Generic Environmental Impact Statement for License Renewal ...
585
Generic Environmental Impact Statement for License Renewal of Nuclear Plants Supplement 57 Regarding LaSalle County Station, Units 1 and 2 Final Report Office of Nuclear Reactor Regulation NUREG-1437 Supplement 57
-
Upload
khangminh22 -
Category
Documents
-
view
0 -
download
0
Transcript of Generic Environmental Impact Statement for License Renewal ...

Generic Environmental Impact Statement for License Renewal of Nuclear Plants Supplement 57 Regarding LaSalle County Station, Units 1 and 2 Final Report
Office of Nuclear Reactor Regulation
NUREG-1437 Supplement 57

Generic Environmental Impact Statement for License Renewal of Nuclear Plants Supplement 57 Regarding LaSalle County Station, Units 1 and 2 Final Report Manuscript Completed: August 2016 Date Published: August 2016 Office of Nuclear Reactor Regulation
NUREG-1437 Supplement 57


iii
COVER SHEET
Responsible Agency: U.S. Nuclear Regulatory Commission, Office of Nuclear Reactor Regulation. There are no cooperating agencies involved in the preparation of this document. Title: Generic Environmental Impact Statement for License Renewal of Nuclear Plants, Supplement 57, Regarding LaSalle County Station, Units 1 and 2, Final Report (NUREG–1437). LaSalle County Station, Units 1 and 2, is located in LaSalle County, Illinois. For additional information or copies of this document contact:
Division of License Renewal U.S. Nuclear Regulatory Commission Office of Nuclear Reactor Regulation
Mail Stop O-11F1 11555 Rockville Pike
Rockville, Maryland 20852 Phone: 1-800-368-5642, extension 6223
Email: [email protected]
ABSTRACT
This supplemental environmental impact statement (SEIS) has been prepared in response to an application submitted by Exelon Generation Company, LLC (Exelon), to renew the operating licenses for LaSalle County Station, Units 1 and 2 (LSCS) for an additional 20 years. This SEIS includes the analysis that evaluates the environmental impacts of the proposed action and alternatives to the proposed action. Alternatives considered include: (1) new nuclear power generation, (2) coal-integrated gasification combined-cycle, (3) natural gas combined-cycle (NGCC), (4) a combination of NGCC, wind, and solar generation, (5) purchased power, and (6) the no-action alternative (i.e., no renewal of the licenses). The U.S. Nuclear Regulatory Commission (NRC) staff’s recommendation is that the adverse environmental impacts of license renewal for LSCS are not so great that preserving the option of license renewal for energy-planning decisionmakers would be unreasonable. The NRC staff based its recommendation on the following factors:
• the analysis and findings in NUREG–1437, Volumes 1 and 2, Generic Environmental Impact Statement for License Renewal of Nuclear Plants;
• the Environmental Report submitted by Exelon;
• consultation with Federal, State, local, and Tribal government agencies;
• the NRC staff’s independent environmental review; and
• consideration of public comments received during the scoping process and received on the draft SEIS.


v
TABLE OF CONTENTS
ABSTRACT .............................................................................................................................. iii TABLE OF CONTENTS ............................................................................................................ v
FIGURES ................................................................................................................................. xv
TABLES ................................................................................................................................ xvii EXECUTIVE SUMMARY ........................................................................................................ xxi ABBREVIATIONS AND ACRONYMS ..................................................................................xxvii UNITS OF MEASURE ..........................................................................................................xxxv
1.0 INTRODUCTION ......................................................................................................... 1-1
1.1 Proposed Federal Action .................................................................................. 1-1 1.2 Purpose and Need for Proposed Federal Action .............................................. 1-1 1.3 Major Environmental Review Milestones .......................................................... 1-1 1.4 Generic Environmental Impact Statement ........................................................ 1-3 1.5 Supplemental Environmental Impact Statement ............................................... 1-5 1.6 Decisions to Be Supported by the SEIS ........................................................... 1-6 1.7 Cooperating Agencies ...................................................................................... 1-6 1.8 Consultations ................................................................................................... 1-6 1.9 Correspondence .............................................................................................. 1-7 1.10 Status of Compliance ....................................................................................... 1-7 1.11 Related Federal and State Activities ................................................................ 1-7 1.12 References ...................................................................................................... 1-8
2.0 ALTERNATIVES INCLUDING THE PROPOSED ACTION ......................................... 2-1
2.1 Proposed Action .............................................................................................. 2-1 2.1.1 Plant Operations during the License Renewal Term .......................... 2-1 2.1.2 Refurbishment and Other Activities Associated with License
Renewal ............................................................................................ 2-2 2.1.3 Termination of Nuclear Power Plant Operations and
Decommissioning after the License Renewal Term ........................... 2-2 2.2 Alternatives ...................................................................................................... 2-3
2.2.1 No-Action Alternative ......................................................................... 2-3 2.2.2 Replacement Power Alternatives ....................................................... 2-4
2.2.2.1 New Nuclear Alternative .................................................... 2-9 2.2.2.2 IGCC Alternative .............................................................. 2-10 2.2.2.3 NGCC Alternative ............................................................ 2-12 2.2.2.4 Combination Alternative (NGCC, Wind, and Solar) .......... 2-13 2.2.2.5 Purchased Power Alternative ........................................... 2-16
2.3 Alternatives Considered but Dismissed .......................................................... 2-16 2.3.1 Energy Conservation and Energy Efficiency .................................... 2-17

Table of Contents
vi
2.3.2 Solar ................................................................................................ 2-17 2.3.3 Wind ................................................................................................ 2-18
2.3.3.1 Offshore Wind.................................................................. 2-18 2.3.3.2 Wind Power with Storage ................................................ 2-19 2.3.3.3 Conclusion ....................................................................... 2-19
2.3.4 Biomass .......................................................................................... 2-19 2.3.5 Hydroelectric ................................................................................... 2-20 2.3.6 Wave and Ocean Energy ................................................................. 2-20 2.3.7 Fuel Cells ........................................................................................ 2-21 2.3.8 Delayed Retirement ......................................................................... 2-21 2.3.9 Geothermal...................................................................................... 2-22 2.3.10 Municipal Solid Waste ..................................................................... 2-22 2.3.11 Petroleum ........................................................................................ 2-22 2.3.12 Supercritical Pulverized Coal ........................................................... 2-23
2.4 Comparison of Alternatives ............................................................................ 2-23 2.5 References .................................................................................................... 2-27
3.0 AFFECTED ENVIRONMENT ...................................................................................... 3-1
3.1 Description of Nuclear Power Plant Facility and Operation .............................. 3-1 3.1.1 External Appearance and Setting ...................................................... 3-1 3.1.2 Nuclear Reactor Systems .................................................................. 3-6 3.1.3 Cooling and Auxiliary Water Systems ................................................ 3-6 3.1.4 Radioactive Waste Management Systems ...................................... 3-13
3.1.4.1 Radioactive Liquid Waste Management ........................... 3-14 3.1.4.2 Radioactive Gaseous Waste Management ...................... 3-15 3.1.4.3 Radioactive Solid Waste Management ............................ 3-16 3.1.4.4 Radioactive Waste Storage ............................................. 3-17 3.1.4.5 Radiological Environmental Monitoring Program ............. 3-17
3.1.5 Nonradioactive Waste Management Systems ................................. 3-18 3.1.6 Utility and Transportation Infrastructure ........................................... 3-19
3.1.6.1 Electricity ......................................................................... 3-19 3.1.6.2 Fuel ................................................................................. 3-19 3.1.6.3 Water ............................................................................... 3-19 3.1.6.4 Transportation Systems ................................................... 3-20 3.1.6.5 Power Transmission Systems .......................................... 3-20
3.1.7 Nuclear Power Plant Operations and Maintenance .......................... 3-21 3.2 Land Use and Visual Resources .................................................................... 3-21
3.2.1 Land Use ......................................................................................... 3-21 3.2.1.1 Onsite Land Use .............................................................. 3-21 3.2.1.2 Coastal Zone ................................................................... 3-22 3.2.1.3 Offsite Land Use .............................................................. 3-23
3.2.2 Visual Resources............................................................................. 3-24

Table of Contents
vii
3.3 Meteorology, Air Quality, and Noise ............................................................... 3-24 3.3.1 Meteorology and Climatology .......................................................... 3-24 3.3.2 Air Quality ........................................................................................ 3-25 3.3.3 Noise ............................................................................................... 3-28
3.4 Geologic Environment .................................................................................... 3-29 3.4.1 Physiography and Geology .............................................................. 3-30 3.4.2 Soils ................................................................................................ 3-31 3.4.3 Seismic Setting ................................................................................ 3-35
3.5 Water Resources ........................................................................................... 3-36 3.5.1 Surface Water Resources ................................................................ 3-36
3.5.1.1 Surface Water Hydrology ................................................. 3-36 3.5.1.2 Surface Water Use .......................................................... 3-40 3.5.1.3 Surface Water Quality and Effluents ................................ 3-42
3.5.2 Groundwater Resources .................................................................. 3-47 3.5.2.1 Site Description and Hydrogeology .................................. 3-47 3.5.2.2 Groundwater Use ............................................................ 3-49 3.5.2.3 Groundwater Quality ........................................................ 3-52
3.6 Terrestrial Resources ..................................................................................... 3-53 3.6.1 LSCS Ecoregion .............................................................................. 3-53 3.6.2 LSCS Site Surveys, Studies, and Reports ....................................... 3-54 3.6.3 LSCS Site ........................................................................................ 3-55
3.6.3.1 Vegetation ....................................................................... 3-55 3.6.3.2 Wildlife ............................................................................. 3-56
3.6.4 LSCS Wildlife Management Plan ..................................................... 3-56 3.6.5 Important Species and Habitats ....................................................... 3-57
3.6.5.1 Important Species ............................................................ 3-57 3.6.5.2 Important Habitats ........................................................... 3-59
3.6.6 Invasive and Non-Native Species .................................................... 3-60 3.7 Aquatic Resources ......................................................................................... 3-60
3.7.1 Illinois River ..................................................................................... 3-60 3.7.1.1 Aquatic Communities in the Illinois River ......................... 3-61
3.7.2 LSCS Cooling Pond ......................................................................... 3-69 3.7.2.1 Aquatic Community in the Cooling Pond .......................... 3-69 3.7.2.2 Cooling Pond Fish Kill Events .......................................... 3-70
3.7.3 Important Species and Habitats ....................................................... 3-71 3.7.3.1 State-Listed Species ........................................................ 3-71 3.7.3.2 Important Habitats ........................................................... 3-74
3.7.4 Non-Native and Nuisance Species .................................................. 3-74 3.8 Federally Protected Species and Habitats...................................................... 3-74
3.8.1 Action Area ...................................................................................... 3-75 3.8.2 Federally Protected Species and Habitats Considered .................... 3-76

Table of Contents
viii
3.9 Historic and Cultural Resources ..................................................................... 3-81 3.9.1 Cultural Background ........................................................................ 3-82 3.9.2 Historic and Cultural Resources ...................................................... 3-84
3.10 Socioeconomics ............................................................................................. 3-84 3.10.1 Power Plant Employment and Expenditures .................................... 3-84 3.10.2 Regional Economic Characteristics ................................................. 3-85
3.10.2.1 Employment and Income ................................................. 3-85 3.10.2.2 Unemployment ................................................................ 3-88
3.10.3 Demographic Characteristics ........................................................... 3-88 3.10.3.1 Transient Population ........................................................ 3-90 3.10.3.2 Migrant Farm Workers ..................................................... 3-91
3.10.4 Housing and Community Services ................................................... 3-92 3.10.4.1 Housing ........................................................................... 3-93 3.10.4.2 Education ........................................................................ 3-93 3.10.4.3 Public Water Supply ........................................................ 3-93
3.10.5 Tax Revenues ................................................................................. 3-95 3.10.6 Local Transportation ........................................................................ 3-97
3.11 Human Health ................................................................................................ 3-98 3.11.1 Radiological Exposure and Risk ...................................................... 3-98 3.11.2 Chemical Hazards ........................................................................... 3-99 3.11.3 Microbiological Hazards................................................................... 3-99
3.11.3.1 Thermophilic Microorganisms of Concern ...................... 3-100 3.11.3.2 Prevalence of Waterborne Diseases Associated with
Recreational Waters ...................................................... 3-101 3.11.4 Electromagnetic Fields .................................................................. 3-101 3.11.5 Other Hazards ............................................................................... 3-102
3.12 Environmental Justice .................................................................................. 3-103 3.12.1 Minority Population ........................................................................ 3-104 3.12.2 Low-Income Population ................................................................. 3-104
3.13 Waste Management and Pollution Prevention .............................................. 3-108 3.13.1 Radioactive Waste ......................................................................... 3-108 3.13.2 Nonradioactive Waste ................................................................... 3-108
3.14 References .................................................................................................. 3-108
4.0 ENVIRONMENTAL CONSEQUENCES AND MITIGATING ACTIONS ....................... 4-1
4.1 Introduction ...................................................................................................... 4-1 4.2 Land Use and Visual Resources ...................................................................... 4-1
4.2.1 Proposed Action ................................................................................ 4-1 4.2.2 No-Action Alternative ......................................................................... 4-2
4.2.2.1 Land Use ........................................................................... 4-2 4.2.2.2 Visual Resources ............................................................... 4-2
4.2.3 New Nuclear Alternative .................................................................... 4-2

Table of Contents
ix
4.2.3.1 Land Use ........................................................................... 4-2 4.2.3.2 Visual Resources ............................................................... 4-3
4.2.4 IGCC Alternative ............................................................................... 4-3 4.2.4.1 Land Use ........................................................................... 4-3 4.2.4.2 Visual Resources ............................................................... 4-4
4.2.5 Natural Gas Combined-Cycle Alternative .......................................... 4-4 4.2.5.1 Land Use ........................................................................... 4-4 4.2.5.2 Visual Resources ............................................................... 4-4
4.2.6 Combination Alternative (NGCC, Wind, Solar) ................................... 4-5 4.2.6.1 Land Use ........................................................................... 4-5 4.2.6.2 Visual Resources ............................................................... 4-5
4.2.7 Purchased Power Alternative ............................................................ 4-6 4.2.7.1 Land Use ........................................................................... 4-6 4.2.7.2 Visual Resources ............................................................... 4-6
4.3 Air Quality and Noise ....................................................................................... 4-6 4.3.1 Proposed Action ................................................................................ 4-6
4.3.1.1 Air Quality .......................................................................... 4-6 4.3.1.2 Noise ................................................................................. 4-7
4.3.2 No-Action Alternative ......................................................................... 4-7 4.3.2.1 Air Quality .......................................................................... 4-7 4.3.2.2 Noise ................................................................................. 4-7
4.3.3 New Nuclear Alternative .................................................................... 4-7 4.3.3.1 Air Quality .......................................................................... 4-7 4.3.3.2 Noise ................................................................................. 4-9
4.3.4 IGCC Alternative ............................................................................. 4-10 4.3.4.1 Air Quality ........................................................................ 4-10 4.3.4.2 Noise ............................................................................... 4-13
4.3.5 NGCC Alternative ............................................................................ 4-13 4.3.5.1 Air Quality ........................................................................ 4-13 4.3.5.2 Noise ............................................................................... 4-15
4.3.6 Combination Alternative (NGCC, Wind, Solar) ................................. 4-16 4.3.6.1 Air Quality ........................................................................ 4-16 4.3.6.2 Noise ............................................................................... 4-18
4.3.7 Purchased Power Alternative .......................................................... 4-19 4.3.7.1 Air Quality ........................................................................ 4-19 4.3.7.2 Noise ............................................................................... 4-19
4.4 Geologic Environment .................................................................................... 4-20 4.4.1 Proposed Action .............................................................................. 4-20 4.4.2 No-Action Alternative ....................................................................... 4-20 4.4.3 New Nuclear Alternative .................................................................. 4-20 4.4.4 IGCC Alternative ............................................................................. 4-21

Table of Contents
x
4.4.5 NGCC Alternative ............................................................................ 4-21 4.4.6 Combination Alternative (NGCC, Wind, Solar) ................................. 4-21 4.4.7 Purchased Power Alternative .......................................................... 4-21
4.5 Water Resources ........................................................................................... 4-21 4.5.1 Proposed Action .............................................................................. 4-21
4.5.1.1 Surface Water Resources ................................................ 4-21 4.5.1.2 Groundwater Resources .................................................. 4-23
4.5.2 No-Action Alternative ....................................................................... 4-26 4.5.2.1 Surface Water Resources ................................................ 4-26 4.5.2.2 Groundwater Resources .................................................. 4-26
4.5.3 New Nuclear Alternative .................................................................. 4-26 4.5.3.1 Surface Water Resources ................................................ 4-26 4.5.3.2 Groundwater Resources .................................................. 4-27
4.5.4 IGCC Alternative ............................................................................. 4-27 4.5.4.1 Surface Water Resources ................................................ 4-27 4.5.4.2 Groundwater Resources .................................................. 4-28
4.5.5 NGCC Alternative ............................................................................ 4-28 4.5.5.1 Surface Water Resources ................................................ 4-28 4.5.5.2 Groundwater Resources .................................................. 4-29
4.5.6 Combination Alternative (NGCC, Wind, Solar) ................................. 4-29 4.5.6.1 Surface Water Resources ................................................ 4-29 4.5.6.2 Groundwater Resources .................................................. 4-30
4.5.7 Purchased Power Alternative .......................................................... 4-30 4.5.7.1 Surface Water Resources ................................................ 4-30 4.5.7.2 Groundwater Resources .................................................. 4-30
4.6 Terrestrial Resources ..................................................................................... 4-30 4.6.1 Proposed Action .............................................................................. 4-30
4.6.1.1 Generic GEIS Issues ....................................................... 4-31 4.6.1.2 Effects on Terrestrial Resources (Non-Cooling
System Impacts) .............................................................. 4-31 4.6.1.3 Water Use Conflicts with Terrestrial Resources ............... 4-33
4.6.2 No-Action Alternative ....................................................................... 4-33 4.6.3 New Nuclear Alternative .................................................................. 4-34 4.6.4 IGCC Alternative ............................................................................. 4-34 4.6.5 NGCC Alternative ............................................................................ 4-35 4.6.6 Combination Alternative (NGCC, Wind, Solar) ................................. 4-36 4.6.7 Purchased Power Alternative .......................................................... 4-36
4.7 Aquatic Resources ......................................................................................... 4-37 4.7.1 Proposed Action .............................................................................. 4-37
4.7.1.1 GEIS Category 1 Issues .................................................. 4-38 4.7.1.2 Impingement and Entrainment of Aquatic Organisms ...... 4-38

Table of Contents
xi
4.7.1.3 Thermal Impacts on Aquatic Organisms .......................... 4-45 4.7.1.4 Water Use Conflicts with Aquatic Resources ................... 4-52
4.7.2 No-Action Alternative ....................................................................... 4-53 4.7.3 New Nuclear Alternative .................................................................. 4-53 4.7.4 IGCC Alternative ............................................................................. 4-54 4.7.5 NGCC Alternative ............................................................................ 4-54 4.7.6 Combination Alternative (NGCC, Wind, Solar) ................................. 4-55 4.7.7 Purchased Power Alternative .......................................................... 4-55
4.8 Special Status Species and Habitats.............................................................. 4-55 4.8.1 Proposed Action .............................................................................. 4-55 4.8.2 No-Action Alternative ....................................................................... 4-57 4.8.3 New Nuclear Alternative .................................................................. 4-57 4.8.4 IGCC Alternative ............................................................................. 4-58 4.8.5 NGCC Alternative ............................................................................ 4-58 4.8.6 Combination Alternative (NGCC, Wind, Solar) ................................. 4-59 4.8.7 Purchased Power Alternative .......................................................... 4-59
4.9 Historic and Cultural Resources ..................................................................... 4-59 4.9.1 Proposed Action .............................................................................. 4-60 4.9.2 No-Action Alternative ....................................................................... 4-62 4.9.3 New Nuclear Alternative .................................................................. 4-62 4.9.4 IGCC Alternative ............................................................................. 4-62 4.9.5 NGCC Alternative ............................................................................ 4-63 4.9.6 Combination Alternative (NGCC, Wind, Solar) ................................. 4-63 4.9.7 Purchased Power Alternative .......................................................... 4-64
4.10 Socioeconomics ............................................................................................. 4-64 4.10.1 Proposed Action .............................................................................. 4-64 4.10.2 No-Action Alternative ....................................................................... 4-65
4.10.2.1 Socioeconomics .............................................................. 4-65 4.10.2.2 Transportation ................................................................. 4-66
4.10.3 New Nuclear Alternative .................................................................. 4-66 4.10.3.1 Socioeconomics .............................................................. 4-66 4.10.3.2 Transportation ................................................................. 4-67
4.10.4 IGCC Alternative ............................................................................. 4-67 4.10.4.1 Socioeconomics .............................................................. 4-67 4.10.4.2 Transportation ................................................................. 4-68
4.10.5 NGCC Alternative ............................................................................ 4-68 4.10.5.1 Socioeconomics .............................................................. 4-68 4.10.5.2 Transportation ................................................................. 4-69
4.10.6 Combination Alternative (NGCC, Wind, Solar) ................................. 4-70 4.10.6.1 Socioeconomics .............................................................. 4-70 4.10.6.2 Transportation ................................................................. 4-70

Table of Contents
xii
4.10.7 Purchased Power Alternative .......................................................... 4-71 4.10.7.1 Socioeconomics .............................................................. 4-71 4.10.7.2 Transportation ................................................................. 4-71
4.11 Human Health ................................................................................................ 4-72 4.11.1 Proposed Action .............................................................................. 4-72
4.11.1.1 Normal Operating Conditions ........................................... 4-72 4.11.1.2 Environmental Impacts of Postulated Accidents .............. 4-76
4.11.2 No-Action Alternative ....................................................................... 4-88 4.11.3 New Nuclear Alternative .................................................................. 4-89 4.11.4 IGCC Alternative ............................................................................. 4-89 4.11.5 NGCC Alternative ............................................................................ 4-90 4.11.6 Combination Alternative (NGCC, Wind, Solar) ................................. 4-90 4.11.7 Purchased Power Alternative .......................................................... 4-90
4.12 Environmental Justice .................................................................................... 4-91 4.12.1 Proposed Action .............................................................................. 4-91 4.12.2 No-Action Alternative ....................................................................... 4-93 4.12.3 New Nuclear Alternative .................................................................. 4-93 4.12.4 IGCC Alternative ............................................................................. 4-94 4.12.5 NGCC Alternative ............................................................................ 4-95 4.12.6 Combination Alternative (NGCC, Wind, Solar) ................................. 4-95 4.12.7 Purchased Power Alternative .......................................................... 4-96
4.13 Waste Management ....................................................................................... 4-97 4.13.1 Proposed Action .............................................................................. 4-97 4.13.2 No-Action Alternative ....................................................................... 4-98 4.13.3 New Nuclear Alternative .................................................................. 4-98 4.13.4 IGCC Alternative ............................................................................. 4-98 4.13.5 NGCC Alternative ............................................................................ 4-99 4.13.6 Combination Alternative (NGCC, Wind, Solar) ................................. 4-99 4.13.7 Purchased Power Alternative .......................................................... 4-99
4.14 Evaluation of New and Potentially Significant Information .............................. 4-99 4.15 Impacts Common to All Alternatives............................................................. 4-100
4.15.1 Fuel Cycles.................................................................................... 4-100 4.15.1.1 Uranium Fuel Cycle ....................................................... 4-101 4.15.1.2 Replacement Power Plant Fuel Cycles .......................... 4-102
4.15.2 Terminating Power Plant Operations and Decommissioning ......... 4-102 4.15.2.1 Existing Nuclear Power Plant ......................................... 4-102 4.15.2.2 Replacement Power Plants ............................................ 4-103
4.15.3 Greenhouse Gas Emissions and Climate Change ......................... 4-104 4.15.3.1 Greenhouse Gas Emissions from the Proposed
Project and Alternatives ................................................. 4-104 4.15.3.2 Climate Change Impacts to Resource Areas ................. 4-107

Table of Contents
xiii
4.16 Cumulative Impacts of the Proposed Action ................................................. 4-113 4.16.1 Air Quality and Noise ..................................................................... 4-114
4.16.1.1 Air Quality ...................................................................... 4-114 4.16.1.2 Noise ............................................................................. 4-115
4.16.2 Geology and Soils ......................................................................... 4-116 4.16.3 Water Resources ........................................................................... 4-116
4.16.3.1 Surface Water Resources .............................................. 4-116 4.16.3.2 Groundwater Resources ................................................ 4-121
4.16.4 Terrestrial Resources .................................................................... 4-121 4.16.5 Aquatic Resources ........................................................................ 4-124
4.16.5.1 Energy Development ..................................................... 4-124 4.16.5.2 Future Urbanization and Transportation Development ... 4-125 4.16.5.3 Wildlife Preserves, Parks, and Recreational Areas ........ 4-125 4.16.5.4 Illinois Wildlife Conservation Plan .................................. 4-125 4.16.5.5 Conclusion ..................................................................... 4-126
4.16.6 Historic and Cultural Resources .................................................... 4-126 4.16.7 Socioeconomics ............................................................................ 4-126 4.16.8 Human Health ............................................................................... 4-127 4.16.9 Environmental Justice ................................................................... 4-128 4.16.10 Waste Management ...................................................................... 4-128 4.16.11 Global Climate Change ................................................................. 4-129 4.16.12 Summary of Cumulative Impacts ................................................... 4-131
4.17 Resource Commitments ............................................................................... 4-133 4.17.1 Unavoidable Adverse Environmental Impacts ................................ 4-133 4.17.2 Short-Term Versus Long-Term Productivity ................................... 4-134 4.17.3 Irreversible and Irretrievable Commitments of Resources .............. 4-134
4.18 References .................................................................................................. 4-135
5.0 CONCLUSION ............................................................................................................ 5-1
5.1 Environmental Impacts of License Renewal ..................................................... 5-1 5.2 Comparison of Alternatives .............................................................................. 5-1 5.3 Recommendation ............................................................................................. 5-1
6.0 LIST OF PREPARERS ............................................................................................... 6-1
7.0 LIST OF AGENCIES, ORGANIZATIONS, AND PERSONS TO WHOM COPIES OF THIS SEIS ARE SENT .......................................................................................... 7-1
8.0 INDEX ......................................................................................................................... 8-1
COMMENTS RECEIVED ON THE LSCS ENVIRONMENTAL REVIEW ....... A-1 APPLICABLE LAWS, REGULATIONS, AND OTHER REQUIREMENTS ......................................................................................... B-1 CONSULTATION CORRESPONDENCE ..................................................... C-1 CHRONOLOGY OF ENVIRONMENTAL REVIEW CORRESPONDENCE .................................................................................. D-1

Table of Contents
xiv
ACTIONS AND PROJECTS CONSIDERED IN THE CUMULATIVE IMPACTS ANALYSIS ................................................................................... E-1 U.S. NUCLEAR REGULATORY COMMISSION STAFF EVALUATION OF SEVERE ACCIDENT MITIGATION ALTERNATIVES FOR LASALLE COUNTY STATION, UNITS 1 AND 2, IN SUPPORT OF LICENSE RENEWAL APPLICATION REVIEW ............................................ F-1 TRANSPORTATION IMPACTS OF HIGH BURNUP FUEL .......................... G-1
xv
FIGURES
Figure 1–1. Environmental Review Process ........................................................................ 1-2 Figure 1–2. Environmental Issues Evaluated for License Renewal ..................................... 1-5 Figure 2–1. Territories of MISO and PJM Interconnection ................................................... 2-6 Figure 3–1. LSCS 50-mi (80-km) Radius Map .................................................................... 3-2 Figure 3–2. LSCS 6-mi (10-km) Radius Map ...................................................................... 3-3 Figure 3–3. LSCS Site Layout............................................................................................. 3-4 Figure 3–4. LSCS Plant Features ....................................................................................... 3-5 Figure 3–5. Closed-Cycle Cooling System with Cooling Pond ............................................ 3-7 Figure 3–6. LSCS Cooling Water Supply and Discharge Facilities ...................................... 3-9 Figure 3–7. Site Physiography, LSCS Vicinity ................................................................... 3-32 Figure 3–8. North-South Geologic Cross Section, LSCS Vicinity ...................................... 3-33 Figure 3–9. Bedrock Topography and Buried Valleys, LSCS Vicinity ................................ 3-34 Figure 3–10. The Upper Illinois River Basin and Drainage Basin Boundaries ..................... 3-38 Figure 3–11. LSCS Surface Water and Related Water Resource Features ........................ 3-39 Figure 3–12. LSCS Site Hydrogeologic Units ...................................................................... 3-48 Figure 3–13. LSCS Groundwater Flow in Engineered Granular Fill .................................... 3-50 Figure 3–14. LSCS Hydrogeologic Cross-Section............................................................... 3-51 Figure 3–15. Icthyoplankton Sampling Location at the LSCS River Intake Structure ........... 3-63 Figure 3–16. Sampling Locations in LSCS Aquatic Surveys ............................................... 3-64 Figure 3–17. Minority Block Groups within a 50-mi (80-km) Radius of LSCS .................... 3-106 Figure 3–18. Low-Income Block Groups within a 50-mi (80-km) Radius of LSCS ............. 3-107
Illustration of Truck Stop Model ....................................................................... G-6

xvii
TABLES
Table ES–1. Summary of NRC Conclusions Relating to Site-Specific Impacts of License Renewal............................................................................................. xxiii
Table 2–1. Summary of Replacement Power Alternatives and Key Characteristics Considered in Depth ........................................................................................ 2-8
Table 2–2. Environmental Impacts of the Proposed Action and Alternatives .................... 2-25 Table 3–1. LSCS Site Land Uses by Area ....................................................................... 3-22 Table 3–2. Land Use within a 10-km (6-mi) Radius of LSCS ........................................... 3-23 Table 3–3. National Ambient Air Quality Standards ......................................................... 3-26 Table 3–4. LSCS Air Emissions (MT/year) ....................................................................... 3-27 Table 3–5. Common Noise Sources and Noise Levels .................................................... 3-28 Table 3–6. Annual Surface Water Withdrawals and Returns to the Illinois River,
LSCS ............................................................................................................. 3-41 Table 3–7. National Pollutant Discharge Elimination System-Permitted Outfalls,
LSCS ............................................................................................................. 3-44 Table 3–8. Wildlife in the Illinois/Indiana Prairies Level IV Ecoregion ............................... 3-53 Table 3–9. State-Listed Species in LaSalle County ......................................................... 3-57 Table 3–10. Common Fish Species in LSCS Aquatic Surveys on the Illinois River ............ 3-67 Table 3–11. Fish Species Comprising 90 Percent of Catch in the Illinois Natural
History Electrofishing Surveys from 1957 through 2009 ................................. 3-68 Table 3–12. Fish Stockings in the LSCS Cooling Pond 2008-2014 .................................... 3-70 Table 3–13. State-Listed Aquatic Species with the Potential To Occur in LaSalle
County ........................................................................................................... 3-71 Table 3–14. Federally Listed Species and Designated Habitat in LaSalle County,
Illinois ............................................................................................................. 3-77 Table 3–15. LSCS Employees Residence by County ........................................................ 3-85 Table 3–16. Employment by Industry in the LSCS ROI (2014, 1-year estimates and
2009-2013, 5-year estimates) ........................................................................ 3-86 Table 3–17. Major Employers in LaSalle County in 2009 ................................................... 3-86 Table 3–18. Estimated Income Information for the LSCS ROI (2014 estimates,
unless otherwise indicated) ............................................................................ 3-87 Table 3–19. Population and Percent Growth in LSCS ROI Counties 1980–2010,
2014 (estimated), and Projected for 2020–2060 ............................................ 3-88 Table 3–20. Demographic Profile of the Population in the LSCS ROI in 2010 ................... 3-89 Table 3–21. Demographic Profile of the Population in the LSCS ROI in 2014 ................... 3-89 Table 3–22. 2013 Estimated Seasonal Housing in Counties within 50 mi (80 km) of
LSCS ............................................................................................................. 3-90 Table 3–23. Migrant Farm Workers and Temporary Farm Labor in Counties Located
within 50 mi (80 km) of LSCS (2012).............................................................. 3-92 Table 3–24. Housing in the LSCS ROI (2014 estimate) ..................................................... 3-93 Table 3–25. Local Public Water Supply Systems ............................................................... 3-94
Tables
xviii
Table 3–26. LSCS Power Block Tax Payments and Valuations 2007–2014 (in dollars) ...................................................................................................... 3-95
Table 3–27. 2013 LSCS Tax Payments to Taxing Entities as a Percentage of Total Levy ............................................................................................................... 3-96
Table 3–28. Annual Payments to Illinois Emergency Management Agency 2009–2014 ..................................................................................................... 3-97
Table 3–29. Major Commuting Routes in the Vicinity of LSCS: 2013-2014 Average Annual Daily Traffic Count ............................................................................. 3-97
Table 4–1. Land Use and Visual Resource Issues ............................................................. 4-2 Table 4–2. Air Quality and Noise ....................................................................................... 4-6 Table 4–3. Geology and Soils Issues ............................................................................... 4-20 Table 4–4. Surface Water Resources Issues ................................................................... 4-22 Table 4–5. Groundwater Issues ....................................................................................... 4-24 Table 4–6. Terrestrial Resource Issues ........................................................................... 4-31 Table 4–7. Aquatic Resource Issues ............................................................................... 4-37 Table 4–8. Special Status Species and Habitat Issues .................................................... 4-55 Table 4–9. Federally Listed Species and Designated Habitat in LaSalle County,
Illinois, and NRC Effect Determinations for Proposed LSCS License Renewal ......................................................................................................... 4-57
Table 4–10. Historic and Cultural Resources Issue ........................................................... 4-60 Table 4–11. Socioeconomic NEPA Issues Affected by License Renewal .......................... 4-65 Table 4–12. Human Health Issues ..................................................................................... 4-72 Table 4–13. Issues Related to Postulated Accidents ......................................................... 4-76 Table 4–14. LSCS CDF for Internal Events ....................................................................... 4-79 Table 4–15. Base Case Mean Population Dose Risk and Offsite Economic Cost Risk
for Internal Events .......................................................................................... 4-81 Table 4–16. LSCS Potentially Cost-Beneficial SAMAs ...................................................... 4-84 Table 4–17. Environmental Justice NEPA Issue ................................................................ 4-91 Table 4–18. Waste Management Issues ............................................................................ 4-97 Table 4–19. Issues Related to the Uranium Fuel Cycle ................................................... 4-101 Table 4–20. Issues Related to Decommissioning ............................................................ 4-103 Table 4–21. Estimated GHG Emissions from Operations at LSCS (MT/yr of CO2e) ......... 4-105 Table 4–22. Direct GHG Emissions from Operation of the Proposed Action and
Alternatives .................................................................................................. 4-107 Table 4–23. Comparison of GHG Emission Inventories ................................................... 4-131 Table 4–24. Summary of Cumulative Impacts on Resource Areas .................................. 4-131 Table 6–1. List of Preparers .............................................................................................. 6-1 Table A–1. Commenters on the Draft Supplemental Environmental Impact
Statement ........................................................................................................ A-2 Table B–1. Federal and State Requirements ..................................................................... B-2 Table B–2. Licenses and Permits ....................................................................................... B-7 Table C–1. ESA Section 7 Consultation Correspondence .................................................. C-2 Table C–2. NHPA Correspondence.................................................................................... C-3
Tables
xix
Table D–1. Environmental Review Correspondence .......................................................... D-1 Table E–1. Projects and Actions Considered in Cumulative Impact Analysis ..................... E-1 Table F–1. LaSalle County Station CDF for Internal Events ............................................... F-3 Table F–2. Base Case Mean Population Dose Risk and Offsite Economic Cost Risk
for Internal Events ............................................................................................ F-4 Table F–3. Summary of Major PRA Models and Corresponding CDF and LERF
Results ............................................................................................................. F-7 Table F–4. Dominant LSCS Contributors to Seismic CDF ............................................... F-12 Table F–5(a). Dominant LSCS Unit 1 Fire Zone Contributors to Fire CDF of 8.9×10⁻⁶
per year. ........................................................................................................ F-14 Table F–5(b). Dominant LSCS Unit 2 Fire Zone Contributors to Fire CDF of 9.4×10⁻⁶
per year ......................................................................................................... F-14 Table F–5. SAMA Cost-Benefit Screening Analysis for LSCS Station .............................. F-34 Table G–1. Transportation Route Information for Shipments from LSCS to the
Proposed Yucca Mountain Repository Site ..................................................... G-4 Table G–2. RADTRAN 6.02 Normal (Incident-Free) Exposure Parameters ....................... G-5 Table G–3. Annual Normal (Incident-Free) Radiation Doses to Transport Workers
and the Public from Shipping Spent Fuel from LSCS to the Proposed Yucca Mountain Repository Site, Normalized to Reference LWR (880 MWe (net)) ..................................................................................... G-6
Table G–4. Radionuclide Inventories Used in Transportation Accident Risk Calculations for the LSCS Reactors ...............................................................G-10
Table G–5. Annual Spent Fuel Transportation Accident Impacts from Shipping Spent Fuel from LSCS to the Proposed Yucca Mountain Repository Site, Normalized to Reference LWR Reactor (880 MWe (net)).......................G-11


xxi
EXECUTIVE SUMMARY
BACKGROUND
By letter dated December 9, 2014, Exelon Generation Company, LLC (Exelon) submitted an application to the U.S. Nuclear Regulatory Commission (NRC) to issue renewed operating licenses for LaSalle County Station, Units 1 and 2 (LSCS) for an additional 20-year period. Pursuant to Title 10 of the Code of Federal Regulations (10 CFR) 51.20(b)(2), the renewal of a power reactor operating license requires preparation of an environmental impact statement (EIS) or a supplement to an existing EIS. In addition, 10 CFR 51.95(c) states that, in connection with the renewal of an operating license, the NRC shall prepare an EIS, which is a supplement to the Commission’s NUREG–1437, Generic Environmental Impact Statement (GEIS) for License Renewal of Nuclear Plants (dated June 2013). Upon acceptance of Exelon’s application, the NRC staff began the environmental review process described in 10 CFR Part 51 by publishing a Notice of Intent to prepare a supplemental environmental impact statement (SEIS) and to conduct scoping. In preparation of this SEIS for LSCS, the NRC staff performed the following:
• conducted public scoping meetings on March 10, 2015, in Ottawa, Illinois;
• conducted a site audit at LSCS from May 5–7, 2015;
• reviewed Exelon’s Environmental Report (ER) and compared it to the GEIS;
• consulted with Federal, State, Tribal, and local agencies;
• conducted a review of the issues following the guidance set forth in NUREG–1555, Revision 1, Standard Review Plans for Environmental Reviews for Nuclear Power Plants, Supplement 1: Operating License Renewal, Final Report; and
• considered public comments received during the scoping process and received on the draft SEIS.
PROPOSED ACTION
Exelon initiated the proposed Federal action (i.e., issuance of renewed power reactor operating licenses) by submitting an application for license renewal of LSCS for which the existing licenses (NPF-11 and NPF-18) expire on April 17, 2022, and December 16, 2023, respectively. The NRC’s Federal action is to decide whether to renew the licenses for an additional 20 years. The regulation at 10 CFR 2.109 states that, if a licensee of a nuclear power plant files an application to renew an operating license at least 5 years before the expiration date of that license, the existing license will not be deemed to have expired until the safety and environmental reviews are completed and until the NRC has made a final decision on whether to issue a renewed license for the additional 20 years.
PURPOSE AND NEED FOR ACTION
The purpose and need for the proposed action (i.e., issuance of renewed licenses) is to provide an option that allows for power generation capability beyond the term of the current nuclear power plant operating licenses to meet future system generating needs. Such needs may be determined by other energy-planning decisionmakers, such as states, operators, and, where authorized, Federal agencies (other than the NRC). This definition of purpose and need reflects

Executive Summary
xxii
the NRC’s recognition that, unless there are findings in the safety review required by the Atomic Energy Act of 1954, as amended, or findings in the National Environmental Policy Act of 1969, as amended, environmental analysis that would lead the NRC to reject a license renewal application, the NRC does not have a role in the energy-planning decisions as to whether a particular nuclear power plant should continue to operate.
ENVIRONMENTAL IMPACTS OF LICENSE RENEWAL
The SEIS evaluates the potential environmental impacts of the proposed action. The environmental impacts from the proposed action are designated as SMALL, MODERATE, or LARGE. As established in the GEIS, Category 1 issues are those that meet all of the following criteria:
• The environmental impacts associated with the issue are determined to apply either to all plants or, for some issues, to plants having a specific type of cooling system or other specified plant or site characteristics.
• A single significance level (i.e., SMALL, MODERATE, or LARGE) has been assigned to the impacts except for collective offsite radiological impacts from the fuel cycle and from high-level waste and spent fuel disposal.
• Mitigation of adverse impacts associated with the issue is considered in the analysis, and it has been determined that additional plant-specific mitigation measures are likely not to be sufficiently beneficial to warrant implementation.
For Category 1 issues, no additional site-specific analysis is required in this SEIS unless new and significant information is identified. Chapter 4 of this SEIS presents the process for identifying new and significant information. Site-specific issues (Category 2) are those that do not meet one or more of the criteria for Category 1 issues; therefore, an additional site-specific review for these non-generic issues is required, and the results are documented in the SEIS. Neither Exelon nor the NRC identified information that is both new and significant related to Category 1 issues that would call into question the conclusions in the GEIS. This conclusion is supported by the NRC staff’s review of the applicant’s ER and other documentation relevant to the applicant’s activities, the public scoping process, comments received, and the findings from the environmental site audit conducted by the NRC staff. Therefore, the NRC staff relied upon the conclusions of the GEIS for all Category 1 issues applicable to LSCS. The NRC staff did find new information regarding the Category 1 uranium fuel cycle issue (Transportation), but the NRC staff determined that this new information is not significant and therefore it does not affect the conclusions for this issue presented in the GEIS. This new information is discussed in Section 4.15.1 and Appendix G of this SEIS. Table ES-1 summarizes the Category 2 issues relevant to LSCS and the NRC staff’s findings related to those issues. If the NRC staff determined that there were no Category 2 issues applicable for a particular resource area, the findings of the GEIS, as documented in Appendix B to Subpart A of 10 CFR Part 51, are incorporated for that resource area.
SMALL: Environmental effects are not detectable or are so minor that they will neither destabilize nor noticeably alter any important attribute of the resource. MODERATE: Environmental effects are sufficient to alter noticeably, but not to destabilize, important attributes of the resource. LARGE: Environmental effects are clearly noticeable and are sufficient to destabilize important attributes of the resource.

Executive Summary
xxiii
Table ES–1. Summary of NRC Conclusions Relating to Site-Specific Impacts of License Renewal
Resource Area Relevant Category 2 Issues Impacts
Surface Water Resources Surface water use conflicts SMALL
Groundwater Resources Groundwater Use Conflicts Groundwater Quality Degradation Radionuclides released to groundwater
SMALL SMALL SMALL
Terrestrial Resources Effects on terrestrial resources (non-cooling system impacts) Water use conflicts with terrestrial resources
SMALL SMALL
Aquatic Resources
Impingement and entrainment of aquatic organisms Thermal impacts on aquatic organisms Water use conflicts with aquatic resources
SMALL SMALL to MODERATE(a) SMALL
Special Status Species and Habitats
Threatened, endangered, and protected species and essential fish habitat No effect(b)
Historic and Cultural Resources Historic and cultural resources No adverse effect(c)
Human Health Microbiological hazards to the public Electric shock hazards
SMALL SMALL
Environmental Justice Minority and low-income populations See note below(d)
Cumulative Impacts
Terrestrial Ecology Aquatic Resources Socioeconomics Environmental Justice Global Climate Change All other resource areas
MODERATE to LARGE MODERATE See note below(e) See note below(d) MODERATE(f) SMALL
(a) Thermal impacts would be SMALL for all aquatic resources in the Illinois River and SMALL for aquatic resources in the cooling pond, except for gizzard shad and threadfin shad. Gizzard shad and threadfin shad would experience MODERATE thermal impacts in the cooling pond.
(b) For Federally protected species, the NRC reports the effects from continued operation of LSCS during the license renewal period in terms of its Endangered Species Act of 1973, as amended, findings of “no effect,” “may effect, but not likely to adversely effect,” or “may affect, and is likely to adversely affect.”
(c) The National Historic Preservation Act of 1966, as amended, requires Federal agencies to consider the effects of their undertakings on historic properties.
(d) There would be no disproportionately high and adverse impacts to minority and low-income populations. (e) The contributory effects from the continued operation of LSCS during the license renewal period would have no
new or increased impact on socioeconomic conditions beyond what is currently being experienced. (f) The incremental impact from the contribution of greenhouse gas (GHG) emissions from continued operation of
LSCS on global climate change would be SMALL. When compared to other baseload replacement power generation sources assessed in this SEIS, the incremental addition of GHG emissions from continued operation of LSCS, when compared to global emissions, are negligible (SMALL) and would have a net, beneficial contribution to GHG emissions and global climate change impacts during the license renewal term. However, the cumulative impacts of global GHG emissions from past, present, and reasonably foreseeable future actions on global climate change are MODERATE.

Executive Summary
xxiv
SEVERE ACCIDENT MITIGATION ALTERNATIVES
Since severe accident mitigation alternatives (SAMAs) have not been previously considered in an environmental impact statement or environmental assessment for LSCS, 10 CFR 51.53(c)(3)(ii)(L) requires Exelon to submit, with the ER, a consideration of alternatives to mitigate severe accidents. SAMAs are potential ways to reduce the risk or potential impacts of uncommon, but potentially severe accidents. SAMAs may include changes to plant components, systems, procedures, and training. The NRC staff reviewed Exelon’s ER evaluation of potential SAMAs and concluded that none of the potentially cost-beneficial SAMAs relate to adequately managing the effects of aging during the extended period of operation. Therefore, the potentially cost-beneficial SAMAs identified need not be implemented as part of the license renewal, pursuant to 10 CFR Part 54.
ALTERNATIVES
The NRC staff considered the environmental impacts associated with alternatives to license renewal. These alternatives include other methods of power generation, as well as not renewing the LSCS operating licenses (i.e., the no-action alternative). The NRC staff considered the following feasible and commercially viable replacement power alternatives:
• new nuclear power;
• coal-integrated gasification combined-cycle;
• natural gas combined-cycle (NGCC);
• combination alternative (NGCC, wind, and solar power); and
• purchased power. The NRC staff initially considered a number of additional alternatives for analysis as alternatives to the license renewal of LSCS. The NRC staff later dismissed these alternatives because of technical, resource availability, or commercial limitations that currently exist and that the NRC staff believes are likely to continue to exist when the current LSCS licenses expire. The no-action alternative and the effects it would have were also considered by the NRC staff. Where possible, the NRC staff evaluated potential environmental impacts for these alternatives located at both the LSCS site and some other unspecified alternate location. The NRC staff considered the following alternatives, but dismissed them:
• energy conservation and energy efficiency;
• supercritical pulverized coal;
• wind power;
• solar power;
• hydroelectric power;
• wave and ocean energy;
• geothermal power;
• municipal solid waste;
• biomass;
Executive Summary
xxv
• oil-fired power;
• fuel cells; and
• delayed retirement. The NRC staff evaluated each alternative using the same resource areas that were used in evaluating impacts from license renewal.
RECOMMENDATION
The NRC staff’s recommendation is that the adverse environmental impacts of license renewal for LSCS are not so great that preserving the option of license renewal for energy-planning decisionmakers would be unreasonable. The NRC staff based its recommendation on the following:
• the analyses and findings in the GEIS;
• the ER submitted by Exelon;
• the NRC staff’s consultation with Federal, State, Tribal, and local agencies;
• the NRC staff’s independent environmental review; and
• the NRC staff’s consideration of public comments received during the scoping process and received on the draft SEIS.

xxvii
ABBREVIATIONS AND ACRONYMS
AC alternating current ACC averted cleanup and decontamination costs ACHP Advisory Council on Historic Preservation ADAMS Agencywide Documents Access and Management System ADS automatic depressurization system AEA Atomic Energy Act of 1954 (as amended) AEC Atomic Energy Commission ALARA as low as is reasonably achievable APE area of potential effect AQCR air quality control region ASME American Society of Mechanical Engineers ATWS anticipated transient(s) without scram BLM Bureau of Land Management BMP best management practice BOC break outside containment BPJ best professional judgement BTA best technology available BWR boiling water reactor BWROG Boiling Water Reactor Owners Group CAA Clean Air Act CAES compressed air energy storage CAFTA computer-aided fault tree analysis CCS carbon capture and storage CCF common cause failure CDF core damage frequency CDC Centers for Disease Control and Prevention CECO Commonwealth Edison Company CEQ Council on Environmental Quality CET containment event tree CFR Code of Federal Regulations
CH4 methane
Class B/C Class B and Class C low-level radioactive waste
CNWRA Center for Nuclear Water Regulatory Analysis

Abbreviations and Acronyms
xxviii
CO carbon monoxide CO2 carbon dioxide CO2e carbon dioxide equivalent COL combined operating license ComEd Commonwealth Edison CRMP cultural resource management plan CSCS core standby cooling system CST condensate storage tank CV containment vent CWA Clean Water Act CWS cooling water system CZ containment remains intact CZMA Coastal Zone Management Act DBA design-basis accident DI drywell intact DC direct current DELT deformities, erosions, lesions, or tumors DMR discharge monitoring reports DOE U.S. Department of Energy EA EA Engineering, Science, & Technology, Inc. EAL emergency action level EcoCat ecological compliance assessment tool ECCS emergency core cooling system ECOS environmental conservation online system Edwardsport Duke Energy Edwardsport Generation System EEM external event multiplier EFH essential fish habitat EIA Energy Information Administration EIS environmental impact statement EMF electromagnetic field EO executive order EOPs emergency operation procedures EPA U.S. Environmental Protection Agency EPG emergency procedure guidelines EPRI Electric Power Research Institute

Abbreviations and Acronyms
xxix
EPT Ephemeroptera, Plecoptera, & Trichoptera ER Environmental Report ESA Endangered Species Act of 1973, as amended ESF engineered safety feature ESRP Environmental Standard Review Plan, NUREG–1555,
Supplement 1, Revision 1 FC containment flooding occurs with drywell vent FEIS final environmental impact statement FES final environmental statement FESOP Federally Enforceable State Operating Permit FIVE fire-induced vulnerability evaluation FPIE full power internal event FPS fire protection system FR Federal Register FRN Federal Register notice FWS U.S. Fish and Wildlife Service GEIS generic environmental impact statement GHGs greenhouse gases GI generic issue GRWS gaseous radioactive waste system GV combustible gas venting initiated HAP hazardous air pollutants HEP human error probability HFCs hydrofluorocarbons HFO high winds, floods, and other H2O water HPCS high pressure core spray HR containment heat removal HRA human reliability analysis HRSG heat recovery steam generator IAC Illinois Administrative Code INAI Illinois Natural Areas Inventory ICRP International Commission on Radiological Protection ID identification Idoneous Idoneous Consulting, Inc.

Abbreviations and Acronyms
xxx
IDNR Illinois Department of Natural Resources IDOT Illinois Department of Transportation IDPH Illinois Department of Public Health IEMA Illinois Emergency Management Agency IEPA Illinois Environmental Protection Agency IGCC integrated gasification combined-cycle IHPA Illinois Historic Preservation Agency ILCS Illinois Compiled Statutes INHS Illinois Department of Public Health IORV inadvertent/stuck open relief valve IPaC information for planning and conservation IPCB Illinois Pollution Control Board IPE individual plant examination IPEEE individual plant examination(s) of external events IRSF interim radioactive waste storage facility IS containment isolated ISFSI independent spent fuel storage facility ISLOCA interfacing-systems loss-of-coolant accident LDN day-night average sound intensity level Leq equivalent sound intensity level LERF large early release frequency LLW low-level waste Ln statistical sound level LOCA loss-of-coolant accident LOE lines of evidence LOOP loss(es) of offsite power LPCI low-pressure coolant injection LPCS low-pressure core spray LRA license renewal application LRWS liquid radioactive waste system LSCS LaSalle County Station, Units 1 and 2 LWRS light-water reactors MAAP Modular Accident Analysis Program MACCS2 MELCOR Accident Consequence Code System 2 MACR maximum averted cost risk
Abbreviations and Acronyms
xxxi
MATS Mercury and Air Toxics Standards MBTA Migratory Bird Treaty Act MISO Midcontinent Independent System Operator MMACR modified maximum averted cost MMPA Marine Mammal Protection Act MMT million metric tons MSA Magnuson–Stevens Fishery Conservation and Management Act,
as amended through 2006 MSIV main steam isolation valve MU Inventory Makeup Available NAAQS National Ambient Air Quality Standards NC no large containment failure NCRP National Council on Radiation Protection and Measurements NEI Nuclear Energy Institute NEPA National Environmental Policy Act of 1969, as amended NESC National Electric Safety Code NETL National Energy Technology Laboratory NGCC natural gas combined-cycle NHPA National Historic Preservation Act of 1966, as amended NIEHS National Institute of Environmental Health Sciences NMFS National Marine Fisheries Service (of the National Oceanic and
Atmospheric Administration) NO2 nitrogen dioxide NOx nitrogen oxide(s) N2O nitrous oxide NPDES National Pollutant Discharge Elimination System NPS National Park Service NRC U.S. Nuclear Regulatory Commission NREL National Renewable Energy Laboratory NRHP National Register of Historic Places NRR Nuclear Reactor Regulation, Office of (NRC) NSR new source review NTTF Near Term Task Force O3 ozone OCR onsite cost risk

Abbreviations and Acronyms
xxxii
ODCM offsite dose calculation manual OECR offsite economic cost risk OP RPV Depressurization OSHA Occupational Safety and Health Administration PAM primary amoebic meningoencephalitis Pb lead PCB polychlorinated biphenyls PDR population dose risk PDS plant damage state PEIS programmatic environmental impact statement PFCS perfluorocarbons PIMW potentially infectious medical waste PNNL Pacific Northwest National Laboratory PRA probabilistic risk assessment PSD prevention of significant deterioration PSDAR post-shutdown decommissioning activities report PV photovoltaic PWR pressurized water reactor RAI request(s) for additional information RB reactor building effectiveness RCIC reactor core isolation cooling RCP reactor coolant pump RCRA Resource Conservation and Recovery Act of 1976, as amended REMP radiological environmental monitoring program RHR residual heat removal RHRSW residual heat removal service water RMIEP risk methods integration and evaluation program ROI region of influence ROW right-of-way RPV reactor pressure vessel RRW risk reduction worth RTO regional transmission organization RX core melt arrested in-vessel SAGS severe accident guidelines SAMA severe accident mitigation alternative

Abbreviations and Acronyms
xxxiii
SAR safety analysis report SBLC standby liquid control SBO station blackout SCPC supercritical pulverized coal SCR spent selective catalytic reduction SEIS supplemental environmental impact statement SER safety evaluation report SF6 sulfur hexafluoride SHPO State Historic Preservation Officer SHSR seismic hazard screening report SNL Sandia National Laboratories SO2 sulfur dioxide SP suppression pool SPC suppression pool cooling SR supporting requirement SRV safety relief valve SWRS solid radioactive waste system SSC structure, system, and component SW service water SWEL seismic walkdown equipment list SWPPP storm water pollution prevention plan SX essential service water syngas synthesis gas TD injection established to RPV and drywell TMDL total maximum daily load TRAGIS transportation routing analysis geographical information system TS technical specification(s) UHS ultimate heat sink URE updating requirement evaluation U.S. United States USACE U. S. Army Corps of Engineers USC United States Code USFS U. S. Forest Service UFSAR updated final safety analysis report USGCRP U.S. Global Change Research Program

Abbreviations and Acronyms
xxxiv
USGS U.S. Geological Survey VOC volatile organic compound Vogtle Vogtle Electric Generating Plant VPP OSHA Voluntary Protection Program WEA averted offsite economic cost WCP averted onsite cleanup cost WHC Wildlife Habitat Council WNS white-nose syndrome WO averted onsite exposure cost WOE weight of evidence WPHA averted offsite exposure cost WRP averted replacement power cost WSA wet gas sulfuric acid WW wetwell airspace failure

xxxv
UNITS OF MEASURE
ac acre(s) cfs cubic foot (feet) per second Ci/MTU curies per metric ton of uranium dB decibels ºC degrees Celsius ºF degrees Fahrenheit ft foot (feet) fps feet per second ft3 cubic foot (feet) gpd gallon(s) per day gpm gallon(s) per minute gCe/kWh grams of carbon equivalent per kilowatt hour ha hectare(s) kg kilogram(s) km kilometer(s) km2 square kilometers Kph kilometers per hour kV kilovolt kW kilowatt(s) kWe kilowatt(s) electric kWh/m2/d kilowatt hours per square meter per day lb pound(s) Lpd liters per day L/min liters per minute MWd megawatt(s) day MT metric tons m meter(s) m/s meter(s) per second MTU metric ton of uranium
µm micrometers m2 square miles m3 cubic meter(s) m3/day cubic meters per day

Units of Measure
xxxvi
m3/min cubic meters per minute m3/yr cubic meters per year m3/s cubic meters per second mgd million gallons per day mgy million gallons per year mg/L milligrams per liter mi mile(s) mph mile(s) per hour mGy milligray mrad millirad mrem millirem mSv millisievert MT metric ton MW megawatt(s) MWe megawatt(s) electric MWh megawatt hour(s) MWt megawatt(s) thermal pCi/L picocuries per liter ppm parts per million person/mi2 persons per square mile rem roentgen equivalent(s) man RKm river kilometer RM river mile Sv sievert(s) Tg teragrams v volt(s) yr year(s)

1-1
1.0 INTRODUCTION
Under the U.S. Nuclear Regulatory Commission’s (NRC’s) environmental protection regulations in Part 51 of Title 10 of the Code of Federal Regulations (10 CFR Part 51)—which implement the National Environmental Policy Act (NEPA)—the issuance or renewal of a nuclear power plant operating license requires the preparation of an environmental impact statement (EIS). The Atomic Energy Act of 1954 (AEA) specifies that licenses for commercial power reactors can be granted for up to 40 years. NRC regulations (10 CFR 54.31) allow for an option to renew a license for up to an additional 20 years. The initial 40-year licensing period was based on economic and antitrust considerations rather than on technical limitations of the nuclear facility. The decision to seek a license renewal rests entirely with nuclear power facility owners and, typically, is based on the facility’s economic viability and the investment necessary to continue to meet NRC safety and environmental requirements. The NRC makes the decision to grant or deny license renewal based on whether the applicant has demonstrated that the environmental and safety requirements in the agency’s regulations can be met during the period of extended operation.
1.1 Proposed Federal Action
Exelon Generation Company, LLC (Exelon), initiated the proposed Federal action by submitting an application for license renewal of LaSalle County Station, Units 1 and 2 (LSCS), for which the existing licenses (NPF-11 and NPF-18) expire on April 17, 2022, and December 16, 2023, respectively. The NRC’s Federal action is to decide whether to renew the licenses for an additional 20 years.
1.2 Purpose and Need for Proposed Federal Action
The purpose and need for the proposed action (issuance of renewed licenses) is to provide an option that allows for power generation capability beyond the term of a current nuclear power plant operating license to meet future system generating needs, as such needs may be determined by other energy-planning decisionmakers. This definition of purpose and need reflects the NRC’s recognition that, unless there are findings in the safety review required by the AEA or findings in the NEPA environmental analysis that would lead the NRC to reject a license renewal application (LRA), the NRC does not have a role in the energy-planning decisions of state regulators and utility officials as to whether a particular nuclear power plant should continue to operate.
1.3 Major Environmental Review Milestones
Exelon submitted an Environmental Report (ER) (Exelon 2014a) as part of its LRA (Exelon 2014b) in December 2014. After reviewing the LRA and ER for sufficiency, the NRC staff published a Federal Register Notice of Acceptability and Opportunity for Hearing (Volume 80 of the Federal Register (FR), page 5822 (80 FR 5822)) on February 3, 2015. Also, on February 3, 2015, the NRC published another notice in the Federal Register (80 FR 5793) on the intent to conduct scoping, thereby beginning the 60-day scoping period. The NRC staff held two public scoping meetings on March 10, 2015, in Ottawa, Illinois. In a letter dated July 2, 2015, the NRC issued a report entitled, “Environmental Impact Statement Scoping Process Summary Report, LaSalle County Station, Units 1 and 2, Brookfield Township,
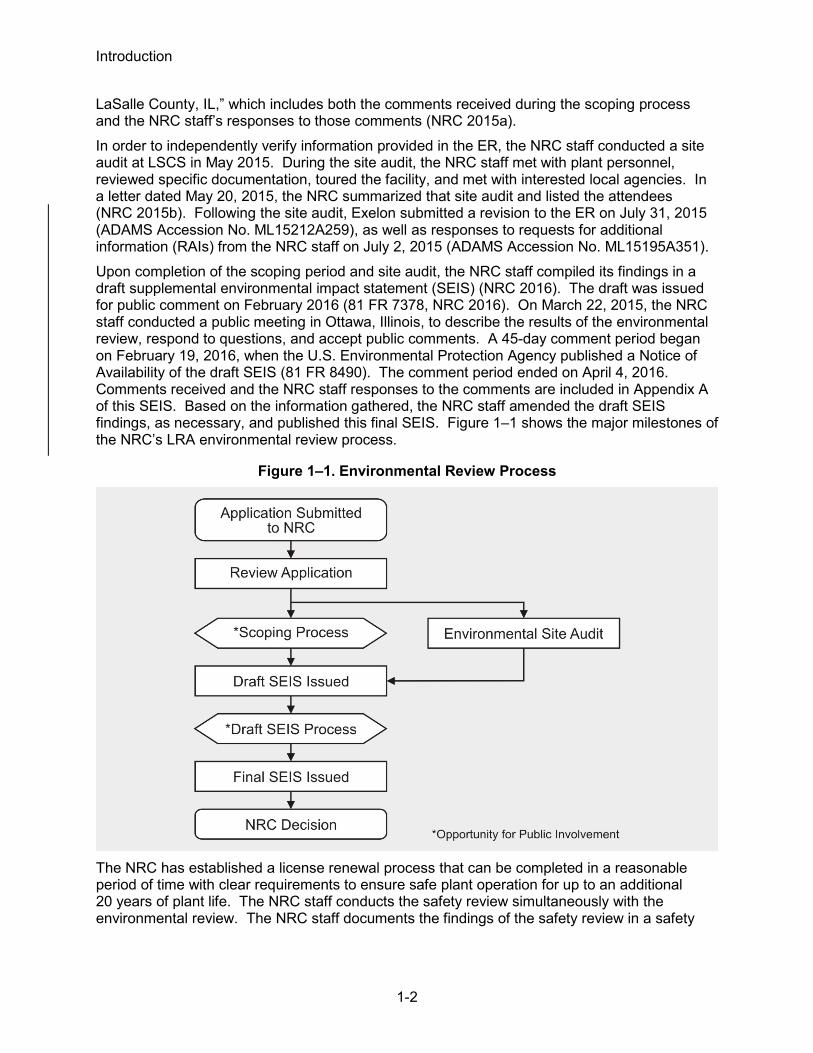
Introduction
1-2
LaSalle County, IL,” which includes both the comments received during the scoping process and the NRC staff’s responses to those comments (NRC 2015a). In order to independently verify information provided in the ER, the NRC staff conducted a site audit at LSCS in May 2015. During the site audit, the NRC staff met with plant personnel, reviewed specific documentation, toured the facility, and met with interested local agencies. In a letter dated May 20, 2015, the NRC summarized that site audit and listed the attendees (NRC 2015b). Following the site audit, Exelon submitted a revision to the ER on July 31, 2015 (ADAMS Accession No. ML15212A259), as well as responses to requests for additional information (RAIs) from the NRC staff on July 2, 2015 (ADAMS Accession No. ML15195A351). Upon completion of the scoping period and site audit, the NRC staff compiled its findings in a draft supplemental environmental impact statement (SEIS) (NRC 2016). The draft was issued for public comment on February 2016 (81 FR 7378, NRC 2016). On March 22, 2015, the NRC staff conducted a public meeting in Ottawa, Illinois, to describe the results of the environmental review, respond to questions, and accept public comments. A 45-day comment period began on February 19, 2016, when the U.S. Environmental Protection Agency published a Notice of Availability of the draft SEIS (81 FR 8490). The comment period ended on April 4, 2016. Comments received and the NRC staff responses to the comments are included in Appendix A of this SEIS. Based on the information gathered, the NRC staff amended the draft SEIS findings, as necessary, and published this final SEIS. Figure 1–1 shows the major milestones of the NRC’s LRA environmental review process.
Figure 1–1. Environmental Review Process
The NRC has established a license renewal process that can be completed in a reasonable period of time with clear requirements to ensure safe plant operation for up to an additional 20 years of plant life. The NRC staff conducts the safety review simultaneously with the environmental review. The NRC staff documents the findings of the safety review in a safety

Introduction
1-3
evaluation report (SER). The findings in the SEIS and the SER are both factors in the NRC’s decision to either grant or deny the issuance of a renewed license.
1.4 Generic Environmental Impact Statement
The NRC staff performed a generic assessment of the environmental impacts associated with license renewal to improve the efficiency of its license renewal review. NUREG–1437, Generic Environmental Impact Statement for License Renewal of Nuclear Power Plants (GEIS) (NRC 1996, 1999, 2013), documents the results of the NRC staff’s systematic approach to evaluate the environmental consequences of renewing the licenses of individual nuclear power plants and operating them for an additional 20 years. The NRC staff analyzed in detail, and resolved, those environmental issues that could be resolved generically in the GEIS. The NRC originally issued the GEIS in 1996, issued Addendum 1 to the GEIS in 1999, and issued Revision 1 to the GEIS in 2013. Unless otherwise noted, all references to the GEIS include Addendum 1 and Revision 1 to the GEIS. The GEIS establishes separate environmental impact issues for the NRC staff to independently verify. Of these issues, the NRC staff determined that some issues are generic to all plants (Category 1). Other issues do not lend themselves to generic consideration (Category 2 or uncategorized). The NRC staff evaluated these issues on a site-specific basis in the SEIS. Appendix B to Subpart A of 10 CFR Part 51 summarizes the NRC staff’s findings in the GEIS. For each potential environmental issue, the NRC staff does the following in the GEIS:
• describes the activity that affects the environment;
• identifies the population or resource that is affected;
• assesses the nature and magnitude of the impact on the affected population or resource;
• characterizes the significance of the effect for both beneficial and adverse effects;
• determines whether the results of the analysis apply to all plants; and
• considers whether additional mitigation measures would be warranted for impacts that would have the same significance level for all plants.
The NRC established its standard of significance for impacts using the Council on Environmental Quality terminology for “significant.” The NRC established three levels of significance for potential impacts—SMALL, MODERATE, and LARGE, as defined below. SMALL: Environmental effects are not detectable or are so minor that they will neither destabilize nor noticeably alter any important attribute of the resource. MODERATE: Environmental effects are sufficient to alter noticeably, but not to destabilize, important attributes of the resource. LARGE: Environmental effects are clearly noticeable and are sufficient to destabilize important attributes of the resource.
Significance indicates the importance of likely environmental impacts and is determined by considering two variables: context and intensity. Context is the geographic, biophysical, and social context in which the effects will occur. Intensity refers to the severity of the impact in whatever context it occurs.

Introduction
1-4
The GEIS includes a determination of whether the analysis of the environmental issue could be applied to all plants and whether additional mitigation measures would be warranted. Issues are assigned a Category 1 or a Category 2 designation. As set forth in the GEIS, Category 1 issues are those that meet the following criteria:
• The environmental impacts associated with the issue have been determined to apply either to all plants or, for some issues, to plants having a specific type of cooling system or other specified plant or site characteristics.
• A single significance level (i.e., SMALL, MODERATE, or LARGE) has been assigned to the impacts (except for collective offsite radiological impacts from the fuel cycle and from high-level waste and spent fuel disposal).
• Mitigation of adverse impacts associated with the issue has been considered in the analysis, and it has been determined that additional plant-specific mitigation measures are likely not to be sufficiently beneficial to warrant implementation.
For generic issues (Category 1), no additional site-specific analysis is required in the SEIS unless new and significant information is identified. The process for identifying new and significant information for site-specific analysis is presented in Chapter 4. Site-specific issues (Category 2) are those that do not meet one or more of the criteria of Category 1 issues; therefore, additional site-specific review for these issues is required. A site-specific analysis is required for 17 of those 78 issues evaluated in the GEIS. Figure 1–2 illustrates this process. The results of that site-specific review are documented in the SEIS.

Introduction
1-5
Figure 1–2. Environmental Issues Evaluated for License Renewal
1.5 Supplemental Environmental Impact Statement
The SEIS presents an analysis that considers the environmental effects of the continued operation of LSCS, alternatives to license renewal, and mitigation measures for minimizing adverse environmental impacts. Chapter 4 contains analysis and comparison of the potential environmental impacts from alternatives. Chapter 5 presents the NRC’s recommendation on whether the environmental impacts of license renewal are so great that preserving the option of license renewal would be unreasonable. The final recommendation considered comments received on the draft SEIS during the public comment period. In the preparation of the SEIS for LSCS, the NRC staff carried out the following activities:
• reviewed the information provided in Exelon’s ER;
• consulted with Federal, State, Tribal, and local agencies;

Introduction
1-6
• conducted an independent review of the issues during site audit; and
• considered the public comments received for the review (during the scoping process) and received on the draft SEIS.
New information can be identified from many sources, including the applicant, the NRC, other agencies, or public comments. If a new issue is revealed, it is first analyzed to determine whether it is within the scope of the license renewal environmental evaluation. If the new issue is not addressed in the GEIS, the NRC staff would determine the significance of the issue and document the analysis in the SEIS.
1.6 Decisions to Be Supported by the SEIS
The decision to be supported by the SEIS is whether to renew the operating licenses for LSCS for an additional 20 years. The NRC decision standard is specified in 10 CFR 51.103(a)(5), as follows:
In making a final decision on a license renewal action pursuant to Part 54 of this chapter, the Commission shall determine whether or not the adverse environmental impacts of license renewal are so great that preserving the option of license renewal for energy planning decisionmakers would be unreasonable.
There are many factors that the NRC takes into consideration when deciding whether to renew the operating license of a nuclear power plant. The analyses of environmental impacts evaluated in this GEIS will provide the NRC’s decisionmaker (in this case, the Commission) with important environmental information for use in the overall decisionmaking process. There are also decisions outside the regulatory scope of license renewal that cannot be made on the basis of the GEIS analysis. These decisions include the following issues: changes to plant cooling systems, disposition of spent nuclear fuel, emergency preparedness, safeguards and security, need for power, and seismicity and flooding (NRC 2013).
1.7 Cooperating Agencies
During the scoping process, no Federal, State, or local agencies were identified as cooperating agencies in the preparation of this SEIS.
1.8 Consultations
The Endangered Species Act of 1973, as amended (ESA) (16 U.S.C. 1531 et seq.); the Magnuson–Stevens Fisheries Conservation and Management Act of 1996, as amended (MSA) (16 U.S.C. 1801 et seq.); and the National Historic Preservation Act of 1966, as amended (NHPA) (54 U.S.C. 300101 et seq.), require Federal agencies to consult with applicable State and Federal agencies and groups before taking action that may affect endangered species, fisheries, or historic and archaeological resources, respectively. The NRC consulted with the following agencies and groups; Appendix C provides a discussion of the consultation documents:
• U.S. Fish and Wildlife Service (FWS);
New and significant information. To merit additional review, information must be both “new” and “significant” (i.e., presenting a seriously different picture of the impacts from those envisioned in the GEIS) and bear on the proposed action or its impacts.

Introduction
1-7
• Illinois Historic Preservation Agency;
• Advisory Council on Historic Preservation;
• Ho-Chunk Nation;
• Miami Tribe of Oklahoma;
• Peoria Tribe of Indians of Oklahoma;
• Citizen Potawatomi Nation;
• Sac and Fox Tribe of the Mississippi in Iowa/Meskwaki Nation;
• Sac and Fox Nation of Missouri in Kansas and Nebraska;
• Sac and Fox Nation;
• Pokagon Band of Potawatomi;
• Forest County Potawatomi;
• Hannahville Indian Community, Band of Potawatomi;
• Prairie Band Potawatomi Nation;
• Winnebago Tribe of Nebraska;
• Kickapoo Tribe in Kansas; and
• Kickapoo Tribe of Oklahoma.
1.9 Correspondence
During the course of the environmental review, the NRC staff contacted Federal, State, regional, local, and Tribal agencies listed in Section 1.8. Appendix C lists the correspondence associated with the ESA, MSA, and NHPA. Appendix D lists all other correspondence.
1.10 Status of Compliance
Exelon is responsible for complying with all applicable NRC regulations and other applicable Federal, State, and local requirements. Appendix F of the GEIS describes some of the major applicable Federal statutes. There are numerous permits and licenses issued by Federal, State, and local authorities for activities at LSCS. Appendix B contains further information about LSCS’s status of compliance.
1.11 Related Federal and State Activities
The NRC reviewed the possibility that activities of other Federal agencies might impact the renewal of the operating licenses for LSCS. There are no Federal projects that would make it necessary for another Federal agency to become a cooperating agency in the preparation of this SEIS. There are no known American Indian lands within 50 miles (mi) (80 kilometers (km)) of the LSCS. There are three Federally owned facilities within 50 mi (80 km) of the LSCS: (1) Fermi National Accelerator Laboratory, (2) Argonne National Laboratory, and (3) Joliet Army Ammunition Plant.

Introduction
1-8
Section 102(2)(C) of NEPA requires the NRC to consult with, and obtain comments from, any Federal agency that has jurisdiction by law or special expertise with respect to any environmental impact involved in the subject matter of the SEIS. For example, during the course of preparing the SEIS, the NRC consulted with the FWS. Appendix C lists all consultation correspondences.
1.12 References
10 CFR Part 51. Code of Federal Regulations, Title 10, Energy, Part 51, “Environmental protection regulations for domestic licensing and related regulatory functions.” 10 CFR Part 54. Code of Federal Regulations, Title 10, Energy, Part 54, “Requirements for renewal of operating licenses for nuclear power plants.” 80 FR 5793. U.S. Nuclear Regulatory Commission. “LaSalle County Station, Units 1 and 2, notice of intent to prepare an environmental impact statement and conduct the scoping process; public meetings and request for comment.” Federal Register 80(22):5793–5795. February 3, 2015. 80 FR 5822. U.S. Nuclear Regulatory Commission. “LaSalle County Station, Units 1 and 2, license renewal application; opportunity to request a hearing and to petition for leave to intervene.” Federal Register 80(22):5822–5825. February 3, 2015. 81 FR 7378. U. S. Nuclear Regulatory Commission. “License Renewal Application for LaSalle County Station, Units 1 and 2.” Federal Register 81(28) 7378-7379. February 11, 2016. 81 FR 8490. U.S. Environmental Protection Agency. “Environmental Impact Statements; Notice of Availability.” Federal Register 81(33) 8490-84. February 19, 2016. Atomic Energy Act of 1954, as amended. 42 U.S.C. § 2011 et seq. Endangered Species Act of 1973, as amended. 16 U.S.C. § 1531 et seq. [Exelon] Exelon Generation Company, LLC. 2014a. Applicant’s Environmental Report—Operating License Renewal Stage, LaSalle County Station. Exelon. December 9, 2014. Agencywide Documents Access and Management System (ADAMS) Nos. ML14343A883 and ML14343A897. [Exelon] Exelon Generation Company, LLC. 2014b. License Renewal Application, LaSalle County Station, Units 1 and 2. Exelon. December 9, 2014. ADAMS No. ML14343A849. Magnuson–Stevens Fishery Conservation and Management Act of 1996, as amended. 16 U.S.C. § 1801 et seq. National Environmental Policy Act of 1969, as amended. 42 U.S.C. § 4321 et seq. National Historic Preservation Act of 1966, as amended. 16 U.S.C. § 470 et seq. [NRC] U.S. Nuclear Regulatory Commission. 1996. Generic Environmental Impact Statement for License Renewal of Nuclear Plants, Final Report. Washington, DC: NRC. NUREG–1437, Volumes 1 and 2. May 31, 1996. ADAMS Nos. ML040690705 and ML040690738. [NRC] U.S. Nuclear Regulatory Commission. 1999. Section 6.3—Transportation, Table 9.1, “Summary of Findings on NEPA Issues for License Renewal of Nuclear Power Plants.” In: Generic Environmental Impact Statement for License Renewal of Nuclear Plants. Washington, DC: NRC. NUREG–1437, Volume 1, Addendum 1. August 1999. ADAMS No. ML040690720.

Introduction
1-9
[NRC] U.S. Nuclear Regulatory Commission. 2013. Generic Environmental Impact Statement for License Renewal of Nuclear Plants. Washington, DC: NRC. NUREG–1437, Revision 1, Volumes 1, 2, and 3. June 19, 2013. ADAMS No. ML13107A023. [NRC] U.S. Nuclear Regulatory Commission. 2015a. Letter from B.D. Wittick (NRC), Branch Chief, to M.P. Gallagher (Exelon). Subject: Issuance of Scoping Summary Report Associated with the LaSalle County Station, Units 1 and 2, License Renewal Application Environmental Review (TAC Nos. MF5567 and MF5568). July 2, 2015. ADAMS No. ML15147A380. [NRC] U.S. Nuclear Regulatory Commission. 2015b. Letter from B.D. Wittick (NRC), Branch Chief, to M.P. Gallagher (Exelon). Subject: Summary of the License Renewal Environmental Audit for LaSalle County Station, Units 1 and 2 (TAC Nos. MF5567 and MF5568). May 20, 2015. ADAMS No. ML15132A674. [NRC] U. S. Nuclear Regulatory Commission. 2016. Generic Environmental Impact Statement for License Renewal of Nuclear Plants, Supplement 57, Regarding LaSalle County Station, Units 1 and 2, Draft Report for Comment. NUREG–1437, Supplement 57. February 2016. ADAMS No. ML16033A103.


2-1
2.0 ALTERNATIVES INCLUDING THE PROPOSED ACTION
Although the U.S. Nuclear Regulatory Commission’s (NRC’s) decisionmaking authority in license renewal is limited to deciding whether or not to renew a nuclear power plant’s operating license, the NRC’s implementation of the National Environmental Policy Act of 1969 (NEPA), as amended (42 U.S.C. 4321 et seq.), requires consideration of the environmental impacts of potential alternatives to renewing a plant’s operating license. While the ultimate decision about which alternative (or the proposed action) to carry out falls to operator, state, or other non-NRC Federal officials, comparing the environmental impacts of renewing the operating license to the environmental impacts of alternatives allows the NRC to determine whether the environmental impacts of license renewal are so great that preserving the option of license renewal for energy-planning decisionmakers would be unreasonable (Title 10 of the Code of Federal Regulations (10 CFR) 51.95(c)(4)). Energy-planning decisionmakers and owners of the nuclear power plant ultimately decide whether the plant will continue to operate, and economic and environmental considerations play important roles in this decision. In general, the NRC’s responsibility is to ensure the safe operation of nuclear power facilities and not to formulate energy policy or encourage or discourage the development of alternative power generation. The NRC does not engage in energy-planning decisions and makes no judgment as to which energy alternatives evaluated would be the most likely alternative in any given case. The remainder of this chapter provides (1) a description of the proposed action, (2) a description of alternatives to the proposed action (including the no-action alternative), and (3) alternatives to LaSalle County Station, Units 1 and 2 (LSCS) license renewal that were considered and eliminated from detailed study. Chapter 4 of this plant-specific supplemental environmental impact statement (SEIS) compares the impacts of renewing the operating licenses of LSCS and continued plant operations to the environmental impacts of alternatives.
2.1 Proposed Action
As stated in Section 1.1 of this document, the NRC’s proposed Federal action is the decision of whether to renew the LSCS operating licenses for an additional 20 years. For the NRC to determine the impacts from continued operation of LSCS, an understanding of that operation is needed. Section 2.1.1 describes normal power plant operations during the license renewal term. LSCS is a two-unit, nuclear-powered steam-electric generating facility that began commercial operation in January 1984 (Unit 1) and October 1984 (Unit 2). The nuclear reactors at both units are General Electric boiling water reactors (BWRs), and together they produce an annual average net output of 2,327 megawatts electric (MWe) (Exelon 2014).
2.1.1 Plant Operations during the License Renewal Term
Most plant operation activities during license renewal would be the same as, or similar to, those occurring during the current license term (NRC 2013). Section 2.1.1 of NUREG–1437, Generic Environmental Impact Statement for License Renewal of Nuclear Power Plants (GEIS), Revision 1 (NRC 2013), describes the general types of activities that are carried out during the operation of a nuclear power plant, such as LSCS, as follows:
• reactor operation;
• waste management;
Alternatives Including the Proposed Action
2-2
• security;
• office and clerical work;
• surveillance, monitoring, and maintenance; and
• refueling and other outages. As stated in the Exelon Generation Company, LLC’s (Exelon’s) Environmental Report (ER) (Exelon 2014), LSCS will continue to operate during the license renewal term in the same manner as it does during the current license term except for, as appropriate, additional aging management programs to address structure and component aging in accordance with 10 CFR Part 54, “Requirements for Renewal of Operating Licenses for Nuclear Power Plants.”
2.1.2 Refurbishment and Other Activities Associated with License Renewal
Refurbishment activities include replacement and repair of major systems, structures, and components. For example, replacement activities may include replacement of recirculation piping systems for BWRs. The intent of the major refurbishment class of activities characterized in the GEIS (NRC 2013) is to encompass actions that typically take place only once in the life of a nuclear plant, if at all. Refurbishment activities may have an impact on the environment beyond those that occur during normal operations and may require evaluation depending on the type of action and the plant-specific design. In preparation for its license renewal application, Exelon performed an evaluation of LSCS structures, systems, and components in accordance with 10 CFR 54.21, “Contents of application—technical information,” to identify whether any major refurbishment activities would be necessary to support the continued operation of LSCS during the proposed 20-year period of extended operation (Exelon 2014). Exelon did not identify any major refurbishment or replacement activities needed to support the continued operation of LSCS beyond the existing operating license term (Exelon 2014). Therefore, these activities are not discussed under the proposed action in Chapter 4.
2.1.3 Termination of Nuclear Power Plant Operations and Decommissioning after the License Renewal Term
NUREG–0586, Generic Environmental Impact Statement on Decommissioning of Nuclear Facilities: Supplement 1, Regarding the Decommissioning of Nuclear Power Reactors, Final Report, describes the impacts of decommissioning (NRC 2002). Most activities associated with plant operations would cease with reactor shutdown. Some activities (e.g., security and oversight of spent nuclear fuel) would remain unchanged, whereas others (e.g., waste management; office and clerical work; laboratory analysis; and surveillance, monitoring, and maintenance) would continue at reduced or altered levels. Systems dedicated to reactor operations would cease operations; however, impacts from their physical presence may continue if they are not removed after reactor shutdown. For multiple-unit sites, such as LSCS, if one unit is shut down, then shared systems may operate at reduced capacities. Impacts associated with dedicated systems that remain in place or shared systems that continue to operate at normal capacities would remain unchanged. Decommissioning will occur whether LSCS is shut down at the end of its current operating license term or at the end of the period of extended operation. There are no site-specific issues related to decommissioning. The license renewal GEIS concludes that license renewal would have a negligible (SMALL) effect on the impacts of terminating operations and decommissioning on all resources.

Alternatives Including the Proposed Action
2-3
2.2 Alternatives
As stated above, the NRC has the obligation to consider reasonable alternatives to the proposed action of renewing the licenses for the nuclear reactors at LSCS. To be reasonable, a replacement power alternative must be commercially viable on a utility scale and operational prior to the expiration of the reactor’s operating licenses, or expected to become commercially viable on a utility scale and operational prior to the expiration of the reactor’s operating licenses (NRC 2013). The 2013 GEIS update incorporated the latest information on replacement power alternatives; however, rapidly evolving technologies are likely to outpace the information presented in the GEIS. As such, a site-specific analysis of alternatives must be performed for each SEIS, taking into account changes in technology and science since the preparation of the GEIS. Section 2.2.1 below describes the no-action alternative (i.e., the NRC takes no action and does not issue renewed licenses for LSCS). Sections 2.2.2.1–2.2.2.5 describe the characteristics of replacement power alternatives for LSCS.
2.2.1 No-Action Alternative
At some point, operating nuclear power plants will terminate operations and undergo decommissioning. The no-action alternative represents a decision by the NRC not to renew the operating license of a nuclear power plant beyond the current operating license term. Under the no-action alternative, the NRC does not renew the operating licenses, and the LSCS plant shuts down at or before the end of the current licenses in 2022 and 2023. After shutdown, plant operators will initiate decommissioning in accordance with 10 CFR 50.82, “Termination of License.” Only those impacts that arise directly as a result of plant shutdown will be addressed in this SEIS. The environmental impacts from decommissioning and related activities are addressed in several other documents, including the decommissioning GEIS (NRC 2002); the license renewal GEIS, Chapter 4 (NRC 2013); and Chapter 4 of this SEIS. These analyses either directly address or bound the environmental impacts of decommissioning whenever Exelon ceases to operate LSCS. Even with renewed operating licenses, LSCS will eventually shut down, and the environmental impacts addressed later in Chapter 4 of this SEIS will occur at that time. As with decommissioning impacts, shutdown impacts are expected to be similar whether they occur at the end of the current license term or at the end of a renewed license term. Termination of operations at LSCS would result in the total cessation of electrical power production. Unlike the alternatives described in Section 2.2.2, the no-action alternative does not meet the purpose and need of the proposed action because it does not provide a means of delivering utility scale power to meet future electric system needs. Given the current need for the power generated by LSCS, the no-action alternative would likely create a need for a replacement power alternative. A full range of replacement power alternatives (including new nuclear, fossil fuels, and renewable energy sources) are described in the following section, and their potential impacts are assessed in Chapter 4. Although the NRC’s authority only extends to the decision of whether to renew the LSCS operating licenses, the replacement power alternatives described in the following sections represent possible options for energy-planning decisionmakers should the NRC choose not to renew the LSCS operating licenses.

Alternatives Including the Proposed Action
2-4
2.2.2 Replacement Power Alternatives
In evaluating alternatives to license renewal, the NRC considered energy technologies or options currently in commercial operation, as well as technologies not currently in commercial operation but likely to be commercially available by the time the current LSCS operating licenses expire. The current operating licenses for the LSCS, Units 1 and 2, expire on April 17, 2022, and December 16, 2023, respectively. Alternatives that are not likely to be constructed, permitted, and connected to the grid by the time the LSCS licenses expire were eliminated from detailed consideration. Alternatives that cannot provide the equivalent of LSCS’s current generating capacity and, in some cases, those alternatives whose costs or benefits do not justify inclusion in the range of reasonable alternatives, were not considered in detail. Each alternative removed from detailed study is briefly discussed, and the basis for its removal is provided in Section 2.3. In total, 17 alternatives to the proposed action were considered (see text box) and then narrowed to the 5 alternatives considered in Sections 2.2.2.1–2.2.2.5. The NRC staff evaluated the environmental impacts of these five alternatives and the no-action alternative. They are discussed in depth in Chapter 4 of this SEIS. The GEIS presents an overview of some energy technologies but does not reach conclusions about which alternatives are most appropriate. Because many energy technologies are continually evolving in capability and cost and because regulatory structures have changed to either promote or impede development of particular alternatives, the analyses in this chapter may include updated information from the following sources:
• U.S. Department of Energy (DOE), U.S. Energy Information Administration (EIA),
• other offices within the DOE,
• U.S. Environmental Protection Agency (EPA),
• industry sources and publications, and
• information submitted by Exelon in its ER. The evaluation of each alternative in Chapter 4 of this SEIS considers the environmental impacts across several impact categories: land use and visual resources, air quality and noise, geologic environment, water resources, ecological resources, historic and cultural resources, socioeconomics, human health, environmental justice, and waste management. Most site-specific issues (Category 2) have been assigned a significance level of SMALL, MODERATE, or LARGE. For ecological and historic and archaeological resources, the impact significance determination language is specific to the authorizing legislation (e.g., Endangered Species Act of 1973, as amended (16 U.S.C. 1531 et seq.), and National Historic Preservation Act of 1966, as amended (16 U.S.C. 470 et seq.)). The order of presentation of the alternatives is not meant to imply increasing or decreasing level of impact. Nor does it imply that an energy-planning decisionmaker would be more likely to select any given alternative. To ensure that the alternatives analysis is consistent with state or regional energy policies, the NRC reviewed energy-related statutes, regulations, and policies within the LSCS region. As a result, the staff considers alternatives that include wind power or solar photovoltaic (PV) power, as well as a combination that includes both of them. Region of Influence LSCS is owned and operated by Exelon and provides electricity to the region of influence (ROI) through transmission lines owned by Commonwealth Edison (ComEd) (Exelon 2014). ComEd
Alternatives Including the Proposed Action
2-5
operates under the PJM Interconnection, LLC (PJM), a regional transmission organization that coordinates the movement of wholesale electricity in 13 states across the Midwest and Northeast (Exelon 2014). ComEd provides service to 3.8 million customers across northern Illinois. Its service territory borders Iroquois County to the south, the Wisconsin border to the north, the Iowa border to the west, and the Indiana border to the east (ComEd 2015). However, electricity consumption in Illinois is not limited to electricity that is generated within the State. Although northern Illinois relies on electricity from ComEd, the rest of Illinois and surrounding states, which are not part of the PJM, are part of the Midcontinent Independent System Operator, Inc. (MISO) (see Figure 2–1) (Exelon 2014). If renewed licenses were not issued, replacement power for LSCS would be required in northern Illinois. Electricity could be replaced by generation sources from a variety of locations. Electricity could be transported from within the PJM; however, the PJM in Illinois is geographically distant from the rest of the PJM region (see Figure 2–1). It is also possible that electricity within MISO could be purchased by PJM, and efforts are currently being made to increase coordination and deliverability between the regional transmission organizations (Ott 2013b). In addition, the State of Illinois has a renewable portfolio standard that includes a stipulation that eligible renewable resources must be procured from facilities located in Illinois or the States that adjoin Illinois (Wisconsin, Indiana, Iowa, Kentucky, Michigan, and Missouri) (ILGA 2011). Renewable resources can be obtained only from other regions of the country if they are not available in Illinois or in the adjoining States (ILGA 2011). Because replacement power would be required in northern Illinois, and any renewable energy resources would need to be procured from facilities in Illinois or the adjoining States, the NRC staff evaluated the impacts of locating replacement power facilities within the States of Illinois, Indiana, Iowa, Kentucky, Michigan, Missouri, and Wisconsin. These seven states constitute the ROI for the NRC staff’s analysis of alternatives. The NRC assumes that replacement power would either be produced in northern Illinois within the PJM region or would be purchased by PJM from MISO. In 2012, electric generators in the ROI had a net summer generating capacity of approximately 179,000 megawatts (MW). This capacity included units fueled by coal (49 percent), natural gas (27 percent), nuclear (11 percent), and wind (6.6 percent) (EIA 2014c). In 2011, the electric industry in the ROI provided approximately 744 million megawatt hours (MWh) of electricity. Electricity produced in the ROI was dominated by coal (67 percent) and nuclear (21 percent). Although natural gas makes up nearly 30 percent of the installed generating capacity in the ROI, it provides only 6 percent of electricity in the region. Nonhydroelectric renewable energy produced 1.3 percent of the electricity in the ROI (EIA 2014b).
Alternatives Evaluated in Depth: • new nuclear • coal-integrated gasification combined-cycle • natural gas combined-cycle • combination alternative (wind power, natural
gas combined-cycle, and solar power) • purchased power Other Alternatives Considered: • energy efficiency and conservation • supercritical pulverized coal • wind power • solar power • hydroelectric power • wave and ocean energy • geothermal power • municipal solid waste • biomass • oil-fired power • fuel cells • delayed retirement

Alternatives Including the Proposed Action
2-6
Figure 2–1. Territories of MISO and PJM Interconnection
Source: MISO-PJM undated
Renewable Energy Legislation in the Region of Influence Renewable energy legislation in Illinois allows the purchase of electricity generation in adjoining States; therefore, any legislation targeting renewable energy in these States could impact a State’s incentive to develop renewable resources. Five States in the ROI (Illinois, Iowa, Missouri, Wisconsin, and Michigan) have legally mandated renewable energy programs. The State of Indiana has a voluntary program, and State of Kentucky does not have any renewable energy requirements. The paragraphs below briefly outline each State’s program, including renewable energy goals and benchmarks. In August 2007, Illinois adopted a renewable portfolio standard that requires the State’s utilities to produce at least 25 percent of their power from renewable sources by 2025, 75 percent of which must come from wind. Solar PV must comprise 6 percent of the annual requirement for calendar year 2015 and thereafter. Other eligible sources include biomass and existing hydroelectric power (DSIRE 2015a). The law also includes an energy efficiency standard that requires utilities to implement cost-effective energy efficiency measures to meet energy savings of 2 percent by calendar year 2016 and thereafter (ILGA 2011). For electric utilities (including ComEd), eligible resources must be located in Illinois; resources can be purchased from adjoining States only if there are insufficient in-State resources (ILGA 2011). Iowa’s Alternative Energy Production Law requires the State’s two investor-owned utilities to generate a combined total of 105 MW of their generating capacity from renewable energy sources. A 2007 order allows the utilities to participate in renewable energy credit trading programs by distinguishing between renewable electricity production capacity used to comply with Iowa law and that which can be used to satisfy other states’ renewable portfolio standards (DSIRE 2014). Missouri adopted a renewable portfolio standard that requires investor-owned utilities to increase their use of renewable sources by 15 percent by 2021 and includes a provision specifying that 2 percent of the renewable portfolio standard requirement must be met by solar energy. Resources can be purchased from outside Missouri, but renewable energy generated in-State receives a multiplier of 1.25 compared to out-of-State generation (DSIRE 2015b).

Alternatives Including the Proposed Action
2-7
Wisconsin’s renewable portfolio standard requires utilities to produce 10 percent of their electricity from renewable sources by 2015. Included in the renewable portfolio standard is a provision that allows electricity providers to create and sell or transfer renewable resource credits and renewable energy certificates. Renewable energy generated outside Wisconsin is eligible, provided that the electricity is distributed to Wisconsin customers (DSIRE 2015c). Michigan enacted a Renewable Energy Standard in 2008 that requires utilities to generate 10 percent of their retail electricity sales from renewable energy resources by 2015. The standard also allows energy efficiency and advanced cleaner energy systems to meet part of the requirement. Renewable energy credits can be purchased from in-State or out-of-State facilities, provided that the facilities are located within the retail electric service territory of a utility that is recognized by the Michigan Public Service Commission (DSIRE 2015d). Indiana does not have a mandatory renewable or alternative energy portfolio standard. On July 9, 2012, Indiana adopted a Clean Energy Portfolio Standard, which sets a voluntary goal of 10 percent clean energy by 2025, based on the amount of electricity supplied by the utility in 2010. Unlike many of the other ROI states, up to 30 percent of the goal may be met with clean coal technology, nuclear energy, combined heat and power systems, natural gas that displaces electricity from coal, and net-metered distributed generation facilities. Fifty percent of qualifying energy must come from within the State. Utilities that participate in the program and meet the program goals are eligible for incentives that are used to pay for the compliance projects (DSIRE 2015e). Kentucky is the only State in the ROI that does not have mandatory or voluntary renewable energy requirements. Given known technological and demographic trends, the EIA predicts that 34 percent of electricity in the United States will be generated by coal in 2040 (EIA 2015). Natural gas generation rose from 16 percent in 2000 to 27 percent in 2013 and is projected to increase to 31 percent in 2040 (EIA 2013a, 2015). Electricity generation from renewable energy is expected to grow from 13 percent of total generation in 2013 to 18 percent in 2040 (EIA 2015). However, there are uncertainties that could affect this forecast, particularly the implementation of policies aimed at reducing greenhouse gas emissions, which would have a direct effect on fossil fuel-based generation technologies. The remainder of this section describes replacement power alternatives to license renewal considered in depth. These include a new nuclear alternative in Section 2.2.2.1; a coal-integrated gasification combined-cycle (IGCC) alternative in Section 2.2.2.2; a natural gas combined-cycle (NGCC) alternative in Section 2.2.2.3; a combination natural gas, wind, and solar power alternative in Section 2.2.2.4; and a purchased power alternative in Section 2.2.2.5. Table 2–1 summarizes key design characteristics of the alternative technologies evaluated in depth. The environmental impacts of these alternatives are evaluated in Chapter 4.
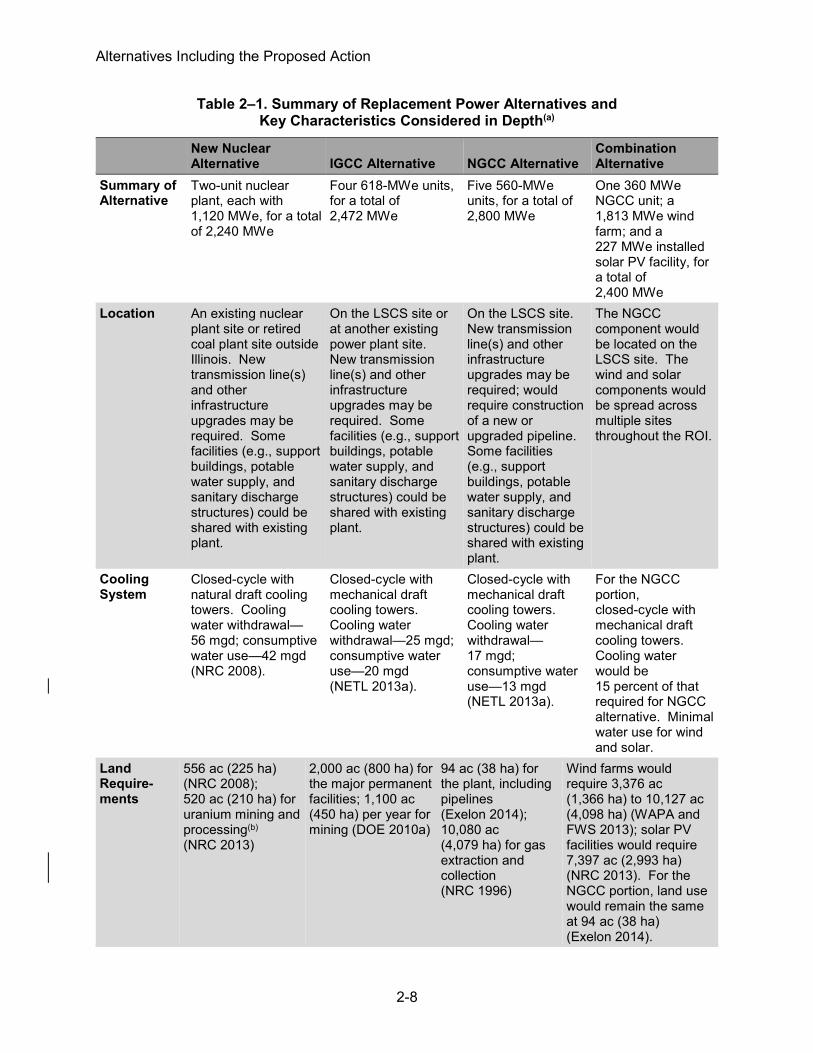
Alternatives Including the Proposed Action
2-8
Table 2–1. Summary of Replacement Power Alternatives and Key Characteristics Considered in Depth(a)
New Nuclear Alternative IGCC Alternative NGCC Alternative
Combination Alternative
Summary of Alternative
Two-unit nuclear plant, each with 1,120 MWe, for a total of 2,240 MWe
Four 618-MWe units, for a total of 2,472 MWe
Five 560-MWe units, for a total of 2,800 MWe
One 360 MWe NGCC unit; a 1,813 MWe wind farm; and a 227 MWe installed solar PV facility, for a total of 2,400 MWe
Location An existing nuclear plant site or retired coal plant site outside Illinois. New transmission line(s) and other infrastructure upgrades may be required. Some facilities (e.g., support buildings, potable water supply, and sanitary discharge structures) could be shared with existing plant.
On the LSCS site or at another existing power plant site. New transmission line(s) and other infrastructure upgrades may be required. Some facilities (e.g., support buildings, potable water supply, and sanitary discharge structures) could be shared with existing plant.
On the LSCS site. New transmission line(s) and other infrastructure upgrades may be required; would require construction of a new or upgraded pipeline. Some facilities (e.g., support buildings, potable water supply, and sanitary discharge structures) could be shared with existing plant.
The NGCC component would be located on the LSCS site. The wind and solar components would be spread across multiple sites throughout the ROI.
Cooling System
Closed-cycle with natural draft cooling towers. Cooling water withdrawal—56 mgd; consumptive water use—42 mgd (NRC 2008).
Closed-cycle with mechanical draft cooling towers. Cooling water withdrawal—25 mgd; consumptive water use—20 mgd (NETL 2013a).
Closed-cycle with mechanical draft cooling towers. Cooling water withdrawal—17 mgd; consumptive water use—13 mgd (NETL 2013a).
For the NGCC portion, closed-cycle with mechanical draft cooling towers. Cooling water would be 15 percent of that required for NGCC alternative. Minimal water use for wind and solar.
Land Require-ments
556 ac (225 ha) (NRC 2008); 520 ac (210 ha) for uranium mining and processing(b) (NRC 2013)
2,000 ac (800 ha) for the major permanent facilities; 1,100 ac (450 ha) per year for mining (DOE 2010a)
94 ac (38 ha) for the plant, including pipelines (Exelon 2014); 10,080 ac (4,079 ha) for gas extraction and collection (NRC 1996)
Wind farms would require 3,376 ac (1,366 ha) to 10,127 ac (4,098 ha) (WAPA and FWS 2013); solar PV facilities would require 7,397 ac (2,993 ha) (NRC 2013). For the NGCC portion, land use would remain the same at 94 ac (38 ha) (Exelon 2014).

Alternatives Including the Proposed Action
2-9
New Nuclear Alternative IGCC Alternative NGCC Alternative
Combination Alternative
Work Force 3,500 workers during peak construction; 812 workers during operations (NRC 2008)
4,600 workers during peak construction; 420 workers during operations (DOE 2010a)
1,783 workers during peak construction; 94 workers during operations (Exelon 2014)
Solar PV—600 workers during peak construction, 60 workers during operations (DOE 2010b). Wind—931 workers during construction, 566 workers during operations (DOE 2008). NGCC—number of construction and operations workers would be less than the NGCC alternative but would not be a linear reduction because of the need for a minimum number of workers regardless of the size of the plant.
Key: ac = acres, ha = hectares, IGCC = coal-integrated gasification combined-cycle (alternative), mgd = million gallons per day, MWe = megawatts electric, NGCC = natural gas combined-cycle (alternative), PV = photovoltaic, and ROI = region of influence.
(a) Because of the speculative nature of using purchased power to replace LSCS capacity and because of the inherent variability of characteristics associated with such an approach, this table does not include the purchased power alternative.
(b) This is normalized to model the light water reactor annual fuel requirement. Forty-two percent of this land requirement is temporarily committed land.
Sources: DOE 2008, 2010a, 2010b; Exelon 2014; NETL 2013a; NRC 1996, 2008, 2013; Ong et al. 2013; WAPA and FWS 2013
2.2.2.1 New Nuclear Alternative
In this section, the NRC staff describes the new nuclear alternative. The NRC staff evaluates the environmental impacts from this alternative in Chapter 4. The NRC staff considered the construction of a new nuclear plant to be a reasonable alternative to license renewal. For example, nuclear generation currently provides 21 percent of electricity generation in the ROI (EIA 2014b). Twelve nuclear power plants operate in the ROI; of these, nine plants have received renewed licenses, and two plants have applied for renewed licenses from the NRC (including LSCS) (NRC 2015). In addition, there is interest in new nuclear power plant development in the region; combined operating license (COL) applications have been filed for two new nuclear power plants in the ROI. On July 24, 2008, Union Electric Company submitted a COL application for Callaway Plant, Unit 2, in Callaway County, Missouri, on the existing Callaway site (AmerenUE 2009). However, Ameren UE has since announced that they are canceling their COL application (Barker 2015). An application was also filed in September 2008 for Enrico Fermi Atomic Power Plant, Unit 3, in Monroe County, Michigan, on the existing Fermi site. On May 1, 2015, the NRC issued a COL authorizing DTE Electric Company to build and operate an economic simplified BWR at the Fermi site (Volume 80 of the

Alternatives Including the Proposed Action
2-10
Federal Register, 26302 (80 FR 26302)). The NRC staff determined that there may be sufficient time for Exelon to prepare and submit an application, build, and operate two new nuclear units using a certified design before the LSCS licenses expire in April 2022 and December 2023. In evaluating the new nuclear alternative, the NRC staff assumed that two new nuclear reactors would be built on an existing nuclear or coal power plant site, allowing for the maximum use of existing ancillary facilities at those locations, such as support buildings and transmission infrastructure. In 1987, Illinois enacted a moratorium preventing the construction of new nuclear power plants within the State. Until the moratorium is lifted, a new nuclear alternative would require siting elsewhere in the ROI. For the purposes of this analysis, the NRC relied on the Vogtle Electric Generating Plant (Vogtle), Units 3 and 4 (located in Waynesboro, Georgia), COL environmental impact statement for technological parameters for the new nuclear alternative because the Vogtle, Units 3 and 4, COL considers two new nuclear reactor units with a similar output as LSCS and is representative of the reactors that could be constructed in the ROI before LSCS’s licenses expire (NRC 2011). As such, the NRC staff assumed two Westinghouse AP1000 reactors with a net electrical output of 2,240 MWe would replace LSCS’s current reactors for this alternative. The NRC staff estimated that 324 ac (131 ha) of land would be required on a long-term basis because of permanent facilities, and an additional 232 ac (94 ha) would be disturbed for temporary facilities, a laydown area, and storage of dredge material (NRC 2008). The heat rejection demands of a new nuclear alternative would be similar to those of LSCS. The new reactors may require a new cooling system (including natural draft cooling towers and intake and discharge structures). The NRC staff assumes that water requirements for the new nuclear alternative would be similar to current water use at LSCS. A new onsite transmission line and drinking water wells may be required if insufficient infrastructure occurs on the site. Construction materials would be delivered by a combination of rail spur, truck, and barge, depending on the specific site location. It is possible that modifications would be required to deliver such materials, depending on the existing infrastructure at the site; modifications could include new rail lines or access roads. The NRC staff also considered the installation of multiple small modular reactors as an alternative to renewing the LSCS licenses. The NRC established the Advanced Reactor Program in the Office of New Reactors because of considerable interest in small modular reactors along with anticipated license applications by vendors. Small modular reactors are approximately 300 MW or less, would have lower initial capacity than that of large-scale units, and would have siting flexibility for locations that are not large enough to accommodate traditional nuclear reactors (DOE undated). As of October 2015, no applications for small modular reactors have been submitted to the NRC. The DOE has estimated that the technology may achieve commercial operation by 2021 to 2025 (DOE undated). Because small modular reactors are not expected to be operational at a commercial scale until near the time LSCS’s licenses expire, it is unlikely that eight new small modular reactors (the number of units required to replace LSCS’s current output) could be constructed in the ROI; therefore, this analysis focuses on nuclear generation by larger nuclear units. 2.2.2.2 IGCC Alternative
In this section, the NRC staff describes the IGCC alternative. The NRC staff evaluates the environmental impacts from this alternative in Chapter 4. Coal provides the greatest share of electrical power in the ROI, and in 2010, coal represented 49 percent of installed generation capacity and accounted for 67 percent of all electricity generated in the ROI (EIA 2014b). IGCC is a technology that generates electricity from coal and combines modern coal gasification technology with both gas-turbine and steam-turbine

Alternatives Including the Proposed Action
2-11
power generation. The technology is cleaner than conventional pulverized coal plants because some of the major pollutants are removed from the gas stream before combustion. An IGCC power plant consists of coal gasification and combined-cycle power generation. Coal gasifiers convert coal into a gas (synthesis gas, also referred to as syngas), which fuels the combined-cycle power generating units. The combined-cycle system for a 618-MWe IGCC power plant includes two combustion turbines, two heat recovery steam generators, and a steam turbine. The combined-cycle units combust gas in one or more combustion turbines, and the resulting hot exhaust gas is then used to heat water into steam to drive a steam turbine. The steam turbine then uses the heat from the gas turbine’s exhaust through a heat recovery steam generator to produce additional electricity (DOE 2010a). This two-cycle process has a high rate of efficiency because the exhaust heat that would otherwise be lost is captured and reused. In addition, the power plant would reduce sulfur dioxide, nitrogen oxides, mercury, and particulate emissions by removing constituents from the syngas before combustion. Nearly 100 percent of the nitrogen from the syngas would be removed before combustion in the gas turbines and would result in lower nitrogen oxide emissions compared to conventional coal-fired power plants (DOE 2010a). IGCC power plants have been in operation since the mid-1990s; the Wabash Rice IGCC repowering project in Indiana and the Polk Power Station in Florida are two examples of operating IGCC plants. Recently, there has been an increased interest in new IGCC projects, and multiple new projects have been proposed or have recently begun operations in the United States. The Duke Energy Edwardsport Generation Station (Edwardsport) in Indiana is a 618-MWe IGCC power plant in the ROI that began commercial operation in June 2013. Duke Energy estimates that the IGCC plant will produce 10 times as much power as the retired coal plant it replaced with 70 percent fewer emissions of sulfur dioxide, nitrogen oxides, and particulates. The IGCC plant will reduce carbon emissions per megawatt hour by nearly half compared to conventional coal-fired plants (Duke Energy 2013). In addition, Edwardsport has the potential for carbon capture and geologic sequestration. Space has been reserved at the site for carbon dioxide capture equipment (NETL 2013b). Many IGCC power plants have been designed with carbon capture and storage (CCS) to further reduce carbon dioxide emissions. The Kemper County IGCC project in east-central Mississippi proposes to use CCS to reduce carbon dioxide emissions by almost 70 percent by removing carbon from the syngas post-gasification (DOE 2010a). According to a 2013 National Energy Technology Laboratory (NETL) report, nine IGCC projects totaling over 4,000 MW are currently active; these projects are in the planning stages, or they have begun construction. Thirteen projects have been proposed and subsequently canceled for a variety of reasons, including air quality issues, state laws and regulations, redirected focus on gas-fired generation and renewables, and unanticipated rising costs (NETL 2013c). IGCC technology and proposed projects have experienced a number of setbacks and opposition, hindering IGCC’s ability to fully integrate into the energy market. The most significant roadblock is IGCC’s high capital cost compared to conventional coal-fired power plants. Cost overruns have been experienced at both the Edwardsport IGCC project and the Kemper County IGCC project. FutureGen, an IGCC plant featuring CCS, lost DOE financial support because of escalating cost estimates (Reuters 2012). Other issues include construction timeline overruns, a limited track record for reliable performance, and opposition from an environmental perspective. Despite some of the current setbacks and concerns associated with IGCC projects, the NRC staff considers IGCC technology to be a reasonable source of baseload power to replace LSCS by the time its licenses expire in 2022 and 2023 because of the current regulatory framework and the number of active IGCC plants within the ROI. On August 3, 2015, EPA signed a final
Alternatives Including the Proposed Action
2-12
rule for carbon pollution that would apply to new fossil fuel-fired power plants (80 FR 64661-65120). The action establishes performance standards for utility boilers and IGCC units based on partial implementation of a CCS system as a method of emission reduction. The emission limit for these sources is 1,305 lb carbon dioxide per megawatt hour (CO2/MWh), and any new coal-fired power plants could require CCS in order to achieve this emission limit. Overall, the NRC staff considers IGCC power plants as an alternative to LSCS because the Edwardsport IGCC project in Indiana is currently in operation and because the Kemper County IGCC project in Mississippi is under construction. The technology parameters for these plants are considered the current state of technology and are used here to describe a hypothetical IGCC power plant located on an existing power plant site within the ROI. To replace the electricity that LSCS generates, the NRC staff considered four IGCC units, each with a net capacity of 618 MWe. Various coal sources are available to coal-fired power plants in the ROI. For the purpose of this evaluation, the NRC staff assumes that the IGCC alternative would burn a sub-bituminous coal based on the type of coal used in electric plants in Illinois. The NRC staff presumes that coal burned in Illinois will be representative of coal that would be burned in an IGCC alternative regardless of where it may be located (EIA 2012). The IGCC units would reduce sulfur dioxide, nitrogen oxides, mercury, and particulate emissions by removing constituents from the syngas. In addition, the units would be designed with the potential to add CCS later. Using CCS, carbon dioxide emission would be compressed and piped off site where it could be sold for beneficial use or geologic storage. The IGCC alternative would be located at an existing site (such as an existing power plant site) to maximize availability of infrastructure and to reduce other environmental impacts. Depending on the specific site location, there might be a need to construct new intake and discharge facilities and a new cooling system. The IGCC alternative would use about the same amount of water as LSCS and a similar amount as the Edwardsport IGCC plant. The NRC staff assumes that the cooling system would use a closed-cycle system with mechanical draft cooling towers. This system would withdraw 25 million gallons per day (gpd) (95 million liters per day (Lpd)) of water and would consume 20 million gpd (76 million Lpd). Onsite visible structures could include the boilers, exhaust stacks, intake and discharge structures, mechanical draft cooling towers, transmission lines, and an electrical switchyard. Construction materials would be delivered by a combination of rail spur, truck, and barge, depending on the specific site location. Modifications may be required to deliver such materials; modifications could include new rail lines or access roads. The NRC staff also considered supercritical pulverized coal (SCPC) as an alternative to renewing the LSCS licenses. SCPC was dismissed as the coal alternative because of new regulations aimed at limiting the environmental impacts from conventional pulverized coal plants. The presence of active IGCC plants in the ROI also contributed to the selection of IGCC for analysis. 2.2.2.3 NGCC Alternative
In this section, the NRC staff describes the NGCC alternative. The NRC staff evaluates the environmental impacts from this alternative in Chapter 4. Natural gas represents nearly 30 percent of installed generation capacity in the ROI but provides only 6 percent of all electrical power in the ROI (EIA 2014b, 2014c). Nationwide, the percentage of power generated by natural gas is expected to rise through 2040, although the actual rise in natural gas generation will depend on future natural gas prices (EIA 2013a). The NRC staff considers the construction of an NGCC power plant to be a reasonable alternative to

Alternatives Including the Proposed Action
2-13
license renewal because it is a feasible, commercially available option for providing electrical generating capacity beyond the expiration of LSCS’s current licenses. Baseload NGCC power plants have proven their reliability and can have capacity factors as high as 85 percent. In an NGCC system, electricity is generated using a gas turbine that burns natural gas. A steam turbine uses the heat from gas turbine exhaust through a heat recovery steam generator to produce additional electricity. This two-cycle process has a high rate of efficiency because the exhaust heat that would otherwise be lost is captured and reused. Like other fossil fuel sources, NGCC power plants are a source of greenhouse gases, including carbon dioxide. An NGCC power plant, however, produces significantly fewer greenhouse gases per unit of electrical output than conventional coal-powered plants. To replace the electricity that LSCS generates, the NRC staff considered five NGCC units, each with a net capacity of 560 MWe (NETL 2007). The NRC staff assumes that each plant configuration consists of two combustion turbine generators, two heat recovery steam generators, and one steam turbine generator with mechanical draft cooling towers for heat rejection. The power plant is assumed to incorporate a selective catalytic reduction system to minimize the plant’s nitrogen oxide emissions (NETL 2007). This 2,800-MWe NGCC plant would consume 124 billion cubic feet (3,500 million cubic meters) of natural gas annually, assuming an average heat content of 1,021 British thermal units per cubic foot (EIA 2013c). Natural gas would be extracted from the ground through wells, and then it would be treated to remove impurities and blended to meet pipeline gas standards before being piped through the State pipeline system to the plant site. This NGCC alternative would produce relatively little waste, primarily in the form of spent catalysts used for control of nitrogen oxide emissions. The NGCC alternative would be located on undeveloped land at LSCS to maximize availability of infrastructure and to reduce other environmental impacts. Depending on the specific site location, there might be a need to construct new intake and discharge facilities and a new cooling system. Because NGCC power plants generate much of their power from a gas-turbine combined-cycle plant and because the overall thermal efficiency of this type of plant is high, an NGCC alternative would require less cooling water than LSCS would. This system would withdraw 17 million gpd (64 million Lpd) of water and would consume 13 million gpd (49 million Lpd). The NRC staff assumes that the cooling system would use a closed-cycle system with mechanical draft cooling towers. Onsite visible structures could include the cooling towers, exhaust stacks, intake and discharge structures, transmission lines, natural gas pipelines, and an electrical switchyard. Construction materials could be delivered by a combination of rail spur, truck, and barge. Modifications may be required to deliver such materials; modifications could include new rail lines or access roads. 2.2.2.4 Combination Alternative (NGCC, Wind, and Solar)
In this section, the NRC staff describes the combination alternative to the continued operation of LSCS consisting of an NGCC facility constructed at an existing power plant site and operating in conjunction with land-based wind farms and solar energy facilities, all of which would be located within the ROI. The NRC staff evaluates the environmental impacts from this alternative in Chapter 4. To serve as an effective baseload power alternative to the LSCS reactors, this combination alternative must be capable of providing an equivalent amount of baseload power. For the purpose of this evaluation, the NRC staff presumes that NGCC, wind farms, and solar PV facilities would comprise the combination alternative.

Alternatives Including the Proposed Action
2-14
NGCC Portion of the Combination Alternative To produce its required share of power (360 MWe), the NGCC portion, operating at an expected capacity factor of 85 percent (NETL 2007), would need to have a nameplate rating of approximately 425 MWe. In 2013, the EIA reported that natural gas-fired power plants are generally used infrequently for shorter periods to meet peak demand. Capacity factors for natural gas plants averaged less than 5 percent during off-peak demand hours for most regions of the country. Natural gas is used for these “peaker plants” because natural gas combustion turbines can respond quickly; therefore, they tend to be used to meet short-term increases in electricity demand (EIA 2013d). A report prepared by CITI Research stated that gas-fired power plants can help overcome the intermittent nature of renewable energy (Channell et al. 2012). The peaking aspect of natural gas-fired power plants makes natural gas an ideal addition to an otherwise renewable energy combination alternative. The NRC staff assumed that one new NGCC unit of the type described in Section 2.2.2.3 would be constructed and installed at LSCS with a total net capacity of 360 MWe. The appearance of an NGCC unit would be similar to that of the full NGCC alternative considered in Section 2.2.2.3, although only one unit would be constructed. The NRC staff assumes that the NGCC portion of this alternative, which is assumed to be located at LSCS, would use existing electrical switchyards, substations, and transmission lines. Depending on the existing site conditions, it is possible that intake and discharge structures of the existing cooling system could continue in service but would be connected to a new closed-cycle cooling system. For the purposes of this analysis, the NRC staff assumes that the NGCC portion of the combination would use mechanical draft cooling towers. Wind Portion of the Combination Alternative The NRC staff assumes that the wind-generated power from this combination alternative would come from land-based wind farms, which would be located in the ROI within the States of Illinois, Indiana, Iowa, Kentucky, Michigan, Missouri, or Wisconsin. The wind portion, assuming a capacity factor of 30 percent, would require a nameplate capacity of 6,042 MWe (WAPA and FWS 2013). The American Wind Energy Association reports a total of more than 67,000 MW of installed wind energy capacity nationwide as of June 30, 2015 (DOE 2015). As of June 2015, Texas is by far the leader in installed land-based capacity with 15,635 MW. Two States in the ROI have the third and fifth largest installed capacity: Iowa with 5,708 MW, followed by Illinois with 3,667 MW (DOE 2015). The installed wind capacity in the ROI has been increasing annually by 1,000 MWe to 2,500 MWe in each of the past 8 years, for a total of over 13,000 MWe of additional wind capacity from 2007 to 2014 (DOE 2015). Therefore, the NRC staff considers 6,042 MW of wind energy to be a reasonable amount by the time the LSCS licenses expire in 2022 and 2023. As is the case with other renewable energy sources, the feasibility of wind resources serving as alternative baseload power is dependent on the location (relative to expected load centers), value, accessibility, and constancy of the resource. Wind energy must be converted to electricity at or near the point where it is extracted, and there are limited energy storage opportunities available to overcome the intermittency and variability of wind resources. At the current stage of wind energy technology development, wind resources in wind power class 3 and higher are suitable for most utility scale applications (NREL 2014a). Wind power class 3 is defined as having a wind speed of 15.7 miles per hour (7.0 meters per second) and a wind density of 500 watts per square meter at 164 ft (50 m) (NREL 2014a). Each State in the ROI, other than Kentucky, has wind resources meeting this power class, with the highest concentrations occurring in Iowa and Illinois (NREL 2015a).
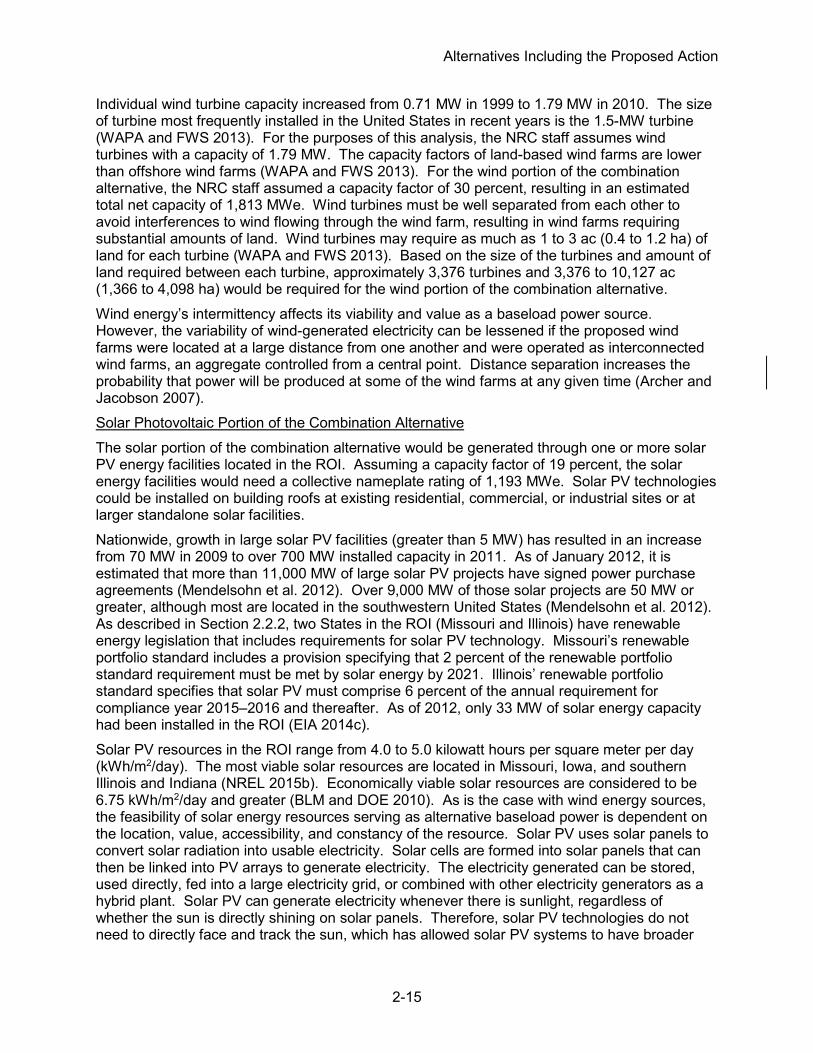
Alternatives Including the Proposed Action
2-15
Individual wind turbine capacity increased from 0.71 MW in 1999 to 1.79 MW in 2010. The size of turbine most frequently installed in the United States in recent years is the 1.5-MW turbine (WAPA and FWS 2013). For the purposes of this analysis, the NRC staff assumes wind turbines with a capacity of 1.79 MW. The capacity factors of land-based wind farms are lower than offshore wind farms (WAPA and FWS 2013). For the wind portion of the combination alternative, the NRC staff assumed a capacity factor of 30 percent, resulting in an estimated total net capacity of 1,813 MWe. Wind turbines must be well separated from each other to avoid interferences to wind flowing through the wind farm, resulting in wind farms requiring substantial amounts of land. Wind turbines may require as much as 1 to 3 ac (0.4 to 1.2 ha) of land for each turbine (WAPA and FWS 2013). Based on the size of the turbines and amount of land required between each turbine, approximately 3,376 turbines and 3,376 to 10,127 ac (1,366 to 4,098 ha) would be required for the wind portion of the combination alternative. Wind energy’s intermittency affects its viability and value as a baseload power source. However, the variability of wind-generated electricity can be lessened if the proposed wind farms were located at a large distance from one another and were operated as interconnected wind farms, an aggregate controlled from a central point. Distance separation increases the probability that power will be produced at some of the wind farms at any given time (Archer and Jacobson 2007). Solar Photovoltaic Portion of the Combination Alternative The solar portion of the combination alternative would be generated through one or more solar PV energy facilities located in the ROI. Assuming a capacity factor of 19 percent, the solar energy facilities would need a collective nameplate rating of 1,193 MWe. Solar PV technologies could be installed on building roofs at existing residential, commercial, or industrial sites or at larger standalone solar facilities. Nationwide, growth in large solar PV facilities (greater than 5 MW) has resulted in an increase from 70 MW in 2009 to over 700 MW installed capacity in 2011. As of January 2012, it is estimated that more than 11,000 MW of large solar PV projects have signed power purchase agreements (Mendelsohn et al. 2012). Over 9,000 MW of those solar projects are 50 MW or greater, although most are located in the southwestern United States (Mendelsohn et al. 2012). As described in Section 2.2.2, two States in the ROI (Missouri and Illinois) have renewable energy legislation that includes requirements for solar PV technology. Missouri’s renewable portfolio standard includes a provision specifying that 2 percent of the renewable portfolio standard requirement must be met by solar energy by 2021. Illinois’ renewable portfolio standard specifies that solar PV must comprise 6 percent of the annual requirement for compliance year 2015–2016 and thereafter. As of 2012, only 33 MW of solar energy capacity had been installed in the ROI (EIA 2014c). Solar PV resources in the ROI range from 4.0 to 5.0 kilowatt hours per square meter per day (kWh/m2/day). The most viable solar resources are located in Missouri, Iowa, and southern Illinois and Indiana (NREL 2015b). Economically viable solar resources are considered to be 6.75 kWh/m2/day and greater (BLM and DOE 2010). As is the case with wind energy sources, the feasibility of solar energy resources serving as alternative baseload power is dependent on the location, value, accessibility, and constancy of the resource. Solar PV uses solar panels to convert solar radiation into usable electricity. Solar cells are formed into solar panels that can then be linked into PV arrays to generate electricity. The electricity generated can be stored, used directly, fed into a large electricity grid, or combined with other electricity generators as a hybrid plant. Solar PV can generate electricity whenever there is sunlight, regardless of whether the sun is directly shining on solar panels. Therefore, solar PV technologies do not need to directly face and track the sun, which has allowed solar PV systems to have broader

Alternatives Including the Proposed Action
2-16
geographical use than concentrated solar power (Ardani and Margolis 2011). Because the ROI contains average solar PV resources and because solar PV is a commercially available option for providing electrical generating capacity, the NRC staff considers the construction of solar PV facilities to be a reasonable alternative to license renewal when combined with wind and NGCC. For the purposes of this analysis, the NRC staff assumes solar PV facilities with a capacity factor of 19 percent (Ardani and Margolis 2011). Solar PV facilities may require 5.7 ac (2.3 ha) of land per megawatt. Although not all of this land would be cleared of vegetation and permanently impacted, it represents the land enclosed in the total site boundary of the solar facility (Ong et al. 2013). For the solar portion of this combination alternative, approximately 6,749 ac (2,731 ha) would be required to support an installed net capacity of 227 MWe. In this analysis, the NRC staff does not speculate on the number and size of individual solar facilities, nor their locations within the ROI. However, as stated above, some of the output could be realized by solar PV installations on building roofs at existing residential, commercial, or industrial sites or at larger standalone solar facilities. To the extent that rooftop or building-integrated solar PV installations remain popular, land impacts would be relatively minor. Solar PV systems do not require water for cooling purposes, but a small amount of water is needed to clean the panels and for potable water for the workforce. Impacts identified in the U.S. Department of the Interior Bureau of Land Management (BLM) and DOE’s Solar Energy Programmatic Environmental Impact Statement (PEIS) (BLM and DOE 2010, 2012) provide information used in the analyses presented in the impact sections in Chapter 4. 2.2.2.5 Purchased Power Alternative
In this section, the NRC staff describes purchased power as an alternative to the continued operation of LSCS. The impacts from purchased power would depend substantially on the generation technologies used to supply the purchased power. Impacts from operation of other electricity generators would likely occur in the ROI. As discussed in Section 2.2.1, replacement power for LSCS would be required in northern Illinois and could come from anywhere within Illinois or adjoining states in either the PJM or MISO Regional Transmission Organizations (RTOs). Given the large geographic area, multiple RTOs within the ROI, and wide-ranging generating facilities, the NRC staff considers purchased power to be a feasible source of baseload power to replace LSCS by the time the licenses expire in 2022 and 2023. Purchased power would likely come from the most common types of electricity generation within the ROI: coal, natural gas, nuclear, and wind. All these power sources are discussed as alternatives to license renewal of LSCS and are identified in Sections 2.2.2.2 to 2.2.2.4. Construction and operational impacts from these sources of electricity generation are considered in Chapter 4. Purchased power may require new transmission lines (which may require new construction) and may also rely on older and less-efficient power plants operating at higher capacities than they currently operate or on new facilities that would be constructed. During operations, impacts from nuclear, coal-fired, and natural gas-fired plants and from wind and solar energy projects would be similar to those described under the new nuclear, coal, natural gas, and combination alternatives described in Chapter 4 for all resource areas.
2.3 Alternatives Considered but Dismissed
Alternatives to LSCS license renewal that were considered and eliminated from detailed study are presented in this section. These alternatives were eliminated because of technical resource availability or current commercial limitations. Many of these limitations would continue to exist when the current LSCS licenses expire.

Alternatives Including the Proposed Action
2-17
2.3.1 Energy Conservation and Energy Efficiency
Energy conservation can include reducing energy demand through behavioral changes or altering the shape of the electricity load and usually does not require the addition of new generating capacity. Conservation and energy efficiency programs are more broadly referred to as demand-side management. Conservation and energy efficiency programs can be initiated by a utility, transmission operators, the state, or other load-serving entities. The State of Illinois’ renewable portfolio standard includes an energy efficiency portfolio standard that requires utilities to reduce electric usage by 2 percent of demand by 2015 (DSIRE 2015a), which is equivalent to 4 million MWh, only 20 percent of the amount that would be required to offset LSCS’s current electrical generation. In general, residential electricity consumers have been responsible for the majority of peak load reductions, and participation in most programs is voluntary. Therefore, the existence of a program does not guarantee that reductions in electricity demand would occur. The GEIS concludes that, although the energy conservation or energy efficiency potential in the United States is substantial, there are likely no cases where an energy efficiency or conservation program has been implemented expressly to replace or offset a large baseload generation station (NRC 2013). Although significant energy savings are possible in the ROI through demand-side management and energy efficiency programs, conservation and energy efficiency programs are not likely to replace LSCS as a standalone alternative; therefore, the NRC staff does not consider conservation and energy efficiency to be a reasonable alternative to license renewal.
2.3.2 Solar
Solar power, including solar PV and concentrated solar power technologies, produce power generated from sunlight. PVs convert sunlight directly into electricity using solar cells made from silicon or cadmium telluride. Concentrating solar power uses heat from the sun to boil water and produce steam to drive a turbine connected to a generator to produce electricity (NREL 2014b). To be considered a viable alternative, a solar alternative must replace the amount of electricity LSCS provides. Assuming a capacity factor of 19 percent (Ardani and Margolis 2011), approximately 12,400 MWe of electricity would need to be generated by solar energy facilities in the seven-State ROI. In 2012, 33 MW of solar energy capacity was installed in the ROI (EIA 2014c). The DOE’s National Renewable Energy Laboratory (NREL) reports that the States in the ROI receive solar insolation of 4.0 to 5.0 kWh/m2/day, which is considered low to average (NREL 2015b). For utility-scale development, insolation levels below 6.5 kWh/m2/day are not considered economically viable given current technologies (BLM and DOE 2010). There is more potential for solar development using local PV applications, such as rooftop solar panels, than through utility-scale solar facilities. In addition, a solar facility can only generate electricity when the sun is shining. Energy storage can be used to overcome intermittency for concentrating solar power facilities; however, current and foreseeable storage technologies that have been paired with solar power facilities have a much smaller capacity than would be necessary to replace LSCS. Taking all of the factors above into account, it is unlikely that solar PV or concentrated solar power technologies could serve as baseload power in the ROI to replace LSCS’s current electricity output. Given the modest levels of solar energy available throughout the ROI, the lack of substantial installed solar capacity in the ROI and the weather-dependent intermittency of solar power, the NRC staff concludes that a solar power energy facility in the ROI would not

Alternatives Including the Proposed Action
2-18
be a reasonable alternative to license renewal. The NRC staff described an alternative of solar power in combination with wind and an NGCC plant in Section 2.2.2.4.
2.3.3 Wind
Two States in the ROI have the third and fifth largest installed capacity in the Nation: Iowa with 5,708 MW, followed by Illinois with 3,667 MW (DOE 2015). The installed wind capacity in the ROI has been increasing annually by 1,000 MWe to 2,500 MWe in each of the past 8 years, for a total of over 13,000 MWe of additional wind capacity from 2007 to 2014 (DOE 2015). All of the wind energy facilities and the electricity generation from wind currently being produced in the ROI are land based. To be considered a viable alternative, a wind alternative must replace the amount of electricity LSCS provides. Assuming a capacity factor of 30 percent for land-based wind and 40 percent for offshore wind, a range of 5,665 to 7,553 MWe of electricity would need to be generated by some combination of land-based and offshore wind energy facilities in the seven-State ROI. As is the case with other renewable energy sources, the feasibility of wind resources serving as alternative baseload power is dependent on the location (relative to expected load centers), value, accessibility, and constancy of the resource. Wind energy must be converted to electricity at or near the point where it is extracted, and there are limited energy storage opportunities available to overcome the intermittency and variability of wind resource availability. Although wind power is intermittent and although individual facilities are unable to provide baseload power, it has been proposed that multiple interconnected wind installations separated by long distances could theoretically function as a virtual power plant and could provide baseload power since individual facilities would be exposed to different weather and wind conditions. To date, however, no states or utilities operate arrays of wind installations as virtual power plants. Given the amount of wind capacity necessary to replace LSCS and the intermittency of wind power, the NRC staff finds a completely wind-based alternative to be unreasonable. However, the NRC staff also concludes that, when used in combination with other technologies with inherently higher capacity factors, wind energy can provide a viable alternative. The NRC staff described such a possible combination alternative in Section 2.2.2.4. 2.3.3.1 Offshore Wind
The United States does not have any offshore wind farms in operation; however, approximately 20 projects representing more than 2,000 MW of capacity are in the planning and permitting process as of 2010 (Musial and Ram 2010). Offshore wind projects have been developed in Europe, most of which are located close to shore and in shallow water less than 98.4 ft (30 m) in depth. Total worldwide installed capacity has been estimated at 2,377 MW (Musial and Ram 2010). Although wind data suggest a potential for offshore wind farms in the Great Lakes, project costs likely will limit the future potential of large-scale projects (Tidball et al. 2010). NREL (Tidball et al. 2010) estimated that offshore project costs would run approximately 200 to 300 percent higher than land-based systems. In addition, based on current prices for wind turbines, the 20-year levelized cost of electricity produced from an offshore wind farm would be above the current production costs from existing power generation facilities. In addition to cost, other barriers include the immature status of the technology, limited resource area, and high risks and uncertainty (Tidball et al. 2010). Because no offshore wind capacity yet exists in either the Great Lakes or on the Atlantic Coast and because none appears likely to exist on a large commercial scale in the Great Lakes by 2022 (given the current state of development), the NRC staff finds that offshore wind will not be a reasonable alternative to LSCS.
Alternatives Including the Proposed Action
2-19
2.3.3.2 Wind Power with Storage
Energy storage is one possible way to overcome intermittency. Besides pumped hydroelectric facilities, compressed air energy storage (CAES) is the technology most suited for storage of large amounts of energy. In CAES systems, electricity generated during low-demand periods can be stored by using a compressor to pressurize and store air; during high-demand periods, the compressed air can be used to drive a turbine to generate electricity. A 2011 DOE report analyzed various power-generation sources, including wind, coupled with CAES systems (Ilic et al. 2011). The report considered siting criteria, using (1) proximity to natural gas lines, high voltage transmission, and a market for wholesale electric power and (2) availability of geology and wind resources. The results show that, within the ROI, the potential exists for one CAES site in northwestern Iowa. Without detailed wind-speed data, specific site information, and detailed information on the energy-storage capacity of the potential CAES site, estimating how much wind capacity would be necessary and determining whether it could provide for an all-wind alternative would be difficult. Furthermore, the NRC staff is not aware of a CAES project coupled with wind generation that is providing baseload power. Therefore, the NRC staff concludes that the use of CAES in combination with wind turbines to replace the LSCS power plant is unlikely. 2.3.3.3 Conclusion
Despite the relatively high reliability demonstrated by modern turbines, the recent technological advancements in turbine design and wind farm operation, and wind energy’s dramatic market penetrations of recent years, empirical data on wind farm capacity factors and wind energy’s limited ability to store power for delayed production of electricity cause the NRC staff to conclude that wind energy—on shore, off shore, or a combination thereof—could not serve as a discrete alternative to the baseload power supplied by the LSCS reactors. However, the NRC staff also concludes that, when used in combination with other technologies with inherently higher capacity factors, wind energy can provide a viable alternative. The NRC staff described such a possible combination alternative in Section 2.2.2.4.
2.3.4 Biomass
Biomass resources used for biomass-fired generation include agricultural residues, animal manure, wood wastes from forestry and industry, residues from food and paper industries, municipal green wastes, dedicated energy crop, and methane from landfills (IEA 2007). Using biomass-fired generation for baseload power depends on the geographic distribution, available quantities, constancy of supply, and energy content of biomass resources. For this analysis, the NRC staff assumed that biomass would be combusted for power generation in the electricity sector. Biomass is also used for space heating in residential and commercial buildings and can be converted to a liquid form for use in transportation fuels (Haq undated). In the GEIS, the NRC staff indicated a wood waste facility could provide baseload power and could operate with capacity factors between 70 and 80 percent (NRC 2013). Although the ROI currently produces electricity from biomass fuels, the plants operating within the ROI generated less than 1 percent of the total power generation in 2011 (EIA 2014b). Based on the relatively low electricity generation currently produced at biomass plants, it is unlikely that these plants, or the construction of several new biomass plants, could increase capacity by adding 2,327 MWe of electricity from biomass-fired generation by the time LSCS’s licenses expire in 2022 and 2023. For utility-scale biomass electricity generation, the NRC staff assumes that the technologies used for biomass conversion would be similar to fossil fuel plants, including the direct combustion of biomass in a boiler to produce steam (NRC 2013). Biomass generation is

Alternatives Including the Proposed Action
2-20
generally more cost-effective when co-fired with coal plants (IEA 2007). Biomass-fired generation plants generally are small and can reach capacities of 50 MWe, which means that more than 40 new facilities would be required before the LSCS licenses expire. After reevaluating current technologies, the NRC staff finds biomass-fired alternatives as still unable to reliably replace the LSCS capacity. For this reason, the NRC staff does not consider biomass to be a reasonable alternative to LSCS license renewal.
2.3.5 Hydroelectric
Hydroelectric power uses the force of water to turn turbines that spin a generator to produce electricity. In a run-of-the-river system, the force of a river current provides the force to create the needed pressure for the turbine. In a storage system, water is accumulated in reservoirs created by dams and is released as needed to generate electricity. The DOE’s Idaho National Environmental Engineering Laboratory (now Idaho National Laboratory) completed a comprehensive survey of hydropower resources in 1997. The ROI has hydroelectric generating potential of 1,954 MW, adjusting for environmental, legal, and institutional constraints (Conner et al. 1998). These constraints could include (1) scenic, cultural, historical, and geological values, (2) Federal and state land use, and (3) legal protection issues, such as wild and scenic legislation and threatened or endangered fish and wildlife legislative protection. A separate assessment by DOE of nonpowered dams (dams that do not produce electricity) concluded that there is potential for 4,185 MW of electricity in the ROI (ORNL 2012). These nonpowered dams serve various purposes, such as providing water supply to inland navigation. The EIA reported that the States comprising the ROI generated 2,262 MW of electricity from hydroelectric power in 2012 (EIA 2014c). In order to replace LSCS’s current output, hydroelectric generation across the ROI would need to double by 2022. Although there is potential for anywhere between 1,954 MW and 4,185 MW of hydroelectric power, it is unlikely that the maximum levels of development would occur across the entire ROI by the time LSCS’s licenses expire in 2022 and 2023 because the generating capacity of hydroelectric power is projected to continue to decrease through 2040 (EIA 2013b). Given the decrease in projected power generation from hydroelectric facilities, the NRC staff does not consider hydroelectric power to be a reasonable alternative to license renewal.
2.3.6 Wave and Ocean Energy
Waves, currents, and tides are often predictable and reliable, making them attractive candidates for potential renewable energy generation. Four major technologies may be suitable to harness wave energy: terminator devices that range from 500 kilowatts to 2 MW, attenuators, point absorbers, and overtopping devices (BOEM undated). Point absorbers and attenuators use floating buoys to convert wave motion into mechanical energy, driving a generator to produce electricity. Overtopping devices trap a portion of a wave at a higher elevation than the sea surface; waves then enter a tube and compress air that is used to drive a generator that produces electricity (NRC 2013). Some designs are undergoing demonstration testing at commercial scales, but none are currently used to provide baseload power (BOEM undated). The Great Lakes do not experience large tides, and there is limited energy output for wave technologies in the Great Lakes. The Electric Power Research Institute (EPRI) published a document that assessed ocean wave energy resources in the United States. The Great Lakes were not included in the analysis, suggesting that the resource potential is not great enough to use on a commercial scale (EPRI 2011). Consequently, the limited resource availability and
Alternatives Including the Proposed Action
2-21
infancy of the technologies in the Great Lakes support the NRC staff’s conclusion that wave and ocean energy technologies are not feasible substitutes for LSCS.
2.3.7 Fuel Cells
Fuel cells oxidize fuels without combustion and its environmental side effects. Fuel cells use a fuel (e.g., hydrogen) and oxygen to create electricity through an electrochemical process. The only byproducts (depending on fuel characteristics) are heat, water, and carbon dioxide (depending on hydrogen fuel type) (DOE 2013a). Hydrogen fuel can come from a variety of hydrocarbon resources. Natural gas is a typical hydrogen source. Fuel cells are not economically or technologically competitive with other alternatives for electricity generation. EIA projects that fuel cells may cost $6,835 per installed kilowatt (total overnight capital costs, 2010 dollars), which is high compared to other alternative technologies analyzed in this section (EIA 2010). More importantly, fuel cell units are likely to be small in size (approximately 10 MWe). Replacing the power LSCS provides would be extremely costly; it would require the construction of approximately 230 units and modifications to the existing transmission system. Given the immature status of fuel cell technology and high cost, the NRC staff does not consider fuel cells to be a reasonable alternative to LSCS license renewal.
2.3.8 Delayed Retirement
A delayed retirement alternative would consider deferring the retirement of generating facilities in Illinois and its six adjoining states that include MISO and PJM RTOs. To maintain reliable operations, electric systems must be able to meet peak load requirements. To ensure sufficient capacity, this must also include a planning reserve margin (FERC 2013). The projected MISO reserve margin for 2021 is 18.6 percent, which exceeds the reserve margin requirement of 17.4 percent. However, recent EPA regulations may lead to increased coal plant retirements at a faster pace than projected. In that case, 3,000 MW to 12,600 MW of plant retirements could decrease the projected reserves anywhere from 16.22 to 6.9 percent, well below the reserve margin requirement (MISO 2011). PJM is facing similar constraints due, in large part, to retirements of coal plants given air quality regulations (Ott 2013a). This indicates an emerging reliability problem potentially affecting major population centers within the PJM region in the near future (Ott 2013a). Because the current generation mix has not resulted in the long-term commitment of generation needed for reliability, generation retirements that have occurred with short notice have created unanticipated reliability problems for PJM (Ott 2013a). The EIA expects that more coal plant retirements will occur before 2016 than those previously predicted. These accelerated retirements are driven by low natural gas prices, slow growth in electricity demand, and the requirements of the Mercury and Air Toxics Standards that will require significant reductions in plant emissions (EIA 2014a, EPA 2015). Exelon also expects increased generation retirements for a variety of reasons, including increased operating costs for older facilities, increased environmental regulations and competition, and decreased load (Exelon undated). As generators are required to adhere to future regulations, some power plants may opt for early retirement of older units rather than incur the cost for compliance. Exelon has further stated that some of their nuclear fleet may be retired early because of low wholesale energy prices and current energy policy (Associated Press 2015). Because of the uncertain regulatory environment and concerns expressed by MISO and PJM concerning the retirement pace of coal power plants, the NRC staff does not consider delayed retirement to be a reasonable alternative to LSCS license renewal.

Alternatives Including the Proposed Action
2-22
2.3.9 Geothermal
Geothermal technologies extract the heat contained in geologic formations to produce steam to drive a conventional steam turbine generator. Facilities producing electricity from geothermal energy have demonstrated capacity factors of 95 percent or greater, making geothermal energy a potential source of baseload electric power. However, the feasibility of geothermal power generation to provide baseload power depends on the regional quality and accessibility of geothermal resources. Utility-scale geothermal energy generation requires geothermal reservoirs with a temperature above 200 °F (93 °C). Utility-scale power plants range from small 300 kilowatts electric to 50 MWe and greater (TEEIC undated). Geothermal resources are concentrated in the western United States. Specifically, these resources are found in Alaska, Arizona, California, Colorado, Hawaii, Idaho, Montana, Nevada, New Mexico, Oregon, Utah, Washington, and Wyoming. In general, most assessments of geothermal resources have been concentrated on these western states (DOE 2013b; USGS 2008). Geothermal resources are used in the ROI for heating and cooling purposes, but no electricity is currently being produced from geothermal resources in the ROI (EIA 2014c). Given the low resource potential in the ROI, the NRC staff does not consider geothermal to be a reasonable alternative to license renewal.
2.3.10 Municipal Solid Waste
Energy recovery from municipal solid waste converts nonrecyclable waste materials into usable heat, electricity, or fuel through combustion (EPA 2014b). The three types of combustion technologies include mass burning, modular systems, and refuse-derived fuel systems (EPA 2014a). Mass burning is the method used most frequently in the United States. The heat released from combustion is used to convert water to steam, which is used to drive a turbine generator to produce electricity. Ash is collected and taken to a landfill, and particulates are captured through a filtering system (EPA 2014a). As of 2010, approximately 86 waste-to-energy plants are in operation in 25 states, processing more than 28 million tons of waste per year (EPA 2014b). These waste-to-energy plants have an aggregate capacity of 2,720 MWe, and although some plants have expanded to handle additional waste and produce more energy, no new plants have been built in the United States since 1995 (EPA 2014b). The average waste-to-energy plant produces about 50 MWe, with some reaching 77 MWe, and can operate at capacity factors greater than 90 percent (Michaels 2010). Indiana has one waste recovery facility that produces steam; Iowa has one waste-to-energy facility that produces 10 MW of electricity; Michigan has three facilities that produce 89.7 MW of electricity; and Wisconsin has two facilities that generate 32.3 MW of electricity (Michaels 2010). In total, as of 2010, the ROI had a municipal solid waste generating capacity of 132 MW. More than 46 average-sized plants would be necessary to provide the same level of output as LSCS, almost doubling the national waste-to-energy generation. The decision to burn municipal waste to generate energy is usually driven by the need for an alternative to landfills rather than energy considerations. Given the improbability that additional stable supplies of municipal solid waste would be available to support approximately 46 new facilities and that so few existing plants operate in the ROI, the NRC staff does not consider municipal solid waste combustion to be a reasonable alternative to LSCS license renewal.
2.3.11 Petroleum
In the ROI, oil-fired generation in 2012 had a generating capacity of 4,986 MW (EIA 2014c). The variable costs of oil-fired generation tend to be greater than those of the nuclear or coal-fired operations, and oil-fired generation tends to have greater environmental impacts than

Alternatives Including the Proposed Action
2-23
natural gas-fired generation. The high cost of oil relative to natural gas has resulted in a steady decline in its use for electricity generation (EIA 2013a). Given the high cost of oil and the small generating capacity from oil-fired power plants in the ROI, the NRC staff does not consider oil-fired generation a reasonable alternative to LSCS license renewal.
2.3.12 Supercritical Pulverized Coal
In general, SCPC power plants are feasible, commercially available options for providing electrical generating capacity. Baseload coal units have proven their reliability and can sustain capacity factors as high as 79 percent. Pulverized coal power generation uses crushed coal that is fed into a boiler where it is burned to create heat. The heat produces steam that is used to spin one or more turbines to generate electricity. Among the technologies available, pulverized coal boilers producing supercritical steam (SCPC boilers) are increasingly common for new coal-fired plants given their high operating temperatures and pressures that increase thermal efficiencies and overall reliability. SCPC facilities consume less fuel per unit output, reducing environmental impacts (NETL undated). As described in Section 2.2.3, EPA has signed a final rule for carbon pollution that would apply to new fossil fuel-fired power plants, including SCPC facilities (80 FR 64661–65120). The action establishes performance standards and has identified a CCS system as a method of emission reduction. The emission limit for these sources of 1,305 lb CO2/MWh, and any new coal-fired power plants could require CCS in order to achieve this emission limit. In addition, given known technology and technological and demographic trends, EIA predicts that by 2040 natural gas will surpass coal as the largest share of U.S. electric power generation (EIA 2013a). This does not consider the EPA rule described above but indicates a general trend away from coal-fired facilities in favor of natural gas-fired power plants due to falling natural gas prices. MISO projected that the EPA regulations could lead to increased coal plant retirements and estimated retirements between 3,000 MW to 12,600 MW, which could have a large impact on MISO’s reserve margin in the future (MISO 2011). Although SCPC plants are currently the most widely used source of electricity generation within the ROI, given the potential for stringent air quality regulations and trends toward natural gas-fired power plants, the NRC staff does not consider SCPC to be a reasonable alternative to LSCS license renewal. Instead, the NRC staff describes an IGCC plant under the coal alternative in Section 2.2.2.2.
2.4 Comparison of Alternatives
In this chapter, the NRC staff considered the following alternatives to LSCS license renewal: new nuclear generation; IGCC generation; NGCC generation; a combination alternative of natural gas, wind, and solar; and purchased power. The NRC also considered the no-action alternative and its effects. The impacts for all alternatives to LSCS license renewal are discussed in Chapter 4 and displayed in Table 2–2 below. The environmental impacts of license renewal and alternatives to license renewal, including other methods of power generation, and not renewing the LSCS operating licenses (the no-action alternative) were evaluated in the final SEIS. With the exception of aquatic and socioeconomic impacts, not renewing the operating license and shutting down LSCS would have SMALL impacts on all other resource areas. MODERATE impacts could occur in the cooling pond, because as water temperatures decline in the cooling pond, some fish populations such as stocked recreational species that thrived in warmer waters may experience population declines. Therefore, aquatic impacts could range from SMALL to MODERATE.

Alternatives Including the Proposed Action
2-24
Socioeconomic impacts in local communities from the loss of jobs and tax revenue after LSCS shutdown could range from SMALL to LARGE. With the exception of aquatic resources, the continued operation of LSCS during the license renewal term would have SMALL environmental impacts. Impacts on aquatic resources were SMALL, except for thermal impacts on gizzard shad and threadfin shad in the cooling pond. Impacts on these fish were MODERATE. Fish kills in the LSCS cooling pond would continue during the license renewal term and would decrease the shad population in the pond immediately following the fish kill. This would have a noticeable effect on threadfin shad and gizzard shad populations. Fish kills, however, would not be destabilizing to these shad populations, because they tend to recover within a year. Because the cooling pond is a highly managed system, any cascading effects resulting from the loss of shad (such as a reduction in prey for stocked species, which in turn could affect a stocked species’ population) could be mitigated through the Illinois Department of Natural Resource’s annual stocking and continual management of the pond. Therefore, the impact on aquatic resources from the proposed action is SMALL to MODERATE. The environmentally preferred alternative is the granting of a renewed license for LSCS. All other alternatives capable of meeting the needs currently served by LSCS entail potentially greater impacts than those of the proposed action of renewing the license for LSCS. To make up the lost power generation if a renewed license is not issued (the no-action alternative), one or a combination of alternatives would be implemented, all of which have greater impacts than the proposed action. Hence, the NRC staff concludes that the no-action alternative will have environmental impacts greater than or equal to those of the proposed license renewal action.
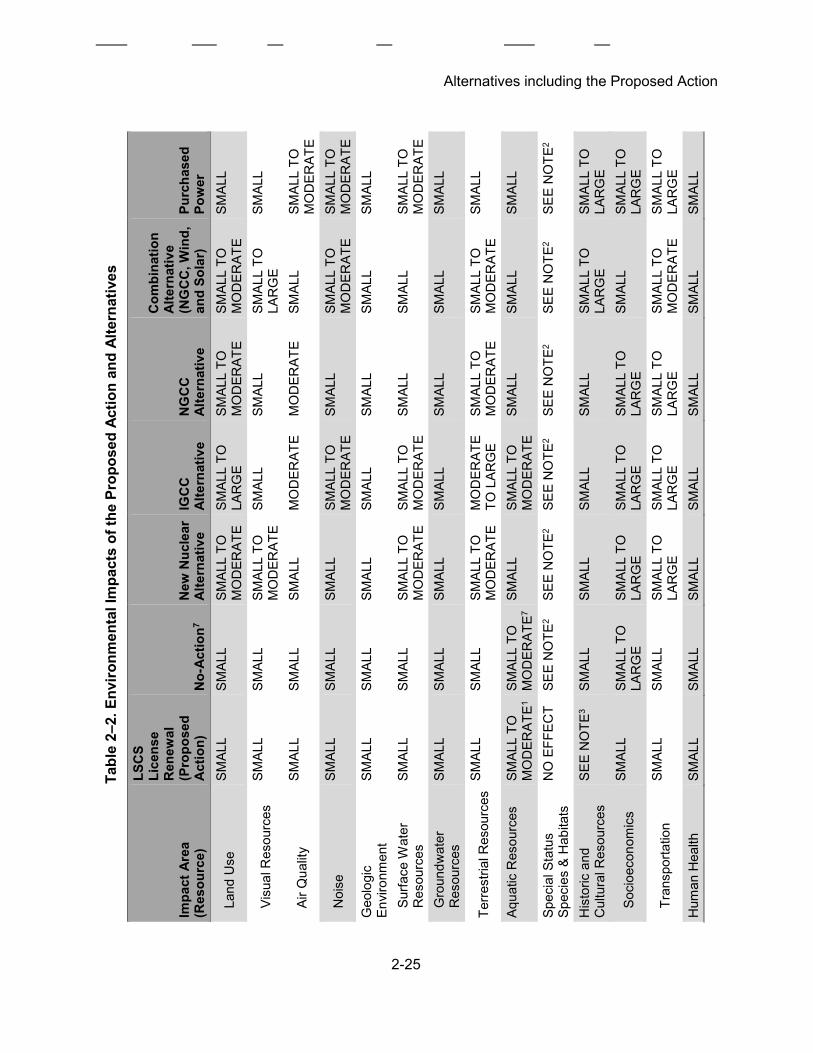
Alternatives including the Proposed Action
2-25
Tabl
e 2–
2. E
nviro
nmen
tal I
mpa
cts
of th
e Pr
opos
ed A
ctio
n an
d Al
tern
ativ
es
Impa
ct A
rea
(Res
ourc
e)
LSC
S Li
cens
e R
enew
al
(Pro
pose
d Ac
tion)
N
o-Ac
tion7
New
Nuc
lear
Al
tern
ativ
e IG
CC
Al
tern
ativ
e N
GC
C
Alte
rnat
ive
Com
bina
tion
Alte
rnat
ive
(NG
CC
, Win
d,
and
Sola
r)
Purc
hase
d Po
wer
Land
Use
SM
ALL
SMAL
L SM
ALL
TO
MO
DER
ATE
SMAL
L TO
LA
RG
E SM
ALL
TO
MO
DER
ATE
SMAL
L TO
M
OD
ERAT
E SM
ALL
Visu
al R
esou
rces
SM
ALL
SMAL
L SM
ALL
TO
MO
DER
ATE
SMAL
L SM
ALL
SMAL
L TO
LA
RG
E SM
ALL
Air Q
ualit
y SM
ALL
SMAL
L SM
ALL
MO
DER
ATE
MO
DER
ATE
SMAL
L SM
ALL
TO
MO
DER
ATE
Noi
se
SMAL
L SM
ALL
SMAL
L SM
ALL
TO
MO
DER
ATE
SMAL
L SM
ALL
TO
MO
DER
ATE
SMAL
L TO
M
OD
ERAT
E G
eolo
gic
Envi
ronm
ent
SMAL
L SM
ALL
SMAL
L SM
ALL
SMAL
L SM
ALL
SMAL
L
Surfa
ce W
ater
R
esou
rces
SM
ALL
SMAL
L SM
ALL
TO
MO
DER
ATE
SMAL
L TO
M
OD
ERAT
E SM
ALL
SMAL
L SM
ALL
TO
MO
DER
ATE
Gro
undw
ater
R
esou
rces
SM
ALL
SMAL
L SM
ALL
SMAL
L SM
ALL
SMAL
L SM
ALL
Terre
stria
l Res
ourc
es
SMAL
L SM
ALL
SMAL
L TO
M
OD
ERAT
E M
OD
ERAT
E TO
LAR
GE
SMAL
L TO
M
OD
ERAT
E SM
ALL
TO
MO
DER
ATE
SMAL
L
Aqua
tic R
esou
rces
SM
ALL
TO
MO
DER
ATE1
SMAL
L TO
M
OD
ERAT
E7 SM
ALL
SMAL
L TO
M
OD
ERAT
E SM
ALL
SMAL
L SM
ALL
Spec
ial S
tatu
s Sp
ecie
s &
Hab
itats
N
O E
FFEC
T SE
E N
OTE
2 SE
E N
OTE
2 SE
E N
OTE
2 SE
E N
OTE
2 SE
E N
OTE
2 SE
E N
OTE
2
His
toric
and
C
ultu
ral R
esou
rces
SE
E N
OTE
3 SM
ALL
SMAL
L SM
ALL
SMAL
L SM
ALL
TO
LAR
GE
SMAL
L TO
LA
RG
E
Soci
oeco
nom
ics
SMAL
L SM
ALL
TO
LAR
GE
SMAL
L TO
LA
RG
E SM
ALL
TO
LAR
GE
SMAL
L TO
LA
RG
E SM
ALL
SMAL
L TO
LA
RG
E
Tran
spor
tatio
n SM
ALL
SMAL
L SM
ALL
TO
LAR
GE
SMAL
L TO
LA
RG
E SM
ALL
TO
LAR
GE
SMAL
L TO
M
OD
ERAT
E SM
ALL
TO
LAR
GE
Hum
an H
ealth
SM
ALL
SMAL
L SM
ALL
SMAL
L SM
ALL
SMAL
L SM
ALL

Alternatives including the Proposed Action
2-26
Impa
ct A
rea
(Res
ourc
e)
LSC
S Li
cens
e R
enew
al
(Pro
pose
d Ac
tion)
N
o-Ac
tion7
New
Nuc
lear
Al
tern
ativ
e IG
CC
Al
tern
ativ
e N
GC
C
Alte
rnat
ive
Com
bina
tion
Alte
rnat
ive
(NG
CC
, Win
d,
and
Sola
r)
Purc
hase
d Po
wer
En
viro
nmen
tal
Just
ice
SEE
NO
TE4
SEE
NO
TE5
SEE
NO
TE6
SEE
NO
TE6
SEE
NO
TE6
SEE
NO
TE6
SEE
NO
TE6
Was
te M
anag
emen
t an
d Po
llutio
n Pr
even
tion
SMAL
L SM
ALL
SMAL
L SM
ALL
TO
MO
DER
ATE
SMAL
L SM
ALL
SMAL
L TO
M
OD
ERAT
E
Key:
IG
CC
= c
oal-i
nteg
rate
d ga
sific
atio
n co
mbi
ned-
cycl
e (a
ltern
ativ
e), N
GC
C =
nat
ural
gas
com
bine
d-cy
cle
(alte
rnat
ive)
, NR
HP
= N
atio
nal
Reg
iste
r of H
isto
ric P
lace
s, A
PE =
are
a of
pot
entia
l effe
ct, C
RM
P =
Cul
tura
l Res
ourc
e M
anag
emen
t Pla
n, a
nd IH
PA =
Illin
ois
His
toric
Pr
eser
vatio
n Ag
ency
.
(1)
Ther
mal
impa
cts
wou
ld b
e SM
ALL
for a
quat
ic re
sour
ces
in th
e Ill
inoi
s R
iver
and
SM
ALL
to M
OD
ERAT
E fo
r aqu
atic
reso
urce
s in
the
cool
ing
pond
. M
OD
ERAT
E th
erm
al im
pact
s w
ould
prim
arily
be
expe
rienc
ed b
y gi
zzar
d an
d th
read
fin s
had
in th
e co
olin
g po
nd.
(2) T
he m
agni
tude
of i
mpa
cts
coul
d va
ry w
idel
y ba
sed
on s
ite s
elec
tion
and
the
pres
ence
or a
bsen
ce o
f spe
cial
sta
tus
spec
ies
and
habi
tats
whe
n th
e al
tern
ativ
e is
impl
emen
ted;
ther
efor
e, th
e N
RC
sta
ff ca
nnot
fore
cast
a le
vel o
f im
pact
for t
his
alte
rnat
ive.
(3
) Bas
ed o
n (1
) the
re b
eing
cur
rent
ly n
o N
RH
P-el
igib
le h
isto
ric p
rope
rties
in th
e AP
E, (2
) trib
al in
put,
(3) E
xelo
n’s
draf
t CR
MP,
(4) t
he fa
ct th
at n
o lic
ense
rene
wal
-rela
ted
phys
ical
cha
nges
or g
roun
d-di
stur
bing
act
iviti
es w
ould
occ
ur, (
5) IH
PA in
put,
and
(6) c
ultu
ral r
esou
rce
asse
ssm
ent,
licen
se
rene
wal
wou
ld n
ot a
ffect
any
kno
wn
hist
oric
pro
perti
es (3
6 C
FR 8
00.4
(d)(1
)).
(4) C
ontin
ued
oper
atio
n of
LSC
S w
ould
not
hav
e di
spro
porti
onat
ely
high
and
adv
erse
hum
an h
ealth
and
env
ironm
enta
l effe
cts
on m
inor
ity a
nd
low
-inco
me
popu
latio
ns.
(5) T
he n
o-ac
tion
alte
rnat
ive
coul
d di
spro
porti
onat
ely
affe
ct m
inor
ity a
nd lo
w-in
com
e po
pula
tions
. (6
) Bas
ed o
n th
is in
form
atio
n an
d th
e an
alys
is o
f hum
an h
ealth
and
env
ironm
enta
l im
pact
s pr
esen
ted
in th
is S
EIS,
it is
not
like
ly th
at th
is a
ltern
ativ
e w
ould
hav
e di
spro
porti
onat
ely
high
and
adv
erse
hum
an h
ealth
and
env
ironm
enta
l effe
cts
on m
inor
ity a
nd lo
w-in
com
e po
pula
tions
. H
owev
er, t
his
dete
rmin
atio
n w
ould
dep
end
on th
e lo
catio
n, p
lant
des
ign,
and
ope
ratio
nal c
hara
cter
istic
s of
the
alte
rnat
ive.
The
refo
re, t
he N
RC
sta
ff ca
nnot
de
term
ine
whe
ther
this
alte
rnat
ive
wou
ld re
sult
in d
ispr
opor
tiona
tely
hig
h an
d ad
vers
e hu
man
hea
lth a
nd e
nviro
nmen
tal e
ffect
s on
min
ority
and
lo
w-in
com
e po
pula
tions
. (7
) The
rmal
impa
cts
wou
ld b
e SM
ALL
for a
quat
ic re
sour
ces
in th
e Ill
inoi
s R
iver
and
SM
ALL
to M
OD
ERAT
E fo
r aqu
atic
reso
urce
s in
the
cool
ing
pond
. M
OD
ERAT
E im
pact
s co
uld
occu
r in
the
cool
ing
pond
, bec
ause
as
wat
er te
mpe
ratu
res
decl
ine
in th
e co
olin
g po
nd, s
ome
fish
popu
latio
ns s
uch
as
stoc
ked
recr
eatio
nal s
peci
es th
at th
rived
in w
arm
er w
ater
s m
ay e
xper
ienc
e po
pula
tion
decl
ines
.

Alternatives Including the Proposed Action
2-27
2.5 References
10 CFR Part 50. Code of Federal Regulations, Title 10, Energy, Part 50, “Domestic licensing of production and utilization facilities.” 10 CFR Part 51. Code of Federal Regulations, Title 10, Energy, Part 51, “Environmental protection regulations for domestic licensing and related regulatory functions.” 10 CFR Part 54. Code of Federal Regulations, Title 10, Energy, Part 54, “Requirements for renewal of operating licenses for nuclear power plants.” 36 CFR Part 800. Code of Federal Regulations, Title 36, Parks, Forest, and Public Property, Part 800, “Protection of historic properties.” 80 FR 26302. U.S. Nuclear Regulatory Commission. “DTE Electric Company: Fermi 3. Combined license and record of decision: Issuance.” Federal Register 80:26302–26303. May 7, 2015. AmerenUE. 2009. Callaway Plant Unit 2 Combined License Application Part 3: Environmental Report. Revision 1. February 2009. 1,444 p. Agencywide Documents Access and Management System (ADAMS) No. ML090710402. Archer CL, Jacobson MZ. 2007. Supplying baseload power and reducing transmission requirements by interconnecting wind farms. Journal of Applied Meteorology and Climatology 46(11):1701–1717. Available at <http://www.stanford.edu/group/efmh/winds/aj07_jamc.pdf> (accessed 28 August 2015). Ardani K, Margolis R. 2011. 2010 Solar Technologies Market Report. Golden, Colorado: National Renewable Energy Laboratory. November 2011. 136 p. Available at <http://www.nrel.gov/docs/fy12osti/51847.pdf> (accessed 28 August 2015). Associated Press. 2015. “Nuclear plants in Illinois could be shuttered if they don’t get a break from state, Exelon says.” Chicago Sun-Times. March 28, 2015. Available at <http://chicago.suntimes.com/business/7/71/477077/nuclear-plants-illinois-shuttered-dont-get-break-state-exelon-says> (accessed 28 August 2015). Barker, J. 2015. “Ameren officially pulls plug on new Callaway nuke.” St. Louis Post-Dispatch. July 31, 2015. Available at <http://www.stltoday.com/business/local/ameren-officially-pulls-plug-on-new-callaway-nuke/article_c4202562-c6c3-5b93-95ee-f45dd8778378.html> (accessed 2 September 2015). [BLM and DOE] U.S. Department of the Interior Bureau of Land Management and U.S. Department of Energy. 2010. Draft Programmatic Environmental Impact Statement for Solar Energy Development in Six Southwestern States. DES 10-59, DOE/EIS-0403, Volumes 1 to 8. December 2010. 11,145 p. Available at <http://www.solareis.anl.gov/documents/dpeis/index.cfm> (accessed 4 September 2015). [BLM and DOE] U.S. Department of the Interior Bureau of Land Management and U.S. Department of Energy. 2012. Final Programmatic Environmental Impact Statement (PEIS) for Solar Energy Development in Six Southwestern States. FES 12-24, DOE/EIS-0403, Volumes 1 to 7. July 2012. 3,596 p. Available at <http://www.solareis.anl.gov/documents/fpeis/index.cfm> (accessed 28 August 2015). [BOEM] Bureau of Ocean Energy Management. Undated. “Ocean Wave Energy.” Available at <http://www.boem.gov/Renewable-Energy-Program/Renewable-Energy-Guide/ Ocean-Wave-Energy.aspx> (accessed 28 August 2015).

Alternatives Including the Proposed Action
2-28
Channell J, Lam T, Pourreza S. 2012. Shale & renewables: A symbiotic relationship. CITI Research. September 12, 2012. 88 p. Available at <http://www.ourenergypolicy.org/ wp-content/uploads/2013/04/citigroup-renewables-and-natgas-report.pdf> (accessed 28 August 2015). [ComEd] Commonwealth Edison Company. 2015. “ComEd—An Exelon Company: Company Profile.” Available at <https://www.comed.com/about-us/company-information/Pages/profile.aspx> (accessed 28 August 2015). Conner AM, Francfort JE, Rinehart BN. 1998. U.S. Hydropower Resource Assessment, Final Report. Idaho Falls, Idaho. Idaho National Engineering and Environmental Laboratory. DOE/ID-10430.2. December 1998. 49 p. Available at <http://hydropower.inl.gov/resourceassessment/pdfs/doeid-10430.pdf> (accessed 28 August 2015). [DOE] U.S. Department of Energy. 2008. 20% Wind Energy by 2030—Increasing Wind Energy’s Contribution to U.S. Electricity Supply. DOE/GO-102008-2567. July 2008. 228 p. Available at <http://www.nrel.gov/docs/fy08osti/41869.pdf> (accessed 10 September 2015). [DOE] U.S. Department of Energy. 2010a. Kemper County Integrated Gasification Combined-Cycle (IGCC) Project, Final Environmental Impact Statement (EIS). Washington, DC: DOE. DOE/EIS-0409, Volume 1. May 2010. 671 p. Available at <http://energy.gov/sites/prod/files/nepapub/nepa_documents/RedDont/ EIS-0409-FEIS-01-2010.pdf> (accessed 28 August 2015). [DOE] U.S. Department of Energy. 2010b. “Final Environmental Assessment for Department of Energy Loan Guarantee for the Agua Caliente Solar Project in Yuma County, Arizona.” DOE/EA-1797. November 2010. Available at <http://energy.gov/sites/prod/files/nepapub/nepa_documents/RedDont/EA-1797-FEA-2010.pdf> (accessed 28 August 2015). [DOE] U.S. Department of Energy. 2015. “WINDExchange: U.S. Installed Wind Capacity.” Available at <http://www.windpoweringamerica.gov/wind_installed_capacity.asp> (accessed 28 August 2015). [DOE] U.S. Department of Energy. 2013a. “Fuel Cell—Basics.” August 14, 2013. Available at <http://energy.gov/eere/energybasics/articles/fuel-cell-basics> (accessed 31 August 2015). [DOE] U.S. Department of Energy. 2013b. “Geothermal Resource Basics.” August 14, 2013. Available at <http://energy.gov/eere/energybasics/articles/geothermal-resource-basics> (accessed 31 August 2015). [DOE] U.S. Department of Energy. Undated. “Small Modular Nuclear Reactors.” Available at <http://energy.gov/ne/nuclear-reactor-technologies/small-modular-nuclear-reactors> (accessed 28 August 2015). [DSIRE] Database of State Incentives for Renewables & Efficiency. 2014. “Iowa Alternative Energy Law.” October 31, 2014. Available at <http://programs.dsireusa.org/system/program/detail/265> (accessed 31 August 2015). [DSIRE] Database of State Incentives for Renewables & Efficiency. 2015a. “Illinois Renewable Portfolio Standard.” June 26, 2015. Available at <http://programs.dsireusa.org/system/program/detail/584> (accessed 31 August 2015).

Alternatives Including the Proposed Action
2-29
[DSIRE] Database of State Incentives for Renewables & Efficiency. 2015b. “Missouri Renewable Electricity Standard.” May 18, 2015. Available at <http://programs.dsireusa.org/system/program/detail/2622> (accessed 31 August 2015). [DSIRE] Database of State Incentives for Renewables & Efficiency. 2015c. “Wisconsin Renewable Portfolio Standard.” May 6, 2015. Available at <http://programs.dsireusa.org/system/program/detail/190> (accessed 31 August 2015). [DSIRE] Database of State Incentives for Renewables & Efficiency. 2015d. “Michigan Renewable Energy Standard.” June 25, 2015. Available at <http://programs.dsireusa.org/system/program/detail/3094> (accessed 31 August 2015). [DSIRE] Database of State Incentives for Renewable Energy. 2015e. “Indiana Clean Energy Portfolio Goal.” May 12, 2015. Available at <http://programs.dsireusa.org/system/program/detail/4832> (accessed 31 August 2015). Duke Energy. 2013. “Project Overview.” Available at <http://www.duke-energy.com/about-us/edwardsport-overview.asp> (accessed 31 August 2015). [EIA] U.S. Energy Information Administration. 2010. “Updated Capital Cost Estimates for Electricity Generation Plants.” November 2010. Available at <http://www.eia.gov/oiaf/beck_plantcosts/index.html> (accessed 31 August 2015). [EIA] U.S. Energy Information Administration. 2012. “Voluntary Reporting of Greenhouse Gases Program—Emission Factors and Global Warming.” Available at <http://www.eia.gov/oiaf/1605/emission_factors.html> (accessed 31 August 2015). [EIA] U.S. Energy Information Administration. 2013a. Annual Energy Outlook 2013 with Projections to 2040. DOE/EIA 0383 (2013). Washington, DC: EIA. April 26, 2013. 244 p. Available at <http://www.eia.gov/forecasts/aeo/pdf/0383(2013).pdf> (accessed 28 August 2015). [EIA] U.S. Energy Information Administration. 2013b. Annual Energy Outlook 2014 Early Release. December 16, 2013. Available at <http://www.eia.gov/forecasts/archive/aeo14/er/pdf/0383er(2014).pdf> (accessed 28 August 2015). [EIA] U.S. Energy Information Administration. 2013c. U.S. Energy Information Administration— Frequently Asked Questions. “How much coal, natural gas, or petroleum is used to generate a kilowatthour of electricity?” Available at <http://www.eia.gov/tools/faqs/faq.cfm?id=667&t=2> (accessed 31 August 2015). [EIA] U.S. Energy Information Administration. 2013d. U.S. Energy Information Administration—Today in Energy. “Natural gas-fired combustion turbines are generally used to meet peak electricity load.” October 1, 2013. Available at <http://www.eia.gov/todayinenergy/detail.cfm?id=13191> (accessed 31 August 2015). [EIA] U.S. Energy Information Administration. 2014a. “U.S. Energy Information Administration—Today in Energy. “AEO2014 projects more coal-fired power plant retirements by 2016 than have been scheduled.” February 14, 2014. Available at <http://www.eia.gov/todayinenergy/detail.cfm?id=15031&src=email> (accessed 31 August 2015). [EIA] U.S. Energy Information Administration. 2014b. State Electricity Profiles 2011. Washington, DC: EIA. Available at <http://www.eia.gov/electricity/state/archive/sep2011.pdf> (accessed 31 August 2015).

Alternatives Including the Proposed Action
2-30
[EIA] U.S. Energy Information Administration. 2014c. State Electricity Profiles 2012. Washington, DC: EIA. Available at <http://www.eia.gov/electricity/state/archive/2012/> (accessed 1 September 2015). [EIA] U.S. Energy Information Administration. 2015. Annual Energy Outlook 2015 with Projections to 2040. DOE/EIA 0383 (2015). Washington, DC: EIA. April 14, 2015. 154 p. Available at <http://www.eia.gov/forecasts/aeo/pdf/0383(2015).pdf> (accessed 2 September 2015). Endangered Species Act of 1973, as amended. 16 U.S.C. § 1531 et seq. [EPA] U.S. Environmental Protection Agency. 2014a. “Municipal Solid Waste: Basic Information about Energy Recovery from Waste.” Available at <http://www.epa.gov/osw/nonhaz/municipal/wte/basic.htm> (accessed 31 August 2015). [EPA] U.S. Environmental Protection Agency. 2014b. “Municipal Solid Waste: Energy Recovery from Waste.” Available at <http://www.epa.gov/osw/nonhaz/municipal/wte/> (accessed 31 August 2015). [EPA] U.S. Environmental Protection Agency. 2015. “Mercury and Air Toxics Standards.” Available at <http://www3.epa.gov/mats/> (accessed 13 October 2015). [EPRI] Electric Power Research Institute. 2011. Mapping and Assessment of the United States Ocean Wave Energy Resource. Palo Alto, California: EPRI. 1024637. December 2011. 176 p. Available at <http://www1.eere.energy.gov/water//pdfs/mappingandassessment.pdf> (accessed 31 August 2015). [Exelon] Exelon Generation Company, LLC. 2014. Applicant’s Environmental Report—Operating License Renewal Stage, LaSalle County Station, Units 1 and 2, License Renewal Application. Kennett Square, Pennsylvania: Exelon. December 9, 2014. ADAMS No. ML14343A883. [Exelon] Exelon Generation Company, LLC. Undated. PJM TOA-AC July Meeting, At-Risk Generation Retirement. 6 p. Available at <http://www.pjm.com/~/media/ committees-groups/committees/toa-ac/20100715/ 20100715-item-04-generation-retirements.ashx> (accessed 31 August 2015). [FERC] Federal Energy Regulatory Commission. 2013. Centralized Capacity Market Design Elements. Commission Staff Report AD13-7-000. August 23, 2013. 34 p. Available at <http://www.ferc.gov/CalendarFiles/20130826142258-Staff%20Paper.pdf> (accessed 31 August 2015). Haq Z. Undated. Biomass for Electricity Generation. U.S. Energy Information Administration. 18 p. Available at <http://www.eia.gov/oiaf/analysispaper/biomass/pdf/biomass.pdf> (accessed 31 August 2015). [IEA] International Energy Agency. 2007. “Biomass for Power Generation and CHP.” IEA Energy Technology Essentials ETE03. Available at <https://www.iea.org/publications/freepublications/publication/essentials3.pdf> (accessed 4 September 2015). [ILGA] Illinois General Assembly. 2011. Illinois Senate Bill 1652, Section 5, Illinois Power Agency Act. Available at <http://www.ilga.gov/legislation/97/SB/09700SB1652enr.htm> (accessed 31 August 2015).

Alternatives Including the Proposed Action
2-31
Ilic J, Prica M, Rabiei S, Goellner J, Wilson D, Shih C (Booz Allen Hamilton, Inc.). 2011. Technical and Economic Analysis of Various Power Generation Resources Coupled with CAES Systems. National Energy Technology Laboratory. May 17, 2011. DOE/NETL-2011/1472. 96 p. Available at <http://www.netl.doe.gov/File%20Library/Research/Energy%20Analysis/Publications/HybridGeneration05242011.pdf> (accessed 31 August 2015). Mendelsohn M, Lowder T, Canavan B. 2012. Utility-Scale Concentrating Solar Power and Photovoltaics Projects: A Technology and Market Overview. Golden, Colorado: National Renewable Energy Laboratory. NREL/TP-6A20-51137. April 2012. 65 p. Available at <http://www.nrel.gov/docs/fy12osti/51137.pdf> (accessed 31 August 2015). Michaels T. 2010. The 2010 ERC Directory of Waste-to-Energy Plants. Washington, DC: Energy Recovery Council. November 12, 2010. 32 p. Available at <http://www.energyrecoverycouncil.org/userfiles/file/ERC_2010_Directory.pdf> (accessed 31 August 2015). [MISO] Midcontinent Independent System Operator, Inc. 2011. 2011 Long Term Resource Assessment. 34 p. Available at <https://www.misoenergy.org/Library/Repository/Study/Seasonal%20Assessments/ 2011%20Long-Term%20Resource%20Assessment.pdf> (accessed 31 August 2015). [MISO-PJM] Midcontinent Independent System Operator, Inc., and PJM Interconnection. Undated. “Joint and Common Market.” Available at <http://www.miso-pjm.com/> (accessed 31 August 2015). Musial W (NREL), Ram B (Energetics). 2010. Large-Scale Offshore Wind Power in the United States: Assessment of Opportunities and Barriers. Golden, Colorado: NREL. NREL/TP-500-40745. September 2010. 240 p. Available at <http://www.nrel.gov/docs/fy10osti/40745.pdf> (accessed 31 August 2015). National Environmental Policy Act of 1969, as amended. 42 U.S.C. § 4321 et seq. National Historic Preservation Act of 1966, as amended. 16 U.S.C. § 470 et seq. [NETL] National Energy Technology Laboratory. 2007. Natural Gas Combined-Cycle Plant. 4 p. Available at <http://www.netl.doe.gov/KMD/cds/disk50/NGCC%20Plant%20Case_FClass_051607.pdf> (accessed 31 August 2015). [NETL] National Energy Technology Laboratory. 2013a. Cost and Performance Baseline for Fossil Energy Plants, Volume 1: Bituminous Coal and Natural Gas to Electricity. Revision 2a. DOE/NETL-2010/1397, September 2013. 626 p. Available at <http://www.netl.doe.gov/File%20Library/research/energy%20analysis/publications/ BitBase_FinRep_Rev2.pdf> (accessed 31 August 2015). [NETL] National Energy Technology Laboratory. 2013b. “IGCC Project Examples.” Available at <http://www.netl.doe.gov/research/coal/energy-systems/gasification/gasifipedia/ project-examples> (accessed 31 August 2015). [NETL] National Energy Technology Laboratory. 2013c. “Gasification Database: Proposed U.S. Projects Having Commercial Potential.” October 2013. Available at <http://www.netl.doe.gov/File%20Library/research/coal/energy%20systems/gasification/ worldwide%20database/US-Gasification-Database.xlsx> (accessed 31 August 2015).
Alternatives Including the Proposed Action
2-32
[NETL] National Energy Technology Laboratory. Undated. Supercritical Pulverized Bituminous Coal Plant. 4 p. Available at <http://www.netl.doe.gov/KMD/cds/disk50/PC%20Plant%20Case_Supercritical_051507.pdf> (accessed 31 August 2015). [NRC] U.S. Nuclear Regulatory Commission. 1996. Generic Environmental Impact Statement for License Renewal of Nuclear Plants, Final Report. Washington, DC: NRC. NUREG–1437, Volumes 1 and 2. May 31, 1996. 1,204 p. ADAMS Nos. ML040690705 and ML040690738. [NRC] U.S. Nuclear Regulatory Commission. 2002. Final Generic Environmental Impact Statement on Decommissioning of Nuclear Facilities: Supplement 1, Regarding the Decommissioning of Nuclear Power Reactors. NUREG–0586, Volumes 1 and 2. Washington, DC: NRC. November 30, 2002. 516 p. ADAMS Nos. ML023470327, ML023500228, and ML023500295. [NRC] U.S. Nuclear Regulatory Commission. 2008. Final Environmental Impact Statement for an Early Site Permit (ESP) at the Vogtle Electric Generating Plant Site. Washington, DC: NRC. NUREG–1872, Volumes 1 and 2. August 2008. 1,242 p. Available at <http://www.nrc.gov/reading-rm/doc-collections/nuregs/staff/sr1872/index.html> (accessed 31 August 2015). [NRC] U.S. Nuclear Regulatory Commission. 2009. Frequently Asked Questions about License Applications for New Nuclear Power Reactors. NUREG/BR–0468. December 2009. 110 p. Available at <http://www.nrc.gov/reading-rm/doc-collections/nuregs/brochures/br0468/> (accessed 31 August 2015). [NRC] U.S. Nuclear Regulatory Commission. 2011. Final Supplemental Environmental Impact Statement for Combined Licenses (COLs) for Vogtle Electric Generating Plant, Units 3 and 4, Final Report. Washington, DC: NRC. NUREG–1947. March 2011. 568 p. ADAMS No. ML11076A010. [NRC] U.S. Nuclear Regulatory Commission. 2013. Generic Environmental Impact Statement for License Renewal of Nuclear Plants. Revision 1. Washington, DC: NRC. NUREG–1437, Volumes 1, 2, and 3. June 30, 2013. 1,535 p. ADAMS Nos. ML13106A241, ML13106A242, and ML13106A244. [NRC] U.S. Nuclear Regulatory Commission. 2015. “Status of License Renewal Applications and Industry Activities.” Available at <http://www.nrc.gov/reactors/operating/licensing/renewal/applications.html> (accessed 31 August 2015). [NREL] National Renewable Energy Laboratory. 2014a. “Dynamic Maps, GIS Data, and Analysis—Wind Data Details.” February 6, 2014. Available at <http://www.nrel.gov/gis/wind_detail.html> (accessed 4 September 2015). [NREL] National Renewable Energy Laboratory. 2014b. “Learning about Renewable Energy—Solar Energy Basics.” July 25, 2014. Available at <http://www.nrel.gov/learning/re_solar.html> (accessed 31 August 2015). [NREL] National Renewable Energy Laboratory. 2015a. “Dynamic Maps, GIS Data, and Analysis Tools—Wind Data.” April 15, 2015. Available at <http://www.nrel.gov/gis/data_wind.html> (accessed 4 September 2015). [NREL] National Renewable Energy Laboratory. 2015b. “Dynamic Maps, GIS Data, and Analysis Tools—Solar Maps.” February 2, 2015. Available at <http://www.nrel.gov/gis/solar.html> (accessed 4 September 2015).

Alternatives Including the Proposed Action
2-33
Ong S, Campbell C, Denholm P, Margolis R, Heath G. 2013. Land-Use Requirements for Solar Power Plants in the United States. Golden, Colorado: National Renewable Energy Laboratory. NREL/TP-6A20-56290. June 2013. 47 p. Available at <http://www.nrel.gov/docs/fy13osti/56290.pdf> (accessed 31 August 2015). [ORNL] Oak Ridge National Laboratory. 2012. An Assessment of Energy Potential at Non-Powered Dams in the United States. Oak Ridge, Tennessee: ORNL. April 2012. 44 p. Available at <http://www1.eere.energy.gov/water/pdfs/npd_report.pdf> (accessed 31 August 2015). Ott A. 2013a. Centralized Capacity Markets in Regional Transmission Organizations and Independent System Operators. Norristown, Pennsylvania: PJM Interconnection, LLC. October 3, 2013. 33 p. Available at <http://www.pjm.com/~/media/about-pjm/who-we-are/public-disclosures/ 20131004-board-response-to-chairman-powelson-regarding-generation-retirements.ashx> (accessed 31 August 2015). Ott A. 2013b. PJM/MISO Seams Coordination and Capacity Deliverability. Norristown, Pennsylvania: PJM Interconnection, LLC. June 20, 2013. 9 p. Available at <http://www.ferc.gov/industries/electric/indus-act/rto/pjm.pdf> (accessed 31 August 2015). [Reuters] Thomson Reuters. 2012. “Southern, Duke push US coal gasification; others quit.” June 12, 2012. Available at <http://www.reuters.com/article/2012/06/12/ utilities-coal-gasification-idUSL1E8H78P420120612> (accessed 31 August 2015). [TEEIC] Tribal Energy and Environmental Information Clearinghouse. Undated. “Utility-Scale and Direct Use Geothermal Energy Generation.” Available at <http://teeic.indianaffairs.gov/er/geothermal/restech/scale/index.htm> (accessed 31 August 2015). Tidball R, Bluestein J, Rodriguez N, Knoke S (ICF International). 2010. Cost and Performance Assumptions for Modeling Electricity Generation Technologies. Golden, Colorado: National Renewable Energy Laboratory. NREL/SR-6A20-48595. November 2010. 211 p. Available at <http://www.nrel.gov/docs/fy11osti/48595.pdf> (accessed 31 August 2015). [USGS] U.S. Geological Survey. 2008. Assessment of Moderate- and High-Temperature Geothermal Resources of the United States. Menlo Park, California: USGS. Fact Sheet 2008-3082. 4 p. Available at <http://pubs.usgs.gov/fs/2008/3082/pdf/fs2008-3082.pdf> (accessed 31 August 2015). [WAPA and FWS] Western Area Power Administration and U.S. Fish and Wildlife Service. 2013. Upper Great Plains Wind Energy Programmatic Environmental Impact Statement, Draft. DOE/EIS-0408. March 2013. 938 p. Available at <http://plainswindeis.anl.gov/documents/dpeis/Draft_UGP_Wind_Energy_PEIS.pdf> (accessed 31 August 2015).


3-1
3.0 AFFECTED ENVIRONMENT
In this supplemental environmental impact statement (SEIS), the “affected environment” is the environment that currently exists at and around LaSalle County Station, Units 1 and 2 (LSCS). Because existing conditions are at least partially the result of past construction and operation at the plant, the impacts of these past and ongoing actions and a discussion on how they have shaped the environment are presented here. The facility and its operation are described in Section 3.1. The affected environment is presented in Sections 3.2 to 3.13.
3.1 Description of Nuclear Power Plant Facility and Operation
LSCS is a two unit nuclear power plant located in LaSalle County, Illinois. It began commercial operation in January 1984 (Unit 1) and October 1984 (Unit 2). Generally, the U.S. Nuclear Regulatory Commission (NRC) staff drew information about LSCS’s facilities and operation from the Exelon Generation Company, LLC (Exelon), Environmental Report (ER) (Exelon 2014a).
3.1.1 External Appearance and Setting
The LSCS site is approximately 75 miles (mi) (120 kilometers (km)) southwest of downtown Chicago, Illinois, and approximately 26 mi (42 km) west of Exelon’s Braidwood Station in Braceville, Illinois, and 23 mi (37 km) southwest of the Dresden Nuclear Power Station near Morris, Illinois. Interstate Highway 80 is 8 mi (13 km) north of the site. Figure 3–1 presents the 50-mi (80-km) area around LSCS. The LSCS site is located in a rural and agricultural setting. However, the surroundings are dominated by many wind turbines, none of which is owned by Exelon. Each wind turbine is 389 feet (ft) (119 meters (m)) tall (which includes the length of one of its three 126.5-ft (38.5-m) rotator blades). The town of Seneca lies 6 mi (10 km) northeast of LSCS. The town of Marseilles lies 7 mi (11 km) north-northwest of LSCS. The Illinois River is 5 mi (8 km) north of LSCS. The CSX Railroad, which runs parallel to, and slightly north of, the Illinois River, is the closest railroad line in this area. A 6-mi (10-km) rail spur connects LSCS to the Atchison, Topeka, and Santa Fe Railroad south of the site (Exelon 2014a). Figure 3–2 presents the 6-mi (10-km) area around LSCS. The LSCS site is approximately 3,776 acres (ac) (1,528 hectares (ha)) of which approximately 2,058 ac (833 ha) are the cooling pond. Underground pipelines approximately 3.5 mi (5.6 km) long connect the cooling pond to the Illinois River, which is the source of the plant’s makeup water and the receiving body of water for plant discharges. This pipeline corridor right-of-way intersects the eastern portion of the Marseilles State Fish and Wildlife Area, which is managed by the Illinois Department of Natural Resources (IDNR) for hunting and wildlife habitat. County Road 6 (also known as North 21st Road) provides access to LSCS and runs along the site’s southern boundary (Exelon 2014a). Figure 3–3 presents the LSCS site layout. The LSCS site’s main structures include two reactor buildings, an auxiliary building (which houses the control room), a turbine building, a diesel generator building, a switchyard, a training building, an interim radioactive waste (radwaste) storage facility, a radwaste building, sewage and wastewater treatment facilities, and an independent spent fuel storage installation (ISFSI). The site’s tallest structure is a 400-ft (122-m) meteorological tower. The area of the LSCS site that is completely enclosed by physical barriers and that allows access only at designated control points is called the protected area. A physical protection program at the LSCS site includes surveillance, observation, and monitoring within the protected area (Exelon 2014a). Figure 3–4 presents the LSCS plant features.

Affected Environment
3-2
Figure 3–1. LSCS 50-mi (80-km) Radius Map
Source: Exelon 2014a
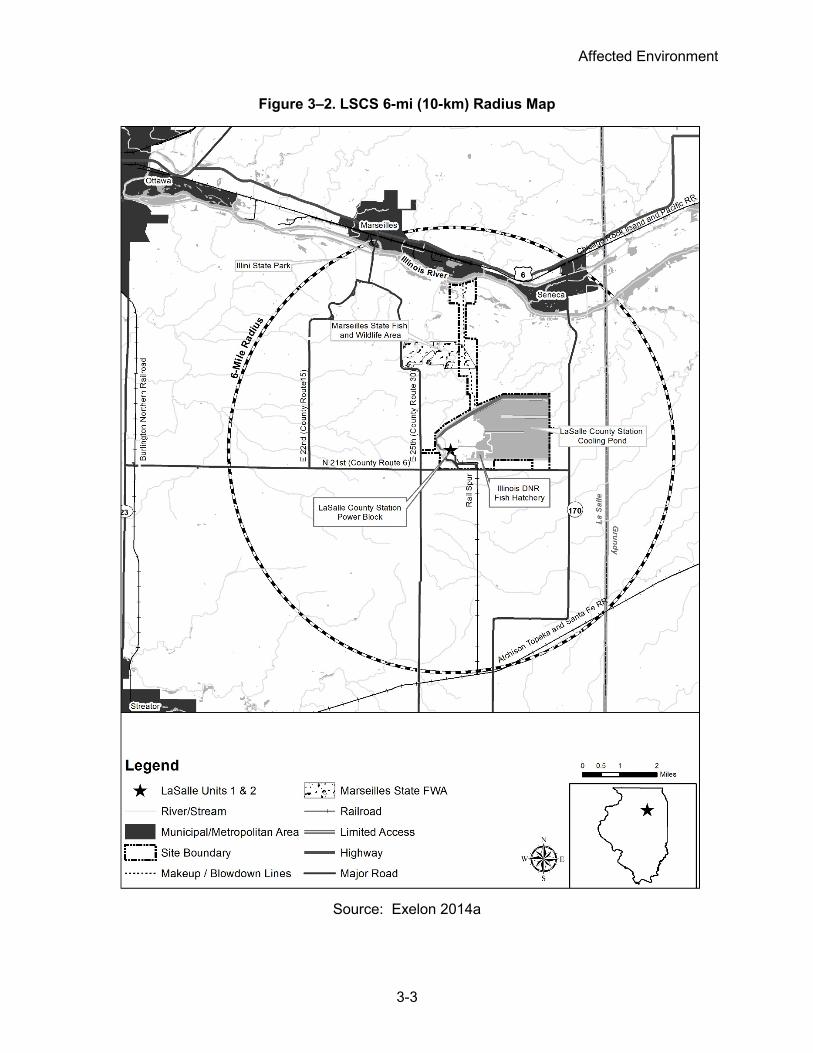
Affected Environment
3-3
Figure 3–2. LSCS 6-mi (10-km) Radius Map
Source: Exelon 2014a
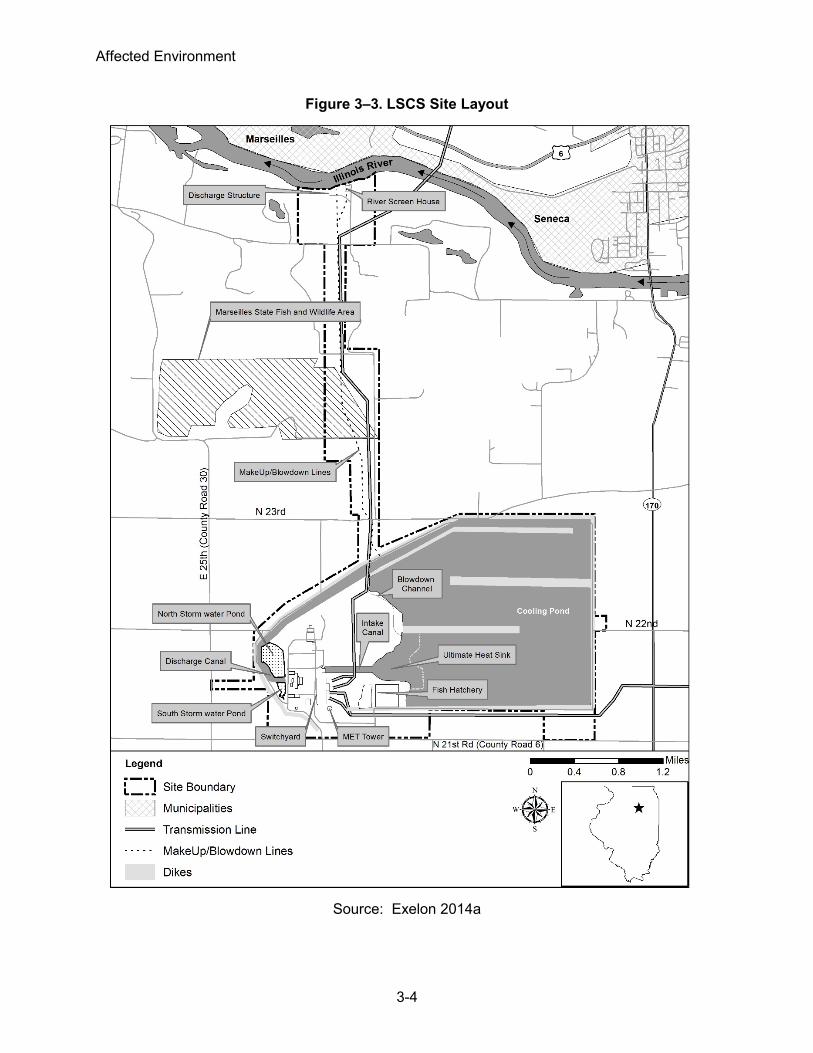
Affected Environment
3-4
Figure 3–3. LSCS Site Layout
Source: Exelon 2014a

Affected Environment
3-5
Figure 3–4. LSCS Plant Features
Source: Exelon 2014a

Affected Environment
3-6
3.1.2 Nuclear Reactor Systems
The nuclear reactor for each of the two LSCS units is a General Electric boiling water reactor (BWR/5) with Mark II containment. Each LSCS reactor is licensed to produce core power of 3,546 megawatts thermal. The annual mean net electrical power capacity for LSCS is 2,327 megawatts electric. LSCS uses a 2,058-ac (833-ha) diked cooling pond for core cooling and holds appropriate permits to withdraw makeup water from, and discharges cooling pond blowdown water to the Illinois River (Exelon 2014a). LSCS operates using low-enriched uranium dioxide fuel with enrichment not exceeding a nominal 5.0 percent by weight of uranium-235 and has been historically operated within a maximum analyzed fuel burnup rate of 62,000 megawatt-days per metric ton of uranium (MWd/MTU). In its ER, Exelon stated that, during some future fuel cycles, it expects the peak fuel burnup rate to exceed 62,000 MWd/MTU in some part-length fuel rods. Addendum 1 to Volume 1 of NUREG–1437, Generic Environmental Impact Statement for License Renewal of Nuclear Power Plants (GEIS) (NRC 1999), states that the environmental impacts would be small for transporting spent fuel enriched with up to 5-percent uranium-235 with an average burnup for the peak rod of up to 62,000 MWd/MTU. It also states that, if peak fuel burnup is projected to exceed 62,000 MWd/MTU, license renewal applicants must submit an assessment of the implications for the environmental impacts. Exelon submitted an assessment of the environmental impacts of transporting spent fuel enriched with an average burnup for the peak rod exceeding 62,000 MWd/MTU in Section 4.13 of its ER. Appendix G of this document provides the NRC staff’s analysis of these projected environmental impacts. Refueling outages for LSCS, Units 1 and 2, are on a staggered 24-month schedule (Exelon 2014a).
3.1.3 Cooling and Auxiliary Water Systems
LSCS uses a closed-cycle, recirculating cooling system that includes an artificial cooling pond for heat dissipation. In this type of closed-cycle system, the cooling pond serves as the primary source of water to cool plant components and as the primary receiving body for excess heat. In BWRs like those used at LSCS, steam is produced directly in each reactor vessel. The steam passes through moisture separators and steam dryers and then flows to the turbine. Such systems contain only two heat transfer (exchange) loops. The primary loop transports the steam from the reactor vessel directly to the turbine, which generates electricity. The secondary cooling loop removes excess heat from the primary loop in the main condenser. From the condenser, the primary condensate is returned as feedwater to the reactor, and the secondary cooling loop removes the excess heat (NRC 2013). At LSCS, condenser cooling water is discharged directly to the cooling pond, where the heat is dissipated through mixing and evaporation (Exelon 2014a). Cooling water that is not otherwise lost from the pond through evaporation or seepage is recirculated from the cooling pond through the condenser systems in a continuous loop. In addition, a portion of the water in the cooling pond is discharged as blowdown on a near continuous basis under normal conditions. (Blowdown is water that is diverted from the cooling system (i.e., cooling pond) to remove impurities that may degrade plant performance.) Total dissolved solids are the primary constituents of concern to prevent scale buildup on plant components. All water lost from the recirculating system must be replaced with fresh water; this water is referred to as makeup water (Exelon 2014a; NRC 2013). Makeup water for the onsite cooling pond is withdrawn from, and blowdown is discharged to, the Illinois River, which lies 3.5 mi

Affected Environment
3-7
(5.6 km) north of LSCS’s cooling pond. The intake and blowdown pipelines are routed below ground through a common right-of-way corridor. Figure 3–5 provides a basic schematic diagram of a closed-cycle, recirculating cooling system that uses a cooling pond.
Figure 3–5. Closed-Cycle Cooling System with Cooling Pond
Source: Modified from NRC 2013, Figure 3.1–4
Groundwater is also used by LSCS for potable water, sanitary water, and demineralized water makeup systems. Unless otherwise cited, the NRC primarily drew information about LSCS’s cooling and auxiliary water systems from Exelon’s ER (Exelon 2014a, 2015p) and its Updated Final Safety Analysis Report (UFSAR) (Exelon 2014b). The NRC staff visited the facilities cited herein during the May 2015 environmental site audit (NRC 2015b). Descriptions of the individual plant cooling and auxiliary systems and components that interact with the environment are provided below. Cooling Pond and Ultimate Heat Sink. Water for the circulating water system (CWS) for condenser cooling water and for the plant service water system are supplied directly from the cooling pond. The LSCS cooling pond is an engineered impoundment encompassing 2,058 ac (833 ha) with an average depth of 15 ft (4.7 m) (NRC 1978) (Figure 3–6). The pond has an elevation of 700 ft (213 m) above mean sea level (MSL) at normal pool elevation. At this water elevation, the cooling pond has a storage capacity of 31,706 acre-feet (39 million cubic meters (m3)) of water. This impoundment was formed by constructing earthen dikes to enclose the north, east, and south sides of the pond; a natural levee created by existing topography forms the fourth side. Engineered fill consisting of silty-clay, taken from borrow areas within the pond basin, was used in the construction of these peripheral dikes. A perimeter drainage ditch designed to intercept runoff and to capture and direct seepage toward surface drainages and away from the dikes flanks the pond’s dikes (Exelon 2014b). Integral to the pond’s construction are three internal baffle or finger dikes (i.e., earthen berms), that total 22,623 ft (6,895 m) in length. These structures direct the flow of water from the discharge canal and through the pond to ensure that the coolest water is available for use by LSCS (Exelon 2014b) (Figure 3–6). The average residence time for water in the cooling pond is 5.5 days (NRC 1978).

Affected Environment
3-8
The peripheral dike system that encloses the cooling pond includes a 300-ft- (91-m)-wide auxiliary spillway structure. The spillway is located northwest of the main plant complex and is adjacent to the discharge canal. The structure is capable of passing a volume of 1,069,000 gallons per minute (gpm) (2,380 cubic feet per second (cfs) or 67.2 meters per second (m/s)) of water associated with the probable maximum water level. Discharge from the structure flows north to South Kickapoo Creek, a tributary to the Illinois River (Exelon 2014b). A dedicated portion of the cooling pond located immediately adjacent to the LSCS intake canal serves as the plant’s ultimate heat sink (UHS). It is also known as the core standby cooling system (CSCS) pond and directly supplies the CSCS equipment cooling water system, as discussed below. This excavated area comprises 83 ac (34 ha) in size and is 5 ft (1.5 m) deep below grade. It can hold 460 acre-feet (567,000 m3) of water. This volume of water is sufficient to supply 30 days of cooling water following safe shutdown from normal operating or accident conditions. The CSCS pond can function even if the perimeter dikes of the cooling pond are breached (Exelon 2014b). Illinois River Water Makeup System. Cooling pond makeup water is withdrawn via the river screen house located on the south bank of the Illinois River at Illinois River Mile (RM) 249.5 (River Kilometer (RKm) 401.5) (Figure 3–6). The river screen house is situated approximately 3.5 mi (5.6 km) north of the cooling pond. The structure is designed to withstand the 100-year flood of the Illinois River (Exelon 2014b). The river screen house contains three makeup water pumps, each with a capacity of 30,000 gpm (67 cfs or 1.9 cubic meters per second (m3/s)). Two pumps are normally operated at all times to meet cooling pond makeup demands, with the third serving as a backup. However, when reduced evaporation demands allow (winter months), the pump discharge ball valves are closed to 30 degrees (one-third open) (Exelon 2015c). River water is first drawn through an intake flume in the bottom of the river and then into a 72-ft- (22-m)-wide funnel inlet basin with concrete dam located 24 ft (7 m) from the shoreline frontage of the river screen house. The inlet is protected by a floating log boom to deflect river debris. From the inlet, water then enters the intake forebay of the screen house and passes first through two adjacent bar grills and then through vertical traveling screens with 3/8-inch (in.) (0.95-centimeter (cm)) openings before entering the pumps (Exelon 2014a, 2015c). The bar grills are galvanized steel and measure 3/8 in. (0.95 cm) thick and 4 in. (10 cm) wide. The narrow dimension of each bar is oriented perpendicular to the incoming water flow, and the centerlines of the narrow dimension of adjacent bars are spaced 3 in. (7.6 cm) apart (Exelon 2015c). Water velocity in the river intake channel is reported as ranging from 0.3 to 0.5 feet per second (fps) (0.10 to 0.15 m/s) with one pump operating and 0.6 to 1.0 fps (0.2 to 0.3 m/s) with two pumps operating. Flow velocity at the travelling screens ranges from about 0.5 to 0.9 fps (0.15 to 0.3 m/s) with one and two makeup pumps in full operation, respectively (NRC 1978; Exelon 2014a). In NRC’s Final Environmental Statement for the operating license of LSCS, the NRC staff estimated that the intake velocity at the face of the traveling screens would be 0.5 fps (0.2 m/s) 93 percent of the time and 1.0 fps (0.3 m/s) the remaining 7 percent of the time (NRC 1978). Exelon has not performed any operational studies to further characterize intake flow velocities (Exelon 2015c). Based on the assessment the NRC performed for LSCS’s operating license (NRC 1978), the velocity at the face of the traveling screens would typically be within the 0.5-fps (0.15-m/s) intake velocity now recommended by the U.S. Environmental Protection Agency (EPA) for protection of aquatic organisms (Volume 69 of the Federal Register, page 41576 (69 FR 41576)), although the velocity may be closer to 1.0 fps (0.3 m/s) during certain periods during operations.

Affected Environment
3-9
Figure 3–6. LSCS Cooling Water Supply and Discharge Facilities
Sources: Modified from Exelon 2014a, 2015p

Affected Environment
3-10
A backwash system removes debris from the river intake traveling screens, and trash rakes remove debris from bar grills. The backwash system can be set to operate in automatic or manual mode, but the system is normally left in automatic mode unless high debris loading requires manual cleaning. In automatic mode, cleaning is initiated when the measured differential water level across the screens reaches 4 in. (10 cm). With a differential water level of 6 in. (15 cm), the system switches to fast speed. A differential level in excess of 16 in. (40 cm) for at least 15 seconds will cause the associated makeup pumps to trip to prevent cavitation damage. Manual mode with either a slow or fast speed setting may be used during periods of high debris loading (Exelon 2015c). Collected debris, including any impinged biota, is deposited in a trash basket located outside the river screen house, with the debris ultimately disposed of in an offsite permitted landfill. The river screen house is not equipped with a fish return system. Screen backwash and other intermittent discharges from the screen house are discharged to the Illinois River through a National Pollutant Discharge Elimination System (NPDES)-permitted outfall (Outfall 002). The intake forebay of the facility has a floating oil boom to prevent any oil leaks from the screen house from entering the river. Section 3.5.1.3 of this SEIS presents additional information on water quality and LSCS’s NPDES permit. With all three river makeup water pumps in operation, LSCS’s maximum surface water makeup supply capacity is 90,000 gpm (200 cfs or 5.66 m3/s), which is equivalent to 129.6 million gallons per day (mgd) (491,000 cubic meters per day (m3/day)). Normal peak makeup withdrawal from the Illinois River, with two pumps operating, is 60,000 gpm (134 cfs or 3.77 m3/s) or 86.4 mgd (327,000 m3/day). Surface water use is detailed in Section 3.5.1.2. From the river screen house, intake water is pumped south to the northern end of the LSCS cooling pond through a 60-in. (152-cm) below ground pipeline. Upon reaching the pond, the water is conveyed into the pond through a reinforced concrete discharge structure located on the north side of the pond’s discharge canal. The structure is designed to prevent erosion of the cooling pond dike (Exelon 2014b) (see Figure 3–6). The river intake pipeline is equipped with air and vacuum relief valves along its course to help guard against pressure surges and other conditions that sometimes occur due to elevation changes along its routing. Nevertheless, the makeup pipeline, which is not a safety-related structure, has experienced a number of breaks resulting in flooding and erosion of areas surrounding the break. To date, no pipeline breaks have affected reactor operation. Pipeline repairs typically involve establishing a temporary roadway to the location of the break, excavating to expose the broken pipe, removal and replacement of the broken pipe section, backfill of the excavation site, grading to return the surface to approximate the original contour of the land surface, and stabilization of the excavation site and temporary roadway to prevent erosion pending revegetation. The most recent such break occurred on January 23, 2014. Exelon reported the break to both the Illinois Environmental Protection Agency (IEPA) and EPA Region V in accordance with the reporting provisions of Exelon’s NPDES permit (Exelon 2015c). To address issues associated with pipeline breaks, Exelon has performed maintenance, including replacing relief valves, and has installed instrumentation on the intake traveling screens to alert the LSCS control room operators to abnormal conditions. Exelon has also modified operating and response procedures and has implemented plans and procedures to prevent and quickly respond to any breaks. For example, operational procedures have been modified to include checks on pipeline integrity and to ensure necessary parts are maintained to replace a section of pipeline should a break occur (Exelon 2014a, 2015c).

Affected Environment
3-11
CWS and Blowdown Discharge. The CWS provides cooling water to the main condensers. In addition to the condensers, the system includes the cooling pond, lake screen house, circulating water pumps, piping, valves, and related equipment. The system normally supplies water to the main condensers at temperatures ranging from 32 °F to a maximum of 100 °F (0 to 37.8 °C) (Exelon 2014b). However, operating license technical specifications (TS) limit the temperature of the cooling water supplied to the facility from the UHS portion of the cooling pond within diurnal temperature limits based on the time of day, but that are no higher than 104 °F (40 °C) (NRC 2015e). The main condenser of each unit requires 616,500 gpm (1,373 cfs or 38.8 m3/s), or 888 mgd (3.36 million m3/day) of circulating water flow to remove waste heat at 100-percent load. Cooling water is withdrawn from the cooling pond through the lake screen house, which is located at the west end of the intake canal (Figure 3–6). The lake screen house contains six circulating water pumps (three for each unit) that take suction from the service water tunnel (Exelon 2014a). Each pump has a capacity of 205,500 gpm (457.7 cfs or 12.9 m3/s) (Exelon 2015c), with two pumps normally in operation per unit to supply water to the condensers. Water first enters the intake forebays after passing through bar grills and traveling screens with 3/8-in. (0.95-cm) openings. The design water intake velocity at the screens is approximately 2.2 fps (0.7 m/s), assuming clean screens. Debris removed from the traveling screens by the screen backwash system and from the bar grills by trash rakes is collected in a trash basket and disposed of in an offsite permitted landfill. Similar to the river intake backwash system, the circulating water backwash system can be operated in either automatic or manual mode. When in automatic mode with a differential water level across the screens ranging between 0 and 6 in. (0 to 15 cm), a timer initiates a 3-minute wash cycle every 12 to 14 hours. With a differential level rising to between 6 and 10 in. (15 to 25 cm), a continuous backwash cycle starts at slow speed. The fast setting is triggered with a differential water level exceeding 10 in. (25 cm). Manual mode may be used during fish runs or other periods of high debris intake (Exelon 2015c). Like the river screen house, the lake screen house has no fish return system (Exelon 2014a, 2014b). From the lake screen house, water is pumped through the main condenser of each unit. A chemical feed system, located in facilities adjacent to the lake screen house, injects biocide and other chemical treatments to reduce biofouling, silting, and scale buildup in the condenser systems. After passing through the unit condensers, heated circulating water is returned to the cooling pond through the discharge canal. The nominal (design) temperature rise in the circulating water passing through the main condensers is approximately 26.7 °F (10 °C) (Exelon 2014b). As previously stated, a series of parallel dikes in the cooling pond direct and slow the rate of movement of the returned cooling water through the pond to facilitate residence time cooling processes so that the coolest water is available for uptake again at the lake screen house. This heat dissipation is necessary so that cooling pond blowdown to the Illinois River meets temperature limitations and mixing zone requirements under the Illinois thermal water quality standards (35 Illinois Administrative Code (IAC) 302) and Special Condition 3 of Exelon’s NPDES Permit No. IL0048151 (IEPA 2013). The permit also authorizes the discharge of various other effluent streams to the cooling pond in addition to condenser cooling water, as further described in Section 3.5.1.3 of this SEIS. Blowdown combined with other comingled effluent streams flows through an open channel originating at the west shore of the cooling pond (UHS portion) and then northwest to a spillway adjacent to the LSCS discharge canal (see Figure 3–6).

Affected Environment
3-12
The blowdown spillway connects to a 66-in. (168-cm) diameter pipeline through which the collected blowdown and other effluent streams travel underground via gravity flow. The blowdown pipeline can also receive processed liquid radioactive waste (radwaste), which may be discharged on a batch basis directly into the blowdown pipeline at a maximum rate of 45 gpm (0.17 cubic meters per minute) (Exelon 2014a). Nevertheless, the radwaste discharge line is equipped with a radiation monitor that will automatically close the radwaste discharge valve in the event of a high-radiation signal (Exelon 2014b). The pipeline discharges into an approximately 500-ft- (150-m)-long discharge structure consisting of a plunge pool and rip-rapped lined swale that connects with the Illinois River at RM 249.4 (RKm 401) and just downstream of the LSCS river screen house (see Figure 3–6). The maximum blowdown rate of the system is equal to the maximum intake rate of 90,000 gpm (200 cfs or 5.66 m3/s). However, motor-operated valves at both the river and lake ends of the discharge line can be used to isolate the pipeline for maintenance and are used to adjust the blowdown to an average of 58,000 gpm (129 cfs or 3.65 m3/s) or less with a target annual average of 30,000 gpm (67 cfs or 1.89 m3/s) (Exelon 2014a, 2014b). The blowdown discharge point is regulated under LSCS’s NPDES permit as Outfall 001 (see Section 3.5.1.3). Because the blowdown pipeline functions under gravity flow, it is less susceptible to surges and breakage than the river intake pipeline. It is also equipped with air and vacuum relief valves. Nevertheless, breaks do occur. The most recent such break occurred on July 13, 2012. Exelon reported the break to both the IEPA and EPA Region V. As discussed above for the makeup pipeline, Exelon has implemented a program to reduce the frequency of breaks and their impacts on operations and the environment (Exelon 2015c). Plant Service Water System. The service water system provides cooling water for various nonsafety-related auxiliary systems and components, including cooling water for the turbine generator; various air conditioning condensers; and the fuel pool, turbine building, and reactor building heat exchangers. It also supplies water for the lake screen house traveling screen backwash system and the radwaste system, and it is used to fill the fire protection system and serves as a backup fire water supply. Service water is normally supplied by four pumps, with a fifth pump serving as a backup, located in the lake screen house. Each pump has a capacity of 16,000 gpm (35.6 cfs or 1.01 m3/s). The pumps take suction from the lake screen house intake service water tunnel and discharge into a common header. Automatic backwash strainers remove any debris that might be passed through the circulating water screens. In addition, the system has two jockey pumps rated at 5,000 gpm (11.1 cfs or 0.31 m3/s). These pumps are powered by an emergency diesel generator and are used to meet minimum flow requirements during a loss of offsite power. The service water is also treated by the chemical feed system to guard against biofouling, scale buildup, corrosion, and silting. Chemical injection occurs directly to the service water tunnel feed lines. All service water return flows are discharged back to the cooling pond (Exelon 2014a, 2014b). Fire Protection Water System. The cooling pond is the source of fire protection water for the LSCS fire hydrants, the water sprinkler and deluge systems, and the hose valve stations. One of two 75-gpm (0.17-cfs or 0.005-m3/s) jockey pumps normally keep the system pressurized. If a system demand occurs, a 225-gpm (0.50-cfs or 0.014-m3/s) intermediate pump is activated. If the demands of the intermediate pump are exceeded, the first of two diesel-driven pumps are automatically engaged. These pumps, each with a capacity of 2,500 gpm (51 cfs or 1.44 m3/s), are located in the lake screen house and take suction directly from the service water tunnel (Exelon 2014b). Core Standby Cooling System. This system is equivalent in purpose to the essential service water systems at other nuclear power plants and provides cooling water for the purpose of

Affected Environment
3-13
cooling safety-related equipment necessary for safe shutdown of the reactors. This equipment includes the residual heat removal heat exchangers, pump seal coolers, and emergency diesel generators; the system also provides emergency spent fuel pool makeup water and a source of water for containment flooding for post-accident recovery. The CSCS withdraws cooling pond water from the UHS portion of the cooling pond (as discussed earlier) via the lake screen house service water tunnel. The water is chemically treated by the chemical feed system as previously described. As a safeguard against blockage of the traveling screens ahead of the service water channel, the system has a 54-in. (137-cm) bypass line that can be opened to directly supply CSCS water. All pumps and strainers for conveying emergency cooling water are located in watertight spaces within the basements of the various plant buildings (Exelon 2014a, 2014b). Potable Water System. LSCS uses groundwater from two deep wells (Nos. 1 and 2) to supply potable (drinking) water, sanitary water, and raw makeup water for the demineralized water system. The wells were installed during plant construction with completion depths of 1,629 ft (497 m) and 1,620 ft (494 m), respectively (Exelon 2014a). Each well has a pump capacity of 300 gpm (1.14 cubic meters per minute) (Exelon 2014b). Water is stored in a 350,000-gallon (gal) (1,325-m3) storage tank before distribution. The plant supply wells and LSCS’s groundwater use are further discussed in Section 3.5.2.2.
3.1.4 Radioactive Waste Management Systems
As part of normal operations and as a result of equipment repairs and replacements due to normal maintenance activities, nuclear power plants routinely generate both radioactive and nonradioactive wastes. Nonradioactive wastes include hazardous and nonhazardous wastes. There is also a class of waste, called mixed waste, which is both radioactive and hazardous. The systems used to manage (i.e., treat, store, and dispose of) these wastes are described in this section. Waste minimization and pollution prevention measures commonly employed at nuclear power plants are also discussed in this section. All nuclear plants were licensed with the expectation that they would release very limited quantities of radioactive material to both the air and water during normal operation. However, NRC regulations require that gaseous and liquid radioactive releases from nuclear power plants must meet radiation dose-based limits specified in Title 10 of the Code of Federal Regulations (10 CFR) Part 20, and the as low as is reasonably achievable (ALARA) criteria in Appendix I to 10 CFR Part 50. Regulatory limits are placed on the radiation dose that members of the public can receive from radioactive effluents released by a nuclear power plant. All nuclear power plants use radioactive waste management systems to control and monitor radioactive wastes. LSCS uses liquid, gaseous, and solid waste processing systems to collect and process, as needed, radioactive materials produced as a by-product of plant operations. The liquid and gaseous radioactive effluents are processed to reduce the levels of radioactive material prior to discharge into the environment. This is to ensure that the dose to members of the public from radioactive effluents is reduced to levels that are ALARA in accordance with NRC’s regulations. The radioactive material removed from the effluents is converted into a solid form for eventual disposal at a licensed radioactive disposal facility. Exelon has a radiological environmental monitoring program (REMP) to assess the radiological impact, if any, to the public and the environment from radioactive effluents released during operations at LSCS. The REMP measures the aquatic, terrestrial, and atmospheric environment for radioactivity, as well as the ambient radiation. In addition, the REMP measures background radiation (i.e., cosmic sources, global fallout, and naturally occurring radioactive material, including radon) (Teledyne 2015).

Affected Environment
3-14
LSCS has an Offsite Dose Calculation Manual (ODCM) that contains the methods and parameters used to calculate offsite doses resulting from liquid and gaseous radioactive effluents. These methods are used to ensure that radioactive material discharges from the plant meet NRC and EPA regulatory dose standards. The ODCM also contains the requirements for the REMP (Exelon 2013d). 3.1.4.1 Radioactive Liquid Waste Management
LSCS Units 1 and 2 share a common liquid radioactive waste system (LRWS). The LRWS collects, monitors, and processes any potentially radioactive liquid wastes produced in the plant. The LRWS also recycles as much processed liquid waste as can be accommodated within the LSCS water balance. Although LSCS tries to limit any radioactive releases via the liquid pathway, discharges from the system are authorized and may occur if treated waste water is not needed for other plant uses. The LRWS is designed so that any liquid radioactive waste discharged from the site will have radioactive nuclide concentrations below the limits specified in 10 CFR Part 20 and Appendix I to10 CFR Part 50. Processing of liquids in the LRWS results in a clean product stream and a reject stream. The clean product stream returns water for use by the main plant systems via the condensate storage tanks if the water quality is found acceptable and if the plant has the need for the makeup water. Water in the reject stream is processed for disposal in the solid radioactive waste system. Unused treated waste water can be sent to a discharge tank and held until a discharge batch accumulates. Before any release of a discharge batch, it would be sampled and treated if necessary to ensure radionuclide concentrations and resulting radiation doses to LSCS personnel and the general public comply with NRC regulations in 10 CFR Part 20 and Appendix I to 10 CFR Part 50. The LWRS sends discharge batches directly into the cooling pond blowdown line. The LRWS consists of a waste processing subsystem, a floor drain processing subsystem, a chemical waste subsystem, and a sludge subsystem. All subsystems are shared by LSCS Units 1 and 2. A vendor-provided liquid waste treatment system is also available to supplement the LRWS if needed. The waste processing subsystem collects and processes water from sources such as equipment drains. This water is treated by settling, filtration, and demineralization. After treatment and sampling, the water is returned for reuse through the condensate storage tanks. The floor drain processing subsystem collects and processes water from the floor drain systems. After treatment and sampling, the water is returned for reuse through the condensate storage tanks. The chemical waste subsystem collects and processes water from areas like the laboratory drains and the radwaste building sump. After treatment and sampling, plant procedures are used to determine where the processed water goes, which may include discharge. The sludge subsystem is not a processing stream, but rather a group of tanks and associated pumps that serve as an interface between the LRWS and the solid radioactive waste handling system. After radioactive contaminants have been removed from the LRWS, concentrated, and treated or held up to allow radioactive decay if necessary, they are transferred to the solid radioactive waste system for processing, temporary storage, and shipment for disposal. The use of these radioactive waste systems and the procedural requirements in the ODCM ensure that the dose from radioactive liquid effluents complies with NRC and EPA regulatory dose standards. Dose estimates for members of the public are calculated based on radioactive liquid effluent release data and aquatic transport models. Exelon’s annual radiological effluent release report

Affected Environment
3-15
contains the radioactive liquid effluents release data from LSCS and the resultant calculated doses. The NRC staff reviewed 5 years of radioactive effluent release data: 2010 through 2014 (Exelon 2011b, 2012b, 2013c, 2014c, 2015b). A 5-year period provides a data set that covers a broad range of activities that occur at a nuclear power plant, such as refueling outages, routine operation, and maintenance activities that can affect the generation of radioactive effluents. LSCS did not have any radioactive liquid effluent releases over the period of 2010 through 2014. Since LSCS had no radioactive liquid effluent releases for the period of 2010 through 2014, its radioactive liquid effluent control program showed that radiation doses to members of the public were controlled within the NRC’s and EPA’s radiation protection standards contained in Appendix I to 10 CFR Part 50, 10 CFR Part 20, and 40 CFR Part 190. Also, since LSCS had no radioactive liquid effluent releases for the period of 2010 through 2014, no adverse trends were observed in the dose levels. Routine plant refueling and maintenance activities currently performed will continue during the license renewal term. Based on the past performance of the radioactive waste system to maintain doses from radioactive liquid effluents to be ALARA, similar performance is expected during the license renewal term. 3.1.4.2 Radioactive Gaseous Waste Management
LSCS Units 1 and 2 share a common gaseous radioactive waste system (GRWS) with a common vent stack located on the roof of the containment building between the two units. The GRWS is designed to process and control radioactive gases and minimize the amount of radioactive gaseous material released into the environment. The gaseous radioactive wastes released consist primarily of xenon, argon, iodine, tritium, and carbon. The steam in a BWR plant such as LSCS contains impurities in the form of radioactive gases that are continuously removed during plant operation from the main condenser by an air ejector. This process is the major source of radioactive gases generated by LSCS (Exelon 2014a). The GRWS removes some radioactive gases and delays the release of other radioactive gases by adsorption on charcoal beds to allow time for radioactive decay. As a final step, the gaseous waste stream passes through a high efficiency particulate air filter, and is discharged through the common vent stack. Other plant facilities that are potential sources of radioactive gas emissions include the primary containment, the secondary containments (reactor buildings), the turbine buildings, and the radwaste building. The ventilation systems in each of these facilities have filtration and treatment systems that the air passes through before being discharged through the vent stack (Exelon 2014a). The use of these radioactive waste systems and the procedural requirements in the ODCM ensure that the dose from radioactive gaseous effluents complies with NRC and EPA regulatory dose standards. Dose estimates for members of the public are calculated based on radioactive gaseous effluent release data and atmospheric transport models. Exelon’s annual radioactive effluent release report contains a detailed presentation of the radioactive gaseous effluents released from LSCS and the resultant calculated doses. The NRC staff reviewed 5 years of radioactive effluent release data: 2010 through 2014 (Exelon 2011b, 2012b, 2013c, 2014c, 2015b). A 5-year period provides a data set that covers a broad range of activities that occur at a nuclear power plant, such as refueling outages, nonrefueling outage years, routine operation, and maintenance activities that can affect the generation of radioactive effluents. The NRC staff compared the data against NRC dose limits and looked for indication of adverse trends (i.e., increasing dose levels) over the period of 2010 through 2014. Since the radioactive gaseous effluents are released from a common vent stack shared by both Unit 1 and Unit 2, the resultant calculated
Affected Environment
3-16
doses presented in the effluent release are divided in half to evaluate compliance with the Appendix I to 10 CFR Part 50 dose criteria. The following summarizes the calculated doses from radioactive gaseous effluents released from LSCS Units 1 and 2 during 2014: Unit 1
• The air dose at the site boundary from gamma radiation in gaseous effluents from LSCS was 2.36×10⁻² millirad (mrad) (2.36×10⁻⁴ milligray (mGy), which is well below the 10 mrad (0.1 mGy) dose criterion in Appendix I to 10 CFR Part 50.
• The air dose at the site boundary from beta radiation in gaseous effluents from LSCS was 1.10×10⁻³ mrad (1.10×10⁻⁵ mGy), which is well below the 20 mrad (0.2 mGy) dose criterion in Appendix I to 10 CFR Part 50.
• The dose to an organ (thyroid) from radioactive iodine, radioactive particulates, and carbon-14 from LSCS was 4.56×10⁻¹ millirem (mrem) (4.56×10⁻³ millisievert (mSv)), which is well below the 15 mrem (0.15 mSv) dose criterion in Appendix I to 10 CFR Part 50.
Unit 2
• The air dose at the site boundary from gamma radiation in gaseous effluents from LSCS was 2.36×10⁻² mrad (2.36×10⁻⁴ mGy), which is well below the 10 mrad (0.1 mGy) dose criterion in Appendix I to 10 CFR Part 50.
• The air dose at the site boundary from beta radiation in gaseous effluents from LSCS was 1.10×10⁻³ mrad (1.10×10⁻⁵ mGy), which is well below the 20 mrad (0.2 mGy) dose criterion in Appendix I to 10 CFR Part 50.
• The dose to an organ (thyroid) from radioactive iodine, radioactive particulates, and carbon-14 from LSCS was 4.56×10⁻¹ mrem (4.56×10⁻³ mSv), which is well below the 15 mrem (0.15 mSv) dose criterion in Appendix I to 10 CFR Part 50.
The NRC staff’s review of LSCS’s radioactive gaseous effluent control program showed that radiation doses to members of the public were controlled within NRC’s and EPA’s radiation protection standards contained in Appendix I to 10 CFR Part 50, 10 CFR Part 20, and 40 CFR Part 190. No adverse trends were observed in the dose levels. Routine plant refueling and maintenance activities currently performed will continue during the license renewal term. Based on the past performance of the radioactive waste system to maintain doses from radioactive gaseous effluents to be ALARA, similar performance is expected during the license renewal term. 3.1.4.3 Radioactive Solid Waste Management
LSCS Units 1 and 2 share a common solid radioactive waste system (SRWS). The SRWS receives, dewaters, solidifies, packages, handles, and provides temporary storage facilities for all radioactive wet solid wastes prior to offsite shipment and disposal in accordance with NRC regulations in 10 CFR Parts 61 and 71. It also receives, decontaminates, compacts (as necessary), and provides temporary storage facilities for all radioactive dry wastes prior to offsite shipment and disposal (Exelon 2014a). Transportation of the radioactive solid waste is governed by the U.S. Department of Transportation regulations in 49 CFR Parts 171 to 178. LSCS disposes of solid radioactive waste at facilities in Utah and Texas. LSCS also utilizes offsite vendor services in Tennessee for dry active waste processing, including compaction, incineration, thermal processing, and sorting of the dry active waste.

Affected Environment
3-17
LSCS Units 1 and 2 have a shared Interim Radwaste Storage Facility (IRSF) with the capacity to hold 270 containers of Class B and Class C (Class B/C) low-level radioactive wastes in two layers of 135 spots each. In 2011, LSCS Units 1 and 2 both received license amendments to allow their IRSF to store Class B/C waste from Braidwood, Byron, and Clinton Stations in addition to the wastes generated at LSCS. Exelon states that LSCS has sufficient excess storage capacity to accommodate extended storage of the Class B/C wastes generated by all four Exelon stations. Also, LSCS can ship Class B/C wastes for treatment and disposal to the Waste Control Specialists facility in Texas to reduce the demand for any extended onsite storage of those wastes. Therefore, storage capacity for low-level radioactive wastes should be sufficient for the length of the license renewal term. (Exelon 2014a) LSCS infrequently generates small quantities of mixed waste (waste having both a hazardous component and radioactive component). The IEPA regulates the hazardous component of the waste and the Illinois Emergency Management Agency Division of Nuclear Safety and the NRC regulate the radioactive component. When generated, mixed wastes are accumulated in the Mixed Waste Storage Building before transport to a licensed offsite facility for treatment and disposal (Exelon 2014a). LSCS has contracts to send its low-level waste (LLW) to two licensed LLW disposal sites: EnergySolutions in Clive, Utah, and Waste Control Specialists in Andrews, Texas. LSCS also sends certain wastes to Toxco Materials Management Center in Oak Ridge, Tennessee, and EnergySolutions in Oak Ridge, Tennessee for processing before disposal. In 2014, 30 LLW shipments were made from LSCS for processing and disposal to the EnergySolutions Clive facility in Clive, Utah, the EnergySolutions Bear Creek facility in Oak Ridge, Tennessee, and the Toxco Materials Management Center in Oak Ridge, Tennessee. The total volume and radioactivity of LLW shipped offsite in 2014 was 1.23×10³ m3 (4.34×10⁴ cubic feet and 1.34×101 curies (4.95×10⁵ megabecquerels), respectively (Exelon 2015b). Routine plant operation, refueling outages, and maintenance activities that generate radioactive solid waste will continue during the license renewal term. Radioactive solid waste is expected to be generated and shipped off site for disposal during the license renewal term. 3.1.4.4 Radioactive Waste Storage
Low-level radioactive waste (LLRW) is stored temporarily onsite before being shipped offsite for disposal at a licensed LLRW disposal facility. Exelon (2014a) stated that LSCS has sufficient capability to store Class B/C LLRW from Braidwood, Byron, and Clinton Stations in addition to LSCS Class B/C waste in the IRSF (Exelon 2014a). LSCS stores its spent fuel in a spent fuel pool and also in an onsite independent spent fuel storage installation (ISFSI). The ISFSI is used to safely store spent fuel in licensed and approved dry cask storage containers onsite. The installation and monitoring of this facility is governed by NRC requirements in 10 CFR Part 72, “Licensing requirements for the independent storage of spent nuclear fuel, high-level radioactive waste, and reactor-related Greater Than Class C waste.” The LSCS ISFSI will remain in place until the U.S. Department of Energy takes possession of the spent fuel and removes it from the site for permanent disposal or processing. Spent fuel transfers to the ISFSI began in 2010 when fuel from the spent fuel pool was placed in casks and transferred to the ISFSI storage pad. As of December 2014, there are 16 dry casks containing spent fuel on the ISFSI storage pad (Exelon 2015b). 3.1.4.5 Radiological Environmental Monitoring Program
Exelon conducts a REMP to assess the radiological impact, if any, to the public and the environment from operations at LSCS.
Affected Environment
3-18
The REMP measures the aquatic, terrestrial, and atmospheric environment for ambient radiation and radioactivity. Monitoring is conducted for the following: direct radiation, air, water, groundwater, milk, local agricultural crops, fish, and sediment. The REMP also measures background radiation (i.e., cosmic sources, global fallout, and naturally occurring radioactive material, including radon). In addition to the REMP, LSCS has an onsite groundwater protection program designed to monitor the onsite plant environment for detection of leaks from plant systems and pipes containing radioactive liquid (Teledyne 2015). Information on the groundwater protection program is contained in Section 3.5.2 of this document. The NRC staff reviewed 5 years of annual radiological environmental monitoring data: 2010 through 2014 (Teledyne 2011, 2012, 2013, 2014, 2015). A 5-year period provides a data set that covers a broad range of activities that occur at a nuclear power plant, such as refueling outages, routine operation, and maintenance activities that can affect the generation and release of radioactive effluents into the environment. The NRC staff looked for indication of adverse trends (i.e., buildup of radioactivity levels) over the period of 2010 through 2014. The NRC staff’s review of Exelon’s data showed no indication of an adverse trend in radioactivity levels in the environment. The data showed that there was no measurable impact to the environment from operations at LSCS.
3.1.5 Nonradioactive Waste Management Systems
Like any other industrial facility, nuclear power plants generate both hazardous and nonhazardous wastes that are not contaminated with radionuclides. LSCS has a nonradioactive waste management program to handle its nonradioactive hazardous and nonhazardous wastes. The waste is managed in accordance with Exelon’s procedures. Listed below is a summary of the types of waste materials generated and managed at LSCS.
• LSCS is typically a small quantity hazardous waste generator; however, hazardous wastes are managed according to large quantity generator standards. LSCS has contracts in place to transfer hazardous waste to licensed offsite treatment and disposal facilities.
• LSCS’s nonhazardous wastes include potentially infectious medical waste (PIMW), used oil, grease, antifreeze, adhesives, and other petroleum-based liquids. PIMW is generated at a health facility onsite and can include used and unused hypodermic needles and syringes, as well as items contaminated with human blood. PIMW is considered a unique special waste category in Illinois and transportation and disposal of this waste is regulated under the Illinois Administrative Code (IAC) Title 35, Sections 1420 through 1422 and 1450 (35 IAC 1420-1422, 1450).
• Universal wastes, such as batteries and mercury-containing lamps are managed in accordance with 35 IAC 733 standards. Other used materials, such as, oils, metals, paper, and other recyclables are recycled according to Exelon procedures and Illinois regulations.
Exelon operates an onsite sewage treatment plant. Sewage treatment effluent is discharged to the LSCS cooling pond. Nonradioactive industrial wastewater is also processed at a separate onsite wastewater treatment plant and the treated effluent is discharged into the cooling pond. Cooling pond blowdown is discharged to the Illinois River under NPDES permit IL0048151 (Exelon 2014a).

Affected Environment
3-19
3.1.6 Utility and Transportation Infrastructure
The utility and transportation infrastructure at nuclear power plants typically interfaces with public infrastructure systems available in the region. Such infrastructure includes utilities, including suppliers of electricity, fuel, and water, as well as roads and railroads that provide access to the site. The following sections briefly describe the existing utility and transportation infrastructure at LSCS. 3.1.6.1 Electricity
Nuclear power plants generate electricity for other users; however, they also use electricity to operate. Offsite power sources provide power to engineered safety features and emergency equipment in the event of a malfunction or interruption of power generation at the plant. Independent backup power sources provide power in the event that power is interrupted from both the plant and offsite power sources. At LSCS, connections to the Commonwealth Edison Company (ComEd) 345-kilovolt (kV) system at the onsite switchyard provide offsite power sources for essential safety systems and emergency equipment (Exelon 2014b). The switchyard is arranged in a double ring bus such that offsite power to both units cannot be lost due to any single failure (Exelon 2014b). In the event of total loss of auxiliary power from offsite sources, onsite diesel generators serve as an independent source of power for safe shutdown (Exelon 2014b). LSCS has five diesel generators. Two diesel generators each are provided for Units 1 and 2. The other diesel generator serves essential auxiliary functions for either Unit 1 or 2. Each diesel generator is designed and installed to provide up to 4.16 kV of power, which is ample capacity to supply all power required for the safe shutdown of both units in the event of a total loss of offsite power (Exelon 2014b). 3.1.6.2 Fuel
The LSCS nuclear units are operated using low-enriched uranium dioxide fuel with enrichment not exceeding 5 percent by weight of uranium-235. At any given time, the LSCS units contain approximately 140 metric tons (MT) (308,600 pounds) of uranium fuel (Exelon 2015b). Exelon replaces about 36 percent of that fuel at each refueling, which occurs on a staggered 24-month cycle (Exelon 2014a). Fresh (i.e., unirradiated) fuel is brought to the site and stored onsite in the LSCS new fuel storage facility prior to installation in the reactor cores (Exelon 2014b). Exelon stores spent fuel in a spent fuel pool and an ISFSI. Nuclear fuel and radioactive waste systems are further described in Section 3.1.4. In addition to nuclear fuel, LSCS requires diesel fuel to operate the emergency diesel power generators. To meet emergency demands, Exelon stockpiles diesel fuel and gasoline on the site. In total, LSCS has nominal onsite capacities to store as much as 204,080 gal (772,530 liters) of diesel fuel and gasoline for a variety of uses, including emergency diesel generators, diesel fire pumps, and plant vehicles (Exelon 2015b). 3.1.6.3 Water
In addition to cooling and auxiliary water (described in Section 3.1.3), nuclear power plants require potable water for sanitary and everyday uses by personnel (e.g., drinking, showering, cleaning, laundry, toilets, and eye washes). At LSCS, two deep wells supply the site with potable water. Water pumped from the wells is routed to an onsite vendor trailer, which deionizes the water and routes the water to a 1.3-million-liter (350,000-gal) storage tank. Water drawn from the storage tank may be used in either the demineralized water makeup system or the potable and sanitary water system. Water withdrawn for use in the potable water system

Affected Environment
3-20
undergoes chlorination prior to entering the system. LSCS withdraws approximately 98 liters per minute (L/min) (26 gpm) from the wells for potable water and other uses (Exelon 2014a). 3.1.6.4 Transportation Systems
All nuclear power plants are served by controlled access roads. In addition to roads, many plants also have railroad connections for moving heavy equipment and other materials. Some plants that are located on navigable waters, such as rivers, Great Lakes, or oceans, have facilities to receive and ship loads on barges. At LSCS, County Road 6, also known as North 21st Road and Grand Ridge-Mazon Road, provides access to the site from the southern boundary. Major roads in the area include State Route 170 (SR-170), which lies 0.8 km (0.5 mi) east of the site, and Interstate 80 (I-80), which lies 13 km (8 mi) north of the site. Section 3.10.6 describes local transportation systems, including roadway access, in more detail. Two major railway systems provide service near the LSCS site: the CSX Railroad runs parallel to and slightly north of the Illinois River, and a 10-km (6-mi) rail spur connects LSCS to the Atchison, Topeka, and Santa Fe Railroad south of the site. Exelon uses a portion of the onsite rail spur to transport spent fuel casks to the onsite storage area, but the spur has not been used to deliver equipment or materials to the site from external sources in many years. (Exelon 2015f) LSCS lies south of the Marseilles Pool in the reach of the Illinois River between the Marseilles Lock and Dam at Marseilles, Illinois, and the Dresden Island Lock and Dam south of Channahon, Illinois (Exelon 2014a). These lock and dam sites are part of the Illinois Waterway, which flows from Chicago, Illinois, to Grafton, Illinois, slightly upstream from St. Louis, Missouri, and is composed of seven water systems: Illinois River, Des Plaines River, Chicago Sanitary and Shipping Canal, South Branch Chicago River, Cal-Sag Channel, Little Calumet River, and the Calumet River (USACE 2012). Much of the barge traffic in this area is dominated by transportation of agricultural products (grains, corn, and soybeans) and other commodities, such as cement and concrete (USACE 2012). Exelon (2015g) does not own or maintain a barge slip for LSCS and does not otherwise receive or ship equipment for LSCS by barge. Major airports in the vicinity of LSCS include Chicago Midway International Airport, Chicago O’Hare International Airport, and Central Illinois Regional Airport, which lie approximately 93 km (58 mi) northeast, 100 km (60 mi) north-northeast, and 110 km (70 mi) south of the site, respectively. Additionally, Illinois Valley Regional Airport in Peru, Illinois, serves LaSalle County, and eight private airports in the county accommodate smaller cargo, passenger, and private aircraft (LaSalle County 2014). 3.1.6.5 Power Transmission Systems
ComEd owns and operates the 345-kV onsite switchyard that connects LSCS with the regional electric grid. From the switchyard, a total of six transmission lines extend to four substations. Two 345-kV lines travel 66 km (41 mi) north from the site to the Plano substation east of Plano, Illinois. Two 345-kV lines travel 100 km (62 mi) northeast to Braidwood Station, Units 1 and 2, in Braceville, Illinois. Two 138-kV lines are connected to the switchyard through a 345/138-kV transformer. One of the 138-kV line extends 27 km (17 mi) to Mazon, Illinois, and the other 138-kV line extends 40 km (25 mi) to Streator, Illinois (AEC 1973; NRC 1978; Exelon 2015h). For license renewal, the NRC (2013) evaluates as part of the proposed action the continued operation of those transmission lines that connect the nuclear power plant to the substation where electricity is fed into the regional power distribution system and transmission lines that supply power to the nuclear plant from the grid. During the environmental review,

Affected Environment
3-21
Exelon (2015h) determined that the four electrical connections between the main plant and the LSCS switchyard are the only lines that fall within these categories. Accordingly, the NRC considers these lines to be in scope for the license renewal environmental review. These connections extend a distance of 1,300 ft (400 m) across flat, primarily gravel laydown areas and paved roads (Exelon 2015h). Because redundant offsite power is provided to LSCS through the LSCS substation, no offsite transmission lines supply power to the nuclear plant from the grid (Exelon 2015h). All of the in-scope transmission lines lie within the owner-controlled and industrial-use area of the site.
3.1.7 Nuclear Power Plant Operations and Maintenance
Maintenance activities conducted at LSCS include inspection, testing, and surveillance to maintain the current licensing basis of the facility and to ensure compliance with environmental and safety requirements. Various programs and activities currently exist at LSCS to maintain, inspect, test, and monitor the performance of facility equipment. These maintenance activities include inspection requirements for reactor vessel materials, boiler and pressure vessel inservice inspection and testing, and maintenance of water chemistry. Additional programs include those carried out to meet TS surveillance requirements, those implemented in response to the NRC generic communications, and various periodic maintenance, testing, and inspection procedures. LSCS must periodically discontinue the production of electricity for outages supporting refueling, periodic in-service inspection and testing, and maintenance activities. The LSCS reactor units are on staggered 24-month refueling cycles (Exelon 2014a).
3.2 Land Use and Visual Resources
3.2.1 Land Use
3.2.1.1 Onsite Land Use
The LSCS site encompasses approximately 1,528 ha (3,776 ac) in Marseilles, LaSalle County, Illinois (Exelon 2015p). The site lies 8 km (5 mi) south of the Illinois River, about 10 km (6 mi) southwest of Seneca, Illinois, and 120 km (75 mi) southwest of downtown Chicago. (Exelon 2014a) A cooling pond occupies the eastern side of the site and accounts for about half of the site area. The generating facilities and associated infrastructure (roads, parking lots, warehouses, switchyards) lie west of the cooling pond and occupy approximately 65 ha (160 ac). This industrial area is surrounded by about 142 ha (350 ac) of undeveloped natural areas, including grassland, old field, shrub-scrub, and small forested fragments (Exelon 2015p). On the southwest shore of the cooling pond, the IDNR operates the LaSalle Fish Hatchery under a lease agreement with Exelon. The hatchery encompasses approximately 18 ha (45 ac) and includes several small buildings and 16 fish-rearing pools (Exelon 2014a). A 5.6-km (3.5-mi) corridor for the makeup and blowdown pipelines—which travel underground from the Illinois River screen house south to the cooling pond—contains woodlands, pastures, and wetlands as well as mowed and maintained right-of-way for a portion of the LaSalle-to-Plano 345-kV transmission line (Exelon 2014a). Table 3–1 lists site land uses, and Figure 3–3 depicts the site layout. Sections 3.1 and 3.6 describe the developed and natural areas of the site in more detail, respectively.

Affected Environment
3-22
Table 3–1. LSCS Site Land Uses by Area
Land Use Area (in acres)(a) Percent Open Water 1,976(b) 52.3 Developed, Open Space 120 3.2 Developed, Low Intensity 218 5.8 Developed, Medium Intensity 73 1.9 Developed, High Intensity 90 2.4 Barren Land 5 0.1 Deciduous Forest 386 10.2 Shrub/Scrub 17 0.5 Grassland/Herbaceous 473 12.5 Pasture/Hay 11 0.3 Cultivated Crops 346 9.2 Woody Wetlands 58 1.5 Emergent Herbaceous Wetlands 2 0.1 Total 3,776 100.0 (a) To convert acres to hectares, divide by 2.4711. (b) Exelon used the 2011 National Land Cover Database (NLCD) to estimate acreage of site land uses. Of the
3,776-acre site, the 2011 NLCD identified 1,976 acres as “open water,” most of which consists of the cooling pond. This number of acres is inconsistent with the 2,058 acres reported in ComEd’s Environmental Report that evaluated the operation of LSCS (ComEd 1977). However, because the methodologies used to estimate land use acreages are different between these documents and the NLCD, and because both methodologies are inherently uncertain, Exelon was unable to resolve the discrepancy between the cooling pond acreage estimates. It is possible that, in the 1977 Environmental Report, features such as dikes, screen house, discharge canals, and storm water ponds were included in the cooling pond acreage estimate. Accordingly, all estimates should be considered approximate.
Source: Exelon 2015d
3.2.1.2 Coastal Zone
In 1972, Congress promulgated the Coastal Zone Management Act (16 USC 1451 et seq.; CZMA) to encourage and assist States and territories in developing management programs that preserve, protect, develop, and, where possible, restore the resources of the coastal zone (i.e., the coastal waters and the adjacent shore lands strongly influenced by one another, which may include islands, transitional and intertidal areas, salt marshes, wetlands, beaches, and Great Lakes waters). Individual states are responsible for developing a Federally approved Coastal Management Plan and implementing a coastal management program in accordance with such a plan. In Illinois, the IDNR administers the coastal management program. Section 307(c)(3)(A) of the CZMA requires that applicants for Federal permits whose proposed activities could reasonably affect coastal zones certify to the licensing agency (here, the NRC) that the proposed activity would be consistent with the state’s coastal management program. The regulations that implement the CZMA indicate that this requirement is applicable to renewal of Federal licenses for actions not previously reviewed by the state (15 CFR 930.51(b)(1)). LSCS is outside of the boundary of the Illinois coastal zone (IDNR 2011b, 2015c). Accordingly, a consistency determination is not required for the proposed LSCS license renewal.

Affected Environment
3-23
3.2.1.3 Offsite Land Use
Within a 10-km (6-mi) radius of the LSCS site, most lands are contained within LaSalle County; however, this radius also includes a small area of land in Grundy County to the east. Land use in this area is primarily agricultural. Cropland or pastures border the LSCS site to the east, south, and west. The Illinois River lies to the north of the site, and the bluffs overlooking the Illinois River are mostly forested. The river’s south bank floodplain includes agricultural fields and woodlots, while the north bank is more developed and includes parts of the incorporated towns of Seneca and Marseilles. The majority of land cover (about 70 percent) within 10 km (6 mi) is used for crop cultivation. Deciduous forest accounts for about 12 percent of land cover, and the remaining 18 percent is composed of various land cover types, including open water, developed land, wetlands, and grasslands. Table 3–2 characterizes the land uses within a 10-km (6-mi) radius of LSCS.
Table 3–2. Land Use within a 10-km (6-mi) Radius of LSCS
Land Use Area
(in acres)(a) Percent Open Water 2,915 4.0 Developed, Open Space 3,124 4.3 Developed, Low Intensity 2,676 3.7 Developed, Medium Intensity 451 0.6 Developed, High Intensity 256 0.4 Barren Land 84 0.1 Deciduous Forest 8,479 11.7 Evergreen Forest 4 0.0 Shrub/Scrub 43 0.1 Grassland/Herbaceous 2,165 3.0 Pasture/Hay 966 1.3 Cultivated Crops 50,755 70.2 Woody Wetlands 425 0.6 Emergent Herbaceous Wetlands 8 0.0 Total 72,351 100.0 (a) To convert acres to hectares, divide by 2.4711.
Source: Exelon 2015i
The IDNR manages three areas for public use and recreation within 10 km (6 mi) of LSCS. The LaSalle Lake State Fish & Wildlife Area comprises the portion of the LSCS cooling pond that is managed by the IDNR and open to the public for fishing and other recreational purposes (Exelon 2014a). The Marseilles State Fish & Wildlife Area is approximately 2.4 km (1.5 mi) north of the LSCS site. The IDNR (2015e) manages this 1,032-ha (2,550-acre) tract of predominantly wooded land for wildlife habitat and hunting. Illini State Park lies approximately 10 km (6 mi) northwest of LSCS on the south bank of the Illinois River and encompasses 206 ha (510 ac) (Exelon 2014a).

Affected Environment
3-24
LaSalle County, in which LSCS is located, is a predominantly agricultural county; 85 percent of the county’s 1,135 square miles (m2) (294,000 ha or 726,400 ac) are in agricultural production (LaSalle County 2014). Much of the county’s agricultural lands were formerly prairie. LaSalle County’s major agricultural crops include corn, soybeans, and its major livestock commodities include cattle and calves, hogs and pigs, and sheep and lambs (LaSalle County 2014). The LaSalle County Comprehensive Plan (LaSalle County 2014) anticipates that the county will experience a slight (4 percent) increase in population over the next 15 years and reach an estimated 141,615 people by 2030. The county plans to manage its land resources in a manner that will preserve prime farmland and to encourage continued urban growth in areas where public infrastructure and services already exist so that farmland, open spaces, and natural and cultural resources are preserved.
3.2.2 Visual Resources
As described in the previous section, the LSCS site is located in a predominantly agricultural region. The site’s grade elevation is approximately 216 m (710 ft) above MSL, which is one of the highest points within a 3-km (5-mi) radius. The site’s generating facilities were built 60 m (200 ft) above the Illinois River floodplain elevation, which ranges from 152 to 155 m (500 to 510 ft) above mean sea level. The tallest structures on the LSCS site are the meteorological tower and the station vent stack, which are 122 m (400 ft) tall and 113 m (370 ft) tall, respectively. The vent stack is painted with thick white and red horizontal stripes. The largest and most visible buildings on the site are the reactor and turbine buildings, which are 56 m (185 ft) and 41 m (134 ft) tall, respectively (Exelon 2014a). To the west and the southwest, the Grand Ridge Energy Center wind farm is situated on slightly higher ground (221 to 227 m (725 to 750 ft) above MSL) on a north-south ridgeline. A second wind farm, Top Crop I, is sited south and east of the Grand Ridge Energy Center. Wind turbines at these facilities stand 118.5 m (389 ft) tall and have rotor blades that are 38.5 m (126.5 ft) long. These two facilities’ 134 wind turbines dominate the viewscape in the vicinity of LSCS. (Exelon 2014a) From most vantage points, the wind turbines are more noticeable than the LSCS buildings or facilities. A motorist travelling north on Highway 170 from Ranson, Illinois, to Seneca, Illinois, would see wind turbines to the west, south, and east until the motorist crested the bluffs of the Illinois River at an elevation of about 200 m (650 ft) above MSL. The motorist would then lose sight of the turbines at the highway bridge that crosses the Illinois River, at which point the road’s elevation descends to approximately 152 m (500 ft) (Exelon 2014a).
3.3 Meteorology, Air Quality, and Noise
3.3.1 Meteorology and Climatology
LSCS is located in LaSalle County in northeastern Illinois, approximately 75 mi (125 km) southwest of downtown Chicago and 35 mi (56 km) southwest of Joliet, Illinois (Exelon 2014a). The regional climate is continental with cold winters; warm summers; and frequent short fluctuations in temperature, humidity, cloudiness, and wind direction (NCDC 2004). During fall, winter, and spring, the polar jet stream is located near or over northeastern Illinois, which causes large-scale synoptic storms to move through the area bringing precipitation, winds, and often dramatic temperature changes (NCDC 2004). Temperature and precipitation conditions vary widely throughout Illinois and between years. A wide range of temperature extremes is common in this region (NCDC 2015a). Tornadoes, thunderstorms, hail, and heat and cold

Affected Environment
3-25
waves are common in the state, and flooding is the most damaging weather-related hazard in Illinois (NCDC 2004). The NRC staff obtained climatological data collected at the Peoria, Illinois, airport station (KPIA), which is located approximately 62 mi (100 km) from LSCS. Additionally, LSCS maintains a meteorological monitoring program that includes a 400-ft (122-m) meteorological tower located approximately 0.5 mi (0.8 km) southeast of the reactor buildings. The tower measures wind direction, wind speed, temperature, and precipitation. Data from these stations were used to characterize the region’s climate and are presented below. The prevailing wind direction, for the 1981 through 2010 timeframe, at the KPIA station was from the south-southwest (NCDC 2015a). The mean annual wind speed for the 1981 through 2010 timeframe is 8.4 miles per hour (mph) (13.5 kilometers per hour (kph)), and the mean monthly wind speed ranges from 6.0 mph (9.7 kph) in August to 10.2 mph (16.4 kph) in March. The annual predominant wind direction from the meteorological tower at LSCS for the 2010 through 2014 timeframe was from the south-southwest direction (for 2011 and 2012) and from the west-northwest direction (for 2010, 2013, and 2014) (Exelon 2015j). The mean annual wind speed at LSCS for the 2010 through 2014 timeframe is 10.4 mph (16.7 kph) (Exelon 2015j). The mean annual temperature for the 1985 through 2014 period of record at the KPIA station is 51.9 °F (11.1 °C), with a mean monthly temperature ranging from a low of 25.2 °F (-3.7 °C) in January to a high of 75.8 °F (24.3 °C) in July (NCDC 2015a). The hottest year over the period of record was in 2012, and coolest was in 1996. The mean annual temperature for the 2010 through 2014 timeframe at LSCS is 50.7 °F (10.3 °C), with a mean monthly temperature ranging from a low of 22.5 °F (-5.3 °C) in January to a high of 75.4 °F (24.1 °C) in July (Exelon 2015j). The mean total annual liquid precipitation for the 1985 through 2014 period of record measured at the KPIA station is 35.9 in. (91.2 cm). The wettest year for the period of record is 55.35 in. (140.6 cm) in 1990 (NCDC 2015a); the driest year from the same period is 22.16 in. (56.2 cm) in 1988 (NCDC 2015a). Monthly precipitation amounts tend to be evenly distributed throughout the year and range from an average of 1.9 in. (4.8 cm) in January to 4.3 in. (10.9 cm) in May (NCDC 2015a). The mean total annual precipitation measurements taken at LSCS’s meteorological tower for the 2010 through 2014 timeframe is 29.83 in. (75.8 cm). Average monthly precipitation ranges from a low of 0.93 in. (2.4 cm) in January to a high of 5.89 in. (14.9 cm) in June (Exelon 2015j). LaSalle County, where LSCS is located, experiences severe weather events, such as tornadoes, floods, and hail. For the 1950 through 2014 period of record, the following events have been recorded (NCDC 2015b):
• 40 tornado events,
• 26 flash floods events,
• 131 hail events, and
• 4 blizzard events.
3.3.2 Air Quality
Under the Clean Air Act of 1970, as amended (CAA) (42 U.S.C. 7410 et seq.), EPA has set primary and secondary National Ambient Air Quality Standards (NAAQS) (40 CFR Part 50) for six common criteria pollutants to protect sensitive populations and the environment. Primary standards specify maximum ambient concentration levels of the criteria pollutants aimed at

Affected Environment
3-26
providing public health protection, including protecting the health of sensitive populations, such as asthmatics, children, and the elderly. Secondary standards specify maximum ambient concentration levels of the criteria pollutants aimed at providing public welfare protection, including protection against decreased visibility and damage to animals, crops, vegetation, and buildings. The NAAQS criteria pollutants include carbon monoxide (CO), lead (Pb), nitrogen dioxide (NO2), ozone (O3), sulfur dioxide (SO2), and particulate matter (PM). Particulate matter is further categorized by size—PM10 (aerodynamic diameter of 10 micrometers (µm) or less) and PM2.5 (aerodynamic diameter of 2.5 µm or less). Table 3–3, identifies the NAAQS for the six common criteria pollutants.
Table 3–3. National Ambient Air Quality Standards
Pollutant Primary/Secondary Standard Averaging Time Level
Carbon Monoxide (CO) Primary 8 hour 9 ppm 1 hour 35 ppm
Lead (Pb) Primary and Secondary Rolling 3-month average 0.15 µg/m3 Nitrogen Dioxide (NO2) Primary 1 hour 100 ppb
Primary and Secondary Annual 53 ppb
Ozone (O3) Primary and Secondary 8 hour 0.075 ppm Particulate matter less than 2.5 µm (PM2.5)
Primary Annual 12 µg/m3
Secondary Annual 15 µg/m3
Primary and Secondary 24 hour 35 µg/m3
Particulate matter less than 10 µm (PM10)
Primary and Secondary 2 hour 150 µg/m3
Sulfur Dioxide (SO2) Primary 1 hour 75 ppb
Secondary 3 hour 0.5 ppm
Key: ppb = parts per billion, ppm = parts per million, µg/m3 = micrograms per cubic meter, and µm = micrometers.
Source: EPA 2015d
EPA designates areas of “attainment” and “nonattainment” with respect to the NAAQS. Areas that have insufficient data to determine designation status are denoted as “unclassifiable.” Areas that were once in nonattainment, but are now in attainment, are called “maintenance” areas; these areas are under a 10-year monitoring plan to maintain the attainment designation status. States have primary responsibility for ensuring attainment and maintenance of the NAAQS. Under Section 110 of the CAA and related provisions, states are to submit, for EPA approval, State Implementation Plans that provide for the timely attainment and maintenance of the NAAQS. Air quality designations are generally made at the county level. For the purpose of planning and maintaining ambient air quality with respect to the NAAQS, EPA has developed air quality control regions (AQCRs), which are intrastate or interstate areas that share a common airshed (40 CFR Part 81). LSCS is located in LaSalle County, Illinois. This County, along with an additional five neighboring Counties (Bureau, Lee, Marshall, Putnam, and Stark Counties) in

Affected Environment
3-27
Illinois compose the North Central Illinois Intrastate AQCR (40 CFR 81.262). With regard to the NAAQS criteria pollutants, LaSalle County is designated as an attainment area for all NAAQS (40 CFR 81.314). The nearest designated nonattainment area is Grundy County, for the 8-hour ozone 2008 standard. The nearest designated maintenance area is Grundy County for the PM2.5 1997 standard. Grundy County is adjacent to LaSalle County, approximately 4 mi (6 km) from LSCS. Although Grundy County is adjacent to LaSalle County, it is not part of the same AQCR that LaSalle County belongs to. Illinois air pollution control rules are issued under Title 35 of the IAC. Air emission sources at LSCS are regulated under a Federally Enforceable State Operating Permit (FESOP) (Permit No. 099802AAA, issued January 7, 2016) by the IEPA (IEPA 2016). A source is eligible for a FESOP (also known as “synthetic minor” air permit) if the potential to emit from the source triggers CAA permit program requirements but if maximum actual emissions are below, or can be restricted to remain below, major source thresholds. LSCS’s FESOP permit will expire in August 2025, and in accordance with the Illinois Environmental Protection Act of 1970 (415 Illinois Compiled Statute (ILCS) 5/39), LSCS will need to submit an application for the renewal of the permit. Permitted sources at LSCS include 5 large diesel-fired generators (3,489 horsepower) and 18 small diesel-fired emergency electric generators and pumps (less than 1,500 horsepower). The LSCS FESOP permit limits nitrogen oxides, carbon monoxide, particulate matter, volatile organic compounds, and/or the sulfur dioxide emissions as well as the fuel consumption from permitted sources. LSCS has been in compliance with the requirements established in its FESOP permit, and there have been no reported violations in the past 5 years (Exelon 2015k; EPA 2015b). Emissions from permitted sources at LSCS are presented in Table 3–4. Permitted sources are intended to be used during emergency circumstances and only operated during routine surveillance and testing (Exelon 2015j). LSCS permitted annual emissions are less than 1 percent of the total 2011 emissions for LaSalle County. Air emissions for LaSalle County in 2011 for carbon monoxide, nitrogen oxides, sulfur dioxide, particulate matter less than 10 µm, and particulate matter less than 2.5 µm were 1,213 tons, 2,308 tons, 611 tons, 832 tons, and 483 tons, respectively (EPA 2011). LSCS permitted annual emissions are less than 1 percent of the total 2011 emissions for LaSalle County.
Table 3–4. LSCS Air Emissions (MT/year)(a)
Pollutant 2008 2009 2010 2011 2012 2013 CO 1.10 1.76 1.65 1.52 2.01 1.6 SO2 0.0042 0.0017 0.0021 0.0017 0.0021 0.001 NOx 4.18 6.62 6.21 5.73 7.58 6.0 PM10 0.075 0.12 0.11 0.10 0.14 0.11 PM2.5 0.075 0.12 0.11 0.10 0.14 0.11 VOC 0.25 0.33 0.32 0.30 0.35 0.30 CO2 -(b) -(b) 315.79 295.46 390.91 308.3
Key: CO = carbon monoxide, NOx = nitrogen oxides, SO2 = sulfur dioxide, PM10 = particulate matter less than 10 micrometers, PM2.5 = particulate matter less than 2.5 micrometers, and VOC = volatile organic compounds.
(a) To convert metric tons (MT) per year to tons per year, multiply by 1.1023. (b) Carbon dioxide emissions reporting commenced in 2010; therefore, prior year emissions are not available.
Sources: Exelon 2014a, 2015k

Affected Environment
3-28
On October 30, 2009, EPA published a rule for the mandatory reporting of greenhouse gases (GHGs) from sources that in general emit 25,000 MT or more of carbon dioxide equivalent (CO2e) per year in the United States (74 FR 56260). Most small facilities across all sectors of the economy fall below the 25,000-MT threshold and are not required to report GHG emissions to EPA. On June 3, 2010, EPA issued the Prevention of Significant Deterioration (PSD) and Title V GHG Tailoring Rule (75 FR 31514). Beginning January 2, 2011, operating permits issued to major sources of GHGs under the PSD or Title V Federal permit programs must contain provisions requiring the use of best available control technology to limit the emissions of GHGs if those sources would be subject to PSD or Title V permitting requirements because of their non-GHG pollutant emission potentials and because their estimated GHG emissions are at least 75,000 tons per year of CO2e. As discussed above, LSCS is a synthetic minor source, and, as shown in Table 3–4, GHG emissions from sources at LSCS are below the GHG Mandatory Reporting (40 CFR Part 98) and Tailoring Rule thresholds. Section 4.15 of this SEIS further discusses GHG emissions. EPA issued the Regional Haze Rule to improve and protect visibility in national parks and wilderness areas from haze, which is caused by numerous, diverse sources located across a broad region (40 CFR 51.308-309). Specifically, Subpart D of 40 CFR Part 81 lists mandatory Class I Federal Areas where visibility is an important value. The Regional Haze Rule requires states to develop State Implementation Plans to reduce visibility impairment at Class I Federal areas. The nearest Class I Federal area for visibility protection is the Mingo National Wildlife Refuge, which is in Missouri approximately 306 mi (492 km) southwest of the LSCS site. EPA recommends that emission sources located within 62 mi (100 km) of a Class I area be modeled to consider adverse impacts (EPA 1992). Considering the distance to the nearest Class I area and the minor nature of air emissions from the site, there is little likelihood that ongoing activities at LSCS adversely affect air quality and air quality-related values (e.g., visibility or acid deposition) in any of the Class I areas.
3.3.3 Noise
Noise is unwanted sound and can be generated by many sources. Sound intensity is measured in logarithmic units called decibels (dB). A dB is the ratio of the measured sound pressure level to a reference level equal to a normal person’s threshold of hearing. Most people barely notice a difference of 3 dB or less (FHA 2011). Another characteristic of sound is frequency or pitch. Noise may be composed of many frequencies, but the human ear does not hear very low or very high frequencies. To represent noise as closely as possible to the noise levels people experience, sounds are measured using a frequency weighting scheme known as the A scale. Sound levels measured on this A scale are given in units of A-weighted decibels (dBA). Table 3–5 presents common noise sources and their respective noise levels. Noise levels can become annoying at 80 dBA and very annoying at 90 dBA. To the human ear, each increase of 10 dBA sounds twice as loud (EPA 1981).
Table 3–5. Common Noise Sources and Noise Levels
Noise Source Noise Level (dBA) Human hearing threshold 0 Soft whisper 30 Quiet residential area 40 Dishwasher 55–70 Lawn mower 65–95
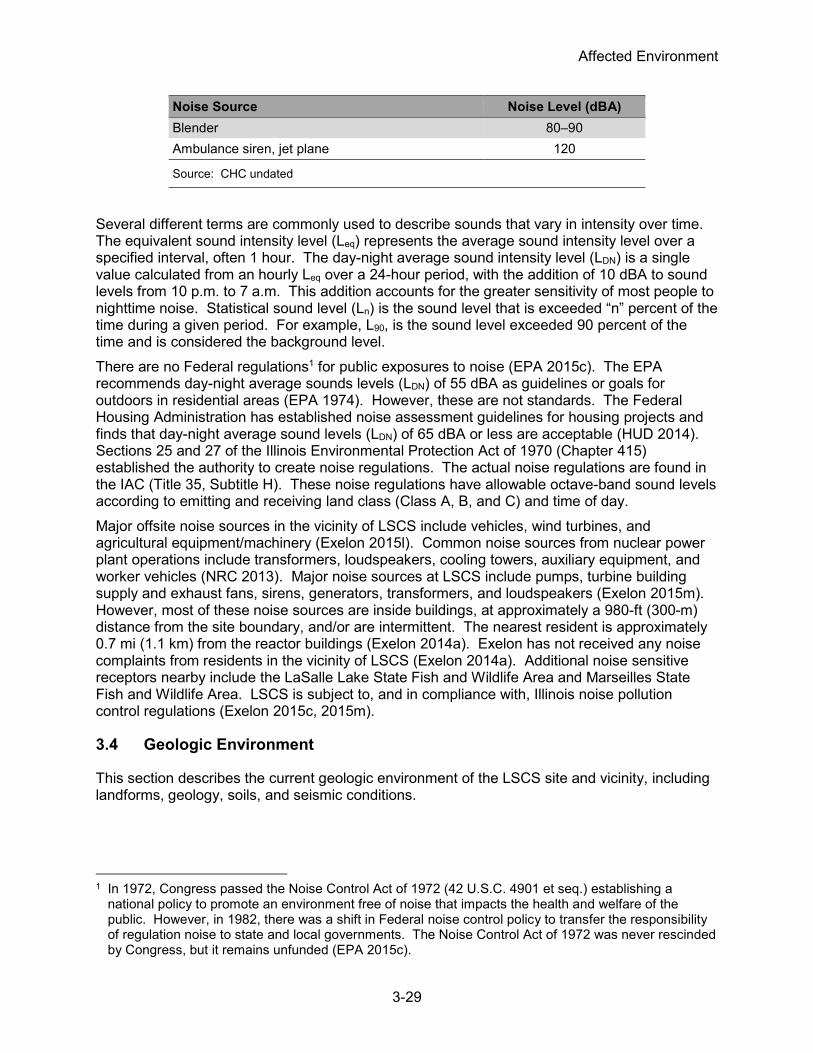
Affected Environment
3-29
Noise Source Noise Level (dBA) Blender 80–90 Ambulance siren, jet plane 120
Source: CHC undated
Several different terms are commonly used to describe sounds that vary in intensity over time. The equivalent sound intensity level (Leq) represents the average sound intensity level over a specified interval, often 1 hour. The day-night average sound intensity level (LDN) is a single value calculated from an hourly Leq over a 24-hour period, with the addition of 10 dBA to sound levels from 10 p.m. to 7 a.m. This addition accounts for the greater sensitivity of most people to nighttime noise. Statistical sound level (Ln) is the sound level that is exceeded “n” percent of the time during a given period. For example, L90, is the sound level exceeded 90 percent of the time and is considered the background level. There are no Federal regulations1 for public exposures to noise (EPA 2015c). The EPA recommends day-night average sounds levels (LDN) of 55 dBA as guidelines or goals for outdoors in residential areas (EPA 1974). However, these are not standards. The Federal Housing Administration has established noise assessment guidelines for housing projects and finds that day-night average sound levels (LDN) of 65 dBA or less are acceptable (HUD 2014). Sections 25 and 27 of the Illinois Environmental Protection Act of 1970 (Chapter 415) established the authority to create noise regulations. The actual noise regulations are found in the IAC (Title 35, Subtitle H). These noise regulations have allowable octave-band sound levels according to emitting and receiving land class (Class A, B, and C) and time of day. Major offsite noise sources in the vicinity of LSCS include vehicles, wind turbines, and agricultural equipment/machinery (Exelon 2015l). Common noise sources from nuclear power plant operations include transformers, loudspeakers, cooling towers, auxiliary equipment, and worker vehicles (NRC 2013). Major noise sources at LSCS include pumps, turbine building supply and exhaust fans, sirens, generators, transformers, and loudspeakers (Exelon 2015m). However, most of these noise sources are inside buildings, at approximately a 980-ft (300-m) distance from the site boundary, and/or are intermittent. The nearest resident is approximately 0.7 mi (1.1 km) from the reactor buildings (Exelon 2014a). Exelon has not received any noise complaints from residents in the vicinity of LSCS (Exelon 2014a). Additional noise sensitive receptors nearby include the LaSalle Lake State Fish and Wildlife Area and Marseilles State Fish and Wildlife Area. LSCS is subject to, and in compliance with, Illinois noise pollution control regulations (Exelon 2015c, 2015m).
3.4 Geologic Environment
This section describes the current geologic environment of the LSCS site and vicinity, including landforms, geology, soils, and seismic conditions.
1 In 1972, Congress passed the Noise Control Act of 1972 (42 U.S.C. 4901 et seq.) establishing a
national policy to promote an environment free of noise that impacts the health and welfare of the public. However, in 1982, there was a shift in Federal noise control policy to transfer the responsibility of regulation noise to state and local governments. The Noise Control Act of 1972 was never rescinded by Congress, but it remains unfunded (EPA 2015c).

Affected Environment
3-30
3.4.1 Physiography and Geology
The site is located in an area that contains glacially deposited sediments overlying a bedrock surface. These deposits formed during successive periods of glaciation. The power block and the cooling pond are located on a glacial moraine (a depositional landform directly deposited by a glacier). This area has a flat gently rolling topography. The river screen house is located north of both the power block and cooling pond on the flat-lying river valley of the Illinois River. The river valley is approximately 3.5 mi (5.6 km) north of the site and is topographically separated from the glacial moraine by the bluffs along the Illinois River. The bluffs along the Illinois River are dissected by stream valleys that cut into the glacial sediments and drain north to the Illinois River. The maximum topographic relief between the site and the river is approximately 255 ft (78 m) (Exelon 2014a; USDA 2008) (Figure 3–7). In the area of the power block and the cooling pond, the land is covered by a 4- to 8-ft (1.2- to 2.4-m) layer of Richland Loess. The loess consists of windblown silt that has been weathered to slightly clayey silt. The Richland Loess is underlain by the Wedron Silty-Clay Till. The till was directly deposited by glacial activity. It consists of unsorted silt and clay sedimentary deposits. In localized areas, the till also contains scattered, disconnected bodies of sand and gravel. In the area of the plant buildings and cooling pond, the Wedron Silty-Clay Till ranges in thickness from 120 to 140 ft (37 to 43 m). Moving north from the plant buildings and the cooling pond to the river, the Wedron Silty-Clay Till decreases in thickness until it disappears near the Illinois River (Figure 3–8) (Exelon 2014a). Below the LSCS site, the Wedron Silty-Clay Till is underlain by bedrock. The topography of the bedrock reflects the surface of the land before glaciation. This topography is now buried by glacially deposited sediments. The site is located between two bedrock valleys that are filled with the Wedron Silty-Clay Till and some alluvial sand and gravel deposits from ancient streams that flowed through the bedrock valleys before they were completely buried. One alluvium-filled buried valley runs east-west and is located between the plant facility and the Illinois River Bluff, and one valley is located south of the plant facility and trends northwest and southeast (Exelon 2014a, 2014b) (Figure 3–9). The underlying bedrock consists of 4,500 ft (1,371 m) of dolomite, sandstone, and shale rock. In turn, these rocks are underlain by granites and metamorphic rocks to a great depth. The Pennsylvanian aged Carbondale Formation forms the top of the bedrock surface over most of the site area. It is composed of alternating strata of shale, sandstone, clay, coal, limestone, and siltstone (Exelon 2014a). LaSalle County contains a number of geologic resources of economic importance. The County is one of a handful of locations that can easily access the St. Peter Sandstone Formation. The unique characteristics of this sandstone make it valuable for a number of commercial uses, including glass, sand filters, sand molding, and abrasives. It is also in high demand for the extraction of oil and gas using conventional horizontal drilling and shale fracking techniques. LaSalle County also contains commercial deposits of gravel and limestone. Limestone and gravel are used in concrete, agricultural limestone, and road surfaces. Clay is mined in the county to manufacture bricks, drain tile, and dinnerware. Coal is no longer mined in the County but historically was mined in bluffs along the Illinois River and around Streator, Illinois (Ataner and Butler 2013; LaSalle County 2014; USDA 2008). The LSCS site is underlain by coal seams, limestone beds, and the St. Peter Sandstone. However, they lie too deep beneath the land surface to be economically accessed. No oil and gas deposits have been identified beneath the site.

Affected Environment
3-31
3.4.2 Soils
Eighty-five percent of the soil in LaSalle County is designated as prime farmland, and 9 percent is farmland of State importance (Exelon 2014a). Within the site boundary, almost all the soil is either silty loam or silty clay loam and is designated as prime farmland or farmland of State importance (Exelon 2014a; USDA 2008, 2015b). Following initial construction of the facility, areas surrounding LSCS were graded to control runoff and to minimize erosion. Many areas were revegetated to support this effort (Exelon 2014a).

Affected Environment
3-32
Figure 3–7. Site Physiography, LSCS Vicinity
Source: NRC Generated

Affected Environment
3-33
Figure 3–8. North-South Geologic Cross Section, LSCS Vicinity (Elevation Exaggerated)
Source: Modified from Exelon 2014a

Affected Environment
3-34
Figure 3–9. Bedrock Topography and Buried Valleys, LSCS Vicinity
Source: Modified from Exelon 2014b

Affected Environment
3-35
3.4.3 Seismic Setting
The site is located in an area of Illinois that might experience slight damage from earthquakes (FEMA 2015; Mid-America Earthquake Center 2009). A number of earthquakes (USGS 2013a, 2013b, 2013c) have originated within Illinois, including the following:
• On May 26, 1909, a large earthquake knocked over many chimneys in Aurora and swayed buildings in Chicago.
• On July 18, 1909, an earthquake knocked down chimneys in Petersburg.
• On August 14, 1965, a sharp local earthquake knocked down chimneys in Elco, Unity, Olive Branch, and Olmstead.
• On November 9, 1968, a magnitude 5.3 earthquake was felt over the entire State of Illinois and in 22 other states.
Dozens of earthquakes originating outside Illinois have been felt inside the State without causing damage. These earthquakes originated in Missouri, Arkansas, Kansas, Nebraska, Tennessee, Indiana, Ohio, Michigan, Kentucky, and Canada. Illinois can be affected by two major seismic zones, the Wabash Valley Seismic Zone and the New Madrid Seismic Zone. The Wabash Valley Zone lies between southeastern Illinois and southwestern Indiana about 322 mi (518 km) from the site. The New Madrid Seismic Zone is about 300 mi (483 km) from the site in southern Illinois, Missouri, Kentucky, and Tennessee. Of these two seismic zones, the New Madrid Seismic Zone is capable of producing very powerful earthquakes. If a large magnitude earthquake occurs in the New Madrid Seismic Zone, major damage could be experienced in southern Illinois (Missouri Department of Natural Resources 2013; USGS 2009). The NRC requires every nuclear power plant to be designed for site-specific ground motions that are appropriate for its location. Nuclear power plants, including LSCS, Units 1 and 2, are designed and built to withstand site-specific ground motion based on their location and nearby earthquake activity. For LSCS, this includes earthquakes originating in either the Wabash Valley Zone or the New Madrid Seismic Zone (Exelon 2014a). The seismic design basis is established during the initial siting process using site-specific seismic hazard assessments. For each nuclear power plant site, applicants estimate a design-basis ground motion based on earthquake sources, wave propagations, and site responses; this estimate is then accounted for in the design of the plant. In this way, nuclear power plants are designed to withstand the maximum credible earthquake for a given site. Because methods of assessing seismic hazards evolve over time and the scientific understanding of earthquake hazards improve (NRC 2014b), the NRC’s understanding of the seismic hazard for a given nuclear power plant may change over time. As new seismic information becomes available, the NRC evaluates the new information to determine whether changes are needed at existing plants or to NRC regulations. The NRC’s evaluation of the impact of seismic activity on a nuclear power plant is an ongoing process that is separate from the license renewal process. On December 23, 2011, the Consolidated Appropriations Act (Public Law 112–074) was signed into law. Section 402 of the law directs the NRC to require reactor licensees to re-evaluate the seismic hazard at their sites against current applicable Commission requirements and thereafter, when appropriate, as determined by the Commission (NRC 2012). In 2012, the NRC required all licensees to re-evaluate the seismic hazards at their sites using updated seismic information and present-day regulatory guidance and methodologies (NRC 2012). The purpose of that request was to gather information to update the seismic hazards analysis to enable the NRC staff to determine whether individual site licenses should be modified, suspended, or revoked (NRC 2014a). On March 31, 2014, Exelon responded to this request and provided its

Affected Environment
3-36
Seismic Hazard and Screening Report (SHSR) for LSCS (Exelon 2014d). On April 21, 2015, the NRC staff issued an assessment (NRC 2015a) documenting its review of the Seismic Hazard and Screening Report. The NRC staff concluded that Exelon met the intent of the guidance for determining the re-evaluated seismic hazard and that it had provided an acceptable response to the request. In addition, the NRC staff directed Exelon to perform further seismic evaluations for NRC review.
3.5 Water Resources
3.5.1 Surface Water Resources
This section describes the current surface water resources within and near LSCS. NUREG-1437, Generic Environmental Impact Statement for License Renewal of Nuclear Plants (GEIS) (NRC 2013), states that surface water encompasses all water bodies that occur above the ground surface, including rivers, streams, lakes, ponds, and man-made reservoirs or impoundments. 3.5.1.1 Surface Water Hydrology
The major surface water body in the region is the Illinois River, located approximately 4 mi (6.4 km) to the north of the LSCS main plant complex (see Figure 3–2). The LSCS site is situated within the lowermost portion of the Upper Illinois River Basin, which includes the 10,949-mi2 (28,369-square-kilometer (km2)) drainage area upstream from Ottawa, Illinois (Figure 3–10). The Illinois River is formed from the confluence of the Kankakee and Des Plaines Rivers at a point approximately 10 mi (16 km) east of Morris, Illinois. The main stem of the Illinois River is joined by the Fox River at Ottawa (Arnold et al. 1999; USGS 1998). The Illinois River is also central to the Illinois Waterway, which provides for navigation from Lake Michigan to the Mississippi River and on to the Gulf of Mexico. The origins of this waterway began with the construction of canals from the lake to the Chicago and Illinois Rivers, beginning in the 1830s. Construction of the formal Illinois Waterway began in 1919 with the State of Illinois leading efforts in the upper part of the river basin and the U.S. Army Corps of Engineers (USACE) in the lower part. Today, the Illinois Waterway includes part of the Chicago River, the Chicago Sanitary and Ship Canal, the Des Plaines River, and the Illinois River. Navigation is made possible by a series of eight major locks and dams and associated navigation pools along the Illinois River and its tributaries. Each pool is named for the dam downstream of each pool (Exelon 2014a; Talkington 1991). Along its length, the waterway contains a navigation channel at least 9 ft (2.7 m) deep and 300 ft (91 m) wide (Talkington 1991). In the vicinity of LSCS, at normal pool elevation, the river has a depth of 12 ft (3.7 m) and a width of 800 ft (244 m) (Exelon 2014a). LSCS is located along the Marseilles Pool portion of the Illinois River. The Marseilles Dam at Illinois RM 247 (RKm 397.5) is approximately 2.4 mi (3.9 km) downstream of the LSCS intake and discharge structures near RM 249.5 (RKm 401.5) (see Section 3.1.3). However, the lock itself is located a further 2.5 mi (4.0 km) downstream of the dam on a bypass canal (Marseilles Canal) (USACE 2014). The Dresden Island Lock and Dam is 22 mi (35 km) upstream of the LSCS intake structure at RM 271.5 (RKm 437) (Exelon 2014a). The Marseilles Dam is 24 ft (7.3 m) high, and the Dresden Dam is 22 ft (6.7 m) high (Talkington 1991). In total, the main stem of the Illinois River flows for approximately 270 mi (439 km) through Illinois and ultimately discharges into the Mississippi River at Grafton, Illinois (Exelon 2014a; USGS 1994; Talkington 1991). However, when accounting for the other components of the Illinois Waterway, the total length of the river system is 327 mi (526 km) (Talkington 1991).
Affected Environment
3-37
The U.S. Geological Survey (USGS) maintains a gaging station on the Illinois River at Marseilles, Illinois (Station 05543500) and RM 246.5 (RKm 396.7). This station is approximately 3 mi (4.8 km) downstream from the LSCS river screen house intake and nearby discharge structure near RM 249.4 (RKm 401). The gaging station is also 0.5 mi (0.8 km) downstream of the Marseilles Dam and 6.9 mi (11 km) upstream from the confluence of the Fox River with the main stem of the Illinois River (Exelon 2014a; USGS 1999b, USGS 2015). The mean annual discharge measured at the USGS gage at Marseilles for water years 1920 through 2014 is 10,750 cfs (304 m3/s). For water year 2014, the mean discharge was 11,190 cfs (316 m3/s). The mean 90-percent exceedance flow is 4,340 cfs (123 m3/s) for the period of record (USGS 2015). The 90 percent exceedance flow is an indicator value of hydrologic drought. It signifies a rate of streamflow that is equaled or exceeded 90 percent of the time, as compared to the average flow for the period of record. Based on average monthly flow over the period of record at the station, November is the low-flow month, and April is the high-flow month for the Marseilles Pool (USGS 2015). Tributaries to the Illinois River in the immediate vicinity of LSCS include South Kickapoo Creek, Spring Brook, Deadly Run, Armstrong Run, and Hog Run (Figure 3–11). These headwater streams and manmade ditches drain the glacial upland on which LSCS is located and generally flow north toward the dissected bluffs of the river and across the river valley and into the Illinois River. The most extensive of these nearby tributaries is South Kickapoo Creek. With its headwaters on the northwest side of the LSCS property, this stream receives stormwater runoff, cooling pond dike seepage collected by the LSCS perimeter drainage ditch, and overflow from the cooling pond auxiliary spillway (see Figure 3–6). The main channel of South Kickapoo Creek flows north to northwest from LSCS, with the main channel discharging to the Illinois River at a point approximately 3.5 mi (5.6 km) northwest of the LSCS cooling pond and approximately 0.4 mi (0.6 km) downstream of the LSCS blowdown discharge structure (Exelon 2014a). On the northeast perimeter of the cooling pond is Armstrong Run. Armstrong Run previously drained much of the area that is now occupied by LSCS before plant construction. Like many of the manmade drainage channels (called “runs”) in the region, it was constructed to convey drainage collected by agricultural drain tile systems (NRC 1978). Armstrong Run now receives runoff and seepage collected from the northeast end of the peripheral dike drainage ditch. It discharges to the Illinois River at a point approximately 3.2 mi (5.1 km) northeast of the cooling pond and about 4.5 RM (7.2 RKm) upstream of the river screen house (Exelon 2014a). As further described in Section 3.1.3, the dominant surface water feature within the LSCS site and vicinity is the 2,058- ac (833- ha) cooling pond (Figure 3–5 and 3–11). Other surface water features on the LSCS plant site include two stormwater management ponds (North and South Storm Water Ponds), two sewage treatment lagoons, and a collection of hatchery ponds as summarized below. The NRC staff visited the facilities cited herein during the May 2015 environmental site audit (NRC 2015b). The North and South Storm Water Ponds are located west of the LSCS main plant complex and receive stormwater runoff from the protected area, serving the north and south zones of the plant, respectively. Within the site, a system of ditches, storm drains, culverts, and underground storm sewers collect runoff and drainage from the protected area and convey much of it to either of the two ponds. Uncontaminated runoff from the north zone of the plant is conveyed to the North Storm Water Pond, with some runoff sources first passing through the Unit 2 oil-water separator. A portion of the switchyard also drains toward the north zone, although most of the switchyard drains east to the cooling pond.
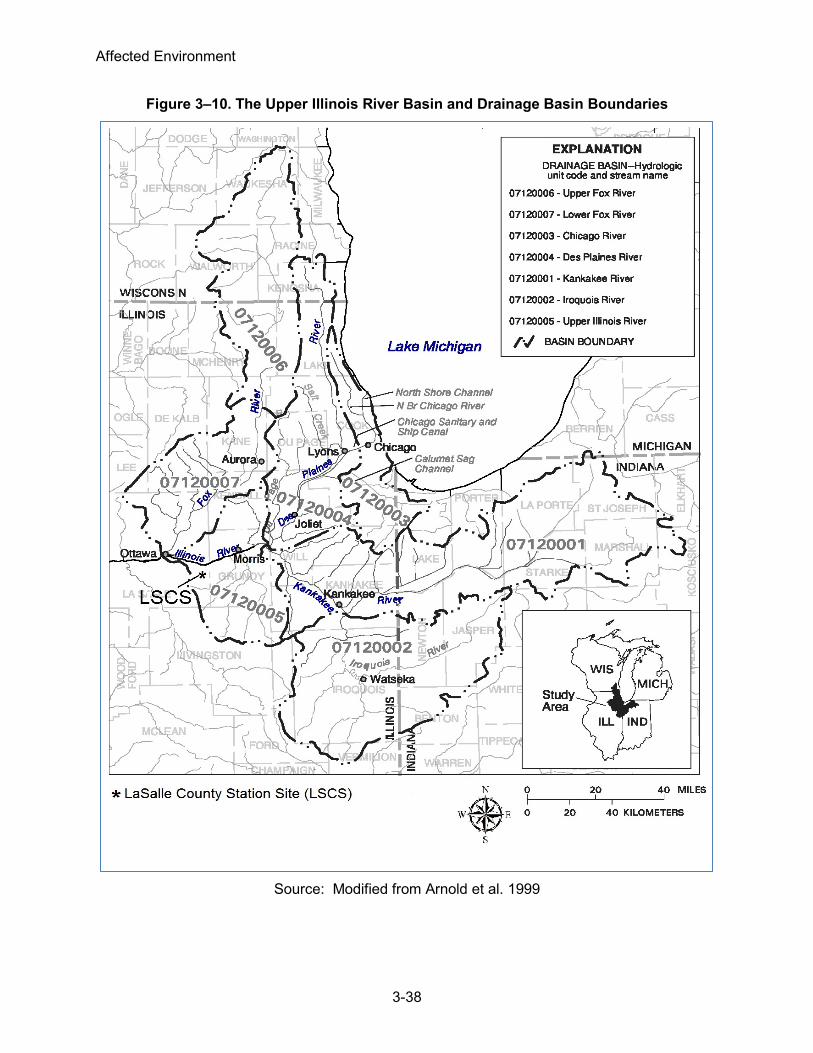
Affected Environment
3-38
Figure 3–10. The Upper Illinois River Basin and Drainage Basin Boundaries
Source: Modified from Arnold et al. 1999

Affected Environment
3-39
Figure 3–11. LSCS Surface Water and Related Water Resource Features
Source: Modified from Exelon 2014a, 2015p
Affected Environment
3-40
Most runoff from the south zone enters the smaller South Storm Water Pond; this pond then discharges to the cooling pond discharge canal through internal Outfall H01. Before entering the pond, some flows first pass through the Unit 1 oil-water separator. The south pond also receives runoff from the firing range. Areas of the plant site to the northwest and south of the developed plant complex do not drain to the ponds but instead are drained by existing surface stream segments and ditches (Exelon 2014a, 2014f). Stormwater management and pollution control at LSCS is subject to Exelon’s Storm Water Pollution Prevention Plan (SWPPP) (Exelon 2013e), which Exelon has implemented in accordance with Special Condition 8 of the site’s NPDES permit (IEPA 2013). The SWPPP applies to industrial stormwater runoff from the site, which is not otherwise process-related and not captured and processed by LSCS’s wastewater treatment facilities. It describes the best management practices, controls, inspection, and monitoring requirements, and the associated implementing procedures and personnel responsibilities for reducing pollutants in stormwater discharge and for ensuring compliance with the terms and conditions of the site NPDES permit (Exelon 2013e). Two open sewage treatment lagoons provide primary and secondary treatment for LSCS’s sanitary effluent. These lagoons are clay and geotextile-lined impoundments and are located to the north of the main plant complex adjacent to LSCS’s sewage treatment plant (as shown in Figure 3–3). Together, the NRC staff estimates the two impoundments cover an area of about 1.6 ac (0.65 ha). After filtration and final disinfection in the sewage treatment plant, the final effluent from the treatment system is discharged into the cooling pond via NPDES internal Outfall B01 (Exelon 2014a, 2014f). A cluster of 16 small fish-rearing ponds is located on the southwest shore of the cooling pond (see Figures 3–6 and 3–11). The NRC staff estimates that the ponds total approximately 29 ac (12 ha) of open water. These ponds comprise the LaSalle Fish Hatchery operated by the IDNR on plant property and subject to a lease agreement with Exelon. The hatchery uses the cooling pond as a makeup water source. Runoff and drainage from the hatchery ponds flow back to the cooling pond and are ultimately subject to LSCS’s NPDES permit provisions (Exelon 2014a, 2014f). The LSCS site’s NPDES permit is further discussed in Section 3.5.1.3. LSCS is not susceptible to riverine flooding because it is located upland and away from the Illinois River. The grade elevation at the plant site is 710 ft (216 m) above MSL, and the floor elevation of the LSCS facilities is 710.5 ft (217 m) above MSL. The plant floor lies at an elevation that is 188 ft (57 m) above the level of a postulated probable maximum flood on the Illinois River (Exelon 2014a, 2014g). Although the river screen house is not a safety-related structure, it is designed to withstand the 100-year flood on the Illinois River. Its loss would not impact the ability to safely shut down the plant as water could still be drawn from the cooling pond and from the UHS portion of the cooling pond, as described in Section 3.1.3 of the SEIS (Exelon 2014a, 2014b). Furthermore, a failure of the peripheral dike system enclosing the cooling pond would not flood the power plant area because the onsite topography would cause cooling pond water to flow north and away from the plant following the existing drainage network (Exelon 2014a, 2014b). 3.5.1.2 Surface Water Use
LSCS withdraws surface water from the Illinois River as makeup water for the plant’s cooling pond. The cooling pond provides water for the plant’s circulating water, service water, and essential cooling water systems. Cooling pond blowdown and other permitted effluent streams are discharged back to the Illinois River via the plant’s primary NPDES outfall (Outfall 001) at a

Affected Environment
3-41
point located about 900 ft (270 m) downstream from LSCS’s river intake structure and associated river screen house. The maximum (nominal) surface water withdrawal rate for LSCS, Units 1 and 2, is 90,000 gpm (200 cfs or 5.66 m3/s). This is equivalent to 129.6 mgd (491,000 m3/day). However, Exelon reports in its ER that LSCS’s normal peak makeup withdrawal rate from the Illinois River is 60,000 gpm (134 cfs or 3.77 m3/s) or 86.4 mgd (327,000 m3/day). This rate assumes a two-pump operation with valves open at 100 percent. The third makeup pump located in the river screen house normally serves as a backup (see Section 3.1.3). The NRC staff reviewed submittals by Exelon to the Illinois State Water Survey that document the volume of surface water withdrawn from, and discharged back to, the Illinois River during the period 2009 to 2013 (Table 3–6). Based on these data, LSCS surface water withdrawals have averaged 24,745 million gallons per year (mgy) (93.7 million cubic meters per year (m3/yr)). This is equivalent to an average withdrawal rate of approximately 105 cfs (2.96 m3/s or 67.8 mgd). Return discharges (blowdown) to the Illinois River have averaged 13,046 mgy (49.4 million m3/yr), which is equivalent to an average discharge rate of about 55.3 cfs (1.56 m3/s or 35.7 mgd). The difference between withdraw and discharge (i.e., approximately 49.7 cfs (1.40 m3/s)) generally reflects process consumptive use or other losses, evaporative losses, and presumably seepage from the cooling pond. In total, these data indicate a consumptive use rate averaging 47 percent.
Table 3–6. Annual Surface Water Withdrawals and Returns to the Illinois River, LSCS
Year Withdrawals
(mgy) mgd cfs Discharges
(mgy) mgd cfs 2009 28,598.4 78.5 121 19,405.0 53.2 82.2 2010 25,876.8 70.9 110 13,686.0 37.5 58.0 2011 23,328.0 63.9 98.9 11,961.1 32.8 50.7 2012 28,857.6 79.1 122 14,005.7 38.4 59.4 2013 17,064.0 46.7 72.3 6,173.0 16.9 26.2
Average 24,745.0 67.8 105 13,046.1 35.7 55.3
Note: Reported and calculated values are rounded. To convert million gallons per year (mgy) to million cubic meters (m3), divide by 264.2. To convert, million gallons per day (mgd) to cubic feet per second (cfs), multiply by 1.547.
Sources: Exelon 2011a, 2012a, 2013a, 2014a, 2014e
LSCS’s surface water withdrawals and consumptive water use are not subject to any water allocation or related permitting requirements at the present time. In 2006, the Governor of Illinois issued an executive order establishing a Statewide program for State and regional water supply planning and management, which included the development and approval of regional plans in designated Priority Water Quantity Planning Areas (State of Illinois 2006). LaSalle County, where LSCS is located, is not included within any of the three designated planning areas (Exelon 2014a; ISWS 2015a). Nevertheless, as referenced above, Exelon reports its surface water withdrawals to the State of Illinois under the State Illinois Water Inventory Program (Exelon 2014a; ISWS 2015b). Reporting is required in accordance with the Illinois Water Use Act of 1983 (525 ILCS 45) and its 2010 amendments. The general purpose and intent of the Act is “to establish a means of reviewing potential water conflicts before damage to any person is incurred and to establish a rule for mitigating water shortage conflicts.” The

Affected Environment
3-42
2010 amendments to the Illinois Water Use Act added high-capacity intakes as subject to the Act’s water use reporting provisions. Such intakes are surface water intakes on a property in which the rate or capacity of water withdrawal of all intakes for the property is equal to, or in excess of, 100,000 gal (380 m3) during any 24-hour period (525 ILCS 45). Under certain conditions, Exelon may take action to curtail surface water withdrawals from, and cooling pond blowdown to, the Illinois River in accordance with the LSCS Extreme Heat Implementation Plan. As necessary, plant personnel would take actions prescribed by the plan and associated procedures to mitigate the impacts of summer drought and/or high river temperature and river low-flow conditions. Depending on predefined conditions set forth in the plan and implementing procedures, such actions may include a combination of monitoring and modeling of river intake and mixing zone temperatures; manipulation of the water level of the cooling pond, including adjusting blowdown flow from and makeup water withdrawals to the cooling pond; and taking other actions to meet NPDES mixing zone thermal limits and the TS limits on condenser inlet temperature from the cooling pond (Exelon 2014a, 2015c). Two other industrial facilities withdraw water from the Marseilles Pool of the Illinois River in the vicinity of LSCS (Figure 3–5) and are listed in the Illinois Water Inventory Program. These are Agrium U.S., Inc., and PCS Phosphate, Marseilles Operation. The volume of water withdrawn by these commercial facilities is not publicly available (Exelon 2014a). Because they are included in the State’s inventory, the NRC staff presumes that each facility withdraws in excess of 100,000 gpd (380 m3). Both are also currently subject to NPDES individual permits (i.e., Permits IL0001708 and IL0036463). Based on reported return discharges to the Illinois River, it is estimated that Agrium’s surface water withdrawals are on the order of 5 mgd (18,900 m3) (EPA 2015a). The public water supply systems in the vicinity of LSCS (i.e., the city of Marseilles and the village of Seneca) do not withdraw water from the Illinois River but instead rely upon groundwater-supplied systems (Exelon 2014a) (see Section 3.5.2.2). Surface water withdrawals within the Marseilles Pool have shown no significant effects on water availability to date (Exelon 2014a). 3.5.1.3 Surface Water Quality and Effluents
The Illinois Pollution Control Board (IPCB), a sister agency to the IEPA, promulgates water quality standards in the State. Two Sections of Title 35 of the IAC (35 IAC 302 and 35 IAC 303) contain the standards applicable to lakes and streams. Procedures that must be followed in using water quality standards to set NPDES permit limits appear in Section 309 (35 IAC 309). Designated uses prescribed by 35 IAC 303 are those uses specified in water quality standards for each lake, river, stream, and groundwater resource. In designating uses for a waterbody, the IPCB considers the use and value of the waterbody for public water supply; propagation of fish, shellfish, and wildlife; and recreational, agricultural, industrial, and navigational purposes. The main stem of the Illinois River is designated a “general use water” by the IPCB. Waters in the general use category must meet water quality standards protective of aquatic life, wildlife, agricultural use, and secondary contact use, as well as most industrial uses and aesthetic quality (35 IAC 303.201). These standards pertain to pH; phosphorus; dissolved oxygen; radioactivity (gross beta, strontium-90, and radium-226 and -228); various chemical constituents (metals and organic compounds); fecal coliform; and other toxic substances. In addition, a segment of the main stem of the Illinois River within LaSalle and Grundy Counties, and encompassing the entire Marseilles Pool on which LSCS is located, is afforded “enhanced dissolved oxygen protection.” Dissolved oxygen levels must be not less than 5.0 milligrams per

Affected Environment
3-43
liter at any time during March through July and not less than 4.0 milligrams per liter at any time during August through February (35 IAC 302.206). Over the last 150 years, water quality within the whole of the Illinois River Basin has historically suffered from rapid population growth; urbanization; and industrial development, including the conversion of prairie, wetlands, and forests. This change resulted in the discharge of untreated and inadequately treated sewage, the discharge of industrial pollutants and refuse, runoff of agricultural chemicals and sediments, and the alteration of the natural river hydrology due to navigation and flood control projects (Exelon 2014a; Talkington 1991). Over the last 50 years, substantial improvements in water quality have occurred because of municipal and industrial waste treatment and management efforts to address both point and nonpoint pollutant sources. Ongoing water quality concerns within the upper Illinois River Basin include the atmospheric deposition of pesticides and trace metals; endocrine disrupting compounds in surface and groundwater; nutrient enrichment of surface and groundwater; the transport and fate of pesticides, trace elements, and volatile organic compounds in surface and ground water; and the effects of urbanization on biodiversity, habitat, and water quality (USGS 1998). Section 303(d) of the Federal Water Pollution Control Act (i.e., Clean Water Act of 1977, as amended (CWA) (33 U.S.C. 1251 et seq.)) requires the State of Illinois and other states to identify all “impaired” waters for which effluent limitations and pollution control activities are not sufficient to attain water quality standards in such waters. The Section 303(d) list includes those water quality-limited stream segments that require the development of total maximum daily loads (TMDLs) to ensure future compliance with water quality standards. The TMDLs specify the maximum amount of a pollutant that a waterbody can receive and still meet water quality standards. Once established, TMDLs are typically implemented through watershed-based programs administered by the State, primarily through the NPDES permit program and associated point and nonpoint source water quality improvement plans and associated best management practices. The IEPA has classified a 30.1-mi- (48.4-km)-long segment (IL_D-23) of the Illinois River between Morris and Ottawa, Illinois, that includes the LSCS site as impaired. This segment is listed as impaired because it does not meet designated uses for fish consumption due to polychlorinated biphenyls (PCBs) and mercury contamination. It is also impaired for primary contact recreation use due to fecal coliform bacteria (IEPA 2014b). Special Condition 13 of the NPDES permit for LSCS prohibits the discharge of PCBs in plant effluents (IEPA 2013). The river segment is classified as fully supporting its designated use for aquatic life. IEPA has assigned a medium priority for the development of TMDLs for segment IL_D-23 (IEPA 2014b). As for other streams and runs in the vicinity of LSCS, IEPA (2014b) designates them as Category 3, which are waters for which no use-support determination can be made due to insufficient available data and/or information. The LSCS cooling pond is included in the IEPA’s CWA Section 314 inventory of lakes and has also been designated as Category 3 (IEPA 2014b). However, LSCS’s cooling pond is defined by the State of Illinois as a wastewater treatment works pursuant to 35 IAC 301.415. Under this definition, the cooling pond is not waters of the State under 35 IAC 301.440. Likewise, as defined in 40 CFR 230.3, pursuant to the Federal CWA, “waste treatment systems, including treatment ponds or lagoons designed to meet the requirements of the Clean Water Act” are explicitly excluded from the definition of “waters of the United States.” Therefore, the cooling pond is not subject to State or Federal water quality standards. Similarly, the LSCS closed-cycle, recirculating, cooling pond is exempt from impingement and entrainment monitoring requirements under Section 316(b) of the CWA.
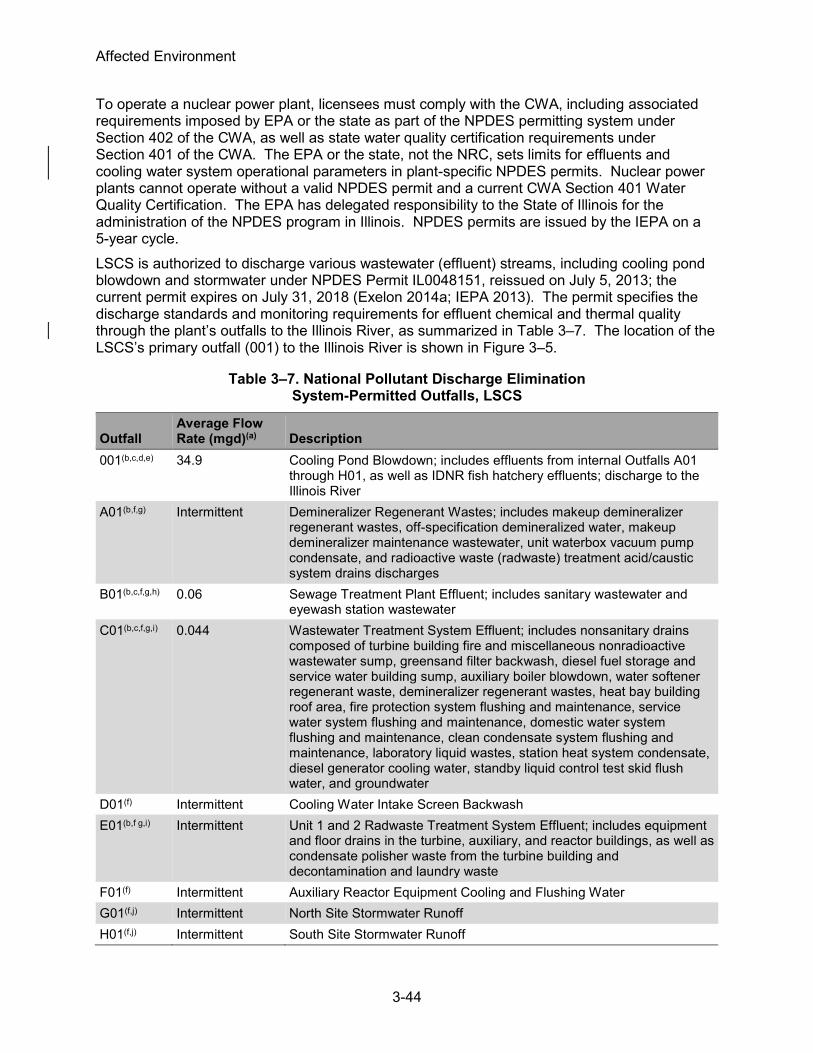
Affected Environment
3-44
To operate a nuclear power plant, licensees must comply with the CWA, including associated requirements imposed by EPA or the state as part of the NPDES permitting system under Section 402 of the CWA, as well as state water quality certification requirements under Section 401 of the CWA. The EPA or the state, not the NRC, sets limits for effluents and cooling water system operational parameters in plant-specific NPDES permits. Nuclear power plants cannot operate without a valid NPDES permit and a current CWA Section 401 Water Quality Certification. The EPA has delegated responsibility to the State of Illinois for the administration of the NPDES program in Illinois. NPDES permits are issued by the IEPA on a 5-year cycle. LSCS is authorized to discharge various wastewater (effluent) streams, including cooling pond blowdown and stormwater under NPDES Permit IL0048151, reissued on July 5, 2013; the current permit expires on July 31, 2018 (Exelon 2014a; IEPA 2013). The permit specifies the discharge standards and monitoring requirements for effluent chemical and thermal quality through the plant’s outfalls to the Illinois River, as summarized in Table 3–7. The location of the LSCS’s primary outfall (001) to the Illinois River is shown in Figure 3–5.
Table 3–7. National Pollutant Discharge Elimination System-Permitted Outfalls, LSCS
Outfall Average Flow Rate (mgd)(a) Description
001(b,c,d,e) 34.9 Cooling Pond Blowdown; includes effluents from internal Outfalls A01 through H01, as well as IDNR fish hatchery effluents; discharge to the Illinois River
A01(b,f,g) Intermittent Demineralizer Regenerant Wastes; includes makeup demineralizer regenerant wastes, off-specification demineralized water, makeup demineralizer maintenance wastewater, unit waterbox vacuum pump condensate, and radioactive waste (radwaste) treatment acid/caustic system drains discharges
B01(b,c,f,g,h) 0.06 Sewage Treatment Plant Effluent; includes sanitary wastewater and eyewash station wastewater
C01(b,c,f,g,i) 0.044 Wastewater Treatment System Effluent; includes nonsanitary drains composed of turbine building fire and miscellaneous nonradioactive wastewater sump, greensand filter backwash, diesel fuel storage and service water building sump, auxiliary boiler blowdown, water softener regenerant waste, demineralizer regenerant wastes, heat bay building roof area, fire protection system flushing and maintenance, service water system flushing and maintenance, domestic water system flushing and maintenance, clean condensate system flushing and maintenance, laboratory liquid wastes, station heat system condensate, diesel generator cooling water, standby liquid control test skid flush water, and groundwater
D01(f) Intermittent Cooling Water Intake Screen Backwash E01(b,f g,i) Intermittent Unit 1 and 2 Radwaste Treatment System Effluent; includes equipment
and floor drains in the turbine, auxiliary, and reactor buildings, as well as condensate polisher waste from the turbine building and decontamination and laundry waste
F01(f) Intermittent Auxiliary Reactor Equipment Cooling and Flushing Water G01(f,j) Intermittent North Site Stormwater Runoff H01(f,j) Intermittent South Site Stormwater Runoff

Affected Environment
3-45
Outfall Average Flow Rate (mgd)(a) Description
I01(b,f,g) Intermittent Reverse Osmosis System Reject Water and Greensand Filter Backwash
002(k) Intermittent Illinois River Makeup Water Intake Screen Backwash; includes river intake screen backwash; trench wash water; process sampling discharge; lake makeup pump gland leakoff; coolers/reliefs flow; lake makeup pump strainer backwash; air compressor receiver and prefilter drainage; dewatering pump discharge; fire protection water; and river screen house switchyard stormwater runoff, floor drains, and roof drains; discharge to the Illinois River at the river screen house
(a) To convert million gallons per day (mgd) to million cubic meters (m3), divide by 264.2. (b) Flow is subject to monitoring and reporting in units of mgd as a monthly average and as a daily maximum on
Discharge Monitoring Report (DMR) (NPDES permit Special Condition 1). (c) pH is subject to limit of 6.0 to 9.0 (NPDES permit Special Condition 2). (d) Temperature is subject to continuous monitoring and DMR reporting of maximum monthly, as well as with
temperature limits and mixing zone criteria (NPDES permit Special Condition 3). The calculated temperature at the edge of the mixing zone is limited to no more than 5 °F (2.8 °C) higher than ambient river temperature. The temperature beyond the mixing zone cannot exceed specified monthly limits for longer than 1 percent (i.e., 87.6 hours) of any 12-month period and cannot at any time exceed the specified monthly limit by more than 1.7 °C (3 °F). During the months of April through November, the calculated temperature outside the mixing cannot exceed 93 °F (34 °C).
(e) Total residual chlorine is subject to a limit of 0.05 milligrams per liter (NPDES permit Special Conditions 4 and 16).
(f) This outfall is the NPDES permit internal monitoring point before the numbered point source outfall. (g) Total suspended solids are subject to specified limits and monitoring. (h) Carbonaceous biochemical oxygen demand is subject to specified limits and monitoring. (i) Oil and grease are subject to specified limits and monitoring. (j) Stormwater is subject to requirements of the Storm Water Pollution Prevention Plan (NPDES permit Special
Condition 8). (k) Adequate maintenance of intake screen system is required to prevent discharge of floating debris back to the
river. The stormwater portion is subject to the requirements of the Storm Water Pollution Prevention Plan (NPDES permit Special Condition 8).
Note: The release of complex metal-bearing waste streams and polychlorinated biphenyls (PCBs) from all outfalls is prohibited by NPDES permit Special Conditions 5 and 13, respectively. Special Condition 9 authorizes the use of water treatment additives that were requested by Exelon as part of the renewed NPDES permit application.
Source: IEPA 2013
As indicated in Table 3–7, the NPDES permit for LSCS requires Exelon to monitor and sample site effluents for various parameters in accordance with applicable effluent limits. Monitoring results are reported in monthly Discharge Monitoring Reports (DMRs) submitted to the State. The NRC staff reviewed the DMRs submitted by Exelon to the IEPA for the period 2010 through 2014. This review encompassed the results of recorded maximum cooling pond blowdown temperatures to the Illinois River and associated calculations of river mixing zone temperatures as reported in the DMRs for the past 5 years (2010 through 2014) and as compiled by Exelon (Exelon 2015c). Based on the NRC staff’s review and Exelon’s responses to the NRC’s requests for additional information, LSCS has received no notices of violation associated with NPDES permitted discharges during the 2010 through 2014 time period. Nonetheless, Exelon recorded several unusual occurrences in its DMR reports. These included reports of a makeup pipeline line failure on January 29, 2010; a blowdown line failure on July 13, 2012; a makeup

Affected Environment
3-46
pipeline line failure on January 25, 2013; a blowdown line air release valve failure on February 8, 2013; a makeup pipeline failure on May 21, 2013; and a makeup pipeline failure on January 23, 2014 (Exelon 2015c). The DMR submittals also document actions taken to comply with provisional variances granted by the IEPA to Exelon with respect to LSCS’s effluent discharges to the Illinois River and associated river mixing zone temperature limits. Specifically, these variances (IEPA-12-15, IEPA-12-24, and IEPA-12-24 extension) were sought and granted in March, July, and August 2012, respectively, due to unusual weather conditions and associated high ambient river water temperatures that impacted the ability for LSCS thermal discharges to meet the requirements of Special Condition 3 of LSCS’s NPDES permit. This limits the number of temperature excursion hours to 1 percent (87.6 hours) of the hours in a 12-month period, ending with any month (see footnote d in Table 3–7). During the variance period(s), Exelon was required, in part, to continuously monitor both the discharge and receiving water temperatures and visually inspect all discharge areas at least three times each day to assess the impact on aquatic life. These thermal discharge excursions were not found to have any impact on aquatic life (Exelon 2015c). An applicant (in this case, Exelon) for a Federal license to conduct activities that may cause a discharge of regulated pollutants into navigable waters of the United States is required by Section 401 of the CWA to provide the licensing agency (in this case, the NRC) with water quality certification from the state (in this case, the State of Illinois). This certification implies that discharges from the project or facility to be licensed will comply with CWA requirements and will not cause or contribute to a violation of state water quality standards. If the applicant has not received Section 401 certification, the NRC cannot issue a renewed license unless that state has waived the requirement. The NRC recognizes that some NPDES-delegated states explicitly integrate their 401 certification process with NPDES permit issuance. However, LSCS’s NPDES permit does not explicitly convey water quality certification under CWA Section 401. By letter dated February 4, 2014, Exelon submitted an application to the IEPA Bureau of Water that requested certification from the IEPA that renewal of Exelon’s NRC operating licenses for LSCS would not violate State water quality standards (Exelon 2014h). The IEPA Division of Water Pollution Control issued a letter to the NRC, and copied Exelon, which provides Section 401 water quality certification for renewal of the operating licenses for LSCS. The certification was issued with the condition that Exelon shall be responsible for obtaining NPDES permits required for wastewater or stormwater discharges to waters of the State (IEPA 2014c). As previously stated in this section, NRC licensees must comply with the CWA, including associated requirements imposed by EPA or the state, as part of the NPDES permitting system under CWA Section 402. The NRC staff concludes that the IEPA’s response provides the necessary certification pursuant to CWA Section 401. To maintain LSCS’s surface water intake system on the Marseilles Pool of the Illinois River, Exelon conducts occasional maintenance dredging at the river screen house (Exelon 2014a). The need for maintenance dredging at the river screen house forebay is periodically evaluated in accordance with an Exelon operating procedure. Currently, needed dredging is conducted under a USACE Section 10 permit, which is issued pursuant to the Rivers and Harbors Appropriation Act of 1899 (33 U.S.C. 403) (USACE 2006). Dredging was most recently conducted in October 2013 in compliance with the provisions of the permit. Less than 100 cubic yards (76 m3) of sediment was removed, and the material was dewatered and placed out of the floodplain near the screen house. Future maintenance dredging will be conducted as needed and with the necessary permits. Exelon does not expect to perform any dredging in the vicinity of the LSCS discharge channel during the license renewal term and does not anticipate the need to conduct any fill activities (Exelon 2015c).
Affected Environment
3-47
3.5.2 Groundwater Resources
This section describes the current groundwater resources at the LSCS site and in the vicinity. 3.5.2.1 Site Description and Hydrogeology
The site is characterized by five hydrogeologic units. By increasing depth, they are as follows:
• the Alluvial Aquifer,
• the Glacial Drift Aquitard,
• the Buried Bedrock Valley Aquifers,
• the Pennsylvanian Aquitard, and
• the Cambrian-Ordovician Aquifer System. The hydrogeologic characteristics of these units are summarized in Figure 3–12. Alluvial (stream) deposits are found beneath, and extend along each side of, the Illinois River. These deposits form the Alluvial Aquifer that lays on top of the bedrock (the Pennsylvanian Aquitard) (Figure 3–8). The river functions as a hydrologic boundary, which prevents groundwater within the Alluvial Aquifer from flowing from one side of the river to the other. The Alluvial Aquifer is generally 2 to 4 ft (0.6 to 1.2 m) thick, is located in the vicinity of the river screen house, and ranges from 3,500 to 4,800 ft (1,067 to 1,463 m) in width. Yields in the Alluvial Aquifer are restricted by the limited areal extent and thickness of the sand and gravel deposits that make up the aquifer. Small dependable yields suitable for domestic purposes are only locally available. The aquifer receives recharge primarily by precipitation and from the river. Well yields from the Alluvial Aquifer in the vicinity of the river screen house are most likely adequate only for domestic use (Exelon 2014a). The Glacial Drift Aquitard is made up of the Richland Loess and the Wedron Silty-Clay Till (see Section 3.4.1). The aquitard largely consists of silty-clay till (unsorted sediment containing a range of grain sizes) with very low permeability. In the area of the plant buildings, the Glacial Drift Aquitard is over 200 ft (61 m) thick (CRA 2006). Any extractable groundwater in this aquitard is produced from thin discontinuous sand and gravel pockets that are recharged by the slow infiltration of precipitation through the silty-clay till. The volume of groundwater produced from these pockets is limited so that it is primarily used as a source of water for domestic or farm activities (Exelon 2014a). As discussed in Section 3.4.1, the site is located between two buried bedrock valleys that contain alluvial deposits of sandy gravels and gravelly sands with lesser amounts of silt and clay in scattered thin layers. These alluvial deposits are overlain and merge with the Wedron Silty-Clay Till. They are recharged by the slow infiltration of precipitation through the thick overlying Glacial Drift Aquitard. Therefore, the volume of groundwater that can be produced from the Buried Bedrock Valley Aquifers is limited to supplying water for domestic or farm activities (Exelon 2014a). The Pennsylvanian Aquitard forms the bedrock. It consists of alternating beds of shale, siltstone, underclay, sandstone, limestone, coal, and many gradational layers. Low permeability shale and siltstone comprise more than 90 percent of the aquitard. In the area of the plant buildings, the Pennsylvanian Aquitard is approximately 176 ft (54 m) thick. Groundwater in the aquitard occurs under artesian conditions. Wells finished in the aquitard get water primarily from thin sandstone and limestone beds within the aquitard, which are recharged by seepage through the overlying shales and through the silty-clay till of the Glacial Drift Aquitard. In general, the sandstone and limestone beds within the aquitard can only supply enough water for

Affected Environment
3-48
domestic or farm use because well yields are commonly less than 36 L/min (10 gpm) (Exelon 2014a).
Figure 3–12. LSCS Site Hydrogeologic Units
Source: Modified from Exelon 2014a
The Pennsylvanian Aquitard is underlain by the Cambrian-Ordovician Aquifer, which is an important aquifer in the region. Beneath the site, this aquifer is composed of the following strata (listed from shallowest to deepest):

Affected Environment
3-49
• Platteville Group,
• Glenwood—St. Peter Sandstone,
• Potosi Dolomite,
• Franconia Formation,
• Ironton Sandstone, and
• Galesville Sandstone. At the site, the Cambrian-Ordovician Aquifer is approximately 1,090 ft (469 m) thick. Although numerous alternating layers of sandstones, limestone, and dolomites impart a heterogeneous character to the system, these units are hydraulically connected and behave as a single aquifer (Exelon 2014a). The Cambrian-Ordovician Aquifer is the most important supplier of public water in the region. The Cambrian-Ordovician Aquifer is underlain by 450 ft (137 m) of the Eau Claire Formation Aquitard, which is underlain by 2,500 ft (762 m) of the Mt. Simon Aquifer. The Mt. Simon Aquifer is underlain by granitic and metamorphic rock. In addition to the hydrogeologic units previously described, the plant area is directly underlain by engineered granular fill that has been placed on top of the Wedron Silty-Clay Till. The engineered granular fill underlies and surrounds the plant buildings and structures. It is composed of sand and gravel and silty clay and contains groundwater that is recharged by local precipitation. Because the underlying Wedron Silty-Clay Till has a very low permeability, groundwater in the granular fill flows laterally eastward until it discharges into the intake canal, or it flows laterally and discharges to the stormwater ponds and the discharge canal to the west (CRA 2006) (Figures 3–12 and 3–13). 3.5.2.2 Groundwater Use
LaSalle County has an adequate supply of groundwater to meet current needs for industrial, municipal, and domestic purposes. Regionally, the most abundant groundwater supplies are obtained from the Cambrian-Ordovician Aquifer (LaSalle County 2014). At the site, water for potable usage is obtained from two cased onsite wells completed into the Cambrian-Ordovician Aquifer. These wells were installed in 1972 and 1974 in the area of the plant buildings. They were drilled to a depth of 1,620 and 1,629 ft (494 and 496 m) and cased to a depth of 921 and 989 ft (281 and 301 m) (Exelon 2014a, 2014b; ISGS 2015). Together the two wells withdraw groundwater at an average rate of 26.1 gpm (98.7 L/min) (Exelon 2014a).

Affected Environment
3-50
Figure 3–13. LSCS Groundwater Flow in Engineered Granular Fill
Source: Modified from Exelon 2014a

Affected Environment
3-51
Figure 3–14. LSCS Hydrogeologic Cross-Section (Elevation Exaggerated)
Source: Modified from CRA 2006

Affected Environment
3-52
Within 10 mi (16 km) of the LSCS site, almost all water used for public water supplies is obtained from the Cambrian-Ordovician Aquifer. However, the Village of Ransom withdraws water from both the Cambrian-Ordovician Aquifer and from permeable zones in the Pennsylvanian Aquitard, and the Village of Grand Ridge obtains water from the Buried Bedrock Valley Aquifers. People in small communities within 10 mi (16 km) of the LSCS site that are not served by a public water supply system obtain water from individual wells in the glacial drift, the Pennsylvanian strata, or the upper portion of the Cambrian-Ordovician Aquifer (Exelon 2014a). 3.5.2.3 Groundwater Quality
In general, the quality of groundwater in the Alluvial Aquifer, the Glacial Drift Aquitard, the Buried Bedrock Valley Aquifers, the Pennsylvanian Aquitard, and the Cambrian-Ordovician Aquifer is suitable for public use and consumption. A search of Illinois State Geological Survey water well files identified six wells outside the site boundary but within 1 mi (1.6 km) of the plant buildings. With the exception of one well completed in the Pennsylvanian Aquitard, all these wells withdraw water from the Cambrian-Ordovician Aquifer (ISGS 2015). In 1985, a condensate line broke in the area east-southeast of the LSCS reactor building. Tritium was detected near the broken line in groundwater near the surface. The line was repaired soon after it broke. In 1986, the highest tritium concentrations detected in the groundwater was approximately 11,000 picocuries per liter (pCi/L). Tritium concentrations in the groundwater near the broken line have declined to the point that, since 2007, tritium concentrations in the groundwater have been below the lower limit of detection (Exelon 2014a; Exelon Nuclear 2008, 2009, 2010, 2011, 2012, 2013, 2014, 2015). In September 2001, a spill of water from a recycled condensate storage tank resulted in tritium contamination into groundwater near the land surface. Tritium concentrations in the groundwater ranged from 766 to 1,280 pCi/L in 2006 (Exelon 2014a; Exelon Nuclear 2007). These concentrations are well below the EPA Maximum Contaminant Level for tritium of 20,000 pCi/L. In 2014, tritium concentrations in the groundwater had further decreased below the lower limit of detection (Exelon Nuclear 2015). Another leak from a recycled condensate tank was identified in 2010. The tank is located near the plant buildings and is underlain by 10 ft (3 m) of engineered granular fill. In turn, the fill is underlain by the Wedron Silty-Clay Till. Soon after the leak was detected, the tank was drained and repaired. The leak contaminated groundwater in engineered granular fill with condensate water that contained tritium. Contamination in the engineered granular fill is being addressed through natural monitored attenuation and by active remediation. Exelon is pumping contaminated groundwater from both a well and a French drain installed in the engineered granular fill and then discharging the recovered water into the cooling pond where it is greatly diluted to below the lower limit of detection (Exelon 2014a). Exelon has been monitoring the cleanup of the engineered granular fill using monitor wells. In June 2015, samples from all of the monitor wells recorded tritium concentrations below the EPA Maximum Contaminant Level for tritium of 20,000 pCi/L (Exelon Nuclear 2010, 2011, 2012, 2013, 2014, 2015; Exelon 2015a, 2015c). Although the engineered granular fill has been contaminated with tritium and is being cleaned up, it is not an aquifer. No aquifers are known to have been contaminated by inadvertent releases of radionuclides to groundwater. One “nonradiological” release to groundwater occurred in 1999 when an oil tank was discovered to have leaked. The spill was remediated, and on February 9, 2005, IEPA issued a letter of “No Further Remediation” for the cleanup activities (Exelon 2014a).

Affected Environment
3-53
3.6 Terrestrial Resources
3.6.1 LSCS Ecoregion
LSCS lies within the Illinois/Indiana Prairies Level IV Ecoregion. This ecoregion encompasses 19,557 mi2 (50,652 km2) in eastern and central Illinois and western Indiana (Woods et al. 2006). It is composed of vast glaciated, flat to rolling plains with terminal and recessional moraines, prairie potholes, and old lake beds. Historically, tallgrass prairie covered the majority of the land surface. Oak-hickory forests were common on moraines and floodplains, and marshes and wet prairies occurred in poorly drained areas. Beginning in the 19th century, agricultural land began to replace the natural vegetation, and it is now the dominant land type (Woods et al. 2006). Prairie remnants lack many natural ecosystem functions due to their small size, and areas of prairie restoration often lack forbs (broad-leaved herbs other than grass) or are overly dominated by big bluestem (Andropogon gerardii) (a grass) or Indiangrass (Sorghastrum nutans) (IDNR 2005). Historically, forests were dominated by oak (Quercus spp.), hickory (Carya spp.), elm (Ulmus spp.), ash (Fraxinus spp.), beech (Fagus spp.), and maple (Acer spp.) species (CEC 2008). Remaining forests are highly fragmented and are experiencing species composition shifts to sugar maple (A. saccharum) and other mesophytic species (IDNR 2005). This shift is in part due to fire suppression, which has favored species that do not rely on periodic fires as part of their life cycle (IDNR 2005). Many wetland areas have been drained for row crops, and agriculture now accounts for over 75 percent of land use within this ecoregion (IDNR 2005). Table 3–8 lists representative wildlife for this ecoregion, as well as species that the Illinois Department of Natural Resources (IDNR) considers to be “critical” to the conservation and restoration of the region’s native habitats; species that are indicative of ecosystem health (known as “indicator species”); and species that are native to the region, but are now extirpated or imperiled. The IDNR maintains the Illinois Wildlife Action Plan (IDNR 2005), which addresses native habitat and species decline and contains a statewide conservation plan.
Table 3–8. Wildlife in the Illinois/Indiana Prairies Level IV Ecoregion
Wildlife representative of the ecoregion American black bear (Ursus americanus)
eastern bluebird (Sialia sialis)
North American porcupine (Erethizon dorsatum)
American redstart (Setophaga ruticilla)
eastern chipmunk (Tamias striatus)
raccoon (Procyon lotor)
bobcat (Lynx rufus)
eastern gray squirrel (Sciurus carolinensis)
tree sparrow (Passer montanus)
Canada warbler (Cardellina canadensis)
gray fox (Urocyon cinereoargenteus)
white-footed mouse (Peromyscus leucopus)
coyote (Canis latrans)
indigo bunting (Passerina cyanea)
white-tailed deer (Odocoileus virginianus)
Wildlife critical to the conservation and restoration of the ecoregion’s native habitats American badger (Taxidea taxus)
Henslow’s sparrow (Ammodramus henslowii)
northern harrier (Circus cyaneus)
eastern massasauga(a) (Sistrurus catenatus)
Illinois chorus frog (Pseudacris streckeri illinoensis)
ornate box turtle (Terrapene ornata ornata)
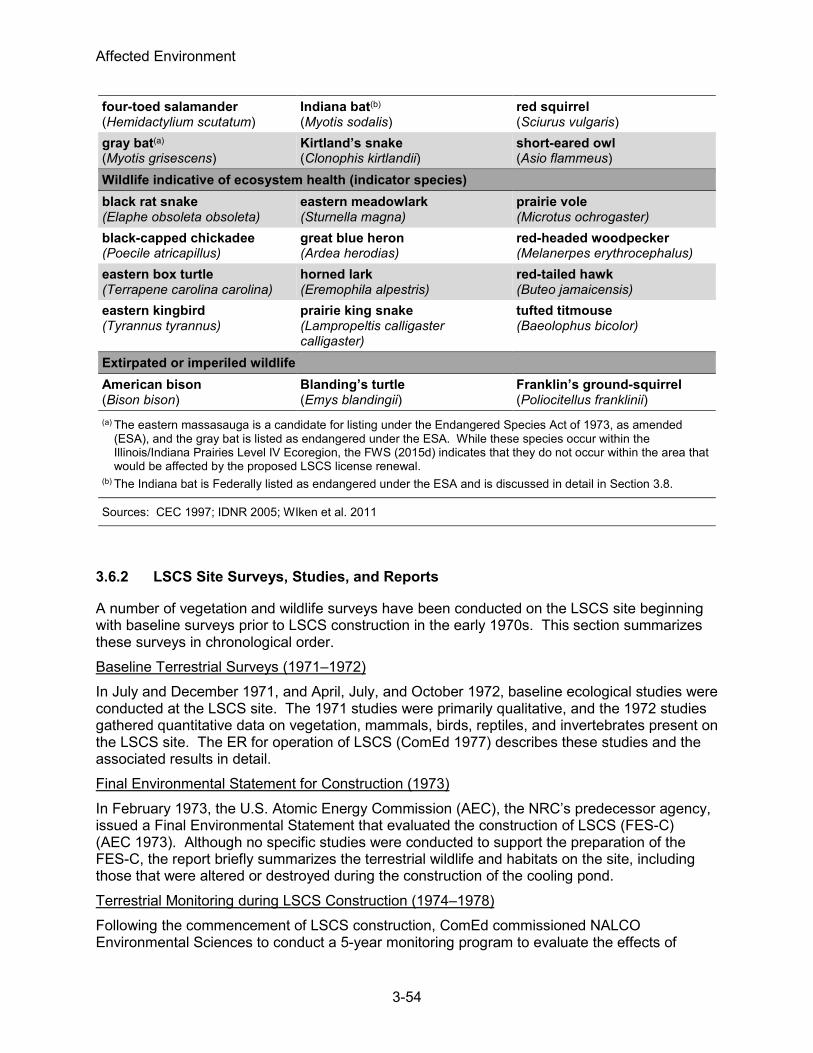
Affected Environment
3-54
four-toed salamander (Hemidactylium scutatum)
Indiana bat(b) (Myotis sodalis)
red squirrel (Sciurus vulgaris)
gray bat(a) (Myotis grisescens)
Kirtland’s snake (Clonophis kirtlandii)
short-eared owl (Asio flammeus)
Wildlife indicative of ecosystem health (indicator species) black rat snake (Elaphe obsoleta obsoleta)
eastern meadowlark (Sturnella magna)
prairie vole (Microtus ochrogaster)
black-capped chickadee (Poecile atricapillus)
great blue heron (Ardea herodias)
red-headed woodpecker (Melanerpes erythrocephalus)
eastern box turtle (Terrapene carolina carolina)
horned lark (Eremophila alpestris)
red-tailed hawk (Buteo jamaicensis)
eastern kingbird (Tyrannus tyrannus)
prairie king snake (Lampropeltis calligaster calligaster)
tufted titmouse (Baeolophus bicolor)
Extirpated or imperiled wildlife American bison (Bison bison)
Blanding’s turtle (Emys blandingii)
Franklin’s ground-squirrel (Poliocitellus franklinii)
(a) The eastern massasauga is a candidate for listing under the Endangered Species Act of 1973, as amended (ESA), and the gray bat is listed as endangered under the ESA. While these species occur within the Illinois/Indiana Prairies Level IV Ecoregion, the FWS (2015d) indicates that they do not occur within the area that would be affected by the proposed LSCS license renewal.
(b) The Indiana bat is Federally listed as endangered under the ESA and is discussed in detail in Section 3.8.
Sources: CEC 1997; IDNR 2005; WIken et al. 2011
3.6.2 LSCS Site Surveys, Studies, and Reports
A number of vegetation and wildlife surveys have been conducted on the LSCS site beginning with baseline surveys prior to LSCS construction in the early 1970s. This section summarizes these surveys in chronological order. Baseline Terrestrial Surveys (1971–1972) In July and December 1971, and April, July, and October 1972, baseline ecological studies were conducted at the LSCS site. The 1971 studies were primarily qualitative, and the 1972 studies gathered quantitative data on vegetation, mammals, birds, reptiles, and invertebrates present on the LSCS site. The ER for operation of LSCS (ComEd 1977) describes these studies and the associated results in detail. Final Environmental Statement for Construction (1973) In February 1973, the U.S. Atomic Energy Commission (AEC), the NRC’s predecessor agency, issued a Final Environmental Statement that evaluated the construction of LSCS (FES-C) (AEC 1973). Although no specific studies were conducted to support the preparation of the FES-C, the report briefly summarizes the terrestrial wildlife and habitats on the site, including those that were altered or destroyed during the construction of the cooling pond. Terrestrial Monitoring during LSCS Construction (1974–1978) Following the commencement of LSCS construction, ComEd commissioned NALCO Environmental Sciences to conduct a 5-year monitoring program to evaluate the effects of

Affected Environment
3-55
temporary and permanent ecological disturbances related to construction from 1974 through 1978. The ER for operation of LSCS (ComEd 1977) describes the results of the first 2 years of this monitoring. Final Environmental Statement for Operation (1978) In November 1978, the NRC issued a Final Environmental Statement that evaluated the operation of LSCS (FES-O) (NRC 1978). The report includes updates to the terrestrial habitat and wildlife information presented in the FES-C based on the 5 years of terrestrial monitoring conducted during LSCS construction. Wildlife Habitat Council Vegetation and Wildlife Surveys (2007) In September 2007, Wildlife Habitat Council (WHC) biologists performed a baseline habitat survey for the Wildlife at Work program. The survey results are documented in the LSCS Wildlife Management Plan (Exelon 2013b). LSCS Wildlife Habitat Team Monitoring (Ongoing) The LSCS Wildlife Habitat Team conducts periodic wildlife surveys of the site in the spring (April), summer (July), and fall (September) to monitor changes in wildlife communities and to document any new species found on the site. Results of periodic surveys are collected in Exelon’s Wildlife Management Plan (Exelon 2013b).
3.6.3 LSCS Site
The LSCS site encompasses approximately 1,528 ha (3,776 ac) in Marseilles, LaSalle County, Illinois. The cooling pond, generating facilities and associated infrastructure, and LaSalle Fish Hatchery occupy the majority (66 percent) of the site. The remaining areas are undeveloped and include the following terrestrial communities: forest, shrub-scrub, grassland, old-field, and wetlands. A cooling pond occupies the eastern side of the site and accounts for about half of the site area. The generating facilities and associated infrastructure (roads, parking lots, warehouses, switchyards) lie west of the cooling pond and occupy approximately 65 ha (160 ac) (Exelon 2015p). This industrial area is surrounded by about 142 ha (350 ac) of undeveloped natural areas, including grassland, old field, schub-scrub, and small forested fragments (Exelon 2015p). 3.6.3.1 Vegetation
Because the majority of the LSCS site is developed or occupied by the cooling pond, only small areas of terrestrial habitat occur on the site. An open grassy area lies between the cooling pond and the site’s industrial area. This area is bounded on the north by the discharge canal and on the south by the property boundary. Another grassy area lies to the southwest of the industrial area. These two areas have a few scattered trees (Exelon 2014a). The makeup and blowdown pipeline corridor extends north from the cooling pond to the Illinois River and supports upland habitats, including shrub-scrub, forest, grassland, and old-fields, and scattered wetlands. Common tree species in the upland forest areas, which comprise the majority of the corridor, include white oak (Quercus alba), red oak (Q. rubra), shagbark hickory (Carya ovata), sugar maple, hop hornbeam (Ostrya virginiana), hawthorn (Crataegus spp.), black cherry (Prunus serotina), and American elm (Ulmus americana) (Exelon 2014a). The corridor widens as it approaches the Illinois River where it contains several small freshwater emergent and freshwater forested/scrub wetlands. These wetlands are discussed in Section 3.6.5.2.

Affected Environment
3-56
3.6.3.2 Wildlife
Mammals During the baseline terrestrial surveys in 1971 and 1972, 29 species of mammals were recorded on the LSCS site. The most commonly observed mammals included raccoon (Procyon lotor), mink (Mustela vison), red fox (Vulpes fulva), gray fox (Urocyon cinereoargenteus), gray squirrel (Sciurus carolinensis), fox squirrel (Sciurus niger), beaver (Castor canadensis), muskrat (Ondatra zibethicus), eastern cottontail (Sylvilagus floridanus), and white-tailed deer (ComEd 1977). During the 2007 WHC baseline inventory of the LSCS site, coyote (Canis latrans), beaver, opossum (Didelphis virginiana), groundhog (Marmota monax), striped skunk (Mephitis mephitis), white-tailed deer, and gray squirrel were observed on the site (Exelon 2013b). Birds During the baseline terrestrial surveys in 1971 and 1972, 129 species of birds were recorded on or near the LSCS site. Of these, 41 are considered permanent residents, 45 are summer residents, 13 are winter residents, and 21 are transients (ComEd 1977). Permanent residents included mallard (Anas platyrhynchos), black duck (A. rubripes), red-tailed hawk (Buteo jamaicensis), red-shouldered hawk (Buteo lineatus), bald eagle (Haliaeetus leucocephalus), bobwhite (Colinus virginianus), ring-necked pheasant (Phasianus colchicus), killdeer (Charadrius vociferus), rock dove (Columba livia), mourning dove (Zenaida macroura), great horned owl (Bubo virginianus), short-eared owl (Asio flammeus), saw-whet owl (Aegolius acadicus), northern flicker (Colaptes auratus), red-bellied woodpecker (Melanerpes carolinus), red-headed woodpecker (M. erythrocephalus), horned lark (Eremophila alpestris), blue jay (Cyanocitta cristata), American crow (Corvus brachyrhynchos), black-capped chickadee (Poecile atricapillus), northern mockingbird (Mimus polyglottos), eastern bluebird (Sialia sialis), cedar waxwing (Bombycilla cedrorum), loggerhead shrike (Lanius ludovicianus), starling (Sturnus vulgaris), and house sparrow (Passer domesticus) (ComEd 1977). During the 2007 WHC baseline inventory of the LSCS site, 15 species of birds were observed, all of which had been previously recorded as occurring on the site during baseline surveys (Exelon 2013b). Reptiles and Amphibians No reptiles or amphibians were collected on the LSCS site in the 1971 baseline surveys (ComEd 1977). In 1972, two Eastern plains garter snakes (Thamnophis radix radix) were observed in pastureland near an intermittent stream (ComEd 1977). The 2007 WHC baseline inventory did not include reptiles or amphibians.
3.6.4 LSCS Wildlife Management Plan
The LSCS Wildlife Management Plan (Exelon 2013b) outlines the goals and projects of LSCS’s Wildlife at Work program. Some of the plan’s past and planned wildlife habitat enhancement and conservation activities at the LSCS site include:
• planting native vegetation, including swamp white oak (Quercus bicolor) near the cooling pond,
• controlling invasive common reed (Phragmites australis) near the cooling pond,
• enhancing existing habitat for grassland nesting birds through seeding, mowing, and controlled burns,
• maintaining nesting boxes for eastern bluebirds, and

Affected Environment
3-57
• installing osprey (Pandion haliaetus) platforms near the cooling pond (Exelon 2014a).
Exelon (2015n), as a corporation, has been a member of the WHC since 2005, and Exelon first received WHC certification for its Wildlife at Work program at LSCS in November 2011.
3.6.5 Important Species and Habitats
3.6.5.1 Important Species
State-Listed Species The Illinois Endangered Species Protection Act of 1972, as amended, makes illegal the transfer, sale, and possession of species (including skins and products) listed by the State as endangered or threatened. The Act establishes an Endangered Species Protection Board, which maintains a list of endangered and threatened species and advises the IDNR on the conservation of those species. Within LaSalle County, the IDNR’s (2014b) Natural Heritage Database indicates that 28 State-listed terrestrial species (19 plants, 3 birds, 2 reptiles, 2 mammals, 1 insect, and 1 amphibian) occur in the county (see Table 3–9). In September 2013, Exelon generated an IDNR Ecological Compliance Assessment Tool (EcoCAT) report that used Illinois Natural Heritage Database information to further refine the list of State-listed species that could occur on the LaSalle site and that could potentially be affected by the proposed license renewal. The EcoCAT report is included in Appendix C of the applicant’s ER (Exelon 2014a). The report indicates that there are no terrestrial State-listed species on or near the LSCS site that may be affected by the proposed license renewal. In a May 2014 letter to Exelon, the IDNR (2014c) confirmed that the EcoCAT report was accurate, and in its letter, the IDNR mentioned no records of State-listed terrestrial species on or near the site. Federally protected species are discussed in Section 3.8.
Table 3–9. State-Listed Species in LaSalle County
Common Name Species Name Status(a)
Amphibians
four-toed salamander Hemidactylium scutatum ST
Birds
cerulean warbler Dendroica cerulea ST
loggerhead shrike Lanius ludovicianus SE
upland sandpiper Bartramia longicauda SE
Insects
regal fritillary Speyeria idalia ST
Mammals
gray bat(b) Myotis grisescens SE
Indiana bat(b) Myotis sodalis SE
Plants
American brooklime Veronica americana SE

Affected Environment
3-58
Common Name Species Name Status(a)
bunchberry Cornus canadensis SE
cliff goldenrod Solidago sciaphila ST
decurrent false aster(b) Boltonia decurrens ST
fibrous-rooted sedge Carex communis ST
forked aster Aster furcatus ST
golden corydalis Corydalis aurea SE
hairy woodrush Luzula acuminata SE
hemlock panic grass Dichanthelium portoricense SE
long beech fern Phegopteris connectilis SE
pink corydalis Corydalis sempervirens SE
plantain-leaved sedge Carex plantaginea SE
queen-of-the-prairie Filipendula rubra SE
red pine Pinus resinosa SE
red-berried elder Sambucus racemosa ssp. pubens
SE
shadbush Amelanchier sanguinea SE
snowberry Symphoricarpos albus var. albus SE
spike Elliptio dilatata ST
weak bluegrass Poa languida SE
Reptiles
blanding's turtle Emydoidea blandingii SE
timber rattlesnake Crotalus horridus ST
(a) SE = State-endangered in Illinois; ST = State-threatened in Illinois (b) These species are also Federally listed under the Endangered Species Act of 1973, as
amended (ESA) and are discussed in detail in Section 3.8.
Source: IDNR 2014b
Although not listed as occurring in LaSalle County by the IDNR, Exelon (2014a) reports that it has observed the State-threatened peregrine falcon (Falco peregrinus) on the LSCS site. A pair of peregrine falcons nested on the roof of the auxiliary building several years ago. Exelon (2014a) personnel have not observed peregrine falcon nesting in recent years, but personnel occasionally observe peregrines in flight on the site. The FES-O (NRC 1978) notes the observance of a single peregrine falcon in November 1972 in an offsite woodland. Bald Eagles The bald eagle is protected under the Bald and Golden Eagle Protection Act (16 USC 668 et seq.). This Federal act prohibits anyone from taking or disturbing bald eagles or golden eagles (Aquila chrysaetos), including their nests or eggs, without a U.S. Fish and Wildlife
Affected Environment
3-59
Service (FWS)-issued permit. The bald eagle was observed near the LSCS site in April 1972, on the river’s north-facing bluffs (ComEd 1977; NRC 1978). However, Exelon (2014a) is not aware of bald eagle observations at the site in recent years. Migratory Birds The Migratory Bird Treaty Act of 1918, as amended (MBTA) (16 U.S.C. §§ 703 et seq.), is administered by the FWS. The Act prohibits anyone from taking native migratory birds, their eggs, feathers, or nests. The MBTA regulations define “take” to mean to pursue, hunt, shoot, wound, kill, trap, capture, or collect, or any attempt to carry out those actions (50 CFR 10.12). However, take does not include habitat destruction or alteration. All Illinois State-listed species described in Section 3.6.3.2 and listed in Table 3–9 are protected under the MBTA. 3.6.5.2 Important Habitats
Illinois Natural Areas Inventory Sites In its Illinois Natural Areas Inventory (INAI), the IDNR (2014a) identifies 28 LaSalle County sites as Category I (“high quality natural community and natural community restorations”), Category II (“specific suitable habitat for state-listed species or state-listed species relocations”), Category III (“State-dedicated Nature Preserves, Land and Water Reserves, & Natural Heritage Landmarks”), or a combination of the three categories. The 2013 EcoCAT report (contained in Appendix D of the applicant’s ER (Exelon 2014a)) indicates that one of these sites with terrestrial habitat lies near the LSCS site: Marseilles Hill Prairie. The Marseilles Hill Prairie (INAI Site No. 1520) lies 3 mi (4.8 km) north of the LSCS main site boundary (Exelon 2015o). It is 39.71 ac (16.07 ha) in size and managed by the IDNR (2014a) to conserve prairie habitat. The IDNR (2014a) designates this INAI site as Category I. State Parks and Wildlife Areas The IDNR manages three areas for State parks or wildlife areas within 10 km (6 mi) of LSCS: LaSalle Lake State Fish & Wildlife Area, Marseilles State Fish & Wildlife Area, and Illini State Park. The LaSalle Lake State Fish & Wildlife Area comprises the portion of the LSCS cooling pond that is managed by the IDNR and open to the public for fishing and other recreational purposes (Exelon 2014a). The Marseilles State Fish & Wildlife Area is open to seasonal hunting of turkey (Meleagris gallopavo), pheasant, quail, dove, deer, rabbit, squirrel, and coyote (IDNR 2015e). Illini State Park provides habitat for a number deciduous trees, including hickory, ash (Fraxinus spp.), walnut (Juglans spp.), elm, cottonwood (Populus deltoids), oak, and maple, as well as white-tailed deer, eastern gray squirrels, opossums, beavers, raccoon, groundhogs, and a variety of waterfowl and songbirds (IDNR 2015b). Wetlands The National Wetlands Inventory Wetlands Mapper identifies eight small areas of freshwater emergent wetland and freshwater forested/scrub wetland on the LSCS site near the Illinois River that total about 10 ac (4 ha) (FWS 2015e). Common tree species in the freshwater forested/scrub wetland include American elm, black cherry, white oak, red oak, black oak, shagbark hickory, bitternut hickory (Carya cordiformis), hackberry (Celtis occidentalis), elm, willow (Salix spp.), and sycamore (Platanus occidentalis) (Exelon 2014a). The freshwater emergent wetlands contain cattail (Typha spp.), horsetail (Equisetum spp.), and other herbaceous vegetation (Exelon 2014a). Managed Prairie Habitat In partnership with Pheasants Forever, Inc., Exelon (2014a) actively manages 4 ha (10 ac) of native prairie to the west of the cooling pond.

Affected Environment
3-60
3.6.6 Invasive and Non-Native Species
The invasive common reed inhabits parts of the cooling pond, particularly along the pond’s western edge. In 2007, as part of its Wildlife at Work program, Exelon (2014a) began an effort to eradicate the species through mechanical harvesting and application of aquatic-safe herbicides.
3.7 Aquatic Resources
The aquatic communities of interest for the LSCS site occur in the Illinois River and in the site’s artificial cooling pond. The Illinois River lies 5 mi (8 km) north of the site. It supplies makeup water to LSCS’s cooling system and receives cooling system blowdown. The cooling pond is the site’s main source of cooling water and is the plant’s UHS. Section 3.1.3 describes the cooling system in detail, and Section 3.5.1 describes the surface water characteristics of the Illinois River and the cooling pond. The sections below describe the two main aquatic ecosystems at the LSCS site, the Illinois River and the LSCS cooling pond (see Sections 3.7.1 and 3.7.2, respectively). In addition, Section 3.7.3 describes State-listed species and important habitats and Section 3.7.4 describes non-native species.
3.7.1 Illinois River
The Illinois River begins southwest of Chicago, at the confluence of the Des Plaines and Kankakee Rivers. It flows south until it reaches the Mississippi River north of St. Louis, Missouri. The total length of the Illinois River is approximately 322 mi (518 km) (IDNR 2011a). The Illinois River’s watershed drains a total of 29,010 mi2 (75,136 km2) from Illinois, Wisconsin, and Indiana (IDNR 2011a). Major tributaries include the Des Plaines, Fox, Kankakee, Vermilion, Mackinaw, Sangamon, Spoon, and La Moine rivers. Prior to the 1800s, the Illinois River Basin was comprised of prairie savannas and oak-hickory forests. The river provided diverse aquatic habitats including backwater lakes, side channels, and a narrow main channel (USGS 1999a). The rapid expansion of agricultural activities throughout the 1800s and early 1900s converted wet and mesic (relatively well drained) floodplain prairies to crop lands. This land use conversion resulted in increased erosion, sediment loading, and nutrient and herbicide transport to the Illinois River. Beginning in the 1900s, several efforts occurred to divert water from Lake Michigan and construct navigation dams or levees to increase the navigability of the Illinois River to the Mississippi River and provide a navigable passage from Chicago (Lake Michigan) to the Gulf of Mexico (USGS 1999a). As the population in Chicago continued to grow, sewage disposal and toxic waste disposal further contributed to the degradation of aquatic habitat in the Illinois River (Parker 2014). By the 1960s, the biodiversity of fish within the upper Illinois River was low and freshwater mussels were nearly absent (Sietman et al. 2001). Pollution tolerant, non-native common carp (Cyprinus carpio) and goldfish (Carassius auratus) dominated fish populations (Parker 2014). Since the passage of the CWA in 1974, water quality within the Illinois River has improved and more diverse fish assemblages inhabit the upper Illinois River (Parker 2014). Similarly, freshwater mussels have recolonized portions of the upper Illinois River since the 1980s (Sietman et al. 2001). Currently, a series of locks and dams along the Illinois River continue to limit habitat connectivity and fish passage along the Illinois River. Four of the locks and dams (Thomas J. O’Brien, Lockport, Brandon Road, and Dresden Island) are upstream of LSCS and four (Marseilles, Starved Rock, Peoria, and LaGrange) are downstream (USACE 1998). The closest locks and

Affected Environment
3-61
dams to LSCS include the Dresden Island Lock and Dam, 22 mi (26 km) upstream of the LSCS intake, the Marseilles Dam, 2.4 mi (3.5 km) downstream of the LSCS discharge, and the Marseilles Lock, 4.9 mi (7.9 km) downstream of the LSCS discharge (USACE 1998, 2014; Exelon 2015c). In 2005, IEPA most recently classified the water quality within the Illinois River as “fair,” which means that the water quality has been impaired, and the water body meets the needs of a designated use most of the time (IDNR 2011a). Current factors that continue to contribute to the degradation of the Illinois River include the increase in invasive fish, accumulated sediments, continued sedimentation, and agricultural chemical runoff (USGS 1999a; Parker et al. 2005). 3.7.1.1 Aquatic Communities in the Illinois River
Plankton Plankton are small organisms that float or drift in rivers and other water bodies. Plankton is a primary food source for many fish, and other animals, and consists of bacteria, protozoans, certain algae, tiny crustaceans such as copepods, and many other organisms. ComEd, the previous owner of LSCS, conducted surveys for plankton within the Illinois River both upstream and downstream of the LSCS discharge and river intake structures. ComEd initially sampled plankton prior to operations, from August 1972 through January 1973, and again during construction, from February 1974 through November 1976. These studies are summarized in the Final Environmental Statement for Operations of LSCS (NRC 1978). Phytoplankton. Phytoplankton are microscopic floating photosynthetic organisms that form one base of aquatic food webs by producing biomass from inorganic compounds and sunlight. As primary producers, phytoplankton play key ecosystem roles in the distribution, transfer, and recycling of nutrients and minerals. Diatoms were the most abundant phytoplankton in the Illinois River near LSCS in the 1970s, and reached peak densities in August (NRC 1978). The most common diatom genera included Cyclotella, Melosira, and Stephanodiscus. The NRC staff noted that many of the diatoms collected in preoperational studies were pollution tolerant (NRC 1978). Other phytoplankton followed similar trends with primary production peaking in August and dipping in winter months. The NRC staff is not aware of any additional phytoplankton surveys that have been conducted in the vicinity of LSCS since the plant began operating in 1982 for Unit 1 and 1984 for Unit 2. Periphyton. Periphyton includes a mixture of algae, cyanobacteria (in the past often called “blue-green algae”), heterotrophic microbes, other small organisms, and detritus that attach to submerged surfaces. Like phytoplankton, periphyton are primary producers and provide a source of nutrients to many bottom-feeding organisms. During ComEd’s initial study prior to construction, diatom densities upstream of the LSCS discharge and intake areas accounted for 75 percent of the total periphyton density in August 1972 and 100 percent in January 1973. The next dominant taxa was green algae, which accounted for 7 percent of the total periphyton density in 1972 and none of the total periphyton density in 1973. Downstream of the LSCS discharge and intake, diatom densities accounted for 94 percent of the total periphyton density in August 1972 and 92 percent in January 1973, while the green algae accounted for 1 percent in 1972 and none in 1973 (NRC 1978). Diatoms were the dominant periphyton group during the warmer months (May, August, and November), whereas green algae was dominant during February from 1974 to 1976 (NRC 1978). Dominant diatom genera included Cyclotella, Navicula, and Nitzschia; dominant green algae genera included Stigeoclonium, Cladophora, Rhizoclonium, and Ulothrix (NRC 1978).
Affected Environment
3-62
The NRC staff is not aware of any additional periphyton surveys that have been conducted in the vicinity of LSCS since the plant began operating in 1982 for Unit 1 and 1984 for Unit 2. Zooplankton. Zooplankton are small animals that float, drift, or weakly swim in the water column and include ichthyoplankton (fish eggs and larvae) with no or limited swimming ability and larvae of benthic invertebrates. Zooplankton are important trophic links between primary producers (e.g., phytoplankton and periphyton) and carnivores (e.g., fish). During preoperational studies, copepods and rotifers dominated zooplankton samples both prior to and during construction (NRC 1978). Dominant copepod genera included Cyclops and Eucyclops, and dominant rotifer genera included Asplanchna, Brachionus, Filinia, Notholca, Polyarthra, and Synchaeta (NRC 1978). Peak densities for both copepods and rotifers generally occurred in August, and minimum densities generally occurred in February. In 2014, EA Engineering, Science, and Technology, Inc. (EA) (2015) collected icthyoplankton samples in front of the LSCS river intake as part of an entrainment study. EA (2015) collected samples using 0.5-m (1.6-ft) conical plankton nets with 505-µm mesh suspended from the forebay bridge in front of the river intake (see Figure 3–15). EA (2015) collected samples during the 2014 spawning season, from late April through August, when icthyoplankton densities would likely be highest.
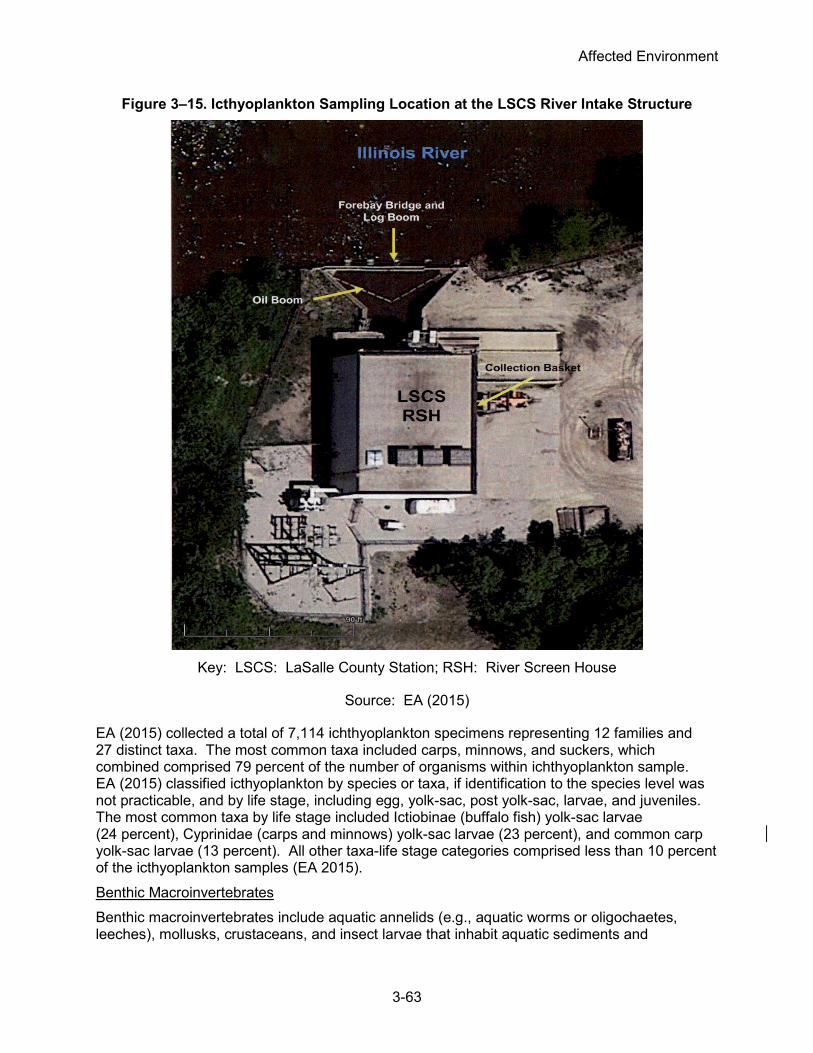
Affected Environment
3-63
Figure 3–15. Icthyoplankton Sampling Location at the LSCS River Intake Structure
Key: LSCS: LaSalle County Station; RSH: River Screen House
Source: EA (2015)
EA (2015) collected a total of 7,114 ichthyoplankton specimens representing 12 families and 27 distinct taxa. The most common taxa included carps, minnows, and suckers, which combined comprised 79 percent of the number of organisms within ichthyoplankton sample. EA (2015) classified icthyoplankton by species or taxa, if identification to the species level was not practicable, and by life stage, including egg, yolk-sac, post yolk-sac, larvae, and juveniles. The most common taxa by life stage included Ictiobinae (buffalo fish) yolk-sac larvae (24 percent), Cyprinidae (carps and minnows) yolk-sac larvae (23 percent), and common carp yolk-sac larvae (13 percent). All other taxa-life stage categories comprised less than 10 percent of the icthyoplankton samples (EA 2015). Benthic Macroinvertebrates Benthic macroinvertebrates include aquatic annelids (e.g., aquatic worms or oligochaetes, leeches), mollusks, crustaceans, and insect larvae that inhabit aquatic sediments and

Affected Environment
3-64
submerged surfaces. They accelerate detrital decomposition and nutrient cycling, and serve as a food source for fish and other aquatic biota. ComEd, Exelon, and their contractors sampled benthic invertebrates during three time periods: preoperational studies from February through November, 1972 through 1976 (as summarized in NRC 1978); a 1999 study in response to low flow and high air temperatures (EA 2000); and a 2013 study in preparation for Exelon’s license renewal application (EA 2014). During the preoperational and the 2013 study, ComEd and Exelon sampled benthic macroinvertebrates at one location upstream of the river intake and blowdown discharge (location 1), at one location immediately downstream of the blowdown discharge (location 2), and at two locations further downstream of the blowdown discharge (locations 3 and 4) (Figure 3–16). ComEd and Exelon sampled each location with a Hester-Dendy artificial substrate sampler and a Ponar grab sampler (NRC 1978; EA 2014). In 1999, Exelon also collected benthos using a Ponar grab at one site upstream and one site downstream of the blowdown discharge, similar to the sampling sites for the preoperational and 2013 study. In addition, EA collected benthos using a Ponar grab at a second downstream site that was further downstream than South Kickapoo Creek (EA 2000).
Figure 3–16. Sampling Locations in LSCS Aquatic Surveys
Source: EA 2014
Collections during preoperational studies resulted in the identification of 143 taxa (NRC 1978). Chironomidae and Oligochaeta were the most dominant groups. The most common oligochaete genera were Limnodrilus and Nais. The most abundant chironomid genera included Cryptochironomous, Dicrotendipes, Procladius, Cricotopus, and Orthocladius. EA (2000) collected a total of 34 taxa from Ponar grab samples. Chironomidae and Oligochaeta were the most taxa-rich groups, with 12 taxa each. EA (2000) determined that the dominant taxa at all sampling sites are considered tolerant to poor water quality. Both total richness and the number of Ephemeroptera, Plecoptera, and Trichoptera species, which are considered

Affected Environment
3-65
intolerant of environmental stress, were slightly higher downstream (locations 2 and 4) compared to upstream (location 1) of the intake and discharge structures. EA (2014) collected a total of 61 taxa from the Hester-Dendy artificial substrate collections. Chironomidae was the most taxa rich group with 21 taxa followed by Ephemeroptera and Bivalvia, with 8 taxa each. The dominant taxa from the Hester-Dendy collections included the following insect larvae: Dicrotendipes modestus (a non-biting midge), Maccaffertium integrum (a mayfly), Cyrnellus fraternus (a caddisfly), and Dicrotendipes neomodestus. Among the 10 most dominant taxa for the Hester-Dendy artificial substrate samples, only one taxon is considered tolerant of environmental degradation, Glyptotendipes (IEPA 1987; EA 2014). The remaining taxa are considered facultative to slightly intolerant to poor water quality (IEPA 1987; EA 2014). For the Ponar grab samples, Chironomidae was the most taxa rich group with 15 taxa, followed by 8 Bivalvia and 4 Ephemeroptera taxa. EA (2014) observed the highest taxa richness at locations 1 and 3 (20 to 29 taxa) as compared to locations 2 and 4 (16 to 27 taxa). Species richness among pollution sensitive Ephemeroptera, Plecoptera, and Trichoptera was similar among all locations, ranging from three to five taxa (EA 2014). At all sampling sites, EA (2014) observed dominant taxa that were relatively tolerant to poor water quality as well as dominant taxa that were relatively intolerant or facultative to poor water quality. Fish ComEd, Exelon, and their contractors sampled fish near LSCS during three time periods: preoperational studies from May through November, 1972 through 1976 (as summarized in NRC 1978); a post-operational study in response to low flow and high air temperatures in July through October, 1999 (EA 2000); and a post-operational study in August 2013 in preparation for Exelon’s license renewal application (EA 2014). During both the preoperational and 2013 study, Exelon sampled fish at one location upstream of the river intake and blowdown discharge (location 1) and at two locations downstream of the blowdown discharge (locations 2 and 5), one of which was South Kickapoo Creek (Figure 3–16). Exelon sampled fish at each sampling site by electrofishing in a downstream direction for 500 m (1,640 ft). In addition, Exelon seined for fish along the shoreline at all three locations using a 25-ft (8-m) long by 6-ft (2-m) deep seine with 0.19- in. (0.48-cm) mesh. Exelon hauled the seine along 15 m (49 ft) of shoreline in a downstream direction. In 1999, EA also electrofished at one site upstream and one site downstream of the blowdown discharge, similar to the sampling sites for the preoperational and 2013 study. In addition, EA electrofished at second downstream site that was further downstream than South Kickapoo Creek (EA 2000). All three studies looked for external parasites or other abnormalities. EA (2000 and 2014) specifically examined all fish for external DELT (deformities, erosions, lesions, or tumors) anomalies. During the preoperational monitoring period, NRC (1978) determined that the most dominant species included emerald shiner (Notropis atherinoides), gizzard shad (Dorosoma cepedianum), common carp, green sunfish (Lepomis cyanellus), bluntnose minnow (Pimephales notatus), and white sucker (Catostomus commersonii) (see Table 3–10). Prior to operations, downstream collection stations generally had lower species abundance and higher species diversity than upstream stations (NRC 1978). The NRC (1978) concluded that the low species abundance and diversity, low condition factors, and the degree of external parasitism and physical damage of the fishes in this area of the Illinois River were indicative of a poor quality aquatic environment. Barge traffic, habitat alteration, and heavy pollution loads contributed significantly

Affected Environment
3-66
to the poor water quality in the Illinois River near LSCS, which primarily supported populations of pollution-tolerant fish in the 1970s (NRC 1978). During the 1999 survey, EA (2000) collected 27 species and 1 hybrid for a total of 960 fish. The most commonly collected fish species included gizzard shad (24 percent), smallmouth buffalo (Ictiobus bubalus) (12 percent), spotfin shiner (Cyprinella spiloptera) (10 percent), green sunfish (9 percent) and bluegill (Lepomis macrochirus) (8 percent) (Table 3–10). EA (2000) observed a total of 63 fish (6.6 percent of the catch) with DELT anomalies. Channel catfish (Ictalurus punctatus), freshwater drum (Aplodinotus grunniens), and common carp exhibited the highest DELT affliction rates (greater than 20 percent). The most common DELT anomalies included fin erosion (52 percent) and deformities (38 percent). During the 2013 study, EA (2014) collected 12 fish species for a total of 1,295 fish. The most commonly collected species during electrofishing included gizzard shad (48 percent), spotfin shiner (16.5 percent), smallmouth buffalo (6 percent), golden redhorse (Moxostoma erythrurum) (5 percent), smallmouth bass (Micropterus dolomieu) (4 percent), and freshwater drum (4 percent; EA 2014) (Table 3–10). Gizzard shad dominated samples both upstream and downstream of the intake and discharge (EA 2014). The most commonly collected species during seining surveys included emerald shiner (83 percent), spotfin shiner (9.5 percent), bluntnose minnow (2 percent), and sand shiner (Notropis stramineus) (2 percent) (EA 2014) (Table 3–10). Emerald shiner dominated samples both upstream and downstream of the intake and discharge (EA 2014). EA (2014) observed DELT anomalies on 2 of the 1,295 fish collected (0.2 percent), both of which were eroded fins on freshwater drum. EA (2014) did not observe any external parasites or other abnormalities.
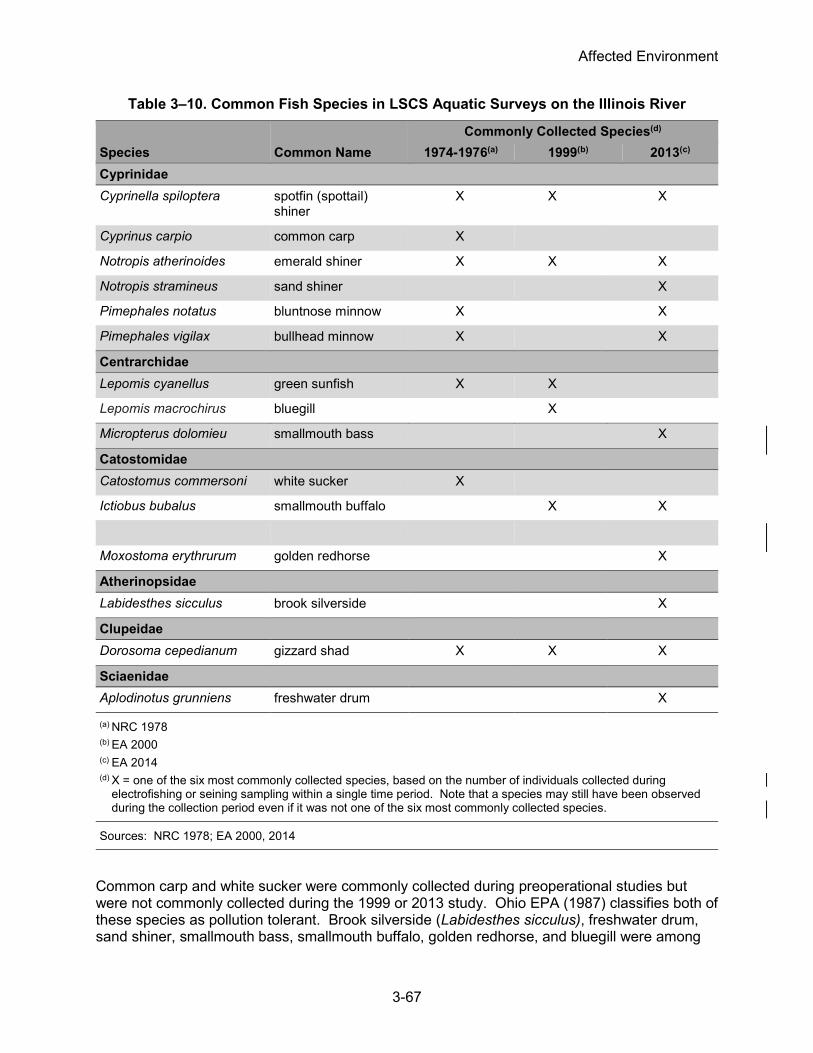
Affected Environment
3-67
Table 3–10. Common Fish Species in LSCS Aquatic Surveys on the Illinois River
Species Common Name Commonly Collected Species(d)
1974-1976(a) 1999(b) 2013(c) Cyprinidae Cyprinella spiloptera spotfin (spottail)
shiner X X X
Cyprinus carpio common carp X
Notropis atherinoides emerald shiner X X X
Notropis stramineus sand shiner X
Pimephales notatus bluntnose minnow X X
Pimephales vigilax bullhead minnow X X
Centrarchidae Lepomis cyanellus green sunfish X X
Lepomis macrochirus bluegill X
Micropterus dolomieu smallmouth bass X
Catostomidae Catostomus commersoni white sucker X
Ictiobus bubalus smallmouth buffalo X X
Moxostoma erythrurum golden redhorse X
Atherinopsidae Labidesthes sicculus brook silverside X
Clupeidae Dorosoma cepedianum gizzard shad X X X
Sciaenidae Aplodinotus grunniens freshwater drum X
(a) NRC 1978 (b) EA 2000 (c) EA 2014 (d) X = one of the six most commonly collected species, based on the number of individuals collected during
electrofishing or seining sampling within a single time period. Note that a species may still have been observed during the collection period even if it was not one of the six most commonly collected species.
Sources: NRC 1978; EA 2000, 2014
Common carp and white sucker were commonly collected during preoperational studies but were not commonly collected during the 1999 or 2013 study. Ohio EPA (1987) classifies both of these species as pollution tolerant. Brook silverside (Labidesthes sicculus), freshwater drum, sand shiner, smallmouth bass, smallmouth buffalo, golden redhorse, and bluegill were among

Affected Environment
3-68
the commonly collected species in the 1999 or 2013 studies but were not commonly collected in the preoperational studies. Five of these seven species (brook silverside, sand shiner, smallmouth bass, golden redhorse, and bluegill) are native species that are sensitive to declines in water quality or habitat degradation (Lerczak 1996; Smith 2002). These results are consistent with other fish surveys (Lerczak 1996; McClelland et al. 2012) within the upper Illinois River that since the mid-1950s through 1990s and the 2000s, show a decline in fish species that are tolerant of poor water quality and an increase in fish species that are sensitive to habitat degradation. For example, Lerczak (1996) examined fish population data from the Illinois Natural History Survey (INHS), which began monitoring fish populations in the Illinois River in 1957. Since 1957, INHS conducted annual electrofishing surveys at set locations throughout the entire Illinois River, including sampling locations approximately 1 RM downstream of the LSCS river intake, within the vicinity of the LSCS river intake, and 11 RM upstream of the LSCS river intake. Within the upper 50 mi (80 km) of the Illinois River, which includes LSCS, Lerczak (1996) concluded that common carp, which is pollution tolerant, has become less common while bluegill, which is intolerant to degraded habitats, has become more common. For example, in the 1960s, INHS captured an average of 35 common carp per hour as compared to 6 common carp per hour in the 1990s. Bluegill increased from averages of less than 1 per hour in the 1960s to 12 per hour in the 1990s. Lerczak (1996) also noted that in the 1990s, fish communities were more evenly distributed among a greater number of species than in the 1960s. For example, in 1962 and 1963, four species comprised 95 percent of all catches: gizzard shad, emerald shiner, common carp, and goldfish—a species with pollution tolerance similar to common carp. In 1995, 10 species comprised 95 percent of all catches including several species that are sensitive to habitat degradation, such as the bluegill, largemouth bass (Micropterus salmoides), and several species of small minnows. McClelland et al. (2012) also examined fish populations during three time periods from 1957 through 2009 based on INHS data. Table 3–11 describes the species that contributed to approximately 90 percent of all electrofishing catches in the Illinois River (McClelland et al. 2012). The NRC staff further classified fish as either pollution tolerant or intolerant. In addition, the NRC staff determined whether McClelland reported increases or decreases in the relative abundance of each species over time. The NRC staff notes that these general trends were not assessed using regression analyses or other statistical analyses. The most common species during the 1957 through 1969 surveys (common carp, gizzard shad, emerald shiner, and goldfish) are considered pollution tolerant species and the relative abundance of these species has generally declined over time. All pollution intolerant species listed in Table 3–11 have generally increased over time. These data suggest that water quality within the Illinois River has improved over time, allowing species that are pollution sensitive to increase in relative abundance.
Table 3–11. Fish Species Comprising 90 Percent of Catch in the Illinois Natural History Electrofishing Surveys from 1957 through 2009
Species(a) Common Name 1957–1969 1970–1989 1990–2009 Trend(c) Pollution Tolerant Species(b) Percent of Catch Cyprinus carpio common carp 24.9 16.4 7.6 ↓ Dorosoma cepedianum gizzard shad 20.4 23.0 16.2 ↓ Notropis atherinoides emerald shiner 19.3 10.7 10.6 ↓ Carassius auratus goldfish 6.6 2.2 - ↓ Cyprinus carpio x Carassius auratus
common carp x goldfish 3.0 - - ↓

Affected Environment
3-69
Species(a) Common Name 1957–1969 1970–1989 1990–2009 Trend(c) Lepomis cyanellus green sunfish 2.4 6.3 5.3 ↑ Ictiobus cyprinellus bigmouth buffalo 1.8 1.8 1.3 ↓ Ameiurus melas black bullhead 1.4 - - ↓ Pimephales vigilax bullhead minnow - - 2.9 ↑ Pimephales notatus bluntnose minnow - - 2.3 ↑ Lepomis humilis orangespotted sunfish - - 1.2 ↑ Aplodinotus grunniens freshwater drum - 3.8 4.8 ↑ Pollution Intolerant Species(b) Percent of Catch Lepomis macrochirus bluegill 2.8 6.2 13.1 ↑ Micropterus salmoides largemouth bass 2.2 5.1 6.4 ↑ Pomoxis nigromaculatus black crappie 1.8 4.2 2.9 ↑ Ictalurus punctatus channel catfish - 3.5 5.6 ↑ Morone chrysops white bass - 2.9 2.8 ↑ Micropterus dolomieu smallmouth bass - - 1.4 ↑
Notes: (-) = Fish species not part of 90 percent of the catch during specified time period (a) Species ordered by decreasing relative abundance based on McClelland et al 2012; species contributed to
approximately 90 percent of all electrofishing catches in the Illinois River and could be classified as either pollution tolerant or intolerant.
(b) Ohio EPA 1987; Osmond et al. 1995; Lerczak 1996; Smith 2002; Maryland DNR 2015; Mississippi DNR 2015. (c) Inclines or declines in the relative abundance of each species are general trends; the NRC staff did not evaluate
these trends using regression analyses or other statistical analyses.
Sources: Ohio EPA 1987; Osmond et al. 1995; Lerczak 1996; Smith 2002; Maryland DNR 2015; Mississippi DNR 2015; McClelland et al. 2012
3.7.2 LSCS Cooling Pond
As described in Section 3.5, the 2,058-ac (833-ha) cooling pond was created in 1978 by pumping water from the Illinois River into the excavated pond. Exelon leases a large portion of the LSCS cooling pond to the IDNR, which maintains the leased portion of the LSCS cooling pond as an outdoor recreation area for public use and fishing. IDNR has actively managed fish populations in the LSCS cooling pond since 1984 (Exelon 2014a). For example, IDNR surveys the cooling pond each year and determines which fish to stock based on fishermen preferences, fish abundance, different species’ tolerance to warm waters, predator and prey dynamics, and other factors (Exelon 2002, 2014a, 2015c). The cooling pond can be characterized as a highly managed ecosystem in which IDNR fish stocking and other human activities primarily influence the species composition and population dynamics. 3.7.2.1 Aquatic Community in the Cooling Pond
IDNR stocks the LSCS cooling pond each year. In 1981, IDNR’s fish hatchery located adjacent to the cooling pond started operations (EA 2002). IDNR assumed management of the hatchery in 1984. Initially, IDNR stocked the LSCS cooling pond with largemouth bass and bluegill (EA 2002). Currently, commonly stocked species include largemouth bass, smallmouth bass, black crappie (Pomoxis nigromaculatus), white crappie (Pomoxis annularis), channel catfish, blue catfish

Affected Environment
3-70
(Ictalurus furcatus), striped bass hybrid (Morone saxatilis x M. chrysops), walleye (Sander vitreus), and bluegill (See Table 3–12; Exelon 2002 and 2015c). Because of the high water temperatures experienced in the summer months, introductions of warm-water species, such as largemouth bass and blue catfish, have been more successful than introductions of cool-water species, such as walleye and muskellunge. In addition to the stocked species, gizzard shad and threadfin shad (Dorosoma petenense)—together called “shad”—also occur in the cooling pond. Shad are not recreationally fished, and IDNR does not currently stock these fish. IDNR stocks some recreationally fished species that consume shad (e.g., catfish and striped bass) in part to limit the size of shad populations (Exelon 2002).
Table 3–12. Fish Stockings in the LSCS Cooling Pond 2008-2014
Species(a) Common Name 2008 2009 2010 2011 2012 2013 2014
Annual Average Percent
Lepomis macrochirus
bluegill 55,466 11,740 84,661 364,731 73,681 25,031 100,130 102,206 40%
Micropterus salmoides
largemouth bass
66,395 51,207 50,434 30,470 84,166 48,753 2,660 47,726 19%
Morone saxatilis hybrid
striped bass hybrid
80,889 68,404 41,284 52,642 0 20,580 26,047 48,308 19%
Ictalurus furcatus
blue catfish 18,560 34,452 19,800 23,368 0 0 18,200 22,876 9%
Micropterus dolomieu
smallmouth bass
25,365 21,155 21,118 22,733 20,683 22,354 20,582 21,999 9%
Lepomis microlophus
redear sunfish
34,151 0 4,830 4,830 0 0 0 14,604 6%
(a) Species are ordered by relative abundance (highest to lowest).
Sources: Exelon 2014a; IDNR and Exelon 2014; Exelon 2015c
3.7.2.2 Cooling Pond Fish Kill Events
LSCS has had four reportable fish kills in the cooling pond since 2001, including fish kills in July 2001, June 2005, June 2009, and August 2010 (Exelon 2014a, 2015c). The temperature in the cooling pond during these events ranged from 93 °F (33.9 °C) to 101°F (38.3 °C) (Exelon 2001, 2009, 2010). In addition, several smaller non-reportable fish kills have occurred when the cooling pond was 95 °F (35 °C) or above (Exelon 2015c). Exelon attributes these fish kills to high cooling pond temperatures as a result of high summer temperatures combined with low winds and high humidity, as described below (Exelon 2001, 2009, 2010). The largest fish kill occurred in July 2001 when IDNR reported approximately 94,500 dead fish due to high temperatures that peaked at 98.2 °F (36.9 °C) (Exelon 2001). IDNR found the maximum temperature in the cooling pond discharge canal to be 120 °F (48.9 °C) and dissolved oxygen levels to range from 6.2 to 18.8 parts per million. The majority of dead fish (96 percent) were gizzard shad (90,800) (Exelon 2001). IDNR identified other dead fish to include 1,279 carp, 1,143 smallmouth buffalo, 610 freshwater drum, 345 channel catfish, 238 striped bass hybrid, 93 smallmouth bass, 24 walleye, 13 bluegill, 12 white bass (Morone chrysops),

Affected Environment
3-71
6 yellow bullhead catfish (Ameiurus natalis), and 4 yellow bass (M. mississippiensis) (Exelon 2001). In a June 2005 fish kill, IDNR counted 1,515 dead fish, including 1,439 striped bass hybrids (95 percent), 36 smallmouth bass (2 percent), 20 walleye (1 percent),11 channel catfish (less than 1 percent), 4 blue catfish (less than 1 percent), 3 yellow bass (less than 1 percent), and 2 sauger (less than 1 percent) (Exelon 2015c). The LSCS cooling pond peaked at 95 °F (35 °C) during the fish kill (Exelon 2015c). In the June 2009 fish kill, 3,000 to 4,000 gizzard shad comprised 99 percent of the dead fish (Exelon 2009). Exelon (2009) also observed 26 smallmouth bass, 4 striped bass, and 4 walleye. Immediately prior to and during the fish kill, the LSCS cooling pond increased 10 °F from 83 °F (28 °C) on June 20 to 93 °F (34 °C) on June 23. In the August 2010 fish kill, IDNR concluded that over 90 percent of the dead fish were small threadfin and gizzard shad less than 3 in. (8 cm) long (Exelon 2010). IDNR also observed dead carp, striped bass hybrids, walleye, and smallmouth bass (Exelon 2010). The LSCS cooling pond peaked at 101.3 °F (38.5 °C) the day before the fish kill.
3.7.3 Important Species and Habitats
3.7.3.1 State-Listed Species
IDNR lists 35 fish and 26 mussel species as State-endangered or threatened (IDNR 2015a). Of these, IDNR (2014b) indicates that 7 species (5 fish, 2 mussels) occur in LaSalle County (see Table 3–13).
Table 3–13. State-Listed Aquatic Species with the Potential To Occur in LaSalle County
Recorded Occurrences Near LSCS
Species Common Name State Status(a) Preo
pera
tiona
l St
udie
s (b
)
Star
ved
Roc
k or
M
arse
illes
Poo
l(c)
LSC
S R
iver
Inta
ke(d
)
Fish Fundulus diaphanous banded killifish ST x x Moxostoma carinatum river redhorse ST Moxostoma valenciennesi greater redhorse SE Notropis heterolepis blacknose shiner SE Notropis texanus weed shiner SE Mussels Alasmidonta viridis slippershell ST Elliptio dilatata spike ST

Affected Environment
3-72
Recorded Occurrences Near LSCS
Species Common Name State Status(a) Preo
pera
tiona
l St
udie
s (b
)
Star
ved
Roc
k or
M
arse
illes
Poo
l(c)
LSC
S R
iver
Inta
ke(d
)
(a) SE = State-endangered in Illinois; ST = State-threatened in Illinois (b) NRC 1978 (c) McClelland and Sass 2007; Fritts 2013 (d) EA 2014, 2015; Exelon 2015c, 2015p
Sources: NRC 1978; IDNR 2014b; McClelland and Sass 2007; Fritts 2013; EA 2014, 2015; Exelon 2014a, 2015c
Banded killifish. Banded killifish occur in clear glacial lakes, streams, or tributaries, often near vegetation (Nyboer et al. 2006). This fish forms small schools near the surface of weedy lakes (Nyboer et al. 2006). In recent years, this species has been documented in the Illinois River (McClelland and Sass 2007; McClelland et al. 2012). In 2006, the INHS collected two banded killifish at RM 241.5 in the Starved Rock Pool sampling area, approximately 8 RM (13 Rkm) downstream of the LSCS river intake (McClelland and Sass 2007). However, from 1993 through 2012, the INHS did not observe banded killifish in the Marseilles Pool sampling area, which included sampling locations approximately 1 RM (1.6 Rkm) downstream of the LSCS river intake, within the vicinity of the LSCS river intake, and 11 RM (18 Rkm) upstream of the LSCS river intake (Fritts 2013). In 2014, EA (2015) collected a juvenile banded killifish during an impingement and entrainment study at the LSCS river intake. In response to this collection, EA Engineering submitted a scientific collectors report to IDNR on March 9, 2016 (EA 2016; NRC 2016a). This species was not collected during preoperational surveys (NRC 1978) or during operational studies in 1999 and 2013 (EA 2000, 2014). River Redhorse. The river redhorse inhabits large river systems, including impoundments and pools, in areas of moderate to swift current and clean gravel substrate (NatureServe 2014a). Barbour et al. (1999) classify this species as an insectivore that is intolerant of pollution and other environmental stressors. INHS electrofishing surveys that began in 1957 have documented this species in the Illinois River (McClelland and Sass 2007). However, from 1993 through 2012, INHS did not observe river redhorse in the Marseilles Pool sampling area, which included sampling locations approximately 1 RM (1.6 RKm) downstream of the LSCS river intake, within the vicinity of the LSCS river intake, and 11 RM (18 RKm) upstream of the LSCS river intake (Fritts 2013). The river redhorse was not collected during preoperational surveys (NRC 1978) or operational surveys in 1999 and 2013 (EA 2000, 2014). From 2013 through 2015, EA (2015) conducted an impingement and entrainment study near the LSCS river intake. Although EA (2015) collected several Moxostoma fish that were not identified to species, EA (2015) concluded that these species were most likely the more common Moxostoma spp., such as shorthead, golden, silver, and black redhorse, given that these common species were conclusively identified during the study.

Affected Environment
3-73
Greater Redhorse. The greater redhorse inhabits lakes and large rivers with sandy to rocky pools (Nyboer et al. 2006). This fish was considered extirpated in Illinois until it was observed in the upper Illinois River basin in 1985 (Nyboer et al. 2006). IDNR (2014b) recorded three observations of this species in LaSalle County, most recently in July 2004. This species is rare in the Illinois River, and INHS did not observe this species from 1957 through 2006 at any sampling station in the Illinois River (McClelland and Sass 2007). This species was not collected during preoperational surveys (NRC 1978), operational studies in 1999 and 2013 (EA 2000, 2014), nor in INHS electrofishing surveys in the Marseilles Pool sampling area from 1993 through 2012 (Fritts 2013). From 2013 through 2015, EA (2015) conducted an impingement and entrainment study near the LSCS river intake. Although EA (2015) collected several Moxostoma fish that were not identified to species, EA (2015) concluded that these species were most likely the more common Moxostoma spp., such as shorthead, golden, silver, and black redhorse given that these common species were conclusively identified during the study. Blacknose shiner. The blacknose shiner inhabits clear vegetated lakes, and pools and runs of clear streams (Nyboer et al. 2006). Increased turbidity and decreases in aquatic vegetation have contributed to the decline of this species (Nyboer et al. 2006). IDNR (2014b) recorded two observations of this species in LaSalle County, most recently in October 2013. This species is rare in the Illinois River and INHS did not observe this species from 1957 through 2006 at any sampling station in the Illinois River (McClelland and Sass 2007). This species was not collected during preoperational surveys (NRC 1978), operational studies in 1999 and 2013 (EA 2000, 2014), an impingement and entrainment study at the LSCS river intake from 2013 through 2015 (EA 2015), nor in INHS electrofishing surveys in the Marseilles Pool sampling area from 1993 through 2012 (Fritts 2013). Weed shiner. In Illinois, the weed shiner inhabits clear sand-bottom creeks with some submerged vegetation (Nyboer et al. 2006). IDNR (2014b) recorded one observation of this species in LaSalle County, most recently in October 2013. This species is rare in the Illinois River and INHS did not observe this species from 1957 through 2006 at any sampling station in the Illinois River (McClelland and Sass 2007). This species was not collected during preoperational surveys (NRC 1978), operational studies in 1999 and 2013 (EA 2000, 2014), an impingement and entrainment study at the LSCS river intake from 2013 through 2015 (EA 2015), nor in INHS electrofishing surveys in the Marseilles Pool sampling area from 1993 through 2012 (Fritts 2013). Slippershell. The slippershell is a freshwater mussel that inhabits small to medium sized streams where it is usually found buried in sandy substrates in shallow water (Nyboer et al. 2006). IDNR (2014b) recorded five observations of this species in LaSalle County, most recently in October 2013. In 1994, 1995, and 1999, Sietman et al. (2001) conducted freshwater mussel surveys in the Illinois River from RM 232.0 to 271.2 (RKm 373 to 436), including the Starved Rock and Marseilles Pools sampling areas. Sietman et al. (2001) did not collect this species during the surveys. Similarly, this species was not observed in 2013 when IDNR collected 14,850 live mussels, representing 23 species, near the Marseilles Dam after a boating accident (Kanter 2013). This species was not collected during LSCS preoperational surveys (NRC 1978), operational studies in 2013 (EA 2014), or during impingement and entrainment studies at the LSCS river intake from 2013 through 2015 (EA 2015). Spike. The spike is a freshwater mussel that inhabits shoals of medium streams to large rivers, reservoirs, and lakes with sand and gravel substrates (Minnesota DNR 2014). It is distributed throughout the eastern United States, the Mississippi River system, and portions of the Great Lakes (NatureServe 2014b). IDNR (2014b) recorded one observation of this species

Affected Environment
3-74
in LaSalle County in August 2010. This species was not collected during LSCS preoperational surveys (NRC 1978); the freshwater mussel survey from RM 232.0 to 271.2 in 1994, 1995, and 1999 (Sietman et al. 2001); IDNR’s collection of mussels near the Marseilles Dam in 2013 (Kanter 2013); operational studies in 2013 (EA 2014); or during impingement and entrainment studies at the LSCS river intake from 2013 through 2015 (EA 2015). 3.7.3.2 Important Habitats
LaSalle Lake State Fish and Wildlife Area is part of the 2,058 ac (833 ha) cooling pond. As described above in Section 3.7.2, IDNR manages this area for public boating and fishing. The Marseilles State Fish and Wildlife Area occurs approximately 1.5 mi (2.4 km) north of the LSCS site and the makeup and blowdown pipeline corridor right-of-way crosses the eastern portion of the area. The Marseilles State Fish and Wildlife Area is a 1,032-ha (2,550-ac) area managed by IDNR for hunting and wildlife habitat (IDNR 2015d). It is a joint-use area with the Illinois Department of Military Affairs, and periodically used by the Illinois National Guard for training (IDNR 2015d).
3.7.4 Non-Native and Nuisance Species
Several non-native species, including the common carp, goldfish, and Asian carps (Hypophthalmichthys spp.), have been introduced into the Illinois River (McClelland et al. 2012). Common carp and goldfish have been present in the vicinity of LSCS prior to operations (McClelland et al. 2012; Exelon 2014a). Both species dominated non-native fish collections in INHS’s long term monitoring surveys from 1957 and 1985 (McClelland et al. 2012). Common carp and goldfish are tolerant of degraded aquatic habitats and can tolerate low levels of dissolved oxygen and high water turbidity. Beginning in 1985, the number of non-native fish observed in the Illinois River increased (McClelland et al. 2012). Species documented in the Illinois River since 1985 include grass carp (Ctenopharyngodon idella), bighead carp (Hypophthalmycthys nobilis), silver carp (Hypophthalmycthys molitrix), round goby (Neogobius melanostomus), white perch (Morone americana), and the white perch-yellow bass hybrid (M. americana x M. mississippiensis) (McClelland et al. 2012). In addition to fish, Exelon has documented the occurrence of invertebrate non-native and nuisance species near the river intake, the cooling pond intake, and within the cooling system. Bryozoans are aquatic invertebrates that grow into large sessile colonies. Zebra mussels are native to the Black and Caspian Seas, and have invaded Europe and North America. These organisms can cause biofouling of LSCS’s underwater piping systems or water intakes. In 1996, Exelon discovered bryozoans at the cooling pond screen house and removed the colony by using a continuous chlorination treatment. In 2010, Exelon observed the bryozoan Plumatella reticulata in the Unit 1 cooling water system and unidentified bryozoans at the river intake and in the cooling pond (HDR 2011). Within the past 5 years, Exelon has continued to regularly observe bryozoan colonies and zebra mussels at both the river intake and the cooling pond intake, and limits the growth of these organisms by using biocides (HDR 2012, 2013, 2014; Exelon 2014a). When necessary, Exelon also follows procedures to remove zebra mussels manually.
3.8 Federally Protected Species and Habitats
Because NRC’s issuance of a renewed license for power plants is a Federal action, the NRC’s National Environmental Policy Act (NEPA) process considers species and habitats that are protected under Federal acts and possibly affected by license renewal. Federal acts that

Affected Environment
3-75
protect species and habitats possibly affected by the renewal of a nuclear plant license include the Endangered Species Act of 1973, as amended (ESA); the Bald and Golden Eagle Protection Act of 1940, as amended; the Migratory Bird Treaty Act of 1918, as amended; the Magnuson-Stevens Fishery Conservation and Management Act, as amended (MSA); and the Marine Mammal Protection Act of 1972, as amended. Of these, the NRC has direct responsibilities only under the ESA and MSA. No species protected under the MSA, which protects habitat for certain marine and anadromous fish species, occur near LSCS. Species protected under the ESA are discussed in this section, and species protected under other Federal acts where the NRC has no direct responsibilities and under State acts are discussed in Section 3.6 for terrestrial resources and Section 3.7 for aquatic resources. Section 7(a)(2) of the ESA states that each Federal agency shall, in consultation with and with the assistance of the Secretary (Secretary of Commerce or Secretary of the Interior, as appropriate), insure that any action authorized, funded, or carried out by that agency is not likely to jeopardize the continued existence of any listed species or result in the destruction or adverse modification of designated critical habitat. In fulfilling these requirements, each agency is to use the best scientific and commercial data available. Section 7 of the ESA sets out the consultation process, which is further implemented by regulation (50 CFR Part 402). The ESA makes it unlawful for a person to take a listed animal without a permit, where “take” under the ESA is defined as “to harass, harm, pursue, hunt, shoot, wound, kill, trap, capture, or collect, or attempt to engage in any such conduct.” Through regulations, the term “harm” is defined as “an act which actually kills or injures wildlife.” Such an act may include significant habitat modification or degradation where it actually kills or injures wildlife by significantly impairing essential behavioral patterns, including breeding, feeding, or sheltering (50 CFR 17.3). Listed plants are not protected from take, although collecting or maliciously harming them on Federal land is illegal. The FWS and the National Marine Fisheries Service jointly administer the ESA. The FWS manages the protection of and recovery efforts for listed terrestrial and freshwater species, and the National Marine Fisheries Service manages the protection of and recovery efforts for listed marine and anadromous species, of which none occur in the Illinois River near LSCS.
3.8.1 Action Area
The ESA regulations at 50 CFR 402.02 define “action area” to mean all areas to be affected directly or indirectly by the Federal action and not merely the immediate area involved in the action. The action area essentially bounds the analysis of ESA-protected species because species that occur within the action area may be affected by the Federal action, while species that do not occur within the action area would likely not be affected by the Federal action. The NRC staff recognizes that, although the action area is stationary, Federally listed species can move in and out of the action area. For instance, a migratory fish species could occur in the action area periodically and then travel to freshwater streams to spawn. Similarly, a flowering plant known to occur near, but outside of, the action area could appear within the action area over time if its seeds are carried into the action area by wind, water, or animals. Thus, in its analysis, the NRC staff considers not only those species known to occur directly within the action area but also those species that may passively or actively move into the action area. The NRC staff then considers whether the life history of each species makes the species likely to move into the action area where it could be affected by the proposed LSCS license renewal. Depending on habitat requirements, migration patterns, or other biological or physical requirements, different species may require different action areas. The LSCS site occupies about 1,528 ha (3,776 ac) in Marseilles, La Salle County, Illinois (Exelon 2015p), about 8 km (5 mi) south of the Illinois River (Exelon 2014a). A cooling pond on
Affected Environment
3-76
the eastern side of the site accounts for about half of the site area. A 5.6-km (3.5-mi) corridor for the makeup and blowdown pipelines—which travel underground from the Illinois River screen house south to the cooling pond—connects the cooling pond with the Illinois River, from which LSCS withdraws makeup water and discharges blowdown (Exelon 2014a). The intake structure on the Illinois River has bar grills, traveling screens with 3/8 in. (9.5 mm) openings, and no fish return system (Exelon 2014a). For Federally protected terrestrial species, the action area is the site, including the water intake and discharge pipe ROW, and areas immediately around the site that could include natural populations affected by plant operations. Within the action area, Federally listed terrestrial species could experience impacts such as habitat disturbance associated with transmission lines, exposure to radionuclides, and other direct and indirect impacts associated with station, cooling system, and in-scope transmission line operation and maintenance (NRC 2013). For Federally protected aquatic species, the action area is the site and the Illinois River in the area affected by water withdrawal and discharge as well as the range of any species affected by water withdrawal and discharge. The license renewal of nuclear plants action can affect Federally listed aquatic species in several ways, such as impingement or entrainment of individuals into the cooling system, alteration of the riverine environment through water level reductions, changes in dissolved oxygen, gas supersaturation, eutrophication, thermal discharges from cooling system operation, habitat loss or alteration from dredging, and exposure to radionuclides (NRC 2013a).
3.8.2 Federally Protected Species and Habitats Considered
Exelon’s ER (2014a) documents correspondence between Exelon and the FWS about the effects of the proposed LSCS license renewal on Federally listed species. In July 2014, the FWS concurred with Exelon’s March 2014 conclusion that license renewal would not adversely affect any Federally listed species and noted that Exelon should consider an additional species: Northern long-eared bat, a proposed species known to occur in the plant vicinity. In August 2014, Exelon submitted a biological evaluation including the northern long-eared bat, and the FWS concurred with Exelon’s conclusion that license renewal would not affect any Federally listed species. Exelon (2014a, Appendix D) includes copies of this correspondence. In late February 2015, NRC staff filled in an online form for an updated protected species list for LSCS on FWS’s Environmental Conservation Online System, Information for Planning and Conservation. The FWS (2015b) responded with a list of threatened and endangered species that may be affected by the LSCS license renewal. In October 2015, the NRC staff checked the FWS (2015a) online Illinois County distribution of listed species for updates. Exelon (2014a) reports that “no federally listed species have been observed on the LSCS property.” Terrestrial and wildlife studies conducted by Exelon associated with LSCS that may have discovered and reported Federally listed species are described in Section 3.6.2 of this SEIS. Exelon commissioned several aquatic monitoring studies in the past, and none of them reported Federally listed species in the Illinois River near LSCS. EA (2000) reported the results of a 1999 monitoring study at three locations in the Illinois River upstream and downstream of the LSCS intake and discharge in late summer. Fish were sampled by electrofishing and seining and benthic macroinvertebrates by Ponar grab. The physical condition of fish put the study area in the poorest category using Ohio criteria, and a benthic macroinvertebrate (macrobenthos) community indicative of poor conditions was present. No Federally listed threatened or endangered species were observed. EA (2014) reported results of fish and macrobenthos monitoring above and below LSCS in summer 2013 and compared results with past studies. Fish were sampled by electrofishing and

Affected Environment
3-77
seining and benthic macroinvertebrates by Ponar grab, kick net samplers, and artificial substrate samplers. No Federally listed threatened or endangered species were observed. EA (2015) reported results of impingement sampling from April 2014 through March 2015 and entrainment sampling in April through August 2014. No Federally listed fish or shellfish species were observed in entrainment or impingement samples. Table 3–14 shows Federally listed species that may occur in LaSalle County near LSCS and habitat notes. Descriptions of the species follow.
Table 3–14. Federally Listed Species and Designated Habitat in LaSalle County, Illinois
Group Federally Listed Species Common Name
Federal Status(a) Habitat
Mussels Plethobasus cyphyus
sheepnose mussel
E Shallow areas in larger rivers and streams.
Flowering Plants
Boltonia decurrens
decurrent false aster
T Moist, sandy floodplains and prairie wetlands along the Illinois River.
Platanthera leucophaea
eastern prairie fringed orchid
T Mesic prairie, wetlands, sedge meadows, marsh edges, and bogs with full sun and little to no woody encroachment.
Delea foliosa leafy prairie- clover
E Prairie remnants on thin soil over limestone.
Mammals Myotis sodalis Indiana bat E Caves, mines (hibernacula); small stream corridors with well-developed riparian woods; upland forests (foraging).
Myotis septentrionalis
northern long-eared bat
T Hibernates in caves and mines - swarming in surrounding wooded areas in autumn. Roosts and forages in upland forests and woods.
Critical Habitat Myotis sodalis Indiana bat Blackball Mine (a) E=endangered; T=threatened
Sources: FWS 2015b, 2015a
Sheepnose Mussel (Plethobasus cyphyus). The FWS listed the sheepnose mussel (also called just sheepnose) as endangered on March 13, 2012, with an effective date of April 12, 2012, but could not designate critical habitat at that time (77 FR 14914). The sheepnose mussel is a freshwater mussel in the family Unionidae. According to Parmalee and Bogan (1998), adult mussels may reach 11 to 12 cm (4.3 to 4.8 in.) in length. Adult mussels are found partially or completely buried in the substrate. They are suspension feeders and eat bacteria, algae, microscopic animals, and detritus (77 FR 14914). Sheepnose is found in large rivers in gravel or mixed sand and gravel (INHS 2013). Further, in unimpounded rivers, sheepnose mussels can be found in less than 0.6 m (2 ft) of water and in relatively fast currents. In reservoirs, sheepnose mussels occupy depths of 3.6 to 4.6 m (12 to 15 ft) (Parmalee and Bogan 1998), though they have also been reported at depths exceeding 6 m (20 ft) (77 FR 14914). Sheepnose mussels are long-lived and can live nearly 100 to 200 years (FWS 2013b).
Affected Environment
3-78
Like other unionids, sheepnose has an unusual life cycle. After fertilization, the eggs live in special gill chambers of the females and develop into microscopic larvae called glochidia. Females brood the glochidia. When the glochidia are ready, the female expels the glochidia, which then must attach to the host fish’s gills or fins to complete development by enclosing themselves in a cyst (encysting). They drop off the host fish as newly transformed juveniles. The sauger (Sander canadensis) is the only known natural host for sheepnose mussel glochidia. The FWS (77 FR 14914) reports that in laboratory studies, sheepnose glochidia have successfully transformed on several other species, including fathead minnow (Pimephales promelas), creek chub (Semotilus atromaculatus), central stoneroller (Campostoma anomalum), and brook stickleback (Culaea inconstans), although interactions between these species and sheepnose may be rare and infrequent in nature due to habitat preferences. The FWS (2015c) identifies golden shiner (Notemigonus crysoleucas) as another possible host species. The sheepnose mussel is found across the Southeast and the Midwest, although it has been eliminated from about two-thirds of its range. Today, the sheepnose mussel is found in Alabama, Illinois, Indiana, Iowa, Kentucky, Minnesota, Mississippi, Missouri, Ohio, Pennsylvania, Tennessee, Virginia, West Virginia, and Wisconsin. In a study for Exelon, EA (2014) sampled fish, benthic invertebrates, and physical and chemical parameters during summer 2013 in the Illinois River both upstream and downstream of LSCS and compared the results to past studies for LSCS in 1974 through 1978 and 1999. EA sampled fish using electrofishing and seines and benthic invertebrates using artificial substrate samples and a grab sampler. EA found no threatened or endangered fish or macroinvertebrate species, including endangered mussels, near LSCS in this study or in past studies. Exelon (2014a) reports not observing any Federally listed species at LSCS. Decurrent False Aster (Boltonia decurrens). Decurrent false aster is a flowering perennial plant in the aster family. The aster-like flowers appear from the tall (typically about 1.5 m (60 in.) or more), bushy plants from August to October, and the flower rays range in color from white to pale violet. “Decurrent” refers to leaf stem bases that run down along the stem where they attach. Decurrent false aster lives in the wet prairies in disturbed alluvial ground and open shores of floodplain forests along the Illinois and Mississippi Rivers, and historically ranged from LaSalle, Illinois, downstream to St. Louis, Missouri, on the Mississippi River. In 1988, the FWS proposed to list the species as threatened (53 FR 5598) because it found only 12 extant populations remaining in 5 Illinois counties and one Missouri County. In addition, destruction and modification of the floodplain forest along the Illinois and Mississippi Rivers due to wetland drainage and agricultural expansion threatened survival of the species. In November 1988, the FWS determined the decurrent false aster to be a threatened species under the ESA but did not designate critical habitat (53 FR 45858). At that time, the FWS thought the species to be extirpated from 13 counties in Illinois and 3 counties in Missouri. Twelve remaining extant populations were located along the Illinois River in Morgan, Schuyler, Fulton, and Marshall Counties; one population along the Mississippi River in St. Clair County; and two populations in St. Charles County, Missouri. It was often found in disturbed alluvial soil where the forest overstory and understory are open due to frequent flooding. It prefers moist, sandy areas around natural lakes in the Illinois River floodplain, but these areas now receive 2 or 3 in. (5 to 7.5 cm) of silt per year due to extensive row crop agricultural practices and numerous levee systems that increase the amount of silt deposited on river banks during floods, and the silt prevents seed germination. The FWS initiated 5-year status reviews of decurrent false aster in 1990 and 2011, requested new information on the species, and found no reason to change the ESA threatened status. In its Recovery Plan that incorporated new information, FWS (1990) reported 18 known populations for this species in Illinois and 2 in Missouri, although not all were self-sustaining. In
Affected Environment
3-79
its 2012 5-year Review, FWS (2012b) found that research since the Recovery Plan indicated that this species may best be described as a metapopulation (a group of spatially separated populations of the same species that interact at some level) that colonizes and disappears from available habitat patches. In a metapopulation, as local populations fluctuate in size, they become vulnerable to extinction during periods when their numbers are low, and the regional persistence of the species depends on the existence of a metapopulation. Elimination of much of the metapopulation structure can increase the chance of regional extinction of the species. The plant’s abundance appears to fluctuate widely in response to annual changes in site conditions and the dynamic Illinois River hydrology. In a metapopulation model of decurrent false aster (Smith et al. 2005), flood pulses characterized by spring floods and midsummer periods of low water maintain subpopulations and help establish new sub-populations. The flood pulses provide necessary disturbance and reduce competition to facilitate the colonization of habitats. Impoundment of the Illinois River and periodic prolonged high water events during the growing season have reduced available habitat and contributed to the species’ decline. The FWS has not reported extant populations in LaSalle County and Exelon (2014a) reports no threatened or endangered species on the LSCS site. Eastern Prairie Fringed Orchid (Platanthera leucophaea). The eastern prairie fringed orchid is 1 of at least 200 North American orchid species and is a perennial herb. Plants are about 8 to 40 in. (0.2 to 1 m) tall. An upright leafy stem carries a flower cluster called an inflorescence. The 3- to 8-in. (76- to 200-cm) lance-shaped leaves sheath the stem. Each plant has one single flower spike composed of 5 to 40 creamy white flowers, and the blossoms often rise just above the height of the surrounding grasses and sedges. Blooming occurs in late June and early July. Night-flying hawkmoths (family Sphingidae) pollinate the nocturnally fragrant flowers (FWS 2013a). This species typically inhabits tallgrass prairies east of the Mississippi River that have calcareous silt loam soils and calcareous wetlands with open portions of fends, sedge meadows, marshes, and bogs. While once numerous and widespread, populations have declined with the disappearance of eastern prairies by conversion of habitat for crop fields, grazing, intensive and continuous hay mowing, drainage, and related human uses. Other reasons for the decline include succession to woody vegetation, competition from non-native species, and over-collection. Remaining populations tend to be small, unprotected, and unmanaged. The FWS designated the eastern prairie fringed orchid as an endangered species in 1989 (54 FR 39857) and in 2012 initiated a 5-year status review of the listing (77 FR 38762). The FWS did not designate critical habitat for this species. Exelon (2014a) reports not observing any Federally listed species on the LaSalle site. Leafy Prairie-Clover (Delea foliosa). The FWS listed the leafy prairie-clover as endangered throughout its range in 1991 (56 FR 19953), when it was known to be present only in two sites in Alabama, nine sites in Tennessee, and three sites in Illinois. The FWS did not designate critical habitat for leafy prairie-clover. The species is perennial and a member of the pea family (Fabaceae). The plants grow erect stems about 0.5-m (1.5-ft) tall, on the end of which grow small purple flowers in dense spikes. Flowering begins in August, and seeds ripen in early October, after which the above-ground portion of the plant dies while the below-ground portion survives the winter (56 FR 19953). This plant is typically found in dry prairies, often in dolomitic soils. In Illinois, leafy prairie-clover was originally known from six counties in the northeastern part of the State, but by 1991 only three populations were known in the State, all in Will County in prairie remnants along the Des Plaines River (56 FR 19953). The U.S. Forest Service (USFS) (undated a) lists the reasons for its decline as plant and habitat loss from inundation by dams, road work, and
Affected Environment
3-80
right-of-way management, including herbicide effects; botanical and horticultural collection; off-road vehicle impacts to plants and habitat; predation by deer and rabbits; encroachment of woody plants; and severe drought. Its habitat is being lost as dolomite prairies are being converted to industrial, commercial, and residential uses (USFS undated b). Recovery efforts by a partnership of the FWS (Chicago Field Office), the USFS, the Forest Preserve District of Will County, the Department of the Army (Joliet Training Area), the IDNR, the Forest Preserve District of Kane County, and Midewin National Tallgrass Prairie are underway in northeastern Illinois (USFS undated b). Exelon (2014a) reports not observing any Federally listed species on the LSCS site. Indiana Bat (Myotis sodalis). The FWS listed the Indiana bat as endangered in 1967 (32 FR 4001). The FWS designated critical habitat for the Indiana bat in 1976 (41 FR 41914) to include 11 caves and 2 mines in six states, including a cave in LaSalle County, Illinois. The Indiana bat is an insectivorous, migratory bat that inhabits the central portion of the Eastern United States and hibernates colonially in caves and mines. The decline of Indiana bats is attributed to urban expansion, habitat loss and degradation, human-caused disturbance of caves or mines, insecticide poisoning, and white-nose syndrome (WNS) (FWS 2011; Pruitt and TeWinkel 2007). During summer months, reproductive female bats tend to roost in colonies under slabs of peeling tree bark or cracks within trees in forest fragments, often near agricultural areas (Pruitt and TeWinkel 2007). Colonies may also inhabit closed-canopy, bottomland deciduous forest; riparian habitats; wooded wetlands and floodplains; and upland communities (Pruitt and TeWinkel 2007). Maternity colonies typically consist of 60 to 80 adult females (Whitaker and Brack 2002). Colonies occupy multiple trees for roosting and rearing young (Watrous et al. 2006) and, once established, usually return to the same areas each year (Pruitt and TeWinkel 2007). Nonreproductive females and males do not roost in colonies during the summer; they may remain near the hibernacula or migrate to summer habitat (Pruitt and TeWinkel 2007). A hibernaculum is an area where bats gather and hibernate in winter. High-quality summer habitat includes mature forest stands containing open subcanopies, multiple moderate- to high-quality snags, and trees with exfoliating bark (Farmer et al. 2002). In summer, bats forage for insects along forest edges, riparian areas, and in semi-open forested habitats. In the winter, Indiana bats rely on caves for hibernation. The species prefers hibernacula in areas with karst (limestone, dolomite, and gypsum), although it may also use other cave-like locations, such as mines. The Indiana Bat Recovery Plan (Pruitt and TeWinkel 2007) indicates that Indiana bats are distributed across 36 of the 102 counties in Illinois. Twenty-two winter hibernacula (16 extant, 4 of uncertain status, and 2 historic) are located throughout these counties. Additionally, 29 extant maternity colonies occur in Illinois, and adult males, nonreproductive females, or both have been captured during summer surveys within 26 of the 36 counties. For 2011, the FWS (2009) estimated that Illinois’s total population of Indiana bats was 54,095 individuals. According to more recent estimates, the Illinois population of Indiana bats has increased by almost 2,000 over in 2011 to 55,956 individuals (FWS 2012a). Exelon (2014a) reports not observing any Federally listed species on the LSCS site. Northern Long-Eared Bat (Myotis septentrionalis). In December 2013, the FWS (78 FR 72058) found that listing of the northern long-eared bat as an endangered species under the ESA was warranted. Earlier in October 2013, the FWS (78 FR 61046) had found that it could not determine critical habitat for this species. The FWS listed the northern long-eared bat as threatened throughout its range on April 2, 2015 (80 FR 17974). The following information is from those listing documents. The northern long-eared bat is a medium-sized bat species with average adult body weights of 5 to 8 grams (0.2 to 0.3 ounces), adult body lengths between

Affected Environment
3-81
77 to 95 mm (3.0 to 3.7 in.) and wingspans between 228 and 258 mm (8.9 to 10.2 in.). Adult fur is typically brown, darker on top than below. The range includes much of the eastern and north central United States (it occurs in 39 states) and all Canadian provinces west to the southern Yukon Territory and eastern British Columbia. Throughout the majority of this range, however, it is patchily distributed, and historically it was less common in the southern and western part of its range than in the northern portion. The bats gather and hibernate in winter typically in mines and caves, where they are now usually found only in low numbers. They migrate out of the hibernacula in summer, when they forage at night and roost during daylight in small numbers in live and dead trees and change roosts often. Their diet includes moths, flies, leafhoppers, caddisflies, and beetles, although the diet differs geographically and seasonally, and an individual can consume 3,000 insects each night. Mating occurs in the autumn and birthing in May or June. Mature forests are an important habitat type for northern long-eared bats, although they occasionally act as forager over forest clearings and along roads. The northern long-eared bat has experienced a sharp decline, estimated at approximately 99 percent from hibernaculum data, in the northeastern portion of its range due to the recent emergence of a fungal disease known as white-nose syndrome (WNS) (currently called Geomycetes destructans), and the FWS expects similar declines in the western part of its range as this disease spreads. The FWS (2013c) confirmed the existence of WNS in northern long-eared and little brown bats from LaSalle and Monroe Counties, Illinois. Human activities that threaten this species include constructing physical barriers at cave accesses and destruction of habitat through mining, flooding, vandalism, development, timber harvest, and other activities. Exelon (2014a) reports not observing any Federally listed species on the LSCS site. Summary of the Occurrence of Listed Species within the Action Area. The six species listed in Table 3–14 are under the FWS’s jurisdiction within LaSalle County, although the information is not specific to the LSCS site. For the six species identified for LaSalle County, the NRC staff did not identify any within the action area after review of the ER (Exelon 2014a), a site visit that included discussions with site staff and review of onsite documents, and published and online sources. Sections 3.6, Terrestrial Resources, and 3.7, Aquatic Resources, summarize the ecological surveys performed on and near the LSCS site that would detect protected species. Exelon (2014a) reports not observing any Federally listed species on the LSCS site. Given the available information, the NRC staff concludes that the six species are unlikely to occur within the action area.
3.9 Historic and Cultural Resources
This section discusses the cultural background and the known historic and cultural resources found on or near LSCS. The discussion is based on a review of historic and cultural resource surveys and other background information on the region surrounding LSCS. In addition, a records search was performed via the Illinois Historic Preservation Agency (IHPA) to obtain the most updated information about historic and cultural resources in the region. The Area of Potential Effect (APE) is the area at the LSCS power plant site, the transmission lines up to the first substation, and immediate environs that may be affected by the license renewal decision and land-disturbing activities associated with continued reactor operations. For this analysis, the first substation (345 kV LSCS switchyard) is located on the LSCS site (Exelon 2014a). The APE may extend beyond the immediate environs in instances where land-disturbing maintenance and operations activities during the license renewal term or refurbishment activities could potentially have an effect. In the case of LSCS, the APE includes the corridor between the cooling pond and the Illinois River containing the makeup and blowdown water pipelines within the site boundary. These pipelines traverse a distance of approximately 5.6 km (3.5 mi) from the cooling pond to the Illinois River. See Figure 3–3.

Affected Environment
3-82
3.9.1 Cultural Background
Human occupation near the LSCS site is generally characterized according to the following chronological sequence (Pauketat 1993):
• Paleo-Indian Period (12,000 – 10,000 before present (BP)),
• Archaic Period (10,000 – 3,000 BP),
• Woodland Period (3,000 – 1,100 BP),
• Mississippian Period (1,100 – 400 BP (ca. A.D. 900 – 1600)), and
• Protohistoric/Historic Period (400 – present (ca. A.D. 1600 – present)). Paleo-Indian Period (12,000 – 10,000 B.P.). The earliest evidence of people living in Illinois dates to the Paleo-Indian Period. Paleo-Indian sites are generally found upland or on river terraces and are characterized by specific types of projectile points (i.e., fluted Clovis and Folsom points) and stone tools such as gravers, scrapers or large blades. These artifacts often occur in association with mastodon remains, suggesting a reliance on megafauna (e.g., mammoth, ground sloth, and saber-tooth tiger) for subsistence along with plants, small game, birds, and amphibians. Social organization consisted of small, highly nomadic bands of hunter-gathers, leaving Paleo-Indian sites with little detailed archaeological information (Neusius and Gross 2007; Pauketat 1993). Archaic Period (10,000 – 3,000 B.P.). The Archaic Period was a time of major climatic shifts as colder environments transitioned to warmer environments similar to modern conditions. In response to this shift, new technologies and subsistence strategies were developed during this time. The Archaic Period is often divided into early, middle, and late subperiods. The Early Archaic Period is characterized by a shift from nomadic to sedentary settlement patterns, with central base camps located on river terraces and smaller hunting camps located in upland areas. This subperiod also shows an increased reliance on wild plant foods, small game, and aquatic resources. The Middle Archaic Period is characterized by an increased number of settlement sites on high stream terraces, which may reflect population increases. While subsistence and settlement patterns remained fairly similar to the Early Archaic Period, artifact assemblages suggest increased exploitation of aquatic resources as well as new artifacts such as pecked and ground stone tools used for intensive processing of nuts; banner stones that signaled the innovation of a new projectile technology called the atlatl or spear-thrower; and grooved axes. The Late Archaic Period is characterized by an increase in the number and size of settlement sites, which indicates an increase in population and a more sedentary lifestyle. New features of Late Archaic artifact assemblages, such as crude ceramic vessels, represent a shift towards increased reliance on horticulture as a subsistence strategy, although hunting and gathering would have continued (Fagan 2005; Neusius and Gross 2007; Pauketat 1993). Woodland Period (3,000 – 1,100 B.P.). The Woodland Period is also often divided into early, middle, and late periods. However, the distinction between the early and middle period is not fixed. The Woodland Period is marked by an increase in more permanent settlements, changes in burial practices, increased cultivation of plants such as sunflowers and cucurbits (e.g., squashes, gourds, melons), and a rise in the manufacture and use of pottery (Fagan 2005). During the Middle Woodland Period, the large and complex Hopewell Culture emerged in the northeastern and Midwestern United States, including Illinois. This culture is characterized by settlement in villages, increased reliance on intensive horticulture, burial mounds, and long distance trade networks. These long distance networks allowed the trade of exotic materials, such as marine shells from the Gulf Coast, obsidian from the Rocky Mountains, copper from Lake Superior, and mica from the Appalachian Mountains far outside their
Affected Environment
3-83
immediate locations. Evidence of the Illinois Hopewell culture is found primarily in the bluffs and floodplains of the Illinois River Valley. The burial mounds of this period often included central features, lined with logs, and filled with grave goods. Different burial treatments within the mounds point to social stratification within society, but through sex and age rather than hereditary lineage (Neusius and Gross 2007). The Late Woodland Period is characterized by an increase in settlement sites, which suggests (a) a rise in population, or (b) a change in settlement patterns from large, centralized village sites to smaller, dispersed habitation sites, or both (Fagan 2005). Mississippian Period (1,100 – 400 B.P. (ca. A.D. 900 – 1600)). The Mississippian Period is characterized by major changes in settlement, subsistence patterns, and social structure. Large highly centralized chiefdoms with permanent settlements sites supported by numerous satellite villages emerged during this period. The platform mound, a new ceremonial earthen mound appeared in association with these permanent settlements. Platform mounds, burial mounds, and defensive structures, such as moats and palisades, were often constructed in clusters in settlements of this period and were common in the larger river valleys of the Midwest. Mississippian Period subsistence relied heavily on maize agriculture, as well as hunting and gathering. Long distance trading increased and craft specialists produced highly specialized lithic and ceramic artifacts, beadwork and shell pendants (Fagan 2005). Examples of Mississippian Period occupation within LaSalle County is the Starved Rock State Park area. Starved Rock is a 1,065 ha (2,632 ac) area along the south bank of the Illinois River between the towns of LaSalle and Ottawa, Illinois. Mississippian period artifacts have been found in some 62 sites in the region surrounding Starved Rock State Park with 16 sites recorded in the park itself (DOI 1998). Protohistoric/Historic Period (A.D. 1600 – Present). The end of the Mississippian Period is characterized by severe social, political, and demographic changes that resulted from indirect and direct contact with Europeans. In particular, it is believed that the introduction of European infectious diseases such as smallpox, typhoid, and influenza severely decimated Native American populations, which had no immunity to these diseases. The spread of these diseases, which were fatal to large numbers of Native Americans, resulted in the widespread abandonment of villages and a concurrent collapse of Native American socioeconomic networks, such that by the time of widespread European contact and settlement, the Mississippian chiefdoms were gone (Fagan 2005). During the historic period, Illinois was primarily populated with a confederation of tribes known as the Illinois, or Illiniwek, and the Miami tribe. During the 1700s and early 1800s, new tribes migrated to Illinois, including the Iroquois, Fox (Mesquakie), Ioway, Kickapoo, Mascouten, Piankashaw, Potawatomi, Sauk, Shawnee, Wea, and Winnebago. Competition for resources led to sporadic war among the Illinois, surrounding tribes, and European immigrants to the area for approximately the next 120 years (ISM 2002). In approximately 1673, French explorers traveled along the Mississippi River and up the Illinois River to present-day LaSalle County. Robert Cavalier, also known as Louis de La Salle, made the first European settlement in LaSalle County. French influence in the Illinois territory began to wane by the mid-1700s due to being ejected from the area by the British. Illinois became part of the Northwestern Territory at the close of the American Revolution. LaSalle County was organized by the Illinois legislature during the 1830–1831 legislative session (Baldwin 1877). The State of Illinois joined the Union in 1818. The area surrounding the LSCS site has principally been used for agriculture and coal mining from this period onward (Exelon 2014a).

Affected Environment
3-84
3.9.2 Historic and Cultural Resources
LSCS historic and cultural resources include prehistoric era and historic era archaeological sites, historic districts, and buildings, as well as any site, structure, or object that may be considered eligible for listing on the National Register of Historic Places (NRHP). Historic and cultural resources also include traditional cultural properties that are important to a living community of people for maintaining their culture. “Historic property” is the legal term for a historic or cultural resource that is eligible for listing on the NRHP. A review of databases maintained by the National Park Service (NPS) indicates that there are 31 properties listed in the NRHP within LaSalle County, including three that have been designated as National Historic Landmarks (DOI 2015). These historic properties reflect the historic cultural contexts for the LSCS property and include Starved Rock State Park, and structures and districts dating from the mid-18th through mid-20th centuries. None of the historic properties is located within the boundaries of the LSCS property (DOI 2015). The closest NRHP site is the Illinois and Michigan Canal (NR200462), approximately 5 mi (8 km) to the north of the plant. A number of surveys of the LSCS site were conducted between 1972 and 1994. In 1972, a Phase I archaeological survey was done by the Illinois Archaeological Survey of the LSCS site—originally known as the Collins Generating Station. Five sites were discovered on LSCS property. However, these sites were not recorded or evaluated because, in 1972, isolated finds were not recognized as sites and therefore not evaluated. Three of the sites were assigned Illinois Archaeological Survey accession numbers—LS00207, LS00208, and LS00209. The 1972 survey concluded that construction of the LSCS would not significantly affect archaeological resources (Exelon 2014a). These findings were accepted by the NRC in its Final Environmental Statement for LSCS issued in 1978 (NRC 1978). In 1993, the Illinois Department of Military Affairs did a survey to support the siting of a military training area immediately northwest of LSCS. This survey found 48 archaeological sites, one of which is located on the LSCS site—LS00514. This site was also determined not to be NRHP eligible (Exelon 2014a). The NRC staff searched the Illinois State Archaeological Site Files, a database maintained by the Illinois State Historic Preservation Officer, and identified the LSCS sites listed in the 1972 and 1993 surveys as well as one additional site—LS00527—which was determined to be NRHP ineligible. No other cultural resources within the current confines of the LSCS site were identified (NRC 2015c).
3.10 Socioeconomics
This section describes current socioeconomic factors that have the potential to be directly or indirectly affected by changes in operations at LSCS. LSCS, and the communities that support it, can be described as a dynamic socioeconomic system. The communities supply the people, goods, and services required to operate the nuclear power plant. Power plant operations, in turn, supply wages and benefits for people and dollar expenditures for goods and services. The measure of a community’s ability to support LSCS operations depends on its ability to respond to changing environmental, social, economic, and demographic conditions.
3.10.1 Power Plant Employment and Expenditures
The socioeconomics region of influence (ROI) is defined by the areas where LSCS employees and their families reside, spend their income, and use their benefits, thus affecting the economic conditions of the region. Exelon employs a permanent workforce of approximately

Affected Environment
3-85
890 employees and 30 long-term contract employees (Exelon 2014a). Approximately 83 percent of LSCS employees reside in a three-county area in northeastern Illinois in Grundy, LaSalle, and Will Counties. Most of the remaining 17 percent of the workforce are spread among 23 other counties in Illinois, with numbers ranging from 1 to 40 employees per county (Exelon 2015q). Given the residential locations of LSCS employees, the most significant effects of plant operations are likely to occur in Grundy, LaSalle, and Will Counties. Table 3–15 summarizes the LSCS workforce geographic distribution. The focus of the socioeconomic impact analysis in this SEIS is, therefore, on the impacts of continued LSCS operations on these three counties, also termed the ROI.
Table 3–15. LSCS Employees Residence by County
County Number of Employees Percentage of Total Illinois Bureau 12 1 Cook 10 1 Grundy 161 18 Kendall 38 4 LaSalle 490 55 Livingston 40 5 Will 86 10 Other counties 52 6 Total 889 100
Source: Exelon 2015q
Exelon purchases goods and services to facilitate LSCS operations. While specialized equipment and services are procured from a wider region, some proportion of the goods and services used in plant operations are acquired from within the ROI. These transactions fuel a portion of the local economy, as jobs are provided and additional local purchases are made by plant suppliers. The LSCS units are on staggered 24-month refueling cycles lasting approximately 25 days each. During refueling outages, site employment typically increases by an additional 800 temporary workers (Exelon 2014a). Approximately 75 to 80 percent of the outage workers are permanent residents of the ROI. The remaining 20 to 25 percent stay in Morris, Ottawa, or Joliet, Illinois (Exelon 2014a).
3.10.2 Regional Economic Characteristics
This section presents information on employment and income in the LSCS socioeconomic ROI. Grundy and LaSalle counties are predominantly rural with agricultural and forested land comprising the majority (90 percent) of the land use in the county. Conversely, Will County is more urban with developed land comprising about 34 percent of total land area in the county (USDA 2015a). 3.10.2.1 Employment and Income
From 2010 to 2014, the labor force in the LSCS ROI decreased approximately 0.8 percent to approximately 440,000. However, the number of employed persons increased by about

Affected Environment
3-86
3.4 percent, to approximately 406,000. Consequently, the number of unemployed people in the ROI decreased by 33.6 percent, by approximately 17,000 persons to approximately 33,000, or about 7.6 percent of the current workforce—down from 11.3 percent in 2010 (BLS 2015). According to the U.S. Census Bureau’s (USCB’s) 2014 “American Community Survey 1-Year Estimates” for LaSalle and Will Counties and 2009-2013 “American Community Survey 5-Year Estimates” for Grundy County, the educational, health, and social services industry represented the largest employment sector in the socioeconomic ROI (22.8 percent) followed by manufacturing and retail (both at 12 percent) (USCB 2015a). A list of employment by industry in each county of the ROI is provided in Table 3–16.
Table 3–16. Employment by Industry in the LSCS ROI (2014, 1-year estimates and 2009-2013, 5-year estimates)
Industry Grundy(a) LaSalle(b) Will(b) Total Percent
Total employed civilian workers 22,931 47,159 342,888 412,978 –
Agriculture, forestry, fishing, hunting, and mining 334 1,645 1,488 3,467 0.8
Construction 1,920 2,556 21,997 26,473 6.4
Manufacturing 2,872 7,495 39,037 49,404 12.0
Wholesale Trade 760 1,015 10,581 12,356 3.0
Retail Trade 2,677 7,030 40,265 49,972 12.1
Transportation, warehousing, and utilities 2,215 3,157 25,581 30,953 7.5
Information 268 397 7,992 8,657 2.1
Finance, insurance, real estate, rental, and leasing
1,037 2,348 22,388 25,773 6.2
Professional, scientific, management, administrative, and waste management services
1,559 3,081 34,365 39,005 9.4
Educational, health, and social services 4,893 10,252 78,846 93,991 22.8
Arts, entertainment, recreation, accommodation, and food services
2,566 3,737 31,560 37,863 9.2
Other services (except public administration) 936 3,026 16,930 20,892 5.1
Public administration 894 1,420 11,858 14,172 3.4
(a) 2009-2013 “American Community Survey 5-Year Estimates.” (b) 2014 “American Community Survey 1-Year Estimates.”
Source: USCB 2015a
Major employers in LaSalle County, the county in which LSCS is located, are listed in Table 3–17. Exelon is shown as the largest employer in the county.
Table 3–17. Major Employers in LaSalle County in 2009 Employer Number of Employees Exelon Generation 890 OSF, Saint Elizabeth Medical Center 730

Affected Environment
3-87
Employer Number of Employees PetSmart 500 Clover Technology Group 450 HR Imaging 425 Office Max 375 SABIC Innovative Plastics 275 Kohl’s 270 Seattle Sutton Healthy Eating 170 Mitsuboshi Belting 168 Pilkington Industries 157 Tyson’s 130 U.S. Silica 130
Source: Ottawa Area Chamber of Commerce & Industry, 2009
Estimated income information for the LSCS ROI is presented in Table 3–18. According to the USCB’s 2014 American Community Survey 1-year estimates, 10.5 percent of families and 14.4 percent of individuals in Illinois were living below the Federal poverty threshold and the median household and per capita income for Illinois was $57,444 and $30,417, respectively (USCB 2015b). In the socioeconomic ROI, people living in LaSalle County had median household and per capita incomes below the State average. The median household and per capita income average in LaSalle County was $50,432 and $25,129, respectively, with 9.6 percent of families and 13.3 percent of individuals living below the poverty level. Conversely, Will County had a higher median household and per capita income average ($74,828 and $32,148, respectively) and a lower percentage of families (6.3 percent) and individuals (7.9 percent) living below the official poverty level. According to the USCB’s “2011-2013 American Community Survey 3-Year Estimates,” Grundy County also had higher median household and per capita income averages ($63,978 and $28,465, respectively) and lower percentages of families (7.2 percent) and individuals (9.4 percent) living below the poverty level than the State of Illinois and LaSalle County (USCB 2015b).
Table 3–18. Estimated Income Information for the LSCS ROI (2014 estimates, unless otherwise indicated)
Grundy(b) LaSalle Will Illinois Median household income (dollars)(a) 63,978 50,432 74,828 57,444 Per capita income (dollars)(a) 28,465 25,129 32,148 30,417 Individuals living below the poverty level (percent) 9.4 13.3 7.9 14.4 Families living below the poverty level (percent) 7.2 9.6 6.3 10.5 (a) In 2012 inflation adjusted dollars. (b) 2011-2013 American Community Survey 3-Year Estimates.
Source: USCB 2015b.

Affected Environment
3-88
3.10.2.2 Unemployment
According to the USCB’s 2014 American Community Survey estimates, the unemployment rates in LaSalle County and the State of Illinois were 8.1 and 10.5 percent, respectively. Comparatively, the Will County unemployment rate during this same time period was 6.0 percent. According to the USCB’s 2013 American Community Survey 3-year estimates, the unemployment rates in Grundy County was 9.6 percent (USCB 2015c).
3.10.3 Demographic Characteristics
According to the 2010 Census, an estimated 103,000 people lived within 20 mi (32 km) of LSCS, which equates to a population density of approximately 81 persons per square mile (persons/mi2) (CAPS 2014). This translates to a Category 3, “least sparse” population density using the GEIS measure of sparseness (60 to 120 persons/mi2 within 20 mi). An estimated 1,926,000 people live within 50 mi (80 km) of LSCS with a population density of approximately 245 persons/mi2 (CAPS 2014). This translates to a Category 4 “in close proximity” population density, using the GEIS measure of proximity (greater than or equal to 190 persons/mi2 within 50 mi). Therefore, LSCS is located in a high population area based on the GEIS sparseness and proximity matrix. Table 3–19 shows population projections and percent growth from 1980 to 2060 in the three-county LSCS ROI. The ROI population continues to increase over the past two decades (2000 and 2010). Based on forecasts, the population is expected to continue these trends at moderate to high rates. Population projections for years 2020 through 2040 shown in the table were developed for the Illinois Department of Transportation.
Table 3–19. Population and Percent Growth in LSCS ROI Counties 1980–2010, 2014 (estimated), and Projected for 2020–2060
Year
Grundy County LaSalle County Will County
Population Percent change Population
Percent change Population
Percent change
1980 30,582 – 112,033 – 324,460 – 1990 32,337 5.7 106,913 -4.6 357,313 10.1 2000 37,535 16.1 111,509 4.3 502,266 40.6 2010 50,063 33.4 113,924 2.2 677,560 34.9 2014 50,425 0.7 111,241 -2.4 685,419 1.2 2020 61,265 22.4 118,178 3.7 868,986 28.3 2030 72,463 18.3 121,928 3.2 1,146,722 32.0 2040 83,665 15.5 125,686 3.1 1,366,456 19.2 2050 94,864 13.4 129,439 3.0 1,624,858 18.9 2060 106,064 11.8 133,193 2.9 1,873,593 15.3
Sources: Decennial population data for 1980-2010, and estimated 2014 (USCB 2015d); projections for 2020-2040 Illinois Department of Transportation (IDOT 2012); 2050-2060 calculated.
The 2010 Census demographic profile of the three-county ROI population is presented in Table 3–20. According to the 2010 Census, minorities (race and ethnicity combined) comprised 28.6 percent of the total three-county population. The largest minority populations in the ROI

Affected Environment
3-89
were Hispanic or Latino of any race (14.1 percent) and Black or African American (9.2 percent) (USCB 2015e).
Table 3–20. Demographic Profile of the Population in the LSCS ROI in 2010
Grundy LaSalle Will ROI Total Population 50,063 113,924 677,560 841,547 Race (percent of total population, Not-Hispanic or Latino) White 88.9 88.3 67.2 71.4 Black or African American 1.2 1.8 11.0 9.2 American Indian & Alaska Native 0.1 0.2 0.1 0.1 Asian 0.6 0.7 4.5 3.7 Native Hawaiian & Other Pacific Islander 0.0 0.0 0.0 0.0 Some other race 0.0 0.0 0.1 0.1 Two or more races 0.9 1.0 1.4 1.3 Ethnicity Hispanic or Latino 4,096 9,135 105,817 119,048 Percent of total population 8.2 8.0 15.6 14.1 Minority population (including Hispanic or Latino ethnicity) Total minority population 5,537 13,379 221,983 240,899 Percent minority 11.1 11.7 32.8 28.6
Source: USCB 2015e
According to the USCB’s 2014 American Community Survey estimates, since 2010 minority populations in the ROI were estimated to have increased by approximately 17,700 persons and now comprise 30.5 percent of the ROI population (see Table 3–21). The largest increase occurred in the Hispanic or Latino population (nearly 8,900 persons since 2010, an increase of 7.5 percent). The next largest increase in minority population was Asian, an increase of approximately 5,800 persons or 18.5 percent from 2010 (USCB 2015f).
Table 3–21. Demographic Profile of the Population in the LSCS ROI in 2014
Grundy LaSalle Will ROI Total Population 50,425 111,241 685,419 847,085 Race (percent of total population, Not-Hispanic or Latino) White 87.4 86.9 65.3 69.5 Black or African American 1.4 2.1 11.3 9.5 American Indian & Alaska Native 0.1 0.2 0.1 0.1 Asian 0.8 0.9 5.3 4.4 Native Hawaiian & Other Pacific Islander 0.0 0.0 0.0 0.0 Some other race 0.0 0.0 0.0 0.0 Two or more races 1.0 1.0 1.4 1.4
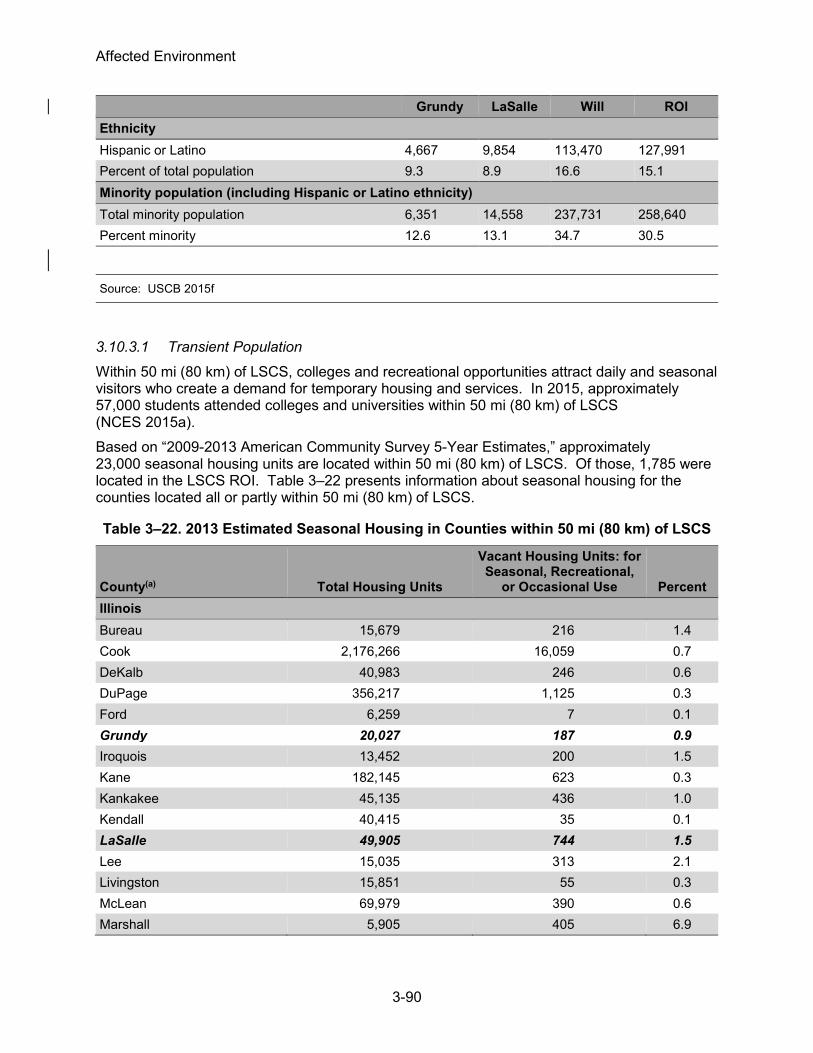
Affected Environment
3-90
Grundy LaSalle Will ROI Ethnicity Hispanic or Latino 4,667 9,854 113,470 127,991 Percent of total population 9.3 8.9 16.6 15.1 Minority population (including Hispanic or Latino ethnicity) Total minority population 6,351 14,558 237,731 258,640 Percent minority 12.6 13.1 34.7 30.5
Source: USCB 2015f
3.10.3.1 Transient Population
Within 50 mi (80 km) of LSCS, colleges and recreational opportunities attract daily and seasonal visitors who create a demand for temporary housing and services. In 2015, approximately 57,000 students attended colleges and universities within 50 mi (80 km) of LSCS (NCES 2015a). Based on “2009-2013 American Community Survey 5-Year Estimates,” approximately 23,000 seasonal housing units are located within 50 mi (80 km) of LSCS. Of those, 1,785 were located in the LSCS ROI. Table 3–22 presents information about seasonal housing for the counties located all or partly within 50 mi (80 km) of LSCS.
Table 3–22. 2013 Estimated Seasonal Housing in Counties within 50 mi (80 km) of LSCS
County(a) Total Housing Units
Vacant Housing Units: for Seasonal, Recreational,
or Occasional Use Percent Illinois Bureau 15,679 216 1.4 Cook 2,176,266 16,059 0.7 DeKalb 40,983 246 0.6 DuPage 356,217 1,125 0.3 Ford 6,259 7 0.1 Grundy 20,027 187 0.9 Iroquois 13,452 200 1.5 Kane 182,145 623 0.3 Kankakee 45,135 436 1.0 Kendall 40,415 35 0.1 LaSalle 49,905 744 1.5 Lee 15,035 313 2.1 Livingston 15,851 55 0.3 McLean 69,979 390 0.6 Marshall 5,905 405 6.9

Affected Environment
3-91
County(a) Total Housing Units
Vacant Housing Units: for Seasonal, Recreational,
or Occasional Use Percent Illinois Ogle 22,558 377 1.7 Peoria 83,162 114 0.1 Putnam 3,084 375 12.2 Tazewell 57,608 164 0.3 Will 237,806 854 0.4 Woodford 15,207 109 0.7 Total 3,472,678 23,034 1.6 (a) Counties within 50 mi (80 km) of LSCS with at least one block group located within the 50-mi (80-km) radius.
Note: ROI counties are in bold italics.
Source: USCB 2015g
3.10.3.2 Migrant Farm Workers
Migrant farm workers are individuals whose employment requires travel to harvest agricultural crops. These workers may or may not have a permanent residence. Some migrant workers follow the harvesting of crops, particularly fruit, throughout rural areas of the United States. Others may be permanent residents living near LSCS and travel from farm to farm harvesting crops. Migrant workers may be members of minority or low-income populations. Because they travel and can spend a significant amount of time in an area without being actual residents, migrant workers may be unavailable for counting by census takers. If uncounted, these minority and low-income workers would be “underrepresented” in the decennial Census population counts. In the 2002 Census of Agriculture, farm operators were asked for the first time whether or not they hired migrant workers—defined as a farm worker whose employment required travel—to do work that prevented the migrant workers from returning to their permanent place of residence the same day. The Census is conducted every 5 years and results in a comprehensive compilation of agricultural production data for every county in the nation. Information about migrant and temporary labor (working less than 150 days) was collected in the 2012 Census of Agriculture. Table 3–23 supplies information about migrant and temporary farm labor within 50 mi (80 km) of LSCS. According to the 2012 Census, approximately 12,000 farm workers were hired to work for less than 150 days and were employed on 5,563 farms within 50 mi (80 km) of LSCS. The county with the highest number of temporary farm workers (1,101) on 253 farms was DeKalb County, Illinois (NASS 2015).
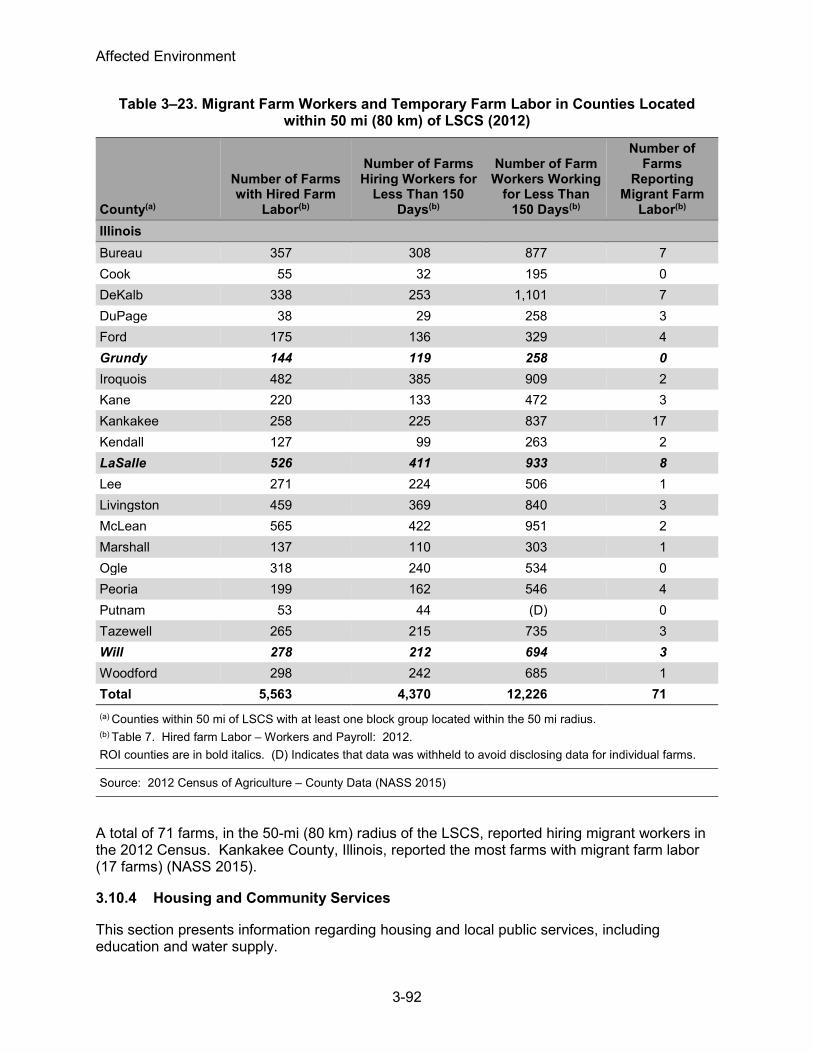
Affected Environment
3-92
Table 3–23. Migrant Farm Workers and Temporary Farm Labor in Counties Located within 50 mi (80 km) of LSCS (2012)
County(a)
Number of Farms with Hired Farm
Labor(b)
Number of Farms Hiring Workers for
Less Than 150 Days(b)
Number of Farm Workers Working
for Less Than 150 Days(b)
Number of Farms
Reporting Migrant Farm
Labor(b) Illinois Bureau 357 308 877 7 Cook 55 32 195 0 DeKalb 338 253 1,101 7 DuPage 38 29 258 3 Ford 175 136 329 4 Grundy 144 119 258 0 Iroquois 482 385 909 2 Kane 220 133 472 3 Kankakee 258 225 837 17 Kendall 127 99 263 2 LaSalle 526 411 933 8 Lee 271 224 506 1 Livingston 459 369 840 3 McLean 565 422 951 2 Marshall 137 110 303 1 Ogle 318 240 534 0 Peoria 199 162 546 4 Putnam 53 44 (D) 0 Tazewell 265 215 735 3 Will 278 212 694 3 Woodford 298 242 685 1 Total 5,563 4,370 12,226 71 (a) Counties within 50 mi of LSCS with at least one block group located within the 50 mi radius. (b) Table 7. Hired farm Labor – Workers and Payroll: 2012. ROI counties are in bold italics. (D) Indicates that data was withheld to avoid disclosing data for individual farms.
Source: 2012 Census of Agriculture – County Data (NASS 2015)
A total of 71 farms, in the 50-mi (80 km) radius of the LSCS, reported hiring migrant workers in the 2012 Census. Kankakee County, Illinois, reported the most farms with migrant farm labor (17 farms) (NASS 2015).
3.10.4 Housing and Community Services
This section presents information regarding housing and local public services, including education and water supply.
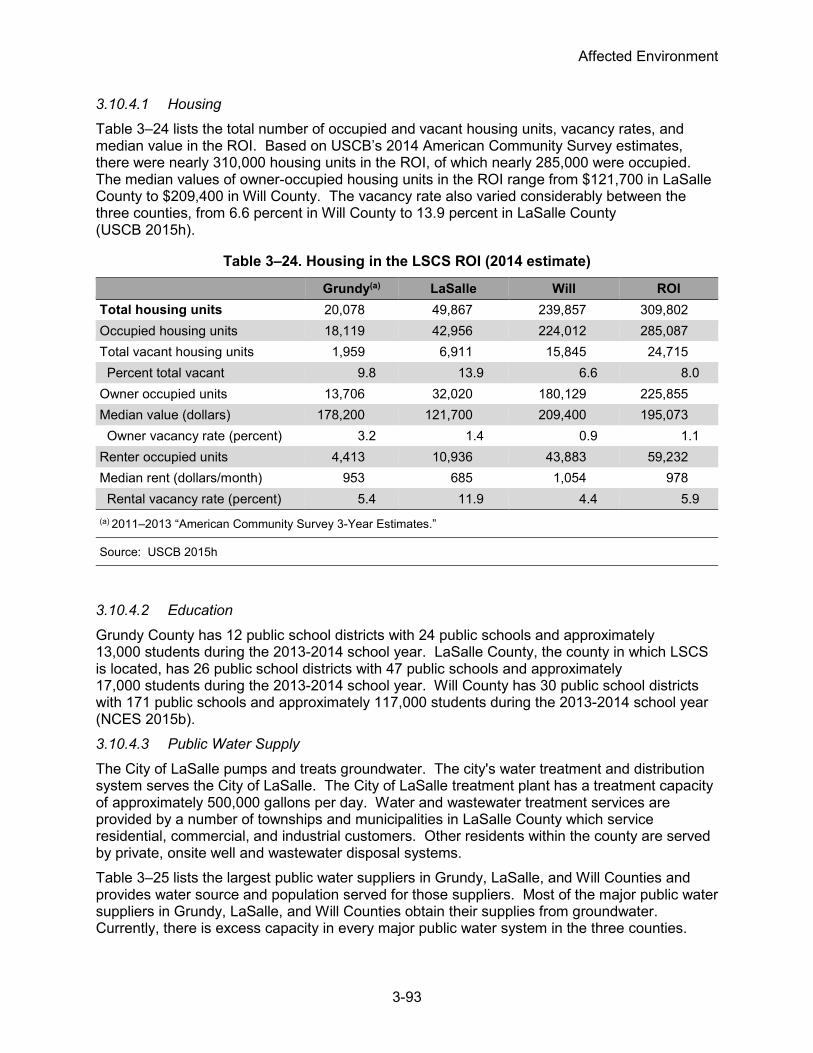
Affected Environment
3-93
3.10.4.1 Housing
Table 3–24 lists the total number of occupied and vacant housing units, vacancy rates, and median value in the ROI. Based on USCB’s 2014 American Community Survey estimates, there were nearly 310,000 housing units in the ROI, of which nearly 285,000 were occupied. The median values of owner-occupied housing units in the ROI range from $121,700 in LaSalle County to $209,400 in Will County. The vacancy rate also varied considerably between the three counties, from 6.6 percent in Will County to 13.9 percent in LaSalle County (USCB 2015h).
Table 3–24. Housing in the LSCS ROI (2014 estimate)
Grundy(a) LaSalle Will ROI Total housing units 20,078 49,867 239,857 309,802 Occupied housing units 18,119 42,956 224,012 285,087 Total vacant housing units 1,959 6,911 15,845 24,715 Percent total vacant 9.8 13.9 6.6 8.0 Owner occupied units 13,706 32,020 180,129 225,855 Median value (dollars) 178,200 121,700 209,400 195,073 Owner vacancy rate (percent) 3.2 1.4 0.9 1.1 Renter occupied units 4,413 10,936 43,883 59,232 Median rent (dollars/month) 953 685 1,054 978 Rental vacancy rate (percent) 5.4 11.9 4.4 5.9 (a) 2011–2013 “American Community Survey 3-Year Estimates.”
Source: USCB 2015h
3.10.4.2 Education
Grundy County has 12 public school districts with 24 public schools and approximately 13,000 students during the 2013-2014 school year. LaSalle County, the county in which LSCS is located, has 26 public school districts with 47 public schools and approximately 17,000 students during the 2013-2014 school year. Will County has 30 public school districts with 171 public schools and approximately 117,000 students during the 2013-2014 school year (NCES 2015b). 3.10.4.3 Public Water Supply
The City of LaSalle pumps and treats groundwater. The city's water treatment and distribution system serves the City of LaSalle. The City of LaSalle treatment plant has a treatment capacity of approximately 500,000 gallons per day. Water and wastewater treatment services are provided by a number of townships and municipalities in LaSalle County which service residential, commercial, and industrial customers. Other residents within the county are served by private, onsite well and wastewater disposal systems. Table 3–25 lists the largest public water suppliers in Grundy, LaSalle, and Will Counties and provides water source and population served for those suppliers. Most of the major public water suppliers in Grundy, LaSalle, and Will Counties obtain their supplies from groundwater. Currently, there is excess capacity in every major public water system in the three counties.

Affected Environment
3-94
Table 3–25. Local Public Water Supply Systems
Public Water System Source Population Served(a) Grundy County Coal City Groundwater 5,587 Diamond Groundwater 2,200 Minooka Groundwater 10,924 Morris Groundwater 12,000 LaSalle County Illinois American-Streator Surface water 19,000 LaSalle Groundwater 9,700 Marseilles Groundwater 4,800 Mandota Groundwater 7,272 Oglesby Groundwater 4,000 Ottawa Groundwater 18,307 Peru Groundwater 11,000 Seneca Groundwater 2,371 Utility Inc. – Lake Holiday Groundwater 6,479 Exelon/LaSalle Groundwater 1,000 Will County Aqua Illinois – University Park Groundwater 6,913 Aqua Illinois – Willowbrook Groundwater 3,422 Breecher Groundwater 4,359 Braidwood Groundwater 6,191 Channahon Groundwater 9,160 Crest Hill Groundwater 20,837 Crete Groundwater 8,259 Elwood Groundwater 2,300 Frankfort Groundwater 24,648 Illinois American – Homer Township Surface water purchased 22,036 Illinois American – West Suburban Surface water purchased 66,429 Joliet Groundwater 147,589 Lockport Groundwater 24,839 Lockport Township Water System Groundwater 2,610 Manhattan Groundwater 6,000 Mokena Surface water purchased 19,500 Monee Groundwater 5,148 New Lenox Surface water purchased 24,394 Peotone Groundwater 4,142 Plainfield Surface water purchased 36,600 Romeoville Groundwater 52,000

Affected Environment
3-95
Public Water System Source Population Served(a) Shorewood Groundwater 15,615 Southeast Joliet Groundwater 2,000 Stateville Correctional Center Groundwater purchased 3,500 Wilmington Surface water 5,724 (a) Safe Drinking Water Search for the State of Illinois (EPA 2015e).
Source: EPA 2015
3.10.5 Tax Revenues
Exelon pays taxes on LSCS property to LaSalle County, public schools, libraries, townships, districts, and other taxing authorities. Property taxes paid by Exelon for LSCS for the years of 2007 through 2013 are listed in Table 3–26. As shown in the table, total property tax payments for the reported years fluctuated from year to year. Property taxes paid on LSCS are based partially on settlement agreements for the valuation of the power block, with the remaining land taxed on the assessment of fair market value, as established by Illinois State tax law. Power block tax payments have been approximately 98 percent of the total tax payment. Settlement agreements in 1999 and 2006 covered the years 2000 through 2004 and 2005 through 2008, respectively. Negotiations for the next settlement agreement began in 2009 and was not completed until mid-2013. Consequently, without the settlement agreement, the LaSalle County tax assessor increased the assessed value of the LSCS power block, which resulted in sharply increased tax payments by Exelon. As shown in Table 3–26, tax payments more than doubled in 2009 in keeping with the increased assessment of the power block made by the County Assessor, as affirmed or amended on appeal by the LaSalle County Board of Review. Based on independent appraisals, Exelon appealed the assessments for tax years 2009 through 2012 to the Illinois Property Tax Appeal Board because the company did not believe the assessments accurately reflected the value of the LSCS power block. In July 2013, Exelon and all taxing bodies agreed to a new long-term settlement agreement that sets the Equalized Assessed Value of the LSCS power block for the next 7 years, starting with the 2013 tax year. The settlement agreement was fully executed and approved by the Court for the 13th Judicial District in LaSalle County, Illinois, in February 2014. At the request of all parties, the Property Tax Appeal Board dismissed the appeals with prejudice in May 2014 (Exelon 2014a). Exelon intends to negotiate additional tax settlement agreements during the license renewal term, as it helps the company and taxing authorities plan for future income revenue and expenditures (Exelon 2014a).
Table 3–26. LSCS Power Block Tax Payments and Valuations 2007–2014 (in dollars)
Year Equalized Assessed
Value Inferred Fair Market Value Taxes Paid by Exelon 2007 235,000,000(a) 1,566,700,000 12,258,540 2008 235,000,000(a) 1,566,700,000 12,181,812 2009 525,000,000(b) 3,571,500,000 24,595,282 2010 525,000,000(b) 3,571,500,000 24,652,781

Affected Environment
3-96
Year Equalized Assessed
Value Inferred Fair Market Value Taxes Paid by Exelon 2011 504,000,000(b) 3,360,000,000 23,888,466 2012 488,250,000(b) 3,255,000,000 23,383,171 2013 485,000,000(a) 3,233,333,333 23,749,334 2014 455,000,000(a) 3,233,333,333 22,490,721
(a) Under settlement agreement. (b) Set by Board of Review.
Source: Exelon 2014, 2015c, 2016
Taxes paid in 2013 to local taxing bodies constitute between 94 percent and less than 1 percent of the total levy for any individual taxing body, as shown in Table 3–27. Tax payments under any new settlement agreement would likely continue at similar percentages (Exelon 2014a).
Table 3–27. 2013 LSCS Tax Payments to Taxing Entities as a Percentage of Total Levy
Taxing Body Exelon Payment
(dollars) Total levy (dollars)
Percent of total levy (%)
Brookfield Township 76,547 81,290 94 Brookfield Township Road 409,211 432,957 94 South Prairie Park District 32,009 35,118 91 Allen-Brookfield District 34,719 39,041 89 Seneca Grade School # 170 6,424,862 7,330,695 87 Seneca High School # 160 8,816,393 10,602,732 83 Seneca Library 608,884 731,132 83 Seneca Fire-Ambulance 491,752 633,545 78 Marseilles Fire District 536,095 777,223 69 Illinois Valley Community College # 513 1,790,079 8,027,119 22 LaSalle County 4,772,514 23,342,931 20 Allen Fire District 5,354 151,128 3 Allen Township 2,913 97,044 3 Allen Township Road 3,950 128,063 3 Allen Township School # 65 20,340 1,125,258 2 City of Marseilles 697 963,696 < 1 Grand Ridge School # 95 364 2,289,613 < 1 Marseilles Library 53 70,300 < 1 Ottawa High School # 140 288 12,691,310 < 1 Reddick Library 32 2,289,613 < 1 Streator High School # 40 3,645 5,512,552 < 1 Village of Ransom 136 36,982 < 1
Source: Exelon 2015r

Affected Environment
3-97
In addition, Exelon makes annual payments to the Illinois Emergency Management Agency for LSCS. These annual payments are listed in Table 3–28. Smaller amounts are paid on an intermittent and voluntary basis to local emergency management agencies and government agencies that participate in emergency management activities.
Table 3–28. Annual Payments to Illinois Emergency Management Agency 2009–2014
Year Amount Paid (dollars) 2009 3,356,117 2010 3,575,454 2011 3,790,603 2012 4,084,540 2013 4,084,540 2014 4,014,846
Source: Exelon 2015s
Exelon anticipates no change in State or local tax laws, rates or assessments that would result in notable future increases or decreases in property taxes or other payments to State or local governments with respect to LSCS during the license renewal term. However, new property tax settlement agreements could result in higher or lower property tax assessments and higher or lower property tax payments.
3.10.6 Local Transportation
The region surrounding LSCS has a highly developed roadway network. Interstate 80 (I-80) runs east and west approximately 8 mi (13 km) north of LSCS. Interstate 55 runs northeast to southwest approximately 15 mi (24 km) east of LSCS. US-51/I-39 runs north and south approximately 21 mi (35 km) west of LSCS. Interstate 80 and I-55 provide access to the LSCS site from Chicago to the northeast. County Road 6, also known as North 21st Road and Grand Ridge-Mazon Road, runs parallel to LSCS’s southern boundary and provides access to the LSCS site. State Highway 170 is 0.5 mi (0.8 km) east of the site and County Road 30, also known as East 25th Road, is slightly west of the site. The CSX Railroad is the closest railroad line to LSCS. It runs parallel to and slightly north of the Illinois River. A 6 mi (10 km) rail spur connects LSCS to the Atchison, Topeka, and Santa Fe Railroad south of the site (Exelon 2014a). Table 3–29 lists commuting routes to the LSCS site and average annual daily traffic volume values. The average annual daily traffic values represent traffic volumes for a 24-hour period factored by both the day of the week and the month of the year.
Table 3–29. Major Commuting Routes in the Vicinity of LSCS: 2013-2014 Average Annual Daily Traffic Count
Roadway and Location Average Annual Daily
Traffic (AADT) County Road 6 (North 21st Road) near LSCS 2,200
County Road 6 (North 21st Road) and Illinois 170 (East 29th Road) 1,800
Illinois 170 (East 29th Road) between River Street and US 6 in Seneca 7,500
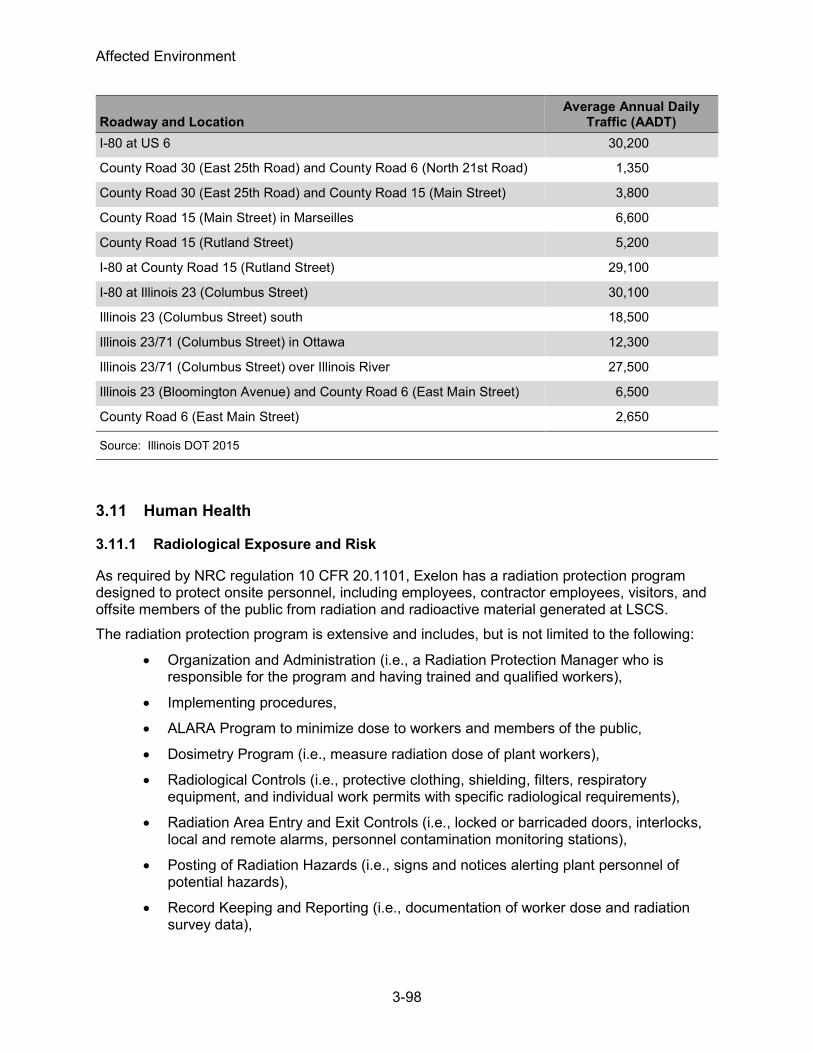
Affected Environment
3-98
Roadway and Location Average Annual Daily
Traffic (AADT) I-80 at US 6 30,200
County Road 30 (East 25th Road) and County Road 6 (North 21st Road) 1,350
County Road 30 (East 25th Road) and County Road 15 (Main Street) 3,800
County Road 15 (Main Street) in Marseilles 6,600
County Road 15 (Rutland Street) 5,200
I-80 at County Road 15 (Rutland Street) 29,100
I-80 at Illinois 23 (Columbus Street) 30,100
Illinois 23 (Columbus Street) south 18,500
Illinois 23/71 (Columbus Street) in Ottawa 12,300
Illinois 23/71 (Columbus Street) over Illinois River 27,500
Illinois 23 (Bloomington Avenue) and County Road 6 (East Main Street) 6,500
County Road 6 (East Main Street) 2,650
Source: Illinois DOT 2015
3.11 Human Health
3.11.1 Radiological Exposure and Risk
As required by NRC regulation 10 CFR 20.1101, Exelon has a radiation protection program designed to protect onsite personnel, including employees, contractor employees, visitors, and offsite members of the public from radiation and radioactive material generated at LSCS. The radiation protection program is extensive and includes, but is not limited to the following:
• Organization and Administration (i.e., a Radiation Protection Manager who is responsible for the program and having trained and qualified workers),
• Implementing procedures,
• ALARA Program to minimize dose to workers and members of the public,
• Dosimetry Program (i.e., measure radiation dose of plant workers),
• Radiological Controls (i.e., protective clothing, shielding, filters, respiratory equipment, and individual work permits with specific radiological requirements),
• Radiation Area Entry and Exit Controls (i.e., locked or barricaded doors, interlocks, local and remote alarms, personnel contamination monitoring stations),
• Posting of Radiation Hazards (i.e., signs and notices alerting plant personnel of potential hazards),
• Record Keeping and Reporting (i.e., documentation of worker dose and radiation survey data),

Affected Environment
3-99
• Radiation Safety Training (i.e., classroom training and use of mockups to simulate complex work assignments),
• Radioactive Effluent Monitoring Management (i.e., control and monitor radioactive liquid and gaseous effluents released into the environment),
• Radioactive Environmental Monitoring (i.e., sampling and analysis of environmental media, such as air, water, vegetation, food crops, direct radiation, and milk to measure the levels of radioactive material in the environment that may impact human health), and
• Radiological Waste Management (i.e., control, monitor, process, and dispose of radioactive solid waste).
Regarding the radiation exposure to LSCS personnel, the NRC staff reviewed the data contained in NUREG–0713, “Occupational Radiation Exposure at Commercial Nuclear Power Reactors and Other Facilities 2014: Forty-Seventh Annual Report” (NUREG–0713, Volume 36) (NRC 2016b). This report, which was the most recent available at the time of this review, summarizes the occupational exposure data through 2014 that are maintained in the NRC’s Radiation Exposure Information and Reporting System database. Nuclear power plants are required by 10 CFR 20.2206 to report their occupational exposure data to the NRC annually. NUREG–0713 calculates a 3-year average collective dose per reactor for all nuclear power reactors licensed by the NRC. The 3-year average collective dose is one of the metrics that the NRC uses in the Reactor Oversight Program to evaluate the applicant’s ALARA program. Collective dose is the sum of the individual doses received by workers at a facility licensed to use radioactive material over a 1-year time period. There are no NRC or EPA standards for collective dose. Based on the data for operating BWRs like those at LSCS, the average annual collective dose per reactor was 119 person-rem. In comparison, LSCS had a reported annual collective dose per reactor of 162 person-rem. In addition, as reported in NUREG–0713, for 2014, no worker at LSCS received an annual dose greater than 2.0 rem (0.02 Sv), which is less than half of the NRC occupational dose limit of 5.0 rem (0.05 Sv) in 10 CFR 20.1201.
3.11.2 Chemical Hazards
The use, storage, and discharge of chemicals, biocides, and sanitary wastes, as well as minor chemical spills are regulated by state and Federal environmental agencies. Chemical hazards to LSCS’s workers during the license renewal term are expected to be minimized by implementing good industrial hygiene practices as required by Federal and State regulations. Discharges of chemical and sanitary wastes are monitored and controlled as part of the LSCS’s NPDES permit IL0048151 to minimize impacts to the public and the environment (Exelon 2014a).
3.11.3 Microbiological Hazards
Nuclear plants such as LSCS that discharge thermal effluents to cooling ponds, lakes, canals, or rivers have the potential to promote the increased growth of thermophilic microorganisms, which could result in adverse health effects for plant workers and the public. Microorganisms of particular concern include several types of bacteria (Legionella spp., Salmonella spp., Shigella spp., thermophilic fungi, and Pseudomonas aeruginosa) and the free-living amoeba Naegleria fowleri.
Affected Environment
3-100
Nuclear plant workers can be exposed to Legionella spp. when performing maintenance activities on plant cooling systems if workers inhale cooling tower vapors because vapors are often within the optimum temperature range for Legionella growth. Plant personnel most likely to come in contact with Legionella aerosols would be workers who clean biofilms off of condenser tubes, cooling towers, and related system components or equipment. Exposure of the public to Legionella from nuclear plant operations is generally not a concern because Legionella exposure would be confined to a small area of the site within the protected area. LSCS does not have cooling towers so exposure of workers to Legionella is unlikely. The public can be exposed to the thermophilic microorganisms Salmonella, Shigella, P. aeruginosa, and N. fowleri during swimming, boating, or other recreational uses of freshwater. If a nuclear plant’s thermal effluent enhances the growth of thermophilic microorganisms, recreational users could experience an elevated risk of exposure when using waters near the plant’s discharge. 3.11.3.1 Thermophilic Microorganisms of Concern
Legionella is a genus of common warm water bacteria that occurs in lakes, ponds, and other surface waters, as well as some groundwater sources and soils. The bacteria are pathogenic to humans when aerosolized and inhaled into the lungs. Approximately 2 to 5 percent of those exposed in this way to Legionella develop an acute bacterial infection of the lower respiratory tract known as Legionnaires’ disease (Pearson 2003). Optimal growth occurs in stagnant surface waters with biofilms or slimes that range in temperature from 35 to 45 °C (95 to 113 °F), though the bacteria can persist in waters from 20 to 50 °C (68 to 122 °F) (Pearson 2003). Elderly and immunocompromised individuals are most susceptible to Legionnaires’ disease (Pearson 2003). According to data from the Centers for Disease Control and Prevention (CDC) (CDC 2011a) from 2000 through 2009, New England and Mid-Atlantic states generally had the highest number of reported legionellosis cases each year. Approximately 2,000 serotypes of Salmonella spp. cause the bacterial infection salmonellosis in humans. Of these, the serotypes Typhimurium and Enteritidis are the most common in the United States (CDC 2010a). Salmonellosis is most common in summer months, and it is transmitted through contact with food, water, or animals contaminated with human or animal feces (CDC 2010a). The bacteria have an optimal growth temperature of 37 °C (98.6 °F) but can grow at temperatures ranging from 6 to 46 °C (43 to 115 °F) (Albrecht 2013a). Studies examining the persistence of Salmonella spp. outside of a host have found that Salmonella can survive for several months in water and in aquatic sediments (Moore et al. 2003). Shigella is a genus of bacteria species that causes shigellosis (i.e., bacterial dysentery), which is spread through consuming fecal-contaminated food or water, by swimming in contaminated water, or by contact with an infected person through contaminated feces and unhygienic handling of food. Its optimum growth temperature is 37 °C (98.6 °F), though it can grow in water temperatures ranging from 10 to 40 °C (50 to 104 °F) (Albrecht 2013b). Shigellosis is most common in summer months and among toddlers age 2 to 4 who are not fully toilet trained and in childcare settings (CDC 2013e). Pseudomonas aeruginosa is a free-living bacterium found in soil, water, sewage, plant surfaces and the skin of healthy individuals. It is most commonly linked to infections transmitted in healthcare settings. However, as a waterborne pathogen, it can cause ear infections (i.e., “swimmer’s ear”), eye infections, and skin rashes after exposure to contaminated hot tubs, swimming pools, or other recreational waters (CDC 2013a). Its optimum growth temperature is 37 °C (98.6 °F), though it can grow at temperatures as high as 42 °C (107.6 °F) (Todar 2004). P. aeruginosa almost exclusively infects immunocompromised individuals or already injured or inflamed sites on the skin (Todar 2004).

Affected Environment
3-101
Naegleria fowleri is a free-living amoeba that occurs in warm lakes, rivers, or hot springs. It is the causative agent of human primary amoebic meningoencephalitis (PAM). Infection occurs when contaminated freshwater enters the nose, and the amoeba migrates to brain tissue; the ensuing illness is usually fatal (CDC 2013b). N. fowleri grows best at higher temperatures up to 46 °C (115 °F) (CDC 2013b), though it has also been isolated from thermally altered waters surrounding power plant discharges at temperatures ranging from 35 to 41 °C (95 to 105.8 °F) (Stevens et al. 1977). 3.11.3.2 Prevalence of Waterborne Diseases Associated with Recreational Waters
From 2002 through 2011, the CDC (2003, 2004a, 2005, 2006a, 2007, 2008a, 2009, 2010b, 2011b, 2012) reported an average of 2,774 cases of Legionnaires’ disease per year, of which between 28 and 151 per year were reported from Illinois. The Illinois Department of Public Health (IDPH) indicates that approximately 1,500 to 2,000 cases of salmonellosis are reported in the State each year (IDPH 2009), and the overwhelming majority of salmonellosis cases are foodborne (CDC 2010a). The CDC reports biannually on waterborne disease outbreaks associated with recreational waters. A review of the past 10 available data years (1999 through 2008) of these reports indicates that no outbreaks or cases of waterborne Salmonella infection from recreational waters occurred in the United States during this timeframe (CDC 2002, 2004b, 2006b, 2008b, 2011c). From 2006 to 2013, all CDC-reported salmonellosis outbreaks have been caused by contaminated produce, meats, or prepared foods or through contact with contaminated animals (CDC 2013d). Approximately 1,300 confirmed cases of shigellosis are reported in Illinois each year (IDPH 2013). CDC reports (2002, 2004b, 2006b, 2008b, 2011c) indicate that less than a dozen shigellosis outbreaks have been attributed to lakes, reservoirs, and other recreational waters in the past 10 available data years (1999 through 2008). None of these cases was in Illinois. Infections attributed to Pseudomonas aeruginosa are most commonly contracted in pools, spas, and hot tubs. No cases of infection linked to contaminated recreational waters in the United States have been reported within the past 10 available data years (1999 through 2008) (CDC 2002, 2004b, 2006b, 2008b, 2011c). The N. fowleri-caused disease, PAM, is rare in the United States. Since 1962, between zero and eight cases of PAM have been reported to the CDC annually, and no cases have been reported in Illinois (CDC 2013c).
3.11.4 Electromagnetic Fields
Based on the GEIS, the Commission found that electric shock resulting from direct access to energized conductors or from induced charges in metallic structures has not been found to be a problem at most operating plants and generally is not expected to be a problem during the license renewal term. However, a site-specific review is required to determine the significance of the electric shock potential along the portions of the transmission lines that are within the scope of this SEIS. In the GEIS, the NRC found that without a review of the conformance of each nuclear plant transmission line with National Electrical Safety Code® (NESC®) criteria, it was not possible to determine the significance of the electric shock potential (IEEE 2002). Evaluation of individual plant transmission lines is necessary because the issue of electric shock safety was not addressed in the licensing process for some plants. For other plants, land use in the vicinity of transmission lines may have changed, or power distribution companies may have chosen to upgrade line voltage. To comply with 10 CFR 51.53(c)(3)(ii)(H), the applicant must provide an

Affected Environment
3-102
assessment of the impact of the proposed action on the potential shock hazard from the transmission lines if the transmission lines that were constructed for the specific purpose of connecting the plant to the transmission system do not meet the recommendations of the NESC for preventing electric shock from induced currents. The NRC uses the NESC criteria and the applicant’s adherence to those criteria during the current operating license as a baseline to assess the potential human health impact of the induced current from an applicant’s transmission lines. As discussed in the GEIS, the issue of electric shock is of small significance for transmission lines that are operated in adherence with the NESC criteria. As discussed in Section 3.1.6 of this SEIS, transmission lines that are within the scope of the NRC’s license renewal environmental review are limited to those transmission lines that connect the nuclear plant to the substation where electricity is fed into the regional distribution system and transmission lines that supply power to the nuclear plant from the grid (NRC 2013). As indicated by Exelon in its ER, no offsite transmission lines are in-scope for the environmental review for license renewal. The only transmission lines that are in scope for license renewal are onsite; the lines from the LSCS power block to the LSCS switchyard (Exelon 2014a). The public does not have access to this area and could not come into contact with these lines. Therefore, there is no potential shock hazard to members of the public from these transmission lines. As discussed in Section 3.11.5 of this SEIS, LSCS maintains an occupational safety program in accordance with the Occupational Safety & Health Administration regulations for its workers, which includes protection from acute electric shock.
3.11.5 Other Hazards
Two additional human health issues are addressed in this section: physical occupational hazards and electric shock hazards. Nuclear power plants are industrial facilities that have many of the typical occupational hazards found at any other electric power generation facility. Workers at or around nuclear power plants would be involved in some electrical work, electric power line maintenance, repair work, and maintenance activities and exposed to some potentially hazardous physical conditions (e.g., falls, excessive heat, cold, noise, electric shock, and pressure). The issue of physical occupational hazards is generic to all nuclear power plants. The Occupational Safety and Health Administration (OSHA) is responsible for developing and enforcing workplace safety regulations. OSHA was created by the Occupational Safety and Health Act of 1970 (29 USC 651 et seq.), which was enacted to safeguard the health of workers. With specific regard to nuclear power plants, plant conditions that result in an occupational risk, but do not affect the safety of licensed radioactive materials, are under the statutory authority of OSHA rather than the NRC as set forth in a Memorandum of Understanding (53 FR 43950) between the NRC and OSHA. Occupational hazards can be minimized when workers adhere to safety standards and use appropriate protective equipment; however, fatalities and injuries from accidents can still occur. LSCS maintains an occupational safety program in accordance with the OSHA regulations for its workers, which includes protection from acute electric shock. LSCS participates in the OSHA Voluntary Protection Program (VPP) (OSHA 2015a). The VPP recognizes employers and workers in the private industry and Federal agencies who have implemented effective safety and health management systems and maintain injury and illness rates below national Bureau of Labor Statistics averages for their respective industries. In the VPP, management, labor, and OSHA establish cooperative relationships at workplaces that have implemented a comprehensive safety and health management system. Approval into VPP is OSHA’s official recognition of the outstanding efforts of employers and employees who have

Affected Environment
3-103
achieved exemplary occupational safety and health (OSHA 2015b). LSCS holds the “Star” rating in the VPP, which indicates “participants whose safety and health management systems operate in a highly effective, self-sufficient manner and meet all VPP requirements. Star is the highest level of VPP participation” (OSHA 2008).
3.12 Environmental Justice
Under Executive Order (EO) 12898 (59 FR 7629), Federal agencies are responsible for identifying and addressing, as appropriate, disproportionately high and adverse human health and environmental impacts on minority and low-income populations. Independent agencies, such as the NRC, are not bound by the terms of EO 12898 but are, as stated in paragraph 6-604 of the EO, “requested to comply with the provisions of [the] order.” In 2004, the Commission issued a Policy Statement on the Treatment of Environmental Justice Matters in NRC Regulatory and Licensing Actions (69 FR 52040), which states, “The Commission is committed to the general goals set forth in EO 12898, and strives to meet those goals as part of its NEPA review process.” The Council on Environmental Quality (CEQ) provides the following information in Environmental Justice: Guidance Under the National Environmental Policy Act (CEQ 1997):
Disproportionately High and Adverse Human Health Effects. Adverse health effects are measured in risks and rates that could result in latent cancer fatalities, as well as other fatal or nonfatal adverse impacts on human health. Adverse health effects may include bodily impairment, infirmity, illness, or death. Disproportionately high and adverse human health effects occur when the risk or rate of exposure to an environmental hazard for a minority or low-income population is significant (as employed by NEPA) and appreciably exceeds the risk or exposure rate for the general population or for another appropriate comparison group (CEQ 1997).
Disproportionately High and Adverse Environmental Effects. A disproportionately high environmental impact that is significant (as employed by NEPA) refers to an impact or risk of an impact on the natural or physical environment in a low-income or minority community that appreciably exceeds the environmental impact on the larger community. Such effects may include ecological, cultural, human health, economic, or social impacts. An adverse environmental impact is an impact that is determined to be both harmful and significant (as employed by NEPA). In assessing cultural and aesthetic environmental impacts, impacts that uniquely affect geographically dislocated or dispersed minority or low-income populations or American Indian tribes are considered (CEQ 1997).
The environmental justice analysis assesses the potential for disproportionately high and adverse human health or environmental effects on minority and low-income populations that could result from the operation of LSCS during the renewal term. In assessing the impacts, the following definitions of minority individuals and populations and low-income population were used (CEQ 1997):
Minority individuals Individuals who identify themselves as members of the following population groups: Hispanic or Latino, American Indian or Alaska Native, Asian, Black or African American, Native Hawaiian or Other Pacific Islander, or two or more races, meaning individuals who identified themselves on a Census form as being a member of two or more races, for example, White and Asian.

Affected Environment
3-104
Minority populations Minority populations are identified when (1) the minority population of an affected area exceeds 50 percent or (2) the minority population percentage of the affected area is meaningfully greater than the minority population percentage in the general population or other appropriate unit of geographic analysis.
Low-income population Low-income populations in an affected area are identified with the annual statistical poverty thresholds from the Census Bureau's Current Population Reports, Series P60, on Income and Poverty.
3.12.1 Minority Population
According to 2010 Census data, approximately 21 percent of the population residing within a 50-mi (80-km) radius of LSCS identified themselves as minority individuals. The largest minority group was Hispanic or Latino (of any race) (9.7 percent), followed by Black or African American (6.4 percent) (USCB 2015e). According to USCB’s (USCB’s) 2010 Census data, minority populations in the socioeconomic ROI (LaSalle, Grundy, and Will Counties) composed 28.6 percent of the total three-county population (see Table 3–20). Figure 3–17 shows predominantly minority population block groups, using 2010 Census data for race and ethnicity, within a 50-mi (80-km) radius of LSCS. Census block groups were considered minority population block groups if the percentage of the minority population within any block group exceeded 21 percent (the percent of the minority population within the 50-mi radius of LSCS). A minority population exists if the percentage of the minority population within the block group is meaningfully greater than the minority population percentage in the 50-mi (80-km) radius. Approximately 400 of the census block groups located within the 50-mi (80-km) radius of LSCS have meaningfully greater minority populations. As shown in Figure 3–17, minority population block groups (race and ethnicity) are mostly clustered near Chicago, Illinois. None of the block groups near to LSCS have meaningfully greater minority populations. According to the USCB’s “2014 American Community Survey 1-Year Estimates,” since 2010, minority populations in the ROI increased by approximately 17,700 persons (an increase of 7.4 percent) and now comprise 30.5 percent of the ROI population (see Table 3–21). The largest increases occurred in the Hispanic or Latino population (an increase of approximately 8,900 persons or 7.5 percent) and Asian population (an increase of approximately 5,800 persons or 18.5 percent) (USCB 2015b).
3.12.2 Low-Income Population
According to 2010 American Community Survey data, 9 percent of individuals residing within a 50-mi (80-km) radius of LSCS were identified as living below the Federal poverty threshold in 2010 (USCB 2015e). The 2010 Federal poverty threshold was $22,113 for a family of four. Figure 3–18 shows the location of predominantly low-income population block groups within a 50-mi (80 km) radius of LSCS. Census block groups were considered low-income population block groups if the percentage of individuals living below the Federal poverty threshold within any block group exceeded the percent of the individuals living below the Federal poverty threshold within the 50-mi radius of LSCS. Approximately 490 of the 1,269 census block groups
Affected Environment
3-105
located within the 50-mi (80-km) radius of LSCS have meaningfully greater low-income populations. As shown in Figure 3–18, low-income population block groups are evenly distributed around LSCS. The LSCS site is not located in a low-income population block group. The nearest low-income population block group is located south and east of the block group containing LSCS. According to the USCB’s “2014 American Community Survey 1-Year Estimates,” 10.5 percent of families and 14.4 percent of individuals in Illinois were living below the Federal poverty threshold and the median household and per capita incomes for Illinois was $57,444 and $30,417, respectively (USCB 2015b). In the socioeconomic ROI, people living in LaSalle County had median household and per capita incomes below the State average. The median household and per capita income averages in LaSalle County were $50,432 and $25,129, respectively, with 9.6 percent of families and 13.3 percent of individuals living below the poverty level. In comparison to the State of Illinois and LaSalle County, Will County had higher median household and per capita income averages ($74,828 and $32,148, respectively) and lower percentages of families (6.3 percent) and individuals (7.9 percent) living below the poverty level (USCB 2015b). According to the USCB’s “2011-2013 American Community Survey 3-Year Estimates,” Grundy County also had higher median household and per capita income averages ($63,978 and $28,465, respectively) and lower percentages of families (7.2 percent) and individuals (9.4 percent) living below the poverty level than the State of Illinois and LaSalle County (USCB 2015b).

Affected Environment
3-106
Figure 3–17. Minority Block Groups within a 50-mi (80-km) Radius of LSCS
Source: USCB 2015e
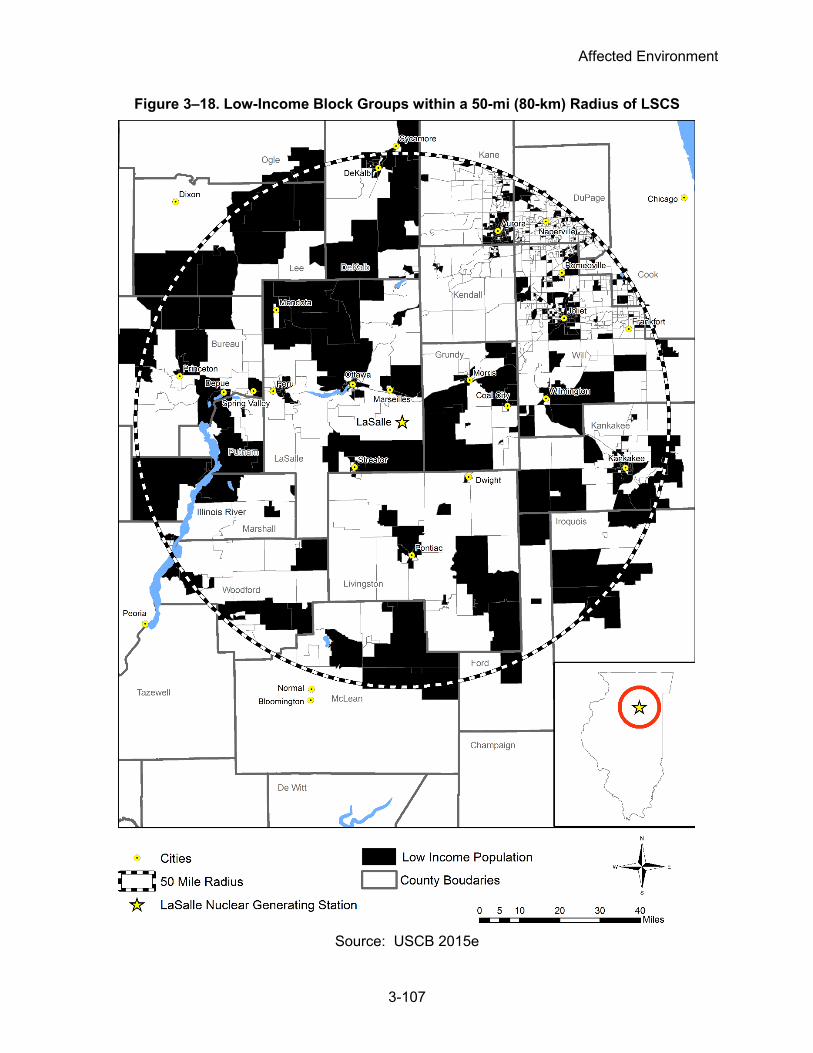
Affected Environment
3-107
Figure 3–18. Low-Income Block Groups within a 50-mi (80-km) Radius of LSCS
Source: USCB 2015e

Affected Environment
3-108
3.13 Waste Management and Pollution Prevention
3.13.1 Radioactive Waste
As discussed in Section 3.1.4 of this SEIS, LSCS uses liquid, gaseous, and solid waste processing systems to collect and treat, as needed, radioactive materials produced as a byproduct of plant operations. Radioactive materials in liquid and gaseous effluents are reduced prior to being released into the environment so that the resultant dose to members of the public from these effluents is well within NRC and EPA dose standards. Radionuclides that can be efficiently removed from the liquid and gaseous effluents prior to release are converted to a solid waste form for disposal in a licensed disposal facility.
3.13.2 Nonradioactive Waste
Waste minimization and pollution prevention are important elements of operations at all nuclear power plants. Licensees are required to consider pollution prevention measures as dictated by the Pollution Prevention Act (Public Law 101-508) and Resource Conservation and Recovery Act of 1976, as amended (Public Law 94-580) (NRC 2013). As described in Section 3.1.5, LSCS has a nonradioactive waste management program to handle nonradioactive waste in accordance with Federal, State, and corporate regulations and procedures. LSCS has waste minimization measures in place, as verified during the site visit conducted by the NRC staff in May 2015. This program includes appropriate recycling, thereby effecting waste reduction. LSCS has a Storm Water Pollution Prevention Plan (SWPPP) that identifies potential sources of pollution that may affect the quality of storm water discharges from each permitted outfall. The SWPPP also describes practices that are used to reduce pollutants in storm water discharges to assure compliance with the site’s NPDES permit. As part of LSCS’s Spill Prevention Control and Countermeasure Plan, measures are in place to monitor areas within the site that have the potential for spills of regulated substances, such as oil (Exelon 2014a).
3.14 References
10 CFR Part 20. Code of Federal Regulations, Title 10, Energy, Part 20, “Standards for protection against radiation.” 10 CFR Part 50. Code of Federal Regulations, Title 10, Energy, Part 50, “Domestic licensing of production and utilization facilities.” 10 CFR Part 51. Code of Federal Regulations, Title 10, Energy, Part 51, “Environmental protection regulations for domestic licensing and related regulatory functions.” 10 CFR Part 61. Code of Federal Regulations, Title 10, Energy, Part 61, “Licensing requirements for land disposal of radioactive waste.” 10 CFR Part 71. Code of Federal Regulations, Title 10, Energy, Part 71, “Packaging and transportation of radioactive material.” 10 CFR Part 72. Code of Federal Regulations, Title 10, Energy, Part 72, “Licensing requirements for the independent storage of spent nuclear fuel, high-level radioactive waste, and reactor-related Greater than Class C waste.” 15 CFR Part 930. Code of Federal Regulations, Title 15, Commerce and Foreign Trade, Part 930, “Federal consistency with approved coastal management programs.”

Affected Environment
3-109
40 CFR Part 50. Code of Federal Regulations, Title 40, Protection of Environment, Part 50, “National primary and secondary ambient air quality standards.” 40 CFR Part 51. Code of Federal Regulations, Title 40, Protection of the Environment, Part 50, “National Primary and Secondary Ambient Air Quality Standards,” Washington, DC. 40 CFR Part 51. Code of Federal Regulations, Title 40, Protection of the Environment, Part 51, “Requirements for Preparation, Adoptions, and Submittal of Implementation Plans." Washington, D.C. 40 CFR Part 81. Code of Federal Regulations, Title 40, Protection of Environment, Part 81, "Designation of areas for air quality planning purposes." 40 CFR Part 98. Code of Federal Regulations, Title 40, Protection of Environment, Part 98, “Mandatory Greenhouse Gas Reporting”. 40 CFR Part 190. Code of Federal Regulations, Title 40, Protection of Environment, Part 190, “Environmental radiation protection standards for nuclear power operations.” 40 CFR Part 230. Code of Federal Regulations, Title 40, Protection of Environment, Part 230, “Section 404(b)(1) Guidelines for Specification of Disposal Sites for Dredged or Fill Material.” 49 CFR Parts 171–178. Code of Federal Regulations, Title 49, Transportation, Subchapter C—Hazardous Materials Regulations and “Specifications for packagings.” 50 CFR 17.3. U.S. Fish and Wildlife Service. 2006. “Endangered and Threatened Wildlife and Plants; Definitions.” 50 CFR Part 402. Code of Federal Regulations, Title 50, Wildlife and Fisheries, Part 402, “Interagency Cooperation—Endangered Species Act of 1973, as Amended.” 32 FR 4001. U.S. Fish and Wildlife Service. 1967. “Endangered Species.” Federal Register 32(48):4001. March 11, 1967. 41 FR 41914. U.S. Fish and Wildlife Service. 1976. “Endangered and Threatened Wildlife and Plants; Determination of Critical Habitat for American Crocodile, California Condor, Indiana Bat, and Florida Manatee.” Federal Register 41(187):41914–41916. September 24, 1976. 53 FR 43950. U.S. Department of Labor. “Memorandum of Understanding Between the Nuclear Regulatory Commission and the Occupational Safety and Health Administration; Worker Protection at NRC-licensed Facilities.” Federal Register 53 (210):43950-43952. October 31, 1988. 53 FR 5598. U.S. Fish and Wildlife Service. 1988. Endangered and Threatened Wildlife and Plants; Proposal to Determine Boltonia decurrens (Decurrent false aster) to be a Threatened a Threatened Species. Federal Register 53(37):5598-5602. February 25, 1988. 53 FR 45858. U.S. Fish and Wildlife Service. 1988. Endangered and Threatened Wildlife and Plants; Determination of Threatened Status for Boltonia decurrens (Decurrent False Aster). Federal Register 53(219):45858-45861. November 14, 1988. 54 FR 39857. U.S. Fish and Wildlife Service. 1989. Endangered and Threatened Wildlife and Plants; Determination of Threatened Status for Eastern and Western Prairie Fringed Orchids. Federal Register 54(187):29857-39863. September 28, 1989. 56 FR 19953. U.S. Fish and Wildlife Service. 1991. Endangered and Threatened Wildlife and Plants; Dalea foliosa (Leafy Prairie-Clover) Determined to be Endangered. Federal Register 56(84):19953-19959. May 1, 1991.
Affected Environment
3-110
59 FR 7629. Executive Order No. 12898. “Federal actions to address environmental justice in minority populations and low-income populations.” Federal Register 59(32):7629–7634. February 16, 1994. 69 FR 52040. U.S. Nuclear Regulatory Commission. “Policy statement on the treatment of environmental justice matters in NRC regulatory and licensing actions.” Federal Register 69(163):52040–52048. August 24, 2004. 69 FR 41576. U.S. Environmental Protection Agency. “National Pollutant Discharge Elimination System—Final Regulations to Establish Requirements for Cooling Water Intake Structures at Phase II Existing Facilities.” Federal Register 69(131):41576–41693. July 9, 2004. 74 FR 56260. Environmental Protection Agency. “Mandatory Reporting of Greenhouse Gases.” Federal Register 74(209): 56260-56519. October 30, 2009. 75 FR 31514. Environmental Protection Agency. “Prevention of Significant Deterioration and Title V Greenhouse Gas Tailoring Rule.” Federal Register 75(106):31514-31608. 77 FR 14914. U.S. Fish and Wildlife Service. “Endangered and Threatened Wildlife and Plants: Determination of Endangered Status for the Sheepnose and Spectaclecase Mussels Throughout Their Range.” Federal Register 77(49):14914-14949. March 13, 2012. 77 FR 38762. U.S. Fish and Wildlife Service. 2012. Endangered and Threatened Wildlife and Plants; 5-Year Status Reviews of Seven Listed Species. Federal Register 77(126):38762-38764. June 29, 2012. 78 FR 61046. U.S. Fish and Wildlife Service. 2013. Endangered and Threatened Wildlife and Plants; 12-Month Finding on a Petition To List the Eastern Small-Footed Bat and the Northern Long-Eared Bat as Endangered or Threatened Species; Listing the Northern Long-Eared Bat as an Endangered Species; Proposed Rule. Federal Register 78(194):61046-61080. October 2, 2013. 78 FR 72058. U.S. Fish and Wildlife Service. 2013. Endangered and Threatened Wildlife and Plants; Listing the Northern Long-Eared Bat as an Endangered Species. Federal Register 78(231):72058-72059. December 2, 2013. 80 FR 17974. U.S. Fish and Wildlife Service. “Endangered and Threatened Wildlife and Plants; Threatened Species Status for the Northern Long-Eared Bat with 4(d) Rule.” Federal Register 80(63):17974-8033. April 2, 2015. 35 IAC 1420.140(a). Illinois Administrative Code, Title 35, Environmental Protection, Part 1420, General Provisions, Section 140, Prohibitions. 35 IAC 201. Illinois Administrative Code, Title 35, Environmental Protection, "Subtitle B," Air Pollution Control Board Subchapter a, "Permits and General Provisions," Part 201 Permit and General Provisions. 35 IAC 301. Illinois Administrative Code, Title 35, Environmental Protection, Subtitle C, "Water Pollution," Chapter I, "Pollution Control Board," Part 301, “Introduction.” Illinois Pollution Control Board. Available at <http://www.ipcb.state.il.us/SLR/IPCBandIEPAEnvironmentalRegulations-Title35.aspx> (accessed 21 August 2015). 35 IAC 302. Illinois Administrative Code, Title 35, Environmental Protection, Subtitle C, "Water Pollution," Chapter I, "Pollution Control Board," Part 302, “Water Quality Standards.” Illinois Pollution Control Board. Available at <http://www.ipcb.state.il.us/SLR/IPCBandIEPAEnvironmentalRegulations-Title35.aspx> (accessed 21 August 2015).
Affected Environment
3-111
35 IAC 303. Illinois Administrative Code, Title 35, Environmental Protection, Subtitle C, “Water Pollution,” Chapter I, “Pollution Control Board,” Part 303, “Water Use Designations and Site Specific Water Quality Standards.” Illinois Pollution Control Board. Available at <http://www.ipcb.state.il.us/SLR/IPCBandIEPAEnvironmentalRegulations-Title35.aspx> (accessed 21 August 2015). 35 IAC 309. Illinois Administrative Code, Title 35, Environmental Protection, Subtitle C, “Water Pollution,” Chapter I, “Pollution Control Board,” Part 309, “Permits,” Subpart A, “NPDES Permits.” Illinois Pollution Control Board. Available at <http://www.ipcb.state.il.us/SLR/IPCBandIEPAEnvironmentalRegulations-Title35.aspx> (accessed 21 August 2015). 35 IAC 733. Illinois Administrative Code, Title 35, Environmental Protection, Part 733, Standards for Universal Waste Management. 35 IAC 900, Illinois Administrative Code, Title 35, Environmental Protection, Subtitle H, “Noise,” Chapter I, “Pollution Control Board.” 525 ILCS 45. Illinois Compiled Statutes. Chapter 525, “Conservation,” Act, “Water Use Act of 1983,” as amended. Available at <http://www.ilga.gov/legislation/ilcs/ilcs3.asp?ActID=1743&ChapterID=44> (accessed 21 August 2015). [AEC] U.S. Atomic Energy Commission. 1973. Final Environmental Statement Related to the LaSalle County Nuclear Station. February 1972. Washington, DC: AEC. 287 p. ADAMS No. ML15043A501. Albrecht JA. 2013a. “University of Nebraska-Lincoln: UNL Food: Bacteria Causing Foodborne Illness: Salmonella.” Available at <http://food.unl.edu/web/safety/salmonella> (accessed 23 October 2013). Albrecht JA. 2013b. “University of Nebraska-Lincoln: UNL Food: Bacteria Causing Foodborne Illness: Shigella.” Available at <http://food.unl.edu/web/safety/shigella> (accessed 23 October 2013). Arnold TL, Sullivan DJ, Harris MA, Fitzpatrick FA, Scudder BC, Ruhl PM, Hanchar DW, Stewart JS. 1999. Environmental Setting of the Upper Illinois River Basin and Implications for Water Quality. Urbana, IL: U.S. Geological Survey, WRD. Water-Resources Investigations Report 98–4268. Available at <http://il.water.usgs.gov/nawqa/uirb/pubs/reports/WRIR_98-4268.pdf> (accessed 21 August 2015). Ataner S, Butler S. 2013. Geologic Field Trip to the Starved Rock State Park Area, LaSalle County, Illinois, Guidebook for the field trip held on October 6, 2013 in conjunction with the 50th Anniversary Annual Meeting of The Clay Minerals Society held at the University of Illinois at Urbana-Champaign. October 6, 2013. Available at <http://www.clays.org/annual%20meeting/50th_annual_meeting_website/docs/CMS13-Fieldtrip-Guide-StarvedRock.pdf> (accessed 31 December 2014). Bald and Golden Eagle Protection Act of 1940, as amended. 16 U.S.C. § 668–668c. Baldwin, E. 1877. History of LaSalle County Illinois: Its Topography, Geology, Botany, Natural History, History of the Mound Builders, Indian Tribes, French Explorations, and A Sketch of the Pioneer Settlers of Each Town to 1840, with an Appendix, Giving the Present Status of the County, Its Population, Resources, Manufactures, and Institutions. Chicago, IL: Rand McNally and Company, 552 p.
Affected Environment
3-112
Barbour MT, Gerritsen J, Snyder BD, Stribling JB. 1999. Rapid Bioassessment Protocols for Use in Streams and Wadeable Rivers: Periphyton, Benthic Macroinvertebrates, and Fish. Second Edition. Appendix C: Tolerance and Trophic Guilds of Selected Fish Species. Washington, DC: U.S. Environmental Protection Agency. EPA 841-B-99-002. Available at <http://water.epa.gov/scitech/monitoring/rsl/bioassessment/index.cfm> (accessed 3 April 2014). [BLS] Bureau of Labor Statistics. 2015. “Local Area Unemployment Statistics.” July 1, 2015. Available at <http://www.bls.gov/data/> (accessed October 2015). [CAPS] Circular Area Profiles. 2014. Missouri Census Data Center. Circular Area Profiles (CAPS) - Version 10C (Revision 4-24-14) Using Data from Summary File 1, 2010 Census. In a 20-mile and 50-mile radius around LSCS (41.24555 Lat., 88.66826 Long). Available at <http://mcdc.missouri.edu/websas/caps10c.html> (accessed October 2015). [CDC] Centers for Disease Control and Prevention. 2002. “Surveillance for Waterborne-Disease Outbreaks—United States, 1999–2000.” Morbidity and Mortality Weekly Report 51(8):1–28. November 22, 2002. Available at <http://www.cdc.gov/mmwr/preview/mmwrhtml/ss5108a1.htm> (accessed 23 October 2013). [CDC] Centers for Disease Control and Prevention. 2003. Summary of Notifiable Diseases—United States, 2001. Morbidity and Mortality Weekly Report 50(53). Atlanta, GA: CDC. May 2, 2003. 136 p. Available at <http://www.cdc.gov/mmwr/PDF/wk/mm5053.pdf> (accessed 22 October 2013). [CDC] Centers for Disease Control and Prevention. 2004a. Summary of Notifiable Diseases—United States, 2002. Morbidity and Mortality Weekly Report 51(53). Atlanta, GA: CDC. April 30, 2004. 88 p. Available at <http://www.cdc.gov/mmwr/PDF/wk/mm5153.pdf> (accessed 22 October 2013). [CDC] Centers for Disease Control and Prevention. 2004b. “Surveillance for Waterborne-Disease Outbreaks and Other Health Events Associated with Recreational Water—United States, 2001–2002.” Morbidity and Mortality Weekly Report 53(8):1–22. October 22, 2004. Available at <http://www.cdc.gov/mmwr/preview/mmwrhtml/ss5308a1.htm> (accessed 23 October 2013). [CDC] Centers for Disease Control and Prevention. 2005. Summary of Notifiable Diseases—United States, 2003. Morbidity and Mortality Weekly Report 52(54). Atlanta, GA: CDC. April 22, 2005. 88 p. Available at <http://www.cdc.gov/mmwr/PDF/wk/mm5254.pdf> (accessed 22 October 2013). [CDC] Centers for Disease Control and Prevention. 2006a. Summary of Notifiable Diseases—United States, 2004. Morbidity and Mortality Weekly Report 53(53). Atlanta, GA: CDC. June 16, 2006. 84 p. Available at <http://www.cdc.gov/mmwr/PDF/wk/mm5353.pdf> (accessed 22 October 2013). [CDC] Centers for Disease Control and Prevention. 2006b. “Surveillance for Waterborne Disease and Outbreaks and Other Health Events Associated with Recreational Water—United States, 2003–2004.” Morbidity and Mortality Weekly Report 55(12):1–24. December 22, 2006. Available at <http://www.cdc.gov/mmwr/preview/mmwrhtml/ss5512a1.htm> (accessed 23 October 2013). [CDC] Centers for Disease Control and Prevention. 2007. Summary of Notifiable Diseases—United States, 2005. Morbidity and Mortality Weekly Report 54(53). Atlanta, GA: CDC. March 30, 2007. 96 p. Available at <http://www.cdc.gov/mmwr/PDF/wk/mm5453.pdf> (accessed 22 October 2013).

Affected Environment
3-113
[CDC] Centers for Disease Control and Prevention. 2008a. Summary of Notifiable Diseases—United States, 2006. Morbidity and Mortality Weekly Report 55(53). Atlanta, GA: CDC. March 21, 2008. 100 p. Available at <http://www.cdc.gov/mmwr/PDF/wk/mm5553.pdf> (accessed 22 October 2013). [CDC] Centers for Disease Control and Prevention. 2008b. “Surveillance for Waterborne Disease and Outbreaks Associated with Recreational Water Use and Other Aquatic Facility-Associated—United States, 2005-2006.” Morbidity and Mortality Weekly Report 57(9):1–29. September 9, 2008. Available at <http://www.cdc.gov/mmwr/preview/mmwrhtml/ss5709a1.htm> (accessed 23 October 2013). [CDC] Centers for Disease Control and Prevention. 2009. Summary of Notifiable Diseases—United States, 2007. Morbidity and Mortality Weekly Report 56(53). Atlanta, GA: CDC. July 9, 2009. 100 p. Available at <http://www.cdc.gov/mmwr/PDF/wk/mm5653.pdf> (accessed 22 October 2013). [CDC] Centers for Disease Control and Prevention. 2010a. “General Information on Salmonella.” April 5, 2012. Available at <http://www.cdc.gov/salmonella/general/> (accessed 23 October 2013). [CDC] Centers for Disease Control and Prevention. 2010b. Summary of Notifiable Diseases—United States, 2008. Morbidity and Mortality Weekly Report 57(54). Atlanta, GA: CDC. June 25, 2010. 100 p. Available at <http://www.cdc.gov/mmwr/PDF/wk/mm5754.pdf> (accessed 22 October 2013). [CDC] Centers for Disease Control and Prevention. 2011a. “Legionellosis—United States, 2000–2009.” Morbidity and Mortality Weekly Report 60(32):1083-1086. August 19, 2011. Available at <http://www.cdc.gov/mmwr/preview/mmwrhtml/mm6032a3.htm> (accessed 23 October 2013). [CDC] Centers for Disease Control and Prevention. 2011b. Summary of Notifiable Diseases—United States, 2009. Morbidity and Mortality Weekly Report 58(53). Atlanta, GA: CDC. May 13, 2011. 104 p. Available at <http://www.cdc.gov/mmwr/PDF/wk/mm5853.pdf> (accessed 22 October 2013). [CDC] Centers for Disease Control and Prevention. 2011c. “Surveillance for Waterborne Disease Outbreaks and Other Health Events Associated with Recreational Water—United States, 2007–2008.” Morbidity and Mortality Weekly Report 60(12):1–32. September 23, 2011. Available at <http://www.cdc.gov/mmwr/preview/mmwrhtml/ss6012a1.htm?s_cid=ss6012a1_w> (accessed 23 October 2013). [CDC] Centers for Disease Control and Prevention. 2012. Summary of Notifiable Diseases—United States, 2010. Morbidity and Mortality Weekly Report 59(53). Atlanta, GA: CDC. June 1, 2012. 116 p. Available at <http://www.cdc.gov/mmwr/PDF/wk/mm5953.pdf> (accessed 22 October 2013). [CDC] Centers for Disease Control and Prevention. 2013a. “Pseudomonas aeruginosa in Healthcare Settings—HAI.” Available at <http://www.cdc.gov/hai/organisms/pseudomonas.html> (accessed 23 October 2013). [CDC] Centers for Disease Control and Prevention. 2013b. “Naegleria fowleri—Primary Amebic Meningoencephalitis (PAM).” Available at <http://www.cdc.gov/parasites/naegleria/> (accessed 23 October 2013).
Affected Environment
3-114
[CDC] Centers for Disease Control and Prevention. 2013c. “Naegleria fowleri—Sources of Infection—Number of Case-reports of Primary Amebic Meningoencephalitis by State of Exposure: United States, 1962–2012.” June 6, 2013. Available at <http://www.cdc.gov/parasites/naegleria/state-map.html> (accessed 21 October 2013). [CDC] Centers for Disease Control and Prevention. 2013d. “Reports of Selected Salmonella Outbreak Investigations.” Available at <http://www.cdc.gov/salmonella/outbreaks.html> (accessed 23 October 2013). [CDC] Centers for Disease Control and Prevention. 2013e. “Shigellosis: General Information—NCZVED.” May 14, 2013. Available at <http://www.cdc.gov/nczved/divisions/dfbmd/diseases/shigellosis/> (accessed 23 October 2013). [CEC] Commission for Environmental Cooperation. 1997. Ecological Regions of North America: Toward a Common Perspective. Available at <http://www.cec.org/storage/42/3484_eco-eng_en.pdf> (accessed 5 August 2015). [CEC] Commission for Environmental Cooperation. 2008. “Ecoregions of North America–Level II.” Available at <http://www.eoearth.org/view/article/152145/> (accessed 9 March 2015). [CEQ] Council on Environmental Quality. 1997. Environmental Justice: Guidance under the National Environmental Policy Act. Available at <http://www.epa.gov/oecaerth/environmentaljustice/resources/policy/ej_guidance_nepa_ceq1297.pdf>. [CHC] Center for Hearing and Communication. Undated. “Common Environmental Noise Levels Factsheet.” Available at <http://www.chchearing.org/noise-center-home/facts-noise/common-environmental-noise-levels> (accessed 3 August 2015). Clean Air Act of 1970. 42 U.S.C. § 7401 et seq. Coastal Zone Management Act of 1972. 16 U.S.C. § 1451 et seq. [ComEd] Commonwealth Edison Company. 1977. LaSalle County Station Environmental Report Operating License Stage. Volume 1. May 10, 1977. ADAMS Nos. ML15273A414 and ML15273A415. Consolidated Appropriations Act of 2012. Pub. L. No. 112–74, 402, 125 Stat. 786, 883 (2011), Section 402. [CRA] Conestoga-Rovers & Associates. 2006. Hydrogeologic Investigation Report, Fleetwide Assessment LaSalle Generating Station Marseilles, Illinois, Revision 1. September 2006. ADAMS No. ML062760008. [DOI] U.S. Department of the Interior, National Park Service. 1998. National Register of Historic Places, Multiple Property Documentation Form, Archaeological Sites of Starved Rock State Park (9,000–150 B.P.). Available at http://pdfhost.focus.nps.gov/docs/NRHP/Text/64500198.pdf (accessed 16 June 2015). [DOI] U.S. Department of the Interior, National Park Service. 2015. National Register of Historic Places: Research. Available at <http://www.nps.gov/nr/research/> (accessed 28 August 2015). [EA] EA Engineering, Science, and Technology, Inc. 2000. Final Report LaSalle Station Aquatic Monitoring 1999, RM 249.7-248.8. Prepared for Commonwealth Edison Company, Marseilles, Illinois. September 2000. Deerfield, Illinois. ADAMS No. ML15273A420.

Affected Environment
3-115
[EA] EA Engineering, Science, and Technology, Inc. 2002. Assessment of the LaSalle County Station Cooling Pond. Prepared for Exelon Generation Company, LLC. March 2002. Deerfield, IL. ADAMS No. ML15195A368. [EA] EA Engineering, Science, and Technology, Inc. 2014. LaSalle County Station 2013 Fish and Benthos Monitoring and Historical Fish and Benthos Comparisons. Prepared for Exelon Generation Company, LLC, Kennett Square, Pennsylvania. May 2014. Deerfield, Illinois. ADAMS No. ML15273A419. [EA] EA Engineering, Science, and Technology, Inc. 2015. Final Impingement and Entrainment Characterization Study LaSalle County Station. Prepared for Exelon Generation Company, LLC, Kennett Square, Pennsylvania. August 2015. Deerfield, Illinois. ADAMS No. ML15273A204. [EA] EA Engineering, Science, and Technology, Inc. 2016. Annual Scientific Permit Report. To: Illinois Department of Natural Resources ORC – Scientific Permits; From: Larry Bushing, EA Scientist. March 9, 2016. ADAMS No. ML16169A181. Endangered Species Act of 1973, as amended. 16 U.S.C. § 1531 et seq. [EPA] Environmental Protection Agency. 1974. Information on Levels of Environmental Noise Requisite to Protect Public Health and Welfare with an Adequate Safety of Margin. Available at <http://www.fican.org/pdf/EPA_Noise_Levels_Safety_1974.pdf> (accessed 15 July 2015). [EPA] Environmental Protection Agency. 1981. Noise Effects Handbook: A Desk Reference to Health and Welfare. Available at <http://nepis.epa.gov/Exe/ZyNET.exe/9100OOAJ.TXT?ZyActionD=ZyDocument&Client=EPA&Index=1981+Thru+1985&Docs=&Query=&Time=&EndTime=&SearchMethod=1&TocRestrict=n&Toc=&TocEntry=&QField=&QFieldYear=&QFieldMonth=&QFieldDay=&IntQFieldOp=0&ExtQFieldOp=0&XmlQuery=&File=D%3A%5Czyfiles%5CIndex%20Data%5C81thru85%5CTxt%5C00000018%5C9100OOAJ.txt&User=ANONYMOUS&Password=anonymous&SortMethod=h%7C-&MaximumDocuments=1&FuzzyDegree=0&ImageQuality=r75g8/r75g8/x150y150g16/i425&Display=p%7Cf&DefSeekPage=x&SearchBack=ZyActionL&Back=ZyActionS&BackDesc=Results%20page&MaximumPages=1&ZyEntry=1&SeekPage=x&ZyPURL> (accessed 24 April 2015). [EPA] Environmental Protection Agency. 1992. Clarification of Prevention of Significance Deterioration (PSD) Guidance for Modelling Class I Area Impacts. Available at <http://www.epa.gov/ttn/nsr/gen/u3-11.txt> (accessed 15 July 2015). [EPA] Environmental Protection Agency. 2011. 2011 National Emissions Inventory Data. Available at <http://www3.epa.gov/ttn/chief/net/2011inventory.html> (accessed 24 April 2015). [EPA] U.S. Environmental Protection Agency. 2015a. “Envirofacts Search: PCS-ICIS.” [Permit Compliance System (PCS) and Integrated Compliance Information System (ICIS) databases]. Page updated June 24, 2014. Available at <http://www.epa.gov/enviro/facts/pcs-icis/search.html> (accessed 31 August 2015). [EPA] Environmental Protection Agency. 2015b. EPA, Enforcement and Compliance History Online, Exelon LaSalle County Station. Available at <http://echo.epa.gov/?redirect=echo> (accessed 22 April 2015). [EPA] Environmental Protection Agency. 2015c. EPA History: Noise and the Noise Control Act. Available at <http://www2.epa.gov/aboutepa/epa-history-noise-and-noise-control-act> (accessed 15 July 2015). [EPA] Environmental Protection Agency. 2015d. National Ambient Air Quality Standards. Available at <http://www.epa.gov/air/criteria.html> (accessed 10 July 2015).

Affected Environment
3-116
[EPA] U.S. Environmental Protection Agency. 2015e. “Safe Drinking Water Information System (SDWIS),” County Search— Grundy, LaSalle and Will Counties, Illinois. Available at <http://www.epa.gov/enviro/facts/sdwis/search.html> (accessed October 2015). [ESPA] Illinois Compiled Statutes, Chapter 520, Wildlife, Part 10, “Illinois Endangered Species Protection Act.” [Exelon] Exelon Generation Company, LLC. 2001. Letter from W. Riffer, Regulatory Assurance Manager, LaSalle County Station to U.S. NRC, Document control Desk. Subject: Environmental Non-Routine Event Report for Exelon Generation Company, LLC—LaSalle County Station. August 17, 2001. ADAMS No. ML012330070. [Exelon] Exelon Generation Company, LLC. 2002. Letter from G.T. Kaegi, Regulatory Assurance Manager, LaSalle County Station to U.S. NRC, Document control Desk. Subject: Environmental Protection Plan and Operating Report Appendix B to Facility License No. NPF-11 and NPF-18. April 29, 2002. ADAMS No. ML021330421. [Exelon] Exelon Generation Company, LLC. 2009. Letter from D. Rhoads, Plant Manager, LaSalle County Station to U.S. NRC, Document control Desk. Subject: Environmental Non-Routine Event Report for Exelon Generation Company, LLC—LaSalle County Station. July 22, 2009. ADAMS No. ML092040381. [Exelon] Exelon Generation Company, LLC. 2010. Letter from P.J. Karaba, Plant Manager, LaSalle County Station to U.S. NRC, Document control Desk. Subject: Environmental Non-Routine Event Report for Exelon Generation Company, LLC—LaSalle County Station. August 25, 2010. ADAMS No. ML102371289. [Exelon] Exelon Generation Co. LLC. 2011a. Illinois Water Inventory Program [LaSalle County Station report submitted to the Illinois State Water Survey for calendar year 2010]. ADAMS No. ML15195A385. [Exelon] Exelon Generation Company, LLC. 2011b. LaSalle County Station, 2010 Radioactive Effluent Release Report. Marseilles, IL: Exelon Nuclear. April 26, 2011. ADAMS No. ML11124A101. [Exelon] Exelon Generation Co. LLC. 2012a. Illinois Water Inventory Program [LaSalle County Station report submitted to the Illinois State Water Survey for calendar year 2011]. ADAMS No. ML15195A385. [RAI response SW-01] [Exelon] Exelon Generation Company, LLC. 2012b. LaSalle County Station, 2011 Radioactive Effluent Release Report. Marseilles, IL: Exelon Nuclear. April 20, 2012. ADAMS No. ML12116A148. [Exelon] Exelon Generation Co. LLC. 2013a. Illinois Water Inventory Program [LaSalle County Station report submitted to the Illinois State Water Survey for calendar year 2012]. ADAMS No. ML15195A385. [Exelon] Exelon Generation Company, LLC. 2013b. LaSalle County Generating Station Wildlife Management Plan. ADAMS No. ML15273A416. [Exelon] Exelon Generation Company, LLC. 2013c. LaSalle County Station, 2012 Radioactive Effluent Release Report. Marseilles, IL: Exelon Nuclear. April 26, 2013. ADAMS No. ML131280052. [Exelon] Exelon Generation Company, LLC. 2013d. Offsite Dose Calculation Manual (ODCM). Revision 4. Marseilles, IL: Exelon Nuclear. CY-LA-170-301. April 2013. ADAMS No. ML13128A059.
Affected Environment
3-117
[Exelon] Exelon Generation Company, LLC. 2013e Storm Water Pollution Prevention Plan, LaSalle County Station, Marseilles, Illinois. June 2013. In Letter from M.P. Gallagher, Vice President, License Renewal Projects, to NRC Document Desk. Subject: Response to NRC Request for Additional Information, dated May 22, 2015, Regarding the LaSalle County Station, Units 1 and 2, License Renewal Application, Environmental Review. July 2, 2015. ADAMS No. ML15195A389. [Exelon] Exelon Generation Company, LLC. 2014a. Applicant’s Environmental Report—Operating License Renewal Stage LaSalle County Station, Unit 1 and Unit 2. Chicago, Illinois: Exelon. December 9, 2014. ADAMS Nos. ML14343A849, ML14343A883, and ML14343A897. [Exelon] Exelon Generation Company, LLC. 2014b. LaSalle County Station, Updated Final Safety Analysis Report, Revision 20. Chicago, Illinois: Exelon. April 11, 2014. ADAMS No. ML14113A099. [Exelon] Exelon Generation Company, LLC. 2014c. LaSalle County Station, 2013 Radioactive Effluent Release Report. Marseilles, IL: Exelon Nuclear. May 1, 2014. ADAMS No. ML14121A217. [Exelon] Exelon Generation Company, LLC. 2014d. LaSalle County Station, Units 1 and 2 Seismic Hazard and Screening Report. Chicago, Illinois: Exelon. March 31, 2014. ADAMS No. ML14091A013. [Exelon] Exelon Generation Co. LLC. 2014e. Illinois Water Inventory Program (LaSalle County Station report submitted to the Illinois State Water Survey for calendar year 2013). ADAMS No. ML15195A385. [Exelon] Exelon Generation Company, LLC. 2014f. Letter from M.P. Gallagher, Vice President, License Renewal Projects, to Illinois Environmental Protection Agency, Bureau of Water. Subject: Application for Clean Water Act Section 401 Certification associated with Renewal of LaSalle County Station Units 1 and 2 Operating Licenses. February 4, 2014. In: LaSalle County Station, Units 1 and 2, License Renewal Application, Appendix E, Applicant’s Environmental Report, Operating License Renewal Stage. ADAMS No. ML14343A897 (Appendix B). [Exelon] Exelon Generation Company, LLC. 2015a. Corrected LaSalle Groundwater Tritium Concentrations. Chicago, Illinois: Exelon. July 28, 2015. ADAMS No. ML15195A402. [Exelon] Exelon Generation Company, LLC. 2015b. LaSalle County Station, 2014 Radioactive Effluent Release Report. Marseilles, IL: Exelon Nuclear. April 30, 2015. ADAMS No. ML15120A282. [Exelon] Exelon Generation Company, LLC. 2015c. Letter from M.P. Gallagher, Vice President, License Renewal Projects, to the NRC Document Control Desk. Subject: Response to NRC Request for Additional Information, dated May 22, 2015, Regarding the LaSalle County Station, Units 1 and 2, License Renewal Application, Environmental Review. July 2, 2015. ADAMS No. ML15195A351. [Exelon] Exelon Generation Company, LLC. 2015d. Letter from M.P. Gallagher, Vice President License Renewal Projects, Exelon, to NRC Document Control Desk. Subject: Response to NRC Request for Additional Information, dated May 22, 2015, Regarding the LaSalle County Station, Units 1 and 2, License Renewal Application, Environmental Review. Enclosure B: LaSalle County Station, Units 1 & 2, Response Sheets for NRC License Renewal Environmental Review Requests for Additional Information. Response to Request for Additional Information LU-01. July 2, 2015. ADAMS No. ML15195A373.

Affected Environment
3-118
[Exelon] Exelon Generation Company, LLC. 2015e. Letter from M.P. Gallagher, Vice President License Renewal Projects, Exelon, to NRC Document Control Desk. Subject: Response to NRC Request for Additional Information, dated May 22, 2015, Regarding the LaSalle County Station, Units 1 and 2, License Renewal Application, Environmental Review. Enclosure B: LaSalle County Station, Units 1 & 2, Response Sheets for NRC License Renewal Environmental Review Requests for Additional Information. Response to Request for Additional Information LU-02. July 2, 2015. ADAMS No. ML15195A374. [Exelon] Exelon Generation Company, LLC. 2015f. Letter from M.P. Gallagher, Vice President License Renewal Projects, Exelon, to NRC Document Control Desk. Subject: Response to NRC Request for Additional Information, dated May 22, 2015, Regarding the LaSalle County Station, Units 1 and 2, License Renewal Application, Environmental Review. Enclosure B: LaSalle County Station, Units 1 & 2, Response Sheets for NRC License Renewal Environmental Review Requests for Additional Information. Response to Request for Additional Information LU-03. July 2, 2015. ADAMS No. ML15195A375. [Exelon] Exelon Generation Company, LLC. 2015g. Letter from M.P. Gallagher, Vice President License Renewal Projects, Exelon, to NRC Document Control Desk. Subject: Response to NRC Request for Additional Information, dated May 22, 2015, Regarding the LaSalle County Station, Units 1 and 2, License Renewal Application, Environmental Review. Enclosure B: LaSalle County Station, Units 1 & 2, Response Sheets for NRC License Renewal Environmental Review Requests for Additional Information. Response to Request for Additional Information LU-04. July 2, 2015. ADAMS No. ML15195A376. [Exelon] Exelon Generation Company, LLC. 2015h. Letter from M.P. Gallagher, Vice President License Renewal Projects, Exelon, to NRC Document Control Desk. Subject: Response to NRC Request for Additional Information, dated May 22, 2015, Regarding the LaSalle County Station, Units 1 and 2, License Renewal Application, Environmental Review. Enclosure B: LaSalle County Station, Units 1 & 2, Response Sheets for NRC License Renewal Environmental Review Requests for Additional Information. Response to Request for Additional Information LU-05. July 2, 2015. ADAMS No. ML15195A377. [Exelon] Exelon Generation Company, LLC. 2015i. Letter from M.P. Gallagher, Vice President License Renewal Projects, Exelon, to NRC Document Control Desk. Subject: Response to NRC Request for Additional Information, dated May 22, 2015, Regarding the LaSalle County Station, Units 1 and 2, License Renewal Application, Environmental Review. Enclosure B: LaSalle County Station, Units 1 & 2, Response Sheets for NRC License Renewal Environmental Review Requests for Additional Information. Response to Request for Additional Information LU-06. July 2, 2015. ADAMS No. ML15195A378. [Exelon] Exelon Generation Company, LLC. 2015j. Letter from M.P. Gallagher, Vice President License Renewal Projects, Exelon, to NRC Document Control Desk. Subject: Response to NRC Request for Additional Information, dated May 22, 2015, Regarding the LaSalle County Station, Units 1 and 2, License Renewal Application, Environmental Review. Enclosure B: LaSalle County Station, Units 1 & 2, Response Sheets for NRC License Renewal Environmental Review Requests for Additional Information. Response to Request for Additional Information MA-01. July 2, 2015. ADAMS No. ML15195A344.

Affected Environment
3-119
[Exelon] Exelon Generation Company, LLC. 2015k. Letter from M.P. Gallagher, Vice President License Renewal Projects, Exelon, to NRC Document Control Desk. Subject: Response to NRC Request for Additional Information, dated May 22, 2015, Regarding the LaSalle County Station, Units 1 and 2, License Renewal Application, Environmental Review. Enclosure B: LaSalle County Station, Units 1 & 2, Response Sheets for NRC License Renewal Environmental Review Requests for Additional Information. Response to Request for Additional Information MA-05. July 2, 2015. ADAMS No. ML15195A348. [Exelon] Exelon Generation Company, LLC. 2015l. Letter from M.P. Gallagher, Vice President License Renewal Projects, Exelon, to NRC Document Control Desk. Subject: Response to NRC Request for Additional Information, dated May 22, 2015, Regarding the LaSalle County Station, Units 1 and 2, License Renewal Application, Environmental Review. Enclosure B: LaSalle County Station, Units 1 & 2, Response Sheets for NRC License Renewal Environmental Review Requests for Additional Information. Response to Request for Additional Information MA-09. July 2, 2015. ADAMS No. ML15195A353. [Exelon] Exelon Generation Company, LLC. 2015m. Letter from M.P. Gallagher, Vice President License Renewal Projects, Exelon, to NRC Document Control Desk. Subject: Response to NRC Request for Additional Information, dated May 22, 2015, Regarding the LaSalle County Station, Units 1 and 2, License Renewal Application, Environmental Review. Enclosure B: LaSalle County Station, Units 1 & 2, Response Sheets for NRC License Renewal Environmental Review Requests for Additional Information. Response to Request for Additional Information MA-10. July 2, 2015. ADAMS No. ML15195A354. [Exelon] Exelon Generation Company, LLC. 2015n. Letter from M.P. Gallagher, Vice President License Renewal Projects, Exelon, to NRC Document Control Desk. Subject: Response to NRC Request for Additional Information, dated May 22, 2015, Regarding the LaSalle County Station, Units 1 and 2, License Renewal Application, Environmental Review. Enclosure B: LaSalle County Station, Units 1 & 2, Response Sheets for NRC License Renewal Environmental Review Requests for Additional Information. Response to Request for Additional Information TE-02. July 2, 2015. ADAMS No. ML15195A380. [Exelon] Exelon Generation Company, LLC. 2015o. Letter from M.P. Gallagher, Vice President License Renewal Projects, Exelon, to NRC Document Control Desk. Subject: Response to NRC Request for Additional Information, dated May 22, 2015, Regarding the LaSalle County Station, Units 1 and 2, License Renewal Application, Environmental Review. Enclosure B: LaSalle County Station, Units 1 & 2, Response Sheets for NRC License Renewal Environmental Review Requests for Additional Information. Response to Request for Additional Information TE-03. July 2, 2015. ADAMS No. ML15195A381. [Exelon] Exelon Generation Company, LLC. 2015p. Letter from M.P. Gallagher, Vice President License Renewal Projects, Exelon, to NRC Document Control Desk. Subject: Revisions to LaSalle County Station, Units 1 and 2, License Renewal Application, Applicant’s Environmental Report – Operating License Renewal Stage. July 31, 2015. ADAMS No. ML15212A259. [Exelon] Exelon Generation Company, LLC. 2015q. Letter from M.P. Gallagher, Vice President License Renewal Projects, Exelon, to NRC Document Control Desk. Subject: Response to NRC Request for Additional Information, dated May 22, 2015, Regarding the LaSalle County Station, Units 1 and 2, License Renewal Application, Environmental Review. Enclosure B: LaSalle County Station, Units 1 & 2, Response Sheets for NRC License Renewal Environmental Review Requests for Additional Information. Response to Request for Additional Information SE-01. July 2, 2015. ADAMS No. ML15195A403.

Affected Environment
3-120
[Exelon] Exelon Generation Company, LLC. 2015r. Letter from M.P. Gallagher, Vice President License Renewal Projects, Exelon, to NRC Document Control Desk. Subject: Response to NRC Request for Additional Information, dated May 22, 2015, Regarding the LaSalle County Station, Units 1 and 2, License Renewal Application, Environmental Review. Enclosure B: LaSalle County Station, Units 1 & 2, Response Sheets for NRC License Renewal Environmental Review Requests for Additional Information. Response to Request for Additional Information SE-02. July 2, 2015. ADAMS No. ML15195A404. [Exelon] Exelon Generation Company, LLC. 2015s. Letter from M.P. Gallagher, Vice President License Renewal Projects, Exelon, to NRC Document Control Desk. Subject: Response to NRC Request for Additional Information, dated May 22, 2015, Regarding the LaSalle County Station, Units 1 and 2, License Renewal Application, Environmental Review. Enclosure B: LaSalle County Station, Units 1 & 2, Response Sheets for NRC License Renewal Environmental Review Requests for Additional Information. Response to Request for Additional Information SE-04. July 2, 2015. ADAMS No. ML15195A406. [Exelon] Exelon Generation Company, LLC. 2016. Electronic mail from N.L. Ranek, License Renewal Environmental Lead, Exelon, to D. Drucker, Project Manager, NRC. Subject: LaSalle County Station 2014 Taxes. Response to request for information. January 14, 2016. ADAMS No. ML16125A129. Exelon Nuclear. 2007. LaSalle County Station Units 1 and 2, Annual Radiological Environmental Operating Report, 1 January Through 31 December 2006. May 2007. ADAMS No. ML071410244. Exelon Nuclear. 2008. LaSalle County Station Units 1 and 2, Annual Environmental Operating Report, Annual Radiological Environmental Operating Report, 1 January Through 31 December 2007. May 2008. ADAMS No. ML081420473. Exelon Nuclear. 2009. LaSalle County Station Units 1 and 2, Annual Environmental Operating Report, Annual Radiological Environmental Operating Report, 1 January Through 31 December 2008. May 2009. ADAMS No. ML091350485. Exelon Nuclear. 2010. LaSalle County Station Units 1 and 2, Annual Environmental Operating Report, Annual Radiological Environmental Operating Report, 1 January Through 31 December 2009. May 2010. ADAMS No. ML101320380. Exelon Nuclear. 2011. LaSalle County Station Units 1 and 2, Annual Environmental Operating Report, Annual Radiological Environmental Operating Report, 1 January Through 31 December 2010. May 2011. ADAMS No. ML111320602. Exelon Nuclear. 2012. LaSalle County Station Units 1 and 2, Annual Environmental Operating Report, Annual Radiological Environmental Operating Report, 1 January Through 31 December 2011. May 2012. ADAMS No. ML12130A420. Exelon Nuclear. 2013. LaSalle County Station Units 1 and 2, Annual Environmental Operating Report, Annual Radiological Environmental Operating Report, 1 January Through 31 December 2012. May 2013. ADAMS No. ML13136A007. Exelon Nuclear. 2014. LaSalle County Station Units 1 and 2, Annual Environmental Operating Report, Annual Radiological Environmental Operating Report, 1 January Through 31 December 2013. May 2014. ADAMS No. ML14135A214. Exelon Nuclear. 2015. LaSalle County Station Units 1 and 2, Annual Environmental Operating Report, Annual Radiological Environmental Operating Report, 1 January Through 31 December 2014. May 2015. ADAMS Nos. ML15141A195 and ML15141A219.

Affected Environment
3-121
Fagan BM. 2005. Ancient North America. 4th ed. London: Thames & Hudson Ltd. 568 p. Farmer A, Cade S, Staufer DF. 2002. Evaluation of Habitat Suitability Index Model. In: Kurta A, Kennedy J, editors. The Indiana Bat: Biology and Management of an Endangered Species. Austin, TX: Bat Conservation International. pp. 172–181. Federal Water Pollution Control Act (Clean Water Act) of 1972, as amended. 33 U.S.C. § 1251 et seq. Rivers and Harbors Appropriation Act of 1899, as amended. 33 U.S.C. § 403 Section 10. [FEMA] Federal Emergency Management Agency. 2015. Earthquake hazard maps available at <www.fema.gov/earthquake/earthquake-hazard-maps#0> (accessed 16 June 2015). [FHA] Federal Highway Administration. 2011. Highway Traffic Noise Analysis and Abatement Policy and Guidance. Available at <https://www.fhwa.dot.gov/environment/noise/regulations_and_guidance/polguide/ polguide02.cfm> (accessed August 2015). Fritts, MW. 2013. Email from M.W. Fritts, Illinois Natural History Survey, to P. Moore, Tetra Tech. Subject: RE: Request: Illinois River Reports. June 24, 2013. ADAMS No. ML15273A418. [FWS] U.S. Fish and Wildlife Service. 1990. Decurrent False Aster Recovery Plan. U.S. Fish and Wildlife Service, Twin Cities, Minnesota. 26 p. Available at <http://ecos.fws.gov/docs/recovery_plans/1990/900928c.pdf.> (accessed 28 August 2015). [FWS] U.S. Fish and Wildlife Service. 2009. Indiana Bat (Myotis sodalis) 5-Year Review: Summary and Evaluation. Midwest Region – Region 3. Available at <http://www.fws.gov/midwest/endangered/recovery/5yr_rev/pdf/INBA5Yr30Sept2009.pdf.> (accessed 28 August 2015). [FWS] U.S. Fish and Wildlife Service. 2011. A National Plan for Assisting States, Federal Agencies, and Tribes in Managing White-Nose Syndrome in Bats. Hadley, MA: FWS. May 2011. 21 p. Available at <http://static.whitenosesyndrome.org/sites/default/files/ white-nose_syndrome_national_plan_may_2011.pdf> (accessed 22 August 2013). [FWS] U.S. Fish and Wildlife Service. 2012a. 2011 Rangewide Population Estimate for the Indiana Bat (Myotis sodalis) by USFWS Region. ADAMS No. ML14265A502. [FWS] U.S. Fish and Wildlife Service. 2012b. Decurrent False Aster (Boltonia decurrens) 5-Year Review: Summary and Evaluation 2012. Midwest Region. Available at <http://www.fws.gov/midwest/endangered/plants/5yrreviews/Boltonia5YrRev2012.pdf.> (accessed 28 August 2015). [FWS] U.S. Fish and Wildlife Service. 2013a. “USFWS: Eastern Prairie Fringed Orchid (Platanthera leucophaea) Fact Sheet.” July 9, 2013. Available at <http://www.fws.gov/midwest/endangered/plants/epfo.html> (accessed 18 December 2013). [FWS] U.S. Fish and Wildlife Service. 2013b. “USFWS: Endangered Species: Sheepnose Mussel (Plethobasus cyphyus).” January 3, 2013. Available at <http://www.fws.gov/midwest/endangered/clams/sheepnose/> (accessed 20 December 2013). [FWS] U.S. Fish and Wildlife Service. 2013c. White-Nose Syndrome Confirmed in Illinois Bats: Illinois becomes 20th state in U.S. to confirm deadly disease in bats. Midwest Region. November 4, 2013. Available at <http://www.fws.gov/midwest/news/621.html.> (accessed 1 September 2015).

Affected Environment
3-122
[FWS] U.S. Fish and Wildlife Service. 2015a. Illinois County Distribution, Federally Endangered, Threatened, and Candidate Species. Midwest Region. Updated September 30, 2015. Available at <http://www.fws.gov/midwest/endangered/lists/illinois-cty.html> (accessed 9 October 2015). [FWS] U.S. Fish and Wildlife Service. 2015b. Letter from FWS to NRC. Subject: LaSalle Power Plant License Renewal. List of threatened and endangered species that may occur in your proposed project location, and/or may be affected by your proposed project. February 27, 2015. ADAMS ML15126A069. [FWS] U.S. Fish and Wildlife Service. 2015c. Letter from L. Nelson, Regional Environmental Officer, FWS, to D. Wrona, NRC. May 8, 2015. ADAMS No. ML15131A004. [FWS] U.S. Fish and Wildlife Service. 2015d. Letter from Rock Island Ecological Services Field Office, FWS, to NRC. Subject: List of threatened and endangered species that may occur in your proposed project location, and/or may be affected by your proposed project. February 27, 2015. ADAMS No. ML15126A069. [FWS] U.S. Fish and Wildlife Service. 2015e. National Wetlands Inventory Wetlands Mapper. Available at <http://www.fws.gov/wetlands/Data/Mapper.html> (accessed 10 March 2015). [HDR] HDR Engineering, Inc. 2010. Zebra Mussel Monitoring Program at LaSalle Nuclear Station, 2009. Prepared for Exelon Nuclear, Warrenville, Illinois. February 2010. Woodstock, Illinois. ADAMS No. ML15273A421. [HDR] HDR Engineering, Inc. 2011. Zebra Mussel Monitoring Program at LaSalle Nuclear Station, 2010. Prepared for Exelon Nuclear, Warrenville, Illinois. February 2011. Woodstock, Illinois. ADAMS No. ML15273A422. [HDR] HDR Engineering, Inc. 2012. Zebra Mussel Monitoring Program at LaSalle Nuclear Station, 2011. Prepared for Exelon Nuclear, Warrenville, Illinois. February 2012. Woodstock, Illinois. ADAMS No. ML15273A440. [HDR] HDR Engineering, Inc. 2013. Zebra Mussel Monitoring Program at LaSalle Nuclear Station, 2012. Prepared for Exelon Nuclear, Warrenville, Illinois. February 2013. Woodstock, Illinois. ADAMS No. ML15273A441. [HDR] HDR Engineering, Inc. 2014. Zebra Mussel Monitoring Program at LaSalle Nuclear Station, 2013. Prepared for Exelon Nuclear, Warrenville, Illinois. February 2014. Woodstock, Illinois. ADAMS No. ML15273A442. [HUD] U.S. Department of Housing and Urban Development. 2014. Noise and Abatement Control. Available at <https://www.hudexchange.info/environmental-review/noise-abatement-and-control/> (accessed 15 July 2015). [IDNR] Illinois Department of Natural Resources. 2005. The Illinois Comprehensive Wildlife Conservation Plan & Strategy. Version 1.0. July 11, 2005. 380 p. Available at <http://www.dnr.illinois.gov/conservation/IWAP/Documents/WildlifeActionPlanFinal.pdf> (accessed 9 March 2015). [IDNR] Illinois Department of Natural Resources. 2007. Status of the Catfish Fishery. Illinois Department of Natural Resources, Division of Fisheries. March 2007. Available at <http://www.dnr.state.il.us/orc/fisheries/07/07%20catfish%20status%20report.pdf> (accessed 21 May 2015).

Affected Environment
3-123
[IDNR] Illinois Department of Natural Resources. 2009. Status of the Striped Bass/Hybrid Striped Bass Fishery. Illinois Department of Natural Resources, Division of Fisheries. March 2009. Available at <http://www.prairiestateoutdoors.com/images/uploads/2009_Striped_Bass_Status.pdf> (accessed 21 May 2015). [IDNR] Illinois Department of Natural Resources. 2011a. Illinois Rivers and Lakes, Fact Sheets. Illinois Department of Natural Resources, Aquatic Illinois, DNR158-6/12. Available at <http://dnr.state.il.us/education/aquatic/aquaticillinoisrivlakefactshts.pdf> (accessed 10 September 2015). [IDNR] Illinois Department of Natural Resources. 2011b. State of Illinois Coastal Management Program. Available at <http://www.dnr.illinois.gov/cmp/Documents/ICMPPD.pdf> (accessed 6 March 2015). [IDNR] Illinois Department of Natural Resources. 2014a. “Illinois Natural Areas Inventory (INAI) Sites.” October 2014. Available at <http://dnr.state.il.us/conservation/naturalheritage/Documents/INAI_by_County.pdf> (accessed 10 March 2015). [IDNR] Illinois Department of Natural Resources. 2014b. “Illinois Threatened and Endangered Species By County.” Updated October 2014. Available at <http://www.dnr.illinois.gov/ESPB/Documents/ET_by_County.pdf> (accessed 9 March 2015). [IDNR] Illinois Department of Natural Resources. 2014c. Letter from S.R. Fairfield, Impact Assessment Section, to M.P. Gallagher, Vice President License Renewal, Exelon Nuclear. Re: Renewal of Facility Operating Licenses by the U.S. Nuclear Regulatory Commission (NRC) for LaSalle Generating Station, Units 1 and 2 - Correspondence dated March 7, 2014 County: LaSalle. May 22, 2014. In Appendix D of Exelon 2014a. [IDNR] Illinois Department of Natural Resources. 2015a. Checklist of Illinois Endangered and Threatened Animals and Plants, Illinois Endangered Species Protection Board. May 19, 2015. Available at <http://www.dnr.illinois.gov/ESPB/Documents/2015_ChecklistFINAL_for_webpage _051915.pdf> (accessed 15 October 2015). [IDNR] Illinois Department of Natural Resources. 2015b. “Illini State Park.” Available at <http://dnr.state.il.us/lands/Landmgt/parks/i&m/east/illini/park.htm> (accessed 10 March 2015). [IDNR] Illinois Department of Natural Resources. 2015c. “Illinois Coastal Management Program Boundaries.” Available at <http://www.dnr.illinois.gov/cmp/Pages/boundaries.aspx> (accessed 6 March 2015). [IDNR] Illinois Department of Natural Resources. 2015d. Marseilles State Fish and Wildlife Area. Available at <http://dnr.state.il.us/lands/Landmgt/parks/r1/MARSEIL.HTM> (accessed 15 October 2015). [IDNR] Illinois Department of Natural Resources. 2015e. “Marseilles State Fish & Wildlife Area (Upland) Hunter Fact Sheet.” Available at <http://www.dnr.illinois.gov/hunting/FactSheets/Pages/MarseillesStateFishWildlifeAreaUpland.aspx> (accessed 6 March 2015). [IDNR and Exelon] Illinois Department of Natural Resources and Exelon Generation Company, LLC. 2014. IDNR and Exelon Meeting Notes, Review of Braidwood, Clinton and LaSalle, Lake Fishery and Land Management Plans. March 5, 2014. ADAMS No. ML15195A368.

Affected Environment
3-124
[IDNR and Exelon] Illinois Department of Natural Resources and Exelon Generation Company, LLC. 2015. IDNR and Exelon Meeting Notes, Review of Braidwood, Clinton and LaSalle, Lake Fishery and Land Management Plans. March 4, 2015. ADAMS No. ML15195A368. [IDPH] Illinois Department of Public Health. 2009. “Salmonella.” January 2009. Available at <http://www.idph.state.il.us/public/hb/hbsam.htm> (accessed 23 October 2013). [IDPH] Illinois Department of Public Health. 2013. “Shigellosis Healthbeat.” Available at <http://www.idph.state.il.us/public/hb/hbshigellosis.htm> (accessed 23 October 2013). [IDPH] Illinois Department of Public Health. 2014. Email from K. Marshall, IDPH, to N. Ranek, Exelon, Subject: RE: LaSalle County Station Units 1 and 2- Consultation about thermophilic organisms. February 19, 2014. ADAMS No. ML15273A445. [IEPA] Illinois Environmental Protection Agency. 1987. Field and Laboratory Methods Manual: Section C, Macroinvertebrate Monitoring. IEPA. Springfield, IL. 55 p. [IEPA] Illinois Environmental Protection Agency. 2016. Federally Enforceable State Operating Permit for LaSalle County Generating Station No. 75040086. January 7, 2016. [IEPA] Illinois Environmental Protection Agency. 2013. NPDES Permit No. lL0048151, National Pollutant Discharge Elimination System, Reissued (NPDES) Permit. Exelon Generation Company, LLC, LaSalle County Generating Station. Effective date, August 1, 2013. Springfield, IL: Division of Water Pollution Control. In: LaSalle County Station, Units 1 and 2, License Renewal Application, Appendix E, Applicant’s Environmental Report, Operating License Renewal Stage. ADAMS No. ML14343A897 (Appendix C). [IEPA] Illinois Environmental Protection Agency. 2014a. Email from G. Good, IEPA, to N. Ranek, Exelon. Subject: RE: LaSalle County Station Units 1 and 2- Consultation about thermophilic organisms. February 19, 2014. ADAMS No. ML15273A446. [IEPA] Illinois Environmental Protection Agency. 2014b. Illinois Integrated Water Quality Report and Section 303(d) List, 2014 – Volume I: Surface Water, Appendix A-1, Illinois' 2014 303(d) List and Prioritization, Appendix A-5, 2014 Illinois Water Quality Maps, Appendix B-2, Specific Assessment Information for Streams, 2014, Appendix B-3, Specific Assessment Information for Lakes, 2014. Illinois Environmental Protection Agency, Bureau of Water. March 2014. (Final submitted to USEPA Region 5.) Available at <http://www.epa.illinois.gov/topics/water-quality/watershed-management/tmdls/303d-list> (accessed 21 August 2015). [IEPA] Illinois Environmental Protection Agency. 2014c. Letter from A. Keller, Manager, Permit Section, Division of Water Pollution Control, to U.S. Nuclear Regulatory Commission, Division of License Renewal- Office of Nuclear Reactor Regulation. Subject: Exelon Generation Company (LaSalle County Station), Renewal of Nuclear Regulatory Commission Operating Licenses for Exelon LaSalle Station Units I and 2 (NPF-11 and NPF-18), Log # C-0054-14 [NPF-11 and NPF-18]. December 29, 2014. ADAMS No. ML15022A325. [Illinois DOT] Illinois Department of Transportation. 2012. “The Illiana Expressway Corridor – Historic and Forecasted Growth of Employment and Population in the Extended Region of Chicago. Market-Driven versus Policy-Based Socio-Economic Forecasts (2010-2040), No-Build Illiana Expressway Scenario.” February 2012. Available at <http://www.idot.illinois.gov/Assets/uploads/files/Transportation-System/Reports/Desenv/Enviromental/Illiana/Appendix%20E1%20-%20%20Historic%20and%20Forecasted%20Growth%20of%20Employment%20and%20Population%20February%202012.pdf> (accessed October 2015).
Affected Environment
3-125
[Illinois DOT] Illinois Department of Transportation. 2015. Getting Around Illinois – 2013-2014 Annual Average Daily Traffic. Map. Available at <http://www.gettingaroundillinois.com/default.htm> (accessed October 2015). [IHPA] Illinois Historic Preservation Agency. 2013. National Register of Historic Places in Illinois. 50 p. Available at <http://www.illinois.gov/ihpa/Preserve/SiteAssets/Pages/Places/ National%20Register%20Properties%20in%20Illinois.pdf> (accessed 28 August 2015). Illinois Environmental Protection Act of 1970. 415 ILCS 5/Title VI. Illinois Compiled Statutes. Chapter 415, 5, “Noise.” [ISGS] Illinois State Geological Survey. 2015. Illinois Water Well (ILWATER) Interactive Map. Available at <http://maps.isgs.illinois.edu/ilwater/> (accessed 13 July 2015). [ISM] Illinois State Museum. 2002. “Native Americans: American Indian Tribes of Illinois.” October 2, 2002. Available at <http://www.museum.state.il.us/muslink/nat_amer/post/index.html> (accessed 15 June 2015). [ISWS] Illinois State Water Survey. 2015a. “Water Supply Planning.” Illinois State Water Survey, Prairie Research Institute University of Illinois at Urbana-Champaign. Available at <http://www.isws.illinois.edu/wsp> (accessed 21 August 2015). [ISWS] Illinois State Water Survey. 2015b. “Illinois Water Inventory Program.” Illinois State Water Survey, Prairie Research Institute University of Illinois at Urbana-Champaign. Available at <http://www.isws.illinois.edu/gws/iwip/> (accessed 21 August 2015). Kanter R. Environmental Almanac: Rare mussel found in Illinois River. News Gazette. Sunday, July 7, 2013. LaSalle County. 2014. LaSalle County Comprehensive Plan, LaSalle County, Illinois. Available at <http://www.lasallecounty.org/envsvcs/lccp-2014.pdf> (accessed 11 May 2015). Lerczak TV, Sparks RE, Blodgett, KD. 1994. The Long Term Illinois River Fish Population Monitoring Program: Final Report. Project F-101-R. Illinois Natural History Survey. River Research Laboratory. Havana, IL. June 1994. Available at <https://www.ideals.illinois.edu/bitstream/handle/2142/10575/inhscaev01994i00006_opt.pdf?sequence=2> (accessed 19 March 2015). Lerczak TV. 1996. Illinois River Fish Communities: 1960s vs. 1990s. Illinois Natural History Survey. April 4, 1996. Available at <http://wwx.inhs.illinois.edu/resources/inhsreports/may-jun96/fish/> (accessed 19 March 2015). Magnuson–Stevens Fishery Conservation and Management Act, as amended. 16 U.S.C. § 1801 et seq. Marine Mammal Protection Act of 1972, as amended. 16 U.S.C. § 1361 et seq. [Maryland DNR] Maryland Department of Natural Resources. 2015. Maryland Fish Facts, American Gizzard Shad. Available at <http://dnr2.maryland.gov/Fisheries/Pages/Fish-Facts.aspx?fishname=American%20Gizzard%20Shad> (accessed 29 October 2015). McClelland MA, Sass GG. 2007. The Long-Term Illinois River Fish Population Monitoring Program, Project F-101-R-18. Illinois Natural History Survey. River Research Laboratory. Havana, IL. April 2007. Available at <https://www.ideals.illinois.edu/bitstream/handle/2142/48748/INHS2007_24.pdf?sequence=2> (accessed 20 August 2015). McClelland MA, Sass GG, Cook TR, Irons KS, Michaels NM, O’Hara NM, Smith CS. 2012. The Long-Term Illinois River Fish Population Monitoring Program. Fisheries 37(8): 340-350.
Affected Environment
3-126
Mid-America Earthquake Center. 2009. New Madrid Seismic Zone Catastrophic Earthquake Response Planning Project—Impact of New Madrid Seismic Zone Earthquakes on the Central USA, Volume I. October 2009. Available at <https://www.ideals.illinois.edu/bitstream/handle/2142/14810/ImpactofNewMadridSeismicZone Earthquakeso%20theCentral%20USAVol1.pdf?sequence=3> (accessed 11 May 2015). Migratory Bird Treaty Act of 1918, as amended. 16 U.S.C. § 703 et seq. [Minnesota DNR] Minnesota Department of Natural Resources. 2014. “Species Profile: Rare Species Guide: Spike (Elliptio dilatata).” Available at <http://www.dnr.state.mn.us/rsg/ profile.html?action=elementDetail&selectedElement=IMBIV14100> (accessed 7 April 2014). [Mississippi DNR] Mississippi Department of Natural Resources. 2015. Step in Establishing Indicators. Available at <http://www.dakotaswcd.org/pdfs/Final%20Indicators%20MDNR.pdf> (accessed 29 October 2015). Missouri Department of Natural Resources. 2013. The New Madrid Seismic Zone, Division of Geology and Land Survey Fact Sheet Number 26. January 2013. Available at <http://www.dnr.mo.gov/pubs/pub2465.pdf> (accessed 11 May 2015). Moore BC, Martinez E, Gay JM, Rice DH. 2003. Survival of Salmonella enterica in freshwater and sediments and transmission by the aquatic midge Chironomus tentans (Chironomidae: Diptera). Applied and Environmental Microbiology 69(8):4556–4560. Available at <http://www.ncbi.nlm.nih.gov/pmc/articles/PMC169145/> (accessed 23 October 2013). [NASS] National Agricultural Statistics Service, U.S. Department of Agriculture. 2015. “2012 Census of Agriculture,” Volume 1, Chapter 2, County Level, Table 7. “Hired Farm Labor – Workers and Payroll: 2012.” 2012 Census of Agriculture, Volume 1 Chapter 2, County Level Data for Illinois. Last modified: 4/15/2014. Available at <http://www.agcensus.usda.gov/Publications/2012/Full_Report/Census_by_State/> (accessed October 2015). National Environmental Policy Act of 1969, as amended. 42 U.S.C. § 4321 et seq. [NatureServe] NatureServe Explorer. 2014a. “Moxostoma carinatum.” Available at <http://explorer.natureserve.org> (accessed 7 April 2014). [NatureServe] NatureServe Explorer. 2014b. “Elliptio dilatata.” Available at <http://explorer.natureserve.org> (accessed 7 April 2014). [NCES] National Center for Education Statistics. 2015a. “College Navigator.” U.S. Department of Education, Washington, D.C. College and university student population within 50 mi of ZIP code 61341. Released July 2015. Available at <http://nces.ed.gov/collegenavigator/default.aspx> (accessed October 2015). [NCES] National Center for Education Statistics. 2015b. “Grundy County, LaSalle County and Will County Public and Private School Districts.” 2013-2014 school year. Available at <http://nces.ed.gov/ccd/districtsearch/> (accessed October 2015). [NCDC] National Climatic Data Center. 2004. Climate of Illinois. Available at <http://www.crh.noaa.gov/Image/dvn/downloads/Clim_IL_01.pdf> (accessed 10 July 2015) [NCDC] National Climatic Data Center. 2015a. Local Climatological Data Annual Summary With Comparative Data, Peoria, Illinois (KPIA). Available at <http://www.ncdc.noaa.gov/IPS/lcd/lcd.html> (accessed 14 July 2015). [NCDC] National Climatic Data Center. 2015b. Storm Events Database, LaSalle County. Available at <https://www.ncdc.noaa.gov/stormevents/> (accessed 10 July 2015).

Affected Environment
3-127
[NEI] Nuclear Energy Institute. 2007. Industry Ground Water Protection Initiative – Final Guidance Document. Washington, DC: NEI. NEI 07-07. August 2007. ADAMS No. ML072600295. Neusius SW, Gross GT. 2007. Seeking Our Past: An Introduction to North American Archaeology. New York, NY: Oxford University Press, Inc. 720 p. Noise Control Act of 1972. 42 U.S.C. § 4901 et seq. [NRC] U.S. Nuclear Regulatory Commission. 1978. Final Environmental Statement Related to Operation of LaSalle County Nuclear Power Station Unit Nos. 1 and 2. Washington, DC: NRC. NUREG–0486. November 1978. ADAMS No. ML14353A388. [NRC] U.S. Nuclear Regulatory Commission. 1999. Generic Environmental Impact Statement for License Renewal of Nuclear Plants. Washington, DC: NRC. NUREG–1437, Volume 1, Addendum 1. August 1999. [NRC] U.S. Nuclear Regulatory Commission. 2012. Letter from E.J. Leeds, Director, Office Nuclear Reactor Regulation, and MJ Johnson, Director, Office of New Reactors to All Power Reactor Licensees and Holders of Construction Permits in Active or Deferred Status. Subject: Request for Information Pursuant to Title 10 of the Code of Federal Regulations 50.54(f) Regarding Recommendations 2.1, 2.3, and 9.3 of the Near-Term Task Force Review of Insights from the Fukushima Dai-ichi Accident. March 12, 2012. ADAMS No. ML12053A340. [NRC] U.S. Nuclear Regulatory Commission. 2013. Generic Environmental Impact Statement for License Renewal of Nuclear Plants. Revision 1. Washington, DC: NRC. NUREG–1437, Volumes 1, 2, and 3. June 2013. 1,535 p. ADAMS No. ML13107A023. [NRC] U.S. Nuclear Regulatory Commission. 2014a. Letter from E.J. Leeds, Director, Office Nuclear Reactor Regulation to All Power Reactor Licensees and Holders of Construction Permits in Active or Deferred Status. Subject: Seismic Screening and Prioritization Results Regarding Information Pursuant to Title 10 of the Code of Federal Regulations 50.54(f) Regarding Seismic Hazard Reevaluations for Recommendation 2.1 of the Near-Term Task Force Review of Insights from the Fukushima Dai-ichi Accident. May 9, 2014. ADAMS No. ML14111A147. [NRC] U.S. Nuclear Regulatory Commission. 2014b. Probabilistic Seismic Hazard Analysis: Background Information. May 20, 2014. ADAMS No. ML14140A648. [NRC] U.S. Nuclear Regulatory Commission. 2015a. LaSalle County Station, Units 1 and 2—Staff Assessment of Information Provided Pursuant to Title 10 of the Code of Federal Regulations Part 50, Section 50.54(F), Seismic Hazard Reevaluations for Recommendation 2.1 of the Near-Term Task Force Review of Insights from the Fukushima Dai-ichi Accident (TAC Nos. MF3881 AND MF3882). April 21, 2015. ADAMS No. ML15013A132. [NRC] U.S. Nuclear Regulatory Commission. 2015b. Memorandum from B. Wittick, Chief, Projects Branch 2, Division of License Renewal, Office of Nuclear Reactor Regulation, to M.P. Gallagher, Vice President, License Renewal Projects, Exelon Generation Company, LLC. Subject: Summary of the License Renewal Environmental Audit for LaSalle County Station, Units 1 And 2. May 20, 2015. 5 p. ADAMS No. ML15132A674. [NRC] U.S. Nuclear Regulatory Commission. 2015c. Note to File: Summary of Visit to Illinois Historic Preservation Agency Associated with the LaSalle County Station, Units 1 and 2, License Renewal Application Environmental Audit, May 2015. ADAMS No. ML15205A286.

Affected Environment
3-128
[NRC] U.S. Nuclear Regulatory Commission. 2015d. Request for Additional Information Regarding the LaSalle County Station, Units 1 and 2, License Renewal Application Environmental Review. May 22, 2015. ADAMS No. ML15139A586. [NRC] U.S. Nuclear Regulatory Commission. 2015e. Letter from B. Vaidya, Project Manager, Plant Licensing III-2 and Planning and Analysis Branch, Office Nuclear Reactor Regulation, to B.C. Hanson, Senior Vice President, Exelon Generation Company, LLC. Subject: LaSalle County Station, Units 1 and 2, Issuance of Amendment Revising the Ultimate Heat Sink Temperature Limit. November 19, 2015. ADAMS No. ML15202A578. [NRC] U.S. Nuclear Regulatory Commission. 2016a. Teleconference Summary between Michelle Moser, NRC, and Nancy Rodgers, IDNR, regarding EA Engineer’s Annual Scientific Permit Report submitted on March 9, 2016. ADAMS No. ML16214A284. [NRC] U.S. Nuclear Regulatory Commission. 2016b. Occupational Radiation Exposure at Commercial Nuclear Power Reactors and Other Facilities 2014: Forty-Seventh Annual Report. Washington, DC: NRC. NUREG–0713, Volume 36, April 2016. ADAMS No. ML16112A230. Nyboer RW, Herkert JR, Ebinger JE, editors. 2006. Endangered and Threatened Species of Illinois: Status and Distribution, Volume 2 - Animals. Illinois Endangered Species Protection Board, Springfield, Illinois. 181 p. Available at <https://www.dnr.illinois.gov/ESPB/Pages/Publications.aspx> (accessed 20 August 2015). Occupational Safety and Health Act of 1970, as amended. 29 U.S.C. § 651 et seq. [OEPA] Ohio Environmental Protection Agency. 1987. Biological Criteria for the Protection of Aquatic Life. Ohio Environmental Protection Agency. July 1987. Columbus, Ohio. Available at <http://www.epa.state.oh.us/Portals/35/documents/Vol1.pdf> (accessed on 26 October 2015). [OSHA] Occupational Safety and Health Administration. 2008. OSHA Directive CSP 03-01-003, Voluntary Protection Programs (VPP): Policies and Procedures Manual, April 18, 2008, at page 7. Available at <https://www.osha.gov/OshDoc/Directive_pdf/CSP_03-01-003.pdf> (accessed May 29, 2015). [OSHA] Occupational Safety and Health Administration. 2015a. OSHA Voluntary Protection Programs, Current Federal and State Plan Sites. Available at <https://www.osha.gov/dcsp/vpp/sitebystate.html> (accessed May 29, 2015). [OSHA] Occupational Safety and Health Administration. 2015b. Voluntary Protection Programs. Available at <https://www.osha.gov/dcsp/vpp/> (accessed May 29, 2015). Osmond DL, Line DE, Gale JA, Gannon RW, Knott CB, Bartenhagen KA, Turner MH, Coffey SW, Spooner J, Wells J, Walker JC, Hargrove LL, Foster MA, Robillard PD, Lehning DW. 1995. WATERSHEDSS: Water, Soil and Hydro-Environmental Decision Support System <http://www.water.ncsu.edu/watershedss/info/aqlife.html> (accessed 28 October 2015). Ottawa Area Chamber of Commerce & Industry. 2009. “Community Profile Overview – Major Industries.” Available at <http://www.ottawaindustrialpark.com/comm-profile.html> (accessed October 2015). Parmalee PW, Bogan AE. 1998. Freshwater Mussels of Tennessee. University of Tennessee Press, Knoxville, Tennessee. Pauketat TR. 1993. A Guide to the Prehistory and Native Cultures of Southwestern Illinois and the Greater St. Louis Area. Illinois Archaeological Educational Series No. 2. Springfield, IL: Illinois Historic Preservation Agency. 60 p.

Affected Environment
3-129
Pearson WE. 2003. Legionella 2003: An Update and Statement by the Association of Water Technologies (AWT). Rockville, MD: Association of Water Technologies. June 2003. 33 p. Available at <http://awt.org/IndustryResources/Legionella03.pdf> (accessed 21 October 2013). Pruitt L, TeWinkel L, editors. 2007. Indiana Bat (Myotis sodalis) Draft Recovery Plan. First Revision. Fort Snelling, MN: U.S. Fish and Wildlife Service. April 2007. 258 p. Available at <http://ecos.fws.gov/docs/recovery_plan/070416.pdf> (accessed 26 September 2013). [RESA] Will Regional Educational Service Agency. 2014. “Districts and PSA [Public School Academies].” Available at <http://www.resa.net/aboutus/districts/> (accessed December 2014). Rivers and Harbors Appropriation Act of 1899. 33 U.S.C. § 403 Section 10. Sietman BE, Whitney SD, Kelner DE, Blodgett DK, Dunn HL. Post-Extirpation Recovery of the Freshwater Mussel (Bivalve: Unionidea) Fauna in the Upper Illinois River. Journal of Freshwater Ecology 16(2):273-281. Smith PW. 2002. The Fishes of Illinois. University of Illinois Press, Urbana and Chicago, IL. Smith M, Caswell H, Mettler-Cherry P. 2005. Stochastic flood and precipitation regimes and the dynamics of a threatened floodplain plant. Ecological Applications 15(3):1036-1052. State of Illinois. 2006. 2006-01 Executive Order for the Development of State and Regional Water-Supply Plans. Executive Department. January 9, 2006. Available at <http://www.illinois.gov/Government/ExecOrders/Documents/2006/execorder2006-1.pdf> (accessed 21 August 2015). Stevens AR, Tyndall RL, Coutant CC, Willaert E. 1977. Isolation of the etiological agent of primary amoebic meningoencephalitis from artificially heated waters. Applied and Environmental Microbiology 34(6):701–705. Available at <http://aem.asm.org/content/34/6/701.full.pdf+html> (accessed 23 October 2013). Talkington, LM. 1991. The Illinois River--Working for our State. Champaign, IL: Illinois State Water Survey. January 1991. Miscellaneous Publication 128. Available at <http://www.isws.illinois.edu/pubdoc/MP/ISWSMP-128.pdf> (accessed 21 August 2015). [Teledyne] Teledyne Brown Engineering Environmental Services. 2011. LaSalle County Station, 2010 Annual Radiological Environmental Operating Report, 1 January Through 31 December 2010. Marseilles, IL: Exelon Nuclear. May 12, 2011. ADAMS No. ML111320602. [Teledyne] Teledyne Brown Engineering Environmental Services. 2012. LaSalle County Station, 2011 Annual Radiological Environmental Operating Report, 1 January Through 31 December 2011. Marseilles, IL: Exelon Nuclear. May 9, 2012. ADAMS No. ML12130A420. [Teledyne] Teledyne Brown Engineering Environmental Services. 2013. LaSalle County Station, 2012 Annual Radiological Environmental Operating Report, 1 January Through 31 December 2012. Marseilles, IL: Exelon Nuclear. May 15, 2013. ADAMS No. ML13136A007. [Teledyne] Teledyne Brown Engineering Environmental Services. 2014. LaSalle County Station, 2013 Annual Radiological Environmental Operating Report, 1 January Through 31 December 2013. Marseilles, IL: Exelon Nuclear. May 15, 2014. ADAMS No. ML14135A214. [Teledyne] Teledyne Brown Engineering Environmental Services. 2015. LaSalle County Station, 2014 Annual Radiological Environmental Operating Report, 1 January Through 31 December 2014. Marseilles, IL: Exelon Nuclear. May 13, 2015. ADAMS No. ML15141A19.
Affected Environment
3-130
Todar K. 2004. “Todar’s Online Textbook of Bacteriology.” University of Wisconsin, Department of Bacteriology. Available at <http://textbookofbacteriology.net/index.html> (accessed 23 October 2013). [USACE] United States Army Corps of Engineers. 1998. Illinois Waterway Navigational Charts. Available at <http://www2.mvr.usace.army.mil/NIC2/ilwwcharts.cfm> (assessed on 8 September 2015). [USACE] U.S. Army Corps of Engineers. 2006. Department of the Army Permit, CEMVR OD-P-2006-185. Issued to Exelon Generating Company, LLC. U.S. Army Corps of Engineers, Rock Island District. Issued April 12, 2006; expiration 31 December 2015. ADAMS No. ML15195A399. [USACE] U.S. Army Corps of Engineers. 2012. “Illinois Waterway Locks & Dams.” Available at <http://www.mvr.usace.army.mil/Portals/48/docs/CC/FactSheets/IL/Illinois_Waterway_LocksandDams%20(2012).pdf> (accessed 6 March 2015). [USACE] U.S. Army Corps of Engineers. 2014. Marseilles Lock & Dam. Rock Island, IL: Rock Island District. October 2014. Available at <http://www.mvr.usace.army.mil/Missions/Navigation/MarseillesLockandDam.aspx> (accessed 21 August 2015). [USCB] U.S. Census Bureau. 2015a. American FactFinder, American Community Survey, Table DP03 – “Selected Economic Characteristics,” 2014, 1-Year Estimates for LaSalle and Will Counties, Illinois, and 2009-2013, 5-Year Estimates, for Grundy, County, Illinois. Available at <http://factfinder2.census.gov/faces/nav/jsf/pages/index.xhtml> (accessed October 2015). [USCB] U.S. Census Bureau. 2015b. American FactFinder, “2014 American Community Survey 1-Year Estimates” for Illinois and LaSalle and Will Counties, “Table S1701 – Poverty Status in the Past 12 Months,” “Table S1702 – Poverty Status in the Past 12 Months of Families,” “Table B19013 – Median Household Income in the Past 12 Months (In 2014 Inflation-Adjusted Dollars),” and “Table B19301 – Per Capita Income in the Past 12 Months (In 2014 Inflation-Adjusted Dollars).” American FactFinder, “2011-2013 American Community Survey 3-Year Estimates” for Grundy, County, Illinois, “Table DP05 – ACS Demographic and Housing Estimates,” “Table S1701 – Poverty Status in the Past 12 Months,” “Table S1702 – Poverty Status in the Past 12 Months of Families,” “Table B19013 – Median Household Income in the Past 12 Months (In 2013 Inflation-Adjusted Dollars),” and “Table B19301 – Per Capita Income in the Past 12 Months (In 2013 Inflation-Adjusted Dollars).” Available at <http://factfinder2.census.gov/faces/nav/jsf/pages/index.xhtml> (accessed October 2015). [USCB] U.S. Census Bureau. 2015c. American FactFinder, “2014 American Community Survey 1-Year Estimates” for Illinois and LaSalle and Will Counties, “Table S2301 – Employment Status,” and “2011-2013 American Community Survey 3-Year Estimates” for Grundy, County, Illinois, “Table S2301 – Employment Status.” Available at <http://factfinder2.census.gov/faces/nav/jsf/pages/index.xhtml> (accessed October 2015). [USCB] U.S. Census Bureau. 2015d. American FactFinder, 1980 - 2010 Decennial Census: 1900 to 1990; “Table DP-1 – Profile of General Demographic Characteristics: 2000”, and “Table DP-1 – Profile of General Population and Housing Characteristics: 2010” for Grundy, LaSalle, and Will Counties Illinois. Available at <http://factfinder2.census.gov/faces/nav/jsf/pages/index.xhtml> (accessed October 2015). [USCB] U.S. Census Bureau. 2015e. American FactFinder, “2010 Census Summary File 1, Table DP-1 – Profile of General Population and Housing Characteristics: 2010.” Available at <http://factfinder2.census.gov/faces/nav/jsf/pages/index.xhtml> (accessed October 2015).

Affected Environment
3-131
[USCB] U.S. Census Bureau. 2015f. American FactFinder, “2014 American Community Survey 1-Year Estimates” for Illinois and LaSalle and Will Counties, “Table PEPSR6H – Annual Estimates of the Residential Population by Sex, Race, and Hispanic Origin for the United States, and Counties: April 1, 2010 to July 1, 2014 – 2014 Population Estimates,” and “2011-2013 American Community Survey 3-Year Estimates” for Grundy, County, Illinois, “Table DP05 – ACS Demographic and Housing Estimates.” Available at <http://factfinder2.census.gov/faces/nav/jsf/pages/index.xhtml> (accessed October 2015). [USCB] U.S. Census Bureau. 2015g. American FactFinder, “2009-2013 American Community Survey 5-Year Estimates,” “Table 25001 – Housing Units” and “Table B25004 – Vacancy Status.” Available at <http://factfinder2.census.gov/faces/nav/jsf/pages/index.xhtml> (accessed October 2015). [USCB] U.S. Census Bureau. 2015h. American FactFinder, “2014 American Community Survey 1-Year Estimates” for LaSalle and Will Counties, “Table DP04 – Selected Housing Characteristics,” and “2011-2013 American Community Survey 3-Year Estimates” for Grundy, County, Illinois, “Table DP04 – Selected Housing Characteristics.” Available at <http://factfinder2.census.gov/faces/nav/jsf/pages/index.xhtml> (accessed October 2015). [USDA] U.S. Department of Agriculture. 2008. Soil Survey of LaSalle County, Illinois. Available at <http://www.nrcs.usda.gov/Internet/FSE_MANUSCRIPTS/illinois/IL099/0/La_Salle_IL.pdf> (accessed 11 May 2015). [USDA] U.S. Department of Agriculture. 2015a. CropScape – Cropland Data Layer. 2014 Cropland Data Layer Statistics for LaSalle, Illinois. Available at <http://nassgeodata.gmu.edu/CropScape/> (accessed October 2015). [USDA] U.S. Department of Agriculture. 2015b. Custom Soil Resource Report for LaSalle County, Illinois. National Resources Conservation Service. Available at <http://websoilsurvey.nrcs.usda.gov/app/WebSoilSurvey.aspx> (accessed 5 January 2015). [USFS] U.S. Forest Service. Undated a. “Threatened, Endangered, and Proposed (TEP) Plant Profile: Dalea foliosa, Leafy Prairie-Clover.” Available at <http://www.fs.fed.us/wildflowers/Rare_Plants/profiles/TEP/dalea_foliosa/index.shtml> (accessed 3 January 2013). [USFS] U.S. Forest Service. Undated b. “Celebrating Wildflowers: Contributing to the Recovery of Leafy Prairie-Clover in Northeastern Illinois by Growing Plants from Seed and Planting in Restored Dolomite Prairie Habitat.” Available at <http://www.fs.fed.us/wildflowers/Rare_Plants/conservation/success/ dalea_foliosa_recovery.shtml> (accessed 3 January 3 2013). [USGS] U.S. Geological Survey. 1994. National Water Quality Assessment Program, The Lower Illinois River Basin. Urbana, IL: U.S. Geological Survey. USGS FS 94-018. Page dated June 1994. Available at <http://il.water.usgs.gov/proj/lirb/pubs/factsheet.html#head1> (accessed 21 August 2015). [USGS] U.S. Geological Survey. 1998. National Water-Quality Assessment Program, Upper Illinois River Basin. Urbana, IL: U.S. Geological Survey, WRD. USGS Fact Sheet FS-072-98. June 1998. Available at <http://il.water.usgs.gov/pubs/fs072_98.pdf> (accessed 21 August 2015).

Affected Environment
3-132
[USGS] United States Geological Survey. 1999a. Ecological status and trends of the Upper Mississippi River System 1998: A report of the Long Term Resource Monitoring Program. U.S. Geological Survey, Upper Midwest Environmental Sciences Center, La Crosse, Wisconsin. April 1999. LTRMP 99-T001. 236 p. Available at <http://www.umesc.usgs.gov/reports_publications/status_and_trends.html> (accessed 21 October 2015). [USGS] U.S. Geological Survey. 1999b. “Illinois River at Marseilles.” Page dated October 12, 1999. Available at <http://il.water.usgs.gov/proj/lirb/bst/site_descrip/marseilles.html> (accessed 21 August 2015). [USGS] U.S. Geological Survey. 2009. Earthquake Hazard in the New Madrid Seismic Zone Remains a Concern. Available at <http://pubs.usgs.gov/fs/2009/3071/pdf/FS09-3071.pdf> (accessed 5 September 2013). [USGS] U.S. Geological Survey. 2013a. Earthquake History of Illinois. Available at <http://earthquake.usgs.gov/earthquakes/states/illinois/history.php> (accessed 4 September 2013). [USGS] U.S. Geological Survey. 2013b. Largest Earthquake in Illinois. Available at <http://earthquake.usgs.gov/earthquakes/states/events/1968_11_09.php> (accessed 4 September 2013). [USGS] U.S. Geological Survey. 2013c. Isoseismal Map of 1968 Earthquake. Available at <http://earthquake.usgs.gov/earthquakes/states/events/1968_11_09_iso.php> (accessed 4 September 2013). [USGS] U.S. Geological Survey. 2015. USGS Water-Year Summary 2014, 05543500 Illinois River at Marseilles, Illinois. Available at <http://waterdata.usgs.gov/nwis/inventory/?site_no=05543500&agency_cd=USGS> (accessed 5 June 2015). Watrous KS, Donovan TM, Mickey RM, Darling SR, Hicks AC, Von Oettingen SL. 2006. Predicting minimum habitat characteristics for the Indiana bat in the Champlain Valley. The Journal of Wildlife Management 70(5):1228-1237. Whitaker JO Jr, Brack V Jr. 2002. Distribution and summer ecology in Indiana. pp. 48–54. In: Kurta A, Kennedy J, editors. 2002. The Indiana Bat: Biology and Management of an Endangered Species. Austin, TX: Bat Conservation International. 253 p. Wiken E, Nava FJ, Griffith G. 2011. North American Terrestrial Ecoregions—Level III. Commission for Environmental Cooperation, Montreal, Canada. April 2011. Available at <http://www3.cec.org/islandora/en/item/10415-north-american-terrestrial-ecoregionslevel-iii-en.pdf> (accessed 5 August 2015). Woods AJ, Omerinik JM, Pederson CL, Moran BC. 2006. Level III and Level IV Ecoregions of Illinois. EPA/600/R-06/104. Prepared on behalf of Oregon State University, U.S. Geological Survey, Eastern Illinois University, U.S. Environmental Protection Agency. Washington, DC: EPA. 45 p. Available at <ftp://ftp.epa.gov/wed/ecoregions/il/il_report.pdf> (accessed 9 March 2015).

4-1
4.0 ENVIRONMENTAL CONSEQUENCES AND MITIGATING ACTIONS
4.1 Introduction
In this chapter, the U.S. Nuclear Regulatory Commission (NRC) evaluates the environmental consequences of the proposed action (i.e., license renewal of LaSalle County Station, Units 1 and 2 (LSCS)), including the (1) impacts associated with continued operations similar to those that have occurred during the current license terms; (2) impacts of various alternatives to the proposed action; (3) impacts from the termination of nuclear power plant operations and decommissioning after the license renewal term (with emphasis on the incremental effect caused by an additional 20 years of operation); (4) impacts associated with the uranium fuel cycle; (5) impacts of postulated accidents (design-basis accidents and severe accidents); (6) cumulative impacts of the proposed action; and (7) resource commitments associated with the proposed action, including unavoidable adverse impacts, the relationship between short-term use and long-term productivity, and irreversible and irretrievable commitment of resources. The NRC also considers new and potentially significant information on environmental issues related to operation during the renewal term. NUREG–1437, Generic Environmental Impact Statement for License Renewal of Nuclear Plants (GEIS) (NRC 2013d) identifies 78 issues to be evaluated in the license renewal environmental review process. Generic issues (Category 1) rely on the analysis presented in the GEIS, unless otherwise noted. Applicable site-specific issues (Category 2) have been analyzed for LSCS and assigned a significance level of SMALL, MODERATE, or LARGE. Section 1.4 of this supplemental environmental impact statement (SEIS) provides an explanation of the criteria for Category 1 and Category 2 issues, as well as the definitions of SMALL, MODERATE, and LARGE. Resource-specific impact significance level definitions are provided where applicable.
4.2 Land Use and Visual Resources
This section describes the potential impacts of the proposed action (license renewal) and alternatives to the proposed action on land use and visual resources.
4.2.1 Proposed Action
Section 3.2 describes land use and visual resources in the vicinity of the LSCS site. Table 4–1 identifies the issues that apply to land use and visual resources during the proposed license renewal period. The GEIS (NRC 2013d) discusses these issues in Section 4.2.1. The GEIS does not identify any site-specific (Category 2) land use or visual resource issues. The NRC staff did not identify any new and significant information related to the generic (Category 1) land use and visual resource issues during the review of the applicant’s Environmental Report (ER) (Exelon 2014a), the site audit, or the scoping process. Therefore, the NRC staff expects no impacts associated with these issues beyond those discussed in the GEIS. The GEIS concludes that the impact level for each of these issues is SMALL.

Environmental Consequences and Mitigating Actions
4-2
Table 4–1. Land Use and Visual Resource Issues
Issue GEIS Section Category Land Use
Onsite land use 4.2.1.1 1
Offsite land use 4.2.1.1 1
Offsite land use in transmission line right-of-ways (ROWs)(a) 4.2.1.1 N/A(b)
Visual Resources
Aesthetic impacts 4.2.1.2 1
(a) This issue applies only to the in-scope portion of electric power transmission lines, which are defined as transmission lines that connect the nuclear power plant to the substation where electricity is fed into the regional power distribution system and transmission lines that supply power to the nuclear plant from the grid. As described in Section 3.1.6, all in-scope transmission lines subject to the evaluation of environmental impacts for license renewal are located within the LSCS site property boundary.
(b) This issue does not apply to LSCS because no offsite transmission lines are within the scope of license renewal. Section 3.1.6 describes the in-scope transmission lines.
Source: Table B–1 in Appendix B, Subpart A, to Title 10 of the Code of Federal Regulations (10 CFR) Part 51
4.2.2 No-Action Alternative
4.2.2.1 Land Use
If LSCS were to shut down, the impacts to land use would remain similar to those during operations until the plant is fully decommissioned. Temporary buildings and staging or laydown areas may be required during large component and structure dismantling. LSCS is likely to have sufficient space within previously disturbed areas for these needs; therefore, no additional land would need to be disturbed that would result in changes to current land uses. The GEIS (NRC 2013d) notes that land use impacts could occur in other areas beyond the immediate nuclear plant site as a result of the no-action alternative if new power plants are needed to replace lost capacity. The NRC staff did not identify any impacts that may result at LSCS beyond those discussed in NUREG–0586, and the NRC staff concludes that the no-action alternative is unlikely to noticeably alter or have more than minor effects on land use. Thus, the NRC staff concludes that the impacts of the no-action alternative on land use during the proposed license renewal term would be SMALL. 4.2.2.2 Visual Resources
If LSCS were to shut down, visual resource impacts would remain similar to those experienced during operations until the site is fully decommissioned. Thus, the NRC staff concludes that the impacts of the no-action alternative on visual resources would be SMALL.
4.2.3 New Nuclear Alternative
4.2.3.1 Land Use
The new nuclear alternative assumes that Exelon would build a new nuclear facility in Indiana, Iowa, Michigan, Missouri, Kentucky, or Wisconsin at an existing power plant site. Construction of the facility would require an estimated 324 ac (131 ha) for permanent buildings and facilities and an additional 232 ac (94 ha) for temporary facilities, laydown areas, and other temporary
Environmental Consequences and Mitigating Actions
4-3
land disturbances. Additional offsite land would be required for uranium mining, although this impact would result in no net change in land use impacts from those that would be associated with the proposed license renewal of LSCS. During construction, the use of an existing power plant site would maximize the availability of existing infrastructure and minimize disruption to land that had not been previously disturbed for industrial uses. However, given the land requirements, some undisturbed or non-industrial-use lands would likely be affected or converted to industrial areas. Such impacts would likely be noticeable within the direct footprint of the facility but would not result in changes that would destabilize surrounding land uses such that those lands would no longer function for their designated uses. Accordingly, the NRC staff concludes that construction impacts would be MODERATE. Operation of a new nuclear facility would incur impacts similar to those assessed for the proposed LSCS license renewal, which the NRC staff concludes, in Section 4.2.1, would be SMALL. Overall, impacts of a new nuclear alternative on land use would be MODERATE during construction and would be SMALL during operation. 4.2.3.2 Visual Resources
Because the facility would be located on an existing power plant site, visual resource impacts of most new buildings and infrastructure would be minimal. The construction of natural draft cooling towers would be the largest visual impact because both the towers themselves and the plume could be visible from a distance. The magnitude of this impact would vary based on the topography of the chosen site and surrounding area. The NRC staff concludes that the impacts to visual resources from construction and operation of a new nuclear alternative would be SMALL to MODERATE.
4.2.4 IGCC Alternative
4.2.4.1 Land Use
The integrated gasification combined-cycle (IGCC) alternative assumes that the new facility would be built at an existing power plant site in Illinois, including the LSCS site, or at another power plant site in Indiana, Iowa, Michigan, Missouri, Kentucky, or Wisconsin. The facility would require 2,000 ac (800 ha) of land to construct the facility. If the facility were to be sited on the LSCS site, the area currently occupied by the LSCS facilities, the undeveloped areas immediately surrounding the facility, and the area occupied by the Illinois fish hatchery would be affected. Exelon would also need to acquire adjacent parcels of land to provide the full complement of acreage required for the IGCC facility. Additional offsite land would be required for coal mining, although this impact would be partially offset by the elimination of land used for uranium mining to supply fuel to LSCS. During construction, the use of an existing site would maximize availability of existing infrastructure. However, construction would likely significantly affect surrounding natural areas on the site and within purchased adjacent land parcels because it would require the clearing and grading of these areas for industrial use. Whether sited on the LSCS site or elsewhere, the large footprint of the facility would likely require the conversion of land to industrial use from other land uses. Accordingly, construction would likely noticeably alter land uses, and the large area of land required for the IGCC facility could destabilize important attributes or functions of sensitive lands, such as nearby wetlands, if present. Accordingly, the NRC staff concludes that construction impacts would be MODERATE to LARGE.

Environmental Consequences and Mitigating Actions
4-4
Operation of an IGCC facility would likely not incur additional land use changes; therefore, operational impacts would be SMALL. Overall, impacts of an IGCC alternative on land use would be MODERATE to LARGE during construction, depending on the location and types of lands affected by construction, and would be SMALL during operation. 4.2.4.2 Visual Resources
Because the IGCC facility would be located on an existing industrial site, additional visual resource impacts would be minimal. The visibility of the plant stacks and mechanical draft cooling towers would vary based on the topography of the chosen site and surrounding area. Some temporary visual impacts may occur during construction from cranes and other construction equipment that may be visible off site. During operation, cooling tower plumes could create noticeable visual impacts. The NRC staff concludes that the impacts from the construction and operation of an IGCC alternative on visual resources would be SMALL.
4.2.5 Natural Gas Combined-Cycle Alternative
4.2.5.1 Land Use
The natural gas combined-cycle (NGCC) alternative assumes that a new NGCC facility would be built at the LSCS site. The facility would require 94 ac (38 ha) of land and would be sited on the undeveloped land immediately surrounding the LSCS. Some infrastructure upgrades could be required, as well as a new or upgraded pipeline, which would affect additional land. Additional offsite land would be required for gas extraction and collection, although this impact would be partially offset by the elimination of land used for uranium mining to supply fuel to LSCS. During construction, the use of the existing site would maximize the availability of existing infrastructure. However, construction would convert natural areas to industrial use because the new facility would be built outside the existing industrial footprint. Although these land use changes would be noticeable, construction would be unlikely to destabilize important attributes of surrounding lands, due to the small size of the facility footprint. Accordingly, the NRC staff concludes that construction impacts would be MODERATE. Operation of an NGCC facility would likely not incur additional land use changes; therefore, operational impacts would be SMALL. Overall, impacts of the NGCC alternative on land use would be MODERATE during construction and would be SMALL during operation. 4.2.5.2 Visual Resources
Because the NGCC facility would be located on an existing industrial site, additional visual resource impacts would be minimal. The mechanical draft cooling towers would likely not be taller than other buildings on site. Some temporary visual impacts may occur during construction from cranes and other construction equipment that may be visible off site. During operation, cooling tower plumes could create some visual impacts in the immediate vicinity of the facility. The NRC staff concludes that the impacts from the construction and operation of an NGCC alternative on visual resources would be SMALL.

Environmental Consequences and Mitigating Actions
4-5
4.2.6 Combination Alternative (NGCC, Wind, Solar)
4.2.6.1 Land Use
The NGCC component of the combination alternative would have the same land requirements as discussed for the NGCC alternative in Section 4.2.5.1. Accordingly, the impacts to land use would be similar to those concluded for the NGCC alternative and, therefore, would be MODERATE during construction and SMALL during operation. The wind component of this alternative would require an estimated 3,376 to 10,127 ac (1,366 to 4,098 ha) of land at onshore wind farm sites and agricultural cropland across the region of influence (ROI). However, the majority of this land would only be temporarily disturbed during construction. Permanently disturbed land would hold the wind turbines, access roads, and transmission lines and would account for 5 to 10 percent of the estimated required acreage. Land used for equipment laydown and turbine component assembly and erection could be returned to its original state following construction. Given the large footprint of the wind component, land use could be affected, although most land uses, such as agriculture, could continue once the wind turbines are operational. Land use impacts for the wind component would range from SMALL to MODERATE depending on the amount and types of land that would be affected by wind turbine construction. The solar component would require an estimated 7,397 ac (2,993 ha) of land across the ROI. The majority of solar installations could be installed on building roofs at existing residential, commercial, or industrial sites or at larger standalone solar facilities; therefore, only a little land would possibly be required for construction. However, the exact magnitude of impacts on land use would depend on the amount of land that must be converted for construction of solar installations. Unlike wind power, solar-powered installations often cannot be collocated with existing land uses (such as in crop-producing agricultural fields). The impacts of the solar component of this alternative on land use would range from SMALL to MODERATE, depending on the amount and types of land that would be affected by construction of the solar installations. The NRC staff concludes that the overall impacts of the combination alternative on land use would be SMALL to MODERATE. This range is primarily the result of the variability in land required for the wind and solar components. 4.2.6.2 Visual Resources
Visual resource impacts for the NGCC component of this alternative would be similar to or less than those described in Section 4.2.5.2 for the NGCC alternative and, therefore, would be SMALL. Visual resources would be significantly affected by construction of the wind component. Although specific effects would vary based on the topography and remoteness of the wind turbine locations, the visual impact of wind energy is often one of the most significant energy-generating visual impacts and could range from MODERATE to LARGE. The visual impacts of the solar component would also vary, based on the topography of the area, but the NRC staff expects these impacts to be minimal because individual solar installations are not tall or expansive, and many of the installations could be constructed on building roofs at existing residential, commercial, or industrial sites. Larger standalone solar facilities could have a greater visual impact, depending on the location, but the impacts of the solar component would likely be SMALL overall. The NRC staff concludes that the impacts of the combination alternative on visual resources would be SMALL to LARGE. This range is primarily the result of the potential visual impacts from the wind component of the alternative.

Environmental Consequences and Mitigating Actions
4-6
4.2.7 Purchased Power Alternative
4.2.7.1 Land Use
The purchased power alternative would have wide ranging impacts that are hard to specifically assess because this alternative could include a mixture of coal, natural gas, nuclear, and wind across many different sites in the ROI. This alternative would likely have little-to-no construction impacts because it would include power from already existing power generating facilities. The construction of additional transmission lines could affect land uses if the lines require the clearing of new transmission line corridors. However, if collocated with existing lines, transmission-line construction would be unlikely to alter existing land uses. The types of operational impacts from this alternative would be similar to the effects discussed in the preceding alternative sections. This alternative would be more likely to intensify already existing effects at power generating facilities than create wholly new effects on land use. Existing facilities would likely have best management practices (BMPs) and other procedures in place to ensure that effects to the environment during operations are minimized. The NRC staff concludes that the impacts on land use from the purchased power alternative would be SMALL. 4.2.7.2 Visual Resources
The purchased power alternative would likely not result in the construction of any buildings or facilities or any other changes to existing visual resources. Visual impacts from transmission-line construction could be minimized by collocating lines within existing transmission line corridors. The NRC staff concludes that the purchased power alternative would not have noticeable impacts on visual resources, and as such, would be SMALL.
4.3 Air Quality and Noise
This section describes the potential impacts of the proposed action (license renewal) and alternatives to the proposed action on air quality and noise conditions.
4.3.1 Proposed Action
4.3.1.1 Air Quality
Section 3.3 describes the meteorological, air quality, and noise conditions in the vicinity of LSCS. Table 4–2 identifies two Category 1 air quality issues that are applicable to LSCS: (1) air quality impacts (all plants) and (2) air quality effects of transmission lines. There are no Category 2 issues for air quality. The Category 1 issue, air quality effects of transmission lines, considers the production of ozone and nitrogen oxides (NOx); the GEIS (NRC 2013d) found that minute and insignificant amounts of ozone and nitrogen oxides are generated during the transmission of power to the nuclear plant from the grid. The Category 1 issue, air quality impacts (all plants), considers the air quality impacts from continued operation and refurbishment associated with license renewal.
Table 4–2. Air Quality and Noise
Issue GEIS Section Category Air quality impacts (all plants) 4.3.1.1 1 Air quality effects of transmission lines 4.3.1.1 1 Noise impacts 4.3.1.2 1
Source: Table B–1 in Appendix B, Subpart A, to 10 CFR Part 51

Environmental Consequences and Mitigating Actions
4-7
The NRC staff did not identify any new and significant information during the review of LSCS’s ER (Exelon 2014a), the site audit, or the scoping process. As a result, the NRC did not identify any information or impacts related to these issues that would change the conclusions presented in the GEIS. Therefore, there are no impacts related to these issues beyond those discussed in the GEIS. The GEIS concludes that the impact level for each of these issues is SMALL. 4.3.1.2 Noise
One Category 1 noise issue is applicable to LSCS: noise impacts (Table 4–2). The 1996 GEIS (NRC 1996) concluded that noise was not a problem at operating plants and that it was not expected to be a problem at any nuclear plant during the license renewal term. The GEIS (NRC 2013d) did not identify new information that would alter this conclusion; therefore, impacts are expected to be SMALL. The NRC staff did not identify any new and significant information during the review of LSCS’s ER (Exelon 2014a, 2015j), the site audit, or the scoping process. As a result, the NRC did not identify any information or impacts related to this issue that would change the conclusions presented in the GEIS. Therefore, there are no impacts related to this issue beyond those discussed in the GEIS. The GEIS concludes that the impact level for this issue is SMALL.
4.3.2 No-Action Alternative
4.3.2.1 Air Quality
When the plant stops operating, there will be a reduction in emissions from many activities related to plant operation, such as the use of stationary combustion sources (i.e., diesel generators and pumps) and vehicle traffic (i.e., employee and delivery vehicles). Therefore, if emissions decrease, the impact on air quality from shutting down LSCS would be SMALL. 4.3.2.2 Noise
When the plant stops operating, there will be a reduction in noise from activities related to plant operations, such as the turbines, switchyard/transformers, sirens, loudspeakers, and vehicle traffic (i.e., employee and delivery vehicles). As activity from noise sources is reduced below levels associated with operation of LSCS, impacts would be SMALL.
4.3.3 New Nuclear Alternative
4.3.3.1 Air Quality
This alternative includes the construction and operation of two Westinghouse AP1000 reactors, each with an approximate generating capacity of 1,120 megawatts electric (MWe). Due to the moratorium preventing the construction of new nuclear power plants within Illinois, the new nuclear alternative would have to be located elsewhere in the ROI (Indiana, Iowa, Michigan, Missouri, Kentucky, and Wisconsin) at an existing nuclear plant or retired coal site to maximize the use of existing infrastructure. Because the new nuclear alternative could be located anywhere within the seven-state ROI, it is unknown at this time whether the specific site(s) would be located within a designated attainment area. Construction of the new nuclear plant would result in temporary impacts on local air quality. During the construction phase, the primary sources of air emissions would consist of engine exhaust and fugitive dust emissions. Engine exhaust emissions would be from heavy construction equipment and commuter, delivery, and support vehicular traffic traveling within, to, and from the facility. Fugitive dust emissions would be from soil disturbances by heavy construction equipment (e.g., earthmoving, excavating, and bulldozing); vehicle traffic on unpaved surfaces; concrete batch plant operations (if any); and wind erosion to a lesser extent.

Environmental Consequences and Mitigating Actions
4-8
Air emissions include criteria pollutants (i.e., particulate matter, nitrogen oxide, carbon monoxide, and sulfur dioxide); volatile organic compounds (VOCs); hazardous air pollutants (HAPs), and greenhouse gases (GHGs). Small quantities of VOC and HAP emissions would be released from equipment refueling; organic solvents used in cleaning, onsite storage, and use of petroleum-based fuels; onsite maintenance of the heavy construction equipment; and certain painting and other construction-finishing activities. Air emissions would be intermittent and would vary, based on the level and duration of a specific activity throughout the construction phase. Based on the State and Federal permits and regulated practices for managing air emissions from construction equipment and temporary stationary sources, controlling fugitive dust, and inspecting vehicles and traffic management plans, the NRC staff expects that potential impacts on air quality from building a nuclear power plant would be minimal. Because air emissions from construction activities would be limited, local, and temporary, the NRC staff concludes that the overall air quality impacts associated with construction of a new nuclear alternative would be SMALL. Operation of a new nuclear generating plant would result in similar air emissions to those at LSCS. Nuclear power plants do not burn fossil fuels to generate electricity. Sources of air emissions include stationary combustion sources (e.g., diesel generators and diesel pumps), cooling towers, and mobile sources (e.g., worker vehicles, onsite heavy equipment and support vehicles, and delivery of materials and disposal of wastes). Air pollutants emitted from stationary combustion sources (e.g., criteria pollutants, VOCs, HAPs, and GHGs) and from cooling towers (particulate matter as drift) associated with operating a nuclear power plant would be permitted in accordance with state and Federal regulatory requirements. As noted in Section 3.3, LSCS maintains a Federally Enforceable State Operating Permit (also known as a “synthetic minor” air permit). A synthetic minor source has the potential to emit air pollutants in quantities at or above the major source threshold levels but has accepted Federally enforceable limitations to keep the emissions below such levels. Because air emissions would be similar for a new nuclear plant, the NRC staff expects similar air permitting conditions and regulatory requirements. Subpart P of 40 CFR 51.307 contains the visibility protection regulatory requirements, including the review of the new sources that may affect visibility in any Federal Class I area. If a new nuclear plant were located near a mandatory Class I area, additional air pollution control requirements may be required. In general, most stationary combustion sources at a nuclear power plant would operate only for limited periods, often for periodic maintenance testing. Thus, emissions from stationary combustion sources would fall far below the threshold for major sources (100 U.S. short tons per year) and the threshold for mandatory GHG reporting (25,000 metric tons (MT) per year). The NRC staff expects similar air emissions for combustion sources from a new nuclear plant as are currently being emitted from LSCS (Exelon 2014a), as follows:
• carbon monoxide (CO)—2.2 tons (2 MT),
• nitrogen oxides (NOx)—8.4 tons (7.6 MT),
• sulfur dioxide (SO2)—0.002 tons (0.002 MT),
• particulate matter (PM10)—0.15 tons (0.14 MT), and
• particulate matter (PM2.5)—0.15 tons (0.14 MT). Additional particulate matter emissions would result from cooling tower operation and worker vehicles commuting to and from the plant. However, a nuclear power plant located in the ROI would use cooling water taken from a nearby river or lake, which would have relatively low concentrations of total dissolved solids. In addition, modern cooling towers would be equipped

Environmental Consequences and Mitigating Actions
4-9
with drift eliminators to minimize the loss of cooling water from the tower via drift. Thus, particulate matter emissions from cooling towers would be anticipated to be minimal. The NRC staff evaluated potential impacts on air quality associated with criteria pollutants and GHG emissions from operating a new nuclear alternative. The NRC staff determined that the impacts would be minimal. Therefore, the NRC staff concludes that the impacts of operation of a new nuclear alternative on air quality from emissions of criteria pollutants and GHGs would be SMALL. The NRC staff concludes that the air quality impacts associated with construction and operation of a new nuclear alternative would be SMALL. 4.3.3.2 Noise
Construction of a new nuclear power plant is similar to that of other large industrial projects and involves many noise-generating activities. In general, noise emissions vary with each phase of construction, depending on the level of activity, the mix of construction equipment for each phase, and site-specific conditions. Noise propagation to receptors is affected by several factors, including source-receptor configuration; land cover; meteorological conditions (i.e., temperature, relative humidity, and vertical profiles of wind and temperature); and screening (e.g., topography and natural or manmade barriers). Typical construction equipment, such as dump trucks, loaders, bulldozers, graders, scrapers, air compressors, generators, and mobile cranes, would be used, and pile-driving and blasting activities would take place during the construction of a new nuclear power plant. Other noise sources include commuter, delivery, and support vehicular traffic traveling within, to, and from the facility. During the construction phase, a variety of construction equipment would be used and at varying duration. Noise emissions from construction equipment are predicted to be in the 85- to 100-dBA range (FHWA 2006); however, noise levels attenuate rapidly with distance. At a 0.5-mi (0.8-km) distance from construction equipment, 85 to 90-dBA noise levels can drop to 51 to 61 dBA (NRC 2002). Additionally, noise abatement and controls can be incorporated to reduce noise impacts. Accounting for attenuation from the construction site and noise controls, predicted noise levels can exceed the U.S. Environmental Protection Agency (EPA) guideline of 55 dBA but can be less than the U.S. Department of Housing and Urban Development acceptable noise level guideline of 65 dBA. Based on the temporary nature of construction activities, consideration of noise attenuation from the construction site to residences, the location and characteristics (i.e., ground cover), and good noise control practices, the NRC staff concludes that the potential noise impacts of construction activities from a new nuclear alternative would be SMALL. During the operation phase, noise sources from the new nuclear power plant would include cooling towers; transformers; turbines; pumps; compressors; other auxiliary equipment (e.g., standby generators); and vehicular traffic (e.g., commuting, delivery, and support), similar to those for LSCS discussed in Section 3.3.2 of this SEIS. Although the plant layout and the distance from primary noise sources to the nearby receptors at LSCS might be different from those at a new nuclear alternative site and the new nuclear alternative will likely have cooling towers, the NRC staff does not expect noise impacts for a new nuclear plant to be any greater than those analyzed for the existing LSCS site. Although there would be noise generated by the impact of falling water associated with the cooling tower, noise from fans would not occur because the cooling tower would be a natural draft cooling tower, thus resulting in lower noise levels. Therefore, the noise impacts from operations of a new nuclear plant located within the ROI region would be SMALL.
Environmental Consequences and Mitigating Actions
4-10
The NRC staff concludes that the noise impacts associated with construction and operation of a new nuclear alternative would be SMALL.
4.3.4 IGCC Alternative
4.3.4.1 Air Quality
This alternative includes the construction and operation of four IGCC units with a total output of 2,472 MWe and a capacity factor of 85 percent. The new power plant is assumed to be located at an existing power plant site(s). These sites could be located in Illinois (including the LSCS site) or other adjoining States in the ROI (i.e., Indiana, Iowa, Michigan, Missouri, Kentucky, and Wisconsin). New infrastructure and infrastructure upgrades would depend on specific-site locations. Because the IGCC alternative could be located anywhere within the seven-state ROI, it is unknown at this time whether the specific site(s) would be located within a designated attainment area. If the IGCC alternative were to be located at LSCS, it would be located in LaSalle County; LaSalle County is designated as an attainment area for all National Ambient Air Quality Standards (NAAQS) (40 CFR 81.314). Construction of an IGCC plant would be similar to that of other large industrial projects and involves many activities similar to those for a new nuclear alternative presented in Section 4.3.3. Construction of an IGCC plant would result in the release of various criteria pollutants (i.e., particulate matter, nitrogen oxides, carbon monoxide, and sulfur dioxide); VOCs; HAPs; and GHGs from operation of internal combustion engines in construction vehicles, equipment, delivery vehicles, and vehicles used by the commuting construction workforce. In addition, soil disturbance activities, such as earthmoving and material handling, would generate fugitive dust. The onsite storage and dispensing of vehicle and equipment fuels result in VOC releases. Air emissions would be intermittent and would vary, based on the level and duration of a specific activity throughout the construction phase. Construction lead times for IGCC plants are estimated to be 3 years (NETL 2013). Impacts would be localized, intermittent, and short lived, and adherence to standard construction BMPs would mitigate such impacts. The NRC staff concludes that construction-related impacts on air quality from an IGCC alternative would be of relatively short duration and would be SMALL. The sources of air emissions during operation include heat recovery steam generator (HRSG) stacks, the wet gas sulfuric acid (WSA) exhaust system, acid gas removal process startup/shutdown vents, startup stacks, flares, material-handling equipment, and mechanical draft cooling towers (DOE 2010a). The HRSG stacks would release the most emissions. Auxiliary boilers and diesel-driven pumps would also generate emissions on an infrequent basis. Compared to conventional coal-fired power plants, the proposed IGCC power plant would reduce sulfur dioxide, nitrogen oxides, mercury, and particulate matter emissions by removing constituents from the synthetic gas (syngas) (i.e., gasifiers convert coal into a gas) (DOE 2010a). The IGCC alternative would also result in lower nitrogen oxide emissions because nearly 100 percent of the fuel-bound nitrogen from the syngas would be removed from the syngas before combustion in the gas turbine. Sulfur removal technology would remove more than 99 percent of the sulfur in the syngas. The use of sulfide-activated carbon could remove more than 92 percent of mercury from the syngas. More than 99.9 percent of particulate matter emissions would be removed from the syngas using high-temperature, high-pressure filtration. Various Federal and state regulations aimed at controlling air pollution would affect an IGCC alternative located in the seven-state ROI. A new IGCC plant would qualify as a new major source because of its potential to emit greater than 100 tons per year of criteria pollutants and would be subject to the requirements of a new source review (NSR) permitting program under

Environmental Consequences and Mitigating Actions
4-11
the Clean Air Act of 1970, as amended (CAA) (42 U.S.C. 7410 et seq.) (EPA 2015f). An NSR permit or construction permit would specify emission limits for each pollutant, along with monitoring and reporting requirements; specifications for fuel and control equipment; and monitoring and performance testing for the IGCC units, auxiliary boiler, and WSA process. The new IGCC plant would be required to secure a Title V operating permit from the state agency. An NSR review would limit emissions for criteria pollutants and would reflect existing ambient air quality at the selected location. An analysis regarding NAAQS compliance would be conducted at the specific site location. The IGCC alternative also would need to comply with the standard of performance for new stationary sources set forth in Subpart Da, “Standards of Performance for Electric Utility Steam Generating Units,” of 40 CFR Part 60. If the IGCC alternative were located close to a mandatory Class I area, additional air pollution control requirements would be necessary (Subpart P of 40 CFR Part 51) as mandated by the Regional Haze Rule. Within the ROI, there are five Class I Federal areas, including Mammoth Cave National Park in Kentucky (40 CFR 81.411), Isle Royale National Park and Seney Wilderness Area in Michigan (40 CFR 81.414), and Hercules-Glades Wilderness Area and Mingo Wilderness Area in Missouri (40 CFR 81.416). The rule could apply to the IGCC alternative but would depend on specific site location(s). If the IGCC alternative were to be located at the LSCS, the nearest Class I Federal area for visibility protection is the Mingo National Wildlife Refuge, which is approximately 306 mi (492 km) southwest of LSCS. Air emissions for the IGCC alternative were estimated based on emission factors presented in Table 4.3–1 in the GEIS (NRC 2013d). The resulting estimated emissions are as follows:
• sulfur dioxide (SO2)—820 tons (740 MT) per year,
• nitrogen oxides (NOx)—3,000 tons (2,720 MT) per year,
• particulate matter (PM10)—480 tons (435 MT) per year,
• carbon monoxide (CO)—2,045 tons (1,850 MT) per year, and
• carbon dioxide equivalent (CO2e)—14.3 million tons (13.0 million MT) per year. The IGCC alternative would produce 820 tons (740 MT) per year of sulfur dioxide and 3,000 tons (2,072 MT) per year of nitrogen oxides. The IGCC plant would have to comply with Title IV of the CAA (42 U.S.C. 7651) reduction requirements for sulfur oxides and nitrogen oxides, which are the main precursors of acid rain and are the major causes of reduced visibility. Title IV establishes maximum sulfur oxide and nitrogen oxide emission rates from the existing plants and a system of sulfur oxide emission allowances that can be used, sold, or saved for future use by the new plants. The new plant would be subjected to the continuous monitoring requirements of sulfur dioxide and nitrogen oxides as specified in 40 CFR Part 75. The Cross-State Air Pollution Rule (Volume 76 of the Federal Register, page 48208 (76 FR 48208)) requires 27 states (including Indiana, Iowa, Michigan, Missouri, Kentucky, and Wisconsin) to improve air quality and requires power plants to reduce annual sulfur dioxide and/or nitrogen oxide emissions to assist in attaining the ozone and fine particle NAAQS. A new IGCC plant would be subject to these additional rules and regulations. The IGCC alternative would emit approximately 14.3 million tons (approximately 13 million MT) per year of CO2e emissions. The plant would be subjected to the continuous monitoring requirements for carbon dioxide, as specified in 40 CFR Part 75. On July 12, 2012, EPA issued a final rule tailoring the criteria that determine which stationary sources and modifications to existing projects become subject to permitting requirements for GHG emissions under the prevention of significant deterioration (PSD) and Title V Federal permit programs of the CAA
Environmental Consequences and Mitigating Actions
4-12
(77 FR 41051). Beginning January 2, 2011,2 operating permits issued to major sources of GHG under the PSD or Title V permit programs must contain provisions requiring the use of best available control technology to limit the emissions of GHGs, if those sources would be subject to PSD or Title V permitting requirements because of their non-GHG pollutant emission potentials and if their estimated GHG emissions are at least 75,000 tons per year of CO2e. If the IGCC alternative meets PSD or Title V permitting requirements for non-GHG pollutant emissions and the GHG emission thresholds established in the rule, GHG emissions from this alternative would be regulated under the PSD and Title V permit programs. In response to the Consolidated Appropriations Act of 2008 (Public Law 110–161), EPA issued final mandatory GHG reporting regulations for major sources effective in December 2009 (74 FR 56260). Major sources are defined as those sources emitting more than 25,000 MT per year of all GHGs. An IGCC alternative would be subject to these reporting regulations with or without carbon capture. On January 8, 2014, EPA issued a proposal for GHG emissions from new fossil fuel-fired electric utility steam generating units (79 FR 1430). It also proposes standards of performance for IGCC units that burn coal. The performance standards are based on partial implementation of carbon capture and sequestration (CCS) as the best system of emission reduction. The EPA issued final standards that limit GHG emissions from newly constructed, modified, and reconstructed fossil fuel-fired electric utility steam generating units and stationary combustion turbines on October 23, 2015 (Clean Power Plan; 80 FR 64510). The IGCC alternative may be subject to these standards. An IGCC alternative also would be subject to the Mercury and Air Toxics Standards (MATS) final rule, which was finalized by EPA on December 16, 2011 (77 FR 9304). Standards for emissions of heavy metals (i.e., mercury, arsenic, chromium, and nickel) and acid gases (i.e., hydrochloric acid and hydrofluoric acid) are set by MATS. Mercury is the most prominent HAP emitted and is subject to regulation by the MATS rule. New IGCC units are required to meet a mercury emission limit of 0.003 lb per gigawatt hour (Subpart UUUUU of 40 CFR Part 63). The NRC staff estimates that an IGCC alternative replacing the electrical output of LSCS would generate 0.03 ton (0.02 MT) of mercury per year. The impact from sulfur dioxide, nitrogen oxide, particulate matter, and carbon monoxide emissions would be significant and would be subject to Title V permitting. GHG emissions also would be noticeable and significant; GHG emissions would be much larger than the threshold in the EPA GHG Tailoring Rule (77 FR 41051), and GHG emissions may be regulated under the PSD and Title V permit programs that would trigger a regulated NSR. In the near future, carbon dioxide emissions could be reduced considerably if CCS technology were installed. As a result of the significant criteria air emissions, a major air emission source, and significant GHG emissions, the NRC staff concludes that the air quality impacts associated with operation of an IGCC alternative would be MODERATE. The NRC staff concludes that the overall air quality impacts associated with construction and operation of an IGCC alternative would be MODERATE.
2 On June 23, 2014, the U.S. Supreme Court issued a decision that EPA may not treat GHGs as an air
pollutant for purposes of determining whether a source is a major source required to obtain a PSD or Title V permit but could continue to require PSD and Title V permits otherwise required, based on emissions of conventional pollutants. In July 2014, EPA issued a memorandum in response to the Supreme Court’s decision and acknowledged that, although the decision is pending judicial action, EPA will no longer require PSD or Title V permits for GHG-emitting sources that are not sources subject to PSD or Title V permits based on emissions of conventional pollutants (e.g., nitrogen oxides and carbon monoxide) (EPA 2015b).

Environmental Consequences and Mitigating Actions
4-13
4.3.4.2 Noise
Construction of an IGCC plant is similar to that of other large industrial projects, and construction-related noise sources would be virtually the same as those for construction of the nuclear alternative. However, the construction period for the IGCC alternative would be shorter, and activities would be scattered over a wider area as compared with construction of a nuclear alternative. Consequently, with construction-related noise for the nuclear alternative as a bounding condition, the NRC staff concludes that construction-related noise impacts associated with the IGCC alternative would be SMALL. Operation of an IGCC plant would introduce mechanical sources of noise that would be audible off site. Continuous sources include the mechanical equipment associated with normal plant operations and mechanical draft cooling towers. Mechanical draft cooling towers may result in greater sound levels than natural draft cooling towers as a result of the mechanical noise associated with the movement of fans. However, mechanical draft cooling towers can be equipped with fans with sound attenuators. Intermittent sources include the equipment related to coal handling, solid waste disposal, transportation related to coal and lime/limestone delivery, and the commuting of plant employees. Noise associated with rail delivery of coal and lime/limestone would extend beyond the plant site boundary and would be most significant for residents living in the vicinity of the facility and along the rail route. Transportation-related noise sources have the potential for causing impacts, as these noise sources reach beyond the plant site boundary. Noise impacts associated with rail delivery are predicted to be in the 80- to 96-dBA range (NRC 2002). As a result of additional noise associated with both the mechanical cooling towers and the rail line and unknown distance from primary noise sources to nearby sensitive receptors, the NRC staff concludes that the potential offsite noise impacts on residents in the vicinity of an operating IGCC alternative site would range from SMALL to MODERATE The NRC staff concludes that the overall potential impacts of noise associated with construction and operation of the IGCC alternative and the rail line are considered to range from SMALL to MODERATE.
4.3.5 NGCC Alternative
4.3.5.1 Air Quality
This alternative includes the construction and operation of five NGCC 560-MWe units (total 2,800 MWe) and a capacity factor of 85 percent. These sites could be located at an existing power plant site in the ROI (including the LSCS site). Some infrastructure upgrades may be required and would require construction of a new or upgraded pipeline. Using existing power plant sites maximizes availability of infrastructure and reduces disruption to land and populations. Because the NGCC alternative could be located anywhere within the seven-state ROI, it is unknown at this time whether the specific site(s) would be located within a designated attainment area. If the NGCC alternative were to be located at LSCS, it would be located in LaSalle County; LaSalle County is designated as an attainment area for all NAAQS (40 CFR 81.314). Construction of an NGCC power plant would be similar to that of other large industrial projects. Construction of an NGCC power plant would result in the release of various criteria pollutants (i.e., particulate matter, nitrogen oxides, carbon monoxide, and sulfur dioxide); VOCs; HAPs; and GHGs from the operation of internal combustion engines in construction vehicles, equipment, delivery vehicles, and vehicles used by the commuting construction workforce. In addition, onsite soil disturbance activities, such as earthmoving and material handling, would

Environmental Consequences and Mitigating Actions
4-14
generate fugitive dust. Releases of VOCs will also result from the onsite storage and dispensing of vehicle and equipment fuels. Air emissions would be intermittent and would vary, based on the level and duration of a specific activity throughout the construction phase. Gas-fired power plants are constructed relatively quickly; construction lead times for NGCC plants are around 2 to 3 years (EIA 2011; OECD/NEA 2005). Impacts would be localized, intermittent, and short lived, and adherence to standard construction BMPs would mitigate such impacts. Therefore, the NRC staff concludes that construction-related impacts on air quality from an NGCC alternative would be of relatively short duration and would be SMALL. Operation of the NGCC plant could result in significant emissions of certain criteria pollutants, including carbon monoxide, nitrogen oxides, and particulate matter. The sources of air emissions during operation include gas turbines through HRSG stacks and mechanical draft cooling towers. An analysis regarding NAAQS compliance would be conducted at the specific site location. Various Federal and state regulations aimed at controlling air pollution would affect an NGCC alternative located in the seven-state ROI. An NGCC plant would be subject to NSR permitting program requirements to ensure that air emissions are minimized and that the local air quality is not substantially degraded (EPA 2015e). The new NGCC plant would be required to secure a Title V operating permit from the state agency. The NGCC plant would need to comply with the standards of performance for stationary combustion turbines set forth in Subpart KKKK of 40 CFR Part 60. If the NGCC alternative were located close to a mandatory Class I area, additional air pollution control requirements would be required (Subpart P of 40 CFR Part 51), as mandated by the Regional Haze Rule. A detailed discussion of these Federal and state regulations is provided in Section 4.3.4 (see the air quality operation discussion for the IGCC alternative). Air emissions for the NGCC alternative were estimated using emission factors developed by the U.S. Department of Energy’s (DOE’s) National Energy Technology Laboratory (NETL) NGCC analysis (NETL 2010). Assuming a total gross capacity of 2,800 MWe and a capacity factor of 0.85, the resulting estimated NGCC emissions are as follows:
• sulfur dioxide (SO2)—32 tons (29 MT) per year,
• nitrogen oxides (NOx)—700 tons (635 MT) per year,
• particulate matter (PM10)—51 tons (46 MT) per year,
• carbon monoxide (CO)—72 tons (65 MT) per year, and
• carbon dioxide equivalent (CO2e)—9.0 million tons (8.2 million MT) per year. The NGCC alternative would produce 32 tons (29 MT) per year of sulfur dioxide and 700 tons (635 MT) per year of nitrogen oxides. The new plant would be subjected to the continuous monitoring requirements of sulfur dioxide and nitrogen oxides as specified in 40 CFR Part 75. A new NGCC plant would be subject to the additional rules and regulations set forth in the Cross-State Air Pollution Rule (see Section 4.3.4 above). The NGCC alternative would emit approximately 9.0 million tons (approximately 8.2 million MT) per year of CO2e. The plant would be subjected to the continuous monitoring requirements for carbon dioxide, as specified in 40 CFR Part 75. On July 12, 2012, EPA issued a final rule tailoring the criteria that determine which stationary sources and modifications to existing projects become subject to permitting requirements for GHG emissions under the PSD and Title V programs of the CAA (77 FR 41051). Beginning January 2, 2011, operating permits issued to major sources of GHG under PSD or Title V Federal permit programs must contain provisions requiring the use of best available control technology to limit the emissions of GHGs, if those sources would be subject to PSD or Title V permitting requirements because of their
Environmental Consequences and Mitigating Actions
4-15
non-GHG pollutant emission potentials and if their estimated GHG emissions are at least 75,000 tons per year of carbon dioxide equivalent (CO2e) emissions. If the NGCC alternative meets PSD or Title V permitting requirements for non-GHG pollutant emissions and the GHG emission thresholds established in the rule, GHG emissions from this alternative would be regulated under the PSD and Title V permit programs. Furthermore, the NGCC alternative would be subject to the carbon dioxide emission performance rate standard and best system of emission reduction set forth in the Clean Power Plan aimed at reducing carbon pollution from power plants (see Section 4.3.4 above). In response to the Consolidated Appropriations Act of 2008 (Public Law 110–161), EPA issued final mandatory GHG reporting regulations for major sources effective in December 2009 (74 FR 56260). Major sources are defined as those emitting more than 25,000 MT per year of all GHGs. An NGCC alternative would be subject to these reporting regulations with or without carbon capture. In December 2000, EPA issued regulatory findings on emissions of HAPs from electric utility steam-generating units (65 FR 79825). These findings indicated that natural gas-fired plants emit HAPs, such as arsenic, formaldehyde, and nickel and stated the following:
[T]he impacts due to HAP emissions from natural gas-fired electric utility steam generating units were negligible based on the results of the study. The Administrator finds that regulation of HAP emissions from natural gas-fired electric utility steam generating units is not appropriate or necessary [65 FR 79825].
Mercury is not emitted from NGCC power plants because natural gas used as fuel does not contain mercury. Nitrogen oxide emissions from an NGCC alternative would be significant and subject to Title V permitting. GHG emissions also would be noticeable and significant; carbon dioxide emissions would be much larger than the threshold in the EPA GHG Tailoring Rule. Therefore, the NRC staff concludes that the overall air quality impacts associated with operation of an NGCC alternative would be MODERATE. The NRC staff concludes that the overall air quality impacts associated with construction and operation of an NGCC alternative would be MODERATE. 4.3.5.2 Noise
The construction-related noise sources for an NGCC alternative would be virtually the same as those for construction of the IGCC alternative. Construction vehicles and equipment associated with the construction of the NGCC plant would generate noise; these impacts would be intermittent and would last only through the duration of plant construction. Noise emissions from common construction equipment would be in the 85- to 100-dBA range (FHWA 2006). However, noise abatement and controls can be incorporated to reduce noise impacts. The NRC staff concludes that construction-related noise impacts associated with the NGCC alternative would be SMALL. Noise impacts from operations would include mechanical draft cooling towers, transformers, turbines, pumps, compressors, exhaust stacks, the combustion inlet filter house, condenser fans, high-pressure steam piping, and vehicles (Saussus 2012). As discussed under the IGCC alternative, mechanical draft cooling towers can be equipped with fans with sound attenuators. Pipelines delivering natural gas fuel could be audible off site near gas compressor stations, but such noise impacts would be similar to impacts already occurring in the vicinity of the existing pipeline to which the new NGCC site would connect. Most noise-producing equipment is located inside the power block buildings, and no outside fuel-handling activities will occur.
Environmental Consequences and Mitigating Actions
4-16
Minor offsite noise sources could include pipeline compressor stations. The NRC staff concludes that operation-related noise impacts from the NGCC alternative would be SMALL. The NRC staff concludes that construction- and operation-related noise impacts from the NGCC alternative would be SMALL.
4.3.6 Combination Alternative (NGCC, Wind, Solar)
The combination alternative relies on NGCC-, wind-, and solar-generating capacity. The solar photovoltaic (PV) portion would consist of a total net capacity of 227 MWe; the onshore wind portion would consist of a total net capacity of 1,813 MWe; and the NGCC portion would consist of a total net capacity of 360 MWe. The NGCC portion of this alternative would be located at LSCS and in an attainment area (LaSalle County) for all NAAQS. The solar and wind portion of this alternative would be located in Illinois or other adjoining States in the ROI (i.e., Indiana, Iowa, Michigan, Missouri, Kentucky, and Wisconsin). 4.3.6.1 Air Quality
Air emissions associated with the construction of the NGCC portion of the combination alternative are similar to the NGCC alternative but due to its smaller size, would be proportionally reduced. As discussed in Section 4.3.5.1, construction activities for an NGCC alternative would cause some temporary impacts to air quality from dust generation during operation of the earth-moving and material-handling equipment and exhaust emissions from worker vehicles and construction equipment. These emissions include criteria pollutants, VOCs, GHGs, and small amounts of HAPs. However, these impacts would be localized, intermittent, and short lived, and adherence to standard construction BMPs would mitigate such impacts. The NRC staff concludes that construction-related impacts on air quality from an NGCC portion of the combination alternative would be of relatively short duration and would be SMALL. For the wind portion of the combination alternative, the total estimated land requirement would be between 3,376 and 10,127 ac (1,366 to 4,098 ha), but only a small percentage of the committed land area (5 to 10 percent or less) would be disturbed by construction activities because wind turbines need to be separated from one another to maximize energy production and to avoid wake turbulences created by upwind turbines. Construction of the wind portion of the combination alternative would involve a number of activities, including road and staging/laydown area construction, land clearing, topsoil stripping, earth-moving operations, grading, ground excavation, drilling, foundation treatment, erecting wind turbines, ancillary building/structure construction, and electrical and mechanical installation. For most wind energy facilities, the site preparation phase would last for only a few months, followed by a year-long construction phase (depending on the size of the wind energy facilities) (Tegen 2006). Air emissions associated with construction activities result from fugitive dust from soil disturbances and engine exhaust from heavy equipment and vehicular traffic. These emissions include criteria pollutants, VOCs, GHGs, and HAPs. Dust-suppression methods and other mitigation measures could reduce impacts from fugitive dust. The wind portion of the combination alternative would have no power block that would otherwise require intensive construction activities. Accordingly, the heavy equipment used, workforce, level of activities, and construction duration would be substantially lower than other alternatives. Therefore, the NRC staff concludes that the overall air quality impacts associated with construction of the wind portion of the combination alternative would be SMALL. Construction of the solar portion of the combination alternative would cause temporary impacts to air quality from fugitive dust from soil disturbances and engine exhaust from heavy equipment and vehicular traffic. Air emissions associated with construction activities include criteria

Environmental Consequences and Mitigating Actions
4-17
pollutants, VOCs, GHGs, and HAPs to a lesser amount. Dust-suppression methods and other mitigation measures could reduce impacts from fugitive dust. The solar PV portion of the combination alternative would have no power block that would otherwise require intensive construction activities. Accordingly, the number of heavy equipment and workforce, level of activities, and construction duration would be substantially lower than those for other alternatives. Therefore, the NRC staff concludes that the overall air quality impacts associated with construction of the solar PV portion of the combination alternative would be SMALL. Air emissions associated with the operation of the NGCC portion of the combination alternative are similar to the NGCC alternative in Section 4.3.5.1 but are reduced proportionally because its generating capacity is approximately 13 percent of the NGCC alternative. Air emissions for the NGCC alternative were estimated using emission factors developed by DOE’s NETL NGCC analysis (NETL 2010). Assuming a total gross capacity of 425 MWe and a capacity factor of 0.85, the resulting estimated NGCC emissions are as follows:
• sulfur dioxide (SO2)—4.9 tons (4.8 MT) per year,
• nitrogen oxides (NOx)—106 tons (96 MT) per year,
• particulate matter (PM10)—7.7 tons (57.0 MT) per year,
• carbon monoxide (CO)—10.9 tons (9.9 MT) per year, and
• carbon dioxide equivalent (CO2e)—1.3 million tons (1.2 million MT) per year. Estimated annual emissions of sulfur dioxide, nitrogen oxides, carbon monoxide, and particulate matter would be lower than the major source threshold. Furthermore, the NGCC portion of this alternative would be located at LSCS and would be a designated attainment area (LaSalle County) for all NAQQS. Therefore, the overall air quality impacts associated with operation of the NGCC portion of the combination alternative would be SMALL. Air emissions from the operation of wind energy facilities would include minor dust and engine exhaust emissions from vehicles and heavy equipment associated with site inspections, maintenance activities, and wind erosion from cleared land and access roads. The types of emission sources and pollutants during operation would be similar to those during construction, but emissions would be much less during operation. The NRC staff concludes that the overall air quality impacts associated with the operation of the wind portion of the combination alternative would be SMALL. In general, air emissions associated with the operation of solar energy facilities are negligible because no fossil fuels are burned to generate electricity. Emissions from solar fields would include fugitive dust and engine exhaust emissions from vehicles and heavy equipment associated with site inspections, maintenance activities (e.g., panel washing or replacement), and wind erosion from cleared lands and access roads. The types of emission sources and pollutants during operation would be similar to those during construction, but emissions would be much lower during operation. These emissions should not cause exceedances of air quality standards or have any impacts on climate change. The NRC staff concludes that the overall air quality impacts associated with the operation of the solar PV portion of the combination alternative would be SMALL. The overall air quality impacts associated with construction and operation of the combination alternative would be SMALL.

Environmental Consequences and Mitigating Actions
4-18
4.3.6.2 Noise
The construction-related noise sources for the NGCC portion of the combination alternative would be virtually the same as those for construction of the NGCC alternative. The construction period for the NGCC portion would be shorter, and the level of construction activities would be less extensive than for the NGCC alternative. Consequently, the NRC staff concludes that construction-related noise impacts associated with the NGCC portion of the combination alternative would be SMALL. Construction of the wind portion of the combination alternative would involve a number of activities, as described above. The wind portion of the combination alternative would have no power block that would otherwise require intensive construction activities. Accordingly, the number of heavy equipment and workforce, level of activities, and construction duration would be substantially lower than other alternatives. Considering these factors, the NRC staff concludes that construction-related noise impacts associated with the wind portion of the combination alternative would be SMALL. Construction of the solar PV portion of the combination alternative would involve a number of activities. The solar PV portion of the combination alternative would have no power block that would otherwise require intensive construction activities. Accordingly, the number of heavy equipment and workforce, level of activities, and construction duration would be substantially lower than other alternatives. Considering these factors, the NRC staff concludes that construction-related noise impacts associated with the solar PV portion of the combination alternative would be SMALL. Besides noise from the power block area, cooling towers, and vehicular traffic, operation-related noise for the NGCC portion would include limited outdoor waste-handling activities. Pipelines delivering natural gas fuel could be audible off site near gas compressor stations, but such sound impacts would be similar to impacts already occurring in the vicinity of the existing pipeline to which the new NGCC site would connect. Most noise-producing equipment is located inside the power block buildings, and no outside fuel-handling activities would occur. The NRC staff concludes that operation-related noise impacts from the NGCC portion of the combination alternative would be SMALL. Noise impacts from wind generation operations would include aerodynamic noise from the turbine rotors and mechanical noise from the turbine drive-train components. Noise levels are dependent on the wind and atmospheric conditions, which vary with time, and site-specific conditions, including the number and size of wind turbines, their layout, their distance to nearby sensitive receptors, land cover, and topography. Wind turbine noise levels can reach 105 dBA; however, studies show that at approximately 1,000 ft (300 m) from a wind turbine, noise levels can reach 43 dBA (GE 2010; Hessler 2011). Therefore, masking effects of background noise should be taken into consideration. Unless noise from wind turbines is masked by high background levels (e.g., near major highways or industrial complexes), it can be noticeable and annoying at farther distances. One study indicated that, for the same A-weighted sound level, proportions of respondents annoyed by wind turbine noise are higher than for other community noise, such as aircraft, road, or railway traffic, and that the proportion of respondents annoyed by the noise increases more rapidly (Pedersen and Persson Waye 2004). Therefore, the NRC staff concludes that operation-related noise impacts from the wind portion of the combination alternative would be SMALL to MODERATE, depending on the layout and location of the wind facility and on its distance to nearby sensitive receptors. The solar PV portion of the combination alternative would have no power block and cooling towers; therefore, there would be a minimal number of noise sources with low-level noises. Noise sources include small-scale cooling systems to dissipate heat from solar module
Environmental Consequences and Mitigating Actions
4-19
assemblies, solar tracking devices, inverters, transformers, and vehicle traffic for maintenance and inspection. Because of minimal noise-generating activities, noise from a solar PV facility would be anticipated to be inaudible or barely perceptible at the facility boundaries. Considering the minimum number of sources with low-noise levels and the area size of the solar PV facility, the NRC staff concludes that operation-related noise impacts from the solar PV portion of the combination alternative would be SMALL. The noise impacts associated with construction and operation of the combination alternative would be SMALL to MODERATE.
4.3.7 Purchased Power Alternative
4.3.7.1 Air Quality
As discussed in Section 2.2.2.5, purchased power would come from common types of existing technology (i.e., coal, natural gas, and nuclear) within the ROI, and the construction of new facilities to replace LSCS would be unlikely. Construction of new transmission lines would result in additional amounts of air emissions. Air emissions associated with the construction of transmission lines would be from operation of the earth-moving and material-handling equipment and exhaust emissions from worker vehicles and construction equipment. These emissions include criteria pollutants, VOCs, GHGs, and HAPs. However, these impacts would be temporary and would not likely be high. For purchased power from existing plants, the impacts on air quality are expected to be SMALL because change to existing plant operations would be minimal. If new facilities were to be constructed for purchased power, the impact on air quality would depend on the plant technology constructed and the air quality status (i.e., attainment, nonattainment, or maintenance status) where the generating plant is located because air emissions can vary substantially based on the alternative air quality standards. For instance, natural gas- and coal-fired plants emit higher amounts of nitrogen oxides, sulfur oxides, particulate matter, and carbon dioxide than nuclear power plants do. Purchased power from new nuclear plants would not have noticeable impacts on air quality. New natural gas- and coal-fired plants would have noticeable impacts on air quality as a result of the higher amounts of air emissions. Furthermore, if the plant is sited in a designated nonattainment or maintenance area, emission impacts from plant operation can be greater than those for a designated attainment area. Based on the above, impacts on air quality from purchased power from new plants would be SMALL to MODERATE. 4.3.7.2 Noise
Purchased power from existing electricity generating facilities would not have noticeable impacts on noise because change to existing plant operations would be minimal. Purchased power from new generating facilities could have impacts on noise. Construction and operation of new facilities could result in additional noise sources, including mechanical equipment associated with normal plant operations and vehicular traffic. Additionally, construction of new transmission lines could increase noise levels. Increase in noise levels from construction of new transmission lines and new facilities would be dependent on the distance of residents to the noise sources. Noise levels from operation would also be dependent on the type of technology; for instance, operation of nuclear or wind power. Therefore, impacts from purchased power on noise would be SMALL to MODERATE.

Environmental Consequences and Mitigating Actions
4-20
4.4 Geologic Environment
This section describes the potential impacts of the proposed action (license renewal) and alternatives to the proposed action on geologic and soil resources.
4.4.1 Proposed Action
Section 3.4 describes the local and regional geologic environment of the LSCS site. Table 4–3 identifies the issue related to geology and soils that is applicable to the LSCS site during the license renewal term.
Table 4–3. Geology and Soils Issues
Issue GEIS Section Category Geology and Soils 4.4.1 1
Source: Table B–1 in Appendix B, Subpart A, to 10 CFR Part 51
The NRC staff did not identify any new and significant information associated with the Category 1 geology and soils issue identified in Table 4–3 during the review of the applicant’s ER, the site audit, the scoping process, or the evaluation of other available information. As a result, the staff did not identify any information or impacts related to this issue that would change the conclusions presented in the GEIS (NRC 2013d). For this issue, the GEIS concludes that the impacts are SMALL. It is expected that there would be no incremental impacts related to this Category 1 issue during the renewal term beyond those discussed in the GEIS; therefore, the impacts associated with this issue are SMALL.
4.4.2 No-Action Alternative
There would not be any impacts to the geology and soils at the LSCS site with the shutdown of the facility. With the shutdown of the facility, no additional land would be disturbed. Therefore, impacts would be SMALL.
4.4.3 New Nuclear Alternative
For the new nuclear alternative, the impacts on geology and soil resources would occur during construction, and no additional land would be disturbed during operations. During construction, sources of aggregate material, such as crushed stone and sand and gravel, would be required to construct buildings, foundations, roads, and parking lots. These resources would likely be obtained from commercial suppliers using local or regional sources. Land clearing during construction and the installation of power plant structures and impervious surfaces would expose soils to erosion and would alter surface drainage. Best management practices would be implemented in accordance with applicable permitting requirements to reduce soil erosion. These practices would include the use of sediment fencing, staked hay bales, check dams, sediment ponds, riprap aprons at construction and laydown yard entrances, mulching and geotextile matting of disturbed areas, and rapid reseeding of temporarily disturbed areas. Removed soils and any excavated materials would be stored on site for redistribution, such as for backfill, at the end of construction. Construction activities would be temporary and localized. Therefore, the impacts of the new nuclear alternative on geology and soil resources would be SMALL.

Environmental Consequences and Mitigating Actions
4-21
4.4.4 IGCC Alternative
For the IGCC alternative, the impacts on geology and soil resources would occur during construction, and no additional land would be disturbed during operations. Geologic construction material would be obtained, and BMPs would be applied as described in the new nuclear alternative in Section 4.4.3. Therefore, the impacts of the IGCC alternative on geology and soil resources would be SMALL.
4.4.5 NGCC Alternative
For the NGCC alternative, the impacts on geology and soil resources would occur during construction, and no additional land would be disturbed during operations. Geologic construction material would be obtained, and BMPs would be applied as described in the new nuclear alternative in Section 4.4.3. Therefore, the impacts of the NGCC alternative on geology and soil resources would be SMALL.
4.4.6 Combination Alternative (NGCC, Wind, Solar)
For the combination NGCC, wind, and solar alternative, the impacts on geology and soil resources would occur during construction, and no additional land would be disturbed during operations. Geologic construction material would be obtained, and BMPs would be applied as described in the new nuclear alternative in Section 4.4.3. The solar PV and the wind farm part of this alternative would require a large amount of land. However, much of the land would be undisturbed because road and facility construction would disturb only a small fraction. Therefore, the impacts of the combination NGCC, wind, and solar alternative on geology and soil resources would be SMALL.
4.4.7 Purchased Power Alternative
The impacts of the purchased power alternative are likely to be bounded by the impact descriptions of the other alternatives. Purchased power is likely to come from existing facilities, or if new facilities are constructed, it would likely be from one of the previously discussed alternatives. These alternatives have SMALL impacts. Therefore, the impact of this alternative on geology and soil resources would be SMALL.
4.5 Water Resources
This section describes the potential impacts of the proposed action (license renewal) and alternatives to the proposed action on surface water and groundwater resources.
4.5.1 Proposed Action
4.5.1.1 Surface Water Resources
Section 3.5.1 describes surface water resource-related aspects and conditions relevant to the LSCS site. Table 4–4 identifies the Category 1 (generic) and Category 2 surface water use and quality issues applicable to LSCS.
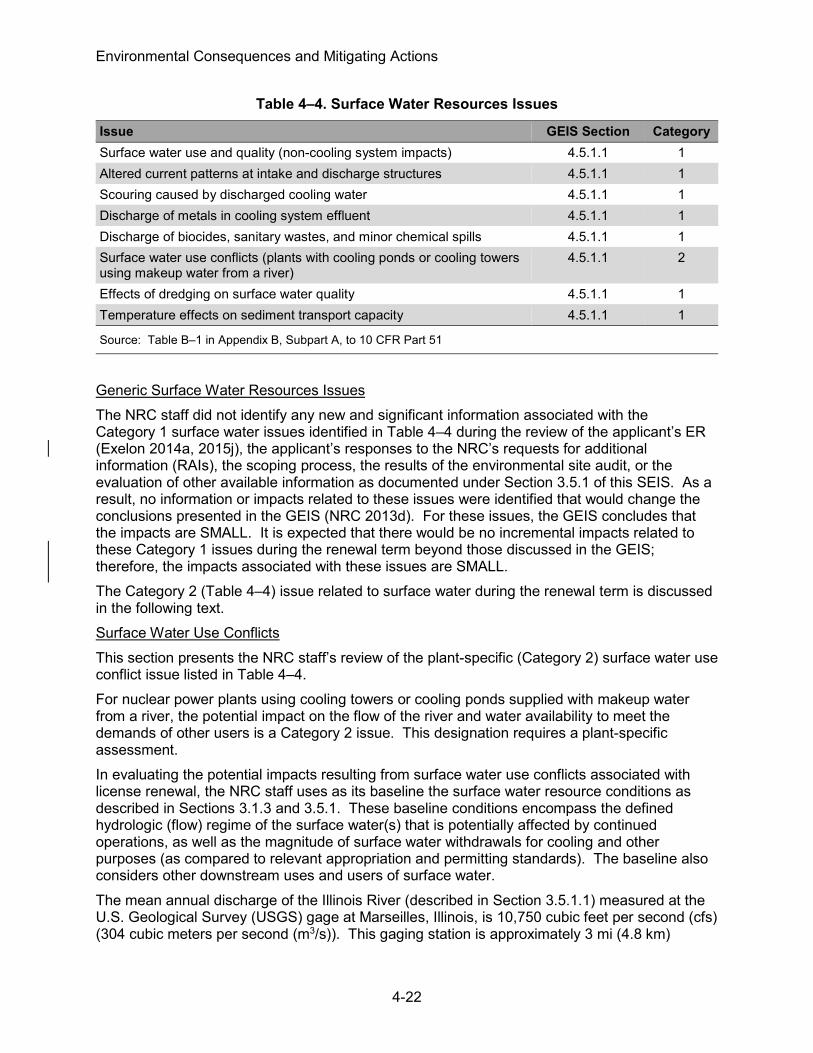
Environmental Consequences and Mitigating Actions
4-22
Table 4–4. Surface Water Resources Issues
Issue GEIS Section Category Surface water use and quality (non-cooling system impacts) 4.5.1.1 1 Altered current patterns at intake and discharge structures 4.5.1.1 1 Scouring caused by discharged cooling water 4.5.1.1 1 Discharge of metals in cooling system effluent 4.5.1.1 1 Discharge of biocides, sanitary wastes, and minor chemical spills 4.5.1.1 1 Surface water use conflicts (plants with cooling ponds or cooling towers using makeup water from a river)
4.5.1.1 2
Effects of dredging on surface water quality 4.5.1.1 1 Temperature effects on sediment transport capacity 4.5.1.1 1
Source: Table B–1 in Appendix B, Subpart A, to 10 CFR Part 51
Generic Surface Water Resources Issues The NRC staff did not identify any new and significant information associated with the Category 1 surface water issues identified in Table 4–4 during the review of the applicant’s ER (Exelon 2014a, 2015j), the applicant’s responses to the NRC’s requests for additional information (RAIs), the scoping process, the results of the environmental site audit, or the evaluation of other available information as documented under Section 3.5.1 of this SEIS. As a result, no information or impacts related to these issues were identified that would change the conclusions presented in the GEIS (NRC 2013d). For these issues, the GEIS concludes that the impacts are SMALL. It is expected that there would be no incremental impacts related to these Category 1 issues during the renewal term beyond those discussed in the GEIS; therefore, the impacts associated with these issues are SMALL. The Category 2 (Table 4–4) issue related to surface water during the renewal term is discussed in the following text. Surface Water Use Conflicts This section presents the NRC staff’s review of the plant-specific (Category 2) surface water use conflict issue listed in Table 4–4. For nuclear power plants using cooling towers or cooling ponds supplied with makeup water from a river, the potential impact on the flow of the river and water availability to meet the demands of other users is a Category 2 issue. This designation requires a plant-specific assessment. In evaluating the potential impacts resulting from surface water use conflicts associated with license renewal, the NRC staff uses as its baseline the surface water resource conditions as described in Sections 3.1.3 and 3.5.1. These baseline conditions encompass the defined hydrologic (flow) regime of the surface water(s) that is potentially affected by continued operations, as well as the magnitude of surface water withdrawals for cooling and other purposes (as compared to relevant appropriation and permitting standards). The baseline also considers other downstream uses and users of surface water. The mean annual discharge of the Illinois River (described in Section 3.5.1.1) measured at the U.S. Geological Survey (USGS) gage at Marseilles, Illinois, is 10,750 cubic feet per second (cfs) (304 cubic meters per second (m3/s)). This gaging station is approximately 3 mi (4.8 km)

Environmental Consequences and Mitigating Actions
4-23
downstream from the LSCS river screen house and associated river intake structure and blowdown discharge canal. Flows measured at this gaging station are also inclusive of surface water withdrawals that other entities make in the same general vicinity as LSCS and that withdraw surface water from the same portion of the Marseilles Pool as LSCS. These include Agrium U.S., Inc., and PCS Phosphate, Marseilles Operation. These facilities are discussed in Section 3.5.1.2 and shown in Figure 3–11. As described in Section 3.5.1.2, LSCS’s average surface water withdrawal rate from the Marseilles Pool of the Illinois River is approximately 105 cfs (2.96 m3/s or 67.8 million gallons per day (mgd)), with consumptive use averaging about 49.7 cfs (1.4 m3/s or 32.1 mgd). This consumptive use is equivalent to about 0.5 percent of the Illinois River’s average annual flow. The NRC staff also evaluated the impacts of continued LSCS operations on low-flow conditions in the Illinois River. The lowest annual mean flow recorded for the Illinois River at Marseilles is 5,583 cfs (157.7 m3/s), and the mean 90-percent exceedance flow is 4,340 cfs (123 m3/s) for the period of record (USGS 2015). The 90-percent exceedance flow is an indicator value of hydrologic drought. It signifies the flow rate that is equaled or exceeded 90 percent of the time as compared to the average flow for the period of record. Compared to these measures of reduced river flow, LSCS’s current consumptive water use (i.e., 49.7 cfs (1.4 m3/s or 32.1 mgd)) represents a 0.9- and a 1.1-percent reduction, respectively, in the flow of the river downstream of the LSCS site. LSCS’s consumptive water use is not expected to increase during the license renewal term (Exelon 2015b). As Exelon noted in its ER (Exelon 2014a), drought conditions could cause the flows in the main stem of the Illinois River and surface water elevations to fall below levels that could impact LSCS operations. As previously discussed in Section 3.5.1.2 of this SEIS, Exelon maintains an Extreme Heat Implementation Plan that is part of an overall Summer Readiness Plan. The Extreme Heat Implementation Plan provides procedural guidance to plant personnel for responding to worst-case summer weather and hydrologic conditions to ensure compliance with LSCS’s National Pollutant Discharge Elimination System (NPDES) permit for thermal discharge limits and to safeguard plant equipment. As necessary, plant personnel run thermal models and will adjust makeup pumping rates to the cooling pond or the rate of blowdown to the river to maintain permit compliance. Under extreme cases, it may be necessary for Exelon to reduce LSCS’s power output or to shut down the plant (e.g., under conditions of extremely low water levels). In conclusion, the NRC staff’s review of available data indicates that consumptive water use associated with LSCS operations combined with other surface water withdrawals within the Marseilles Pool have no substantial impact on downstream water availability. LSCS’s surface water withdrawals and low rate of consumptive use of flow in the Illinois River are very unlikely to substantially impact downstream water availability or instream uses of surface water within the Marseilles Pool during the license renewal term. Thus, operation of LSCS during the license renewal term is not expected to result in a water use conflict on the Illinois River. In addition, in the event of worst-case summer weather and hydrologic conditions affecting LSCS, Exelon has operational procedures in place to minimize hydrologic and thermal impacts on the river. In total, the NRC staff concludes that the potential impacts on surface water resources and downstream water availability from LSCS’s continued withdrawals and consumptive water use during the license renewal term would be SMALL. 4.5.1.2 Groundwater Resources
Section 3.5.2 describes groundwater resources at LSCS. Table 4–5 identifies issues related to groundwater that are applicable to LSCS during the license renewal term.

Environmental Consequences and Mitigating Actions
4-24
Table 4–5. Groundwater Issues
Issue GEIS Section Category Groundwater contamination and use (non-cooling system impacts) 4.5.1.2 1 Groundwater use conflicts (plants that withdraw less than 100 gpm) 4.5.1.2 1 Groundwater use conflicts (plants with closed-cycle cooling systems that withdraw makeup water from a river)
4.5.1.2 2
Groundwater quality degradation (plants with cooling ponds at inland sites) 4.5.1.2 2 Radionuclides released to groundwater 4.5.1.2 2
Source: Table B–1 in Appendix B, Subpart A to 10 CFR Part 51
Generic Groundwater Resources Issues The NRC staff did not identify any new and significant information associated with the Category 1 groundwater issues identified in Table 4–5 during the review of the applicant’s ER, the site audit, the scoping process, or the evaluation of other available information. As a result, no information or impacts related to these issues were identified that would change the conclusions presented in the GEIS (NRC 2013d). For these issues, the GEIS concludes that the impacts are SMALL. It is expected that there would be no incremental impacts related to these Category 1 issues during the renewal term beyond those discussed in the GEIS; therefore, the impacts associated with these issues are SMALL. The three Category 2 issues (see also Table 4–5) related to groundwater during the renewal term are discussed below. Groundwater Use Conflicts (Plants with Closed-Cycle Cooling Systems That Withdraw Makeup Water from a River) This issue looks at the potential impact of the consumption of river water on the availability of groundwater supplies. LSCS uses a cooling pond and withdraws water from a small river. In turn, the cooling pond loses water to the atmosphere by evaporation. As a result, less water is returned to the Illinois River than that withdrawn. This issue evaluates the impact of river water consumption and lowered river water levels on groundwater supplies. The Illinois River alluvium is hydrologically connected to the Alluvial Aquifer. The Alluvial Aquifer is found below and on each side of the Illinois River. It is underlain by the Pennsylvanian Aquitard (see Figure 3–8 in Section 3.4.1 of this document). Because the Pennsylvanian Aquitard is not a significant source of groundwater, the Alluvial Aquifer is the aquifer that would be most impacted by changes in Illinois River water levels. The average flow in the Illinois River at the Marseilles stream gage (5 mi (8 km) downstream from the intake and discharge structures) is 10,750 cfs (304 m3/s) (Exelon 2014a; USGS 1979, 2015). LSCS’s normal peak withdrawal rate from the river at the intake structure is 134 cfs (3.8 m3/s), and 67 cfs (1.89 m3/s) of blowdown is discharged to the river from the cooling pond. This means that 67 cfs (1.89 m3/s) is not returned to the river. This rate of consumption is 0.6 percent of the normal river flow in the area of the intake and discharge structures. From 1920 through 2014, the lowest annual river flow recorded at the Marseilles stream gage was 5,583 cfs (158 m3/s) in 1964 (USGS 2015). During this period of low flow, the average rate of consumption by the plant would be 1.2 percent of the flow in the river. This rate of consumption is also unlikely to have much impact on river levels and little or no impact on water levels in the Alluvial Aquifer. Therefore, the NRC staff concludes that impacts to groundwater use would be SMALL.

Environmental Consequences and Mitigating Actions
4-25
Groundwater Quality Degradation (Plants with Cooling Ponds at Inland Sites) This issue looks at the potential for the use of closed-cycle inland unlined cooling ponds to degrade the surrounding groundwater quality and the water quality of offsite wells. The total dissolved solids concentration in the cooling pond is limited by LSCS operational procedures to a concentration below the applicable State of Illinois water quality standard for receiving waters as set forth in 35 IAC 302. The water quality of the cooling pond is good enough to support a highly successful recreational fishery. With the exception of a few tritium samples that were near background values, between 2009 and 2014, radionuclide concentrations in the cooling pond have not been detected above background values (Exelon Nuclear 2010, 2011, 2012, 2013, 2014, 2015). The cooling pond is enclosed on the north, east, and south by dikes. On the west side of the cooling pond, the natural topography serves as the shoreline. Seepage from the cooling pond is negligible because the pond was built on the Glacial Drift Aquitard (Wedron Silty-Clay Till), which has a very low permeability and is 120- to 140-ft (37- to 43-m) thick in the area of the cooling pond. Seepage modeling, using data from test boring and pits in the reservoir area, indicates that any seepage rates would be very low (Exelon 2014a). As previously discussed in Section 3.5.2.1, this aquitard contains only small volumes of extractable groundwater (Exelon 2014a). Therefore, the impact of the cooling pond on groundwater quality would be SMALL. Radionuclides Released to Groundwater This issue looks at the potential contamination of groundwater from the inadvertent release of radioactive liquids from plant systems into the environment. Section 3.5.2.3 of this SEIS characterizes the groundwater quality at the LSCS site and vicinity, including historical releases of tritium to groundwater. In evaluating the potential impacts on groundwater quality associated with license renewal, the NRC staff uses, as its baseline, the existing groundwater conditions as described in Section 3.5.2.3 of this SEIS. These baseline conditions encompass the existing quality of groundwater potentially affected by continued operations (as compared to relevant State or EPA primary drinking water standards), as well as the current and potential onsite and offsite uses and users of groundwater for drinking and other purposes. The baseline also considers other down-gradient or in-aquifer uses and users of groundwater. Historical releases of liquids containing tritium have not impacted groundwater quality in aquifers within or beyond the LSCS site boundary. With the exception of the 2010 leak from the recycled condensate tank, all radiological leaks into groundwater have been successfully remediated. The 2010 leak from the recycled condensate tank contaminated groundwater in engineered granular fill but did not contaminate groundwater in an aquifer. The groundwater contaminated by this leak into the engineered fill has undergone significant cleanup, and because of the low permeability, thickness, and lateral extent of the surrounding Wedron Silty-Clay Till, it is very unlikely that the leak will impact offsite groundwater. The Cambrian-Ordovician Aquifer System is overlain by 312 ft (95 m) of aquitard and is too deep to be impacted by site activities. A search of Illinois State Geological Survey water well files identified six wells outside the site boundary but within 1 mi (1.6 km) of the plant buildings (ISGS 2015). With the exception of one well completed in the Pennsylvanian Aquitard, all the wells have been completed in the Cambrian-Ordovician Aquifer. Given the low permeability, thickness, and lateral extent of the Wedron Silty-Clay Till, there is little chance of significant impact to the groundwater quality of onsite and offsite aquifers. Present and future LSCS operations are not expected to impact the quality of groundwater in any aquifers that are a current or potential future source of water for offsite users. Therefore,
Environmental Consequences and Mitigating Actions
4-26
the NRC staff concludes that the impacts on groundwater use and quality during the license renewal term would be SMALL.
4.5.2 No-Action Alternative
4.5.2.1 Surface Water Resources
Surface water withdrawals and the rate of consumptive water use would greatly decrease and eventually cease after LSCS is shut down. Wastewater discharges would be reduced considerably. Therefore, shutdown would reduce the overall impacts on surface water use and quality. Stormwater would continue to be discharged from the plant site. Overall, the impact of this alternative on surface water resources would be SMALL. 4.5.2.2 Groundwater Resources
With the cessation of operations, there should be little or no impacts on groundwater quality, and the consumption of groundwater would be much less. The Glacial Drift Aquitard (Wedron Silty-Clay Till) and surrounding dikes would continue to limit groundwater movement either into or out of the cooling pond. Therefore, the impact of this alternative on groundwater resources would be SMALL.
4.5.3 New Nuclear Alternative
4.5.3.1 Surface Water Resources
Impacts from construction activities on surface water resources associated with the new nuclear alternative would be considerable in scale by virtue of the land area required for new nuclear units (i.e., 556 ac (225 ha). Deep excavation work for the nuclear island, extensive site clearing, and a large laydown area for facility construction would have the potential for direct and indirect impacts on water resources, which would vary based on site-specific conditions. Construction activities would alter any onsite surface water drainage features. Some temporary impacts to surface water quality may result from increased sediment loading and from any pollutants in stormwater runoff from disturbed areas, from excavation, and from any dredge-and-fill activities. Stormwater runoff from construction areas and spills and leaks from construction equipment could potentially affect downstream surface water quality. Nevertheless, application of BMPs in accordance with a State-issued NPDES general permit, including appropriate waste management, water discharge, stormwater pollution prevention, and spill prevention practices, would prevent or minimize surface water or groundwater quality impacts during construction. The NRC staff assumes that any existing intake and discharge infrastructure at an alternative site location would be refurbished and used to reduce construction-related impacts on surface water quality. Dredge-and-fill operations would be conducted under a permit from the U.S. Army Corps of Engineers (USACE) and State-equivalent permits requiring the implementation of applicable BMPs to minimize associated impacts. The staff assumes that there would be no direct use of surface water during construction and that water would be obtained from onsite groundwater or from a local water utility or trucked to the point of use. During construction, the dewatering of excavations would not be expected to affect offsite surface water bodies. The operation of the two new nuclear units using closed-cycle cooling with natural draft cooling towers would require an estimated 86.6 cfs (2.45 m3/s or 56 mgd) of surface water for cooling makeup and related processes. Consumptive water use would be approximately

Environmental Consequences and Mitigating Actions
4-27
65 cfs (1.84 m3/s or 42 mgd). The projected consumptive water use under this alternative represents about a 31-percent increase as compared to current LSCS operations, which consume approximately 49.7 cfs (1.4 m3/s or 32.1 mgd) of surface water (see Sections 3.5.1.2 and 4.5.1.1). However, permitting agencies within the ROI could impose limits on surface water withdrawals and consumption, which would potentially reduce the cited makeup water and consumptive use demands for this alternative on an annualized basis, particularly during periods of drought. The NRC staff further expects that water treatment additives for new nuclear plant operations and effluent discharges would be relatively similar in quality and volume to LSCS. Effluent discharges and stormwater discharges would be subject to a State-issued NPDES permit, and surface water withdrawals would be subject to applicable State water appropriation and registration requirements. To prevent and respond to accidental non-nuclear releases to surface water, facility operations would be conducted in accordance with a spill prevention, control, and countermeasures plan; storm water pollution prevention plan; or equivalent plans and associated BMPs and procedures. Based on the above, the overall impacts on surface water use and quality from construction and operations under the new nuclear alternative would be SMALL to MODERATE. 4.5.3.2 Groundwater Resources
For the new nuclear alternative, the staff assumed that construction water would be obtained from onsite groundwater or from a local water utility. During construction and throughout the life of this alternative, groundwater withdrawals would be subject to applicable State water appropriation and registration requirements. The application of BMPs in accordance with a State-issued NPDES general permit, including appropriate waste management, water discharge, stormwater pollution prevention plan, and spill prevention practices, would prevent or minimize groundwater quality impacts during construction. During operations, the consumptive use of groundwater for potable water and water for fire protection would be similar to the proposed action. Therefore, the impact of this alternative on groundwater resources would be SMALL.
4.5.4 IGCC Alternative
4.5.4.1 Surface Water Resources
Impacts from construction activities associated with the IGCC alternative on surface water resources would be expected to be similar to, but somewhat greater than, those under the new nuclear alternative (see Section 4.5.3.1). The potential for greater impacts is attributable to the additional land required for construction of the power blocks for four IGCC units and for excavation and construction of other onsite facilities for coal handling and storage and for coal ash and scrubber waste management. The same assumptions for construction and operations also apply to this alternative, except as noted. Some temporary impacts to surface water quality may result from increased sediment loading and from pollutants in stormwater runoff from disturbed areas and from excavation and dredge-and-fill activities. In addition, hydrologic and water-quality impacts could occur from the extension or refurbishment of rail spurs to transport coal and other materials to potential site locations and to transfer coal ash from those sites. Using an existing power plant site would allow the use of the existing cooling water intake, effluent discharge, and rail infrastructure. If the IGCC plant is located at the LSCS site, portions of the cooling pond and other plant areas may be repurposed to construct IGCC facilities, including closed-cycle mechanical draft cooling towers. Regardless, as described in Section 4.5.3.1 for the new nuclear alternative,
Environmental Consequences and Mitigating Actions
4-28
water-quality impacts from construction activities would be minimized by the application of BMPs and through compliance with State-issued NPDES permits. Any dredge-and-fill operations would be conducted under a permit from the USACE and State-equivalent permits requiring the implementation of BMPs to minimize impacts. Operation of an IGCC plant would require less makeup water and would have lower consumptive use than that of either the new nuclear alternative or current LSCS operations. The projected cooling water makeup requirement for an IGCC plant under this alternative is approximately 39 cfs (1.09 m3/s or 25 mgd), with consumptive use of about 31 cfs (0.87 m3/s or 20 mgd). This alternative would consume about 38 percent less surface water than that under current LSCS operations, which consumes approximately 49.7 cfs (1.4 m3/s or 32.1 mgd). As summarized in Section 4.5.3.1 for the new nuclear alternative, surface water withdrawals and effluent discharges would be subject to applicable regulatory requirements under this alternative. However, management of runoff and leachate from coal and ash storage facilities would require additional regulatory oversight and would present an additional risk to surface water resources near site locations. For this alternative, based on the projected magnitude of ground disturbance and hydrologic alteration and potential water quality impacts from coal and ash handling and management, impacts on surface water resources would range from SMALL to MODERATE. 4.5.4.2 Groundwater Resources
The impact significance level on groundwater resources for the IGCC alternative is less than the new nuclear alternative described in Section 4.5.3.2. Approximately the same amount of groundwater would be consumed during the operation of the facility, but less groundwater would be consumed in the construction of the facility than for the new nuclear alternative. Therefore, impacts of the IGCC alternative on groundwater resources would be SMALL.
4.5.5 NGCC Alternative
4.5.5.1 Surface Water Resources
Direct impacts from construction activities associated with the NGCC alternative on surface water resources would be expected to be much smaller than those under either the new nuclear or IGCC alternative. A new NGCC plant and associated pipelines would occupy a much smaller footprint (i.e., about 94 ac (38 ha)) than that of the current LSCS facility or the proposed new nuclear or IGCC facilities. This smaller footprint would result in less extensive excavation and earthwork. Otherwise, the same assumptions for construction and operations also apply to this alternative, except as noted. Some temporary impacts to surface water quality may result from increased sediment loading, any pollutants in stormwater runoff from disturbed areas, excavation, and dredge-and-fill activities. Depending on the path of any required new gas pipelines and transmission lines to service the NGCC plant, some stream crossings could be necessary. However, because of the short-term nature of any required dredge-and-fill operations and stream-crossing activities, the hydrologic alterations and sedimentation would be localized, and water-quality impacts would be temporary and would cease after construction has been completed and the site has been stabilized. The use of modern pipeline construction techniques, such as horizontal directional drilling, would further minimize the potential for water-quality impacts in the affected streams. In addition, as described in Section 4.5.3.1 for the new nuclear alternative, water-quality impacts would be minimized by the application of BMPs and through compliance with State-issued NPDES permits for construction. Any dredge-and-fill operations would be conducted under a

Environmental Consequences and Mitigating Actions
4-29
permit from the USACE and State-equivalent permits requiring the implementation of BMPs to minimize impacts. For onsite facility operations, a five-unit NGCC plant would have a smaller cooling water demand and lower consumptive water use as compared to that under current LSCS operations and for the new nuclear and IGCC alternatives. It is projected that an NGCC plant would require approximately 26.3 cfs (0.74 m3/s or 17 mgd) of surface water for cooling and related processes, with consumptive use totaling about 20.1 cfs (0.57 m3/s or 13 mgd). Thus, this alternative would consume about 60 percent less surface water than that under current LSCS operations, which consumes approximately 49.7 cfs (1.4 m3/s or 32.1 mgd). Based on this analysis, the overall impacts on surface water resources from construction and operations under the NGCC alternative would be SMALL. 4.5.5.2 Groundwater Resources
The impact significance level on groundwater resources for the NGCC alternative are less than the new nuclear alternative described in Section 4.5.3.2. Approximately the same amount of groundwater would be consumed during the operation of the facility, but less groundwater would be consumed in the construction of the facility. Therefore, impacts of the NGCC alternative on groundwater resources would be SMALL.
4.5.6 Combination Alternative (NGCC, Wind, Solar)
4.5.6.1 Surface Water Resources
For the NGCC component of this alternative, the impacts on surface water resources from facility construction and operations at either the LSCS site or another existing power plant site would be a fraction of those described in Section 4.5.5.1 because the NGCC plant would be scaled back to a single 360-megawatt (MW) unit. As a result, operational cooling water demands would be reduced by roughly 90 percent. Impacts on surface water resources from constructing land-based wind turbines would primarily be limited to the relatively small amounts of water needed at each installation site for dust suppression and soil compaction during site clearing, turbine pad preparation, and concrete production. Construction of utility-scale solar PV farms would require relatively larger volumes of water per site due to the larger land area required per megawatt of replacement power produced. For both components under this alternative, the NRC assumes that required construction water would be procured from offsite sources and trucked to the point of use on an as-needed basis. Water could also be supplied via a local water utility. The likely use of ready-mix concrete would also reduce the need for onsite use of nearby water sources for construction. Installation of land-based wind turbines and utility-scale solar PV farms would also require construction of access roads and possibly transmission lines (especially for sites that are not already proximal to transmission line corridors). Access road construction would also require some water for dust suppression and roadbed compaction and would have the potential to result in soil erosion and stormwater runoff from cleared areas. For such activities, construction water would likely be trucked to the point of use from offsite locations, along with road construction materials. In all cases, it is expected that construction activities would be conducted in accordance with State-issued NPDES or equivalent permits for stormwater discharges associated with construction activity, which would require the implementation of appropriate BMPs to prevent or mitigate water-quality impacts. In contrast to land-based wind turbine sites and utility-scale solar PV farms, installation of small solar PV units on rooftops and

Environmental Consequences and Mitigating Actions
4-30
at already-developed sites within the electric service ROI (see Section 2.2.2) would have little or no impact on surface water resources. To support the operation of wind turbine and PV installations, no direct use of surface water would be expected. Water would likely be obtained from groundwater or purchased from a water utility. Regardless, only very small amounts of water would be needed to periodically clean turbine blades and motors, and water could be trucked to the point of use as part of routine servicing. Water also would be required to clean panels at solar PV farms or those situated in rooftop arrays. Adherence to appropriate waste management and minimization plans, spill prevention practices, and pollution prevention plans during servicing of wind turbine and solar PV installations and operation of vehicles connected with site operations would minimize the risks to soils and surface water resources from spills of petroleum, oil, and lubricant products and stormwater runoff. Given the information presented above, the impacts on surface water resources from construction and operations under the combination alternative would be SMALL. 4.5.6.2 Groundwater Resources
Construction dewatering would be minimal because of the small footprint of foundation structures, pad sites, and piling emplacements. Little or no impacts on groundwater use or water quality would be expected from routine operations. Consequently, the impacts on groundwater use and quality under this combination alternative would be SMALL.
4.5.7 Purchased Power Alternative
4.5.7.1 Surface Water Resources
The impacts of this alternative on surface water resources are likely to be bounded by the impact descriptions for the other alternatives, although new transmission lines may be required. Specifically, new and continued operation of nuclear, coal-fired, and natural gas-fired plants and renewable energy projects would not be expected to result in incremental impacts on surface water use and quality that are greater than those described in Sections 4.5.3, 4.5.4, 4.5.5, and 4.5.6, as long as all energy-generating facilities operate within the bounds of applicable water use and NPDES permits. Therefore, the impact of this alternative on surface water resources would be expected to range from SMALL to MODERATE. 4.5.7.2 Groundwater Resources
The impacts of the purchased power alternative on groundwater resources are likely to be bounded by the impact descriptions for the other alternatives. Purchased power is likely to come from existing facilities, or if new facilities are constructed, it would likely be from one of the previously discussed alternatives. These alternatives have SMALL impacts. Therefore, the impact of this alternative on groundwater resources would be SMALL.
4.6 Terrestrial Resources
This section describes the potential impacts of the proposed action (license renewal) and alternatives to the proposed action on terrestrial resources.
4.6.1 Proposed Action
Section 3.6 describes terrestrial resources on and in the vicinity of the LSCS site. Table 4–6 identifies the generic (Category 1) and site-specific (Category 2) issues that apply to terrestrial resources during the proposed license renewal period.
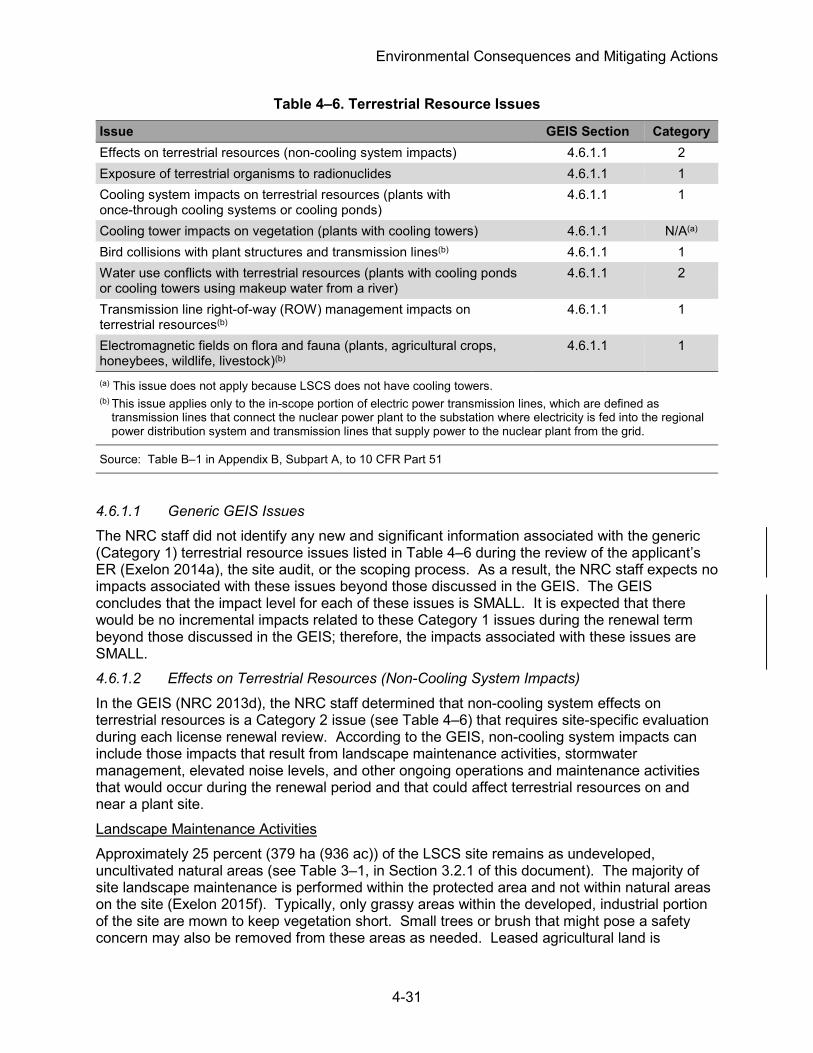
Environmental Consequences and Mitigating Actions
4-31
Table 4–6. Terrestrial Resource Issues
Issue GEIS Section Category Effects on terrestrial resources (non-cooling system impacts) 4.6.1.1 2 Exposure of terrestrial organisms to radionuclides 4.6.1.1 1 Cooling system impacts on terrestrial resources (plants with once-through cooling systems or cooling ponds)
4.6.1.1 1
Cooling tower impacts on vegetation (plants with cooling towers) 4.6.1.1 N/A(a)
Bird collisions with plant structures and transmission lines(b) 4.6.1.1 1 Water use conflicts with terrestrial resources (plants with cooling ponds or cooling towers using makeup water from a river)
4.6.1.1 2
Transmission line right-of-way (ROW) management impacts on terrestrial resources(b)
4.6.1.1 1
Electromagnetic fields on flora and fauna (plants, agricultural crops, honeybees, wildlife, livestock)(b)
4.6.1.1 1
(a) This issue does not apply because LSCS does not have cooling towers. (b) This issue applies only to the in-scope portion of electric power transmission lines, which are defined as
transmission lines that connect the nuclear power plant to the substation where electricity is fed into the regional power distribution system and transmission lines that supply power to the nuclear plant from the grid.
Source: Table B–1 in Appendix B, Subpart A, to 10 CFR Part 51
4.6.1.1 Generic GEIS Issues
The NRC staff did not identify any new and significant information associated with the generic (Category 1) terrestrial resource issues listed in Table 4–6 during the review of the applicant’s ER (Exelon 2014a), the site audit, or the scoping process. As a result, the NRC staff expects no impacts associated with these issues beyond those discussed in the GEIS. The GEIS concludes that the impact level for each of these issues is SMALL. It is expected that there would be no incremental impacts related to these Category 1 issues during the renewal term beyond those discussed in the GEIS; therefore, the impacts associated with these issues are SMALL. 4.6.1.2 Effects on Terrestrial Resources (Non-Cooling System Impacts)
In the GEIS (NRC 2013d), the NRC staff determined that non-cooling system effects on terrestrial resources is a Category 2 issue (see Table 4–6) that requires site-specific evaluation during each license renewal review. According to the GEIS, non-cooling system impacts can include those impacts that result from landscape maintenance activities, stormwater management, elevated noise levels, and other ongoing operations and maintenance activities that would occur during the renewal period and that could affect terrestrial resources on and near a plant site. Landscape Maintenance Activities Approximately 25 percent (379 ha (936 ac)) of the LSCS site remains as undeveloped, uncultivated natural areas (see Table 3–1, in Section 3.2.1 of this document). The majority of site landscape maintenance is performed within the protected area and not within natural areas on the site (Exelon 2015f). Typically, only grassy areas within the developed, industrial portion of the site are mown to keep vegetation short. Small trees or brush that might pose a safety concern may also be removed from these areas as needed. Leased agricultural land is

Environmental Consequences and Mitigating Actions
4-32
maintained by the leasee and in accordance with the standing lease. Exelon (2014a) has no plans to disturb undeveloped areas of the site as part of the proposed license renewal. Several ongoing restoration projects would result in positive impacts to terrestrial resources during the license renewal term. These projects are discussed in Section 3.6 and include ongoing management of a small area of native prairie, native vegetation plantings, removal of the invasive common reed (Phragmites australis) around the cooling pond, and various bird habitat enhancements. Stormwater Management Natural drainage of the LSCS site is generally toward the cooling pond. Two stormwater ponds on the west side of the LSCS site receive stormwater runoff from the site’s protected area, which is divided into two zones (I and II) for purposes of stormwater management. A system of surface ditches and underground piping drain the two zones. Zone I discharges to the north stormwater pond, and Zone II discharges to the south stormwater water pond. Each stormwater pond discharges to the cooling pond discharge canal via NPDES-permitted Outfalls G01 (north stormwater pond) and H01 (south stormwater pond). Some storm drains on the site are routed through oil separators before entering the stormwater ponds. Areas to the northwest and south of the protected area are drained away by existing creeks and gullies (Exelon 2014a). Exelon maintains a stormwater pollution prevention (SWPP) plan in accordance with Special Condition 8 of the site’s NPDES permit (Permit No. IL0048151; IEPA 2013). The SWPP plan identifies potential sources of pollutants that could affect stormwater discharges at Outfalls G01, H01, and 002 and practices that Exelon uses to reduce pollutants in stormwater discharges and ensure compliance with applicable conditions of the NPDES permit (Exelon 2014c). The NPDES permit also requires that the SWPP plan identify areas with a high potential for significant soil erosion due to topography, activities, or other factors, and that the SWPP plan contain measures to limit erosion in these areas (IEPA 2013). Exelon further monitors areas with potential for spills of oil or other regulated substances under the LSCS Spill Prevention Control and Countermeasure Plan (Exelon 2014c). Collectively, these measures ensure that the effects to terrestrial resources from pollutants carried by stormwater would be small during the proposed license renewal term. Noise The GEIS (NRC 2013d) indicates that elevated noise levels could be a non-cooling system impact to terrestrial resources. However, the GEIS also concludes that generic noise impacts would be small because noise levels would remain well below regulatory guidelines for offsite receptors during continued operations and refurbishment associated with license renewal. The NRC staff did not identify any information during its review that would indicate that noise impacts to terrestrial resources at LSCS would be unique or require separate analysis. Other Operations and Maintenance Activities Exelon (2014a) anticipates no refurbishment or other operations or maintenance activities during the license renewal term that would disturb terrestrial habitats or result in changes to existing land uses. Exelon (2015e) states that it would continue to comply with all applicable environmental laws and regulations and would adhere to its company policy of regularly evaluating and implementing options that move beyond compliance. Such options may include maintaining Exelon’s Wildlife Management Plan and Wildlife Habitat Council certification for LSCS throughout the proposed license renewal term.
Environmental Consequences and Mitigating Actions
4-33
When new activities that could impact the environment occur at LSCS, Exelon states that it follows several procedures to ensure that potential environmental effects are considered and appropriately addressed. Exelon (2015g) maintains an Environmental Review procedure (EN-AA-103) that provides a process for screening proposed activities to determine if an activity requires further evaluation for environmental impacts and risks. Such activities include engineering configuration changes, maintenance activities, and operational changes. If further environmental evaluation is warranted, Exelon’s (2015g) Environmental Evaluations procedure (EN-AA-103-0001) provides guidance on identifying the environmental and regulatory impacts of an activity. If Exelon personnel determine that implementation of a proposed activity would result in an unacceptable environmental condition or risk, the proposed activity is not implemented until the environmental impact is appropriately addressed. These procedures would continue to be implemented during the proposed license renewal term and would ensure that environmental impacts to terrestrial resources would be addressed or mitigated prior to site operational or maintenance activities. Conclusion Based on the NRC staff’s independent review, the staff concludes that the landscape maintenance, stormwater management, elevated noise levels, and other ongoing operations and maintenance activities that Exelon might undertake during the renewal term would primarily be confined to disturbed areas of the LSCS site. These activities would not have noticeable effects on terrestrial resources, nor would they destabilize any important attribute of the terrestrial resources on or in the vicinity of the LSCS site. Therefore, the staff expects non-cooling system impacts on terrestrial resources during the license renewal term to be SMALL. 4.6.1.3 Water Use Conflicts with Terrestrial Resources
In the GEIS (NRC 2013d), the NRC staff determined that effects of water use conflicts on terrestrial resources is a Category 2 issue (see Table 4–6) that requires site-specific evaluation during each license renewal review. Water use conflicts occur when the amount of water needed to support terrestrial riparian communities is diminished as a result of demand for agricultural, municipal, or industrial use; decreased water availability due to droughts; or a combination of these factors. As indicated in Section 4.5.1.1, the amount of Illinois River water LSCS consumes is minor in comparison to the flow of water past the plant. In Section 4.5.1.1, the NRC staff found that water use conflicts with surface water resources would be SMALL during the proposed license renewal term because the surface flows in the Illinois River are able to meet the consumptive demand and because regulatory mechanisms are in place that limit LSCS’s consumptive use. These regulatory mechanisms ensure that LSCS does not consume an amount that would be harmful to riparian communities during low river flow conditions. The terrestrial resources near the plant (described in Section 3.6) do not appear to be affected by the consumption of water from the river. The NRC staff concludes that water use conflicts would not occur from the proposed license renewal or would be so minor that the effects on terrestrial resources would be undetectable. Thus, the NRC staff concludes that the impacts of water use conflicts on terrestrial resources during the proposed license renewal term would be SMALL.
4.6.2 No-Action Alternative
If LSCS were to shut down, the impacts to terrestrial ecology would remain similar to those during operations until the plant is fully decommissioned. Temporary buildings and staging or laydown areas may be required during large component and structure dismantling. LSCS is likely to have sufficient space within previously disturbed areas for these needs, and therefore,

Environmental Consequences and Mitigating Actions
4-34
no additional land disturbances would occur on previously undisturbed land. Adjacent lands may experience temporary increases in erosional runoff, dust, or noise, but these impacts could be minimized with the implementation of standard BMPs (NRC 2002). The NRC staff concludes that the no-action alternative is unlikely to noticeably alter or have more than minor effects on terrestrial resources. Thus, the NRC staff concludes that the impacts of the no-action alternative on terrestrial resources during the proposed license renewal term would be SMALL.
4.6.3 New Nuclear Alternative
The new nuclear alternative assumes that Exelon would build a new nuclear facility in Indiana, Iowa, Michigan, Missouri, Kentucky, or Wisconsin at an existing power plant site. Construction of the facility would require an estimated 324 ac (131 ha) for permanent buildings and facilities and an additional 232 ac (94 ha) for temporary facilities, laydown areas, and other temporary land disturbances. Additional offsite land would be required for uranium mining, although this impact would result in no net change in land use impacts from those that would be associated with the proposed license renewal of LSCS. During construction, terrestrial species could experience habitat loss or fragmentation, loss of food resources, and altered behavior due to noise and other construction-related disturbances. Erosion and sedimentation from clearing, leveling, and excavating land could affect adjacent riparian and wetland habitats, if present. Implementation of appropriate BMPs would minimize these effects. This alternative could also require construction of new transmission lines or upgrades to existing lines. Because the new nuclear facility would be located on an existing energy-producing site, transmission lines could likely be collocated within existing transmission line corridors to minimize land disturbance. Although construction activities could noticeably alter terrestrial resources through habitat loss or fragmentation, construction is unlikely to destabilize any important attributes of the terrestrial environment. The exact magnitude of impacts would vary based on the chosen location of the facility and the amount and types of undisturbed habitat that would be affected by construction of the alternative, and thus, impacts of construction could range from SMALL to MODERATE. During operation, impacts would be similar in type and magnitude to those assessed in Section 4.6.1 for continued operation of LSCS under the proposed renewal term and would, therefore, be SMALL. The NRC staff concludes that the impacts of the new nuclear alternative on terrestrial resources would be SMALL to MODERATE during construction and SMALL during operation. The range in construction impacts is primarily the result of the uncertainty in the amount and types of undisturbed habitat that construction would affect.
4.6.4 IGCC Alternative
The IGCC alternative assumes that the new facility would be built at an existing power plant site in Illinois, including the LSCS site, or at another power plant site in Indiana, Iowa, Michigan, Missouri, Kentucky, or Wisconsin. The facility would require 2,000 ac (800 ha) of land to construct the facility. If the facility were to be sited on the LSCS site, the area currently occupied by the LSCS facilities, the undeveloped areas immediately surrounding the facility, and the area occupied by the Illinois fish hatchery would be affected. Exelon would also need to acquire adjacent parcels of land to provide the full complement of acreage required for the IGCC facility. Additional offsite land would be required for coal mining, although this impact would be partially offset by the elimination of land used for uranium mining to supply fuel to LSCS.
Environmental Consequences and Mitigating Actions
4-35
During construction, impacts to terrestrial habitats and species are likely to be similar to the types of impacts described for the new nuclear alternative in Section 4.6.3 but would likely be larger in magnitude due to the larger footprint of the IGCC facility. If the facility were to be sited on the LSCS site, the purchase of additional parcels of land could affect sensitive habitats, including wetlands and riparian areas. Accordingly, construction would likely noticeably alter terrestrial resources and could destabilize important attributes of the terrestrial environment. The exact magnitude of impacts would vary, based on the chosen location of the facility and the amount and types of undisturbed habitat that would be disturbed for construction of the alternative. Thus, impacts of construction could range from MODERATE, if some disturbances to terrestrial habitats occur, to LARGE, if significant disturbances to terrestrial habitats occur, especially if disturbed habitats are wetlands or other sensitive habitat types. The GEIS (NRC 2013d) concludes that impacts on terrestrial resources from the operation of fossil energy alternatives would essentially be similar to those from continued operations of a nuclear facility. Unique impacts would include periodic maintenance dredging if coal is delivered by barge, which could create noise, dust, and sedimentation. Dredging and delivery of coal to the site could introduce minerals and trace elements to water resources on which terrestrial biota rely. Elements from these minerals could also bioaccumulate in nearby riparian or wetland habitats. Air emissions during operation would include sulfur oxides and nitrogen oxides, which can combine with water vapor and create sulfuric and nitric acids. These acids would then be released back into the environment through precipitation, which could affect the acidity levels of water resources and have detrimental effects to plant foliage. Acid precipitation has the potential to destabilize the terrestrial environment by creating conditions that are too acidic for certain plants or animals and by mobilizing certain metals. The IGCC facility would also emit various GHGs during operation, which is an effect that can have far-reaching consequences because GHGs contribute to climate change. The effects of climate change on terrestrial resources are discussed in Section 4.15.3.2. The various air emissions during operation of the IGCC facility could create noticeable impacts on the terrestrial environment, and therefore, the operational impacts would be MODERATE. The NRC staff concludes that the impacts of the IGCC alternative on terrestrial resources would be MODERATE to LARGE during construction and MODERATE during operation. The range in construction impacts is primarily the result of the uncertainty in the amount and types of undisturbed habitat that construction would affect.
4.6.5 NGCC Alternative
The NGCC alternative assumes that a new NGCC facility would be built at the LSCS site. The facility would require 94 ac (38 ha) of land and would be sited on the undeveloped land immediately surrounding the LSCS. Some infrastructure upgrades could be required, as well as a new or upgraded pipeline, which would affect additional land. Additional offsite land would be required for gas extraction and collection, although this impact would be partially offset by the elimination of land used for uranium mining to supply fuel to LSCS. During construction, impacts to terrestrial habitats and species are likely to be similar to the types of impacts described for the new nuclear alternative in Section 4.6.3 but would likely be smaller in magnitude, due to the smaller footprint of the NGCC facility. Because the NGCC facility would be built outside of the existing industrial footprint of LSCS, construction would require the conversion of natural areas to industrial use, which would result in the direct destruction of some existing terrestrial habitats. Although construction would noticeably alter terrestrial resources, it would be unlikely to destabilize important attributes of the terrestrial environment due to the small footprint size and the pre-disturbed nature of much of the existing land on the LSCS site. Thus, impacts of construction would likely be MODERATE.

Environmental Consequences and Mitigating Actions
4-36
The GEIS (NRC 2013d) concludes that impacts to terrestrial resources from the operation of fossil energy alternatives would essentially be similar to those from continued operations of a nuclear facility. Unique impacts would include air emissions of GHGs such as nitrogen oxides, carbon dioxide, and methane, all of which can have far-reaching consequences because they contribute to climate change. The effects of climate change on terrestrial resources are discussed in Section 4.15.3.2. Although the impacts of operating the NGCC alternative may be noticeable, they are unlikely to destabilize any important attribute of the terrestrial environment and would, therefore, be SMALL. The NRC staff concludes that the impacts of the NGCC alternative on terrestrial resources would be MODERATE during construction and SMALL during operation.
4.6.6 Combination Alternative (NGCC, Wind, Solar)
The NGCC component of the combination alternative would have the same land requirements as discussed for the NGCC alternative in Section 4.6.5. Accordingly, the impacts to terrestrial resources would be similar to those concluded for the NGCC alternative and, therefore, would be MODERATE during construction and SMALL during operation. The wind component of this alternative would require an estimated 3,376 to 10,127 ac (1,366 to 4,098 ha) of land at onshore wind farm sites and agricultural cropland across the ROI. Permanently disturbed land would hold the wind turbines, access roads, and transmission lines. Land used for equipment laydown and turbine component assembly and erection could be returned to its original state. Use of BMPs would ensure that disturbed lands were appropriately restored to reduce long-term impacts to the terrestrial environment. Operation of wind turbines could uniquely affect terrestrial species through mechanical noise, collision with turbines and meteorological towers, and interference with migratory behavior. Bat and bird mortality from turbine collisions is an ongoing concern for operating wind farms; however, recent developments in turbine design have reduced the potential for bird and bat strikes. The NRC staff expects that this component has the potential to noticeably alter terrestrial resources, primarily through the loss of habitat and bird and bat mortalities associated with wind turbine operation. However, it is unlikely that the wind component would destabilize any important attribute of the terrestrial environment, and thus, impacts would be MODERATE. The solar component of this alternative would require an estimated 7,397 ac (2,993 ha) of land across the ROI. The majority of solar installations could be installed on building roofs at existing residential, commercial, or industrial sites or at larger standalone solar facilities, and thus, it is possible that little terrestrial habitat would be disturbed during construction. However, the exact magnitude of impacts on terrestrial resources would depend on the amount of terrestrial habitat that is lost or fragmented during construction of solar installations. Operation would have no measurable effects on the terrestrial environment. Overall impacts from construction and operation of this component of the alternative would range from SMALL to MODERATE, depending on the locations of solar installations and the amount of terrestrial habitat affected. Overall, the NRC staff concludes that the impacts of the combination alternative on terrestrial resources would be SMALL to MODERATE. This range is primarily the result of the variability in land required for the wind and solar components and the types of terrestrial habitats that would be disturbed by construction of these components.
4.6.7 Purchased Power Alternative
The purchased power alternative would have wide-ranging impacts that are hard to specifically assess because this alternative could include a mixture of coal, natural gas, nuclear, and wind
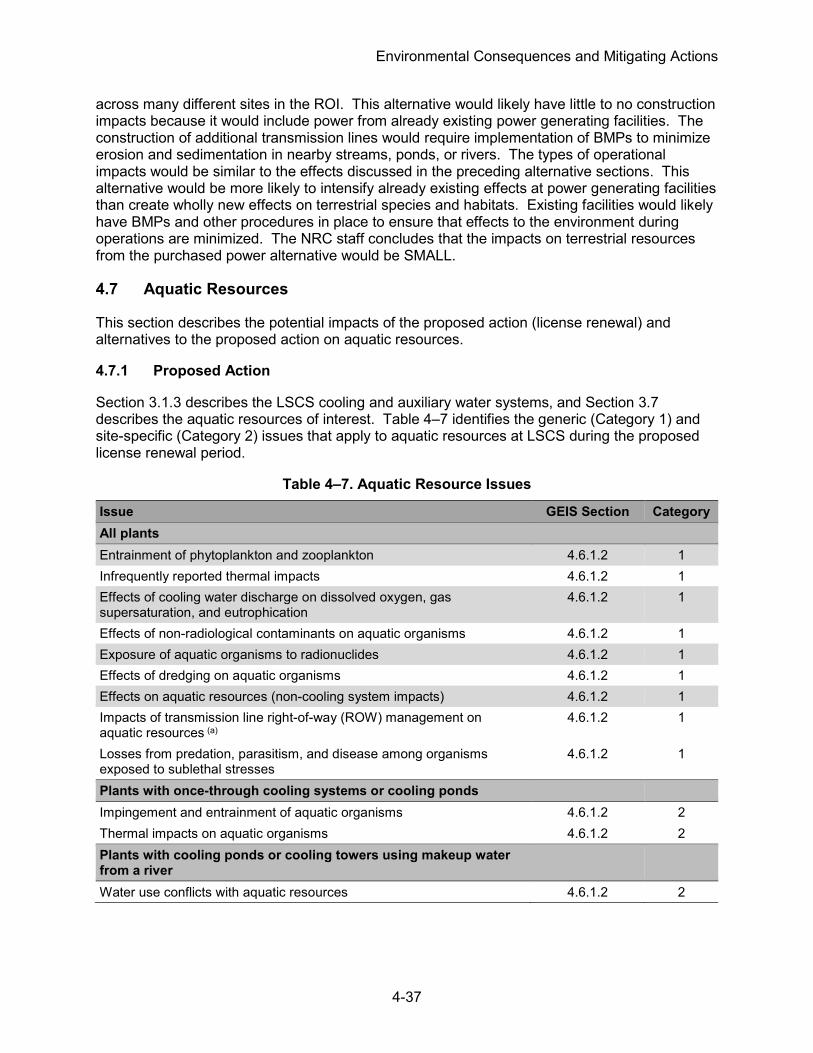
Environmental Consequences and Mitigating Actions
4-37
across many different sites in the ROI. This alternative would likely have little to no construction impacts because it would include power from already existing power generating facilities. The construction of additional transmission lines would require implementation of BMPs to minimize erosion and sedimentation in nearby streams, ponds, or rivers. The types of operational impacts would be similar to the effects discussed in the preceding alternative sections. This alternative would be more likely to intensify already existing effects at power generating facilities than create wholly new effects on terrestrial species and habitats. Existing facilities would likely have BMPs and other procedures in place to ensure that effects to the environment during operations are minimized. The NRC staff concludes that the impacts on terrestrial resources from the purchased power alternative would be SMALL.
4.7 Aquatic Resources
This section describes the potential impacts of the proposed action (license renewal) and alternatives to the proposed action on aquatic resources.
4.7.1 Proposed Action
Section 3.1.3 describes the LSCS cooling and auxiliary water systems, and Section 3.7 describes the aquatic resources of interest. Table 4–7 identifies the generic (Category 1) and site-specific (Category 2) issues that apply to aquatic resources at LSCS during the proposed license renewal period.
Table 4–7. Aquatic Resource Issues
Issue GEIS Section Category All plants Entrainment of phytoplankton and zooplankton 4.6.1.2 1 Infrequently reported thermal impacts 4.6.1.2 1 Effects of cooling water discharge on dissolved oxygen, gas supersaturation, and eutrophication
4.6.1.2 1
Effects of non-radiological contaminants on aquatic organisms 4.6.1.2 1 Exposure of aquatic organisms to radionuclides 4.6.1.2 1 Effects of dredging on aquatic organisms 4.6.1.2 1 Effects on aquatic resources (non-cooling system impacts) 4.6.1.2 1 Impacts of transmission line right-of-way (ROW) management on aquatic resources (a)
4.6.1.2 1
Losses from predation, parasitism, and disease among organisms exposed to sublethal stresses
4.6.1.2 1
Plants with once-through cooling systems or cooling ponds Impingement and entrainment of aquatic organisms 4.6.1.2 2 Thermal impacts on aquatic organisms 4.6.1.2 2 Plants with cooling ponds or cooling towers using makeup water from a river
Water use conflicts with aquatic resources 4.6.1.2 2
Environmental Consequences and Mitigating Actions
4-38
Issue GEIS Section Category (a) This issue applies only to the in-scope portion of electric power transmission lines, which are defined as
transmission lines that connect the nuclear power plant to the substation where electricity is fed into the regional power distribution system and transmission lines that supply power to the nuclear plant from the grid.
Source: Table B–1 in Appendix B, Subpart A, to 10 CFR Part 51
4.7.1.1 GEIS Category 1 Issues
The NRC staff did not identify any new and significant information associated with the Category 1 aquatic resource issues identified in Table 4–7 during the review of the applicant’s ER, aquatic surveys and studies performed at LSCS and in the Illinois River, and available scientific literature; the site audit; and the Federal and State agency and public comments received during the scoping process. As a result, no information or impacts related to these issues were identified that would change the conclusions presented in the GEIS (NRC 2013d). For these issues, the GEIS concludes that the impacts are SMALL. It is expected that there would be no incremental impacts related to these Category 1 issues during the renewal term beyond those discussed in the GEIS; therefore, the impacts associated with these issues are SMALL. 4.7.1.2 Impingement and Entrainment of Aquatic Organisms
In the GEIS (NRC 2013d), the NRC determined that impingement and entrainment of aquatic organisms is a Category 2 issue (see Table 4–7) that requires site-specific evaluation during each license renewal review for plants with once-through cooling systems or cooling ponds, such as LSCS. Impingement is the entrapment of all life stages of fish and shellfish on the outer part of an intake structure or against a screening device during periods of water withdrawal (40 CFR 125.83). Impingement can kill organisms immediately or contribute to a slower death resulting from exhaustion, suffocation, injury, and other physical stresses. The potential for injury or death is generally related to the amount of time an organism is impinged, its susceptibility to injury, and the physical characteristics of the screen washing system and fish return (if present) of the plant. Entrainment is the incorporation of all life stages of fish and shellfish with intake water flow entering and passing through a cooling-water intake structure and into a circulating water system (CWS) (40 CFR 125.83). Organisms susceptible to entrainment are generally of smaller size than those susceptible to impingement and include ichthyoplankton (fish eggs and larvae), larval stages of shellfish and other macroinvertebrates, zooplankton, and phytoplankton. Entrained organisms may experience physical trauma and stress, pressure changes, excess heat, and exposure to chemicals, all of which may result in injury or death (Mayhew et al. 2000). A particular species can be subject to both impingement and entrainment if some individual fish are impinged on screens while others pass through the screens and are entrained. For instance, adults could be impinged while juveniles could be entrained, if they are small enough to pass through the intake screen openings. At LSCS, aquatic organisms may be impinged or entrained at two locations. Organisms that inhabit the Illinois River may be impinged or entrained when makeup water is drawn from the river, through the river screen house, and into the cooling pond. Organisms that inhabit the cooling pond may be impinged or entrained when water is drawn from the pond, through the cooling pond screen house, and into the CWS. Organisms that are entrained by passing

Environmental Consequences and Mitigating Actions
4-39
through the cooling pond’s screen house and into the LSCS CWS are subject to mechanical, thermal, and toxic stresses that make survival unlikely. This section’s analysis uses a retrospective assessment of the present and past impacts to the aquatic ecosystem resulting from LSCS operation in order to provide a prospective assessment for the future impacts over the proposed license renewal term (i.e., through 2042 for Unit 1 and through 2043 for Unit 2). The timeframe and geographic extent are two components of the assessment that bound the analysis. The timeframe defines how far back and how far forward the analysis will extend. In assessing the level of impact, the staff looked at the projected effects in comparison to a baseline condition. In agreement with National Environmental Policy Act (NEPA) guidance (CEQ 1997), the baseline of the assessment is the condition of the resource without the action (i.e., under the no-action alternative). Under the no-action alternative, the plant would shut down, and the resource would conceptually return to its condition without the plant, which is not necessarily the same as the condition before the plant was constructed. The timeframe for analyzing ecological resources extends far enough into the past to understand trends and to determine whether the resource is stable, which the NRC definitions of impact levels require. For assessing direct and indirect impacts, the geographic boundaries depend on the biology of the species under consideration. The NRC staff used a modified weight-of-evidence (WOE) approach to evaluate the effects of impingement and entrainment on the aquatic resources in the Illinois River and LSCS cooling pond. The NRC chose this approach because EPA recommends a WOE approach for ecological risk assessment (EPA 1998). The WOE approach is a useful tool due to the complex nature of assessing risk (or impact), and the NRC has used this approach in other evaluations of the effects of nuclear power plant cooling systems on aquatic communities (e.g., NRC 2010, 2013c, 2015a, 2015b). Menzie et al. (1996) defines WOE as “…the process by which multiple measurement endpoints are related to an assessment endpoint to evaluate whether significant risk of harm is posed to the environment.” In the present WOE approach, the NRC staff examined five lines of evidence (LOE) to determine if operation of LSCS is contributing to adverse impacts on aquatic resources in the Illinois River or LSCS cooling pond. The lines of evidence are as follows:
LOE Description 1 Results of impingement studies performed at LSCS 2 Results of entrainment studies performed at LSCS 3 Temporal trends in fish populations in the Illinois River 4 Spatial differences in fish populations in the Illinois River 5 Consideration of engineered designs and operational controls that affect
impingement and entrainment rates
LOE 1: Impingement Studies Exelon contracted EA Engineering, Science, and Technology, Inc. (EA) to conduct a study to determine the impingement rates among the fish and shellfish in the Illinois River. From April 2014 through March 2015, EA (2015) collected 20 samples of all fish and shellfish impinged at the river screen house within set 24-hour collection periods. EA identified all impinged fish and shellfish to species, or the lowest taxonomic level possible. EA (2015) extrapolated annual impingement rates for each species by multiplying the number of fish collected during a 24-hour collection period by the volume of water that would be withdrawn during 1 year and dividing it by the volume of water withdrawn during the 24-hour collection period.

Environmental Consequences and Mitigating Actions
4-40
EA (2015) collected a total of 635 fish representing 41 species, 9 crayfish representing 2 taxa, and 9 mussels representing 3 species. The most commonly impinged fish include gizzard shad (Dorosoma cepedianum; 29 percent of all samples), round goby (Neogobius melanostomus; 11 percent), threadfin shad (Dorosoma petenense; 9 percent), bluegill (Lepomis macrochirus; 6 percent), freshwater drum (Aplodinotus grunniens; 6 percent), and bluntnose minnow (Pimephales notatus; 5 percent). Gizzard shad was the most commonly impinged species and the most commonly collected species during electrofishing surveys in 2013 (EA 2014 and 2015). In addition, EA (2014) collected gizzard shad more often downstream of the intake as compared to upstream, which would suggest that impingement is not noticeably altering populations of gizzard shad near LSCS. Bluegill, bluntnose minnow, and freshwater drum each comprised 5 to 6 percent of the impinged fish and each comprised 2 to 3 percent of the electrofishing or seining samples in 2013 (EA 2014, 2015). These results suggest that the impingement rate is similar to the occurrence rate in monitoring surveys in the river near LSCS. In addition, EA (2014) reported similar numbers of these three fish species directly upstream and downstream of the river intake, which would suggest that impingement is not noticeably altering populations of bluegill, bluntnose minnow, and freshwater drum near LSCS. The NRC staff notes that EA (2014) may not conclusively determine whether impingement affects populations of fish near LSCS due to the limited sample size and because some fish may migrate sufficient distances such that a noticeable difference would not likely be identified between samples collected immediately upstream and downstream of the intake. Both round goby and threadfin shad are invasive species. All other impinged species comprised less than 5 percent of the impinged fish (EA 2015). The nine impinged crayfish included eight Orconectes species, seven of which were northern Clearwater crayfish (Orconectes propinquus) and one Procamarus sp. (EA 2015). The nine impinged mussels included two fragile papershell (Leptodea fragilis), one pink heelsplitter (Potamilus alatus), and six paper pondshell (Utterbackia imbecillis). EA (2015) estimated the annual impingement to be 10,673 organisms per year. The estimated annual impingement rates at LSCS are approximately 1 to 6 percent of the impingement rate at Dresden Nuclear Station, which is located at the confluence of the Kankakee and Illinois Rivers (EA 2015; Exelon 2015b). Dresden Nuclear Station operates in either an indirect-open cycle or operates its cooling pond in a closed-cycle mode, similar to LSCS. NRC (2004) determined that the impacts from impingement would be SMALL on aquatic resources at Dresden Nuclear Station. LOE 1 Conclusion
Based on the available impingement studies, intake of makeup water from the Illinois River appears to have a minor effect on the aquatic community in the vicinity of LSCS, and the NRC staff finds that impingement is not likely to noticeably alter or destabilize any important attributes of the community. Although fish and aquatic biota are also impinged at the lake screen house when cooling pond water is drawn into LSCS’s cooling system, the impacts of impingement on the aquatic community within the cooling pond are unknown because they have not been addressed in studies. LOE 2: Entrainment Studies Exelon contracted EA to conduct a study to determine the entrainment rates among the fish and shellfish taxa in the Illinois River. As part of this study, EA (2015) collected icthyoplankton

Environmental Consequences and Mitigating Actions
4-41
samples in front of the LSCS river intake as part of an entrainment study. EA (2015) collected samples using 0.5-m (1.6-ft) conical plankton nets with 505 micron mesh suspended from the forebay bridge in front of the river intake (see Figure 3.7–1). EA (2015) collected samples during the 2014 spawning season, from late April 2014 through August 2014, when icthyoplankton densities would likely be highest. EA (2015) extrapolated annual entrainment rates for each taxa based on the number of taxa collected during a 24-hour collection period, the volume of water that would be withdrawn during 1 year, and the volume of water withdrawn during the 24-hour collection period. EA (2015) collected a total of 7,114 ichthyoplankton specimens representing 12 families and 27 distinct taxa. The most common taxa included carps, minnows, and suckers, which combined comprised 79 percent of the ichthyoplankton sample. EA (2015) classified icthyoplankton by species or taxa, if identification to the species level was not practicable, and by life stage, including egg, yolk-sac, post yolk-sac, larvae, and juveniles. The most common taxa by life stage included lctiobinae yolk-sac larvae (24 percent), cyprinidae yolk-sac larvae (23 percent), and common carp yolk-sac larvae (13 percent). All other taxa-life stage categories comprised less than 10 percent of the icthyoplankton samples (EA 2015). EA (2015) estimated the annual entrainment rate to be about 38 million organisms per year. The estimated annual entrainment rates at LSCS are approximately 28 to 38 percent of the entrainment rate at Dresden Nuclear Station, which is located at the confluence of the Kankakee and Illinois Rivers (EA 2015; Exelon 2015b). Dresden Nuclear Station operates in either an indirect-open cycle or operates its cooling pond in a closed-cycle mode, similar to LSCS. NRC (2004) determined that the impacts from entrainment would be SMALL on aquatic resources at Dresden Nuclear Station. LOE 2 Conclusion
Based on the available entrainment studies, intake of makeup water from the Illinois River appears to have a minor effect on the aquatic community in the vicinity of LSCS, and the NRC staff finds that entrainment is not likely to noticeably alter or destabilize any important attributes of the community. Although fish and aquatic biota are also entrained at the lake screen house when cooling pond water is drawn into LSCS’s cooling system, the impacts of entrainment on the aquatic community within the cooling pond are unknown because they have not been addressed in studies. LOE 3: Temporal Trends in Fish Populations in the Illinois River Impingement and entrainment from the withdrawal of makeup water from the Illinois River have removed individuals from the river ecosystem since LSCS began operating in 1982. Over this period of time, the aquatic community has changed in a number of ways, including species richness (the number of species present), species composition (the kinds of species present), and species evenness (the relative abundance of species). This LOE compares fish populations prior to and during operations to determine whether changes have occurred and if such changes can be attributed to LSCS operations. If impingement and entrainment were to affect fish within the vicinity of LSCS, fish abundances and species richness would likely be lower post-operation as compared to before operations. In the section below, the NRC staff made general characterizations of fish populations during preoperational and operational surveys. However, differences between time periods could occur for multiple reasons, including variations in sampling equipment, the frequency and timing of sampling events, and sampling locations. Furthermore, the lack of repeated samples over time prevented the NRC staff from conducting statistical analyses on the changes in fish

Environmental Consequences and Mitigating Actions
4-42
populations over time. Therefore, the trends presented below for LSCS studies describe general patterns in fish populations that have not been tested for statistical significance. As discussed in Section 3.7, fish populations near LSCS have changed over time. The main trends have been an increase in species richness and increases in the abundance of species that are sensitive to poor water quality. For example, two commonly collected species during preoperational surveys, common carp (Cyprinus carpio) and white sucker (Catostomus commersonii), were not commonly collected during the 1999 or 2013 study (NRC 1978; EA 2000, 2014). OEPA (1987) classifies both of these species as pollution tolerant. On the other hand, brook silverside (Labidesthes sicculus), sand shiner (Notropis stramineus), smallmouth bass (Micropterus dolomieu), smallmouth buffalo (Ictiobus bubalus), golden redhorse (Moxostoma erythrurum), and bluegill (Lepomis macrochirus) were among the six most commonly collected species in the 1999 or 2013 study but were not commonly collected in the preoperational studies (NRC 1978; EA 2000, 2014). Five of these seven species are native species that are sensitive to declines in water quality or habitat degradation (Smith 2002; Lerczak 1996). These results suggest that the quality of aquatic habitat within the Illinois River near LSCS has improved since the 1970s. Similar trends of improved water quality, increased species richness, and increases in the relative abundance of pollution-sensitive species have been documented in several studies on the Illinois River (Lerczak 1996; McClelland and Pegg 2005; McClelland et al. 2012; Fritts 2013). These results suggest that the major changes in fish populations near LSCS are the result of improved water quality, likely from the protections provided in the Clean Water Act (CWA), advances in municipal and industrial waste treatment, agricultural conservation measures, and other factors. Conclusion
Given that species richness and populations of pollution-sensitive fish have increased since LSCS began operations, and populations of pollution-tolerant fish have decreased, the NRC staff concludes that impingement and entrainment are not having a noticeable impact on temporal changes in fish population in the Illinois River near LSCS. Other factors, such as improved habitat diversity and quality, are having a more noticeable impact on the temporal patterns in fish populations (Lerczak 1996; McClelland and Pegg 2005; McClelland et al. 2012). LOE 4: Spatial Differences in Fish Populations in the Illinois River This LOE compares fish populations upstream and downstream of the river intake structure to determine whether spatial changes have occurred since LSCS began operating and if such changes can be attributed to LSCS operations. If impingement and entrainment were to affect fish populations within the vicinity of LSCS, fish abundances and species richness would likely be lower downstream of the river intake structure as compared to upstream of the river intake structure, due to the removal of fish, eggs, and larvae from impingement and entrainment. The NRC staff notes that this LOE may not conclusively determine whether LSCS operation affects populations of fish near LSCS due to the limited sample size and because some fish may migrate sufficient distances such that a noticeable difference would not likely be identified between samples collected immediately upstream and downstream of the intake. In the section below, the NRC staff made general characterizations of the fish populations upstream and downstream of the river intake. Neither EA (2014) nor the NRC staff conducted statistical analyses on the differences in fish populations among the sample sites. Therefore, the trends presented below for LSCS studies describe general patterns in fish populations that have not been tested for statistical significance. In 2013, EA (2014) conducted fish surveys and compared fish abundances and species richness between upstream and downstream of the river intake. During electrofishing surveys,
Environmental Consequences and Mitigating Actions
4-43
EA (2014) collected more fish downstream of the intake (43 fish) as compared to upstream (36 fish). However, species richness was moderately higher upstream of the intake (13 species) compared to downstream of the intake (9 species). For seining samples, EA (2014) collected more fish and species of fish upstream (location 1; 245 fish; 6 species) as compared to the closest downstream location (location 2; 65 fish; 3 fish species). EA (2014) attributed the higher fish abundances and species richness upstream of the river intake to better habitat quality, particularly regarding instream cover for sunfish. The NRC staff is not aware of any studies to determine whether the heated effluent has affected the density of aquatic plants that may provide cover for fish. Rocks and tree limbs could also provide cover for fish. EA (2014) collected the most amount of fish and species of fish at the furthest downstream sampling site near South Kickapoo Creek (location 5; 906 fish; 12 species). During seining surveys, EA (2014) collected four species exclusively at the furthest downstream sampling site (location 5). EA (2014) attributed the high fish abundance and diversity at the furthest downstream location to its proximity to South Kickapoo Creek, as well as the habitat diversity at the site and the suitability of that location to seining. Conclusion
Given that no clear pattern exists regarding the species richness and species abundances upstream and downstream of the river intake structure, the NRC staff concludes that impingement and entrainment are not having a noticeable impact on spatial patterns in fish population in the Illinois River near LSCS. Other factors, such as habitat diversity and quality, are likely having a more noticeable impact on temporal fish population trends near LSCS (Lerczak 1996; McClelland and Pegg 2005; McClelland et al. 2012). LOE 5: Engineered Design and Operational Controls In August 2014, EPA published a final rule establishing requirements under section 316(b) of the CWA for cooling-water intake structures at existing facilities (79 FR 48300). The final rule indicates that two basic approaches can reduce impingement and entrainment mortality: (1) flow reduction and (2) including technologies into the cooling-water intake design that gently exclude organisms or collect and return organisms without harm to the water body. The EPA also notes that two additional approaches can reduce impingement and entrainment but that these technologies may not be available to all facilities. The two additional approaches are: relocating the facility’s intake to a less biologically rich area in a water body and reducing the intake velocity. The LSCS CWS on the Illinois River incorporates several of these approaches. Flow Reduction
Reducing the amount of water that is withdrawn for cooling purposes from a water body reduces the number of aquatic organisms that are drawn through the intake structure and subject to impingement or entrainment. Because LSCS uses a cooling-pond-based heat-dissipation system, the majority of cooling water needed for plant operation is drawn from the cooling pond rather than the Illinois River. The cooling pond system is a closed-cycle cooling system as water in the pond continues to be recirculated through the plant for cooling, and only makeup water (water lost to evaporation or discharged as blowdown) is drawn directly from the Illinois River. Depending on the quality of the makeup water, closed-cycle cooling systems can consume significantly less water than if the same facility were to use a once-through cooling system. Exelon (2014a) determined that the maximum withdrawal rate, with all three makeup pumps operating at capacity, would withdraw approximately 1.8 percent of the river’s 92-year annual average mean flow. Similarly, NRC (1978) estimated that the annual average amount of water withdrawn from the Illinois River for cooling pond makeup would be about 1 percent of the typical flow, or 3 percent of the 7Q10 (e.g., the 7-day, 10-year low flow) flow.
Environmental Consequences and Mitigating Actions
4-44
Technologies That Exclude or Collect and Return Organisms
The LSCS cooling system has several technologies that help exclude organisms from becoming impinged or entrained. Water enters the river screen house through an intake bay equipped with bar grills and 3/8-in. (9.5-mm) mesh travelling screens to prevent debris and aquatic biota from entering the system (Exelon 2014a). The EPA indicates that, ideally, traveling screens would be used with a fish handling and return system (79 FR 48300). LSCS’s river screen house does not contain a fish return system (Exelon 2014a). However, the intake velocity (discussed below) should allow some fish to swim away and escape impingement. Intake Flow
Water velocity associated with the intake structure greatly influences the rate of impingement and entrainment. The higher the approach velocity, through-screen velocity, or both, the greater the number of organisms that will be impinged or entrained. At an approach velocity of 0.5 ft/s (0.15 m/s) or less, most fish can swim away and escape from the intake current (79 FR 48300). As indicated in Section 3.1.3, water velocity within the intake channel ranges from 0.3 to 0.5 ft/s (0.1 to 0.2 m/s) with one pump operating to 0.6 to 1.0 ft/s (0.2 to 0.3 m/s) with two pumps operating (EA 2015). The velocity at the face of the travelling screens is 0.5 ft/s (0.2 m/s) during one-pump full-flow operation and 0.9 ft/s (0.3 m/s) during two-pump full-flow operation (EA 2015). Thus, when one pump is operating, the river screen house intake velocities are within the 0.5-fps (0.15-m/s) intake velocity recommended by EPA for protection of aquatic organisms. However, the through-screen velocity when two or three pumps are operating could contribute to impingement and entrainment effects. Best Technology Available
On July 5, 2013, the Illinois EPA (IEPA) renewed LSCS’s NPDES permit (No. IL0048151). Special Condition 15 relates to potential impacts from cooling water intake and whether LSCS utilizes the Best Technology Available (BTA) for cooling-water intake structures to prevent or minimize impingement mortality in accordance with the Best Professional Judgment (BPJ) provisions of 40 CFR 125.3. In the permit, IEPA determined that:
The facility utilizes a closed-cycle recirculating cooling system, a 2058 acre cooling pond, for cooling of plant condensers and is determined to be the equivalent of BTA for cooling water intake structures to prevent/minimize impingement mortality in accordance with the BPJ provisions of 40 CFR 125.3 because it allows the facility to only withdraw the amount of water necessary to maintain the cooling pond level rather than the entire volume used for cooling of the plant condensers.
Conclusion
While flow control measures, traveling screens, and low intake velocities reduce the effects of impingement and entrainment mortality at LSCS, the lack of a fish return system and the through-screen velocity when two or three pumps are operating could contribute to impingement and entrainment effects. This LOE does not conclusively indicate whether impingement or entrainment at LSCS is creating detectable effects on the Illinois River aquatic community. Thus, this LOE, considered alone, is inconclusive. Overall Impingement and Entrainment Conclusion The NRC staff reviewed available impingement and entrainment studies, assessed spatial and temporal changes in fish populations near LSCS in the Illinois River, and considered engineered designs and operational controls that affect impingement and entrainment rates. The NRC staff concludes that the impacts to aquatic resources in the Illinois River from impingement and
Environmental Consequences and Mitigating Actions
4-45
entrainment would be SMALL and would not likely noticeably alter aquatic resources in the vicinity of LSCS based on the following:
• relatively low impingement and entrainment rates,
• increases in species richness and relative abundance of pollution-sensitive species since LSCS began operations,
• reduced flow due to operation as a closed-cycle system with the use of the LSCS cooling pond,
• bar grills and traveling screens with 3/8 in. (0.95-cm) openings to exclude fish, and
• IEPA’s determination of BTA for use of a closed-cycle recirculating cooling system. Although fish and aquatic biota are also impinged and entrained at the cooling pond screen house when cooling pond water is drawn into LSCS’s cooling system, the impacts of impingement on the aquatic community within the cooling pond are unknown because Exelon has not conducted any impingement or entrainment studies at the cooling pond intake, nor have any consistent fish monitoring studies been implemented in the cooling pond. The NRC staff notes that the use of bar grills and traveling screens with 3/8-in. (0.95-cm) openings would reduce the impacts from impingement and entrainment in the cooling pond. 4.7.1.3 Thermal Impacts on Aquatic Organisms
In the GEIS (NRC 2013d), the NRC determined that thermal impacts on aquatic organisms is a Category 2 issue (see Table 4–7) that requires site-specific evaluation during each license renewal review for plants with once-through cooling systems or cooling ponds, such as LSCS. The NRC’s regulations at 10 CFR Part 51 concerning license renewal reviews and the GEIS direct the NRC to consider all aquatic resources that may be affected by plant operations, regardless of the type of water body in which such resources reside. For instance, Section 4.2.2 of the 1996 GEIS specifically notes that aquatic biota of cooling ponds may be affected by thermal discharges and that these effects should be considered the same as those considered for once-through cooling systems, except that such effects mainly influence aquatic communities that did not exist before the creation of the cooling pond. The 2013 GEIS did not identify new information that would alter this methodology or alter any conclusions regarding impacts to aquatic populations in cooling ponds. Consideration of the impact on aquatic resources in cooling ponds is consistent with previous NRC license renewal reviews (e.g., NRC 2008b, 2013c, 2015a). The NRC staff used a modified WOE approach to evaluate thermal impacts on the aquatic resources in the Illinois River and LSCS cooling pond. The NRC staff examined the five LOEs as follows.
LOE Description 1 Results of past NRC reviews on thermal impacts of LSCS operations 2 A review of regulatory and administrative controls on thermal effluents 3 Population trends of indicator species 4 Health of fish populations as an indicator of water quality 5 Fish kills
LOE 1: Past NRC Reviews The NRC (1978) previously assessed the potential thermal impacts of LSCS operations in the Final Environmental Impact Statement for LSCS Operations. The NRC (1978) estimated the

Environmental Consequences and Mitigating Actions
4-46
size of the thermal plume under two scenarios, one in March and one in July, using relatively conservative assumptions (e.g., the 7Q10 low-flow estimate, maximum blowdown rate, 100 percent load factor). For the March scenario, the NRC (1978) determined that the 5 °F (3 °C) isotherm would range from 2,500 m2 (27,000 ft2) in March to 400 m2 (4,300 ft2) in July. The thermal plume would cover approximately 9 percent of the river in March and 8 percent in July (NRC 1978). The zone of passage for fish would be 91 to 92 percent, which would be greater than the minimum 75 percent required by Illinois water quality standards. Thus, the NRC (1978) concluded that juvenile and adult fish would either be able to avoid the thermal plume, or a small number of organisms may be exposed to the thermal plume for a short period of time. The NRC staff concluded that the discharge impacts would likely be minimal and of little influence on the natural biotic populations in the Illinois River. LOE 1 Conclusion
The NRC’s past review of the thermal impacts from LSCS discharges to the Illinois River indicated that the thermal impacts on the aquatic community would be minor. LOE 2: Regulatory and Administrative Controls The Illinois Administrative Code (IAC) and the LSCS NPDES permit (IEPA 2013) impose regulatory controls on LSCS’s thermal effluent that ensure that impacts on the aquatic environment are reduced or mitigated. Title 35, Environmental Protection, Section 302, “Water Quality Standards,” of the IAC contains stipulations pertaining to effluent temperature as well as mixing zones and zones of initial dilution. The following limitations and requirements included in Section 302 pertain to effluent temperature and serve to protect aquatic biota from the effects of such effluents.
The maximum temperature rise shall not exceed 2.8 °C (5 °F) above natural receiving water body temperatures. [35 IAC 302.211(d)]
Water temperature at representative locations in the main river shall at no time exceed 33.7 °C (93 °F) from April through November and 17.7 °C (63 °F) in other months. [35 IAC 302.211(e)]
Several IAC stipulations pertaining to mixing zones also protect aquatic biota from thermal effluents.
Mixing is not allowed in waters which include a tributary stream entrance. [35 IAC 302.102(b)(2)]
Mixing is not allowed in waters containing mussel beds, endangered species habitat, fish spawning areas, areas of important aquatic life habitat, or any other natural features vital to the well-being of aquatic life. [35 IAC 302.102(b)(4)]
Mixing must allow for a zone of passage for aquatic life. [35 IAC 302.102(b)(6)]
The area and volume of mixing must not contain more than 25 percent of the cross-sectional area or volume of a stream and must not intersect any body of water in such a manner that the maintenance of aquatic life in the body of water as a whole would be adversely affected. [35 IAC 302.102(b)(7) and (8)]
The area and volume in which mixing occurs must be as small as is practicable, and in no circumstances larger than 26 ac (11 ha). [35 IAC 302.102(b)(12)]
The LSCS NPDES permit (IEPA 2013) also contains requirements related to thermal effluents. Special Condition 3 of the permit, which limits the maximum temperature rise above ambient conditions and maximum water temperatures during various times of the year, mirrors the temperature requirements at 35 IAC 302.211 listed above.
Environmental Consequences and Mitigating Actions
4-47
The NRC staff reviewed the results of recorded maximum cooling pond blowdown temperatures to the Illinois River and associated calculations of river mixing zone temperatures as reported in the discharge monitoring reports (DMR) for the past 5 years (2010 through 2014) and as compiled by Exelon (Exelon 2015b). Based on the NRC’s staff review and Exelon’s responses to the NRC’s RAIs, LSCS has received no notices of violation associated with NPDES permitted discharges during the 2010 through 2014 time period (see Section 3.5.1). Nonetheless, Exelon requested three variances with respect to LSCS’s effluent discharges to the Illinois River and associated river mixing zone temperature limits. Specifically, these variances (IEPA-12-15, IEPA-12-24, and IEPA-12-24 extension) were sought and granted in March, July, and August 2012, respectively, due to unusual weather conditions and associated high ambient river water temperatures that impacted the ability for LSCS thermal discharges to meet the requirements of Special Condition 3 of LSCS’s NPDES permit. This limits the number of temperature excursion hours to 1 percent (87.6 hours) of the hours in a 12-month period, ending with any month (see footnote d in Table 3–7 of this document). During the variance period(s), Exelon was required, in part, to continuously monitor both the discharge and receiving water temperatures and visually inspect all discharge areas at least three times each day to assess the impact on aquatic life. These thermal discharge excursions were not found to have any impact on aquatic life (Exelon 2015b). Under certain conditions, Exelon may take action to curtail surface water withdrawals from, and cooling pond blowdown to, the Illinois River in accordance with the LSCS Extreme Heat Implementation Plan. As necessary, plant personnel would take actions prescribed by the plan and associated procedures to mitigate the impacts of summer drought and/or high river temperature and river low-flow conditions. Depending on predefined conditions set forth in the plan and implementing procedures, such actions may include a combination of monitoring and modeling of river intake and mixing zone temperatures; manipulation of the water level of the cooling pond, including adjusting blowdown flow from and makeup water withdrawals to the cooling pond; and taking other actions to meet NPDES mixing zone thermal limits and the technical specification limits on the condenser inlet temperature from the cooling pond (Exelon 2014a; 2015a). LOE 2 Conclusion
The LSCS thermal effluent is limited by the IAC and the LSCS NPDES permit to ensure that it does not create adverse effects on the aquatic communities in the Illinois River. In the past 5 years, Exelon received no notices of violations and IEPA granted three provisional variances to allow higher-than-permitted temperatures. Exelon reported no fish kills or other events to the IEPA or the NRC that would indicate adverse environmental effects resulting from the provisional variances. The NRC depends on the State to enforce the regulatory controls in place at LSCS and effectively ensure that any environmental effects to Illinois River aquatic communities are not detectable or are so minor as to neither destabilize nor noticeably alter the community. LOE 3: Spatial and Temporal Trends for Indicator Species Heat shock has the potential to kill or injure individual fish and other organisms in the Illinois River ecosystem. This LOE compares the population trends of indicator species prior to and during operations and upstream and downstream of the discharge structure to determine whether changes have occurred and if such changes can be attributed to LSCS operations. If heat shock were to affect aquatic resources within the vicinity of LSCS, the NRC staff would expect the following:

Environmental Consequences and Mitigating Actions
4-48
• Fish and macroinvertebrate abundances and species richness would likely be lower after operations began as compared to prior to operations, and lower downstream as compared to upstream of the discharge, and
• Populations of pollution-sensitive fish and macroinvertebrates would likely be lower after operations began as compared to prior to operations, and lower downstream of the discharge as compared to upstream of the discharge.
As described in LOE 3 and 4 in Section 4.7.1.2, the NRC staff reviewed fish population trends in the Illinois River near LSCS from the 1970s through 2013 (NRC 1978; EA 2000, 2014). The NRC staff determined that species richness and populations of pollution-sensitive fish have increased since LSCS began operations, and populations of pollution-tolerant fish have decreased. In addition, the NRC staff did not identify any clear patterns regarding the species richness and species abundances upstream and downstream of the river intake and discharge structures. Therefore, the thermal effluent is not likely having a noticeable impact on the temporal patterns of fish populations in the Illinois River near LSCS. Other factors, such as habitat diversity and improved water quality, are likely having a more noticeable impact on the spatial patterns in fish populations. As described in Section 3.7.1.1.2, EA (2000, 2014) compared the macroinvertebrate communities upstream and downstream of the LSCS discharge. During 1999 surveys, EA (2000) determined that the dominate macroinvertebrate taxa at sites both upstream and downstream of the discharge structure were tolerant to poor water quality. EA (2000) also determined that both total species richness and the number of Ephemeroptera, Plecoptera, and Trichoptera (EPT) species, which are considered intolerant of environmental stress, were slightly higher downstream (locations 2 and 4) compared to upstream (location 1) of the discharge structure. During 2013 surveys, EA (2014) observed dominant taxa that were relatively tolerant to poor water quality as well as dominant taxa that were relatively intolerant or facultative to poor water quality, both upstream and downstream of the discharge. Similarly, species richness among pollution-sensitive EPT was similar among all locations, ranging from three to five taxa (EA 2014). Given that the NRC staff did not identify any clear patterns regarding the species richness and species abundances upstream and downstream of the river discharge structures, the thermal effluent is not likely having a noticeable impact on fish populations near LSCS. Other factors, such as habitat diversity and quality, are having a more noticeable impact on the spatial patterns in fish populations. LOE 3 Conclusion
Given that species richness and populations of pollution-sensitive fish have increased since LSCS began operations and no clear pattern exists regarding the species richness and species abundances upstream and downstream of the discharge, the NRC staff concludes that heat shock is not having a noticeable impact on aquatic resources in the Illinois River near LSCS. Other factors, such as habitat diversity and quality, are likely having a more noticeable impact on the temporal and spatial patterns in fish populations. LOE 4: Health of Fish Populations as an Indicator of Water Quality Fish parasites and anomalies generally occur most often in fish that inhabit waterbodies with poor water quality (OEPA 1989). Therefore, if the LSCS thermal effluent were to result in heat stress for fish near LSCS, one would expect an increase in the occurrence of parasites and anomalies since operations began.
Environmental Consequences and Mitigating Actions
4-49
During preoperational studies, the NRC (1978) noted a high level of external parasitism, disease, and physical abnormalities associated with fish near LSCS. The NRC (1978) did not provide any quantitative estimates of the amount of fish that had external parasitism, diseases, or physical abnormalities. In 1999, EA (2000) observed a total of 63 fish (6.6 percent of the catch) with DELT (deformities, erosions, lesions, or tumors) anomalies. Channel catfish (Ictalurus punctatus), freshwater drum (Aplodinotus grunniens), and common carp exhibited the highest DELT affliction rates (greater than 20 percent). The most common DELT anomalies included fin erosion (52 percent) and deformities (38 percent). In 2013, EA (2014) observed a 0.2-percent DELT rate of all the 1,295 fish collected during electrofishing and seining studies in the Illinois River. Both fish were freshwater drum that exhibited eroded fins. One fish was collected upstream of the discharge structure (location 1) and the other fish was collected downstream of the discharge structure (location 2). EA (2014) did not observe any fish with parasites. These results suggest that the quality of aquatic habitat within the Illinois River near LSCS has improved since the 1970s. Similar trends of improved water quality and decreased rates of fish parasites and DELT anomalies have been documented in other studies on the Illinois River. For example, McClelland and Pegg (2005) reviewed trends in fish parasites and anomalies from Illinois Natural History Survey (INHS) data and found a decrease in anomalies over time, with no anomalies in 2004. These results suggest that the major changes in fish parasites and physical anomalies on fish near LSCS are the result of improved water quality, likely from the protections provided in the CWA, advances in municipal and industrial waste treatment, implementation of agricultural conservation measures, and other factors. LOE 4 Conclusion
Given the decreasing rate of fish parasites and DELT anomalies observed on fish in the Illinois River near LSCS, the NRC staff concludes that heat shock from LSCS’s thermal effluent is not having a noticeable impact on fish health in the Illinois River near LSCS. Other factors, such as water quality, are likely having a more noticeable impact on the rate of fish parasites and DELT anomalies (Lerczak 1996; McClelland and Pegg 2005; McClelland et al. 2012). LOE 5: Fish Kills Since 2001, Exelon has reported four fish kill events in the LSCS cooling pond; Section 3.7.2.2 describes these events. Exelon attributes these fish kills to high cooling pond temperatures as a result of high summer temperatures combined with low winds and high humidity (Exelon 2001, 2009, 2010). Each event resulted in the mortality of several hundred to several thousand fish. The largest of these events occurred in July 2001 and included approximately 94,500 dead fish (Exelon 2001). The majority of dead fish (96 percent) were gizzard shad (90,800). The majority of the fish in kills since 2001 were either gizzard shad or threadfin shad (Exelon 2001, 2009, and 2010). Fish kills have had a noticeable impact on shad populations in the cooling pond. For example, during Illinois Department of Natural Resources (IDNR) surveys in the cooling pond, the gizzard shad catch per hour was 451 in 2000 and in 2001, after the largest fish kill, it was 108 (Exelon 2002). Exelon (2002) attributed this decline to the large fish kill that included 90,800 gizzard shad during the previous summer. Similarly, in a status review of the cooling pond in 2011, 2012, and 2014, IDNR noted the decline in the shad populations and attributed this decline to a fish kill during the summer (Exelon 2015b). Shad populations generally recovered within about 1 year after a kill occurred (Exelon 2002, 2015b) and loss of shad did not substantially affect the community dynamics within the cooling pond

Environmental Consequences and Mitigating Actions
4-50
(Exelon 2010, 2015b). The NRC staff also did not identify any long-term or destabilizing changes from previous fish kills. Shad are main prey items for recreationally fished species within the LSCS cooling pond. Species with important trophic links, such as predators or prey, are considered important aquatic species based on the definition in the NRC’s standard review plan (NRC 2013f). As such, the NRC staff considers shad an important attribute of the aquatic community in the LSCS cooling pond because it is prey for many of the recreationally fished species. Stocked species are generally a small percentage of fish affected by fish kills in the LSCS cooling pond (Exelon 2001, 2009, 2010). IDNR generally stocks the pond with fish that are tolerant to high temperatures. In addition, if a fish kill or other environmental conditions have negatively impacted a stocked species, IDNR can increase the stocking level during the following spring (Exelon 2014a, 2015b). Further, IDNR has often reported abundant, growing populations of various stocked fish, such as striped bass hybrids and channel catfish (IDNR 2007, 2009; Exelon 2015b). The NRC expects that fish kills would continue during the proposed license renewal period because fish kills in the LSCS cooling pond can occur when temperatures rise above 95 °F (35 °C), the temperature at which most fish in the cooling pond are thermally stressed (Exelon 2014a, 2015a). Past temperature records indicate that the cooling pond regularly exceeded 95 °F (35 °C) during the past 10 summers (Exelon 2015b). Further, the LSCS cooling pond has reached a point where fish kills could be expected every summer (Exelon 2002). On August 3, 2015, the NRC staff published an Environmental Assessment in the Federal Register (80 FR 46062) as part of the NRC staff’s review of Exelon’s application to amend LSCS Technical Specification 3.7.3, “Ultimate Heat Sink,” by increasing the maximum cooling water temperature supplied to the plant from the ultimate heat sink (UHS) from 101.25 degrees Fahrenheit (°F) (38.47 degrees Celsius (°C)) to a variable limit between 101.25 and 104 °F (38.47 and 40 °C), depending on the time of day. On November 19, 2015, the NRC approved the amendment (NRC 2015g). In its Environmental Assessment, the NRC staff determined that raising the maximum allowable temperature of the UHS would increase cooling pond water temperatures, especially during extreme warm weather conditions. Fish kills would be more likely to occur, especially when cooling pond temperatures rise above 95 °F (35 °C), the temperature at which most fish in the cooling pond are thermally stressed. The NRC staff concluded that there would likely be an increase in the number or intensity of fish kills, and that the majority of fish killed would be shad. The increase in intensity and number of fish kills would not result in a significant impact, however, because the cooling pond is a managed ecosystem where fish populations affected by fish kills generally recover in about a year and do not significantly alter the fish community structure. Lastly, any impacts from the increased temperatures would be confined to the cooling pond and would not affect aquatic resources in the Illinois River. Exelon leases the cooling pond to the IDNR for the IDNR to manage and stock a portion of the cooling pond. However, Exelon retains the authority to terminate the lease. If the lease were to be terminated during the license renewal period, the NRC staff assumes that the fish community would continue to exist in the cooling pond without stocking, although the distribution of species and population sizes may change without artificial replenishment and with the elimination of recreational fishing pressure. The NRC staff made this determination based on observations of other cooling ponds at nuclear power plants that are not stocked with fish but contain a growing fish community based on the withdrawal of water from a river (e.g., NRC 2013c).
Environmental Consequences and Mitigating Actions
4-51
Exelon has not reported any fish kills on the Illinois River since LSCS began operating. Furthermore, discharge to the Illinois River remained within the NPDES-allowed limits during each of the reportable fish kills (Exelon 2015b). LOE 5 Conclusion
No fish kills have occurred on the Illinois River. Thus, this LOE indicates that the effects of the thermal discharge on Illinois River aquatic biota are not detectable. Fish kills in the LSCS cooling pond are expected to occur during the license renewal term (Exelon 2002, NRC 2015g). The NRC staff determined that such fish kills would have noticeable impacts on shad based on the following:
• Exelon and IDNR documented decreased or noticeable reductions in shad population sizes following fish kills in the cooling pond (Exelon 2002, 2015b).
• Exelon and IDNR attributed the declines in shad populations to the fish kills (Exelon 2002, 2015b).
Fish kills are not destabilizing to shad populations, however, because they tend to recover in about a year. Stocked species are a minor portion of affected fish during most fish kills, and therefore, the NRC staff concludes that fish kills do not noticeably alter populations of stocked species. In addition, if a fish kill negatively impacts a stocked species, IDNR can increase the stocking level during the following spring. Summary of Thermal Impacts Conclusion The NRC staff reviewed past NRC studies of thermal impacts, regulatory and administrative controls to limit the temperature in the LSCS discharge, spatial and temporal patterns of species richness and pollution-sensitive species, the health of fish prior to and during LSCS operations, and the occurrence of fish kills. The NRC staff concluded that the impacts to aquatic resources from heat shock would be SMALL for all fish within the Illinois River and for stock fish within the LSCS cooling pond, based on the following:
• fish could avoid the thermal plume, which would cover up to 9 percent of the Illinois River,
• the LSCS thermal effluent is limited by the IAC and the LSCS NPDES permit,
• species richness and the relative abundance of pollution-sensitive species have increased since LSCS began operations,
• the occurrence of fish parasites and physical abnormalities, which are indicative of poor water quality, has decreased since LSCS began operations, and
• stocked species are a minor portion of affected fish during most fish kills in the LSCS cooling pond.
The NRC staff determined that fish kills in the LSCS cooling pond would have MODERATE impacts on shad. A MODERATE impact is defined as environmental effects that are sufficient to alter noticeably, but not destabilize, important attributes of the resource (NRC 2013f). The NRC staff determined that fish kills would have noticeable impacts on important attributes of the aquatic environment within the cooling pond (i.e., shad) based on the following:
• Exelon and IDNR noted reductions in shad population sizes following fish kills in the cooling pond (Exelon 2002, 2015b).

Environmental Consequences and Mitigating Actions
4-52
• Exelon and IDNR attributed the decline in shad populations to the fish kills (Exelon 2002, 2015b).
• Based on the definition of important species in the NRC’s standard review plan (NRC 2013f), shad is an important aquatic attribute to the cooling pond ecosystem because it is prey for many recreationally fished species.
• Fish kills would not be destabilizing to shad populations because they tend to recover in about a year.
• Fish kills are expected to occur in the LSCS cooling pond during the license renewal term (Exelon 2002; NRC 2015g).
Therefore, the NRC staff concluded that thermal impacts would be MODERATE to shad in the LSCS cooling pond. The applicant has proposed no mitigation to reduce the MODERATE environmental impacts associated with thermal impacts to gizzard shad and threadfin shad in the cooling pond (Exelon 2015b). However, because the cooling pond is a highly managed system, any cascading effects resulting from the loss of shad (such as a reduction in prey for stocked species, which in turn could affect a stocked species’ population) could be mitigated through IDNR’s annual stocking and continual management of the pond. 4.7.1.4 Water Use Conflicts with Aquatic Resources
In the GEIS (NRC 2013d), the NRC determined that effects of water use conflicts on aquatic resources is a Category 2 issue (see Table 4–7) that requires site-specific evaluation during each license renewal review. Water use conflicts occur when the amount of water needed to support aquatic resources is diminished as a result of demand for agricultural, municipal, or industrial use or decreased water availability due to droughts, or a combination of these factors. The mean annual discharge of the Illinois River (described in Section 3.5.1.1) measured at the USGS gage at Marseilles, Illinois, is 10,750 cfs (304 m3/s). As described in Section 3.5.1.2, LSCS’s average surface water withdrawal rate from the Marseilles Pool of the Illinois River is 105 cfs (2.96 m3/s or 67.8 mgd), with consumptive use averaging about 49.7 cfs (1.4 m3/s or 32.1 mgd). This consumptive use is equivalent to about 0.5 percent of the Illinois River’s average annual flow. During periods of low flow, LSCS’s current consumptive water use (i.e., 49.7 cfs (1.4 m3/s or 32.1 mgd)) represents a 0.9- and a 1.1-percent reduction, respectively, in the flow of the river downstream of the LSCS site. As previously discussed in Section 3.5.1.2 of this SEIS, Exelon maintains an Extreme Heat Implementation Plan that is part of an overall Summer Readiness Plan. The Extreme Heat Implementation Plan provides procedural guidance to plant personnel for responding to worst-case summer weather and hydrologic conditions to ensure compliance with LSCS’s NPDES permit for thermal discharge limits and to safeguard plant equipment. As necessary, plant personnel run thermal models and will adjust makeup pumping rates to the cooling pond or the rate of blowdown to the river to maintain permit compliance. Under extreme cases, it may be necessary for Exelon to reduce LSCS’s power output or to shut down the plant (e.g., under conditions of extremely low water levels). The amount of Illinois River water LSCS consumes is minor in comparison to the flow of water past the plant, and administrative mechanisms are in place so LSCS does not consume an amount that would be harmful to aquatic biota during low-flow conditions. The NRC staff did not identify any information that indicates that the Illinois River biota are affected by the loss of river water consumed by LSCS’s makeup water withdrawals. The NRC staff concludes that water use conflicts would not occur from the proposed license renewal or would be so minor that the effects on aquatic resources would be undetectable. Thus, the NRC staff concludes that the

Environmental Consequences and Mitigating Actions
4-53
impacts of water use conflicts on aquatic resources during the proposed license renewal term would be SMALL.
4.7.2 No-Action Alternative
If LSCS were to cease operating, impacts to aquatic ecology would decrease or stop following reactor shutdown. Some withdrawal of water from the Illinois River would continue during the shutdown period as the fuel is cooled, although the amount of water withdrawn would decrease over time. The reduced demand for cooling water would substantially decrease the effects of impingement, entrainment, and thermal effluents. These effects would likely stop following the removal of fuel from the reactor cores and shutdown of the spent fuel pool. Given the small area of the thermal plume in the Illinois River under normal operating conditions (less than 9 percent), effects from cold shock are unlikely. The cooling pond, however, would likely experience shifts in the relative abundances of fish populations because less heat-tolerant species would no longer be stressed by thermal additions to the pond. Some fish populations, such as stocked recreational species that thrive in warmer waters, may experience population declines in the cooling pond. These alterations in community structure would likely be noticeably for some species within the cooling pond. Thus, the NRC staff concludes that the impacts of the no-action alternative on aquatic resources during the proposed license renewal term would be SMALL within the Illinois River and SMALL to MODERATE within the cooling pond.
4.7.3 New Nuclear Alternative
Construction of a new nuclear alternative would occur at an existing nuclear power plant site (other than the LSCS site) or a retired coal plant site. Construction activities could degrade water quality of nearby streams, ponds, or rivers through erosion and sedimentation; result in loss of habitat through pond or wetland filling; or result in direct mortality of aquatic organisms from dredging or other in-water work. Due to the relatively short-term nature of construction activities, these effects would likely be relatively localized and temporary. Siting the plant on an existing site could make use of existing transmission lines, roads, parking areas, and other infrastructure, which would limit the amount of habitat disturbance that would be required. Less habitat disturbance would create less erosion and sedimentation. The construction of intake and discharge structures could result in direct mortality of individuals as well as water quality degradation. Appropriate permits would ensure that water quality impacts would be addressed through mitigation or BMPs, as stipulated in the permits. The EPA, USACE, or the State would oversee applicable permitting, including a CWA Section 404 permit, Section 401 certification, and Section 402(p) NPDES general stormwater permit. The NRC (2013a) has completed the review of one combined license application to build and operate a new nuclear plant in the ROI (Fermi 3 in Michigan) and concluded that construction would have SMALL impacts on aquatic resources. Without more specific details on the location of the new nuclear alternative, the NRC staff finds it reasonable to adopt its previous construction conclusions regarding Fermi 3 for the construction portion of this alternative. Operational impacts would include those listed in Table 4–7, and the GEIS (NRC 2013d) conclusions of SMALL for Category 1 issues in the table would apply during the operational phase of the new nuclear alternative. Because this alternative would use a closed-cycle system, impingement, entrainment, and thermal effects would also be SMALL. Water use conflicts with aquatic resources would depend on the site location, water body, and specific aquatic community present and cannot be determined without more specific details on the location of this alternative.

Environmental Consequences and Mitigating Actions
4-54
The NRC staff concludes that the impacts to aquatic resources from construction and operation of a new nuclear alternative would be SMALL.
4.7.4 IGCC Alternative
Construction of an IGCC alternative would occur at the LSCS site or another existing power plant site in the ROI. The GEIS (NRC 2013d) indicates that the impacts of new power plant construction on ecological resources would be qualitatively similar. Thus, those impacts discussed under the new nuclear alternative would apply during the construction phase. Thus, construction impacts would be SMALL. Operation of the IGCC alternative would require less cooling water than LSCS because the plant would operate with a closed-cycle system. Accordingly, impingement, entrainment, and thermal effects on aquatic resources would likely be smaller than for continued operation of LSCS, though the exact magnitude would depend upon the water body and specific aquatic communities present. Chemical discharges from the cooling system would be similar to those at LSCS. Operation would require coal deliveries, cleaning, and storage, which would require periodic dredging (if coal is delivered by barge); create dust, sedimentation, and turbidity; and introduce trace elements and minerals into the water. Air emissions from the IGCC units would include small amounts of sulfur dioxide, particulates, and mercury that would settle on water bodies or be introduced into the water from soil erosion. If the IGCC plant were located on the same water body (the Illinois River) in the vicinity of the LSCS site, overall operational impacts would be less than for the continued operation of LSCS because of the reduced impingement, entrainment, and thermal effects. However, without knowing the location of the IGCC plant, the associated water body, aquatic species, and their interactions within the ecosystem, the NRC staff cannot assume that overall impacts of operation of an IGCC plant would be less than those for the continued operation of LSCS. Thus, impacts could range from SMALL to MODERATE. The NRC staff concludes that the impacts to aquatic resources from construction of an IGCC plant would be SMALL and the impacts from operation would be SMALL to MODERATE.
4.7.5 NGCC Alternative
Construction of an NGCC alternative would occur at the LSCS site. The GEIS (NRC 2013d) indicates that the impacts of new power plant construction on ecological resources would be qualitatively similar. Thus, those impacts discussed under the new nuclear alternative would apply during the construction phase. Construction of new pipelines, if necessary, could impact previously undisturbed habitats. This impact would vary depending on the location of the plant and would be more likely to impact terrestrial resources than aquatic resources. Because the NGCC alternative would be built at the LSCS site, new pipelines could be collocated in existing corridors to reduce impacts. Overall, construction impacts would be SMALL. Operation of the NGCC alternative cooling system would be qualitatively similar to the IGCC alternative but would result in smaller impacts because the NGCC alternative would consume about half as much cooling water. Air emissions from the NGCC units would include nitrogen oxide, carbon dioxide, and particulates that would settle on water bodies or be introduced into the water from soil erosion. Given that the NGCC plant would be located on the same water body (the Illinois River) as LSCS, overall operational impacts would be less than for the continued operation of LSCS, due to the reduced impingement, entrainment, and thermal effects, which were determined to be SMALL for aquatic resources in the Illinois River. The NRC staff concludes that the impacts to aquatic resources from construction and operation of an NGCC plant would be SMALL.
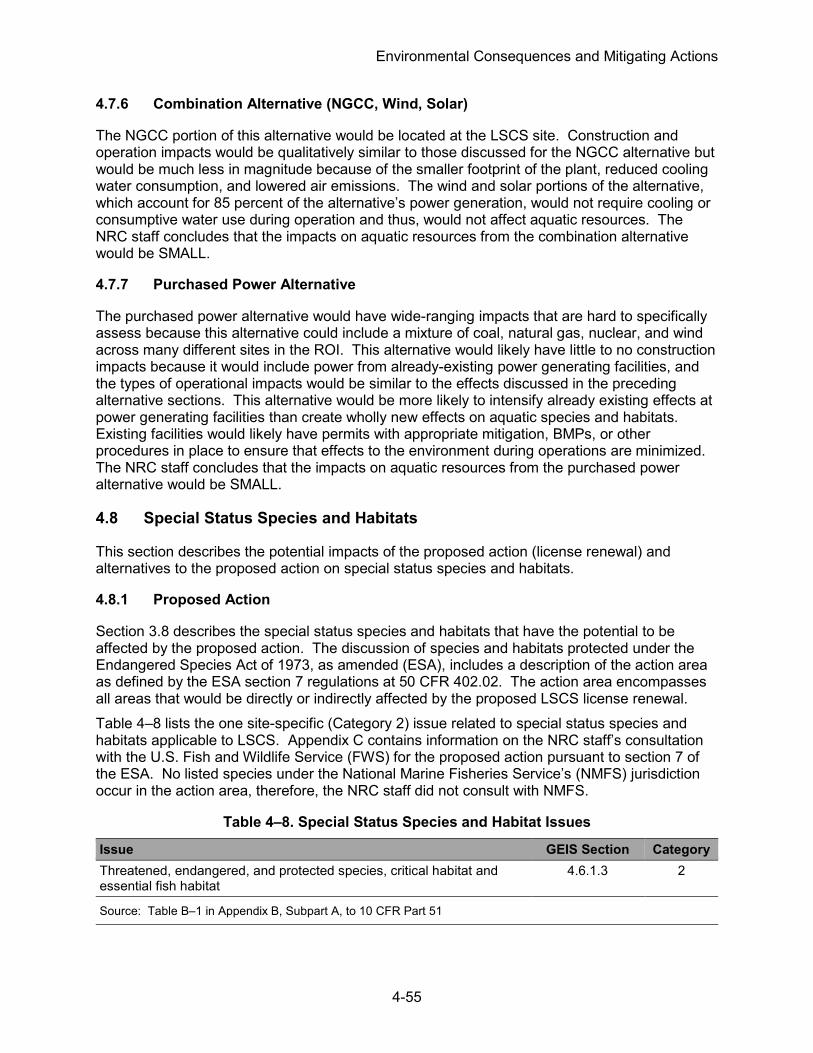
Environmental Consequences and Mitigating Actions
4-55
4.7.6 Combination Alternative (NGCC, Wind, Solar)
The NGCC portion of this alternative would be located at the LSCS site. Construction and operation impacts would be qualitatively similar to those discussed for the NGCC alternative but would be much less in magnitude because of the smaller footprint of the plant, reduced cooling water consumption, and lowered air emissions. The wind and solar portions of the alternative, which account for 85 percent of the alternative’s power generation, would not require cooling or consumptive water use during operation and thus, would not affect aquatic resources. The NRC staff concludes that the impacts on aquatic resources from the combination alternative would be SMALL.
4.7.7 Purchased Power Alternative
The purchased power alternative would have wide-ranging impacts that are hard to specifically assess because this alternative could include a mixture of coal, natural gas, nuclear, and wind across many different sites in the ROI. This alternative would likely have little to no construction impacts because it would include power from already-existing power generating facilities, and the types of operational impacts would be similar to the effects discussed in the preceding alternative sections. This alternative would be more likely to intensify already existing effects at power generating facilities than create wholly new effects on aquatic species and habitats. Existing facilities would likely have permits with appropriate mitigation, BMPs, or other procedures in place to ensure that effects to the environment during operations are minimized. The NRC staff concludes that the impacts on aquatic resources from the purchased power alternative would be SMALL.
4.8 Special Status Species and Habitats
This section describes the potential impacts of the proposed action (license renewal) and alternatives to the proposed action on special status species and habitats.
4.8.1 Proposed Action
Section 3.8 describes the special status species and habitats that have the potential to be affected by the proposed action. The discussion of species and habitats protected under the Endangered Species Act of 1973, as amended (ESA), includes a description of the action area as defined by the ESA section 7 regulations at 50 CFR 402.02. The action area encompasses all areas that would be directly or indirectly affected by the proposed LSCS license renewal. Table 4–8 lists the one site-specific (Category 2) issue related to special status species and habitats applicable to LSCS. Appendix C contains information on the NRC staff’s consultation with the U.S. Fish and Wildlife Service (FWS) for the proposed action pursuant to section 7 of the ESA. No listed species under the National Marine Fisheries Service’s (NMFS) jurisdiction occur in the action area, therefore, the NRC staff did not consult with NMFS.
Table 4–8. Special Status Species and Habitat Issues
Issue GEIS Section Category Threatened, endangered, and protected species, critical habitat and essential fish habitat
4.6.1.3 2
Source: Table B–1 in Appendix B, Subpart A, to 10 CFR Part 51

Environmental Consequences and Mitigating Actions
4-56
Correspondence In late February 2015, the NRC staff filled in an online form to obtain an updated protected species list for LSCS on the FWS’s Environmental Conservation Online System, Information for Planning and Conservation. The FWS (2015b) responded with a list of threatened and endangered species that may occur in the project location and may be affected by the Federal action. In October 2015, the NRC staff checked the FWS (2015a) online Illinois County distribution of listed species for updates. Analysis and Determination of Effects Exelon (2014a) reports that no Federally listed species identified in Section 3.8, have been reported in the action area and no designated or proposed critical habitat under the ESA occurs in the action area. Thus, the NRC staff concludes that the proposed action would have no effect on the Federally listed species identified in Section 3.8. The FWS (2014) does not typically provide its concurrence with “no effect” determinations by Federal agencies. Thus, the ESA does not require further informal consultation or the initiation of formal consultation with the FWS for the proposed license renewal. ESA regulations at 50 CFR 402.12(f)(4) direct Federal agencies to consider cumulative effects as part of the proposed action effects analysis. Under the ESA, cumulative effects are defined as “those effects of future State or private activities, not involving Federal activities, that are reasonably certain to occur within the action area of the Federal action subject to consultation” (50 CFR 402.02). Unlike the NEPA definition of cumulative impacts (see Section 4.16), cumulative effects under the ESA do not include past actions or other Federal actions requiring separate ESA section 7 consultation. When formulating biological opinions under formal section 7 consultation, the FWS and the National Marine Fisheries Service (NMFS) (FWS and NMFS 1998) consider cumulative effects when determining the likelihood of jeopardy or adverse modification. Therefore, consideration of cumulative effects under the ESA is necessary only if listed species will be adversely affected by the proposed action (FWS 2014). Since the NRC staff concludes that no species would be adversely affected by license renewal, the NRC staff did not assess cumulative effects. Reporting Requirements If in the future, a Federally listed species is observed on the LSCS site, the NRC has measures in place to ensure that NRC staff would be appropriately notified so that the NRC staff could determine the appropriate course of action. If the renewed licenses have not yet been issued, the NRC’s response could include the initiation of consultation pursuant to section 7 of the ESA. LSCS’s Unit 1 and Unit 2 operating licenses, Appendix B, “Environmental Protection Plan” (see NRC 2001), require Exelon to report to the NRC within 24 hours any “unusual or important event” that indicates or could result in significant environmental impact causally related to plant operation. The licenses give the specific example of “mortality or unusual occurrence of any species protected by the Endangered Species Act of 1973.” Additionally, the NRC’s regulations containing notification requirements require that operating nuclear power reactors report to the NRC within 4 hours “any event or situation, related to…protection of the environment, for which a news release is planned or notification to other government agencies has been or will be made” (10 CFR 50.72(b)(2)(xi)). Such notifications include reports regarding Federally listed species, as described in Section 3.2.12 of NUREG–1022, “Event Reporting Guidelines for 10 CFR 50.72 and 50.73” (NRC 2013b). Special Status Species and Habitats Impacts Summary
Table 4–9 summarizes the NRC staff’s findings.

Environmental Consequences and Mitigating Actions
4-57
Table 4–9. Federally Listed Species and Designated Habitat in LaSalle County, Illinois, and NRC Effect Determinations for Proposed LSCS License Renewal
Group Federally Listed Species Common Name
Federal Status(a) Determination
Clams and Mussels Plethobasus cyphyus sheepnose mussel E no effect Flowering Plants Boltonia decurrens decurrent false aster T no effect Platanthera leucophaea eastern prairie fringed
orchid T no effect
Delea foliosa leafy prairie clover E no effect Mammals Myotis sodalis Indiana bat E no effect Myotis septentrionalis northern long-eared bat T no effect Critical Habitat Myotis sodalis Indiana bat no effect (a) E=endangered; T=threatened
Sources: FWS 2015a, 2015b
4.8.2 No-Action Alternative
Under the no-action alternative, the plant would shut down. Federally listed species and designated critical habitat can be affected not only by operation of nuclear power plants but also by activities during shutdown. The ESA action area for the no-action alternative would most likely be the same as discussed in Section 3.8. The plant would require substantially less cooling water, so potential impacts to aquatic species and habitats discussed in Section 4.8.1 would be reduced, although the plant would still require some cooling water for some time. Changes in land use and other shutdown activities might affect terrestrial species differently than under continued operation. Typically, the effects on ESA-listed aquatic species would be smaller than the effects under continued operation but would depend on the listed species and habitats present if shutdown were to occur. The types and magnitudes of adverse impacts to terrestrial ESA-listed species would depend on the shutdown activities and the listed species and habitats present when the alternative is implemented. Therefore, the NRC cannot forecast a particular level of impact for this alternative.
4.8.3 New Nuclear Alternative
This alternative entails shutdown and decommissioning of LSCS and construction of a new nuclear unit at an alternative industrial location, possibly in Indiana, Iowa, Michigan, Missouri, Kentucky, or Wisconsin. Section 4.8.2 discusses ESA considerations for the shutdown of LSCS. Because the new nuclear alternative would be built on an existing power plant site outside of Illinois, which has restrictions on new nuclear power plant construction, the special status species and habitats affected by the action would be different than those considered under the proposed action. Because the NRC would be the licensing agency under this alternative, the ESA would require the NRC to initiate consultation with FWS and NMFS, as applicable, prior to construction to ensure that the construction and operation of the new nuclear plant would not be

Environmental Consequences and Mitigating Actions
4-58
likely to jeopardize the continued existence of any Federally listed species or result in the destruction of designated critical habitat. Section 4.8.2 discusses general ESA considerations. In the unlikely event that the new nuclear plant is sited in an area that could affect water bodies with designated essential fish habitat (EFH), which applies only to certain commercially harvested marine and anadromous fish species, consultation with NMFS under the MSA would be required to assess potential impacts to that habitat. Because the types and magnitudes of adverse impacts to listed species would depend on the proposed site, plant design, operation, and species and habitats listed when the alternative is implemented, the NRC cannot forecast a particular level of impact for this alternative.
4.8.4 IGCC Alternative
This alternative entails shutdown and decommissioning of LSCS and construction of a new IGCC facility at either the LSCS site or an alternative industrial location. Section 4.8.2 discusses ESA considerations for the shutdown of LSCS. Unlike the new nuclear alternative, the NRC does not license IGCC facilities, and the NRC would not be responsible for initiating ESA section 7 consultation if listed species or habitats might be adversely affected under this alternative. If no other federal agency was involved in licensing the facilities, the facilities themselves would be responsible for protecting listed species because the ESA forbids the “take” of a listed species, where “take” means “harass, harm, pursue, hunt, shoot, wound, kill, trap, capture, or collect, or attempt to engage in any such conduct.” If the IGCC alternative were to be built on the LSCS site, the ESA action area might still be different because the activities and structures associated with the construction and operations of an IGCC plant would be different than those described under the continued operation of LSCS. If the IGCC alternative were to be built at a site other than the LSCS site, the listed species and habitats affected by the action would be different than those identified for LSCS. Because the types and magnitudes of adverse impacts to -listed species would depend on the proposed site, plant design, operation, and species and habitats listed when the alternative is implemented, the NRC cannot forecast a particular level of impact for this alternative.
4.8.5 NGCC Alternative
This alternative entails the shutdown and decommissioning of LSCS and construction of a new NGCC facility at either the LSCS site or an alternative industrial location. Section 4.8.2 discusses ESA considerations for the shutdown of LSCS. Unlike the new nuclear alternative, the NRC does not license NGCC facilities, and the NRC would not be responsible for initiating ESA section 7 consultation if listed species or habitats might be adversely affected under this alternative. If no other federal agency was involved in licensing the facilities, the facilities themselves would be responsible for protecting listed species because the ESA forbids the “take” of a listed species, where “take” means “harass, harm, pursue, hunt, shoot, wound, kill, trap, capture, or collect, or attempt to engage in any such conduct.” If the NGCC alternative were to be built on the LSCS site, the ESA action area might still be different because the activities and structures associated with the construction and operations of an NGCC plant would be different than those described under the continued operation of LSCS. If the NGCC alternative were to be built at a site other than the LSCS site, the listed species and habitats affected by the action would be different than those identified for LSCS.

Environmental Consequences and Mitigating Actions
4-59
Because the types and magnitudes of adverse impacts to listed species would depend on the proposed site, plant design, operation, and species and habitats listed when the alternative is implemented, the NRC cannot forecast a particular level of impact for this alternative.
4.8.6 Combination Alternative (NGCC, Wind, Solar)
This alternative entails the shutdown and decommissioning of LSCS and construction of new non-nuclear facilities at the LSCS site and alternative industrial locations. Section 4.8.2 discusses ESA considerations for the shutdown of LSCS. The combination alternative would involve construction and operation of wind turbines and solar PV systems throughout the ROI, as well as an NGCC plant at the LSCS site. Unlike the new nuclear alternative, the NRC does not license NGCC, wind, or solar facilities, and the NRC would not be responsible for initiating ESA section 7 consultation if listed species or habitats might be adversely affected under this alternative. If no other federal agency was involved in licensing the facilities, the facilities themselves would be responsible for protecting listed species because the ESA forbids the “take” of a listed species, where “take” means “harass, harm, pursue, hunt, shoot, wound, kill, trap, capture, or collect, or attempt to engage in any such conduct.” Even though the NGCC portion of the combination alternative would be located on the LSCS site, the ESA action area might be different because the activities and structures associated with the construction and operations of the NGCC portion of the combination alternative would be different than those described under the continued operation of LSCS. Since the wind and solar parts of the combination alternative would be located on a site or sites other than the LSCS site, the listed species and habitats affected by the action would be different than those identified for LSCS. Because the types and magnitudes of adverse impacts to listed species would depend on the proposed site, wind and solar component designs, operation, and species and habitats listed when the alternative is implemented, the NRC cannot forecast a particular level of impact for this alternative.
4.8.7 Purchased Power Alternative
Because the purchased power alternative might include a mixture of coal, natural gas, nuclear, and wind across many different sites in the ROI, the special status species and habitats affected by the action would be different than those considered under continued operation. Because the types and magnitudes of adverse impacts to listed species would depend on the proposed sites, plant designs, operation, and species and habitats listed at the various sites when the alternative is implemented, the NRC cannot forecast a particular level of impact for this alternative. As with the other alternatives discussed previously, the facilities themselves, or a different federal regulator, but not the NRC, would be responsible for initiating ESA section 7 consultation if listed species or habitats might be adversely affected under this alternative.
4.9 Historic and Cultural Resources
This section describes the potential impacts of the proposed action (license renewal) and alternatives to the proposed action on historic and cultural resources.
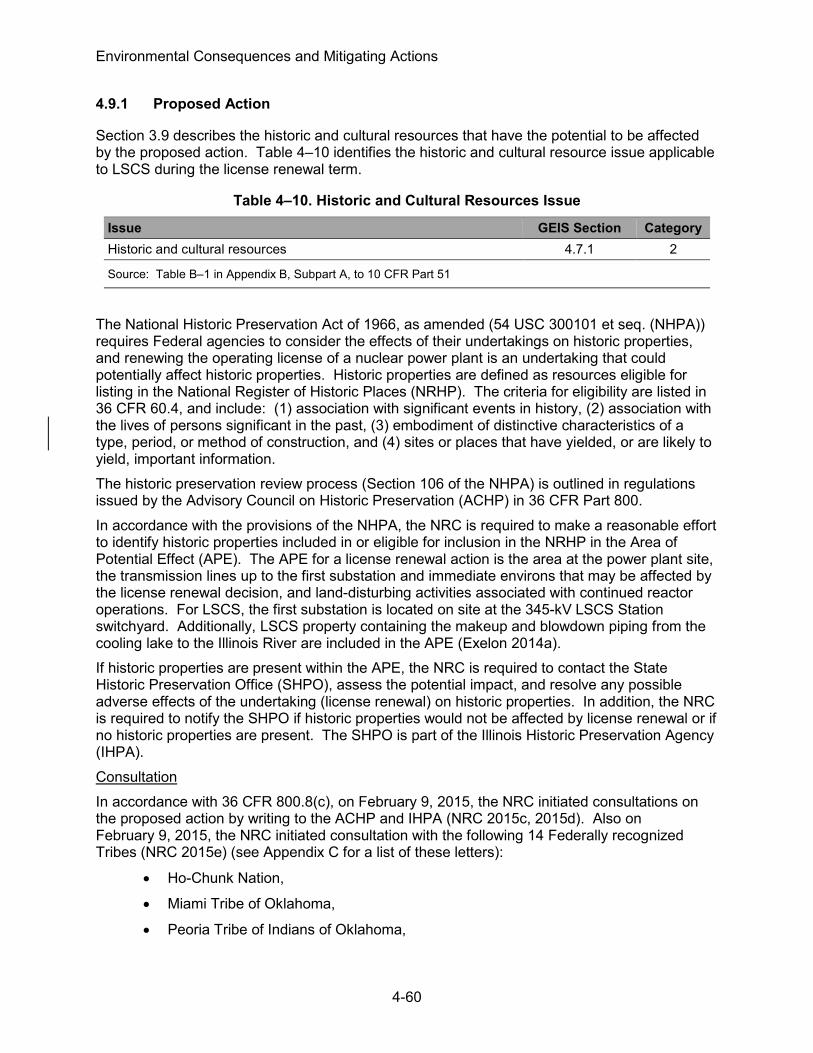
Environmental Consequences and Mitigating Actions
4-60
4.9.1 Proposed Action
Section 3.9 describes the historic and cultural resources that have the potential to be affected by the proposed action. Table 4–10 identifies the historic and cultural resource issue applicable to LSCS during the license renewal term.
Table 4–10. Historic and Cultural Resources Issue
Issue GEIS Section Category Historic and cultural resources 4.7.1 2
Source: Table B–1 in Appendix B, Subpart A, to 10 CFR Part 51
The National Historic Preservation Act of 1966, as amended (54 USC 300101 et seq. (NHPA)) requires Federal agencies to consider the effects of their undertakings on historic properties, and renewing the operating license of a nuclear power plant is an undertaking that could potentially affect historic properties. Historic properties are defined as resources eligible for listing in the National Register of Historic Places (NRHP). The criteria for eligibility are listed in 36 CFR 60.4, and include: (1) association with significant events in history, (2) association with the lives of persons significant in the past, (3) embodiment of distinctive characteristics of a type, period, or method of construction, and (4) sites or places that have yielded, or are likely to yield, important information. The historic preservation review process (Section 106 of the NHPA) is outlined in regulations issued by the Advisory Council on Historic Preservation (ACHP) in 36 CFR Part 800. In accordance with the provisions of the NHPA, the NRC is required to make a reasonable effort to identify historic properties included in or eligible for inclusion in the NRHP in the Area of Potential Effect (APE). The APE for a license renewal action is the area at the power plant site, the transmission lines up to the first substation and immediate environs that may be affected by the license renewal decision, and land-disturbing activities associated with continued reactor operations. For LSCS, the first substation is located on site at the 345-kV LSCS Station switchyard. Additionally, LSCS property containing the makeup and blowdown piping from the cooling lake to the Illinois River are included in the APE (Exelon 2014a). If historic properties are present within the APE, the NRC is required to contact the State Historic Preservation Office (SHPO), assess the potential impact, and resolve any possible adverse effects of the undertaking (license renewal) on historic properties. In addition, the NRC is required to notify the SHPO if historic properties would not be affected by license renewal or if no historic properties are present. The SHPO is part of the Illinois Historic Preservation Agency (IHPA). Consultation In accordance with 36 CFR 800.8(c), on February 9, 2015, the NRC initiated consultations on the proposed action by writing to the ACHP and IHPA (NRC 2015c, 2015d). Also on February 9, 2015, the NRC initiated consultation with the following 14 Federally recognized Tribes (NRC 2015e) (see Appendix C for a list of these letters):
• Ho-Chunk Nation,
• Miami Tribe of Oklahoma,
• Peoria Tribe of Indians of Oklahoma,

Environmental Consequences and Mitigating Actions
4-61
• Citizen Potawatomi Nation,
• Sac and Fox Tribe of the Mississippi in Iowa/Meskwaki,
• Sac and Fox Nation of Missouri in Kansas and Nebraska,
• Sac and Fox Nation,
• Pokagon Band of Potawatomi,
• Forest County Potawatomi,
• Hannahville Indian Community, Band of Potawatomi,
• Prairie Band of Potawatomi Nation,
• Winnebago Tribe of Nebraska,
• Kickapoo Tribe in Kansas, and
• Kickapoo Tribe of Oklahoma. By letter, the NRC provided information about the proposed action, defined the APE, and indicated that the NHPA review would be integrated with the NEPA process, according to 36 CFR 800.8(c). The NRC invited participation in the identification and possible decisions concerning historic properties and also invited participation in the scoping process. The NRC received no scoping comments from any of the tribes contacted. In April 2015, the NRC received a determination from the IHPA stating no objection to the undertaking and that no historic properties would be affected (Leibowitz 2015) (see Appendix C). The NRC met with the Illinois SHPO in May 2015. The Illinois SHPO did not express any concerns about the proposed LSCS license renewal during the meeting (NRC 2015f). Exelon currently has no planned physical changes or license-renewal-related refurbishment activities at the LSCS site. Any future ground-disturbing activities at the LSCS site will be done in accordance with established LSCS procedures to determine whether the proposed activities will impact known or potential cultural and historic resources (Exelon 2015b). Exelon would consult with the SHPO, if necessary, to determine what measures would be needed to minimize and mitigate the impacts (Exelon 2014a). Supplemental cultural resource surveys may be performed of the affected areas based on consultation with the SHPO. As described in Section 3.9, there are no historic properties or known NRHP-eligible historic or cultural resources located within the LSCS APE. Exelon has established a draft Cultural Resource Management Plan (CRMP) to help ensure historic and cultural resources are considered prior to ground-disturbing activities. The CRMP instructs Exelon’s staff on how to evaluate land disturbing activity for possible impacts to historic and cultural resources and identifies previously disturbed areas of the LSCS property and any areas with the potential to contain undiscovered resources (Exelon 2015b). Additionally, Exelon has established procedures in the event that historic or cultural resources are inadvertently discovered during operational activities. These procedures direct the Exelon staff to stop work, protect exposed resources, and contact Exelon environmental personnel to take appropriate action (Exelon 2015b). Cultural resource training is not currently required for LSCS staff members (Exelon 2015b). The NRC staff concludes that license renewal would not affect any known historic properties (36 CFR Section 800.4(d)(1)) based on (1) no current NRHP-eligible historic properties in the APE, (2) tribal input, (3) Exelon’s draft CRMP, (4) no current plan for license-renewal-related physical changes or ground-disturbing activities, (5) IHPA input, and (6) cultural resource assessment. The NRC staff notes that Exelon could reduce the risk of potential impacts to historic and cultural resources located on or near the LSCS site by finalizing its draft CRMP,

Environmental Consequences and Mitigating Actions
4-62
with input from the SHPO, and by providing training on cultural resources for Exelon’s staff engaged in planning and executing ground-disturbing activities.
4.9.2 No-Action Alternative
Not renewing the operating licenses and terminating reactor operations would have no effect on historic properties and cultural resources within the site boundaries of LSCS. Therefore, the NRC staff concludes that the impacts on historic and cultural resources from the no-action alternative would be SMALL.
4.9.3 New Nuclear Alternative
Any land areas potentially affected by the construction of the new nuclear alternative power plant would need to be surveyed to identify and record historic and archaeological cultural resources. An inventory of a previously disturbed former plant industrial site may still be necessary if the site has not been previously surveyed or to verify the level of previous disturbance and to evaluate the potential for intact subsurface cultural resources to be present. Power plant developers would need to survey all potentially affected land areas associated with operation of the alternative (e.g., land required for new roads, transmission corridors, other ROWs). Any cultural resources found during these surveys would need to be recorded and evaluated for eligibility for listing on the NRHP. Mitigation of adverse effects would need to be considered if eligible resources properties were encountered. Areas with the greatest sensitivity and most significant cultural resources should be avoided. Visual impacts on significant cultural resources, such as the historic property viewsheds near the proposed power plant site, should also be assessed and evaluated. The potential for impacts to historic and cultural resources from the new nuclear alternative would vary greatly, depending on the location of the site selected for the proposed new nuclear power plant site. Cooling towers could impact historic property viewsheds. However, given the preference to use a previously disturbed former power plant site, avoidance of undisturbed land could further reduce potential impacts to historic and cultural resources. The NRC staff concludes that the impacts on historic and cultural resources from the construction and operation of a new nuclear alternative power plant would be SMALL.
4.9.4 IGCC Alternative
Any areas potentially affected by the construction of the IGCC alternative may need to be surveyed to identify and record historic and cultural resources if a Federal undertaking under NHPA is present. If the IGCC alternative is located on the existing LSCS site, previously disturbed areas known to not contain historic and cultural resources could be used. If the alternative is sited on the approximately 350 ac (142 ha) of undeveloped land on the LSCS site, a survey and inventory for potential historic and cultural resources may need to be performed. If the IGCC power plant is sited at an existing power plant site other than LSCS and a Federal undertaking under NHPA is present, a cultural resource survey may still be necessary if the site has not been previously surveyed or to verify the level of disturbance and evaluate the potential for intact subsurface resources. Any resources found in these surveys would need to be evaluated for eligibility on the NRHP, and mitigation of adverse effects would need to be addressed if eligible resources were encountered. Areas with the greatest sensitivity should be avoided. Visual impacts on significant cultural resources, such as the historic property viewshed of historic properties near the proposed power plant site, should also be assessed and evaluated.
Environmental Consequences and Mitigating Actions
4-63
The potential for impacts on historic and cultural resources from the IGCC alternative would vary greatly depending on the location of the proposed site. Given that the preference is to use a previously disturbed former plant site and no major infrastructure upgrades are necessary, avoidance of significant historic and cultural resources should be possible and effectively managed under current laws and regulations. The NRC staff concludes that the impacts on historic and archaeological resources from the IGCC alternative would be SMALL.
4.9.5 NGCC Alternative
Any areas potentially affected by the construction and operation of an NGCC power plant may need to be surveyed to identify and record historic and cultural resources if a Federal undertaking under NHPA is present. If the NGCC power plant is constructed at the existing LSCS site, previously disturbed areas known to not contain historic and cultural resources could be used. If the power plant is sited on the approximately 350 ac (142 ha) of undeveloped land on the LSCS site and a Federal undertaking under NHPA is present, a survey and inventory of potential historic and cultural resources would need to be performed. Additionally, plant operators would need to survey all areas associated with the alternative (e.g., a new pipeline, roads, transmission corridors, other ROWs). Any resources found in these surveys would need to be evaluated for eligibility on the NRHP, and mitigation of adverse effects would need to be addressed if eligible resources were encountered. Areas with the greatest sensitivity should be avoided. Visual impacts on significant cultural resources, such as the viewsheds of historic properties near the proposed power plant site, should also be assessed and evaluated. Given that the NGCC alternative is assumed to be sited at LSCS, avoidance of significant historic and cultural resources should be possible. However, historic and archaeological resources could potentially be affected, depending on the resource richness of the land required for a new gas pipeline; but, as with the plant site itself, avoidance of significant historic and cultural resources should be possible and effectively managed under current laws and regulations. The NRC staff concludes that the impacts on historic and cultural resources from the NGCC alternative would be SMALL.
4.9.6 Combination Alternative (NGCC, Wind, Solar)
Areas potentially affected by the construction of the NGCC, wind, and solar alternative may need to be surveyed to identify and record historic and archaeological resources if a Federal undertaking under NHPA is present. Any resources found in these surveys would need to be evaluated for eligibility on the NRHP, and mitigation of adverse effects would need to be addressed if eligible resources were encountered. Impacts to historic and cultural resources from the NGCC portion of this alternative are similar to the NGCC alternative in Section 4.9.5. The potential for impacts on historic and cultural resources from the wind portion of this alternative would vary greatly, depending on the location of the proposed sites. Areas with the greatest sensitivity could be avoided or effectively managed under current laws and regulations. However, construction of wind farms and their support infrastructure have the potential to notably impact historic and archaeological resources because of earthmoving activities (e.g., grading and digging) and the aesthetic changes they may bring to the viewshed of historic properties located nearby. The impacts of the construction of a new solar alternative on historic and cultural resources will vary, depending on the form of the solar capacity installed. Rooftop installations minimize land disturbance and the modifications necessary to the transmission system, thereby minimizing impacts to historic and cultural resources. Land-based installations are larger than rooftop installations and will require some degree of land disturbance for installation purposes, potentially causing greater impacts to

Environmental Consequences and Mitigating Actions
4-64
historic and archaeological resources. Aesthetic changes caused by the installation of both forms could have a noticeable effect on the viewshed of nearby historic properties. Using previously disturbed sites for land-based installations and collocating any new transmission lines with existing ROWs could minimize impacts to historic and archaeological resources. Areas with the greatest sensitivity could be avoided or effectively managed under current laws and regulations. The NRC staff concludes that, depending on the resource richness of the sites chosen for the NGCC, wind, and solar alternative, the impacts could range from SMALL to LARGE.
4.9.7 Purchased Power Alternative
No direct impacts on historic and cultural resources are expected from purchased power. If new transmission lines were needed to convey power to the PJM Interconnection area, surveys similar to those discussed in Section 4.9.3 may need to be performed if a Federal undertaking under NHPA is present. However, transmission lines would likely be collocated with existing ROWs, minimizing any impacts to historic and cultural resources. Indirectly, construction of new nuclear, coal-fired, and natural-gas-fired plants, or wind energy projects, and any new transmission lines to support increased demand in the purchased power alternative could affect historic and cultural resources. If the amount of purchased power exceeds the available supply, new electrical power generating facilities may be needed. Any areas potentially affected by construction may need to be surveyed to identify and record historic and cultural resources if a Federal undertaking under NHPA is present. Resources found in these surveys would need to be evaluated for eligibility on the NRHP, and mitigation of adverse effects would need to be addressed if eligible resources were encountered. Plant operators would need to survey all areas associated with operation of the alternative (e.g., roads, transmission corridors, other ROWs). The potential for impacts on historic and cultural resources would vary greatly, depending on the location of the proposed sites; however, using previously disturbed sites could greatly minimize impacts to historic and cultural resources. Areas with the greatest sensitivity could be avoided or effectively managed under current laws and regulations. The NRC staff concludes that, depending on the resource richness of the sites chosen, the impacts on historic and cultural resources could range from SMALL to LARGE.
4.10 Socioeconomics
This section describes the potential socioeconomic impacts of the proposed action (license renewal) and alternatives to the proposed action.
4.10.1 Proposed Action
Socioeconomic effects of ongoing reactor operations at LSCS have become well established as regional socioeconomic conditions have adjusted to the presence of the nuclear power plant. These conditions are described in Section 3.10. Any changes in employment and tax payments caused by license renewal and any associated refurbishment activities could have a direct and indirect impact on community services and housing demand, as well as traffic volumes in the communities around a nuclear power plant. Table 4–11 identifies the socioeconomic NEPA issues from Table B–1 in Appendix B to Subpart A of 10 CFR Part 51, applicable to LSCS during the license renewal term.

Environmental Consequences and Mitigating Actions
4-65
Table 4–11. Socioeconomic NEPA Issues Affected by License Renewal
Issue GEIS Sections Category Employment and income, recreation and tourism 4.8.1.1 1 Tax revenues 4.8.1.2 1 Community services and education 4.8.1.3 1 Population and housing 4.8.1.4 1 Transportation 4.8.1.5 1
Source: Table B–1 in Appendix B, Subpart A of 10 CFR Part 51
The supplemental site-specific socioeconomic impact analysis for the license renewal of LSCS included a review of Exelon’s ER, scoping comments, other information records, and a data-gathering site visit to LSCS. The NRC staff did not identify any new and significant information during the review that would result in impacts that would exceed the predicted socioeconomic impacts evaluated in the GEIS, and no additional socioeconomic NEPA issues were identified beyond those listed in Table B–1. In addition, Exelon indicated in its ER that it has no plans to add non-outage workers during the license renewal term and that increased maintenance and inspection activities could be managed using the current workforce. Consequently, people living in the vicinity of LSCS are not likely to experience any changes in socioeconomic conditions during the license renewal term beyond what is currently being experienced. Therefore, the impact of continued reactor operations during the license renewal term would not exceed the socioeconomic impacts predicted in the GEIS. For these issues, the GEIS predicted that the impacts would be SMALL for all nuclear plants.
4.10.2 No-Action Alternative
4.10.2.1 Socioeconomics
Not renewing the operating license and terminating reactor operations would have a noticeable impact on socioeconomic conditions in the communities located near LSCS. The loss of jobs and income would have an immediate socioeconomic impact. Some, but not all, of the approximately 890 employees would begin to leave after reactor operations are terminated, and overall tax revenue generated by plant operations would be reduced (Exelon 2014a). Exelon pays annual property taxes to various entities to partially fund their respective operating budgets. The property tax revenue is used to fund public schools, libraries, county and local township operations, and other services. The loss of tax revenue could reduce or eliminate some public and educational services. Indirect employment and income generated by power plant operations would also be reduced. Former LSCS workers and their families could leave in search of employment elsewhere. The increase in available housing along with decreased demand could cause housing prices to fall. Since the majority of employees reside in LaSalle and Grundy Counties, socioeconomic impacts from the termination of reactor operations would be concentrated in these counties, with a corresponding reduction in purchasing activity and tax revenue in the regional economy. Income and revenue losses from the termination of reactor operations at LSCS would directly affect LaSalle County and nearby communities most reliant on income from power plant operations. The impact of the job loss, however, may not be as noticeable in local communities, given the amount of time required for decommissioning. The socioeconomic impacts from the
Environmental Consequences and Mitigating Actions
4-66
termination of nuclear plant operations (which would not entirely cease until after decommissioning) would, depending on the jurisdiction, range from SMALL to LARGE. 4.10.2.2 Transportation
Traffic congestion caused by commuting workers and truck deliveries on roads in the vicinity of LSCS would be reduced after power plant shutdown. Most of the reduction in traffic volume would be associated with the loss of jobs. The number of truck deliveries to LSCS would be reduced until decommissioning. Traffic-related transportation impacts would be SMALL as a result of the shutdown of the nuclear power plant.
4.10.3 New Nuclear Alternative
4.10.3.1 Socioeconomics
Socioeconomic impacts are defined in terms of changes to the demographic and economic characteristics and social conditions of a region. For example, the number of jobs created by the construction and operation of a power plant could affect regional employment, income, and expenditures. Two types of jobs would be created by this alternative: (1) construction jobs, which are transient, short in duration, and less likely to have a long-term socioeconomic impact, and (2) power plant operations jobs, which have the greater potential for permanent, long-term socioeconomic impacts. Workforce requirements for the construction and operation of a new nuclear power plant were evaluated to measure their possible effects on current socioeconomic conditions. The construction workforce could peak at 3,500 workers (NRC 2008a). The relative economic effect of this many workers on the local economy and tax base would vary, with the greatest impacts occurring in the communities where the majority of construction workers would reside and spend their income. As a result, local communities could experience a short-term economic “boom” from increased tax revenue and income generated by construction expenditures and the increased demand for temporary (rental) housing and public as well as commercial services. After construction, local communities could experience a return to preconstruction economic conditions. Based on this information and given the number of workers, socioeconomic impacts during construction in communities near an existing nuclear power plant or retired coal site could range from MODERATE to LARGE. Approximately 800 workers would be required during nuclear power plant operations (NRC 2008a). Some LSCS operations workers could transfer to the new nuclear power plant. Local communities near the new nuclear power plant would experience the economic benefits from increased tax revenue and income generated by operational expenditures and demand for housing and public as well as commercial services. The amount of property tax payments under the new nuclear alternative may also increase if additional land is required to support this alternative. This alternative would also result in a loss of approximately 890 relatively high-paying jobs at LSCS and a corresponding reduction in purchasing activity and revenue contributions to the regional economy. Should LSCS cease operations, there would be an immediate socioeconomic impact to local communities and businesses from the loss of jobs (some, but not all, of the 890 employees would begin to leave), and tax payments may be reduced. In addition, the housing market could experience increased vacancies and decreased prices if operations workers and their families move out of the region. The impact of the job loss, however, may not be noticeable in local communities, given the amount of time required for decommissioning of

Environmental Consequences and Mitigating Actions
4-67
the existing LSCS facilities. Based on this information and given the number of operations workers, socioeconomic impacts during nuclear power plant operations on local communities could range from SMALL to MODERATE. 4.10.3.2 Transportation
Transportation impacts associated with construction and operation of a new nuclear power plant would consist of commuting workers and truck deliveries of construction materials to the power plant site. During periods of peak construction activity, up to 3,500 workers could be commuting daily to the construction site (NRC 2008a). Workers commuting to the construction site would arrive via site access roads and the volume of traffic on nearby roads could increase substantially during shift changes. In addition to commuting workers, trucks would be transporting construction materials and equipment to the work site, thereby increasing the amount of traffic on local roads. The increase in vehicular traffic would peak during shift changes, resulting in temporary levels of service impacts and delays at intersections. Materials could also be delivered by rail or barge, depending on the location. Traffic-related transportation impacts during construction would likely range from MODERATE to LARGE. Traffic-related transportation impacts on local roads would be greatly reduced after the completion of the power plant. Approximately 800 operations workers would be commuting daily to the new nuclear power plant site (NRC 2008a). Transportation impacts would include daily commuting by the operating workforce, material deliveries, and the removal of commercial waste material to offsite disposal or recycling facilities by truck. Traffic on roadways would peak during shift changes and refueling outages, resulting in temporary levels of service impacts and delays at intersections. Overall, at the new nuclear power plant site, transportation impacts would be SMALL to MODERATE during operations.
4.10.4 IGCC Alternative
4.10.4.1 Socioeconomics
As explained in Section 4.10.3, two types of jobs would be created by this alternative: (1) construction jobs, which are transient, short in duration, and less likely to have a long-term socioeconomic impact, and (2) power plant operations jobs, which have the greater potential for permanent, long-term socioeconomic impacts. Workforce requirements for the construction and operation of a new IGCC power plant were evaluated to measure their possible effects on current socioeconomic conditions. The construction workforce could peak at 4,600 workers (DOE 2010a). The relative economic effect of this many workers on the local economy and tax base would vary, with the greatest impacts occurring in the communities where the majority of construction workers would reside and spend their income. As a result, local communities could experience a short-term economic “boom” from increased tax revenue and income generated by construction expenditures and the increased demand for temporary (rental) housing and public as well as commercial services. After construction, local communities could experience a return to preconstruction economic conditions. Based on this information and given the number of workers, socioeconomic impacts during construction in communities near an existing power plant site could range from MODERATE to LARGE. An estimated 420 workers would be required during power plant operations (DOE 2010a). Local communities would experience the economic benefits from increased tax revenue and income generated by operational expenditures and demand for housing and public as well as commercial services. The amount of property tax payments under the IGCC alternative may also increase if additional land is required to support this alternative.
Environmental Consequences and Mitigating Actions
4-68
This alternative would also result in a loss of approximately 890 relatively high-paying jobs at LSCS and a corresponding reduction in purchasing activity and revenue contributions to the regional economy. Should LSCS cease operations, there would be an immediate socioeconomic impact to local communities and businesses from the loss of jobs (some, but not all, of the 890 employees would begin to leave), and tax payments may be reduced. In addition, the housing market could experience increased vacancies and decreased prices if operations workers and their families move out of the region. The impact of the job loss, however, may not be noticeable in local communities, given the amount of time required for decommissioning the existing LSCS facilities. Based on this information and given the number of operations workers, socioeconomic impacts during IGCC power plant operations on local communities could range from SMALL to MODERATE. 4.10.4.2 Transportation
Transportation impacts associated with construction and operation of the two-unit, IGCC power plant would consist of commuting workers and truck deliveries of construction materials to the power plant site. During periods of peak construction activity, up to 4,600 workers could be commuting daily to the construction site. Workers commuting to the construction site would arrive via site access roads, and the volume of traffic on nearby roads could increase substantially during shift changes. In addition to commuting workers, trucks would be transporting construction materials and equipment to the work site, thereby increasing the amount of traffic on local roads. The increase in vehicular traffic would peak during shift changes, resulting in temporary levels of service impacts and delays at intersections. Materials could also be delivered by rail or barge, depending on location. Traffic-related transportation impacts during construction would likely range from MODERATE to LARGE. Traffic-related transportation impacts on local roads would be greatly reduced after the completion of the power plant. The estimated maximum number of operations workers commuting daily to the power plant site could be 420 (DOE 2010a). Fewer workers would be required if multiple units are operated at the same site. Frequent coal and limestone deliveries and ash removal by rail would add to the overall transportation impact. The increase in traffic on roadways would peak during shift changes, resulting in temporary levels of service impacts and delays at intersections. Onsite coal storage would make it possible to receive several trains per day at a site with rail access. If the IGCC power plant is located on navigable waters, coal and other materials could be delivered by barge. Coal and limestone delivery and ash removal via rail would cause levels of service impacts due to delays at railroad crossings. Overall, transportation impacts would be SMALL to MODERATE during IGCC power plant operations.
4.10.5 NGCC Alternative
4.10.5.1 Socioeconomics
As explained in Section 4.10.3, two types of jobs would be created by this alternative: (1) construction jobs, which are transient, short in duration, and less likely to have a long-term socioeconomic impact, and (2) power plant operations jobs, which have the greater potential for permanent, long-term socioeconomic impacts. Workforce requirements for the construction and operation of a new NGCC power plant were evaluated to measure their possible effects on current socioeconomic conditions. The construction workforce could peak at 1,783 workers (Exelon 2014a). The relative economic effect of this many workers on the local economy and tax base would vary, with the greatest impacts occurring in the communities where the majority of construction workers would reside and spend their income. As a result, local communities could experience a short-term economic

Environmental Consequences and Mitigating Actions
4-69
“boom” from increased tax revenue and income generated by construction expenditures and the increased demand for temporary (rental) housing and public as well as commercial services. After construction, local communities could experience a return to preconstruction economic conditions. Based on this information and given the number of workers, socioeconomic impacts during construction in communities near an existing power plant site could range from MODERATE to LARGE. An estimated 94 workers would be required during power plant operations (Exelon 2014a). Local communities would experience the economic benefits from increased tax revenue and income generated by operational expenditures and demand for housing and public as well as commercial services. The amount of property tax payments under the NGCC alternative may also increase if additional land is required to support this alternative. This alternative would also result in a loss of approximately 890 relatively high-paying jobs at LSCS and a corresponding reduction in purchasing activity and revenue contributions to the regional economy. Should LSCS cease operations, there would be an immediate socioeconomic impact to local communities and businesses from the loss of jobs (some, but not all, of the 890 employees would begin to leave), and tax payments may be reduced. In addition, the housing market could experience increased vacancies and decreased prices if operations workers and their families move out of the region. The impact of the job loss, however, may not be noticeable in local communities given the amount of time required for decommissioning the existing LSCS facilities. Based on this information and given the number of operations workers, socioeconomic impacts during NGCC power plant operations on local communities could range from SMALL to MODERATE. 4.10.5.2 Transportation
Transportation impacts associated with construction and operation of a five-unit, NGCC power plant would consist of commuting workers and truck deliveries of construction materials to the power plant site. During periods of peak construction activity, up to 1,783 workers could be commuting daily to the construction site. Workers commuting to the construction site would arrive via site access roads, and the volume of traffic on nearby roads could increase substantially during shift changes. In addition to commuting workers, trucks would be transporting construction materials and equipment to the work site, thus increasing the amount of traffic on local roads. The increase in vehicular traffic would peak during shift changes, resulting in temporary levels of service impacts and delays at intersections. Pipeline construction and modification of existing natural gas pipeline systems could also have a temporary impact. Materials also could be delivered by barge or rail, depending on location. Traffic-related transportation impacts during construction would likely range from MODERATE to LARGE. Traffic-related transportation impacts would be greatly reduced after completing the installation of the NGCC alternative. Transportation impacts would include daily commuting by the operating workforce, equipment and materials deliveries, and the removal of commercial waste material to offsite disposal or recycling facilities by truck. The operations workforce of 94 workers would likely not be noticeable relative to total traffic volumes on local roadways. Since fuel is transported by pipeline, the transportation infrastructure would experience little to no increased traffic from plant operations. Overall, given the relatively small operations workforce estimate of 94 workers, transportation impacts would be SMALL during power plant operations.

Environmental Consequences and Mitigating Actions
4-70
4.10.6 Combination Alternative (NGCC, Wind, Solar)
4.10.6.1 Socioeconomics
As explained in Section 4.10.3, two types of jobs would be created by this alternative: (1) construction jobs, which are transient, short in duration, and less likely to have a long-term socioeconomic impact, and (2) operations jobs, which have the greater potential for permanent, long-term socioeconomic impacts. Workforce requirements for the construction and operation of the NGCC, wind, and solar generation components of this combination alternative were evaluated to estimate their possible effects on current socioeconomic conditions. Fewer workers would be required to construct the single NGCC unit at the LSCS site than the full-power NGCC alternative. Installation of an estimated 3,376 wind turbines would likely be done in stages and could require up to 931 construction workers (NREL 2013). Additional workers would be required to install solar PV systems on existing buildings or structures at already-developed residential, commercial, or industrial sites. Similar to the wind farms, installation would likely be done in stages and could require up to 600 construction workers (DOE 2010b). Conversely, a small number of operations workers would be needed to operate the single NGCC unit and additional small numbers of workers would be required to maintain the wind farms and PV systems. Local communities could experience the economic benefits from increased tax revenue and income generated by operational expenditures and demand for housing and public as well as commercial services. The amount of property tax payments under the wind and solar PV components may also increase if additional land is required to support this combination alternative. This combination alternative would also result in a loss of approximately 890 relatively high-paying jobs at LSCS, and a corresponding reduction in purchasing activity, tax payments, and revenue contributions would occur in the surrounding regional economy. Should LSCS cease operations, there would be an immediate socioeconomic impact to local communities and businesses from the loss of jobs (some, but not all, of the 890 employees would begin to leave), and tax payments may be reduced. In addition, the housing market could experience increased vacancies and decreased prices if operations workers and their families move out of the region. The impact of the job loss, however, may not be noticeable in local communities, given the amount of time required for decommissioning of the existing LSCS facilities. Based on this information and given the relatively small numbers of construction and operations workers, socioeconomic impacts during construction and operations on local communities would be SMALL. 4.10.6.2 Transportation
Transportation impacts during the construction and operation of the NGCC unit as well as the wind and solar components of this combination alternative would be less than the impacts for any of the previous alternatives discussed. This is because the construction workforce for each component and the volume of materials and equipment needing to be transported to the respective construction site would be smaller than for any one of the individual replacement power alternatives. In other words, the transportation impacts would not be concentrated as in the other alternatives but spread out over a wider area. Workers commuting to the construction site would arrive via site access roads, and the volume of traffic on nearby roads could increase during shift changes. In addition to commuting workers, trucks would be transporting construction materials and equipment to the work site, thereby increasing the amount of traffic on local roads. The increase in vehicular traffic would peak during shift changes, resulting in temporary levels of service impacts and delays at

Environmental Consequences and Mitigating Actions
4-71
intersections. Transporting heavy and oversized components on local roads could have a noticeable impact over a large area. Some components and materials could also be delivered by rail or barge, depending on location. Traffic-related transportation impacts during construction could range from SMALL at the LSCS site and SMALL to MODERATE at the wind farms and solar installations; depending on current road capacities and average daily traffic volumes. During operations, transportation impacts would be less noticeable during shift changes and maintenance activities. Given the small numbers of operations workers, the levels of service traffic impacts on local roads from NGCC, wind farm, and solar PV operations would be SMALL.
4.10.7 Purchased Power Alternative
4.10.7.1 Socioeconomics
This alternative would result in a loss of approximately 890 relatively high-paying jobs at LSCS, and a corresponding reduction in purchasing activity, tax payments, and revenue contributions would occur in the surrounding regional economy. Should LSCS cease operations, there would be an immediate socioeconomic impact to local communities and businesses from the loss of jobs (some, but not all, of the 890 employees would begin to leave), and tax payments may be reduced. In addition, the housing market could experience increased vacancies and decreased prices if operations workers and their families move out of the region. The impact of the job loss, however, may not be noticeable in local communities, given the amount of time required for decommissioning of the existing LSCS facilities. Purchased power from existing power generating facilities would not have any socioeconomic impact, because there would be no change in power plant operations or workforce. If the amount of purchased power exceeds the available supply, new electrical power generating facilities would be needed. Construction and operation of a new electrical power generating facility to supply purchased power could cause noticeable socioeconomic impacts in the communities located near the new facility. The intensity of the impact would depend on the number of workers required to build and operate the new electrical power generating facility and the amount of increased demand for housing and public services. This alternative would also result in a loss of approximately 890 relatively high-paying jobs at LSCS, and a corresponding reduction in purchasing activity, tax payments, and revenue contributions would occur in the surrounding regional economy. Should LSCS cease operations, there would be an immediate socioeconomic impact to local communities and businesses from the loss of jobs (some, but not all, of the 890 employees would begin to leave), and tax payments may be reduced. In addition, the housing market could experience increased vacancies and decreased prices if operations workers and their families move out of the region. The impact of the job loss, however, may not be noticeable in local communities, given the amount of time required for decommissioning of the existing LSCS facilities. Therefore, the extent of the socioeconomic impact would depend on whether a new electrical power generating facility was needed to supply purchased power. If a new power generating facility is needed, socioeconomic impacts would range anywhere from SMALL to LARGE. 4.10.7.2 Transportation
Purchased power from existing power generating facilities would not have any transportation impact, because there would be no change in power plant operations or workforce. If necessary, construction and operation of a new electrical power generating facility could cause noticeable transportation impacts, depending on the number of workers and truck deliveries required to build and operate the new electrical power generating facility. Consequently, traffic

Environmental Consequences and Mitigating Actions
4-72
volumes could increase noticeably on local roads near the new power plant site during shift changes. The extent of the transportation impact would depend on whether a new electrical power generating facility were needed to supply purchased power. If a new power generating facility is needed, transportation impacts would range anywhere from SMALL to LARGE.
4.11 Human Health
This section describes the potential impacts of the proposed action (license renewal) and alternatives to the proposed action on human health resources.
4.11.1 Proposed Action
Section 3.11 describes the human health resources associated with LSCS. Table 4–12 identifies the human health resource issues applicable to LSCS during the license renewal term.
Table 4–12. Human Health Issues
Issue GEIS Section Category Radiation exposures to the public 4.9.1.1.1 1 Radiation exposures to plant workers 4.9.1.1.1 1 Human health impact from chemicals 4.9.1.1.2 1 Microbiological hazards to the public (plants with cooling ponds or canals or cooling towers that discharge to a river)
4.9.1.1.3 2
Microbiological hazards to plant workers 4.9.1.1.3 1 Chronic effects of electromagnetic fields (EMFs)(a) 4.9.1.1.4 N/A(b) Physical occupational hazards 4.9.1.1.5 1 Electric shock hazards(a) 4.9.1.1.5 2 (a) This issue applies only to the in-scope portion of electric power transmission lines, which are defined as
transmission lines that connect the nuclear power plant to the substation where electricity is fed into the regional power distribution system and transmission lines that supply power to the nuclear plant from the grid.
(b) N/A (not applicable) The categorization and impact finding definition does not apply to this issue.
Source: Table B–1 in Appendix B, Subpart A, to 10 CFR Part 51
4.11.1.1 Normal Operating Conditions
Generic Human Health Issues (Category 1) The NRC staff did not identify any new and significant information during its review of Exelon’s ER (Exelon 2014a), the site audit, or the scoping process for the Category 1 issues listed in Table 4–12. Therefore, there are no impacts related to these issues beyond those discussed in the GEIS. For these Category 1 issues, the GEIS concluded that the impacts are SMALL and, thus, the impacts associated with these issues for the LSCS license renewal are SMALL. Chronic Effects of Electromagnetic Fields (EMFs)
In the GEIS (NRC 2013d), the chronic effects of 60-Hz electromagnetic fields (EMFs) from power lines were not designated as Category 1 or 2 and will not be until a scientific consensus is reached on the health implications of these fields.

Environmental Consequences and Mitigating Actions
4-73
The potential for chronic effects from these fields continues to be studied and is not known at this time. The National Institute of Environmental Health Sciences (NIEHS) directs related research through DOE. The report by NIEHS (NIEHS 1999) contains the following conclusion:
The NIEHS concludes that ELF-EMF (extremely low frequency-electromagnetic field) exposure cannot be recognized as entirely safe because of weak scientific evidence that exposure may pose a leukemia hazard. In our opinion, this finding is insufficient to warrant aggressive regulatory concern. However, because virtually everyone in the United States uses electricity and therefore is routinely exposed to ELF-EMF, passive regulatory action is warranted such as continued emphasis on educating both the public and the regulated community on means aimed at reducing exposures. The NIEHS does not believe that other cancers or non-cancer health outcomes provide sufficient evidence of a risk to currently warrant concern.
This statement is not sufficient to cause the NRC staff to change its position with respect to the chronic effects of EMFs. The NRC staff considers the GEIS finding of “UNCERTAIN” still appropriate and will continue to follow developments on this issue. Site-Specific Human Health Issues (Category 2) Microbiological Hazards to the Public
In the GEIS (NRC 2013d), the NRC staff determined that effects of thermophilic microorganisms on the public for plants using cooling ponds, lakes, or canals or cooling towers that discharge to a river is a Category 2 issue (see Table 4–12) that requires site-specific evaluation during each license renewal review. In order to determine whether the continued operations of LSCS could promote increased growth of thermophilic microorganisms and thus have an adverse effect on the public, the NRC staff considered several factors: the thermophilic microorganisms of concern, LSCS’s thermal effluent characteristics, Exelon’s chlorination procedures, recreational use of the LSCS cooling pond and the Illinois River, and input from the Illinois Environmental Protection Agency (IEPA) and Illinois Department of Public Health (IDPH). Section 3.11.3 describes the thermophilic microorganisms that the GEIS identified to be of potential concern at nuclear power plants and summarizes data from the Centers for Disease Control and Prevention (CDC) on the prevalence of waterborne diseases associated with these microorganisms that have been linked to recreational water from 2002 through 2011. CDC data indicate that no outbreaks or cases of waterborne Salmonella or Pseudomonas aeruginosa infection from recreational waters have occurred in the United States during this time frame. Shigella and Naegleria fowleri infections linked to exposure in recreational waters were rarely reported, and none of the reported cases occurred in Illinois. Public exposure to aerosolized Legionella from nuclear plant operations is generally not a concern because such exposure would be confined to a small area of the site to which the public would not have access. In the case of LSCS, which does not have cooling towers, exposure of workers to Legionella is unlikely. Based on the information presented in Section 3.11.3, the thermophilic organisms most likely to be of potential concern at Illinois are Shigella and N. fowleri. LSCS’s circulating water system and two service water systems discharge heated water to the site’s artificial cooling pond through a discharge canal. LSCS also continuously discharges blowdown to the Illinois River, and this discharge is subject to the limitations set forth in the site’s NPDES permit (IEPA 2013). The permit requires monitoring and reporting of the average monthly and daily maximum rates of blowdown discharges to the river (Outfall 001), as further

Environmental Consequences and Mitigating Actions
4-74
described in Section 3.5.1.3 of this SEIS (Exelon 2014a). Sections 3.1.3 and 3.5.1 describe the cooling system and surface water characteristics, respectively. The temperature in the cooling pond is generally below the optimal growth temperature of both Shigella and N. fowleri (95 to 106 °F (35 to 41 °C)). From 2001 through 2014, there have been a few periods during summer months that the temperatures in the cooling pond exceeded 95 °F (35 °C) (Exelon 2015b). Although these temperatures could reasonably enhance survival or growth of Shigella and N. fowleri, the short duration and periodicity of these temperatures are unlikely to have produced a measurable effect on the Shigella and N. fowleri population, if present in the pond. For blowdown to the Illinois River, Special Condition 3 of the NPDES permit limits the maximum temperature rise above ambient conditions and maximum water temperatures at Outfall 001. This condition stipulates that, at the edge of the thermal mixing zone, discharges from Outfall 001 shall not cause the Illinois River water to rise above natural temperatures by more than 2.8 °C (5 °F). The temperature beyond the mixing zone cannot exceed specified monthly limits for longer than 1 percent (i.e., 87.6 hours) of any 12-month period and cannot at any time exceed the specified monthly limit by more than 1.7 °C (3 °F). During the months of April through November, the calculated temperature outside the mixing zone cannot exceed 93 °F (34 °C). These limits are consistent with Title 35, Environmental Protection, Section 302, “Water Quality Standards,” of the IAC, which stipulates that, for thermal effluents, the maximum temperature rise shall not exceed 2.8 °C (5 °F) above natural receiving water body temperatures and that the water temperature at representative locations in the main river shall at no time exceed 33.7 °C (93 °F) from April through November and 17.7 °C (63 °F) in other months (35 IAC 302.211). These temperature limits in the NPDES permits are below the optimal growth temperature for both Shigella and N. fowleri, and thus, would not enhance the growth or survival of these thermophilic organisms, if present in Illinois River water. In addition to temperature limitations, the IAC prohibits the area and volume of thermal mixing from being more than 25 percent of the cross-sectional area or volume of stream flow (35 IAC 302.102). The NRC (1978) determined that LSCS’s thermal mixing zone meets the IAC’s criteria: the surface area of the thermal mixing zone was estimated to be 2,500 m2 (27,000 ft2) in March to 400 m2 (4,300 ft2) in July, which would cover approximately 8 to 9 percent of the river. Thus, the IAC’s thermal mixing limitations effectively minimize the area and volume over which microorganisms could experience enhanced growth or survival in the Illinois River near the LSCS discharge. Chlorine is an effective disinfectant for water containing the microorganisms of concern. The EPA (1999a) reports that chlorination at concentrations of 1 to 2 milligrams per liter (mg/L) in water at a pH of 6.0 to 8.0 can effectively eliminate health hazards caused by bacteria, including Shigella. The CDC (CDC 2013) reports that chlorine at a concentration of 1 part per million ((ppm) (1 mg/L)) added to 77 °F (25 °C) clear water at a pH of 7.5 will reduce the number of viable N. fowleri trophozoites by 99.99 percent in 12 minutes. Exelon treats water entering the circulating water system and service water systems with sodium hypochlorite to control biofouling (Exelon 2014a). Water discharged to the Illinois River may not contain more than an instantaneous maximum concentration of 0.2 mg/L of residual chlorine or 0.05 mg/L of residual oxides, as measured at Outfall 001, per Special Condition 4 of the NPDES permit (IEPA 2013). Chlorination of the system is likely to prevent some increased growth and survival of microorganisms that might otherwise result from operation of LSCS. Both the cooling pond and the Illinois River are used for recreational purposes. The cooling pond is part of the LaSalle Lake State Fish and Wildlife Area, which Exelon and the IDNR jointly manage. It is generally open to the public from mid-March until mid-October (Exelon 2014a).

Environmental Consequences and Mitigating Actions
4-75
Portions of the cooling pond within the exclusion zone, which includes the essential cooling pond, are off limits to the public (Exelon 2014a). Swimming, wading, water skiing, and use of non-motorized boats are prohibited at LaSalle Lake (IDNR 2015b), which further reduces the potential for human exposure to the microorganisms of concern, if present in the cooling pond. As discussed above, LSCS’s thermal mixing zone in the Illinois River is relatively small (0.1 ha (0.22 ac)), and the temperature limitations set forth in the NPDES permit are lower than those that would promote increased growth or survival of thermophilic microorganisms. In accordance with the IAC, the discharge is not located near any public access areas because thermal mixing is prohibited “in water adjacent to bathing beaches, bank fishing areas, boat ramps or dockages or any other public access area” (35 IAC 302.102(b)(3)). Given the small area of thermally altered waters and the unlikelihood of the water to create conditions favorable to thermophilic microorganisms, exposure of recreational Illinois River users to elevated concentrations of the microorganisms of concern is unlikely. The environmental standard review plan for license renewal directs the NRC staff to consult with the State public health department regarding concerns about the potential for waterborne disease outbreaks associated with license renewal. In response to RAIs, Exelon (2015b) included copies of correspondence between Exelon and IDPH and IEPA regarding this issue. Exelon requested information from IEPA and IDPH on the potential increase in adverse effects on public health from exposure to N. fowleri or any other thermophilic pathogen in the Illinois River. In response, IEPA and IDPH each indicated that its staff does not have the expertise necessary to adequately evaluate Exelon’s assessment (IEPA 2014a; IDPH 2014). Accordingly, the NRC staff did not separately contact the IDPH or IEPA during its license renewal review. Conclusion The thermophilic microorganisms Shigella and N. fowleri have been linked to waterborne outbreaks in recreational waters within the United States. However, based on these microorganisms’ temperature tolerances, Shigella and N. fowleri are unlikely to be present in the vicinity of LSCS. Additionally, Exelon’s chlorination procedures and the small thermal mixing zones in the cooling pond and Illinois River make exposure of recreational water users to elevated levels of these microorganisms unlikely. The NRC staff concludes that the impacts of thermophilic microorganisms on the public are SMALL for LSCS license renewal. Electric Shock Hazards
Based on the GEIS, the Commission found that electric shock resulting from direct access to energized conductors or from induced charges in metallic structures has not been found to be a problem at most operating plants and generally is not expected to be a problem during the license renewal term. However, a site-specific review is required to determine the significance of the electric shock potential along the portions of the transmission lines that are within the scope of this SEIS. As discussed in Section 3.11.4, there are no offsite transmission lines that are in scope for this SEIS. Therefore, there are no potential impacts to members of the public. As discussed in Section 3.11.5, LSCS maintains an occupational safety program in accordance with the Occupational Safety and Health Administration regulations for its workers, which includes protection from acute electric shock. Therefore, the NRC staff concludes that the potential impacts from acute electric shock during the license renewal term would be SMALL.
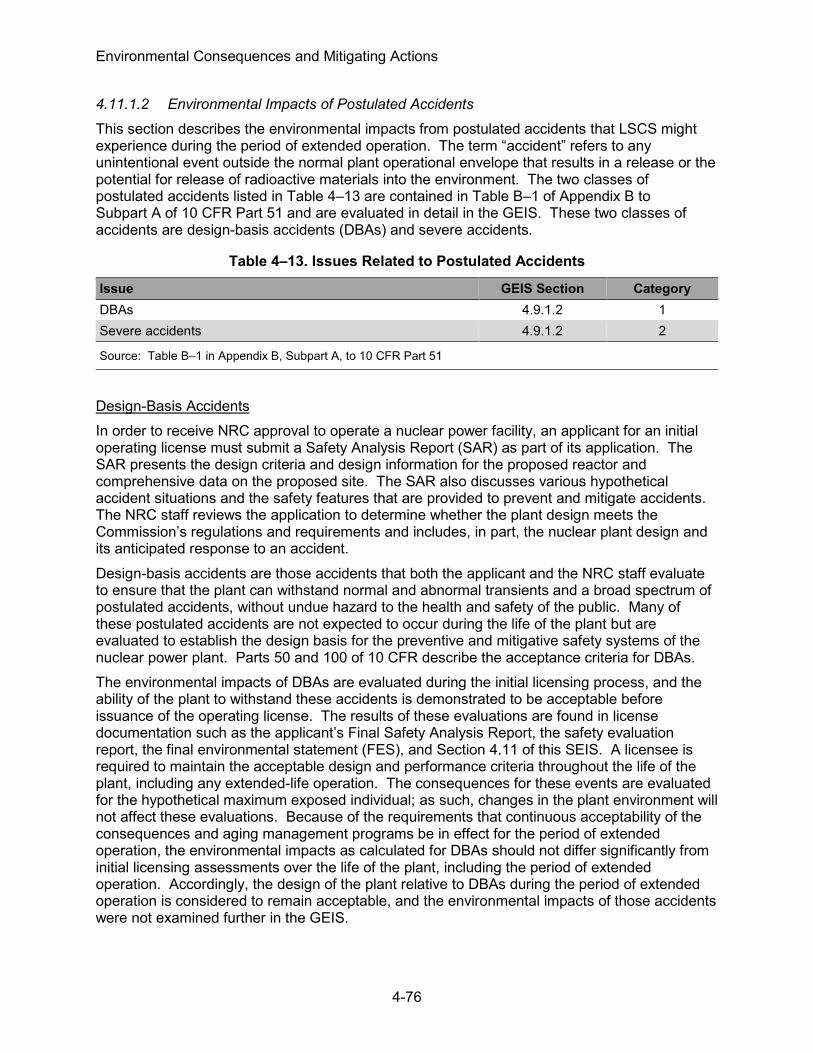
Environmental Consequences and Mitigating Actions
4-76
4.11.1.2 Environmental Impacts of Postulated Accidents
This section describes the environmental impacts from postulated accidents that LSCS might experience during the period of extended operation. The term “accident” refers to any unintentional event outside the normal plant operational envelope that results in a release or the potential for release of radioactive materials into the environment. The two classes of postulated accidents listed in Table 4–13 are contained in Table B–1 of Appendix B to Subpart A of 10 CFR Part 51 and are evaluated in detail in the GEIS. These two classes of accidents are design-basis accidents (DBAs) and severe accidents.
Table 4–13. Issues Related to Postulated Accidents
Issue GEIS Section Category DBAs 4.9.1.2 1 Severe accidents 4.9.1.2 2
Source: Table B–1 in Appendix B, Subpart A, to 10 CFR Part 51
Design-Basis Accidents In order to receive NRC approval to operate a nuclear power facility, an applicant for an initial operating license must submit a Safety Analysis Report (SAR) as part of its application. The SAR presents the design criteria and design information for the proposed reactor and comprehensive data on the proposed site. The SAR also discusses various hypothetical accident situations and the safety features that are provided to prevent and mitigate accidents. The NRC staff reviews the application to determine whether the plant design meets the Commission’s regulations and requirements and includes, in part, the nuclear plant design and its anticipated response to an accident. Design-basis accidents are those accidents that both the applicant and the NRC staff evaluate to ensure that the plant can withstand normal and abnormal transients and a broad spectrum of postulated accidents, without undue hazard to the health and safety of the public. Many of these postulated accidents are not expected to occur during the life of the plant but are evaluated to establish the design basis for the preventive and mitigative safety systems of the nuclear power plant. Parts 50 and 100 of 10 CFR describe the acceptance criteria for DBAs. The environmental impacts of DBAs are evaluated during the initial licensing process, and the ability of the plant to withstand these accidents is demonstrated to be acceptable before issuance of the operating license. The results of these evaluations are found in license documentation such as the applicant’s Final Safety Analysis Report, the safety evaluation report, the final environmental statement (FES), and Section 4.11 of this SEIS. A licensee is required to maintain the acceptable design and performance criteria throughout the life of the plant, including any extended-life operation. The consequences for these events are evaluated for the hypothetical maximum exposed individual; as such, changes in the plant environment will not affect these evaluations. Because of the requirements that continuous acceptability of the consequences and aging management programs be in effect for the period of extended operation, the environmental impacts as calculated for DBAs should not differ significantly from initial licensing assessments over the life of the plant, including the period of extended operation. Accordingly, the design of the plant relative to DBAs during the period of extended operation is considered to remain acceptable, and the environmental impacts of those accidents were not examined further in the GEIS.

Environmental Consequences and Mitigating Actions
4-77
The Commission has generically determined that the environmental impacts of DBAs are of SMALL significance for all plants because the plants were designed to successfully withstand these accidents. Therefore, for the purposes of license renewal, DBAs are designated as a Category 1 issue. The early resolution of the DBAs makes them a part of the current licensing basis of the plant; the current licensing basis of the plant is to be maintained by the licensee under its current license and, therefore, under the provisions of 10 CFR 54.30, is not subject to review under license renewal. No new and significant information related to DBAs was identified during the review of the LSCS ER (Exelon 2014a), the site audit, the scoping process, or evaluation of other available information. Therefore, there are no impacts related to these issues beyond those discussed in the GEIS. Severe Accidents Severe nuclear accidents are those that are more severe than DBAs because they could result in substantial damage to the reactor core, whether or not there are serious offsite consequences. In the GEIS, the NRC staff assessed the effects of severe accidents during the period of extended operation, using the results of existing analyses and site-specific information to conservatively predict the environmental impacts of severe accidents for each plant during the period of extended operation. Severe accidents initiated by external phenomena such as tornadoes, floods, earthquakes, fires, and sabotage have not traditionally been discussed in quantitative terms in FESs and were not specifically considered for the LSCS site in the GEIS (NRC 1996). However, the GEIS did evaluate existing impact assessments performed by the NRC and by the industry at 44 nuclear plants in the United States and concluded that the risk from beyond-design-basis earthquakes at existing nuclear power plants is SMALL. The GEIS for license renewal performed a discretionary analysis of terrorist acts in connection with license renewal and concluded that the core damage and radiological release from such acts would be no worse than the damage and release expected from internally initiated events. In the GEIS, the Commission concludes that the risk from sabotage and beyond-design-basis earthquakes at existing nuclear power plants is small and, additionally, that the risks from other external events are adequately addressed by a generic consideration of internally initiated severe accidents (NRC 1996, 2013a). Based on information in the GEIS, the staff found the following to be true:
The probability weighted consequences of atmospheric releases, fallout onto open bodies of water, releases to ground water, and societal and economic impacts from severe accidents are small for all plants. However, alternatives to mitigate severe accidents must be considered for all plants that have not considered such alternatives.
The NRC staff identified no new and significant information related to postulated accidents during the review of Exelon’s ER for LSCS (Exelon 2014a), the site audit, the scoping process, or evaluation of other available information. Therefore, there are no impacts related to these issues beyond those discussed in the GEIS. However, in accordance with 10 CFR 51.53(c)(3)(ii)(L), the staff has reviewed severe accident mitigation alternatives (SAMAs) for LSCS. Severe Accident Mitigation Alternatives If the NRC staff has not previously considered SAMAs for the applicant’s plant in an environmental impact statement or related supplement or in an environmental assessment, 10 CFR 51.53(c)(3)(ii)(L) requires license renewal applicants to consider alternatives to mitigate

Environmental Consequences and Mitigating Actions
4-78
severe accidents. The purpose of this consideration is to ensure that plant changes (i.e., hardware, procedures, and training) with the potential for improving severe accident safety performance are identified and evaluated. If a SAMA determined to be potentially cost beneficial is not related to adequately managing the effects of aging during the period of extended operation, then it is not required to be implemented as part of the license renewal process pursuant to 10 CFR Part 54. The NRC staff has not previously considered SAMAs for LSCS; therefore, the following addresses alternatives to mitigate severe accidents. Overview of SAMA Process
This section presents a summary of the SAMA evaluation for LSCS, as described in the ER (Exelon 2014a) and responses to requests for additional information (RAIs) (Exelon 2015h), and the NRC staff’s review of this information. The NRC staff performed its review with contract assistance from the Center for Nuclear Waste Regulatory Analyses. Appendix F to this SEIS provides the NRC staff’s detailed review, and Appendix F to Exelon’s ER provides Exelon’s LSCS SAMA evaluation. The SAMA evaluation for LSCS conducted by Exelon contained the following main components:
(1) Exelon quantified the level of risk associated with potential reactor accidents using the plant-specific probabilistic risk assessment (PRA) and other risk models.
(2) Exelon examined the major risk contributors and identified possible ways (SAMAs) of reducing that risk. Common ways of reducing risk are changes to components, systems, procedures, and training.
(3) Exelon screened out SAMA candidates that are not applicable to the LSCS plant design or are of low benefit in boiling water reactors (BWRs) such as LSCS, as well as candidates that have already been implemented at LSCS or whose benefits have been achieved at LSCS using other means.
(4) Exelon estimated the costs of implementing the unscreened SAMA candidates, and those whose estimated implementation cost exceeded the maximum possible averted cost risk were also screened out.
(5) Exelon estimated how much each remaining unscreened SAMA could reduce risk. Referred to as potential benefits of implementing each SAMA, those estimates were developed in terms of dollars in accordance with NRC guidance for performing regulatory analyses. Exelon compared the implementation cost with the benefit of each remaining unscreened SAMA candidate to determine whether it was potentially cost beneficial (the benefits of the SAMA exceeded its cost). Sensitivity analyses were then performed by Exelon to quantify effects on the cost-benefit evaluation.
Estimate of Risk
Exelon submitted an assessment of SAMAs for LSCS in Appendix F of the ER (Exelon 2014a). The assessment was based on the most recent LSCS PRA available at that time, a plant-specific offsite consequence analysis performed using the MELCOR Accident Consequence Code System 2 (MACCS2) Version 1.13.1 computer code, and insights from the combined individual plant examination (IPE) and individual plant examination of external events (IPEEE) for LSCS (Commonwealth Edison Company (CECO) 1994). Exelon combined two distinct analyses to form the basis for estimating risk in the SAMA analysis: (1) LSCS Level 1 and Level 2 PRA models and (2) a supplemental analysis of offsite consequences and economic impacts (essentially a Level 3 PRA model) developed specifically for the SAMA analysis. The Level 1 model is a significant upgrade and revision to the IPE
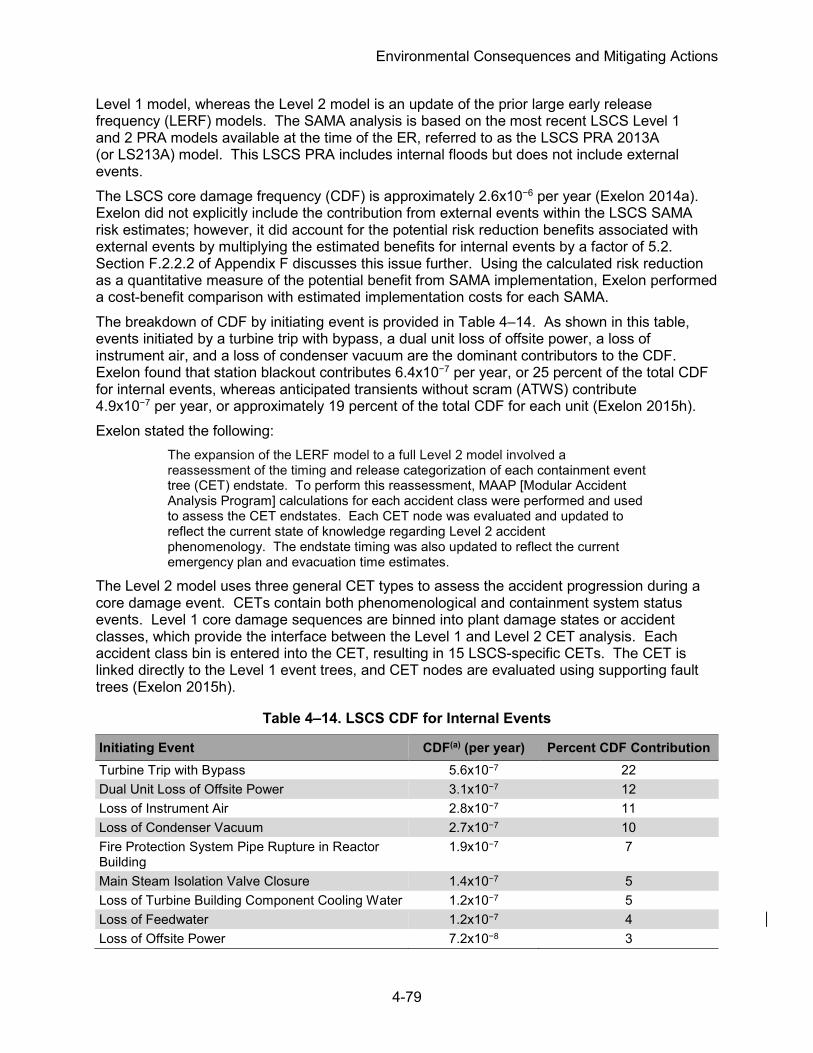
Environmental Consequences and Mitigating Actions
4-79
Level 1 model, whereas the Level 2 model is an update of the prior large early release frequency (LERF) models. The SAMA analysis is based on the most recent LSCS Level 1 and 2 PRA models available at the time of the ER, referred to as the LSCS PRA 2013A (or LS213A) model. This LSCS PRA includes internal floods but does not include external events. The LSCS core damage frequency (CDF) is approximately 2.6x10⁻⁶ per year (Exelon 2014a). Exelon did not explicitly include the contribution from external events within the LSCS SAMA risk estimates; however, it did account for the potential risk reduction benefits associated with external events by multiplying the estimated benefits for internal events by a factor of 5.2. Section F.2.2.2 of Appendix F discusses this issue further. Using the calculated risk reduction as a quantitative measure of the potential benefit from SAMA implementation, Exelon performed a cost-benefit comparison with estimated implementation costs for each SAMA. The breakdown of CDF by initiating event is provided in Table 4–14. As shown in this table, events initiated by a turbine trip with bypass, a dual unit loss of offsite power, a loss of instrument air, and a loss of condenser vacuum are the dominant contributors to the CDF. Exelon found that station blackout contributes 6.4x10⁻⁷ per year, or 25 percent of the total CDF for internal events, whereas anticipated transients without scram (ATWS) contribute 4.9x10⁻⁷ per year, or approximately 19 percent of the total CDF for each unit (Exelon 2015h). Exelon stated the following:
The expansion of the LERF model to a full Level 2 model involved a reassessment of the timing and release categorization of each containment event tree (CET) endstate. To perform this reassessment, MAAP [Modular Accident Analysis Program] calculations for each accident class were performed and used to assess the CET endstates. Each CET node was evaluated and updated to reflect the current state of knowledge regarding Level 2 accident phenomenology. The endstate timing was also updated to reflect the current emergency plan and evacuation time estimates.
The Level 2 model uses three general CET types to assess the accident progression during a core damage event. CETs contain both phenomenological and containment system status events. Level 1 core damage sequences are binned into plant damage states or accident classes, which provide the interface between the Level 1 and Level 2 CET analysis. Each accident class bin is entered into the CET, resulting in 15 LSCS-specific CETs. The CET is linked directly to the Level 1 event trees, and CET nodes are evaluated using supporting fault trees (Exelon 2015h).
Table 4–14. LSCS CDF for Internal Events
Initiating Event CDF(a) (per year) Percent CDF Contribution Turbine Trip with Bypass 5.6x10⁻⁷ 22 Dual Unit Loss of Offsite Power 3.1x10⁻⁷ 12 Loss of Instrument Air 2.8x10⁻⁷ 11 Loss of Condenser Vacuum 2.7x10⁻⁷ 10 Fire Protection System Pipe Rupture in Reactor Building
1.9x10⁻⁷ 7
Main Steam Isolation Valve Closure 1.4x10⁻⁷ 5 Loss of Turbine Building Component Cooling Water 1.2x10⁻⁷ 5 Loss of Feedwater 1.2x10⁻⁷ 4 Loss of Offsite Power 7.2x10⁻⁸ 3

Environmental Consequences and Mitigating Actions
4-80
Initiating Event CDF(a) (per year) Percent CDF Contribution Manual Shutdown 5.9x10⁻⁸ 2 Inadvertently Open Relief Valve 5.9x10⁻⁸ 2 Loss of 125-V Direct-Current Bus 2A 5.1x10⁻⁸ 2 Loss of 125-V Direct-Current Buses 2A and 2B 3.9x10⁻⁸ 2 Other Initiating Events(b) 3.3x10⁻⁷ 13 Total (Internal Events)(c) 2.58x10⁻⁶ 100 (a) CDF is based on Fussell-Vesely importance and total CDF. (b) For “Other Initiating Events,” each event would contribute less than 2 percent to the total CDF. (c) Column totals may be different because of rounding.
Key: CDF = core damage frequency, and V = volt(s).
Source: Exelon 2014a
The result of the Level 2 PRA is a set of 13 release bins or categories with their respective frequency and release characteristics. The results of this analysis for LSCS are provided in Tables F.2–5, F.2–6, F.3–15, F.3–16, and F.3–19 of the ER (Exelon 2014a). The categories were defined based on the timing of release (three release time ranges) and the magnitude of release (four release magnitude ranges). One additional release category was included for an intact containment. For use in the SAMA analysis, the release category for high magnitude and early timing was divided into two bins (one with containment isolation and one without such isolation). Due to the small release category contributions from six categories, the number of release category bins was reduced to eight cases. The frequency of each release category was obtained by summing the frequency of the individual accident progression CET endpoints binned into the release category. Source terms were developed for each of the 13 release categories using the results of MAAP Version 4.0.5 computer code calculations (Exelon 2014a). Exelon computed offsite consequences for potential releases of radiological material using the MACCS2 Version 1.13.1 code and analyzed exposure and economic impacts from its determination of offsite and onsite risks. Inputs for these analyses include plant-specific and site-specific input values for core radionuclide inventory, source term and release characteristics, site meteorological data, projected population distribution and growth within a 50-mi (80-km) radius, emergency response evacuation modeling, and economic data. The estimation of onsite impacts (in terms of cleanup costs, decontamination costs, and occupational dose) is based on guidance in NUREG/BR–0184, Regulatory Analysis Technical Evaluation Handbook (NRC 1997). In its calculation for replacement power costs, Exelon accounted for the increased electric power output of LSCS compared to the generic reactor power output presented in NUREG/BR–0184 (NRC 1997). In the ER, as updated by Exelon’s response to RAIs from the NRC staff (Exelon 2015h), Exelon estimated the dose risk to be 0.0764 person-sievert (Sv) per year (7.64 person-rem per year) to the population within 50 mi (80 km) of the LSCS site. The offsite economic cost risk was calculated to be $57,700 per year. Table 4–15 summarizes the breakdown of the population dose risk by containment release mode. The medium-magnitude intermediate release category accounted for 52 and 62 percent of the population dose risk and offsite economic cost risk, respectively. Additionally, two categories (1) medium-magnitude early release and (2) high-magnitude early release for breaks outside containment) together accounted for

Environmental Consequences and Mitigating Actions
4-81
approximately 41 and 31 percent of the population dose risk and offsite economic cost risk, respectively. The NRC staff has reviewed Exelon’s data and evaluation methods and concludes that the quality of the risk analyses is adequate to support an assessment of the risk reduction potential for candidate SAMAs. Accordingly, the staff based its assessment of offsite risk on the CDFs and offsite doses reported by Exelon. Potential Plant Improvements
Exelon considered potential plant improvements (SAMAs) that addressed the major contributors to CDF and release frequency at LSCS and considered SAMA candidates from six other boiling water reactor (BWR) plants, as follows:
(1) Susquehanna Steam Electric Station; (2) Cooper Nuclear Station; (3) Duane Arnold Energy Center; (4) Nine Mile Point, Unit 2; (5) Columbia Generating Station; and (6) Grand Gulf Nuclear Station.
Exelon identified potential plant improvements by reviewing the following:
• LSCS PRA results and PRA group insights;
• Potentially cost-effective Phase 2 SAMAs from the following:
− Susquehanna Steam Electric Station SAMA analysis;
− Cooper Nuclear Station SAMA analysis;
− Duane Arnold Energy Center SAMA analysis;
− Nine Mile Point, Unit 2, SAMA analysis;
− Columbia Generating Station SAMA analysis; and
− Grand Gulf Nuclear Station SAMA analysis;
• LSCS IPE; and
• LSCS IPEEE.
Table 4–15. Base Case Mean Population Dose Risk and Offsite Economic Cost Risk for Internal Events
Release Mode Population Dose Risk(a) Offsite Economic Cost Risk
ID(b) Frequency (per year) person-rem/yr % Contribution $/yr % Contribution
H/E–BOC(c) 8.3x10‒8 1.3x100 18 7.2x10³ 13 H/E 6.0x10‒8 3.2x10‒1 4 2.8x10³ 5 H/I(d) 1.9x10‒8 1.1x10‒1 1 9.7x10² 2 M/E 2.4x10‒7 1.7x100 23 1.0x10⁴ 18 M/I(d) 1.0x10‒6 3.9x100 52 3.6x10⁴ 62
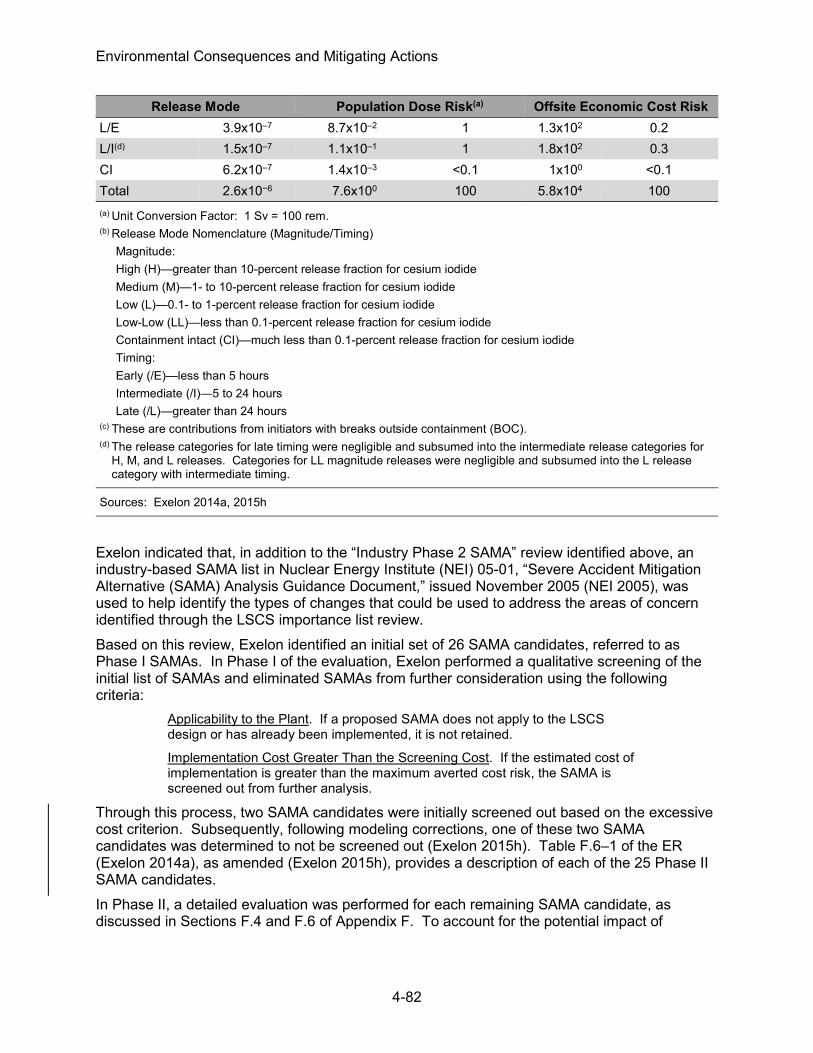
Environmental Consequences and Mitigating Actions
4-82
Release Mode Population Dose Risk(a) Offsite Economic Cost Risk L/E 3.9x10‒7 8.7x10‒2 1 1.3x10² 0.2 L/I(d) 1.5x10‒7 1.1x10‒1 1 1.8x10² 0.3 CI 6.2x10‒7 1.4x10‒3 <0.1 1x100 <0.1 Total 2.6x10⁻⁶ 7.6x100 100 5.8x10⁴ 100 (a) Unit Conversion Factor: 1 Sv = 100 rem. (b) Release Mode Nomenclature (Magnitude/Timing)
Magnitude: High (H)—greater than 10-percent release fraction for cesium iodide Medium (M)—1- to 10-percent release fraction for cesium iodide Low (L)—0.1- to 1-percent release fraction for cesium iodide Low-Low (LL)—less than 0.1-percent release fraction for cesium iodide Containment intact (CI)—much less than 0.1-percent release fraction for cesium iodide Timing: Early (/E)—less than 5 hours Intermediate (/I)—5 to 24 hours Late (/L)—greater than 24 hours
(c) These are contributions from initiators with breaks outside containment (BOC). (d) The release categories for late timing were negligible and subsumed into the intermediate release categories for
H, M, and L releases. Categories for LL magnitude releases were negligible and subsumed into the L release category with intermediate timing.
Sources: Exelon 2014a, 2015h
Exelon indicated that, in addition to the “Industry Phase 2 SAMA” review identified above, an industry-based SAMA list in Nuclear Energy Institute (NEI) 05-01, “Severe Accident Mitigation Alternative (SAMA) Analysis Guidance Document,” issued November 2005 (NEI 2005), was used to help identify the types of changes that could be used to address the areas of concern identified through the LSCS importance list review. Based on this review, Exelon identified an initial set of 26 SAMA candidates, referred to as Phase I SAMAs. In Phase I of the evaluation, Exelon performed a qualitative screening of the initial list of SAMAs and eliminated SAMAs from further consideration using the following criteria:
Applicability to the Plant. If a proposed SAMA does not apply to the LSCS design or has already been implemented, it is not retained.
Implementation Cost Greater Than the Screening Cost. If the estimated cost of implementation is greater than the maximum averted cost risk, the SAMA is screened out from further analysis.
Through this process, two SAMA candidates were initially screened out based on the excessive cost criterion. Subsequently, following modeling corrections, one of these two SAMA candidates was determined to not be screened out (Exelon 2015h). Table F.6–1 of the ER (Exelon 2014a), as amended (Exelon 2015h), provides a description of each of the 25 Phase II SAMA candidates. In Phase II, a detailed evaluation was performed for each remaining SAMA candidate, as discussed in Sections F.4 and F.6 of Appendix F. To account for the potential impact of

Environmental Consequences and Mitigating Actions
4-83
external events, the estimated benefits based on internal events were multiplied by a factor of 5.2, as discussed in Section F.2.2.2 of Appendix F. Evaluation of Risk Reduction and Costs of Improvements
Exelon evaluated the risk-reduction potential of the 25 SAMAs retained for the Phase II evaluation in a revised analysis (Exelon 2015h). The SAMA evaluations were generally performed by Exelon in a realistic or slightly conservative fashion that overestimates the benefit of the SAMA. In most cases, the failure likelihood of the added equipment is taken to be optimistically low, thereby overestimating the benefit of the SAMA. Other cases assumed that the SAMA eliminated all the risk associated with the proposed enhancement. The NRC staff notes that this bounding approach overestimates the benefit and is conservative. Exelon used model requantification to determine the potential benefits for each of the SAMAs. The CDFs, population dose reductions, and offsite economic cost reductions were estimated using the LSCS PRA model. The changes made to the model to quantify the impact of each SAMA are described in Section F.6 of the ER. Table 4–16 summarizes the assumptions used to estimate the risk reduction for each potentially cost-beneficial SAMA, the estimated risk reduction in terms of CDF percent reduction, population dose, offsite economic cost, and the estimated total benefit (present value) of the averted risk. The determination of the benefits for the various SAMAs is further discussed in Section F.6 of Appendix F. The NRC staff reviewed the assumptions used in evaluating the benefit or risk reduction estimate of each SAMA, as described in the Section F.6 of the ER. The resolution of RAIs that resulted from this review is discussed in Section F.4 of Appendix F. The determination of the benefits for the various SAMAs is further discussed in Section F.6 of Appendix F. Exelon estimated the costs of implementing the 25 Phase II SAMAs through the use of other licensees’ estimates for similar improvements and the development of site-specific cost estimates, where appropriate. SAMA cost estimates were based on initial hardware, installation, and implementation costs. In response to an NRC staff RAI to provide further information as to what was included in the LSCS cost estimates, Exelon explained that maintenance and testing costs during the license renewal period were conservatively not included in the estimate (Exelon 2015h). The NRC staff reviewed the applicant’s cost estimates presented in Section F.6 of the ER (Exelon 2014a). For certain improvements, the NRC staff also compared the cost estimates to estimates developed elsewhere for similar improvements, including estimates developed as part of other licensees’ analyses of SAMAs for operating reactors. The NRC staff noted that a few SAMAs (e.g., SAMAs 8, 14, and 27) involve use of equipment that may be available as a result of the B.5.b program. In response to an NRC staff RAI to discuss this further, Exelon responded that the B.5.b program at LSCS includes a small generator that is used to support two individual safety relief valve (SRV) solenoids to hold the SRVs open after 125-V direct-current (DC) battery depletion, but the generator does not power the station battery chargers, and it is not designed to support the reactor core isolation cooling (RCIC) system through DC feeds. Because of these limitations, the B.5.b generator is not a viable substitute for the generators that have been proposed for SAMAs 8, 14, and 27; therefore, the availability of the B.5.b generator would not reduce the implementation costs for these SAMAs. With the above clarifications, the NRC staff concludes that the cost estimates provided by Exelon are sufficient and appropriate for use in the SAMA evaluation.

Environmental Consequences and Mitigating Actions
4-84
Tabl
e 4–
16. L
SCS
Pote
ntia
lly C
ost-B
enef
icia
l SAM
As(a
)
Indi
vidu
al S
AMA
and
Assu
mpt
ions
% R
isk
Red
uctio
n(b)
Tota
l Ben
efit
($)(c
)
Cos
t ($)
(c)
CD
F Po
pula
tion
Dos
e O
ECR
Bas
elin
e (In
tern
al +
Ex
tern
al)
Bas
elin
e w
ith
Unc
erta
inty
(9
5th
Perc
entil
e)
2—AU
TOM
ATE
SUPP
RES
SIO
N P
OO
L C
OO
LIN
G
14
20
25
1.4M
3.
1M
400K
SA
MA
2 M
odel
ing:
The
faul
t tre
e in
corp
orat
ed th
e au
tom
atio
n of
sup
pres
sion
poo
l coo
ling
alig
nmen
t by
chan
ging
the
inde
pend
ent b
asic
eve
nt
IDs
for s
uppr
essi
on p
ool c
oolin
g in
itiat
ion
to a
ltern
ate
IDs.
Thi
s ac
com
plis
hes
two
func
tions
: (1
) ass
ignm
ent o
f alte
rnat
e fa
ilure
pro
babi
litie
s th
at
are
repr
esen
tativ
e of
an
auto
mat
ed fu
nctio
n an
d (2
) pre
vent
ion
of th
e re
cove
ry lo
gic
from
iden
tifyi
ng s
uppr
essi
on p
ool c
oolin
g in
itiat
ion
failu
res
as
hum
an a
ctio
ns a
nd p
recl
usio
n of
the
supp
ress
ion
pool
coo
ling
initi
atio
n fa
ilure
s fro
m d
epen
dent
hum
an e
rror c
ombi
natio
ns.
3—IN
STAL
L PA
SSIV
E VE
NT
PATH
36
51
61
1.
0M
2.2M
1.
0M
SAM
A 3
Mod
elin
g: T
he b
asic
eve
nt fo
r the
ope
rato
r act
ion
for v
entin
g w
as re
plac
ed w
ith a
new
pla
ceho
lder
eve
nt w
ith a
val
ue o
f 1x1
0‒6, w
hich
pr
even
ts th
e cr
eatio
n of
dep
ende
nt o
pera
tor a
ctio
ns, i
nclu
ding
the
vent
act
ion.
The
har
dwar
e fa
ilure
s as
soci
ated
with
the
vent
pat
h va
lves
hav
e be
en re
tain
ed to
app
roxi
mat
e th
e po
tent
ial f
ailu
res
of th
e ru
ptur
e di
sk (w
ith th
e su
ppor
t sys
tem
dep
ende
ncie
s re
mov
ed).
4—IN
STAL
L A
KEY
LOC
K M
SIV
LOW
-LEV
EL IS
OLA
TIO
N
BYP
ASS
SWIT
CH
16
12
10
67
4K
1.4M
63
5K
SAM
A 4
Mod
elin
g: T
he in
depe
nden
t hum
an e
rror p
roba
bilit
y to
byp
ass
the
mai
n st
eam
isol
atio
n va
lve
low
-leve
l iso
latio
n in
terlo
ck w
as s
et to
1x
10‒5
, and
the
join
t hum
an e
rror p
roba
bilit
ies
that
incl
ude
this
act
ion
have
bee
n el
imin
ated
. 5—
AUTO
MAT
E SB
LC IN
ITIA
TIO
N
8 7
6 38
6K
827K
40
0K
SAM
A 5
Mod
elin
g: T
he a
utom
atic
SBL
C in
itiat
ion
capa
bilit
y is
mod
eled
by
man
ipul
atio
n of
ass
ocia
ted
basi
c ev
ents
. Ea
rly S
BLC
initi
atio
n ba
sic
even
t ID
(2SL
OP-
LVLC
TRLH
--) w
as c
hang
ed to
“SAM
A5” a
nd s
et to
a p
roba
bilit
y of
1x1
0‒6 to
redu
ce th
e in
depe
nden
t fai
lure
con
tribu
tion
to a
sm
all v
alue
and
to p
reve
nt th
e in
clus
ion
of d
epen
dent
ope
rato
r act
ion
com
bina
tions
with
SBL
C in
itiat
ion
failu
res,
con
sist
ent w
ith th
e au
tom
ated
ac
tion.
8—
OB
TAIN
A 4
80-V
AC
PO
RTA
BLE
GEN
ERAT
OR
TO
SU
PPLY
TH
E 12
5-V
DC
BAT
TER
Y C
HAR
GER
S AN
D D
EVEL
OP
PRO
CED
UR
ES F
OR
ITS
USE
4
4 4
259K
55
4K
400K
SAM
A 8
Mod
elin
g: T
he 4
80-V
AC
gen
erat
or c
apab
ility
has
been
app
roxi
mat
ed b
y ad
ding
the
dies
el fi
re p
ump
as a
low
-pre
ssur
e in
ject
ion
sour
ce
for s
tatio
n bl
acko
ut s
cena
rios
in w
hich
the
ADS
and
RC
IC a
re in
itial
ly s
ucce
ssfu
l. In
add
ition
, a lu
mpe
d ev
ent w
as a
dded
to re
pres
ent t
he
480-
V AC
pow
er s
ourc
e th
at fe
eds
the
Div
isio
n 1
batte
ry c
harg
ers.
9—
DEV
ELO
P FL
OO
D Z
ON
E-SP
ECIF
IC P
RO
CED
UR
ES
9 3
3 22
4K
479K
11
5K
SAM
A 9
Mod
elin
g: I
nitia
ting
even
t fre
quen
cies
for f
lood
ing
even
ts w
ere
set t
o ze
ro in
the
cuts
ets.

Environmental Consequences and Mitigating Actions
4-85
Indi
vidu
al S
AMA
and
Assu
mpt
ions
% R
isk
Red
uctio
n(b)
Tota
l Ben
efit
($)(c
)
Cos
t ($)
(c)
CD
F Po
pula
tion
Dos
e O
ECR
Bas
elin
e (In
tern
al +
Ex
tern
al)
Bas
elin
e w
ith
Unc
erta
inty
(9
5th
Perc
entil
e)
10—
CH
ANG
E TH
E LO
GIC
TO
CLO
SE T
HE
TUR
BIN
E D
RIV
EN
FEED
WAT
ER P
UM
P D
ISC
HAR
GE
VALV
ES W
HEN
TH
E PU
MPS
AR
E N
OT
RU
NN
ING
9
21
23
1.3M
2.
8M
260K
SAM
A 10
Mod
elin
g: T
he h
uman
failu
re e
vent
ass
ocia
ted
with
clo
sing
the
turb
ine-
driv
en fe
edw
ater
pum
p di
scha
rge
valv
es w
as c
hang
ed to
a n
ew
even
t with
a fa
ilure
pro
babi
lity
of 1
x10‒4
. Th
is tr
eatm
ent r
educ
es th
e in
depe
nden
t con
tribu
tion
of th
e is
olat
ion
failu
re a
nd p
recl
udes
the
gene
ratio
n of
dep
ende
nt h
uman
erro
r com
bina
tion,
incl
udin
g th
e op
erat
or a
ctio
n to
isol
ate
the
valv
es.
14—
PRO
VID
E A
POR
TAB
LE D
C S
OU
RC
E TO
SU
PPO
RT
RC
IC
AND
SR
V O
PER
ATIO
N
9 7
7 44
4K
949K
48
9K
SAM
A 14
Mod
elin
g: T
he D
C g
ener
ator
cap
abilit
y ha
s be
en a
ppro
xim
ated
by
addi
ng th
e di
esel
fire
pum
p as
a lo
w-p
ress
ure
inje
ctio
n so
urce
for
stat
ion
blac
kout
sce
nario
s in
whi
ch th
e AD
S an
d R
CIC
are
initi
ally
suc
cess
ful.
In a
dditi
on, a
lum
ped
even
t was
add
ed to
repr
esen
t the
480
-V A
C
pow
er s
ourc
e th
at fe
eds
the
Div
isio
n 1
batte
ry c
harg
ers.
15
—TI
E R
HR
SW T
O T
HE
LPC
S SY
STEM
FO
R IS
LOC
A M
ITIG
ATIO
N
37
57
57
3.4M
7.
2M
1.4M
SAM
A 15
Mod
elin
g: C
hang
es w
ere
mad
e to
bot
h th
e m
ain
faul
t tre
e an
d th
e re
cove
ry fa
ult t
ree.
The
cro
ss-ti
e w
as a
ssum
ed to
requ
ire th
e LP
CS
inje
ctio
n pa
th (e
xist
ing
logi
c fro
m th
e LP
CS
syst
em) a
nd th
e av
aila
bilit
y of
the
RH
RSW
pum
ps (e
xist
ing
logi
c fro
m th
e R
HR
SW s
yste
m).
IS
LOC
As in
the
LPC
S lin
e w
ere
incl
uded
as
failu
re fo
r the
cro
ss-ti
e, a
s w
as a
n ev
ent r
epre
sent
ing
the
failu
re to
alig
n th
e cr
oss-
tie.
The
cros
s-tie
lo
gic
was
add
ed a
t the
seq
uenc
e le
vel f
or B
OC
and
ISLO
CA
sequ
ence
s fo
r whi
ch c
redi
t was
not
pre
viou
sly
take
n fo
r any
low
-pre
ssur
e in
ject
ion
syst
ems,
and
was
add
ed to
the
exis
ting
faul
t tre
e st
ruct
ure
in s
cena
rios
for w
hich
ven
ting
or c
onta
inm
ent f
ailu
re re
sulte
d in
the
loss
of
inje
ctio
n sy
stem
s.
16—
PRO
VID
E PO
RTA
BLE
FAN
S FO
R A
LTER
NAT
E R
OO
M
CO
OLI
NG
IN T
HE
CSC
S VA
ULT
S 14
12
15
86
6K
1.9M
47
5K
SAM
A 16
Mod
elin
g: T
he a
ltern
ate
CSC
S ro
om c
oolin
g ca
pabi
lity
was
app
roxi
mat
ed b
y de
letin
g th
e ga
tes
asso
ciat
ed w
ith ro
om c
oolin
g fa
ilure
s (e
xclu
ding
the
auto
mat
ic in
itiat
ion
failu
res,
whi
ch a
re a
lread
y ad
dres
sed
in th
e m
odel
). 18
—IM
PRO
VE T
HE
CO
NN
ECTI
ON
BET
WEE
N T
HE
FIR
E PR
OTE
CTI
ON
AN
D F
EED
WAT
ER S
YSTE
MS
9 9
10
609K
1.
3M
649K
SAM
A 18
Mod
elin
g: T
he fa
ult t
ree
was
upd
ated
to c
redi
t the
FPS
in p
lace
s fo
r whi
ch L
PCI a
nd L
PCS
are
cred
ited,
but
the
syst
em is
faile
d fo
r the
LO
CA
and
IOR
V in
itiat
ing
even
t and
for w
ater
ham
mer
sce
nario
s. I
n ad
ditio
n, th
e lo
gic
was
cha
nged
to in
clud
e th
e FP
S in
ject
ion
capa
bilit
y in
the
early
sta
tion
blac
kout
sce
nario
s in
whi
ch th
e AD
S is
ava
ilabl
e fo
r tho
se s
eque
nces
not
impa
cted
by
the
LPC
S-LP
CI g
ate.

Environmental Consequences and Mitigating Actions
4-86
Indi
vidu
al S
AMA
and
Assu
mpt
ions
% R
isk
Red
uctio
n(b)
Tota
l Ben
efit
($)(c
)
Cos
t ($)
(c)
CD
F Po
pula
tion
Dos
e O
ECR
Bas
elin
e (In
tern
al +
Ex
tern
al)
Bas
elin
e w
ith
Unc
erta
inty
(9
5th
Perc
entil
e)
19—
PRO
VID
E R
EMO
TE A
LIG
NMEN
T C
APAB
ILIT
Y O
F R
HR
SW
TO T
HE
LPC
S SY
STEM
FO
R L
OC
A M
ITIG
ATIO
N
38
58
58
3.4M
7.
3M
2.9M
SAM
A 19
Mod
elin
g: T
he in
clus
ion
of th
e R
HR
SW-L
PCS
cros
s-tie
requ
ired
chan
ges
to b
oth
the
mai
n fa
ult t
ree
and
the
reco
very
faul
t tre
e. T
he
cros
s-tie
was
ass
umed
to re
quire
the
LPC
S in
ject
ion
path
(exi
stin
g lo
gic
from
the
LPC
S sy
stem
) and
the
avai
labi
lity
of th
e R
HR
SW p
umps
(e
xist
ing
logi
c fro
m th
e R
HR
SW s
yste
m).
ISLO
CAs
in th
e LP
CS
line
wer
e in
clud
ed a
s fa
ilure
for t
he c
ross
-tie,
as
was
an
even
t for
failu
re to
alig
n th
e cr
oss-
tie.
Cro
ss-ti
e lo
gic
was
add
ed a
t the
seq
uenc
e le
vel f
or B
OC
and
ISLO
CA
sequ
ence
s fo
r whi
ch c
redi
t was
not
pre
viou
sly
take
n fo
r any
lo
w-p
ress
ure
inje
ctio
n sy
stem
s an
d w
as a
dded
to th
e ex
istin
g fa
ult t
ree
stru
ctur
e in
sce
nario
s in
whi
ch v
entin
g or
con
tain
men
t fai
lure
resu
lted
in
the
loss
of i
njec
tion
syst
ems.
21—
INST
ALL
AUTO
MAT
IC A
TWS
LEVE
L C
ON
TRO
L SY
STEM
14
14
12
75
4K
1.6M
1.
5M
SAM
A 21
Mod
elin
g: T
he S
AMA
is m
odel
ed b
y se
tting
the
early
and
late
leve
l con
trol a
ctio
ns to
zer
o in
the
faul
t tre
e.
23—
ENH
ANC
E TH
E FU
EL P
OO
L EM
ERG
ENC
Y M
AKEU
P PU
MP
AND
CO
NN
ECTI
ON
27
46
52
3.
0M
6.5M
1.
4M
SAM
A 23
Mod
elin
g: T
he in
clus
ion
of th
e fu
el p
ool e
mer
genc
y m
akeu
p pu
mp
cros
s-tie
requ
ired
chan
ges
to b
oth
the
mai
n fa
ult t
ree
and
the
reco
very
faul
t tre
e. T
he c
ross
-tie
was
ass
umed
to re
quire
the
resi
dual
hea
t rem
oval
B in
ject
ion
path
(exi
stin
g lo
gic
from
the
LPC
I sys
tem
). T
he
logi
c w
as a
dded
to th
e ex
istin
g fa
ult t
ree
stru
ctur
e in
sce
nario
s in
whi
ch v
entin
g or
con
tain
men
t fai
lure
resu
lted
in th
e lo
ss o
f inj
ectio
n sy
stem
s.
(a) P
oten
tially
cos
t-ben
efic
ial S
AMAs
rela
te to
LSC
S, U
nit 1
and
Uni
t 2.
(b) R
isk
redu
ctio
n pe
rcen
tage
s di
spla
yed
in th
is ta
ble
wer
e ob
tain
ed fr
om th
e ER
(Exe
lon,
201
4) b
efor
e Ex
elon
’s re
vise
d re
sults
(Exe
lon
2015
h).
Ris
k re
duct
ion
perc
enta
ges
for t
he re
vise
d be
nefit
resu
lts w
ere
not p
rovi
ded.
(c) E
xelo
n id
entif
ied
pote
ntia
lly c
ost-b
enef
icia
l SAM
As b
y co
mpa
ring
the
tota
l ben
efit
with
unc
erta
inty
at t
he 9
5th
perc
entil
e to
the
estim
ated
impl
emen
tatio
n co
st.
Tota
l ben
efit
and
cost
val
ues
pres
ente
d in
this
tabl
e w
ere
obta
ined
from
Exe
lon’
s re
vise
d re
sults
(Exe
lon
2015
h).
Key:
AC
= a
ltern
atin
g cu
rrent
, AD
S =
auto
mat
ic d
epre
ssur
izat
ion
syst
em, A
TWS
= an
ticip
ated
tran
sien
ts w
ithou
t scr
am, B
OC
= b
reak
out
side
con
tain
men
t, C
DF
= co
re d
amag
e fre
quen
cy, C
SCS
= co
re s
tand
by c
oolin
g sy
stem
, DC
= d
irect
cur
rent
, EC
CS
= em
erge
ncy
core
coo
ling
syst
em, F
PS =
fire
pro
tect
ion
syst
em, I
D =
iden
tific
atio
n, IO
RV
= in
adve
rtent
/stu
ck o
pen
relie
f val
ve, I
SLO
CA
= in
terfa
cing
-sys
tem
s lo
ss-o
f-coo
lant
acc
iden
t, LP
CI =
low
-pre
ssur
e co
olan
t in
ject
ion,
LPC
S =
low
-pre
ssur
e co
re s
pray
, LO
CA
= lo
ss-o
f-coo
lant
acc
iden
t, M
SIV
= m
ain
stea
m is
olat
ion
valv
e, O
ECR
= o
ffsite
eco
nom
ic c
ost r
isk,
R
CIC
= re
acto
r cor
e is
olat
ion
cool
ing,
RH
RSW
= re
sidu
al h
eat r
emov
al s
ervi
ce w
ater
, SAM
A =
seve
re a
ccid
ent m
itiga
tion
alte
rnat
ive,
SBL
C =
sta
ndby
liqu
id
cont
rol,
and
SRV
= sa
fety
relie
f val
ve.
Sour
ces:
Exe
lon
2014
a, 2
015h
Environmental Consequences and Mitigating Actions
4-87
Cost-Benefit Comparison
If the implementation costs for a SAMA candidate exceeded the calculated benefit, the SAMA was determined to be not cost beneficial. If the SAMA benefit exceeded the estimated cost, the SAMA candidate was considered to be potentially cost beneficial. Table 4–16 presents the results of the cost-benefit evaluation. Exelon’s cost-benefit analysis identified 14 SAMA candidates determined to be potentially cost beneficial at the 95th percentile on an individual basis, as follows:
• SAMA 2: Automate suppression pool cooling.
• SAMA 3: Install passive vent path.
• SAMA 4: Install a keylock main steam isolation valve (MSIV) low-level isolation bypass switch.
• SAMA 5: Automate SBLC initiation.
• SAMA 8: Obtain a 480-V AC portable generator to supply the 125-V DC battery chargers and develop procedures for its use.
• SAMA 9: Develop flood zone-specific procedures.
• SAMA 10: Change the logic to close the turbine-driven feedwater pump discharge valves when the pumps are not running.
• SAMA 14: Provide a portable DC source to support RCIC and SRV operation.
• SAMA 15: Tie RHRSW to the LPCS system for ISLOCA mitigation.
• SAMA 16: Provide portable fans for alternate room cooling in the core standby cooling system vaults.
• SAMA 18: Improve the connection between the fire protection and feedwater systems.
• SAMA 19: Provide remote alignment capability of RHRSW to the LPCS system for LOCA mitigation.
• SAMA 21: Install automatic ATWS level control system.
• SAMA 23: Enhance the fuel pool emergency makeup pump and connection. When the planned installation of a hardened vent pipe is considered as the base case, the number of SAMA candidates considered to be potentially cost beneficial at the 95th percentile may be reduced. Because a new baseline is established following the implementation of a SAMA, which further influences the benefits provided by the remaining SAMA candidates, Exelon defined an optimal set to containing SAMAs that, if implemented, would render the remaining SAMAs to be not cost beneficial. Acknowledging Exelon’s commitment to install the hardened vent pipe (SAMA 1), additional modifications included in the optimal set are SAMAs 2, 4, 9, and 15, as presented in the ER (Exelon 2014a). Assessment of the optimal set was performed before Exelon generated revised results in response to the NRC staff’s RAIs (Exelon 2015h). Exelon is referring the 14 potentially cost-beneficial SAMAs from its revised analysis (Exelon 2015h) to the LSCS Plant Health Committee for further implementation considerations within the established plant procedural process, as indicated in Section 4.15 of the ER (Exelon 2014a).

Environmental Consequences and Mitigating Actions
4-88
Conclusions
Exelon considered 26 SAMA candidates based on risk-significant contributors at LSCS from updated probabilistic safety assessment models, SAMA-related industry documentation, plant-specific enhancements, and its review of SAMA candidates from potential improvements primarily at six other BWR plants. Revised Phase I screening reduced the list to 25 unique SAMA candidates by eliminating SAMAs that are not applicable to LSCS, that have already been implemented at LSCS, or that have excessive implementation costs. Exelon assessed the costs and benefits associated with each of the 25 potential SAMAs. Exelon concluded that 14 of these SAMA candidates were potentially cost beneficial at the 95th percentile (shown in Table 4–16). Exelon has decided to proceed with the modification to install a hardened vent pipe regardless of cost even though it is not cost beneficial. From a sensitivity analysis, no additional SAMA candidates were identified as potentially cost beneficial. Pursuant to 10 CFR 54.30, a licensee’s compliance with its current licensing basis is not within the scope of the license renewal review. Therefore, because the potentially cost-beneficial SAMAs have to do with the licensee’s current licensing basis and do not relate to aging management during the period of extended operation, their implementation is not required as part of license renewal. Instead, as stated in Section 4.15 of the ER (Exelon 2014a), Exelon indicated that the potentially cost-beneficial SAMAs are being referred to the LSCS Plant Health Committee for further implementation considerations within the established plant procedural process. The NRC staff reviewed Exelon’s SAMA analysis and concludes that, based on the discussion in Appendix F of this document, the methods used and implementation of those methods were sound. On the basis of the applicant’s treatment of SAMA benefits and costs, the NRC staff finds that the SAMA evaluations performed by Exelon are reasonable and are sufficient for the license renewal submittal. The NRC staff concurs with Exelon’s conclusion that 14 SAMA candidates are potentially cost beneficial for LSCS and notes that Exelon’s assessment was based on generally conservative treatment of costs, benefits, and uncertainties. Based on the NRC staff’s review of Exelon’s SAMA evaluations, including Exelon’s response to the NRC staff’s RAIs, the NRC staff concludes that Exelon has adequately identified areas in which risk can be further reduced in a cost-beneficial manner through the implementation of the identified potentially cost-beneficial SAMAs. Given the potential for cost-beneficial risk reduction, the NRC staff agrees that further evaluation by Exelon of the 14 SAMA candidates identified by Exelon as being potentially cost beneficial is warranted. The NRC staff also evaluated whether the identified potentially cost-beneficial SAMAs are subject to aging management. The evaluation considered any structures, systems, and components associated with these SAMAs that perform intended functions without moving parts or without a change in configuration or properties and that would not be subject to replacement based on a qualified life or specified time period. The NRC staff determined that the potentially cost-beneficial SAMAs do not relate to adequately managing the effects of aging during the period of extended operation. Therefore, they do not need to be implemented as part of license renewal in accordance with 10 CFR Part 54.
4.11.2 No-Action Alternative
Human health risks would be smaller following plant shutdown. The two reactor units, which are currently operating within regulatory limits, would emit less gaseous, liquid, and solid radioactive material to the environment. In addition, following shutdown, the variety of potential accidents at the plant (radiological or industrial) would be reduced to a limited set associated with shutdown events and fuel handling and storage. In Section 4.11.1, the NRC staff concluded that the impacts of continued plant operation on human health would be SMALL, except for “chronic effects of electromagnetic fields (EMFs),” for which the impacts are UNCERTAIN. In
Environmental Consequences and Mitigating Actions
4-89
Section 4.11.1.2, the NRC staff concluded that the impacts of accidents during operation were SMALL. Therefore, as radioactive emissions to the environment decrease, and as the likelihood and types of accidents decrease following shutdown, the NRC staff concludes that the risk to human health following plant shutdown would be SMALL.
4.11.3 New Nuclear Alternative
Impacts on human health from construction of two new nuclear units would be similar to impacts associated with the construction of any major industrial facility. Compliance with worker protection rules would control those impacts on workers at acceptable levels. Impacts from construction on the general public would be minimal, since limiting active construction area access to authorized individuals is expected. Impacts on human health from the construction of two new nuclear units would be SMALL. The human health effects from the operation of two new nuclear units would be similar to those of operating the two existing LSCS units. As presented in Section 4.11.1, impacts on human health from the operation of LSCS would be SMALL, except for “chronic effects of electromagnetic fields (EMFs),” for which the impacts are UNCERTAIN. Therefore, the impacts on human health from the operation of two new nuclear units would be SMALL.
4.11.4 IGCC Alternative
Impacts from construction on workers are expected to be similar to those experienced during construction of any major industrial facility. Impacts from construction of an IGCC facility are expected to be the same as those for construction of fossil fuel facilities. Construction would increase traffic on local roads, which could affect the health of the general public. Human health impacts would be the same for all facilities, whether located on greenfield sites or at an existing power plant. Personal protective equipment, training, and engineered barriers would protect the workforce (NRC 2013d). Therefore, the impacts on human health from the construction of an IGCC facility would be SMALL. The IGCC alternative introduces worker risks from coal and limestone mining, worker and public risk from coal and lime/limestone transportation, worker and public risk from disposal of coal-combustion waste, and public risk from inhalation of stack emissions. In addition, human health risks are associated with the management and disposal of coal combustion waste. Coal combustion generates waste in the form of ash, and equipment for controlling air pollution captures additional ash and produces scrubber sludge, which must be managed as coal combustion waste. Human health risks may extend beyond the facility workforce to the public, depending on their proximity to the coal combustion waste storage and/or disposal facility. The character and the constituents of coal combustion waste depend on both the chemical composition of the source coal and the technology used to combust it. Generally, the primary sources of adverse consequences from coal combustion waste are from exposure to sulfur oxide and nitrogen oxide in air emissions and radioactive elements, such as uranium and thorium, as well as the heavy metals and hydrocarbon compounds contained in fly ash and bottom ash, and scrubber sludge (NRC 2013d). Regulatory agencies, including EPA and state agencies, base air emission standards and requirements on human health impacts. These agencies also impose site-specific emission limits as needed to protect human health. Given the regulatory oversight exercised by EPA and state agencies, the NRC staff concludes that the human health impacts from radiological doses and inhaled toxins and particulates generated from the IGCC alternative would be SMALL (NRC 2013d).

Environmental Consequences and Mitigating Actions
4-90
4.11.5 NGCC Alternative
Impacts on human health from construction of the NGCC alternative would be similar to effects associated with the construction of any major industrial facility. Compliance with worker protection rules would control those impacts on workers at acceptable levels. Impacts from construction on the general public would be minimal, since crews would limit active construction area access to authorized individuals. Based on the above, the NRC staff concludes that the impacts on human health from the construction of the NGCC alternative would be SMALL. Impacts from the operation of an NGCC facility include public risk from inhalation of gaseous emissions. The risk may be attributable to nitrogen oxide emissions that contribute to ozone formation, which in turn contribute to health risk. Regulatory agencies, including the EPA and state agencies, base air emission standards and requirements on human health impacts. These agencies also impose site-specific emission limits as needed to protect human health. Given the regulatory oversight exercised by EPA and state agencies, the NRC staff concludes that the human health impacts from the NGCC alternative would be SMALL.
4.11.6 Combination Alternative (NGCC, Wind, Solar)
Impacts on human health from construction of a combination of NGCC, wind, and solar alternative would be similar to effects associated with the construction of any major industrial facility. Compliance with worker protection rules and personal protective equipment, training, and engineered barriers would protect the workforce (NRC 2013d). Impacts from construction on the general public would be minimal, since crews would limit active construction area access to authorized individuals. Based on the above, the NRC staff concludes that the Impacts on human health from the construction of the NGCC, wind, and solar alternative would be SMALL. Operational hazards at an NGCC facility are discussed in Section 4.11.5. Operational hazards at a wind facility for the workforce include working at heights, near rotating mechanical or electrically energized equipment, and in extreme weather. Potential impacts to workers and the public include ice thrown from rotor blades and broken blades thrown as a result of mechanical failure. Potential impacts also include EMF exposure, aviation safety (hazards), and exposure to noise and vibration from the rotating blades. Operational hazards at a solar PV facility may involve exposure to airborne toxic metals (e.g., cadmium) and silicon if the PV cell loses its integrity from a fire. Workers could also inhale silicon dust if a PV cell were smashed by an object or from a fall to the ground. However, based on worker and environmental protection rules, it is expected that remediation of toxic material would occur. Such remediation would minimize the impact to workers and the environment. Therefore, given the expected compliance with worker and environmental protection rules and the use of personal protective equipment, training, and engineered barriers, the NRC staff concludes that the potential human health impacts would be SMALL.
4.11.7 Purchased Power Alternative
Purchased power is expected to come from the types of electricity generation available within the ROI: coal, natural gas, nuclear, and wind. The human health impacts from the operation of these types of power plants are discussed in Sections 4.11.3, 4.11.4, 4.11.5, and 4.11.6. Based on the information in those sections, the NRC staff concludes that the human health impacts of the purchased power alternative using nuclear, coal, natural gas, wind, and solar would be SMALL.

Environmental Consequences and Mitigating Actions
4-91
4.12 Environmental Justice
This section describes the potential human health and environmental effects of the proposed action (license renewal) and alternatives to the proposed action on minority and low-income populations.
4.12.1 Proposed Action
Section 3.12 identifies minority and low-income populations living in the vicinity of LSCS. Table 4–17 identifies the environmental justice issue applicable to LSCS during the license renewal term.
Table 4–17. Environmental Justice NEPA Issue
Issue GEIS Section Category Minority and low-income populations 4.10.1 2
Source: Table B–1 in Appendix B, Subpart A of 10 CFR Part 51
The NRC addresses environmental justice matters for license renewal by (1) identifying the location of minority and low-income populations that may be affected by the continued operation of the nuclear power plant during the license renewal term, (2) determining whether there would be any potential human health or environmental effects to these populations and special pathway receptors, and (3) determining if any of the effects may be disproportionately high and adverse. Adverse health effects are measured in terms of the risk and rate of fatal or nonfatal adverse impacts on human health. Disproportionately high and adverse human health effects occur when the risk or rate of exposure to an environmental hazard for a minority or low-income population is significant and exceeds the risk or exposure rate for the general population or for another appropriate comparison group. Disproportionately high environmental effects refer to impacts or risks of impacts on the natural or physical environment in a minority or low-income community that are significant and appreciably exceed the environmental impact on the larger community. Such effects may include biological, cultural, economic, or social impacts. Figures 3–17 and 3–18 show the location of predominantly minority and low-income population block groups residing within a 50-mi (80-km) radius of LSCS. This area of impact is consistent with the impact analysis for public and occupational health and safety, which also focuses on populations within a 50-mi (80-km) radius of the plant. Chapter 4 presents the assessment of environmental and human health impacts for each resource area. The analyses of impacts for all environmental resource areas indicated that the impact from license renewal would be SMALL. Potential impacts on minority and low-income populations (including migrant workers or Native Americans) would mostly consist of socioeconomic and radiological effects; however, radiation doses from continued operations during the license renewal term are expected to continue at current levels, and they would remain within regulatory limits. Section 4.11.1.2 of this SEIS discusses the environmental impacts from postulated accidents that might occur during the license renewal term, which include both design basis and severe accidents. In both cases, the Commission has generically determined that impacts associated with DBAs are small because nuclear plants are designed and operated to successfully withstand such accidents, and the probability-weighted consequences of severe accidents are small.

Environmental Consequences and Mitigating Actions
4-92
Therefore, based on this information and the analysis of human health and environmental impacts presented in Chapter 4 of this SEIS, there would be no disproportionately high and adverse human health and environmental effects on minority and low-income populations from the continued operation of LSCS during the license renewal term. As part of addressing environmental justice concerns associated with license renewal, the NRC staff also assessed the potential radiological risk to special population groups (such as migrant workers or Native Americans) from exposure to radioactive material received through their unique consumption practices and interaction with the environment, including subsistence consumption of fish and wildlife, native vegetation, surface waters, sediments, and local produce; absorption of contaminants in sediments through the skin; and inhalation of airborne radioactive material released from the plant during routine operation. This analysis is presented below. Subsistence Consumption of Fish and Wildlife
The special pathway receptors analysis is an important part of the environmental justice analysis because consumption patterns may reflect the traditional or cultural practices of minority and low-income populations in the area, such as migrant workers or Native Americans. Section 4–4 of Executive Order 12898 (1994) directs Federal agencies, whenever practical and appropriate, to collect and analyze information about the consumption patterns of populations that rely principally on fish and/or wildlife for subsistence and to communicate the risks of these consumption patterns to the public. In this SEIS, the NRC considered whether there were any means for minority or low-income populations to be disproportionately affected by examining impacts on American Indian, Hispanics, migrant workers, and other traditional lifestyle special pathway receptors. The assessment of special pathways considered the levels of radiological and nonradiological contaminants in vegetation, crops, soils and sediments, groundwater, surface water, fish, and game animals on or near LSCS. Radionuclides released to the atmosphere may deposit on soil and vegetation and, therefore, may eventually be incorporated into the human food chain. To assess the impact of LSCS operations to humans from the ingestion pathway, samples of fish, milk, green leafy vegetables, surface water, sediment, and groundwater are collected and analyzed for radioactivity. The following describes Exelon’s radiological environmental monitoring program (REMP). Exelon has an ongoing comprehensive REMP to assess the impact of LSCS operations on the environment. To assess the impact of nuclear power plant operations, samples are collected annually from the environment and analyzed for radioactivity. A plant effect would be indicated if the radioactive material detected in a sample were larger or higher than background levels. Two types of samples are collected. The first type, a control sample, is collected from areas that are beyond the influence of the nuclear power plant or any other nuclear facility. These samples are used as reference data to determine normal background levels of radiation in the environment. These samples are then compared with the second type of samples, indicator samples, collected near the nuclear power plant. Indicator samples are collected from areas where any contribution from the nuclear power plant will be at its highest concentration. These samples are then used to evaluate the contribution of nuclear power plant operations to radiation or radioactivity levels in the environment. An effect would be indicated if the radioactivity levels detected in an indicator sample were larger or higher than the control sample or background levels. Samples were collected from the aquatic and terrestrial environment in the vicinity of LSCS in 2014. The aquatic environment includes groundwater, surface water, fish, and river sediment. Aquatic monitoring results for 2014 of water, sediment, and fish showed only naturally occurring

Environmental Consequences and Mitigating Actions
4-93
radioactivity and radioactivity associated with fallout from past atmospheric nuclear weapons testing and were consistent with levels measured prior to the operation of LSCS. No radioactivity was detected greater than the minimum detectable activity in any aquatic sample during 2014, and no adverse long-term trends were identified in aquatic monitoring data (Exelon 2015a). The terrestrial environment includes airborne particulates, milk, and food products (i.e., beets, kohlrabi, potatoes, Swiss chard, and kale). However, cow milk samples were not analyzed in 2014, as the dairy herd was sold prior to the first sample in 2014 (Exelon 2015a). Terrestrial monitoring results for 2014 of groundwater and leafy garden vegetable samples, showed only naturally occurring radioactivity. The radioactivity levels detected were consistent with levels measured prior to the operation of LSCS. No radioactivity was detected greater than the minimum detectable activity in any terrestrial samples during 2014. The terrestrial monitoring data also showed no adverse trends in the terrestrial environment (Exelon 2015a). Analyses performed on 1,393 samples collected from the environment at LSCS in 2014 showed no significant measurable radiological constituent above background levels. Overall, radioactivity levels detected in 2014 were consistent with previous levels, as well as radioactivity levels measured prior to the operation of LSCS. REMP sampling in 2014 did not identify any radioactivity above the minimum detectable activity (Exelon 2015a). Based on the radiological environmental monitoring data from LSCS, the NRC staff finds that no disproportionately high and adverse human health impacts would be expected in special pathway receptor populations in the region as a result of subsistence consumption of water, local food, fish, and wildlife. Continued operation of LSCS would not have disproportionately high and adverse human health and environmental effects on these populations.
4.12.2 No-Action Alternative
This section evaluates the potential for disproportionately high and adverse human health and environmental effects on minority and low-income populations that could result from the no-action alternative. Impacts on minority and low-income populations would depend on the number of jobs and the amount of tax revenues lost by communities in the immediate vicinity of the power plant after LSCS ceases operations. Not renewing the operating licenses and terminating reactor operations would have a noticeable impact on socioeconomic conditions in the communities located near LSCS. The loss of jobs and income would have an immediate socioeconomic impact. Some, but not all, of the approximately 890 employees would begin to leave after reactor operations are terminated; and overall tax revenue generated by plant operations would be reduced. The reduction in tax revenue would decrease the availability of public services in LaSalle County. This could disproportionately affect minority and low-income populations that may have become dependent on these services. See also Appendix J of NUREG–0586, Supplement 1 (NRC 2002), for additional discussion of these impacts.
4.12.3 New Nuclear Alternative
This section evaluates the potential for disproportionately high and adverse human health and environmental effects on minority and low-income populations that could result from the construction and operation of a new nuclear power plant. Some of these potential effects have been identified in resource areas discussed in this SEIS. For example, increased demand for rental housing during replacement power plant construction could disproportionately affect low-income populations. Everyone living near the proposed power plant site could be affected by the construction and operation of a new nuclear power plant, including minority and low-income populations.
Environmental Consequences and Mitigating Actions
4-94
Potential impacts to minority and low-income populations from the construction and operation of a new nuclear power plant at an existing nuclear power plant or retired coal plant site would mostly consist of environmental and socioeconomic effects (e.g., noise, dust, traffic, employment, and housing impacts). Noise and dust impacts from construction would be short term and primarily limited to onsite activities. Minority and low-income populations residing along site access roads would be affected by increased commuter vehicle traffic during shift changes and truck traffic. However, these effects would be temporary during certain hours of the day and would not likely be high and adverse. Increased demand for rental housing during construction could affect low-income populations. However, given the proximity of some existing nuclear power plant or retired coal plant sites to metropolitan areas, construction workers could commute to the site, thereby reducing the potential demand for rental housing. Potential impacts to minority and low-income populations from new nuclear power plant operations would mostly consist of radiological effects; however, radiation doses are expected to be well below regulatory limits. All people living near the new nuclear power plant would be exposed to the same potential effects from power plant operations, and permitted air emissions are expected to remain within regulatory standards. Based on this information and the analysis of human health and environmental impacts presented in this SEIS, it is not likely that the construction and operation of a new nuclear power plant would have disproportionately high and adverse human health and environmental effects on minority and low-income populations. However, this determination would depend on the location, plant design, and operational characteristics of the new power plant. Therefore, the NRC staff cannot determine whether this alternative would result in disproportionately high and adverse human health and environmental effects on minority and low-income populations.
4.12.4 IGCC Alternative
This section evaluates the potential for disproportionately high and adverse human health and environmental effects on minority and low-income populations that could result from the construction and operation of a new IGCC power plant. Some of these potential effects have been identified in resource areas discussed in this SEIS. For example, increased demand for rental housing during replacement power plant construction could disproportionately affect low-income populations. Everyone living near the proposed power plant site could be affected by the construction and operation of a new IGCC power plant, including minority and low-income populations. Potential impacts to minority and low-income populations from the construction and operation of a new IGCC plant at the LSCS site or at another existing power plant site would consist of environmental and socioeconomic effects (e.g., noise, dust, traffic, employment, and housing impacts). Noise and dust impacts from construction would be short term and primarily limited to onsite activities. Minority and low-income populations residing along site access roads would be affected by increased commuter vehicle traffic during shift changes and truck traffic. However, these effects would be temporary during certain hours of the day and would not likely be high and adverse. Increased demand for rental housing during construction could affect low-income populations. However, given the proximity of some existing power plant sites to Chicago (LSCS site) and other metropolitan areas (at another existing power plant site), construction workers could commute to the site, thereby reducing the potential demand for rental housing. Emissions from the IGCC plant during power plant operations could disproportionately affect minority and low-income populations. However, permitted air emissions are expected to remain within regulatory standards.
Environmental Consequences and Mitigating Actions
4-95
Based on this information and the analysis of human health and environmental impacts presented in this SEIS, it is not likely that the construction and operation of a new IGCC plant would have disproportionately high and adverse human health and environmental effects on minority and low-income populations. However, this determination would depend on the location, plant design, and operational characteristics of the new power plant at the LSCS site or at another existing power plant site. Therefore, the NRC staff cannot determine whether this alternative would result in disproportionately high and adverse human health and environmental effects on minority and low-income populations.
4.12.5 NGCC Alternative
This section evaluates the potential for disproportionately high and adverse human health and environmental effects on minority and low-income populations that could result from the construction and operation of a new NGCC plant. Some of these potential effects have been identified in resource areas discussed in this SEIS. For example, increased demand for rental housing during replacement power plant construction could disproportionately affect low-income populations. Everyone living near the proposed power plant site could be affected by the construction and operation of a new NGCC power plant, including minority and low-income populations. Potential impacts to minority and low-income populations from the construction and operation of a new NGCC plant at the LSCS site would mostly consist of environmental and socioeconomic effects (e.g., noise, dust, traffic, employment, and housing impacts). Noise and dust impacts from construction would be short term and primarily limited to onsite activities. Minority and low-income populations residing along site access roads would be affected by increased commuter vehicle traffic during shift changes and truck traffic. However, these effects would be temporary during certain hours of the day and would not likely be high and adverse. Increased demand for rental housing during construction could affect low-income populations in the vicinity of the LSCS site. However, given the proximity of LSCS to the Chicago metropolitan area, many construction workers could commute to the site, thereby reducing the potential demand for rental housing. Emissions from the NGCC plant during power plant operations could disproportionately affect minority and low-income populations living in the vicinity of the new power plant. However, permitted air emissions are expected to remain within regulatory standards. Based on this information and the analysis of human health and environmental impacts presented in this SEIS, it is not likely that the construction and operation of a new NGCC plant would have disproportionately high and adverse human health and environmental effects on minority and low-income populations. However, this determination would depend on the location, plant design, and operational characteristics of the new power plant at LSCS. Therefore, the NRC staff cannot determine whether this alternative would result in disproportionately high and adverse human health and environmental effects on minority and low-income populations.
4.12.6 Combination Alternative (NGCC, Wind, Solar)
This section evaluates the potential for disproportionately high and adverse human health and environmental effects on minority and low-income populations that could result from the construction and operation of a combination of NGCC, wind, and solar PV electrical power generating activities. Some of these potential effects have been identified in resource areas discussed in this SEIS. For example, increased demand for rental housing during construction could disproportionately affect low-income populations. Everyone living near the new NGCC,

Environmental Consequences and Mitigating Actions
4-96
wind farms, and solar PV installations could be affected by construction activities and facility operations, including minority and low-income populations. Potential impacts to minority and low-income populations from the construction and operation of a new NGCC plant, wind turbines, and solar PV installations would mostly consist of environmental and socioeconomic effects (e.g., noise, dust, traffic, employment, and housing impacts). Noise and dust impacts from construction would be short term and primarily limited to onsite activities. Minority and low-income populations residing along site access roads would be affected by increased commuter vehicle traffic during shift changes and truck traffic. However, these effects would be temporary during certain hours of the day and would not likely be high and adverse. Increased demand for rental housing during construction could affect low-income populations. However, given the small number of construction workers and the possibility that many workers could commute to these construction sites, the potential need for rental housing would not be significant. Minority and low-income populations living in close proximity to wind farm and solar PV power generating installations could be disproportionately affected by maintenance and operations activities. However, operational impacts from the wind turbines and solar PV installations would mostly be limited to noise and aesthetic effects. Based on this information and the analysis of human health and environmental impacts presented in this SEIS, it is not likely that the construction and operation of a new NGCC plant, wind farms, and solar PV installations would have disproportionately high and adverse human health and environmental effects on minority and low-income populations. However, this determination would depend on the location, plant design, and operational characteristics of these new power generating facilities. Therefore, the NRC staff cannot determine whether this alternative would result in disproportionately high and adverse human health and environmental effects on minority and low-income populations.
4.12.7 Purchased Power Alternative
This section evaluates the potential for disproportionately high and adverse human health and environmental effects on minority and low-income populations that could result from purchasing electric power. As previously discussed, such effects may include human health, biological, cultural, economic, or social impacts. Purchased power from existing power generating facilities would not likely have any disproportionately high and adverse effects on minority populations, because there would be no change in power plant operations or workforce. However, low-income populations could be disproportionately affected by increased utility bills, due to the cost of purchased power, although programs are available to assist low-income families in paying for increased electrical costs. If the amount of purchased power needed exceeds the available supply, new electric power generating facilities would be needed. Construction and operation of a new electrical power generating facility to supply purchased power could create new human health and environmental effects in communities located near the new facility. Everyone living near the new electric power generating facility could be affected by construction activities and facility operations, including minority and low-income populations. Potential human health and environmental effects from constructing and operating a new power generating facility have been described in the previous sections. Operational impacts for all new power generating facilities would mostly be limited to noise, air emissions, and aesthetic effects. Minority and low income populations could experience disproportionate human health
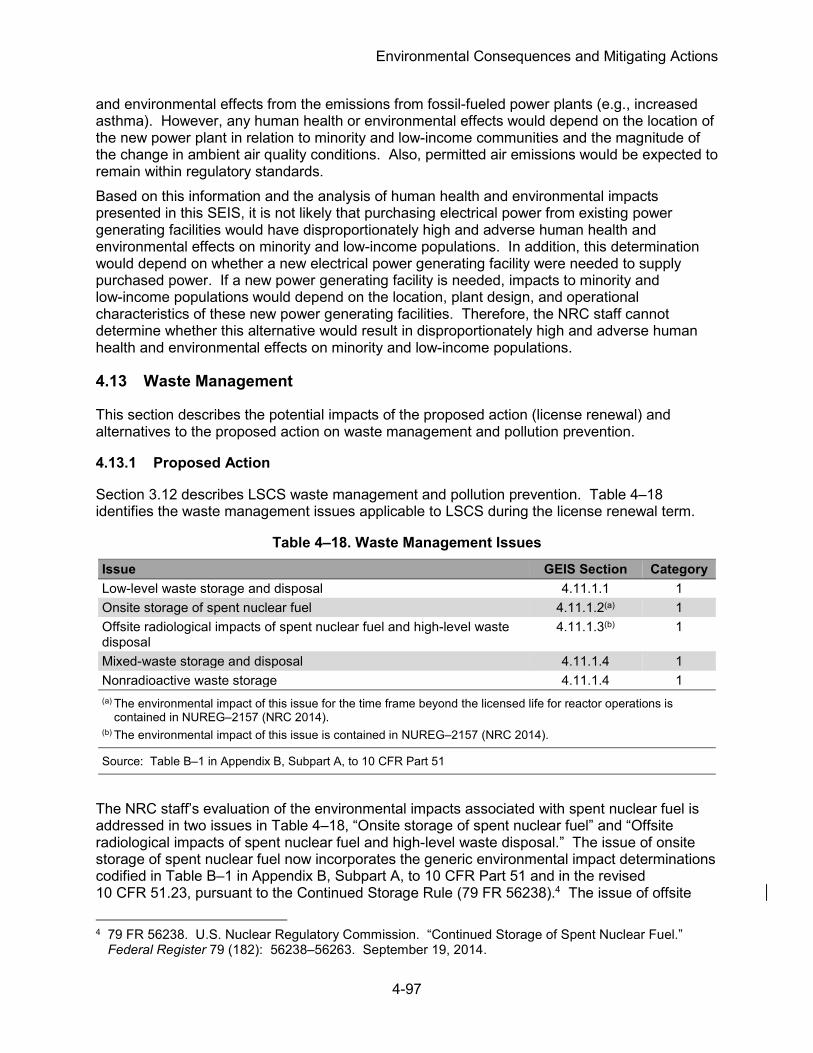
Environmental Consequences and Mitigating Actions
4-97
and environmental effects from the emissions from fossil-fueled power plants (e.g., increased asthma). However, any human health or environmental effects would depend on the location of the new power plant in relation to minority and low-income communities and the magnitude of the change in ambient air quality conditions. Also, permitted air emissions would be expected to remain within regulatory standards. Based on this information and the analysis of human health and environmental impacts presented in this SEIS, it is not likely that purchasing electrical power from existing power generating facilities would have disproportionately high and adverse human health and environmental effects on minority and low-income populations. In addition, this determination would depend on whether a new electrical power generating facility were needed to supply purchased power. If a new power generating facility is needed, impacts to minority and low-income populations would depend on the location, plant design, and operational characteristics of these new power generating facilities. Therefore, the NRC staff cannot determine whether this alternative would result in disproportionately high and adverse human health and environmental effects on minority and low-income populations.
4.13 Waste Management
This section describes the potential impacts of the proposed action (license renewal) and alternatives to the proposed action on waste management and pollution prevention.
4.13.1 Proposed Action
Section 3.12 describes LSCS waste management and pollution prevention. Table 4–18 identifies the waste management issues applicable to LSCS during the license renewal term.
Table 4–18. Waste Management Issues Issue GEIS Section Category Low-level waste storage and disposal 4.11.1.1 1 Onsite storage of spent nuclear fuel 4.11.1.2(a) 1 Offsite radiological impacts of spent nuclear fuel and high-level waste disposal
4.11.1.3(b) 1
Mixed-waste storage and disposal 4.11.1.4 1 Nonradioactive waste storage 4.11.1.4 1 (a) The environmental impact of this issue for the time frame beyond the licensed life for reactor operations is
contained in NUREG–2157 (NRC 2014). (b) The environmental impact of this issue is contained in NUREG–2157 (NRC 2014).
Source: Table B–1 in Appendix B, Subpart A, to 10 CFR Part 51
The NRC staff’s evaluation of the environmental impacts associated with spent nuclear fuel is addressed in two issues in Table 4–18, “Onsite storage of spent nuclear fuel” and “Offsite radiological impacts of spent nuclear fuel and high-level waste disposal.” The issue of onsite storage of spent nuclear fuel now incorporates the generic environmental impact determinations codified in Table B–1 in Appendix B, Subpart A, to 10 CFR Part 51 and in the revised 10 CFR 51.23, pursuant to the Continued Storage Rule (79 FR 56238).4 The issue of offsite
4 79 FR 56238. U.S. Nuclear Regulatory Commission. “Continued Storage of Spent Nuclear Fuel.”
Federal Register 79 (182): 56238–56263. September 19, 2014.

Environmental Consequences and Mitigating Actions
4-98
radiological impacts of spent nuclear fuel and high-level waste disposal are codified in Table B–1 in Appendix B, Subpart A, to 10 CFR Part 51, and the technical feasibility of disposal in a geologic repository is discussed in NUREG–2157, Generic Environmental Impact Statement for Continued Storage of Spent Nuclear Fuel, Volumes 1 and 2 (NRC 2014). The NRC staff did not identify any new and significant information related to waste management issues listed in Table 4–18 during its review of the applicant’s ER (Exelon 2014a), the site visit, or the scoping process. Therefore, there are no impacts related to these issues beyond those discussed in the GEIS (NRC 2013d) and NUREG–2157 (NRC 2014). During the license renewal term, for these Category 1 issues discussed in the GEIS, the NRC staff concludes that the impacts are SMALL.
4.13.2 No-Action Alternative
If the no-action alternative were implemented, LSCS would cease operation at the end of the term of the initial operating licenses, or sooner, and enter decommissioning. The plants, which are currently operating within regulatory limits, would generate less spent nuclear fuel and emit less gaseous and liquid radioactive effluents into the environment. In addition, following shutdown, the variety of potential accidents at the plants (radiological and industrial) would be reduced to a limited set associated with shutdown events and fuel handling and storage. Therefore, as radioactive emissions to the environment decrease, and the likelihood and variety of accidents decrease following shutdown and decommissioning, the NRC staff concludes that impacts from implementation of the no-action alternative would be SMALL.
4.13.3 New Nuclear Alternative
Construction-related debris would be generated during construction activities and would be recycled or disposed of in approved landfills. During normal plant operations, routine plant maintenance, and cleaning activities would generate radioactive low-level waste, spent nuclear fuel, and high-level waste, as well as nonradioactive waste. Sections 3.1.4 and 3.1.5 discuss radioactive and nonradioactive waste management at LSCS. Quantities of radioactive and nonradioactive waste generated by LSCS would be comparable to that generated by the two new nuclear plants. According to the GEIS (NRC 2013d), the generation and management of solid radioactive and nonradioactive waste during the license renewal term are not expected to result in significant environmental impacts. Based on this information, the waste impacts would be SMALL for the new nuclear alternative.
4.13.4 IGCC Alternative
Construction-related debris would be generated during plant construction activities and would be recycled or disposed of in approved landfills. Coal combustion generates waste in the form of fly ash and bottom ash. In addition, equipment for controlling air pollution generates additional ash, spent selective catalytic reduction (SCR) catalyst, and scrubber sludge. The management and disposal of the large amounts of coal combustion waste is a significant part of the operation of a coal-fired power generating facility. Although an IGCC facility is likely to use offsite disposal of coal combustion waste, some short-term storage of coal combustion waste (either in open piles or in surface impoundments) is likely to take place on site, thus establishing the potential for leaching of toxic chemicals into the local environment.

Environmental Consequences and Mitigating Actions
4-99
The impacts of managing the substantial amounts of solid waste, especially fly ash and scrubber sludge, generated during operation of this alternative would be MODERATE (NRC 1996). The amount of the construction waste would be small compared to the amount of waste generated during the operational stage and much of it could be recycled (i.e., marketed for beneficial use). Therefore, the NRC staff concludes that the overall waste management impacts from construction of this alternative would be SMALL and from operation of this alternative would be MODERATE.
4.13.5 NGCC Alternative
Construction-related debris would be generated during plant construction activities, and would be recycled or disposed of in approved landfills. Waste generation from NGCC technology would be minimal. The only significant waste generated at an NGCC power plant would be spent SCR catalyst, which is used to control nitrogen oxide emissions. The spent catalyst would be regenerated or disposed of offsite. Other than the spent SCR catalyst, waste generation at an operating natural-gas-fired plant would be limited largely to typical operations and maintenance of nonhazardous waste. Overall, the NRC staff concludes that waste impacts from the NGCC alternative would be SMALL.
4.13.6 Combination Alternative (NGCC, Wind, Solar)
Construction-related debris would be generated during construction activities and would be recycled or disposed of in approved landfills. Waste generation from NGCC technology is discussed in Section 4.13.5. Waste generation from a combination of wind and solar PV alternatives would be minimal, consisting of debris from routine maintenance and the disposal of worn or broken parts. Based on this information, the NRC staff concludes that waste impacts from the construction and operation of a combination wind and solar PV alternative would be SMALL.
4.13.7 Purchased Power Alternative
The types of waste generated by the alternative electricity generation sources (i.e., coal, natural gas, nuclear, and wind) used in the purchased power alternative are discussed in Sections 4.13.3, 4.13.4, 4.13.5, and 4.13.6. Depending on types of power generation plants used to provide the electricity for the purchased power alternative, the NRC staff concludes that the waste management impacts would range from SMALL to MODERATE.
4.14 Evaluation of New and Potentially Significant Information
New and significant information must be new based on a review of the GEIS (NRC 2013d) as codified in Table B–1 of Appendix B to Subpart A of 10 CFR Part 51, and must bear on the proposed action or its impacts, presenting a seriously different picture of the impacts from those envisioned in the GEIS (i.e., impacts of greater severity than impacts considered in the GEIS, considering their intensity and context). In accordance with 10 CFR 51.53(c), the ER that the applicant submits must provide an analysis of the Category 2 issues in Table B–1 of 10 CFR Part 51, Subpart A, Appendix B. Additionally, it must discuss actions to mitigate any adverse impacts associated with the proposed action and environmental impacts of alternatives to the proposed action. In accordance with

Environmental Consequences and Mitigating Actions
4-100
10 CFR 51.53(c)(3), the ER does not need to contain an analysis of any Category 1 issue unless there is new and significant information on a specific issue. The NRC process for identifying new and significant information is described in NUREG–1555, Supplement 1, Standard Review Plans for Environmental Reviews for Nuclear Power Plants, Supplement 1: Operating License Renewal (NRC 2013f). The search for new information includes:
• review of an applicant’s ER and the process for discovering and evaluating the significance of new information;
• review of public comments;
• review of environmental quality standards and regulations;
• coordination with Federal, state, and local environmental protection and resource agencies; and
• review of technical literature. New information that the staff discovers is evaluated for significance using the criteria set forth in the GEIS. For Category 1 issues in which new and significant information is identified, reconsideration of the conclusions for those issues is limited in scope to assessment of the relevant new and significant information; the scope of the assessment does not include other facets of an issue that the new information does not affect. The NRC staff reviewed the discussion of environmental impacts associated with operation during the renewal term in the GElS and has conducted its own independent review, including a public involvement process (e.g., public meetings) to identify new and significant issues for the LSCS license renewal application environmental review. The NRC staff has not identified new and significant information on environmental issues related to operation of LSCS during the renewal term. The NRC staff also determined that information provided during the public comment period did not identify any new issue that requires site-specific assessment. The NRC staff did, however, find new, but not significant, information regarding the uranium fuel cycle issue, and this information is discussed in Section 4.15.1 and Appendix G of this SEIS.
4.15 Impacts Common to All Alternatives
This section describes the impacts that are considered common to all alternatives discussed in this SEIS, including the proposed action and replacement power alternatives. The continued operation of a nuclear power plant and replacement fossil fuel power plants both involve the mining, processing, and consumption of fuel, which results in comparative impacts (NRC 2013d). In addition, the termination of operations and the decommissioning of both a nuclear power plant and replacement fossil-fueled power plants, as well as GHG emissions, are discussed in the following sections.
4.15.1 Fuel Cycles
This section describes the environmental impacts associated with the fuel cycles of the proposed action and replacement power alternatives. Most replacement power alternatives employ a set of steps in the utilization of their fuel sources, which can include extraction, transformation, transportation, and combustion. Emissions generally occur at each stage of the fuel cycle (NRC 2013d).

Environmental Consequences and Mitigating Actions
4-101
4.15.1.1 Uranium Fuel Cycle
The uranium fuel cycle issues applicable to LSCS are discussed below and listed in Table 4–19 for Category 1 issues. Table B–1 of Appendix B to Subpart A of 10 CFR Part 51 contains more information on these issues.
Table 4–19. Issues Related to the Uranium Fuel Cycle
Issue GEIS Section Category Offsite radiological impacts—individual impacts from other than the disposal of spent fuel and high-level waste
4.12.1.1 1
Offsite radiological impacts—collective impacts from other than the disposal of spent fuel and high-level waste
4.12.1.1 1
Nonradiological impacts of the uranium fuel cycle 4.12.1.1 1 Transportation 4.12.1.1 1
Source: Table B–1 in Appendix B, Subpart A, to 10 CFR Part 51
The uranium fuel cycle includes uranium mining and milling, production of uranium hexafluoride, isotopic enrichment, fuel fabrication, reprocessing of irradiated fuel, transportation of radioactive materials, and management of low-level wastes and high-level wastes related to uranium fuel cycle activities. The generic potential impacts of the radiological and nonradiological environmental impacts of the uranium fuel cycle and transportation of nuclear fuel and wastes are described in detail in NUREG–1437 (NRC 2013d). The NRC staff did not identify any new and significant information related to the uranium fuel cycle issues “Offsite radiological impacts—individual impacts from other than the disposal of spent fuel and high level waste,” “Offsite radiological impacts—collective impacts from other than the disposal of spent fuel and high-level waste,” and “Nonradiological impacts of the uranium fuel cycle,” listed above in Table 4–19, during its review of the applicant’s ER (Exelon 2014a), the site visit, and the scoping process. Therefore, there are no impacts related to these issues beyond those discussed in the GEIS. For these Category 1 issues, the GEIS concludes that the impacts are SMALL, except for the issue, “Offsite radiological impacts—collective impacts,” to which the NRC has not assigned an impact level. This issue assesses the 100-year radiation dose to the U.S. population (i.e., collective effects or collective dose) from radioactive effluent released as part of the uranium fuel cycle for a nuclear power plant during the license renewal term compared to the radiation dose from natural background exposure. It is a comparative assessment for which there is no regulatory standard to base an impact level. The NRC staff did, however, find new information regarding the uranium fuel cycle issue “Transportation,” listed above in Table 4–19, in its review of the applicant’s ER. The NRC has generically determined, in its license renewal application reviews, that the environmental impacts of the transportation of fuel and radioactive wastes to and from nuclear power facilities are small for all reactors as long as certain specific conditions are met. The application for license renewal of LSCS stated that the specific conditions that allow the transportation impacts of spent fuel to be generically determined to be small may not be met for LSCS. Therefore, the NRC staff analyzed the environmental impacts of transporting spent fuel from LSCS in Appendix G of this SEIS. From this analysis, the NRC staff concludes that the environmental impacts of the transportation of spent fuel from LSCS would be consistent with the environmental impacts associated with the transportation of fuel and radioactive wastes to and from current-generation reactors presented in Table S–4 of 10 CFR 51.52, and thus would be SMALL.

Environmental Consequences and Mitigating Actions
4-102
4.15.1.2 Replacement Power Plant Fuel Cycles
Fossil Fuel Energy Alternatives Fuel cycle impacts for a fossil-fuel-fired plant result from the initial extraction of fuel, cleaning and processing of fuel, transport of fuel to the facility, and management and ultimate disposal of solid wastes from fuel combustion. These impacts are discussed in more detail in Section 4.12.1.2 of the GEIS (NRC 2013d) and can generally include:
• significant changes to land use and visual resources;
• impacts to air quality, including release of criteria pollutants, fugitive dust, VOCs, and coalbed methane in the atmosphere;
• noise impacts;
• geology and soil impacts due to land disturbances and mining;
• water resource impacts, including degradation of surface water and groundwater quality;
• ecological impacts, including loss of habitat and wildlife disturbances;
• historic and cultural resources impacts within the mine footprint;
• socioeconomic impacts from employment of both the mining workforce and service and support industries;
• environmental justice impacts;
• health impacts to workers from exposure to airborne dust and methane gases; and
• generation of coal and industrial wastes. New Nuclear Energy Alternatives Uranium fuel cycle impacts for a nuclear plant result from the initial extraction of fuel, transport of fuel to the facility, and management and ultimate disposal of spent fuel. The environmental impacts of the uranium fuel cycle are discussed above in Section 4.15.1.1. Renewable Energy Alternatives The “fuel cycle” for renewable energy facilities is difficult to define for technologies such as wind and solar because these natural resources exist regardless of any effort to harvest them for electricity production. Impacts from the presence or absence of these renewable energy technologies are often difficult to determine (NRC 2013d).
4.15.2 Terminating Power Plant Operations and Decommissioning
This section describes the environmental impacts associated with the termination of operations and the decommissioning of a nuclear power plant and replacement power alternatives. All operating power plants will terminate operations and be decommissioned at some point after the end of their operating life or after a decision is made to cease operations. For the proposed action, license renewal would delay this eventuality for an additional 20 years beyond the current license period, which ends in 2022 and 2023 for LSCS Units 1 and 2, respectively. 4.15.2.1 Existing Nuclear Power Plant
Environmental impacts from the activities associated with the decommissioning of any reactor before or at the end of an initial or renewed license are evaluated in Supplement 1 of

Environmental Consequences and Mitigating Actions
4-103
NUREG–0586 (NRC 2002). Additionally, the incremental environmental impacts associated with decommissioning activities resulting from continued plant operation during the renewal term are discussed in the GEIS. Table 4–20 lists the Category 1 issue in Table B–1 of Title 10 of the CFR Part 51, Subpart A, Appendix B, that is applicable to LSCS decommissioning following the license renewal term.
Table 4–20. Issues Related to Decommissioning
Issue GEIS Section Category Termination of plant operations and decommissioning 4.12.2.1 1
Source: Table B–1 in Appendix B, Subpart A, to 10 CFR Part 51
Decommissioning would occur whether LSCS were shut down at the end of its current operating license or at the end of the period of the license renewal term. Exelon stated in its ER (Exelon 2014a) that it is not aware of any new and significant information on the environmental impacts of LSCS during the license renewal term. The NRC staff has not found any new and significant information during its independent review of Exelon’s ER, the site visit, or the scoping process. Therefore, the NRC staff concludes that there are no impacts related to decommissioning, beyond those discussed in the GEIS, which concluded that the impacts are SMALL. 4.15.2.2 Replacement Power Plants
Fossil Fuel Energy Alternatives The environmental impacts from the termination of power plant operations and decommissioning of a fossil-fuel-fired plant are dependent on the facility’s decommissioning plan. General elements and requirements for a fossil fuel plant decommissioning plan are discussed in Section 4.12.2 of the GEIS and can include the removal of structures to at least 3 ft (1 m) below grade; removal of all coal, combustion waste, and accumulated sludge; removal of intake and discharge structures; and the cleanup and remediation of incidental spills and leaks at the facility. The decommissioning plan outlines the actions necessary to restore the site to a condition equivalent in character and value to the greenfield or brownfield site on which the facility was first constructed (NRC 2013d). The environmental consequences of decommissioning are discussed in Section 4.12.2 of the GEIS and can generally include:
• short-term impacts on air quality and noise from the deconstruction of facility structures,
• short-term impacts on land use and visual resources,
• long-term reestablishment of vegetation and wildlife communities,
• socioeconomic impacts due to the decommissioning workforce and the long-term loss of jobs, and

Environmental Consequences and Mitigating Actions
4-104
• elimination of health and safety impacts on operating personnel and the general public.
New Nuclear Alternative Termination of operations and decommissioning impacts for a nuclear plant include all activities related to the safe removal of the facility from service and the reduction of residual radioactivity to a level that permits release of the property under restricted conditions or unrestricted use and termination of a license (NRC 2013d). The environmental impacts of the uranium fuel cycle are discussed above in Section 4.15.1.1. Renewable Alternative Termination of power plant operation and decommissioning for renewable energy facilities would be similar to the impacts discussed for fossil-fuel-fired plants above. Decommissioning would involve the removal of facility components and operational wastes and residues in order to restore the site to a condition equivalent in character and value to the greenfield or brownfield site on which the facility was first constructed (NRC 2013d).
4.15.3 Greenhouse Gas Emissions and Climate Change
The following sections discuss GHG emissions and climate change impacts. Section 4.15.3.1 evaluates GHG emissions associated with operation of LSCS and replacement power alternatives. Section 4.15.3.2 discusses the observed changes in climate, the potential future climate change during the license renewal term based on climate model simulations under future global GHG emission scenarios, and the impacts of climate change on affected resources. The cumulative impacts of global GHG emissions on climate are discussed in Section 4.16.11, “Global Climate Change.” 4.15.3.1 Greenhouse Gas Emissions from the Proposed Project and Alternatives
Gases found in the Earth’s atmosphere that trap heat and play a role in the Earth’s climate are collectively termed GHG. GHGs include carbon dioxide (CO2); methane (CH4); nitrous oxide (N2O); water vapor (H2O); and fluorinated gases, such as hydrofluorocarbons (HFCs), perfluorocarbons (PFCs), and sulfur hexafluoride (SF6). The Earth’s climate responds to changes in concentrations of GHGs in the atmosphere because GHGs affect the amount of energy absorbed and heat trapped by the atmosphere. Increasing GHG concentrations in the atmosphere generally increases Earth’s surface temperature. Atmospheric concentrations of carbon dioxide, methane, and nitrous oxide have significantly increased since 1750 (IPCC 2007c, 2013). Carbon dioxide, methane, nitrous oxide, water vapor, and fluorinated gases (termed long-lived GHGs) are well mixed throughout the Earth’s atmosphere, and their impact on climate is long lasting as a result of their long atmospheric lifetime (EPA 2009a). Carbon dioxide is of primary concern for global climate change, due to its long atmospheric lifetime, and it is the primary gas emitted as a result of human activities. Climate change research indicates that the cause of the Earth’s warming over the last 50 years is due to the buildup of GHGs in the atmosphere resulting from human activities (USGCRP 2014; IPCC 2013). The EPA has determined that GHGs “may reasonably be anticipated both to endanger public health and to endanger public welfare” (74 FR 66496). Proposed Action Operation of LSCS emits GHGs directly and indirectly. LSCS’s direct GHG emissions result from stationary combustion sources (i.e., diesel generators on site), refrigerant appliances that contain fluorinated gases, LSCS’s carbon dioxide injection system and fire protection system, and use of sulfur hexafluoride to locate leaks in condensers (Exelon 2015d). Indirect GHG

Environmental Consequences and Mitigating Actions
4-105
emissions originate from mobile combustion sources (employee vehicle GHG emissions and nonroad equipment) and purchased electricity generated off site. Annual direct GHG emissions at LSCS and indirect GHG emissions attributable to purchased electricity generated off site are presented in Table 4–21 for the 2010 to 2014 timeframe. Employee vehicle GHG emissions are not provided in Table 4–21 because Exelon does not compile or report GHG data for mobile sources. The NRC staff estimates annual GHG emissions resulting from employee vehicles to be approximately 9,400 metric tons (MT) per year of carbon dioxide equivalent emissions.
Table 4–21. Estimated GHG Emissions from Operations at LSCS (MT/yr of CO2e)
Year Stationary Combustion
Sources(a) Fugitive
Emissions(b) Purchased Electricity(c)
Refrigerant-Related Sources(d) Total
2010 1,022 1,355 34,260 1,104 37,741 2011 322 2,980 33,493 629 37,424 2012 350 1,792 36,066 360 38,568 2013 245 2,508 30,520 955 34,228 2014 605 4,566 32,978 474 38,623
(a) Stationary combustion sources include emissions from large (greater than 600 horsepower) and small (less than 600 horsepower) diesel engines. These emissions were calculated based on fuel-use data and EPA AP-42 emission factors.
(b) Fugitive emissions account for LSCS’s (1) CO2 injection system used to adjust pH in the cooling pond, (2) the CO2 fire protection system, and (3) SF6 used to locate leaks in the condensers. These emissions assume that all purchased CO2 and SF6 were released.
(c) Purchased electricity emissions were calculated based on monthly billings from the offsite electricity supplier for LSCS.
(d) Refrigerant-related sources include emissions from direct HFC/PFC refrigerants and ozone-depleting refrigerants. The emissions assume all purchased refrigerants were released.
Key: MT/yr of CO2e = metric ton(s) per year of carbon dioxide equivalent (emissions).
Source: Exelon 2015d
No-Action Alternative As discussed in previous no-action alternative sections, the no-action alternative represents a decision by the NRC not to renew the operating license of a nuclear power plant beyond the current operating license term. At some point, all nuclear plants will terminate operations and undergo decommissioning. Under the no-action alternative, plant operations for LSCS would terminate at or before the end of the current license term. When the plant stops operating, a reduction in GHG emissions from activities related to plant operation, such as use of diesel generators and employee vehicles, will occur. The GHG emissions are anticipated to be less than those presented in Table 4–21. New Nuclear Alternative As discussed in Section 2.2.2.1, the NRC staff evaluated the new nuclear power plant alternative that would consist of two units with an approximate generating capacity of 1,120 megawatt electric (MWe) each. The GEIS (NRC 2013d) presents life-cycle GHG emissions associated with nuclear power generation. As presented in Tables 4.12–4

Environmental Consequences and Mitigating Actions
4-106
through 4.12–6 of the GEIS, life-cycle5 GHG emissions from nuclear power generation can range from 1 to 288 grams of carbon equivalent per kilowatt hour (g Ce/kWh). Operation of nuclear power plants does not burn fossil fuels to generate electricity and, therefore, does not emit GHG emissions. Sources of GHG emissions include stationary combustion sources (e.g., emergency diesel generators and diesel-driven pumps) and mobile sources (e.g., worker vehicles, onsite heavy equipment, support vehicles, delivery of materials, and disposal of wastes). It is anticipated that air emissions from a new nuclear power plant would be similar to those from LSCS. IGCC Generation Alternative As discussed in Section 2.2.2.2, the NRC staff evaluated the IGCC plant alternative that would consist of four 618-MWe units for a total 2,472 MW. The GEIS presents life-cycle GHG emissions associated with coal power generation. As presented in Table 4.12–4 of the GEIS, life-cycle GHG emissions from coal power generation can range from 264 to 1,689 g Ceq/kWh. However, these life-cycle emission factors are for conventional coal power plants; recent studies estimate life-cycle GHG emissions for an IGCC plant to be 937 kilograms of carbon dioxide equivalent per megawatt-hour (kg CO2e/MWh) (NETL 2012). The NRC staff estimates that operation of the IGCC alternative directly will emit about 14.3 million tons per year (13.0 million MT per year) of carbon dioxide equivalent emissions. NGCC Generation Alternative As discussed in Section 2.2.2.3, the NRC staff evaluated an NGCC alternative that consists of five NGCC 560-MWe units (total 2,800 MWe). The GEIS presents life-cycle GHG emissions associated with natural gas power generation. As presented in Table 4.12–5 of the GEIS, life-cycle GHG emissions from natural gas can range from 120 to 930 g Ceq/kWh. The NRC staff estimates that operation of the NGCC alternative directly will emit about 9.8 million tons (8.2 million MT) per year of carbon dioxide equivalent emissions. Combination Alternative (NGCC, Wind, and Solar) As discussed in Section 2.2.2.4, the NRC staff evaluated an alternative that relies on NGCC (15 percent), wind (75 percent), and solar (10 percent) capacity to replace LSCS. The combination alternative would consist of a 360-MWe NGCC unit, a 227-MWe solar PV facility, and a 1,813-MWe windfarm. For this combination alternative, it is assumed that the majority of the GHG emissions result from the NGCC portion only because renewable portions (wind and solar PV) do not burn fossil fuels to generate electricity. As discussed in Section 4.3.5., GHG emissions associated with the operation of the NGCC portion are reduced proportionally because its electricity output is approximately 13 percent that of the NGCC alternative. The NRC staff estimates that operation of the combination alternative will directly result in about 1.3 million tons (1.2 million MT) per year of carbon dioxide equivalent emissions. Purchased Power Alternative Purchased power would come from common types of existing technology (coal, natural gas, nuclear, and renewable sources) within the ROI. GHG emissions from purchased power will vary and will depend on the type and combination of technology from which purchased power originates. In 2014, coal, natural gas, and nuclear power accounted for 39-, 27-, and 19-percent shares, respectively, of total U.S. electricity generation (EIA 2015b). Using these percentage shares for the purchased power alternative, the NRC staff estimates 8.0 million ton (7.3 million MT) per year of carbon dioxide equivalent emissions. However, GHG emissions
5 Life-cycle carbon emissions analyses consider construction, operation, decommissioning, and
associated processing of fuel (e.g., gas and coal).

Environmental Consequences and Mitigating Actions
4-107
may be greater or less than this estimate and will depend on the technology from which the purchased power originates. Summary of GHG Emissions from the Proposed Action and Alternatives Table 4–22 presents the direct GHG emissions from operation of the proposed action and alternatives. GHG emissions from the proposed action (license renewal) and the new nuclear alternative would be the lowest. GHG emissions for IGCC, NGCC, combination, and purchased power alternatives are higher than those for the proposed action and a new nuclear alternative by several orders of magnitude. GHG emissions from the purchased power alternative are expected to be greater than those from the NGCC alternative but less than those from the IGCC alternative.
Table 4–22. Direct(a) GHG Emissions from Operation of the Proposed Action and Alternatives
Technology CO2e (MT/yr) LSCS license renewal(a) 5.7x10³ New Nuclear(b) 5.7x10³ IGCC(c) 13.0x10⁶ NGCC(c) 8.2x10⁶ Combination(d) 1.2x10⁶ Purchased Power(e) 7.3x10⁶ (a) Emissions rounded up from the stationary combustion sources, fugitive, and refrigerant
related sources emissions (i.e., direct emissions) for the year 2014 from Table 4–21. Purchased electricity-related GHG emissions presented in Table 4–21 are indirect emissions from the offsite electricity supplier for LSCS. Therefore, in order to provide a commensurate comparison of direct GHG emissions of the proposed action (LSCS license renewal) and the alternatives (i.e., the combustion of natural gas or coal) only the direct emissions from LSCS are presented in this table.
(b) Emissions assumed similar to LSCS operation. (c) The GHG emissions for the NGCC and IGCC alternatives presented include emissions
resulting from direct combustion of gas and coal, respectively. (d) This is only the NGCC portion of GHG emissions. (e) Air emissions were estimated by assuming that purchased-power coal accounted for a
39-percent share, natural gas accounted for a 27-percent share, nuclear accounted for a 19-percent share, and renewables accounted for a 15-percent share of electricity generation.
4.15.3.2 Climate Change Impacts to Resource Areas
Climate change is the decades or longer change in climate measurements (e.g., temperature and precipitation) that has been observed on a global, national, and regional level (IPCC 2007c; EPA 2014; USGCRP 2014). Climate change can vary regionally, spatially, and seasonally, depending on local, regional, and global factors. Just as regional climate differs throughout the world, the impacts of climate change can vary between locations. On a global level, from 1901 to 2013, average surface temperatures rose at a rate of 0.15 ˚F (0.08 ˚C) per decade, and total annual precipitation increased at an average rate of 0.2 percent per decade (EPA 2014). The observed global change in average surface temperature and precipitation has been accompanied by an increase in sea surface temperatures, a decrease in global glacier ice, an increase in sea level, and changes in extreme weather events. Such

Environmental Consequences and Mitigating Actions
4-108
extreme events include an increase in the frequency of heat waves, heavy precipitation, and recorded maximum daily high temperatures (IPCC 2007c; USGCRP 2009, 2014; EPA 2014). In the United States, the U.S. Global Change Research Program (USGCRP) reports that, from 1895 to 2012, average surface temperature increased by 1.3 °F to 1.9 °F (0.72 to 1.06 °C) and, since 1900, average annual precipitation has increased by 5 percent. On a seasonal basis, warming has been the greatest in winter and spring. Since the 1980s, an increase in the length of the frost-free season, the period between the last occurrence of 32 ˚F (0 °C) in the spring and first occurrence of 32 ˚F (0 °C) in the fall, has been observed for the contiguous United States; between 1991 and 2011, the average frost-free season was 10 days longer than between 1901 and 1960 (USGCRP 2014). Since the 1970s, the United States has warmed at a faster rate as the average surface temperature rose at an average rate of 0.31 to 0.45 ˚F (0.17 to 0.25 °C) per decade (EPA 2014). The year 2014 was the warmest on record (AMS 2015). Observed climate-related changes in the United States include increases in the frequency and intensity of heavy precipitation, earlier onset of spring snowmelt and runoff, rise of sea level in coastal areas, increase in occurrence of heat waves, and a decrease in occurrence of cold waves (USGCRP 2014). Temperature data indicate that the Midwest region, where LSCS is located, experienced a 0.06 ˚C (0.11 ˚F) per decade increase in annual mean temperature during the 1900 to 2010 period (NOAA 2013). Temperature data for the recent past indicate an increased rate of warming for the Midwest region of 0.12 °C (0.22 °F) per decade for the 1950-to-2010 time period and a 0.26 ˚C (0.47 ˚F) temperature increase for the 1979-to-2010 time period. Average annual precipitation data for the Midwest region exhibit an increasing trend of 0.31 in. (0.79 cm) per decade for the long-term period (1895 to 2011) (NOAA 2013). The NRC staff analyzed temperature and precipitation trends for the period of 1865 to 2014 in the northeast region (Climate Division No. 2) of Illinois (NCDC 2015). Average annual temperatures during this time period show large year-to-year variations; however, since 1865, temperatures have increased 0.1 °F (0.05 °C) per decade. Average annual precipitation also displays year-to-year variations, although precipitation has increased at a rate of 0.48 in. (1.2 cm) per decade. Future global GHG emission concentrations (emission scenarios) and climate models are commonly used to project possible climate change. Climate models indicate that over the next few decades, temperature increases will continue due to current GHG emission concentrations in the atmosphere (USGCRP 2014). Over the longer term, the magnitude of temperature increases and climate change effects will depend on both past and future global GHG emissions (IPCC 2007c; USGCRP 2009, 2014). For the license renewal period of LSCS, Units 1 and Unit 2 (2022 to 2042 and 2023 to 2043, respectively), climate model simulations (between 2021 and 2050 relative to the reference period (1971 to 1999)) indicate an increase in annual mean temperature in the Midwest region of 2.5 to 3.5 ˚F (4.5 to 6.3 °C) for both a low- and high-emission-modeled scenario (NOAA 2013). The predicted increase in temperature during this time period occurs for all seasons, with the largest increase occurring in the summertime (June, July, and August). Climate model simulations (for the time period 2021 to 2050) suggest spatial differences in annual mean precipitation changes for the Midwest, with northern areas experiencing an increase in precipitation and with the southern areas experiencing a decrease in precipitation. For Illinois, the models indicate a 0- to 3-percent increase in annual mean precipitation, with fall, winter, and spring seasons experiencing precipitation change increases and with the summer season experiencing a decrease in precipitation. However, these changes in precipitation were only statistically significant under a high-emission-modeled scenario (NOAA 2013).
Environmental Consequences and Mitigating Actions
4-109
The implications of climate change on LSCS operations are outside the scope of the NRC’s license renewal environmental review, which documents the potential environmental impacts from continued reactor operations. Site-specific environmental conditions are considered when siting nuclear power plants, including consideration of meteorological and hydrologic siting criteria in 10 CFR Part 100. LSCS was designed and constructed in accordance with the General Design Criteria of Appendix A to 10 CFR Part 50. NRC regulations require that plant structures, systems, and components important to safety be designed to withstand the effects of natural phenomena, such as flooding, without loss of capability to perform safety functions. Furthermore, nuclear power plants are required to operate within technical safety specifications in accordance with the NRC operating license, including coping with natural phenomena hazards. The NRC conducts safety reviews before allowing licensees to make operational changes due to changing environmental conditions. Additionally, the NRC evaluates nuclear power plant operating conditions and physical infrastructure to ensure ongoing safe operations through its Reactor Oversight Process. If new information about changing environmental conditions becomes available, the NRC will evaluate the new information to determine whether any safety-related changes are needed at existing nuclear power plants. This process is separate and distinct from the NRC’s license renewal environmental review that is conducted in accordance with NEPA (42 U.S.C. 4321 et seq.). Changes in climate have broader implications for public health, water resources, land use and development, and ecosystems. For instance, changes in precipitation patterns and an increase in air temperature can affect water availability and quality, distribution of plant and animal species, land-use patterns, and land cover; these impacts can, in turn, affect terrestrial and aquatic habitats. The sections below discuss how future climate change may impact air quality, land use, water resources, aquatic resources, terrestrial resources, human health, and minority and low-income populations in the ROI for LSCS. Although the future effects of climate change are uncertain, the following discussions describe the potential implications of climate change in affected environmental resource areas. Air Quality As discussed above, an increase in average temperatures in Illinois has been observed. Despite the strong year-to-year variations, climate models project continued warming in the Midwest region during the license renewal period. Air pollutant concentrations result from complex interactions between physical and dynamic properties of the atmosphere, land, and ocean. The formation, transport, dispersion, and deposition of air pollutants depend, in part, on weather conditions (IPCC 2007a). Air pollutant concentrations are sensitive to winds, temperature, humidity, and precipitation (EPA 2009a). Hence, climate change can impact air quality as a result of the changes in meteorological conditions. Ozone has been found to be particularly sensitive to climate change (IPCC 2007a; EPA 2009b). Ozone is formed, in part, as a result of the chemical reaction of nitrogen oxides and VOCs in the presence of heat and sunlight. Nitrogen oxides and VOC sources include both natural emissions (e.g., biogenic emissions from vegetation or soils) and human-activity-related emissions (e.g., motor vehicles and power plants). Sunshine, high temperatures, and air stagnation are favorable meteorological conditions to produce higher levels of ozone (IPCC 2007a; EPA 2009a). The emission of ozone precursors also depends on temperature, wind, and solar radiation (IPCC 2007a); both nitrogen oxide and biogenic VOC emissions are expected to be higher in a warmer climate (EPA 2009b). Although surface temperatures are expected to increase in the Midwest, this may not necessarily result in an increase in ozone concentrations. The observed correlation between increased ozone concentrations and temperature has been found to occur in polluted and urban regions (i.e., those areas where ozone concentration are greater than 60 parts per billion). Additionally, increases in ozone

Environmental Consequences and Mitigating Actions
4-110
concentrations correlated with temperature increases occur in combination with cloud-free regions and air stagnation episodes (Jacob and Winner 2009; IPCC 2013). Furthermore, climate models do not agree on the sign of ozone response to climate change. Some models indicate increases in ozone concentrations with climate change for the Midwest and Northeast (e.g., Wu et al. 2008), and others project decreases in ozone concentrations with climates for the northern regions of the United States (e.g., Tagaris et al. 2009). Land Use Anthropogenic land use is both a contributor to climate change and a receptor of climate change impacts (Dale 1997). As described previously in this section, the Midwest will likely experience rising temperatures and heavier precipitation events during the proposed license renewal period. Agriculture (the major land use in the vicinity of LSCS) and growing urban areas will further exacerbate these changes by continuing to inhibit natural ecosystem functions that could moderate climate change effects. For instance, air temperatures and near-surface moisture levels change in areas where natural vegetation is converted to agricultural use, and higher temperatures have been observed in the Midwest as a result of converting land to agricultural use (USGCRP 2014). The USGCRP (2014) indicates that land use changes, such as the continued expansion of urban areas, paired with climate change effects, such as heavier precipitation events, can exacerbate climate change effects, including reduced water filtration into the soil and increased surface runoff. Although anthropogenic land uses will contribute to climate change in these and other ways, land uses will also be affected by climate change in several ways. For instance, plant winter hardiness zones are likely to shift one-half to one full zone by the end of the proposed license renewal period (USGCRP 2014). This shift will affect the ability to grow certain crops as the Midwest will likely contain plants now associated with the Southeast by the end of the century (USGCRP 2014). Additionally, the USGCRP (2014) projects that the Midwest will experience a loss in cropland cover and an expansion in exurban and suburban areas. Changes in cropland cover and expansion of exurban and suburban areas could then reduce the quality and availability of land resources and agricultural productivity. Water Resources Predicted changes in the timing, intensity, and distribution of precipitation will likely result in changes in surface water runoff affecting water availability across the Midwest. As discussed above, the Midwest may experience an increase in mean precipitation during the fall, winter, and spring and an increase in the frequency and intensity of extreme (heavy) precipitation (USGCRP 2014). As cited by the USGCRP, in spite of increased annual average precipitation, the loss of moisture from soils because of higher temperatures, along with increased evapotranspiration from vegetation and the increased average number of days without precipitation, is likely to intensify short-term (seasonal or shorter) droughts across the region into the future (USGCRP 2009, 2014). Such conditions can potentially reduce the amount of water available for surface runoff and streamflow on a seasonal timeframe. Runoff and streamflow at a regional scale for the Midwest region indicate no clear trend during the last half century; however, annual runoff and river flow are projected to increase in the upper Midwest. Climate change impacts on groundwater availability depend on basin geology, frequency and intensity of high-rainfall periods, recharge, soil moisture, and groundwater and surface water interactions (USGCRP 2014). Precipitation and evapotranspiration are key drivers in aquifer recharge. Increased precipitation in the fall, winter, and spring is likely to result in increased groundwater recharge. More precipitation during these seasons (as opposed to summer) would percolate into the groundwater because it would experience lower evaporation and transpiration rates. Furthermore, a portion of the winter precipitation would fall as snow. Instead of running

Environmental Consequences and Mitigating Actions
4-111
off the land, much of the snow is likely to slowly melt in place and contribute to groundwater recharge. Terrestrial Resources As described above, the Midwest will likely experience rising temperatures and heavier precipitation events during the proposed license renewal period. As the climate changes, terrestrial resources will either need to be able to tolerate the new physical conditions or shift their population range to new areas with a more suitable climate. Scientists currently estimate that species are shifting their ranges at a rate of 20 to 36 ft (6.1 to 11 m) in elevation per decade and 3.8 to 10.5 mi (6.1 to 16.9 km) in latitude per decade (Chen et al. 2011; Thuiller 2007). Although some species may readily adapt to a changing climate, others may be more prone to experience adverse effects. For example, species whose ranges are already limited by habitat loss or fragmentation or who require very specific environmental conditions may not be able to successfully shift their ranges over time. Migratory birds that travel long distances may also be disproportionately affected because they may not be able to pick up on environmental clues that a warmer, earlier spring is occurring in the United States while overwintering in tropical areas. Fraser et al. (2013) found that songbirds overwintering in the Amazon did not leave their winter sites earlier, even when spring sites in the eastern United States experienced a warmer spring. As a result, the song birds missed periods of peak food availability. For many Midwest species, migration to changed habitats is projected to be slow due to flat topography, high latitudes, and fragmented habitats (USGCRP 2014). For instance, in its final rule to list the red knot (Calidris canutus rufa), a shorebird that uses the Great Lakes during spring and fall migration, FWS cites several effects resulting from climate change as factors contributing to the species’ decline (79 FR 73705). These effects include habitat loss from sea level rise, asynchronies in the timing of annual cycles, and increased frequency of severe storm events. Special status species and habitats, such as those that are Federally protected by the ESA, would likely be more sensitive to climate changes because these species’ populations are already experiencing threats that are endangering their continued existence throughout all, or a significant portion of their ranges. Habitat ranges for forest systems in the Midwest, such as paper birch (Betula papyrifera), balsam fir (Abies balsamea), and black spruce (Picea mariana), are projected to decline across the Midwest as they shift northward, and species that are common farther south, such as oaks (Quercus spp.) and pines (Pinus spp.), will expand their range north into the Midwest region (USGCRP 2014). Climate changes could also favor non-native, invasive species and promote population increases of insect pests and plant pathogens, which may be more tolerant to a wider range of climate conditions. Aquatic Resources The potential effects of climate change, whether from natural cycles or manmade activities, could result in changes that could affect aquatic resources in the Illinois River. Raised air temperatures could result in higher water temperatures in the cooling pond and in the Illinois River and its tributaries. Higher water temperatures would increase the potential for thermal effects on aquatic biota, such as fish kills within the cooling pond, and could exacerbate existing environmental stressors, such as excess nutrients, sedimentation, and lowered dissolved oxygen associated with eutrophication (USGCRP 2014). The Midwest will likely experience an increased frequency of extreme rainfall events, which will cause erosion and could lead to a decline in water quality (USGCRP 2014). Species that require cleaner waters, such as freshwater mussels, could experience further population declines. The USGCRP (2014) predicts habitat loss and local extinctions of fish and other aquatic species throughout the United States from the combined effects of water withdrawal and climate change. Shifts in species assemblages and distributions are also likely as climate change continues (USGCRP 2014), which could alter the balance of the aquatic community in the Illinois River.

Environmental Consequences and Mitigating Actions
4-112
As discussed below under the section entitled, “Terrestrial Resources,” special status species, such as those that are Federally protected under the ESA (16 U.S.C. 1531 et seq.), would be more sensitive to climate changes. Invasions of non-native species that thrive under a wide range of environmental conditions and warmer waters could further disrupt the current composition of aquatic communities (NRC 2013d). Historic and Cultural Resources Increases in river levels because of changes in meteorological conditions due to climate change could result in the loss of historic and cultural resources from flooding, erosion, or inundation. Due to water-level changes, some resources could be lost before they could be documented or otherwise studied. However, the limited extent of climate change that may occur during the 20-year license renewal term would not likely result in any significant loss of historic and cultural resources at LSCS. Socioeconomics Rapid changes in climate conditions could have an impact on the availability of jobs in certain industries. For example, tourism and recreation are major job creators in some regions, bringing billions of dollars to regional economies. Across the Nation, fishing, hunting, and other outdoor activities make important economic contributions to rural economies and are also a part of the cultural tradition. A changing climate would mean reduced opportunities for some activities in some locations and expanded opportunities for others. Hunting and fishing opportunities could also change as animals’ habitats shift and as relationships among species are disrupted by their different responses to climate change (USGCRP 2014). Water-dependent recreation could also be affected (USGCRP 2009). The USGCRP reports that increasing heat and humidity associated with climate change in parts of the Midwest region by the year 2050 could create unfavorable conditions for summertime outdoor recreation and tourism activity (USGCRP 2014). However, the limited extent of climate change that may occur during the 20-year license renewal term would not likely cause any significant changes in socioeconomic conditions in the vicinity of LSCS. Human Health Increasing temperatures due to changes in climate conditions could have an impact on human health. However, changes in climate conditions that may occur during the license renewal term will not result in any significant change to the impacts discussed in Section 4.11.1 from LSCS’s radioactive and nonradioactive effluents. Environmental Justice Rapid changes in climate conditions could disproportionately affect minority and low-income populations. The USGCRP (2009) indicates that “infants and children, pregnant women, the elderly, people with chronic medical conditions, outdoor workers, and people living in poverty are especially at risk from a variety of climate-related health effects.” Examples of these effects include increased heat stress; air pollution; extreme weather events; and diseases carried by food, water, and insects. The greatest health burdens related to climate change are likely to fall on the poor, especially those lacking adequate shelter and access to other resources, such as air conditioning. Elderly people on fixed incomes, who are more likely to be poor, are more likely to have debilitating chronic diseases or limited mobility. In addition, the elderly have a reduced ability to regulate their own body temperature or the ability to sense when they are too hot. According to the USGCRP (2009), the elderly “are at greater risk of heart failure, which is further exacerbated when cardiac demand increases in order to cool the body during a heat wave.” The USGCRP (2009) also found that people taking medications, such as diuretics for

Environmental Consequences and Mitigating Actions
4-113
high blood pressure, have a higher risk of dehydration. The USGCRP (2014) reconfirmed the previous report findings regarding the risks of climate change on low-income populations and also warns that climate change could affect the availability and access to local plant and animal species, thus impacting the people who have historically depended on them for food or medicine. However, minority and low-income populations at LaSalle are not likely to experience disproportionately high and adverse impacts from climate change, based on the expected small or slow change, effectively, in the environment during the 20-year license renewal term.
4.16 Cumulative Impacts of the Proposed Action
The NRC staff considered potential cumulative impacts in the environmental analysis of continued operation of LSCS during the 20-year license renewal period. Cumulative impacts may result when the environmental effects associated with the proposed action are overlaid or added to temporary or permanent effects associated with other past, present, and reasonably foreseeable actions. Cumulative impacts can result from individually minor, but collectively significant, actions taking place over a period of time. An impact that may be SMALL by itself possibly could result in a MODERATE or LARGE cumulative impact when it is considered in combination with the impacts of other actions on the affected resource. Likewise, if a resource is regionally declining or imperiled, even a SMALL individual impact could be important if it contributes to, or accelerates, the overall resource decline. For the purposes of this cumulative analysis, past actions are those before the receipt of the license renewal application; present actions are those related to the resources at the time of current operation of the power plant; and future actions are those that are reasonably foreseeable through the end of plant operation, including the period of extended operation. Therefore, the analysis considers potential impacts through the end of the current license terms, as well as the 20-year license renewal term. The geographic area over which past, present, and reasonably foreseeable actions would occur depends on the type of action considered and is described below for each resource area. To evaluate cumulative impacts, the incremental impacts of the proposed action, as described in Sections 4.2 to 4.15, are combined with other past, present, and reasonably foreseeable future actions, regardless of which agency (Federal or non-Federal) or person undertakes such actions. The NRC staff used the information provided in Exelon’s ER; responses to RAIs; information from other Federal, State, and local agencies; scoping comments; and information gathered during visits to the LSCS site to identify other past, present, and reasonably foreseeable actions. For a project to be considered in the cumulative analysis, the NRC staff determined whether it would occur within the noted geographic areas of interest and within the period of extended operation, whether it was reasonably foreseeable, and whether there would be a potential overlapping effect with the proposed project. For past actions, consideration within the cumulative impacts assessment is resource and project specific. In general, the effects of past actions are included in the description of the affected environment in Chapter 3, which serves as the baseline for the cumulative impacts analysis. However, past actions that continue to have an overlapping effect on a resource that potentially could be affected by the proposed action are considered in the cumulative analysis. Appendix E describes other actions and projects identified during this review and considered in the NRC staff’s analysis of the potential cumulative effects. Not all actions or projects listed in Appendix E are considered in each resource area because of the uniqueness of the resource and its geographic area of consideration.
Environmental Consequences and Mitigating Actions
4-114
4.16.1 Air Quality and Noise
This section addresses the direct and indirect effects of license renewal on air quality and noise when added to the aggregate effects of other past, present, and reasonably foreseeable future actions. As described in Section 4.3.1, the incremental impacts on air quality and noise levels from the proposed license renewal would be SMALL. 4.16.1.1 Air Quality
The geographic area considered in the cumulative air quality analysis is the county where the proposed action is located, as air quality designations for criteria air pollutants are generally made at the county level. Counties are further grouped together based on a common airshed—known as an Air Quality Control Region (AQCR)—to provide for the attainment and maintenance of the NAAQS. LSCS is located in LaSalle County, Illinois, which is part of the North Central Illinois Intrastate AQCR (40 CFR 81.262). With regard to NAAQS criteria pollutants, LaSalle County and the entire North Central Illinois Intrastate AQCR are designated as attainment for all NAAQS (40 CFR 81.314). According to EPA’s Enforcement and Compliance History Online, there are 20 facilities designated as major6 air emission sources, 9 synthetic minor air emissions sources, and 160 facilities designated as minor air emission sources located in LaSalle County (EPA 2015b). LSCS, as discussed in Section 3.3.2 of this SEIS, is a synthetic minor air source. Air emissions from permitted sources at LSCS are presented in Chapter 3, Table 3–4. There will be no refurbishment-related activities during the license renewal period. Additionally, Exelon does not anticipate equipment or operational upgrades or replacement activities that would increase air emissions during the license renewal term (Exelon 2015c). As a result, the NRC staff expects emissions from LSCS during the license renewal period to be similar to those emissions presented in Section 3.3.2. Appendix E provides a list of current projects and reasonably foreseeable future actions that could contribute to cumulative impacts to air quality. Air emissions sources that contribute to air quality identified in Appendix E are currently operating and, given the designated attainment status for all NAAQS in LaSalle County, these emissions have not contributed to a violation of the NAAQS. Consequently, cumulative impacts to air quality in LaSalle County would be the result of changes to present-day emissions and future actions within the county. Development and construction activities associated with regional growth of housing, business, and industry, as well as associated vehicular traffic, can increase air emissions. Regional air quality conditions could deteriorate from the effects of the growth of the county as construction activities give rise to dust, exhaust, and emissions that can degrade air quality. Population growth is estimated to increase by 4 percent per decade in LaSalle County (LaSalle County 2014). Air quality effects of development are monitored through the statewide ambient air quality monitoring network. If degradation in air quality is observed, the IEPA can develop air quality control programs to mitigate the effects of development. Furthermore, any new stationary sources of emissions that would be established in the region would be required to apply for an air permit from the IEPA and be operated in accordance with regulatory requirements. IEPA will examine the potential air quality impacts using various modeling tools to assess any potential changes to compliance with the NAAQS prior to issuing an air permit to a new source (or to an existing source that proposes to undergo significant modification).
6 Major sources emit or have the potential to emit 10 tons per year of any one hazardous air pollutant
(HAP), 25 tons per year of any combination of HAPs, or 100 tons per year of any other regulated air contaminant. A minor source has a potential to emit that is less than the major source thresholds. A minor synthetic source is an air pollution source that has a Federally Enforceable State Operating Permit (FESOP) with conditions that legally restrict its potential to emit to below threshold levels.

Environmental Consequences and Mitigating Actions
4-115
Climate change can impact air quality as a result of changes in meteorological conditions. Air pollutant concentrations are sensitive to winds, temperature, humidity, and precipitation (EPA 2009a). As discussed in Section 4.15.3.2, ozone levels have been found to be particularly sensitive to climate change influences (EPA 2009b; IPCC 2007c). Climate change may make it difficult for regions to meet ozone NAAQS (USGCRP 2009). However, as discussed in Section 4.15.3, while surface temperatures are expected to increase in the Midwest, this may not necessarily result in an increase in ozone concentrations. Changes in air emission concentrations will depend on the combination of higher temperatures, current levels of ozone (increases in ozone concentrations and temperature correlations have been observed in urban regions), stagnant air masses, sunlight, and emissions of pollutant precursors. Furthermore, climate models do not agree on the direction of ozone changes (increase or decrease) in response to climate change for the Midwest (Wu et al. 2008; Tagaris et al. 2009). Because of the small quantity of emissions from LSCS and that no emissions increase associated with license renewal is expected, the potential for LSCS to contribute to a cumulative impact with other air pollutant sources is SMALL. Given the current designated attainment status of LaSalle County and few reasonably foreseeable projects that may increase air emissions in the region of interest, the NRC staff concludes that, combined with the emissions from other past, present, and reasonably foreseeable future actions, cumulative impacts on air quality would be SMALL. 4.16.1.2 Noise
Section 3.3.3 presents a summary of noise sources at LSCS and in the vicinity of the site. Noise levels in the vicinity of a nuclear power plant could increase from planned activities associated with urban, industrial, and commercial development. The magnitude of cumulative impacts depends on the nuclear plant’s proximity to other noise sources. A 3-A-weighted decibels (-dBA) change in sound level is considered barely discernable (FHWA 2011), as discussed in Section 3.3.3 of this SEIS. A 3-dBA increase would occur with the placement of another identical source over an existing source (e.g., a doubling of the traffic volume). Ongoing or foreseeable future projects in and around LSCS, as identified in Appendix E, would increase noise levels only in the vicinity of the noise sources. Therefore, contributions to noise levels from future actions are limited to projects in the vicinity of LSCS (within a 2 mi (3.3 km) radius). For example, wind farm projects in the immediate vicinity of LSCS may contribute to noise impacts, particularly the Grand Ridge Wind Farm. As discussed in Section 4.3.6, noise impacts from wind generation operations would include aerodynamic noise from the turbine rotors and mechanical noise from the turbine drivetrain components. Wind-turbine-generated noise will vary depending on the speed of the turbine, environmental conditions, and the distance of the receptor from the turbine. Exelon stated that any additional noise from installation and operation of the wind turbine in the vicinity has been imperceptible (Exelon 2015j). The NRC staff identified noise concerns raised by the public regarding wind farm installations in counties surrounding LaSalle (News-Gazette 2013, Daily Herald 2010, FarmProgress 2010; FairWindEnergy undated). However, the NRC staff did not identify noise concerns raised specifically in LaSalle County or the immediate area surrounding LSCS. Furthermore, wind-turbine-generated noise, and other projects, must comply with noise regulations found in IAC Title 35, Subtitle H. Accordingly, the NRC staff concludes that the cumulative impact to the noise environment from past, present, and reasonably foreseeable actions is SMALL.

Environmental Consequences and Mitigating Actions
4-116
4.16.2 Geology and Soils
This section addresses the direct and indirect effects of license renewal on geology and soils when added to the aggregate effects of other past, present, and reasonably foreseeable future actions. As noted in Section 4.4.1, the NRC staff concludes that the impacts of the proposed action (license renewal) on geology and soils would be SMALL. The cumulative impacts on the geologic environment primarily relate to land disturbance and the potential for soil erosion and loss, as well as the projected consumption of geologic resources. Exelon has no plans to conduct refurbishment or replacement actions. Ongoing operation and maintenance activities at LSCS are expected to be confined to previously disturbed areas. Any use of geologic materials such as aggregates to support operation and maintenance activities would be procured from local and regional sources. Thus, activities associated with continued operations are not expected to affect the geologic environment. The NRC staff assumes that any construction activities would use material from local and regional sources, as these materials are abundant in the region. These identified projects are of such a scale as to not be likely to impact regional sources and supplies of the identified resources. Furthermore, construction activities would need to be conducted in accordance with State and local requirements and development activities would be subject to BMPs for soil erosion and sediment control, which would serve to minimize soil erosion and loss. Considering ongoing activities and reasonably foreseeable actions, the NRC staff concludes that the cumulative impacts on geology and soils during the license renewal term would be SMALL.
4.16.3 Water Resources
This section addresses the direct and indirect effects of the proposed action (license renewal) on water resources when added to the aggregate effects of other past, present, and reasonably foreseeable future actions. 4.16.3.1 Surface Water Resources
As described in Section 4.5.1.1, the incremental impacts on surface water resources from continued operations of LSCS during the license renewal term would be SMALL. The NRC staff has also evaluated other projects and actions for consideration in determining their contribution to cumulative impacts on surface water resources (see Appendix E). The description of the affected environment under Section 3.5.1 of this SEIS serves as the baseline for the cumulative impacts assessment for surface water resources. The geographic area of analysis for the surface water resources component of the cumulative impacts analysis includes the lowermost portion of the Upper Illinois River Basin, as described in Section 3.5.1.1, with a detailed focus on the Marseilles Pool of the Illinois River and its tributaries. As such, this review focused on those projects and activities that would withdraw water from or discharge effluent to the Marseilles Pool. The cumulative impacts on surface water use and quality, along with associated climate change considerations, are presented below. Water Use Considerations The Upper Illinois River Basin is composed of a 10,949 square mile (mi2) (28,369 square kilometer (km2)) drainage area upstream from Ottawa, Illinois. LSCS is located on the Marseilles Pool of the main stem of the Illinois River. This pool is one of eight such navigation pools along the Illinois River and major tributaries that includes an associated lock and dam. Each pool includes a navigation channel that is at least 9 ft (2.7 m) deep and 300 ft (91 m) wide. Together, the navigation pools are part of the Illinois Waterway, which enables commercial river

Environmental Consequences and Mitigating Actions
4-117
traffic to travel from Lake Michigan to the Mississippi River and from there to the Gulf of Mexico (Arnold et al. 1999; Talkington 1991; USGS 1998). Operation of the navigation pools using the locks and dams has the effect of decreasing overall river flow velocity and stabilizing river water levels, particularly during low flows. As a result of this extensive management, some 60 percent of the State of Illinois’ commodities travel the waterway annually. This includes grain, petroleum products, coal, chemicals, sand and gravel, pulp, paper, and others (Talkington 1991). In support of this cumulative impacts analysis, the NRC staff obtained and evaluated the best available data on water consumption and projected trends in water use, as compiled by responsible water resources management agencies. The USGS published a comprehensive investigation of hydrologic and water quality conditions in the Upper Illinois River Basin in 1999 that also considered water use (Arnold et al. 1999). Excluding surface water diversions from Lake Michigan in the Chicago area, nearly five times as much groundwater as surface water is used in the Upper Illinois River Basin for public water supply. Within the basin, surface water is primarily used for cooling and associated thermoelectric power generation, followed by public water supply and industrial and commercial use. In total, more than 90 percent of all reported water use in the basin is for the cooling and thermoelectric power generation sector, with nearly all of the water from surface water sources. This percentage reflects total water demands and does not account for water that is withdrawn and not consumptively used (i.e., water that is returned to the water source rather than being lost) (Arnold et al. 1999). Thermoelectric power generating plants that use once-through cooling systems return most of the water they withdraw back to the source. In contrast, those using closed-cycle cooling systems, which are now the standard for new facilities, withdraw much less water (i.e., about 90 percent less than those with once-through cooling systems) but their operation entails consumptive loses (i.e., primarily due to evaporation) of greater than 50 percent, resulting in the return of less water (NRC 2013d). The rankings by water use sector cited above in Arnold et al. (1999) are mirrored in the county-level forecasts of water use prepared by Southern Illinois University for the Illinois State Water Survey (Dziegielewski et al. 2005). As part of its analysis, the NRC staff considered the counties in the lowermost Upper Illinois River Basin, including counties that border LaSalle County, where LSCS is located, and the immediately upstream portion of the Marseilles Pool in Grundy County. Total water demand (both groundwater and surface water) overall in the Illinois counties within the lowermost part of the Upper Illinois River Basin is projected to increase by about 30 percent by 2025, as compared to water use in the year 2000. This is a 1,148 mgd (4.35 million m3/d) (equivalent to 1,776 cfs (50.2 m3/s)) increase over water use in 2000 (Dziegielewski et al. 2005). By 2025, the demand for public water use within the lowermost Upper Illinois River Basin is projected to increase by about 36 percent. This reflects an increase of approximately 69 mgd (261,000 m3/d) as compared to public water use in the year 2000. For self-supplied commercial and industrial water use, an increase of approximately 16 mgd (60,600 m3/d) by 2025 is forecast (Dziegielewski et al. 2005). The NRC staff believes that the county-level total water demand projections likely overestimate future demand, as they are heavily influenced by large forecasted increases in water demand for thermoelectric power generation, which have not been realized to date. In addition, the thermoelectric power generation component of these projections includes the Collins Generating Station, a fossil-fuel fired power plant in Morris (Grundy County), Illinois, which withdrew water from the Illinois River. This facility was permanently decommissioned in 2004

Environmental Consequences and Mitigating Actions
4-118
and, as a result, the county-level projections, particularly for Grundy County, probably overestimate future total water demand. In LaSalle County, total water demands are projected to increase by approximately 3.8 mgd (14,400 m3) to 89.8 mgd (340,000 m3/d) by 2025 as compared to the county’s total water use in 2000. This is a rate of increase of about 0.15 mgd (570 m3/d) per year, or an increase of about 4 percent as compared to water use in 2000. This total county demand includes 62.9 mgd (238,100 m3/d) attributable to LSCS operations. This total projected increase by 2025 includes 0.3 mgd (1,140 m3/d) for public water supply (3 percent increase) and 2.5 mgd (9,500 m3/d) increase for self-supplied commercial and industrial uses (a nearly 70 percent increase), with the remainder attributable to use for thermoelectric power generation (Dziegielewski et al. 2005). The projected increase in public water supply demand is in line with the historical trend in LaSalle County’s population growth, which has averaged about 2 percent per decade. Most recently, the Illinois Department of Commerce and Economic Opportunity has projected county population to grow at a rate of about 4 percent between 2020 and 2030, or about 0.4 percent per year (LaSalle County 2014). Based on the discussion above, the NRC staff estimates that by the end of the period of extended operations for LSCS in 2043, LaSalle County’s total water demands could increase to 96.5 mgd (365,000 m3/d). This conservative projection assumes water demand will increase by about 0.4 percent per year equally across all water use sectors and that LSCS’s river makeup water withdrawals, which dominate water withdrawals in the county and across the lowermost Upper Illinois River Basin, will also increase proportionally. However, even if the entire projected water demand for LaSalle County (96.5 mgd, equivalent to 149 cfs (4.2 m3/s)) which includes water needs by LSCS were to be withdrawn from the Marseille Pool of the Illinois River and not returned, this would be equivalent to approximately 1.4 percent of the mean annual flow of the Illinois River through the Marseilles Pool. This small percentage increase would be less because some of the water withdrawn from the pool would be returned, as more than 50 percent of the water withdrawn by LSCS at present (i.e., about 55 cfs (1.6 m3/s)) is returned directly to the Marseilles Pool. It is extremely likely that future demands for public water supply will continue to be met by groundwater and not surface water. There are no municipalities that use the Marseilles Pool of the Illinois River as a public water supply source. All identified public water supplies within 10 mi (16 km) of LSCS rely on groundwater (Exelon 2014a, 2014b). Given the abundant groundwater supplies in the county and also the higher cost of surface water treatment, the NRC staff does not anticipate public water supplies to switch to surface water as a water source during the license renewal term. Thus, it is extremely unlikely that continued LSCS operations withdrawing surface water from the Marseilles Pool of the Illinois River, combined with those of other users in the county, would substantially impact the downstream availability of surface water. Water Quality Considerations Water quality within the whole of the Illinois River Basin has historically suffered from rapid population growth, urbanization, and industrial development. This resulted in the discharge of poorly treated sewage, the discharge of industrial pollutants and refuse, runoff of agricultural chemicals and sediments, and the alteration of the natural hydrology of the river (Exelon 2014a; Talkington 1991). Nonetheless, over the last 50 years, substantial improvements in water quality have occurred, due to municipal and industrial waste treatment and management efforts to address both point and nonpoint pollutant sources. Ongoing water quality concerns within the Upper Illinois River Basin remain and include the atmospheric deposition of pesticides and trace metals; endocrine disrupting compounds in surface and groundwater; nutrient enrichment of surface and
Environmental Consequences and Mitigating Actions
4-119
groundwater; the transport and fate of pesticides, trace elements, and volatile organic compounds in surface and groundwater; and the effects of urbanization on biodiversity, habitat, and water quality (USGS 1998; Groschen 2004). As discussed in Section 3.5.1.3 of this SEIS, a segment of the Illinois River that encompasses the Marseilles Pool does not meet designated uses and associated water-quality standards and is listed as an impaired waterway. The segment is listed as impaired for not meeting designated uses for fish consumption due to polychlorinated biphenyls (PCBs) and mercury as well as for primary contact recreation use, due to fecal coliform bacteria. However, the segment is classified as fully supporting its designated use for aquatic life. IEPA has assigned a medium priority for the development of Total Maximum Daily Load (TMDL) limits to improve water quality in this river segment pursuant to Section 303(d) of the Federal Water Pollution Control Act (i.e., Clean Water Act (CWA)) (33 U.S.C. 1251). As noted previously, development in the lowermost Upper Illinois River Basin, including associated population growth and industrial development, is expected. Upstream development could lead to increased discharges and pollutant loading to the Marseilles Pool of the Illinois River with impacts on ambient water quality. The magnitude of cumulative impacts would depend on the nature and location of the actions relative to receiving surface water bodies, the number of actions (facilities or projects), and the extent of municipal, county, and state regulatory agency development planning and environmental regulatory controls. At a minimum, new and modified industrial and large commercial facilities would be subject to regulation under the Federal CWA (33 U.S.C. 1251) (i.e., Section 402). This would include IEPA-administered NPDES permit limits on stormwater and point source discharges designed to be protective of surface water resources. Likewise, it is this regulatory framework that presently governs industrial effluent and thermal discharges from LSCS and other major industrial facilities in the lowermost Upper Illinois River Basin. Climate Change Considerations The NRC staff also considered the USGCRP’s most recent compilations of the state of knowledge relative to global climate change effects (USGCRP 2014). Climate change can impact surface water as a result of changes in temperature and precipitation. As discussed in Section 4.15.3.2, climate model simulations for the Midwest region indicate an increase in annual mean temperature as well as precipitation. More especially, the frequency and intensity of heavy precipitation events is forecast to increase. Increased precipitation results in greater runoff and streamflow. The USGCRP (USGCRP 2014) predicts that runoff and streamflow for the upper Midwest will increase overall. In its ER, Exelon (2014a) cites an analysis prepared by the Illinois State Water Survey (Knapp 2009) that assesses trends in stream flows encompassing the Illinois River Basin and their implications for flood frequency. For stream gaging sites with a long period of record (90 years), the analysis indicates a consistent trend of increasing stream flows in the upper Midwest, attributed to a 7- to 10-percent increase in precipitation over the past 30 years (through 2008). Results from an earlier study prepared by USGS (Arnold et al. 1999) and specific to the Upper Illinois River Basin also indicate a statistically significant increase in mean annual stream flow (over the period 1950–1997) at all seven stations selected for analysis, including as measured at the USGS gage at Marseilles, Illinois. In contrast to Knapp (2009), the USGS study was not able to correlate any trends in precipitation with the apparent increases in streamflow. Rather, the authors concluded that the observed trends were more likely attributable to land-use changes in the affected watersheds, causing more rapid runoff of precipitation, and to increases in groundwater usage and associated increased return effluent to receiving waters from wastewater treatment plants in the basin. These two studies serve to

Environmental Consequences and Mitigating Actions
4-120
point to the uncertainty over whether there has been an observable trend in precipitation and/or streamflow in the upper Midwest, as forecast by the USGCRP. Despite any observable trends to date, rapid runoff events occurring due to more frequent and intensive precipitation events associated with climate change, especially over cleared or urbanized areas, will result in increases in erosion and transport of sediment and other pollutants to receiving waters. This can negatively affect ambient water quality. Further, higher air temperatures and increased runoff associated with heavy precipitation events could impact the thermal regime of the Marseilles Pool of the Illinois River, along with increases in runoff laden with nutrients, sediment, and other contaminants. Higher surface water temperatures decrease the cooling efficiency of thermoelectric power generating facilities as well as plant capacity, due to the need to reduce the discharge of thermal effluent (USGCRP 2014). As intake water temperatures warm, cooling water makeup requirements increase. Degradation in ambient surface water quality increases the costs of water treatment for both industrial cooling water and potable water, due to the need for increased filtration and higher additions of chemical treatments for such uses as antiscaling and disinfection. With respect to LSCS operations, these potential climate-induced changes can lead to higher cooling pond temperatures and an increase in evaporative losses from LSCS’s cooling pond. This can conceivably result in additional makeup water withdrawals from the Marseilles Pool and an increased need for blowdown discharges from the cooling pond to the Illinois River. At present, the data available to the NRC staff is not sufficient to indicate whether or not a warming trend is evident in the waters of the Illinois River, including the Marseilles Pool. Exelon (2015b) has not identified any increasing trend in cooling pond temperatures to date, although this observation is based on limited data. Regardless, as detailed in Section 3.5.1.3 of this SEIS, the chemical and thermal quality of LSCS’s discharges to the Illinois River are subject to the effluent limitations and monitoring requirements prescribed by its NPDES permit (IEPA 2013). Additionally, thermal mixing zone limits set by LSCS’s NPDES permit indirectly limit surface water withdrawals and consumptive water use during low river flow and extreme summer weather events. Future thermal and pollutant discharges from new and modified industrial and large commercial facilities in the lowermost Upper Illinois River Basin would be required to comply with applicable NPDES permit requirements under the Federal CWA, local and regional health standards, and TMDLs imposed by the State of Illinois. Conclusion Surface water availability is expected to continue to be sufficient through the license renewal term, based on the projections and associated assumptions cited above. Surface water from the Marseilles Pool of the Illinois River has been able to support ongoing demands for uses ranging from navigation to cooling and thermoelectric power generation to commercial and industrial water supply. Flows within the Upper Illinois River Basin and through the Marseilles Pool are not likely to decrease and may trend higher during the LSCS license renewal term, in part due to climate-induced hydrologic changes. No increase in LSCS consumptive water use is expected during the license renewal term. Surface water withdrawals and associated consumptive water use for LSCS operations are expected to remain a small percentage of the mean annual and 90-percent exceedance flow through the Marseilles Pool of the Illinois River. It is reasonable to anticipate that water-quality-based limits imposed by the IEPA through NPDES permits and other measures on cooling water, wastewater, and stormwater discharges and similar limits on sources of development, agricultural, and urban runoff will continue to maintain or improve ambient surface water quality in the Illinois River. LSCS’s combined cooling pond blowdown, wastewater, and stormwater discharges to the Illinois River are

Environmental Consequences and Mitigating Actions
4-121
regulated under an IEPA-administered NPDES permit. Available data indicate that LSCS operations are a very small contributor to the pollutant and thermal loading to the Illinois River. Based on the foregoing, the NRC staff concludes that the cumulative impacts from past, present, and reasonably foreseeable future actions and trends on surface water resources during the license renewal term would be SMALL. 4.16.3.2 Groundwater Resources
This section addresses the direct and indirect effects of license renewal on groundwater use and quality when added to the aggregate effects of other past, present, and reasonably foreseeable future actions. As noted in Section 4.5.1.2, the NRC staff concludes the impacts of the proposed action (license renewal) on groundwater consumption and quality would be SMALL. All groundwater consumed at LSCS is obtained from two wells completed in the Cambrian-Ordovician Aquifer (see Section 3.5.2.2). LaSalle County has an adequate supply of groundwater for industrial, municipal, and domestic purposes (LaSalle County 2014). The Cambrian-Ordovician Aquifer System is a major source of water in LaSalle County. Groundwater levels in the Cambrian-Ordovician Aquifer System of LaSalle County and the plant area have shown little change from 1995 to 2007 (Burch 2002, 2008). Even if this trend does not continue, the plant is unlikely to have a significant impact on the Cambrian-Ordovician Aquifer System. Ongoing operations have not impacted the groundwater quality of aquifers on or off the site. The Cambrian-Ordovician Aquifer System is overlain by 312 ft (95 m) of aquitards, which prevent the groundwater quality from being impacted by site activities. Whether an aquifer is located on site or off site, the low permeability, thickness, and lateral extent of the Wedron Silty-Clay Till means there is little chance of significant impact to groundwater quality from site activities. Considering ongoing activities and reasonably foreseeable actions, the NRC staff concludes that the cumulative impacts on groundwater use and quality during the LSCS license renewal term would be SMALL.
4.16.4 Terrestrial Resources
This section addresses the direct and indirect effects of license renewal on terrestrial resources when added to the aggregate effects of other past, present, and reasonably foreseeable future actions. Section 4.6 of this SEIS finds that the direct and indirect impacts on terrestrial resources from the proposed license renewal, when considered in the absence of the aggregate effects, would be SMALL. The cumulative impact is the total effect on terrestrial resources of all actions taken, no matter who has taken the actions (the second principle of cumulative effects analysis in CEQ 1997). Two related concepts bound the analysis of cumulative impacts: (1) the timeframe and (2) geographic extent. The timeframe for cumulative analyses for ecological resources extends far enough into the past to understand the processes that affect the present resource conditions and to examine whether and why terrestrial resources are stable or unstable, which the NRC’s definitions of impact levels require. The timeframe for cumulative impact analysis is more extensive than that for the direct and indirect impact analysis. The geographic extent considered in this cumulative terrestrial resource analysis depends on the particular cumulative impacts being discussed. Direct and indirect impacts from LSCS operation are largely limited to the LSCS site and immediate vicinity. However, projects or actions located beyond this geographic area could directly or indirectly affect terrestrial resources in this area. This section focuses on the cumulative effects of such actions.

Environmental Consequences and Mitigating Actions
4-122
The level of cumulative impacts is measured against a baseline. Consistent with other Federal agencies’ and the Council on Environmental Quality’s (CEQ 1997) NEPA guidance, the term “baseline” pertains to the condition of the resource without the action (i.e., under the no-action alternative). Under the no-action alternative, the plant would shut down, and the resource would conceptually return to its condition without the plant (which is not necessarily the same as the condition before the plant was constructed). The baseline, or benchmark, for assessing cumulative impacts on terrestrial resources takes into account the preoperational environment, as recommended by EPA (1999b) for its review of NEPA documents. Past Development and Habitat Alteration The LSCS site was partially disturbed during the construction of the facility to develop site buildings and infrastructure and to create the cooling pond. Of the site’s 1,528 ha (3,776 ac), 65 ha (160 ac) were permanently converted for industrial use to support buildings and infrastructure, and approximately 800 ha (1,976 ac) are occupied by the cooling pond. During construction, some additional land may have been temporarily disturbed to allow for laydown areas for construction supplies or storage of construction equipment. In the broader area—the Illinois/Indiana Prairies Level IV Ecoregion—native tallgrass prairies, wetlands, and floodplain forests have been converted to agricultural and urban land, which now account for the major land-use types. Habitat loss, in general, can negatively affect breeding success, dispersal success, predation rate, and other animal behaviors (Fahrig 2003). Habitat fragmentation (the breaking up of a larger area of habitat into smaller patches of smaller total area) can also negatively affect terrestrial biota. In a study of breeding bird communities in 24 Illinois grassland fragments, Herkert (1994) found that fragmentation was likely a factor in Midwestern grassland bird population declines. A study conducted in 2012 on the partridge pea (Chamaecrista fasciculata) concludes that native prairie plant species that occur in smaller, isolated prairie fragments are likely to suffer a reduction in genetic fitness (Mannouris and Byers 2013). IDNR (2005) reports that remaining prairie remnants within the State lack many natural ecosystem functions, due to their small size, and areas of prairie restoration often lack forbs or are overly dominated by big bluestem (Andropogon gerardii) or Indiangrass (Sorghastrum nutans). Accordingly, remaining native populations in these habitats are likely to suffer from reduced genetic fitness, which is further exacerbated by fragmentation. Energy Production and Development Two nuclear power plant sites with four operating reactors (Braidwood Station, Units 1 and 2, and Dresden Nuclear Power Station, Units 2 and 3) lie within 50 mi (80 km) of the LSCS site. Because the effects of these facilities would primarily be limited to the terrestrial resources on each plant’s site and the immediate vicinity, the operation of these two facilities during the proposed LSCS license renewal term would not result in cumulative effects to the terrestrial resources affected by LSCS operation. Four fossil-fuel-fired energy facilities occur in the region (Table E–1 in Appendix E) and each is about 20 mi (30 km) from LSCS. Although no coal or gas energy projects are under construction in the region at this time, other energy development may arise over the proposed license renewal term. Air emissions from these facilities include GHGs, such as nitrogen oxides, carbon dioxide, and methane, all of which can have far-reaching consequences because they cumulatively contribute to climate change. The effects of climate change on terrestrial resources are discussed in Section 4.15.3.2. Four wind energy facilities exist in the region (Table E–1 in Appendix E). Grand Ridge Wind Farm is a 140-unit wind facility located immediately west of the LSCS property, and it extends southwest for approximately 8 mi (13 km). The other three wind facilities are located between
Environmental Consequences and Mitigating Actions
4-123
6 mi (10 km) and 27 mi (43 km) from the LSCS site and consist of a total of 450 wind units. Operation of wind farms can result in direct mortality of birds and bats through collision with turbine blades as well as indirect effects, such as wildlife avoidance, habitat disruption, reduced nesting or breeding density, habitat abandonment, and behavioral effects (Stewart et al. 2005, 2007). Given that the majority of bird and bat species are migratory, effects of wind farms on bird and bat populations can be far reaching. Development, Urbanization, and Habitat Fragmentation As the region surrounding the LSCS site becomes more developed, habitat fragmentation will increase, and the amount of forested, prairie, and wetland habitat is likely to decline further. Transmission lines, pipelines, and associated corridors established to connect new buildings to the regional electric grid and to utilities could further fragment habitats if the corridors split otherwise continuous tracts of habitat. Edge species that prefer open or partially open habitats will likely benefit from the fragmentation, whereas species that require interior forest or wetland habitat will likely suffer. Continued urbanization in the future will likely include construction of additional housing units and associated commercial buildings; roads, bridges, and rail; and water or wastewater treatment and distribution facilities and associated pipelines. Increased development will likely decrease the overall availability and quality of terrestrial habitats. Species that require larger ranges, especially larger predators, will likely suffer reductions in their populations. Similarly, species with threatened or endangered Federal or State status or otherwise declining populations would be more sensitive to declines in habitat availability and quality. Native prairie plants will likely continue to experience reductions in genetic fitness, as previously discussed. Wildlife Refuges, State Parks, and Recreational Areas A number of State parks, State Fish and Wildlife Areas, and State Natural Areas and recreational areas are located near LSCS (Table E–1 in Appendix E) that provide valuable habitat to native wildlife, migratory birds, and protected terrestrial species and habitats. Illini State Park, which comprises 510 ac (206 ha) and lies 6 mi (10 km) north-northwest of the LSCS site, provides habitat for a number deciduous trees, including hickory (Carya spp.), ash (Fraxinus spp.), walnut (Juglans spp.), elm (Ulmus spp.), cottonwood (Populus deltoids), oak (Quercus spp.), and maple (Acer spp.), as well as white-tailed deer (Odocoileus virginianus), eastern gray squirrels (Sciurus carolinensis), opossums (Didelphis virginiana), beavers (Castor canadensis), raccoon (Procyon lotor), groundhogs (Marmota monax), and a variety of waterfowl and songbirds (IDNR 2015a). Starved Rock State Park, which comprises 2,700 ac (1,090 ha) and lies 15 mi (24 km) northwest of the LSCS site along the Illinois River, contains a variety of habitats, including canyons, sandstone bluffs, rolling plains, forest, upland prairies, waterfalls, rivers, and streams, and provides particularly high-quality habitat to many species of native wildlife and migrating birds. As fragmentation and land-use changes continue, these protected areas will become ecologically more important because they provide large, uninterrupted areas of minimally disturbed habitat. Conclusion The NRC staff concludes that the cumulative impacts on terrestrial resources in the vicinity of the LSCS site are MODERATE to LARGE, based on past, present, and reasonably foreseeable future actions. This level of impact is primarily the result of past habitat alteration and loss on the LSCS site and within the larger Illinois/Indiana Prairies Level IV Ecoregion. The environmental effects of these actions are clearly noticeable and have destabilized important attributes of certain terrestrial communities. The loss of genetic fitness of native prairie species and the loss of tallgrass prairies, wetlands, and floodplains are demonstrative of such effects.

Environmental Consequences and Mitigating Actions
4-124
The incremental, site-specific impact from the continued operation of LSCS during the license renewal period would be an unnoticeable or minor contributor to cumulative impacts on terrestrial resources.
4.16.5 Aquatic Resources
This section addresses the direct and indirect effects of license renewal on aquatic resources when added to the aggregate effects of other past, present, and reasonably foreseeable future actions. Section 4.7 finds that the direct and indirect impacts on aquatic resources from the proposed license renewal would be SMALL for all aquatic ecology issues, with the exception of MODERATE impacts to gizzard shad and threadfin shad from heat shock in the cooling pond. The geographic area considered in the cumulative aquatic resources analysis includes the LSCS cooling pond and the vicinity of the intake and discharge structures on the Illinois River affected by LSCS water withdrawal and discharge. The baseline, or benchmark, for assessing cumulative impacts on aquatic resources takes into account the preoperational environment as recommended by EPA (1999b) for its review of NEPA documents. Section 3.7 presents an overview of the current condition of the LSCS cooling pond and Illinois River and the history and factors that led to current conditions. In summary, the direct and indirect impacts from draining wetlands, construction of locks and dams, maintenance of navigation channels, industrial effluent, and sewage discharge are some of the most influential human activities on the Illinois River Basin (Parker 2014). By the 1960s, biodiversity of fish within the upper Illinois River was low and freshwater mussels were nearly absent from the upper Illinois River (Sietman et al. 2001). Pollution-tolerant non-native common carp (Cyprinus carpio) and goldfish (Carassius auratus) dominated fish populations (Parker 2014). Since the passage of the CWA in 1974, water quality within the Illinois River has improved, and more diverse fish assemblages have inhabited the upper Illinois River (Parker 2014). Similarly, freshwater mussels have recolonized portions of the upper Illinois River since the 1980s (Sietman et al. 2001). Many natural and anthropogenic activities can influence the current and future aquatic biota in the area surrounding the LSCS site and the Illinois River Basin. Potential biological stressors include operational impacts from LSCS (as described in Section 4.7), energy development, and urbanization. 4.16.5.1 Energy Development
Several other power plants withdraw water from and discharge water to the Illinois River (see Appendix E). The largest nuclear power plant near LSCS and located on the Illinois River is the Dresden Nuclear Station, located on River Mile 272.3 of the Illinois River. Dresden Nuclear Station withdraws water from the Kankakee River and discharges to the Illinois River (EA 2015). For 3.5 months of the year, Dresden operates in an indirect-open-cycle mode, and during the remainder of the year (8.5 months), Dresden operates its cooling pond in a closed-cycle mode, similar to LSCS. Operating in a closed-cycle mode reduces the impacts to aquatic resources because less water is withdrawn and discharged, and therefore, less thermal effluent is discharged to the Illinois River. The NRC (2004) determined that the impacts from impingement, entrainment, and heat shock from Dresden Nuclear Station would be SMALL on aquatic resources. Furthermore, it is unlikely that the thermal effluent from Dresden Nuclear Station and LSCS overlap, given that both thermal plumes dissipate within the vicinity of each respective discharge structure and the distance between the two plants (NRC 2004; Exelon 2014a). Impingement and entrainment at both plants could affect similar fish populations; however, operating in the closed-cycle mode would reduce impacts to fish (NRC 2004; EA 2015).

Environmental Consequences and Mitigating Actions
4-125
Kendall County Generation is a natural-gas-fueled plant with 1,140 MW generating capacity that withdraws water from and discharges water to the Illinois River. This plant is approximately 27 mi (43 km) northeast of LSCS. Given that the discharge plumes are limited to the vicinity of the discharge structures, the heated effluent from the two plants would not likely overlap. However, many of the same fish populations could be affected by impingement and entrainment at LSCS and Kendall County Generation. The other power plants located on the Illinois River have a much smaller generating capacity—less than 180 MW (see Appendix E)—and therefore require less cooling water. Given the lower withdraw and discharge rates, effects to aquatic resources from impingement, entrainment, and thermal effluents would also be lower at these facilities. Several wind and solar farms operate within 50 mi (80 km) of LSCS (see Appendix E). These facilities would not have detectable impacts on aquatic resources in the Illinois River because, in general, they do not require water during operation. 4.16.5.2 Future Urbanization and Transportation Development
Future urbanization in the vicinity of LSCS would likely include construction of new housing units and associated commercial buildings; roads, bridges, and rail; and water or wastewater treatment (or both), distribution facilities, and associated pipelines. Continued development of the area has the potential to increase the rate and volume of stormwater runoff and reduce groundwater recharge. If not managed appropriately, such development could result in increased flooding, higher and more frequent storm-related flows, and low flows of longer duration in streams. The increased runoff rates and high channel velocities from inappropriately managed sites could result in excessive bank erosion and associated sedimentation and stream degradation in the Illinois River and its tributaries. As a result, aquatic biota populations may experience habitat degradation or loss, reduced food or prey availability, and increased susceptibility to exotic species invasions. Such potential impacts can be mitigated through implementation of BMPs that address stormwater quality, quantity, and discharge. Stormwater BMPs are often required by state and local regulations, which would ensure that impacts to aquatic resources resulting from future development would be appropriately mitigated. 4.16.5.3 Wildlife Preserves, Parks, and Recreational Areas
Several wildlife preserves, parks, and recreation sites lie within the vicinity of LSCS (see Appendix E), including the Marseilles State Fish and Wildlife Area, which lies 1.5 mi (2.4 km) north of the LSCS site. The continued preservation of these areas will protect aquatic habitats and, as land development continues, these areas will become ecologically more important because they will provide large areas of unfragmented natural habitat. 4.16.5.4 Illinois Wildlife Conservation Plan
The State of Illinois maintains a Comprehensive Wildlife Conservation Plan and Strategy (IDNR 2005), which is implemented by the IDNR and numerous Federal, State, local, and private partners. The plan addresses long-range landscape-level planning initiatives, which include projects to address declining wildlife populations and conservation and restoration of ecologically important, sensitive, and rare habitats. Part of the plan includes the Conservation Reserve Enhancement Program, which is a voluntary program to assist landowners in protecting environmentally sensitive land, decreasing erosion, restoring wildlife habitat, increasing populations of threatened and endangered species, and safeguarding groundwater and surface water in the Illinois River Basin (IDNR 2005). Commitment to this plan will help protect or restore aquatic habitats and continue to support a diversity of aquatic life in the future.

Environmental Consequences and Mitigating Actions
4-126
4.16.5.5 Conclusion
The stresses from past river flow alterations, increasing urbanization, and demand for water resources across the geographic area of interest depend on many factors that the NRC staff cannot quantify but that are likely to noticeably alter aquatic resources when all stresses on the aquatic communities are assessed cumulatively. Continued protection of aquatic habitats through wildlife preserves, parks, and recreational areas, as well as the implementation of the Illinois Wildlife Conservation Plan, will likely mitigate some of these effects, and, therefore, the NRC staff finds it reasonable to assume that these activities will ensure that future actions do not destabilize important attributes of the aquatic resources in the vicinity of LSCS. Accordingly, the NRC staff concludes that the cumulative impacts on aquatic resources from the proposed license renewal and other past, present, and reasonably foreseeable projects would be MODERATE.
4.16.6 Historic and Cultural Resources
This section addresses the direct and indirect effects of license renewal on historic and cultural resources when added to the aggregate effects of other past, present, and reasonably foreseeable future actions. The geographic area considered in this analysis is the APE associated with the proposed undertaking, as described in Section 3.9. The archaeological record for the region indicates prehistoric and historic occupation of the LSCS site and its immediate vicinity. Given the location of identified cultural resources, the construction of LSCS may have resulted in destruction of cultural resources within the LSCS site and its immediate vicinity. Other land uses in the vicinity of LSCS may have resulted in impacts on and the loss of, cultural resources on the LSCS site and its immediate vicinity. However, there remains the possibility for additional historic or cultural resources to be located within the LSCS site. The present and reasonably foreseeable projects that could affect these resources, reviewed in conjunction with license renewal, are noted in Appendix E of this document. Direct impacts would occur if historic and cultural resources in the APE were physically removed or disturbed. It is unlikely that the projects discussed in Appendix E would impact historic and cultural resources on the LSCS site because those resources are not in areas that would be subject to foreseeable future development. As described in Section 4.9 of this document, no known cultural resources would be adversely affected by LSCS license renewal activities, as no associated changes or ground-disturbing activities will occur (Exelon 2014a). Moreover, as discussed in Section 4.9, Exelon has established draft procedures to ensure cultural resources are considered in project planning during operation of LSCS. The NRC staff concludes that the cumulative impacts of the proposed license renewal on historic and cultural resources, when combined with other past, present, and reasonably foreseeable future activities, would be SMALL.
4.16.7 Socioeconomics
This section addresses socioeconomic factors that have the potential to be directly or indirectly affected by changes in operations at LSCS, in addition to the aggregate effects of other past, present, and reasonably foreseeable future actions. The primary geographic area of interest considered in this cumulative analysis includes LaSalle, Grundy, and Will Counties, where approximately 83 percent of LSCS employees reside (see Table 3–15). This is where the economy, tax base, and infrastructure would most likely be affected because the majority of
Environmental Consequences and Mitigating Actions
4-127
LSCS workers and their families reside, spend their incomes, and use their benefits within these counties. As discussed in Section 4.10, continued operation of LSCS during the license renewal term would have no impact on socioeconomic conditions in the region beyond what is already being experienced. Since Exelon has no plans to hire additional workers during the license renewal term, overall expenditures and employment levels at LSCS would remain relatively unchanged with no new or increased demand for housing and public services. Based on this and other information presented in Chapter 4, there would be no contributory effect on socioeconomic conditions in the region during the license renewal term from the continued operation of LSCS beyond what is currently being experienced. Therefore, the only contributory effects would come from reasonably foreseeable future planned activities at LSCS, unrelated to the proposed action (license renewal), and other reasonably foreseeable planned offsite activities. For example, offsite residential development is planned throughout the LSCS region. The availability of new housing could attract individuals and families from outside the region, increasing the local population and causing increased traffic on local roads, as well as increased demand for public services. When combined with other past, present, and reasonably foreseeable future activities, the contributory effects of continued reactor operations at LSCS would have no new or increased impact on socioeconomic conditions in the region beyond what is currently being experienced.
4.16.8 Human Health
The NRC and EPA established radiological dose limits for protection of the public and workers from both acute and long-term exposure to radiation and radioactive materials. These dose limits are codified in 10 CFR Part 20 and 40 CFR Part 190. As discussed in Section 4.11.1, the NRC staff concluded that impacts to human health from continued plant operations are SMALL. For the purposes of this analysis, the geographical area considered is the area included within an 80-km (50-mi) radius of the LSCS plant site. There are four other nuclear power plants within the applicable geographical area: Braidwood Station, Units 1 and 2, and Dresden Nuclear Power Station, Units 2 and 3. Also, LSCS’s 80-km (50-mi) radius overlaps with the 80-km (50-mi) radii of Byron Station, Units 1 and 2; Quad Cities Nuclear Power Station, Units 1 and 2; and Clinton Power Station, Unit 1. As discussed in Section 3.1.4.4, in addition to storing its spent nuclear fuel in a storage pool, LSCS stores some of its spent nuclear fuel in an onsite independent spent fuel storage installation (ISFSI). EPA regulations in 40 CFR Part 190 limit the dose to members of the public from all sources in the nuclear fuel cycle, including nuclear power plants, fuel fabrication facilities, waste disposal facilities, and transportation of fuel and waste. As discussed in Section 3.1.4.5, LSCS has a REMP that measures radiation and radioactive materials in the environment from LSCS, its ISFSI, and all other sources. The NRC staff reviewed the radiological environmental monitoring results for the 5-year period from 2010 to 2014 as part of the cumulative impacts assessment. The NRC staff’s review of Exelon’s data showed no indication of an adverse trend in radioactivity levels in the environment from LSCS or its ISFSI. The data showed that there was no measurable impact to the environment from operations at LSCS. The NRC staff concludes that the cumulative radiological impacts of the proposed license renewal, when combined with other past, present, and reasonably foreseeable future activities, would be SMALL. This is based on the NRC staff’s review of REMP data, radioactive effluent release data, worker dose, and LSCS’s expected continued compliance with Federal radiation protection standards during continued operation, and regulation of any future development or actions in the vicinity of the LSCS site by the NRC and the State of Illinois.

Environmental Consequences and Mitigating Actions
4-128
4.16.9 Environmental Justice
The environmental justice cumulative impact analysis evaluates the potential for disproportionately high and adverse human health and environmental effects on minority and low-income populations that could result from past, present, and reasonably foreseeable future actions, including the continued operational effects of LSCS during the renewal term. Everyone living near LSCS currently experiences its operational effects, including minority and low-income populations. The NRC addresses environmental justice matters for license renewal by identifying the location of minority and low-income populations, determining whether there would be any potential human health or environmental effects to these populations, and determining if any of the effects may be disproportionately high and adverse. Adverse health effects are measured in terms of the risk and rate of fatal or nonfatal adverse impacts on human health. Disproportionately high and adverse human health effects occur when the risk or rate of exposure to an environmental hazard for a minority or low-income population is significant and exceeds the risk or exposure rate for the general population or for another appropriate comparison group. Disproportionately high environmental effects refer to impacts or risks of impacts on the natural or physical environment in a minority or low-income community that are significant and appreciably exceed the environmental impact on the larger community. Such effects may include biological, cultural, economic, or social impacts. Some of these potential effects have been identified in resource areas presented in preceding sections of Chapter 4 in this SEIS. As previously discussed in this chapter, the impact from license renewal for all resource areas (e.g., land, air, water, ecology, and human health) would be SMALL. As discussed in Section 4.12 of this SEIS, there would be no disproportionately high and adverse impacts on minority and low-income populations from the continued operation of LSCS during the license renewal term. Since Exelon has no plans to hire additional workers during the license renewal term, employment levels at LSCS would remain relatively constant, and there would be no additional demand for housing or increased traffic. Based on this information and the analysis of human health and environmental impacts presented in the preceding sections, it is not likely there would be any disproportionately high and adverse contributory effect on minority and low-income populations from the continued operation of LSCS during the license renewal term. Therefore, the only contributory effects would come from the other reasonably foreseeable future planned activities at LSCS, unrelated to the proposed action (license renewal), and other reasonably foreseeable planned offsite activities. Exelon has no reasonably foreseeable future planned activities at LSCS beyond continued reactor operations. When combined with other past, present, and reasonably foreseeable future activities, the ongoing contributory effects of continued reactor operations at LSCS would not likely cause disproportionately high and adverse human health and environmental effects on minority and low-income populations residing in the vicinity of LSCS beyond what is currently being experienced.
4.16.10 Waste Management
This section describes waste management impacts during the license renewal term when added to the aggregate effects of other past, present, and reasonably foreseeable future actions. For the purpose of this cumulative impacts analysis, the area within a 50-mi (80-km) radius of LSCS was considered. The NRC staff concluded, in Section 4.11, that the potential human health impacts from LSCS’s waste during the license renewal term would be SMALL. As discussed in Sections 3.1.4 and 3.1.5, Exelon maintains waste management programs for radioactive and nonradioactive waste generated at LSCS and is required to comply with Federal
Environmental Consequences and Mitigating Actions
4-129
and State permits and other regulatory requirements for the management of waste material. The nuclear power plants and other facilities within a 50-mi (80-km) radius of LSCS are also required to comply with appropriate NRC, EPA, and state requirements for the management of radioactive and nonradioactive waste. Current waste management activities at LSCS would likely remain unchanged during the license renewal term, and continued compliance with Federal and State requirements for radioactive and nonradioactive waste is expected. Based on the above, the NRC staff concludes that the potential cumulative impacts from radioactive and nonradioactive waste during the license renewal term would be SMALL. Continued compliance with Federal and State requirements for radioactive and nonradioactive waste management by Exelon is expected.
4.16.11 Global Climate Change
This section addresses the impact of GHG emissions resulting from continued operation of LSCS on global climate change when added to the aggregate effects of other past, present, and reasonably foreseeable future actions. The impacts of climate change on air, water, and ecological resources are discussed in Section 4.15.3. Climate is influenced by both natural and human-induced factors; the observed global warming (increase in Earth’s surface temperature) in the 21st century has been attributed to the increase in GHG emissions resulting from human activities (USGCRP 2009). Climate model projections indicate that future climate change is dependent on current and future GHG emissions (IPCC 2007b; USGCRP 2009, 2014). As described in Section 4.15.3.1, operations at LSCS emit GHG emissions. The cumulative impact of a GHG emission source on climate is global. GHG emissions are transported by wind and become well mixed in the atmosphere as a result of their long atmospheric residence time. Therefore, the extent and nature of climate change is not specific to where GHGs are emitted. In April 2015, EPA published the official U.S. inventory of GHG emissions, which identifies and quantifies the primary anthropogenic sources and sinks of GHGs. The EPA GHG inventory is an essential tool for addressing climate change and participating with the United Nations Framework Convention on Climate Change to compare the relative global contribution of different emission sources and GHGs to climate change. In 2013, the United States emitted 6,673 teragrams (Tg) (6,673 million metric tons (MMT)) of carbon dioxide equivalents (CO2e), and from 1990 to 2013, emissions increased by 5.9 percent (EPA 2015d). In 2012 and 2013, the total amount of CO2e emissions related to electricity generation was 2,022 Tg (2,022 MMT) and 2,039 Tg (2,039 MMT), respectively (EPA 2015d). The Energy Information Administration (EIA) reported that, in 2013, electricity production alone in Illinois was responsible for 94.1 MMT CO2e (EIA 2015a). Facilities that emit 25,000 MT CO2e or more per year are required to annually report their GHG emissions to EPA. These facilities are known as direct emitters, and the data are publicly available in EPA’s facility-level information on GHGs tool (FLIGHT). In 2013, FLIGHT identified 11 facilities in LaSalle County, Illinois, where LSCS is located, that emitted a total of 0.89 MT CO2e (EPA 2015c). In 2012, FLIGHT identified 290 facilities in Illinois that emitted a total of 134 MMT CO2e (EPA 2015c). Appendix E provides a list of current and reasonably foreseeable future projects and actions that could contribute to GHG emissions. Permitting and licensing requirements and other mitigative measures can minimize the impacts of GHG emissions. For instance, in 2012, EPA issued a final GHG Tailoring Rule (77 FR 41051) to address GHG emissions from stationary sources under the CAA permitting requirements; the GHG Tailoring Rule establishes when an emission source will be subject to permitting requirements and control technology to reduce GHG emissions. On June 25, 2013, President Obama set forward a plan to reduce carbon

Environmental Consequences and Mitigating Actions
4-130
pollution. The Climate Action Plan will reduce carbon pollution, prepare the United States for the impacts of climate change, and lead international efforts to combat global climate change. The Clean Power Plan Final Rule7 (80 FR 64661), aimed at reducing carbon pollution from power plants, requires carbon emissions from the power sector to be 32 percent below 2005 levels (870 million tons less). The Clean Power Plan sets forth carbon dioxide emission performance rate standards for fossil fuel-fired power plants that should be achieved by 2030. Future actions and steps taken to reduce GHG emissions can lessen the impacts on climate change. In 2006, Illinois Executive Order (E.O. 06-11) created the Illinois Climate Change Advisory Group (ICCAG), which was charged with recommending State-level strategies to meet statewide GHG reduction goals. The Illinois GHG reduction goals are as follows: reduction of GHG emissions to 1990 levels (231 MT CO2e) by 2020 and 60 percent below 1990 levels by 2050. The ICCAG’s 2007 report identified that between1995–1997 nuclear generation capacity decreased in Illinois with the decrease replaced with coal generation along with an increase in GHG emissions (ICCAG 2007). As presented in Table 4–22, the IGCC, NGCC, combination, and purchased power alternatives’ annual GHG emissions are higher by several orders of magnitude than those from continued operation of LSCS. Therefore, if LSCS’s generating capacity were to be replaced by other non-nuclear power generating alternatives assessed in this SEIS, there would be an increase in GHG emissions, as was observed in 1995–1997 for Illinois. If non-nuclear replacement power alternatives were to be located in Illinois, the associated increase in GHGs may result in the implementation of additional State-level strategies (ICCAG 2007) to meet Illinois GHG reduction goals. Consequently, continued operation of LSCS (the proposed action) results in GHG emissions avoidance. EPA’s U.S. inventory of GHG emissions illustrates the diversity of GHG sources, such as electricity generation (including fossil fuel combustion and incineration of waste), industrial processes, and agriculture. As presented in Section 4.15.3, annual direct GHG emissions from combustion sources resulting from ancillary operations at LSCS range from 4,514 to 7,659 MT CO2e. In comparing LSCS’s GHG emission contribution to different emissions sources, whether it be total U.S. GHG emissions, emissions from electricity production in Illinois, or emissions on a county level, GHG emissions from LSCS are minor relative to these inventories; this is evident, as presented in Table 4–23. Further, total annual LSCS GHG emissions are below EPA’s reporting threshold of 25,000 MT CO2e, as codified in 40 CFR Part 98. The emissions impact of a single source on climate change requires that a climate model account for that specific emissions source in order to project the magnitude and extent of climate change. Climate models indicate that short-term climate change (through the year 2030) is dependent on past GHG emissions. Therefore, climate change is projected to occur with or without present and future GHG emissions from LSCS. The NRC staff concludes that the incremental impact from the contribution of GHG emissions from the proposed action of the continued operation of LSCS on climate change would be SMALL. Due to the global significance of GHG emissions, this global climate change cumulative impacts analysis considers the entire Earth’s atmosphere and therefore global emissions (as opposed to county, state, or national emissions). As discussed in Section 4.15.3.2, climate change and climate-related environmental changes have been observed on a global level, and climate models indicate that future climate change will depend on present and future global GHG
7 On February 9, 2016, the U.S. Supreme Court issued a stay of implementation of the Clean Power Plan
pending judicial review in the U.S. Court of Appeals for the District of Columbia. The Clean Power Plan requirements are therefore on hold until the U.S. Court of Appeals makes a final ruling on the plan.

Environmental Consequences and Mitigating Actions
4-131
emissions. With continued increases in global GHG emission rates, climate models project that Earth’s average surface temperature will continue to increase and climate-related changes will persist. Therefore, the cumulative impact of global GHG emissions from past, present, and reasonably foreseeable future actions on climate change is noticeable but not destabilizing. The NRC staff concludes that the cumulative impacts of global GHG emissions from past, present, and reasonably foreseeable future actions are MODERATE. However, as discussed above, the incremental addition of GHG emissions from the continued operation of LSCS, when compared to global emissions, are negligible and would have a net, beneficial contribution to GHG emissions and climate change impacts during the license renewal term compared to other baseload replacement power generation sources assessed in this SEIS.
Table 4–23. Comparison of GHG Emission Inventories
Source CO2e MMT/year Global Fossil Fuel Combustion Emissions (2013) (a) 36,000 U.S. Emissions (2013)(b) 6,673 Illinois (2013)(c) 134 LaSalle County, Illinois (2013)(c) 0.89 LSCS(d) 0..008 (a) Source: GCP 2014 (b) Source: EPA 2015d (c) GHG emissions account only for direct emitters, those facilities that emit 25,000 MT or more a year (EPA 2015c). (d) Direct emissions (stationary combustion sources, fugitive emissions, and refrigerant related sources) rounded
from and obtained from Exelon 2015d.
4.16.12 Summary of Cumulative Impacts
The NRC staff considered the potential impacts resulting from the operation of LSCS during the period of extended operation and other past, present, and reasonably foreseeable future actions near LSCS. The preliminary determination is that the potential cumulative impacts would range from SMALL to LARGE, depending on the resource. Table 4–24 summarizes the cumulative impacts on resource areas.
Table 4–24. Summary of Cumulative Impacts on Resource Areas
Resource Area Cumulative Impact Air Quality and Noise
Past, present, and reasonably foreseeable future activities exist in the geographic areas of interest (local for noise; local and regional for criteria pollutants) that could affect air quality and noise resources. However, the incremental contribution of impacts on air quality and noise resources from plant operations at LSCS would be minimal. The NRC staff concludes that cumulative impacts from LSCS related actions and other past, present, and reasonably foreseeable future actions on air quality and noise resources in the geographic areas of interest would be SMALL.
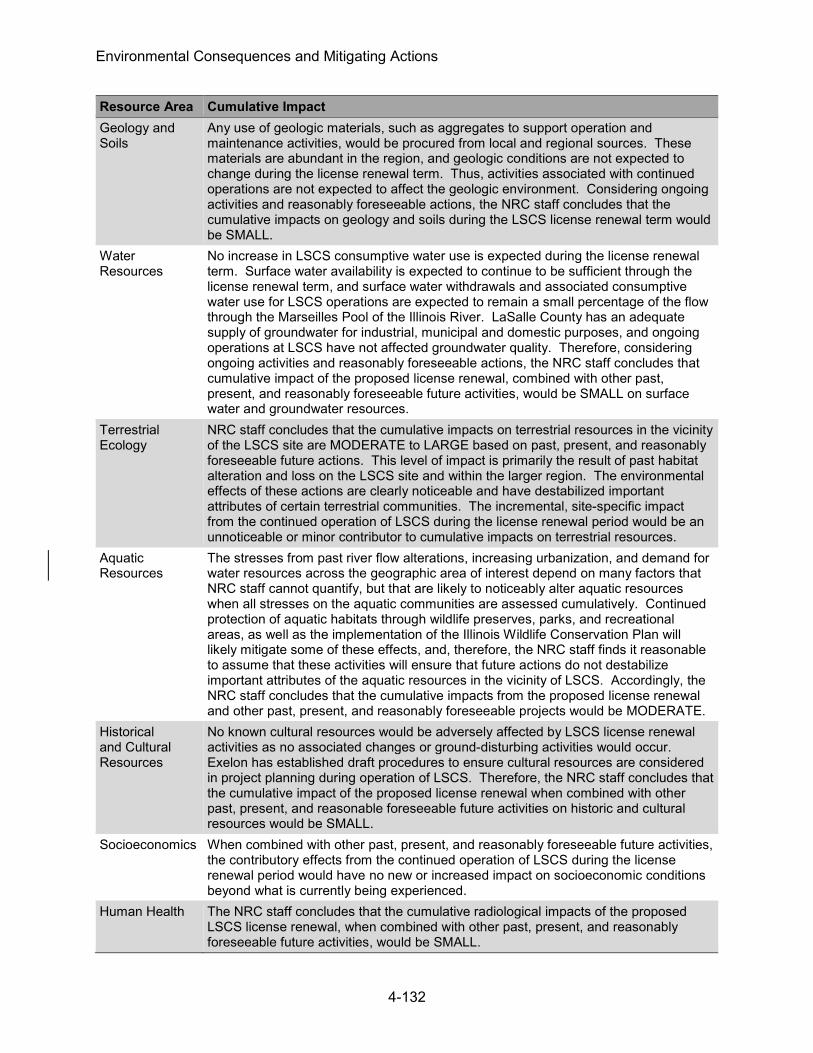
Environmental Consequences and Mitigating Actions
4-132
Resource Area Cumulative Impact Geology and Soils
Any use of geologic materials, such as aggregates to support operation and maintenance activities, would be procured from local and regional sources. These materials are abundant in the region, and geologic conditions are not expected to change during the license renewal term. Thus, activities associated with continued operations are not expected to affect the geologic environment. Considering ongoing activities and reasonably foreseeable actions, the NRC staff concludes that the cumulative impacts on geology and soils during the LSCS license renewal term would be SMALL.
Water Resources
No increase in LSCS consumptive water use is expected during the license renewal term. Surface water availability is expected to continue to be sufficient through the license renewal term, and surface water withdrawals and associated consumptive water use for LSCS operations are expected to remain a small percentage of the flow through the Marseilles Pool of the Illinois River. LaSalle County has an adequate supply of groundwater for industrial, municipal and domestic purposes, and ongoing operations at LSCS have not affected groundwater quality. Therefore, considering ongoing activities and reasonably foreseeable actions, the NRC staff concludes that cumulative impact of the proposed license renewal, combined with other past, present, and reasonably foreseeable future activities, would be SMALL on surface water and groundwater resources.
Terrestrial Ecology
NRC staff concludes that the cumulative impacts on terrestrial resources in the vicinity of the LSCS site are MODERATE to LARGE based on past, present, and reasonably foreseeable future actions. This level of impact is primarily the result of past habitat alteration and loss on the LSCS site and within the larger region. The environmental effects of these actions are clearly noticeable and have destabilized important attributes of certain terrestrial communities. The incremental, site-specific impact from the continued operation of LSCS during the license renewal period would be an unnoticeable or minor contributor to cumulative impacts on terrestrial resources.
Aquatic Resources
The stresses from past river flow alterations, increasing urbanization, and demand for water resources across the geographic area of interest depend on many factors that NRC staff cannot quantify, but that are likely to noticeably alter aquatic resources when all stresses on the aquatic communities are assessed cumulatively. Continued protection of aquatic habitats through wildlife preserves, parks, and recreational areas, as well as the implementation of the Illinois Wildlife Conservation Plan will likely mitigate some of these effects, and, therefore, the NRC staff finds it reasonable to assume that these activities will ensure that future actions do not destabilize important attributes of the aquatic resources in the vicinity of LSCS. Accordingly, the NRC staff concludes that the cumulative impacts from the proposed license renewal and other past, present, and reasonably foreseeable projects would be MODERATE.
Historical and Cultural Resources
No known cultural resources would be adversely affected by LSCS license renewal activities as no associated changes or ground-disturbing activities would occur. Exelon has established draft procedures to ensure cultural resources are considered in project planning during operation of LSCS. Therefore, the NRC staff concludes that the cumulative impact of the proposed license renewal when combined with other past, present, and reasonable foreseeable future activities on historic and cultural resources would be SMALL.
Socioeconomics When combined with other past, present, and reasonably foreseeable future activities, the contributory effects from the continued operation of LSCS during the license renewal period would have no new or increased impact on socioeconomic conditions beyond what is currently being experienced.
Human Health The NRC staff concludes that the cumulative radiological impacts of the proposed LSCS license renewal, when combined with other past, present, and reasonably foreseeable future activities, would be SMALL.
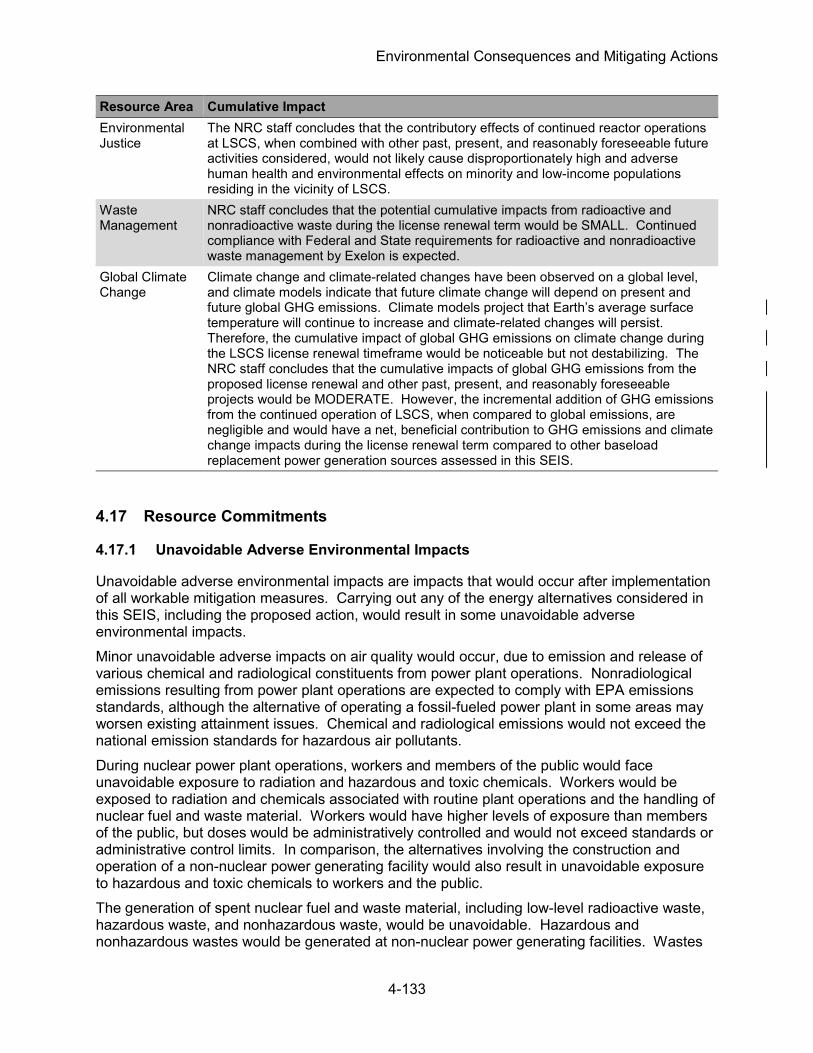
Environmental Consequences and Mitigating Actions
4-133
Resource Area Cumulative Impact Environmental Justice
The NRC staff concludes that the contributory effects of continued reactor operations at LSCS, when combined with other past, present, and reasonably foreseeable future activities considered, would not likely cause disproportionately high and adverse human health and environmental effects on minority and low-income populations residing in the vicinity of LSCS.
Waste Management
NRC staff concludes that the potential cumulative impacts from radioactive and nonradioactive waste during the license renewal term would be SMALL. Continued compliance with Federal and State requirements for radioactive and nonradioactive waste management by Exelon is expected.
Global Climate Change
Climate change and climate-related changes have been observed on a global level, and climate models indicate that future climate change will depend on present and future global GHG emissions. Climate models project that Earth’s average surface temperature will continue to increase and climate-related changes will persist. Therefore, the cumulative impact of global GHG emissions on climate change during the LSCS license renewal timeframe would be noticeable but not destabilizing. The NRC staff concludes that the cumulative impacts of global GHG emissions from the proposed license renewal and other past, present, and reasonably foreseeable projects would be MODERATE. However, the incremental addition of GHG emissions from the continued operation of LSCS, when compared to global emissions, are negligible and would have a net, beneficial contribution to GHG emissions and climate change impacts during the license renewal term compared to other baseload replacement power generation sources assessed in this SEIS.
4.17 Resource Commitments
4.17.1 Unavoidable Adverse Environmental Impacts
Unavoidable adverse environmental impacts are impacts that would occur after implementation of all workable mitigation measures. Carrying out any of the energy alternatives considered in this SEIS, including the proposed action, would result in some unavoidable adverse environmental impacts. Minor unavoidable adverse impacts on air quality would occur, due to emission and release of various chemical and radiological constituents from power plant operations. Nonradiological emissions resulting from power plant operations are expected to comply with EPA emissions standards, although the alternative of operating a fossil-fueled power plant in some areas may worsen existing attainment issues. Chemical and radiological emissions would not exceed the national emission standards for hazardous air pollutants. During nuclear power plant operations, workers and members of the public would face unavoidable exposure to radiation and hazardous and toxic chemicals. Workers would be exposed to radiation and chemicals associated with routine plant operations and the handling of nuclear fuel and waste material. Workers would have higher levels of exposure than members of the public, but doses would be administratively controlled and would not exceed standards or administrative control limits. In comparison, the alternatives involving the construction and operation of a non-nuclear power generating facility would also result in unavoidable exposure to hazardous and toxic chemicals to workers and the public. The generation of spent nuclear fuel and waste material, including low-level radioactive waste, hazardous waste, and nonhazardous waste, would be unavoidable. Hazardous and nonhazardous wastes would be generated at non-nuclear power generating facilities. Wastes

Environmental Consequences and Mitigating Actions
4-134
generated during plant operations would be collected, stored, and shipped for suitable treatment, recycling, or disposal in accordance with applicable Federal and state regulations. Due to the costs of handling these materials, power plant operators would be expected to carry out all activities and optimize all operations in a way that generates the smallest amount of waste possible.
4.17.2 Short-Term Versus Long-Term Productivity
The operation of power generating facilities would result in short-term uses of the environment, as described in Chapter 4. “Short term” is the period of time that continued power generating activities take place. Power plant operations require short-term use of the environment and commitment of resources (e.g., land and energy), indefinitely or permanently. Certain short-term resource commitments are substantially greater under most energy alternatives, including license renewal, than under the no-action alternative because of the continued generation of electrical power and the continued use of generating sites and associated infrastructure. During operations, all energy alternatives entail similar relationships between local short-term uses of the environment and the maintenance and enhancement of long-term productivity. Air emissions from power plant operations introduce small amounts of radiological and nonradiological constituents to the region around the plant site. Over time, these emissions would result in increased concentrations and exposure, but they are not expected to impact air quality or radiation exposure to the extent that public health and long-term productivity of the environment would be impaired. Continued employment, expenditures, and tax revenues generated during power plant operations directly benefit local, regional, and state economies over the short term. Local governments investing project-generated tax revenues into infrastructure and other required services could enhance economic productivity over the long term. The management and disposal of spent nuclear fuel, low-level radioactive waste, hazardous waste, and nonhazardous waste requires an increase in energy and consumes space at treatment, storage, or disposal facilities. Regardless of the location, the use of land to meet waste disposal needs would reduce the long-term productivity of the land. Power plant facilities are committed to electricity production over the short term. After decommissioning these facilities and restoring the area, the land could be available for other future productive uses.
4.17.3 Irreversible and Irretrievable Commitments of Resources
This section describes the irreversible and irretrievable commitments of resources that have been noted in this SEIS. Resources are irreversible when primary or secondary impacts limit the future options for a resource. An irretrievable commitment refers to the use or consumption of resources that are neither renewable nor recoverable for future use. Irreversible and irretrievable commitments of resources for electrical power generation include the commitment of land, water, energy, raw materials, and other natural and man-made resources required for power plant operations. In general, the commitments of capital, energy, labor, and material resources are also irreversible. The implementation of any of the energy alternatives considered in this SEIS would entail the irreversible and irretrievable commitments of energy, water, chemicals, and—in some cases—

Environmental Consequences and Mitigating Actions
4-135
fossil fuels. These resources would be committed during the license renewal term and over the entire life cycle of the power plant, and they would be unrecoverable. Energy expended would be in the form of fuel for equipment, vehicles, and power plant operations and electricity for equipment and facility operations. Electricity and fuel would be purchased from offsite commercial sources. Water would be obtained from existing water supply systems. These resources are readily available, and the amounts required are not expected to deplete available supplies or exceed available system capacities.
4.18 References
10 CFR Part 20. Code of Federal Regulations, Title 10, Energy, Part 20, “Standards for protection against radiation.” 10 CFR Part 50. Code of Federal Regulations, Title 10, Energy, Part 50, “Domestic licensing of production and utilization facilities.” 10 CFR Part 51. Code of Federal Regulations, Title 10, Energy, Part 51, “Environmental protection regulations for domestic licensing and related regulatory functions.” 10 CFR Part 54. Code of Federal Regulations, Title 10, Energy, Part 54, “Requirements for renewal of operating licenses for nuclear power plants.” 10 CFR Part 100. Code of Federal Regulations, Title 10, Energy, Part 100, “Reactor site criteria.” 36 CFR 60.4, Code of Federal Regulations, Title 36, Parks, Forests, and Public Property, Part 60, “National Register of Historic Places”, Section 60.4, “Criteria for evaluation.” 36 CFR Part 800. Code of Federal Regulations, Title 36, Parks, Forests, and Public Property. Part 800, “Protection of Historic Properties.” 40 CFR Part 51. Code of Federal Regulations, Title 40, Protection of Environment, Part 51, “Requirements for preparation, adoption, and submittal of implementation plans.” 40 CFR Part 60. Code of Federal Regulations, Title 40, Protection of Environment, Part 60, “Standards of Performance for New Stationary Sources.” 40 CFR Part 63. Code of Federal Regulations, Title 40, Protection of Environment, Part 63, “National emission standards for hazardous air pollutants for source categories.” 40 CFR Part 75. Code of Federal Regulations, Title 40, Protection of Environment, Part 75, “Continuous emission monitoring.” 40 CFR Part 81. Code of Federal Regulations, Title 40, Protection of Environment, Part 81, “Designation of areas for air quality planning purposes.” 40 CFR Part 125. Code of Federal Regulations, Title 40, Protection of Environment, Part 125, “Criteria and standards for the National Pollutant Discharge Elimination System.” 40 CFR Part 190. Code of Federal Regulations, Title 40, Protection of Environment, Part 190, “Environmental radiation protection standards for nuclear power operations.” 50 CFR Part 402. Code of Federal Regulations, Title 50, Wildlife and Fisheries, Part 402, “Interagency cooperation—Endangered Species Act of 1973, as amended.”
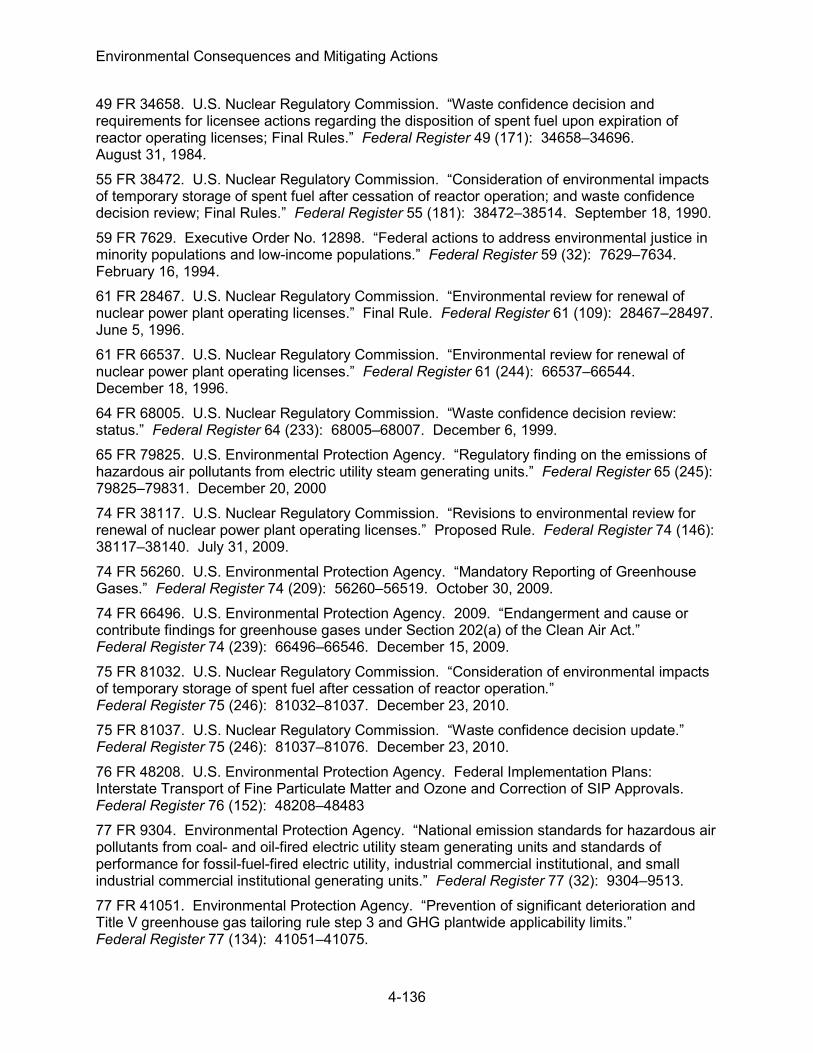
Environmental Consequences and Mitigating Actions
4-136
49 FR 34658. U.S. Nuclear Regulatory Commission. “Waste confidence decision and requirements for licensee actions regarding the disposition of spent fuel upon expiration of reactor operating licenses; Final Rules.” Federal Register 49 (171): 34658–34696. August 31, 1984. 55 FR 38472. U.S. Nuclear Regulatory Commission. “Consideration of environmental impacts of temporary storage of spent fuel after cessation of reactor operation; and waste confidence decision review; Final Rules.” Federal Register 55 (181): 38472–38514. September 18, 1990. 59 FR 7629. Executive Order No. 12898. “Federal actions to address environmental justice in minority populations and low-income populations.” Federal Register 59 (32): 7629–7634. February 16, 1994. 61 FR 28467. U.S. Nuclear Regulatory Commission. “Environmental review for renewal of nuclear power plant operating licenses.” Final Rule. Federal Register 61 (109): 28467–28497. June 5, 1996. 61 FR 66537. U.S. Nuclear Regulatory Commission. “Environmental review for renewal of nuclear power plant operating licenses.” Federal Register 61 (244): 66537–66544. December 18, 1996. 64 FR 68005. U.S. Nuclear Regulatory Commission. “Waste confidence decision review: status.” Federal Register 64 (233): 68005–68007. December 6, 1999. 65 FR 79825. U.S. Environmental Protection Agency. “Regulatory finding on the emissions of hazardous air pollutants from electric utility steam generating units.” Federal Register 65 (245): 79825–79831. December 20, 2000 74 FR 38117. U.S. Nuclear Regulatory Commission. “Revisions to environmental review for renewal of nuclear power plant operating licenses.” Proposed Rule. Federal Register 74 (146): 38117–38140. July 31, 2009. 74 FR 56260. U.S. Environmental Protection Agency. “Mandatory Reporting of Greenhouse Gases.” Federal Register 74 (209): 56260–56519. October 30, 2009. 74 FR 66496. U.S. Environmental Protection Agency. 2009. “Endangerment and cause or contribute findings for greenhouse gases under Section 202(a) of the Clean Air Act.” Federal Register 74 (239): 66496–66546. December 15, 2009. 75 FR 81032. U.S. Nuclear Regulatory Commission. “Consideration of environmental impacts of temporary storage of spent fuel after cessation of reactor operation.” Federal Register 75 (246): 81032–81037. December 23, 2010. 75 FR 81037. U.S. Nuclear Regulatory Commission. “Waste confidence decision update.” Federal Register 75 (246): 81037–81076. December 23, 2010. 76 FR 48208. U.S. Environmental Protection Agency. Federal Implementation Plans: Interstate Transport of Fine Particulate Matter and Ozone and Correction of SIP Approvals. Federal Register 76 (152): 48208–48483 77 FR 9304. Environmental Protection Agency. “National emission standards for hazardous air pollutants from coal- and oil-fired electric utility steam generating units and standards of performance for fossil-fuel-fired electric utility, industrial commercial institutional, and small industrial commercial institutional generating units.” Federal Register 77 (32): 9304–9513. 77 FR 41051. Environmental Protection Agency. “Prevention of significant deterioration and Title V greenhouse gas tailoring rule step 3 and GHG plantwide applicability limits.” Federal Register 77 (134): 41051–41075.

Environmental Consequences and Mitigating Actions
4-137
78 FR 37282. U.S. Nuclear Regulatory Commission. “Revisions to environmental review for renewal of nuclear power plant operating licenses.” Federal Register 78 (119): 37282–37324. June 20, 2013. 79 FR 1430. U.S. Environmental Protection Agency. “Standards of Performance for Greenhouse Gas Emissions from New Stationary Sources: Electric Utility Generating Units.” Federal Register 79 (5): 1430–1519. January 8, 2014. 79 FR 48300. U.S. Environmental Protection Agency. “National Pollutant Discharge Elimination System—Final Regulations to Establish Requirements for Cooling Water Intake Structures at Existing Facilities and Amend Requirements at Phase I Facilities.” Federal Register 79 (158): 48300–48439. August 15, 2014. 79 FR 56263. U.S. Nuclear Regulatory Commission. “Generic environmental impact statement for continued storage of spent nuclear fuel.” Federal Register 79 (182): 56263–56264. September 19, 2014. 79 FR 56238. U.S. Nuclear Regulatory Commission. “Continued storage of spent nuclear fuel.” Federal Register 79 (182): 56238–56263. September 19, 2014. 79 FR 73705. U.S. Fish and Wildlife Service. 2014. Endangered and threatened wildlife and plants; threatened species status for the rufa red knot. Federal Register 79 (238): 73705–73748. December 11, 2014. 80 FR 46062. U.S. Nuclear Regulatory Commission. “Exelon Generation Company, LLC; LaSalle County Station, Units 1 and 2; Environmental assessment and finding of no significant impact; issuance.” Federal Register 80 (148): 46062-46066. August 3, 2015.
80 FR 64661. U.S. Environmental Protection Agency. “Carbon Pollution Emission Guidelines for Existing Stationary Sources: Electric Utility Generating Units.” Federal Register 80 (205): 64661–65120. October 23, 2015. 35 IAC 302. Illinois Administrative Code, Title 35, Environmental Protection, Part 302, “Water Quality Standards.” 415 ILCS 5/Tit. VI. Illinois Compiled Statutes. Chapter 415, 5, “Noise.” 54 USC 300101. United States Code. Title 54, National Park Service and Related Programs, Section 300101 et seq., National Historic Preservation Act. [AMS] American Meteorological Society. 2015. State of the Climate in 2014. Special Supplement to the Bulletin of American Meteorological Society Vol. 96, No. 7, July 2015. Available at <https://www2.ametsoc.org/ams/index.cfm/publications/bulletin-of-the-american-meteorological-society-bams/state-of-the-climate/> (accessed 4 August 2015). Arnold TL, Sullivan DJ, Harris MA, Fitzpatrick FA, Scudder BC, Ruhl PM, Hanchar DW, Stewart JS. 1999. Environmental Setting of the Upper Illinois River Basin and Implications for Water Quality. Urbana, IL: U.S. Geological Survey, WRD. Water-Resources Investigations Report 98–4268. Available at <http://il.water.usgs.gov/nawqa/uirb/pubs/reports/WRIR_98-4268.pdf> (accessed 21 August 2015). Burch, SL. 2002. A Comparison of Potentiometric Surfaces for the Cambrian-Ordovician Aquifers of Northeastern Illinois, 1995 and 2000. Data/Case Study 2002–02, Illinois State Water Survey. 2002. Available at <http://www.isws.illinois.edu/pubdoc/dcs/iswsdcs2002-02.pdf> (accessed 16 June 2015).

Environmental Consequences and Mitigating Actions
4-138
Burch, SL. 2008. A Comparison of Potentiometric Surfaces for the Cambrian-Ordovician Aquifers of Northeastern Illinois, 2000 and 2007, Data/Case Study 2008–04, Illinois State Water Survey. 2008. Available at <http://www.isws.illinois.edu/pubdoc/DCS/ISWSDCS2008-04.pdf> (accessed 16 June 2015). [CDC] Centers for Disease Control and Prevention. 2013. “Pathogen & Environment: Naegleria fowleri - Primary Amebic Meningoencephalitis (PAM).” Updated November 6, 2013. Available at <http://www.cdc.gov/parasites/naegleria/pathogen.html> (accessed 3 January 2014). [CECO] Commonwealth Edison Company. 1994. LaSalle County Nuclear Power Station, Individual Plant Examination and Individual Plant Examination (External Events). April 1994. [CEQ] Council on Environmental Quality. 1997. “Considering Cumulative Effects under the National Environmental Policy Act.” Executive Office of the President, Washington, DC. 122 p. Available at <http://energy.gov/sites/prod/files/nepapub/nepa_documents/RedDont/G-CEQ-ConsidCumulEffects.pdf> (accessed 21 August 2015). Chen IC, Hill JK, Ohlemuller R, Roy DB, Thomas CD. 2011. Rapid range shifts of species associated with high levels of climate warming. Science 333(6045): 1024–1026. Clean Air Act of 1970, as amended (CAA). 42 U.S.C. 7410 et seq. Consolidated Appropriations Act of 2008. 121 Stat. 1844. Daily Herald. 2010. Illinois Emerges as One of the Country’s Leaders in Wind Energy. Available at <http://prev.dailyherald.com/story/?id=345484> (accessed August 2015). Dale VH. 1997. The relationship between land-use change and climate change. Ecological Applications 7(3): 753–769. [DOE] U.S. Department of Energy. 2010a. Kemper County IGCC Project Final Environmental Impact Statement. DOE/EIS–0409. May 2010. Available at <http://energy.gov/sites/prod/files/nepapub/nepa_documents/RedDont/EIS-0409-FEIS-01-2010.pdf> (accessed 3 August 2015). [DOE] U.S. Department of Energy. 2010b. Final Environmental Assessment for Department of Energy Loan Guarantee for the Agua Caliente Solar Project in Yuma County, Arizona. DOE/EA–1797. November. Available at <http://energy.gov/nepa/downloads/ea-1797-final-environmental-assessment> (accessed 3 August 2015). Dziegielewski B, Yang X, Bik T, Margono H, Richey M. 2005. County-Level Forecasts of Water Use in Illinois: 2005–2025: Project Completion Report. Carbondale, IL: Southern Illinois University Carbondale. March 30, 2005. 211 p. Available at <http://www.isws.illinois.edu/wsp/waterdemand.asp> (accessed 5 September 2015). [EA] EA Engineering, Science, and Technology, Inc. 2000. Final Report LaSalle Station Aquatic Monitoring 1999, RM 249.7–248.8. Prepared for Commonwealth Edison Company, Marseilles, Illinois. September 2000. Deerfield, Illinois. ADAMS No. ML15273A420. [EA] EA Engineering, Science, and Technology, Inc. 2014. LaSalle County Station 2013 Fish and Benthos Monitoring and Historical Fish and Benthos Comparisons. Prepared for Exelon Generation Company, LLC, Kennett Square, Pennsylvania. May 2014. Deerfield, Illinois. ADAMS No. ML15273A419.

Environmental Consequences and Mitigating Actions
4-139
[EA] EA Engineering, Science, and Technology, Inc. 2015. Final Impingement and Entrainment Characterization Study LaSalle County Station. Prepared for Exelon Generation Company, LLC, Kennett Square, Pennsylvania. August 2015. Deerfield, Illinois. ADAMS No. ML15243A204. [EIA] U.S. Energy Information Administration. 2011. International Energy Outlook 2011. Washington, DC: EIA. DOE/EIA–0484(2011). September 2011. 301 p. Available at <http://www.eia.gov/forecasts/archive/ieo11/pdf/0484(2011).pdf> (accessed August 2015). [EIA] U.S. Energy Information Administration. 2015a. Electricity, 1990–2013, U.S. Electric Power Industry Estimated Emissions by State (EIA–767, EIA–906, EIA–920, EIA–923). Available at <http://www.eia.gov/electricity/data/state/> (accessed August 2015). [EIA] U.S. Energy Information Administration. 2015b. Frequently Asked Questions, What is U.S. electricity generation by energy source? Available at <http://www.eia.gov/tools/faqs/faq.cfm?id=427&t=3> (accessed August 2015) [ESA] Endangered Species Act of 1973, as amended. 16 U.S.C. § 1531 et seq. [EPA] U.S. Environmental Protection Agency. 1998. Guidelines for Ecological Risk Assessment. Washington, DC: EPA Risk Assessment Forum. EPA/630/R–95/002F. 188 p. Available at <http://www.epa.gov/raf/publications/pdfs/ECOTXTBX.PDF> (accessed 27 March 2014). [EPA] U.S. Environmental Protection Agency. 1999a. Alternative Disinfectants and Oxidants Guidance Manual. Washington, DC: EPA Office of Water. EPA 815–R–99–014. 346 p. Available at <http://www.epa.gov/ogwdw/mdbp/alternative_disinfectants_guidance.pdf> (accessed 21 August 2015). [EPA] U.S. Environmental Protection Agency. 1999b. Consideration of Cumulative Impacts in EPA Review of NEPA Documents. EPA–315–R–99–002, Office of Federal Activities (2252A), Washington, D.C. Available at <http://www2.epa.gov/sites/production/files/2014-08/documents/cumulative.pdf> (accessed 20 October 2015). [EPA] U.S. Environmental Protection Agency. 2004. Technical Development Document for the Final Section 316(b) Phase II Existing Facilities Rule. Washington, DC: EPA Office of Water. EPA 821–R–04–007. February 12, 2004. 228 p. Available at <http://water.epa.gov/lawsregs/lawsguidance/cwa/316b/upload/Cooling-Water_Phase-2_TDD_2004.pdf> (accessed 3 June 2014). [EPA] U.S. Environmental Protection Agency. 2009a. “Endangerment and Cause or Contribute Finding for Greenhouse Gases under Section 202(a) of the Clean Air Act.” Available at <http://www.epa.gov/climatechange/endangerment/> (accessed 4 August 2015). [EPA] U.S. Environmental Protection Agency. 2009b. Assessment of the Impacts of Global Change on Regional U.S. Air Quality: A synthesis of Climate Change Impacts on Ground-Level Ozone. EPA/600/R–07/094F. April 2009. Available at <http://ofmpub.epa.gov/eims/eimscomm.getfile?p_download_id=491176> (accessed 4 August 2015). [EPA] U.S. Environmental Protection Agency. 2014. Climate Change Indicators in the United States, 2014. EPA–430–R–14–004. Available at <http://www.epa.gov/climatechange/pdfs/climateindicators-full-2014.pdf> (accessed 4 August 2015).

Environmental Consequences and Mitigating Actions
4-140
[EPA] U.S. Environmental Protection Agency. 2015a. Clean Air Act Permitting for Greenhouse Gases. Available at <http://www.epa.gov/nsr/ghgpermitting.html> (accessed August 2015) [EPA] U.S. Environmental Protection Agency. 2015b. Enforcement and Compliance History Online, LaSalle County. Available at <http://echo.epa.gov/?redirect=echo> (accessed August 2015). [EPA] U.S. Environmental Protection Agency. 2015c. EPA Facility Level GHG Emissions Data, Illinois and LaSalle County. Available at <http://ghgdata.epa.gov/ghgp/main.do> (accessed August 2015). [EPA] U.S. Environmental Protection Agency. 2015d. Inventory of U.S. Greenhouse Gas Emissions and Sinks: 1990–2013. April 15, 2015. Available at <http://www.epa.gov/climatechange/Downloads/ghgemissions/US-GHG-Inventory-2015-Main-Text.pdf> (accessed August 2015). [EPA] U.S. Environmental Protection Agency. 2015e. Learn About New Source Review. Available at <http://www2.epa.gov/nsr/learn-about-new-source-review> (accessed 5 October 2015). [EPA] U.S. Environmental Protection Agency. 2015f. “New Source Review Basic Information on PSD.” Available at <http://www.epa.gov/NSR/psd.html> (accessed August 2015). [Exelon] Exelon Generation Company, LLC. 2001. Letter from W. Riffer, Regulatory Assurance Manager, LaSalle County Station to U.S. NRC, Document control Desk. Subject: Environmental Non-Routine Event Report for Exelon Generation Company, LLC—LaSalle County Station. August 17, 2001. ADAMS No. ML012330070. [Exelon] Exelon Generation Company, LLC. 2002. Letter from G.T. Kaegi, Regulatory Assurance Manager, LaSalle County Station to U.S. NRC, Document control Desk. Subject: Environmental Protection Plan and Operating Report Appendix B to Facility License No. NPF–11 and NPF–18. April 29, 2002. ADAMS No. ML021330421. [Exelon] Exelon Generation Company, LLC. 2009. Letter from D. Rhoads, Plant Manager, LaSalle County Station to U.S. NRC, Document control Desk. Subject: Environmental Non-Routine Event Report for Exelon Generation Company, LLC—LaSalle County Station. July 22, 2009. ADAMS No. ML092040381. [Exelon] Exelon Generation Company, LLC. 2010. Letter from P.J. Karaba, Plant Manager, LaSalle County Station to U.S. NRC, Document control Desk. Subject: Environmental Non-Routine Event Report for Exelon Generation Company, LLC—LaSalle County Station. August 25, 2010. ADAMS No. ML102371289. [Exelon] Exelon Generation Company, LLC. 2014a. Applicant’s Environmental Report—Operating License Renewal Stage LaSalle County Station, Unit 1 License No. NPF–11, Unit 2 License No. NPF–18. Chicago, Illinois: Exelon. December 9, 2014. ADAMS Nos. ML14343A849, ML14343A883, and ML14343A897. [Exelon] Exelon Generation Company, LLC. 2014b. LaSalle County Station, Updated Final Safety Analysis Report (UFSAR). Revision 20, April 2014. ADAMS No. ML14113A099. [Exelon] Exelon Generation Company, LLC. 2014c. Letter from M.P. Gallagher, Vice President License Renewal Projects, Exelon, to Dan Heacock, Facility Evaluation Manager, Illinois Environmental Protection Agency. Subject: Application for Clean Water Act Section 401 Certification Associated with Renewal of LaSalle County Stations Units 1 and 2 Operating Licenses. February 4, 2014. In Appendix B of ADAMS No. ML14343A883.

Environmental Consequences and Mitigating Actions
4-141
[Exelon] Exelon Generation Company, LLC. 2015a. LaSalle County Station, Units 1 and 2, Annual Radiological Environmental Operating Report, 1 January through 31 December 2014. May 13, 2015. ADAMS No. ML15141A195. [Exelon] Exelon Generation Company, LLC. 2015b. Letter from M.P. Gallagher, Vice President, License Renewal Projects, to NRC Document Control Desk. Subject: Response to NRC Request for Additional Information, dated May 22, 2015, Regarding the LaSalle County Station, Units 1 and 2, License Renewal Application, Environmental Review. July 2, 2015. ADAMS No. ML15195A351. [Exelon] Exelon Generation Company, LLC. 2015c. Letter from M.P. Gallagher, Vice President License Renewal Projects, to NRC Document Control Desk. Subject: Response to NRC Request for Additional Information, dated May 22, 2015, Regarding the LaSalle County Station, Units 1 and 2, License Renewal Application, Environmental Review. Enclosure B: LaSalle County Station, Units 1 & 2, Response Sheets for NRC License Renewal Environmental Review Requests for Additional Information. Response to Request for Additional Information MA–04. July 2, 2015. ADAMS No. ML15195A347. [Exelon] Exelon Generation Company, LLC. 2015d. Letter from M.P. Gallagher, Vice President License Renewal Projects, Exelon, to NRC Document Control Desk. Subject: Response to NRC Request for Additional Information, dated May 22, 2015, Regarding the LaSalle County Station, Units 1 and 2, License Renewal Application, Environmental Review. Enclosure B: LaSalle County Station, Units 1 & 2, Response Sheets for NRC License Renewal Environmental Review Requests for Additional Information. Response to Request for Additional Information MA–07. July 2, 2015. ADAMS No. ML15195A350. [Exelon] Exelon Generation Company, LLC. 2015e. Letter from M.P. Gallagher, Vice President License Renewal Projects, Exelon, to NRC Document Control Desk. Subject: Response to NRC Request for Additional Information, dated May 22, 2015, Regarding the LaSalle County Station, Units 1 and 2, License Renewal Application, Environmental Review. Enclosure B: LaSalle County Station, Units 1 & 2, Response Sheets for NRC License Renewal Environmental Review Requests for Additional Information. Response to Request for Additional Information TE–02. July 2, 2015. ADAMS No. ML15195A380. [Exelon] Exelon Generation Company, LLC. 2015f. Letter from M.P. Gallagher, Vice President License Renewal Projects, Exelon, to NRC Document Control Desk. Subject: Response to NRC Request for Additional Information, dated May 22, 2015, Regarding the LaSalle County Station, Units 1 and 2, License Renewal Application, Environmental Review. Enclosure B: LaSalle County Station, Units 1 & 2, Response Sheets for NRC License Renewal Environmental Review Requests for Additional Information. Response to Request for Additional Information TE–04. July 2, 2015. ADAMS No. ML15195A382. [Exelon] Exelon Generation Company, LLC. 2015g. Letter from M.P. Gallagher, Vice President License Renewal Projects, Exelon, to NRC Document Control Desk. Subject: Response to NRC Request for Additional Information, dated May 22, 2015, Regarding the LaSalle County Station, Units 1 and 2, License Renewal Application, Environmental Review. Enclosure B: LaSalle County Station, Units 1 & 2, Response Sheets for NRC License Renewal Environmental Review Requests for Additional Information. Response to Request for Additional Information TE–05. July 2, 2015. ADAMS No. ML15195A383.
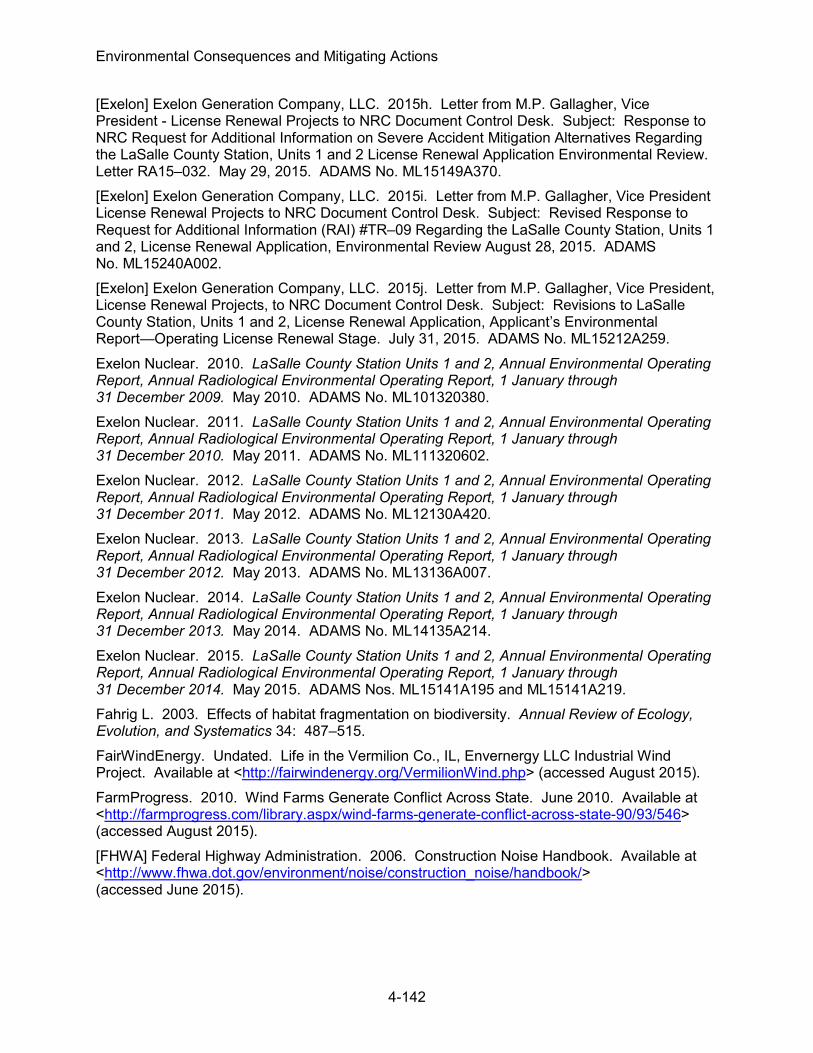
Environmental Consequences and Mitigating Actions
4-142
[Exelon] Exelon Generation Company, LLC. 2015h. Letter from M.P. Gallagher, Vice President - License Renewal Projects to NRC Document Control Desk. Subject: Response to NRC Request for Additional Information on Severe Accident Mitigation Alternatives Regarding the LaSalle County Station, Units 1 and 2 License Renewal Application Environmental Review. Letter RA15–032. May 29, 2015. ADAMS No. ML15149A370. [Exelon] Exelon Generation Company, LLC. 2015i. Letter from M.P. Gallagher, Vice President License Renewal Projects to NRC Document Control Desk. Subject: Revised Response to Request for Additional Information (RAI) #TR–09 Regarding the LaSalle County Station, Units 1 and 2, License Renewal Application, Environmental Review August 28, 2015. ADAMS No. ML15240A002. [Exelon] Exelon Generation Company, LLC. 2015j. Letter from M.P. Gallagher, Vice President, License Renewal Projects, to NRC Document Control Desk. Subject: Revisions to LaSalle County Station, Units 1 and 2, License Renewal Application, Applicant’s Environmental Report—Operating License Renewal Stage. July 31, 2015. ADAMS No. ML15212A259. Exelon Nuclear. 2010. LaSalle County Station Units 1 and 2, Annual Environmental Operating Report, Annual Radiological Environmental Operating Report, 1 January through 31 December 2009. May 2010. ADAMS No. ML101320380. Exelon Nuclear. 2011. LaSalle County Station Units 1 and 2, Annual Environmental Operating Report, Annual Radiological Environmental Operating Report, 1 January through 31 December 2010. May 2011. ADAMS No. ML111320602. Exelon Nuclear. 2012. LaSalle County Station Units 1 and 2, Annual Environmental Operating Report, Annual Radiological Environmental Operating Report, 1 January through 31 December 2011. May 2012. ADAMS No. ML12130A420. Exelon Nuclear. 2013. LaSalle County Station Units 1 and 2, Annual Environmental Operating Report, Annual Radiological Environmental Operating Report, 1 January through 31 December 2012. May 2013. ADAMS No. ML13136A007. Exelon Nuclear. 2014. LaSalle County Station Units 1 and 2, Annual Environmental Operating Report, Annual Radiological Environmental Operating Report, 1 January through 31 December 2013. May 2014. ADAMS No. ML14135A214. Exelon Nuclear. 2015. LaSalle County Station Units 1 and 2, Annual Environmental Operating Report, Annual Radiological Environmental Operating Report, 1 January through 31 December 2014. May 2015. ADAMS Nos. ML15141A195 and ML15141A219. Fahrig L. 2003. Effects of habitat fragmentation on biodiversity. Annual Review of Ecology, Evolution, and Systematics 34: 487–515. FairWindEnergy. Undated. Life in the Vermilion Co., IL, Envernergy LLC Industrial Wind Project. Available at <http://fairwindenergy.org/VermilionWind.php> (accessed August 2015). FarmProgress. 2010. Wind Farms Generate Conflict Across State. June 2010. Available at <http://farmprogress.com/library.aspx/wind-farms-generate-conflict-across-state-90/93/546> (accessed August 2015). [FHWA] Federal Highway Administration. 2006. Construction Noise Handbook. Available at <http://www.fhwa.dot.gov/environment/noise/construction_noise/handbook/> (accessed June 2015).

Environmental Consequences and Mitigating Actions
4-143
[FHWA] Federal Highway Administration. 2011. Highway Traffic Noise Analysis and Abatement Policy and Guidance. Available at <https://www.fhwa.dot.gov/environment/noise/regulations_and_guidance/polguide/ polguide02.cfm> (accessed August 2015). Federal Water Pollution Control Act (Clean Water Act) of 1972, as amended. 33 U.S.C. § 1251 et seq. Fraser KC, Silverio C, Kramer P, Mickle N, Aeppli R, Stutchbury BJM. 2013. A trans-hemispheric migratory songbird does not advance spring schedules or increase migration rate in response to record-setting temperatures at breeding sites. PLoS ONE 8(5): e64587. Fritts, MW. 2013. Email from M.W. Fritts, Illinois Natural History Survey, to P. Moore, Tetra Tech. Subject: RE: Request: Illinois River Reports. June 24, 2013. ADAMS No. ML15273A418. [FWS] U.S. Fish and Wildlife Service. 2014. “Guidance for Preparing a Biological Assessment.” 6 p. Available at <http://www.fws.gov/midwest/endangered/section7/pdf/BAGuidance.pdf> (accessed 29 May 2014). [FWS] U.S. Fish and Wildlife Service. 2015a. Illinois County Distribution, Federally Endangered, Threatened, and Candidate Species. Midwest Region. Updated September 30 2015. Accessed 9 October 2015. Available at http://www.fws.gov/midwest/endangered/lists/illinois-cty.html [FWS] U.S. Fish and Wildlife Service. 2015b. Letter from FWS to NRC. Subject: LaSalle Power Plant License Renewal. List of threatened and endangered species that may occur in your proposed project location, and/or may be affected by your proposed project. 27 February 2015. ADAMS No. ML15126A069. [FWS and NMFS] U.S. Fish and Wildlife Service and National Marine Fisheries Service. 1998. Endangered Species Consultation Handbook: Procedures for Conducting Consultation and Conference Activities Under Section 7 of the Endangered Species Act. March 1998. 315 p. Available at <http://www.nmfs.noaa.gov/pr/pdfs/laws/esa_section7_handbook.pdf> (accessed 12 May 2014). [GCP] Global Carbon Project. 2014. Global Carbon Budget, Media Summary Highlights. Available at <http://www.globalcarbonproject.org/carbonbudget/14/hl-compact.htm> (accessed August 2015). [GE] General Electric. 2010. “How Loud is a Wind Turbine?” Available at <http://www.gereports.com/how-loud-is-a-wind-turbine/> (August 2015). Groschen GE, Arnold TL, Harris MA, Dupré DH, Fitzpatrick FA, Scudder BC, Morrow WS, Terrio PJ, Warner KL, Murphy EA. 2004. Water Quality in the Upper Illinois River Basin, Illinois, Indiana, Wisconsin, 1999–2001. Reston, VA: U.S. Geological Survey. Circular 1230. June 2004. 42 p. Available at <http://pubs.usgs.gov/circ/2004/1230/pdf/circular1230.pdf> (accessed 21 August 2015). Herkert JR. 1994. The effects of habitat fragmentation on Midwestern grassland bird communities. Ecological Applications 4(3): 461–471.

Environmental Consequences and Mitigating Actions
4-144
Hessler DM (Hessler Associates, Inc.). 2011. Assessing Sound Emissions from Proposed Wind Farms and Measuring the Performance of Completed Projects. Washington, DC: The National Association of Regulatory Utility Commissioners (NARUC). October 13, 2011. 69 p. Available at <http://www.naruc.org/Grants/Documents/Final%20full%20MN%20SERCAT%20rep%20with%20NARUC%20cover%20Hessler.pdf> (accessed August 2015). [IDNR] Illinois Department of Natural Resources. 2005. The Illinois Comprehensive Wildlife Conservation Plan & Strategy. Version 1.0. July 11, 2005. 380 p. Available at <http://www.dnr.illinois.gov/conservation/IWAP/Documents/WildlifeActionPlanFinal.pdf> (accessed 16 October 2015). [IDNR] Illinois Department of Natural Resources. 2007. Status of the Catfish Fishery. Illinois Department of Natural Resources, Division of Fisheries. March 2007. Available at <http://www.dnr.state.il.us/orc/fisheries/07/07%20catfish%20status%20report.pdf> (accessed 21 May 2015). [IDNR] Illinois Department of Natural Resources. 2009. Status of the Striped Bass/Hybrid Striped Bass Fishery. Illinois Department of Natural Resources, Division of Fisheries. March 2009. Available at <http://www.prairiestateoutdoors.com/images/uploads/2009_Striped_Bass_Status.pdf> (accessed 21 May 2015). [IDNR] Illinois Department of Natural Resources. 2015a. “Activities at Illini State Park.” Available at <http://www.dnr.illinois.gov/Parks/Activity/Pages/Illini.aspx> (accessed 24 September 2015). [IDNR] Illinois Department of Natural Resources. 2015b. LaSalle Lake State Fish & Wildlife Area. Available at <http://www.dnr.state.il.us/lands/landmgt/parks/r1/lasalle.htm> (accessed 15 October 2015). [IDPH] Illinois Department of Public Health. 2014. Letter from K. Marshall, IDPH, to Exelon. Subject: LaSalle County Station Units 1 and 2 – Consultation about thermophilic organisms. February 28, 2014. ADAMS No. ML15273A445. [IEPA] Illinois Environmental Protection Agency. 2013. NPDES Permit No. lL0048151, National Pollutant Discharge Elimination System, Reissued (NPDES) Permit. Exelon Generation Company, LLC, LaSalle County Generating Station. Effective date, August 1, 2013. Springfield, IL: Division of Water Pollution Control. In: LaSalle County Station, Units 1 and 2, License Renewal Application, Appendix E, Applicant’s Environmental Report, Operating License Renewal Stage. ADAMS No. ML14343A897 (Appendix C). [IEPA] Illinois Environmental Protection Agency. 2014. Letter from G. Good, Manager, IEPA, to Exelon. Subject: LaSalle County Station Units 1 and 2 – Consultation about thermophilic organisms. February 28, 2014. ADAMS No. ML15273A446. [IPCC] Intergovernmental Panel on Climate Change. 2007a. Climate Change 2007: Impacts, Adaptation and Vulnerability. Contribution of Working Group II to the Fourth Assessment Report of the Intergovernmental Panel on Climate Change. Parry ML, Canziani OF, Palutikof JP, van der Linden PJ, Hanson CE, editors. Cambridge University Press, Cambridge, United Kingdom. [IPCC] Intergovernmental Panel on Climate Change. 2007b. Climate Change 2007: Synthesis Report. Contribution of Working Groups I, II and III to the Fourth Assessment Report of the Intergovernmental Panel on Climate Change [Core Writing Team, Pachauri RK, Reisinger A (eds.)]. IPCC, Geneva, Switzerland.

Environmental Consequences and Mitigating Actions
4-145
[IPCC] Intergovernmental Panel on Climate Change. 2007c. Climate Change 2007: The Physical Science Basis. Contribution of Working Group I to the Fourth Assessment Report of the Intergovernmental Panel on Climate Change. Solomon S, Qin D, Manning M, Chen Z, Marquis M, Averyt KB, Tignor M, Miller HL, editors. Cambridge University Press, Cambridge, United Kingdom, and New York, New York, United States. [IPCC] Intergovernmental Panel on Climate Change. 2007c. Climate Change 2007: The Physical Science Basis. Contribution of Working Group I to the Fourth Assessment Report of the Intergovernmental Panel on Climate Change. [IPCC] Intergovermental Panel on Climate Change. 2013. Climate Change 2013: The Physical Science Basis. Contribution of Working Group I to the Fifth Assessment Report of the Intergovernmental Panel on Climate Change [Stocker TF, Qin D, Plattner G-K, Tignor M, Allen SK, Boschung J, Nauels A, Xia Y, Bex V, Midgley PM (eds.)]. Available at <http://www.ipcc.ch/pdf/assessment-report/ar5/wg1/WG1AR5_SPM_FINAL.pdf> [ISGS] Illinois State Geological Survey. 2015. Illinois Water Well (ILWATER) Interactive Map. Available at <http://maps.isgs.illinois.edu/ilwater/> (accessed 13 July 2015). Jacob DJ, Winner DA. 2009. Effect of climate change on air quality. Atmospheric Environment 43(51–63). Knapp, HV. 2009. Trends in Illinois River Streamflow and Flooding (PowerPoint presentation). Center for Watershed Science, Illinois State Water Survey, University of Illinois at Urbana-Champaign. In 2009 Governor's Conference on the Management of the Illinois River System “Looking Back, Moving Forward.” October 20–22, 2009. Peoria, IL. Available at <http://ilrdss.sws.uiuc.edu/pubs/govconf2009/session3c/session3c.htm> (accessed 25 August 2015). LaSalle County. 2014. LaSalle County Comprehensive Plan, LaSalle County, Illinois. Updated June 2014. Available at <http://www.lasallecounty.org/envsvcs/lccp-2014.pdf> (accessed 31 August 2015). Leibowitz R. 2015. Letter to D.J. Wrona, NRC, regarding License renewal – U.S. NRC LaSalle County Station, Units 1 and 2, dated April 1, 2015. ADAMS No. ML15106A791. Lerczak TV. 1996. Illinois River Fish Communities: 1960s vs. 1990s. Illinois Natural History Survey. April 4, 1996. Available at <http://wwx.inhs.illinois.edu/resources/inhsreports/may-jun96/fish/> (accessed 19 March 2015). Mannouris C, Byers DL. 2013. The impact of habitat fragmentation on fitness-related traits in a native prairie plant, Chamaecrista fasciculata (Fabaceae). Biological Journal of the Linnean Society 108(1): 55–67. Mayhew DA, Jensen LD, Hanson DF, Muessig PH. 2000. A comparative review of entrainment survival studies at power plants in estuarine environments. Environmental Science and Policy 3: 295–301. McClelland MA, Pegg MA. 2005. The Long-Term Illinois River Fish Population Monitoring Program, Project F–101–R–16. Illinois Natural History Survey. River Research Laboratory. Havana, IL. May 2005. McClelland, MA, Sass GG, Cook TR, Irons KS, Michaels NM, O’Hara TM, Smith CS. 2012. The Long-Term Illinois River Fish Population Monitoring Program. Fisheries 37(8): 340–350.

Environmental Consequences and Mitigating Actions
4-146
Menzie C, Henning MH, Cura J, Finkelstein K, Gentile J, Maughan J, Mitchell D, Petron S, Potocki B, Svirsky S, Tyler P. 1996. Special report of the Massachusetts weight-of-evidence workgroup: A weight-of-evidence approach for evaluating ecological risks. Human and Ecological Risk Assessment 2(2): 227–304. [MSA] Magnuson–Stevens Fishery Conservation and Management Reauthorization Act of 2006, as amended. 16 U.S.C. §§ 1801–1884. National Environmental Policy Act of 1969 (NEPA). 42 USC § 4321, et seq. [NCDC] National 2015. Climate at a Glance: Average Temperature and Precipitation, 1895–2015, Illinois, Northeast Climate Division. Available at <https://www.ncdc.noaa.gov/cag/time-series/us> (accessed 21 January 2015). [NEI] Nuclear Energy Institute. 2005. “Severe Accident Mitigation Alternative (SAMA) Analysis Guidance Document.” NEI 05–01, Rev. A. Washington, DC: NEI. November 2005. ADAMS No. ML060530203. [NETL] National Energy Technology Laboratory. 2010. U.S. Department of Energy, National Energy Technology Laboratory. Life Cycle Analysis, Natural Gas Combined Cycle (NGCC) Power Plant. DOE/NETL–403/110509. Available at <http://www.netl.doe.gov/research/energy-analysis/publications/details?pub=6c2fe989-d368-4bf5-8e5f-3bd85ff79f8f> (accessed August 2015). [NETL] National Energy Technology Laboratory. 2012. Life Cycle Analysis: Integrated Gasification Combined Cycle (IGCC) Power Plant. Available at <http://www.netl.doe.gov/File%20Library/Research/Energy%20Analysis/Publications/IGCC-LCA-Final-Report---9-30-10---Final---Rev-2-1.pdf> (accessed August 2015). [NETL] National Energy Technology Laboratory. 2013. Cost and Performance Baseline for Fossil Energy Plants, Volume 1: Bituminous Coal and Natural Gas to Electricity, Revision 2a. DOE/NETL–2010/1397. September. Available at <http://www.netl.doe.gov/energy-analyses/pubs/BitBase_FinRep_Rev2.pdf> (accessed August 2015). [NOAA] National Oceanic and Atmospheric Administration. 2013. Regional Climate Trends and Scenarios for the U.S. National Climate Assessment, Part 3. Climate of the Midwest. NOAA Technical Report NESDID 142–3. News-Gazette. 2013. A setback for wind farms. September 15, 2013. Available at <http://www.news-gazette.com/news/local/2013-09-15/setback-wind-farms.html> (accessed August 2015). [NRC] U.S. Nuclear Regulatory Commission. 1978. Final Environmental Statement Related to Operation of LaSalle County Nuclear Power Station Unit Nos. 1 and 2. Washington, DC: Office of Nuclear Reactor Regulation. NUREG–0486. November 1978. ADAMS No. ML14353A388. [NRC] U.S. Nuclear Regulatory Commission. 1996. Generic Environmental Impact Statement for License Renewal of Nuclear Plants. Final Report. Washington, DC: NRC. NUREG–1437, Volumes 1 and 2. May 31, 1996. 1,204 p. ADAMS Nos. ML040690705 and ML040690738. [NRC] U.S. Nuclear Regulatory Commission. 1997. Regulatory Analysis Technical Evaluation Handbook. Washington, DC: NRC. NUREG/BR–0184. ADAMS No. ML050190193. [NRC] U.S. Nuclear Regulatory Commission. 1999. Section 6.3–Transportation, Table 9.1, Summary of findings on NEPA issues for license renewal of nuclear power plants. In: Generic Environmental Impact Statement for License Renewal of Nuclear Plants. Washington, DC: NRC. NUREG–1437, Volume 1, Addendum 1. August 1999. ADAMS No. ML040690720.
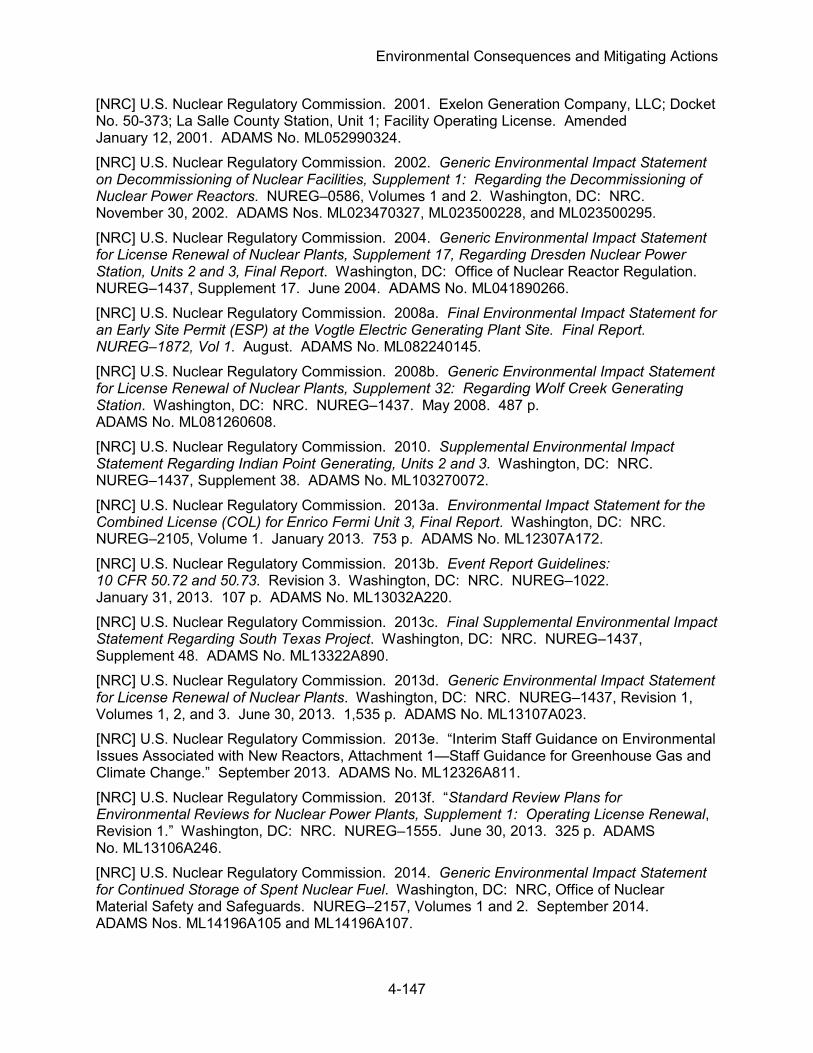
Environmental Consequences and Mitigating Actions
4-147
[NRC] U.S. Nuclear Regulatory Commission. 2001. Exelon Generation Company, LLC; Docket No. 50-373; La Salle County Station, Unit 1; Facility Operating License. Amended January 12, 2001. ADAMS No. ML052990324. [NRC] U.S. Nuclear Regulatory Commission. 2002. Generic Environmental Impact Statement on Decommissioning of Nuclear Facilities, Supplement 1: Regarding the Decommissioning of Nuclear Power Reactors. NUREG–0586, Volumes 1 and 2. Washington, DC: NRC. November 30, 2002. ADAMS Nos. ML023470327, ML023500228, and ML023500295. [NRC] U.S. Nuclear Regulatory Commission. 2004. Generic Environmental Impact Statement for License Renewal of Nuclear Plants, Supplement 17, Regarding Dresden Nuclear Power Station, Units 2 and 3, Final Report. Washington, DC: Office of Nuclear Reactor Regulation. NUREG–1437, Supplement 17. June 2004. ADAMS No. ML041890266. [NRC] U.S. Nuclear Regulatory Commission. 2008a. Final Environmental Impact Statement for an Early Site Permit (ESP) at the Vogtle Electric Generating Plant Site. Final Report. NUREG–1872, Vol 1. August. ADAMS No. ML082240145. [NRC] U.S. Nuclear Regulatory Commission. 2008b. Generic Environmental Impact Statement for License Renewal of Nuclear Plants, Supplement 32: Regarding Wolf Creek Generating Station. Washington, DC: NRC. NUREG–1437. May 2008. 487 p. ADAMS No. ML081260608. [NRC] U.S. Nuclear Regulatory Commission. 2010. Supplemental Environmental Impact Statement Regarding Indian Point Generating, Units 2 and 3. Washington, DC: NRC. NUREG–1437, Supplement 38. ADAMS No. ML103270072. [NRC] U.S. Nuclear Regulatory Commission. 2013a. Environmental Impact Statement for the Combined License (COL) for Enrico Fermi Unit 3, Final Report. Washington, DC: NRC. NUREG–2105, Volume 1. January 2013. 753 p. ADAMS No. ML12307A172. [NRC] U.S. Nuclear Regulatory Commission. 2013b. Event Report Guidelines: 10 CFR 50.72 and 50.73. Revision 3. Washington, DC: NRC. NUREG–1022. January 31, 2013. 107 p. ADAMS No. ML13032A220. [NRC] U.S. Nuclear Regulatory Commission. 2013c. Final Supplemental Environmental Impact Statement Regarding South Texas Project. Washington, DC: NRC. NUREG–1437, Supplement 48. ADAMS No. ML13322A890. [NRC] U.S. Nuclear Regulatory Commission. 2013d. Generic Environmental Impact Statement for License Renewal of Nuclear Plants. Washington, DC: NRC. NUREG–1437, Revision 1, Volumes 1, 2, and 3. June 30, 2013. 1,535 p. ADAMS No. ML13107A023. [NRC] U.S. Nuclear Regulatory Commission. 2013e. “Interim Staff Guidance on Environmental Issues Associated with New Reactors, Attachment 1—Staff Guidance for Greenhouse Gas and Climate Change.” September 2013. ADAMS No. ML12326A811. [NRC] U.S. Nuclear Regulatory Commission. 2013f. “Standard Review Plans for Environmental Reviews for Nuclear Power Plants, Supplement 1: Operating License Renewal, Revision 1.” Washington, DC: NRC. NUREG–1555. June 30, 2013. 325 p. ADAMS No. ML13106A246. [NRC] U.S. Nuclear Regulatory Commission. 2014. Generic Environmental Impact Statement for Continued Storage of Spent Nuclear Fuel. Washington, DC: NRC, Office of Nuclear Material Safety and Safeguards. NUREG–2157, Volumes 1 and 2. September 2014. ADAMS Nos. ML14196A105 and ML14196A107.

Environmental Consequences and Mitigating Actions
4-148
[NRC] U.S. Nuclear Regulatory Commission. 2015a. Final Supplemental Environmental Impact Statement Regarding Braidwood Station. Washington, DC: NRC. NUREG–1437, Supplement 55. ADAMS No. ML15062A428. [NRC] U.S. Nuclear Regulatory Commission. 2015b. Final Supplemental Environmental Impact Statement Regarding Seabrook Station. Washington, DC: NRC. NUREG–1437, Supplement 46. ADAMS Nos. ML15209A575 and ML15209A870. [NRC] U.S. Nuclear Regulatory Commission. 2015c. Letter from D.J. Wrona to A.E. Haaker, Illinois Historic Preservation Agency. Subject: LaSalle County Station, Units 1 and 2 License Renewal Application Review. February 9, 2015. ADAMS No. ML15022A578. [NRC] U.S. Nuclear Regulatory Commission. 2015d. Letter from D.J. Wrona to R. Nelson, Advisory Council on Historic Preservation. Subject: LaSalle County Station, Units 1 and 2 License Renewal Application Review. February 9, 2015. ADAMS No. ML15023A094. [NRC] U.S. Nuclear Regulatory Commission. 2015e. Letters from D.J. Wrona to 14 tribes. Subject: Request for Scoping Comments concerning the LaSalle County Station, Units 1 and 2 License Renewal Application Review. February 9, 2015. ADAMS No. ML15023A139. [NRC] U.S. Nuclear Regulatory Commission. 2015f. Meeting Summary: NRC Visit to Illinois State Historic Preservation Office on May 7, 2015. ADAMS No. ML15205A286. [NRC] U.S. Nuclear Regulatory Commission. 2015g. Letter from B. Vaidya, Project Manager, Plant Licensing III-2 and Planning and Analysis Branch, Office Nuclear Reactor Regulation, to B.C. Hanson, Senior Vice President, Exelon Generation Company, LLC. Subject: LaSalle County Station, Units 1 and 2, Issuance of Amendment Revising the Ultimate Heat Sink Temperature Limit. November 19, 2015. ADAMS Nos. ML15202A578. [NREL] National Renewable Energy Laboratory. 2013. Estimated Economic Impacts of Utility Scale Wind Power in Iowa. Technical Report NREL/TP–6A20-53187. November. Available at <http://www.nrel.gov/docs/fy14osti/53187.pdf>. [OEPA] Ohio Environmental Protection Agency. 1987. Biological Criteria for the Protection of Aquatic Life. Ohio Environmental Protection Agency. July 1987. Columbus, Ohio. Available at <http://www.epa.state.oh.us/Portals/35/documents/Vol1.pdf> (accessed 26 October 2015). [OEPA] Ohio Environmental Protection Agency. 1989. From EA 1999. [OECD/NEA] Organisation for Economic Co-Operation and Development Nuclear Energy Agency. 2005. Projected Costs of Generating Electricity 2005. OECD Publishing. 230 p. Available at <http://www.oecd-ilibrary.org/content/book/9789264008274-en> (accessed August 2015). Parker J. 2014. Long-term impacts of water quality and climate variability on Illinois River waterway fish assemblages. M.S. Thesis, University of Illinois at Urbana-Champaign. May 30, 2014. Available at <https://www.ideals.illinois.edu/handle/2142/49756> (accessed 20 August 2015). Pedersen E, Persson Waye K. 2004. Perception and annoyance due to wind turbine noise—a dose–response relationship. Journal of the Acoustical Society of America 116(6): 3460–3470. Available at <http://www.shipdhamturbines.org.uk/files/RDG08.pdf> (accessed August 2015). Saussus P. 2012. Major noise sources and mitigation cost estimates for gas-fired power facilities. POWER. Available at <http://www.powermag.com/ major-noise-sources-and-mitigation-cost-estimates-for-gas-fired-power-facilities/?pagenum=1> (August 2015).

Environmental Consequences and Mitigating Actions
4-149
Sietman BE, Whitney SD, Kelner DE, Blodgett DK, Dunn HL. 2001. Post-extirpation recovery of the freshwater mussel (Bivalvia: Unionidae) fauna in the upper Illinois River. Journal of Freshwater Ecology, 16(2): 273–281. Smith PW. 2002. The Fishes of Illinois. University of Illinois Press, Urbana and Chicago, IL. Stewart GB, Coles CF, Pullin S. 2005. Effects of wind turbines on bird abundance review report. Centre for Evidence-Based Conservation, Systematic Review No. 4. Available at <http://tethys.pnnl.gov/sites/default/files/publications/Stewart%20et%20al.%202005.pdf> (accessed 24 September 2015). Stewart GB, Pullin AS, Coles CF. 2007. Poor evidence-base for assessment of windfarm impacts on birds. Environmental Conservation 34(1): 1–11. Available at <https://scholar.google.com/scholar?q=Poor+Evidence-Base+For+Assessment+Of+Windfarm+Impacts+On+Birds&hl=en&as_sdt=0&as_vis=1&oi=scholart&sa=X&ved=0CBsQgQMwAGoVChMIz_aWiNSQyAIVBXk-Ch3ROAhK> (accessed 24 September 2015). Tagaris E, Liao KJ, Delucia AJ, Deck L, Amar P, Russel AG. 2009. Potential impact of climate change on air pollution-related human health effects. Environmental Science and Technology 43: 4979–4988. Available at <http://pubs.acs.org/doi/pdf/10.1021/es803650w> (accessed 28 December 2014). Talkington LM. 1991. The Illinois River--Working for our State. Champaign, IL: Illinois State Water Survey. January 1991. Miscellaneous Publication 128. Available at <http://www.isws.illinois.edu/pubdoc/MP/ISWSMP-128.pdf> (accessed 21 August 2015). Tegen S. 2006. Comparing Statewide Economic Impacts of New Generation from Wind, Coal, and Natural Gas in Arizona, Colorado, and Michigan. NREL/TP–500–37720. National Renewable Energy Laboratory. May 2006. 38 p. Available at <http://www.windpoweringamerica.gov/pdfs/38154_econdev_compare_statewide.pdf> (August 2015). Thuiller W (Laboratoire d’Ecologie Alpine). 2007. Biodiversity: climate change and the ecologist. Nature 448: 550–552. DOI: 10.1038/448550a. [USGCRP] U.S. Global Change Research Program. 2009. Global Climate Change Impacts in the United States. Karl TR, Melillo JM, Peterson TC, editors. ADAMS No. ML100580077. [USGCRP] U.S. Global Change Research Program. 2014. Climate Change Impacts in the United States: The Third National Climate Assessment. Melillo JM, Richmond TC, Yohe GW, editors. May 9, 2014. ADAMS No. ML14129A233. [USGS] U.S. Geological Survey. 1979. River Mileages and Drainage Areas for Illinois Streams—Volume 2, Illinois River Basin, Water-Resources Investigations Report 79–111. Available at <http://il.water.usgs.gov/pubs/wrir79_111.pdf> (accessed 28 May 2015). [USGS] U.S. Geological Survey. 1998. National Water-Quality Assessment Program, Upper Illinois River Basin. Urbana, IL: U.S. Geological Survey, WRD. USGS Fact Sheet FS072-98. June 1998. Available at <http://il.water.usgs.gov/pubs/fs072_98.pdf> (accessed 25 August 2015).

Environmental Consequences and Mitigating Actions
4-150
[USGS] U.S. Geological Survey. 2015. USGS Water-Year Summary 2014, 05543500 Illinois River at Marseilles, Illinois. Available at <http://waterdata.usgs.gov/nwis/inventory/?site_no=05543500&agency_cd=USGS> (accessed 5 June 2015). Wu S, Mickley LJ, Leibensperger EM, Jacob DJ, Rind D, Streets DG. 2008. Effects of 2000–2050 global change on ozone air quality in the United States. Journal of Geophysical Research, Volume 113.
5-1
5.0 CONCLUSION
This supplemental environmental impact statement (SEIS) contains the environmental review of the application for renewed operating licenses for LaSalle County Station, Units 1 and 2 (LSCS), submitted by Exelon Generation Company, LLC (Exelon), as required by the Code of Federal Regulations (CFR), Part 51 of Title 10 (10 CFR Part 51), the U.S. Nuclear Regulatory Commission’s (NRC’s) regulations that implement the National Environmental Policy Act (NEPA). This chapter presents conclusions and recommendations from the site-specific environmental review of LSCS. Section 5.1 summarizes the environmental impacts of license renewal; Section 5.2 presents a comparison of the environmental impacts of license renewal and energy alternatives; and Section 5.3 presents the NRC staff conclusions and recommendation.
5.1 Environmental Impacts of License Renewal
The NRC staff’s review of site-specific environmental issues in this SEIS leads to the conclusion that issuing renewed licenses at LSCS would have SMALL to MODERATE impacts for the Category 2 issues applicable to license renewal at LSCS. The NRC staff considered mitigation measures for each Category 2 issue, as applicable. The NRC staff concluded that no additional mitigation measure is warranted.
5.2 Comparison of Alternatives
In Chapter 4, the staff considered the following alternatives to LSCS license renewal:
• no-action alternative,
• new nuclear alternative,
• integrated gasification combined-cycle alternative
• natural gas combined-cycle (NGCC) alternative,
• combination alternative (NGCC, wind, solar), and
• purchased power. Based on the summary of environmental impacts provided in Table 2–2, the NRC staff concluded that the environmental impacts of renewal of the operating licenses for LSCS would be smaller than those of feasible and commercially viable alternatives. The no-action alternative, the act of shutting down LSCS on or before its license expiration dates, would have SMALL environmental impacts with the exception of socioeconomic impacts which would have SMALL to LARGE environmental impacts. Continued operation of LSCS would have SMALL to MODERATE environmental impacts for aquatic resources and SMALL environmental impacts in all other areas. The NRC staff concluded that continued operation of LSCS is the environmentally preferred alternative.
5.3 Recommendation
The NRC’s recommendation is that the adverse environmental impacts of license renewal for LSCS are not so great that preserving the option of license renewal for energy-planning decisionmakers would be unreasonable. This recommendation is based on the following:
Conclusion
5-2
• the analysis and findings in NUREG–1437, Volumes 1 and 2, Generic Environmental Impact Statement for License Renewal of Nuclear Plants,
• the environmental report submitted by Exelon,
• consultation with Federal, State, local, and Tribal government agencies,
• the NRC staff’s environmental review, and
• consideration of public comments received during the scoping process and received on the draft SEIS.

6-1
6.0 LIST OF PREPARERS
This supplemental environmental impact statement (SEIS) was prepared by members of the Office of Nuclear Reactor Regulation (NRR) with assistance from other U.S. Nuclear Regulatory Commission (NRC) organizations and contract support from Pacific Northwest National Laboratory (PNNL), the Center for Nuclear Waste Regulatory Analyses (CNWRA), a private contractor and Idoneous, Inc. (Idoneous). Table 6–1 lists the NRC staff who contributed to the development of the SEIS. PNNL provides contract support for analysis of transportation impacts of high burnup fuel. CNWRA provides contract support for severe accident mitigation alternative (SAMA) reviews. Idoneous provides contract support for technical editing reviews.
Table 6–1. List of Preparers
Name Education/Experience Function or Expertise NRC-NRR Jim Danna M.S., Civil Engineering/Geology
29 years of experience in engineering and project management including 16 years at NRC, including as an NRC technical and projects branch manager
Management oversight
David Wrona B.S., Electrical Engineering; 27 years of nuclear plant experience, including as an NRC resident inspector, reactor engineer, project manager, and projects and technical branch manager
Management oversight
David Drucker B.S., General Engineering; M.S., Engineering Management; 34 years of project and program management experience
Project management
Jeffrey Rikhoff M.R.P., Regional Planning; M.S., Economic Development and Appropriate Technology; B.A., English; 35 years of combined industry and government experience including 28 years in NEPA compliance, environmental impact analysis, socioeconomics and environmental justice impact analysis, cultural resource impacts, and comprehensive land-use and development planning
Socioeconomics and environmental justice
Bill Rautzen B.S., Health Physics; B.S., Industrial Hygiene; M.S. Health Physics; 5 years of experience in environmental impact analysis
Human health, radiological, and waste management

List of Preparers
6-2
Name Education/Experience Function or Expertise Kevin Folk B.A., Geoenvironmental Studies;
M.S., Environmental Biology; 25 years of experience in NEPA compliance; geologic, hydrologic, and water quality impacts analysis; utility infrastructure analysis; and environmental regulatory compliance and water supply and wastewater discharge permitting
Surface water resources
Briana Grange B.S., Conservation Biology; 10 years of experience in environmental impact analysis, section 7 consultations, and essential fish habitat consultations
Terrestrial ecology, land use, and visual resources
Nancy Martinez A.M., Earth and Planetary Science; B.S., Earth and Environmental Science; 4 years of experience in environmental impact analysis
Air quality, noise, and climate change
Michelle Moser M.S., Biological Sciences; B.S., Environmental Sciences; 13 years of experience in ecological studies, environmental impact assessment, and protected resource management
Aquatic ecology and microbiological hazards
Jerry Dozier M.S. Reliability Engineering; M.B.A. Business Administration; B.S. Mechanical Engineering; 30 years of experience including operations, reliability engineering, technical reviews, and NRC branch management
SAMA
Russell Chazell B.S., Liberal Studies; J.D, Law; M.S., Nuclear Engineering; Certificate in Project Management; Certificate in NEPA; 26 years of combined industry and government experience including analytical and environmental laboratory science, laboratory project management, technical business development, engineering project management, and NEPA compliance
Historic and cultural resources Non-radioactive waste management Non-radioactive human health
William Ford M.S., Geology; 41 years of combined industry and government experience working on groundwater, surface water, and geology projects and associated technical and environmental analyses
Geologic environment and groundwater resources
Robert Hoffman B.S., Environmental Resource Management; 29 years of experience in NEPA compliance, environmental impact assessment, alternatives identification and development, and energy facility siting
Alternatives and cumulative effects

List of Preparers
6-3
Name Education/Experience Function or Expertise Dennis Logan Ph.D., Marine Studies and Biological
Oceanography; M.S., Biological Sciences, Marine Biology; B.S., Zoology; 40 years of experience in ecological studies, ecological risk assessment, environmental impact assessment, protected resource management, and project management
Threatened and endangered species
Don Palmrose B.S., Nuclear Engineering; M.S., Nuclear Engineering; Ph.D., Nuclear Engineering; 30 years of relevant experience
High burnup fuel transportation impacts
National Laboratory Personnel Steve Maheras, PNNL(a)
B.A. Zoology; M.S. Health Physics Ph.D. Health Physics 27 years of experience in health physics and transportation risk assessment
High burnup fuel transportation impacts
Commercial Contractors R. Benke, CNWRA (b)
Ph.D., Nuclear Engineering, M. Eng., Radiological Health B.S., Nuclear Engineering, 20 years of experience in nuclear engineering, radiological health, risk analysis, and is a certified health physicist
SAMA
D. Speaker, CNWRA
B.S., Nuclear Engineering M.S., Nuclear Engineering 10 years of experience in nuclear engineering, radiation detection, instrumentation, nondestructive evaluation, and nuclear reactor design and analysis
SAMA
E.R. Schmidt, Contractor
B.S., Mechanical Engineering; M.S., Nuclear Engineering 50 years of nuclear industry experience including 35 year experience in performing, managing and reviewing Probabilistic Risk Assessments
SAMA
Susan Anastasi, Idoneous
Technical Editing
(a) Pacific Northwest National Laboratory (PNNL) is operated by Battelle for the U.S. Department of Energy. (b) CNWRA is a federally funded research and development center sponsored by the NRC.


7-1
7.0 LIST OF AGENCIES, ORGANIZATIONS, AND PERSONS TO WHOM COPIES OF THIS SEIS ARE SENT
Name Affiliation J. Barrett Tribal Nation—Citizen Potawatomi Nation H. Frank Tribal Nation—Forest County Potawatomi K. Meshigaud Tribal Nation—Hannahville Indian Community, Band of Potawatomi J. Greendeer Tribal Nation—Ho-Chunk Nation S. Cadue Tribal Nation—Kickapoo Tribe in Kansas G. Salazar Tribal Nation—Kickapoo Tribe of Oklahoma D. Lankford Tribal Nation—Miami Tribe of Oklahoma J. Froman Tribal Nation—Peoria Tribe of Indians in Oklahoma J. Warren Tribal Nation—Pokagon Band of Potawatomi S. Ortiz Tribal Nation—Prairie Band of Potawatomi Nation J. Bender Tribal Nation—Sac and Fox Tribe of the Mississippi in lowa/Meskwaki B. Robidoux Tribal Nation—Sac and Fox Nation of Missouri in Kansas and Nebraska G. Thurman Tribal Nation—Sac and Fox Nation J. Blackhawk Tribal Nation—Winnebago Tribe of Nebraska R. Nelson Advisory Council on Historic Preservation J. Duyvejonck U.S. Fish & Wildlife Service R. Leibowitz Illinois Historic Preservation Agency Alan Keller Illinois Environmental Protection Agency Nathan Grider Illinois Department of Natural Resources Patty Smith Mayor, City of Marseilles, Illinois Bob Eschbach Mayor, City of Ottawa, Illinois David Spicer Mayor, Village of Seneca, Illinois Kay Hines Mayor, City of Grand Ridge, Illinois EIS Scoping Meeting Participants Reed Wilson Office of U.S. Representative Kinzinger Elizabeth Poole U.S. EPA Region 5 Jerry Hicks LaSalle County Board Chairman Rick Zuffa Illinois Emergency Management Agency Cecil Settles Illinois Emergency Management Agency Doug O’Brien Illinois Clean Energy Coalition Jim Carlson Superintendent, Seneca Township High School Roger Blumquist Argonne National Laboratory Beth Jung Nuclear Power Illinois Linda Lewison Nuclear Energy Information Service
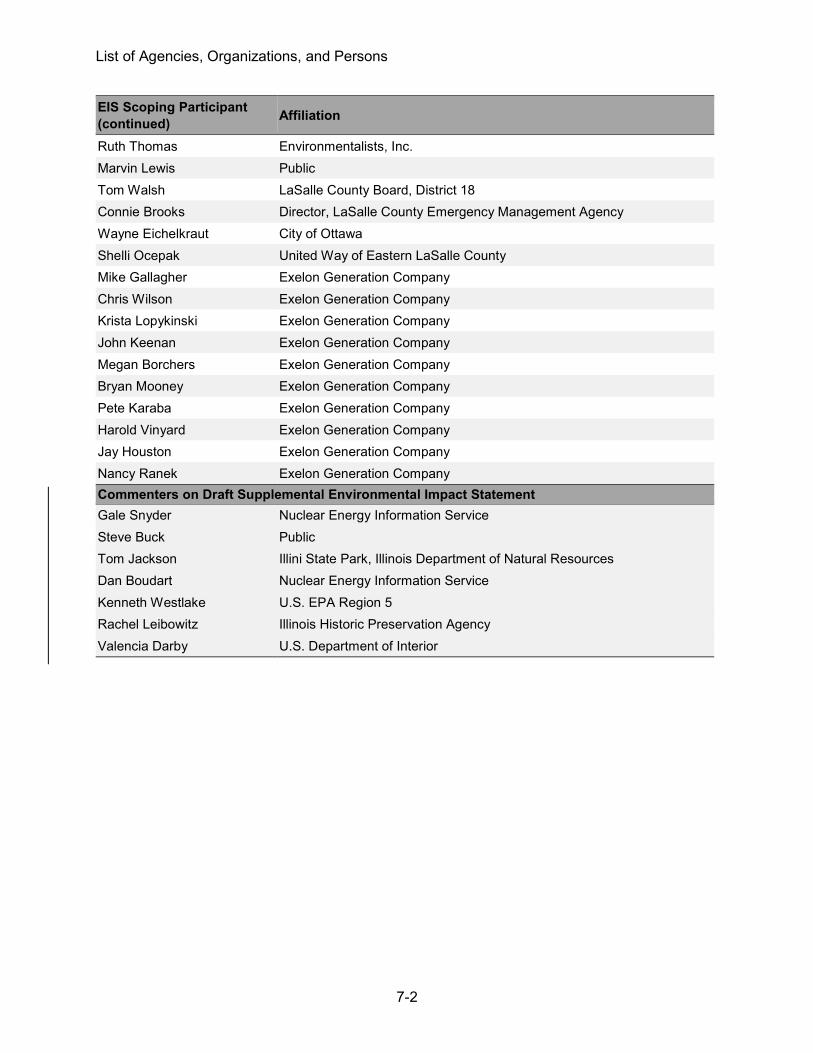
List of Agencies, Organizations, and Persons
7-2
EIS Scoping Participant
(continued) Affiliation
Ruth Thomas Environmentalists, Inc. Marvin Lewis Public Tom Walsh LaSalle County Board, District 18 Connie Brooks Director, LaSalle County Emergency Management Agency Wayne Eichelkraut City of Ottawa Shelli Ocepak United Way of Eastern LaSalle County Mike Gallagher Exelon Generation Company Chris Wilson Exelon Generation Company Krista Lopykinski Exelon Generation Company John Keenan Exelon Generation Company Megan Borchers Exelon Generation Company Bryan Mooney Exelon Generation Company Pete Karaba Exelon Generation Company Harold Vinyard Exelon Generation Company Jay Houston Exelon Generation Company Nancy Ranek Exelon Generation Company Commenters on Draft Supplemental Environmental Impact Statement Gale Snyder Nuclear Energy Information Service Steve Buck Public Tom Jackson Illini State Park, Illinois Department of Natural Resources Dan Boudart Nuclear Energy Information Service Kenneth Westlake U.S. EPA Region 5 Rachel Leibowitz Illinois Historic Preservation Agency Valencia Darby U.S. Department of Interior
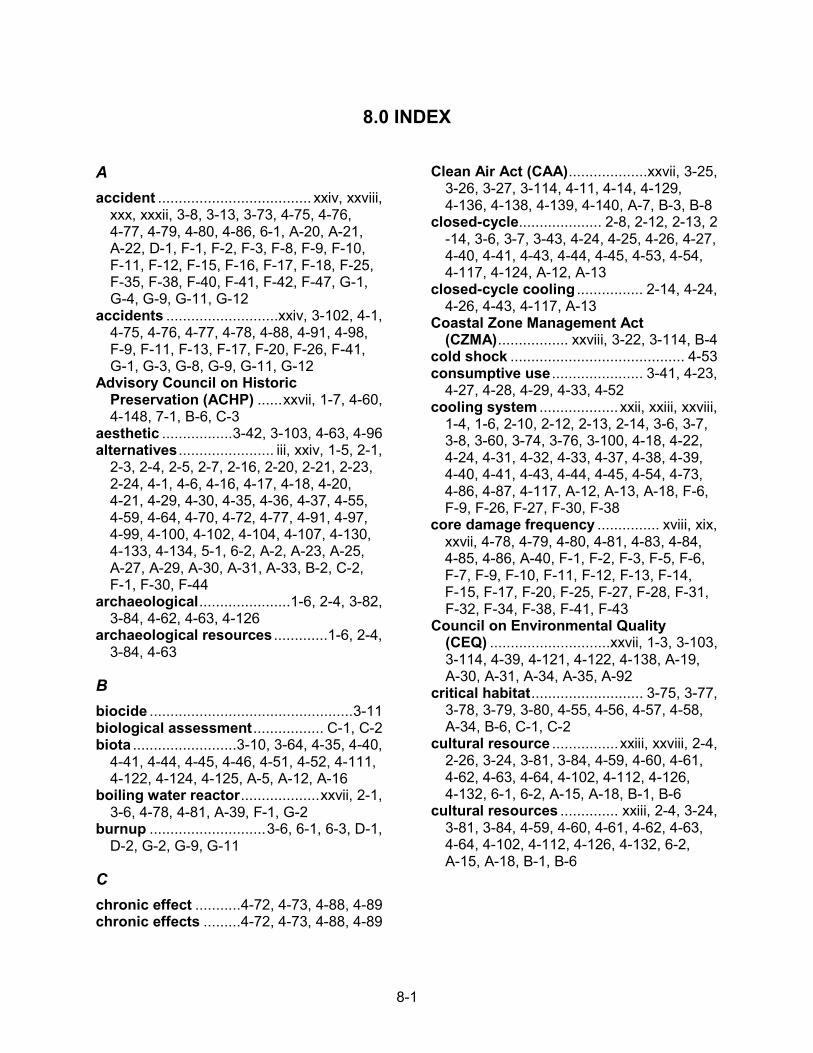
8-1
8.0 INDEX
A accident ..................................... xxiv, xxviii,
xxx, xxxii, 3-8, 3-13, 3-73, 4-75, 4-76, 4-77, 4-79, 4-80, 4-86, 6-1, A-20, A-21, A-22, D-1, F-1, F-2, F-3, F-8, F-9, F-10, F-11, F-12, F-15, F-16, F-17, F-18, F-25, F-35, F-38, F-40, F-41, F-42, F-47, G-1, G-4, G-9, G-11, G-12
accidents ........................... xxiv, 3-102, 4-1, 4-75, 4-76, 4-77, 4-78, 4-88, 4-91, 4-98, F-9, F-11, F-13, F-17, F-20, F-26, F-41, G-1, G-3, G-8, G-9, G-11, G-12
Advisory Council on Historic Preservation (ACHP) ...... xxvii, 1-7, 4-60, 4-148, 7-1, B-6, C-3
aesthetic ................. 3-42, 3-103, 4-63, 4-96 alternatives ....................... iii, xxiv, 1-5, 2-1,
2-3, 2-4, 2-5, 2-7, 2-16, 2-20, 2-21, 2-23, 2-24, 4-1, 4-6, 4-16, 4-17, 4-18, 4-20, 4-21, 4-29, 4-30, 4-35, 4-36, 4-37, 4-55, 4-59, 4-64, 4-70, 4-72, 4-77, 4-91, 4-97, 4-99, 4-100, 4-102, 4-104, 4-107, 4-130, 4-133, 4-134, 5-1, 6-2, A-2, A-23, A-25, A-27, A-29, A-30, A-31, A-33, B-2, C-2, F-1, F-30, F-44
archaeological ......................1-6, 2-4, 3-82, 3-84, 4-62, 4-63, 4-126
archaeological resources .............1-6, 2-4, 3-84, 4-63
B biocide ................................................. 3-11 biological assessment ................. C-1, C-2 biota ......................... 3-10, 3-64, 4-35, 4-40,
4-41, 4-44, 4-45, 4-46, 4-51, 4-52, 4-111, 4-122, 4-124, 4-125, A-5, A-12, A-16
boiling water reactor ................... xxvii, 2-1, 3-6, 4-78, 4-81, A-39, F-1, G-2
burnup ............................ 3-6, 6-1, 6-3, D-1, D-2, G-2, G-9, G-11
C chronic effect ........... 4-72, 4-73, 4-88, 4-89 chronic effects ......... 4-72, 4-73, 4-88, 4-89
Clean Air Act (CAA) ................... xxvii, 3-25, 3-26, 3-27, 3-114, 4-11, 4-14, 4-129, 4-136, 4-138, 4-139, 4-140, A-7, B-3, B-8
closed-cycle.................... 2-8, 2-12, 2-13, 2 -14, 3-6, 3-7, 3-43, 4-24, 4-25, 4-26, 4-27, 4-40, 4-41, 4-43, 4-44, 4-45, 4-53, 4-54, 4-117, 4-124, A-12, A-13
closed-cycle cooling ................ 2-14, 4-24, 4-26, 4-43, 4-117, A-13
Coastal Zone Management Act (CZMA) ................. xxviii, 3-22, 3-114, B-4
cold shock .......................................... 4-53 consumptive use ...................... 3-41, 4-23,
4-27, 4-28, 4-29, 4-33, 4-52 cooling system ................... xxii, xxiii, xxviii,
1-4, 1-6, 2-10, 2-12, 2-13, 2-14, 3-6, 3-7, 3-8, 3-60, 3-74, 3-76, 3-100, 4-18, 4-22, 4-24, 4-31, 4-32, 4-33, 4-37, 4-38, 4-39, 4-40, 4-41, 4-43, 4-44, 4-45, 4-54, 4-73, 4-86, 4-87, 4-117, A-12, A-13, A-18, F-6, F-9, F-26, F-27, F-30, F-38
core damage frequency ............... xviii, xix, xxvii, 4-78, 4-79, 4-80, 4-81, 4-83, 4-84, 4-85, 4-86, A-40, F-1, F-2, F-3, F-5, F-6, F-7, F-9, F-10, F-11, F-12, F-13, F-14, F-15, F-17, F-20, F-25, F-27, F-28, F-31, F-32, F-34, F-38, F-41, F-43
Council on Environmental Quality (CEQ) ............................. xxvii, 1-3, 3-103, 3-114, 4-39, 4-121, 4-122, 4-138, A-19, A-30, A-31, A-34, A-35, A-92
critical habitat ........................... 3-75, 3-77, 3-78, 3-79, 3-80, 4-55, 4-56, 4-57, 4-58, A-34, B-6, C-1, C-2
cultural resource ................ xxiii, xxviii, 2-4, 2-26, 3-24, 3-81, 3-84, 4-59, 4-60, 4-61, 4-62, 4-63, 4-64, 4-102, 4-112, 4-126, 4-132, 6-1, 6-2, A-15, A-18, B-1, B-6
cultural resources .............. xxiii, 2-4, 3-24, 3-81, 3-84, 4-59, 4-60, 4-61, 4-62, 4-63, 4-64, 4-102, 4-112, 4-126, 4-132, 6-2, A-15, A-18, B-1, B-6

Index
8-2
D decommissioning ................ xxxii, 2-2, 2-3,
4-1, 4-57, 4-58, 4-59, 4-65, 4-66, 4-68, 4-69, 4-70, 4-71, 4-98, 4-100, 4-102, 4-103, 4-104, 4-105, 4-106, 4-134, A-18, A-22, E-1, E-10
design-basis accident ................ xxviii, 4-1, 4-75
discharge ........................... xxviii, 2-8, 2-10, 2-12, 2-13, 2-14, 3-7, 3-8, 3-10, 3-11, 3-12, 3-13, 3-14, 3-22, 3-36, 3-37, 3-40, 3-41, 3-43, 3-44, 3-45, 3-46, 3-49, 3-55, 3-61, 3-64, 3-65, 3-66, 3-70, 3-76, 3-99, 3-100, 4-22, 4-23, 4-24, 4-26, 4-27, 4-32, 4-37, 4-46, 4-47, 4-48, 4-49, 4-51, 4-52, 4-53, 4-72, 4-73, 4-74, 4-75, 4-85, 4-87, 4-103, 4-116, 4-118, 4-120, 4-124, 4-125, 6-1, A-5, A-17, A-19, A-25, A-26, A-32, B-3, B-4, E-4, E-8, F-30, F-35, F-42, G-7, G-9
discharges ............................3-1, 3-6, 3-10, 3-12, 3-14, 3-36, 3-37, 3-40, 3-41, 3-42, 3-44, 3-45, 3-46, 3-49, 3-76, 3-101, 3-108, 4-26, 4-27, 4-28, 4-29, 4-32, 4-45, 4-46, 4-47, 4-54, 4-73, 4-74, 4-119, 4-120, 4-124, 4-125, A-16, A-24, E-4
dose .................................. xxxii, 3-13, 3-14, 3-15, 3-16, 3-98, 3-99, 3-108, 4-80, 4-83, 4-101, 4-127, 4-148, A-40, B-2, B-5, F-3, F-19, F-20, F-21, F-22, F-31, F-32, F-40, F-41, F-43, G-1, G-3, G-4, G-5, G-7, G-8, G-9, G-10, G-11, G-12
dredge ........................................ 2-10, 4-26, 4-27, 4-28
dredging ........................... 3-46, 3-76, 4-22, 4-35, 4-37, 4-53, 4-54, A-32, B-7
E education ......................... 3-92, 3-123, 4-65 electromagnetic field ........................ xxviii,
4-72, 4-88, 4-89 electromagnetic fields ...... 4-72, 4-88, 4-89 endangered and threatened
species ..................................... 3-57, B-6 endangered species .................... 1-6, 3-76,
3-77, 3-79, 3-80, 3-122, 4-46, 4-56, 4-125, 4-143, 6-2, B-1, C-2, C-5
Endangered Species Act ............ xviii, xxiii, xxix, 1-6, 1-7, 1-8, 2-4, 2-30, 3-54, 3-58, 3-75, 3-78, 3-80, 3-109, 3-115, 4-55,
4-56, 4-57, 4-58, 4-59, 4-111, 4-112, 4-135, 4-139, 4-143, A-18, A-34, A-92, B-6, B-8, C-1, C-2, C-5
entrainment .......................xxiii, 3-43, 3-62, 3-72, 3-73, 3-74, 3-76, 3-77, 4-37, 4-38, 4-39, 4-40, 4-41, 4-42, 4-43, 4-44, 4-45, 4-53, 4-54, 4-124, 4-125, 4-145, A-12, A-13, A-14, A-16, A-17
environmental justice .............. 2-4, 3-103, 3-110, 4-91, 4-92, 4-102, 4-128, 4-136, 6-1, A-92
essential fish habitat ................. xxiii, xxviii, 4-55, 4-58, 6-2, B-6, C-3
eutrophication ................ 3-76, 4-37, 4-111 evaporative ..................... 3-41, 4-120, A-26 evaporative loss ............. 3-41, 4-120, A-26 Exelon ........................................ iii, xxi, xxii,
xxiv, xxv, 1-1, 1-2, 1-5, 1-7, 1-8, 1-9, 2-1, 2-2, 2-3, 2-4, 2-8, 2-9, 2-10, 2-21, 2-26, 2-27, 2-28, 2-30, 3-1, 3-2, 3-3, 3-4, 3-5, 3-6, 3-7, 3-8, 3-9, 3-10, 3-11, 3-12, 3-13, 3-14, 3-15, 3-16, 3-17, 3-18, 3-19, 3-20, 3-21, 3-22, 3-23, 3-24, 3-25, 3-27, 3-29, 3-30, 3-31, 3-33, 3-34, 3-35, 3-36, 3-37, 3-39, 3-40, 3-41, 3-42, 3-43, 3-44, 3-45, 3-46, 3-47, 3-48, 3-49, 3-50, 3-52, 3-55, 3-56, 3-57, 3-58, 3-59, 3-60, 3-61, 3-64, 3-65, 3-69, 3-70, 3-71, 3-72, 3-74, 3-75, 3-76, 3-78, 3-79, 3-80, 3-81, 3-83, 3-84, 3-85, 3-86, 3-94, 3-95, 3-96, 3-97, 3-98, 3-99, 3-102, 3-108, 3-115, 3-116, 3-117, 3-118, 3-119, 3-120, 3-122, 3-123, 3-124, 3-127, 3-128, 3-129, 3-130, 4-1, 4-2, 4-3, 4-7, 4-8, 4-22, 4-23, 4-24, 4-25, 4-31, 4-32, 4-33, 4-34, 4-39, 4-40, 4-41, 4-43, 4-44, 4-45, 4-47, 4-49, 4-50, 4-51, 4-52, 4-56, 4-60, 4-61, 4-65, 4-68, 4-69, 4-72, 4-73, 4-74, 4-75, 4-76, 4-77, 4-78, 4-79, 4-80, 4-81, 4-82, 4-83, 4-86, 4-87, 4-88, 4-92, 4-93, 4-98, 4-101, 4-103, 4-104, 4-105, 4-113, 4-114, 4-115, 4-116, 4-118, 4-119, 4-120, 4-124, 4-126, 4-127, 4-128, 4-129, 4-131, 4-132, 4-133, 4-137, 4-138, 4-139, 4-140, 4-141, 4-142, 4-144, 4-147, 4-148, 5-1, 5-2, 7-2, A-2, A-4, A-5, A-6, A-7, A-8, A-9, A-10, A-12, A-13, A-14, A-15, A-16, A-17, A-18, A-19, A-20, A-21, A-22, A-23, A-24, A-26, A-28, A-29, A-31, A-33, A-36, A-38, A-39, A-41, A-92, A-93, B-7, B-8, C-2, D-1, D-2, E-4, E-8, F-1, F-2, F-3, F-4, F-5, F-6, F-9, F-10, F-11,
Index
8-3
F-12, F-13, F-14, F-15, F-16, F-17, F-18, F-19, F-20, F-21, F-22, F-23, F-24, F-25, F-26, F-27, F-28, F-29, F-30, F-31, F-32, F-33, F-38, F-39, F-40, F-41, F-42, F-43, F-44, F-45, F-46, F-47, G-2, G-4, G-5, G-9, G-11, G-13
Exelon Generation Company .......... iii, xxi, 1-1, 1-8, 2-2, 2-30, 3-1, 3-115, 3-116, 3-117, 3-118, 3-119, 3-120, 3-123, 3-124, 3-127, 3-128, 4-137, 4-138, 4-139, 4-140, 4-141, 4-142, 4-144, 4-147, 4-148, 5-1, 7-2, A-2, A-4, A-92, A-93, B-8, D-1, E-8, F-1, F-45, F-46, F-47, G-2, G-13
F Fish and Wildlife Coordination Act
(FWCA) .............................................. B-8
G Generic Environmental Impact Statement
(GEIS) ............................................ iii, xxi, xxii, xxv, xxix, 1-3, 1-4, 1-6, 1-7, 1-8, 1-9, 2-1, 2-2, 2-3, 2-4, 2-17, 2-19, 2-32, 3-6, 3-36, 3-88, 3-101, 3-127, 4-1, 4-2, 4-6, 4-7, 4-11, 4-20, 4-22, 4-24, 4-31, 4-32, 4-33, 4-35, 4-36, 4-37, 4-38, 4-45, 4-52, 4-53, 4-54, 4-55, 4-60, 4-65, 4-72, 4-73, 4-75, 4-76, 4-77, 4-91, 4-97, 4-98, 4-99, 4-100, 4-101, 4-102, 4-103, 4-105, 4-106, 4-146, 4-147, 5-2, A-12, A-13, A-14, A-16, A-17, A-22, A-28, A-29, A-30, A-33, A-34, A-39, A-93, A-94, G-2, G-14
greenhouse ................................. xxiii, xxix, 2-7, 2-13, 3-27, 4-8, 4-136, A-25, A-29
greenhouse gases ..................... xxix, 2-13, 3-27, 4-8, 4-136
groundwater ............................... xxiii, 3-13, 3-18, 3-42, 3-43, 3-44, 3-47, 3-49, 3-52, 3-93, 3-100, 4-21, 4-23, 4-24, 4-25, 4-26, 4-27, 4-28, 4-29, 4-30, 4-92, 4-93, 4-102, 4-110, 4-117, 4-118, 4-119, 4-121, 4-125, 4-132, 6-2, B-1, E-4
H hazardous waste ..................... 3-18, 4-133,
4-134, A-5, B-5, B-7, B-8 heat shock ................................. 4-47, 4-48,
4-49, 4-51, 4-124
high heat shock burnup fuel .............. 6-1, D-1, D-2
high-level waste ........................... xxii, 1-4, 4-97, 4-98, 4-101, A-38, G-2
I Illinois Department of Natural Resources
(IDNR) ............................... xxx, 3-1, 3-21, 3-22, 3-23, 3-40, 3-44, 3-53, 3-54, 3-57, 3-58, 3-59, 3-60, 3-61, 3-69, 3-70, 3-71, 3-72, 3-73, 3-74, 3-80, 3-115, 3-122, 3-123, 3-124, 3-128, 4-49, 4-50, 4-51, 4-52, 4-74, 4-122, 4-123, 4-125, 4-144, 7-1, 7-2, A-2, A-14, A-15, A-18, A-19, A-20, B-7, E-5, E-6, E-8, E-9
impingement ............................. 3-43, 3-72, 3-73, 3-74, 3-76, 3-77, 4-38, 4-39, 4-40, 4-41, 4-42, 4-43, 4-44, 4-45, 4-53, 4-54, 4-124, 4-125, A-11, A-12, A-13, A-14, A-16, A-17
independent spent fuel storage installation (ISFSI) .................... xxx, 3-1, 3-17, 3-19, 4-127
Indian tribe ........................................ 3-103 Indian tribes ...................................... 3-103 Indiana bat ................................ 3-54, 3-57,
3-77, 3-80, 3-132, 4-57 invasive species ..................... 4-40, 4-111,
A-12, A-32, A-33
L LaSalle County Station (LSCS) .............. iii,
xvii, xviii, xix, xxi, xxii, xxiii, xxiv, xxv, xxx, 1-1, 1-2, 1-5, 1-6, 1-7, 1-8, 1-9, 2-1, 2-2, 2-3, 2-4, 2-5, 2-8, 2-9, 2-10, 2-11, 2-12, 2-13, 2-14, 2-16, 2-17, 2-18, 2-19, 2-20, 2-21, 2-22, 2-23, 2-24, 2-25, 2-26, 2-30, 3-1, 3-2, 3-3, 3-4, 3-5, 3-6, 3-7, 3-8, 3-9, 3-10, 3-11, 3-12, 3-13, 3-14, 3-15, 3-16, 3-17, 3-18, 3-19, 3-20, 3-21, 3-22, 3-23, 3-24, 3-25, 3-26, 3-27, 3-28, 3-29, 3-30, 3-31, 3-32, 3-33, 3-34, 3-35, 3-36, 3-37, 3-39, 3-40, 3-41, 3-42, 3-43, 3-44, 3-45, 3-46, 3-47, 3-48, 3-50, 3-51, 3-52, 3-53, 3-54, 3-55, 3-56, 3-57, 3-58, 3-59, 3-60, 3-61, 3-62, 3-63, 3-64, 3-65, 3-66, 3-67, 3-68, 3-69, 3-70, 3-71, 3-72, 3-73, 3-74, 3-75, 3-76, 3-77, 3-78, 3-79, 3-80, 3-81, 3-82, 3-83, 3-84, 3-85, 3-86, 3-87, 3-88, 3-89, 3-90, 3-91, 3-92, 3-93, 3-95, 3-96,
Index
8-4
3-97, 3-98, 3-99, 3-100, 3-102, 3-103, 3-104, 3-105, 3-106, 3-107, 3-108, 3-112, 3-114, 3-115, 3-116, 3-117, 3-118, 3-119, 3-120, 3-124, 3-127, 3-128, 3-129, 4-1, 4-2, 4-3, 4-4, 4-6, 4-7, 4-8, 4-9, 4-10, 4-11, 4-12, 4-13, 4-16, 4-17, 4-19, 4-20, 4-21, 4-23, 4-24, 4-25, 4-26, 4-27, 4-28, 4-29, 4-30, 4-31, 4-32, 4-33, 4-34, 4-35, 4-37, 4-38, 4-39, 4-40, 4-41, 4-42, 4-43, 4-44, 4-45, 4-46, 4-47, 4-48, 4-49, 4-50, 4-51, 4-52, 4-53, 4-54, 4-55, 4-56, 4-57, 4-58, 4-59, 4-60, 4-61, 4-62, 4-63, 4-64, 4-65, 4-66, 4-68, 4-69, 4-70, 4-71, 4-72, 4-73, 4-74, 4-75, 4-76, 4-77, 4-78, 4-79, 4-80, 4-81, 4-82, 4-83, 4-84, 4-86, 4-87, 4-88, 4-89, 4-91, 4-92, 4-93, 4-94, 4-95, 4-97, 4-98, 4-100, 4-101, 4-102, 4-103, 4-104, 4-105, 4-106, 4-107, 4-108, 4-109, 4-110, 4-112, 4-113, 4-114, 4-115, 4-116, 4-117, 4-118, 4-119, 4-120, 4-121, 4-122, 4-123, 4-124, 4-125, 4-126, 4-127, 4-128, 4-129, 4-130, 4-131, 4-132, 4-133, 4-137, 4-138, 4-139, 4-140, 4-141, 4-142, 4-144, 4-145, 4-148, 5-1, 8-1, A-1, A-3, A-5, A-6, A-7, A-8, A-9, A-10, A-11, A-12, A-13, A-14, A-15, A-16, A-17, A-18, A-19, A-20, A-21, A-22, A-23, A-24, A-25, A-26, A-27, A-28, A-29, A-30, A-31, A-32, A-33, A-34, A-35, A-36, A-37, A-38, A-39, A-40, A-92, A-93, B-2, B-6, B-8, C-1, C-2, C-3, C-4, D-1, D-2, E-1, E-2, E-5, E-8, F-1, F-2, F-3, F-4, F-5, F-6, F-7, F-8, F-9, F-10, F-11, F-12, F-13, F-14, F-15, F-16, F-17, F-18, F-19, F-20, F-21, F-22, F-23, F-24, F-25, F-26, F-27, F-28, F-29, F-30, F-31, F-32, F-34, F-38, F-39, F-41, F-42, F-43, F-44, F-45, F-46, F-47, G-1, G-2, G-3, G-4, G-6, G-7, G-8, G-9, G-10, G-11, G-12, G-13
long-term dose ................................... F-41 low-level waste ........ xxx, 3-17, 4-98, 4-101
M Magnuson–Stevens Fishery
Conservation and Management Act (MSA) ................................. xxxi, 1-6, 1-7, 1-8, 3-75, 3-125, 4-58, 4-146, B-6, B-9, C-3, C-5
Marine Mammal Protection Act (MMPA) .................. xxxi, 3-75, 3-125, B-9
mitigation ............................. xxii, xxiv, xxxii, 1-3, 1-4, 1-5, 4-16, 4-17, 4-52, 4-53, 4-55, 4-62, 4-63, 4-64, 4-77, 4-86, 4-87, 4-133, 4-148, 5-1, 6-1, A-21, A-22, A-23, D-1, F-1, F-9, F-38, F-42
mixed waste ............................... 3-13, 3-17 Myotis sodalis .......................... 3-54, 3-57,
3-77, 3-80, 3-121, 3-129, 4-57
N National Environmental Policy Act
(NEPA) ...............................xviii, xxii, xxxi, 1-1, 1-8, 2-1, 2-31, 3-74, 3-103, 3-114, 3-126, 4-39, 4-56, 4-61, 4-64, 4-65, 4-91, 4-109, 4-122, 4-124, 4-138, 4-139, 4-146, 5-1, 6-1, 6-2, A-15, A-16, A-17, A-19, A-27, A-29, A-30, A-31, A-32, A-33, A-35, A-93, B-2, C-1, C-3, C-5, G-12, G-14
National Marine Fisheries Service (NMFS) ........................... xxxi, 3-75, 4-55, 4-56, 4-57, 4-58, 4-143, B-6, C-1, C-2, C-3, C-5
National Pollutant Discharge Elimination System (NPDES) ...................... xvii, xxxi, 3-10, 3-11, 3-12, 3-18, 3-40, 3-42, 3-43, 3-44, 3-45, 3-46, 3-99, 3-108, 3-110, 3-111, 3-124, 4-23, 4-26, 4-27, 4-28, 4-29, 4-30, 4-32, 4-44, 4-46, 4-47, 4-51, 4-52, 4-53, 4-73, 4-74, 4-119, 4-120, 4-135, 4-137, 4-144, A-9, A-24, B-1, B-4, B-7, B-8, E-4, E-7
Native American ..................... 3-83, 3-125, 4-91, 4-92
no-action .................................. iii, xxiv, 2-1, 2-3, 2-4, 2-23, 2-24, 2-26, 4-2, 4-34, 4-39, 4-53, 4-57, 4-62, 4-93, 4-98, 4-105, 4-122, 4-134, 5-1
no-action alternative ...................... iii, xxiv, 2-1, 2-3, 2-4, 2-23, 2-24, 2-26, 4-2, 4-34, 4-39, 4-53, 4-57, 4-62, 4-93, 4-98, 4-105, 4-122, 4-134, 5-1
nonattainment .................. 3-26, 3-27, 4-19
O once-through ............................ 4-31, 4-37,
4-38, 4-43, 4-45, 4-117, A-16, A-18 once-through cooling .............. 4-31, 4-37,
4-38, 4-43, 4-45, 4-117, A-16, A-18

Index
8-5
P postulated accidents .................. 4-1, 4-75,
4-76, 4-77, 4-91, G-1 pressurized water reactor................... xxxii
R radioactive nuclide.............................. 3-14 radon ................................... 3-13, 3-18, G-8 reactor ................................. xxi, xxvii, xxxii,
2-1, 2-2, 2-3, 2-9, 2-10, 2-28, 3-1, 3-6, 3-10, 3-12, 3-15, 3-17, 3-19, 3-21, 3-24, 3-25, 3-29, 3-35, 3-44, 3-52, 3-81, 3-99, 3-108, 4-53, 4-60, 4-62, 4-64, 4-65, 4-76, 4-77, 4-78, 4-80, 4-81, 4-83, 4-86, 4-88, 4-93, 4-97, 4-102, 4-109, 4-127, 4-128, 4-133, 4-136, 6-1, 6-3, A-9, A-22, A-23, A-25, A-26, A-34, A-39, A-92, E-1, E-10, F-1, F-3, F-9, F-10, F-12, F-16, F-18, F-20, F-26, F-27, F-32, F-38, F-41, G-1, G-2, G-3, G-4, G-7, G-11, G-12
refurbishment .............................. 2-2, 3-81, 4-6, 4-27, 4-32, 4-61, 4-64, 4-114, 4-116, A-9, A-34
replacement power ..................... xxiii, xxiv, xxxiv, 2-3, 2-5, 2-7, 2-16, 4-29, 4-70, 4-80, 4-93, 4-94, 4-95, 4-100, 4-102, 4-104, 4-130, 4-131, 4-133, A-27, A-37, F-3, F-22, F-40, F-41
right-of-way .......................... xxxii, 3-1, 3-7, 3-21, 3-74, 3-80, 4-2, 4-31, 4-37
runoff .................................. 3-7, 3-31, 3-37, 3-40, 3-43, 3-45, 3-61, 4-26, 4-27, 4-28, 4-29, 4-30, 4-32, 4-34, 4-108, 4-110, 4-118, 4-119, 4-120, 4-125, A-26, B-4
S scoping ............................... iii, xxi, xxii, xxv,
1-1, 1-2, 1-6, 1-8, 4-1, 4-7, 4-20, 4-22, 4-24, 4-31, 4-38, 4-61, 4-65, 4-72, 4-76, 4-77, 4-98, 4-101, 4-103, 4-113, 5-2, A-1, A-16, A-39, A-92, C-2, C-3, C-4, D-1
seismic...................................... xxxiii, 3-29, 3-35, F-4, F-9, F-11, F-12, F-15, F-25, F-27, F-29
severe accident ................... xxiv, xxxii, 4-1, 4-75, 4-77, 4-86, 4-91, 6-1, A-2, D-1, F-1, F-11, F-20, F-38, F-41
severe accident mitigation alternative ......................... xix, xxiv, xxxii, 4-77, 4-78, 4-80, 4-81, 4-82, 4-83, 4-84, 4-85, 4-86, 4-87, 4-88, 4-146, 6-1, 6-2, 6-3, A-2, A-39, A-40, A-41, D-1, F-1, F-2, F-4, F-5, F-6, F-10, F-11, F-13, F-14, F-15, F-16, F-17, F-18, F-19, F-20, F-21, F-22, F-23, F-24, F-25, F-26, F-27, F-28, F-29, F-30, F-31, F-32, F-34, F-35, F-36, F-37, F-38, F-39, F-40, F-42, F-43, F-44, F-46
severe accidents ......................... xxiv, 4-1, 4-75, 4-77, 4-91, F-11, F-20, F-41
solid waste ........................ xxiv, 2-22, 3-13, 3-16, 3-17, 3-99, 3-108, 4-13, 4-99, 4-102, B-1, E-4
spent fuel ........................ xxii, xxx, 1-4, 3-1, 3-6, 3-13, 3-17, 3-19, 3-20, 4-53, 4-101, 4-102, 4-127, 4-136, A-38, A-39, E-1, G-1, G-2, G-3, G-4, G-6, G-7, G-8, G-9, G-11, G-12
State Historic Preservation Office (SHPO) .......................... xxxiii, 3-84, 4-60, 4-61, 4-62, 4-148
State Pollutant Discharge Elimination System (SPDES) ............................... B-1
stormwater ....................... 3-37, 3-40, 3-44, 3-45, 3-46, 3-49, 4-26, 4-27, 4-28, 4-29, 4-30, 4-31, 4-32, 4-33, 4-53, 4-119, 4-120, 4-125, B-4
surface runoff ................................... 4-110 surface water ................... 3-10, 3-36, 3-37,
3-40, 3-41, 3-42, 3-46, 3-60, 3-100, 4-21, 4-22, 4-23, 4-26, 4-27, 4-28, 4-29, 4-30, 4-33, 4-47, 4-52, 4-73, 4-92, 4-102, 4-110, 4-116, 4-117, 4-118, 4-119, 4-120, 4-125, 4-132, 6-2, A-14, A-26, B-1, B-4
T taxes .................................. 3-95, 3-97, 4-65 threatened and endangered
species ....................... 3-76, 3-122, 4-56, 4-125, 4-143, C-2, C-5
threatened species ................... 3-57, 3-78, 4-137, B-6, C-1
transmission corridor ....................... 4-62, 4-63, 4-64
transmission line corridors ................ 4-6, 4-29, 4-34

Index
8-6
transmission lines ...................... 2-4, 2-12, 2-13, 2-14, 2-16, 3-20, 3-76, 3-81, 3-101, 3-102, 4-2, 4-5, 4-6, 4-19, 4-28, 4-29, 4-30, 4-31, 4-34, 4-36, 4-37, 4-38, 4-53, 4-60, 4-64, 4-72, 4-75
tribe ...................................................... 3-83 tritium ................................ 3-15, 3-52, 4-25
U U. S. Army Corps of Engineers
(USACE) ......................................... xxxiii, 3-20, 3-36, 3-46, 3-60, 3-130, 4-26, 4-28, 4-29, 4-53, A-32, B-4, B-7, B-8
U.S. Department of Energy (DOE) .... xxviii, 2-4, 2-8, 2-9, 2-10, 2-11, 2-14, 2-15, 2-16, 2-17, 2-18, 2-19, 2-20, 2-21, 2-22, 2-27, 2-28, 2-29, 2-30, 2-31, 2-33, 3-17, 4-10, 4-14, 4-17, 4-67, 4-68, 4-70, 4-72, 4-138, 4-139, 4-146, 6-3, G-3, G-5, G-7, G-13
U.S. Environmental Protection Agency (EPA) ................................ xxviii, 1-2, 1-8, 2-4, 2-11, 2-21, 2-22, 2-23, 2-30, 3-8, 3-10, 3-12, 3-14, 3-15, 3-16, 3-25, 3-26, 3-27, 3-28, 3-29, 3-42, 3-43, 3-44, 3-46, 3-52, 3-67, 3-69, 3-95, 3-99, 3-108, 3-110, 3-112, 3-115, 3-116, 3-132, 4-9, 4-11, 4-12, 4-14, 4-15, 4-25, 4-39, 4-43, 4-44, 4-53, 4-74, 4-89, 4-90, 4-104, 4-105, 4-107, 4-108, 4-109, 4-114, 4-115,
4-122, 4-124, 4-127, 4-129, 4-130, 4-131, 4-133, 4-136, 4-137, 4-139, 4-140, 7-1, 7-2, A-1, A-2, A-8, A-9, A-11, A-25, A-26, A-30, A-33, A-36, A-92, B-1, B-3, B-4, B-5, B-8, E-3, E-4, E-5, E-8, F-20
U.S. Fish and Wildlife Service (FWS) ................................. xxix, 1-6, 1-8, 2-8, 2-9, 2-14, 2-15, 2-33, 3-54, 3-59, 3-75, 3-76, 3-77, 3-78, 3-79, 3-80, 3-81, 3-109, 3-110, 3-121, 3-122, 3-129, 4-55, 4-56, 4-57, 4-111, 4-137, 4-143, B-6, C-1, C-2, C-5
uranium ................................ xxii, xxxv, 2-8, 3-6, 3-19, 4-1, 4-3, 4-4, 4-34, 4-35, 4-89, 4-100, 4-101, 4-102, 4-104, G-1, G-2, G-4, G-9
W wastewater ......................... 3-1, 3-18, 3-40,
3-43, 3-44, 3-46, 3-93, 4-119, 4-120, 4-123, 4-125, 6-1, A-6, A-12, A-13, A-14, E-4, E-7, E-8
Y Yucca Mountain .................... xix, G-2, G-3,
G-4, G-6, G-7, G-8, G-9, G-11, G-12, G-13
COMMENTS RECEIVED ON THE LSCS ENVIRONMENTAL REVIEW


A-1
A. Comments Received on the LSCS Environmental Review
A.1 Comments Received During the Scoping Period
The scoping process for the environmental review of the license renewal application for LaSalle County Station, Units 1 and 2 (LSCS), began on February 3, 2015, with the publication of the U.S. Nuclear Regulatory Commission’s (NRC’s) Notice of Intent to conduct scoping in Volume 80 of the Federal Register, page 5793 (80 FR 5793). The scoping process included two public meetings held in Ottawa, Illinois, on March 10, 2015. Approximately 30 people attended the meetings. After the NRC presented its prepared statements on the license renewal process, the meetings were open for public comments. Attendees provided oral statements that were recorded and transcribed by a certified court reporter. A summary and transcripts of the scoping meetings are available through the NRC’s Agencywide Documents Access and Management System (ADAMS). The ADAMS Public Electronic Reading Room is accessible at http://www.nrc.gov/reading-rm/adams.html. The scoping meetings summary is available at ADAMS No. ML15091A329. Transcripts for the afternoon and evening meetings are available at ADAMS Nos. ML15083A538 and ML15089A580, respectively. In addition to receiving comments during the public meetings, the NRC received one comment electronically. A total of 15 commenters provided comments during the scoping period. Comments from 12 of the 15 commenters were in support of license renewal for LSCS or in support of nuclear power in general. These comments are not within the scope of this license renewal review; therefore, the NRC staff did not respond to them. These commenters, along with the affiliation and the source of their comments (i.e., afternoon or evening scoping meeting transcript), are listed in the LSCS Scoping Summary Report (ADAMS No. ML15147A380). Comments received from the other 3 of the 15 commenters (Linda Lewison, Marvin Lewis, and Nelson Dewey) do not fall within, or are specifically excluded from, the purview of the NRC’s environmental review related to license renewal. These comments addressed the disposition of spent nuclear fuel and safety concerns associated with fuel enrichment and hydraulic fracturing. These comments and the NRC staff’s responses to them are available in the LSCS Scoping Summary Report (ADAMS No. ML15147A380).
A.2 Comments Received on the Draft Supplemental Environmental Impact Statement
The NRC issued a site-specific draft supplemental environmental impact statement (SEIS) for public comment in February 2015 (ADAMS No. ML16033A103). A 45-day comment period began on the date the U.S. Environmental Protection Agency (EPA) published a Notice of Availability of the filing of the draft SEIS, which allowed members of the public and agencies time to comment on the environmental review. On March 22, 2015, the NRC conducted a public meeting in Ottawa, Illinois, to describe the results of the environmental review, respond to questions, and accept public comments. Table A–1 lists the commenters and their affiliation and includes the comment source, which shows how the comment was received (i.e., through a public meeting, by letter, or through Regulations.gov). The table also lists the ADAMS No. for the comment received. This number can be used to locate the document in the agency’s electronic document retrieval system (ADAMS). However, all of the public comments received are reproduced at the end of this appendix. Table A–1 also lists the identifying (ID) numbers that were assigned to the comments.

Appendix A
A-2
Table A–1. Commenters on the Draft Supplemental Environmental Impact Statement
Commenter Affiliation ID Comment Source ADAMS No.
Gale Snyder Nuclear Energy Information Service
M-001 to M-002
Meeting Transcript
ML16091A441
Doug O’Brien Illinois Clean Energy Coalition
M-003 Meeting Transcript
ML16091A441
Steve Bach Resident of Ottawa, Illinois M-004 Meeting Transcript
ML16091A441
Tom Jackson Illini State Park, IDNR M-005 Meeting Transcript
ML16091A441
Dan Boudart Nuclear Energy Information Service
M-006 Meeting Transcript
ML16091A441
Kenneth Westlake U.S. Environmental Protection Agency
E-001 to E-002
Letter
ML16098A330
Anonymous Nuclear Energy Information Service
N-001 to N-002
Letter
ML16091A112
Michael Gallager Exelon Generation Company, LLC
L-001 to L-099
Letter
ML16095A269
Nancy Ranek Exelon Generation Company, LLC
L-100 to L-173
Letter
ML16099A107
Rachel Leibowitz Illinois Historic Preservation Agency
H-001 Letter
ML16082A274
Valincia Darby U.S. Department of Interior I-001 Regulations.gov ML16098A329
In response to the comments, the NRC staff revised the text of the report as appropriate and documented its response to these comments in this appendix. However, the NRC staff did not provide a response for all comments, including those that did not require the staff to reevaluate the report (i.e., Comments M-004, M-005, H-001, and I-001). In addition, the NRC staff did not provide responses for Comments L-100 to L-173. Because these comments involved mostly small editorial and punctuation changes, the NRC staff revised the text as appropriate but did not prepare written responses. Section A.3 contains the comments and the NRC staff’s responses to them. They have been grouped by resource area or by evaluations in the report, such as alternatives, waste management, climate change, and severe accident mitigation alternatives (SAMAs). Section A.4 contains copies of the original comments along with the identifying number assigned to each comment. Section A.5 contains the list of references for this appendix.

Appendix A
A-3
A.3 Comments and Responses Regarding the Draft SEIS
A.3.1 Alternatives
Comment L-028: In Section 2.2.2 on page 2–6, correct the sentence in lines 15 to 17 as follows: “The [Illinois] law also includes an energy efficiency standard that requires utilities to implement cost-effective energy efficiency measures to meet energy savings of 12 percent by calendar year 2016 and thereafter (ILGA 2011).” SB 1652, Section 5/8–103 (ILGA 2011, page 46) sets the energy savings goal for Illinois utilities at 2 percent of energy delivered in the year commencing June 1, 2015 and thereafter. Response: The commenter requests that the statement regarding state energy efficiency requirements be corrected. The NRC staff agrees with the comment and revised the text as suggested.
Comment L-029: In Section 2.2.2.1 on page 2–9, correct the sentence in lines 6 to 8 as follows: “Twelve nuclear power plants operate in the ROI; eightten applicants have received renewed licenses, and threetwo additional applicants have applied for renewed licenses from the NRC (including LSCS) (NRC 2015 http://www.nrc.gov/reactors/operating/licensing/renewal/applications.html).
The corrections reflect renewals of the Byron and Braidwood Stations’ operating licenses in November 2015 and January 2016, respectively (see http://www.nrc.gov/reactors/operating/licensing/renewal/applications.html) Response: The commenter requests that the statement regarding the status of nuclear plants within the region of influence (ROI) be updated to include recent licensing actions concerning Byron and Braidwood. The NRC staff has updated the text to reflect the renewed license recently issued to Braidwood; however, Byron had already been included in the earlier values presented. Of the 12 nuclear power plants in the ROI, 9 have received renewed licenses (Braidwood, Byron, Dresden, Quad Cities, Duane Arnold, Callaway, Donald Cook, Palisades, and Point Beach). Two (Fermi and LaSalle) have applied for renewed licenses from the NRC, and one (Clinton) has yet to submit a license renewal application. Therefore, the NRC staff revised the text as appropriate.
Comment L-030: In Section 2.2.2.4 on page 2–16, the sentence in lines 17 to 18 reads as follows: “For the solar portion of this combination alternative, approximately 7,397 ac (2,993 ha) would be required to support an installed net capacity of 227 MWe.” In the Combination Alternative column of Table 2–1 on p. 2–8, the Land Requirements row reads, in part, as follows for the 227 MWe installed solar PV facility portion: “[S]olar PV facilities would require 6,749 ac (2,731 ha) (Ong et al. 2013).” The inconsistency between Table 2–1 and the sentence in lines 17 to 18 on p. 2–16 with respect to land requirements should be corrected or explained. Response: The commenter has identified an inconsistency in the report regarding the land required for the solar portion of the combination alternative. The NRC staff has corrected Table 2–1 and related discussions in Sections 4.2.6 and 4.6.6 to conform them with the value of 7,397 acres (ac) (2,993 hectares (ha)) presented in Section 2.2.2.4.
Comment L-031: In Section 2.4 on page 2–24, the sentence in lines 1 to 2 reads as follows: “The environmental impacts of the proposed action … would be SMALL for all impact categories.” However, in the “Proposed Action” column of Table 2–2 on p. 2–25, the “Aquatic Resources” row contains the words “SMALL to MODERATE.” The inconsistency between Table 2–2 and the sentence in lines 1 to 2 on page 2–24 with respect to impact level

Appendix A
A-4
characterization should be corrected based on the resolution of Exelon Generation’s comments regarding section 4.7.1.2 in the DSEIS, which are presented in comments L-001 through L-009. Response: The commenter has identified an inconsistency regarding Table 2–2 and the associated text in Section 2.4. The NRC staff has revised the text to conform with the impact determinations in Table 2–2.
Comment L-032: In Section 2.4 on page 2–26, the “Key” for Table 2–2 on p. 2–26 should be corrected as follows: Key: IGCC = coal-integrated gasification combined-cycle (alternative), NGCC = natural gas combined-cycle (alternative), NRHP = National Register of Historic Places, APE = area of potential effect, CRMP = Cultural ResponseResources Management Plan, and IHPA = Illinois Historic Preservation Agency. Response: The commenter identified that the acronym CRMP is defined incorrectly in the key to Table 2–2. The NRC staff has revised the text as appropriate.
A.3.2 Description of Nuclear Power Plant and Facility
Comment L-033: In Section 3.1.1 on page 3–1, correct the text in line 16 as follows:
“ … Braidwood Generating Station in Braceville, Illinois. Interstate Highway 80 is 8 mi (13 km) north…” Response: The NRC staff agrees with the comment and corrected the text as suggested.
Comment L-034: In Section 3.1.1 on page 3–1, correct the sentence in lines 22 to 24 as follows: “The Chicago, Rock Island and PacificCSX Railroad, which runs parallel to, and slightly north of, the Illinois River, is the closest railroad line in this area.” Exelon Generation provided this updated railroad ownership information in response to RAI LU-03 (ML15185A375). Also, DSEIS Section 3.1.6, p. 3–20, reflects the updated railroad information. Response: The NRC staff agrees with the comment and revised the text as suggested.
Comment L-035: In Section 3.1.3 on page 3–7 in line 20, correct the text as follows:
“ … thea natural levee of the Illinois Rivercreated by existing topography forms the fourth side.” Response: The commenter requests that a statement regarding the cooling pond be modified. The NRC staff agrees with the comment and revised the text as suggested.
Comment L-36: In Section 3.1.3 on page 3–11 in line 1, correct the text as follows: “ … water supplied to the facility from the UHS portion of the cooling pond to 101.25 °F (38.5 °C)within diurnal temperature limits based on the time of day, but that are no higher than 104 ºF (40 ºC) …” This correction is needed because Tech Spec 3.7.3 was revised by Letter from NRC to Exelon Generation (B. Hanson) dated 11/19/2015, ADAMS Accession No. ML15202A578. Response: The commenter requests that a statement on the technical specification-prescribed temperature limit in the ultimate heat sink (UHS) portion of the cooling pond be revised to reflect the revised temperature limits approved by the NRC in response to an Exelon Generation Company, LLC (Exelon) license amendment request. The NRC staff agrees with the comment and revised the text as suggested. In addition, a reference citation to the approved license amendment (issued by the NRC in November 2015) has been added.
Comment L-037: In Section 3.1.3 on page 3–11 in line 4, correct the text in the parenthetical on as follows: “… (3.36 million m3/d) …”

Appendix A
A-5
Response: The commenter requests that the units of measure given in parentheses for condenser circulating water flow be revised. The NRC staff agrees with the comment and revised the text as suggested.
Comment L-038: In Section 3.1.3 on page 3–11 in line 11, correct the text as follows:
“… openings. Trash rakes prevent larger debris and aquatic biota from entering the system. The …”. The deleted sentence is incorrect because bar grills, not the trash rake, prevent larger debris from entering the system. The trash rake is used to remove such debris from the bar grill. The bar grills are sometimes referred to collectively as the trash rack. Response: The commenter requests that a statement regarding the trash rakes be deleted. The NRC staff agrees with the comment and deleted the statement as suggested.
Comment L-039: In Section 3.1.3 on page 3–11 in lines 44 to 46, correct the sentence as follows: “Nevertheless, the blowdown lineradwaste discharge line is equipped with a radiation monitor that will automatically isolateclose the radwaste discharge linevalve in the event of a high-radiation signal …”. See LSCS UFSAR, subsection 11.2.2.6, p. 11.2–19. Response: The commenter requests that a statement regarding the monitored discharge of radwaste to the blowdown line be revised. The NRC staff agrees with the comment, revised the statement as suggested, and further reorganized the paragraph for clarity.
Comment L-040: In Section 3.1.3 on page 3–11 in line 46, the reference “Exelon 2014b” is cited. This appears to be an error because Section 3.14 in the Draft SEIS identifies “Exelon 2014b” as follows: “[Exelon] Exelon Generation Co. LLC. 2014b. Illinois Water Inventory Program [LaSalle County Station report submitted to the Illinois State Water Survey for calendar year 2013]. ADAMS No. ML15195A385.” The document identified as Exelon 2014b contains no information about the LSCS radwaste processing system. Response: The commenter indicates that a text reference citing information on the radwaste discharge to the blowdown line is not correct. The NRC staff agrees with the comment. As noted by the commenter, “Exelon 2014b” erroneously cited the wrong reference document and was intended to cite the LSCS updated final safety analysis report (UFSAR) in Section 3.14. The reference listings in Section 3.14 and the corresponding text reference citations in Chapter 3 have been reviewed and revised, as necessary, and “Exelon 2014b” now accurately corresponds to the reference listing for the LSCS UFSAR in Section 3.14.
Comment L-041: In Section 3.1.3 on page 3–12 in lines 2 to 3, correct the text as follows:
“…lined swale that connects with the Illinois River at RM 249.4 (RKm 401) and just upstreamdownstream of the LSCS river screen house…” Response: The commenter requests that a statement on the location of the discharge structure relative to that of the river screen house be revised. The NRC staff agrees with the comment and revised the statement as suggested.
Comment L-042: In Section 3.1.5 on page 3–18 in line 14, correct the text as follows: “… nuclear power plants generate both hazardous and nonhazardous wastes that are not contaminated with either radionuclides or hazardous chemicals.” This correction is needed because contamination with hazardous chemicals is not the only criteria for a nonradioactive waste to be classified as hazardous waste and because this section addresses nonradioactive wastes that are both hazardous and nonhazardous. Response: The NRC staff agrees with the comment and revised the text as suggested.

Appendix A
A-6
Comment L-043: In Section 3.1.5 on page 3–18 in lines 34 and 35, correct the text as follows because nonradioactive industrial wastewaters are not processed at the sewage treatment plant: “… Nonradioactive industrial wastewater is also processed at thea separate onsite wastewater treatment plant, and the treated effluent is also discharged into the cooling pond. Response: The NRC staff agrees with the comment and updated the text as suggested.
Comment L-044: In Section 3.1.6.1 on page 3–19 in lines 12 to 15, correct the text as follows because LSCS has five, rather than six, diesel generators to supply standby a-c power: “… LSCS has sixfive diesel generators. (three for each nuclear unit) that can each Two diesel-generators each are provided for Units 1 and 2. The other diesel-generator is arranged to serve essential auxiliaries for either Unit 1 or Unit 2 (Exelon 2014g, Section 1.2.2.6.7). Each diesel-generator is designed and installed to provide up to 4.16 kV of power, which is ample capacity to supply all power required for the safe shutdown of both units in the event of a total loss of offsite power (Exelon 2014g, Section 8.3.1.2). Response: The commenter requests that statements regarding onsite independent power sources be revised to reflect the correct number and function of the diesel generators. The NRC staff agrees with the comment and revised the statements as suggested.
Comment L-045: In Section 3.1.6.3 on page 3–19 in line 39, correct the text as follows: “… for potable water and other uses.” Response: The commenter requests the NRC staff to make a correction to a statement regarding deep well water use. The NRC staff agrees with the comment and revised the statement as suggested.
Comment L-046: In Section 3.1.6.4 on page 3–20 in line 11, correct the text as follows: “…Lock and Dam at Marseilles, Illinois, and the Dresden Island Lock and Dam south of Channahon,…” Response: The commenter requests that the NRC staff make a correction to the name of a lock and dam referenced in the SEIS. The NRC staff agrees with the comment and revised the statement as suggested.
Comment L-047: In Section 3.1.6.4 on page 3–20 in lines 12 and 13, correct the sentence as follows: “… These lock and dam sites are part of the Illinois Waterway, which flows from Chicago, Illinois, to Grafton, Illinois, slightly upstream from St. Louis, Missouri, and is composed of seven water systems: …” See DSEIS Section 3.5.1.1, page 3–35, line 43. Response: The commenter requests that the NRC clarify the termination point of the Illinois Waterway. The NRC staff agrees with the comment and revised the statements as suggested.
A.3.3 Land Use and Visual Resources
Comment L-048: In Section 3.2.1.1 on page 3–21 in line 18, correct the text as follows because the cooling pond is located on the eastern side of the LSCS site: “A cooling pond occupies the westerneastern side of the site and accounts for about half of the site area.” Response: The commenter requests that the NRC staff correct a reference to the location of the cooling pond on site. The NRC staff agrees with the comment and revised the statement as suggested.
Comment L-049: In Section 3.2.2 on page 3–24, correct the sentence in lines 3 to 4 as follows: “… The site’s grade elevation is approximately 216 m (710 ft) above MSL, which is one of the highest points within a 3-km (5-mi) radius.” This correction is needed because, in line 12 on
Appendix A
A-7
page 3–24, the DSEIS describes wind turbines located within 5 miles of LSCS and indicates them to be at slightly higher elevations (725 to 750 ft) than the LSCS site. Also, the LSCS License Renewal Environmental Report (ER) (page 3–9) and the UFSAR on which it is based (e.g., Section 2.3.2.3) indicate the plant is one of the highest points, but does not designate it as the highest point, within a 5-mile radius. The ER (page 3–9) goes on to describe the slightly higher ground west and east of LSCS as the site of several wind turbines. Response: The commenter requests that the NRC staff clarify that the site is one of several areas with high elevation that are within the vicinity of the site. The NRC staff agrees with the comment and revised the statement as suggested.
Comment L-075: In Section 4.2.6.1 on page 4–5 in the 2nd line of the 1st paragraph correct the text as follows: “… as discussed for the NGCC alternative in Section 4.3.3.14.2.5.1. Accordingly, the impacts to land use …” Response: The commenter requests that the NRC staff correct a reference to an SEIS section number. The NRC staff agrees with the comment and revised the statement as suggested.
Comment L-076: In Section 4.2.6.1 on page 4–5 in the 2nd line of the 1st paragraph correct the text as follows: “… than those described in Section 4.3.3.24.2.5.2 for the NGCC alternative and, therefore, would be …” Response: The commenter requests that the NRC staff correct a reference to an SEIS section number. The NRC staff agrees with the comment and revised the statement as suggested.
A.3.4 Meteorology, Air Quality, and Noise
Comment L-050: In Section 3.3.1 on page 3–24 in line 25, correct the sentence as follows:
“LSCS is located in LaSalle County in northeastern Illinois, approximately 7075 mi (113120 km) southwest of downtown Chicago and 35 mi (56 km) southwest of Joliet, Illinois…” This correction is needed for consistency with the estimated distance to Chicago provided on p. 3–21 in the DSEIS, and to provide an approximate point of reference within the Chicago city limits for the measurement. Response: The commenter requests that the distance between LSCS and downtown Chicago be revised. The NRC staff agrees with the comment and revised the statement as suggested.
Comment L-051: In Section 3.3.2 correct the paragraph that begins in line 22 on page 3–26 and ends in line 9 on page 3–27 as follows because a renewed LSCS FESOP Permit No. 099802AAA was issued on January 7, 2016: “Illinois air pollution control rules are issued under Title 35 of the IAC. Air emission sources at LSCS are regulated under a Federally Enforceable State Operating Permit (FESOP) (Permit No. 099802AAA, issued in December 2000January 7, 2016) (IEPA 2016).issued by the IEPA (IEPA 2000). A source is eligible for a FESOP (also known as “synthetic minor” air permit) if the potential to emit from the source triggers CAA permit program requirements but if maximum actual emissions are below, or can be restricted to remain below, major source thresholds. LSCS’s FESOP permit was issued in December 2000, and expired in December 2005. In accordance with 35 IAC Part 201 and the Illinois Environmental Protection Act of 1970 (415 Illinois Compiled Statute (ILCS) 5/39), Exelon submitted a renewal application for the FESOP permit (on July 15, 2005) to the IEPA 90 days before the expiration of the permit; therefore, the conditions of the FESOP are administratively extended. On April 7, 2015, the IEPA issued a draft FESOP permit for LSCS for public review and comment (IEPA 2015).”

Appendix A
A-8
Response: The commenter requests that Section 3.3.2 of the SEIS be updated to state that the LSCS FESOP permit was renewed and issued under the Illinois Environmental Protection Act of 1970 (IEPA) in January 2016. The NRC staff requested that Exelon provide a copy of the 2016 FESOP permit because it had previously provided a copy of the 2000 FESOP permit in response to a 2015 request for additional information (RAI). The NRC staff reviewed the air permit and agrees with the comment. Section 3.3.2 of the SEIS has been revised to identify that the FESOP permit was issued by the IEPA in January 2016.
Comment L-052: In Section 3.3.3 on page 3–27, Correct the entry in the “2013” column and “CO” row of Table 3–4 as follows: “1.91.6.” This correction is needed because the value reported in the 2013 LSCS Annual Emissions Report is 1.754656 tons of CO or approximately 1.6 metric tons (see Response to RAI MA-05 in Letter to NRC from Exelon Generation (M. Gallagher) dated 7/02/2015). Response: The commenter requests that Table 3–4 correct the carbon monoxide emissions for the year 2013. The NRC staff agrees with the comment and the 2013 carbon monoxide emission was revised to 1.6 metric tons (MT) in Table 3–4 of the SEIS.
Comment L-077: In Section 4.3.5.1 on page 4–14, in the last bulleted item, the CO2e emissions from the NGCC alternative are stated to be “9.8 million tons per year.” This value is incorrect. The CO2e emission rate of 8.2 million MT per year is correct based on the cited emissions factor. However, 8.2 million MT converts to approximately 9 million tons, not 9.8 million tons. The incorrect value appears twice –once in the bulleted list and again in the last (partial) paragraph at the bottom of page 4–14, and should be corrected in both locations. Response: The commenter requests that Section 4.3.5.1 correct the carbon dioxide equivalent (CO2e) conversion from metric ton to ton. The NRC staff agrees with the commenter and has corrected 9.8 million tons to 9.0 million tons.
Comment L-078: In Section 4.3.6 on page 4–16 in the 4th line of the 1st paragraph, the text states that the NGCC portion of the Combination Alternative would have “a total net capacity of 360 MWe.” That net capacity is consistent with the description of the combination alternative in Section 2.2.2.4 (see DSEIS page 2–14, lines 9 and 22). However, on page 4–17, in the partial paragraph before the bulleted list, the text states that the projected air emissions for the NGCC portion of the Combination Alternative were estimated “[a]ssuming a total gross capacity of 360 MWe” (emphasis added), and the values for the emission rates presented in the bulleted list on p. 4–17 were calculated using 360 MWe as the gross capacity (306 MWe net). Accordingly, the NGCC emissions in the bulleted list are inconsistent with Section 2.2.2.4, and they need to be recalculated using a total net capacity of 360 MWe. Response: The commenter requests that NGCC emissions for the Combination Alternative be recalculated to use a total net capacity of 360 megawatts electric (MWe). The NRC staff agrees with the commenter and has recalculated the emissions based on a 425-MWe gross capacity and an 85-percent capacity factor.
A.3.5 Water Resources
Comment E-001: The Draft SEIS states that the river intake pipeline has experienced “a number of breaks” resulting in flooding and erosion of areas around the breaks. We note these breaks are not safety related and were reported to both U.S. EPA and Illinois EPA, per provisions of the National Pollution Discharge Elimination System permit. The document states that several structural and procedural measures have been taken to address the issue. The Draft SEIS does not state whether the measures have successfully repaired the breaks and eliminated recurrence of this problem, including whether flooding and erosion have been

Appendix A
A-9
successfully addressed. Recommendation: The Final SEIS should clarify whether the mentioned structural and procedural improvements to reduce incidences of leaks and improve response have been successful and whether the resulting flooding and erosion has been successfully addressed. We recommend any further work on the intake system be considered refurbishment activities and be included as part of the analysis in the Final SEIS. Response: EPA requests that the final SEIS discuss whether the measures taken by Exelon, as cited in the SEIS, to prevent and respond to breaks that have occurred in LSCS’s river intake pipeline have been successful, including associated flooding and erosion. EPA also suggests that the operation and maintenance actions taken by Exelon be considered refurbishment activities and included in the final SEIS.
The NRC staff agrees with the comment in part and disagrees with it in part. The discussion of pipeline failures is presented within the context of past and present actions at licensed nuclear power plants and includes an explanation on how they have shaped the current natural and human-built environment. These existing conditions serve as the baseline for the evaluation of the potential impacts of continued operations during the license renewal term. The NRC staff agrees that additional information on the nature of the impacts experienced to date and on measures taken to repair pipeline leaks and to restore the affected environment would be appropriate and informative. Therefore, the discussion in Section 3.1.3 was expanded in this regard. However, the NRC staff offers no assessment as to whether the actions taken by Exelon have been successful in reducing the frequency of pipeline failures. As noted by EPA, the pipeline serves no safety-related function; therefore, its operation is not directly regulated by the NRC. Exelon has taken action to report, respond, and repair pipeline failures in accordance with its operation and maintenance procedures and applicable State laws and regulations, including the reporting provisions contained in the National Pollutant Discharge Elimination System (NPDES) permit issued to LSCS.
The NRC staff also disagrees that any ongoing or future work undertaken by Exelon to reduce the frequency and impacts of pipeline breaks should be considered refurbishment and discussed as such in the SEIS. The NRC’s regulations at Title 10 of the Code of Federal Regulations (10 CFR) 51.53(c)(2) prescribe the content of ERs that reactor licensees seeking license renewal must submit to the NRC. In their ERs, licensees must describe in detail the affected environment around the plant, the modifications directly affecting the environment or any plant effluents, and any planned refurbishment activities. As summarized in Section 2.1.2 of this SEIS, the NRC considers refurbishment to encompass the replacement and repair of major systems, structures, and components to ensure the safe and economic operation of nuclear plants beyond the current license term(s). In its ER, as indicated in Section 2.1.2 of this SEIS, Exelon did not identify any major refurbishment or replacement activities needed to support the continued operation of LSCS beyond the existing operating license terms. Therefore, the NRC staff considers Exelon’s actions to reduce the frequency and severity of pipeline breaks to constitute operation and maintenance, which Exelon would be expected to continue to perform during the current license terms regardless of a license renewal decision.
Comment L-053: In Section 3.5.1.1 on page 3–39 in line 17, correct the text as follows: “…sanitary effluent. These lagoons are clay and geotextile-lined impoundments and are located to the north …” This correction is needed to accurately characterize the design of the sewage treatment lagoons, as described in the LSCS License Renewal Environmental Report, in Section 2.2.8 on page 2–16. Response: The commenter requests that a statement regarding the construction of the sewage treatment lagoons be expanded for accuracy. The NRC staff agrees with the comment and revised the text as suggested.

Appendix A
A-10
Comment L-54: In Section 3.5.1.2 on page 3–39 in line 46, correct the text as follows because LSCS has a cooling pond rather than a cooling tower: “… essential cooling water systems. Cooling towerpond blowdown and other permitted effluent streams …” Response: The commenter requests that a statement regarding cooling blowdown be modified for accuracy. The NRC staff agrees with the comment and revised the text as suggested.
Comment L-055: In Section 3.5.1.2 on page 3–40 correct the “Sources” cited for Table 3–6 as follows: “Sources: Exelon 2011a, 2012a, 2013a, 2014a, 2014d2014b”. This correction is needed because the 2013 Illinois water survey report is listed in section 3.14 of the DSEIS as “Exelon 2014b”. Response: The commenter indicates that a text reference citation in Table 3–6 is not correct. The NRC staff agrees with the comment. As noted by the commenter, the citation “Exelon 2014d” referred to the wrong reference document and was intended to cite the 2013 Illinois water survey report. The citation in question has been revised to “Exelon 2014e” for accuracy with the references listed in Section 3.14, which have been reviewed and revised, as necessary, for accuracy.
Comment L-056: In Section 3.5.1.2 on page 3–41 in line 17, correct the text as follows:
“… vicinity of LSCS (Figure 3–53–11) and are listed in the Illinois Water Inventory Program. These are …” This correction is needed because Figure 3–5 does not show the locations of the two industrial facilities mentioned in the text. Response: The commenter requests that the text reference to Figure 3–5 be revised for accuracy. The NRC staff agrees with the comment and revised the figure reference as suggested.
Comment L-057: In Section 3.5.1.3 on page 3–43 in line 11, correct the text as follows because the plant’s outfalls are summarized in Table 3–7 rather than on the cited figure: “…through the plant’s outfalls to the Illinois River, as summarized in FigureTable 3–7. The location of…” Response: The commenter requests that the text reference to Figure 3–7 be revised to Table 3–7 for accuracy. The NRC staff agrees with the comment and revised the reference as suggested.
Comment L-058: In Section 3.5.1.3 on page 3–43 in lines 11 to 12, correct the text as follows: “The location of the LSCS’s primary outfall (001) to the Illinois River is shown in Figure 3–53–11. This correction is needed because Figure 3–5 does not show the location of LSCS Outfall 001. Response: The commenter requests that the text reference to Figure 3–5 be revised for accuracy. The NRC staff agrees with the comment and revised the figure reference as suggested.
Comment L-079: In Section 4.5.1.1 on page 4–23 in the 8th and 9th lines of the 1st full paragraph, correct the text as follows: “… Agrium U.S., Inc., and PCEPCS Phosphate, Marseilles Operation. These facilities are discussed in Section 3.5.1.2 and shown in Figure 3–53–11.” These corrections are needed because Figure 3–5 does not show the locations of the two industrial facilities mentioned in the text and because the name “PCE Phosphate” is incorrect. Response: The commenter indicates that the name of one of two listed industrial facilities is incorrect and that a referenced figure number is in error. The NRC staff agrees with the comments and revised the facility name and figure number as suggested.

Appendix A
A-11
Comment L-080: In Section 4.5.1.2 on page 4–25 in the 4th line of the 1st full paragraph, correct the text as follows: “… a maximum of 750 milligrams per liter (mg/L)a concentration below the applicable State of Illinois water quality standard for receiving waters as set forth in 35 IAC 302, which is less than half the total dissolved solids …” This correction is needed due to recent LSCS operational procedure changes. Response: The text has incorporated the more recent information.
A.3.6 Terrestrial Resources
Comment L-059: In Section 3.6.3 on page 3–54 in line 29, correct the text as follows because the cooling pond is located on the eastern side of the LSCS property: “A cooling pond occupies the westerneastern side of the site and accounts for about half of the site area.” Response: The commenter requests that the NRC staff correct a reference to the location of the cooling pond on site. The NRC staff agrees with the comment and revised the statement as suggested.
Comment L-081: In Section 4.5.1.2 on page 4–35 in the 14th to 15th lines of the 3rd paragraph, correct the text as follows: “… The effects of climate change on terrestrial resources are discussed in Section 4.13.3.24.15.3.2…” Response: The commenter requests that the NRC correct a reference to an SEIS section number. The NRC staff agrees with the comment and revised the statement as suggested.
Comment L-082: In Section 4.6.5 on page 4–36 in the 5th to 6th lines of the 3rd paragraph, correct the text as follows: “… The effects of climate change on terrestrial resources are discussed in Section 4.13.3.24.15.3.2…” Response: The commenter requests that the NRC correct a reference to an SEIS section number. The NRC staff agrees with the comment and revised the statement as suggested.
Comment L-083: In Section 4.6.6 on page 4–36 in the 2nd line of the 1st paragraph, correct the text as follows: “… as discussed for the NGCC alternative in Section 4.3.3.14.6.5. Accordingly, the impacts to terrestrial …” Response: The commenter requests that the NRC correct a reference to an SEIS section number. The NRC staff agrees with the comment and revised the statement as suggested.
A.3.7 Aquatic Resources
Comment L-001: At Section 4.7.1.2 page 4–38, clarify the 2nd paragraph in Section 4.1.7.2 on p. 4–38 by adding a new sentence after the sentence on the 3rd and 4th lines in the paragraph, as follows: “Impingement can kill organisms immediately or contribute to a slower death resulting from exhaustion, suffocation, injury, and other physical stresses. However, impingement survival is common and impinged organisms often include those that are previously moribund, injured, or otherwise in poor health.” Response: The commenter suggests that the NRC staff include a statement that impingement survival is common. The NRC staff did not include the suggested statement because it does not agree that impingement survival is common. Impingement survival is variable and can be less than 1 percent at some power plants (Miller 2007; EPA 2014). The rate of impingement survivability depends on the species impinged, health of the impinged organism, age of the impinged organism, exposure to heat or other pollutants, time spent impinged, and occurrence

Appendix A
A-12
of fish return systems or other technologies used to reduce impingement mortality (Miller et al. 2007; EPA 2014). As described in NUREG–1437, Generic Environmental Impact Statement for License Renewal of Nuclear Plants (GEIS) (NRC 2013a), although fish return systems or other technologies can decrease impingement mortality, some stressed and injured fish returned to the water body may take a number of days to die, and even individuals with minor damage may develop a bacterial or fungal infection that eventually leads to mortality. This comment did not result in any changes to the SEIS.
Comment L-002: At Section 4.7.1.2, page 4–40, clarify the 2nd paragraph under the heading “LOE 1: Impingement Studies” on p. 4–40 by adding a sentence in the 6th line as follows: “… (Pimephales notatus; 5 percent). All other impinged species comprised less than 5 percent of the impinged fish (EA 2015). Gizzard shad was the most commonly impinged species and…” Response: The commenter suggests that the NRC staff clarify that each species not described in the impingement summary paragraph comprised less than 5 percent of the impingement sample. The NRC staff did not include this statement because it is repetitive with the sentence located in Section 4.7.1.2, page 4-40, in the fourth paragraph under the heading entitled, “LOE 1: Impingement Studies.” This comment did not result in any changes to the SEIS.
Comment L-003: At Section 4.7.1.2, page 4–40, in the 4th paragraph under the heading “LOE 1: Impingement Studies” on p. 4–40, delete the 2nd sentence, as follows, because, as a result of the preceding comment, it will appear in the 2nd paragraph under the same heading: “Both round goby and threadfin shad are invasive species. All other impinged species comprised less than 5 percent of the impinged fish (EA 2015).” Response: The commenter suggests that the NRC staff delete a statement that each species not described in the impingement summary paragraph comprised less than 5 percent of the impingement sample. The NRC staff did not delete the statement because it describes the impacts from impingement to these species. This comment did not result in any changes to the SEIS.
Comment L-004: At Section 4.7.1.2, page 4–41, clarify the conclusion in the 2nd paragraph under the heading “LOE 1 Conclusion” on p. 4–41 by revising it as follows: “…the impacts of impingement on the aquatic community within the cooling pond are unknown because, they have not been addressed in studies as a wastewater treatment system, the LSCS closed-cycle, recirculating, cooling pond is exempt from impingement and entrainment monitoring requirements under Section 316(b) of the Clean Water Act (CWA). Accordingly, studies have not been conducted.” Comment L-005: At Section 4.7.1.2, page 4–41, clarify the conclusion in the 2nd paragraph under the heading “LOE 2 Conclusion” by revising it as follows: “…the impacts of entrainment on the aquatic community within the cooling pond are unknown because, they have not been addressed in studies as a wastewater treatment system, the LSCS closed-cycle, recirculating, cooling pond is exempt from impingement and entrainment monitoring requirements under Section 316(b) of the Clean Water Act (CWA). Accordingly, studies have not been conducted.” Comment L-007: At Section 4.7.1.2, page 4–45, clarify the 1st sentence in the last paragraph under the heading “Overall Impingement and Entrainment Conclusion” by revising it as follows: “Although fish and aquatic biota are also impinged and entrained at the cooling pond screen house when cooling pond water is drawn into LSCS’s cooling system pond intake structure, the impacts of impingement and entrainment on the aquatic community within the cooling pond are unknown because, Exelon has not conducted any impingement or entrainment studies at the cooling pond intake, nor have any consistent fish monitoring studies been implemented in the
Appendix A
A-13
cooling pond.as a wastewater treatment system, the LSCS closed-cycle, recirculating, cooling pond is exempt from impingement and entrainment monitoring requirements in Section 316(b) of the Clean Water Act (CWA).” Response: The commenter suggests that the NRC staff revise the SEIS to state that the impacts of impingement and entrainment on the aquatic community within the cooling pond are unknown because, as a wastewater treatment system, the cooling pond is exempt from impingement and entrainment monitoring requirements in the CWA. The NRC staff does not agree with this comment because it is not the requirements of the CWA that make the impingement and entrainment impacts within the cooling pond unknown, but rather, the impacts are unknown because no impingement and entrainment studies exist to evaluate such impacts, regardless of the CWA requirements. The fact that cooling pond monitoring is not required under Section 316(b) of the CWA does not preclude Exelon from conducting impingement and entrainment studies to better characterize the potential impacts to aquatic resources within the cooling pond for the purposes of developing a license renewal application. For example, in support of the South Texas Project (STP) license renewal application, the STP licensee submitted a study that examined impingement and entrainment rates from the withdrawal of water from the STP cooling pond into its cooling water system (ENSR 2008). NRC (2013b) reviewed the impingement and entrainment study as part of its evaluation of operational impacts on aquatic resources within the cooling pond at STP.
The NRC staff agrees, however, with the portion of the comment that states that the LSCS closed-cycle, recirculating, cooling pond is exempt from impingement and entrainment monitoring requirements under Section 316(b) of the Clean Water Act (CWA). For example, in Section 3.5.1.3 of the SEIS, the NRC staff states that the LSCS’s cooling pond is defined by the State of Illinois as a wastewater treatment works pursuant to 35 IAC 301.415. Under this definition, the cooling pond is not waters of the State under 35 IAC 301.440 nor is it subject to State or Federal water quality standards. In the final SEIS, the NRC staff further clarifies in Section 3.5.1.3 that the LSCS closed-cycle, recirculating, cooling pond is exempt from impingement and entrainment monitoring requirements under Section 316(b) of the Clean Water Act (CWA). Comment L-006: At Section 4.7.1.2, page 4–44, clarify the 1st full sentence in the partial paragraph at the top of page 4–44 by revising it as follows: “… The cooling pond system is similar to a closed-cycle cooling system, which is similar to cooling towers in that water in the pond continues to be recirculated through the plant for cooling, and only makeup water (water lost to evaporation or discharged as blowdown) is drawn directly from the Illinois River.” Response: The commenter suggests that the NRC staff clarify that the cooling pond system is a closed-cycle cooling system, which is similar to cooling towers. The NRC staff agrees with part of this comment because, as described in the GEIS (NRC 2013a), a cooling pond system is a type of closed-cycle cooling system. Accordingly, the NRC revised the first part of the sentence to indicate that a cooling pond is a closed-cycle system. However, the NRC staff did not include the suggested revision that a cooling-pond system is similar to cooling towers because the NRC staff determined in the GEIS (NRC 2013a) that the impacts to aquatic resources from power plants with a cooling pond system differ from power plants with cooling towers.
Comment L-008: At Section 4.7.1.2, page 4–45, clarify the last sentence in the last paragraph under the heading “Overall Impingement and Entrainment Conclusion” on p. 4–45 by revising it as follows: “… The NRC staff notes that the use at LSCS’s cooling pond intake structure of a shad net, bar grills, and traveling screens with 3/8-in. (0.95-cm) openings wouldeffectively reducereduces the impacts from impingement and entrainment in the cooling pond.”
Appendix A
A-14
Response: The commenter suggests that the NRC staff revise the SEIS to state that a variety of engineered features effectively reduces impacts from impingement and entrainment in the cooling pond. The NRC staff did not incorporate this change because Exelon did not provide any studies or data that would support this statement or that evaluate the actual levels of impingement and entrainment at the LSCS’s cooling pond intake structure. This comment did not result in any changes to the SEIS.
Comment L-009: At Section 4.7.1.3, pages 4–49 to 4–51, Exelon Generation does not agree with the Staff’s decision to consider (under LOE 5) thermal impacts on aquatic organisms in the LSCS cooling pond, and in particular with the determination that thermal impacts on gizzard shad and threadfin shad (shad) due to continued operation of LSCS would be MODERATE. Exelon disagrees with the need to consider these impacts within the LSCS cooling pond for the following reasons:
1. There is no requirement for the staff to evaluate thermal impacts on organisms in the LSCS cooling pond. The Draft Supplemental Environmental Impact Statement (DSEIS) states that, “NRC’s regulations at 10 CFR Part 51 concerning license renewal reviews and the GEIS [Generic Environmental Impact Statement for License Renewal of Nuclear Plants, Rev. 1] direct the NRC to consider all aquatic resources that may be affected by plant operations, regardless of the type of water body in which such resources reside.” DSEIS at 4–45. The DSEIS does not identify what regulation specifically provides this direction, nor has Exelon Generation identified which regulation in Part 51 supports this statement. The statements of consideration for the final rule also do not clarify this issue. See 78 Fed. Reg. 37,282, 37,304 (June 20, 2013). On the contrary, 10 CFR 51.53(c)(3)(ii)(A), which is quoted below, specifically discusses the withdrawal of makeup water from a river and the resulting aquatic impacts on stream communities, but establishes no requirements for impacts within cooling ponds:
“If the applicant’s plant utilizes cooling towers or cooling ponds and withdraws makeup water from a river, an assessment of the impact of the proposed action on water availability and competing water demands, the flow of the river, and related impacts on stream (aquatic) and riparian (terrestrial) ecological communities must be provided…” Exelon Generation recognizes that the GEIS (p. 3–52) defines surface water resources to include “man-made reservoirs or other impoundments,” but that definition does not apply to aquatic resources, which is the relevant topic here. There is also a reference in the GEIS (p. 3–139) to potential adverse human health effects from microorganisms in thermal effluents, but again, that topic is not relevant to impacts on aquatic resources. And finally, the GEIS itself is not codified in regulation—only its conclusions are, most pertinently in the text quoted above.
2. The staff should not evaluate thermal impacts on organisms in the LSCS cooling pond, because the cooling pond is a wastewater treatment system. As the DSEIS acknowledges, the LSCS cooling pond is a “wastewater treatment system,” and therefore, is not a “water of the United States” under the Clean Water Act (CWA) or a “water of the State” under Illinois law. See DSEIS at 3–42. The DSEIS also notes on page 3–68, that “The cooling pond can be characterized as a highly managed ecosystem in which fish stocking by the IDNR [Illinois Department of Natural Resources] and other human activities primarily influence the species composition and population dynamics.” Therefore, the NRC should not be evaluating impacts on the aquatic environment in the cooling pond from LSCS’s thermal additions to the cooling pond water. Section 316(a) of the CWA, as its title states, provides “Effluent limits that will assure protection and propagation of balanced, indigenous population of shellfish, fish,
Appendix A
A-15
and wildlife.” The CWA effluent limits, however, do not apply to influents into the LSCS cooling pond, which has no indigenous populations. Accordingly, there is no CWA requirement to protect organisms in the pond. To suggest otherwise through a National Environmental Policy Act (NEPA) analysis would be to suggest that an environmental standard impermissibly applies within a wastewater treatment system that is itself exempt from that standard.
3. Not evaluating thermal impacts on organisms in the LSCS cooling pond would be consistent with prior analyses for LSCS. The LSCS Final Environmental Statement at the Operating License stage (FES-O) noted that the conclusions regarding aquatic impacts in the FES at the Construction Permit stage remained valid, including the conclusion that “aquatic impacts from operation of the station will be confined to the Illinois River.” FES-O at 5–12. For the reasons stated above, Exelon Generation believes this conclusion remains valid at the license renewal stage.
4. The conclusion of “MODERATE” impacts on shad populations is oversimplified, and misleading. If the staff analyzes aquatic impacts within the LSCS cooling pond at all, the analysis of such impacts should begin from the premise that no aquatic populations (whether stocked or not) would exist in this location without the LSCS because the cooling pond was constructed to serve that plant. Also, Exelon Generation leases land near the pond to the IDNR for fish hatchery operations. Considering that baseline, any impacts on cooling pond organisms due to LSCS operation would necessarily be smaller than shutting the plant down, after which the hatchery and the organisms in the cooling pond may be eliminated entirely. Therefore, it is misleading and serves no use for agency decision making to assign a MODERATE impact for continued operation while assigning a SMALL impact for the No-Action Alternative. At a minimum, even if the SEIS were to consider thermal impacts on aquatic organisms in the cooling pond, it should recognize this complexity by either assigning a SMALL impact for continued operation but a MODERATE impact for the No-Action Alternative, or by not using the SMALL, MODERATE, and LARGE designations to characterize the impacts, as has been done elsewhere in the DSEIS for special status species and historic and cultural resources.
5. Considered on its own merits, the conclusion of “MODERATE” impacts on shad populations is not supported by facts. The basis provided by the Staff for MODERATE impacts are the declines in shad populations after fish kills “each summer.” DSEIS at 4–50. While these events may have temporarily reduced the number of shad, even regular fish kills every year have not destabilized or noticeably altered any important attribute of the shad resource, as shown by the regular recovery of populations. Moreover, shad are not a desirable fish for the cooling pond. They are not stocked fish, and instead, as the DSEIS states, certain recreationally fished species are stocked “in part to limit the size of shad populations.”
DSEIS at 3–68 (emphasis added). This need to further limit shad populations, beyond the decreases in population inadvertently caused by fish kills, in order to protect the overall aquatic health of the cooling pond, suggests that the shad population should not be evaluated at all for impacts from operation of the LSCS. Furthermore, if IDNR were to determine that the aquatic health of the cooling pond required an increased shad population, there is no reason to believe that shad could not be stocked to accommodate the need, as the DSEIS reports is done for other species. DSEIS at 4–50.

Appendix A
A-16
6. Past NRC practice is not dispositive. The DSEIS points to prior examples where the Staff considered aquatic impacts within cooling ponds in other license renewal SEISs, including Braidwood and other plants with environmental reviews based on the 1996 GEIS. Exelon Generation objected on the record to this approach in the Braidwood SEIS, and the mere existence of prior Staff practice does not require the NRC to, going forward, impermissibly evaluate aquatic impacts on the LSCS cooling pond. Errors in legal interpretation should not be carried forward into new analyses.
Response: The commenter does not agree with the NRC staff’s analysis, which considers (under Line of Evidence (LOE) 5) thermal impacts in Section 4.7.1.3 on aquatic organisms in the LSCS cooling pond, and in particular with the NRC staff’s determination that thermal impacts on gizzard shad and threadfin shad (shad) due to continued operation of LSCS would be MODERATE.
The NRC staff does not agree with the comment based on the following reasons. First, the NRC is not prohibited from considering the thermal impacts on aquatic organisms in the LSCS cooling pond by either the National Environmental Policy Act of 1969, as amended (NEPA), or the NRC’s regulations implementing NEPA in 10 CFR Part 51. Instead, both NEPA and the NRC’s regulations implementing NEPA give the NRC broad discretion in determining the environmental impacts that it considers in support of a license renewal application. For instance, NEPA requires all Federal agencies, for major Federal actions significantly affecting the quality of the human environment, to provide a detailed statement on the environmental impacts of the proposed action. Environmental impacts may be those reasonably foreseeable impacts directly or indirectly caused by the action or the cumulative impact on the environment which results from the incremental impact of the action when added to other past, present, and reasonably foreseeable future actions. The NRC requires an applicant for a renewed operating license to submit information useful in aiding the NRC in complying with NEPA, such as a description of the affected environment around the plant and the impacts of license renewal on the environment, discussed in proportion to their significance. The NRC also uses a scoping process to determine the scope of its environmental impact statement including those environmental impacts to be analyzed in depth and those whose discussion is to be limited. From the information submitted by the applicant and the information gathered as part of its scoping process, the NRC independently develops an environmental impact statement that considers and weighs the environmental impacts of the proposed action. The environmental impact statement will consider matters covered by environmental quality standards and requirements irrespective of whether a certification or license from the appropriate Federal, State, or local authority has been obtained. This environmental review process does not prohibit the NRC staff from considering the thermal impacts on aquatic organisms in cooling ponds within its environmental impact statement.
Second, considering the thermal impacts on aquatic organisms in the LSCS cooling pond is consistent with previous NRC evaluations of environmental impacts. In its 1996 environmental impact statement generically evaluating the environmental impacts of license renewal (NRC 1996) at Section 4.4.3, the NRC looked generically at the effects to the aquatic biota of cooling ponds from water quality degradation, impingement, entrainment, and thermal discharges. NRC (1996) determined that these effects are the same in cooling ponds as those considered for once-through cooling systems except that impacts in cooling ponds mainly influence aquatic communities that did not exist before creation of the cooling pond. NRC (1996) reviewed various reports regarding the impacts to aquatic organisms in cooling ponds and coordinated with other regulatory agencies and nuclear utilities. NRC (1996) concluded that, for some plants, the large volumes of water withdrawn, heated, and discharged back to the receiving water (such as cooling ponds) may cause adverse effects to fish
Appendix A
A-17
populations during the license renewal term and, therefore, the impacts of fish entrainment and impingement and of thermal discharge effects could be SMALL, MODERATE, or LARGE for plants with once-through cooling and cooling ponds. This conclusion was affirmed by the NRC’s 2013 GEIS. Consistent with the NRC’s 1996 GEIS and 2013 GEIS, previous NRC operating license renewal environmental impact statements have considered the impacts on aquatic resources in cooling ponds (e.g., NRC 2008, 2013b, 2015).
Based on the above, the NRC staff disagrees with the commenter’s suggestion that the NRC is prohibited from considering the thermal impacts on aquatic organisms in the LSCS cooling pond. The commenter also states that the NRC staff should not analyze the thermal impacts to aquatic resources within the cooling pond based on 10 CFR 51.53(c)(3)(ii)(A). The NRC staff does not agree with this portion of the comment because 10 CFR 51.53(c)(3)(ii)(A) describes the type of information that an applicant should include in its ER, not the type of analysis that the NRC staff should present in its environmental impact statement. Furthermore, the NRC staff analyzed the impacts described in 10 CFR Part 51.53(c)(3)(ii)(A) in Section 4.7.1.4, “Water Use Conflicts with Aquatic Resources,” which is a separate analysis from the thermal analysis presented in Section 4.7.1.3. The commenter also suggests that the NRC staff should not analyze the impacts to aquatic resources in the cooling pond because the cooling pond is exempt from impingement and entrainment monitoring requirements under Section 316(b) of the CWA. The NRC staff does not agree with this statement because the lack of cooling pond monitoring requirements under Section 316(b) of the CWA does not preclude Exelon from conducting impingement and entrainment studies to better characterize the potential impacts to aquatic resources within the cooling pond, nor does it preclude the NRC staff from analyzing those impacts, as described above and in its response to Comments L-004, L-005, and L-007.
The commenter states that the consideration of environmental impacts on aquatic organisms in the LSCS cooling pond should begin from the premise that no aquatic populations would exist in this location without the LSCS having been constructed in the first place. The staff disagrees with this statement because it doesn’t matter why the cooling pond currently exists; rather, NEPA and the NRC’s regulations implementing NEPA require the NRC staff to provide a detailed statement on the environmental impacts that the proposed action may have on currently existing resources, such as the cooling pond.
The commenter states that the No-Action alternative should be MODERATE with respect to thermal impacts on aquatic organisms in the cooling pond. The NRC staff agrees with this comment in part. As described in Section 4.7.2 of the SEIS, for the No-Action alternative, thermal discharge to the cooling pond would be greatly reduced and eventually stop. The cooling pond would likely experience shifts in the relative abundances of fish populations because less heat-tolerant species would no longer be stressed by thermal additions to the pond. Some fish populations, such as stocked recreational species that thrive in warmer waters, may experience population declines in the cooling pond. Given that these shifts in community structure would likely be noticeable for some species, the NRC staff revised the conclusion in Section 4.7.2 and determined that, for the No-Action alternative, the impacts would be SMALL to MODERATE within the cooling pond and SMALL within the Illinois River.
The commenter also states that the No-Action alternative should assume that the hatchery and the organisms in the cooling pond may be eliminated entirely post-operation. The NRC staff does not agree with this part of the comment because, as described in Section 2.2.1, the No-Action alternative considers the impacts that arise directly as a result of plant shutdown, such as the reduction of thermal effluent discharged into the cooling pond. Section 2.2.1,

Appendix A
A-18
further states that the environmental impacts from decommissioning and related activities, such as the potential elimination of the cooling pond, are not considered within the No-Action alternative. The commenter also suggests that the NRC staff not assign a SMALL, MODERATE, or LARGE impact determination for thermal impacts in the cooling pond, which the commenter suggests would follow the methodology in the special status species and historic and cultural resources analyses. The NRC staff does not agree with this comment because the special status species and historic and cultural resources sections do provide impact determinations, but they are based on the language in the Endangered Species Act of 1973, as amended (16 U.S.C. 1531 et seq.), for special status species and in Section 106 of the National Historic Preservation Act of 1966, as amended (16 U.S.C. 470 et seq.), for historic and cultural resources. Further, Table B–1 in Appendix B to Subpart A of 10 CFR Part 51 concludes that thermal impacts on aquatic organisms for plants with once-through cooling systems or cooling ponds may be SMALL, MODERATE, or LARGE, and Section 4.5 of NUREG–1555, Standard Review Plans for Environmental Reviews for Nuclear Power Plants: Environmental Standard Review Plan, Supplement 1, Revision 1 (NRC 2013b), directs the staff to characterize thermal impacts to aquatic resources according to these levels of impact. Therefore, failing to make such a conclusion would be inconsistent with the NRC’s regulations in 10 CFR Part 51 and guidance in NRC (2013c) concerning license renewal.
The commenter also states that the NRC staff’s conclusion of “MODERATE” impacts on shad populations is not supported by facts. The NRC staff does not agree with this comment for several reasons, as described below. As an initial matter, the commenter appears to confuse the definitions of MODERATE and LARGE by stating that it disagrees with the NRC staff’s conclusion of MODERATE because fish kills have not destabilized or noticeably altered shad populations. As defined in Table B–1 in Appendix B to Subpart A of 10 CFR Part 51 and as stated in Chapter 1 of the LSCS SEIS, the definition of MODERATE is that the environmental effects are sufficient to alter noticeably, but not to destabilize, important attributes of the resource (emphasis added). The NRC staff considers shad an important attribute of the aquatic community in the cooling pond because it is prey for many of the recreationally fished species within the cooling pond. The NRC’s standard review plan (NRC 2013b) defines species with important trophic links, such as predators or prey, as important species. Furthermore, the Illinois Department of Natural Resources (IDNR) has documented several instances of noticeable changes in the population of shad due to fish kills. As stated in Section 4.7.1.3, during IDNR surveys in the LSCS cooling pond, the gizzard shad catch per hour was 451 in 2000 and was 108 in 2001 after the largest fish kill (Exelon 2002). Similarly, in a status review of the cooling pond in 2011, 2012, and 2014, IDNR noted the decline in the threadfin shad population due to fish kills during each summer (Exelon 2015). Shad populations generally recovered within 1 year after a kill occurred (Exelon 2002, 2015), and loss of shad did not substantially affect the community dynamics within the cooling pond (Exelon 2010, 2015). Based on the definition of important ecological resources in the NRC’s standard review plan (2013b), IDNR’s surveys that noted a noticeable decline in shad following large fish kills (Exelon 2002, 2015), and the likelihood that fish kills in the LSCS cooling pond would continue to occur during the license renewal term, the NRC staff determined that operation of the LSCS cooling system would have noticeable, or MODERATE, effects on threadfin shad and gizzard shad. The NRC staff also noted that fish kills would not be destabilizing because shad tend to recover within a year and because population declines do not substantially affect community dynamics within the cooling pond.
The NRC staff acknowledges that there is a degree of uncertainty regarding the magnitude of the impact to shad populations due to the fact that the best available information does not include the estimated population size of shad prior to and after a fish kill. Without this information, the NRC staff is not able to calculate the percent of the shad population that has
Appendix A
A-19
been affected by each fish kill. In this situation, the Council on Environmental Quality’s “Collaboration in NEPA, A Handbook for NEPA Practitioners,” recommends that practitioners use the best available information. Therefore, the NRC staff has followed this guidance and has relied upon the best available data, which includes:
• Qualitative and quantitative reports that describe the number of fish affected by fish kills in the LSCS cooling pond (e.g., Exelon 2001, 2002, 2009, 2010),
• Annual fall fish surveys by IDNR (e.g., Exelon 2015),
• Exelon and IDNR reports and meeting notes that attribute shad declines to fish kills (e.g., Exelon 2002, 2015), and
• Temperature data within the cooling ponds and known thermal stress limits for fish species within the cooling pond (e.g., Exelon 2001, 2009, 2010, 2014, 2015).
Comment L-060: In Section 3.7.1 on page 3–60 in line 2, correct the text as follows:
“… intake, and the Marseilles Lock and Dam, 2.4 mi (3.5 km) downstream of the LSCS discharge …” This correction is needed because, while the Marseilles Dam is 2.4 mi downstream from the LSCS discharge, the Marseilles Lock is 4.9 mi (7.9 km) downstream. Response: The commenter suggests a revision to clarify the location of the Marseilles Lock and Dam. The NRC staff agrees with the commenter and revised Section 3.7.1 of the SEIS to state that the Marseilles Dam is 2.4 miles (mi) (3.5 kilometers (km)) downstream of the LSCS discharge and that the Marseilles Lock is 4.9 mi (7.9 km) downstream of the LSCS discharge.
Comment L-061: In Section 3.7.1.1 on page 3–65 in Table 3–10, because the species “Micropterus dolomieu smallmouth bass” is not a member of the “Catostomidae” family, but rather is a species within the “Centrarchidae” family, the row containing “Micropterus dolomieu smallmouth bass” should be moved up to below the row containing “Lepomis macrochirus bluegill,” within the family “Centrarchidae.” Response: The commenter suggests a revision to clarify that smallmouth bass (Micropterus dolomieu) is not a member of the Catostomidae family, but rather a member of the Centrarchidae family. The NRC staff agrees with this comment and has revised Table 3–10 to clearly indicate that smallmouth bass is a member of the Centrarchidae family.
Comment L-062: In Section 3.7.2.1 on page 3–68 in lines 10 to 11 correct the text as follows:
“…to the cooling pond started operations, at which point IDNR started stocking the cooling pond with species from the hatchery (EA 2002). IDNR assumed management of the hatchery in 1984. Initially, IDNR stocked the LSCS cooling pond with…” Response: The commenter suggests a revision to clarify that IDNR assumed management of the fish hatchery in 1984. The NRC staff agrees with the comment and made a clarification to the SEIS in Section 3.7.2.1 that IDNR assumed management of the fish hatchery in 1984.
Comment L-063: In Section 3.7.3.1 on page 3–70 in line 19, correct the text as follows: “… species, such as walleye and tiger muskellunge.” Response: The commenter suggests a revision in Section 3.7.3.1 to clarify that muskellunge, not tiger muskellunge, is a cool water species that has been stocked in the LSCS cooling pond. The NRC staff agrees with the comment and made a clarification to the SEIS in Section 3.7.3.1 that muskellunge, not tiger muskellunge, is a cool water species that has been stocked in the LSCS cooling pond.

Appendix A
A-20
Comment L-064: In Section 3.7.3.1 on page 3–70 in lines 13 and 14, correct the text as follows: “… study at the LSCS river intake. In response to this collection, Exelon noted that EA Engineering intends to request a scientific collector’s permit report from IDNRfile a scientific collectors report with IDNR. This species was not …” Response: The commenter suggests that the NRC staff revise the text to specify that EA Engineering intends to “file a scientific collectors report with IDNR” rather than “request a scientific collector’s permit report from IDNR.” The NRC staff agrees with this comment and has revised the text in Section 3.7.3.1 to state that “EA Engineering intends to file a scientific collectors report with IDNR.”
Comment L-065: In Section 3.7.3.1 on page 3–72 in line 3, correct the text as follows: “… boatingcommercial barge accident (Kanter 2013). This species was not collected during LSCS preoperational …” Response: The commenter suggests that the NRC staff revise the text to specify that commercial barges were involved in the boating accident, as described in Kanter (2013). The NRC staff does not agree with the comment because Kanter (2013) does not specify whether the boats were commercially licensed or not. This comment did not result in any changes to the SEIS.
Comment L-066: In Section 3.7.4 on pages 3–72 and 3–73, either re-name section 3.7.4 as discussed below, or move the information about bryozoans to either section 3.7.1.1 or section 3.7.2.1 in the DSEIS. This correction is needed because, although bryozoans may be nuisance species, they are actually native to waters of Illinois including the Illinois River. As such, the inclusion of bryozoans in the section 3.7.4, Non-Native Species, discussion is inaccurate. Perhaps the easiest edit is to re-title the section as “Non-Native and Nuisance Species.” Bryozoans were described in the ER (Section 3.7.1.6, Invasive/Non-native Species) because they are invasive. Response: The commenter suggests that the NRC staff rename Section 3.7.4 from “Non-Native Species” to “Non-Native and Nuisance Species” because the species discussed in Section 3.7.4 include both native and non-native nuisance species. The NRC staff agrees with this comment and renamed Section 3.7.4 from “Non-Native Species” to “Non-Native and Nuisance Species” to more accurately describe the type of aquatic species discussed in Section 3.7.4.
Comment L-084: In Section 4.7.1.2 on page 4–63 in the 7th line of the last paragraph, the text discussing the WOE approach incorrectly references “NRC 2013b” (Event Reporting Guidelines). It appears the staff intended to reference the SEIS for the South Texas Project license renewal, which is “NRC 2013c.” Accordingly, correct the text as follows: “… (e.g., NRC 2010, 2013b2013c, 2015a, 2015b). Menzie et al. (1996) defines WOE as “…the process …” Response: The commenter suggests that the NRC staff correct a citation because it incorrectly references the wrong document, NRC’s Event Reporting Guidelines. The NRC staff agrees with this comment and has corrected the citation so that it references the correct document, the STP Final SEIS.

Appendix A
A-21
A.3.8 Historic and Cultural Resources
Comment L-085: In Section 4.9.4 on page 4–63 in the 1st line of the 1st paragraph, correct the text discussing the IGCC Alternative as follows: “…alternative is sited on the approximately 250350 ac (101142 ha) of undeveloped land on the LSCS site, …” This correction is needed because the amount of undeveloped land was updated to 350 ac in Exelon Generation’s response to RAI LU-01, which was provided to NRC by a letter dated July 2, 2015 (ADAMS Accession No. ML15195A373), and in Section 3.2 (p. 3–5) of the ER revisions, which were provided to NRC with a letter dated July 31, 2015 (ADAMS Accession No. ML15212A259). Note that Section 3.2.1.1 on p. 3–21, line 21 of the DSEIS identifies the correct acreage for undeveloped land. Response: Section 4.9.4 has been revised as suggested.
Comment L-086: In Section 4.9.5 on page 4–63 in the 5th line of the 1st paragraph in Section 4.9.5 on p. 4–63, correct the text as follows: “… be used. If the power plant is sited on the approximately 250350 ac (101142 ha) of undeveloped land …” This correction is needed because the amount of undeveloped land was updated to 350 ac in Exelon Generation’s response to RAI LU-01, which was provided to NRC by a letter dated July 2, 2015 (ADAMS Accession No. ML15195A373), and in Section 3.2 (p. 3–5) of the ER revisions, which was provided to NRC with a letter dated July 31, 2015 (ADAMS Accession No. ML15212A259). Note that Section 3.2.1.1 on p. 3–21, line 21 of the DSEIS identifies the correct acreage for undeveloped land. Response: Section 4.9.5 has been revised as suggested.
A.3.9 Socioeconomics
Comment M-001: The analysis of socioeconomic impacts are incomplete. No analysis of impacts for early or unexpected closures were considered or provided. No mention or analysis of negative impacts resulting from an abrupt planned or unexpected early closure of LaSalle is presented. This is a significant omission, particularly in light of Exelon Corporation’s threat of two years ago to close reactors in Illinois on economic grounds. An abrupt end of LaSalle site operations would wreak economic havoc on affected governmental and essential service entities’. The Safety Evaluation Report fails to recognize or mention events that could result in such a closure situation, such as an unexpected major accident resulting in immediate and presumably, premature closing, or NRC-ordered shutdown. It is irrational to assume the only socioeconomic effects of LaSalle’s presence will be positive ones. To minimize economic and service disruptions we believe that planning for some kind of eventual closure must be made long before it happens. We recommend that dependent government and tax entities begin formal negotiations with Exelon to establish an escrow of mitigation funds based on some mutually agreeable assessment and payment structure so that funds would be available to soften the economic blow of a plant closure. Comment N-001: The Exelon Safety Evaluation Report (SER) documents a significant tax impact for the presence of the LaSalle Nuclear Station, yet only addresses the positive impacts. No mention or analysis of negative impacts resulting from abrupt, planned, or unexpected early closure of LaSalle is presented. This is a significant omission, particularly in light of Exelon Corporation's threat of two years ago to close reactors in Illinois on economic grounds. According to the Exelon SER LaSalle represents a sizeable portion of the County total tax base. It also accounts for large portions of the School District's adjusted property tax levy. These are
Appendix A
A-22
not insignificant amounts. Their abrupt disappearance would wreak economic havoc on the affected governmental and essential service entities' ability to operate - just as Exelon's predecessor ComEd did to the community of Zion in 1997 when they unilaterally closed the Zion reactors. The SER either fails to recognize or mention at all some of the possible events that could result in such a closure situation:
• Unexpected major accident, resulting in immediate and presumably premature closure
• NRC-ordered shut down
• Exelon's unilateral decision to close the plant on economic or other grounds, as it did at Zion, resulting in an immediate loss of about 55% of Zion's tax base
• Devaluation through sale, as occurred at the Clinton station, resulting in enormous loss of tax base
• Eventual old-age, license expiration closure (the outcome most hoped for) Exelon being a business will certainly make the calculations it made when it closed Zion, and decide if LaSalle should continue to operate. In this omission the SER makes the same mistake the U.S. Government made when it invaded Iraq - it had no exit strategy. To simply assume that the only socio-economic effects of LaSalle's presence will be positive ones is simply irrational. Recommendation: Planning for some kind of eventual closure must be made long before it happens to minimize economic and service disruptions to the entities whose tax base will be affected. Debate about the license extension serves as a good reminder of this fact, and an opportunity to take action. We recommend that dependent governmental and taxing entities begin formal negotiations with Exelon to establish an escrowed “closure mitigation fund,” based on some mutually agreeable assessment and payment structure, so that dependent entities will have some kind of temporary funds available to soften the economic blow of closure, and not radically disrupt essential services. Response: The NRC staff assumes that the commenter is referring to Exelon’s ER rather than the safety evaluation report (SER) prepared by the NRC. With the exception of an unexpected major accident and an NRC-ordered shutdown for safety reasons, the possible events leading to the closure of LSCS identified in this comment involve energy planning decisions that would be made by Exelon and state officials. The NRC has no role in these energy planning decisions. In addition, the closure of LSCS could occur at any time, including after the expiration of either the current or renewed operating license.
Information about Exelon’s tax payments is described in Section 3.10.5, “Tax Revenue,” in the SEIS, and the socioeconomic impacts of station closure and the termination of reactor operations caused by the expiration of the LSCS operating license are described as part of the “No-Action” alternative in Section 4.10.2 of Chapter 4 in the SEIS. The impacts of closing and decommissioning a nuclear power plant are also described in NUREG–0586, Final Generic Environmental Impact Statement on Decommissioning of Nuclear Facilities: Supplement 1, Regarding the Decommissioning of Nuclear Power Reactors (NRC 2002). The environmental consequences of decommissioning LSCS would be addressed as part of the license termination plan.
In regard to what is to be discussed in the ER, 10 CFR 51.45(c) states:

Appendix A
A-23
Environmental reports prepared at the license renewal stage under § 51.53(c) need not discuss the economic or technical benefits and costs of either the proposed action or alternatives except if these benefits and costs are either essential for a determination regarding the inclusion of an alternative in the range of alternatives considered or relevant to mitigation. In addition, environmental reports prepared under § 51.53(c) need not discuss issues not related to the environmental effects of the proposed action [license renewal] and its alternatives.
In Section 4.10.2, “No-Action Alternative,” under socioeconomic impacts, the NRC staff determined that not renewing the operating licenses and terminating reactor operations could noticeably impact socioeconomic conditions in the communities located near LSCS. Specifically, termination of power plant operations would result in the loss of jobs and income for individuals working at, or providing services to, LSCS and would reduce tax revenue in affected tax jurisdictions. Depending on the jurisdiction, socioeconomic impacts from the termination of nuclear plant operations could range from SMALL to LARGE.
Comment L-67: In Section 3.10.1 on page 3–83, correct the “Source” cited for Table 3–15 on p. 3–83 because, while “Exelon 2014” is cited, there is no corresponding entry for “Exelon 2014” in the reference list in section 3.14. The source for the data presented in Table 3–15 is Exelon Generation’s response to RAI SE-01, which was provided to NRC in a letter dated July 2, 2015 (ADAMS Accession No. ML15195A403). Response: The NRC staff has revised the source citation in Table 3–15 and added the reference as suggested.
Comment L-068: In Section 3.10.1 on page 3–83 in line 9, the text citing the LSCS License Renewal Environmental Report (i.e., “Exelon 2014a”) should be corrected because the workforce information being presented is not based on Exelon 2014a. Rather, it is based on Exelon Generation’s response to RAI SE-01, which was provided to NRC in a letter dated July 2, 2015 (ADAMS Accession No. ML15195A403). Response: The NRC staff has revised the reference citation as suggested.
Comment L-069: In Section 3.10.5 on page 3–94, Correct the “Source” cited for Table 3–27 on p. 3–94 because, while the text cites the LSCS License Renewal Environmental Report (i.e., “Exelon 2014a”) as the source for the 2013 tax data being presented, the data were not based on Exelon 2014a. Rather, the data are based on Exelon Generation’s response to RAI SE-02, which was provided to NRC in a letter dated July 2, 2015 (ADAMS Accession No. ML15195A404). Response: The NRC staff has revised the source citation in Table 3–27 and added the reference as suggested.
Comment L-070: In Section 3.10.5 on page 3–95 in line 1, correct the text as follows: “In addition, Exelon makes annual payments to the Illinois Emergency Preparedness Management Agency for …” Response: The NRC staff has revised the text as suggested.
Comment L-071: In Section 3.10.5 on page 3–95, Correct the “Source” cited for Table 3–28 on p. 3–95 because, while the text cites the LSCS License Renewal Environmental Report (i.e., “Exelon 2014a”) as the source for the annual payments to IEMA being presented, the data were not based on Exelon 2014a. Rather, the data are based on Exelon Generation’s response to RAI SE-04, which was provided to NRC in a letter dated July 2, 2015 (ADAMS Accession No. ML15195A406).
Appendix A
A-24
Response: The NRC staff has revised the source citation in Table 3–28 and has added the reference as suggested.
Comment L-072: In Section 3.10.6 on page 3–95 in line 20, correct the text as follows: “… the site. The Chicago, Rock Island & Pacific CSX Railroad is the closest railroad line to LSCS. It …” This updated railroad information was provided in Exelon Generation’s response to RAI LU-03, which was provided to NRC in a letter dated July 2, 2015 (ADAMS Accession No.ML15195A375). Response: The NRC staff has revised the text as suggested.
Comment L-087: In Section 4.10.5.2 on page 4–69 in the 1st line of the 1st paragraph, correct the text as follows: “Transportation impacts associated with construction and operation of a threefive-unit, NGCC power …” This correction is needed because the NGCC alternative as described in Section 2.2.2.3 of the DSEIS would require five 560-MWe NGCC units to replace the generating capacity of the LSCS. Response: The NRC staff has revised the text as suggested.
A.3.10 Human Health
Comment L-073: In Section 3.11.5 on page 3–100 in line 20, correct the text as follows because section 3.11.5 does not address electric shock hazards: “Two additional human health issues are addressed in this section:This section addresses physical occupational hazards and electric shock hazardsapplicable only to workers. Response: This comment expresses concern that electric shock hazards are not addressed in Section 3.11.5. The NRC staff has updated the text in Section 3.11.5 to clarify that LSCS maintains an Occupational Safety and Health Administration worker safety program that includes electric shock hazards.
Comment L-088: In Section 4.11.1.1 on page 4–73 in the last sentence, correct the text as follows: “… The permit limitsrequires monitoring and reporting of the average monthly and daily maximum rates of blowdown discharges to the river (Outfall 001) to a maximum rate of 45 gallons per minute (gpm) (0.17 m3 per minute (m3/min)), …”. This correction is needed because the NPDES permit does not set a maximum flow rate for the LSCS blowdown. The correct NPDES permit conditions are described in Section 3.5.1.3 of the DSEIS, and this change is consistent with that DSEIS section. Response: This comment expresses concern that the NPDES permit requirements for LSCS blowdown discharges to the river are not characterized correctly in Section 4.11.1.1. NRC staff agrees with this comment and updated the text in Section 4.11.1.1 to reflect the correct NPDES permit requirements.
A.3.11 Environmental Justice
Comment L-074: In Section 3.12.1 on page 3–102 in line 30, correct the text as follows because the ROI minority population data for 2014 is located in Table 3–21: “… 7.4 percent) and now comprise 30.5 percent of the ROI population (see Table 2.10.3–33–21). The …” Response: The NRC staff has revised the text as suggested.

Appendix A
A-25
A.3.12 Greenhouse Gas Emissions and Climate Change
Comment E-002: The Draft SEIS includes estimated greenhouse gas (GHG) emissions as result of the preferred alternative (beginning on page 4–104), including emissions from stationary combustion sources, fugitive emissions, purchased electricity, and refrigerant-related sources. Per Table 4–21, totals range from 34,228 to 39,997 metric tons of carbon dioxide equivalents per year (MT/yr of C02e). Table 4–22 lists the direct GHG emissions from operation of the proposed action and alternatives, which lists an estimated 1,022 MT/yr of C02e as a result of continued operation of LSCS. As stated in the footnote, direct impacts for the LSCS continued operation and new nuclear alternatives only include emissions from stationary combustion sources. EPA assumes that the emissions from other sources (e.g., fugitive emissions, purchased electricity, and refrigerant-related sources) are a result of necessary actions to ensure the continued safe operation of LSCS. Therefore, it is unclear why the analysis and Table 4–22 only include emissions from stationary combustion sources and not the other listed sources of GHG emissions. Recommendation: The Final SEIS should clarify why the alternatives analysis related to GHG does not include sources other than stationary combustion sources. We recommend the Final SEIS either explain in the narrative why the other sources of GHG (e.g., fugitive emissions, purchased electricity, and refrigerant-related sources) are not pertinent to the analysis and conclusion, or amend Table 4–22 to reflect an accurate accounting of GHG emissions from the two nuclear alternatives (LSCS continued operation and new nuclear). Response: The commenter recommends that the SEIS clarify why Table 4–22 of the LSCS SEIS only includes direct GHG emission from combustion sources or that the staff revise Table 4–22 to account for GHG emissions from various sources at LSCS. Table 4–22 of the SEIS only presents direct emissions resulting from operation of LSCS in order to provide a commensurate comparison of the proposed action (LSCS continued operation) and the Alternatives. The GHG emissions evaluated and presented in Table 4–22 for the Alternatives are the result of gas or coal combustion and, therefore, are direct emissions. As discussed in Section 4.15.3.1 of the SEIS, plant operations at LSCS release GHG emissions from stationary combustion sources, fugitive emissions, purchased electricity, and refrigerant-related sources. Purchased electricity is from an offsite electricity supplier; therefore, the emissions are indirect. The supplier, not LSCS, would account for the GHG emissions from purchased electricity. Thus, to provide a commensurate comparison of the GHG emissions of the Alternatives and the proposed action, direct emissions from LSCS were presented in Table 4–22.
Section 4.15.3.1 has been revised to clarify direct and indirect GHG emissions sources from operation of LSCS. Clarification has been provided in Table 4–22 explaining why only direct emissions are provided, and Table 4–22 GHG emissions from LSCS were revised to include direct emissions from stationary combustion sources, fugitive emissions, and refrigerant related sources, but not indirect emissions from purchased electricity for the reason discussed above. Additionally, Section 4.16.11 was also revised to present direct LSCS GHG emissions.
Comment M-002: Inadequate attention is being paid to water availability at the LaSalle Nuclear Power Plant under potential future climate disruption conditions. Historically, LaSalle Nuclear Power Plant has been one of the Illinois reactor sites most sensitive to water availability. Extreme droughts in 1998, 2005, and 2006, have brought the reactors close to mandatory shutdowns to stay within EPA thermal pollution limits. The forecast for the future of Illinois climate over the next few decades indicate it will approach that of current day west Texas. This will have severe impacts on the aquatic system in the area, and on the availability of water for intake and discharge at LaSalle. A more thorough re-examination of LaSalle’s ability to safely

Appendix A
A-26
operate, obtain sufficient cooling water, and not thermally and radiologically damage the local aquatic ecosystem is in order in this re-licensing proceeding. Comment N-002: Historically, the LaSalle NPP has been one of the Illinois reactor sites most sensitive to water availability under severe drought conditions (e.g., 1998; 2005; 2006). It’s siting on a portion of the Illinois river network that is shallower than other parts has brought the reactors close to mandatory shutdown to stay within EPA regulatory limits for thermal pollution during extreme droughts on more than one occasion over the past two decades. Forecasts for the future of Illinois’ climate over the next few decades indicate it approaching that of current- day West Texas. This will have severe impacts on the aquatic systems in the area; and on the availability of water for intake and discharge for LaSalle. A more thorough re-examination of LaSalle's ability to safely operate, obtain sufficient cooling water, and not thermally and radiologically damage the local aquatic eco-system is in order in this relicensing proceeding. Response: The commenters request that the LSCS SEIS consider water availability and the ability for LSCS to safely operate under potential future climate conditions. As summarized in Section 4.1 and as further discussed in Section 4.15.3.2 of the SEIS, impacts to facility operations from climate change are not evaluated in the SEIS because the scope of the environmental review focuses on the evaluation of impacts from continued operation of LSCS on environmental resources. Accordingly, Sections 4.5 and 4.7 of this SEIS present the NRC staff’s analysis of the potential environmental impacts of license renewal and continued operations on water resources and aquatic resources, respectively, including water use conflicts, water availability, and impacts to aquatic resources.
Section 4.15.3.2 of the SEIS evaluates potential climate change impacts on environmental resources, including water resources and aquatic resources. Specifically, the water resources cumulative impact discussion in Section 4.16.3 evaluates climate change impacts on surface water as a result of changes in temperature and precipitation. This section explains that higher air temperatures and increased runoff associated with heavy precipitation events could impact the thermal regime of the Marseilles Pool of the Illinois River. The implications for potential climate-induced changes on cooling pond temperatures and evaporative losses from LSCS’s cooling pond are also discussed in Section 4.16.3 of the SEIS. To inform the NRC’s operating reactor licensing environmental reviews, the NRC uses consensus information from the U.S. Global Change Research Program (USGCRP). The USGCRP integrates and presents the prevailing consensus of Federal research on climate and global change, as sponsored by 13 Federal agencies.
Furthermore, nuclear power plants are required to operate in accordance with technical specifications, which are part of the NRC operating license. Technical specifications, in part, are intended to ensure the ability of a licensed nuclear power plant to cope with natural phenomena hazards, such as ensuring that adequate cooling water is available under adverse conditions, such as drought. For example, as described in Section 3.5.1.2 of the LSCS SEIS, Exelon has plans and procedures in place to take necessary actions under adverse environmental conditions of drought and high water temperatures to ensure that technical specifications and environmental permit requirements are met. Failure to meet technical specifications may require the plant to reduce power or to shut down.
The NRC also conducts safety reviews before allowing licensees to make operational changes due to changing environmental conditions. Additionally, the NRC evaluates nuclear power plant operating conditions and physical infrastructure to ensure ongoing safe operations through its Reactor Oversight Process. If new information about changing environmental conditions

Appendix A
A-27
becomes available, the NRC will evaluate the new information to determine whether any safety-related changes are needed at existing nuclear power plants. The NRC does not wait for a licensee to identify such conditions. This process is separate and distinct from the NRC’s license renewal environmental review that is conducted in accordance with the National Environmental Policy Act (NEPA).
Comment L-010: Table ES–1, in the executive summary on page xxi labeled “Summary of NRC Conclusions Relating to Site-Specific Impacts of License Renewal,” (emphasis added) indicates that Global Climate Change Cumulative Impacts are “MODERATE.” As explained further in comments below regarding Section 4.16.11, this entry in Table ES–1 is misleading to decision makers and the public in that it fails to meaningfully inform them about either the non-site-specific nature of cumulative impacts from GHG emissions or the net beneficial contribution of site specific LaSalle County Station (LSCS) GHG emissions. Accordingly, the table should be modified to clarify these points of confusion. Response: The commenter requests that Table ES–1 be revised to clarify the incremental impact from continued operation of LSCS on Global Climate Change. The NRC staff agrees with the comment and has added a footnote to Table ES–1 to clarify the incremental impact of continued operation of LSCS on Global Climate Change.
Comment L-011: At Section 4.15.3.1, pages 4–105, Table 4–21 reports an incorrect value for GHG emissions from purchased electricity at LSCS during 2011. The amount of GHG emissions from 2011 purchased electricity reported in Table 4–21 erroneously duplicates the value for 2012 (i.e., 36,066 MT/yr of CO2e). The 2011 value should be 33,493 MT/yr of CO2e. This error in the 2011 “Purchased Electricity” column also causes an error for 2011 in the “Total” column. Hence, the total LSCS GHG emissions for 2011 should be 37,424 MT/yr of CO2e. Response: The commenter requests that GHG emissions for the year 2011 for purchased electricity be corrected. The NRC staff agrees with the comment. Table 4–21 erroneously duplicated the 2012 GHG emission values for purchased electricity. Table 4–21 was revised to provide the correct GHG emission value for purchased electricity for the year 2011, and the total GHG emissions value for the year 2011 was also corrected.
Comment L-012: The following comment applies to Sections 4.15.3 and 4.15.3.21 on pages 4–104 and from pages 4–107 to 4–113. The introduction to Section 4.15.3 on p. 4–104 states that the subsections within Section 4.15.3 “discuss GHG [Greenhouse Gas] emissions released from operation of LSCS and the environmental impacts that could occur from changes in climate conditions. The cumulative impacts of GHG emissions on climate are discussed in Section 4.16.11…” Section 4.15.3.1 then describes GHG emissions that would result from the proposed action (i.e., LSCS license renewal) and alternatives, and Section 4.15.3.2 provides an extended discussion of the impacts of general climate change on resource areas. The purpose of Section 4.15.3.2, is unclear. Accordingly, it should be either deleted or revised to more clearly explain how extraordinarily small the contribution of LSCS GHG emissions during operation is to general climate change impacts in comparison to the global, U.S., Illinois State, and other LaSalle County GHG emissions, as shown in Table 4–23. In addition, given that all of the power generation alternatives (except new nuclear) would produce annual GHG emissions several orders of magnitude greater than LSCS operation (see Table 4–22), Section 4.15.3.2 should point out that the proposed action would have a net beneficial effect on global climate change because LSCS produces miniscule GHG emissions. Accordingly, continued operation of LSCS would serve to reduce emissions from base load power generation in comparison to most replacement power alternatives. It is only through base load, clean energy, such as nuclear power, that significant reductions in GHG emissions can be achieved. Without noting such information in Section 4.15.3.2, the reader is left with the impression that
Appendix A
A-28
GHG emissions from LSCS have some measurable causal relationship to the climate change impacts discussed the section, when no such relationship exists. As a result, Section 4.15.3.2 is misleading to the public as written and not helpful for agency decision-making. Response: The commenter states that the purpose of Section 4.15.3.2 of the SEIS is unclear and requests that it be deleted or revised to discuss that the contribution of GHG emissions from continued operation are small and that license renewal under the proposed action would reduce emissions from base load power generation. Further, the commenter expresses concern that Section 4.15.3.2 is misleading by suggesting that GHG emissions from LSCS measurably contribute to climate change impacts as discussed in Section 4.15.3.2.
The purpose of Section 4.15.3.2 is to discuss observed changes, including trends in climate, projected climate change during the license renewal term, and the potential impacts of climate change on environmental resources. The NRC staff disagrees that Section 4.15.3.2 of the SEIS should be deleted or should be revised to include the specific statements requested by the commenter for the following reasons. First, as discussed in the 2013 license renewal GEIS, to comply with the Commission’s direction in CLI-09-21 (NRC 2009), the NRC staff includes, in each SEIS, a plant-specific analysis of any impacts caused by GHG emissions over the course of the license renewal term, as well as any impacts caused by potential climate change on affected resources during the license renewal term. Second, the SEIS section immediately preceding Section 4.15.3.2 (i.e., Section 4.15.3.1) states that GHG emissions from the proposed action (continued operation of LSCS) results in the lowest GHG emissions when compared to GHG emissions from the Alternatives (which is discussed under the section entitled, “Summary of GHG Emissions from the Proposed Action and Alternatives”). Therefore, the NRC staff disagrees with the comment that Section 4.15.3.2 should be revised to state that GHG emissions from continued operation of LSCS are small because this issue is discussed in Section 4.15.3.1. Third, Section 4.15.3.2 clearly indicates that the potential environmental impacts from climate change presented in the section are based on climate model simulations under future global GHG emission scenarios rather than on a single GHG emission source. This provides the reader with the necessary context to evaluate the potential collective contribution of all GHG emitters and its potential impact on environmental resources.
The introductory paragraph of Section 4.15.3 was revised to clarify the scope of the analysis provided in Section 4.15.3.2.
Comment L-092: In Section 4.15.3.1, pages 4–105, Table 4–21, correct the “Purchased Electricity” and “Total” columns in the “2011” row as follows:
Year Purchased Electricity Total 2011 36,06633,493 39,99737,424
See DSEIS Section 4.18, References, Exelon 2015d (ADAMS Accession No. ML15195A350). Response: The commenter requests that GHG emissions for the year 2011 for purchased electricity be corrected in Table 4–21. The NRC staff agrees with the comment. Table 4–21 was revised to provide the correct GHG emission for purchased electricity for the year 2011, and total GHG emissions for the year 2011 was also corrected.
A.3.13 Cumulative Impacts On Global Climate Change
Comment M-003: The overall impacts of nuclear energy production in Illinois are positive. Alternative sources of energy generation in Illinois would create more negative impacts environmentally, particularly in the area of CO2 emissions. The Illinois Clean Energy Coalition’s
Appendix A
A-29
study in 2014 showed that Illinois’s nuclear fleet prevents the emission of over 92 million tons of CO2. We cannot quickly or easily replace nuclear generation with other clean sources that can be relied on to produce electricity 24hrs/day 7days/week. The loss of any of Illinois’s nuclear plants would require us to increase our use of fossil fuels. This would move us in the wrong direction with respect to carbon emissions. Response: Text was added to Section 4.16.11 that discusses the net beneficial effect of the proposed action when compared to the GHG emissions by the Alternatives. Continued operation of LSCS (the proposed action) effectively results in GHG emissions avoidance.
Comment L-013: The following comment applies to Sections 4.16.11 from pages 4–129 to 4–132. The evaluation of cumulative impacts of greenhouse gas (GHG) emissions from continued operation of LSCS on Global Climate Change in this section and the resulting conclusion of “Site-Specific” MODERATE impacts as reported in Table ES–1, leave the reader with the incorrect impression that LSCS’s operation for another 20 years would have some measurable, negative impact on global climate change, when it could not. As presented, and as explained in detail below, the overall analysis and conclusion is not helpful to an agency decision maker nor does it accurately inform the public, because it fails to convey the fact that nuclear power is one of the few base load electricity solutions to avoid release of GHG emissions and, therefore, the net effect of the proposed action will be beneficial. Exelon recommends that the NRC resolve this misinformation by abandoning the categories of SMALL, MODERATE, and LARGE to label cumulative Global Climate Change impacts. These three categories are inapplicable for this topic and detract from, rather than inform, the NEPA analysis. There is no requirement for the DSEIS to shoehorn all impact areas into these three categories. Nor does the license renewal GEIS specify the use of these categories for all analyses, or for cumulative Global Climate Change impacts in particular. Moreover, there is precedent for the NRC to take an alternative approach. For example, the LSCS DSEIS itself does not use these three categories for impacts in the following areas: Special Status Species and Habitats, Historic and Cultural Resources, Environmental Justice, or cumulative Socioeconomic or Environmental Justice impacts. Instead, in Table ES–1 the NRC provides a high-level tailored summary of the impacts in each of these areas. Thus, there is a well-worn, viable path for the NRC to discuss the beneficial impacts on Global Climate Change of operating LSCS for another 20 years. Consistent with the Staff’s conclusions in these other areas, and as explained below, Exelon recommends the following conclusion for cumulative Global Climate Change impacts: “The proposed action would result in reduced GHG emissions in comparison to the reasonable alternatives and would have a beneficial effect on overall cumulative global climate change impacts and goals.” Another alternative would be to not discuss cumulative impacts on Global Climate Change in the SEIS at all. There is precedent for a federal agency to not perform, or include in an EIS a discussion of, a cumulative impacts analysis when the net effect of the proposed action is shown to be beneficial. The approaches suggested above are acceptable for the following reasons:
1. To reach its finding of MODERATE impacts, the Staff has added the miniscule GHG emissions from ancillary operations at LSCS (e.g., backup diesel generators) to the total GHGs released in the State of Illinois and elsewhere, while simultaneously ignoring the millions of metric tons of GHG emissions that will be avoided by having clean, nuclear energy generation from LSCS continue for another 20 years. See DSEIS, Tables 4–22 and 4–23; see also The White House, Office of Press Secretary, “Fact Sheet: Obama Administration Announces Actions to Ensure that Nuclear Energy Remains a Vibrant Component of the United States’ Clean Energy Strategy” (Nov. 6, 2015) (“Nuclear

Appendix A
A-30
power, which in 2014 generated about 60 percent of carbon-free electricity in the United States, continues to play a major role in efforts to reduce carbon emissions from the power sector”), available at https://www.whitehouse.gov/the-press-office/2015/11/06/fact-sheet-obama-administration-announces-actions-ensure-nuclear-energy; The Brattle Group, “Pennsylvania Nuclear Power Plants’ Contribution to the State Economy,” at 11–12 (Sept. 2015) (calculating the “substantial carbon dioxide and criteria pollutant emissions” prevented by operating nuclear power plants), available at http://www.nuclearmatters.com/resources/reports-studies/document/Nuclear-Matters-Report_Pennsylvania-Value-of-Nuclear.pdf. Ignoring the net beneficial effect of the proposed action on Global Climate Change when compared to the effects of other reasonable alternatives is a clear failure to consider relevant facts.
The NRC states that it derived the NEPA impact categories of SMALL, MEDIUM, and LARGE from CEQ regulations. See, e.g., Final Report, “Generic Environmental Impact Statement for License Renewal of Nuclear Plants,” NUREG–1437, Rev. 1, at S–6 (“The NRC’s standard of significance for impacts uses the Council on Environmental Quality (CEQ) terminology for “significantly” (40 CFR 1508.27), which requires consideration of both “context” and “intensity.” Based on this, the NRC established three levels of significance for potential impacts: SMALL, MODERATE, and LARGE.”). As applied to cumulative impacts on Global Climate Change, however, the NRC’s approach is inconsistent with CEQ’s regulations. See 40 CFR 1500.1(c) (“Purpose” of CEQ regulations) (“The NEPA process is intended to help public officials make decisions that are based on understanding of environmental consequences, and take actions that protect, restore, and enhance the environment.”); 40 CFR 1500.2 (“Policy” in CEQ regulations) (“Federal agencies shall to the fullest extent possible: (b) Implement procedures to make the NEPA process more useful to decisionmakers and the public;”).
2. The Staff concluded in the DSEIS that the impacts of GHG emissions from past, present, and foreseeable future actions on global climate change are MODERATE with or without the operation of LSCS for another 20 years. However, reporting this finding of MODERATE cumulative impacts in the DSEIS is misleading to the public and meaningless to decisionmakers, because no applicable frame of reference has been provided. The DSEIS lacks a discussion of the frame of reference for GHGs suggested in the Draft CEQ guidance on how GHGs should be addressed in NEPA documents. See CEQ, Revised Draft Guidance for Federal Departments and Agencies on Consideration of Greenhouse Gas Emissions and the Effects of Climate Change in NEPA Reviews, 79 Fed. Reg. 77,802 (Dec. 24, 2012). That guidance states:
“Finally, when discussing GHG emissions, as for all environmental impacts, it can be helpful to provide the decisionmaker and the public with a frame of reference. To provide a frame of reference, agencies can incorporate by reference applicable agency emissions targets such as applicable Federal, state, tribal, or local goals for GHG emission reductions to provide a frame of reference and make it clear whether the emissions being discussed are consistent with such goals. For example, Bureau of Land Management projects in California, especially joint projects with the State, look at how the agency action will help or hurt California in reaching its emission reduction goals under the State’s Assembly Bill 32 (Global Warming Solutions Act), which helps frame the context for the BLM NEPA analysis.” Id. at 77,826; see also USEPA, “Consideration of Cumulative Impacts in EPA Review of NEPA Documents,” EPA 315-R-99-002 (May 1999) (“EPA reviewers should recommend that the proper spatial scope of the analysis include geographic areas that

Appendix A
A-31
sustain the resources of concern. Importantly, the geographical boundaries should not be extended to the point that the analysis becomes unwieldy and useless for decision-making.”), available at https://www.epa.gov/sites/production/files/2014-08/documents/cumulative.pdf. The DSEIS should compare the cumulative impacts of the proposed LSCS license renewal with the cumulative impacts of the reasonable alternatives. And the benefits of LSCS license renewal in meeting Illinois public policy goals for controlling GHG emissions should be discussed in comparison to the reasonable alternatives. See, e.g., Illinois Governor’s Office, Executive Order on Climate Change and Greenhouse Gas Reduction, 2006–11 (Oct. 5, 2006) (establishing a Climate Change Advisory Group and stating that “Illinois is a national leader in addressing climate change by…proposing an aggressive energy independence plan that includes strategies to reduce carbon emissions,…), available at http://www.illinois.gov/Government/ExecOrders/Documents/2006/execorder2006-11.pdf.
3. Similarly, Federal courts have interpreted NEPA to require a “useful analysis of the cumulative impacts of past, present, and future projects.” City of Carmel-by-the-Sea v. U.S. Dept. of Transp., 123 F.3d 1142, 1160 (9th Cir. 1997). This means that the EIS must analyze the combined effects of proposed actions in sufficient detail to be “useful to a decision maker in deciding whether, or how, to alter the program to lessen cumulative impacts.” Id. (quoting Natural Res. Def. Council v. Hodel, 865 F.2d 288, 299 (D.C. Cir. 1988)). The conclusion of MODERATE cumulative impacts without context is not useful for a decision maker or to the public.
4. As indicated in Exelon’s ER (Section 4.12), the NRC regulations governing the cumulative impacts analysis for license renewal are focused on the cumulative impacts of actions “occurring in the vicinity of the nuclear plant” and on “regional resource characteristics” (quoting 10 CFR 51.53(c)(3)(ii)(O) and 10 CFR Part 51, Subpart A, Appendix B, Table B–1). There is no regulatory requirement for the NRC to consider the cumulative impacts of GHG emissions on Global Climate Change. If the NRC proceeds to evaluate such impacts, however, it must do so in a manner that is useful to agency decision makers and informs the public. See Hodel, 865 F.2d at 299. To evaluate and report the findings of cumulative impacts on global climate change in the manner done in the DSEIS, without focusing on the net benefits of the proposed action and placing the impacts in the context of meeting public policy goals for controlling GHG emissions, would neither be useful to decision makers nor inform the public.
5. Other agencies take a different approach for dealing with the same topic. For example, the Federal Energy Regulatory Commission (FERC) very recently assessed the cumulative impacts on global climate change from a natural gas pipeline expansion project. See FERC, Southeast Market Pipelines Project, Final Environmental Impact Statement at 3–295 to 3–298 (Dec. 2015), available at http://elibrary.ferc.gov:0/idmws/file_list.asp?document_id=14409956. FERC stated that because natural gas emits less CO2 than other fuel sources, such as fuel oil or coal which could reasonably be the fuel of choice at electric generating stations if the pipeline was not extended, it anticipated that the project would “reduce current GHG emissions…” Emphasis added. Similarly, FERC noted that the overall lifecycle GHG emissions from natural gas plants are significantly lower than other fuel source alternatives (e.g., coal). Based on this comparison to alternatives, and focusing on the CEQ regulations to assess significance, FERC concluded that the gas pipeline project it evaluated “would not significantly contribute to cumulative global climate impacts.” Id. at

Appendix A
A-32
3–298; see also 40 CFR 1508.27 (explaining that the assessment of the significance of an environmental impact requires consideration of both context and intensity, including whether an action “is related to other actions” that could have cumulatively significant impacts).
FERC did not find it necessary or appropriate to reach a conclusion on the cumulative impacts of all projects worldwide on global climate change (including the incremental contribution of the new pipeline), as the DSEIS does for LSCS license renewal. Such a vague, broad and all-encompassing inquiry into projects related and unrelated to the proposed action is not informative to decision makers. FERC also did not assess the project as a contributor of GHGs despite the obvious fact that fossil-fuel-powered construction and inspection equipment—that would release GHGs—would be used for the project. FERC’s approach provides a relevant line of inquiry and formulation of the conclusion for decision makers and the public. See also Christopher, “Success by a Thousand Cuts: The Use of Environmental Impact Assessment in Addressing Climate Change,” Vt. J. of Envtl. L. 549, 594 (2008) (noting that EISs for wind farms often consider climate impacts by comparing a baseline alternative in which CO2 emitters continue operations with a zero emissions alternative offered by wind energy).
6. Courts have held that when a proposed action will lead to a net beneficial environmental impact in a particular area, then the environmental review need not address the cumulative impact of the proposed action in that particular area. This is because a cumulative impacts analysis and discussion in an EIS helps identify mitigating actions. See generally 40 CFR § 1508.25(b)(3) (scope includes mitigating actions). When a proposed action has a net beneficial effect in a particular area, however, there is no logical reason to modify that beneficial project or mitigate the beneficial impact, simply because other past, present, or reasonably foreseeable future projects in the area may have negative effects.
For example, in San Francisco Baykeeper v. U.S. Army Corps of Engineers, the court considered challenges to the environmental review of proposed dredging and seaport renovations. Baykeeper argued that the Corps’ NEPA reviews omitted a cumulative impacts discussion about the effect of the dredging and renovations on the introduction of invasive marine species. Baykeeper argued that the invasive species would be introduced to the bay through discharge of ballast water from ships, and that the dredging and renovations would increase the number of ships and, therefore, the volume of ballast water discharged. But smaller ships require more ballast water than larger, more stable ships. The Corps had concluded that the larger ships that would be able to visit the port after the dredging and renovations would, over time, replace the smaller, more numerous ships that required more ballast water. Accordingly, the Corps concluded that the proposed actions would reduce the cumulative volume of ballast water being discharged to the bay, and thereby have a beneficial effect on the risk of introducing invasive marine species transported in ballast water. See 219 F.Supp.2d 1001, 1008–14 (N.D.Cal. 2001). The court rejected Baykeeper’s arguments, holding that because the proposed action would have a beneficial effect on the risk of invasive species introduction, there was no obligation to discuss the cumulative impacts of invasive species in detail. See id. at 1013–14. In dicta, the court suggested that it would have rejected the challenge even if, during one of the transitional years of the renovation, there was an increase in ballast waste discharge. Id. at 1017 n.9; see also Defenders of Wildlife v. Babbit, 130 F.Supp.2d 121, 137 (D.D.C. 2001) (holding that because the “net effect” of the proposed actions on pronghorn species will be beneficial, there was no need for a

Appendix A
A-33
cumulative impacts analysis of other projects for this proposed action). The contribution of LSCS to Global Climate Change is similar to the port renovations considered in San Francisco Baykeeper: LSCS’s contribution has a net benefit to Global Climate Change when compared to reasonable alternatives. Accordingly, the NRC could prepare the SEIS without an analysis of cumulative impacts.
7. Exelon provided similar comments on the DSEISs for Braidwood. See NUREG–1437, Generic Environmental Impact Statement for License Renewal of Nuclear Plants, Supplement 55, Regarding Braidwood Station, Units 1 & 2 at A–92 to A–93 (Nov. 2015). The NRC staff did not accept those comments, primarily because, citing 40 CFR 1508.7, the NRC staff concluded that the relevant inquiry focused on the “cumulative impact of GHG emissions resulting from continued operation of Braidwood on global climate change when added to the aggregate effects of other past, present, and reasonably foreseeable future actions…” Id. at A–93. Exelon does not agree with the manner in which the staff has applied that regulatory provision. As previously noted, the incremental impact of additional GHG emissions from continued operation is de minimis, and as stated in the LSCS DSEIS and in the FSEIS for Braidwood, climate change is projected to occur “with or without” continued operation. This is not a case where the proposed project has a small but noticeable contribution to a larger impact. Quite the opposite. Like the proposed port renovations in San Francisco Baykeeper, which would lead to a reduction in the risk of invasive species impacts, and the S.E. Market pipeline analyzed by FERC, the most notable environmental result of LCSC’s operation of another 20 years would be millions of tons of avoided emissions (i.e., a beneficial impact). See 219 F.Supp.2d at 1013–14. The analysis used and conclusions reached in the DSEIS disregard this critical fact and, as such, fail to be useful to decision makers or inform the public.
Commentators have recognized that “even the most miniscule emission becomes significant when added to the cumulative impact of global emissions.” See Wishnie, Student Article, “EPA for a New Century: Climate Change & the Reform of the National Environmental Policy Act,” 16 N.Y.U. Envtl. L.J. 628, 646 (2008). But without a reasonable process, the cumulative impact analysis would create an “unworkable burden for agencies” as they consider smaller and smaller impacts. Id. Therefore, the analysis must focus on the relevant question of what the environmental impacts of the proposed action will be, in comparison to alternatives and in the context of public policy goals for controlling GHG emissions. See Gold and Imwalle, “Accounting for Climate Change in Environmental Review Documents,” Trends, Newsletter of the ABA Section of Environment, Energy, & Resources, at 8 (Jan. 2008).
Exelon provides some suggestions for text edits in the comments that follow. A holistic revision to the DSEIS’ discussion about cumulative impacts on Global Climate Change is, however, required. Response: The commenter recommends that, for SEIS Section 4.16.11, “Global Climate Change,” the NRC staff (1) should not apply impact levels (SMALL, MODERATE, or LARGE), (2) should discuss the net beneficial effect of the proposed action on global climate change and compare it to the Alternatives, (3) should include a frame of reference for GHG emissions, and (4) should provide an ROI for the cumulative analysis with an appropriate scope. The commenter provided examples on how other agencies have assessed cumulative impacts on global climate change in environmental review documents. Alternatively, the commenter recommends that, if Section 4.16.11 of the SEIS is not revised to discuss the items noted, the SEIS should not discuss cumulative impacts on global climate change and delete this section

Appendix A
A-34
because the commenter believes it does not accurately inform the public on the benefits of LSCS operation on climate change.
The NRC staff does not agree with the commenter that Section 4.16.11 of the SEIS should be deleted. On June 20, 2013, the NRC published a final rule (78 FR 37282) revising its environmental protection regulation, 10 CFR Part 51, “Environmental Protection Regulations for Domestic Licensing and Related Regulatory Functions.” The final rule updates the potential environmental impacts associated with the renewal of an operating license for a nuclear power reactor for an additional 20 years. In this rule, the NRC states that it would include, within every license renewal SEIS, a “plant-specific analysis of any impacts caused by GHG emissions over the course of the license renewal term as well as any impacts caused by potential climate change upon the affected resources.” The NRC staff considers the scope of impacts from GHG emissions to be inclusive of direct, indirect, and cumulative impacts. This commitment was made in the 2013 final rule and affirmed by the Commission consistent with the Commission’s previous direction in CLI-09-21 (November 3, 2009).
The commenter further requests that the NRC staff not apply impact levels to the Global Climate Change section because there is no requirement to apply impact levels to all resource areas. In doing so, the NRC is not being consistent with CEQ regulations, 40 CFR 1500.1(c) and 40 CFR 1500.2. The commenter identifies that there are resource areas for which impact levels are not applied (Special Status Species and Habitats, Historic and Cultural Resources, Environmental Justice, or cumulative Socioeconomic or Environmental Justice impacts); therefore, Global Climate Change should take such an alternative approach. The NRC staff disagrees with the commenter’s characterization. The impact significance levels assigned for the resource areas that the commenter has identified are reported in accordance with statutory findings or policy determinations rather than SMALL, MODERATE, or LARGE. Use of the latter adjectival significance levels would be superfluous and inappropriate for these resources areas. For instance, as explained in Table ES–1, the NRC staff reports the effects from continued operation of LSCS during the license renewal period for special status species and habitats in terms of the findings under the Endangered Species Act of 1973, as amended (i.e., no effect, are not likely to adversely affect, are likely to adversely affect, or are likely to jeopardize the listed species or adversely modify the designated critical habitat of Federally listed species populations or their critical habitat). Similarly, for Historic and Cultural Resources, the NRC reports the effects from continued operation of LSCS during the license renewal period in terms of the criteria under the National Historic Preservation Act of 1966 for adverse effects on historic properties (i.e., no historic properties are present, historic properties are present but are not adversely affected, or there is an adverse effect). As discussed in the 2013 final rule and in the 2013 license renewal GEIS, NRC’s Policy Statement on the Treatment of Environmental Justice Matters in NRC Regulatory and Licensing Actions (69 FR 52040; August 24, 2004) requires a determination of whether human health and environmental effects of continued operations during the license renewal term and refurbishment associated with license renewal on minority populations and low-income populations would be disproportionately high and adverse. Absent a statutory or policy determination, the NRC staff believes it is appropriate to use the NRC’s established levels of significance for potential impacts as described in Section 1.4 of the SEIS for Global Climate Change. As discussed in the 2013 license renewal GEIS, the NRC’s standard of significance for impacts uses the CEQ terminology for “significantly” (40 CFR 1508.27), which requires consideration of both “context” and “intensity.” The NRC staff does not agree with the commenter that the use of the three significance levels (SMALL, MODERATE, or LARGE) as applied to the cumulative impacts on Global Climate Change are inconsistent with CEQ’s regulations. Cumulative impacts can result from individually minor, but collectively significant, actions taking place over a period time.
Appendix A
A-35
The Global Climate Change discussion does provide an ROI. The section identifies that “[d]ue to the global significance of GHG emissions, this global climate change cumulative impacts analysis considers the entire Earth’s atmosphere and therefore global emissions (as opposed to county, state, or national emissions).” As discussed in Section 4.16.11, GHG emissions are transported and become well mixed throughout the Earth’s atmosphere, their impact on climate is long lasting as a result of their long atmospheric lifetime, and the extent and nature of climate change is not specific to where GHGs are emitted. Therefore, given the atmospheric lifetime of GHGs, atmospheric mixing, and the global implications of GHG emissions, it would be inappropriate to arbitrarily set a smaller ROI (i.e., county or state) as a physical boundary on GHG emissions.
The NRC staff agrees with the commenter that Section 4.16.11 of the LSCS should discuss the net beneficial effect of the proposed action when compared to the Alternatives. This discussion was added to Section 4.16.11 and the conclusion was also revised accordingly. The NRC staff also agrees with the commenter that a frame of reference should be provided. A discussion on Illinois GHG reduction goals has been included in Section 4.16.11.
Comment L-014: In Section 4.16.11 on page 4–129 revise lines 8 and 9 as follows:
“… addresses the impact of GHG emissions resulting from worldwide past, present, and reasonably foreseeable human activities continued operation of LSCS on global climate change when added to the aggregate effects of other past, present, and reasonably foreseeable future actions.” As it appears in the DSEIS, the text implies that operation of LSCS provides some substantial contribution to the GHG emissions discussed in section 4.16.11, but as shown in Tables 4–22 and 4–23, it does not. As a further example, none of the 94.1 MMT of CO2 emissions reported in Illinois from electricity generation in reference EIA 2015a, which is cited by the NRC Staff in the DSEIS, came from nuclear power plants. Response: The commenter requests a revision to a statement in Section 4.16.11 that it believes inaccurately implies that LSCS operations have a substantial contribution to GHG emissions. The NRC staff does not agree with the proposed revision or with the comment that the current statement implies that LSCS substantially contributes to GHG emissions. The statement as it is currently phrased by the NRC staff is wholly consistent with the concept of cumulative impacts as defined in the CEQ’s regulations for implementing NEPA: “‘Cumulative impact’ is the impact on the environment which results from the incremental impact of the action when added to other past, present, and reasonably foreseeable future actions regardless of what agency (federal or non-federal) or person undertakes such other actions” (40 CFR 1508.7). This definition has also been incorporated by reference into the NRC’s regulations for implementing NEPA in 10 CFR Part 51. Further, cumulative impacts may result when the environmental effects associated with the proposed action are overlaid on, or added to, temporary or permanent effects associated with other past, present, and reasonably foreseeable actions. Cumulative impacts can result from individually minor, but collectively significant, actions taking place over a period of time. Regardless, Section 4.16.11 states that the incremental impact from the contribution of GHG emissions from continued operation of LSCS on climate change would be SMALL and minor when compared to global emissions. No change was made to the SEIS in response to this comment.
Comment L-015: In Section 4.16.11 on page 4–130, revise the text in line 2 as follows: “… performance rate standards for non-nuclear power plants that should be achieved by 2030. Future actions … “
Appendix A
A-36
Response: The commenter requests that the subject statement clarify that performance standards are applicable to non-nuclear power plants. The NRC staff agrees with the comment and revised the statement in Section 4.16.11 to state “performance rate standards for fossil fuel-fired power plants” to use the language specifically contained in the Clean Power Plan.
Comment L-016: In Section 4.16.11 on page 4–130, revise the text in line 5 as follows: “…non-nuclear electricity generation, industrial processes, and agriculture. As presented in Section 4.15.3, …” Response: The commenter requests that the subject statement identify that GHG emissions from electricity generation sources account for non-nuclear electricity generation sources. The NRC staff agrees that revising the subject statement would clarify the electricity generation sources. The statement has been revised to identify the specific sources and to state: “EPA’s U.S. inventory of GHG emissions illustrates the diversity of GHG sources, such as electricity generation (including fossil fuel combustion and incineration of waste), industrial processes, and agriculture.”
Comment L-017: In Section 4.16.11 on page 4–130, revise the text in line 6 as follows: “…direct GHG emissions from combustion sources resulting from ancillary operations at LSCS range from …” Response: The commenter requests that the word “ancillary” be added to the subject statement. The NRC staff agrees with the comment and has made this change.
Comment L-018: In Section 4.16.11 on page 4–130, revise the text in line 7 as follows: “…and total annual emissions range from 34,228 to 39,99738,623 MT CO2eq. In …” This change is necessary because there are errors in Table 4–21 (p. 4–105), from which the information in line 7 on p. 4–130 was taken. The value in Table 4–21 for the 2011 LSCS GHG emissions from purchased electricity should be 33,493 MT CO2e instead of 36,066 (see reference Exelon 2015d). As a result, the associated LSCS 2011 total GHG emissions should be 37,424 MT CO2e. After the correction is made, the 2014 total of 38,623 MT CO2e becomes the upper bound for the range of potential annual GHG emissions at LSCS. Therefore, 38,623 MT CO2e per year should be used in the discussion in Section 4.16.11 on p. 4–130. Response: The commenter requests that the range of GHG emissions from LSCS operation provided in Section 4.16.11 of the SEIS be revised. The NRC staff has deleted total GHG emissions from the subject statement as explained in response to Comment E-002; therefore, this revision is no longer necessary.
Comment L-019: In Section 4.16.11 on page 4–130, revise line 10 as follows: “…level, GHG emissions from LSCS are minorminiscule relative to these inventories; this is evident, as …” Response: The commenter requests that the subject statement be revised to state “miniscule” rather than “minor” in comparing LSCS’s GHG contributions to other inventories. The NRC staff disagrees that the change is necessary because the statement in question references Table 4–23 where a quantitative comparison can be made. No change was made to the SEIS in response to this comment.
Comment L-020: In Section 4.16.11 on page 4–130, revise the sentence that begins in line 11 as follows: “The emissions impact of a single source on climate change—both additions of GHGs and avoided GHGs—requires …” Response: The commenter requests that the subject statement be revised to state that emission impacts include GHG increases and avoided GHGs. The NRC staff does not agree

Appendix A
A-37
with the comment and disagrees that the change is necessary because climate models use net GHG concentration scenarios. No change was made to the SEIS in response to this comment.
Comment L-021: In Section 4.16.11 on page 4–130, Revise the sentence that ends in line 14 as follows: “…the year 2030) is dependent on past GHG emissions and, necessarily, avoided emissions Response: The commenter requests that the subject statement be revised to include avoided emissions. The NRC staff does not agree with the comment and disagrees that the change is necessary because climate models use net GHG concentrations. No change was made to the SEIS in response to this comment.
Comment L-022: In Section 4.16.11 on page 4–130, revise the text in line 15 as follows: “ … occur with or without the present and future GHG emissions from LSCS and the avoided GHG emissions that LSCS provides. In fact, as shown in Table 4–22, in comparison to replacement power scenarios, other than new nuclear, continued operation of LSCS would lead to the avoidance of GHG emissions that are far larger (by orders of magnitude) than LSCS’s GHG emissions. The NRC staff concludes …” Response: The commenter requests that the subject statement be revised. The NRC staff does not agree with the comment that the identified statement be revised to discuss avoided emissions. However, a discussion on avoided GHG emissions has been added to Section 4.16.11 preceding the paragraph of concern to the commenter.
Comment L-023: In Section 4.16.11 on page 4–130, revise the text in line 25 as follows: “Therefore, the cumulative impact of GHG emissions on climate change from all sources throughout the world is noticeable but not …” Response: The commenter requests that the subject statement be revised and provided recommended changes. The NRC staff does not agree with the recommended changes; however, it revised the subject statement to clarify global GHG emissions from past, present, and reasonably foreseeable future actions. Therefore, the cumulative impact of global GHG emissions from past, present, and reasonably foreseeable future actions on climate change is noticeable, but not destabilizing.
Comment L-024: In Section 4.16.11 on page 4–130, Revise the text in lines 26 and 27 as follows: “ … destabilizing. The NRC staff concludes that the cumulative impacts of GHG emissions from past, present, and reasonably foreseeable future actions are MODERATE. However, asAs …” Response: The commenter requests that the cumulative impact conclusion for Global Climate Change be deleted. The NRC staff does not agree with the comment. Section 4.16.11 states that due to the global significance of GHG emissions, the global climate change cumulative impacts analysis considers the entire Earth’s atmosphere and, therefore, global emissions (as opposed to county, state, or national emissions). Further, Section 4.16.11 of the SEIS presents scientific research to support the MODERATE impact level and conclusion. Climate change research and climate models indicate that short-term climate change is projected to occur with or without present and future GHG emissions. In other words, even if GHG emissions were to be completely eliminated, the Earth’s average surface temperature will continue to increase, and climate-related changes will persist over the next few decades. The magnitude of the continued increase in GHG emission rates will determine the amount of additional future warming and long-term (beyond 2030) climate change. Because climate change and climate-related changes have been observed on a global level (Section 4.15.13.10 of the SEIS) and because climate models indicate that future climate change will continue, the cumulative
Appendix A
A-38
impact of GHG emissions on global climate is MODERATE (i.e., the cumulative impact of GHG emissions on climate change is noticeable, but not destabilizing).
Comment L-025: In Section 4.16.11 on page 4–130, Revise the text in line 29 as follows: “… LSCS, when compared to global emissions, are minor. A significance level characterization for such emissions during the LSCS license renewal term, however, is not meaningful to agency decision makers because cumulative impacts of GHG emissions on global climate change will take place with or without continued operation of LSCS, and because continued operation of LSCS would have a net beneficial effect on GHG emissions and thus on overall cumulative global climate change. Therefore, the staff has not assigned a significance level characterization to cumulative Global Climate Change impacts…” Response: The commenter requests that the cumulative impact conclusion for Global Climate Change include a discussion on why a significance impact level is not appropriate for cumulative Global Climate Change impacts. The NRC staff does not agree with the comment. As provided in response to Comment L-024, Section 4.16.11 of the SEIS presents scientific research to support the MODERATE impact level and conclusion. No change was made to the SEIS in response to this comment.
Comment L-026: In Section 4.16.11 on page 4–130, in footnote (d) of Table 4–23, the DSEIS cites the wrong reference for the LSCS GHG emissions. The LSCS GHG emissions data (presented in Table 4–21 of the DSEIS) was provided in Exelon’s response to RAI MA-07 (ML15195A350), which is reference “Exelon 2015d” in section 4.18. Response: The commenter requests that the reference cited in footnote (d) of Table 4–23 be corrected. Footnote (d) in Table 4–23 has been revised to identify that the source for GHG emissions is Exelon 2015d in accordance with the references in Section 4.17 of the SEIS.
Comment L-093: In Section 4.16.11 on page 4–130 in Table 4–23, correct footnote (d) as follows: (d) Emissions rounded from and obtained from Exelon 2015c2015d. This correction is needed because the LSCS GHG emissions data (presented in Table 4–21 of the DSEIS) was provided to the NRC in Exelon’s response to RAI MA-07 (ADAMS Accession No. ML15195A350), which is listed as “Exelon 2015d” in DSEIS Section 4.18, References. Response: The commenter requests that the reference cited in footnote (d) of Table 4–23 be corrected. Footnote (d) in Table 4–23 has been revised to identify that the source for GHG emissions is Exelon 2015d in accordance with the references in Section 4.17 of the SEIS.
A.3.14 Waste Management
Comment M-006: You can’t say that there are no impacts from the storage of high-level waste at nuclear power plants around the country until a study of storage impacts is completed. Response: The comment concerns the environmental impacts of the storage of spent fuel at nuclear power plants. The NRC’s regulations in 10 CFR Part 20, Part 50, and Part 72 require that spent nuclear fuel be stored and maintained in a safe and secure manner while a nuclear power plant is operating and after the plant operating license expires. Power reactors must limit radiation doses to workers and the public, including at spent fuel pools and cask storage facilities. The facilities are under constant monitoring and surveillance. The spent fuel remains under the direct control of the licensee and the regulatory oversight of the NRC until its ultimate disposition.
Exelon is required to safely handle, process, and store spent fuel in accordance with NRC regulations. Spent fuel is stored on site in a combination of two types of NRC-approved methods: storage in a spent fuel pool and in dry casks. Both of these methods maintain the

Appendix A
A-39
spent fuel in a safe configuration. Additionally, to ensure the long-term safety of spent fuel, Exelon is required by 10 CFR 50.54(bb) to maintain adequate funding for the safe long-term storage of spent fuel on site.
Section 4.11.1.2, “Onsite Storage of Spent Nuclear Fuel,” of the GEIS (NRC 2013b) discusses the impacts from the onsite storage of spent fuel at nuclear power plant sites during the license renewal term. As discussed in Section 4.13.1 of this SEIS, the NRC staff did not identify any new and significant information with respect to spent fuel storage during its review of Exelon’s ER, the site audit, or the scoping process. As such, there are no impacts expected for spent fuel storage during the period of extended operation beyond those discussed in the GEIS (NRC 2013b), which concludes that the impacts are SMALL.
Regarding the long-term storage of spent nuclear fuel beyond the licensed life for operation of a reactor, on August 26, 2014, the Commission approved the Continued Storage Rule at 10 CFR 51.23 and associated NUREG–2157, Generic Environmental Impact Statement for Continued Storage of Spent Nuclear Fuel (Continued Storage GEIS) (NRC 2014). The Continued Storage GEIS provides the technical basis for the revised 10 CFR 51.23. The Continued Storage Rule adopts the generic impact determinations made in NUREG–2157 and codifies the NRC’s generic determinations regarding the environmental impacts of continued storage of spent nuclear fuel beyond a reactor’s operating license (i.e., those impacts that could occur as a result of the storage of spent nuclear fuel at at-reactor or away-from-reactor sites after a reactor’s licensed operational life and until a permanent repository becomes available). In accordance with 10 CFR 51.23, the impact determinations in NUREG–2157 regarding continued storage are deemed incorporated into the SEIS for LSCS license renewal. Therefore, the environmental impacts of the storage of spent fuel at nuclear power plants have been evaluated and, thus, this comment did not result in any changes to the SEIS.
A.3.15 SAMA
Comment L-089: In Section 4.11.1.2 on page 4–78 in the list of SAMA evaluation components provided in the 2nd full paragraph under the heading “Overview of SAMA Process,” insert a new component between the existing items (2) and (3), and renumber the list, as follows: “(3) Exelon screened out SAMA candidates that are not applicable to the LSCS plant design or are of low benefit in boiling water reactors (BWRs) such as LSCS, as well as candidates that have already been implemented at LSCS or whose benefits have been achieved at LSCS using other means.
(3)(4) Exelon estimated the costs of implementing the unscreened SAMA candidates, and those whose estimated implementation cost exceeded the maximum possible averted cost-risk were also screened out.
(5) Exelon estimated how much each remaining unscreened SAMA could reduce risk. Referred to as potential benefits of implementing each SAMA, those estimates were developed in terms of dollars in accordance with NRC guidance for performing regulatory analyses. The costs of implementing the candidate SAMAs were also estimated Sensitivity analyses were performed by Exelon to quantify effects on the SAMA evaluation. (4) Exelon compared the implementation cost andwith the benefit offor each remaining unscreened SAMA candidate to determine whether it was potentially cost beneficial (the benefits of the SAMA exceeded its cost). Sensitivity analyses were then performed by Exelon to quantify effects on the cost-benefit evaluation.”
This correction is needed because, as written, item (4) states that “Exelon compared the cost and benefit of each remaining SAMA to determine…” (emphasis added), but there is nothing in

Appendix A
A-40
the list that describes the early screening steps, which cause there to be such “remaining” SAMAs. Response: The commenter requests that the SAMA methodology be corrected. The change is consistent with SAMA guidance and has been changed as requested.
Comment L-090: In Section 4.11.1.2, both Table 4–14 on page 4–79 and Table F–1 on page F–3 contain a row indicating that “Loss of Feedwater” contributes 1.1E-8/yr to the CDF. The entry in each table should be replaced by 1.2E-7/yr. See Table F.2–2 in Appendix F to the LSCS ER. Response: The commenter requests that values in the tables be made consistent. The tables were made consistent as requested. The percent change in core damage frequency (CDF) was negligible, and the staff agrees with the comment.
Comment L-091: In Section 4.11.1.2, on page 4–83 in the 2nd paragraph, correct the text as follows: “… Table 4–16 summarizes the assumptions used to estimate the risk reduction for each evaluatedpotentially cost-beneficial SAMA, the estimated risk reduction in terms of CDF percent reduction, population dose, offsite economic cost, and the estimated total benefit (present value) of the averted risk…” This correction is needed because Table 4–16 in the DSEIS only addresses the potentially cost beneficial SAMAs. Appendix F in the DSEIS contains a table that includes all of the evaluated SAMAs. Response: The commenter requests that the statement regarding the reference to Table 4–16 be corrected. The NRC staff agrees with the comment and has revised the text as suggested.
Comment L-094: In Appendix F on page F–1 line 16, as is stated in Section 4.11.1.2 of the DSEIS (p. 4–82), the number of SAMA candidates initially identified for LSCS is 26 rather than 27. Response: The NRC staff agrees with the comment and revised the text as suggested.
Comment L-095: As documented in section 4.11.1.2, page 4–82, 26 SAMAs were originally identified and 2 were originally screened on cost. As was documented in RAI responses (ADAMS Accession No. ML15149A370), one of these 2 SAMAs was subsequently determined to not be screened on cost in Phase 1 due to modeling corrections. Response: The NRC staff agrees with this comment and revised the text appropriately.
Comment L-096: In Appendix F on page F–6, line 15 correct the text as follows: “… open supporting requirements, threefour are related to documentation and three have a relatively …” This change is needed because DA-C10 is a documentation issue. Response: The NRC staff agrees with the comment and revised the text as suggested. DA-C10 is a documentation issue.
Comment L-097: In Appendix F on page F–33 in Table F–6 correct the entry in the column labeled “Baseline (Internal + External),” and row labeled “6 – CREATE ECCS SUCTION STRAINER BACKFLUSH CAPABILITY WITH RHRSW” as follows:
Individual SAMA Assumption Baseline (Internal + External) 6 – CREATE ECCS SUCTION’’’ $88K $87K
Response: The NRC staff agrees with the comment and revised the text as suggested.

Appendix A
A-41
Comment L-098: In Appendix F on page F–34 in Table F–6, the modeling description for SAMA 11 provided in the column labeled “Individual SAMA and Assumption” is incorrect. The text appears to be the same as for SAMA 8, and it should be replaced with text appropriate for SAMA 11. Response: The NRC staff agrees with the comment and revised the text as provided for SAMA 11 in the ER.
Comment L-099: In Appendix G on page G–5 in Table G–2, the column labeled “Source” cites “Exelon 2015a, 2015b” in two rows—the row labeled “Dose rate at 1 m from vehicle, mrem/hr” and the row labeled “Packaging dimensions, m.” However, Section G.5, References (p. G–13), contains only a single “Exelon 2015” entry (Exelon Generation’s response to RAI TR-09, ML15240A002). Accordingly, reference information for “Exelon 2015b” should be added in Section G.5. Response: This comment notes discrepancies with the references cited in Appendix G. The NRC staff agrees with this comment and has updated the references and the text and corresponding tables in Appendix G to reflect the proper citations.
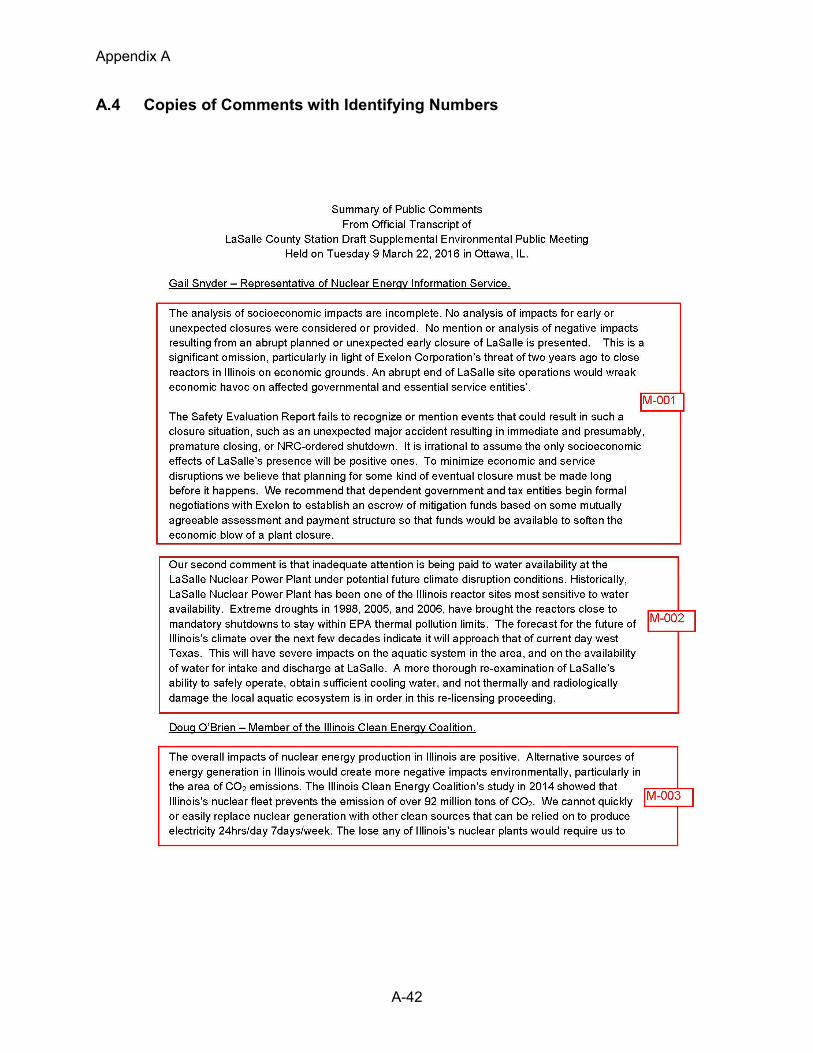
Appendix A
A-42
A.4 Copies of Comments with Identifying Numbers
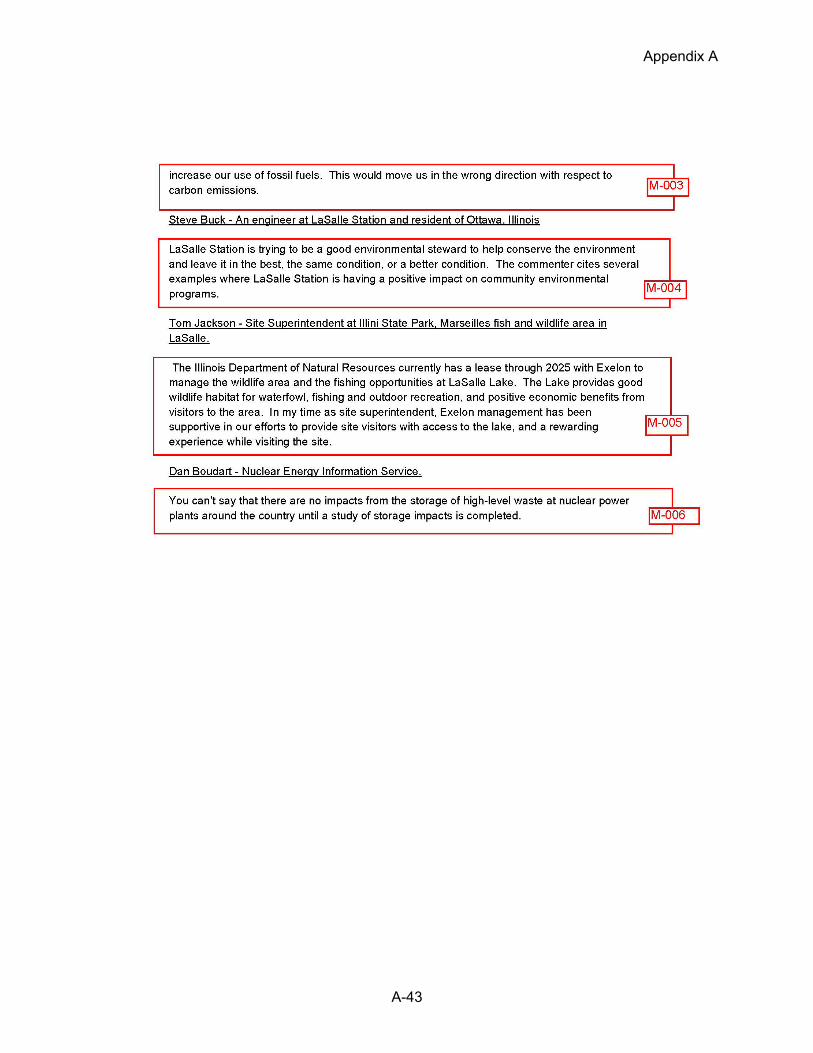
Appendix A
A-43

Appendix A
A-44

Appendix A
A-45

Appendix A
A-46

Appendix A
A-47
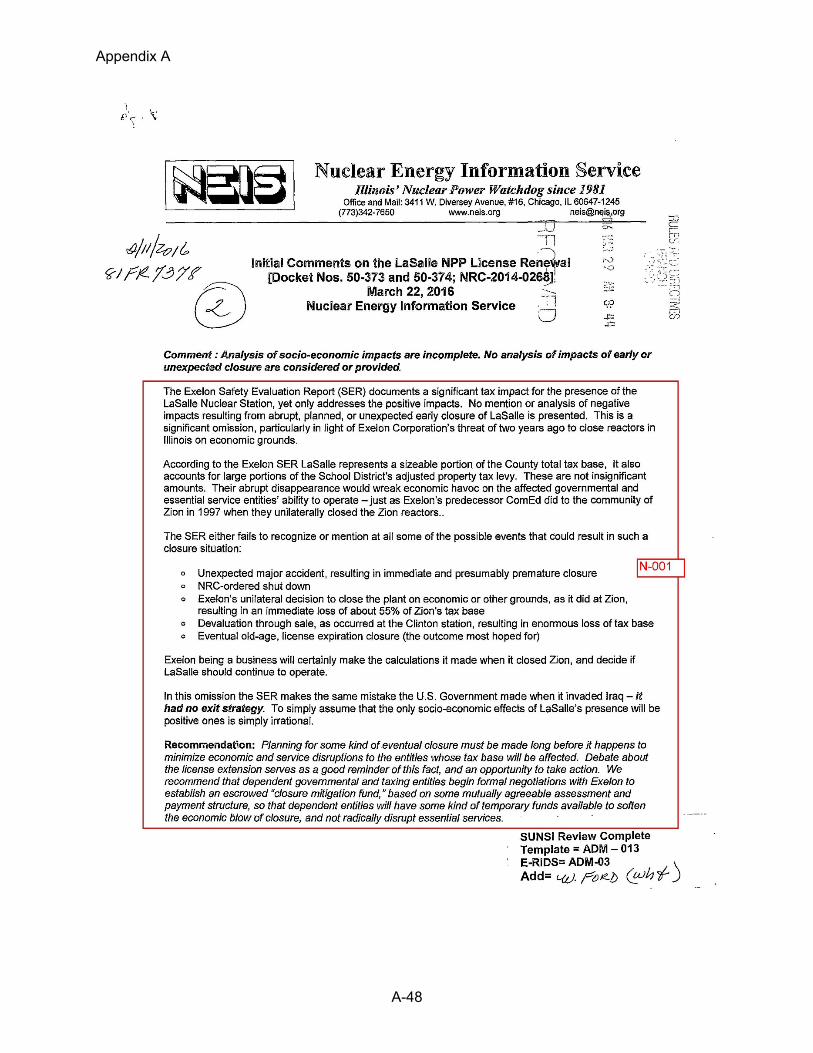
Appendix A
A-48
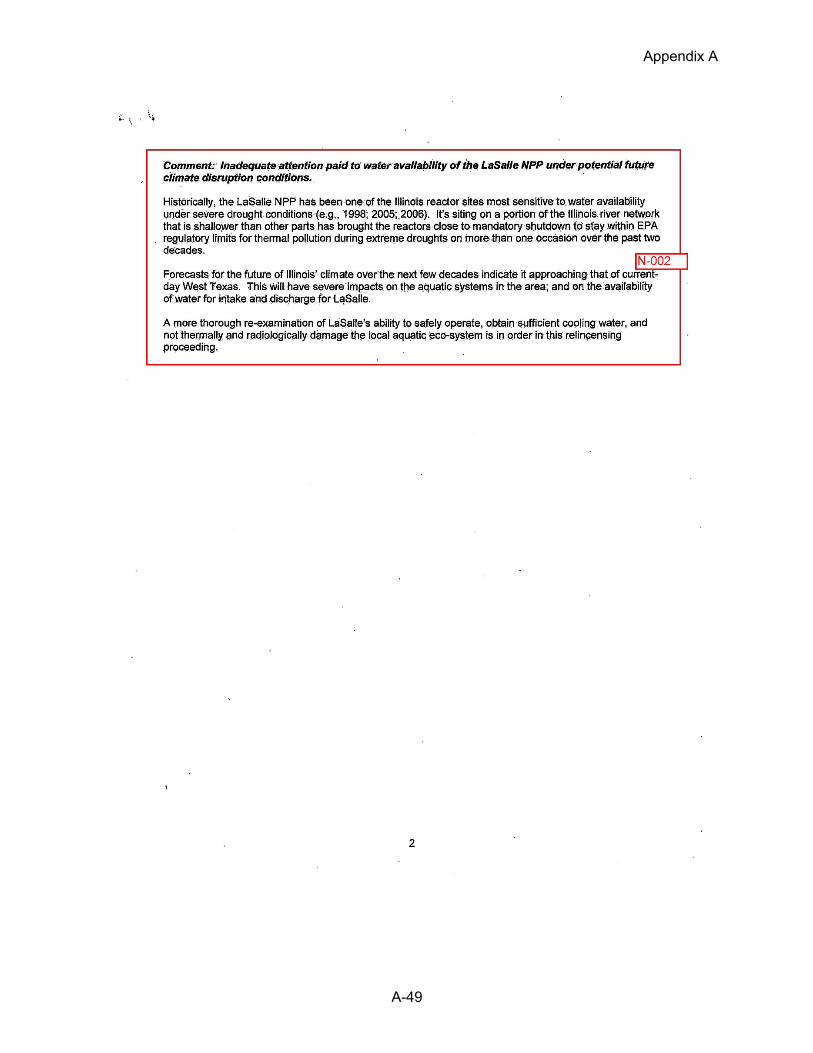
Appendix A
A-49

Appendix A
A-50

Appendix A
A-51

Appendix A
A-52

Appendix A
A-53

Appendix A
A-54

Appendix A
A-55

Appendix A
A-56

Appendix A
A-57
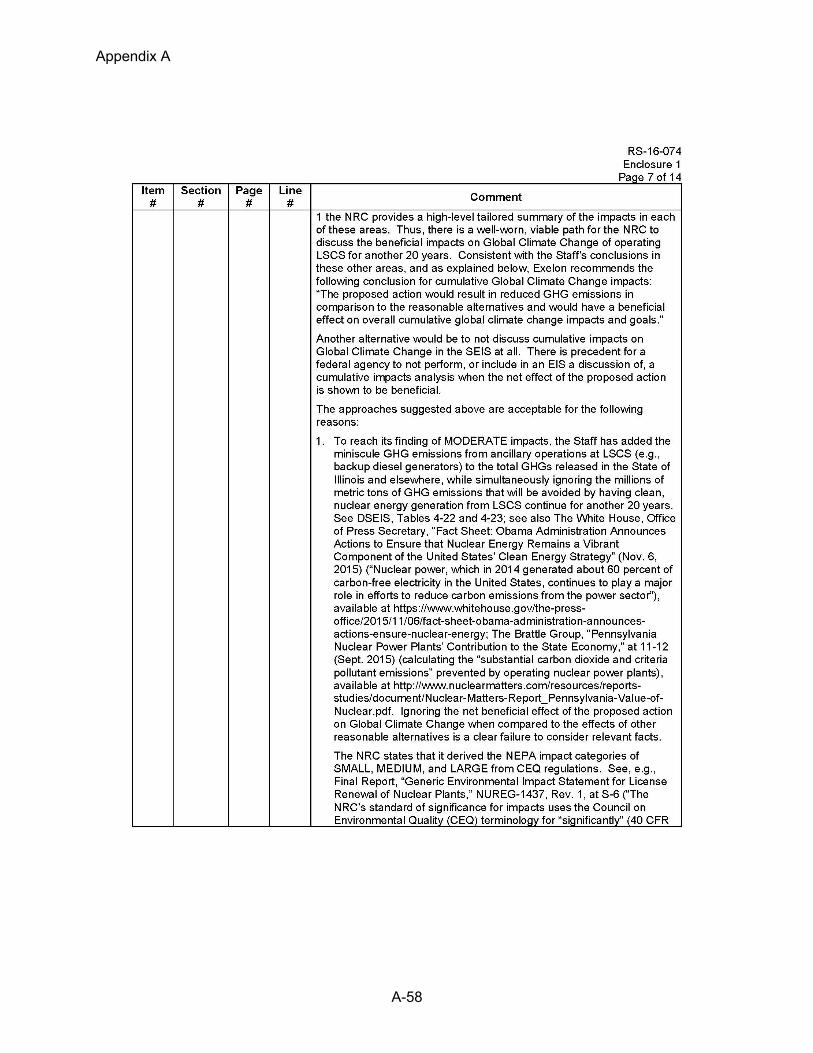
Appendix A
A-58

Appendix A
A-59

Appendix A
A-60
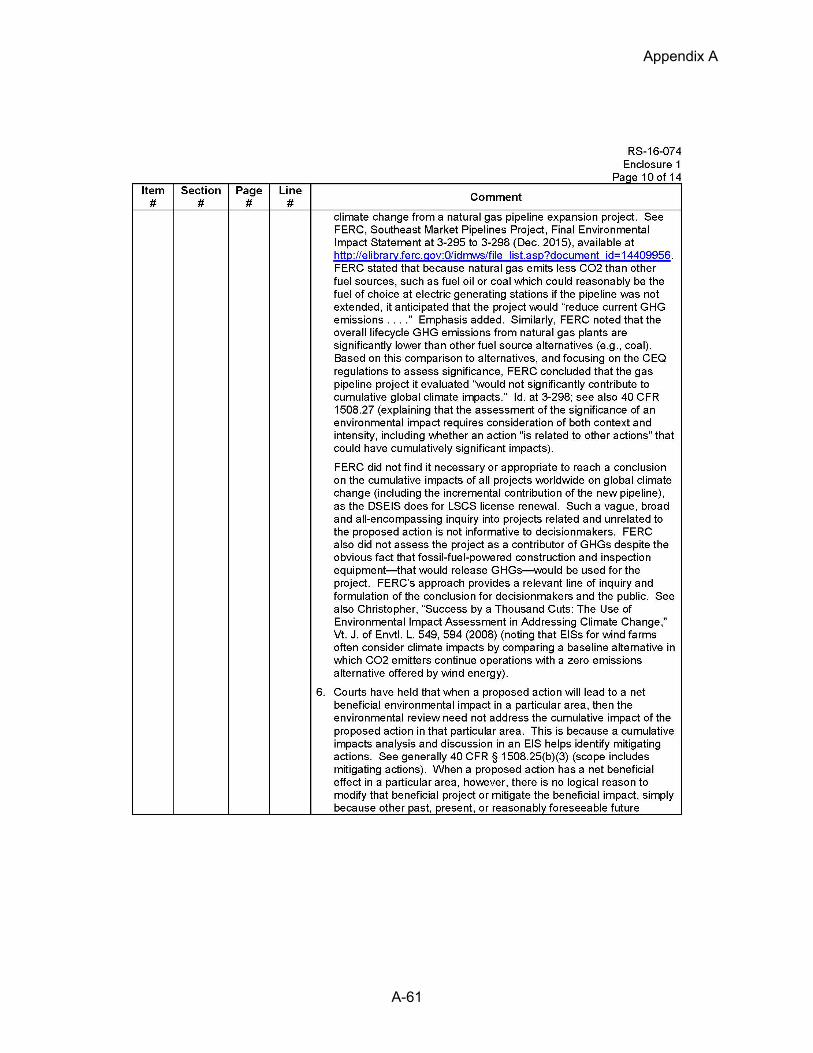
Appendix A
A-61

Appendix A
A-62

Appendix A
A-63

Appendix A
A-64

Appendix A
A-65

Appendix A
A-66
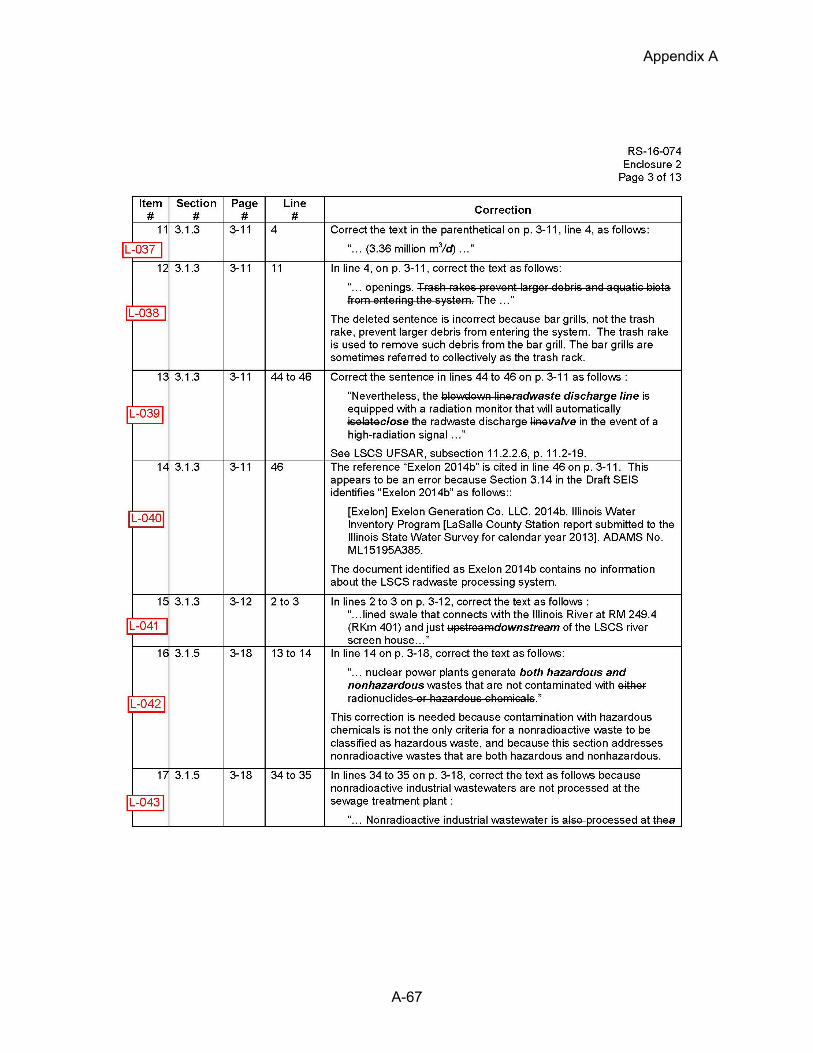
Appendix A
A-67

Appendix A
A-68
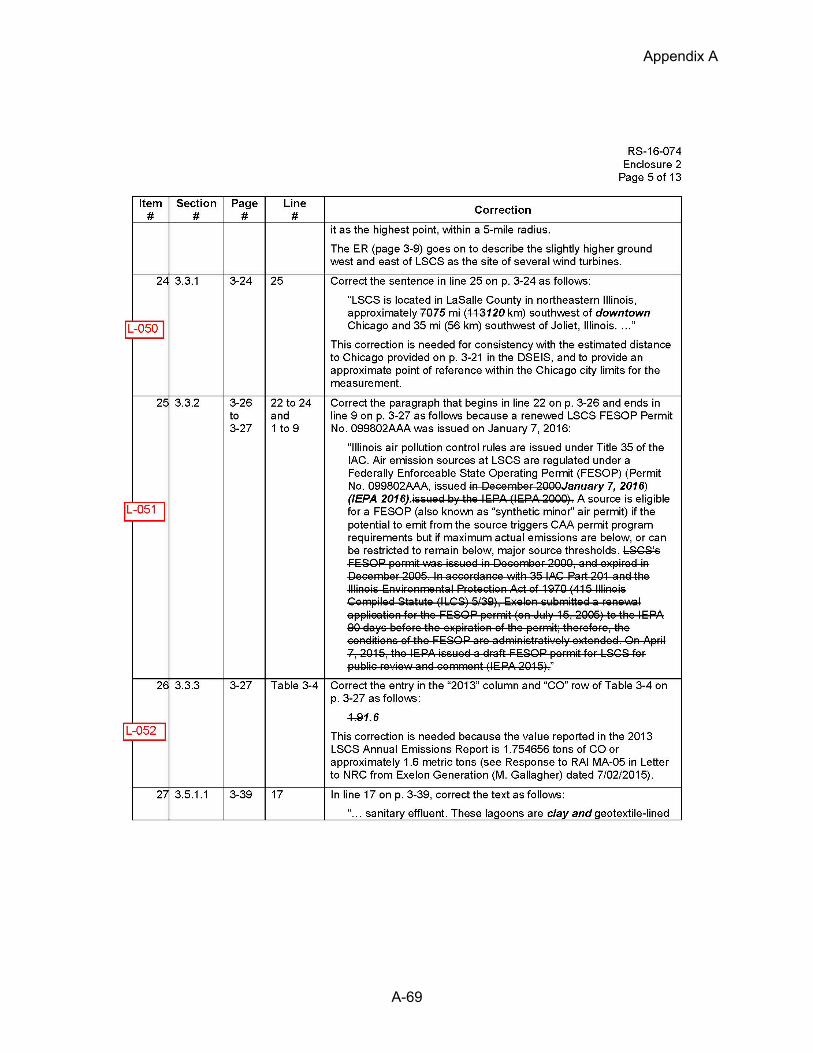
Appendix A
A-69

Appendix A
A-70

Appendix A
A-71

Appendix A
A-72

Appendix A
A-73

Appendix A
A-74

Appendix A
A-75
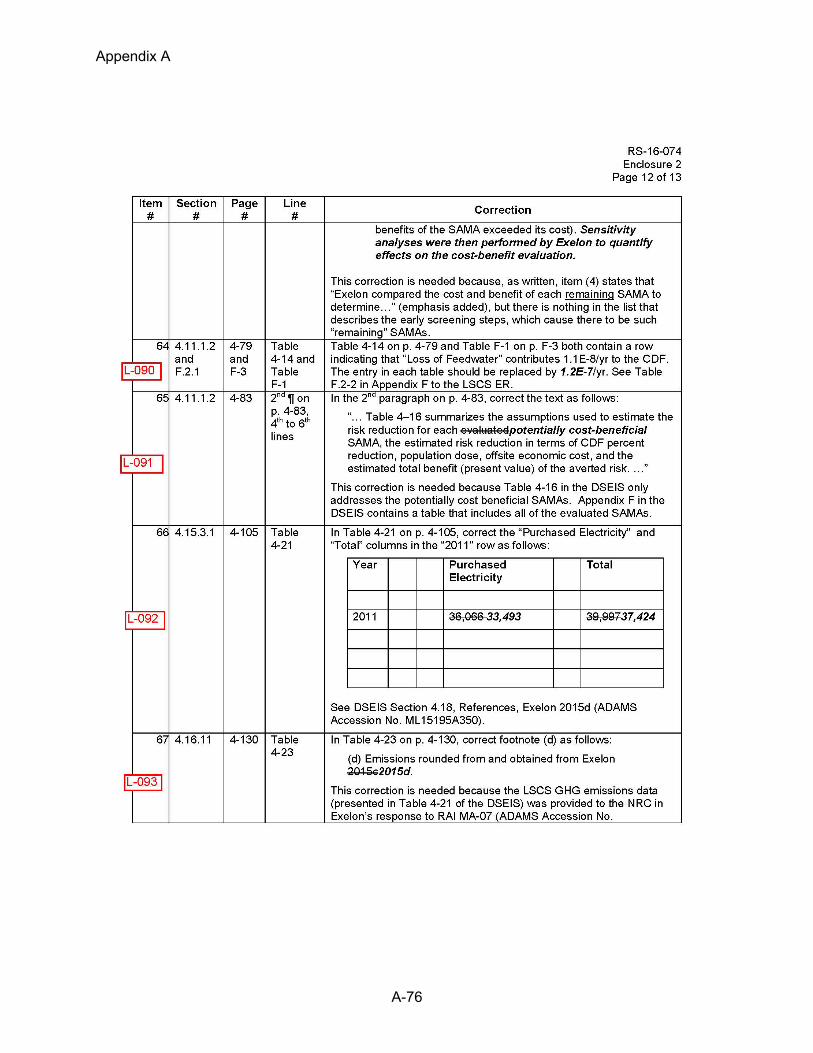
Appendix A
A-76

Appendix A
A-77

Appendix A
A-78

Appendix A
A-79
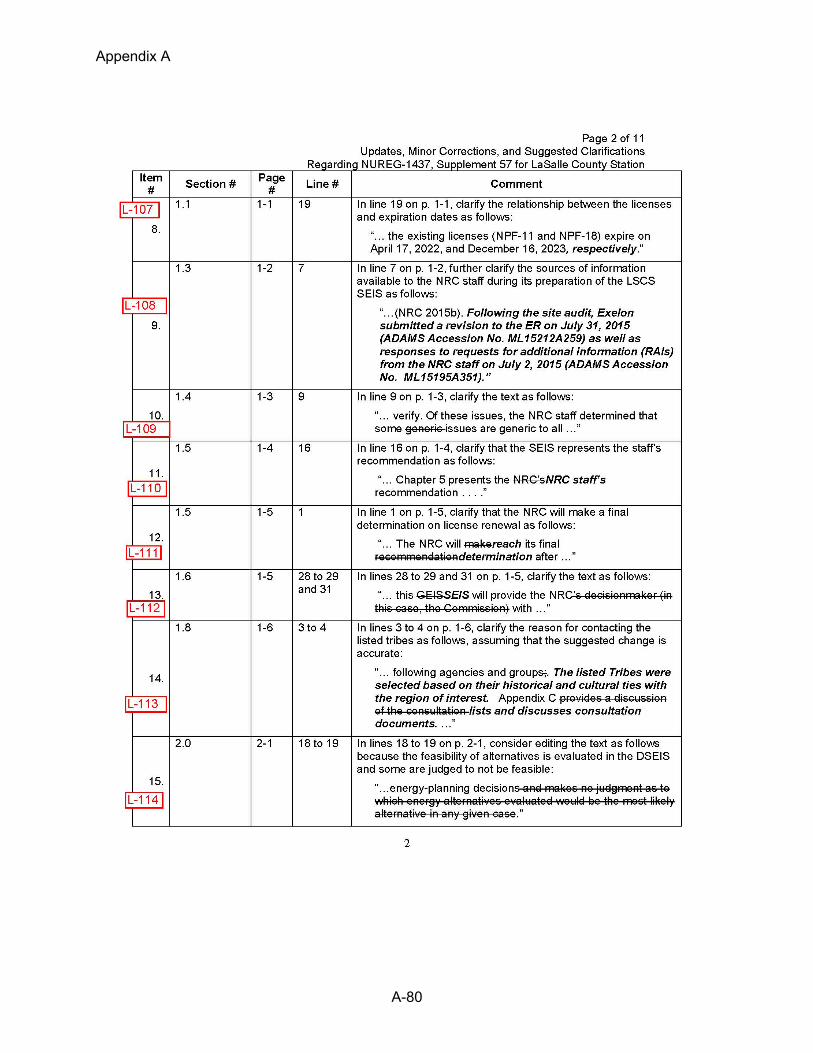
Appendix A
A-80

Appendix A
A-81
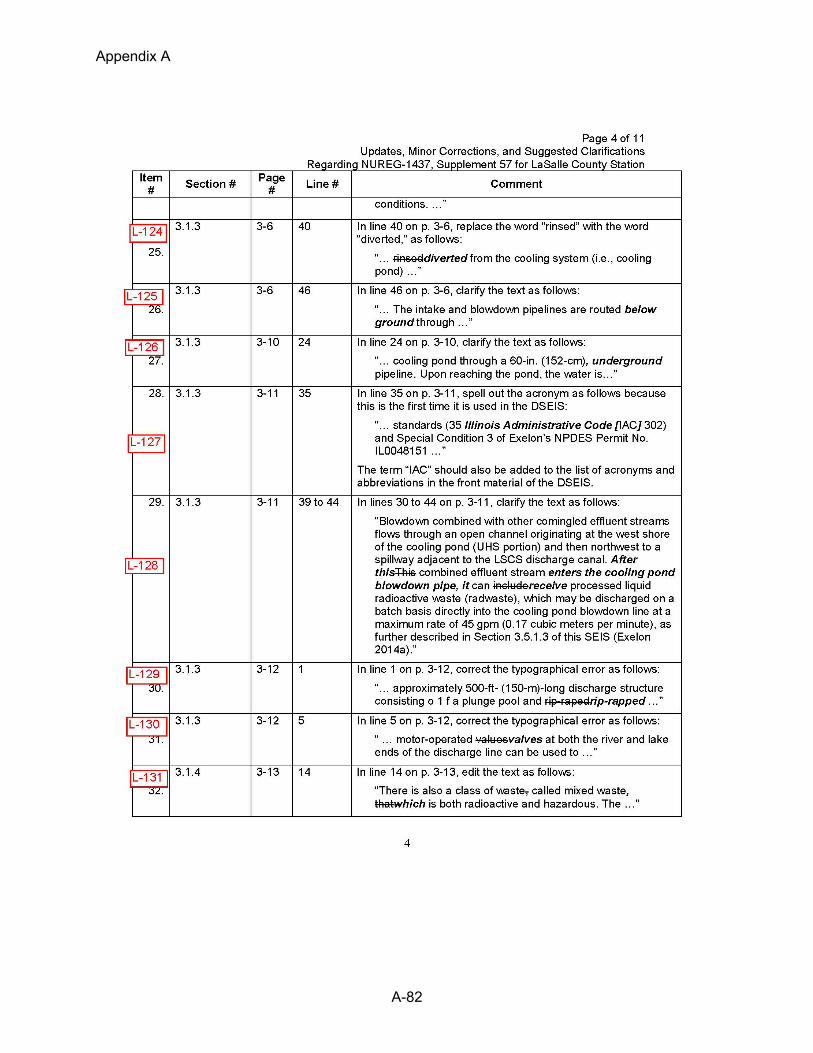
Appendix A
A-82

Appendix A
A-83

Appendix A
A-84

Appendix A
A-85
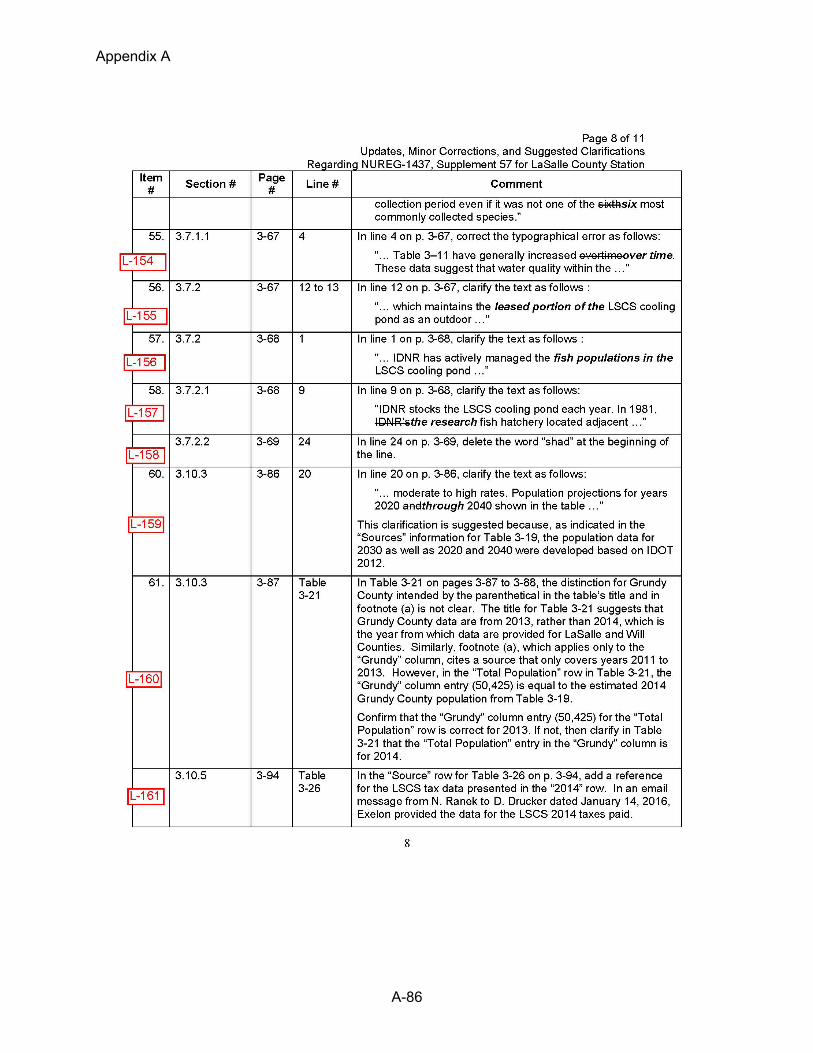
Appendix A
A-86

Appendix A
A-87

Appendix A
A-88

Appendix A
A-89

Appendix A
A-90

Appendix A
A-91

Appendix A
A-92
A.5 References
10 CFR Part 20. Code of Federal Regulations, Title 10, Energy, Part 20, “Standards for protection against radiation.” 10 CFR Part 50. Code of Federal Regulations, Title 10, Energy, Part 50, “Domestic licensing of production and utilization facilities.” 10 CFR Part 51. Code of Federal Regulations, Title 10, Energy, Part 51, “Environmental protection regulations for domestic licensing and related regulatory functions.” 10 CFR Part 72. Code of Federal Regulations, Title 10, Energy, Part 72, “Licensing requirements for the independent storage of spent nuclear fuel, high-level radioactive waste, and reactor-related Greater than Class C waste.” 40 CFR Part 1500. Code of Federal Regulations, Title 40, Part 1500 Protection of Environment, Council on Environmental Quality Purpose, Policy, and Mandate, Section 1500.1 Purpose, Section 1500.2 Policy, Section 1508.7 Cumulative Impact, Section 1508.27 Significantly. 69 FR 52040. U.S. Nuclear Regulatory Commission. “Policy statement on the treatment of environmental justice matters in NRC regulatory and licensing actions.” Federal Register 69(163):52040–52048. August 24, 2004. 78 FR 37282. U.S. Nuclear Regulatory Commission. “Revisions to environmental review for renewal of nuclear power plant operating licenses.” Federal Register 78 (119): 37282–37324. June 20, 2013. 80 FR 5793. U.S. Nuclear Regulatory Commission. “LaSalle County Station, Units 1 and 2, notice of intent to prepare an environmental impact statement and conduct the scoping process; public meetings and request for comment.” Federal Register 80(22):5793–5795. February 3, 2015. Endangered Species Act of 1973, as amended. 16 U.S.C. § 1531 et seq. [EA] EA Engineering, Science, and Technology, Inc. 2015. Final Impingement and Entrainment Characterization Study LaSalle County Station. Prepared for Exelon Generation Company, LLC, Kennett Square, Pennsylvania. August 2015. Deerfield, Illinois. ADAMS No. ML15243A204. [ENSR] ENSR Corporation. 2008. Aquatic Ecology—Main Cooling Reservoir and Circulating Water Intake Structure Study, Unit 3 and 4, Licensing Project. Prepared for STP Nuclear Operating Company. Houston, TX: ENSR. 53 p. ADAMS No. ML11256A057. [EPA] U.S. Environmental Protection Agency. 2014. Benefits Analysis for the Final Section 316(b) Existing Facilities Rule. EPA-821-R-14-005. May 2014. Available at https://www.epa.gov/sites/production/files/2015-05/documents/cooling-water_phase-4_benefits_2014.pdf (accessed 27 April 2016). [Exelon] Exelon Generation Company, LLC. 2001. Letter from W. Riffer, Regulatory Assurance Manager, LaSalle County Station to U.S. NRC, Document Control Desk. Subject: Environmental Non-Routine Event Report for Exelon Generation Company, LLC—LaSalle County Station. August 17, 2001. ADAMS No. ML012330070. [Exelon] Exelon Generation Company, LLC. 2002. Letter from G.T. Kaegi, Regulatory Assurance Manager, LaSalle County Station to U.S. NRC, Document Control Desk. Subject: Environmental Protection Plan and Operating Report Appendix B to Facility License No. NPF–11 and NPF–18. April 29, 2002. ADAMS No. ML021330421.

Appendix A
A-93
[Exelon] Exelon Generation Company, LLC. 2009. Letter from D. Rhoads, Plant Manager, LaSalle County Station to U.S. NRC, Document Control Desk. Subject: Environmental Non-Routine Event Report for Exelon Generation Company, LLC—LaSalle County Station. July 22, 2009. ADAMS No. ML092040381. [Exelon] Exelon Generation Company, LLC. 2010. Letter from P.J. Karaba, Plant Manager, LaSalle County Station to U.S. NRC, Document Control Desk. Subject: Environmental Non-Routine Event Report for Exelon Generation Company, LLC—LaSalle County Station. August 25, 2010. ADAMS No. ML102371289. [Exelon] Exelon Generation Company, LLC. 2014. Applicant’s Environmental Report—Operating License Renewal Stage LaSalle County Station, Unit 1 License No. NPF–11, Unit 2 License No. NPF–18. Chicago, Illinois: Exelon. December 9, 2014. ADAMS Nos. ML14343A849, ML14343A883, and ML14343A897. [Exelon] Exelon Generation Company, LLC. 2015. Letter from M.P. Gallagher, Vice President, License Renewal Projects, to NRC Document Control Desk. Subject: Response to NRC Request for Additional Information, dated May 22, 2015, Regarding the LaSalle County Station, Units 1 and 2, License Renewal Application, Environmental Review. July 2, 2015. ADAMS No. ML15195A351. Federal Water Pollution Control Act (Clean Water Act) of 1972, as amended. 33 U.S.C. § 1251 et seq. Rivers and Harbors Appropriation Act of 1899, as amended. 33 U.S.C. § 403 Section 10. Illinois Environmental Protection Act of 1970. 415 ILCS 5/Title VI. Illinois Compiled Statutes. Chapter 415, 5, “Noise.” Kanter R. 2013. Environmental Almanac: Rare mussel found in Illinois River. News Gazette. Sunday, July 7, 2013. Miller, Eric F. 2007. Post-Impingement Survival and Inferred Maximum Thermal Tolerances for Common Nearshore Marine Fish Species of Southern California. Bulletin of the Southern California Academy of Sciences: Vol. 106: Iss. 3. Available at http://scholar.oxy.edu/scas/vol106/iss3/3 (accessed 27 April 2016). National Historic Preservation Act of 1966, as amended. 54 USC 300101 et seq. National Environmental Policy Act of 1969, as amended. 42 U.S.C. § 4321 et seq. [NRC] U.S. Nuclear Regulatory Commission. 1996. Generic Environmental Impact Statement for License Renewal of Nuclear Plants, Final Report. Washington, DC: NRC. NUREG–1437, Volumes 1 and 2. May 31, 1996. ADAMS Nos. ML040690705 and ML040690738. [NRC] U.S. Nuclear Regulatory Commission. 2002. Final Generic Environmental Impact Statement on Decommissioning of Nuclear Facilities: Supplement 1, Regarding the Decommissioning of Nuclear Power Reactors. NUREG–0586, Volumes 1 and 2. Washington, DC: NRC. November 30, 2002. 516 p. ADAMS Nos. ML023470327, ML023500228, and ML023500295. [NRC] U.S. Nuclear Regulatory Commission. 2008. Generic Environmental Impact Statement for License Renewal of Nuclear Plants, Supplement 32: Regarding Wolf Creek Generating Station. Washington, DC: NRC. NUREG–1437. May 2008. 487 p. ADAMS No. ML081260608.

Appendix A
A-94
[NRC] U.S. Nuclear Regulatory Commission. 2009. In the matter of Duke Energy Carolinas, LLC (Combined License Application for William States Lee III Nuclear Station, Units 1 and 2); in the matter of Tennessee Valley Authority (Bellefonte Nuclear Power Plant, Units 3 and 4), Commission Order CLI–09–21. November 3, 2009. [NRC] U.S. Nuclear Regulatory Commission. 2013a. Generic Environmental Impact Statement for License Renewal of Nuclear Plants. Washington, DC: NRC. NUREG–1437, Revision 1, Volumes 1, 2, and 3. June 30, 2013. ADAMS No. ML13107A023. [NRC] U.S. Nuclear Regulatory Commission. 2013b. Standard Review Plans for Environmental Reviews for Nuclear Power Plants Supplement 1: Operating License Renewal Final Report. Washington, DC: NRC. NUREG–1555, Supplement 1. June 30, 2013. ADAMS No. ML13106A246. [NRC] U.S. Nuclear Regulatory Commission. 2013c. Final Supplemental Environmental Impact Statement Regarding South Texas Project. Washington, DC: NRC. NUREG–1437, Supplement 48. November 2013. ADAMS No. ML13322A890. [NRC] U.S. Nuclear Regulatory Commission. 2014. Generic Environmental Impact Statement for Continued Storage of Spent Nuclear Fuel. Washington, DC: NRC, Office of Nuclear Material Safety and Safeguards. NUREG–2157, Volumes 1 and 2. September 2014. ADAMS Nos. ML14196A105 and ML14196A107. [NRC] U.S. Nuclear Regulatory Commission. 2015. Final Supplemental Environmental Impact Statement Regarding Braidwood Station. Washington, DC: NRC. NUREG–1437, Supplement 55. ADAMS No. ML15062A428.

APPLICABLE LAWS, REGULATIONS, AND OTHER REQUIREMENTS


B-1
B. Applicable Laws, Regulations, and Other Requirements
There are a number of Federal laws and regulations that affect environmental protection, health, safety, compliance, and consultation at every nuclear power plant licensed by the U.S. Nuclear Regulatory Commission (NRC). Certain Federal environmental requirements have been delegated to state authorities for implementation, enforcement, or oversight. Furthermore, states have also enacted laws to protect public health and safety and the environment. It is the NRC’s mission, among other things, to ensure that U.S. nuclear power plants are operated in a manner that provides adequate protection of the public health and safety and of the environment through compliance with applicable Federal and state laws, regulations, and other requirements. The requirements that may be applicable to the operation of NRC-licensed nuclear power plants encompass a broad range of Federal and state laws and regulations, addressing environmental, historic and cultural, health and safety, transportation, and other concerns. Generally, these laws and regulations are relevant to how the work involved in performing the proposed action would be conducted to protect workers, the public, and environmental resources. Some of these laws and regulations require permits or consultation with other Federal agencies or state, tribal, or local governments. The Atomic Energy Act of 1954, as amended (AEA) (42 United States Code (U.S.C.) § 2011 et seq.), authorizes any state to enter into agreement with the NRC to assume regulatory authority for certain activities (see 42 U.S.C. § 2021). For example, through this Agreement State Program, Illinois assumed regulatory responsibility over certain byproduct, source, and quantities of special nuclear materials not sufficient to form a critical mass. The Illinois Emergency Management Agency (IEMA), Division of Nuclear Safety, administers several programs to protect citizens and the environment, including: a comprehensive monitoring system for the 11 operating nuclear power reactors in Illinois, inspection and regulation of radioactive materials licensees and x-ray machines, and oversight of cleanup efforts at sites contaminated with radioactive materials (IEMA undated). In addition to carrying out some Federal programs, state legislatures develop their own laws. State statutes supplement, as well as implement, Federal laws for the protection of air, water quality, and groundwater. State legislation may address solid waste management programs, locally rare or endangered species, and historic and cultural resources. The Clean Water Act (CWA) (33 U.S.C. § 1251 et seq.) allows for primary enforcement and administration through state agencies, provided that the state program is at least as stringent as the Federal program. The state program must conform to the CWA and to the delegation of authority for the Federal National Pollutant Discharge Elimination System (NPDES) program from the U.S. Environmental Protection Agency (EPA) to the state. The primary mechanism to control water pollution is the requirement for direct dischargers to obtain an NPDES permit or, in the case of states where the authority has been delegated from the EPA, such as Illinois, a State Pollutant Discharge Elimination System permit. One important difference between Federal regulations and certain state regulations is the definition of waters regulated by the state. Certain state regulations may include underground waters, whereas the CWA only regulates surface waters. The Illinois Environmental Protection Agency (IEPA), Bureau of Water, Water Pollution Control, conducts the numerous programs, including permit programs and surface water quality monitoring and assessment programs, to protect and enhance the quality of the state’s surface waters (IEPA undated).

Appendix B
B-2
B.1 Federal and State Requirements
LaSalle County Station, Units 1 and 2 (LSCS), are subject to Federal and State requirements. Table B–1 lists the principal Federal and State laws and regulations that are used or mentioned in this supplemental environmental impact statement (SEIS) for LSCS.
Table B–1. Federal and State Requirements
Law/regulation Requirements
Current operating license and license renewal
Atomic Energy Act of 1954, as amended (AEA), 42 U.S.C. § 2011 et seq.
The AEA and the Energy Reorganization Act of 1974, as amended (42 U.S.C. § 5801 et seq.), give the NRC the licensing and regulatory authority for nuclear energy uses within the commercial sector. These regulations give the NRC responsibility for licensing and regulating commercial uses of atomic energy and allow the NRC to establish dose and concentration limits for protection of workers and the public for activities under NRC jurisdiction. The NRC implements these responsibilities through regulations set forth in Title 10 of the Code of Federal Regulations (10 CFR).
National Environmental Policy Act of 1969, as amended (NEPA), 42 U.S.C. § 4321 et seq.
NEPA requires Federal agencies to integrate environmental values into their decisionmaking process by considering the environmental impacts of proposed Federal actions and reasonable alternatives to those actions. NEPA establishes policy, sets goals (in Section 101), and provides means (in Section 102) for carrying out the policy. Section 102(2) contains action-forcing provisions to ensure that Federal agencies follow the letter and spirit of the Act. For major Federal actions significantly affecting the quality of the human environment, Section 102(2)(C) of NEPA requires Federal agencies to prepare a detailed statement that includes the environmental impact of the proposed action and other specified information.
Title 10 of the Code of Federal Regulations (10 CFR), Energy, Part 51
Regulations in 10 CFR Part 51, “Environmental protection regulations for domestic licensing and related regulatory functions,” contain environmental protection regulations applicable to the NRC’s domestic licensing and related regulatory functions. These regulations implement Section 102(2) of NEPA.
10 CFR Part 54 Regulations in 10 CFR Part 54, “Requirements for renewal of operating licenses for nuclear power plants,” govern the issuance of renewed operating licenses and renewed combined licenses for nuclear power plants licensed pursuant to Sections 103 or 104b of the AEA and Title II of the Energy Reorganization Act. The regulations focus on managing the effects of aging during the period of extended operation on the functionality of specific structures and components. The rule is intended to ensure that important systems, structures, and components will maintain their intended functions during the period of extended operation.

Appendix B
B-3
Law/regulation Requirements
10 CFR Part 50 Regulations in 10 CFR Part 50, “Domestic licensing of production and utilization facilities,” are NRC regulations issued under the AEA and Title II of the Energy Reorganization Act to provide for the licensing of production and utilization facilities. This part also gives notice to all persons who knowingly provide to any licensee, applicant, contractor, or subcontractor, components, equipment, materials, or other goods or services, that relate to a licensee’s or applicant’s activities subject to this part, that they may be individually subject to NRC enforcement action for violation of 10 CFR 50.5.
Air quality protection
Clean Air Act (CAA), 42 U.S.C. § 7401 et seq.
The CAA is intended to “protect and enhance the quality of the Nation’s air resources so as to promote the public health and welfare and the productive capacity of its population.” The CAA establishes requirements to ensure maintenance of air quality standards and authorizes individual states to manage permits. Section 118 of the CAA requires each Federal agency, with jurisdiction over properties or facilities engaged in any activity that may result in the discharge of air pollutants, to comply with all Federal, state, inter-state, and local requirements with regard to the control and abatement of air pollution. Section 109 of the CAA directs the U.S. Environmental Protection Agency (EPA) to set National Ambient Air Quality Standards (NAAQS) for criteria pollutants. The EPA has identified and set NAAQS for the following criteria pollutants: particulate matter, sulfur dioxide, carbon monoxide, ozone, nitrogen dioxide, and lead. Section 111 of the CAA requires establishment of national performance standards for new or modified stationary sources of atmospheric pollutants. Section 160 of the CAA requires that specific emission increases must be evaluated before permit approval to prevent significant deterioration of air quality. Section 112 requires specific standards for release of hazardous air pollutants (including radionuclides). These standards are implemented through plans developed by each state and approved by the EPA. The CAA requires sources to meet standards and obtain permits to satisfy those standards. Nuclear power plants may be required to comply with the CAA Title V, Sections 501–507, for sources subject to new source performance standards or sources subject to National Emission Standards for Hazardous Air Pollutants. Emissions of air pollutants are regulated by the EPA in 40 CFR Parts 50 to 99.
Illinois Administrative Code (IAC), Title 35, “Environmental Protection,” Subtitle B, “Air Pollution,” Chapter I, “Pollution Control Board,” Subchapter a, “Permits and General Provisions,” Part 201, “Permits and General Provisions”
This part of the IAC sets standards for air emissions from auxiliary boilers, emergency generators, radwaste volume reduction system, cooling towers, and ancillary operations.

Appendix B
B-4
Law/regulation Requirements
Water resources protection
Clean Water Act (CWA), 33 U.S.C. § 1251 et seq., and the NPDES (40 CFR 122)
The CWA was enacted to “restore and maintain the chemical, physical, and biological integrity of the Nation’s waters.” The Act requires each Federal agency, with jurisdiction over properties or facilities engaged in any activity that may result in the discharge or runoff of pollutants to surface waters, to comply with all Federal, state, inter-state, and local requirements. As authorized by the CWA, the National Pollutant Discharge Elimination System (NPDES) permit program controls water pollution by regulating point sources that discharge pollutants into waters of the United States. The NPDES program requires all facilities that discharge pollutants from any point source into waters of the United States to obtain an NPDES permit. A nuclear power plant may also participate in the NPDES General Permit for Industrial Stormwater due to stormwater runoff from industrial or commercial facilities to waters of the United States. EPA is authorized under the CWA to directly implement the NPDES program; however, EPA has authorized many states to implement all or parts of the national program. Section 401 of the CWA requires states to certify that the permitted discharge would comply with all limitations necessary to meet established state water quality standards, treatment standards, or schedule of compliance. The U.S. Army Corps of Engineers is the lead agency for enforcement of CWA wetland requirements (33 CFR Part 320). Under Section 401 of the CWA, the EPA or a delegated state agency has the authority to review and approve, condition, or deny all permits or licenses that may result in a discharge to waters of the State, including wetlands.
Coastal Zone Management Act of 1972, as amended (CZMA), 16 U.S.C. § 1451 et seq.
Congress enacted the CZMA in 1972 to address the increasing pressures of over-development upon the Nation’s coastal resources. The National Oceanic and Atmospheric Administration administers the Act. The CZMA encourages states to preserve, protect, develop, and, where possible, restore or enhance natural coastal resources such as wetlands, floodplains, estuaries, beaches, dunes, barrier islands, and coral reefs, as well as the fish and wildlife using those habitats. Participation by states is voluntary. To encourage states to participate, the CZMA makes Federal financial assistance available to any coastal state or territory, including those on the Great Lakes, that are willing to develop and implement a comprehensive coastal management program.
IAC, Title 35, “Environmental Protection,” Subtitle C, “Water Pollution,” Chapter I, “Pollution Control Board,” Part 309, “Permits”
This part of the IAC implements the NPDES program under the CWA.
Wild and Scenic Rivers Act, 16 U.S.C. § 1271 et seq.
The Wild and Scenic Rivers Act created the National Wild and Scenic Rivers System, which was established to protect the environmental values of free flowing streams from degradation by impacting activities, including water resources projects.
415 Illinois Compiled Statutes (ILCS) 5, “Environmental Protection Act,” Title III, “Water Pollution”
This part of the ILCS sets forth Illinois State standards for water pollution.

Appendix B
B-5
Law/regulation Requirements
Waste management and pollution prevention
Resource Conservation and Recovery Act (RCRA), 42 U.S.C. § 6901 et seq.
RCRA requires the EPA to define and identify hazardous waste; establish standards for its transportation, treatment, storage, and disposal; and require permits for persons engaged in hazardous waste activities. Section 3006 (42 U.S.C. 6926) allows states to establish and administer these permit programs with EPA approval. EPA regulations implementing the RCRA are found in 40 CFR Parts 260 through 283. Regulations imposed on a generator or on a treatment, storage, and/or disposal facility vary according to the type and quantity of material or waste generated, treated, stored, and/or disposed. The method of treatment, storage, and/or disposal also impacts the extent and complexity of the requirements.
Pollution Prevention Act, 42 U.S.C. § 13101 et seq.
The Pollution Prevention Act establishes a national policy for waste management and pollution control that focuses first on source reduction, then on environmental issues, safe recycling, treatment, and disposal.
10 CFR Part 20 Regulations in 10 CFR Part 20, “Standards for protection against radiation,” establish standards for protection against ionizing radiation resulting from activities conducted under licenses issued by the NRC. These regulations are issued under the AEA and the Energy Reorganization Act. The purpose of these regulations is to control the receipt, possession, use, transfer, and disposal of licensed material by any licensee in such a manner that the total dose to an individual (including doses resulting from licensed and unlicensed radioactive material and from radiation sources other than background radiation) does not exceed the standards for protection against radiation prescribed in the regulations in this part.
IAC Title 35, “Environmental Protection,” Subtitle G, “Waste Disposal,” Chapter I, “Pollution Control Board,” Subchapter c, “Hazardous Waste Operating Requirements,” Part 722, “Standards Applicable to Generators of Hazardous Waste”
This part of the IAC establishes standards for generators of hazardous waste.
IAC Title 35, “Environmental Protection,” Subtitle C, “Water Pollution,” Chapter II, “Environmental Protection Agency,” Part 391, “Design Criteria for Sludge Application on Land”
This part of the IAC presents criteria for transporting, storing, and applying sludge on land in an environmentally acceptable manner. In addition, it identifies methods of sludge transportation, handling, storage, application and monitoring to control potential environmental problems.
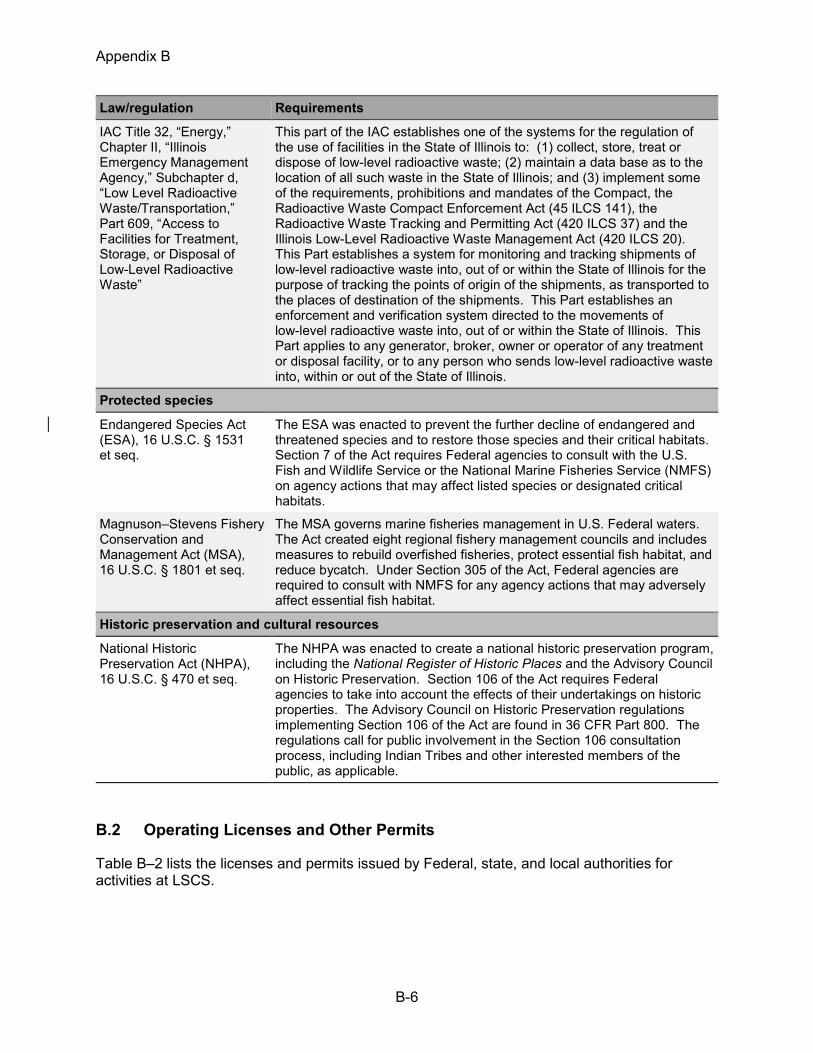
Appendix B
B-6
Law/regulation Requirements
IAC Title 32, “Energy,” Chapter II, “Illinois Emergency Management Agency,” Subchapter d, “Low Level Radioactive Waste/Transportation,” Part 609, “Access to Facilities for Treatment, Storage, or Disposal of Low-Level Radioactive Waste”
This part of the IAC establishes one of the systems for the regulation of the use of facilities in the State of Illinois to: (1) collect, store, treat or dispose of low-level radioactive waste; (2) maintain a data base as to the location of all such waste in the State of Illinois; and (3) implement some of the requirements, prohibitions and mandates of the Compact, the Radioactive Waste Compact Enforcement Act (45 ILCS 141), the Radioactive Waste Tracking and Permitting Act (420 ILCS 37) and the Illinois Low-Level Radioactive Waste Management Act (420 ILCS 20). This Part establishes a system for monitoring and tracking shipments of low-level radioactive waste into, out of or within the State of Illinois for the purpose of tracking the points of origin of the shipments, as transported to the places of destination of the shipments. This Part establishes an enforcement and verification system directed to the movements of low-level radioactive waste into, out of or within the State of Illinois. This Part applies to any generator, broker, owner or operator of any treatment or disposal facility, or to any person who sends low-level radioactive waste into, within or out of the State of Illinois.
Protected species
Endangered Species Act (ESA), 16 U.S.C. § 1531 et seq.
The ESA was enacted to prevent the further decline of endangered and threatened species and to restore those species and their critical habitats. Section 7 of the Act requires Federal agencies to consult with the U.S. Fish and Wildlife Service or the National Marine Fisheries Service (NMFS) on agency actions that may affect listed species or designated critical habitats.
Magnuson–Stevens Fishery Conservation and Management Act (MSA), 16 U.S.C. § 1801 et seq.
The MSA governs marine fisheries management in U.S. Federal waters. The Act created eight regional fishery management councils and includes measures to rebuild overfished fisheries, protect essential fish habitat, and reduce bycatch. Under Section 305 of the Act, Federal agencies are required to consult with NMFS for any agency actions that may adversely affect essential fish habitat.
Historic preservation and cultural resources
National Historic Preservation Act (NHPA), 16 U.S.C. § 470 et seq.
The NHPA was enacted to create a national historic preservation program, including the National Register of Historic Places and the Advisory Council on Historic Preservation. Section 106 of the Act requires Federal agencies to take into account the effects of their undertakings on historic properties. The Advisory Council on Historic Preservation regulations implementing Section 106 of the Act are found in 36 CFR Part 800. The regulations call for public involvement in the Section 106 consultation process, including Indian Tribes and other interested members of the public, as applicable.
B.2 Operating Licenses and Other Permits
Table B–2 lists the licenses and permits issued by Federal, state, and local authorities for activities at LSCS.

Appendix B
B-7
Table B–2. Licenses and Permits
Permit Number Dates Responsible Agency
Operating license NPF-11 Issued: 04/17/1982 Expires: 04/17/2022 NRC
Operating license NPF-18 Issued: 12/16/1983 Expires: 12/16/2023 NRC
NPDES permit IL0048151 Issued: 07/05/2013 Expires: 07/31/2018
IEPA, Division of Water Pollution Control
Federally enforceable state operating permit (FESOP) for air emissions from emergency generators, storage tanks, and dispensing facilities
Application #75040086 ID# 099802AAA
Issued: 01/07/2016 Expires: 08/12/2025
IEPA, Division of Air Pollution Control
Notification of hazardous waste activity as a small quantity generator of hazardous waste
ILD000803643 Not Applicable IEPA, Bureau of Land
Department of Army permit for maintenance dredging at river screen house intake
CEMVR-OD-P-2015-1458
Issued: 01/25/2016 Expires: 03/18/2017
U.S. Army Corps of Engineers
Waste tracking permit for shipments of low-level radioactive waste
IL-0104 Not Applicable IEMA, Division of Nuclear Safety
License to deliver radioactive material to processing facility in Tennessee
T-IL009-L14 Renewed annually Tennessee Department of Environment and Conservation
Permit to deliver radioactive material to disposal facility in Utah
010000028 Renewed annually Utah Department of Environmental Quality
Dam safety regarding operation and maintenance of cooling reservoir dam
DS2000237 Issued: 12/20/2000 Expires: Not Applicable
Illinois Department of Natural Resources, Office of Water Resources
Hazardous materials certificate of registration 051713 550 083VX Issued: 05/17/2013
Expires: 06/30/2016
U.S. Department of Transportation, Pipeline and Hazardous Materials Safety Administration
Sources: Exelon 2014, 2015

Appendix B
B-8
B.3 References
10 CFR Part 50. Code of Federal Regulations, Title 10, Energy, Part 50, “Domestic licensing of production and utilization facilities.” 10 CFR Part 51. Code of Federal Regulations, Title 10, Energy, Part 51, “Environmental protection regulations for domestic licensing and related regulatory functions.” 10 CFR Part 54. Code of Federal Regulations, Title 10, Energy, Part 54, “Requirements for renewal of operating licenses for nuclear power plants.” 40 CFR Part 122. Code of Federal Regulations, Title 40, Protection of Environment, Part 122, “EPA administered permit programs: the National Pollutant Discharge Elimination System.” 49 CFR Part 107. Code of Federal Regulations, Title 49, Transportation, Part 107, “Hazardous materials program procedures.” 49 U.S.C. 5108. United States Code, Title 49, Chapter 51, Part 5108, “Registration.” [IAC] Illinois Administrative Code Title 32, Chapter II, Subchapter d, Part 609, “Access to facilities for treatment, storage, or disposal of low-level radioactive waste.” [IAC] Illinois Administrative Code Title 35, Subtitle B, Chapter I, Subchapter a, Part 201, “Permits and general provisions.” [IAC] Illinois Administrative Code Title 35, Subtitle C, Chapter I, Part 309, “Permits.” [IAC] Illinois Administrative Code Title 35, Subtitle C, Chapter II, Part 391, “Design criteria for sludge application on land.” [IAC] Illinois Administrative Code Title 35, Subtitle G, Chapter I, Subchapter c, Part 722, “Standards applicable to generators of hazardous waste.” 415 ILCS 5/Tit. II. Illinois Compiled Statutes. Chapter 415, 5, “Environmental Protection Act,” Title II, “Air pollution.” 415 ILCS 5/Tit. III. Illinois Compiled Statutes. Chapter 415, 5, “Environmental Protection Act,” Title III, “Water pollution.” [AEA] Atomic Energy Act of 1954, as amended. 42 U.S.C. § 2011 et seq. [CAA] Clean Air Act of 1963, as amended. 42 U.S.C. § 7401 et seq. [CWA] Clean Water Act of 1977, as amended. 33 U.S.C. § 1251 et seq. [ESA] Endangered Species Act of 1973, as amended. 16 U.S.C. § 1531 et seq. [Exelon] Exelon Generation Company, LLC. 2014. LaSalle County Station, Units 1 and 2 License Renewal Application, Applicant’s Environmental Report. December 9, 2014. Agencywide Documents Access and Management System (ADAMS) Nos. ML14343A883 and ML14343A897. [Exelon] Exelon Generation Company, LLC. 2015. E-mail from N. Ranek, Exelon, to D. Drucker, NRC. Subject: RE: USACE permit. December 10, 2015. ADAMS No. ML15363A237. [FWCA] Fish and Wildlife Coordination Act of 1934, as amended. 16 U.S.C. § 661 et seq. [IEMA] Illinois Emergency Management Agency, Division of Nuclear Safety. Undated. Available at <http://www.illinois.gov/iema/Pages/default.aspx> (accessed 3 September 2015).

Appendix B
B-9
[IEPA] Illinois Environmental Protection Agency, Bureau of Water. Undated. “Water Pollution Control.” Available at <http://www.epa.state.il.us/water/index-wpc.html> (accessed September 3, 2015). [MMPA] Marine Mammal Protection Act of 1972, as amended. 16 U.S.C. § 1361 et seq. [MSA] Magnuson–Stevens Fishery Conservation and Management Act, as amended. 16 U.S.C. § 1801 et seq. [NHPA] National Historic Preservation Act of 1966, as amended. 16 U.S.C. § 470 et seq. Pollution Prevention Act of 1990. 42 U.S.C. § 13101 et seq. [RCRA] Resource Conservation and Recovery Act of 1976, as amended. 42 U.S.C. § 6901 et seq. Wild and Scenic Rivers Act, as amended. 16 U.S.C. § 1271 et seq.


CONSULTATION CORRESPONDENCE


C-1
C. Consultation Correspondence
C.1 Endangered Species Act (ESA) Section 7 Consultation
C.1.1 Federal Agency Obligations Under ESA Section 7
As a Federal agency, the U.S. Nuclear Regulatory Commission (NRC) must comply with the Endangered Species Act of 1973, as amended (16 United States Code (U.S.C.) 1531 et seq., herein referred to as ESA), as part of any action authorized, funded, or carried out by the agency, such as the proposed agency action that this supplemental environmental impact statement (SEIS) evaluates—whether to issue renewed licenses for the continued operation of LaSalle County Station, Units 1 and 2 (LSCS) for an additional 20 years beyond the current license terms. Under section 7 of the ESA, the NRC must consult with the U.S. Fish and Wildlife Service (FWS) and the National Marine Fisheries Service (NMFS) (referred to jointly as “the Services” and individually as “Service”), as appropriate, to ensure that the proposed agency action is not likely to jeopardize the continued existence of any endangered or threatened species or result in the destruction or adverse modification of designated critical habitat. The ESA and the regulations that implement ESA section 7 (Title 50 of the Code of Federal Regulations (50 CFR) Part 402, “Interagency cooperation—Endangered Species Act of 1973, as amended”) describe the consultation process that Federal agencies must follow in support of agency actions. As part of this process, the Federal agency shall either request that the Services provide a list of any listed or proposed species or designated or proposed critical habitats that may be present in the action area or request that the Services concur with a list of species and critical habitats that the Federal agency has created (50 CFR 402.12(c)). If it is determined that any such species or critical habitats may be present, the Federal agency is to prepare a biological assessment to evaluate the potential effects of the action and determine whether the species or critical habitat are likely to be adversely affected by the action (16 U.S.C. 1536(c), 50 CFR 402.12(a)). Further, biological assessments are required for any agency action that is a “major construction activity” (50 CFR 402.12(b)), which the ESA regulations define to include major Federal actions significantly affecting the quality of the human environment under the National Environmental Policy Act of 1969, as amended (42 U.S.C. 4321 et seq., herein referred to as NEPA) (50 CFR 402.02). Federal agencies may fulfill their obligations to consult with the Services under ESA section 7 and to prepare a biological assessment in conjunction with the interagency cooperation procedures required by other statutes, including NEPA (50 CFR 402.06(a)). In such cases, the Federal agency should include the results of the ESA section 7 consultation in the NEPA document (50 CFR 402.06(b)). Accordingly, Section C.1.2 describes the biological assessment prepared for the proposed agency action evaluated in this SEIS, and Section C.1.3 describes the chronology and results of the ESA section 7 consultation.
C.1.2 Biological Assessment
The NRC considers this SEIS to fulfill its obligation to prepare a biological assessment under ESA section 7. Accordingly, the NRC did not prepare a separate biological assessment for the proposed LSCS license renewal. Although the contents of a biological assessment are at the discretion of the Federal agency (50 CFR 402.12(f)), the ESA regulations suggest information that agencies may consider for inclusion. The NRC has considered this information in the following sections.

Appendix C
C-2
Section 3.8 describes the action area and the Federally listed and proposed species and designated and proposed critical habitat that have the potential to be present in the action area. This section includes information pursuant to 50 CFR 402.12(f)(1), (2), and (3). Section 4.8 provides an assessment of the potential effects of the proposed LSCS license renewal on the species and critical habitat present and the NRC’s effect determinations, which are consistent with those identified in Section 3.5 of the Endangered Species Consultation Handbook (FWS and NMFS 1998). The NRC also addresses alternatives to the proposed action. This section includes information pursuant to 50 CFR 402.12(f)(4) and (5).
C.1.3 Chronology of ESA Section 7 Consultation
Upon receipt of Exelon’s license renewal application, the NRC staff considered whether any Federally listed or proposed species or designated or proposed critical habitats may be present in the action area (as defined at 50 CFR 402.02) for the proposed LSCS license renewal. No species under the NMFS’s jurisdiction occur within the action area. Therefore, the NRC staff did not consult with the NMFS. With respect to species under the FWS’s jurisdiction, in late February 2015, NRC staff filled an online form for an updated protected species list for LSCS on the FWS’s Environmental Conservation Online System (ECOS), Information for Planning and Conservation (IPaC). FWS (2015b) responded with a list of threatened and endangered species that may occur in the project location and may be affected by the Federal action. In October 2015, NRC staff checked the FWS (2015a) online Illinois County distribution of listed species for updates. From this, the NRC staff compiled a list of ESA-protected species and critical habitats in the vicinity of the facility. In Section 3.8, the NRC staff concludes that no ESA-protected species or critical habitats occur in the action area, and, in Section 4.8, concludes that the proposed action would have no effect on any ESA-protected species or critical habitats. The FWS (2013) does not typically provide its concurrence with “no effect” determinations by Federal agencies. Thus, the ESA does not require further informal consultation or the initiation of formal consultation with the FWS for the proposed LSCS license renewal. Nonetheless, because this SEIS constitutes the NRC’s biological assessment, the NRC staff submitted a copy of the draft SEIS to the FWS for its review in accordance with 50 CFR 402.12(j). Table C–1 lists the correspondence related to the NRC’s ESA obligations with respect to its review of the LSCS license renewal application.
Table C–1. ESA Section 7 Consultation Correspondence
Date Sender and Recipient Description ADAMS No.(a)
February 27, 2015 FWS to NRC List of threatened and endangered species that may occur in your proposed project location, and/or may be affected by your proposed project
ML15126A069
March 3, 2015 NRC to FWS Request for scoping comments/notification of scoping meetings
ML15062A534
(a) These documents can be accessed through the NRC’s Agencywide Documents Access and Management System (ADAMS) at http://adams.nrc.gov/wba/.
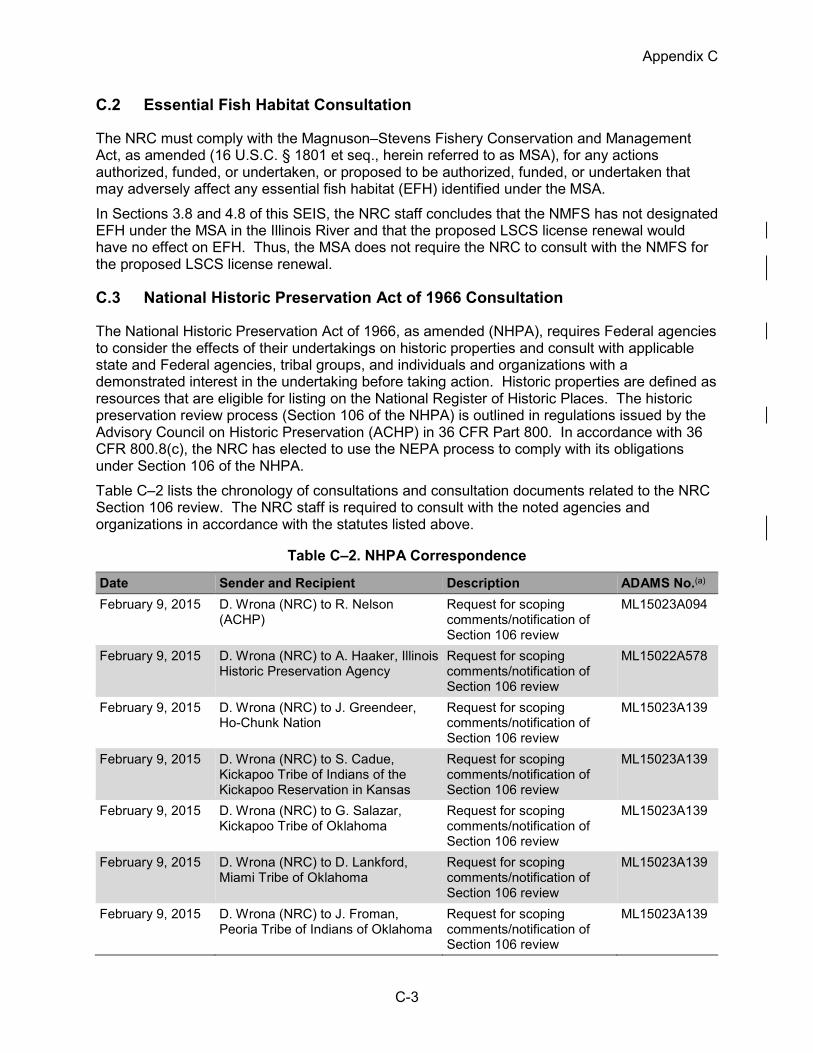
Appendix C
C-3
C.2 Essential Fish Habitat Consultation
The NRC must comply with the Magnuson–Stevens Fishery Conservation and Management Act, as amended (16 U.S.C. § 1801 et seq., herein referred to as MSA), for any actions authorized, funded, or undertaken, or proposed to be authorized, funded, or undertaken that may adversely affect any essential fish habitat (EFH) identified under the MSA. In Sections 3.8 and 4.8 of this SEIS, the NRC staff concludes that the NMFS has not designated EFH under the MSA in the Illinois River and that the proposed LSCS license renewal would have no effect on EFH. Thus, the MSA does not require the NRC to consult with the NMFS for the proposed LSCS license renewal.
C.3 National Historic Preservation Act of 1966 Consultation
The National Historic Preservation Act of 1966, as amended (NHPA), requires Federal agencies to consider the effects of their undertakings on historic properties and consult with applicable state and Federal agencies, tribal groups, and individuals and organizations with a demonstrated interest in the undertaking before taking action. Historic properties are defined as resources that are eligible for listing on the National Register of Historic Places. The historic preservation review process (Section 106 of the NHPA) is outlined in regulations issued by the Advisory Council on Historic Preservation (ACHP) in 36 CFR Part 800. In accordance with 36 CFR 800.8(c), the NRC has elected to use the NEPA process to comply with its obligations under Section 106 of the NHPA. Table C–2 lists the chronology of consultations and consultation documents related to the NRC Section 106 review. The NRC staff is required to consult with the noted agencies and organizations in accordance with the statutes listed above.
Table C–2. NHPA Correspondence
Date Sender and Recipient Description ADAMS No.(a)
February 9, 2015 D. Wrona (NRC) to R. Nelson (ACHP)
Request for scoping comments/notification of Section 106 review
ML15023A094
February 9, 2015 D. Wrona (NRC) to A. Haaker, Illinois Historic Preservation Agency
Request for scoping comments/notification of Section 106 review
ML15022A578
February 9, 2015 D. Wrona (NRC) to J. Greendeer, Ho-Chunk Nation
Request for scoping comments/notification of Section 106 review
ML15023A139
February 9, 2015 D. Wrona (NRC) to S. Cadue, Kickapoo Tribe of Indians of the Kickapoo Reservation in Kansas
Request for scoping comments/notification of Section 106 review
ML15023A139
February 9, 2015 D. Wrona (NRC) to G. Salazar, Kickapoo Tribe of Oklahoma
Request for scoping comments/notification of Section 106 review
ML15023A139
February 9, 2015 D. Wrona (NRC) to D. Lankford, Miami Tribe of Oklahoma
Request for scoping comments/notification of Section 106 review
ML15023A139
February 9, 2015 D. Wrona (NRC) to J. Froman, Peoria Tribe of Indians of Oklahoma
Request for scoping comments/notification of Section 106 review
ML15023A139
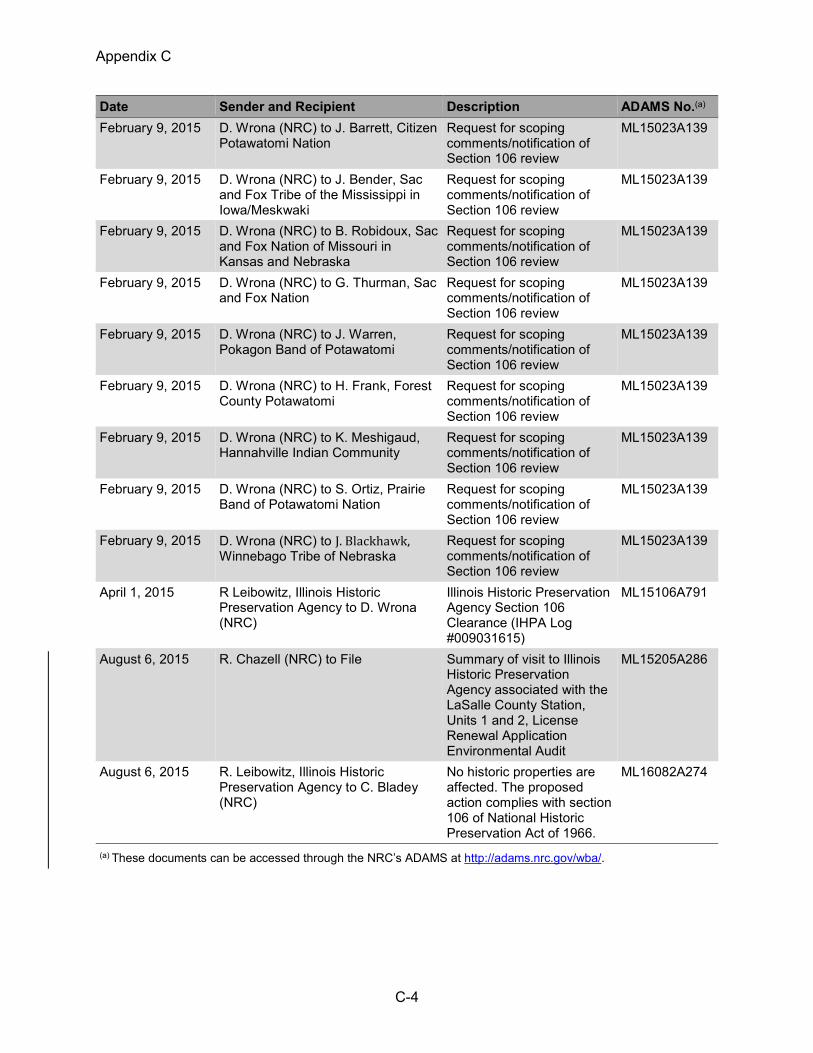
Appendix C
C-4
Date Sender and Recipient Description ADAMS No.(a)
February 9, 2015 D. Wrona (NRC) to J. Barrett, Citizen Potawatomi Nation
Request for scoping comments/notification of Section 106 review
ML15023A139
February 9, 2015 D. Wrona (NRC) to J. Bender, Sac and Fox Tribe of the Mississippi in Iowa/Meskwaki
Request for scoping comments/notification of Section 106 review
ML15023A139
February 9, 2015 D. Wrona (NRC) to B. Robidoux, Sac and Fox Nation of Missouri in Kansas and Nebraska
Request for scoping comments/notification of Section 106 review
ML15023A139
February 9, 2015 D. Wrona (NRC) to G. Thurman, Sac and Fox Nation
Request for scoping comments/notification of Section 106 review
ML15023A139
February 9, 2015 D. Wrona (NRC) to J. Warren, Pokagon Band of Potawatomi
Request for scoping comments/notification of Section 106 review
ML15023A139
February 9, 2015 D. Wrona (NRC) to H. Frank, Forest County Potawatomi
Request for scoping comments/notification of Section 106 review
ML15023A139
February 9, 2015 D. Wrona (NRC) to K. Meshigaud, Hannahville Indian Community
Request for scoping comments/notification of Section 106 review
ML15023A139
February 9, 2015 D. Wrona (NRC) to S. Ortiz, Prairie Band of Potawatomi Nation
Request for scoping comments/notification of Section 106 review
ML15023A139
February 9, 2015 D. Wrona (NRC) to J. Blackhawk, Winnebago Tribe of Nebraska
Request for scoping comments/notification of Section 106 review
ML15023A139
April 1, 2015 R Leibowitz, Illinois Historic Preservation Agency to D. Wrona (NRC)
Illinois Historic Preservation Agency Section 106 Clearance (IHPA Log #009031615)
ML15106A791
August 6, 2015 R. Chazell (NRC) to File Summary of visit to Illinois Historic Preservation Agency associated with the LaSalle County Station, Units 1 and 2, License Renewal Application Environmental Audit
ML15205A286
August 6, 2015 R. Leibowitz, Illinois Historic Preservation Agency to C. Bladey (NRC)
No historic properties are affected. The proposed action complies with section 106 of National Historic Preservation Act of 1966.
ML16082A274
(a) These documents can be accessed through the NRC’s ADAMS at http://adams.nrc.gov/wba/.

Appendix C
C-5
C.4 References
36 CFR Part 800. Code of Federal Regulations, Title 36, Parks, Forests, and Public Property, Part 800, “Protection of historic properties.” 50 CFR Part 402. Code of Federal Regulations, Title 50, Wildlife and Fisheries, Part 402, “Interagency cooperation—Endangered Species Act of 1973, as amended.” Endangered Species Act of 1973, as amended. 16 U.S.C. § 1531 et seq. [FWS] U.S. Fish and Wildlife Service. 2013. “Endangered Species Program: What We Do: Consultations: Frequently Asked Questions.” July 15, 2013. Available at <http://www.fws.gov/endangered/what-we-do/faq.html#8> (accessed 5 June 2014). [FWS] U.S. Fish and Wildlife Service. 2015a. Illinois County Distribution, Federally Endangered, Threatened, and Candidate Species. Midwest Region. Updated September 30, 2015. Accessed October 9, 2015. Available at <http://www.fws.gov/midwest/endangered/lists/illinois-cty.html> [FWS] U.S. Fish and Wildlife Service. 2015b. Letter from FWS to NRC. Subject: LaSalle Power Plant License Renewal. List of threatened and endangered species that may occur in your proposed project location, and/or may be affected by your proposed project. February 27, 2015. ADAMS No. ML15126A069. [FWS and NMFS] U.S. Fish and Wildlife Service and National Marine Fisheries Service. 1998. Endangered Species Consultation Handbook: Procedures for Conducting Consultation and Conference Activities Under Section 7 of the Endangered Species Act. March 1998. 315 p. Available at <http://www.fws.gov/endangered/esa-library/pdf/esa_section7_handbook.pdf> (accessed 8 July 2013). Magnuson–Stevens Fishery Conservation and Management Act, as amended. 16 U.S.C. § 1801 et seq. National Environmental Policy Act of 1969, as amended. 42 U.S.C. § 4321 et seq. National Historic Preservation Act of 1966, as amended. 54 U.S.C. § 300101 et seq.


CHRONOLOGY OF ENVIRONMENTAL REVIEW CORRESPONDENCE


D-1
D. Chronology of Environmental Review Correspondence
This appendix contains a chronological listing of correspondence between the U.S. Nuclear Regulatory Commission (NRC) and external parties as part of its license renewal application (LRA) environmental review for LaSalle County Station, Units 1 and 2 (LSCS) other than consultation correspondence and comments received during the scoping process. Consultation correspondence is listed and discussed in Appendix C of this supplemental environmental impact statement (SEIS). Scoping comments are provided and addressed in Appendix A of this SEIS and in the Scoping Summary Report (see Table D–1 below). All documents are available electronically from the NRC’s Public Electronic Reading Room found on the Internet at the following Web address: http://www.nrc.gov/reading-rm.html. From this site, the public can gain access to the NRC’s Agencywide Documents Access and Management System (ADAMS), which provides text and image files of the NRC’s public documents in ADAMS. The ADAMS accession number for each document is included in the following table.
D.1 Environmental Review Correspondence
Table D–1 lists the environmental review correspondence, by date, beginning with the request by Exelon Generation Company, LLC (Exelon) to renew the operating licenses for LSCS.
Table D–1. Environmental Review Correspondence
Date Correspondence Description ADAMS No. December 9, 2014 Transmittal of LSCS LRA from Exelon to NRC ML14343A840 December 11, 2014 Receipt and availability of LSCS LRA ML14337A267 December 29, 2014 Letter from Illinois Environmental Protection Agency to NRC
regarding LSCS Clean Water Act Section 401 Certification ML15022A325
January 26, 2015 Determination of acceptability and sufficiency for docketing, proposed review schedule, and opportunity for a hearing regarding the application, for renewal of the operating licenses for LSCS
ML15021A451
January 27, 2015 Notice of intent to prepare an environmental impact statement and conduct scoping for LSCS license renewal
ML15005A480
March 10, 2015 Transcript from afternoon public scoping meeting ML15083A538 March 10, 2015 Transcript from evening public scoping meeting ML15089A580 March 31, 2015 Transmittal of severe accident mitigation alterative (SAMA)
audit plan from NRC to Exelon ML15083A546
April 24, 2015 SAMA audit summary ML15106A812 April 28, 2015 Transmittal of environmental audit plan from NRC to Exelon ML15106A392 April 30, 2015 Transmittal of SAMA requests for additional information
(RAIs) from NRC to Exelon ML15114A320
May 20, 2015 Environmental audit summary ML15132A674 May 22, 2015 Transmittal of environmental RAIs from NRC to Exelon ML15142A764 May 29, 2015 Exelon response to SAMA RAIs ML15149A370 June 25, 2015 Summary of teleconference between NRC and Exelon
regarding transportation impacts for LSCS high burnup fuel ML15167A486

Appendix D
D-2
Date Correspondence Description ADAMS No. June 25, 2015 Transmittal of RAIs regarding transportation impacts for
LSCS high burnup fuel from NRC to Exelon ML15167A488
July 2, 2015 Exelon response to environmental RAIs ML15195A351 July 8, 2015 Scoping Summary Report ML15147A380 July 24, 2015 Exelon response to RAIs regarding transportation impacts for
LSCS high burnup fuel ML15205A003
July 31, 2015 Exelon transmittal of revisions to the License Renewal Application Environmental Report
ML15212A259
August 28, 2015 Revised response to RAIs regarding transportation impacts for LSCS high burnup fuel
ML15240A002
September 21, 2015 Resubmittal of Index Item # 058 (“ER References to be Docketed”) from Exelon
ML15273A423

ACTIONS AND PROJECTS CONSIDERED IN THE CUMULATIVE
IMPACTS ANALYSIS


E-1
E. Projects and Actions Considered in the Cumulative Impacts Analysis
Table E–1 identifies actions and projects considered in the U.S. Nuclear Regulatory Commission (NRC) staff’s analysis of cumulative impacts related to the environmental analysis of the continued operation of LaSalle County Station, Units 1 and 2 (LSCS). Potential cumulative impacts associated with these actions and projects are addressed in Section 4.16 of this Supplemental Environmental Impact Statement. However, not all actions or projects listed in this appendix are considered in each resource area because of the uniqueness of the resource and its geographic area of consideration.
Table E–1. Projects and Actions Considered in Cumulative Impact Analysis
Project Name Summary of Project
Location (Relative to LSCS) Status
Nuclear Projects Clinton Power Station, Unit 1
Nuclear power plant, one 1,067-MWe General Electric Type 6 reactor
DeWitt County, IL, approximately 75 mi (121 km) south. 50-mi (80 km) radius overlaps with that of LSCS
Operational (NRC 2015a)
Byron Station, Units 1 and 2
Nuclear power plant, two 1,121-MWe Westinghouse 4-loop reactors
Ogle County, IL, approximately 65 mi (105 km) north-northwest. 50-mi (80 km) radius overlaps with that of LSCS
Operational (NRC 2015b, 2015c)
Braidwood Station, Units 1 and 2
Nuclear power plant, two 1,121-MWe Westinghouse 4-loop reactors
Will County, IL, approximately 23 mi (37 km) east
Operational (NRC 2015d, 2015e)
Dresden Nuclear Power Station, Units 2 and 3
Nuclear power plant, two 867-MWe General Electric Type 3 reactors
Grundy County, IL, approximately 23 mi (37 km) east-northeast
Operational (NRC 2015f, 2015g)
Dresden Nuclear Power Station, Unit 1
Nuclear power plant (undergoing decommissioning)
Grundy County, IL, approximately 23 mi (37 km) east-northeast
Shut down in October 1978 and is currently in SAFSTOR. No dismantlement activities are under way. All spent fuel from DNPS Unit 1 transferred to the onsite Independent Spent Fuel Storage Installation (NRC 2015h)

Appendix E
E-2
Project Name Summary of Project
Location (Relative to LSCS) Status
Quad Cities Nuclear Power Station, Units 1 and 2
Nuclear power plant, two 867-MWe General Electric Type 3 reactors
Rock Island County, IL, approximately 91 mi (146 km) west-northwest. 50 mi (80 km) radius overlaps with that of LSCS
Operational (NRC 2015i, 2015j)
Renewable Energy Projects Grand Ridge Wind Farm
140-unit wind farm with 210 MW generating capacity and 34 MW energy storage support facility
Immediately west of LSCS property and extending southwest approximately 8 mi (13 km)
Operational (Invenergy 2015a, 2015b, 2015c, 2015d; Windpower 2015a, 2015b, 2015c, 2015d)
Top Crop Wind Farm 200-unit wind farm with 300 MW generating capacity
Grundy, LaSalle and Livingston Counties, IL, approximately 6 mi (10km) south-southeast
Operational (EIA 2015a, 2015b; Windpower 2015e, 2015f; EDP Renewables 2015)
Grand Ridge Solar Farm
Solar photovoltaic facility with 20 MW generating capacity
Streator, IL, approximately 8 mi (13 km) southwest
Operational (EIA 2015c, Invenergy 2015e)
Minonk Wind Farm 100-unit wind farm with 192 MW generating capacity
Woodford and Livingston Counties, IL, approximately 27 mi (43 km) southwest
Operational (EIA 2015d, Mortenson 2015)
Streator-Cayuga Ridge Wind Farm
150-unit wind farm with 300 MW generating capacity
Livingston County, IL, approximately 18 mi (29 km) southeast
Operational (EIA 2015e, Windpower 2015g)
Starved Rock Power Station
Hydroelectric dam with 6.8 MW generating capacity
On Illinois River, approximately 17 mi (28 km) west-northwest
Operational (EIA 2015f)
Midwest Hydro LLC Hydroelectric dam with 3.6 MW generating capacity
On Fox River, approximately 12 mi (19 km) northwest
Operational (EIA 2015g)
Morris Genco LLC Waste-to-energy biomass-fueled facility with 2 MW generating capacity
Grundy County, IL, approximately 17 mi (27 km) northwest
Operational (EIA 2015h)
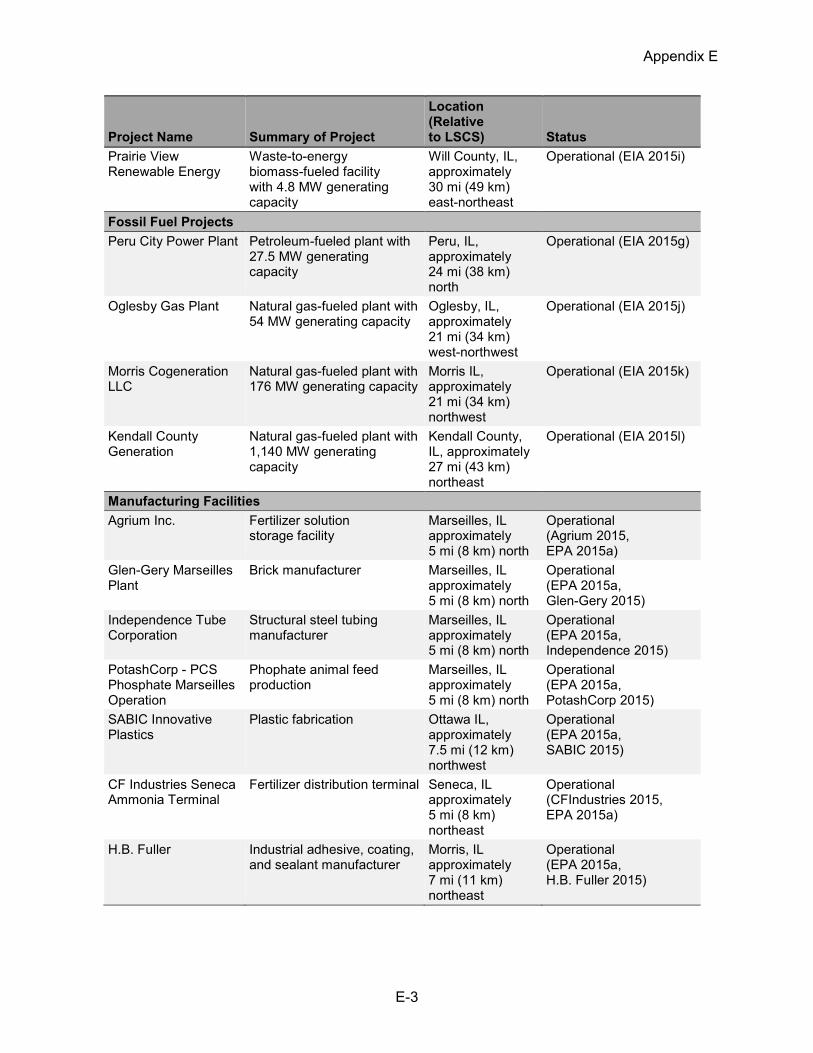
Appendix E
E-3
Project Name Summary of Project
Location (Relative to LSCS) Status
Prairie View Renewable Energy
Waste-to-energy biomass-fueled facility with 4.8 MW generating capacity
Will County, IL, approximately 30 mi (49 km) east-northeast
Operational (EIA 2015i)
Fossil Fuel Projects Peru City Power Plant Petroleum-fueled plant with
27.5 MW generating capacity
Peru, IL, approximately 24 mi (38 km) north
Operational (EIA 2015g)
Oglesby Gas Plant Natural gas-fueled plant with 54 MW generating capacity
Oglesby, IL, approximately 21 mi (34 km) west-northwest
Operational (EIA 2015j)
Morris Cogeneration LLC
Natural gas-fueled plant with 176 MW generating capacity
Morris IL, approximately 21 mi (34 km) northwest
Operational (EIA 2015k)
Kendall County Generation
Natural gas-fueled plant with 1,140 MW generating capacity
Kendall County, IL, approximately 27 mi (43 km) northeast
Operational (EIA 2015l)
Manufacturing Facilities Agrium Inc. Fertilizer solution
storage facility Marseilles, IL approximately 5 mi (8 km) north
Operational (Agrium 2015, EPA 2015a)
Glen-Gery Marseilles Plant
Brick manufacturer Marseilles, IL approximately 5 mi (8 km) north
Operational (EPA 2015a, Glen-Gery 2015)
Independence Tube Corporation
Structural steel tubing manufacturer
Marseilles, IL approximately 5 mi (8 km) north
Operational (EPA 2015a, Independence 2015)
PotashCorp - PCS Phosphate Marseilles Operation
Phophate animal feed production
Marseilles, IL approximately 5 mi (8 km) north
Operational (EPA 2015a, PotashCorp 2015)
SABIC Innovative Plastics
Plastic fabrication Ottawa IL, approximately 7.5 mi (12 km) northwest
Operational (EPA 2015a, SABIC 2015)
CF Industries Seneca Ammonia Terminal
Fertilizer distribution terminal Seneca, IL approximately 5 mi (8 km) northeast
Operational (CFIndustries 2015, EPA 2015a)
H.B. Fuller Industrial adhesive, coating, and sealant manufacturer
Morris, IL approximately 7 mi (11 km) northeast
Operational (EPA 2015a, H.B. Fuller 2015)

Appendix E
E-4
Project Name Summary of Project
Location (Relative to LSCS) Status
Landfills LandComp Landfill 188 ac (76 ha) municipal
solid waste landfill Ottawa, IL, approximately 14 mi (2 km) northwest
Operational until 2034 (IEPA 2013, 2015)
Environtech, Inc. 169 ac (68 ha) municipal solid waste landfill
Morris, IL, approximately 17 mi (27 km) northeast
Expected to close 2015 (IEPA 2013, 2015)
Livingston Landfill 550 ac (223 ha) municipal solid waste landfill
Livingston, IL, approximately 22 mi (35 km) south
Operational until 2037 (IEPA 2013, 2015)
Prairie View Recycling and Disposal Facility
408 ac (165 ha) municipal solid waste landfill
Wilmington, IL, approximately 30 mi (48 km) northeast within former Joliet Army Ammunition Plant
Operational until 2040, (IEPA 2013, 2015)
Water Supply and Treatment Facilities City of Marseilles, water supply
Withdraws groundwater obtained from wells in the Cambrian-Ordovician Aquifer.
Approximately 6 mi (10 km) north-northwest
Operational (EPA 2015b, Exelon 2014)
City of Seneca, water supply
Withdraws groundwater obtained from wells in the Cambrian-Ordovician Aquifer.
Approximately 6 mi (10 km) north-northeast
Operational (EPA 2015b, Exelon 2014)
Village of Grand Ridge, water supply
Withdraws groundwater obtained from wells in the Buried Bedrock Valleys Aquifer.
Approximately 8.5 mi (13.5 km) east
Operational (EPA 2015a, Exelon 2014)
City of Marseilles, wastewater treatment
Water treatment with discharge to the Illinois River
Approximately 6 mi (10 km) north-northwest
Operational (EPA 2015a)
Various minor NPDES wastewater discharges
Various businesses with smaller wastewater discharges
Within 50 mi (80 km)
Operational (EPA 2015a)
Mining Projects U.S. Silica Sandstone mine and silica
production facility Ottawa, IL, approximately 12 mi (19.5 km) northwest
Operational (EPA 2015a, U.S. Silica 2015)
Unimin Corporation Sandstone mine and silica production facility
Utica, IL, approximately 18.5 mi (30 km) northwest
Operational (EPA 2015a, Unimin 2015)

Appendix E
E-5
Project Name Summary of Project
Location (Relative to LSCS) Status
Northern White Sand LLC
Sandstone mine and silica production facility that is proposing 350 ac (142 ha) expansion.
Utica, IL, approximately 16.5 mi (26.5 km) northwest
Operational Proposed expansion is pending before the LaSalle County Board (EPA 2015a, NewsTribune 2014)
Mississippi Sand LLC Proposed 314 ac (127 ha) sandstone mine near eastern entrance to Starved Rock State Park
Ottawa, IL, approximately 17 mi (27 km) north-northwest, near eastern entrance to Starved Rock State Park
On hold pending legal challenges (NewsTribune 2014)
Remediation Site Joliet Army Ammunition Plant
14-sq mi (36-sq. km) military complex operated from early 1940s through 1977 to manufacture, load, assemble, and package high-explosive artillery shells, bombs, mines, and small-arms ammunition. Other activities on site included testing of ammunition, washout and renovation of shells, and burning and demolition of explosives.
Joliet, IL, approximately 28 mi (45 km) northeast
Ongoing remediation under the purview of the U.S. Army. Land use controls are restricting land uses; portions are now under productive reuse by the U.S. Forest Service (Midewin National Tallgrass Prairie), the Veteran’s Administration (Abraham Lincoln National Cemetery), Will County (500-ac [202-ha] landfill), and productive uses through commercial and industrial redevelopment (EPA 2013).
Parks and Recreation Sites LaSalle Lake State Fish and Wildlife Area
2,058 ac (833 ha) lake that serves as the cooling lake for LaSalle County Station. Managed for public boating and fishing.
Onsite Operational. Managed by Illinois Department of Natural Resources (IDNR 2015a)
Marseilles State Fish and Wildlife Area
2,550 ac (1,032 ha) tract that serves as joint-use area for the Illinois Department of Natural Resources (as a hunting and habitat management site) and the Illinois National Guard (for live-fire training when hunting seasons are closed).
Approximately 1.5 mi (2.4 km) north
Operational. Cooperatively managed by Illinois Department of Natural Resources and Illinois Department of Military Affairs through Memorandum of Agreement (IDNR 2015b, ING undated)
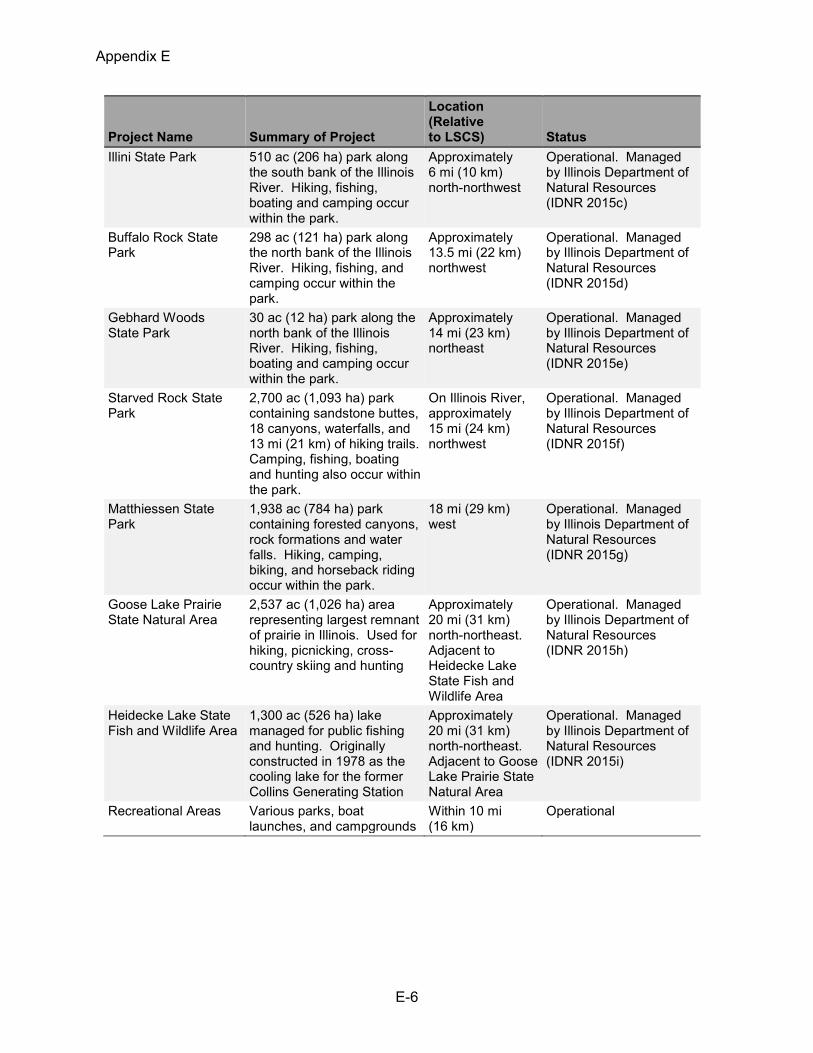
Appendix E
E-6
Project Name Summary of Project
Location (Relative to LSCS) Status
Illini State Park
510 ac (206 ha) park along the south bank of the Illinois River. Hiking, fishing, boating and camping occur within the park.
Approximately 6 mi (10 km) north-northwest
Operational. Managed by Illinois Department of Natural Resources (IDNR 2015c)
Buffalo Rock State Park
298 ac (121 ha) park along the north bank of the Illinois River. Hiking, fishing, and camping occur within the park.
Approximately 13.5 mi (22 km) northwest
Operational. Managed by Illinois Department of Natural Resources (IDNR 2015d)
Gebhard Woods State Park
30 ac (12 ha) park along the north bank of the Illinois River. Hiking, fishing, boating and camping occur within the park.
Approximately 14 mi (23 km) northeast
Operational. Managed by Illinois Department of Natural Resources (IDNR 2015e)
Starved Rock State Park
2,700 ac (1,093 ha) park containing sandstone buttes, 18 canyons, waterfalls, and 13 mi (21 km) of hiking trails. Camping, fishing, boating and hunting also occur within the park.
On Illinois River, approximately 15 mi (24 km) northwest
Operational. Managed by Illinois Department of Natural Resources (IDNR 2015f)
Matthiessen State Park
1,938 ac (784 ha) park containing forested canyons, rock formations and water falls. Hiking, camping, biking, and horseback riding occur within the park.
18 mi (29 km) west
Operational. Managed by Illinois Department of Natural Resources (IDNR 2015g)
Goose Lake Prairie State Natural Area
2,537 ac (1,026 ha) area representing largest remnant of prairie in Illinois. Used for hiking, picnicking, cross-country skiing and hunting
Approximately 20 mi (31 km) north-northeast. Adjacent to Heidecke Lake State Fish and Wildlife Area
Operational. Managed by Illinois Department of Natural Resources (IDNR 2015h)
Heidecke Lake State Fish and Wildlife Area
1,300 ac (526 ha) lake managed for public fishing and hunting. Originally constructed in 1978 as the cooling lake for the former Collins Generating Station
Approximately 20 mi (31 km) north-northeast. Adjacent to Goose Lake Prairie State Natural Area
Operational. Managed by Illinois Department of Natural Resources (IDNR 2015i)
Recreational Areas Various parks, boat launches, and campgrounds
Within 10 mi (16 km)
Operational

Appendix E
E-7
Project Name Summary of Project
Location (Relative to LSCS) Status
Other Projects Future Urbanization Construction of housing units
and associated commercial buildings; roads, bridges, and rail; water and/or wastewater treatment and distribution facilities; and associated pipelines as described in local land-use planning documents
Throughout region Construction would occur in the future, as described in State and local land-use planning documents.
Key: ac = acres; ha = hectares; km = kilometers; mi = miles; NPDES = National Pollutant Discharge Elimination System; sq. = square
E.2 References
Agrium. 2015. “Marseilles Solution Storage.” Available at <http://www.agrium.com/en/what-we-do/locations> (accessed 8 September 2015). CFIndustries. 2015. “Seneca Ammonia Terminal.” Available at <http://www.cfindustries.com/distribution_seneca-terminal.html> (accessed 18 August 2015). EDP Renewables. 2015. “Illinois/Top Crop Factsheet.” Available at <http://topcrop.edpr-windfarms.com/wp-content/uploads/sites/14/2014/03/Top-Crop_Fact-Sheet_6.25.15.pdf> (accessed 7 August 2015). [EIA] U.S. Energy Information Administration. 2015a. “Illinois State Profile and Energy Estimates, Profile Overview Interactive Map – Blackstone [Top Crop] Wind Farm LLC.” Available at <http://www.eia.gov/state/?sid=IL> (accessed 29 September 2015). [EIA] U.S. Energy Information Administration. 2015b. “Illinois State Profile and Energy Estimates, Profile Overview Interactive Map – Blackstone II [Top Cropn II] Wind Farm LLC.” Available at <http://www.eia.gov/state/?sid=IL> (accessed 29 September 2015). [EIA] U.S. Energy Information Administration. 2 015c. “Illinois State Profile and Energy Estimates, Profile Overview Interactive Map – Grand Ridge Solar Farm.” Available at <http://www.eia.gov/state/?sid=IL> (accessed 14 August 2015). [EIA] U.S. Energy Information Administration. 2015d. “Illinois State Profile and Energy Estimates, Profile Overview Interactive Map – Minonk Wind Farm.” Available at <http://www.eia.gov/state/?sid=IL> (accessed 14 August 2015). [EIA] U.S. Energy Information Administration. 2015e. “Illinois State Profile and Energy Estimates, Profile Overview Interactive Map – Streator Cayuga Ridge South.” Available at <http://www.eia.gov/state/?sid=IL> (accessed 30 September 2015). [EIA] U.S. Energy Information Administration. 2015f. “Illinois State Profile and Energy Estimates, Profile Overview Interactive Map – Peru Hydro.” Available at <http://www.eia.gov/state/?sid=IL> (accessed 14 August 2015). [EIA] U.S. Energy Information Administration. 2015g. “Illinois State Profile and Energy Estimates, Profile Overview Interactive Map – Dayton Hydro.” Available at <http://www.eia.gov/state/?sid=IL> (accessed 16 August 2015).
Appendix E
E-8
[EIA] U.S. Energy Information Administration. 2015h. “Illinois State Profile and Energy Estimates, Profile Overview Interactive Map – Morris Genco LLC.” Available at <http://www.eia.gov/state/?sid=IL> (accessed 30 September 2015). [EIA] U.S. Energy Information Administration. 2015i. “Illinois State Profile and Energy Estimates, Profile Overview Interactive Map – Prairie View.” Available at <http://www.eia.gov/state/?sid=IL> (accessed 17 August 2015). [EIA] U.S. Energy Information Administration. 2015j. “Illinois State Profile and Energy Estimates, Profile Overview Interactive Map – Oglesby.” Available at <http://www.eia.gov/state/?sid=IL> (accessed 16 August 2015). [EIA] U.S. Energy Information Administration. 2015k. “Illinois State Profile and Energy Estimates, Profile Overview Interactive Map – Morris Cogeneration LLC.” Available at <http://www.eia.gov/state/?sid=IL> (accessed 16 August 2015). [EIA] U.S. Energy Information Administration. 2015l. “Illinois State Profile and Energy Estimates, Profile Overview Interactive Map – Kendall County Generation Facility.” Available at <http://www.eia.gov/state/?sid=IL> (accessed 16 August 2015). [EPA] U.S. Environmental Protection Agency. 2013. “Region 5 Cleanup Sites: Joliet Army Ammunition Plant.” November 14, 2013. Available at <http://www.epa.gov/region05/cleanup/jolietarmy/index.html> (accessed 17 August 2015). [EPA] U.S. Environmental Protection Agency. 2015a. “Envirofacts PCS/ICIS search results for Peru Illinois: Facilities with permits to discharge wastewater to waters of the United States.” August 14, 2015. Available at <http://oaspub.epa.gov/enviro/PCSICISQuery.list?minx=-89.148560&miny=40.996484&maxx=-88.187256&maxy=4l> (accessed 14 August 2015). [EPA] U.S. Environmental Protection Agency. 2015b. “Envirofacts SDWIS search results for LaSalle, Illinois: List of Safe Drinking Water Systems.” August 17, 2015. Available at <http://www.epa.gov/enviro/facts/sdwis/search.html> (accessed 17 August 2015). [Exelon] Exelon Generation Company, LLC. 2014. Applicant’s Environmental Report – Operating License Renewal Stage, LaSalle County Station, Units 1 and 2, License Renewal Application. Kennett Square, PA: Exelon. December 9, 2014. ADAMS No. ML14343A883. [Glen-Gery] Glen-Gery Corporation. 2015. “Marseilles Plant.” Available at <http://www.glengery.com/about-us/locations/item/164981492-marseilles-plant/164981492-marseilles-plant> (accessed 1 October 2015). H.B. Fuller. 2015. Available at <http://www.hbfuller.com/north-america> (accessed 1 October 2015) [IDNR] Illinois Department of Natural Resources. 2015a. “LaSalle Lake State Fish & Wildlife Area.” Available at <http://www.dnr.state.il.us/Lands/Landmgt/PARKS/R1/LASALLE.HTM> (accessed 18 August 2015). [IDNR] Illinois Department of Natural Resources. 2015b. “Marseilles State Fish & Wildlife Area.” Available at <http://www.dnr.state.il.us/Lands/Landmgt/PARKS/R1/MARSEIL.HTM> (accessed 18 August 2015). [IDNR] Illinois Department of Natural Resources. 2015c. “Illini State Park.” Available at <http://www.dnr.illinois.gov/Parks/Pages/Illini.aspx> (accessed 18 August 2015). [IDNR] Illinois Department of Natural Resources. 2015d. “Buffalo Rock State Park.” Available at <http://www.dnr.state.il.us/Lands/Landmgt/PARKS/I&M/EAST/BUFFALO/Home.htm> (accessed 18 August 2015).

Appendix E
E-9
[IDNR] Illinois Department of Natural Resources. 2015e. “Gebhard Woods State Park.” Available at <http://www.dnr.state.il.us/Lands/Landmgt/PARKS/I&M/EAST/GEBHARD/Park.htm> (accessed 18 August 2015). [IDNR] Illinois Department of Natural Resources. 2015f. “Starved Rock State Park.” 2015 Available at <http://www.dnr.illinois.gov/Parks/Pages/StarvedRock.aspx> (accessed 18 August 2015). [IDNR] Illinois Department of Natural Resources. 2015g. “Matthiessen State Park.” Available at <http://www.dnr.state.il.us/Lands/Landmgt/PARKS/R1/mttindex.htm> (accessed 18 August 2015). [IDNR] Illinois Department of Natural Resources. 2015h. “Goose Lake Prairie State Natural Area.” Available at <http://www.dnr.illinois.gov/Parks/Pages/GooseLakePrairie.aspx> (accessed 18 August 2015). [IDNR] Illinois Department of Natural Resources. 2015i. “Heidecke Lake State Fish and Wildlife Area.” Available at <http://www.dnr.state.il.us/Lands/Landmgt/PARKS/R2/Heidecke.htm> (accessed 18 August 2015). [IEPA] Illinois Environmental Protection Agency. 2013. Nonhazardous Solid Waste Management and Landfill Capacity in Illinois: 2012. Springfield, IL: IEPA. October 2013. 67 p. Available at <http://www.epa.state.il.us/land/landfill-capacity/2012/report.pdf> (accessed 14 August 2015). [IEPA] Illinois Environmental Protection Agency. 2015. Illinois Landfill Projections of Disposal Capacity as of January 1, 2015. Springfield, IL: IEPA. July 2015. 48 p. Available at <http://www.epa.illinois.gov/Assets/iepa/waste-management/landfills/landfill-capacity/landfill-capacity-report-2015.pdf> (accessed 14 August 2015). [Independence] Independence Tube Corporation. 2015. Available at <http://www.independencetube.com/history> (accessed 1 October 2015). [ING] Illinois National Guard. Undated. “Marseilles Training Area.” Available at <http://www.il.ngb.army.mil/MilitaryAffairs/MTA/> (accessed 18 August 2015). [Invenergy] Invenergy, LLC. 2015a. “Grand Ridge I.” Available at <http://www.invenergyllc.com/ProjectsbyCountry/UnitedStates/GrandRidgeI.aspx> (accessed 14 August 2015). [Invenergy] Invenergy, LLC. 2015b. “Grand Ridge II – IV.” Available at <http://www.invenergyllc.com/ProjectsbyCountry/UnitedStates/GrandRidgeIIIV.aspx> (accessed 14 August 2015). [Invenergy] Invenergy, LLC. 2015c. “Grand Ridge IV Storage.” Available at http://www.invenergyllc.com/ProjectsbyCountry/UnitedStates/GrandRidgeIVStorage.aspx (accessed 14 August 2015). [Invenergy] Invenergy, LLC. 2015d. “Grand Ridge Energy Storage.” Available at http://www.invenergyllc.com/ProjectsbyCountry/UnitedStates/GrandRidgeEnergyStorage.aspx (accessed 14 August 2015). [Invenergy] Invenergy, LLC. 2015e. “Grand Ridge Solar.” Available at <http://www.invenergyllc.com/ProjectsbyCountry/UnitedStates/GrandRidgeSolar.aspx> (accessed 14 August 2015).

Appendix E
E-10
Mortenson 2015. “Minonk Wind Farm Project.” Available at <http://www.mortenson.com/wind/projects/minonk-wind-farm> (accessed 14 August 2015). [NewsTribune] LaSalle News Tribune. 2014. “Sorting out LaSalle County’s four newest sand mines.” July 2, 2014. Available at <http://newstrib.com/main.asp?SectionID=2&SubSectionID=232&ArticleID=37558> (accessed 8 September 2015). [NRC] U.S. Nuclear Regulatory Commission. 2015a. “Clinton Power Station, Unit 1.” June 30, 2015. Available at <http://www.nrc.gov/info-finder/reactor/clin.html> (accessed 11 August 2015). [NRC] U.S. Nuclear Regulatory Commission. 2015b. “Byron Station, Unit 1.” June 30, 2015. Available at <http://www.nrc.gov/info-finder/reactor/byro1.html> (accessed 11 August 2015). [NRC] U.S. Nuclear Regulatory Commission. 2015c. “Byron Station, Unit 2.” June 30, 2015. Available at <http://www.nrc.gov/info-finder/reactor/byro2.html> (accessed 11 August 2015). [NRC] U.S. Nuclear Regulatory Commission. 2015d. “Braidwood Station, Unit 1.” June 30, 2015. Available at <http://www.nrc.gov/info-finder/reactor/brai1.html> (accessed 11 August 2015). [NRC] U.S. Nuclear Regulatory Commission. 2015e. “Braidwood Station, Unit 2.” June 30, 2015. Available at <http://www.nrc.gov/info-finder/reactor/brai2.html> (accessed 11 August 2015). [NRC] U.S. Nuclear Regulatory Commission. 2015f. “Dresden Nuclear Power Station, Unit 2.” June 30, 2015. Available at <http://www.nrc.gov/info-finder/reactor/dres2.html> (accessed 11 August 2015). [NRC] U.S. Nuclear Regulatory Commission. 2015g. “Dresden Nuclear Power Station, Unit 3.” July 1, 2015. Available at <http://www.nrc.gov/info-finder/reactor/dres3.html> (accessed 11 August 2015). [NRC] U.S. Nuclear Regulatory Commission. 2015h. “Dresden – Unit 1.” June 12, 2015. Available at <http://www.nrc.gov/info-finder/decommissioning/power-reactor/ dresden-nuclear-power-station-unit-1.html> (accessed 11 August 2015). [NRC] U.S. Nuclear Regulatory Commission. 2015i. “Quad Cities Nuclear Power Station, Unit 1.” July 1, 2015. Available at <http://www.nrc.gov/info-finder/reactor/quad1.html> (accessed 11 August 2015). [NRC] U.S. Nuclear Regulatory Commission. 2015j. “Quad Cities Nuclear Power Station, Unit 2.” July 1, 2015. Available at <http://www.nrc.gov/info-finder/reactor/quad2.html> (accessed 11 August 2015). PotashCorp 2015. “PotashCorp – Marseilles.” Available at <http://www.potashcorp.com/about/facilities/phosphate/marseilles/> (accessed 18 August 2015). [SABIC] Saudi Basic Industries Corporation. 2015. “Annual Report 2014.” Available at <http://www.sabic.com/me/en/newsandmediarelations/publications/overview_annual_report> (accessed 1 October 2015). [Unimin] Unimin Corporation. 2015. “Unimin Locations.” Available at <http://www.unimin.com/unimin-locations.cfm> (accessed 9 September 2015.) U.S. Silica 2015. “U.S. Silica Locations – Ottawa IL.” Available at <http://www.ussilica.com/locations/ottawa-il> (accessed 19 August 2015).
Appendix E
E-11
Windpower 2015a. “The Windpower - Grand Ridge I Wind Farm.” Available at <http://www.thewindpower.net/windfarm_en_4022_grand-ridge-i.php> (accessed 7 August 2015). Windpower 2015b. “The Windpower - Grand Ridge II Wind Farm.” Available at <http://www.thewindpower.net/windfarm_en_10985_grand-ridge-ii.php> (accessed 7 August 2015). Windpower 2015c. “The Windpower - Grand Ridge III Wind Farm.” Available at <http://www.thewindpower.net/windfarm_en_10986_grand-ridge-iii.php> (accessed 7 August 2015). Windpower 2015d. “The Windpower - Grand Ridge IV Wind Farm.” Available at <http://www.thewindpower.net/windfarm_en_18016_grand-ridge-iv.php> (accessed 7 August 2015). Windpower 2015e. “The Windpower – Top Crop Wind Farm.” Available at <http://www.thewindpower.net/windfarm_en_724_top-crop.php> (accessed 7 August 2015). Windpower 2015f. “The Windpower - Top Crop II Wind Farm.” Available at <http://www.thewindpower.net/windfarm_en_21266_top-crop-ii.php> (accessed 7 August 2015). Windpower 2015g. “The Windpower – Streator Cayuga Ridge Wind Farm.” Available at <http://www.thewindpower.net/windfarm_en_10983_streator-cayuga-ridge-wind-farm.php> (accessed 14 August 2015).


U.S. NUCLEAR REGULATORY COMMISSION STAFF EVALUATION OF
SEVERE ACCIDENT MITIGATION ALTERNATIVES FOR LASALLE COUNTY STATION, UNITS 1 AND 2, IN SUPPORT OF LICENSE
RENEWAL APPLICATION REVIEW


F-1
F. U.S. Nuclear Regulatory Commission Staff Evaluation of Severe Accident Mitigation Alternatives for LASALLE COUNTY STATION, UNITS 1 AND 2, in Support of License Renewal Application Review
F.1 Introduction
Exelon Generation Company, LLC (Exelon) submitted a license renewal application for LaSalle County Station (LSCS), Units 1 and 2. Exelon assessed severe accident mitigation alternatives (SAMAs) for LSCS in Appendix F of its Environmental Report (ER) (Exelon 2014a). This assessment was based on the most recent LSCS probabilistic risk assessment (PRA) available at that time, a plant-specific offsite consequence analysis performed using the MELCOR Accident Consequence Code System (MACCS2) Version 1.13.1 computer code, and insights from the LSCS individual plant examination (IPE) and individual plant examination of external events (IPEEE). In identifying and evaluating potential SAMAs, Exelon considered SAMAs that addressed the major contributors to core damage frequency (CDF) and release frequency at LSCS, as well as SAMA candidates from six other boiling water reactor (BWR) plants. Exelon initially identified 26 potential SAMAs. Then, Exelon reduced the list to 25 unique SAMA candidates by eliminating SAMAs that are not applicable to LSCS, that have already been implemented at LSCS, or that have excessive implementation costs. Next, Exelon assessed the costs and benefits associated with each of the 25 potential SAMAs and concluded that 14 SAMA candidates were potentially cost beneficial at the 95th percentile. Exelon performed sensitivity analyses on the real discount rate, CDF uncertainty at the 95th percentile, as well as the offsite consequence parameters, and considered those results in the cost-benefit analysis. As an additional sensitivity analysis in the ER, Exelon considered the planned installation of a hardened vent pipe as the base case to provide supplemental information on potentially cost-beneficial SAMAs following the vent pipe installation. Based on a review of Exelon’s SAMA assessment and the SAMA audit held on April 7‒8, 2015, the U.S. Nuclear Regulatory Commission (NRC) staff issued requests for additional information (RAIs) to Exelon by letter dated April 30, 2015 (NRC 2015). Key questions concerned the differences between LSCS Units 1 and 2, systems shared between the two units and how these are modeled in the PRA; the definition and assignment of accident classes; additional details on the Level 2 and Level 3 PRA models, including the basis for representative sequences for each release category; the determination of the frequency of the intact release category; the identification and screening of candidate SAMAs; the potential for additional SAMAs to mitigate fire risk; the evaluation of the risk reduction of certain SAMAs; and the basis for the SAMA cost estimates. By letter dated May 29, 2015, Exelon submitted additional information that included revisions and a correction, which changed the determination of one SAMA from potentially cost beneficial in the ER to not cost beneficial (Exelon 2015). Exelon’s responses addressed the NRC staff’s concerns. The evaluation of the LSCS SAMA analysis is presented below.
F.2 Estimate of Risk for LSCS
Exelon’s estimates of offsite risk at LSCS are summarized in Section F.2.1. The summary is followed by the NRC staff’s review of Exelon’s risk estimates in Section F.2.2.
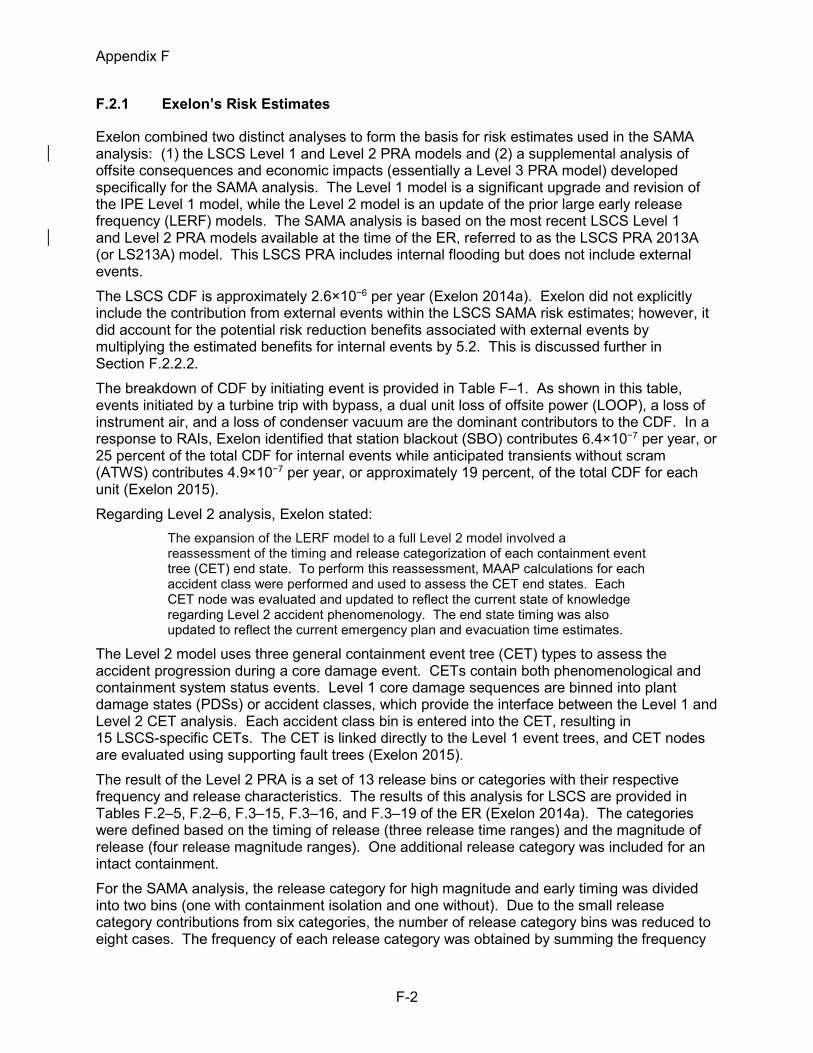
Appendix F
F-2
F.2.1 Exelon’s Risk Estimates
Exelon combined two distinct analyses to form the basis for risk estimates used in the SAMA analysis: (1) the LSCS Level 1 and Level 2 PRA models and (2) a supplemental analysis of offsite consequences and economic impacts (essentially a Level 3 PRA model) developed specifically for the SAMA analysis. The Level 1 model is a significant upgrade and revision of the IPE Level 1 model, while the Level 2 model is an update of the prior large early release frequency (LERF) models. The SAMA analysis is based on the most recent LSCS Level 1 and Level 2 PRA models available at the time of the ER, referred to as the LSCS PRA 2013A (or LS213A) model. This LSCS PRA includes internal flooding but does not include external events. The LSCS CDF is approximately 2.6×10⁻⁶ per year (Exelon 2014a). Exelon did not explicitly include the contribution from external events within the LSCS SAMA risk estimates; however, it did account for the potential risk reduction benefits associated with external events by multiplying the estimated benefits for internal events by 5.2. This is discussed further in Section F.2.2.2. The breakdown of CDF by initiating event is provided in Table F–1. As shown in this table, events initiated by a turbine trip with bypass, a dual unit loss of offsite power (LOOP), a loss of instrument air, and a loss of condenser vacuum are the dominant contributors to the CDF. In a response to RAIs, Exelon identified that station blackout (SBO) contributes 6.4×10⁻⁷ per year, or 25 percent of the total CDF for internal events while anticipated transients without scram (ATWS) contributes 4.9×10⁻⁷ per year, or approximately 19 percent, of the total CDF for each unit (Exelon 2015). Regarding Level 2 analysis, Exelon stated:
The expansion of the LERF model to a full Level 2 model involved a reassessment of the timing and release categorization of each containment event tree (CET) end state. To perform this reassessment, MAAP calculations for each accident class were performed and used to assess the CET end states. Each CET node was evaluated and updated to reflect the current state of knowledge regarding Level 2 accident phenomenology. The end state timing was also updated to reflect the current emergency plan and evacuation time estimates.
The Level 2 model uses three general containment event tree (CET) types to assess the accident progression during a core damage event. CETs contain both phenomenological and containment system status events. Level 1 core damage sequences are binned into plant damage states (PDSs) or accident classes, which provide the interface between the Level 1 and Level 2 CET analysis. Each accident class bin is entered into the CET, resulting in 15 LSCS-specific CETs. The CET is linked directly to the Level 1 event trees, and CET nodes are evaluated using supporting fault trees (Exelon 2015). The result of the Level 2 PRA is a set of 13 release bins or categories with their respective frequency and release characteristics. The results of this analysis for LSCS are provided in Tables F.2–5, F.2–6, F.3–15, F.3–16, and F.3–19 of the ER (Exelon 2014a). The categories were defined based on the timing of release (three release time ranges) and the magnitude of release (four release magnitude ranges). One additional release category was included for an intact containment. For the SAMA analysis, the release category for high magnitude and early timing was divided into two bins (one with containment isolation and one without). Due to the small release category contributions from six categories, the number of release category bins was reduced to eight cases. The frequency of each release category was obtained by summing the frequency

Appendix F
F-3
of the individual accident progression CET endpoints binned into the release category. Source terms were developed for each of the 13 release categories using the results of Modular Accident Analysis Program (MAAP) Version 4.0.5 computer code calculations (Exelon 2014a). Exelon computed offsite consequences for potential releases of radiological material using the MACCS2 Version 1.13.1 code and analyzed exposure and economic impacts from its determination of offsite and onsite risks. Inputs for these analyses include plant-specific and site-specific input values for core radionuclide inventory, source term and release characteristics, site meteorological data, projected population distribution and growth within a 50-mile (80-km) radius, emergency response evacuation modeling, and economic data. The estimation of onsite impacts (in terms of cleanup costs, decontamination costs, and occupational dose) is based on guidance in NUREG/BR–0184 (NRC 1997a). In its calculation for replacement power costs, Exelon accounted for the increased electric power output of LSCS compared to the generic reactor power output presented in NUREG/BR–0184 (NRC 1997a).
Table F–1. LaSalle County Station CDF for Internal Events
Initiating Event CDF(a)
(per year) Percent CDF Contribution
Turbine Trip with Bypass 5.6×10⁻⁷ 22 Dual Unit Loss of Offsite Power 3.1×10⁻⁷ 12 Loss of Instrument Air 2.8×10⁻⁷ 11 Loss of Condenser Vacuum 2.7×10⁻⁷ 10 Fire Protection System Pipe Rupture in Reactor Building 1.9×10⁻⁷ 7 Main Steam Isolation Valve Closure 1.4×10⁻⁷ 5 Loss of Turbine Building Component Cooling Water 1.2×10⁻⁷ 5 Loss of Feedwater 1.2×10⁻⁷ 5 Loss of Offsite Power 7.2×10⁻⁸ 3 Manual Shutdown 5.9×10⁻⁸ 2 Inadvertently Open Relief Valve 5.9×10⁻⁸ 2 Loss of 125 V Direct Current Bus 2A 5.1×10⁻⁸ 2 Loss of 125 V Direct Current Buses 2A and 2B 3.9×10⁻⁸ 2 Other Initiating Events(b) 3.3×10⁻⁷ 13 Total (Internal Events)(c) 2.58×10⁻⁶ 100 (a) CDF based on Fussell-Vesely importance and total CDF. (b) Other initiating events each contributing less than 2 percent to total CDF. (c) Column totals may be different because of rounding.
Key: CDF = core damage frequency
Source: Exelon 2014a
In the ER, as updated by the response to RAIs (Exelon 2015), Exelon calculated the dose risk to be 0.0764 person-sievert (Sv) per year (7.64 person-rem per year) to the population within 80 km (50 mi) of the LSCS site. The offsite economic cost risk was calculated to be $57,700 per year. The breakdown of the population dose risk by containment release category is summarized in Table F–2. The medium magnitude, intermediate release category accounted

Appendix F
F-4
for 52 and 62 percent of the population dose risk and offsite economic cost risk, respectively. Additionally, two categories (medium magnitude, early release and high magnitude, early releases for breaks outside containment) together accounted for approximately 41 and 31 percent of the population dose risk and offsite economic cost risk, respectively.
F.2.2 Review of Exelon’s Risk Estimates
Exelon’s determination of offsite risk at the LSCS site is based on the following three major elements of the analysis:
(1) Upgraded Level 1 risk model that supersedes the 1994 IPE/IPEEE submittal (CECO 1994), a new interim fire PRA and the seismic and other external event analyses of the 1994 IPE/IPEEE submittal;
(2) Expanded Level 2 risk model; and (3) MACCS2 analyses performed by Exelon to translate fission product source terms
and release frequencies from the Level 2 PRA model into offsite consequence measures.
The NRC staff reviewed each of these analyses to determine the acceptability of the LSCS risk estimates for the SAMA analysis.
Table F–2. Base Case Mean Population Dose Risk and Offsite Economic Cost Risk for Internal Events
Release Category Population Dose Risk(a) Offsite Economic Cost Risk
ID(b) Frequency (per year) person-rem/year % Contribution $/year % Contribution
H/E–BOC(c) 8.3×10‒8 1.3×100 18 7.2×10³ 13 H/E 6.0×10‒8 3.2×10‒1 4 2.8×10³ 5 H/I(d) 1.9×10‒8 1.1×10‒1 1 9.7×10² 2 M/E 2.4×10‒7 1.7×100 23 1.0×10⁴ 18 M/I(d) 1.0×10‒6 3.9×100 52 3.6×10⁴ 62 L/E 3.9×10‒7 8.7×10‒2 1 1.3×10² 0.2 L/I(d) 1.5×10‒7 1.1×10‒1 1 1.8×10² 0.3 CI 6.2×10‒7 1.4×10‒3 <0.1 1.0×100 <0.1
Total 2.6×10⁻⁶ 7.6×100 100 5.8×10⁴ 100 (a)Unit Conversion Factor: 1 Sv = 100 rem (b)Release Mode Nomenclature (Magnitude/Timing)
Magnitude: High (H)—Greater than 10 percent release fraction for cesium iodide Medium (M)—1 to 10 percent release fraction for cesium iodide Low (L)—0.1 to 1 percent release fraction for cesium iodide Low-Low (LL)—Less than 0.1 percent release fraction for cesium iodide Containment intact (CI)—Much less than 0.1 percent release fraction for cesium iodide
Timing: Early (/E)—Less than 5 hours Intermediate (/I)—5 to 24 hours Late (/L)—Greater than 24 hours
Appendix F
F-5
Release Category Population Dose Risk(a) Offsite Economic Cost Risk (c)Contributions from initiators with breaks outside containment (BOC) (d)The release categories for late timing were negligible and subsumed into the intermediate release categories for
H, M, and L releases. Categories for LL magnitude releases were negligible and subsumed into the L release category with intermediate timing.
Sources: Exelon 2014a, 2015
F.2.2.1 Internal Events CDF Model
Commonwealth Edison Company submitted a combined IPE/IPEEE report to fulfill the requirements of Generic Letter 88-20 (NRC 1988). This submittal was brief and referred to the information in NUREG/CR–4832, “Analysis of the LaSalle Unit 2 Nuclear Power Plant: Risk Methods Integration and Evaluation Program (RMIEP),” which was performed by Sandia National Laboratories (SNL) and sponsored by the NRC (NRC 1992). The NRC staff’s review of the LSCS IPE is described in its 1995 memorandum (NRC 1995). Based on its review of the LSCS nuclear power plant IPE submittal and associated documentation, the NRC staff concluded that the licensee met the intent of Generic Letter 88-20 (NRC 1988). As indicated in the NRC staff review, while the licensee concluded that no vulnerabilities exist at LSCS, the licensee cited potential improvements identified and discussed in Volume 3, Part 1 of the RMIEP report. These potential improvements are discussed in Section F.3.2. There have been numerous revisions to the LSCS PRA since the original 1994 IPE submittal. A listing of the complete revision history of the LSCS PRA, since the original IPE submittal, was provided in the ER (Exelon 2014a) and in response to an NRC staff RAI (Exelon 2015). The PRA revision history is summarized in Table F–3. A comparison of the CDF for internal events between the 1994 IPE and the current PRA model indicates there has been a significant reduction in total CDF (point estimate including internal floods from 3.4×10⁻⁵ per year8 to 2.6×10⁻⁶ per year). The CDF value from the 1994 IPE (3.4×10⁻⁵ per year) is within the range of CDF values reported in the IPEs for BWR 5/6 plant units. In NUREG–1560, CDF values ranged from 1×10⁻⁵
per year to 4×10⁻⁵ per year (NRC 1997b). It is recognized that other plants have updated the values for CDF subsequent to the IPE submittals to reflect modeling and hardware changes. The NRC staff considered the peer review performed for the LSCS PRA and the potential impact of the review findings on the SAMA evaluation. In the ER, Exelon described the 2008 Boiling Water Reactor Owners Group (BWROG) peer review of the LSCS PRA. The peer review was indicated to be performed against Addendum B of the then current PRA Standard (ASME/ANS 2005) with the criteria in Regulatory Guide 1.200, Revision 1 (NRC 2007), including the NRC positions stated in Appendix A of the regulatory guide. Exelon indicated that a PRA update was conducted in 2011 that addressed the majority of the 2008 peer review findings and American Society of Mechanical Engineers/American Nuclear Society (ASME/ANS) PRA standards supporting requirements assigned a Capability Category II or lower. In ER Table F.2–7 (Exelon 2014a), a summary was presented on the remaining open
8 The 3.4×10⁻⁶ per year total CDF is the sum of the point estimates for internal events and internal floods
from RMIEP, as given in the Technical Evaluation Report attached to the NRC review of the LSCS IPE (NRC 1995).

Appendix F
F-6
supporting requirements identified from the peer review as not meeting Capability Category II and associated findings, along with an assessment of the impact on the base PRA. Of the six open supporting requirements, four are related to documentation and two have a relatively minor impact on the PRA results. The NRC staff has determined that Exelon has demonstrated sufficient internal events PRA quality by addressing the peer review open findings noted above consistent with the guidance in Nuclear Energy Institute (NEI) 05-01 (NEI 2005) and that the final resolution of the findings provides reasonable assurance of a minimal impact on the results of the SAMA analysis. As previously indicated, the 2013A update to the PRA model (LS213A) is the most recent evaluation of the risk profile at LSCS for internal events. Exelon indicates this PRA model is documented as an application-specific model developed for use in the SAMA application. The current PRA model of record is the 2011A PRA. In the 2013A model, Level 1 logic from the 2011A model was not changed beyond what was required to integrate it with the Level 2 model. CDF portions of the 2011A and 2013A PRA models are identical. Therefore, updates performed in the 2011A model to resolve the peer review comments were carried into the 2013A model. Section F.2 of the ER states that the LSCS PRA is a Unit 2 model. Because the units are nearly identical, the PRA for Unit 2 is considered to be applicable to Unit 1, unless otherwise noted. In an RAI, the NRC staff asked Exelon to provide a brief description of the differences between the units, particularly those differences that might impact internal flooding and their impacts on the unit risk. Exelon responded that the major difference between the units is that the common or “0” diesel generator is located in the Unit 1 Auxiliary Building and the “0” diesel generator cooling water pump is located in the Unit 1 Division 1 core standby cooling system (CSCS) pump room. A flood event that initiates in the Unit 1 Division 1 CSCS pump room does not propagate from this room, because the surrounding areas are protected by a water tight door and walls. Exelon indicated that this specific flood scenario is a negligible contributor to risk on both units because it only impacts one division of CSCS equipment. The Unit 1 CDF contribution from a flood in this area would be slightly higher than Unit 2 because the internal flood also will impact the Unit 1 residual heat removal service water (RHRSW) pumps. The Unit 1 RHRSW pumps do not have a function for Unit 2; therefore, loss of these pumps has no quantitative impacts on the Unit 2 CDF values. Because these flood scenarios have a negligible CDF impact and a limited impact on plant equipment and operator response, Exelon concluded there would be no impact on the SAMA evaluation. Exelon also discussed the general plant layout; internal flooding scenarios; and other asymmetries between units, including the power supplies for the shared systems. Exelon concluded and the NRC staff agrees that none of the minor differences has an impact on the SAMA evaluation (Exelon 2015).
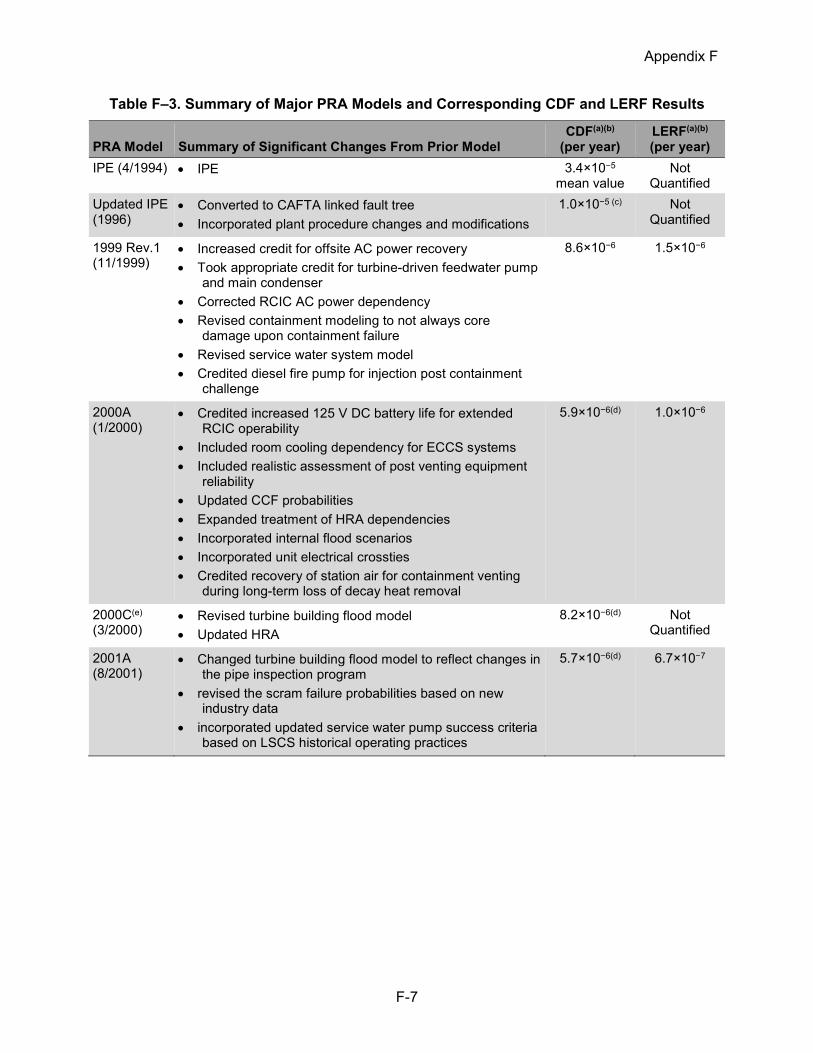
Appendix F
F-7
Table F–3. Summary of Major PRA Models and Corresponding CDF and LERF Results
PRA Model Summary of Significant Changes From Prior Model CDF(a)(b)
(per year) LERF(a)(b) (per year)
IPE (4/1994) • IPE 3.4×10⁻⁵ mean value
Not Quantified
Updated IPE (1996)
• Converted to CAFTA linked fault tree • Incorporated plant procedure changes and modifications
1.0×10⁻⁵ (c) Not Quantified
1999 Rev.1 (11/1999)
• Increased credit for offsite AC power recovery • Took appropriate credit for turbine-driven feedwater pump
and main condenser • Corrected RCIC AC power dependency • Revised containment modeling to not always core
damage upon containment failure • Revised service water system model • Credited diesel fire pump for injection post containment
challenge
8.6×10⁻⁶ 1.5×10⁻⁶
2000A
(1/2000) • Credited increased 125 V DC battery life for extended
RCIC operability • Included room cooling dependency for ECCS systems • Included realistic assessment of post venting equipment
reliability • Updated CCF probabilities • Expanded treatment of HRA dependencies • Incorporated internal flood scenarios • Incorporated unit electrical crossties • Credited recovery of station air for containment venting
during long-term loss of decay heat removal
5.9×10⁻⁶(d) 1.0×10⁻⁶
2000C(e)
(3/2000) • Revised turbine building flood model • Updated HRA
8.2×10⁻⁶(d) Not Quantified
2001A (8/2001)
• Changed turbine building flood model to reflect changes in the pipe inspection program
• revised the scram failure probabilities based on new industry data
• incorporated updated service water pump success criteria based on LSCS historical operating practices
5.7×10⁻⁶(d) 6.7×10⁻⁷

Appendix F
F-8
PRA Model Summary of Significant Changes From Prior Model CDF(a)(b)
(per year) LERF(a)(b) (per year)
2003A (6/2003)
• Revised component failure data including extensive use of plant-specific component failure data gathered from the LSCS Maintenance Rule program
• Revised initiating events data utilizing the latest LSCS operating experience
• Added alternate configuration logic for all systems with alternate/standby trains
• Added logic for newly installed redundant 125 V DC backup battery chargers on both divisions of Unit 2
• Added new logic for the trailer-mounted Station Air compressor to the model
• Revised Station Air success criteria
6.6×10⁻⁶(d) 3.6×10⁻⁷
2006A (1/2007)
• Model modified to reflect the emergency operating procedures for LSCS which differ from the generic BWROG EPGs in that they do not direct ADS inhibit unless a failure to scram occurs (or power is unknown)
• Updated the turbine building flooding accident sequences • Allocated LOCA frequencies on a location and size-
specific basis • Updated data to use the most current industry data and
plant-specific data
8.1×10⁻⁶ 3.1×10⁻⁷
2006B (5/2007)
• Completely revised internal flooding analysis • Added additional dependent HEPs to recovery files • Quantified several support system initiator fault trees and
added frequencies to model
3.6×10⁻⁶ 3.0×10⁻⁷
2006C (1/2008)
Subject of 2008 Peer Review • Revised RHR suppression pool cooling model to address
error • Updated several fault tree logics to address internal
review issue • Revised several CCF probabilities • Revised frequency for medium below core LOCA • Added additional flood scenario links in system fault tree
models • Added coincident maintenance links in system fault trees
4.0×10⁻⁶ 3.0×10⁻⁷

Appendix F
F-9
PRA Model Summary of Significant Changes From Prior Model CDF(a)(b)
(per year) LERF(a)(b) (per year)
2011A (3/2013)
• Updated transient frequencies and component failure rates using latest plant data
• Deleted loss of bus 241Y and 242Y as initiating events because loss of these buses does not result in a scram
• Refined treatment of the ECCS water hammer scenarios • Crediting closure of the reactor building ventilation check
dampers as a potential flood mitigation strategy • Deleted most coincident maintenance terms as these
events did not meet the current definition of the ASME/ANS PRA Standard
• Re-evaluated categorization of mitigated ATWS (i.e., SLBC successfully injected) scenarios with subsequent failure of containment heat removal from Class IV to Class II
• Corrected probability of failure of ADS due to environment from 1.0 to 10−3 based on the controls/steam sensitive portion of the ADS system is not in the reactor building
• Revised the probability for preexisting containment failure modes from 5×10⁻³ to 2.3×10⁻³ to be consistent with current industry information
2.6×10⁻⁶ 1.3×10⁻⁷
2013A (7/2014)
• Replace LERF model with full Level 2 model 2.6×10⁻⁶ 1.4×10⁻⁷
(a) All values assumed to be point estimates unless indicated to be otherwise. (b) Models prior to 2000A version did not include internal flooding. (c) CDF value based on information in NUREG–1560, Volume 3, Table B–1. Note that this NUREG volume did not
contain specific details on the reported CDF values. (d) CDF values include 1×10⁻⁷ per year due to seismic events. LERF value is unknown. (e) 2000B model was not issued in any regulatory applications.
Key: AC = alternating current; ADS = automatic depressurization system; ATWS = anticipated transients without scram; BWROG = Boiling Water Reactor Owners Group; CAFTA = Computer-Aided Fault Tree Analysis; CDF = core damage frequency; CCF = common cause failure; DC = direct current; ECCS = emergency core cooling systems; EPG = emergency procedure guidelines; HEP = human error probability; HRA = human reliability analysis; IPE = individual plant examination; LERF = large early release frequency; LOCA = loss-of-coolant accident; LSCS = LaSalle County Station; PRA = probabilistic risk assessment; RCIC = reactor core isolation cooling, RHR = residual heat removal; SLBC = standby liquid control
Sources: Exelon 2014a, 2015
In response to an NRC staff RAI to identify shared plant systems, or those that could be cross-tied between units, and to describe the modeling, including the treatment of unavailability during outages or accidents involving the other unit, Exelon responded that the most significant piece of equipment shared between units is the common or “0” diesel generator. This diesel generator is shared between the Unit 1 and Unit 2 Division 1 AC power divisions. Modeling of this component assumes that it loads automatically to the modeled unit 50 percent of the time when demanded. The model includes an operator action to manually align the “0” diesel generator to the modeled unit if the “0” diesel generator does not automatically align to the unit. The model also includes an operator action related to the failure to control the loading of the diesel generator when it is aligned to both units. Exelon further indicated that the Division 1 and

Appendix F
F-10
Division 2 AC safety-related 4 (kV) buses can be cross-tied between units, which provides a means to power these buses via the opposite unit offsite power sources. The PRA model includes the opposite unit offsite power sources, divisional crosstie breakers, and the operator action necessary to complete this alignment. Other shared systems include the instrument air system, the service water system, and the fire protection system (FPS). Other than the “0” diesel generator, crosstie breakers, and AC power supplies, the model does not explicitly consider the impacts of events occurring at one unit that affect the other unit. Service water and instrument air have the capability to support both units simultaneously during events at both units. With respect to the FPS, it could be aligned to both units and could be shared for injection. However, the PRA model does not account for this condition probabilistically. For all shared systems, system unavailability during outages is considered in the development of system maintenance unavailability basic events. (Exelon 2015). Exelon stated in the ER:
The freeze date for data and plant modifications to be considered for the Level 1 portion of the LS213A model (the 2011 LSCS PRA update, LS211A) is December 31, 2010. The Emergency Operating Procedures (EOPs) and Severe Accident Guidelines (SAGs) used in this analysis are those in place as of the freeze date. No significant plant modifications affecting the risk profile were performed since the PRA model freeze date. EOP and SAG changes made since the freeze date were reviewed and incorporated, as necessary, into the LS213A model. The freeze date for the LS213A model was December 31, 2013.
In an RAI, the NRC staff asked Exelon to identify any planned changes or modifications to the LSCS design (other than the hardened pipe vent), operation, reactor power level, fuel cycle, or fuel design that might affect the SAMA analysis and describe their expected impacts. In response, Exelon indicated that the PRA open items tracking database (commonly referred to as the updating requirement evaluation (URE) database) was reviewed and no outstanding modifications were identified, with the exception of the necessary plant modifications to meet the NRC order related to the Near Term Task Force (NTTF) on Fukushima. In particular, these changes will be made in relation to mitigating strategies (EA-12-049) and the installation of the hardened pipe containment vent (EA-12-050) (Exelon 2015). As noted above, the CDF due to ATWS events is 4.9x10⁻⁷ per year9 or 19 percent of the total CDF for internal events. In response to an RAI to discuss the reasons for the relatively high contribution to the total CDF for internal events, Exelon responded by summarizing the plant design and operating features that affect the ATWS CDF. The joint human error probabilities (HEPs) for operator actions that must be performed in short time windows are prevalent in the ATWS cutsets and are the dominant contributors to CDF from this accident class. Some short time windows for response are due to the plant design and the lack of a redundant, high-pressure, high-volume injection system for use in these scenarios. The only high-pressure, high-volume injection system available in an ATWS is feedwater. Emergency operating procedures require the high-pressure core spray system to be secured, and the Reactor Core Isolation Cooling System (RCIC) is a low-volume system. The capability of feedwater is limited by the rate at which water can be made up to the condenser. Exelon further provided the ATWS CDF and relative contribution to total CDF for a number of other BWR units. Exelon concluded that, in general, ATWS CDF and the percent contribution of 9 This value does not include the CDF contribution from mitigated ATWS events for which standby liquid
control (SBLC) injection is successful but core damage occurs due to subsequent coolant injection or heat removal failures.

Appendix F
F-11
ATWS to the CDF vary significantly in the industry, and values can be found both above and below those documented for LSCS (Exelon 2015). The NRC staff noted that Section F.2.3.1 of the ER states “all ATWS events are modeled as a turbine trip.” In response to an RAI to clarify this statement, Exelon indicated that this statement was intended to explain the prior statement in the ER that “The turbine trip initiating event is important to note because it also represents the ATWS frequency.” A better way to describe the relationship of the turbine trip initiator to the ATWS is that ATWS sequences are a large contributor to the percentage of CDF attributed to the turbine trip initiating event. Exelon noted that other initiating events also result in ATWS sequences (Exelon 2015). On the basis of the NRC staff’s evaluation of internal events Level 1 PRA previously described in this subsection, and Exelon’s response to the NRC staff RAIs, the NRC staff concludes that the internal events Level 1 PRA model is of sufficient quality to support the SAMA evaluation.
F.2.2.2 External Events
As previously indicated, the LSCS PRA used for the SAMA analysis does not include external events. In the absence of such an analysis, Exelon used the results of a new interim fire PRA and the LSCS IPEEE to identify the highest risk accident sequences and the potential means of reducing the risk posed by those sequences and to estimate the benefit of potential SAMAs, as discussed below and in Section F.3.2. The LSCS IPEEE was submitted in April 1994 (CECO 1994) in response to Supplement 4 of Generic Letter 88-20 (NRC 1991). The submittal cited the external events analysis performed as part of the NRC-sponsored RMIEP analysis of LSCS (NRC 1992). This analysis included internal fire, internal flood, and seismic risk assessments, as well as a probabilistic bounding analysis of the other external hazards (turbine-generated missiles, accidental aircraft impacts, high winds, transportation and nearby facility accidents, and external flooding). The IPEEE did not provide a definition of a vulnerability and did not identify any plant improvements resulting from the fire, seismic, or other external hazard analyses in the IPEEE submittal. The RMIEP report identified two issues in the fire area that were “provided to the station for disposition.” These were (1) to install tops on the main control room electrical panels and (2) to institute an inspection program for penetration seals at the top of switchgear panels. The disposition of these improvements is discussed in Section F.3. Upon completion of the NRC staff review of the IPEEE submittal and the supporting RMIEP work, the NRC staff concluded that the licensee’s IPEEE process is capable of identifying the most likely severe accidents and severe accident vulnerabilities and the LSCS IPEEE has met the intent of Supplement 4 to Generic Letter 88-20 (NRC 2000). The LSCS IPEEE seismic assessment used the simplified seismic PRA performed for the RMIEP project. This analysis resulted in a point estimate CDF of 6.0x10⁻⁷ per year due to seismic events. The dominant seismic CDF sequences are listed in Table F–4. The RMIEP seismic PRA used seismic hazard curves available at that time. In the ER, Exelon provided an updated seismic CDF utilizing currently available hazard curves and the conditional core damage probabilities for each accident sequence and ground motion acceleration range provided in the RMIEP report. This yielded a seismic CDF of 6.6x10⁻⁷ per year. In response to an NRC staff RAI to provide more information on the source of these hazard curves, Exelon indicated that the LSCS hazard curves used in the SAMA analysis are the same as the LSCS hazard curves included in the response to the NRC’s NTTF on Fukushima Recommendation 2.1 (Exelon 2014b, 2015).

Appendix F
F-12
Also in response to an NRC staff RAI, Exelon provided the LSCS seismic CDF using the simplified methodology from the Generic Issue (GI) 199 evaluation (NRC 2010). The LSCS seismic CDF using this methodology was found to be 2.3x10⁻⁶ per year, based on peak ground acceleration (Exelon 2015). The NRC staff notes that this seismic CDF is somewhat larger than that based on the RMIEP conditional core damage probabilities, which can be expected based on the simplified nature of the GI-199 estimate.
Table F–4. Dominant LSCS Contributors to Seismic CDF
Sequence Sequence Description CDF* (per year)
Contribution to Total
Seismic CDF* (percent)
LOOP-Trans-3 LOOP, HPCS, and RCIC fail due to seismic failure of CST, low-pressure injection fails due to random electrical support failures
2.8×10⁻⁷ 42
LOOP-Trans-4 LOOP, HPCS, and RCIC fail due to failure of reactor level instrumentation or seismic failure of CST, depressurization fails
2.2×10⁻⁷ 35
LOOP-Trans-1 LOOP, HPCS fails due to random events, containment heat removal fails and low-pressure injection fails
7.5×10⁻⁸ 11
Small-LOCA-3 Small LOCA, HPCS, and RCIC fail, low-pressure injection fails
3.4×10⁻⁸ 5
*Based on RMIEP seismic CDF of 6.6×10⁻⁷ per year (NRC 1992) and percent contribution given in the ER (Exelon 2014a)
KEY: CDF = core damage frequency; CST = condensate storage tank; ER = environmental report; HPCS = high pressure core spray; LOCA = loss-of-coolant accident; LOOP = loss of offsite power; LSCS = LaSalle County Station; RCIC = reactor core isolation cooling; RMIEP = Risk Methods Integration and Evaluation Program
As discussed in Section F.3, Exelon reviewed the dominant sequences listed in Table F–4 to identify potential SAMAs to mitigate those sequences. The total updated seismic CDF was used in developing the external events multiplier, as discussed later in this subsection. Seismic walkdowns of LSCS Units 1 and 2 were conducted as part of Exelon’s actions in response to the 50.54(f) letter (NRC 2012a) requesting information related to the Fukushima Daiichi NTTF recommendations. Exelon reported that the walkdowns resulted in no adverse anchorage conditions, no adverse seismic spatial interactions, and no other adverse seismic conditions associated with the items on the seismic walkdown equipment list (SWEL) for either unit. Similarly, area walk-bys resulted in no adverse seismic conditions associated with other systems, structures, or components located in the vicinity of the SWEL item(s). The Unit 1 seismic walkdown identified 9 minor conditions while the Unit 2 walkdown identified 10 minor conditions. Other than these minor conditions, the seismic walkdowns identified no degraded, nonconforming, or unanalyzed conditions that required either immediate or follow-on action (Exelon 2012a, 2012b). The NRC staff notes that the agency’s and industry’s response to the Fukushima Daiichi event includes additional seismic evaluations, as outlined in the NRC’s 50.54(f) letter dated March 12, 2012 (NRC 2012a).

Appendix F
F-13
While the LSCS IPEEE/RMIEP included an internal fire PRA, it has been superseded by a new interim LSCS fire PRA. The current LSCS fire PRA gives a fire CDF of 8.9×10⁻⁶ per year for Unit 1 and 9.4×10⁻⁶ per year for Unit 2. Table F–5 provides a summary of dominant fire zone CDF results from the LSCS fire PRA. The LSCS IPEEE fire assessment did not provide a definition of the term “fire vulnerability” nor identify fire-related improvements. As discussed above, the RMIEP report identified two issues in the fire area that were “provided to the station for disposition.” These were (1) to install tops on the main control room electrical panels and (2) to institute an inspection program for penetration seals at the top of switchgear panels. The disposition of these improvements is discussed in Section F.3. Exelon considers this fire model to be an interim implementation of NUREG/CR–6850 (NRC 2005) because all tasks identified in that document were not completely addressed or implemented in the model. The ER includes a listing of limitations of the current LSCS fire PRA relative to the tasks of NUREG/CR–6850 (NRC 2005). While some limitations may result in additional fire scenarios or impact the frequency of existing scenarios, others lead to conservatisms in the current result. Exelon also notes that the fire PRA utilizes the 2006C internal events PRA, which is not integrated with the current internal events 2013A PRA. Accordingly, the LSCS fire PRA cannot be used in an integrated analysis with the internal events PRA. Therefore, the total fire CDF from the analysis was used to determine the external events multiplier, while the listing of dominant sequences was used to identify potential cost-beneficial SAMAs as allowed by the industry guidance in NEI 05-01 and further discussed in Section F.3. The LSCS IPEEE/RMIEP analysis of high winds, tornadoes, external floods, and other external events (HFO) consisted of a bounding probabilistic assessment. For these events, the IPEEE/RMIEP concluded that these events were not significant contributors to plant risk and there were no improvements identified for these events (CECO 1994). The ER discusses each of these external events and provides the following CDF estimates from RMIEP.
Turbine Generated Missiles (mean) 9.5×10⁻⁸ per year Accidental Aircraft Impact (median) 5.0×10⁻⁷ per year High Winds (median) 3.0×10⁻⁸ per year Transportation & Nearby Facility Accidents10 3.0×10⁻⁸ per year External Flooding3 3.0×10⁻⁸ per year Total HFO external events 6.9×10⁻⁷ per year
The NRC staff considers the use of these CDFs consistent with the guidance provided in NEI 05-01.
10 For the purposes of the SAMA analysis, external event frequencies for external flooding as well as
transportation and nearby facility accidents are taken to be the same as the frequency for high winds.

Appendix F
F-14
Table F–5(a). Dominant LSCS Unit 1 Fire Zone Contributors to Fire CDF of 8.9×10⁻⁶ per year.
Fire Zone Zone Description CDF
(per year)
Contribution to Total Fire
CDF (percent)
4F1 Unit 1—Division 1 Essential Switchgear Room 2.7×10⁻⁶ 30 4E3-2 Unit 1—Division 2 Essential Switchgear Room 2.7×10⁻⁶ 30 4C1 Control Room 5.9×10⁻⁷ 7 4E1-2 Unit 1—Auxiliary Electric Equipment Room—Main AER
Room 3.9×10⁻⁷ 4
Table F–5(b). Dominant LSCS Unit 2 Fire Zone Contributors to Fire CDF of 9.4×10⁻⁶ per year
Fire Zone Zone Description CDF
(per year)
Contribution to CDF
(percent) 4E4-2 Unit 2—Division 2 Essential Switchgear Room 2.9×10⁻⁶ 30 4F2 Unit 2—Division 1 Essential Switchgear Room 2.7×10⁻⁶ 29 4E2-2 Unit 2—Auxiliary Electric Equipment Room-Main AER
Room 7.7×10⁻⁷ 8
4C1 Control Room 5.9×10⁻⁷ 6
Key: CDF = core damage frequency; LSCS = LaSalle County Station
The NRC staff notes that Exelon’s response to the NRC’s 50.54(f) letter (NRC 2012a) requesting information related to the Fukushima Daiichi NTTF recommendations includes a flooding walkdown and a flood hazards reevaluation. As reported in the NRC staff assessment of the walkdown report (NRC 2014), five deficiencies were identified during the course of the flooding walkdowns and entered into the corrective action program for tracking and resolution. Two deficiencies were related to lack of seal or significant rust in penetrations. Three deficiencies were related to exterior doors’ threshold elevations being lower than the calculated flood elevation. The NRC staff concluded that the licensee’s implementation of flooding walkdown methodology meets the intent of the walkdown guidance. In the flood hazards reevaluation (Exelon 2014c), Exelon concluded that “The current design basis flood does not bound the reevaluated hazard for all applicable flood-causing mechanisms, combined-effect floods, associated effects, and/or flood event duration parameters.” Because of this result, Exelon is preparing a fully integrated assessment of these flood hazards. Exelon’s flood hazard evaluation also includes a summary of interim evaluations and actions taken or planned to address the instances for which the reevaluated hazard exceeds the design basis. These issues are being addressed via the ongoing Japan Lessons Learned program and implementation of the Fukushima Daiichi NTTF recommendations, including NRC Order EA-12-049, “Order to Modify Licenses with Regard to Requirements for Mitigation Strategies for Beyond-Design-Basis External Events” (NRC 2012b) and is outside the scope of the SAMA analysis.

Appendix F
F-15
As discussed in the ER, there are no up-to-date quantitative external event models for LSCS, so a multiplier to the internal events PRA results was developed to account for risk contributions from external events in the SAMA evaluation. For seismic contributions to risk, Exelon used the updated RMIEP seismic CDF value of 6.6×10⁻⁷ per year. For fire contributions to risk, Exelon used a Unit 2 fire CDF of 9.4×10⁻⁶ per year, discussed above. For HFO events, the value of 6.9x10⁻⁷ per year was used. Based on these results, Exelon indicated in the ER that the total CDF for external events is approximately 1.08×10⁻⁵ per year. The total CDF (internal and external events) is then approximately 1.33×10⁻⁵ per year or 5.2 times the CDF for internal events. This multiplier was used by Exelon in the SAMA analysis to account for the impact of external events on the calculated benefits. The NRC staff agrees with the applicant’s overall conclusion concerning use of the multiplier to represent the impact of external events and finds that a multiplier of 5.2 will reasonably account for external events in the SAMA evaluation.
F.2.2.3 Level 2 Fission Product Release Analysis
The NRC staff reviewed the general process Exelon used to translate the results of the Level 1 PRA into containment releases, as well as the results of the Level 2 analysis, as described in the ER (Exelon 2014a) and Exelon’s responses to NRC staff RAIs (Exelon 2015). Exelon indicates that this PRA model is documented as an application-specific model developed for the use in the SAMA application. The SAMA Level 2 model is an expansion of the prior LERF-only model to a full Level 2 model. The LSCS Level 1 PRA postulates accident sequences that lead to core damage and potentially challenge containment. These discrete accident sequences contribute to the CDF, represent the spectrum of possible challenges to containment, and are placed into functional sequence groupings (i.e., accident classes and subclasses). The Level 1 accident class bins are then used as the starting point for the Level 2 PRA CET analysis. Level 1 accident sequences and resulting cutsets are incorporated directly into the Level 2 analysis to maintain the propagation of dependencies. The accident classes and subclasses used for the LSCS SAMA analysis are summarized in ER Table F.2–3 (Exelon 2014a). The response of containment to core damage is analyzed by a CET for each accident class or subclass. Each node in the CET is evaluated using the nodal functional fault trees that include the following considerations:
• fault tree models from the Level 1 analysis for the system or function,
• any Level 2 limitations in timing, procedures, access, or dependencies,
• phenomenological effects, and
• environmental impacts on equipment or operator actions. The CETs and the end-state assignments are based on deterministic core melt progression calculations. Exelon directly links the Level 1 and Level 2 models using a single top logic structure and quantifies them using the Electric Research Power Institute (EPRI) Computer-Aided Fault Tree Analysis (CAFTA) software. Functional event nodes of the LSCS Level 2 CET are:
• Containment Isolated (IS),
• RPV Depressurization (OP),

Appendix F
F-16
• Core Melt Arrested In-Vessel (RX),
• Combustible Gas Venting Initiated (GV),
• Containment Remains Intact (CZ),
• Injection Established to RPV or Drywell (TD),
• Containment Flooding Occurs with Drywell Vent (FC),
• Containment Heat Removal (HR),
• Containment Vent (CV),
• Suppression Pool Bypass (SP),
• No Large Containment Failure (NC),
• Inventory Makeup Available (MU),
• Drywell Intact (DI),
• Wetwell (WW) Airspace Failure, and
• Reactor Building Effectiveness (RB). As described in ER Section F.2.1 (Exelon 2014a), the release categories were defined based on the timing and magnitude of releases. Each CET end state represents a radionuclide release to the environment and is assigned to a release category based on the CET sequence characteristics, MAAP 4.0.5 results, and a set of release category rules. When MAAP is not well suited to modeling the accident phenomena associated with a scenario, the scenario is modeled using conservative estimates (e.g., steam explosion) and insights from other Level 2 PRA models from plants of a similar type. ER Table F.2–6 provides a summary of the LSCS Level 2 release category frequencies for each of the 15 accident classes or subclasses (Exelon 2014a). For accident class II (accident sequences involving a loss of containment heat removal with the reactor pressure vessel initially intact but with post containment failure or venting induced by core damage), the NRC staff noted in an RAI that the subclasses listed in ER Table F.2–6 were different from those in ER Table F.2–3. In response, Exelon indicated that the four accident Class II subclasses (II, IIE, IIV, IIVE), used in the SAMA analysis and included in ER Table F.2–6, represent early (IIE and IIVE) releases resulting from containment failure and containment venting, respectively; and non-early (II and IIV) releases resulting from containment failure and containment venting, respectively. Exelon indicated that for convenience in modeling, the Class II accident classes are separated into two CETs; one representing the early releases and the other representing intermediate or late (non-early) releases for the containment failure sequences and two similar ones for venting sequences. Exelon further indicated that the analysis of the timing of a General Emergency declaration has been evaluated from a probabilistic standpoint for Class II accident scenarios. This evaluation was performed because of the potential differences in interpretation of the Emergency Action Levels (EALs) and the probability that the Emergency Director could delay the declaration of the General Emergency resulting in an early release. Interviews of key emergency response personnel were performed to determine the best estimate probability that the EALs would be interpreted such that the General Emergency declaration would be delayed resulting in an early release as opposed to an intermediate or late release. These interviews consisted of case studies and a discussion of EALs. The mean probability of failure to declare a General Emergency with adequate time to take protection measures for the general public prior to
Appendix F
F-17
containment failure is 5 percent or 0.05 based on expert opinions. As a result, the LSCS Level 2 model is structured such that 5 percent of the Class II accidents can result in an “Early” release, but 95 percent of the Class II accident releases are “non-early” releases. The NRC staff noted in an RAI that ER Table F.2–6, which provides the accident class frequency contribution to each release category, includes a significant intact containment frequency for the Class II accident subclasses. Class II accidents are normally considered, and defined in ER Table 2–3, to include sequences where core damage occurs after containment failure; therefore, there should be no intact containment sequences in Class II. In response to the RAI to discuss the reasons for these results, Exelon indicated that the “intact” frequency was obtained from the difference between the CDF for each accident subclass and the total of all the other release category frequencies. As discussed above, the Class II accident classes are split into two timing categories; early and non-early and a separate Class II event tree was used for each category. For the early release class, the total Class II frequency is multiplied by 0.05 when the CDF value is transferred into the Level 2 model. Then, the remaining event tree nodes are evaluated. This results in truncation of low-frequency sequences leading to the total of all the release categories being significantly less than the CDF for the Class II subclasses. To account for this undercounting of Class II releases, Exelon performed a sensitivity study to determine the impact of this truncation issue. The study was performed by setting the PRA model basic event related to the General Emergency declaration to 1.0 (instead of 0.95 and 0.05) and requantifying the model. After quantification, the 95 percent and 5 percent split between non-early and early releases were calculated. Because the results demonstrated that low-frequency sequences had previously been truncated from the final results, Exelon revised the release category frequencies in its response to the RAI (Exelon 2015, Table F.2–6 revised). Exelon noted that in the requantified results, there is still a very small unaccounted for frequency in the Level 2 release results due to additional truncated sequences (approximately 5 percent of the CDF). This release frequency was divided proportionally among each release category applicable to that accident class (i.e., Class II, IIE, IIV and IIVE). Exelon indicated that model truncation is a known source of uncertainty in model results and while the proportional redistribution of the truncated cutsets does not provide an exact solution to this quantification issue, it is considered to be a reasonable approximation of how these low contributors should be allocated to the release categories. Exelon concluded that any deviations between the true release category allocations of the truncated frequency and those resulting from the proportional distribution of the frequency would correlate to very small changes to the cost-benefit results; therefore, no impacts on the conclusions of the SAMA analysis were expected. Exelon noted further that the Class II accident subclasses are the only accident classes where the CDF values were multiplied by a split fraction before transferring into the Level 2 fault trees. Therefore, the larger impact observed for this accident class is not applicable to other accident classes. Other truncation issues would be small and are bounded by the uncertainty in other inputs. Exelon concluded that the SAMA evaluation would not be impacted by model truncation issues. The NRC staff agrees, for the purposes of the SAMA analysis, with the Exelon approach to resolving the issue associated with the original ER analysis of Class II release category assessment, the conclusions associated with this issue, and the more general issue of impacts from model truncation. The NRC staff also notes that the issue of how the “intact” release category frequency was determined for other accident classes would have a very small impact on the SAMA analysis because major accident class contributors to those other-than-Class II release categories that are most important to offsite cost risk (Classes IIID, IV, and V) had a zero “intact” containment frequency in the original ER analysis. Exelon’s revisions to

Appendix F
F-18
the release category frequencies influenced the base case maximum averted cost risk (MACR) and the cost-benefit analysis for each SAMA (Exelon 2015). Exelon developed the accident progression and associated release characteristics for each release category by using the results of MAAP Version 4.0.5 computer code calculations. A MAAP case was identified as a representative case for each of the LSCS Level 2 PRA release categories based on a review of the Level 2 model cutsets and the dominant types of scenarios that contribute to the release category. Tables F.3–17 and F.3–18 in the ER provide a description of the representative cases for each release category and additional information on the selection of these representative cases (Exelon 2014a). With regard to the selection of representative cases, the NRC staff noted in an RAI that the dominant contributor to the low-magnitude early (L/E) release category is an ATWS sequence. This event sequence involves successful depressurization of the reactor pressure vessel (RPV) with core melt arresting in the vessel and a WW airspace failure. However, the MAAP scenario stated in ER Tables F.3–17 and F.3–18 to be used as the reference MAAP case for this sequence was not used to represent this release category. Instead, an alternate MAAP case with a significantly lower cesium iodide release fraction was stated to have been used. In response to the RAI, Exelon clarified that the reference MAAP cases in the Level 2 analysis are not necessarily exact models of the sequence but are instead used along with the Level 2 Release Category rules to assign an appropriate end state to the Level 2 sequence (Exelon 2015). A specific MAAP scenario modeling the dominant sequence for the L/E release category was not developed for the LSCS SAMA analysis. Rather, expert judgment and review of similar MAAP cases were used. In-vessel retention would be expected to reduce radionuclide release fractions significantly because (1) RPV injection post-core damage prevents further heat up of radionuclides, and (2) the suppression pool is not bypassed (i.e., fission products are retained in the pool instead of being released directly to the environment). Exelon noted that while Tables F.3–17 and F.3–18 of the ER indicate that MAAP case LS130533B was used to represent the L/E release category, MAAP case LS130524B was actually used to represent the L/E release category indicated in Table F.3–19 of the ER. Use of the LS130524B scenario in place of the LS130533B scenario is conservative because the LS130524B release fractions bound the release fractions from the LS130533B scenario, and the LS130524B scenario results in a substantial release of radionuclides several hours earlier than the LS130533B scenario (containment breach in LS130524B vs. containment vent in LS130533B). Both scenarios are containment flooding scenarios. As indicated above, the dominant release category sequence is an ATWS sequence with a WW airspace failure, successful RPV depressurization, in-vessel retention, and no suppression pool bypass. The MAAP case LS130524B represents an ATWS sequence with WW airspace failure, successful RPV depressurization, core spray available after core damage at vessel breach, and containment flooding. Use of MAAP scenario LS130524B to model this sequence as a surrogate for the L/E release category was judged by Exelon to be reasonable since LS130524B models containment flooding shortly after vessel breach, which mimics the actions of in-vessel retention by both cooling debris and retaining fission products in the local water inventory (i.e., scrubbing the release). The NRC staff reviewed the logic of this assessment of the release characteristics for the L/E release category and concludes that the results are acceptable for the purposes of the SAMA analysis because the release category is bounding and conservative. In response to an NRC staff RAI to provide justification for the adequacy of the MAAP release fraction results from simulation times less than 48 hours past the declaration of a general

Appendix F
F-19
emergency, Exelon discussed each of these MAAP analysis cases. The run times were considered adequate based on either: (i) results at the end of the run having reached an obvious plateau and being stable well before the end of the run, or (ii) the core debris being quenched in a large body of water (the suppression pool) and stabilized at a relatively low temperature (Exelon 2015). Based on this discussion and the fact that the run times were no more than 8.5 hours less than the desired run time, the NRC staff agrees that the run times used in Exelon’s SAMA analysis are acceptable. Section F.2.2.11 of the ER, titled "2013A UPGRADE" (Exelon 2014a), states:
In order to support the SAMA analysis, the LSCS LERF model was replaced by a full Level 2 model. The Level 1 logic from the 2011A model was not changed beyond what was required to integrate it with the Level 2 model.
In response to an NRC staff RAI to describe the changes in the Level 2 model that are considered upgrades as opposed to updates and to describe the steps taken to assure technical adequacy of the 2013A Level 2 model, Exelon responded that the word “upgrade” in the subheading “2013A Upgrade” in Section F.2.2.11 of the ER was intended to have its common meaning rather than the meaning ascribed by the ASME/ANS PRA Standard (ASME/ANS 2009) and, in retrospect, was misleading. No change to the LERF analysis or methodology that would be considered an “upgrade” by the ASME/ANS PRA Standard definition was made during the model update that created the 2013A model. Accordingly, the 2013A model did not require a peer review. Exelon further indicated that it has implemented procedures and processes to assure the technical adequacy of the full power internal event (FPIE) PRA models. The 2013A model was reviewed and approved in accordance with these procedures and processes. (Exelon 2015). On the basis of the NRC staff’s review of Exelon’s Level 2 model, the peer review performed on the 2006C PRA model, the general process Exelon used to translate the results of the Level 1 PRA into containment releases, and Exelon’s responses to NRC staff RAIs, the NRC staff concludes that the Level 2 PRA as modified in response to the NRC staff RAIs is of sufficient quality to support the SAMA evaluation.
F.2.2.4 Level 3 Offsite Consequence Analysis
The NRC staff reviewed Exelon’s process to propagate the containment performance (Level 2) portion of the PRA to an assessment of offsite consequences (Level 3 PRA). Using the MACCS2 Version 1.13.1 code, Exelon determined the offsite consequences from potential releases of radioactive material (Exelon 2014a). In the Level 3 analysis, Exelon combined release fractions and release categories, discussed in Section F.2.2.3, with the calculated core inventory to yield potential source terms of radionuclides released to the outside environment. In response to an NRC staff RAI, Exelon indicated that the LSCS radionuclide inventory was calculated with ORIGEN Version 2.1 software (Exelon 2015). The NRC staff finds the MACCS2 and ORIGEN codes to be acceptable for the SAMA evaluation because the codes are widely used for radiological dose calculations resulting from airborne releases of radioactive material and radionuclide source term determinations, respectively. Exelon determined radionuclide inventories in the core for a thermal power output of 3489 (MWt). Because the current licensed core power level is 3546 MWt, Exelon applied a scaling factor of 1.0163 (3546 MWt/3489 MWt = 1.0163) to the radionuclide inventories in the core presented in Table F.3–11 of the ER (Exelon 2014a). In response to an NRC staff RAI on the core inventory calculation performed by Exelon for Unit 1, Exelon indicated that the core inventory calculation was bounding for either unit because time spent during refueling outages was ignored, an extended cycle length was modeled, and the higher activity value for each

Appendix F
F-20
radioisotope was chosen from two results for the end of the fuel cycle (Exelon 2015). Furthermore, Exelon reported that the core design process ensures that the core inventory of each unit remains within the single design basis source term. The NRC staff finds that these reasons provide reasonable assurance that actual radionuclide core inventories will be lower than the radionuclide inventories used in the SAMA analysis. In response to an NRC staff RAI on planned changes or modifications to the LSCS design, operation, reactor power level, fuel cycle, or fuel characteristics, Exelon indicated planned modifications in response to the NRC order arising from the severe accidents at the Fukushima Daiichi nuclear generating station, including mitigating strategies and installing a hardened pipe containment vent, as required by EA-12-050 and described within the ER. Additionally, Exelon highlighted its PRA sensitivity study that indicated modifications excluding the hardened pipe containment vent lowered the CDF by approximately 5 percent (Exelon 2015). The NRC staff finds the Exelon approach to not take credit for the hardened pipe containment vent or other modifications in the SAMA analysis to be conservative and acceptable because this treatment does not cause potentially cost-beneficial SAMAs to be missed. The NRC staff also requested additional information on the assumptions used to calculate the inventories of radioactive cobalt, and Exelon described that guidance values for cobalt were scaled to the core thermal power level of the LSCS units (Exelon 2015). Exelon further described that one of the cobalt radioisotopes was overestimated and explained the limited influence of cobalt radioisotopes to the offsite dose and offsite economic costs, which are dominated by other radionuclides in the core inventory. Because the radionuclide inventories for cobalt have not been underestimated and the offsite dose and offsite economic cost components provide the largest contributions to the MACR, the NRC staff agrees that the inventories for the radioisotopes of cobalt are acceptable for use in the SAMA analysis. The NRC staff concludes that the current radionuclide inventory calculations in Table F.3–11 of the ER (Exelon 2014a) are adequate for the estimation of offsite consequences because current calculations bound the expected radionuclide inventory for either reactor core, and Exelon’s additional information further justifies the appropriateness of the calculated core inventory. Exelon presented the major input parameter values and assumptions of the offsite consequence analyses in Appendix F of the ER (Exelon 2014a). Exelon considered site-specific meteorological data for the calendar years 2010, 2011, and 2012. Meteorological data from 2012 were selected for input to the MACCS2 code because they resulted in the highest population dose risk and offsite economic cost risk, as described in Section F.3.7 of the ER (Exelon 2014a). Exelon acquired meteorological data, such as wind speed, wind direction, atmospheric stability class, and precipitation, from onsite meteorological monitoring stations at LSCS. Atmospheric mixing heights were obtained from information published by the U.S. Environmental Protection Agency. The NRC staff finds the applicant’s modeling of atmospheric conditions and plume dispersion to be acceptable because it is supported by site-specific annual meteorological data and implemented using widely accepted software. Because selection of the 2012 meteorological data set resulted in the highest population dose risk and offsite economic cost risk, the NRC staff accepts its use in the SAMA evaluation. Exelon addressed missing meteorological data either by interpolation or by substitution. For missing wind-speed data, a power law was used to convert wind speeds measured at different heights. For data gaps less than 6 hours, interpolation was performed with valid data immediately before and after the data gap. For data gaps greater than 6 hours, data substitution was performed with valid data for the same times from either the day before or after the missing data. Exelon indicated that missing data represented 2 percent or less for each of the three annual meteorological data sets. Because these percentages of missing data are
Appendix F
F-21
reasonable and the methods used to substitute missing data are common remedies, the NRC staff finds these approaches to be acceptable for use in the SAMA analysis. Having assessed the sensitivity to different annual meteorological data sets, release heights, plume heat, and deposition velocities, Exelon found the population dose risk and offsite economic cost risk either decreased (by as much as 9 percent) or increased slightly (by as much as 3 percent) due to the alternative inputs. In response to an NRC staff RAI, Exelon quantified the influence of precipitation on the population dose risk and offsite economic cost risk. Specifically, Exelon compared the total annual precipitation, population dose risk, and total offsite economic cost risk for the previously identified calendar years of 2010, 2011, and 2012 and reported that the single year (2012) with the highest population dose risk and total economic cost risk had the lowest total annual precipitation (Exelon 2015). This observation indicated that other atmospheric parameters during the modeled release had a greater influence on the consequence analysis results than the time-integrated precipitation for the entire year. The NRC staff finds that the selection of the 2012 meteorological data and the other parameter values for atmospheric dispersion are appropriate for use in the SAMA analysis because changes to the analysis typically lower expected benefits for individual SAMAs and any small increases would not change the identification of cost-beneficial SAMAs. As previously described, the sources of data and models for atmospheric dispersion used by the applicant are appropriate for calculating consequences from potential airborne releases of radioactive material. Exelon used the SECPOP2000 Version 3.12 code, projected the expected growth and distribution of population out to the year 2043, and reported that the total population within 80 km (50 mi) surrounding LSCS is anticipated to increase from 1,546,445 in the year 2000 to approximately 3,107,897 in the year 2043, as shown in Table F.3–7 of the ER (Exelon 2014a). From Section F.3.2, as well as Tables F.3–1 and F.3–2 of the ER, Exelon considered census data from years 2000 and 2010, county growth rates for the year 2030, and transient population contributions in the projection. The NRC staff finds that the methodology for population projection is consistent with relevant guidance (NEI 2005). In response to an NRC staff RAI, Exelon indicated that the county population growth rate data were based on projections published by the State of Illinois (Exelon 2015). The NRC staff verified the appropriateness of selected data and compared the county growth rate data reported in the ER with the data source and found no discrepancies. Compared to the previously discussed atmospheric parameters, Exelon reported greater influences on potential increases to the population dose risk and offsite economic cost risk from sensitivity assessments of the population within 80 km [50 mi], evacuation speed, intermediate phase resettlement, wealth values, and other economic inputs and rates. These results were presented in Section F.7.3 of the ER (Exelon 2014a). In response to an NRC staff RAI, Exelon confirmed that known SECPOP errors were prevented from influencing the SAMA analysis results and that manual entry of population and economic data conformed to formatting requirements (Exelon 2015). The NRC staff also requested supporting justification for spatial distribution assumptions used in the population projections. Exelon responded by explaining that the uniform population distribution within a county overestimates the population within 80 km (50 mi) of the LSCS site because many of the highly dense population areas lie outside the radial distance of 80 km (50 mi), and portions of the highest populated counties that lie within that radial distance tend to be more rural, more suburban, and much less populated (Exelon 2015). The NRC staff finds the use of block-level census data to be acceptable because it is site-specific and more representative than uniformly distributed population estimates within a county. Because the applicant provided adequate RAI responses on the population projection, and because an additional analysis was performed by the applicant that

Appendix F
F-22
demonstrated that the current approach was conservative, the NRC staff finds the methods, assumptions, and data used for estimating population to be reasonable and acceptable for purposes of the SAMA evaluation. For the 16-km (10-mi) emergency planning zone at LSCS, Exelon considered site-specific information in LSCS evacuation time estimates in its determination of evacuation times, time delays, and travel speeds. For the baseline Level 3 calculation described in Section F.3.6 of the ER (Exelon 2014a), Exelon assumed 95 percent of the population within the emergency planning zone would evacuate with an evacuation speed of 1.6 meters per second (3.6 miles per hour). In a sensitivity analysis (Exelon 2014a), Exelon reported an increase in the population dose risk by 5 percent (negligible change to the offsite economic cost risk) due to an assumed factor-of-2 reduction in the average evacuation speed. Because Exelon used site-specific information and applied more pessimistic (lower) fractions for the evacuating population in the emergency planning zone compared to generic values, the NRC staff concludes that the evacuation assumptions and analyses are reasonable and acceptable for the purposes of the SAMA analysis at LSCS. Exelon developed economic values using data from the 2007 National Census of Agriculture and Bureau of Economic Analysis for the counties within the 80-km (50-mi) radius of LSCS. Exelon updated economic values to a reference timeframe of July 2013 using the consumer price index from the Bureau of Labor Statistics. As stated in Table F.3–9 of the ER, weighted average wealth values were $283,637/person for nonfarm wealth and $11,937/hectare for farmland wealth. The NRC staff considers the values for nonfarm wealth to be reasonable ranges that would not be expected to result in underestimates of offsite economic cost risk. In response to an NRC RAI on more recent data from the 2012 National Census of Agriculture, Exelon assessed the differences and indicated that annual sales of farm products and farm wealth values from 2012 were typically larger than the 2007 data adjusted to 2013 values by the consumer price index (Exelon 2015). Overall differences in county data for the fraction of farmland and fraction of dairy farms were small between the 2012 and 2007 data sets. Having calculated that the farm-dependent costs comprise 5 percent of the total offsite economic cost risk, Exelon concluded that incorporation of the data from the 2012 National Census of Agriculture would not have a significant impact on the SAMA analysis (Exelon 2015). Farm-dependent costs do not influence the onsite and replacement power components of the total averted cost risk. Given that estimated benefits at the 95th percentile for SAMA candidates determined to be not cost beneficial were more than 20 percent below their estimated implementation costs in Exelon’s revised analysis (Exelon 2015), the NRC staff concludes that incorporation of 2012 agricultural data would not change the determination of cost-beneficial SAMAs. Additionally, extrapolation of economic data to the year of the assessment, and not through the period of extended operation, is consistent with guidance accepted by NRC (NEI 2005). Because Exelon’s assessment included site-specific data and followed an approach that is consistent with economic guidance, the NRC staff finds the data sources, adjustments, and considerations made by the applicant in the Level 3 analysis to be acceptable for the SAMA analysis. Exelon estimated present dollar values based on the internal events PRA at LSCS and applied a multiplication factor of 5.2 to account for external events. As shown in Section F.4.6 of the ER (Exelon 2014a), offsite economic costs and offsite exposure costs provided the greatest contributions to the total dollar value at approximately 74 and 20 percent, respectively. Onsite cleanup and replacement power costs collectively contributed about 6.5 percent to the baseline total dollar value for a real discount rate of 3 percent. Onsite exposure costs contributed less than 1 percent. Section F.6 provides more detailed information on the cost-benefit calculation
Appendix F
F-23
and its evaluation. Changes to the maximum averted cost risk as a result of Exelon’s revised analysis are presented in Section F.6.1. Exelon identified several critical input parameters to the MACCS2 code that potentially impact the Level 3 results and performed sensitivity analysis in Section F.7.3 of the ER (Exelon 2014A). The sensitivities were compared to the 95th percentile PRA results sensitivity which increases the averted cost-risk values for the SAMAs by a factor of 2.14 (214 percent). The 95th percentile PRA results sensitivity bounded all of the cases and no additional SAMAs were identified that were not already identified in Section F.7.2 of the ER. On May 4, 2016, the Commission issued a decision (CLI-16-07) in the Indian Point Nuclear Generating Units 2 and 3 (Indian Point) license renewal proceeding, in which it directed the staff to supplement the Indian Point SAMA analysis with additional sensitivity analyses. Specifically, the Commission held that documentation was lacking for two inputs (TIMDEC and CDNFRM) used in the MACCS2 computer analyses, and that uncertainties in those input values could potentially affect the SAMA analysis cost-benefit conclusions. The Commission therefore directed the staff to perform additional sensitivity analyses. In response to an RAI relating to this Commission decision (ADAMS No. ML16188A187), Exelon developed a new MACCS2 TIMDEC and CDNFRM combined sensitivity case (TIMDEC CDNFRM) and applied the maximum values specified by the Commission (1 year (365 days) for TIMDEC and $100,000 for the CDNFRM values for the decontamination factor of 15) to all of the LaSalle release categories (ADAMS No. ML16193A389). New Offsite Economic Cost Risk (OECR) and Population Dose Risk (PDR) values were calculated. The increases to the base case seen in the OECR was approximately 54 percent and in the PDR was approximately 2 percent for this TIMDEC CDNFRM sensitivity case. These increases are well within the bounds of the 214 percent increase determined by the baseline with uncertainty (95th percentile) which was included as part of the SAMA candidate cost-benefit evaluation documented in Section F.7 of the Environmental Report. Therefore, no new SAMA candidates were identified as potentially cost-beneficial and no changes were made to the conclusions of the SAMA analysis based on this new TIMDEC CDNFRM sensitivity case. The NRC staff finds this determination to be acceptable for the SAMA analysis. Based on its review of Exelon’s submissions, the NRC staff concludes that Exelon’s methodology to estimate offsite consequences for LSCS provides an acceptable basis to assess the risk reduction potential for SAMA candidates. Because the conservative modeling assumptions were included in the assessment and input data were either obtained for the LSCS site or found to be consistent with guidance values, the NRC staff concludes that the data and modeling assumptions for the Level 3 analysis are appropriate for the SAMA evaluation. Accordingly, the NRC staff based its assessment of offsite risk on the core damage frequencies, population doses, and offsite economic costs reported by Exelon.
F.3 Potential Plant Improvements
The process for identifying potential plant improvements, an evaluation of that process, and the improvements evaluated in detail by Exelon are discussed in this section.
F.3.1 Process for Identifying Potential Plant Improvements
Exelon identified potential plant improvements (SAMAs) by review of:
• LSCS PRA results and PRA group insights;
• Potentially cost-effective Phase 2 SAMAs from

Appendix F
F-24
− Susquehanna Steam Electric Station SAMA Analysis,
− Cooper Nuclear Station SAMA Analysis,
− Duane Arnold Energy Center SAMA Analysis,
− Nine Mile Point Unit 2 SAMA Analysis,
− Columbia Generating Station SAMA Analysis, and
− Grand Gulf Nuclear Station SAMA Analysis;
• LSCS IPE; and
• LSCS IPEEE. Exelon indicated that in addition to the “Industry Phase 2 SAMA” review identified above, an industry-based SAMA list from NEI 05-01 (NEI 2005) was used to help identify the types of changes that could be used to address the areas of concern identified through the LSCS importance list review. Based on this review, Exelon identified an initial set of 26 SAMA candidates, referred to as Phase I SAMAs. In Phase I of the evaluation, Exelon performed a qualitative screening of the initial list of SAMAs and eliminated SAMAs from further consideration using the following criteria:
• Applicability to the plant: If a proposed SAMA does not apply to the LSCS design or has already been implemented, it is not retained.
• Implementation cost greater than the screening cost: If the estimated cost of implementation is greater than the MACR, the SAMA is screened out from further analysis.
During this process, SAMA candidates 17 and 26 in Table F.5-4 of the ER (Exelon 2014a) were screened out based on exceeding the cost criteria.11 Table F.6–1 of the ER (Exelon 2014a) provides a description of each of the 24 Phase II SAMA candidates, which was later revised to 25 Phase II SAMA candidates in Exelon’s revised analysis (Exelon 2015). In Phase II, a detailed evaluation was performed for each remaining SAMA candidate, as discussed in Sections F.4 and F.6. To account for the potential impact of external events, the estimated benefits based on internal events were multiplied by a factor of 5.2, as discussed in Section F.2.2.2.
F.3.2 Review of Exelon’s Process
Exelon’s efforts to identify potential SAMAs focused primarily on areas associated with LSCS specific internal initiating events. The NRC staff reviewed the discussions of the SAMA identification process and the listing of Phase I candidate SAMAs included in the ER. The primary source of candidate SAMAs (22 of a total of 26) was the review of the LSCS Level 1 and Level 2 importance analysis. Four additional SAMAs were identified based on the review of other BWR cost-effective SAMAs and the review of external events.
11 The results of a sensitivity analysis to determine the impact of a correction to the Level 2 model
discussed above, resulted in one of the Phase I SAMAs (SAMA 26) being retained that was originally screened out.

Appendix F
F-25
In the ER, Exelon provided a tabular listing of the Level 1 PRA basic events sorted according to their risk reduction worth (RRW) (Exelon 2014a). These results were reviewed by Exelon to identify those potential risk contributors that made a significant contribution to CDF. The RRW rankings were reviewed down to 1.01. Events below this point would influence the CDF by less than 1 percent and thus were judged, by Exelon, to be highly unlikely contributors for the identification of cost-beneficial enhancements. These basic events, which included component failures, operator actions, initiating events, and sequence identification markers (or flags), were reviewed to determine any additional mitigating actions that may need to be considered. In the ER, Exelon provides a discussion of the appropriate importance threshold for the identification of candidate SAMAs. Guidance in NEI 05-01 indicates that “dominant risk contributors” should be considered, but a “dominant” risk contributor was not clearly defined. The NEI 05-01 example uses an RRW of 1.005, which corresponds to the ASME/ANS PRA Standards (ASME/ANS 2009) definition of risk significant events. A 1 percent change in LSCS CDF corresponds to approximately 3×10⁻⁸ per year compared to Regulatory Guide 1.174 (NRC 2011) definition that anything less than a 1×10⁻⁶ per year is a “very small change.” It is noted that an RRW of 1.01 corresponds to a maximum averted cost risk (including external events) of approximately $56,000, if it is assumed that a SAMA is 100 percent effective in eliminating the events contribution to CDF and that the total cost-risk is proportional to CDF. As Exelon indicates, while this is larger than a typically assumed simple procedure change cost of $50,000, the cost for a procedure change can vary widely depending on complexity of the change and the systems involved. Considering the above and that (1) the Exelon review of the LSCS importance analyses results includes, in addition to basic events, accident sequence markers and the individual contributors to these sequences, which effectively results in looking at risk contributors that are lower than the RRW threshold; and (2) a separate review of the important contributors to fire and seismic risk for candidate SAMAs was performed, as discussed below, the NRC staff therefore concludes that Exelon’s use of an RRW threshold of 1.01 for identifying candidate SAMAs from the Level 1 internal events importance analysis is acceptable. In the ER, Exelon also provided tabular listings of the Level 2 PRA basic events for the combined “High” (H/E-BOC, H/E, H/I), the “Medium Early” (M/E), and the “Medium Intermediate” (M/I) release categories. These release categories combine to represent over 97 percent of the offsite risk. Exelon used an RRW cutoff of 1.03 when reviewing these basic events for additional SAMA candidates. While higher than the cutoff used for the Level 1 review, the NRC staff considers this to be acceptable based on their combined contribution to offsite risk, the release frequency of each is a relatively small part of the total release frequency (6 to 36 percent), and many of the events are also included in the Level 1 importance review. The NRC staff developed several RAIs during its review of Exelon’s assessment of SAMAs. The following discussion summarizes these RAIs and Exelon’s responses (Exelon 2015). The NRC staff noted that the turbine trip with bypass initiating event (%TT) is indicated to have a frequency of 0.8 per year, which implies that a number of turbine trips with bypass have occurred over the LSCS operating history and asked if any of these occurrences suggest possible cost-beneficial SAMAs. Exelon responded that the LSCS turbine trip initiating event frequency is based on a Bayesian update of a generic prior for the period of 2006−2010, which includes two plant-specific events (one for each unit). Review of the two plant-specific events used in the Bayesian update indicates that the causes of the events are not related to one another, and that the site has taken corrective action to address the root causes of the events. These conditions do not imply any outlier behavior at LSCS or indicate that there is a potential to identify cost-beneficial SAMAs related to turbine trip events.
Appendix F
F-26
The NRC staff noted that the discussion of potential SAMAs for a significant number of events involve water-hammer-induced loss of coolant accidents (LOCAs) related to the generation of a LOCA signal on high drywell pressures when an actual LOCA does not exist. These events are mitigated by SAMA 7, and the NRC staff asked Exelon to provide more detail on the water hammer scenarios and the potential for other SAMAs to mitigate the water-hammer-induced core damage. In response, Exelon provided a discussion of the four typical cases associated with water hammer events at LSCS and the potential for other SAMAs. Exelon indicated that procedures already are in place and credited in the PRA for the operators to prevent residual heat removal (RHR) starting (and thereby preventing the conditions that lead to a water hammer) for certain scenarios and that installing fast-acting valves (that also would prevent the conditions that lead to water hammer) would be expensive and have some adverse consequences. Exelon clarified that the “LOOP-delayed LOCA” scenario, that was stated to not have been modeled in the PRA, is a series of operator actions required to address the automated actuations that occur in some potential water hammer scenarios. These actions are not explicitly included in the PRA because the dominant contributors to core damage are considered to be the water hammer events. Exelon concluded and the NRC staff agrees that including these scenarios in the PRA model would result in a very small change in plant risk that would impact neither the SAMA identification process nor the conclusions of the SAMA analysis. The NRC staff noted that for an event involving an emergency core cooling systems (ECCS) room cooling fan failing to run, Exelon indicated that previous LSCS evaluations could not demonstrate that portable fans would provide adequate cooling for the reactor building corner rooms when the normal cooling system failed. Exelon was asked to discuss this previous evaluation and if sufficient cooling can be achieved if the portable fans can provide air movement through the room coolers, assuming cooling water remains available. In response, Exelon provided the results of a cost-benefit assessment for a SAMA that utilized portable fans and ducting to provide air flow through modified room coolers. This assessment assumed that the previously described commitment to install a reliable hardened pipe containment vent (SAMA 1) had been implemented thereby resulting in a benefit including uncertainty of approximately $42,000 versus a cost of $475,000. The NRC staff noted that for an event where the operator fails to recover low-pressure systems, the discussion indicates that low-pressure systems would not have the power to function. Exelon was asked to consider the potential for utilizing a fire truck or other portable self-powered pumps for injection into the containment. Exelon responded that SAMA 1 (reliable hardened pipe containment vent) with its planned implementation and SAMA 8 (portable 480V AC generator) were determined to be potentially cost beneficial and are proposed in the ER to address the risk contributions from this event. The combination of these two SAMAs would help prevent core damage by providing a means for (i) containment heat removal/pressure control via the reliable hardened pipe containment vent, and (ii) maintaining RPV injection using the existing FPS connection, by providing long-term support for the safety relief valves (SRVs) so that they do not reclose and cause RPV re-pressurization. The addition of a portable self-powered injection pump without SAMA 8 for these contributors would provide very little additional benefit. There would be no apparent reduction in the implementation cost, and it would serve the less desirable function of mitigating a core-damage event rather than preventing core damage. Exelon concluded and the NRC staff agrees that the use of a portable self-powered pump is not considered to be the optimal choice for mitigating the risk associated with the cited event. Exelon’s discussion of the review of industry cost-beneficial SAMAs included Grand Gulf SAMA 59 (to increase operator training to alternate the operation of ECCS pumps for loss-of-room cooling). Exelon stated that rather than cycling large pumps in scenarios where
Appendix F
F-27
the cooling system is lost, a more effective means of maintaining injection with the ECCS pumps is considered to be through the use of portable/temporary cooling alignment, which is addressed in the LSCS importance list review by SAMA 16. In an RAI, the NRC staff asked Exelon to consider a SAMA similar to Grand Gulf’s SAMA 59 for rooms where the use of portable fans may not be effective. In response, Exelon provided a discussion of the various cases where use of portable fans may not be effective and pointed out that most are mitigated by the hardened pipe containment vent (SAMA 1), which Exelon has already committed to installing. Exelon concluded and the NRC staff agrees that once the requirement to install the reliable hardened pipe containment vent has been implemented, the potential benefit of a procedure change to cycle the ECCS pumps would be small (Exelon 2015). While the LSCS IPE submittal did not identify any vulnerability, as discussed in the NRC’s IPE Safety Evaluation Report, the IPE did cite NUREG/CR–4832, Volume 3, Part 1, for insights into potential improvements to:
• Eliminate the sneak circuit in the RCIC isolation logic that results in the RCIC steam line inboard isolation valve closing when offsite AC power is lost and the appropriate diesel generator starts.
• Change the RCIC room temperature isolation logic so that, in cases where AC power from Train A has failed but AC power from Train B is available, this isolation logic does not isolate if no other ECCS is working.
• Change the venting procedure so that venting does not result in severe environments in the reactor building.
In response to an NRC staff RAI to discuss the current status of these potential improvements, Exelon replied, for the first two improvements listed above, changes have been made so that the described sneak circuit and the RCIC isolation no longer exist at LSCS. For the third listed improvement, design improvements were considered and dispositioned at the time of the IPE and no design changes were made at that time to install a hardened pipe containment vent and prevent the rupture of the containment vent piping. Rather, procedure changes were made to acknowledge the design deficiency and initiate alignment of alternate injection systems prior to containment venting, if at all possible. Changes also were made to procedures to control containment pressure within a specific range during the venting evolution. The potential for containment vent path rupture/failure will be addressed through the installation of the reliable hardened pipe containment vent (SAMA 1) (Exelon 2015). Based on the above discussion, the NRC staff concludes that the set of SAMAs evaluated in the ER, together with those identified in response to NRC staff RAIs, addresses the major contributors to the CDF for internal events. As previously discussed, the best available information on seismic and internal fire risk is not compatible with the internal events risk model. Consequently, the search for SAMA candidates to mitigate these risks was based on a review of the dominant risk contributors identified and discussed in Section F.2.2.2. In the ER, Exelon discussed the dominant seismic risk sequences listed in Table F–4 (Exelon 2014a), remarked that changes to LSCS as well as reanalysis of important failures has led to reductions in the significance of several of these sequences, and identified two SAMA candidates that mitigate the seismic risk. The NRC staff notes that the lowest seismic risk contribution considered has a CDF of approximately 1 percent of the CDF for internal events. This value corresponds to a benefit of $11,000 if mitigating only the seismic risk, or $56,000 if mitigating all the other risk contributors. The NRC staff concludes that this is an acceptably low

Appendix F
F-28
cutoff for identification of SAMA candidates since it is lower than the typical cost for revising a procedure. The ER also includes a discussion of the contributors to the dominant fire zone risks listed in Table F–5 (Exelon 2014a). This discussion describes the important fire scenarios that contribute to the fire CDF for this fire zone, the results of a review of the important cutsets, and those SAMAs that would reduce the frequency of these fire scenarios. Exelon’s review and analysis did not identify any unique SAMAs for mitigating these fire scenarios, but Exelon concluded that three of the previous SAMA internal events would significantly impact the fire risk. Exelon noted that the largest unreviewed fire zone represents less than 2.5 percent of the overall total CDF, including external events or about $142,000. In response to an RAI to consider additional fire zones, Exelon provided a discussion of 15 additional fire zones with benefits down to $37,500 per unit. This value was based on a procedure development cost of $50,000 for the first unit and half of that for the second unit, averaging $37,500 per unit. The contributors to the fire risk for each of these zones were reviewed by Exelon to determine if there were any procedure changes that could be potentially cost beneficial. The results of this review are presented in the RAI response on a zone-by-zone basis. No potentially cost-beneficial procedure changes were identified (Exelon 2015). In an RAI, the NRC staff noted that fires in the Division 1 and Division 2 essential switchgear rooms for each unit comprise 60 percent of the total fire CDF and that the only SAMA proposed for mitigating these fires is SAMA 1, installing a reliable hardened pipe containment vent. SAMA 1 only mitigates the adverse consequences of venting and does not mitigate the direct impact of the fire. The NRC staff asked Exelon to discuss these fire scenarios and the potential for other SAMAs to directly mitigate the fire at an earlier stage of the scenario or to mitigate events in the cutsets other than adverse conditions due to venting. Exelon indicated that 79 percent of the contributions are cases in which injection is initially available but subsequently fails due to harsh environmental conditions after containment failure. The unavailability of the containment vent is due to fire-induced failures associated with vent valve support systems, with the vent valve control cables, or both. The reliable hardened pipe containment vent (SAMA 1) eliminates support system requirements and would provide a means of preventing the containment failures and vent path failures that lead to loss of injection capability. Further, for the remaining 21 percent of the contributors, hardware failures result in the unavailability of injection systems, such that even if a containment vent path were available, core damage would still occur. The hardware failures are comprised of both failures of the 4 kV AC power sources that support the injection systems and the failures of the injection system components themselves. LSCS already has the B.5.b pump, which can provide this RPV injection capability for the long-term scenarios that are characteristic of these contributors, but it is not currently credited in the PRA model. LSCS operators have been trained to use the B.5.b pump and the current emergency operating procedures include the B.5.b pump as a potential alternate RPV injection source that could be used to mitigate the Division 1 and Division 2 essential switchgear room fire scenarios. In addition, diverse and flexible coping capability, “FLEX” (NRC 2012b), is intended to provide a separate set of portable makeup pumps that also could be used to perform this function. While the details of the FLEX changes are not finalized, they would further improve the capability of LSCS to respond to these types of scenarios (Exelon 2015). In an RAI, the NRC staff noted that the largest contributing fire scenario to the Auxiliary Electrical Equipment Room fire risk is a bounding cable fire caused by hot work but no SAMAs were identified to mitigate this risk. The NRC staff asked Exelon to discuss the potential for a

Appendix F
F-29
SAMA to mitigate this risk. In response, Exelon indicated that the transient fire ignition frequency calculated for a fire compartment considers the potential for ignition due to “hot work” (cutting, grinding, or welding tasks), among other sources. Based on the 2009 LSCS Fire PRA, the hot work influence factor for the Auxiliary Electrical Equipment Room is “low,” which is the lowest possible factor for this area. Procedures already are in place that require a fire watch to be posted (with portable extinguishers available) and for nearby equipment to be protected when “hot work” is being performed. These practices already are accounted for in the fire risk evaluation for the Auxiliary Electrical Equipment Room. Based on these considerations, no potential SAMAs related to hot work limitations are available that would yield a measurable change in Auxiliary Electrical Equipment Room fire risk. Because the hot work is associated with a bounding transient fire scenario that is assumed to lead to failure of all equipment in the fire compartment, further details are not available to generate additional SAMAs to mitigate the fire beyond those associated with the initiating event frequency (Exelon 2015). As discussed in Section F.2.2.2, the LSCS IPEEE did not provide a definition of vulnerability and did not identify any plant improvements resulting from the fire, seismic, or other external events analyses. However, the RMIEP report identified two issues in the fire area that were “provided to the station for disposition.” These issues were to install tops on the main control room electrical panels and to institute an inspection program for penetration seals at the top of switchgear panels. As discussed in the ER, these improvements were not implemented. Based on the current understanding of fires in electrical panels, such as those installed at LSCS, and on industry guidance for the treatment of fire in these panels in NUREG/CR–6285, Exelon concluded that these two identified potential improvements would not be effective in mitigating the associated fire risk. In an RAI, the NRC staff noted that the RMIEP Summary (NUREG/CR–4832, Volume 1) identifies the common cause failures (CCF) of the CSCS cooling water pumps as the dominant events in the seismic risk reduction importance assessment. In response to the RAI to discuss these events and their importance in the seismic analysis used for SAMA identification, Exelon discussed the internally cited conflicting information in Volume 1 (Summary) and Volume 8 (Seismic Analysis) and concluded that CCFs of the CSCS cooling water pumps do not appear to drive the results of seismic risk at LSCS. While no SAMAs were generated to directly address these specific failures, the consequences of the CCF of the CSCS cooling water pumps is essentially a long-term SBO, a scenario previously addressed by SAMAs evaluated in the LSCS analysis. SAMA 27 mitigates cases in which RCIC remains available (not failed by seismically induced failure of the condensate storage tank), and SAMA 26 reduces the risk associated with scenarios in which RCIC is not available. These SAMAs are considered by Exelon to adequately address any potential contributions from CCF of the CSCS cooling water pumps. In addition, Exelon stated that review of the LOOP and dual unit LOOP contributors from the LSCS 2013A PRA model indicates that CCFs of the CSCS pumps are low contributors to those scenarios. If, as stated in Section 4.5.1 of NUREG/CR–4832 Volume 1, the dominant seismic sequences are “all seismically induced losses of offsite power and look exactly like the equivalent internally initiated sequences except that no credit is given for recovering offsite power,” then the conclusion would be that CCF of the CSCS cooling water pumps are not significant contributors to seismic risk. Exelon also noted that subsequent to the completion of the RMIEP analysis, Commonwealth Edison (now Exelon) performed a review of that study and largely used the results as the basis for the combined IPE and IPEEE submittal. Exelon indicated that one of the conclusions of the review effort, documented in the executive summary of the April 1994 IPE/IPEEE (CECO 1994), is that Commonwealth Edison considered the “Beta factor” CCF process used in the RMEIP analysis to be overly conservative (Exelon 2015). As stated earlier, the Exelon IPEEE analysis of other external hazards (high winds, tornadoes,
Appendix F
F-30
external floods, and other external events) did not identify opportunities for improvements for these events. As discussed in Section F.2.2.2, the LSCS external flooding design and capability was assessed in the engineering walkdowns and flood hazard reevaluation required for the response to the Fukushima Daiichi NTTF’s Recommendation 2.3 (NRC 2012a). The walkdown identified deficiencies that are being addressed through the LSCS corrective action program, while the results of the hazard reevaluation led to the requirement for the performance of a full external flooding integrated assessment, now underway. These issues are being addressed via the ongoing Japan Lessons Learned program and implementation of the Fukushima Daiichi NTTF recommendations, including NRC Order EA-12-049, “Order to Modify Licenses with Regard to Requirements for Mitigation Strategies for Beyond-Design-Basis External Events” (NRC 2012b). The NRC staff concludes that for the purposes of SAMA identification, external flooding is adequately addressed. Since external flooding is not a significant contributor to plant risk, a cost-beneficial SAMA is not likely to be identified. Additionally, the ongoing programs described above provide improvements to the external flooding risk that are more conservative than a cost-beneficial SAMA. Regarding the prevention of water hammer events, the NRC staff questioned Exelon about potentially lower cost alternatives to SAMA 7 (alter the LOCA signal logic to require both high drywell pressure and low RPV water level for initiation of a LOCA signal). In non-LOCA transient scenarios, the heat load rejected to the containment is sufficient to prompt the initiation of suppression pool cooling (SPC), but even with SPC in operation, the drywell pressure will reach 2 psig and a LOCA signal will register. If a consequential LOOP occurs with the LOCA signal, the RHR discharge line can drain to the suppression pool in the ~45 seconds between RHR pump load shed and the time it is reloaded on the diesel-backed bus, which sets up a water hammer condition in the voided pipe. The lower cost alternative would be to change the suppression pool cooling operating procedures or practices to reduce the chances of the 2 psi high drywell pressure signal being reached for normal transients. In response, Exelon indicated that no changes to the LSCS operating procedures would reduce the chance that the 2 psig high drywell pressure signal would be reached in the scenarios of interest. The issue is that in the scenarios of interest (initiators that result in the loss of containment cooling), SPC does not have the capacity to remove enough heat to prevent the containment pressure from exceeding 2 psig without venting containment in accordance with normal operating procedures to maintain containment pressure less than the LOCA signal initiation pressure setpoint. Any changes to the suppression pool cooling system operating procedures intended to increase the time available between the initiating event and the 2 psig high drywell pressure signal would have a very small impact on risk. Human error probabilities (HEPs) are influenced by a number of factors, including time available for response. In this case, the HEP for the operator action to vent the containment to prevent the high drywell signal is not significantly impacted by timing considerations, and increasing the time available to the operators would correlate to very small averted cost-risk values. The more difficult mitigating actions for water hammer scenarios are associated with the approximate 20-second time interval between the occurrence of the loss of the running pump on the LOCA-induced LOOP and the time when the pumps are automatically started and reloaded onto the emergency bus. This short time period is not associated with the operation of suppression pool cooling; therefore, a SAMA would have no benefit to these scenarios. In these scenarios, the operators must put the pump in pull-to-lock to prevent restart and then fill and vent the system to ensure a water hammer does not occur (Exelon 2015). The NRC staff notes that the set of SAMAs submitted is not all-inclusive because additional, possibly even less expensive, alternatives can always be postulated. However, the NRC staff concludes that the benefits of any additional modifications are unlikely to exceed the benefits of

Appendix F
F-31
the modifications evaluated and that the alternative improvements would not likely cost less than the least expensive alternatives evaluated, when the subsidiary costs associated with maintenance, procedures, and training are considered. The NRC staff concludes that Exelon used a systematic and comprehensive process for identifying potential plant improvements for LSCS, and that the set of potential plant improvements identified by Exelon is reasonably comprehensive and, therefore, acceptable. This search included reviewing insights from the plant-specific risk studies, and reviewing plant improvements considered in previous SAMA analyses. While explicit treatment of external events in the SAMA identification process was limited, the NRC staff has determined that the prior implementation of plant modifications and the absence of external event vulnerabilities reasonably justify examining primarily the internal events risk results for this purpose.
F.4 Risk Reduction Potential of Plant Improvements
Exelon evaluated the risk-reduction potential of the 25 SAMAs retained for the Phase II evaluation in a revised analysis (Exelon 2015). The SAMA evaluations were generally performed by Exelon in a realistic or slightly conservative fashion that overestimates the benefit of the SAMA. In most cases, the failure likelihood of the added equipment is taken to be optimistically low, thereby overestimating the benefit of the SAMA. In other cases, it was assumed that the SAMA eliminated all of the risk associated with the proposed enhancement. The NRC staff notes that this bounding approach overestimates the benefit and therefore is appropriately conservative. Exelon used model requantification to determine the potential benefits for each of the SAMAs. The CDFs, population dose reductions, and offsite economic cost reductions were estimated using the LSCS PRA model. The changes made to the model to quantify the impact of each SAMA are described in Section F.6 of the ER. Table F–6 summarizes the assumptions used to estimate the risk reduction for each evaluated SAMA, the estimated risk reduction in terms of CDF percent reduction, population dose, offsite economic cost, and the estimated total benefit (present value) of the averted risk. The determination of the benefits for the various SAMAs is further discussed in Section F.6. The NRC staff reviewed the assumptions used in evaluating the benefit or risk reduction estimate of each SAMA, as described in the Section F.6 of the ER. The resolution of RAIs that resulted from this review follow. The discussions of SAMA 8 in Section F.6.8 of the ER and SAMA 14 in Section F.6.13 of the ER include the statement “Flow from the fire protection system, in its current configuration, is only adequate in cases where RCIC....” In response to an RAI to discuss what is meant by “current configuration,” and the potential for a SAMA to address the FPS configuration and make it possible to use without prior RCIC operation, Exelon responded that there are two major issues that preclude the use of the FPS for RPV makeup in early time frames to prevent core damage. The first is related to the low flow rate of the makeup path, and the second is related to the relatively long time that is required to align the FPS for injection. The connection that is currently used to provide RPV makeup from the FPS consists of fire hoses that are manually aligned between the FPS header and the feedwater injection lines. The RPV pressure must be reduced below 75 psig for Unit 1 and 60 psig for Unit 2 to achieve a flow rate of 200 gpm into the RPV and would be successful only after 4 hours following initial high pressure injection and subsequent RPV depressurization. Prior to 4 hours, decay heat levels would be such that 200 gpm would be insufficient for RPV makeup. Relative to the second issue, Exelon indicated that operator interviews indicate that about 40 minutes are required to establish the flow path from the FPS to the RPV. It would not be possible to align this injection path even if adequate

Appendix F
F-32
flow could be obtained from the FPS to make up for boil-off. Exelon indicated and the NRC staff agrees that both of these issues were assumed mitigated by SAMA 18, “Improvement of the Connection Between the Fire Protection and Feedwater Systems.” While this SAMA was developed to reduce the alignment time such that it would be possible to perform the alignment in cases where RCIC injection fails, one of the assumptions made in the SAMA 18 assessment was that the improved connection also would improve the flow rate of FPS injection to a point where it could provide adequate makeup in loss of all injection scenarios (Exelon 2015). In Section F.6.13 of the ER, the discussion of SAMA 14 (provide a portable DC source to support RCIC and SRV operation) indicates that the PRA model was changed to include a lumped event to represent the 480 V AC power source that feeds the Division 1 battery chargers. The SAMA description and the basic events cited to be mitigated by this SAMA indicated that a DC power source to directly supply an engineered safety feature (ESF) DC distribution panel is needed. In response to an RAI to discuss the inclusion of an AC power supply in the model, Exelon responded that the description of the PRA model changes related to the lumped event that was added to “represent the 480V AC power source that feeds the Division 1 battery charger” is erroneous and that the text should read “a lumped event was added to represent the 125 V DC generator that would supply 125 V ESF DC distribution panel 1(2)11Y.” The detailed PRA model change descriptions documented in Section F.6.13 of the ER accurately describe how the lumped event (basic event ID “SAMA 14”) was incorporated into the PRA model for SAMA 14 (Exelon 2015). In an RAI, the NRC staff noted that SAMA 7 (water hammer prevention) and SAMA 25 (periodic training on water hammer scenarios resulting from a false LOCA signal) both are intended to mitigate the water hammer scenarios involving SPC operation interrupted by a LOOP. The changes made to the model and the impacts on population dose risk and offsite economic cost risk are significantly different for the two SAMAs. In response to the NRC staff RAI to discuss these SAMAs and their analyses in more detail to justify these differences, Exelon responded that SAMA 7 and SAMA 25 are different approaches to addressing the risk associated with water hammer events at LSCS. While the different approaches might be expected to lead to some differences in the CDF and risk impact of the two SAMAs, the difference in person-rem and offsite economic risk impacts reported in the ER was found to be due to a recently discovered error in a supporting spreadsheet calculation for SAMA 25. Exelon provided corrected values in the RAI response and indicated that the reduced benefit for SAMA 25 changed its disposition from cost beneficial to not cost beneficial (Exelon 2015). The NRC staff agrees that these values are correct. The NRC staff noted that SAMA 9 (Develop flood zone specific procedures) and SAMA 11 (Provide the capability to trip the FPS pumps) both address internal flooding; whose principal contributor is a FPS pipe rupture in the reactor building. The assumption that all of the relevant internal flooding risk will be eliminated by implementing SAMA 9, lowers the overall CDF by 9 percent and results in this SAMA being cost beneficial. As stated in Section F.6.11 of the ER, SAMA 11 is designed to eliminate the FPS’s flow. For SAMA 11, there is less than a 2 percent reduction in CDF. In response to an RAI to discuss the FPS design, the FPS pipe break scenarios, and associated modeling to support the above results, Exelon responded that the primary reason for the significant difference between SAMA 9 and SAMA 11 risk reductions is that they target different portions of flooding risk. SAMA 9 targets all flooding initiators while SAMA 11 targets only a subset of FPS flooding scenarios. SAMA 9 was conservatively modeled by assuming that it eliminated all internal flooding risk. The 9 percent reduction in CDF is consistent with the CDF values reported for the internal flooding initiators in Table F.2–2 of the ER. SAMA 11 provides only a means of tripping the FPS pumps in the main control room, which helps reduce the risk of FPS flooding events that require a rapid response (i.e., large
Appendix F
F-33
breaks) but would only have a small impact on the longer term FPS flooding scenarios. Since SAMA 11 only improves the reliability of one human action in the PRA model, only a small improvement in CDF is expected. In contrast, SAMA 9 improves the reliability of all human response actions to all flood scenarios and, therefore, has a larger overall impact on the model (Exelon 2015). The NRC staff reviewed Exelon’s bases for calculating the risk reduction for the various plant improvements and concludes, with the above clarifications and corrections, that the rationale and assumptions for estimating risk reduction are reasonable and generally conservative (i.e., the estimated risk reduction is higher than what would actually be realized). Accordingly, the NRC staff based its estimates of averted risk for the various SAMAs on Exelon’s risk reduction estimates.

F-34
Appendix F
Tabl
e F–
5. S
AMA
Cos
t-Ben
efit
Scre
enin
g An
alys
is fo
r LSC
S St
atio
n(a)
Indi
vidu
al S
AMA
and
Assu
mpt
ion
% R
isk
Red
uctio
n(b)
Tota
l Ben
efit
($)(c
)
Cos
t ($
)(c)
CD
F Po
pula
tion
Dos
e O
ECR
Bas
elin
e (In
tern
al +
Ex
tern
al)
Bas
elin
e W
ith
Unc
erta
inty
(9
5th
perc
entil
e)
1 –
INST
ALL
REL
IABL
E H
ARD
PIP
E C
ON
TAIN
MEN
T VE
NT
28
36
43
2.5M
5.
4M
13M
S
AM
A 1
Mod
elin
g: T
he m
odel
was
mod
ified
by
elim
inat
ing
the
supp
ort s
yste
m d
epen
denc
ies,
impr
ovin
g th
e re
liabi
lity
of th
e ve
ntin
g ac
tion
to
refle
ct s
impl
ifica
tion
of th
e co
ntro
ls, a
nd e
limin
atin
g th
e ev
ents
rela
ted
to v
ent p
ath
rupt
ure
and
leak
age.
2
– AU
TOM
ATE
SUPP
RES
SIO
N P
OO
L C
OO
LIN
G
14
20
25
1.4M
3.
1M
400K
S
AM
A 2
Mod
elin
g: T
he fa
ult t
ree
inco
rpor
ated
the
auto
mat
ion
of s
uppr
essi
on p
ool c
oolin
g al
ignm
ent b
y ch
angi
ng th
e in
depe
nden
t bas
ic e
vent
ID
s fo
r sup
pres
sion
poo
l coo
ling
initi
atio
n to
alte
rnat
e ID
s. T
his
acco
mpl
ishe
s tw
o fu
nctio
ns:
(i) a
ssig
nmen
t of a
ltern
ate
failu
re p
roba
bilit
ies
that
ar
e re
pres
enta
tive
of a
n au
tom
ated
func
tion,
and
(ii)
prev
ent t
he re
cove
ry lo
gic
from
iden
tifyi
ng s
uppr
essi
on p
ool c
oolin
g in
itiat
ion
failu
res
as
hum
an a
ctio
ns a
nd p
recl
ude
the
supp
ress
ion
pool
coo
ling
initi
atio
n fa
ilure
s fro
m d
epen
dent
hum
an e
rror
com
bina
tions
. 3
– PA
SSIV
E VE
NT
PATH
36
51
61
1.
0M
2.2M
1.
0M
SA
MA
3 M
odel
ing:
The
bas
ic e
vent
for t
he o
pera
tor a
ctio
n fo
r ven
ting
was
repl
aced
with
a n
ew p
lace
hold
er e
vent
with
a v
alue
of 1
0‒6 (
prev
ents
th
e cr
eatio
n of
dep
ende
nt o
pera
tor a
ctio
ns, i
nclu
ding
the
vent
act
ion)
. Th
e ha
rdw
are
failu
res
asso
ciat
ed w
ith th
e ve
nt p
ath
valv
es h
ave
been
re
tain
ed to
app
roxi
mat
e th
e po
tent
ial f
ailu
res
of th
e ru
ptur
e di
sk (w
ith th
e su
ppor
t sys
tem
dep
ende
ncie
s re
mov
ed).
4 –
INST
ALL
A K
EYLO
CK
MSI
V LO
W L
EVEL
ISO
LATI
ON
B
YPAS
S SW
ITC
H
16
12
10
674K
1.
4M
635K
S
AM
A 4
Mod
elin
g: T
he in
depe
nden
t hum
an e
rror
pro
babi
lity
to b
ypas
s th
e m
ain
stea
m is
olat
ion
valv
e lo
w le
vel i
sola
tion
inte
rlock
was
set
to 1
0‒5
and
the
join
t hum
an e
rror
pro
babi
litie
s th
at in
clud
e th
is a
ctio
n ha
ve b
een
elim
inat
ed.
5 –
AUTO
MAT
E SB
LC IN
ITIA
TIO
N
8 7
6 38
6K
827K
40
0K
SA
MA
5 M
odel
ing:
The
aut
omat
ic S
BLC
initi
atio
n ca
pabi
lity
is m
odel
ed b
y m
anip
ulat
ion
of a
ssoc
iate
d ba
sic
even
ts.
Ear
ly S
BLC
initi
atio
n ba
sic
even
t ID
(2S
LOP
-LV
LCTR
LH--
) was
cha
nged
to “S
AM
A5”
and
set
to a
pro
babi
lity
of 1
0‒6 t
o re
duce
the
inde
pend
ent f
ailu
re c
ontri
butio
n to
a s
mal
l va
lue
and
prev
ent t
he in
clus
ion
of d
epen
dent
ope
rato
r act
ion
com
bina
tions
with
SB
LC in
itiat
ion
failu
res,
con
sist
ent w
ith th
e au
tom
ated
act
ion.
6
– C
REA
TE E
CC
S SU
CTI
ON
STR
AIN
ER B
ACKF
LUSH
C
APAB
ILIT
Y W
ITH
RH
RSW
1
1 1
87K
186K
2.
9M
SA
MA
Mod
elin
g: T
he c
ontri
butio
n re
late
d to
com
mon
cau
se fa
ilure
stra
iner
clo
ggin
g w
as e
limin
ated
by
setti
ng th
e co
rres
pond
ing
basi
c ev
ents
in
the
cuts
et fi
les
to z
ero.
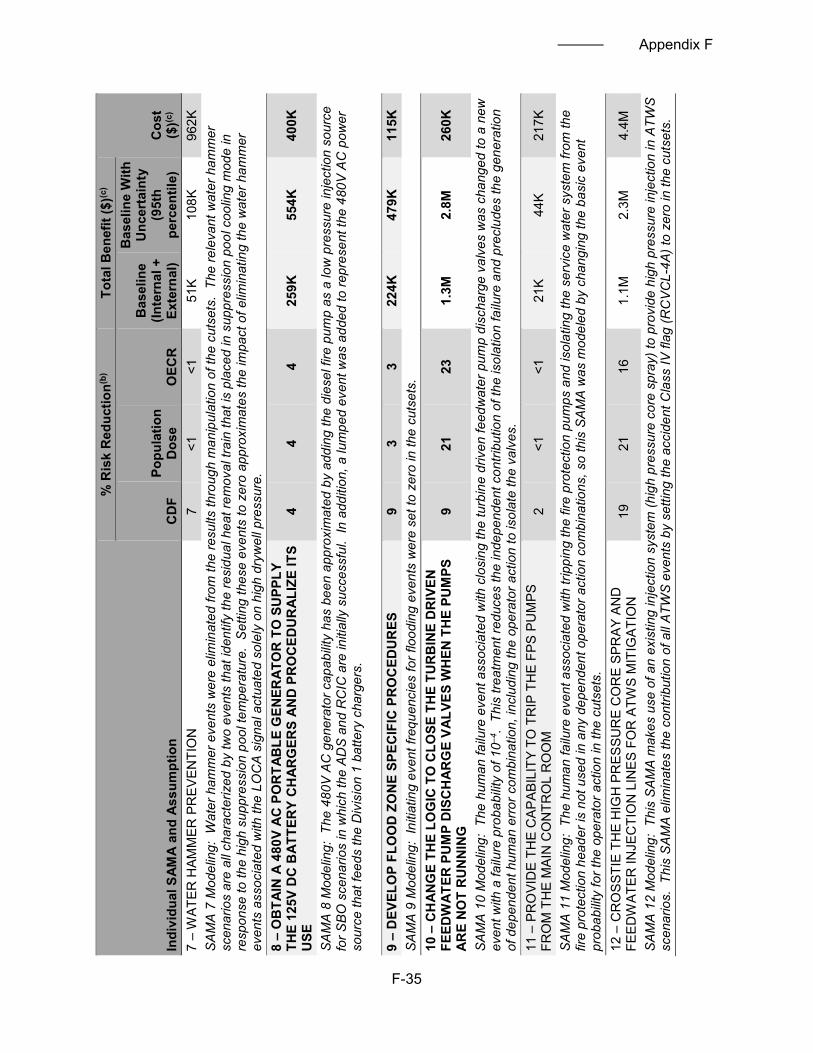
Appendix F
F-35
Indi
vidu
al S
AMA
and
Assu
mpt
ion
% R
isk
Red
uctio
n(b)
Tota
l Ben
efit
($)(c
)
Cos
t ($
)(c)
CD
F Po
pula
tion
Dos
e O
ECR
Bas
elin
e (In
tern
al +
Ex
tern
al)
Bas
elin
e W
ith
Unc
erta
inty
(9
5th
perc
entil
e)
7 –
WAT
ER H
AMM
ER P
REV
ENTI
ON
7
<1
<1
51K
108K
96
2K
SA
MA
7 M
odel
ing:
Wat
er h
amm
er e
vent
s w
ere
elim
inat
ed fr
om th
e re
sults
thro
ugh
man
ipul
atio
n of
the
cuts
ets.
The
rele
vant
wat
er h
amm
er
scen
ario
s ar
e al
l cha
ract
eriz
ed b
y tw
o ev
ents
that
iden
tify
the
resi
dual
hea
t rem
oval
trai
n th
at is
pla
ced
in s
uppr
essi
on p
ool c
oolin
g m
ode
in
resp
onse
to th
e hi
gh s
uppr
essi
on p
ool t
empe
ratu
re.
Set
ting
thes
e ev
ents
to z
ero
appr
oxim
ates
the
impa
ct o
f elim
inat
ing
the
wat
er h
amm
er
even
ts a
ssoc
iate
d w
ith th
e LO
CA
sig
nal a
ctua
ted
sole
ly o
n hi
gh d
ryw
ell p
ress
ure.
8
– O
BTA
IN A
480
V AC
PO
RTA
BLE
GEN
ERAT
OR
TO
SU
PPLY
TH
E 12
5V D
C B
ATTE
RY
CH
ARG
ERS
AND
PR
OC
EDU
RAL
IZE
ITS
USE
4
4 4
259K
55
4K
400K
SA
MA
8 M
odel
ing:
The
480
V A
C g
ener
ator
cap
abili
ty h
as b
een
appr
oxim
ated
by
addi
ng th
e di
esel
fire
pum
p as
a lo
w p
ress
ure
inje
ctio
n so
urce
fo
r SB
O s
cena
rios
in w
hich
the
AD
S a
nd R
CIC
are
initi
ally
suc
cess
ful.
In a
dditi
on, a
lum
ped
even
t was
add
ed to
repr
esen
t the
480
V A
C p
ower
so
urce
that
feed
s th
e D
ivis
ion
1 ba
ttery
cha
rger
s.
9 –
DEV
ELO
P FL
OO
D Z
ON
E SP
ECIF
IC P
RO
CED
UR
ES
9 3
3 22
4K
479K
11
5K
SA
MA
9 M
odel
ing:
Ini
tiatin
g ev
ent f
requ
enci
es fo
r flo
odin
g ev
ents
wer
e se
t to
zero
in th
e cu
tset
s.
10 –
CH
ANG
E TH
E LO
GIC
TO
CLO
SE T
HE
TUR
BIN
E D
RIV
EN
FEED
WAT
ER P
UM
P D
ISC
HAR
GE
VALV
ES W
HEN
TH
E PU
MPS
AR
E N
OT
RU
NN
ING
9
21
23
1.3M
2.
8M
260K
SA
MA
10
Mod
elin
g: T
he h
uman
failu
re e
vent
ass
ocia
ted
with
clo
sing
the
turb
ine
driv
en fe
edw
ater
pum
p di
scha
rge
valv
es w
as c
hang
ed to
a n
ew
even
t with
a fa
ilure
pro
babi
lity
of 1
0‒4 .
Thi
s tre
atm
ent r
educ
es th
e in
depe
nden
t con
tribu
tion
of th
e is
olat
ion
failu
re a
nd p
recl
udes
the
gene
ratio
n of
dep
ende
nt h
uman
err
or c
ombi
natio
n, in
clud
ing
the
oper
ator
act
ion
to is
olat
e th
e va
lves
. 11
– P
RO
VID
E TH
E C
APAB
ILIT
Y TO
TR
IP T
HE
FPS
PUM
PS
FRO
M T
HE
MAI
N C
ON
TRO
L R
OO
M
2 <1
<1
21
K 44
K 21
7K
SA
MA
11
Mod
elin
g: T
he h
uman
failu
re e
vent
ass
ocia
ted
with
trip
ping
the
fire
prot
ectio
n pu
mps
and
isol
atin
g th
e se
rvic
e w
ater
sys
tem
from
the
fire
prot
ectio
n he
ader
is n
ot u
sed
in a
ny d
epen
dent
ope
rato
r act
ion
com
bina
tions
, so
this
SA
MA
was
mod
eled
by
chan
ging
the
basi
c ev
ent
prob
abili
ty fo
r the
ope
rato
r act
ion
in th
e cu
tset
s.
12 –
CR
OSS
TIE
THE
HIG
H P
RES
SUR
E C
OR
E SP
RAY
AN
D
FEED
WAT
ER IN
JEC
TIO
N L
INES
FO
R A
TWS
MIT
IGAT
ION
19
21
16
1.
1M
2.3M
4.
4M
SA
MA
12
Mod
elin
g: T
his
SA
MA
mak
es u
se o
f an
exis
ting
inje
ctio
n sy
stem
(hig
h pr
essu
re c
ore
spra
y) to
pro
vide
hig
h pr
essu
re in
ject
ion
in A
TWS
sc
enar
ios.
Thi
s S
AM
A e
limin
ates
the
cont
ribut
ion
of a
ll A
TWS
eve
nts
by s
ettin
g th
e ac
cide
nt C
lass
IV fl
ag (R
CV
CL-
4A) t
o ze
ro in
the
cuts
ets.

F-36
Appendix F
Indi
vidu
al S
AMA
and
Assu
mpt
ion
% R
isk
Red
uctio
n(b)
Tota
l Ben
efit
($)(c
)
Cos
t ($
)(c)
CD
F Po
pula
tion
Dos
e O
ECR
Bas
elin
e (In
tern
al +
Ex
tern
al)
Bas
elin
e W
ith
Unc
erta
inty
(9
5th
perc
entil
e)
14 –
PR
OVI
DE
A PO
RTA
BLE
DC
SO
UR
CE
TO S
UPP
OR
T R
CIC
AN
D S
RV
OPE
RAT
ION
9
7 7
444K
94
9K
489K
SA
MA
14
Mod
elin
g: T
he D
C g
ener
ator
cap
abili
ty h
as b
een
appr
oxim
ated
by
addi
ng th
e di
esel
fire
pum
p as
a lo
w p
ress
ure
inje
ctio
n so
urce
for
SB
O s
cena
rios
in w
hich
the
AD
S a
nd R
CIC
are
initi
ally
suc
cess
ful.
In a
dditi
on, a
lum
ped
even
t was
add
ed to
repr
esen
t the
480
V A
C p
ower
so
urce
that
feed
s th
e D
ivis
ion
1 ba
ttery
cha
rger
s.
15 –
TIE
RH
RSW
TO
TH
E LP
CS
SYST
EM F
OR
ISLO
CA
MIT
IGAT
ION
37
57
57
3.
4M
7.2M
1.
4M
SA
MA
15
Mod
elin
g: C
hang
es w
ere
mad
e to
bot
h th
e m
ain
faul
t tre
e an
d th
e re
cove
ry fa
ult t
ree.
The
cro
ss-ti
e w
as a
ssum
ed to
requ
ire th
e LP
CS
in
ject
ion
path
(exi
stin
g lo
gic
from
the
LPC
S s
yste
m) a
nd th
e av
aila
bilit
y of
the
RH
RS
W p
umps
(exi
stin
g lo
gic
from
the
RH
RS
W s
yste
m).
IS
LOC
As
in th
e LP
CS
line
wer
e in
clud
ed a
s fa
ilure
for t
he c
ross
-tie,
as
was
an
even
t rep
rese
ntin
g th
e fa
ilure
to a
lign
the
cros
s-tie
. Th
e cr
oss-
tie
logi
c w
as a
dded
at t
he s
eque
nce
leve
l for
BO
C a
nd IS
LOC
A s
eque
nces
whe
re c
redi
t was
not
pre
viou
sly
take
n fo
r any
low
pre
ssur
e in
ject
ion
syst
ems.
The
logi
c al
so w
as a
dded
to th
e ex
istin
g fa
ult t
ree
stru
ctur
e in
sce
nario
s w
here
ven
ting
or c
onta
inm
ent f
ailu
re re
sulte
d in
the
loss
of
inje
ctio
n sy
stem
s.
16 –
PR
OVI
DE
POR
TAB
LE F
ANS
FOR
ALT
ERN
ATE
RO
OM
C
OO
LIN
G IN
TH
E C
SCS
VAU
LTS
14
12
15
866K
1.
9M
475K
SA
MA
16
Mod
elin
g: T
he a
ltern
ate
CS
CS
room
coo
ling
capa
bilit
y w
as a
ppro
xim
ated
by
dele
ting
the
gate
s as
soci
ated
with
room
coo
ling
failu
res
(exc
ludi
ng th
e au
tom
atic
initi
atio
n fa
ilure
s, w
hich
are
alre
ady
addr
esse
d in
the
mod
el).
18 –
IMPR
OVE
TH
E C
ON
NEC
TIO
N B
ETW
EEN
TH
E FI
RE
PRO
TEC
TIO
N A
ND
FEE
DW
ATER
SYS
TEM
S 9
9 10
60
9K
1.3M
64
9K
SA
MA
18
Mod
elin
g: T
he fa
ult t
ree
was
upd
ated
to c
redi
t the
FP
S in
the
plac
es w
here
LP
CI a
nd L
PC
S a
re c
redi
ted,
but
the
syst
em is
faile
d fo
r th
e LO
CA
and
IOR
V in
itiat
ing
even
t and
for w
ater
ham
mer
sce
nario
s. I
n ad
ditio
n, th
e lo
gic
was
cha
nged
to in
clud
e th
e FP
S in
ject
ion
capa
bilit
y in
th
e ea
rly S
BO
sce
nario
s in
whi
ch th
e A
DS
is a
vaila
ble
for t
hose
seq
uenc
es n
ot im
pact
ed b
y th
e LP
CS
-LP
CI g
ate.
19
– P
RO
VID
E R
EMO
TE A
LIG
NMEN
T C
APAB
ILIT
Y O
F R
HR
SW
TO T
HE
LPC
S SY
STEM
FO
R L
OC
A M
ITIG
ATIO
N
38
58
58
3.4M
7.
3M
2.9M
SA
MA
19
Mod
elin
g: T
he in
clus
ion
of th
e R
HR
SW
-LP
CS
cro
ss-ti
e re
quire
d ch
ange
s to
bot
h th
e m
ain
faul
t tre
e an
d th
e re
cove
ry fa
ult t
ree.
The
cr
oss-
tie w
as a
ssum
ed to
requ
ire th
e LP
CS
inje
ctio
n pa
th (e
xist
ing
logi
c fro
m th
e LP
CS
sys
tem
) and
the
avai
labi
lity
of th
e R
HR
SW
pum
ps
(exi
stin
g lo
gic
from
the
RH
RS
W s
yste
m).
ISLO
CA
s in
the
LPC
S li
ne w
ere
incl
uded
as
failu
re fo
r the
cro
ss-ti
e, a
s w
as a
n ev
ent r
epre
sent
ing
the
failu
re to
alig
n th
e cr
oss-
tie.
The
cros
s-tie
logi
c w
as a
dded
at t
he s
eque
nce
leve
l for
BO
C a
nd IS
LOC
A s
eque
nces
whe
re c
redi
t was
not
pr
evio
usly
take
n fo
r any
low
pre
ssur
e in
ject
ion
syst
ems.
The
logi
c al
so w
as a
dded
to th
e ex
istin
g fa
ult t
ree
stru
ctur
e in
sce
nario
s w
here
ven
ting
or c
onta
inm
ent f
ailu
re re
sulte
d in
the
loss
of i
njec
tion
syst
ems.

Appendix F
F-37
Indi
vidu
al S
AMA
and
Assu
mpt
ion
% R
isk
Red
uctio
n(b)
Tota
l Ben
efit
($)(c
)
Cos
t ($
)(c)
CD
F Po
pula
tion
Dos
e O
ECR
Bas
elin
e (In
tern
al +
Ex
tern
al)
Bas
elin
e W
ith
Unc
erta
inty
(9
5th
perc
entil
e)
20 –
IMPR
OVE
VAC
UU
M B
REA
KER
REL
IABI
LITY
BY
INST
ALLI
NG
R
EDU
ND
ANT
VALV
ES IN
EAC
H L
INE
1 2
2 11
3K
243K
1.
2M
SA
MA
20
Mod
elin
g: T
he in
stal
latio
n of
the
redu
ndan
t vac
uum
bre
aker
s is
mod
eled
by
setti
ng th
e pr
obab
ility
of t
he v
acuu
m b
reak
ers
faili
ng to
re
clos
e to
zer
o. I
t is
assu
med
that
ther
e ar
e no
neg
ativ
e co
nseq
uenc
es a
ssoc
iate
d w
ith in
stal
ling
the
redu
ndan
t vac
uum
bre
aker
s (i.
e., t
he
failu
re to
ope
n pr
obab
ility
of t
he v
acuu
m b
reak
ers
is n
ot in
crea
sed)
. 21
– IN
STAL
L AU
TOM
ATIC
ATW
S LE
VEL
CO
NTR
OL
SYST
EM
14
14
12
754K
1.
6M
1.5M
S
AM
A 2
1 M
odel
ing:
The
SA
MA
is m
odel
ed b
y se
tting
the
early
and
late
leve
l con
trol a
ctio
ns to
zer
o in
the
faul
t tre
e.
22 –
HYD
RO
GEN
IGN
ITO
RS
IN P
RIM
ARY
CO
NTA
INM
ENT
<1
1 1
34K
72K
205K
S
AM
A 2
2 M
odel
ing:
The
SA
MA
is m
odel
ed b
y se
tting
the
failu
re p
roba
bilit
y of
hyd
roge
n de
tona
tion
to z
ero
in th
e cu
tset
s.
23 –
EN
HAN
CE
FUEL
PO
OL
EMER
GEN
CY
MAK
EUP
PUM
P AN
D C
ON
NEC
TIO
N
27
46
52
3.0M
6.
5M
1.4M
SA
MA
23
Mod
elin
g: T
he in
clus
ion
of th
e fu
el p
ool e
mer
genc
y m
akeu
p pu
mp
cros
s-tie
requ
ired
chan
ges
to b
e m
ade
to b
oth
the
mai
n fa
ult t
ree
and
the
reco
very
faul
t tre
e. T
he c
ross
-tie
was
ass
umed
to re
quire
the
resi
dual
hea
t rem
oval
B in
ject
ion
path
(exi
stin
g lo
gic
from
the
LPC
I sy
stem
). T
he lo
gic
was
add
ed to
the
exis
ting
faul
t tre
e st
ruct
ure
in s
cena
rios
whe
re v
entin
g or
con
tain
men
t fai
lure
resu
lted
in th
e lo
ss o
f inj
ectio
n sy
stem
s.
24 –
PR
OVI
DE
INTE
R D
IVIS
ION
4 K
V AC
CR
OSS
TIE
CAP
ABIL
ITY
5 5
6 36
7K
785K
1.
8M
SA
MA
24
Mod
elin
g: T
he im
plem
enta
tion
of th
e in
ter-
divi
sion
cro
ss-ti
e is
mod
eled
by
incl
udin
g th
e ot
her t
wo
dies
el g
ener
ator
s fro
m th
e sa
me
unit
as p
oten
tial p
ower
sup
ply
sour
ces
for a
giv
en e
mer
genc
y bu
s.
25 –
PER
IOD
IC T
RAI
NIN
G O
N W
ATER
HAM
MER
SC
ENAR
IOS
RES
ULT
ING
FR
OM
A F
ALSE
LO
CA
SIG
NAL
5
<1
<1
42K
89K
112K
SA
MA
25
Mod
elin
g: T
his
SA
MA
was
mod
eled
by
chan
ging
bas
ic e
vent
val
ues
in th
e cu
tset
s to
refle
ct th
e im
prov
ed re
liabi
lity
of th
e dr
ywel
l ve
ntin
g ac
tion
for p
reve
ntin
g a
LOC
A s
igna
l in
non-
LOC
A c
ases
. 26
– S
EISM
ICAL
LY Q
UAL
IFIE
D L
OW
-PR
ESSU
RE
RPV
MAK
EUP
CAP
ABIL
ITY
28
33
39
2.3M
4.
9M
6.0M
SA
MA
26
Mod
elin
g: C
hang
es w
ere
mad
e to
bot
h th
e m
ain
faul
t tre
e an
d th
e re
cove
ry fa
ult t
ree.
Log
ic w
as a
dded
to th
e ex
istin
g fa
ult t
ree
stru
ctur
e in
sce
nario
s w
here
LP
CI a
nd L
PC
S a
re c
redi
ted
and
whe
re c
onta
inm
ent f
ailu
re re
sults
in th
e lo
ss o
f inj
ectio
n sy
stem
s du
e to
adv
erse
en
viro
nmen
tal c
ondi
tions
. Lo
gic
was
incl
uded
in th
e fa
ult t
ree
prec
lude
cre
dit f
or lo
ss o
f inv
ento
ry s
cena
rios
whe
re th
e 60
0 ga
llons
per
min
ute
mak
eup
rate
may
be
inad
equa
te (e
.g.,
LOC
A e
vent
s an
d m
akeu
p to
pre
vent
RP
V m
elt-t
hrou
gh).

F-38
Appendix F
Indi
vidu
al S
AMA
and
Assu
mpt
ion
% R
isk
Red
uctio
n(b)
Tota
l Ben
efit
($)(c
)
Cos
t ($
)(c)
CD
F Po
pula
tion
Dos
e O
ECR
Bas
elin
e (In
tern
al +
Ex
tern
al)
Bas
elin
e W
ith
Unc
erta
inty
(9
5th
perc
entil
e)
27 –
PR
ECLU
DE
EMER
GEN
CY
DEP
RES
SUR
IZAT
ION
WH
EN
RC
IC IS
TH
E O
NLY
INJE
CTI
ON
SYS
TEM
AVA
ILAB
LE A
ND
PR
OVI
DE
LON
G-T
ERM
DC
PO
WER
4
3 3
196K
42
0K
512K
SA
MA
27
Mod
elin
g: T
he S
AM
A is
mod
eled
by
setti
ng th
e fa
ilure
pro
babi
lity
of s
eque
nces
in w
hich
RC
IC is
initi
ally
ope
ratio
nal i
n a
SB
O to
zer
o in
the
cuts
ets.
(a
) SAM
As in
bol
d ar
e po
tent
ially
cos
t ben
efic
ial.
Pot
entia
lly c
ost-b
enef
icia
l SAM
As re
late
to b
oth
LSC
S un
its, U
nit 1
and
Uni
t 2.
(b) R
isk
redu
ctio
n pe
rcen
tage
s di
spla
yed
in th
is ta
ble
wer
e ob
tain
ed fr
om th
e ER
(Exe
lon
2014
a) p
rior t
o Ex
elon
’s re
vise
d re
sults
(Exe
lon
2015
). R
isk
redu
ctio
n pe
rcen
tage
s fo
r the
revi
sed
bene
fit re
sults
wer
e no
t pro
vide
d.
(c) E
xelo
n id
entif
ied
pote
ntia
lly c
ost-b
enef
icia
l SAM
As b
y co
mpa
ring
the
tota
l ben
efit
with
unc
erta
inty
at t
he 9
5th
perc
entil
e to
the
estim
ated
impl
emen
tatio
n co
st.
Tota
l ben
efit
and
cost
val
ues
pres
ente
d in
this
tabl
e w
ere
obta
ined
from
Exe
lon’
s re
vise
d re
sults
(Exe
lon
2015
).
Key:
AC
= a
ltern
atin
g cu
rrent
; AD
S =
auto
mat
ic d
epre
ssur
izat
ion
syst
em; A
TWS
= an
ticip
ated
tran
sien
ts w
ithou
t scr
am; B
OC
= b
reak
out
side
con
tain
men
t; C
DF
= co
re d
amag
e fre
quen
cy; C
SCS
= co
re s
tand
by c
oolin
g sy
stem
; DC
= d
irect
cur
rent
; EC
CS
= em
erge
ncy
core
coo
ling
syst
em; F
PS =
fire
pro
tect
ion
syst
em; I
D =
iden
tific
atio
n; IO
RV
= in
adve
rtent
/stu
ck o
pen
relie
f val
ve; I
SLO
CA
= in
terfa
cing
-sys
tem
s lo
ss-o
f-coo
lant
acc
iden
t; LP
CI =
low
pre
ssur
e co
olan
t in
ject
ion;
LPC
S =
low
pre
ssur
e co
re s
pray
; LO
CA
= lo
ss-o
f-coo
lant
acc
iden
t; LS
CS
= La
Salle
Cou
nty
Stat
ion;
MSI
V =
mai
n st
eam
isol
atio
n va
lve;
O
ECR
= o
ffsite
eco
nom
ic c
ost r
isk;
RC
IC =
reac
tor c
ore
isol
atio
n co
olin
g; R
HR
SW =
resi
dual
hea
t rem
oval
ser
vice
wat
er; R
PV =
reac
tor p
ress
ure
vess
el;
SAM
A =
seve
re a
ccid
ent m
itiga
tion
alte
rnat
ive;
SBO
= s
tatio
n bl
acko
ut; S
BLC
= s
tand
by li
quid
con
trol;
SRV
= sa
fety
relie
f val
ve
Sour
ces:
Exe
lon
2014
a, 2
015

Appendix F
F-39
F.5 Cost Impacts of Candidate Plant Improvements
Exelon estimated the costs of implementing the 25 Phase II SAMAs through the use of other licensees’ estimates for similar improvements and the development of site-specific cost estimates where appropriate. SAMA cost estimates were based on initial hardware, installation, and implementation costs. In response to an NRC staff RAI to provide further information as to what was included in the LSCS cost estimates, Exelon clarified that maintenance and testing costs during the license renewal period were conservatively not included in the estimate (Exelon 2015). The NRC staff reviewed the applicant’s cost estimates presented in Section F.6 of the ER (Exelon 2014a). For certain improvements, the NRC staff also compared the cost estimates to estimates developed elsewhere for similar improvements, including estimates developed as part of other licensees’ analyses of SAMAs for operating reactors. The NRC staff noted that a few SAMAs (e.g., 8, 14, and 27) involve the use of equipment that may be available as a result of the B.5.b program and asked Exelon to discuss this further and the impact on the cost-benefit analysis. Exelon responded that the B.5.b program at LSCS includes a small generator that is used to support two individual SRV solenoids to hold the SRVs open after 125V DC battery depletion, but the generator does not power the station battery chargers and it is not designed to support the RCIC system through direct DC feeds. Because of these limitations, the B.5.b generator is not a viable substitute for the generators that have been proposed for SAMAs 8, 14, and 27; therefore, the availability of the B.5.b generator would not reduce the implementation costs for these SAMAs. With the above clarifications, the NRC staff concludes that the cost estimates provided by Exelon are sufficient and appropriate for use in the SAMA evaluation.
F.6 Cost-Benefit Comparison
Exelon’s cost-benefit analysis and the NRC staff’s review are described in the following sections.
F.6.1 Exelon’s Evaluation
The methodology used by Exelon was based primarily on NRC’s guidance for performing cost-benefit analysis, NUREG/BR–0184 (NRC 1997a) and industry guidance (NEI 2005) endorsed by NRC. As described in Section F.4 of the ER (Exelon 2014a), the modified maximum averted cost risk (MMACR) was determined for each SAMA according to the following formula, which the staff accepts as mathematically equivalent to the formula in the NUREG/BR–0184:
MMACR = EEM (WPHA + WEA + WO + WCD + WRP) where EEM = external event multiplier (unitless) WPHA = present value of averted offsite exposure cost ($) WEA = present value of averted offsite economic cost ($) WO = present value of averted onsite exposure cost ($)

Appendix F
F-40
WCD = present value of averted onsite cleanup cost ($) WRP = present value of averted replacement power cost ($)
Exelon’s derivation of each of the associated costs is presented separately in this section. For each SAMA, the applicant’s analysis determined percentage reductions in population dose risk (PDR%), offsite economic cost risk (OECR%), and onsite cost risk (OCR%). The internal and external benefit from the implementation of an individual SAMA is determined from these percentage reductions and their associated present value costs according to the following formula:
SAMA Benefit = EEM [PDR% WPHA + OECR% WEA + OCR% (WO + WCD + WRP)] For each SAMA, the estimated benefit is compared to the cost of implementation. If the cost of implementing the SAMA is larger than the benefit associated with the SAMA, the SAMA is not considered to be cost beneficial. If the cost of implementing the SAMA is smaller than the benefit associated with the SAMA, the SAMA is considered to be cost beneficial. In the ER, Exelon calculated the net value for individual SAMAs in a similar manner. Positive net values indicated a potentially cost-beneficial SAMA, and negative net values implied that the SAMA was not cost beneficial. In accordance with NUREG/BR–0058 guidance (NRC 2004) that states present worth estimates should be developed using both the 3 percent and 7 percent discount rates, Exelon conducted a baseline analysis using the 3 percent discount rate and a sensitivity analysis using the 7 percent discount rate (Exelon 2014a). Additional sensitivity analyses were performed by the applicant to quantify influences on the calculated benefits from the 95th percentile PRA results, offsite consequence modeling parameter changes, and assumed implementation of a hardened pipe containment vent. Additional details on the sensitivity analysis are presented in Section F.6.2. Averted Offsite Exposure Cost (WPHA) Exelon defined WPHA cost as the monetary value of accident risk avoided from population doses after discounting (Exelon 2014a). The WPHA costs were calculated using the following formula:
WPHA = Averted public dose risk (person-rem per year) × monetary equivalent of unit dose ($2,000 per person-rem) × present value conversion factor (NRC 1997a)
As stated in NUREG/BR–0184 (NRC 1997a), it is important to note that the monetary value of the public health risk after discounting does not represent the expected reduction in public health risk because of a single accident. Rather, it is the present value of a stream of potential losses extending over the remaining lifetime (in this case, the 20-year renewal period) of the facility. Thus, it reflects the expected annual loss caused by a single accident, the possibility that such an accident could occur at any time over the renewal period, and the effect of discounting these potential future losses to present value. For a discount rate of 3 percent, Exelon calculated the WPHA cost of $213,863 due to internal events in the ER (Exelon 2014a). Averted Offsite Economic Cost (WEA) Exelon defined WEA as the monetary value of risk avoided from offsite property damage after discounting (Exelon 2014a). The WEA values were calculated using the following formula:
WEA = Annual offsite property damage risk before discounting in dollars per year × present value conversion factor (NRC 1997a)
For a discount rate of 3 percent, Exelon calculated the WEA cost of $802,484 due to internal events in the ER (Exelon 2014a).

Appendix F
F-41
Averted Onsite Exposure Cost (WO) Exelon defined WO as the avoided onsite exposure (Exelon 2014a). Similar to the WPHA calculations, the applicant calculated costs for immediate onsite exposure. Long-term onsite exposure costs were calculated consistent with guidance in the Regulatory Analysis Technical Evaluation Handbook (NRC 1997a), which included an additional term for accrual of long-term doses. Exelon derived the values for averted occupational exposure from information provided in Section 5.7.3 of the Regulatory Analysis Technical Evaluation Handbook (NRC 1997a). Best estimate values providing for an immediate occupational dose (3,300 person-rem) and long-term occupational dose (20,000 person-rem over a 10-year cleanup period) were used. The present value of these doses was calculated using the equations provided in the handbook in conjunction with a monetary equivalent of unit dose of $2,000 per person-rem, a real discount rate of 7 percent, and a time period of 20 years to represent the license renewal period. Immediate and long-term onsite exposure costs were summed to determine the WO cost. For a discount rate of 3 percent, Exelon calculated the WO cost of $1,597 due to internal events in the ER (Exelon 2014a). Averted Onsite Cleanup Cost (WCD) Exelon defined WCD as the avoided cost for cleanup and decontamination of the site (Exelon 2014a). The applicant derived the values for WCD based on information provided in Section 5.7.6 of NUREG/BR–0184, the Regulatory Analysis Technical Evaluation Handbook (NRC 1997a). Averted cleanup and decontamination costs were calculated using the following formula:
WCD = Annual CDF × present value of cleanup costs per core damage event × present value conversion factor.
The total cost of cleanup and decontamination subsequent to a severe accident is estimated in the Regulatory Analysis Technical Evaluation Handbook to be $1.5×10⁹ (undiscounted). This value was converted to present costs over a 10-year cleanup period and integrated over the term of the proposed license extension. For a discount rate of 3 percent, Exelon calculated the WCD cost of $50,284 due to internal events in the ER (Exelon 2014a). Averted Replacement Power Cost (WRP) Exelon defined WRP as the avoided costs of replacement power (Exelon 2014a). Long-term replacement costs were calculated using the following formula: WRP = Annual CDF × present value of replacement power for a single event × factor for remaining service years for which replacement power is required × reactor power scaling factor Exelon based its calculations on the net electric output for LSCS, specifically 1,210 megawatt-electric (MWe), and scaled up from reference plant value of 910 MWe specified in NUREG/BR–0184 (NRC 1997a). For a discount rate of 3 percent, Exelon calculated WRP costs of $18,955 due to internal events in the ER (Exelon 2014a). Modified Maximum Averted Cost Risk (MMACR) Using the above equations and an annual CDF of 2.58×10‒6, Exelon estimated the total present dollar value equivalent associated with completely eliminating severe accidents caused by internal events, referred to as the MACR, to be about $1,087,183 at a single unit for a discount rate of 3 percent in the ER (Exelon 2014a). In Exelon’s revised analysis, the MACR increased to approximately $1,168,000. To account for the risk contributions from external events and

Appendix F
F-42
yield the internal and external benefit, Exelon selected an external event multiplier (EEM) value of 5.2 for LSCS, as described in Section F.4.6.2 of the ER (Exelon 2014a). By multiplying MACR and EEM, Exelon estimated MMACR to be about $5,657,600 for a single unit with a discount rate of 3 percent, as presented in Section F.4.6.3 of the ER (Exelon 2014a). In Exelon’s revised analysis, the MMACR increased to $6,073,600 (Exelon 2015). As described above in the SAMA benefit formula, components of the MMACR calculation factor into the benefit determination for individual SAMAs. When Exelon revised its analysis in response to RAIs from the NRC staff, updates were not presented for the individual components of MACR (WPHA, WEA, WO, WCD, WRP). Exelon’s Results
If the implementation costs for a SAMA candidate exceeded the calculated benefit, the SAMA was determined to be not cost beneficial. If the SAMA benefit exceeded the estimated cost, the SAMA candidate was considered to be potentially cost beneficial. Results of the cost-benefit evaluation are presented in Table F–5. Exelon’s cost-benefit analysis identified 14 SAMA candidates determined to be potentially cost beneficial at the 95th percentile on an individual basis:
• SAMA 2: Automate suppression pool cooling.
• SAMA 3: Passive vent path.
• SAMA 4: Install a keylock main steam isolation valve (MSIV) low-level isolation bypass switch.
• SAMA 5: Automate standby liquid control (SBLC) initiation.
• SAMA 8: Obtain a 480 V AC portable generator to supply the 125 V DC battery chargers and proceduralize its use.
• SAMA 9: Develop flood zone specific procedures.
• SAMA 10: Change the logic to close the turbine driven feedwater pump discharge valves when the pumps are not running.
• SAMA 14: Provide a portable DC source to support RCIC and SRV operation.
• SAMA 15: Tie RHRSW to the low-pressure core spray (LPCS) system for interfacing systems loss-of-coolant accident (ISLOCA) mitigation.
• SAMA 16: Provide portable fans for alternate room cooling in the CSCS vaults.
• SAMA 18: Improve the connection between the fire protection and feedwater systems.
• SAMA 19: Provide remote alignment capability of RHRSW to the LPCS system for LOCA mitigation.
• SAMA 21: Install Automatic ATWS level control system.
• SAMA 23: Enhance fuel pool emergency makeup pump and connection. When the planned installation of a hardened pipe containment vent is considered as the base case, the number of SAMA candidates considered to be potentially cost beneficial at the 95th percentile may decrease. Because a new baseline is established following the implementation of a SAMA, which further influences the benefits provided by the remaining

Appendix F
F-43
SAMA candidates, Exelon defined an optimal set to containing SAMAs that, if implemented, would render the remaining SAMAs to be not cost beneficial. Acknowledging Exelon’s planned installation of the hardened pipe containment vent (SAMA 1), additional modifications included in the optimal set are SAMAs 2, 4, 9, and 15, as presented in the ER (Exelon 2014a). Assessment of the optimal set was performed prior to Exelon generating revised results in response to the NRC staff’s RAIs (Exelon 2015). Exelon is referring the 14 potentially cost-beneficial SAMAs from its revised analysis (Exelon 2015) to the LSCS Plant Health Committee for further implementation considerations within the established plant procedural process, as indicated in Section 4.15 of the ER (Exelon 2014d).
F.6.2 Review of Exelon’s Cost-Benefit Evaluation
During its review of the cost-benefit analysis performed by Exelon, the NRC staff compared the applicant’s approach with guidance in NUREG/BR–0184 (NRC 1997a) and discount rate guidelines in NEI 05-01 (NEI 2005). NEI guidance states that two sets of estimates should be developed for discount rates of 7 percent and 3 percent (NEI 2005). Exelon performed assessments using both discount rates. Exelon provided a baseline set of results using a discount rate of 3 percent. For the other types of potential sensitivity analyses suggested (NEI 2005), the NRC staff finds that Exelon’s information provided in the ER submittal and subsequent RAI responses on plant modifications, peer review findings or observations, and evacuation speeds have been adequately addressed in the baseline analysis, as discussed in this appendix. As previously indicated, Exelon performed the cost-benefit evaluation using an analysis time period of 20 years. Because Exelon explicitly accounted for uncertainty in its sensitivity analysis by applying a multiplication factor of 2.14 and the results of the sensitivity analysis were used to identify additional potentially beneficial SAMAs, the NRC staff finds that an additional sensitivity analysis for a timeframe longer than 20 years is not necessary. Although longer timeframes would increase estimated benefits compared to baseline results, the 20-year timeframe is consistent with the later expiration month of December 2043 for a renewed license of Unit 2 stated in Section 1.1 of the ER (Exelon 2014a), and it is unlikely that influences from a longer timeframe would exceed the factor of 2.14 already considered by Exelon. Based on its review of the applicant’s cost-benefit evaluation, the NRC staff determined that the applicant’s approach is consistent with the guidance and acceptable. The applicant considered possible increases in benefits from analysis uncertainties on the results of the SAMA assessment. In the ER (Exelon 2014a), Exelon indicated that the 95th percentile value of the LSCS CDF was greater than the mean CDF by a factor of 2.14, and thus, a multiplication factor of 2.14 was selected to account for uncertainty. This multiplication factor was applied in addition to the separate external events multiplication factor of 5.2 (Exelon 2014a). Exelon’s assessment accounted for the potential risk-reduction benefits associated with both internal and external events. The NRC staff considers the multipliers of 2.14 for uncertainty and 5.2 for external events at LSCS to provide an adequate margin and are, therefore, acceptable for the SAMA analysis. Using Exelon’s information presented in the ER (Exelon 2014a), the NRC staff spot checked the applicant’s calculations of delta CDF (i.e., percentage reduction in CDF due to accumulated differences in the release categories for a specific SAMA candidate compared to the base case), population dose risk, and offsite economic cost risk. By applying the formula for SAMA benefit presented in Section F.6.1 and comparing the results with those presented in the ER (Exelon 2014a), the NRC staff found the results to be in agreement and within small round-off errors.

Appendix F
F-44
Exelon’s revised cost-benefit analysis identified 14 SAMA candidates as potentially cost beneficial at the 95th percentile (Exelon 2015). From its sensitivity analyses in the ER, no additional SAMA candidates were determined to be potentially cost beneficial. As described in Section F.3.2, the NRC staff asked the applicant to evaluate potentially lower cost alternatives to SAMA 7. From its review of the original SAMA analysis and additional information, the NRC staff agrees with Exelon’s disposition of potentially lower cost alternatives. Because Exelon’s cost-benefit evaluations have been reviewed by the NRC staff and Exelon satisfactorily addressed NRC staff questions regarding the evaluations, the NRC staff concludes that the cost-benefit evaluations are of sufficient quality to support the SAMA evaluation. Therefore, the NRC staff concludes that, with the exception of the potentially cost-beneficial SAMAs discussed above, the costs of the other SAMAs evaluated would be higher than their associated benefits and not cost beneficial.
F.7 Conclusions
Exelon considered 26 SAMA candidates based on risk-significant contributors at LSCS from updated probabilistic safety assessment models, SAMA-related industry documentation, plant-specific enhancements, and its review of SAMA candidates from potential improvements primarily at six other BWR plants. Revised Phase I screening reduced the list to 25 unique SAMA candidates by eliminating SAMAs that are not applicable to LSCS, that have already been implemented at LSCS, or that have excessive implementation costs. Exelon assessed the costs and benefits associated with each of the 25 potential SAMAs shown in Table F–5. Exelon concluded that 14 SAMA candidates were potentially cost beneficial at the 95th percentile. Despite it being not cost beneficial, Exelon has decided to proceed with the modification to install a hardened pipe containment vent regardless of cost. Exelon also performed a sensitivity analysis, and no additional SAMA candidates were identified as potentially cost beneficial. Because the potentially cost-beneficial SAMAs do not relate to aging management during the period of extended operation, their implementation is not required as part of license renewal pursuant to Title 10 of the Code of Federal Regulations (10 CFR) Part 54, “Requirements for Renewal of Operating Licenses for Nuclear Power Plants.” Nevertheless, as stated in Section 4.15 of the ER (Exelon 2014d), Exelon indicated that the potentially cost-beneficial SAMAs are being referred to the LSCS Plant Health Committee for further implementation considerations within the established plant procedural process. The NRC staff reviewed Exelon’s SAMA analysis and concludes that the methods used and the implementation of the methods were sound. On the basis of the applicant’s treatment of SAMA benefits and costs, the NRC staff finds that the SAMA evaluations performed by Exelon are reasonable and sufficient for the license renewal submittal. The NRC staff concurs with Exelon’s conclusion that 14 SAMA candidates are potentially cost beneficial for LSCS and notes that Exelon’s assessment was based on generally conservative treatment of costs, benefits, and uncertainties. Based on the NRC staff’s review of Exelon’s SAMA evaluations, including Exelon’s response to the NRC staff’s RAIs, the NRC staff concludes that Exelon has adequately identified areas where risk can be further reduced in a cost-beneficial manner through the implementation of the identified potentially cost-beneficial SAMAs. Given the potential for cost-beneficial risk reduction, the NRC staff concludes that further evaluation by Exelon of the 14 SAMA candidates identified by Exelon as being potentially cost beneficial is warranted. The NRC staff also evaluated whether any of the potentially cost-beneficial SAMAs identified are subject to aging management such that they would be within the scope of license renewal. The evaluation considered any structures, systems, and components associated with these SAMAs that perform intended functions without moving parts or without a change in

Appendix F
F-45
configuration or properties and would not be subject to replacement based on a qualified life or specified time period. The NRC staff determined that the potentially cost-beneficial SAMAs do not relate to adequately managing the effects of aging during the period of extended operation. Therefore, they need not be implemented as part of license renewal in accordance with 10 CFR Part 54.
F.8 References
10 CFR Part 54. Code of Federal Regulations, Title 10, Energy, Part 54, “Requirements for Renewal of Operating Licenses for Nuclear Power Plants.” [ASME/ANS] (American Society of Mechanical Engineers/American Nuclear Society). 2005. Addenda RA-Sa-2003 and RA-Sb-2005 to ASME RA-S-2002, Standard for Probabilistic Risk Assessment for Nuclear Power Plant Applications. December 2005. [ASME/ANS] American Society of Mechanical Engineers and American Nuclear Society. 2009. Addenda to ASME/ANS RA-S–2008, Standard for Level 1/Large Early Release Frequency Probabilistic Risk Assessment for Nuclear Power Plant Applications. New York, NY: ASME. ASME/ANS RA-Sa-2009. February 2, 2009. 352 p. This document is proprietary and available for sale on www.asme.org. [CECO] Commonwealth Edison Company. 1994. LaSalle County Nuclear Power Station, Individual Plant Examination and Individual Plant Examination (External Events). April 1994. [Exelon] Exelon Generating Company, LLC. 2012a. “Seismic Walkdown Report In Response To The 50.54(f) Information Request Regarding Fukushima Near-Term Task Force Recommendation 2.3: Seismic for the LaSalle County Station, Unit 1, Report Number: 12Q0108.50-R-001, Revision 1. November 27, 2012. ADAMS No. ML12353A225. [Exelon] Exelon Generating Company, LLC. 2012b. “Seismic Walkdown Report In Response To The 50.54(f) Information Request Regarding Fukushima Near-Term Task Force Recommendation 2.3: Seismic for the LaSalle County Station, Unit 2, Report Number: 12Q0108.50-R-002, Revision 1. November 27, 2012. ADAMS No. ML12353A207. [Exelon] Exelon Generation Company, LLC. 2014a. “Applicant’s Environmental Report, Operating License Renewal Stage, LaSalle County Station. Appendix F: Severe Accident Mitigation Alternatives Analysis.” ADAMS No. ML14343A897. December 2014. [Exelon] Exelon Generation Company, LLC. 2014b. Letter from Glen T. Kaegi to NRC Document Control Desk. Subject: Exelon Generation Company, LLC, Seismic Hazard and Screening Report (Central and Eastern United States (CEUS) Sites), Response to NRC Request for Information Pursuant to 10 CFR 50.54(f) Regarding Recommendation 2.1 of the Near-Term Task Force Review of Insights from the Fukushima Dai-ichi Accident. Exelon letter RS-14-068. March 31, 2014. ADAMS No. ML14091A013. [Exelon] Exelon Generation Company, LLC. 2014c. Letter from T. John Conner to NRC Document Control Desk. Subject: Exelon Generation Company, LLC Response to March 12, 2012, Request for Information Enclosure 2, Recommendation 2.1, Flooding, Required Response 2, Flood Hazard Reevaluation Report. Exelon letter RS-14-055. March 12, 2014. ADAMS Nos. ML14079A425 and ML14079A426. [Exelon] Exelon Generation Company, LLC. 2014d. “Applicant’s Environmental Report, Operating License Renewal Stage, LaSalle County Station.” ADAMS No. ML14343A883. December 2014.

Appendix F
F-46
[Exelon] Exelon Generation Company, LLC. 2015. Letter from M.P. Gallagher, Vice President, License Renewal Projects Exelon Generation Company, LLC, to NRC Document Control Desk. Subject: Response to NRC Request for Additional Information on Severe Accident Mitigation Alternatives Regarding the LaSalle County Station, Units 1 and 2 License Renewal Application Environmental Review. Letter RA15-032. May 29, 2015. ADAMS No. ML15149A370. [NEI] Nuclear Energy Institute. 2005. Severe Accident Mitigation Alternative (SAMA) Analysis Guidance Document. Revision A. Washington, DC: NEI. NEI 05-01. November 2005. 79 p. ADAMS No. ML060530203. [NRC] U.S. Nuclear Regulatory Commission. 1988. “Individual Plant Examination for Severe Accident Vulnerabilities—10 CFR 50.54(f).” Washington, DC: NRC. Generic Letter No. 88-20. November 23, 1988. Available at <http://www.nrc.gov/reading-rm/doc-collections/gen-comm/gen-letters/1988/gl88020.html> (accessed 21 October 2014). [NRC] U.S. Nuclear Regulatory Commission. 1991. “Individual Plant Examination of External Events for Severe Accident Vulnerabilities.” Washington, DC: NRC. Generic Letter No. 88-20, Supplement 4. June 28, 1991. [NRC] U.S. Nuclear Regulatory Commission. 1992. Analysis of the LaSalle Unit 2 Nuclear Power Plant: Risk Methods Integration and Evaluation Program (RMIEP). Washington, DC: NRC. NUREG/CR–4832, Vols. 1‒9, 1992‒1993. [NRC] U.S. Nuclear Regulatory Commission. 1995. Memorandum from M. Wayne Hodges, NRC, to Steven A Varga, NRC. Subject: Review of LaSalle Individual Plant Examination (IPE) Submittal-Internal Events. November 1, 1995. [NRC] U.S. Nuclear Regulatory Commission. 1997a. Regulatory Analysis Technical Evaluation Handbook. Washington, DC: NRC. NUREG/BR–0184. January 1997. 308 p. ADAMS No. ML050190193. [NRC] U.S. Nuclear Regulatory Commission. 1997b. Individual Plant Examination Program: Perspectives on Reactor Safety and Plant Performance,” NUREG–1560, Washington, D.C. 1997. [NRC] U.S. Nuclear Regulatory Commission. 2000. Letter from Donna M. Skay to Oliver D. Kingsley, Commonwealth Edison Company. Subject: LaSalle County Station, Units 1 and 2, NRC Staff Evaluation of the Individual Plant Examination of External Events (IPEEE) Submittal. (TAC Nos. M83634 and M83635). December 8, 2000. ADAMS No. ML003776159. [NRC] U.S. Nuclear Regulatory Commission. 2004. Regulatory Analysis Guidelines of the U.S. Nuclear Regulatory Commission. Revision 4. Washington, DC: NRC. NUREG/BR–0058. September 2004. 56 p. Available at<http://www.nrc.gov/reading-rm/doc-collections/nuregs/brochures/br0058/> (accessed 21 October 2014). [NRC] U.S. Nuclear Regulatory Commission. 2005. EPRI/NRC-RES Fire PRA Methodology for Nuclear Power Facilities. Vols. 1 and 2. Washington, DC: NRC. NUREG/CR–6850. September 2005. ADAMS Nos. ML052580075 and ML052580118. [NRC] U.S. Nuclear Regulatory Commission. 2007. An Approach for Determining the Technical Adequacy of Probabilistic Risk Assessment Results for Risk-Informed Activities. Revision 1. Regulatory Guide 1.200. January 2007. ADAMS No. ML070240001. [NRC] U.S. Nuclear Regulatory Commission. 2010. Letter from T. McGinty, Director, to All Holders of an Operating License. Subject: NRC Information Notice 2010-18: Generic Issue 199, “Implications of Updated Probabilistic Seismic Hazard Estimates in Central and Eastern United States on Existing Plants.” September 2, 2010. ADAMS No. ML101970221.

Appendix F
F-47
[NRC] U.S. Nuclear Regulatory Commission. 2011. An Approach for Using Probabilistic Risk Assessment in Risk-Informed Decisions on Plant-Specific Changes to the Licensing Basis. Revision 2. Regulatory Guide 1.174. May 2011. ADAMS No. ML100910006. [NRC] U.S. Nuclear Regulatory Commission. 2012a. Letter from E. Leeds, Director, to All Power Reactor Licensees. Subject: Request for information pursuant to Title 10 of the Code of Federal Regulations 50.54(f) regarding Recommendations 2.1, 2.3, and 9.3, of the Near-Term Task Force review of insights from the Fukushima Dai-ichi accident. March 12, 2012. ADAMS No. ML12053A340. [NRC] U.S. Nuclear Regulatory Commission. 2012b. Letter from E. Leeds, Director, to All Power Reactor Licensees and Holders of Construction Permits in Active or Deferred Status. EA-12-049. Subject: Issuance of Order to Modify Licenses with Regard to Requirements for Mitigation Strategies for Beyond-Design-Basis External Events. March 12, 2012. ADAMS No. ML12054A735. [NRC] U.S. Nuclear Regulatory Commission. 2014. Letter from Blake Purnell, Project Manager, NRC, to Michael J. Pacilio, Senior Vice President, Exelon Generation Company. Subject: LaSalle County Station, Units 1 and 2 - Staff Assessment of the Flooding Walkdown Report Supporting Implementation of the Near-Term Task Force Recommendation 2.3 Related to the Fukushima Dai-ichi Accident. (TAC Nos. MF0240 and MF0241). June 30, 2014. ADAMS No. ML14177A859. [NRC] U.S. Nuclear Regulatory Commission. 2015. Letter from D. Drucker, Environmental Project Manager, to M.P. Gallagher, Vice President License Renewal Projects, Exelon Generation Company, LLC. Subject: Request for Additional Information on Severe Accident Mitigation Alternatives Regarding the LaSalle County Station, Units 1 and 2, License Renewal Application Environmental Review (TAC Nos. MF5567 and MF5568). April 30, 2015. ADAMS Nos. ML15114A320 and ML15114A102.


TRANSPORTATION IMPACTS OF HIGH BURNUP FUEL

G-1
G. Transportation Impacts of LSCS High Burnup Fuel
G.1 Introduction
The U.S. Nuclear Regulatory Commission (NRC) has generically determined in its license renewal application reviews that the environmental impacts of the transportation of fuel and radioactive wastes to and from nuclear power facilities are small for all reactors as long as certain specific conditions are met. The application for license renewal of LaSalle County Station, Units 1 and 2 (LSCS) stated that the specific conditions that allow the transportation impacts of spent fuel to be generically determined to be small may not be met for LSCS. Therefore, this appendix provides the NRC staff’s analysis of the environmental impacts of transporting spent fuel from LSCS.
G.2 Background
The U.S. Nuclear Regulatory Commission (NRC) performed a generic analysis of the environmental effects of the transportation of fuel and waste to and from light-water reactors (LWRs) in WASH–1238, “Environmental Survey of Transportation of Radioactive Materials to and from Nuclear Power Plants” (AEC 1972), and in a supplement to WASH–1238, NUREG–75/038 (NRC 1975), and found the impact to be small. These documents provided the basis for Table S–4 in Title 10 of the Code of Federal Regulations (CFR) Part 51.52(b) that summarizes the environmental impacts of transportation of fuel and waste to and from one 3,000- to 5,000-megawatt-thermal (MWt) (1,000- to 1,500-megawatt-electric (MWe)) LWR. Impacts are provided for normal conditions of transport and accidents in transport for a reference 1,100-MWe LWR.12 Dose to transportation workers during normal transportation operations was estimated to result in a collective dose of 4 person-rem per reference reactor-year. The combined dose to the public along the route and the dose to onlookers were estimated to result in a collective dose of 3 person-rem per reference reactor-year. Environmental risks of radiological effects during accident conditions, as stated in Table S–4, are small. Nonradiological impacts from postulated accidents were estimated as one fatal injury in 100 reference reactor-years and one nonfatal injury in 10 reference reactor-years. Subsequent reviews of transportation impacts in NUREG–0170, Final Environmental Statement on the Transportation of Radioactive Material by Air and Other Modes (NRC 1977), and NUREG/CR–6672, Reexamination of Spent Fuel Shipment Risk Estimates (Sprung et al. 2000), concludes that impacts were bounded by Table S–4 in 10 CFR 51.52. In accordance with 10 CFR 51.52(a), a full description and a detailed analysis of transportation impacts are not required in the initial licensing of an LWR (i.e., impacts are assumed to be bounded by Table S–4) if the reactor meets the following criteria:
• The reactor has a core thermal power level that does not exceed 3,800 MWt.
• Fuel is in the form of sintered uranium oxide pellets having a uranium-235 enrichment not exceeding 4 percent by weight, and the pellets are encapsulated in Zircaloy-clad fuel rods.
12 The transportation impacts associated with LSCS were normalized for a reference 1,100-MWe LWR at
an 80-percent capacity factor for comparisons to Table S–4.

Transportation Impacts of High Burnup Fuel
G-2
• The average level of irradiation of the fuel from the reactor does not exceed 33,000 megawatt-days per metric ton of uranium (MWd/MTU), and no irradiated fuel assembly is shipped until at least 90 days after it is discharged from the reactor.
• With the exception of irradiated fuel, all radioactive waste shipped from the reactor is packaged and in a solid form.
• Unirradiated fuel is shipped to the reactor by truck; irradiated fuel is shipped from the reactor by truck, rail, or barge; and radioactive waste other than irradiated fuel is shipped from the reactor by truck or rail.
The environmental impacts of the transportation of fuel and radioactive wastes to and from nuclear power facilities are resolved generically in 10 CFR 51.52 as long as the specific conditions in the rule (see above) are met. 10 CFR 51.52 does not specifically address license renewal. However, NUREG–1437, Generic Environmental Impact Statement for License Renewal of Nuclear Power Plants (GEIS) (NRC 2013), points out that nuclear fuel is needed for the operation of light water reactors during the license renewal term in the same way that it is needed during the current license period. Therefore, the factors that affect the data presented in Table S–4 of 10 CFR 51.52 do not change when a light water reactor is operating under a renewed license. The GEIS further states that the NRC reevaluated the transportation issues and the adequacy of Table S–4 for license renewal application reviews (NRC 2013). In 1999, the NRC issued an addendum to the GEIS (NRC 1999) in which the agency evaluated the applicability of Table S–4 to future license renewal proceedings, particularly because shipments of spent fuel were likely to involve more highly enriched fresh fuel (more than 4 percent as assumed in Table S–4) and higher-burnup spent fuel (higher than 33,000 MWd/MTU as assumed in Table S–4). On the basis of the evaluations, the NRC concluded that the values given in Table S–4 would still be bounding, as long as the (1) enrichment of the fresh fuel was 5 percent or less, (2) burnup of the spent fuel was 62,000 MWd/MTU or less, and (3) higher-burnup spent fuel (higher than 33,000 MWd/MTU) was cooled for at least 5 years before being shipped offsite. The GEIS (NRC 2013) quotes the conclusion of the 1999 addendum as follows:
The impacts of transporting spent fuel enriched up to 5 percent uranium-235 with average burnup for the peak rod to current levels approved by NRC up to 62,000 MWd/MTU and the cumulative impacts of transporting high-level waste to a single repository, such as Yucca Mountain, Nevada are found to be consistent with the impact values contained in 10 CFR 51.52(c), Summary Table S–4, “Environmental Impact of Transportation of Fuel and Waste to and from One Light-Water-Cooled Nuclear Power Reactor.” If fuel enrichment or burnup conditions are not met, the applicant must submit an assessment of the implications for the environmental impact values reported in 10 CFR 51.52.
Therefore, when the fuel burnup rate may exceed 62,000 MWd/MTU during the period of extended operation, further analysis of transportation impacts is warranted. Exelon Generation Company, LLC (Exelon), submitted an environmental report (ER) (Exelon 2014a) as part of its license renewal application (Exelon 2014b) for LSCS in December 2014. LSCS is located in north-eastern Illinois. Each LSCS reactor is a General Electric boiling water reactor (BWR), Type 5, with a thermal power rating of 3,546 MWt. The two reactors at LSCS have a combined electrical output of 2,327 MWe. Both LSCS units operate using low-enriched uranium dioxide fuel with enrichment not exceeding a nominal 5.0 percent by weight of uranium-235; these units have been historically operated within a maximum analyzed fuel burnup rate of 62,000 MWd/MTU. However, during some future fuel

Transportation Impacts of High Burnup Fuel
G-3
cycles, the peak fuel burnup is projected to exceed 62,000 MWd/MTU in some part-length fuel rods. The part-length fuel rods are attached to the fuel bundle lower tie plate and typically experience higher burnups and higher power than full-length rods due to the bottom-peaked axial power shapes that exist throughout a large portion of a BWR fuel cycle, and a representative high-burnup case was identified based on a burnup of 75,000 MWd/MTU and a uranium-235 enrichment of 5.0 percent by weight. Accordingly, Exelon provided a full description and detailed analyses of the transportation impacts of shipping irradiated fuel from LSCS in its ER (Exelon 2014a) and provided updates to that analysis by letters dated July 24, 2015 (Exelon 2015a), and August 28, 2015 (Exelon 2015b). In these analyses, the radiological impacts of transporting irradiated fuel from LSCS were calculated using the RADTRAN 6.02 computer code (Weiner et al. 2015). RADTRAN 6.02 was also used in this SEIS and is the most commonly used transportation impact analysis software in the nuclear industry.
G.3 NRC Analysis of LSCS High Burnup Fuel Transportation Impacts
This section provides the NRC staff’s analysis of the environmental impacts of transporting spent fuel from LSCS to a monitored retrievable storage facility or a permanent repository for normal operating conditions and transportation accidents. For the purposes of this analysis, the NRC staff considered the proposed Yucca Mountain repository site in Nevada as a surrogate destination. Currently, the NRC has not made a decision about the U.S. Department of Energy (DOE) application for the proposed geologic repository at Yucca Mountain. However, the NRC staff considers that an estimate of the impacts of the transportation of spent fuel to a possible repository in Nevada is a reasonable bounding estimate of the transportation impacts on a storage or disposal facility because of the distances involved and the representativeness of the distribution of members of the public in urban, suburban, and rural areas (i.e., population distributions) along the shipping routes. The NRC Yucca Mountain adjudicatory proceeding is currently suspended, and Yucca Mountain-related matters are pending in Federal Court. Regardless of the outcome of these proceedings, the NRC staff concludes that transportation impacts are roughly proportional to the distance from the reactor site to the repository site, in this case, Illinois to Nevada. This NRC staff’s analysis is based on shipment of spent fuel by legal-weight trucks in shipping casks with characteristics similar to currently available casks (i.e., massive, heavily shielded, cylindrical metal pressure vessels). Because of the large size and weight of spent fuel shipping casks, each shipment is assumed to consist of a single shipping cask loaded on a modified trailer. These assumptions are consistent with those made in the evaluation of the environmental impacts of transportation of spent fuel in Addendum 1 to NUREG–1437 (NRC 1999). Because the alternative transportation methods involve rail transportation or heavy-haul trucks, which would reduce the overall number of spent fuel shipments (NRC 1999), thereby reducing impacts, these assumptions are conservative. In addition, the use of current shipping cask designs for this analysis results in conservative impact estimates because the current designs are based on transporting short-cooled spent fuel (approximately 120 days out of reactor). Future shipping casks would be designed to transport longer cooled fuel (greater than 5 years out of reactor) and would require much less shielding to meet external dose limitations. Therefore, future shipping casks are expected to have higher cargo capacities, thus reducing the numbers of shipments and associated impacts. The NRC staff calculated radiological impacts of transportation of spent fuel using the RADTRAN 6.02 computer code (Weiner et al. 2015). Routing and population data used in RADTRAN 6.02 for truck shipments were obtained from the Transportation Routing Analysis
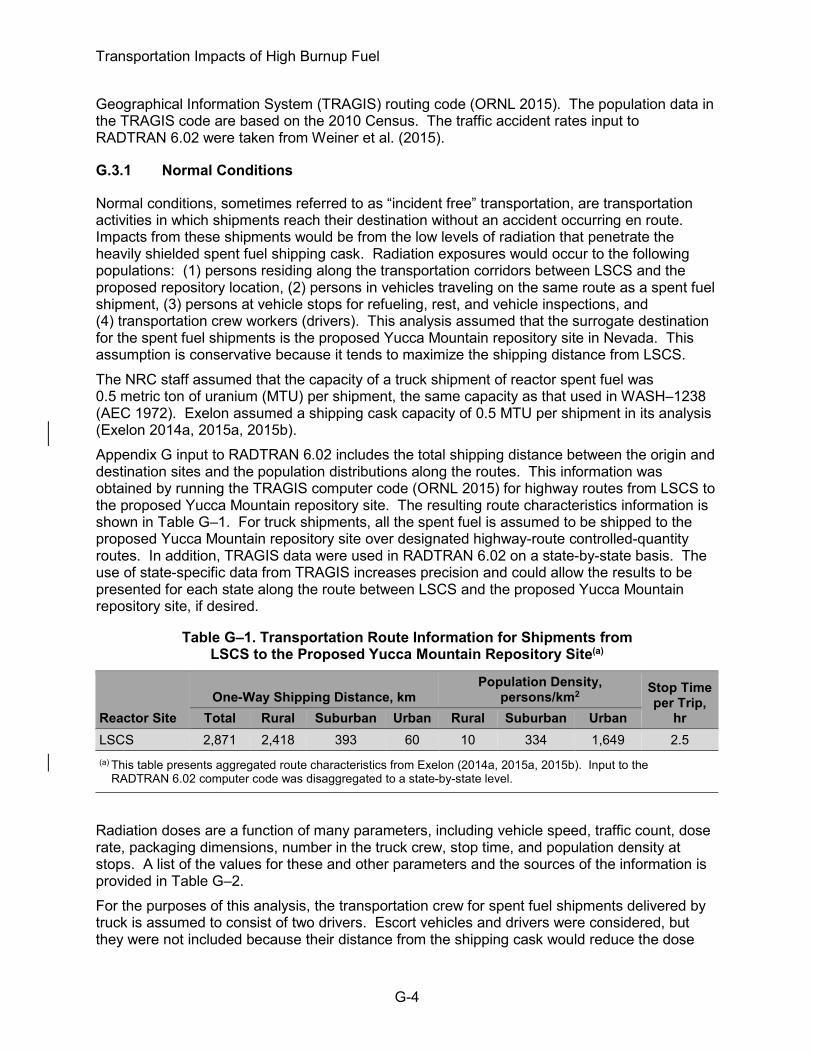
Transportation Impacts of High Burnup Fuel
G-4
Geographical Information System (TRAGIS) routing code (ORNL 2015). The population data in the TRAGIS code are based on the 2010 Census. The traffic accident rates input to RADTRAN 6.02 were taken from Weiner et al. (2015).
G.3.1 Normal Conditions
Normal conditions, sometimes referred to as “incident free” transportation, are transportation activities in which shipments reach their destination without an accident occurring en route. Impacts from these shipments would be from the low levels of radiation that penetrate the heavily shielded spent fuel shipping cask. Radiation exposures would occur to the following populations: (1) persons residing along the transportation corridors between LSCS and the proposed repository location, (2) persons in vehicles traveling on the same route as a spent fuel shipment, (3) persons at vehicle stops for refueling, rest, and vehicle inspections, and (4) transportation crew workers (drivers). This analysis assumed that the surrogate destination for the spent fuel shipments is the proposed Yucca Mountain repository site in Nevada. This assumption is conservative because it tends to maximize the shipping distance from LSCS. The NRC staff assumed that the capacity of a truck shipment of reactor spent fuel was 0.5 metric ton of uranium (MTU) per shipment, the same capacity as that used in WASH–1238 (AEC 1972). Exelon assumed a shipping cask capacity of 0.5 MTU per shipment in its analysis (Exelon 2014a, 2015a, 2015b). Appendix G input to RADTRAN 6.02 includes the total shipping distance between the origin and destination sites and the population distributions along the routes. This information was obtained by running the TRAGIS computer code (ORNL 2015) for highway routes from LSCS to the proposed Yucca Mountain repository site. The resulting route characteristics information is shown in Table G–1. For truck shipments, all the spent fuel is assumed to be shipped to the proposed Yucca Mountain repository site over designated highway-route controlled-quantity routes. In addition, TRAGIS data were used in RADTRAN 6.02 on a state-by-state basis. The use of state-specific data from TRAGIS increases precision and could allow the results to be presented for each state along the route between LSCS and the proposed Yucca Mountain repository site, if desired.
Table G–1. Transportation Route Information for Shipments from LSCS to the Proposed Yucca Mountain Repository Site(a)
Reactor Site One-Way Shipping Distance, km
Population Density, persons/km2
Stop Time per Trip,
hr Total Rural Suburban Urban Rural Suburban Urban LSCS 2,871 2,418 393 60 10 334 1,649 2.5 (a) This table presents aggregated route characteristics from Exelon (2014a, 2015a, 2015b). Input to the
RADTRAN 6.02 computer code was disaggregated to a state-by-state level.
Radiation doses are a function of many parameters, including vehicle speed, traffic count, dose rate, packaging dimensions, number in the truck crew, stop time, and population density at stops. A list of the values for these and other parameters and the sources of the information is provided in Table G–2. For the purposes of this analysis, the transportation crew for spent fuel shipments delivered by truck is assumed to consist of two drivers. Escort vehicles and drivers were considered, but they were not included because their distance from the shipping cask would reduce the dose
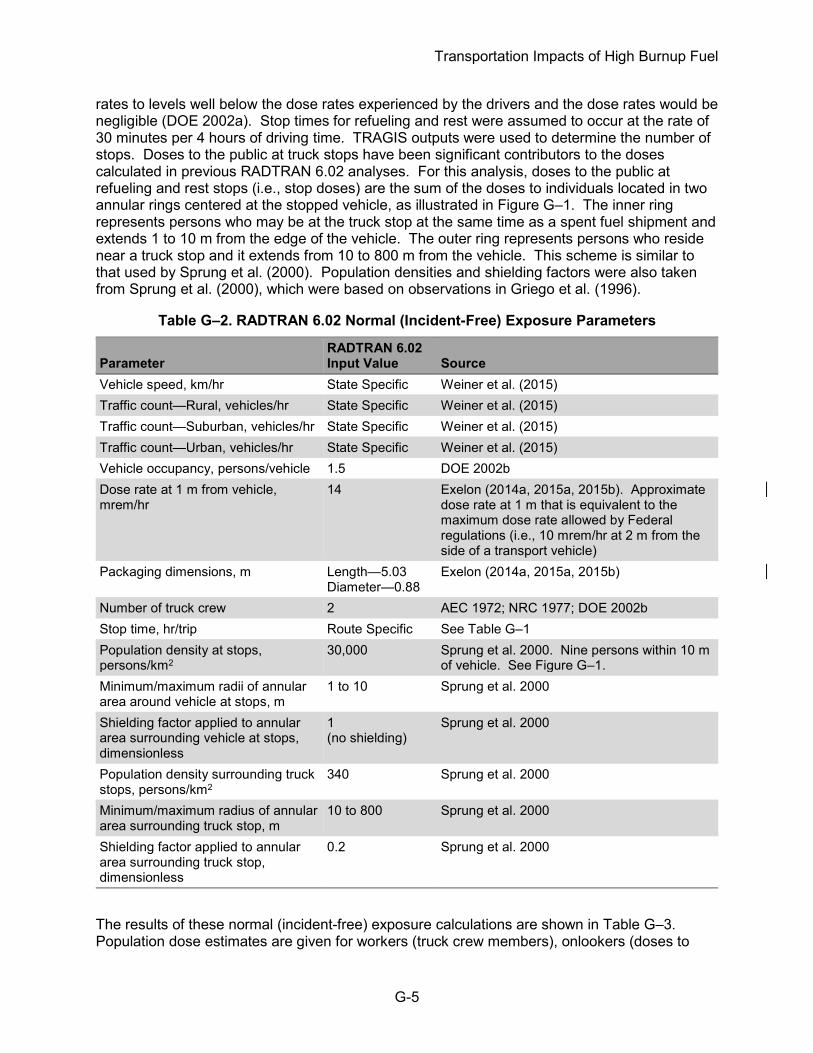
Transportation Impacts of High Burnup Fuel
G-5
rates to levels well below the dose rates experienced by the drivers and the dose rates would be negligible (DOE 2002a). Stop times for refueling and rest were assumed to occur at the rate of 30 minutes per 4 hours of driving time. TRAGIS outputs were used to determine the number of stops. Doses to the public at truck stops have been significant contributors to the doses calculated in previous RADTRAN 6.02 analyses. For this analysis, doses to the public at refueling and rest stops (i.e., stop doses) are the sum of the doses to individuals located in two annular rings centered at the stopped vehicle, as illustrated in Figure G–1. The inner ring represents persons who may be at the truck stop at the same time as a spent fuel shipment and extends 1 to 10 m from the edge of the vehicle. The outer ring represents persons who reside near a truck stop and it extends from 10 to 800 m from the vehicle. This scheme is similar to that used by Sprung et al. (2000). Population densities and shielding factors were also taken from Sprung et al. (2000), which were based on observations in Griego et al. (1996).
Table G–2. RADTRAN 6.02 Normal (Incident-Free) Exposure Parameters
Parameter RADTRAN 6.02 Input Value Source
Vehicle speed, km/hr State Specific Weiner et al. (2015) Traffic count—Rural, vehicles/hr State Specific Weiner et al. (2015) Traffic count—Suburban, vehicles/hr State Specific Weiner et al. (2015) Traffic count—Urban, vehicles/hr State Specific Weiner et al. (2015) Vehicle occupancy, persons/vehicle 1.5 DOE 2002b Dose rate at 1 m from vehicle, mrem/hr
14 Exelon (2014a, 2015a, 2015b). Approximate dose rate at 1 m that is equivalent to the maximum dose rate allowed by Federal regulations (i.e., 10 mrem/hr at 2 m from the side of a transport vehicle)
Packaging dimensions, m Length—5.03 Diameter—0.88
Exelon (2014a, 2015a, 2015b)
Number of truck crew 2 AEC 1972; NRC 1977; DOE 2002b Stop time, hr/trip Route Specific See Table G–1 Population density at stops, persons/km2
30,000 Sprung et al. 2000. Nine persons within 10 m of vehicle. See Figure G–1.
Minimum/maximum radii of annular area around vehicle at stops, m
1 to 10 Sprung et al. 2000
Shielding factor applied to annular area surrounding vehicle at stops, dimensionless
1 (no shielding)
Sprung et al. 2000
Population density surrounding truck stops, persons/km2
340 Sprung et al. 2000
Minimum/maximum radius of annular area surrounding truck stop, m
10 to 800 Sprung et al. 2000
Shielding factor applied to annular area surrounding truck stop, dimensionless
0.2 Sprung et al. 2000
The results of these normal (incident-free) exposure calculations are shown in Table G–3. Population dose estimates are given for workers (truck crew members), onlookers (doses to
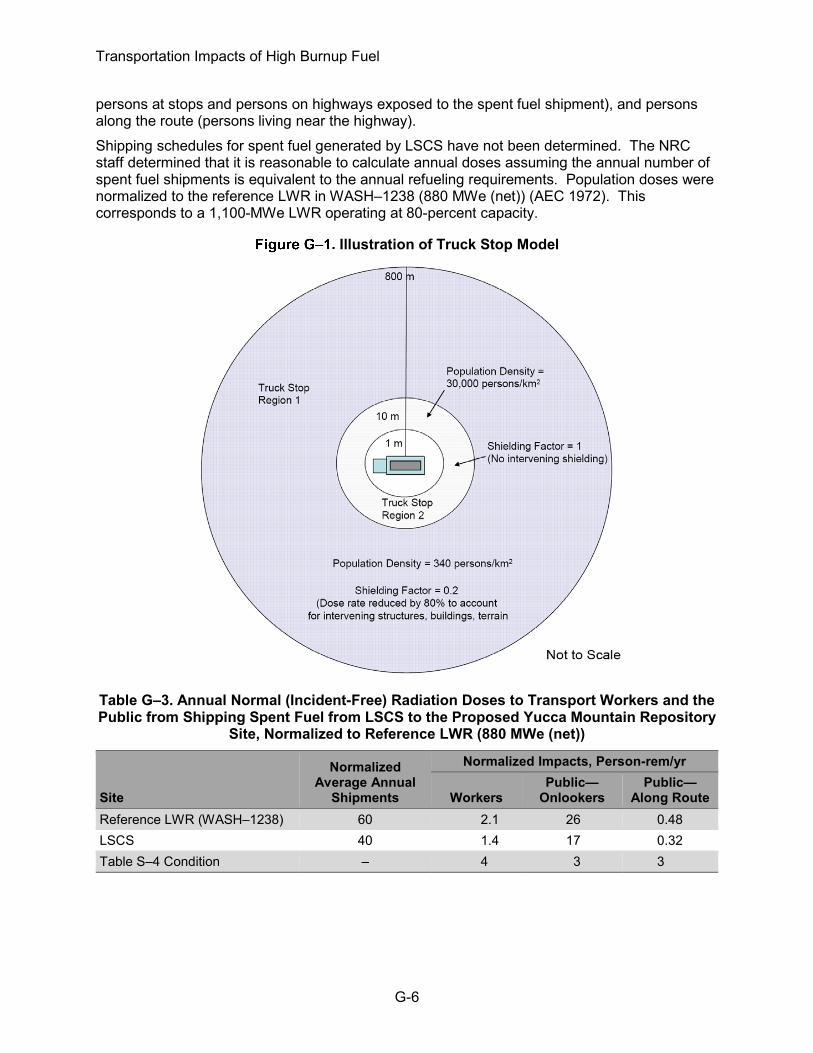
Transportation Impacts of High Burnup Fuel
G-6
persons at stops and persons on highways exposed to the spent fuel shipment), and persons along the route (persons living near the highway). Shipping schedules for spent fuel generated by LSCS have not been determined. The NRC staff determined that it is reasonable to calculate annual doses assuming the annual number of spent fuel shipments is equivalent to the annual refueling requirements. Population doses were normalized to the reference LWR in WASH–1238 (880 MWe (net)) (AEC 1972). This corresponds to a 1,100-MWe LWR operating at 80-percent capacity.
Illustration of Truck Stop Model
Table G–3. Annual Normal (Incident-Free) Radiation Doses to Transport Workers and the Public from Shipping Spent Fuel from LSCS to the Proposed Yucca Mountain Repository
Site, Normalized to Reference LWR (880 MWe (net))
Site
Normalized Average Annual
Shipments
Normalized Impacts, Person-rem/yr
Workers Public—
Onlookers Public—
Along Route Reference LWR (WASH–1238) 60 2.1 26 0.48 LSCS 40 1.4 17 0.32 Table S–4 Condition – 4 3 3
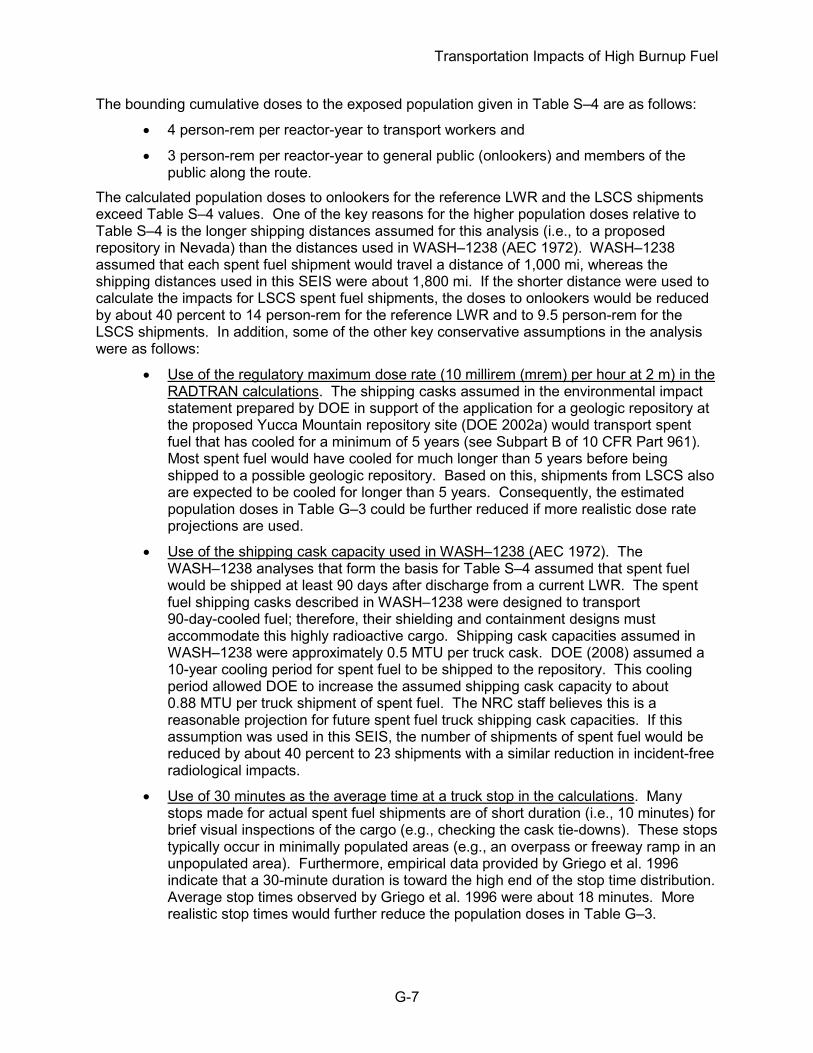
Transportation Impacts of High Burnup Fuel
G-7
The bounding cumulative doses to the exposed population given in Table S–4 are as follows:
• 4 person-rem per reactor-year to transport workers and
• 3 person-rem per reactor-year to general public (onlookers) and members of the public along the route.
The calculated population doses to onlookers for the reference LWR and the LSCS shipments exceed Table S–4 values. One of the key reasons for the higher population doses relative to Table S–4 is the longer shipping distances assumed for this analysis (i.e., to a proposed repository in Nevada) than the distances used in WASH–1238 (AEC 1972). WASH–1238 assumed that each spent fuel shipment would travel a distance of 1,000 mi, whereas the shipping distances used in this SEIS were about 1,800 mi. If the shorter distance were used to calculate the impacts for LSCS spent fuel shipments, the doses to onlookers would be reduced by about 40 percent to 14 person-rem for the reference LWR and to 9.5 person-rem for the LSCS shipments. In addition, some of the other key conservative assumptions in the analysis were as follows:
• Use of the regulatory maximum dose rate (10 millirem (mrem) per hour at 2 m) in the RADTRAN calculations. The shipping casks assumed in the environmental impact statement prepared by DOE in support of the application for a geologic repository at the proposed Yucca Mountain repository site (DOE 2002a) would transport spent fuel that has cooled for a minimum of 5 years (see Subpart B of 10 CFR Part 961). Most spent fuel would have cooled for much longer than 5 years before being shipped to a possible geologic repository. Based on this, shipments from LSCS also are expected to be cooled for longer than 5 years. Consequently, the estimated population doses in Table G–3 could be further reduced if more realistic dose rate projections are used.
• Use of the shipping cask capacity used in WASH–1238 (AEC 1972). The WASH–1238 analyses that form the basis for Table S–4 assumed that spent fuel would be shipped at least 90 days after discharge from a current LWR. The spent fuel shipping casks described in WASH–1238 were designed to transport 90-day-cooled fuel; therefore, their shielding and containment designs must accommodate this highly radioactive cargo. Shipping cask capacities assumed in WASH–1238 were approximately 0.5 MTU per truck cask. DOE (2008) assumed a 10-year cooling period for spent fuel to be shipped to the repository. This cooling period allowed DOE to increase the assumed shipping cask capacity to about 0.88 MTU per truck shipment of spent fuel. The NRC staff believes this is a reasonable projection for future spent fuel truck shipping cask capacities. If this assumption was used in this SEIS, the number of shipments of spent fuel would be reduced by about 40 percent to 23 shipments with a similar reduction in incident-free radiological impacts.
• Use of 30 minutes as the average time at a truck stop in the calculations. Many stops made for actual spent fuel shipments are of short duration (i.e., 10 minutes) for brief visual inspections of the cargo (e.g., checking the cask tie-downs). These stops typically occur in minimally populated areas (e.g., an overpass or freeway ramp in an unpopulated area). Furthermore, empirical data provided by Griego et al. 1996 indicate that a 30-minute duration is toward the high end of the stop time distribution. Average stop times observed by Griego et al. 1996 were about 18 minutes. More realistic stop times would further reduce the population doses in Table G–3.

Transportation Impacts of High Burnup Fuel
G-8
A sensitivity study was performed by the NRC staff to demonstrate the effects of using more realistic dose rates and stop times on the incident-free population dose calculations for shipments of LSCS spent fuel. For this sensitivity study, the dose rate was reduced to 5 mrem per hour, which is the approximate 50-percent confidence interval of the dose rate distribution estimated by Sprung et al. (2000) for future spent fuel shipments. The number of shipments was reduced to 23 shipments per year, and the stop time was reduced to 18 minutes per stop. All other RADTRAN 6.02 input values were unchanged. The result is that the annual crew doses, onlooker doses, and doses to persons along the route were reduced by about 80 percent of the annual doses shown in Table G–3 to 0.29 person-rem, 2.7 person-rem, and 0.078 person-rem, respectively. If the shipping distance was reduced from 1,800 mi to 1,000 mi as discussed above, the annual crew doses, onlooker doses, and doses to persons along the route would be further reduced to 0.16 person-rem, 1.5 person-rem, and 0.043 person-rem, respectively. Radiation protection experts assume that any amount of radiation may pose some risk of causing cancer or a severe hereditary effect and that the risk is higher for higher radiation exposures. Therefore, a linear, no-threshold dose response relationship is used to describe the relationship between radiation dose and detriments, such as cancer induction. The National Research Council (National Research Council 2006) uses the linear, no-threshold dose response model as a basis for estimating the risks from low doses. This approach is accepted by the NRC as a conservative method for estimating health risks from radiation exposure, recognizing that the model may overestimate those risks. Based on this method, the NRC staff estimated the risk to the public from radiation exposure using the nominal probability coefficient for total detriment. This coefficient has the value of 570 fatal cancers, nonfatal cancers, and severe hereditary effects per 1,000,000 person-rem, equal to 0.00057 effects per person-rem. The coefficient is taken from the International Commission on Radiological Protection (ICRP) Publication 103 (ICRP 2007). Both the National Council on Radiation Protection and Measurements (NCRP) and ICRP suggest that when the collective effective dose is smaller than the reciprocal of the relevant risk detriment (in other words, less than 1/0.00057, which is less than 1,754 person-rem), the risk assessment should note that the most likely number of excess health effects is zero (NCRP 1995; ICRP 2007). The annual public dose impacts for transporting spent fuel from LSCS to the proposed Yucca Mountain repository site were estimated to be about 17 person-rem, which is less than the 1,754 person-rem value that ICRP (2007) and NCRP (1995) suggest would most likely result in zero excess health effects. To place these impacts in perspective, the average U.S. resident receives about 311 mrem per year effective dose equivalent from natural background radiation (i.e., exposures from cosmic radiation; naturally occurring radioactive materials, such as radon; and global fallout from testing of nuclear explosive devices) (NCRP 2009). Using this average effective dose, the collective population dose from natural background radiation to the population along the route from LSCS to the proposed Yucca Mountain repository site would be about 1.6x10⁵ person-rem. Therefore, the radiation doses from transporting irradiated fuel from LSCS to the proposed Yucca Mountain repository site are minimal compared to the collective population dose to the same population from exposure to natural sources of radiation. This assessment is a comparative assessment for which there is no regulatory standard to base an impact level, and, again, it is provided only to place the impacts in perspective.
G.3.2 Radiological Impacts of Accidents
As discussed previously, the NRC staff used the RADTRAN 6.02 computer code to estimate the impacts of transportation accidents involving spent fuel shipments. RADTRAN 6.02 considers a

Transportation Impacts of High Burnup Fuel
G-9
spectrum of postulated transportation accidents, ranging from those with high frequencies and low consequences (e.g., “fender benders”) to those with low frequencies and high consequences (i.e., accidents in which the shipping container is exposed to severe mechanical and thermal conditions). Radionuclide inventories are important parameters in the calculation of accident risks. The radionuclide inventories used in this analysis were from the Exelon ER (Exelon 2014a, 2015a, 2015b). The spent fuel inventory used in the NRC staff analysis is listed in Table G–4 and is based on a burnup of 75,000 MWd/MTU. Robust shipping casks are used to transport spent fuel because of the radiation shielding and accident resistance required by 10 CFR Part 71. Spent fuel shipping casks must be certified Type B packaging systems, which means that they must withstand a series of severe postulated accident conditions with essentially no loss of containment or shielding capability. These casks also are designed with fissile material controls to ensure that the spent fuel remains subcritical under normal and accident conditions. According to Sprung et al. (2000), the probability of encountering accident conditions that would lead to shipping cask failure is less than 0.01 percent (i.e., more than 99.99 percent of all accidents would result in no release of radioactive material from the shipping cask). The NRC staff assumed that shipping casks approved for transportation of LSCS spent fuel would provide equivalent mechanical and thermal protection of the spent fuel cargo. Accident frequencies are calculated in RADTRAN 6.02 using user-specified accident rates and conditional shipping cask failure probabilities. State-specific accident rates were taken from Weiner et al. (2015) and used in the RADTRAN 6.02 calculations. Conditional shipping cask failure probabilities (i.e., the probability of cask failure as a function of the mechanical and thermal conditions applied in an accident) were taken from Sprung et al. 2000. The RADTRAN 6.02 accident risk calculations were performed using the radionuclide inventories (curie(s) per metric ton of uranium [Ci/MTU]) in Table G–4 multiplied by the shipping cask capacity (0.5 MTU). The resulting risk estimates were then multiplied by assumed annual spent fuel shipments (shipments per year) to derive estimates of the annual accident risks associated with spent fuel shipments from LSCS to the proposed Yucca Mountain repository site in Nevada. As was done for routine exposures, the NRC staff assumed that the numbers of shipments of spent fuel per year are equivalent to the annual discharge quantities. For this assessment, release fractions for current-generation LWR fuel designs (Sprung et al. 2000) were used. The NRC staff used RADTRAN 6.02 to calculate the population dose from the released radioactive material from four of five possible exposure pathways.13 These pathways are as follows:
• External dose from exposure to the passing cloud of radioactive material (cloudshine).
• External dose from the radionuclides deposited on the ground by the passing plume (groundshine). The NRC staff’s analysis included the radiation exposure from this pathway even though the area surrounding a potential accidental release would be evacuated and decontaminated, thus preventing long-term exposures from this pathway.
13 Internal dose from ingestion of contaminated food was not considered because the NRC staff assumed
evacuation and subsequent interdiction of foodstuffs following a postulated transportation accident.
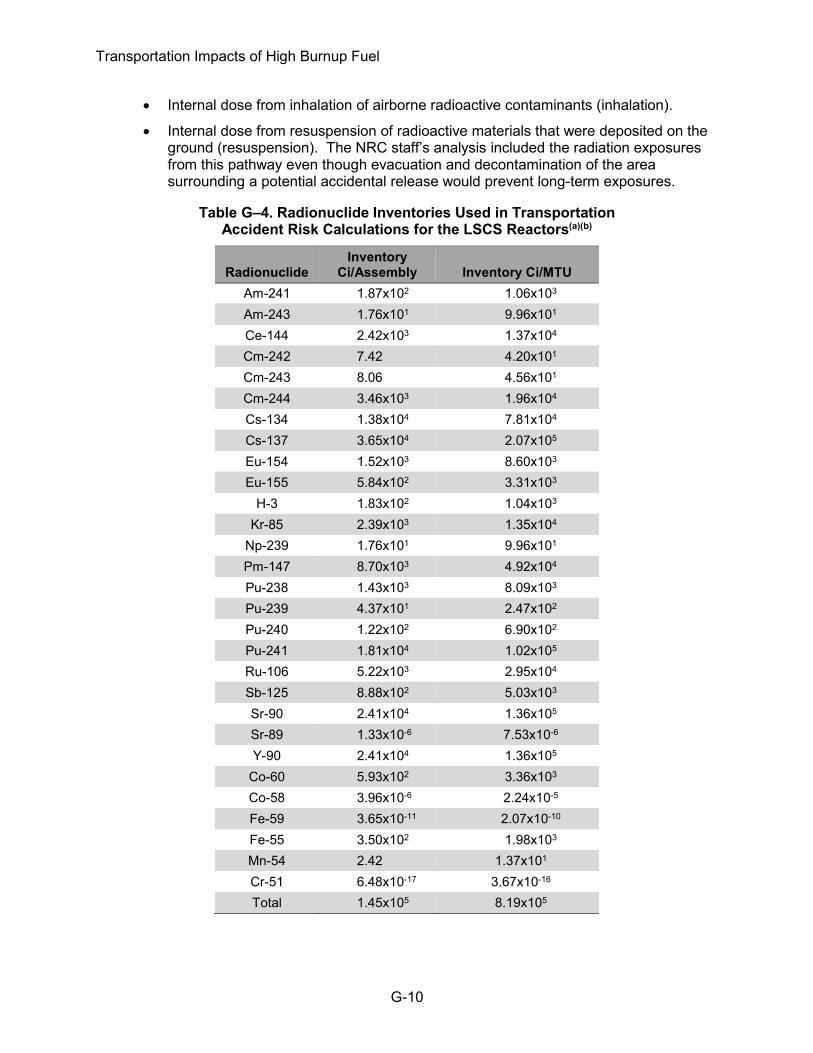
Transportation Impacts of High Burnup Fuel
G-10
• Internal dose from inhalation of airborne radioactive contaminants (inhalation).
• Internal dose from resuspension of radioactive materials that were deposited on the ground (resuspension). The NRC staff’s analysis included the radiation exposures from this pathway even though evacuation and decontamination of the area surrounding a potential accidental release would prevent long-term exposures.
Table G–4. Radionuclide Inventories Used in Transportation Accident Risk Calculations for the LSCS Reactors(a)(b)
Radionuclide Inventory
Ci/Assembly Inventory Ci/MTU Am-241 1.87x10² 1.06x10³ Am-243 1.76x101 9.96x101 Ce-144 2.42x10³ 1.37x10⁴ Cm-242 7.42 4.20x101 Cm-243 8.06 4.56x101 Cm-244 3.46x10³ 1.96x10⁴ Cs-134 1.38x10⁴ 7.81x10⁴ Cs-137 3.65x10⁴ 2.07x10⁵ Eu-154 1.52x10³ 8.60x10³ Eu-155 5.84x10² 3.31x10³
H-3 1.83x10² 1.04x10³ Kr-85 2.39x10³ 1.35x10⁴
Np-239 1.76x101 9.96x101 Pm-147 8.70x10³ 4.92x10⁴ Pu-238 1.43x10³ 8.09x10³ Pu-239 4.37x101 2.47x10² Pu-240 1.22x10² 6.90x10² Pu-241 1.81x10⁴ 1.02x10⁵ Ru-106 5.22x10³ 2.95x10⁴ Sb-125 8.88x10² 5.03x10³ Sr-90 2.41x10⁴ 1.36x10⁵ Sr-89 1.33x10⁻⁶ 7.53x10⁻⁶ Y-90 2.41x10⁴ 1.36x10⁵
Co-60 5.93x10² 3.36x10³ Co-58 3.96x10⁻⁶ 2.24x10⁻⁵ Fe-59 3.65x10⁻¹¹ 2.07x10⁻¹⁰ Fe-55 3.50x10² 1.98x10³ Mn-54 2.42 1.37x101 Cr-51 6.48x10⁻¹⁷ 3.67x10⁻¹⁶ Total 1.45x10⁵ 8.19x10⁵
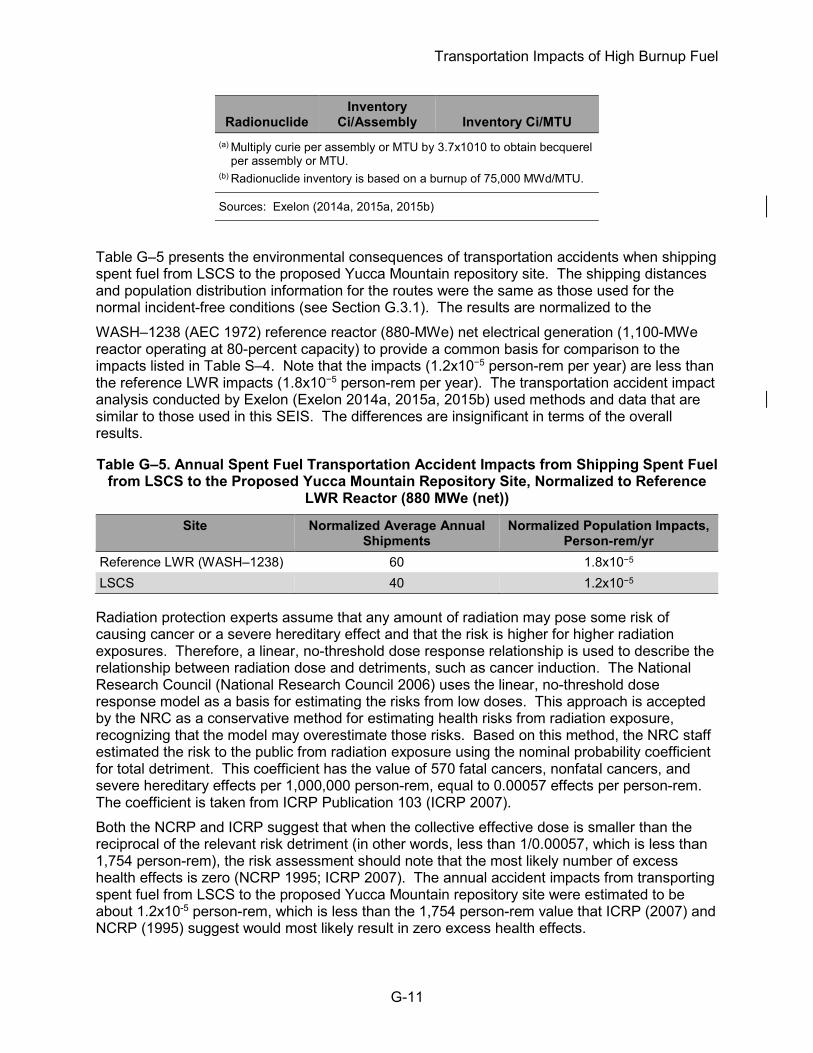
Transportation Impacts of High Burnup Fuel
G-11
Radionuclide Inventory
Ci/Assembly Inventory Ci/MTU (a) Multiply curie per assembly or MTU by 3.7x10¹⁰ to obtain becquerel
per assembly or MTU. (b) Radionuclide inventory is based on a burnup of 75,000 MWd/MTU.
Sources: Exelon (2014a, 2015a, 2015b)
Table G–5 presents the environmental consequences of transportation accidents when shipping spent fuel from LSCS to the proposed Yucca Mountain repository site. The shipping distances and population distribution information for the routes were the same as those used for the normal incident-free conditions (see Section G.3.1). The results are normalized to the WASH–1238 (AEC 1972) reference reactor (880-MWe) net electrical generation (1,100-MWe reactor operating at 80-percent capacity) to provide a common basis for comparison to the impacts listed in Table S–4. Note that the impacts (1.2x10⁻⁵ person-rem per year) are less than the reference LWR impacts (1.8x10⁻⁵ person-rem per year). The transportation accident impact analysis conducted by Exelon (Exelon 2014a, 2015a, 2015b) used methods and data that are similar to those used in this SEIS. The differences are insignificant in terms of the overall results.
Table G–5. Annual Spent Fuel Transportation Accident Impacts from Shipping Spent Fuel from LSCS to the Proposed Yucca Mountain Repository Site, Normalized to Reference
LWR Reactor (880 MWe (net))
Site Normalized Average Annual Shipments
Normalized Population Impacts, Person-rem/yr
Reference LWR (WASH–1238) 60 1.8x10⁻⁵ LSCS 40 1.2x10⁻⁵
Radiation protection experts assume that any amount of radiation may pose some risk of causing cancer or a severe hereditary effect and that the risk is higher for higher radiation exposures. Therefore, a linear, no-threshold dose response relationship is used to describe the relationship between radiation dose and detriments, such as cancer induction. The National Research Council (National Research Council 2006) uses the linear, no-threshold dose response model as a basis for estimating the risks from low doses. This approach is accepted by the NRC as a conservative method for estimating health risks from radiation exposure, recognizing that the model may overestimate those risks. Based on this method, the NRC staff estimated the risk to the public from radiation exposure using the nominal probability coefficient for total detriment. This coefficient has the value of 570 fatal cancers, nonfatal cancers, and severe hereditary effects per 1,000,000 person-rem, equal to 0.00057 effects per person-rem. The coefficient is taken from ICRP Publication 103 (ICRP 2007). Both the NCRP and ICRP suggest that when the collective effective dose is smaller than the reciprocal of the relevant risk detriment (in other words, less than 1/0.00057, which is less than 1,754 person-rem), the risk assessment should note that the most likely number of excess health effects is zero (NCRP 1995; ICRP 2007). The annual accident impacts from transporting spent fuel from LSCS to the proposed Yucca Mountain repository site were estimated to be about 1.2x10⁻⁵ person-rem, which is less than the 1,754 person-rem value that ICRP (2007) and NCRP (1995) suggest would most likely result in zero excess health effects.

Transportation Impacts of High Burnup Fuel
G-12
In addition, the collective population dose from natural background radiation to the population along the representative routes from LSCS to the proposed Yucca Mountain repository site would be about 1.6x10⁵ person-rem. Therefore, the accident impacts from transporting spent fuel to the proposed Yucca Mountain repository site are minimal compared to the collective population dose to the same population from exposure to natural sources of radiation. This assessment is a comparative assessment for which there is no regulatory standard to base an impact level and is provided only to place the impacts in perspective.
G.3.3 Nonradiological Impacts of Accidents
A nonradiological accident is a truck accident in which the property damage, injuries, or fatalities are caused by the force of the impact; no release of, or exposure to, radiological materials occurs as a result of the truck accident. In WASH–1238 (AEC 1972) and NUREG–75/038 (NRC 1975), the NRC staff assessed the impacts of these nonradiological truck accidents that may occur during the transport of fuel and waste to and from LWRs and estimated the impacts from these nonradiological accidents as one fatal injury in 100 reference reactor-years and one nonfatal injury in 10 reference reactor-years. Using data from the National Highway Transportation Safety Administration for large trucks over the period 2009 through 2013, NRC staff estimated that there would be less than one fatal injury per 100 reference reactor-years and less than one nonfatal injury per 10 reference reactor-years for shipments of spent fuel from LSCS to the proposed Yucca Mountain repository site. Therefore, the nonradiological impacts of accidents from the transportation of LSCS spent fuel would be small.
G.4 Conclusions for Transportation Impacts of High Burnup Fuel
The NRC staff performed an independent confirmatory analysis of the impacts under normal operating and accident conditions of transporting irradiated fuel from LSCS to the proposed Yucca Mountain repository site. To make comparisons to Table S–4, the environmental impacts were adjusted (i.e., normalized) to the environmental impacts associated with the reference LWR in WASH–1238 (AEC 1972) by multiplying the LSCS impact estimates by the ratio of the total electric output for the reference reactor to the electric output of the LSCS reactors. Because of the conservative approaches and data used to calculate impacts, the NRC staff does not expect the actual environmental effects to exceed those calculated in this SEIS. Thus, the NRC staff concludes that the environmental impacts of the transportation of irradiated fuel from LSCS would be SMALL and would be consistent with the environmental impacts associated with the transportation of fuel and radioactive wastes to and from current-generation reactors presented in Table S–4 of 10 CFR 51.52. The NRC staff concludes that transportation impacts are roughly proportional to the distance from LSCS to the repository site—in this case Illinois to Nevada. The distance from LSCS to any new planned repository in the contiguous United States would be no more than double the distance from LSCS to the proposed Yucca Mountain repository site. Doubling the environmental impact estimates from the transportation of spent reactor fuel, as presented in this section, would provide a reasonable bounding estimate of the impacts to meet the requirements of the National Environmental Policy Act of 1969, as amended (42 U.S.C. 4321 et seq.). The NRC staff concludes that the environmental impacts of these doubled estimates would not be significant and, therefore, would still be SMALL.

Transportation Impacts of High Burnup Fuel
G-13
G.5 References
10 CFR Part 50. 2012. Code of Federal Regulations, Title 10, Energy, Part 50, “Domestic licensing of production and utilization facilities.” 10 CFR Part 51. 2011. Code of Federal Regulations, Title 10, Energy, Part 51, “Environmental protection regulations for domestic licensing and related regulatory functions.” 10 CFR Part 71. 2011. Code of Federal Regulations, Title 10, Energy, Part 71, “Packaging and transportation of radioactive material.” 10 CFR Part 961. 2002. Code of Federal Regulations, Title 10, Energy, Part 961, “Standard contract for disposal of spent nuclear fuel and/or high-level radioactive waste.” 65 FR 794. U.S. Nuclear Regulatory Commission. “FirstEnergy Nuclear Operating Company, Davis-Besse Nuclear Power Station, Unit 1; Environmental Assessment and Finding of No Significant Impact.” Federal Register (65):794. January 6, 2000. [AEC] U.S. Atomic Energy Commission. 1972. Environmental Survey of Transportation of Radioactive Materials to and from Nuclear Power Plants. Washington, DC: AEC. WASH–1238. December 2002. ADAMS No. ML14092A626. [DOE] U.S. Department of Energy. 2002a. “Final Environmental Impact Statement for a Geologic Repository for the Disposal of Spent Nuclear Fuel and High-Level Radioactive Waste at Yucca Mountain, Nye County, Nevada.” Washington, DC: DOE. DOE/EIS-0250, Office of Civilian Radioactive Waste Management. February 2002. Available at <http://energy.gov/nepa/downloads/eis-0250-final-environmental-impact-statement> (accessed 5 October 2015). [DOE] U.S. Department of Energy. 2002b. A Resource Handbook on DOE Transportation Risk Assessment. Washington, DC: DOE. DOE/EM/NTP/HB-01. July 2002. ADAMS No. ML12192A286. [DOE] U.S. Department of Energy. 2008. “Final Supplemental Environmental Impact Statement for a Geologic Repository for the Disposal of Spent Nuclear Fuel and High-Level Radioactive Waste at Yucca Mountain, Nye County, Nevada.” Washington, DC: DOE. DOE/EIS-0250F-S1. June 2008. Available at http://energy.gov/downloads/final-supplemental-environmental-impact-statement-geologic-repository-disposal-spent-2 (accessed 5 October 2015). [Exelon] Exelon Generation Company, LLC. 2014a. Applicant’s Environmental Report—Operating License Renewal Stage, LaSalle County Station. Chicago, Illinois: Exelon. December 9, 2014. ADAMS Nos. ML14343A883 and ML14343A897. [Exelon] Exelon Generation Company, LLC. 2014b. License Renewal Application, LaSalle County Station, Units 1 and 2. Chicago, Illinois: Exelon. December 9, 2014. ADAMS No. ML14343A849. [Exelon] Exelon Generation Company, LLC. 2015a. LaSalle County Station, Units 1 & 2, Response to NRC Request for Additional Information, dated June 25, 2015, Regarding License Renewal Application, Environmental Review. Chicago, Illinois: Exelon. July 24, 2015. ADAMS No. ML15205A003. [Exelon] Exelon Generation Company, LLC. 2015b. LaSalle County Station, Units 1 and 2—Revised Response to Request for Additional Information (RAI) #TR-09 Re License Renewal Application, Environmental Review. Chicago, Illinois: Exelon. August 28, 2015. ADAMS No. ML15240A002.

Transportation Impacts of High Burnup Fuel
G-14
Griego, NR, Smith JD, Neuhauser KS. 1996. Investigation of RADTRAN Stop Model Input Parameters for Truck Stops. Albuquerque, New Mexico: Sandia National Laboratories. March 13, 1996. ADAMS No. ML14111A188. [ICRP] International Commission on Radiological Protection. 2007. “The 2007 Recommendations of the International Commission on Radiological Protection.” ICRP Publication 103, Elsevier, Maryland Heights, Missouri. Available at <http://www.sciencedirect.com/science/journal/01466453/37/2-4> (accessed 9 October 2015). National Environmental Policy Act of 1969, as amended. 42 U.S.C. § 4321 et seq. National Research Council. 2006. “Health Risks from Exposure to Low Levels of Ionizing Radiation BEIR VII Phase 2.” National Academies Press, Washington, DC. Available at <http://www.nap.edu/openbook.php?record_id=11340&page=1> (accessed 9 October 2015). [NCRP] National Council on Radiation Protection and Measurements. 1995. “Principles and Applications of Collective Dose in Radiation Protection.” NCRP Report No. 121, Bethesda, Maryland. Available at <http://www.ncrppublications.org/Reports/121>. [NCRP] National Council on Radiation Protection and Measurements. 2009. Ionizing Radiation Exposure of the Population of the United States. NCRP Report No. 160, Bethesda, Maryland. Available at <http://app.knovel.com/web/toc.v/cid:kpIREPUS05> (accessed 9 October 2015). [NRC] U.S. Nuclear Regulatory Commission. 1975. Environmental Survey of Transportation of Radioactive Materials to and from Nuclear Power Plants, Supplement 1. Washington, DC: NRC. NUREG–75/038. April 30, 1975. ADAMS No. ML14091A176. [NRC] U.S. Nuclear Regulatory Commission. 1977. Final Environmental Statement on the Transportation of Radioactive Material by Air and Other Modes. Washington, DC: NRC. NUREG–0170, Volume 1. December 31, 1977. ADAMS No. ML12192A283. [NRC] U.S. Nuclear Regulatory Commission. 1999. Generic Environmental Impact Statement for License Renewal of Nuclear Plants. Washington, DC: NRC. NUREG–1437, Volume 1, Addendum 1. August 31, 1999. ADAMS No. ML040690720. [NRC] U.S. Nuclear Regulatory Commission. 2013. Generic Environmental Impact Statement for License Renewal of Nuclear Plants. Washington, DC: NRC. NUREG–1437, Revision 1, Volumes 1, 2, and 3. June 19, 2013. ADAMS Accession No. ML13107A023. [ORNL] Oak Ridge National Laboratory. 2015. WebTRAGIS, v.6. “Transportation Routing Analysis GIS.” Available at <https://webtragis.ornl.gov/tragis/app/login> (accessed 1 August 2015). Sprung J, Ammerman DJ, Breivik NL, Dukart RJ, Kanipe FL, Koski JA, Mills GS, Neuhauser KS, H.D. Radloff, Weiner RF, and Yoshimura HR. 2000. Reexamination of Spent Fuel Shipment Risk Estimates. Albuquerque, NM: Sandia National Laboratories. NUREG/CR–6672. March 31, 2000. ADAMS No. ML003698324. Weiner RF, Hinojosa D, Heames TJ, and Farnum CO. 2015. RADTRAN 6/RadCat 6 User Guide.


NU
REG
-1437 Supplem
ent 57 Final
Generic Environm
ental Impact Statem
ent for License Renew
al of Nuclear Plants
Regarding LaSalle C
ounty Station, Units 1 and 2
August 2016