An integrative biology approach for analysis of drug action in models of human vascular inflammation
21
The FASEB Journal express article10.1096/fj.04-1538fje. Published online June 18, 2004. An integrative biology approach for analysis of drug action in models of human vascular inflammation Eric J. Kunkel,* Marlene Dea,* Allen Ebens,* Evangelos Hytopoulos,* Jennifer Melrose,* Dat Nguyen,* Ken S. Ota,* Ivan Plavec,* Yuker Wang,* Susan R. Watson,* Eugene C. Butcher, † and Ellen L. Berg* *BioSeek, Inc., Burlingame, CA 94010; † Laboratory of Immunology and Vascular Biology, Department of Pathology, Stanford University School of Medicine, Stanford, CA 94305 Corresponding author: Ellen L. Berg, Bioseek, Inc., 863-C Mitten Rd., Burlingame, CA 94010. E-mail: [email protected] ABSTRACT Unexpected drug activities discovered during clinical testing establish the need for better characterization of compounds in human disease-relevant conditions early in the discovery process. Here, we describe an approach to characterize drug function based on statistical analysis of protein expression datasets from multiple primary human cell-based models of inflammatory disease. This approach, termed Biologically Multiplexed Activity Profiling (BioMAP), provides rapid characterization of drug function, including mechanism of action, secondary or off-target activities, and insights into clinical phenomena. Using three model systems containing primary human endothelial cells and peripheral blood mononuclear cells in different environments relevant to vascular inflammation and immune activation, we show that BioMAP profiles detect and discriminate multiple functional drug classes, including glucocorticoids; TNF-α antagonists; and inhibitors of HMG-CoA reductase, calcineurin, IMPDH, PDE4, PI-3 kinase, hsp90, and p38 MAPK, among others. The ability of cholesterol lowering HMG-CoA reductase inhibitors (statins) to improve outcomes in rheumatic disease patients correlates with the activities of these compounds in our BioMAP assays. In addition, the activity profiles identified for the immunosuppressants mycophenolic acid, cyclosporin A, and FK-506 provide a potential explanation for a reduced incidence of posttransplant cardiovascular disease in patients receiving mycophenolic acid. BioMAP profiling can allow integration of meaningful human biology into drug development programs. Key words: endothelium • leukocyte • chemokine • adhesion • systems biology ompletion of the human genome (1–3) together with technological advances in chemical synthesis have opened up unparalleled opportunities for the development of new medicines. Realization of this potential, however, requires rapid and practical approaches to characterizing the functions of molecules in the context of complex human disease biology. The studies presented here are part of an effort to better understand the molecular regulation of key inflammatory proteins (e.g., adhesion molecules, cytokines, chemokines) under the complex environmental conditions present in human inflammatory diseases. We have undertaken a “systems” approach (4, 5) where we apply chemical and genetic tools to a panel of primary C Page 1 of 21 (page number not for citation purposes)
-
Upload
independent -
Category
Documents
-
view
1 -
download
0
Transcript of An integrative biology approach for analysis of drug action in models of human vascular inflammation
The FASEB Journal express article10.1096/fj.04-1538fje. Published online June 18, 2004.
An integrative biology approach for analysis of drug action in models of human vascular inflammation Eric J. Kunkel,* Marlene Dea,* Allen Ebens,* Evangelos Hytopoulos,* Jennifer Melrose,* Dat Nguyen,* Ken S. Ota,* Ivan Plavec,* Yuker Wang,* Susan R. Watson,* Eugene C. Butcher,† and Ellen L. Berg* *BioSeek, Inc., Burlingame, CA 94010; †Laboratory of Immunology and Vascular Biology, Department of Pathology, Stanford University School of Medicine, Stanford, CA 94305
Corresponding author: Ellen L. Berg, Bioseek, Inc., 863-C Mitten Rd., Burlingame, CA 94010. E-mail: [email protected]
ABSTRACT
Unexpected drug activities discovered during clinical testing establish the need for better characterization of compounds in human disease-relevant conditions early in the discovery process. Here, we describe an approach to characterize drug function based on statistical analysis of protein expression datasets from multiple primary human cell-based models of inflammatory disease. This approach, termed Biologically Multiplexed Activity Profiling (BioMAP), provides rapid characterization of drug function, including mechanism of action, secondary or off-target activities, and insights into clinical phenomena. Using three model systems containing primary human endothelial cells and peripheral blood mononuclear cells in different environments relevant to vascular inflammation and immune activation, we show that BioMAP profiles detect and discriminate multiple functional drug classes, including glucocorticoids; TNF-α antagonists; and inhibitors of HMG-CoA reductase, calcineurin, IMPDH, PDE4, PI-3 kinase, hsp90, and p38 MAPK, among others. The ability of cholesterol lowering HMG-CoA reductase inhibitors (statins) to improve outcomes in rheumatic disease patients correlates with the activities of these compounds in our BioMAP assays. In addition, the activity profiles identified for the immunosuppressants mycophenolic acid, cyclosporin A, and FK-506 provide a potential explanation for a reduced incidence of posttransplant cardiovascular disease in patients receiving mycophenolic acid. BioMAP profiling can allow integration of meaningful human biology into drug development programs.
Key words: endothelium • leukocyte • chemokine • adhesion • systems biology
ompletion of the human genome (1–3) together with technological advances in chemical synthesis have opened up unparalleled opportunities for the development of new medicines. Realization of this potential, however, requires rapid and practical approaches
to characterizing the functions of molecules in the context of complex human disease biology.
The studies presented here are part of an effort to better understand the molecular regulation of key inflammatory proteins (e.g., adhesion molecules, cytokines, chemokines) under the complex environmental conditions present in human inflammatory diseases. We have undertaken a “systems” approach (4, 5) where we apply chemical and genetic tools to a panel of primary
C
Page 1 of 21(page number not for citation purposes)
human cell-based assays while measuring the levels of several inflammation-related proteins. Our primary human cell-based disease models (Biologically Multiplexed Activity Profiling assays, or BioMAP models) allow us to probe drug and gene function and characterize cell and pathway interactions in physiological and disease-relevant contexts. In these models, biological complexity is provided by 1) the activation of multiple signaling pathways, 2) interactions of multiple primary human cell types, and 3) the use of multiple systems for data analysis. We find that these model systems are surprisingly robust, reproducible, and responsive to and discriminatory of the activities of a large number of anti-inflammatory- and immunomodulatory agents, including approved and investigational therapeutics. The application of this approach to elucidate gene function has been recently described (6), where multisystems analysis of data from gene-overexpression studies was successfully applied to map signaling networks relevant to vascular inflammation.
In the present study, we use biologically multiplexed activity profiling to 1) correlate functional responses of drugs to mechanism class, 2) identify secondary target activities, and 3) provide insights into and generate hypotheses regarding mechanisms that may underlie clinical activities of approved therapeutics. Using three complex models of inflammation, we detect and distinguish a variety of compound classes, including inhibitors of p38 MAPK, MEK1/2, PI-3-kinase, hsp90, HMG-CoA reductase, IMPDH, and calcineurin as well as glucocorticoids, TNF-α antagonists, and immunomodulatory cytokines. We also demonstrate that rapid insight into biological activities does not require large numbers of molecular measurements, but instead can be embodied in analyses of a limited number of readout parameters selected for their information content and relevance to the inflammatory process.
MATERIALS AND METHODS
Cytokines, antibodies, and reagents
Recombinant human IFN-γ, TNF-α, and IL-1β were from R&D Systems (Minneapolis, MN). Mouse antibodies were obtained from commercial sources: murine IgG (Sigma, St. Louis, MO), anti-human tissue factor (mIgG1; Calbiochem, San Diego, CA), anti-human ICAM-1 (mIgG1; Beckman Coulter, Fullerton, CA), and anti-human E-selectin (mIgG1; HyCult Biotechnology, Uden, The Netherlands). Mouse antibodies against human VCAM-1 (mIgG1), CD31 (mIgG1), HLA-DR (mIgG2a), CD3 (mIgG1), CD40 (mIgG1), CD69 (mIgG1), MIG (mIgG1), MCP-1 (mIgG1), CD14 (mIgG1), IL-1α (mIgG1), and CD38 (mIgG1) were obtained from BD Biosciences (San Jose, CA). Mouse antibodies against IL-8 (mIgG1) and M-CSF (mIgG1), and polyclonal goat antibodies against TNF-α and IL-1β, control goat IgG, and TNFRI-Ig fusion protein were obtained from R&D Systems. Apigenin, UO126, budesonide, dexamethasone, genistein, zearalenone, β-zearalenol, azathioprine, prednisolone, leflunomide, AA861, and cyclosporin A were obtained from Sigma. PD098059, PD169316, SKF-86002, SB220025, mevastatin, nordihydroguaiaretic acid (NGDA), FK-506, and rapamycin were from Calbiochem. Atorvastatin and simvastatin were from LKT Laboratories (St. Paul, MN). Recombinant human IL-4 and IL-10 were from R&D Systems. Ro-20-1274, R(–)rolipram, DRB, PP2, and PP1 were from BIOMOL (Plymouth Meeting, PA). Mycophenolic acid, WHI-P131, ZM39923, wortmannin, AG490, AG126, and SB239063 were from Calbiochem. ZM336372, radicicol, 17-AAG, SP600125, lovastatin, LY294002, and geldanamycin were from Tocris (Ellisville, MO). Compounds were evaluated over a range of concentrations (see Supplemental Fig. S1), and data
Page 2 of 21(page number not for citation purposes)
shown are at concentrations that do not result in cell toxicity as evidenced by untoward alterations in cell morphology and >50% reductions in total cell protein levels. Staphylococcal enterotoxin B, toxic shock syndrome toxin-1 (Staphylococcal enterotoxin F) from Staphylococcus aureus, and lipopolysaccharide from Salmonella enteritidis were obtained from Sigma.
Cell culture
Human umbilical vein endothelial cells (HUVEC) were obtained from Cascade Biologics (Portland, OR) and cultured in EGM-2 medium containing supplements provided by the manufacturer and 2% heat-inactivated fetal bovine serum (Hyclone, Logan, UT) and subcultured with 0.05% trypsin-0.53 mM EDTA (Mediatech, Herndon, VA) as described by the manufacturer. Peripheral blood mononuclear cells (PBMC) were prepared from buffy coats (Stanford Blood Bank, Stanford, CA) by centrifugation over Hisopaque-1077 (Sigma). Experiments were performed by culturing HUVEC in microtiter plates (Falcon; BD Biosciences), in the presence of cytokines (IL-1β, 1 ng/ml; TNF-α, 5 ng/ml; and IFN-γ, 100 ng/ml), activators (SAg, 20 ng/ml, or LPS, 0.2 ng/ml), and/or PBMC (7.5×10⁴) for the indicated times. Drugs (see Supplemental Tables S1 and S2 for doses) were added 1 h before stimulation and were present during the entire 24 h stimulation period.
Cell-based ELISAs
Cell-based ELISAs were carried out essentially as previously described (29). Briefly, microtiter plates containing treated and stimulated HUVEC (or HUVEC/PBMC) were blocked and then incubated with primary antibodies or isotype control antibodies (0.01–0.5 µg/ml) for 1 h. After washing, plates were then incubated with a peroxidase-conjugated anti-mouse IgG (Promega) secondary antibody or a biotin-conjugated anti-mouse IgG antibody (Jackson ImmunoResearch, West Grove, PA) for 1 h followed by streptoavidin-HRP (Jackson ImmunoResearch) for 30 min. Plates were washed and developed with TMB substrate (Clinical Science Products, Mansfield, MA), and the absorbance (OD) was read at 450 nm (subtracting the background absorbance at 650 nm) with a Molecular Devices (Sunnyvale, CA) SpectraMAX 190 plate reader.
siRNA transfection
Early passage (<5) exponentially growing HUVEC cells were harvested, washed once with PBS, and resuspended at 2 × 10⁶ cells in 100 µl Nucelofection solution (Human Umbilical Vein Endothelial Cell Nucleofector Kit, AMAXA, Koeln, Germany). TNFR1 siRNA (AAGTGCCACAAAGGAACCTAC; 15 µl of a 20 µM solution; Dharmacon, Lafayette, CO) or a scrambled control siRNA were added to the cell suspension, transferred into an electroporation cuvette, and electroporated using the U-1 setting. The cell suspension was then transferred into a separate tube containing 3 ml EGM-2 media (Clonetics), incubated at 37°C for 10 min, and plated into microtiter plates (25,000 cells/well) for cytokine activation and ELISA analysis as described above.
Page 3 of 21(page number not for citation purposes)
Data analysis
Mean OD values for each parameter measured by ELISA were calculated from triplicate samples per experiment. Mean values were then used to generate ratios between treated (e.g., drug or siRNA) and matched control (e.g., media or DMSO) parameter values within each experiment. These normalized parameter ratios were then log10 transformed. Log expression ratios were used in all Pearson correlation calculations (Partek Pro, version 5.1; Partek, St. Charles, MO). Individual experiment profiles or averaged profiles (n=3 experiments per drug) were ordered by hierarchical clustering (Pearson correlation metric with average distance). Averaged profile data were ordered in the correlation plot by coupling multidimensional scaling and pivoting to move high correlations toward the diagonal. Significant correlations were determined by 1) creating a distribution of Pearson correlations using randomized data made from permuting the empirical profiles, 2) selecting a Pearson correlation to minimize the false detection rate (FDR) (13) (the FDR is the ratio of the number of correlations greater than this selected Pearson correlation in the randomized data to the number of correlations greater than this selected Pearson correlation in the empirical data), and 3) applying this cut-off Pearson correlation value to the correlations between experimental profiles. This ensures that for a 5% FDR, 95% of the correlations derived from the experimental profiles are a result of a true biological effect, and not random chance. Correlations were visualized in two dimensions by multidimensional scaling using AT&T GraphViz software (http://www.research.att.com/sw/tools/graphviz/). Distances between compounds are representative of their similarities and lines are drawn between compounds whose profiles are similar at a level not due to chance (as defined above). IC50 values were calculated from dose-response data for a given parameter using GraphPad Prism software (GraphPad Software, San Diego, CA).
RESULTS
Effects of drugs in an endothelial model of inflammation
Endothelial cells express adhesion receptors and chemokines that modulate inflammatory responses by regulating leukocyte traffic. In chronically inflamed tissues, endothelial cells are exposed to multiple proinflammatory cytokines, including IL-1β, TNF-α, and IFN-γ. Therefore, to study the effects of various treatments on a model of chronic inflammation, we stimulated primary human endothelial cells (EC) with this combination of cytokines (the “3C” system) for 24 h in the presence of selected compounds. Protein readouts were selected for their robust modulation in response to one or more cytokine combinations or to specific compounds (see below), and for their potential or known relevance to vascular inflammation, and included VCAM-1, ICAM-1, and E-selectin (vascular adhesion molecules for leukocytes) (7); MHC class II (antigen presentation) (8); MIG/CXCL9, MCP-1/CCL2, and IL-8/CXCL8 (chemokines that mediate selective leukocyte recruitment from the blood) (9); and CD31 (leukocyte transmigration) (10).
Figure 1A presents the relative changes in each readout parameter produced by treatment with two different compounds in 10 independent experiments. Although the order of parameters in arbitrary and their values are independent, we have drawn lines between the data points within each experiment to facilitate comparisons between experiments. The treatments shown include an antibody inhibitor of TNF-α, and PD169316, a p38 MAPK inhibitor. Each of these agents
Page 4 of 21(page number not for citation purposes)
produced a characteristic profile, indicating that it induces a unique and reproducible response in the 3C system. Figure 1B shows the response of the 3C system to multiple doses of PD169316 and illustrates how the shape of the profile remains similar at different compound concentrations, from 0.03 to 3 µM (common for well-behaved competitive inhibitors). Additional dose-response data for several compounds is provided in Supplemental Figure S1. Notably, the relative expression levels of individual parameters vary from experiment to experiment and from cell donor to cell donor, but the ratio of parameter values with drug to those without (control) remains much more consistent. This is illustrated for MCP-1 in Figure 1C, where the absolute parameter values in the 3C system in the presence of solvent control (closed circles; 25% CV) or PD169316 (open circles; 31% CV) are much more variable than their ratios (open triangles; 14% CV).
Responses reflect mechanisms of drug action
To determine whether the readout profiles produced by compounds were correlated with their mechanism of action, we evaluated the responses of the 3C system to a range of chemically diverse inhibitors acting on common cellular pathways. Figure 2 (heat map) summarizes the effect of each drug (tested at the highest nontoxic dose, generally between 1 and 10 µM) on the log-transformed level of each readout protein in three independent experiments (green indicates an increased level of the readout measurement relative to the untreated control, black indicates no change, and red indicates a decreased level). The data were then subjected to nonsupervised hierarchical clustering to reveal relationships among activity profiles. Figure 2 (tree) shows the results of hierarchical clustering when the Pearson correlation is used as the clustering metric. Compounds affecting a common target produce response profiles that group together in this analysis. For example, profiles generated from treatment with PD169316, SB220025, and SB202190, chemically distinct inhibitors of p38 MAPK, group together while the profiles from the MEK inhibitor, PD098059, cluster separately, as do the profiles for inhibitors of NF-κB signaling [apigenin (11) and NGDA (12)].
This BioMAP system also responded to manipulations at the gene level or with biological agents. Figure 2 shows that inhibition of TNF-α with an anti-TNF-α antibody (or a soluble form of the TNF receptor 1; data not shown) yields a response that clustered with that obtained by knockdown of TNF receptor 1 using siRNA. Gene knockdown in such complex cell systems may be useful to dissect gene function and to predict the effects of drugs against the gene target. Thus, response profiles in the 3C system can be used to classify drugs on the basis of their targets.
Coverage of additional pathways using multicellular systems
To transcend the limitations of a single cell type and a single, albeit complex, environmental condition, we established multicellular systems comprising peripheral blood mononuclear cells (PBMC; a mixture of CD4+ and CD8+ T cells, monocytes, NK cells, and other mononuclear leukocytes) and EC, either stimulating the T cell receptor complex with superantigen (the “SAg system”) or stimulating toll receptor signaling with lipopolysaccharide (the “LPS system”). Eight readout parameters were selected for the SAg system and 10 for the LPS system. They include CD3 (a T cell marker); CD14 (a monocyte marker); CD38, and CD69 (early activation markers); CD40 (a TNFR family member important for lymphocyte costimulation); E-selectin and VCAM-
Page 5 of 21(page number not for citation purposes)
1 (endothelial adhesion molecules); tissue factor (TF; also known as CD142, an initiator of coagulation); IL-1α and M-CSF (cytokines); and IL-8, MCP-1, and MIG (chemokines that control leukocyte recruitment). In these multicellular systems, cells respond directly to the initiating stimuli and/or to each other, resulting in a complex cascade of events.
The SAg and LPS systems responded robustly and reproducibly to a number of compounds that were inactive or only weakly active in the 3C system (Fig. 3A). For example, FK-506 and cyclosporin A, two inhibitors of calcineurin-mediated T cell receptor signaling, both strongly inhibited the SAg system, inducing well-correlated responses. Other compounds active in the SAg system (but not the 3C system) included IL-10, the phosphodiesterase 4 inhibitors Ro-20-1274 and rolipram, the immunosuppressant rapamycin, the JAK inhibitors WHI-P131 and ZM39923, HMG-CoA reductase inhibitors, corticosteroids, and the src-family kinase inhibitors PP1 and PP2. Many compounds active in the endothelial inflammation system (Fig. 2) retained activity in the more complex multicellular systems (for instance, the p38 inhibitors PD169316 and SB220025, and anti-TNF-α).
Statistical methods for discrimination of drug activities using multiple cell culture systems
In studies of gene activities (6), we found that gene function was most effectively characterized by combining data from multiple cell systems into a single profile for comparison, an approach that revealed functional association of genes into well-defined pathways. Therefore, to allow a similar objective evaluation of the significance of all relationships between compound activities, profile data from the three systems used here were combined, yielding for each drug (at a given concentration) a combined profile comprising 24 normalized parameter readout measurements (the 7 measured parameters from the 3C system, the 7 readouts from the SAg system, and the 10 readouts from the LPS system; Fig. 3A). Although hierarchical clustering as shown in Figure 2 illustrates the power of a complex biological system to distinguish compounds by mechanism of action; this binary clustering method can obscure significant similarities between compounds that are on different branches of the tree. Therefore, we performed pairwise comparisons of these 24 parameter profiles, measuring the similarity between profiles with Pearson correlations (Fig. 3B), and represented the implied relationships in two dimensions using multidimensional scaling (Fig. 3C). In this graph, the distance between compounds is a reflection of the degree of difference in their profiles. A statistical permutation method based on minimizing the FDR (13) was used to identify statistically significant correlations, and these are indicated by the lines connecting the drugs.
Examination of the resulting Function Similarity Map (Fig. 3C) demonstrates that the profiles obtained for a majority of compounds known to share a common mechanism (listed in Table 1) are significantly related to each other. These include glucocorticoids, p38 inhibitors, hsp90 inhibitors, HMG-CoA reductase inhibitors (statins), calcineurin inhibitors, and TNF-α antagonists. Interestingly, compounds known to have poor target specificity, such as the general tyrosine kinase inhibitors AG126 and genistein; the JAK inhibitors ZM39923, WHI-P131, and AG490; or the 5-lipoxygenase inhibitors AA861 and NGDA (14), show little functional similarity with each other, reflecting the unique biological consequences of their inhibition of multiple molecular targets. Thus, parallel system analysis identifies compounds with statistically similar functions across the systems tested, rapidly defining compounds that are likely to share molecular targets and specificity.
Page 6 of 21(page number not for citation purposes)
In other cases, multisystem analysis reveals similarity of functional responses induced by mechanistically distinct drugs. These may often reflect pathway relationships. For example, the profile of the mTOR antagonist rapamycin is significantly correlated to the profiles of the general PI-3 kinase inhibitors LY294002 and wortmannin. This is consistent with the known regulation of p70S6K (an mTOR target) by PI-3 kinase (15) (Fig. 4A). Interestingly, the nonsteroidal fungal estrogen receptor agonists zearalenone and β-zearalenol (16) both clustered with a large group of p38 MAPK inhibitors, an effect potentially related to the reported ability of estrogen to modulate p38 signaling (17). The phosphodiesterase 4 inhibitors (Ro-20-1724 and rolipram) cluster with glucocorticoids (dexamethasone, budesonide, and prednisolone). Both drug classes are implicated in broadly based suppression of leukocyte function, including suppression of the core NF-κB signaling cascade, explaining their similar activities in the systems (SAg and LPS), which critically depend on leukocyte signaling. Although such relationships can be identified, PDE4 inhibitors and corticosteroids can be distinguished by differential effects in these assays on CD40 and M-CSF in the LPS system (Fig. 3A) and in additional systems such as fibrosis BioMAP models where inhibition of collagen I production is a feature of corticosteroids but not PDE4 inhibitors (data not shown). Thus, while the set of systems presented here detects and discriminates a broad range of immunomodulatory activities and can point to similarity of functional immunologic effects through common or distinct molecular targets, additional discrimination of drug function can be obtained by adding systems with different biology.
Inspection of the profiles obtained for well-studied compounds can also reveal new biological insights into clinical activities of compounds. One example is provided by the ability of BioMAP profiling to reveal potent and unique immunologic effects of the statins, drugs designed to target HMG-CoA reductase for cholesterol lowering. Indeed, examination of the unique and distinctive profile obtained for HMG-CoA reductase inhibitors in these systems shows that one of the dominant features of these profiles is a significant reduction in CD69, a leukocyte activation antigen, in the complex SAg system (Fig. 4B). Table 2 shows that of seven HMG-CoA reductase inhibitors tested, all demonstrated this activity, although with differing potencies. Addition of mevalonate reversed the effect of the statins on CD69 (data not shown), indicating that this activity is most likely a consequence of the inhibition of HMG-Co-A reductase and not an off-target effect. This activity is consistent with reported activities of statins on immune function distinct from their effects on cholesterol synthesis (18, 19).
A novel, distinctive profile was also obtained for the immunosuppressant mycophenolic acid (MPA, Fig. 4C). The key feature of the MPA profile was a strong inhibitory effect on MCP-1 expression in all three systems. No other immunosuppressant tested, including cyclosporine A, rapamycin, FK-506, or azathioprine shared this feature (see Fig. 3).
DISCUSSION
The ability to inhibit cellular responses to pro-inflammatory cytokines is a common feature of many anti-inflammatory and immunosuppressive compounds and serves as the basis of numerous cell-based screens in drug discovery. For example, many of these compounds, including corticosteroids, immunosuppressants, proteasome inhibitors, various kinase inhibitors, and others, have been shown to inhibit particular endothelial cell responses induced by IL-1β or TNF-α. Such assays detect but do not effectively discriminate or classify compounds with
Page 7 of 21(page number not for citation purposes)
different mechanisms of action. In an effort to provide cell-based assays with better capacity to discriminate between compounds with different mechanisms of action, we have developed and evaluated a set of human cell-based model systems that incorporate increased levels of biological complexity with relevance to inflammatory disease biology. We hypothesize that such systems would be useful for the rapid identification of effective new therapeutics. In testing the performance of these systems with known pharmacologic agents, we discovered that the responses measured in these complex systems were surprisingly robust and reproducible and could be used for efficient classification of compounds according to their functional activities.
One key discovery of the current study is that relatively small sets of parameters can provide extensive coverage of pharmacological and biological space relevant to cell- and tissue-level inflammation, particularly in the context of several complex cell systems. This broad sensitivity may be an innate property of complex cellular systems, in which the level of each receptor or cytokine parameter measured is an indirect reflection of pathway interactions mediated by hundreds of signaling steps within and between cells. Moreover, because biological functions are context dependent, analysis in several complex systems in parallel dramatically enhances the breadth of functional responses that can be detected and distinguished. In addition to the drugs discussed, we find that these model systems detect known and novel gene components of the NF-κB, PI3K/Akt, Ras/ERK, and IFN-γ pathways, allowing efficient and automated prediction of gene functional networks (6).
The systems described here have multiple applications to drug discovery. The broad coverage of biology provides a useful tool for compound validation, for example, to probe compound specificity. Protein kinases are an important drug development target family, and a number of kinase inhibitors are active in the assays presented here. Due to the large size of the kinome as well as the degree of similarity of targeted ATP binding sites, drug specificity remains problematic. Our results show that multiplexed profiling can efficiently identify compounds functionally specific for a common kinase target (as seen with the well-characterized p38 inhibitors used in our study) but also identifies drugs with off-target activities [such as the functional clustering of the c-Raf antagonist ZM336372 with p38 inhibitors (20)] or poor specificity (such as the JAK inhibitors that cluster away from each other, or the general tyrosine kinase inhibitors genistein and AG126, whose functional responses reflect the specific set of kinases they inhibit). Thus, BioMAP comparisons of targeted compounds have the potential to rapidly identify drug specificity problems early in preclinical development.
In addition to revealing information about mechanism class and/or target specificity of compounds, this relatively high-throughput approach can also result in new biological insights for well-studied compounds. Although HMG-CoA reductase inhibitors, the statins, have been approved for their ability to lower serum cholesterol, they yield unique and distinctive activity profiles in the systems presented here. This activity, shared by all members of this class, is predictive of an immunomodulatory effect. Interestingly, one prominent feature of the statin profile is a significant reduction in CD69, a cell surface antigen associated with leukocyte activation in the complex SAg system. Because of the association of CD69 with T cell activation, this activity may be related to the reported beneficial effects of statins in autoimmune diseases such as rheumatoid arthritis (21). Recently, clinical studies showed a significant reduction in the expression of CD69 in patients with Lupus after simvastatin therapy (22). Of note, the various statin compounds differ significantly in their potencies in our BioMAP assays,
Page 8 of 21(page number not for citation purposes)
with cerivastatin >> atorvastatin > simvastatin > lovastatin > rosuvastatin > pravastatin. This ranking does not reflect enzyme potency or effectiveness in lowering LDL cholesterol in patients, as rosuvastatin is the most potent inhibitor of HMG-CoA reductase in vitro and in vivo (23, 24) and rosuvastatin and atorvastatin are the most effective statins in lowering cholesterol in humans (25). Nor does the ranking correlate with lipophilicity, as simvastatin and cerivastatin are similar in this respect (simvastatin = cerivastatin > lovastatin = atorvastatin > pravastatin). It does, however, raise the possibility that compounds with preferential activity on immune activation can be identified in BioMAP or derivative model systems.
Another novel and distinctive multisystem profile was obtained for mycophenolic acid (MPA), the active form of mycophenolate mofetil, a prodrug approved as an immunosuppressant for use in kidney transplantation. Key features of the MPA profile include strong effects on MCP-1 expression in all three BioMAP systems. MCP-1 is a monocyte and T cell chemoattractant that plays a role in leukocyte recruitment in many chronic inflammatory disease settings. Increased levels of MCP-1 are found in patients with coronary artery disease and diabetes and are associated with an increased risk of cardiovascular mortality (26). Interestingly, MCP-1 suppresses insulin-dependent adipocyte glucose uptake and, thus, may exacerbate the pathologic consequences of hyperinsulinemia and obesity, including diabetes (27). No other immunosuppressant tested, including cyclosporin A, rapamycin, FK-506, or azathioprine, had such a selective effect on MCP-1, and none had any effect on MCP-1 expression in the 3C system. Mycophenolic acid was recently found to decrease the risk of posttransplant diabetes, in comparison with cyclosporin A and FK-506, which are associated with an increased incidence (28). The selective effect of mycophenolic acid on the expression of MCP-1 in the complex assays described here provides a potential correlate for this clinical activity.
In conclusion, biologically multiplexed activity profiling in scalable complex cellular systems has the potential to rapidly characterize pathways (and mechanisms of action) of novel molecules. The power of this systems biology approach is illustrated here by functional classification of a wide variety of anti-inflammatory drug classes. The strength of the approach derives from the complex, combinatorially determined system responses and is enhanced by parallel interrogation of systems in which different pathways are stimulated. Rapid and efficient analyses of systems responses are made possible by the finding, validated here, that relatively few parameters need to be measured in any given system in order to capture much of the relevant system behavior. We propose that this approach of pauciparameter analysis of drug function in parallel complex cell systems can permit a discovery science approach to cell and chemical biology. BioMAP analysis allows the integration of human biology and pathophysiology into target validation and the early stages of drug discovery, thus improving the efficiency of drug development programs.
ACKNOWLEDGMENTS
We would like to thank M. Dajee, C. Laudanna, L. J. Picker, R. Tibshirani, and T. Hastie for their input on this manuscript. Supported in part by SBIR grants to E. L. Berg (R43 AI048255) and I. Plavec (R43 AI049048).
Page 9 of 21(page number not for citation purposes)
REFERENCES
1. Collins, F. S., Green, E. D., Guttmacher, A. E., and Guyer, M. S. (2003) A vision for the future of genomics research. Nature 422, 835–847
2. Venter, J. C., Adams, M. D., Myers, E. W., Li, P. W., Mural, R. J., Sutton, G. G., Smith, H. O., Yandell, M., Evans, C. A., Holt, R. A., et al. (2001) The sequence of the human genome. Science 291, 1304–1351
3. Lander, E. S., Linton, L. M., Birren, B., Nusbaum, C., Zody, M. C., Baldwin, J., Devon, K., Dewar, K., Doyle, M., FitzHugh, W., et al. (2001) Initial sequencing and analysis of the human genome. Nature 409, 860–921
4. Davidov, E., Holland, J., Marple, E., and Naylor, S. (2003) Advancing drug discovery through systems biology. Drug Discov. Today 8, 175–183
5. Ideker, T., Thorsson, V., Ranish, J. A., Christmas, R., Buhler, J., Eng, J. K., Bumgarner, R., Goodlett, D. R., Aebersold, R., and Hood, L. (2001) Integrated genomic and proteomic analyses of a systematically perturbed metabolic network. Science 292, 929–934
6. Plavec, I., Sirenko, O., Privat, S., Wang, Y., Dajee, M., Melrose, J., Nakao, B., Hytopoulos, E., Berg, E. L., and Butcher, E. C. (2004) Method for analyzing signaling networks in complex cellular systems. Proc. Natl. Acad. Sci. USA 101, 1223–1228
7. Springer, T. A. (1995) Traffic signals on endothelium for lymphocyte recirculation and leukocyte emigration. Annu. Rev. Physiol. 57, 827–872
8. Pober, J. S., Kluger, M. S., and Schechner, J. S. (2001) Human endothelial cell presentation of antigen and the homing of memory/effector T cells to skin. Ann. N. Y. Acad. Sci. 941, 12–25
9. Ebnet, K., Kaldjian, E. P., Anderson, A. O., and Shaw, S. (1996) Orchestrated information transfer underlying leukocyte endothelial interactions. Annu. Rev. Immunol. 14, 155–177
10. Muller, W. A., and Randolph, G. J. (1999) Migration of leukocytes across endothelium and beyond: molecules involved in the transmigration and fate of monocytes. J. Leukoc. Biol. 66, 698–704
11. Gerritsen, M. E., Carley, W. W., Ranges, G. E., Shen, C. P., Phan, S. A., Ligon, G. F., and Perry, C. A. (1995) Flavonoids inhibit cytokine-induced endothelial cell adhesion protein gene expression. Am. J. Pathol. 147, 278–292
12. Brennan, P., and O'Neill, L. A. (1998) Inhibition of nuclear factor kappaB by direct modification in whole cells–mechanism of action of nordihydroguaiaritic acid, curcumin and thiol modifiers. Biochem. Pharmacol. 55, 965–973
13. Tusher, V. G., Tibshirani, R., and Chu, G. (2001) Significance analysis of microarrays applied to the ionizing radiation response. Proc. Natl. Acad. Sci. USA 98, 5116–5121
Page 10 of 21(page number not for citation purposes)
14. Werz, O. (2002) 5-lipoxygenase: cellular biology and molecular pharmacology. Curr.Drug Targets Inflam.Allergy 1, 23–44
15. Gonzalez-Garcia, A., Garrido, E., Hernandez, C., Alvarez, B., Jimenez, C., Cantrell, D. A., Pullen, N., and Carrera, A. C. (2002) A new role for the p85-phosphatidylinositol 3-kinase regulatory subunit linking FRAP to p70 S6 kinase activation. J. Biol. Chem. 277, 1500–1508
16. Miksicek, R. J. (1994) Interaction of naturally occurring nonsteroidal estrogens with expressed recombinant human estrogen receptor. J. Steroid Biochem. Mol. Biol. 49, 153–160
17. Liu, W. L., Guo, X., and Guo, Z. G. (2002) Estrogen prevents bovine aortic endothelial cells from TNF-alpha -induced apoptosis via opposing effects on p38 and p44/42 CCDPK. Acta Pharmacol. Sin. 23, 213–218
18. Leung, B. P., Sattar, N., Crilly, A., Prach, M., McCarey, D. W., Payne, H., Madhok, R., Campbell, C., Gracie, J. A., Liew, F. Y., et al. (2003) A novel anti-inflammatory role for simvastatin in inflammatory arthritis. J. Immunol. 170, 1524–1530
19. Weitz-Schmidt, G., Welzenbach, K., Brinkmann, V., Kamata, T., Kallen, J., Bruns, C., Cottens, S., Takada, Y., and Hommel, U. (2001) Statins selectively inhibit leukocyte function antigen-1 by binding to a novel regulatory integrin site. Nat. Med. 7, 687–692
20. Hall-Jackson, C. A., Eyers, P. A., Cohen, P., Goedert, M., Boyle, F. T., Hewitt, N., Plant, H., and Hedge, P. (1999) Paradoxical activation of Raf by a novel Raf inhibitor. Chem. Biol. 6, 559–568
21. Kanda, H., Hamasaki, K., Kubo, K., Tateishi, S., Yonezumi, A., Kanda, Y., Yamamoto, K., and Mimura, T. (2002) Antiinflammatory effect of simvastatin in patients with rheumatoid arthritis. J. Rheumatol. 29, 2024–2026
22. Abud-Mendoza, C., de la, F. H., Cuevas-Orta, E., Baranda, L., Cruz-Rizo, J., and Gonzalez-Amaro, R. (2003) Therapy with statins in patients with refractory rheumatic diseases: a preliminary study. Lupus 12, 607–611
23. McTaggart, F., Buckett, L., Davidson, R., Holdgate, G., McCormick, A., Schneck, D., Smith, G., and Warwick, M. (2001) Preclinical and clinical pharmacology of Rosuvastatin, a new 3-hydroxy-3-methylglutaryl coenzyme A reductase inhibitor. Am. J. Cardiol. 87, 28B–32B
24. Davidson, M. H. (2002) Rosuvastatin: a highly efficacious statin for the treatment of dyslipidaemia. Expert Opin. Investig. Drugs 11, 125–141
25. Davidson, M., Ma, P., Stein, E. A., Gotto, A. M., Jr., Raza, A., Chitra, R., and Hutchinson, H. (2002) Comparison of effects on low-density lipoprotein cholesterol and high-density lipoprotein cholesterol with rosuvastatin versus atorvastatin in patients with type IIa or IIb hypercholesterolemia. Am. J. Cardiol. 89, 268–275
Page 11 of 21(page number not for citation purposes)
26. Aukrust, P., Ueland, T., Muller, F., Andreassen, A. K., Nordoy, I., Aas, H., Kjekshus, J., Simonsen, S., Froland, S. S., and Gullestad, L. (1998) Elevated circulating levels of C-C chemokines in patients with congestive heart failure. Circulation 97, 1136–1143
27. Sartipy, P., and Loskutoff, D. J. (2003) Monocyte chemoattractant protein 1 in obesity and insulin resistance. Proc. Natl. Acad. Sci. USA 100, 7265–7270
28. Miller, L. W. (2002) Cardiovascular toxicities of immunosuppressive agents. Am. J. Transplant. 2, 807–818
29. Melrose, J., Tsurushita, N., Liu, G., and Berg, E. L. (1998) IFN-gamma inhibits activation-induced expression of E- and P-selectin on endothelial cells. J. Immunol. 161, 2457–2464
Received March 7, 2004; accepted May 4, 2004.
Page 12 of 21(page number not for citation purposes)
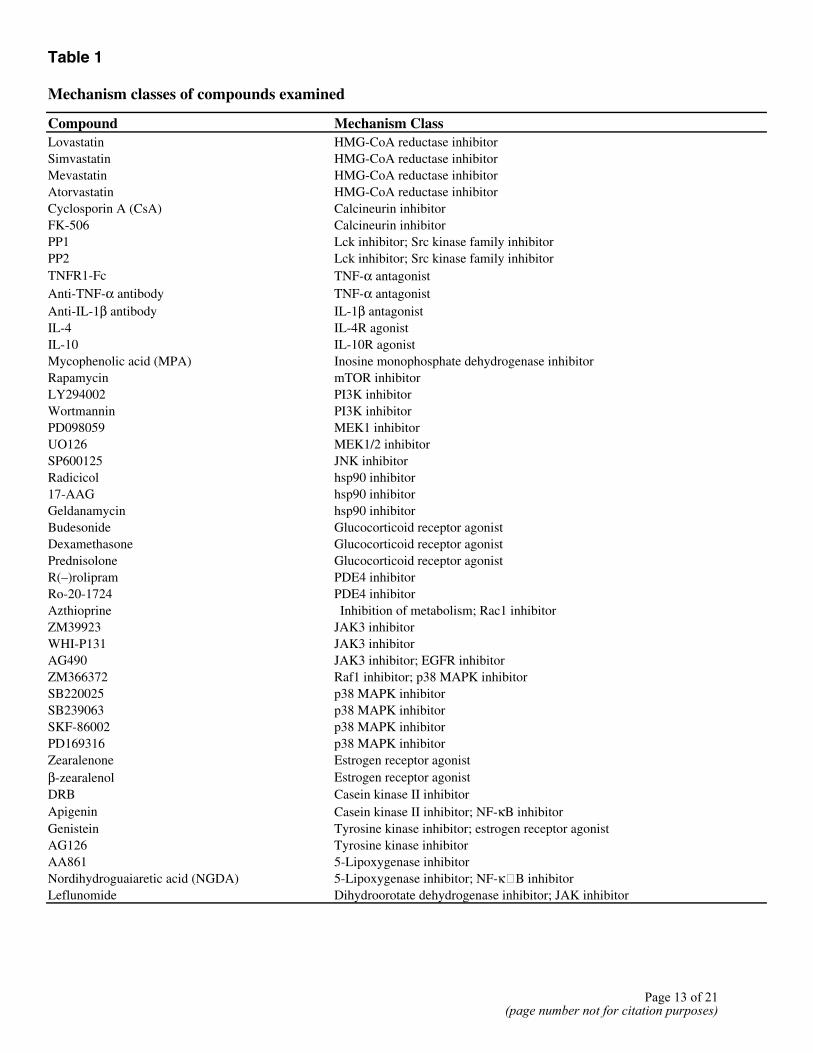
Table 1 Mechanism classes of compounds examined
Compound Mechanism Class Lovastatin HMG-CoA reductase inhibitor Simvastatin HMG-CoA reductase inhibitor Mevastatin HMG-CoA reductase inhibitor Atorvastatin HMG-CoA reductase inhibitor Cyclosporin A (CsA) Calcineurin inhibitor FK-506 Calcineurin inhibitor PP1 Lck inhibitor; Src kinase family inhibitor PP2 Lck inhibitor; Src kinase family inhibitor TNFR1-Fc TNF-α antagonist Anti-TNF-α antibody TNF-α antagonist Anti-IL-1β antibody IL-1β antagonist IL-4 IL-4R agonist IL-10 IL-10R agonist Mycophenolic acid (MPA) Inosine monophosphate dehydrogenase inhibitor Rapamycin mTOR inhibitor LY294002 PI3K inhibitor Wortmannin PI3K inhibitor PD098059 MEK1 inhibitor UO126 MEK1/2 inhibitor SP600125 JNK inhibitor Radicicol hsp90 inhibitor 17-AAG hsp90 inhibitor Geldanamycin hsp90 inhibitor Budesonide Glucocorticoid receptor agonist Dexamethasone Glucocorticoid receptor agonist Prednisolone Glucocorticoid receptor agonist R(–)rolipram PDE4 inhibitor Ro-20-1724 PDE4 inhibitor Azthioprine Inhibition of metabolism; Rac1 inhibitor ZM39923 JAK3 inhibitor WHI-P131 JAK3 inhibitor AG490 JAK3 inhibitor; EGFR inhibitor ZM366372 Raf1 inhibitor; p38 MAPK inhibitor SB220025 p38 MAPK inhibitor SB239063 p38 MAPK inhibitor SKF-86002 p38 MAPK inhibitor PD169316 p38 MAPK inhibitor Zearalenone Estrogen receptor agonist β-zearalenol Estrogen receptor agonist DRB Casein kinase II inhibitor Apigenin Casein kinase II inhibitor; NF-κB inhibitor Genistein Tyrosine kinase inhibitor; estrogen receptor agonist AG126 Tyrosine kinase inhibitor AA861 5-Lipoxygenase inhibitor Nordihydroguaiaretic acid (NGDA) 5-Lipoxygenase inhibitor; NF-κ�B inhibitor Leflunomide Dihydroorotate dehydrogenase inhibitor; JAK inhibitor
Page 13 of 21(page number not for citation purposes)
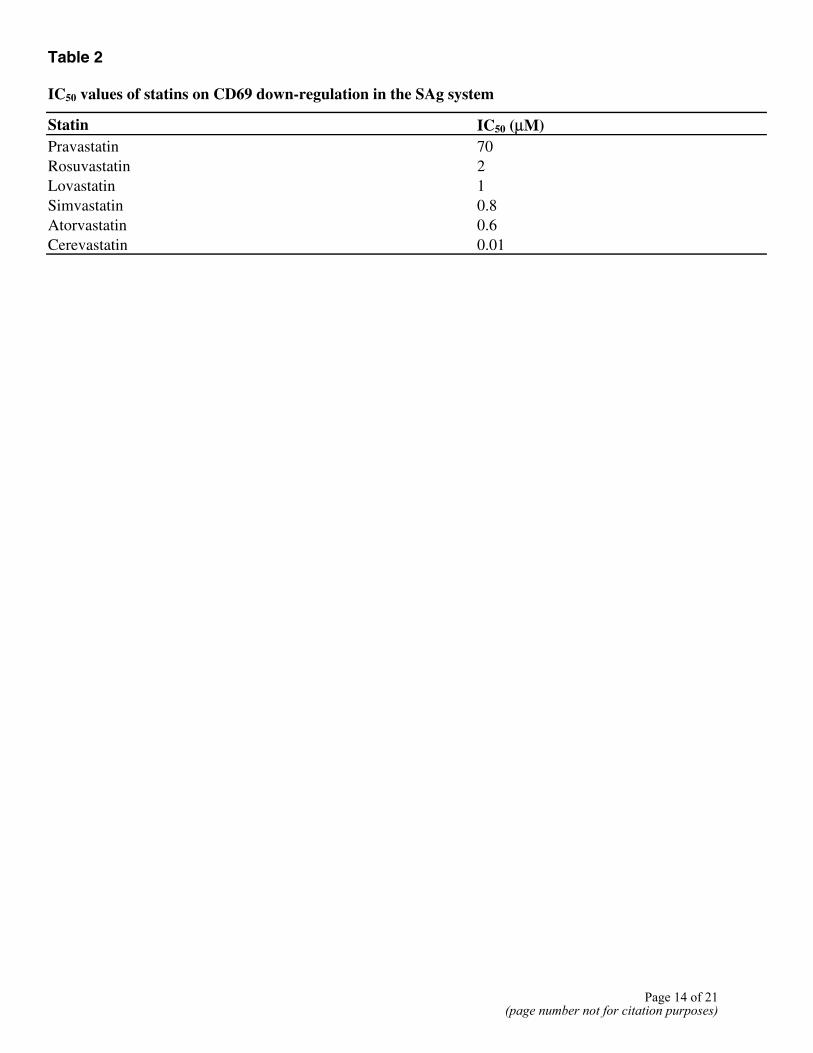
Table 2 IC50 values of statins on CD69 down-regulation in the SAg system
Statin IC50 (µM) Pravastatin 70 Rosuvastatin 2 Lovastatin 1 Simvastatin 0.8 Atorvastatin 0.6 Cerevastatin 0.01
Page 14 of 21(page number not for citation purposes)
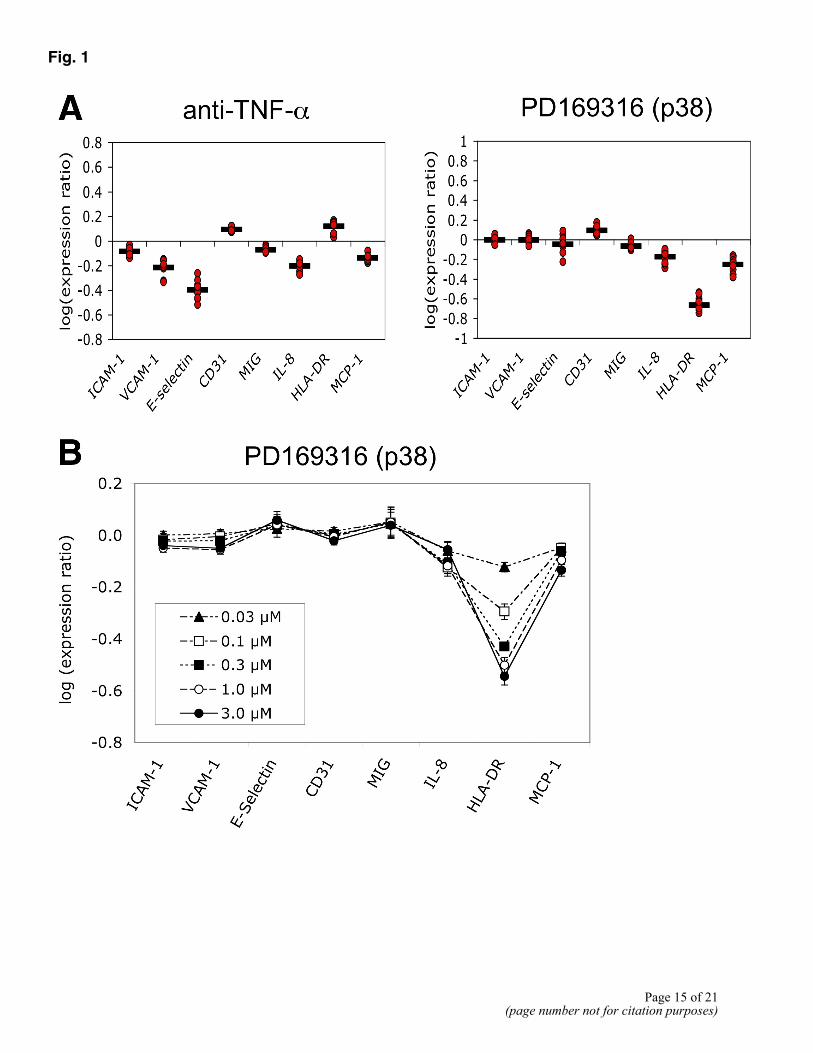
Fig. 1
Page 15 of 21
(page number not for citation purposes)
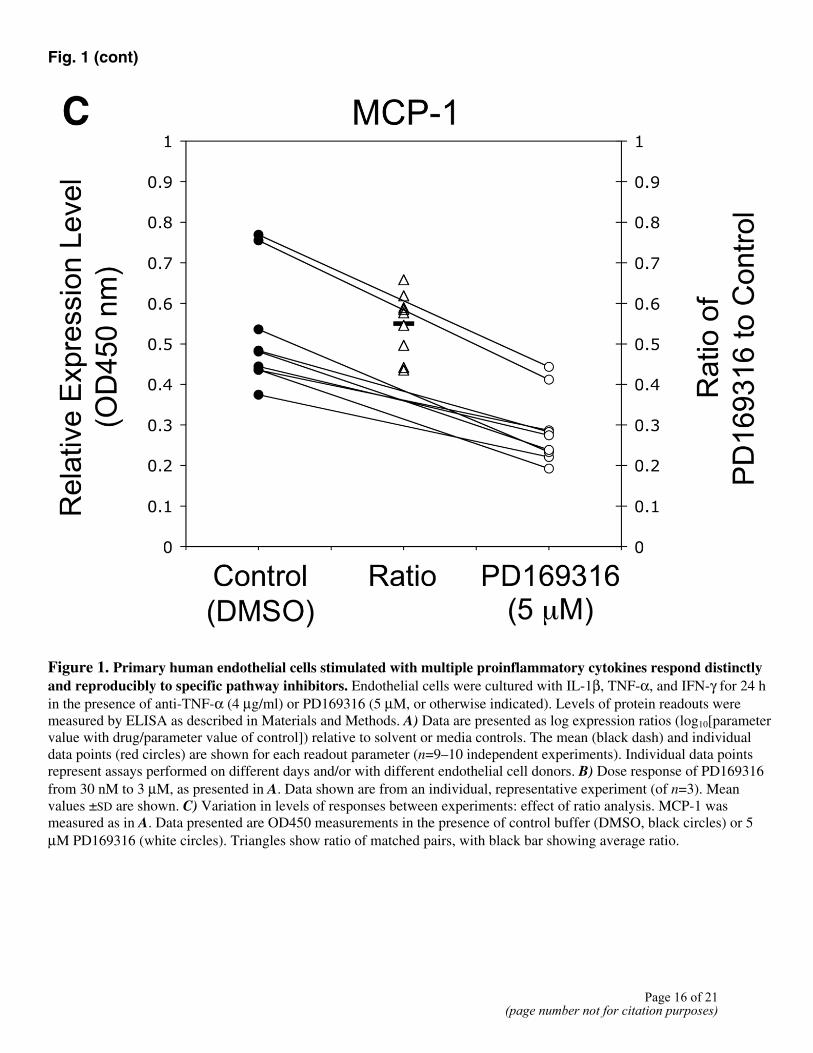
Fig. 1 (cont)
Figure 1. Primary human endothelial cells stimulated with multiple proinflammatory cytokines respond distinctly and reproducibly to specific pathway inhibitors. Endothelial cells were cultured with IL-1β, TNF-α, and IFN-γ for 24 h in the presence of anti-TNF-α (4 µg/ml) or PD169316 (5 µM, or otherwise indicated). Levels of protein readouts were measured by ELISA as described in Materials and Methods. A) Data are presented as log expression ratios (log10[parameter value with drug/parameter value of control]) relative to solvent or media controls. The mean (black dash) and individual data points (red circles) are shown for each readout parameter (n=9–10 independent experiments). Individual data points represent assays performed on different days and/or with different endothelial cell donors. B) Dose response of PD169316 from 30 nM to 3 µM, as presented in A. Data shown are from an individual, representative experiment (of n=3). Mean values ±SD are shown. C) Variation in levels of responses between experiments: effect of ratio analysis. MCP-1 was measured as in A. Data presented are OD450 measurements in the presence of control buffer (DMSO, black circles) or 5 µM PD169316 (white circles). Triangles show ratio of matched pairs, with black bar showing average ratio.
Page 16 of 21(page number not for citation purposes)
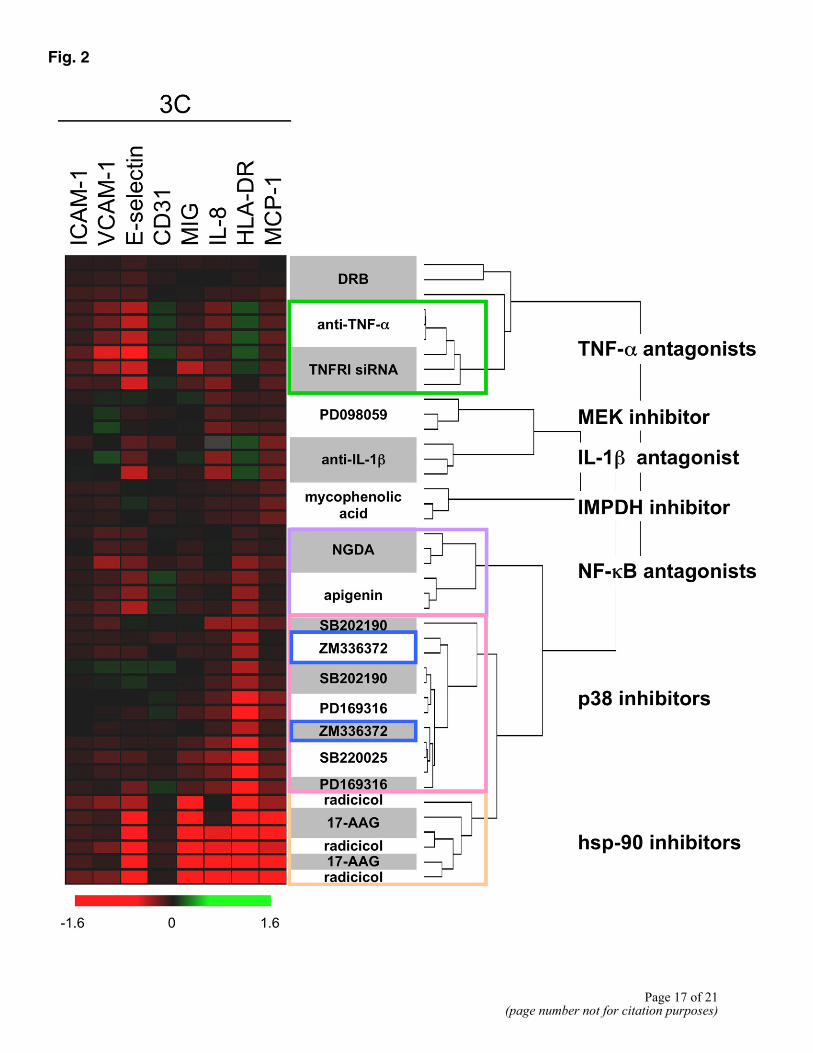
Fig. 2
Page 17 of 21(page number not for citation purposes)
Figure 2. Classification of compounds by mechanism class in the 3C system. Endothelial cell assays were performed as in Figure 1 in the presence of the indicated compounds. On the left is a heat map illustrating log parameter expression ratio data from individual experiments, showing the increase (green), decrease (red), or lack of change (black) of individual parameter levels. Color saturation reflects the magnitude of the drug effect (see scale, bottom). On the right, a dendrogram shows the results of nonsupervised hierarchical clustering of the log expression ratio profiles for each compound and experiment, using the Pearson correlation coefficient as the clustering metric. Compounds with similar classes (see Table 1) are shown by colored boxes. Known off-target activity of the Raf1 inhibitor (ZM336372; blue boxes) shown by clustering with p38 MAPK inhibitors.
Page 18 of 21(page number not for citation purposes)
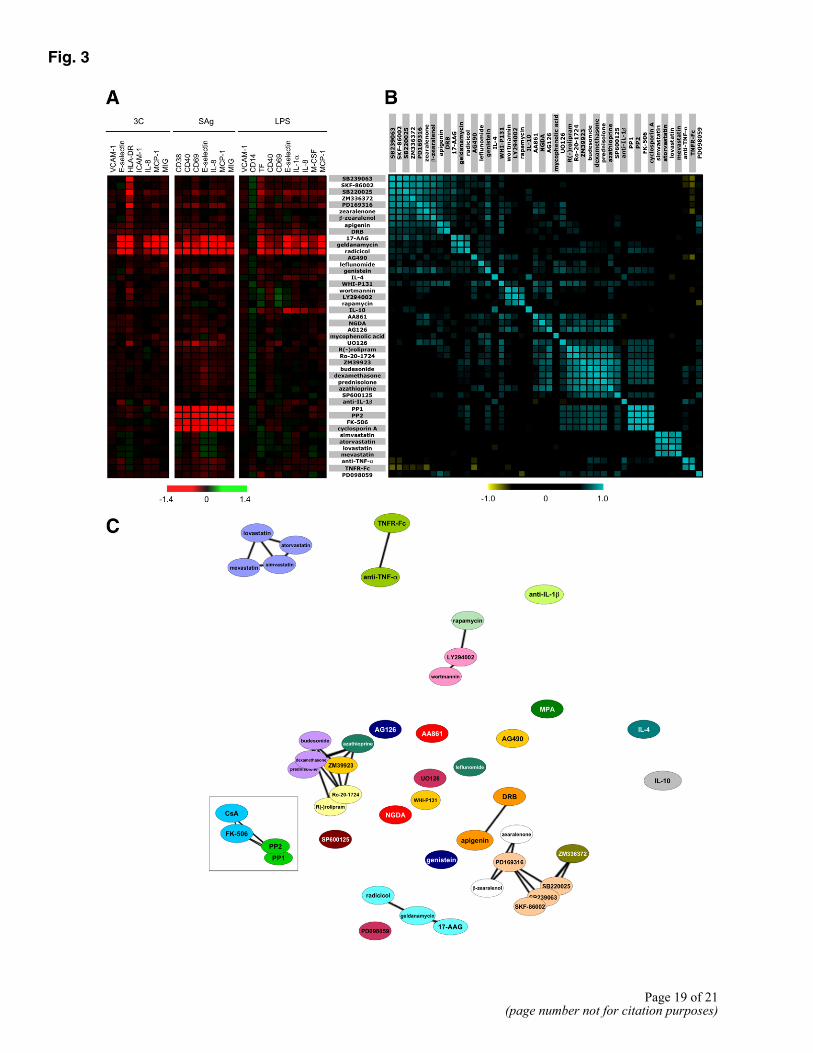
Fig. 3
Page 19 of 21(page number not for citation purposes)
Figure 3. Multisystem analysis increases detection and discrimination of compounds. Forty-six compounds representing 24 distinct mechanism classes were tested in the 3C, SAg, and LPS systems, as described in Materials and Methods. A) Heat map of mean log parameter expression ratio data from three experiments (n=3 replicates in each experiment), showing the increase (green), decrease (red), or lack of change (black) of individual parameters for each condition. B) Pearson correlation values for pairwise comparisons of average profile data are shown: positive correlations are in blue (most intense for r>0.9); black is no correlation (r~0); and yellow indicates negative correlations. The list of compounds in A and B were ordered automatically by scaling and pivoting to move high correlations to the diagonal. C) A function similarity map is generated by subjecting the pairwise correlation data to multidimensional scaling. Significant correlations determined as described in Materials and Methods are shown by lines. The distance between compounds is inversely related to the similarity of the compound profiles. Compounds are color coded by reported class as listed in Table 1.
Page 20 of 21(page number not for citation purposes)
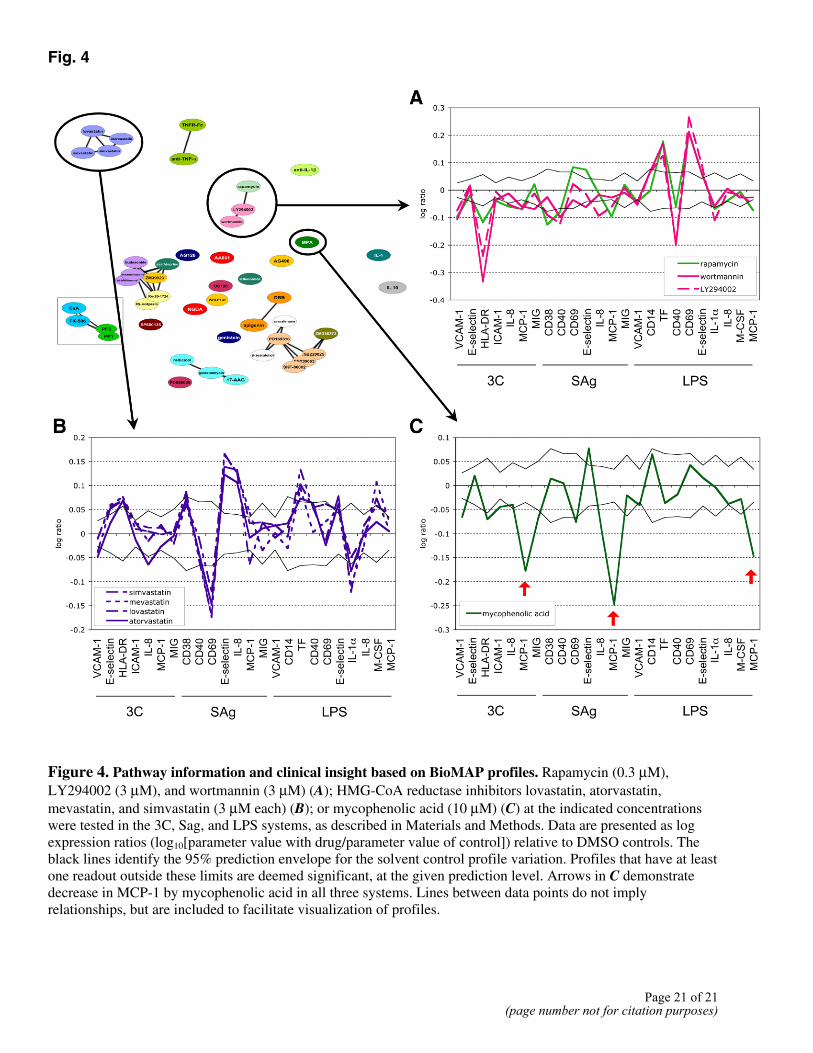
Fig. 4
Figure 4. Pathway information and clinical insight based on BioMAP profiles. Rapamycin (0.3 µM), LY294002 (3 µM), and wortmannin (3 µM) (A); HMG-CoA reductase inhibitors lovastatin, atorvastatin, mevastatin, and simvastatin (3 µM each) (B); or mycophenolic acid (10 µM) (C) at the indicated concentrations were tested in the 3C, Sag, and LPS systems, as described in Materials and Methods. Data are presented as log expression ratios (log10[parameter value with drug/parameter value of control]) relative to DMSO controls. The black lines identify the 95% prediction envelope for the solvent control profile variation. Profiles that have at least one readout outside these limits are deemed significant, at the given prediction level. Arrows in C demonstrate decrease in MCP-1 by mycophenolic acid in all three systems. Lines between data points do not imply relationships, but are included to facilitate visualization of profiles.
Page 21 of 21(page number not for citation purposes)