Agricultural Drought Indices - Proceedings of an Expert Meeting
Upload
independentCategory
view
1download
0
Journal of Database Management, 24(3), 31-50, July-September 2013 31
Copyright © 2013, IGI Global. Copying or distributing in print or electronic forms without written permission of IGI Global is prohibited.
ABSTRACTThe authors developed and evaluated an expert system-based training system using Information Systems Design Theory (ISDT). First, an Expert System for Training (EST) was designed and implemented, and then a version of EST without expertise features, called IST, was also created. In order to evaluate which training system (if any) delivers better training, a three-group quasi-experiment was used. Each group was trained to use Statistical Process Control (SPC). One group was trained using the EST; outcomes for this group were significantly the highest among the three. A second group was trained using the IST; outcomes were not as high as the first group but significantly higher compared with the control group. The control group was trained with traditional means. Results show that the ISDT led to a useful purposely-developed application for enhancing the training of workers who have limited education but need to know about a very specific and complex field where the availability of trainers is limited. The authors call for further research that uses this ISDT to build purposely-developed software to support training of complex tasks.
An Information Systems Design Theory for an Expert
System for TrainingJuan Manuel Gómez Reynoso, Autonomous University of Aguascalientes, Aguascalientes,
Mexico
Lorne Olfman, Claremont Graduate University, Claremont, CA, USA
Terry Ryan, Claremont Graduate University, Claremont, CA, USA
Tom Horan, Claremont Graduate University, Claremont, CA, USA
Keywords: Expert Systems, Information Systems Design Theory (ISDT), Information Systems Development, Statistical Process Control (SPC), Training
INTRODUCTION
This paper reports the development of an in-formation systems design theory (ISDT) for an expert system to support worker training. It describes design research that produced a
system to support the teaching of quality control concepts to workers who do not know these concepts. The motivation for this work came from small manufacturing companies in cen-tral Mexico that need to teach their employees statistical process control. They approached the
DOI: 10.4018/jdm.2013070103
Copyright © 2013, IGI Global. Copying or distributing in print or electronic forms without written permission of IGI Global is prohibited.
32 Journal of Database Management, 24(3), 31-50, July-September 2013
local university for assistance. As a first step, the first author of this paper devised standard training sessions without the aid of a training support system.
However, technology, including informa-tion technology (IT), has added new options to deliver training (Buch & Bartley, 2002). IT is used to build new tools and methods that share knowledge and learning (Kekäle, Pirolt, & Fal-ter, 2002). For example, production managers can use such tools for training the workforce before the production actually occurs, and consequently, make savings and reduce the time used in training. Marold (2002) believes that “the learning model of the 21st century uses the computer as the conduit of teaching and learning” (p. 114). Kekäle et al. (2002) argue that IT continues to produce new ways to help people learn.
Expert systems (ES) provide the means to create tools that are used for helping people solve problems. ES use artificial intelligence (AI) and are defined as computerized advisory programs that attempt to imitate the reasoning process of experts (Turban, 1995; Turban, McLean, & Wetherbe, 2001). Training represents one of the areas with the most significant payoff in using AI (Herrod & Papas, 1989). ES help to focus the instructional development efforts on knowledge rather than procedures and to develop solutions to increasingly complex problems (Grabinger, Wilson, & Jonassen, 1990). An ES is one of the best tools to train people in quality systems (e.g., ISO 9000) (Chang, Tsang, & Yeung, 1993).
As a result, we decided to use design re-search to develop an information systems design theory (ISDT), including an ES instance, to support statistical process control (SPC) train-ing. The next section of this paper describes the ISDT using the components suggested by Gregor and Jones (2007). Next, we explain the process we used to build the training systems (IST, EST), and the process we used to evaluate these systems. These sections are followed by a discussion and concluding remarks.
INFORMATION SYSTEMS DESIGN THEORY
Building on the work by Walls, Widmeyer, and El Sawy (1992, 2004), Gregor and Jones (2007, p. 329) note that their purpose “was to delineate the possible components of a design theory for IS, providing an ontological language for discussion of these theories.” They suggested eight components which we describe in the following subsections.
Purpose and Scope
When an organization has need for very domain-specific software, it is generally not available in the market. Thus, it can become necessary to develop new software that addresses these special needs. This software can be referred to as “purposely-developed”. A few years ago, a number of small manufacturing businesses in the State of Aquascalientes, Mexico identified a need to improve their workers’ ability to recognize defective products that they were manufacturing. With the help of the State employment agency and the Autonomous Uni-versity of Aguascalientes, training in Statistical Process Control was offered. Although the training was successful, it was observed by the instructors that it should be possible to build an Expert System that could improve the quality of training because an ES could provide the trainees with advice as to the likelihood that a pattern of defective items was “out of limits”. We decided to create a purposely-developed ES that would be part of a class of information systems that could be used for similar training contexts.
Constructs
The constructs for this research are expert systems (ES), X -R charts, and training. ES provide the means to create tools that are used for helping people solve problems. ES use ar-

Copyright © 2013, IGI Global. Copying or distributing in print or electronic forms without written permission of IGI Global is prohibited.
Journal of Database Management, 24(3), 31-50, July-September 2013 33
tificial intelligence (AI) and are defined as computerized advisory programs that attempt to imitate the reasoning process of experts (Turban, 1995; Turban et al., 2001). ES can focus instructional development efforts on knowledge rather than procedures and develop solutions to increasingly complex problems (Grabinger et al., 1990). Chang et al. (1993) argue that an ES is one of the best tools to train people in quality systems (e.g., ISO 9000). Training represents one of the areas with the most significant payoff in using AI (Herrod & Papas, 1989).
Training delivers new knowledge/skills to people. Training is accomplished by giving lectures as well as facilitating practice. Some of the problems that organizations have in train-ing efforts are, among others, loss of transfer that results from the lack of use (Tyler, 2000), employees forget many of the details that they were taught (Buick, 1997), inadequate education (Cheng, 2002; Mason, 2000), economic issues (Irish, 1995), time constraints (Desai, Richards, & Eddy, 1999; Mazier, 2002), and knowledge and expertise availability (Nelson, 2002). Some issues are magnified when training deals with complex tasks. Researchers argue that one issue in training is the scarcity of training materials and the availability of methods to accomplish its main goal (Hsu, 2002; Huang, 2002). Desai et al. (1999) believe that effective training and development strategies are a necessary and important investment for management. Train-ing investments have experienced a dramatic growth over time (Montesino, 2002). Brown (2001) states that computer technology helps to reduce the cost of training. Thus, it is very important to increase training efficiency and to reduce its associated cost.
Quality has become one of the most impor-tant aspects in consumer decisions in the selec-tion of products and/or services (Montgomery, 2001). Quality plays a very important role in organizations (Antony, Balbotin, & Taner, 2000; Mason, 2000; Yi, Shin, Cho, & Kim, 2002). Quality is measured through two different ap-proaches: inspection and prevention (Mason, 2000; Montgomery, 2001). Quality control ef-
forts have been focused on inspection of finished products (after-production inspection). Finished products are inspected by any of a variety of plans. Inspection tests the final product quality. It does not inform operators why an error has occurred and what corrective action(s) must be taken to eliminate the error (Mason, 2000). Yet prevention is performed during the operation stage. Prevention monitors, controls, analyzes and improves process performance by system-atically eliminating causes of variation (Mason, 2000). Berger and Hart (1986) stated that the way quality control is approached presents two glaring deficiencies: first, no inspection plan for verifying finished products will catch all the rejects; second, when an inspected product is detected with bad quality, the damage is already done. Thus, money has already been lost due to bad production.
Industries use several techniques for quality control purposes. SPC is one of those techniques and has been widely used (Berger & Hart, 1986; Gaafar, 1992). It is one of the most effective tools of total quality management and its main function is to monitor and minimize process variations (Antony, 2000; Antony et al., 2000; Guh, 2003; Mason, 2000; Noffsinger, 2002). SPC’s focus is on producing parts with the smallest possible variation from standards (Noffsinger, 2002). Typically, “SPC applica-tions involve three major tasks in sequence: 1) monitoring the process, 2) diagnosing the deviated process, and 3) taking corrective ac-tion” (Guh, 2003, p. 1). SPC is very simple to apply but the mathematics and statistics required make SPC very difficult to understand by the workforce, not just because of complexity, but because frequently the workforce lacks the knowledge, skills, and experience needed in those disciplines.
X -R charts are the main element of SPC (Gaafar, 1992; Montgomery, 2001). A process is considered to be under control if assignable or special causes of variation are not present in the process (Antony et al., 2000). For example, a manufacturing process is under control when all the points on chart X and chart R are plot-ted in a normal distribution manner, which
Copyright © 2013, IGI Global. Copying or distributing in print or electronic forms without written permission of IGI Global is prohibited.
34 Journal of Database Management, 24(3), 31-50, July-September 2013
means they are anomaly-free. Thus, if any pat-tern occurs in those charts, something wrong is happening in the process and corrective ac-tions must be taken.
The main value of using an expert system to supplement instruction on SPC, including analysis of X -R charts is that the ES can make an inference about the patterns in this data and inform trainees so that they can more readily understand such patterns. SPC deals with some statistical and mathematical concepts, pattern recognition, and the corresponding corrective action. For example, in order to identify whether a sample is anomaly free, it is neces-sary to construct a histogram. This histogram has to be compared to a normal distribution. If the histogram does not behave like a normal distribution, then, it is imperative to identify which anomalies are present in the sample.
Principles of Form and Function
Past research on training identified a set of is-sues that have to be addressed. Among those issues are: scarcity of training materials (Hsu,
2002; Huang, 2002), learning by doing is very important for trainees (Oldfield, 2004), training costs (Bowman, Grupe, & Simkin, 1995; Irish, 1995), trainees forget what they learn during training (Buick, 1997), inadequate education (Cheng, 2002; Mason, 2000), time constraints (Desai et al., 1999; Mazier, 2002), and expertise availability (Nelson, 2002). These issues can be addressed by creating a tool that is combined with a training strategy. Thus, a training tool that includes a set of attributes that addresses these issues stands a good chance of being successful. Table 1 lists the identified issues and which attributes of the EST address them. Additional key factors relating to requirements are described below.
Build Algorithms of a Set of Anomalies Using “If-Then” Rules
The manufacturing industry identifies several unwanted patterns for quality control purposes. These patterns should be analyzed when prod-ucts are being manufactured. A successful EST cannot be developed without the algorithms to
Table 1. Requirements identified from the framework of training
Issue Attribute
Scarcity of training materials • Include the notes for the training course in electronic format • Allow trainees to create as many examples as they want
Learning by doing
• An easy to use interface that allows trainees to explore as many scenarios as they want, with a data sample • An interface that shows how the distribution changes as a data sample is manipulated
Training costs• Make the system always available so as to reduce the need for additional tutoring and related fees • Do not restrict the number of persons that can be trained with the system
Trainees forget what have been taught• Allow trainees to store their own examples • Trainees can reinforce their knowledge as many times as they want by reviewing their examples
Time constraints• System must be developed in a platform most likely to exist in any training place and/or home so that the system always will be available to be used
Expertise availability
• Include a knowledge base that identifies unwanted patterns in data samples • Include an inference engine that searches data samples for unwanted patterns • Include help about how to use the system in electronic format

Copyright © 2013, IGI Global. Copying or distributing in print or electronic forms without written permission of IGI Global is prohibited.
Journal of Database Management, 24(3), 31-50, July-September 2013 35
detect these patterns. Such algorithms represent the knowledge base that should be included in the EST, and they are responsible for analyzing a set of data and for providing results to trainees.
Increase the Number of Examples That Can Be Solved During the Training Sessions
It is very important to connect theory to practice (van Delft, 2001). In the case of training, this connection is through the solution of potential cases or scenarios. A training software tool should allow trainees to create their own ex-amples, and not just review an established pool of exercises. Although the pool of exercises can be big, it can still be limited. Taking this into account, the following attributes were identified as critical for the EST:
• Allow the creation of examples by interact-ing with the system through a GUI;
• Give the option of storing examples into the pool of exercises;
• Allow the modification of an example so that trainees explore different options with the same data sample.
Interpret X -R Charts
An EST should be able to uncover unwanted patterns in a data sample. This is the main goal of analyzing X -R charts. It is very important that the EST not only analyzes data but also makes an inference about the patterns in this data. This is a critical attribute for the EST: after analyzing data, the system must make an interpretation of a data sample in order to inform trainees.
Identify and Illustrate Where the Anomalies (If Any) are Located
After analyzing data it is extremely important to inform trainees about the actual state of a data sample. Such feedback allows trainees to visually identify what is happening and associate
this chart with its corresponding description. For example, if a particular data set has an anomaly, the anomaly has to be identified by the system. Then, the system must show graphically which points in the sample are contributing to the anomaly. Also, the system must inform trainees what type of anomaly is present. This leads to the following critical attributes:
• Create a plot of the data sample before it has been analyzed;
• If an anomaly is present, modify the plot so that the points that are contributing to a particular anomaly are perfectly distin-guishable from the rest;
• Inform the trainee about the result of the analysis in textual form;
• Show graphically the distribution of a particular data set;
• Each time that any point is modified, modify the plot of the distribution.
Artifact Mutability
The artifact that can be developed from the ISDT is designed to supplement training of workers with very basic knowledge of mathematics and statistics and who work in small manufacturing companies. Their task is to apply SPC methods, and the goal of the system is to assist them in learning how to recognize anomalies in their production lines. The artifact can be modified to support different kinds of workers in differ-ent kinds of organizations. A very important aspect is the fact that not all organizations use the same set of nonconformities for qual-ity control purposes. The artifact allows each organization to manage the set of rules. Thus, it can be used to train a wide variety of people. For example, the car industry requires that almost all the components (e.g., a carburetor screw) must have a specific length; the artifact can be used to train people to take care of this quality issue. In a frozen produce company the size of each piece is not important, but the mixture for filling the bag is, and in this case
Copyright © 2013, IGI Global. Copying or distributing in print or electronic forms without written permission of IGI Global is prohibited.
36 Journal of Database Management, 24(3), 31-50, July-September 2013
workers can be trained to detect the presence of an adequate mixture. In addition, it is possible to teach students the principles of the normal distribution in a classroom.
Testable Propositions
The value of the ISDT can be determined by creating a prototype system and evaluating if it works better than some other system or method. With respect to training workers to use SPC, it is possible to do so without a system. Therefore, one testable proposition (H1) is that a training support system can enhance the outcomes of training. However, we also propose that a training support system (which we call IST) is not enough; it has to include an Expert System component – we call that version EST. Thus we propose that the EST will work better than the IST (H2):
H1: Training outcomes are equal or better with purposely-developed tools than using traditional means;
H2: Assuming H1 is true, using EST versus IST to train members of the workforce increases training effectiveness.
Justificatory Knowledge
Artifact creation relies on existing kernel theories that are applied, tested, modified, and extended through experience, creativity, intuition, and problem solving capabilities of the researcher (Hevner, March, & Park, 2004; Markus, 2002; Walls, Widmeyer, & El Sawy, 1992). The key kernel theory for this research is Statistical Process Control, which we defined previously. Guh (2003) developed an Architec-ture for an Assignable Cause Interpreter (ACI) that outlines how artificial intelligence can be used to diagnose and take corrective action for a deviated process.
Principles of Implementation
Object oriented techniques can link the design theory to an instance so that an object-oriented
design methodology is the best suitable ap-proach. Therefore, the Unified Modeling Language (UML) was used to identify all the potential elements of the expert system. Because a series of prototypes must be constructed, an incremental prototyping approach was used. Details of the implementation process that led to the creation of the Expert System for Training (EST) are described in the next major section of this paper.
Expository Instantiation
The Expert System for Training was the proto-type artifact produced to instantiate the ISDT described above. The details of the artifact and an evaluation of its effectiveness are described in the following sections of this paper.
DEVELOPMENT OF THE EXPERT SYSTEM FOR TRAINING (EST)
The EST was developed using a prototyping approach as suggested by Nunamaker (1992). Versions of the EST were created through in-cremental prototyping. Four persons tested the different prototypes, which were developed by the first author. These evaluators had been devel-oping information systems for about three years on average. In addition, they had experience in maintaining software, and had knowledge of three different systems analysis and design ap-proaches (object oriented, structured, and rapid application development) and two operating systems (Windows and UNIX). Testing was conducted using an unstructured approach. That is, requirements were collected through informal individual interviews, however records were not kept. New requirements and observations made by evaluators of a current prototype were addressed in a new prototype, which, in turn, was evaluated by the same testers.
After several prototypes had been con-structed, a usability test and a pilot test were conducted with different evaluators in order to create the final prototype. These evaluators had

Copyright © 2013, IGI Global. Copying or distributing in print or electronic forms without written permission of IGI Global is prohibited.
Journal of Database Management, 24(3), 31-50, July-September 2013 37
the same demographic characteristics as the subjects who were recruited for the prototype test portion. The two tests led to the develop-ment of the final version of the EST as well as the IST.
Software Elements for the Research
The research goal was to test the effectiveness of training using an EST in a complex task: Interpretation of X -R charts (part of SPC) for industrial processes. The task is more complex than learning how to use Microsoft Word, Microsoft Excel, or email, which have been used in previous training system studies (Bow-man et al., 1995; Desai, Richards, & Eddy, 2000). Complexity comes from the fact that SPC deals with some statistical and mathemat-ical concepts, pattern recognition, and the corresponding corrective action. Thus, knowl-edge about SPC demands expertise in these issues. Such functionality can be incorporated into an EST. The EST’s knowledge base includes the rules of the statistics and mathematics needed and the heuristics for pattern recogni-tion. The EST’s interface can plot the X -R charts and how a data sample is distributed. When the sample has anomalies, the EST can highlight them in the plots. In addition, as the EST applies the rules and identifies X -R anomalies (patterns) present in the sample, it can help to learn how to identify such a problem. Thus, an ES that performs pattern recognition and identifies where in the sample the anoma-ly is present (in a visual way using a GUI) was developed for the present study.
As mentioned before, several prototypes were developed. For each prototype changes were made based on evaluators’ suggestions until a complete and adequate prototype was produced. Note that the IST is a fully functional previous prototype of the EST (as per step 5 below). The IST does not include ES techniques so it cannot make sensitive data analysis. Thus, trainees using this version cannot benefit from using this feature.
Thus the set of prototypes for the EST were developed as follows:
1. Code the set of GUIs;2. Add the electronic documents and func-
tionality for the “SPC Generalities”;3. Add the electronic documents and func-
tionality for the “Review Topics”;4. Add the online help for the “How to use
the system” component;5. Add the functionality for “Reviewing
Examples” of data samples. The prototype developed up to this point was used as the IST;
6. Add the AI features for pattern recognition and the functionality for the “Construct Examples” module. This constituted the final prototype for the EST.
It is extremely important that the EST be easy-to-use. Past research states that usability is a software quality measure (Nakamichi, Shima, Sakai, & Matsumoto, 2006; Seffah & Andreevskaia, 2003). A well-designed interface can give the trainee a much clearer overall picture of the system (Hayes, 1999; Vokurka, Flores, & Pearce, 1996). A GUI can be tailored so that trainees only point-and-click and drag-and-drop while using the EST. Further, using a GUI minimizes the dialogue between the EST and trainees, and can reduce the effort needed to train the trainees in the use of the EST.
Usability Test
Usability may be detected through quantitative data about a user’s behavior and can be used for discovering problems based on operation of the application by subjects (Nakamichi et al., 2006). A usability test was conducted using a structured approach after the final prototypes were completed in order to assess whether trainees would be able to use the EST and the IST easily. Subjects were asked to use the EST1 for three hours. They completed pre-test and posttest questionnaires. The questionnaires had two sections. Section 1 was completed before
Copyright © 2013, IGI Global. Copying or distributing in print or electronic forms without written permission of IGI Global is prohibited.
38 Journal of Database Management, 24(3), 31-50, July-September 2013
the test, and section 2 after subjects made use of the system. Questionnaires were developed using suggestions from the literature (Dumas & Redish, 1999) as well as some items from a previously published usability test2. Open-ended questions were added to collect evalu-ators’ recommendations of new features and improvements for the artifact.
Evaluators were invited based on two criteria: first, they were working in software development-related jobs; and second, they had some knowledge of SPC. Twenty-seven students in the ninth semester of the Computer Science bachelor program in the Autonomous University of Aguascalientes (UAA) were in-vited to participate as usability testers3. They were invited because, in a previous statistics course, they were taught SPC and they held a software development-related job. Nineteen of them participated in the test, which represents a 70.37% response ratio.
The tests were conducted with all par-ticipants at the same time in the same com-puter laboratory. All computers had exactly the same technological characteristics in order to eliminate any problems related to hardware specifications.
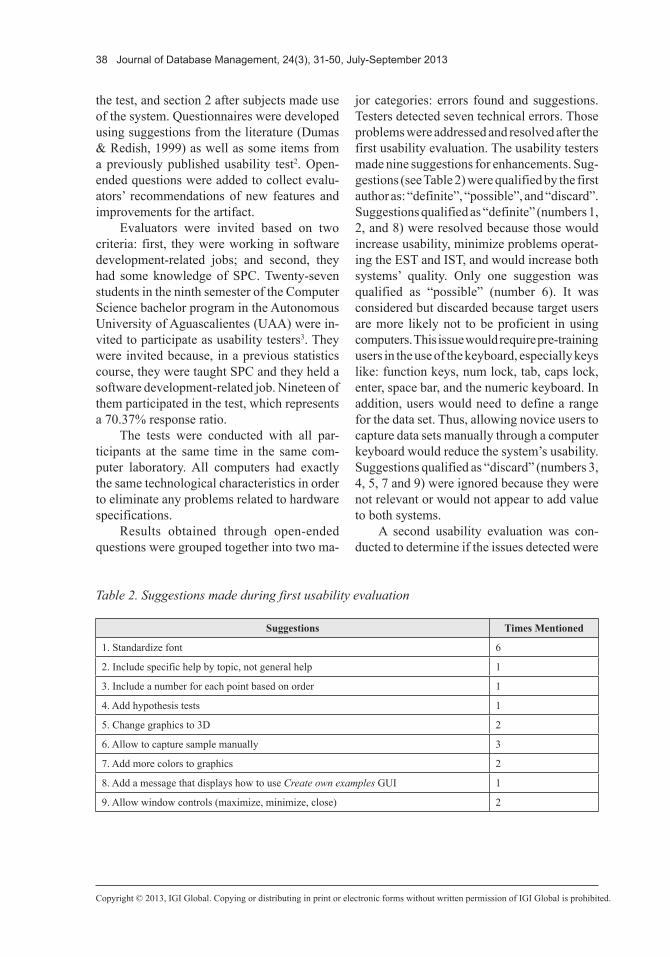
Results obtained through open-ended questions were grouped together into two ma-
jor categories: errors found and suggestions. Testers detected seven technical errors. Those problems were addressed and resolved after the first usability evaluation. The usability testers made nine suggestions for enhancements. Sug-gestions (see Table 2) were qualified by the first author as: “definite”, “possible”, and “discard”. Suggestions qualified as “definite” (numbers 1, 2, and 8) were resolved because those would increase usability, minimize problems operat-ing the EST and IST, and would increase both systems’ quality. Only one suggestion was qualified as “possible” (number 6). It was considered but discarded because target users are more likely not to be proficient in using computers. This issue would require pre-training users in the use of the keyboard, especially keys like: function keys, num lock, tab, caps lock, enter, space bar, and the numeric keyboard. In addition, users would need to define a range for the data set. Thus, allowing novice users to capture data sets manually through a computer keyboard would reduce the system’s usability. Suggestions qualified as “discard” (numbers 3, 4, 5, 7 and 9) were ignored because they were not relevant or would not appear to add value to both systems.
A second usability evaluation was con-ducted to determine if the issues detected were
Table 2. Suggestions made during first usability evaluation
Suggestions Times Mentioned
1. Standardize font 6
2. Include specific help by topic, not general help 1
3. Include a number for each point based on order 1
4. Add hypothesis tests 1
5. Change graphics to 3D 2
6. Allow to capture sample manually 3
7. Add more colors to graphics 2
8. Add a message that displays how to use Create own examples GUI 1
9. Allow window controls (maximize, minimize, close) 2
Copyright © 2013, IGI Global. Copying or distributing in print or electronic forms without written permission of IGI Global is prohibited.
Journal of Database Management, 24(3), 31-50, July-September 2013 39
resolved. Testers were those from the first usability evaluation, which increased system evaluation reliability and helped to strengthen results. Results from the second usability evalu-ation showed less dispersion than from the first. In all cases, reductions in means as well as standard deviations were observed.
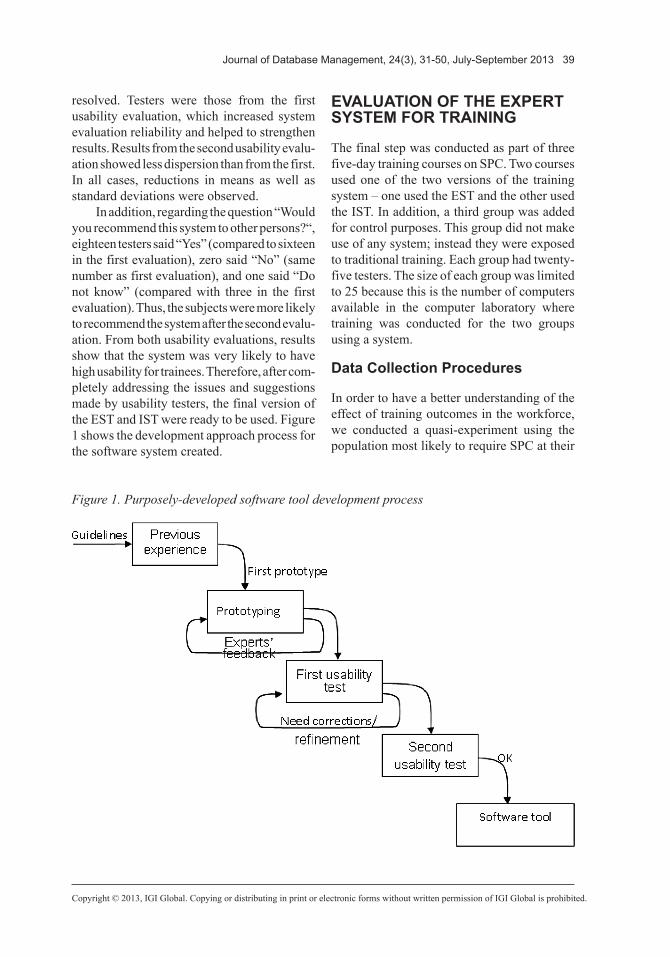
In addition, regarding the question “Would you recommend this system to other persons?“, eighteen testers said “Yes” (compared to sixteen in the first evaluation), zero said “No” (same number as first evaluation), and one said “Do not know” (compared with three in the first evaluation). Thus, the subjects were more likely to recommend the system after the second evalu-ation. From both usability evaluations, results show that the system was very likely to have high usability for trainees. Therefore, after com-pletely addressing the issues and suggestions made by usability testers, the final version of the EST and IST were ready to be used. Figure 1 shows the development approach process for the software system created.
EVALUATION OF THE EXPERT SYSTEM FOR TRAINING
The final step was conducted as part of three five-day training courses on SPC. Two courses used one of the two versions of the training system – one used the EST and the other used the IST. In addition, a third group was added for control purposes. This group did not make use of any system; instead they were exposed to traditional training. Each group had twenty-five testers. The size of each group was limited to 25 because this is the number of computers available in the computer laboratory where training was conducted for the two groups using a system.
Data Collection Procedures
In order to have a better understanding of the effect of training outcomes in the workforce, we conducted a quasi-experiment using the population most likely to require SPC at their
Figure 1. Purposely-developed software tool development process

Copyright © 2013, IGI Global. Copying or distributing in print or electronic forms without written permission of IGI Global is prohibited.
40 Journal of Database Management, 24(3), 31-50, July-September 2013
workplace: adults that have not been previ-ously trained to use SPC. These individuals may be employed or looking for work in manufacturing companies. The study only in-cluded people who were required by their employers or who wanted to learn the interpre-tation of X -R charts.
Several companies in Aguascalientes, Mexico manufacture products such as: mi-crochips, frozen produce, rotational modeling polyethylene containers, and auto parts. All of these companies have quality control techniques in place. Several were invited to participate in the study through four organizations that have relations with them. These organizations are: Consejo de Ciencia y Tecnología del Estado de Aguascalientes4, Servicio Estatal de Empleo5, Instituto de Capacitación para el Trabajador del Estado de Aguascalientes6 and the UAA. An invitation that included a description of the purpose, contents and objectives of the course on SPC7 and necessary characteristics of par-ticipants was sent to these four organizations so that they invited only those businesses that could offer participants that met the criteria. Participants included only adults with similar levels of education and work experience. Ad-ditional information was provided through telephone and face-to-face discussions in order to answer questions and explain issues related to training courses. Each organization invited only persons that most likely would need SPC in their future jobs.
Each group had five training sessions about SPC using different training tools. Only one
instructor (the first author) was used for the study in order to control the effects of teaching styles and to avoid compensatory coaching for any group. The three groups received the same printed notes for the course. In addition, one group (ESTG) used EST, while the second group (ISTG) used IST; the third group (NOSG) was trained using traditional means – a blackboard, markers, etc. Sessions were organized into three parts. In the first part, trainees in the ESTG and ISTG groups were told to review instructions provided online and on paper, while the NOSG group was given a lecture. In the second part, example case solutions were presented by the instructor, and in the final part trainees were asked to explore their own data sets, which were collected on paper (ISTG and NOSG) or in text files (ESTG) by the instructor. At the end of the day, the instructor examined the trainees’ solved examples to assess their motivation to learn. In all three groups trainees’ results demonstrated a high level of motivation. Performance of the three experimental groups was compared in or-der to assess which group had the best learning. Table 3 shows the similarities and differences between training courses.
The study measured the effectiveness of training (the dependent variable) by giving an exam at the end of the training course. The exam was designed by independent sources (two lecturers that who did not participate in any stage of the study). In addition, the three groups were given the same exam. The three training courses were conducted as follows, on a daily basis, for five consecutive days:
Table 3. Summary of differences and similarities in training courses
FeatureCourse Tool(s) used Topics were
presented by
Materials given to trainees
Self-created examples
How trainees progress was assessed
ESTG EST Self-study Course notes
Collected in text files
Through reviewing text files created through the EST
ISTG IST Self-study Course notes
Collected on paper
Through reviewing examples written on paper
NOSG Blackboard and markers
Lecture Course notes
Collected on paper
Through reviewing examples written on paper
Copyright © 2013, IGI Global. Copying or distributing in print or electronic forms without written permission of IGI Global is prohibited.
Journal of Database Management, 24(3), 31-50, July-September 2013 41
• The ESTG group made use of the EST, which is the final prototype of the developed training tool. For this group, the instructor functioned as a consultant: only answering questions but not lecturing at all. The EST allows trainees to review stored examples, create their own examples, analyze ex-amples (either stored or created), review electronic notes of the course, and store created examples. In addition, EST uses ES techniques to detect when an anomaly is present in a data set. The ESTG group received a package with the notes for the course. During the first session, participants first received a 15-minute demonstration about how to use the system. Subsequent sessions began with a brief introduction to the topic of the day. Then, participants read that part of the material but did not receive a lecture. In the next activity, the group solved a set of ten examples previ-ously prepared by the instructor and some examples proposed by participants. After that, trainees were allowed to create and solve their own examples. Examples were plotted and saved as text files using the EST. Each participant was required to plot and save at least ten examples. Every day the instructor retrieved and reviewed all text files to verify whether participants were engaged in building their own examples;
• The ISTG group made use of the IST. For this group, the instructor functioned as a consultant: only answering questions but not lecturing. The IST allows trainees to review stored examples, create their own examples, perform data analysis, and re-view the electronic notes for the course. This version does not have ES techniques to detect anomalies in data samples, but in-stead only makes a straightforward analysis of a data set. This version of the training system only identifies when an anomaly is present. The ISTG group received a pack-age with the notes for the course. During the first session, participants first received a 15-minute demonstration about how to
use the system. Subsequent sessions began with a brief introduction to the topic of the day. Then, participants read that part of the material but did not receive a lecture. In the next activity, the group solved a set of ten examples previously prepared by the researcher and some examples proposed by participants. After that, trainees were allowed to create and solve their own ex-amples. Examples were plotted and solved in the system. Subjects determined if a chart was normal or abnormal; subjects identified anomalies that may have been present and which points contributed to the anomaly. They transcribed these analyses on paper sheets previously prepared by the researcher. Each participant was required to plot and save at least ten examples. Every day the instructor reviewed all paper sheets to verify whether participants were engaged in building their own examples;
• The NOSG group was given traditional training. For this group, the instructor functioned in the traditional role as lecturer. That is, the subjects did not use any type of training system. They received a pack-age with the notes for the course. During each session participants were lectured on the topic of the day. In the next activity, the group solved a set of ten examples previously prepared by the instructor and some examples proposed by participants. After that, trainees were allowed to create and solve their own examples. Examples were plotted and solved by hand. Sub-jects determined if a chart was normal or abnormal; they identified anomalies that may have been present and which points contributed to the anomaly. They transcribed these analyses on paper sheets previously prepared by the instructor. Each participant was required to plot and write at least ten examples. Every day the instructor reviewed all paper sheets to verify whether participants were engaged in building their own examples.
Copyright © 2013, IGI Global. Copying or distributing in print or electronic forms without written permission of IGI Global is prohibited.
42 Journal of Database Management, 24(3), 31-50, July-September 2013
Each course was offered during the same one week time frame (mornings on weekdays) over three consecutive weeks. ISTG was offered the first week, ESTG was offered the second week, and NOSG the third week. Participants were free to enroll in any of the three courses. Enrollment was conducted on a first come first served basis. After enrollment was completed, the type of training (EST, IST, traditional) was randomly assigned to each course.
The EST and IST courses were offered in the same computer laboratory at UAA so that any issues related with technology differences were removed. The traditional training course was offered in a classroom at the same University’s facilities. Each subject was asked to sign a letter of consent stating that his/her participation in the study was voluntary. Subjects could drop out of the study at any time they wished. Demographic data about each participant was collected at the beginning of the quasi-experiment.
The first author created a total of eighty cases for training purposes. A pool of thirty cases was included as text files into both versions of the developed artifacts – EST and IST. In ad-dition, a pool of fifty more cases was prepared for use during training sessions. Five sets of ten of the cases were used in each of the training sessions. Some cases included one or more anomalies, and some cases were anomaly-free. All anomalies that the systems can handle were present in the set of designed cases.
In order to assess whether participants were engaged in the learning process, the instructor reviewed participants’ self-created examples. Based on these examples, it was very clear that all of them wanted to learn. No single participant failed to deliver his/her set of ten examples every day. Thus, it can be said that they were engaged in the training process. In addition, self-created examples were increasing in complexity. That is, the first examples were very simple and most of them only included a single anomaly. However, as participants advanced through the training sessions, they created examples in which two or more anomalies were plotted.
At the end of the fifth session for each group, an exam was administrated to partici-
pants to measure learning in the training ses-sions. The exam consisted of a set of fifteen exercises. Some exercises contained anomalies and some did not. Each exercise was graded in two parts depending on the type of exercise. Correct anomaly identification is composed by two actions: first, identify correctly an anomaly; second, distinguish the points that are contrib-uting to that anomaly. Thus, an exercise with anomalies was graded as follows: a point was awarded when a participant correctly identified a particular anomaly (part one) and a point was awarded when a participant correctly marked the points that contributed to the anomaly identified. An exercise without anomalies was graded as follows: a point was awarded when a participant correctly identified the chart as anomaly-free (part one). Only one point was awarded because if participants were guessing, then they were failing in the two required actions mentioned before. Thus, they were losing two points, not gaining one.
At the end of the quasi-experiment, a ques-tionnaire was given to participants in order to measure other outcomes of the training program.
Comparison of Performance Among the Groups
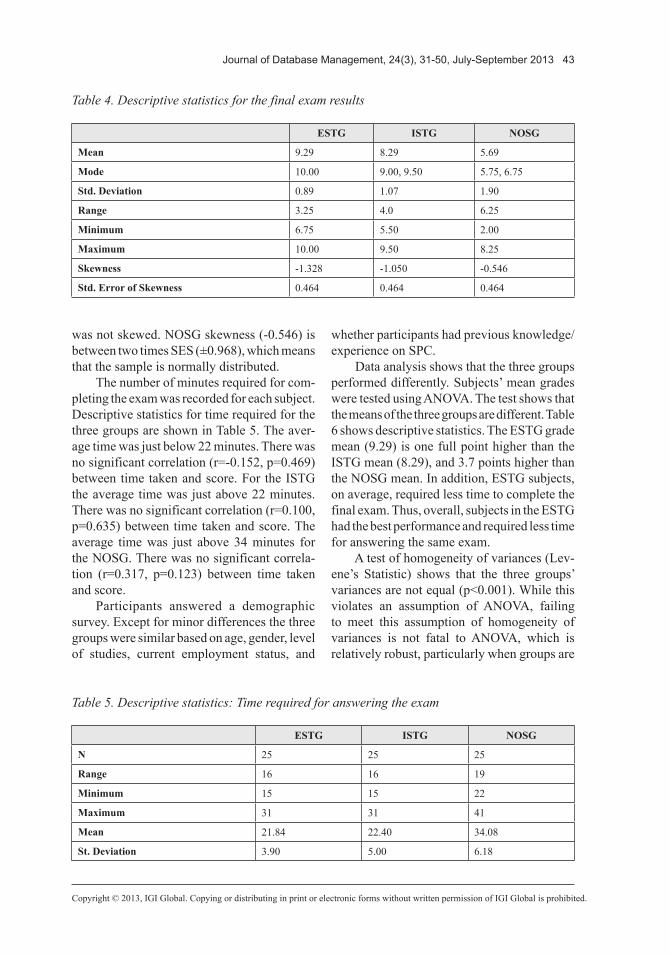
No participants dropped the courses. Hence, all of them completed all five sessions and wrote the final exam. Table 4 shows the descriptive statistics regarding final exam scores for the three groups. For the ESTG 11 of 25 subjects scored a perfect 10. Following the guidelines of Tabachnik and Fidell (1996), ESTG skewness (-1.328) is beyond two times the standard error of skewness (SES) (±0.968), which means that the sample is not normally distributed; it was negatively skewed.
In addition, the distribution for the ISTG group was not normal with 12 of 25 subjects scoring either a 9 or a 9.5. ISTG skewness (-1.050) is beyond two times SES (±0.968), which means that this sample is not normally distributed. It was negatively skewed but not as skewed as the first group (ESTG). Contrary to ESTG and ISTG groups, data for NOSG
Copyright © 2013, IGI Global. Copying or distributing in print or electronic forms without written permission of IGI Global is prohibited.
Journal of Database Management, 24(3), 31-50, July-September 2013 43
was not skewed. NOSG skewness (-0.546) is between two times SES (±0.968), which means that the sample is normally distributed.
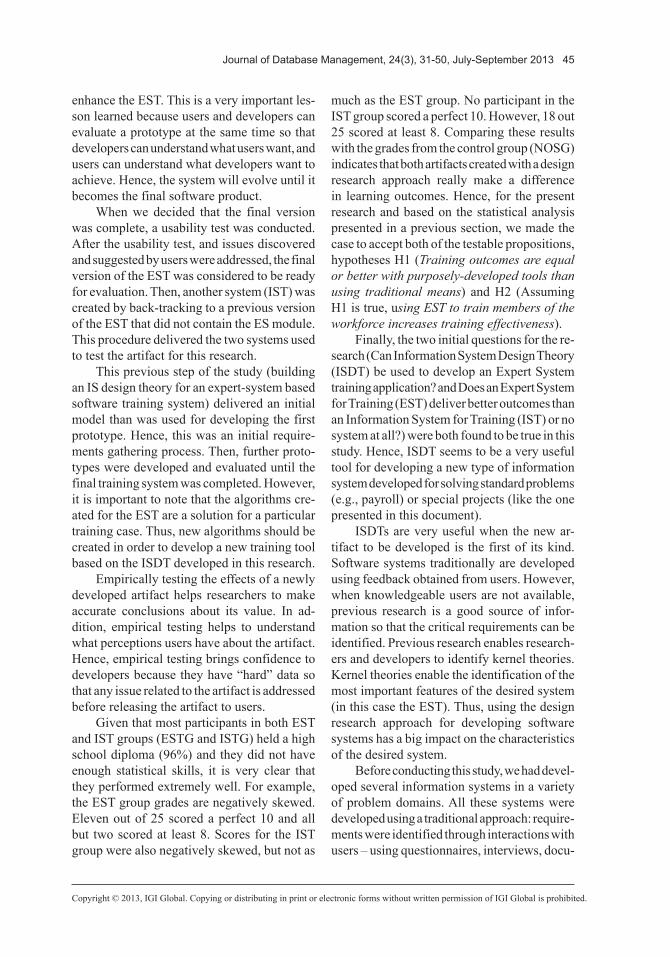
The number of minutes required for com-pleting the exam was recorded for each subject. Descriptive statistics for time required for the three groups are shown in Table 5. The aver-age time was just below 22 minutes. There was no significant correlation (r=-0.152, p=0.469) between time taken and score. For the ISTG the average time was just above 22 minutes. There was no significant correlation (r=0.100, p=0.635) between time taken and score. The average time was just above 34 minutes for the NOSG. There was no significant correla-tion (r=0.317, p=0.123) between time taken and score.
Participants answered a demographic survey. Except for minor differences the three groups were similar based on age, gender, level of studies, current employment status, and
whether participants had previous knowledge/experience on SPC.
Data analysis shows that the three groups performed differently. Subjects’ mean grades were tested using ANOVA. The test shows that the means of the three groups are different. Table 6 shows descriptive statistics. The ESTG grade mean (9.29) is one full point higher than the ISTG mean (8.29), and 3.7 points higher than the NOSG mean. In addition, ESTG subjects, on average, required less time to complete the final exam. Thus, overall, subjects in the ESTG had the best performance and required less time for answering the same exam.
A test of homogeneity of variances (Lev-ene’s Statistic) shows that the three groups’ variances are not equal (p<0.001). While this violates an assumption of ANOVA, failing to meet this assumption of homogeneity of variances is not fatal to ANOVA, which is relatively robust, particularly when groups are
Table 4. Descriptive statistics for the final exam results
ESTG ISTG NOSG
Mean 9.29 8.29 5.69
Mode 10.00 9.00, 9.50 5.75, 6.75
Std. Deviation 0.89 1.07 1.90
Range 3.25 4.0 6.25
Minimum 6.75 5.50 2.00
Maximum 10.00 9.50 8.25
Skewness -1.328 -1.050 -0.546
Std. Error of Skewness 0.464 0.464 0.464
Table 5. Descriptive statistics: Time required for answering the exam
ESTG ISTG NOSG
N 25 25 25
Range 16 16 19
Minimum 15 15 22
Maximum 31 31 41
Mean 21.84 22.40 34.08
St. Deviation 3.90 5.00 6.18

Copyright © 2013, IGI Global. Copying or distributing in print or electronic forms without written permission of IGI Global is prohibited.
44 Journal of Database Management, 24(3), 31-50, July-September 2013
of equal sample size (Garson, 1998)8, which is the case of the study. Table 7 shows that the training method makes a difference in grade performance (p<0.001). It is important to con-trol the overall alpha error rate while testing each of the pairwise differences for statisti-cal significance. In order to do that a Tukey HSD and Ryan-Einot-Gabriel-Welsch Range (REGWQ) post hoc analysis were conducted. Post hoc analysis shows that all pairwise differ-ences were statistically significant: The ESTG had better performance than the other training approaches, and the ISTG’s performance was better than the NOSG.
As a backup, nonparametric tests, Kruskal-Wallis, Median, and the Dunn-Sidak paired t-test were also performed and results are highly significant. The ESTG had better outcomes than the ISTG (p<0.004) and the NOSG (p<0.001). The ISTG had better outcomes than the NOSG (p<0.001).
DISCUSSION AND CONCLUSION
Design research was chosen as the methodol-ogy for developing a new class of artifacts that
intends to train people with a low education level. We used ISDT to develop and evaluate a training artifact (EST). The EST is a training tool developed to train people that have a low education level currently working – or want-ing to work – in manufacturing organizations. The evaluation was conducted using a quasi-experiment and showed that trainees learned more by using the artifact than by using a limited training system or by using no system at all.
A major contribution of the present study was the development of a prototype of the Expert System for Training, a system type that did not exist at the outset of this research project. The EST is intended to train people with low educa-tion in a specific quality control technique used in manufacturing. The artifact was developed using a theory-driven prototyping approach. Several prototypes were constructed and evaluated using pre-solved examples and pre-designed errors. It was very useful to develop the artifact by prototyping because each version was tested so that errors and improvements were identified and addressed. After having a prototype with full functionality, further pro-totypes were tested by four lecturers that teach statistics. This process helped to improve and
Table 7. ANOVA table for comparison of training groups on grade
Sum of Squares df1 Mean Square F Significance
Between GroupsWithin GroupsTotal
172.667 132.705 305.372
2 72 74
86.333 1.843
46.841 .000
Table 6. Summary of descriptive statistics for grade
Group N Mean Std. Deviation
Std. Error
95% Confidence Interval for Mean
Minimum MaximumLower Bound
Upper Bound
1 25 9.29 .8859 .1772 8.9243 9.6557 6.75 10.00
2 25 8.29 1.0721 .2144 7.8475 8.7325 5.50 9.50
3 25 5.69 1.8961 .3792 4.9073 6.4727 2.00 8.25
Total 75 7.756 2.0314 .2346 7.2893 8.2241 2.00 10.00
Copyright © 2013, IGI Global. Copying or distributing in print or electronic forms without written permission of IGI Global is prohibited.
Journal of Database Management, 24(3), 31-50, July-September 2013 45
enhance the EST. This is a very important les-son learned because users and developers can evaluate a prototype at the same time so that developers can understand what users want, and users can understand what developers want to achieve. Hence, the system will evolve until it becomes the final software product.
When we decided that the final version was complete, a usability test was conducted. After the usability test, and issues discovered and suggested by users were addressed, the final version of the EST was considered to be ready for evaluation. Then, another system (IST) was created by back-tracking to a previous version of the EST that did not contain the ES module. This procedure delivered the two systems used to test the artifact for this research.
This previous step of the study (building an IS design theory for an expert-system based software training system) delivered an initial model than was used for developing the first prototype. Hence, this was an initial require-ments gathering process. Then, further proto-types were developed and evaluated until the final training system was completed. However, it is important to note that the algorithms cre-ated for the EST are a solution for a particular training case. Thus, new algorithms should be created in order to develop a new training tool based on the ISDT developed in this research.
Empirically testing the effects of a newly developed artifact helps researchers to make accurate conclusions about its value. In ad-dition, empirical testing helps to understand what perceptions users have about the artifact. Hence, empirical testing brings confidence to developers because they have “hard” data so that any issue related to the artifact is addressed before releasing the artifact to users.
Given that most participants in both EST and IST groups (ESTG and ISTG) held a high school diploma (96%) and they did not have enough statistical skills, it is very clear that they performed extremely well. For example, the EST group grades are negatively skewed. Eleven out of 25 scored a perfect 10 and all but two scored at least 8. Scores for the IST group were also negatively skewed, but not as
much as the EST group. No participant in the IST group scored a perfect 10. However, 18 out 25 scored at least 8. Comparing these results with the grades from the control group (NOSG) indicates that both artifacts created with a design research approach really make a difference in learning outcomes. Hence, for the present research and based on the statistical analysis presented in a previous section, we made the case to accept both of the testable propositions, hypotheses H1 (Training outcomes are equal or better with purposely-developed tools than using traditional means) and H2 (Assuming H1 is true, using EST to train members of the workforce increases training effectiveness).
Finally, the two initial questions for the re-search (Can Information System Design Theory (ISDT) be used to develop an Expert System training application? and Does an Expert System for Training (EST) deliver better outcomes than an Information System for Training (IST) or no system at all?) were both found to be true in this study. Hence, ISDT seems to be a very useful tool for developing a new type of information system developed for solving standard problems (e.g., payroll) or special projects (like the one presented in this document).
ISDTs are very useful when the new ar-tifact to be developed is the first of its kind. Software systems traditionally are developed using feedback obtained from users. However, when knowledgeable users are not available, previous research is a good source of infor-mation so that the critical requirements can be identified. Previous research enables research-ers and developers to identify kernel theories. Kernel theories enable the identification of the most important features of the desired system (in this case the EST). Thus, using the design research approach for developing software systems has a big impact on the characteristics of the desired system.
Before conducting this study, we had devel-oped several information systems in a variety of problem domains. All these systems were developed using a traditional approach: require-ments were identified through interactions with users – using questionnaires, interviews, docu-
Copyright © 2013, IGI Global. Copying or distributing in print or electronic forms without written permission of IGI Global is prohibited.
46 Journal of Database Management, 24(3), 31-50, July-September 2013
ment revisions, and observation. These systems were not developed using previous research, but were based on users’ needs and research-ers’ past experience, yet we found it difficult to match what users had in mind with what users really needed and with what we thought users required. Comparing the previous approach with the design research approach, we found that the design theory helped to create a first prototype where the main issues were already identified and addressed. It generally required less time and fewer resources, and decreased the relative cost for developing this information system as compared to the previous systems (noted above).
Sometimes, systems developers can miss features or architectures that might work per-fectly for a new system. Based on this study, we believe that by using a design research approach, systems analysts can develop more robust information systems that might require less effort, time and resources. By using exist-ing kernel theories, the first prototype would include many of the features that the users would require (theoretically) so that other new features could be added without major changes. Such information systems would be more maintain-able, which would decrease systems costs and would increase the chance of users’ acceptance (Pressman, 2005; Sommerville, 2006).
Before this study, we only conducted pro-totype tests using unstructured environments. However, after testing a prototype with a structured approach (according to the principles of ISDT) it was very clear that the transition from the final prototype to the final version of the system was very smooth. There were no problems because of developers’ wrong assump-tions, users failing to fully test the system, or certain issues being overlooked or ignored by either or both groups.
Importance for Practice
Academics and practitioners accept there is a gap between theory and practice (Martin, 2004). However, it is argued that both should accept that practice and theory complement each other
(Martin, 2004) rather than compete. “Design theories do not only emerge from practice and practical knowledge. They emerge also from general theories of explanatory character and from ideas of good design” (Goldkuhl, 2004, p. 69). Thus, design research can offer a useful approach for addressing practitioners’ needs.
ISDT is a means to produce relevant research because ISDT is capable of develop-ing information systems that are applicable to specific practice needs. By addressing such needs, ISDT can help organizations to be more competitive, innovative, and to respond quickly to changes in their environment. The ISDT created for the present research not only led to the development of a training tool for industrial organizations that use SPC for quality control purposes, it also provided a new set of char-acteristics that should be included in systems with the same purpose.
In addition, it can be used as guidelines for developing new types of systems that address very specific types of training situations as outlined previously. However, it cannot be used as a general guideline for any type of system, even those that might require ES techniques.
Limitations of the Study
There are some limitations to this research. We could have ignored important kernel theories for the design theory and/or overlooked at-tributes that might need to be included in the system. In addition, since this research was conducted, new kernel theories may have been published. Experts in training in SPC that also have knowledge in developing information systems were not available for testing. Hence, testers could have ignored important issues during evaluations. EST might be enhanced and improved by using a different programming language (e.g., an AI language -- the systems reported here were developed in Delphi V6), or a different AI approach (e.g., Fuzzy Logic), which could increase usability and quality. In addition, using a non-prototyping systems de-velopment approach might result in a different training system.
Copyright © 2013, IGI Global. Copying or distributing in print or electronic forms without written permission of IGI Global is prohibited.
Journal of Database Management, 24(3), 31-50, July-September 2013 47
Since a quasi-experimental design was used in the third step, findings cannot be generalized. Even though statistical power was strong and hypothesis-testing outcomes were as predicted, sample groups might not be representative of the population, thus limiting external validity. Hence, results might be different if a repre-sentative sample is used. In addition, results might be different if a bigger sample is used in the third step of the study. Finally, only one instructor was used for the three groups in order to control for teaching differences. However, there is a chance that the instructor, despite a commitment to be neutral, was more involved with one group, which might be reflected in the outcomes.
Areas for Additional Research
In order to strengthen the evaluation process of an ISDT, a longitudinal study can be conducted so that several evaluations of participants can be performed; especially useful would be evalua-tions of subjects’ learning in situ. Such a study could evaluate not only whether participants learn during training courses, but also how much they retain after training and how it impacts their real on-the-job performance.
Another evaluation can be conducted that includes learning styles. A study that could reveal the match between learning style and learning tool might be very useful for practi-tioners and researchers because practitioners could use the perfect training tool that matches the learning style for a specific group of em-ployees. In doing so, training outcomes could be maximized. In addition, researchers could continue studying and developing training tools for a specific learning style. This approach could develop better and enhanced training tools for each learning style.
Final Thoughts
In addition, we encourage those interested in building training support systems for SPC to uti-lize the design theory presented in this research as a means for new development efforts. The ISDT presented herein can be used to develop
the initial prototype of the system, which should reduce the development cycle and help optimize the resources assigned to such a project. Given the results of this study, ISDTs can provide a very useful approach for developing information systems for a very specific purpose. Finally, we encourage those interested in developing any type of information system to use the design research approach and to follow the three-step process outlined in this paper.
ACKNOWLEDGMENT
An earlier version of this paper was published in the DESRIST 2006 proceedings.
REFERENCES
Antony, J. (2000). Ten key ingredients for making SPC successful in organizations. Measuring Business Excellence, 4(4), 7–10.
Antony, J., Balbotin, A., & Taner, T. (2000). Key ingredients for the effective implementation of sta-tistical process control. Work Study, 49(6), 242–247.
Berger, R. W., & Hart, T. H. (1986). Statistical process control. A guide for implementation. New York, NY: The American Society for Quality Control.
Bowman, B. J., Grupe, F. G., & Simkin, M. G. (1995). Teaching end-user applications with computer-based training: Theory and an empirical investigation. Journal of End User Computing, 7(2), 12–18.
Brown, K. G. (2001). Using computers to deliver training: Which employees learn and why? Personnel Psychology, 54, 271–296.
Buch, K., & Bartley, S. (2002). Learning style and training delivery mode preference. Journal of Work-place Learning, 14(1), 5–10.
Buick, I., & Muthu, G. (1997). An investigation of the current practices of in-house employee training and development within hotels in Scotland. The Service Industries Journal, 17(4), 652.
Chang, L. L., Tsang, W. M., & Yeung, K. L. (1993). An expert system for ISO 9000 quality management system. In Proceedings of the TENCON ‘93. Proceed-ings. 1993 IEEE Region 10 Conference on Computer, Communication, Control and Power Engineering., Beijing, China.
Copyright © 2013, IGI Global. Copying or distributing in print or electronic forms without written permission of IGI Global is prohibited.
48 Journal of Database Management, 24(3), 31-50, July-September 2013
Cheng, Y. C., Ng, K. H., & Ching Mok, M. M. (2002). Economic considerations in education policy mak-ing: A simplified framework. International Journal of Educational Management, 16(1).
Desai, M., Richards, T., & Eddy, J. P. (1999). End-user training: A meta model. Journal of Instructional Psychology, 26(2), 1–8.
Desai, M., Richards, T., & Eddy, J. P. (2000). A field experiment: Instructor-based training vs. computer-based training. Journal of Instructional Psychology, 27(4), 239–243.
Dumas, J. F., & Redish, J. C. (1999). A practical guide to usability testing. Bristol, UK: Intellect Books.
Gaafar, L. K., & Keats, J. B. (1992). Statistical process control: A guide for implementation. International Journal of Quality & Reliability Management, 9(4), 9–20.
Garson, D. G. (1998). Oneway analysis of variance example. Retrieved July 29, 2005, from http://www2.chass.ncsu.edu/garson/pa765/anova1.htm
Goldkuhl, G. (2004). Design theories in information systems - A need for multi-grounding. Journal of Information Technology Theory and Application, 6(2), 59–72.
Grabinger, R. S., Wilson, B. W., & Jonassen, D. H. (1990). Building expert systems in training and education. Praeger Publishers.
Gregor, S., & Jones, D. (2007). The anatomy of a design theory. Journal of the Association for Infor-mation Systems, 8(5), 312–335.
Guh, R.-S. (2003). Integrating artificial intelligence into on-line statistical process control. Quality and Reliability Engineering International, 19, 1–20.
Hayes, P. J. (1999). Providing expert systems with integrated natural language and graphical interfaces. In Proceedings of 1986 Fall Joint Computer Confer-ence, Dallas, TX.
Herrod, R., & Papas, B. C. (1989, June 19-23). Industrial applications of artificial intelligence. In Proceedings of the Pulp and Paper Industry Techni-cal Conference, Atlanta, GA.
Hevner, A., March, S. T., & Park, J. (2004). Design science in information systems research. Manage-ment Information Systems Quarterly, 28(1), 75–105.
Hsu, J., & Turoff, M. (2002). Targeting computer training: improving learning by more effectively adapting training to meet user needs. In Proceedings of the Eight Americas Conference on Information Systems (pp. 1065-1075).
Huang, A. H. (2002). A three-tier technology training strategy in a dynamic business environment. Journal of End User Computing, 14(2), 30–39.
Irish, J. (1995). Anatomy of a multimedia project. Training (New York, N.Y.), 32, 44–49.
Kekäle, T., Pirolt, K., & Falter, C. (2002). IT tools in personnel training in small enterprises: Results of the project “apply”. Journal of Workplace Learning, 14(7), 269–277.
Markus, L. M., Majchrzak, A., & Gasser, L. (2002). A design theory for systems that support emergent knowledge processes. Management Information Systems Quarterly, 26(3), 179–212.
Marold, K. A. (2002). The 21st century learning model: Electronic tutelage realized. Journal of Information Technology Education, 1(2), 113–123.
Martin, A. (2004). Addressing the gap between theory and practice: IT project design. Journal of Informa-tion Technology Theory and Application, 6(2), 23–42.
Mason, B., & Antony, J. (2000). Statistical process control: An essential ingredient for improving ser-vice and manufacturing quality. Managing Service Quality, 10(4), 233–238.
Mazier, E. E. (2002). Hard times call for creative training approaches. National Underwriter (Property & Casualty/Risk & Benefits Management Edition), 106(42), 11-12.
Montesino, M. U. (2002). Strategic alignment of training, transfer-enhancing behaviors, and train-ing usage: A postraining study. Human Resource Development Quarterly, 13(1), 89–108.
Montgomery, D. C. (2001). Introduction to statistical quality control (4th ed.). Wiley.
Nakamichi, N., Shima, K., Sakai, M., & Matsumoto, K. (2006). Detecting low usability web pages using quantitative data of users’ behavior. In Proceedings of the 28th International Conference on Software Engineering, Shanghai, China.
Nelson, H. J., Armstrong, D. J., & Ghods, M. (2002). Old dogs and new tricks. Communications of the ACM, 45(10), 132–137.
Copyright © 2013, IGI Global. Copying or distributing in print or electronic forms without written permission of IGI Global is prohibited.
Journal of Database Management, 24(3), 31-50, July-September 2013 49
Noffsinger, J. R., & Anderson, R. B. (2002). Effect of autocorrelated data on composite panel produc-tion monitoring and control: A comparison of SPC techniques. Forest Products Journal, 60-67.
Nunamaker, J. F. (1992). Build to learn, evaluate and learn. Informatica, 1, 1–6.
Oldfield, N., & Rose, C. (2004). Learning delivers the best return. Industrial and Commercial Training, 36(1), 25–28.
Pressman, R. S. (2005). Software engineering: A practitioner’s approach, 6/e. New York, NY: Mc Graw-Hill.
Seffah, A., & Andreevskaia, A. (2003). Empowering software engineers in human-centered design. In Proceedings of the 25th International Conference on Software Engineering, Portland, Oregon.
Sommerville, I. (2006). Software engineering. 8/e. London, UK: Addison-Wesley.
Turban, E. (1995). Decision support and expert systems management support systems (4th ed.). Prentice Hall.
Turban, E., McLean, E., & Wetherbe, J. (2001). Information technology for management. Making connections for strategic advantage (2nd ed.). New York, NY: John Wiley & Sons.
Tyler, K. (2000). Hold on to what you’ve learned. HRMagazine, 45(5), 94.
UW. (2004, October 5). Usability test for the Univer-sity of Washington libraries’ information gateway. Retrieved from http://www.lib.washington.edu/us-ability/redesign03-04/surveyResults.html
van Delft, C. (2001). Some new classroom cases for teaching statistical quality control methods. Quality Engineering, 14(1), 45–48.
Vokurka, R. J., Flores, B. E., & Pearce, S. L. (1996). Automatic feature identification and graphical sup-port in rule-based forecasting: A comparison. Inter-national Journal of Forecasting, 12(1), 495–512.
Walls, J. G., Widmeyer, G. R., & El Sawy, O. A. (1992). Building an information system design theory for vigilant EIS. Information Systems Research, 3, 36–58.
Yi, G.-R., Shin, J., Cho, H., & Kim, K.-J. (2002). Quality-oriented shop floor control system for large-scale manufacturing processes: Functional framework and experimental results. Journal of Manufacturing Systems, 21(3), 187–199.
ENDNOTES1 Testers only tested the EST because the IST
is a sub-prototype of the EST.2 This usability test was conducted through an
online survey by the University of Washington for its UW Libraries’ Information Gateway. (UW, 2004)
3 The Computer Science bachelor program at the UAA is composed of ten semesters of course work.
4 The Science and Technology Council of the State of Aguascalientes.
5 The State Employment Service.6 The Training Institute for the Worker in the
State of Aguascalientes.7 No mention was made of variations in the
course.8 Electronic source at http://www2.chass.ncsu.
edu/garson/pa765/anova1.htm (accessed 10/19/2006).
Juan M. Gómez Reynoso is a Professor in the Department of Electronic Systems at the Au-tonomous University of Aguascalientes, Mexico. He earned his doctoral degree at Claremont Graduate University, were he specialized in Design Research. He has published articles in several conferences and journals in the field of information systems. Juan’s research interests include: design software end-user that is how software can be learned and used in organiza-tions, mobile computing. Juan has been involved in more than 100 bachelor theses, supervised 2 doctoral students; and 28 master students to completion and has served on more than 30 other dissertation committees.

Copyright © 2013, IGI Global. Copying or distributing in print or electronic forms without written permission of IGI Global is prohibited.
50 Journal of Database Management, 24(3), 31-50, July-September 2013
Lorne Olfman is a Professor in the Center for Information Systems and Technology at Claremont Graduate University (CGU) and former Dean of the School of Information Systems and Tech-nology. He came to Claremont in 1987 after graduating with a PhD in Business (Management Information Systems) from Indiana University (IU). He also holds an MBA (from IU), an MA in Economics and a BSc in Computing Science (both from the University of Calgary). Lorne worked in the public and private sectors in Canada for 10 years before entering the PhD program. Lorne’s research interests include: how software can be learned and used in organizations, the impact of computer-based systems on knowledge management, and the design and adoption of systems used for group work. Along with Terry Ryan, Lorne co-directs the Social Learning Software Lab ([SL]2). A key component of Lorne’s teaching is his involvement with doctoral students; he has supervised 51 students to completion and has served on 69 other dissertation committees. As an active member of the Information Systems community, Lorne has co-authored more than 140 refereed articles including 50 in journals, 28 as book chapters, and 65 as conference papers. He was Program Chair and then Conference Chair for ACM SIGMIS, served on many international conference committees, co-chaired mini-tracks at HICSS and served on the HICSS IS Advisory Board. He has also served on a variety of editorial boards, and is currently a Senior Editor of the AIS Transactions on Human Computer Interaction. Lorne was co-chair of the Doctoral Consortium for the 2009 Americas Conference on Information Systems. He was Chair of the Claremont Graduate University Faculty from June 2011-May 2013.
Terry Ryan serves as Professor of Information Systems and Technology at Claremont Graduate University in Claremont, California. His recent publications have appeared in Communications of the ACM, Computers & Education, International Journal of Computer Supported Collaborative Learning, International Journal of Information Systems for Crisis Response and Management, International Journal of Networking and Virtual Organizations, Journal of the Association of Information Systems, Journal of Organizational and End User Computing, Journal of Organi-zational Knowledge Management, and On the Horizon. He conducts research—primarily em-ploying action design research methods—on topics related to social learning, online discourse, and software development, maintenance, and acquisition.
Thomas A. Horan is Professor and Director of the Center for Information Systems and Tech-nology (CISAT) at Claremont Graduate University (CGU). Dr. Horan has approximately 25 years of experience in major governmental and industry innovations. Dr. Horan’s work has been sponsored by numerous organizations, including the California HealthCare Foundation, Blue Shield Foundation, US Social Security Administration, US Department of Transportation, National Science Foundation, and the United Nations Development Corporation. He has over 120 publications, including in major journals such as the Journal of the American Medical Informatics Association, Communications of the ACM, Journal of the AIS, Communications of the AIS, MIS Quarterly Executive, American Journal of Preventive Medicine, Government Information Quarterly, and International Journal of Healthcare Technology and Management.
Copyright © 2022 FDOKUMEN