AN IN VITRO STUDY - EPrints@Tamil Nadu Dr MGR Medical ...
137
COMPARISON OF THE POTENTIAL DISCOLOURATION EFFECT OF MTA ANGELUS, ENDOCEM MTA AND NEO MTA ON NATURAL TEETH – AN IN VITRO STUDY Dissertation submitted to THE TAMILNADU Dr. M.G.R. MEDICAL UNIVERSITY In partial fulfillment for the Degree of MASTER OF DENTAL SURGERY BRANCH IV CONSERVATIVE DENTISTRY AND ENDODONTICS MAY 2020
-
Upload
khangminh22 -
Category
Documents
-
view
1 -
download
0
Transcript of AN IN VITRO STUDY - EPrints@Tamil Nadu Dr MGR Medical ...
COMPARISON OF THE POTENTIAL DISCOLOURATION
EFFECT OF MTA ANGELUS, ENDOCEM MTA AND NEO MTA
ON NATURAL TEETH – AN IN VITRO STUDY
Dissertation submitted to
THE TAMILNADU Dr. M.G.R. MEDICAL UNIVERSITY
In partial fulfillment for the Degree of
MASTER OF DENTAL SURGERY
BRANCH IV
CONSERVATIVE DENTISTRY AND ENDODONTICS
MAY 2020


ACKNOWLEDGEMENT
I take this opportunity to sincerely thank my post graduate teacher and
my guide Dr. C. S. Karumaran, M.D.S., Professor, Department of
Conservative Dentistry and Endodontics, Ragas Dental College and Hospital,
for his patience, perseverance in motivating, guiding and supporting me
throughout my study period. His guidance, support, and constant
encouragement throughout my study period helped me to finish my thesis.
My sincere thanks to Dr. R. Anil Kumar, M.D.S., Professor and
HOD, Department of Conservative Dentistry and Endodontics, Ragas Dental
College and Hospital, who helped me with his guidance, during my study
period.
I extend my sincere thanks to Dr P. Shankar, M.D.S., Professor,
Ragas Dental College and Hospital, for his guidance and encouragement
during my study period.
I extend my sincere thanks to Dr. M. Rajasekaran, M.D.S.., Professor,
Ragas Dental College and Hospital, for his encouragement, motivation,
support and guidance all throughout my study period.
I extend my sincere thanks to Dr. B. Veni Ashok, M.D.S., Professor,
for his constant encouragement in academics and support throughout my
propaganda.
I would like to solemnly thank and be grateful to Dr. G Shankar
Narayan, M.D.S., Dr. S.M. Venkatesan, M.D.S., for their constant support,
guidance and encouragement throughout my propaganda.
I would like to thank Dr. B Venketesh, M.D.S., Dr. M. Sabari M.D.S,
Dr.Arrvind Vikram, M.D.S. Readers, for all their help and support during
my study period.
I would also like to thank Dr. C Nirmala, M.D.S., Dr. Shalini, M.D.S.,
Dr. V Sudhakar, M.D.S., Senior lecturers for their friendly guidance and
support.
I also wish to thank the management of Ragas Dental College and
Hospital, Chennai for their help and support.
I thank all my batchmates Dr. Anu Priya G, Dr. Anitha Varghese,
Dr. Akshaya V B, Dr. Vinaya Madhuri B, Dr. Gayathri, Dr. Sai Swathi R,
Dr, Suraj U, who had the patience to bear with me, my beloved seniors
especially Dr. Nandhini Devi, Dr. Darlene Ann Johnson and juniors
especially Dr. Azhagu Abirami, Dr. Roselin Stalin for their constant moral
support, guidance patience, love and encouragement during my period.
Nothing like a friend in need is a friend indeed, I’m blessed to
have my friends, Dr. Priyanka Venkatasubramaniam, Dr. Jayanthi,
Dr. Mahalakshmi, Dr. Vijendranath for all the help, support and
encouragement they have given me.
I would like to extend my gratitude to my father Fabian Sebastian, my
mother Judith Sebastian, my brother Benedict Roshan Sebastian my aunt
Maria O’ Connor and my philanthropist Stephen Dinesh for their constant
love, understanding, moral support and encouragement throughout these
years without which I would not have reached so far.
My sincere thanks to Mr.K.Thavamani for his patience and support
in DTP and Binding works. I extend my thanks to S.Venkatesan for his help
in statistical work.
Above all, I am thankful to God, who always guides me and has given
these wonderful people into my life.

LIST OF ABBREVIATIONS
SL.NO ABBREVIATIONS DESCRIPTION
1 MTA Mineral Trioxide Aggregate
2 GIC Glass Ionomer Cement
3 EDTA Ethylenediamine-tetraacetic acid
4 CEJ Cemento - enamel junction
5 SD
Standard Deviation
6 IBM.SPSS International Business Machines Statistical
Package for the Social Sciences
7 ANOVA Analysis of variance

CONTENTS
S. NO. INDEX PAGE.NO
1. INTRODUCTION 1
2. AIM AND OBJECTIVES 5
3. REVIEW OF LITERATURE 6
4. MATERIALS AND METHODS 23
5. RESULTS 30
6. DISCUSSION 37
7. SUMMARY 54
8. CONCLUSION 58
9. BIBLIOGRAPHY 61
10. ANNEXURES -
LIST OF TABLES
S.NO. TITLE
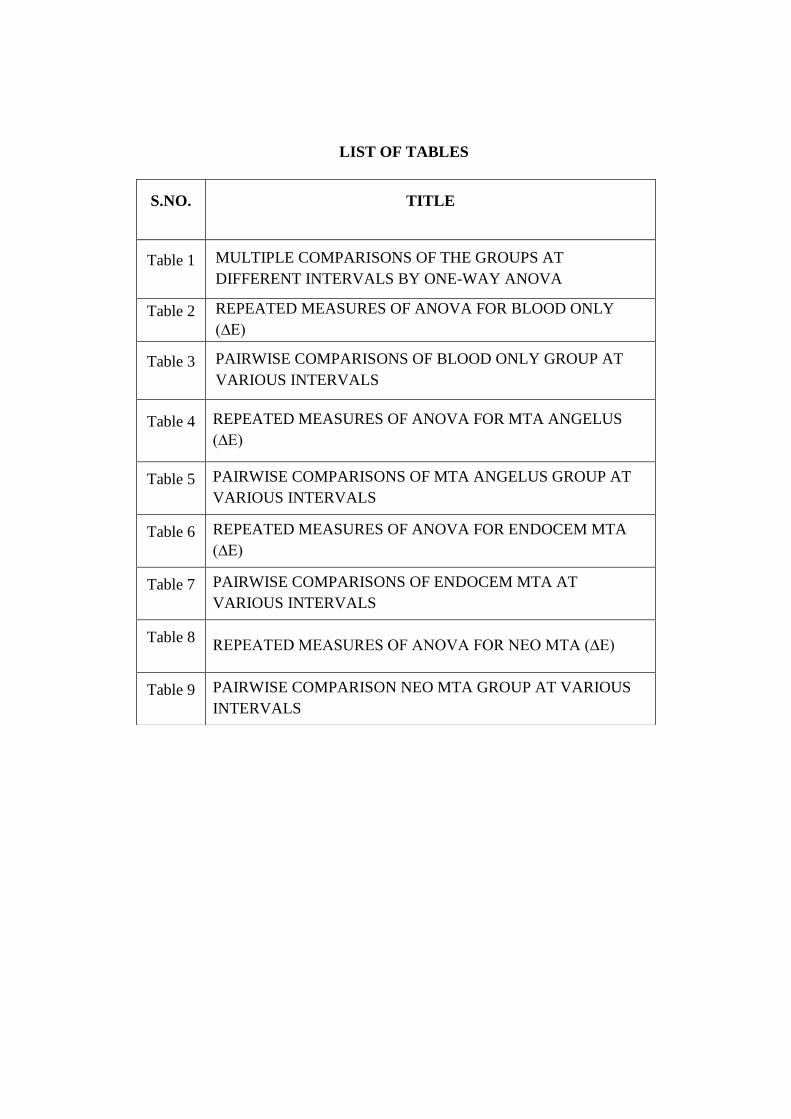
Table 1 MULTIPLE COMPARISONS OF THE GROUPS AT
DIFFERENT INTERVALS BY ONE-WAY ANOVA
Table 2 REPEATED MEASURES OF ANOVA FOR BLOOD ONLY
(∆E)
Table 3 PAIRWISE COMPARISONS OF BLOOD ONLY GROUP AT
VARIOUS INTERVALS
Table 4 REPEATED MEASURES OF ANOVA FOR MTA ANGELUS
(∆E)
Table 5 PAIRWISE COMPARISONS OF MTA ANGELUS GROUP AT
VARIOUS INTERVALS
Table 6 REPEATED MEASURES OF ANOVA FOR ENDOCEM MTA
(∆E)
Table 7 PAIRWISE COMPARISONS OF ENDOCEM MTA AT
VARIOUS INTERVALS
Table 8 REPEATED MEASURES OF ANOVA FOR NEO MTA (∆E)
Table 9 PAIRWISE COMPARISON NEO MTA GROUP AT VARIOUS
INTERVALS
LIST OF GRAPHS
S.NO. TITLE
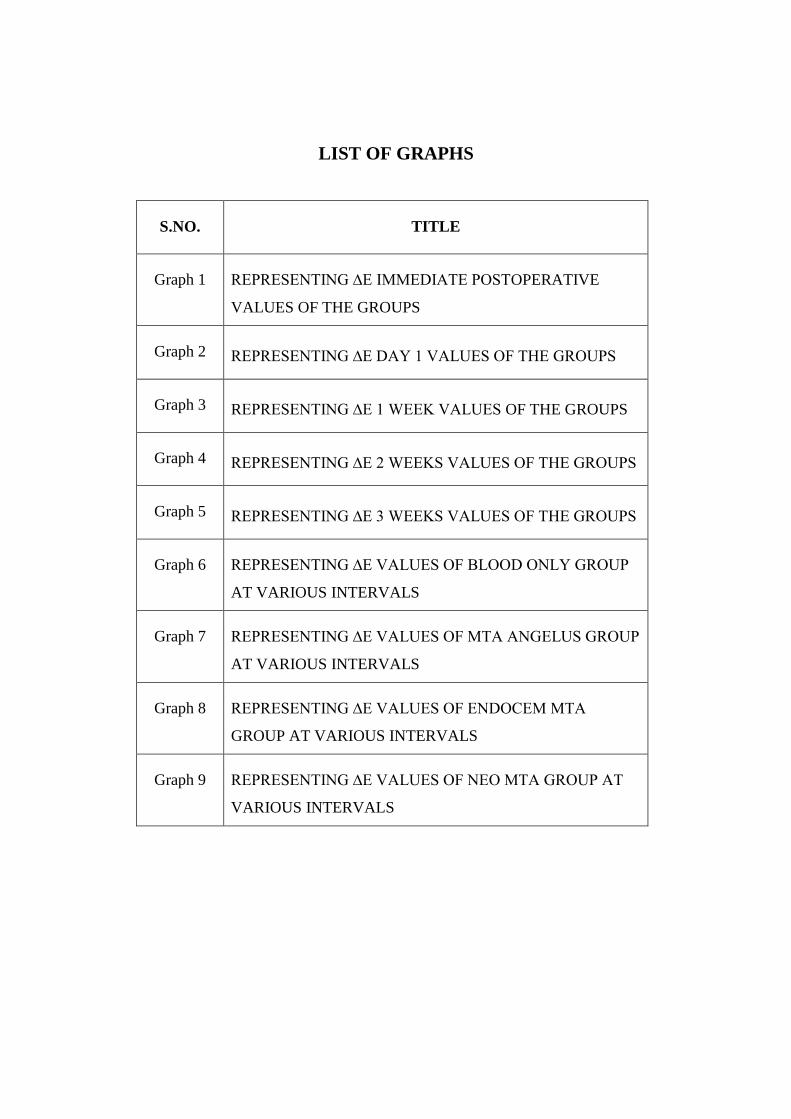
Graph 1 REPRESENTING ∆E IMMEDIATE POSTOPERATIVE
VALUES OF THE GROUPS
Graph 2 REPRESENTING ∆E DAY 1 VALUES OF THE GROUPS
Graph 3 REPRESENTING ∆E 1 WEEK VALUES OF THE GROUPS
Graph 4 REPRESENTING ∆E 2 WEEKS VALUES OF THE GROUPS
Graph 5 REPRESENTING ∆E 3 WEEKS VALUES OF THE GROUPS
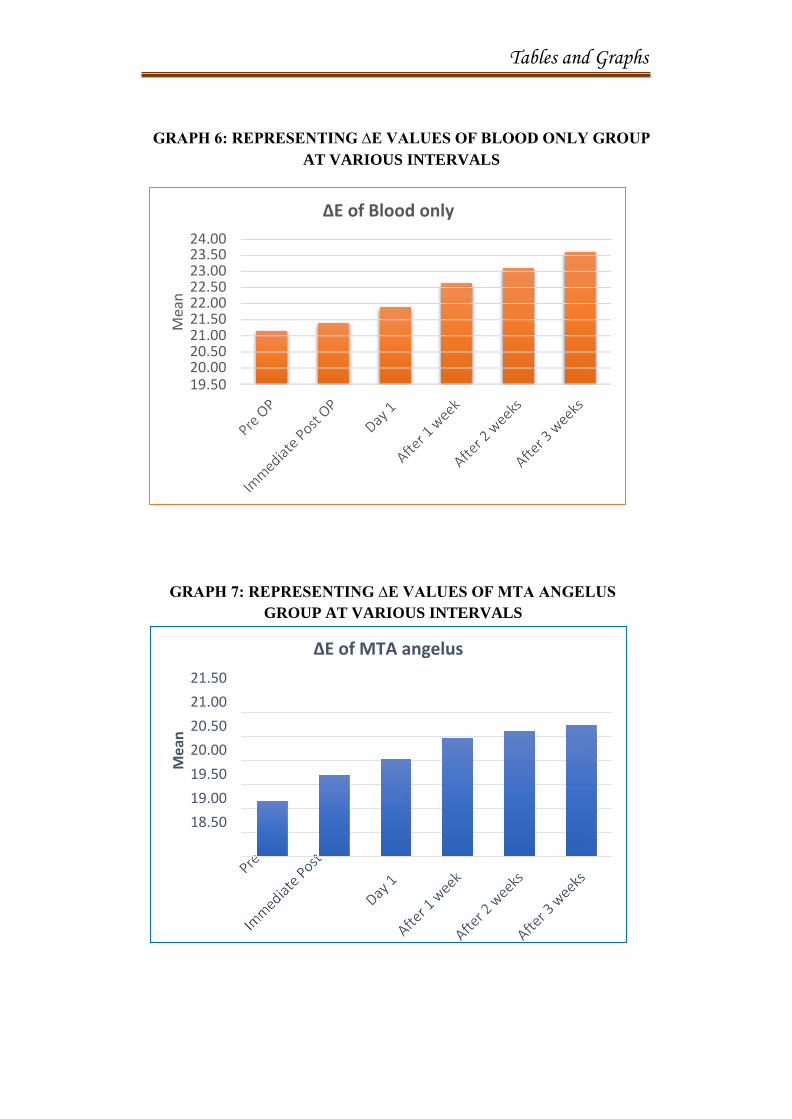
Graph 6 REPRESENTING ∆E VALUES OF BLOOD ONLY GROUP
AT VARIOUS INTERVALS
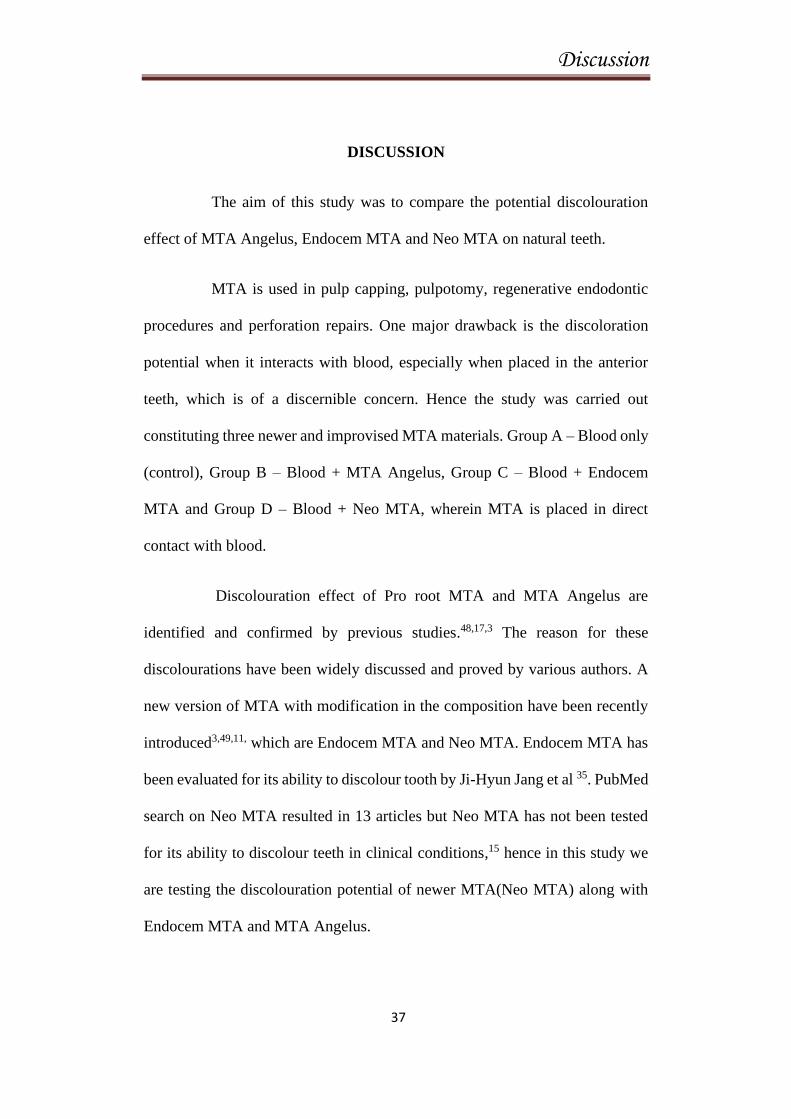
Graph 7 REPRESENTING ∆E VALUES OF MTA ANGELUS GROUP
AT VARIOUS INTERVALS
Graph 8 REPRESENTING ∆E VALUES OF ENDOCEM MTA
GROUP AT VARIOUS INTERVALS
Graph 9 REPRESENTING ∆E VALUES OF NEO MTA GROUP AT
VARIOUS INTERVALS
LIST OF FIGURES
S.NO. TITLE
FIGURE 1 EXTRACTED HUMAN UPPER CENTRAL INCISORS
FIGURE 2 DECORONATION OF TEETH AT CEJ
FIGURE 3 DIAMOND DISC
FIGURE 4 HANDPIECE
FIGURE 5 ISO DIAMOND CYLINDRICAL BUR – SR -13 (MANI)
FIGURE 6 SYRINGE (UNOLOK)
FIGURE 7 SALINE
FIGURE 8 SODIUM HYPOCHLORITE IRRIGATION SOLUTION 3%
(CHEMDENT)
FIGURE 9 DESMEAR 17% EDTA SOLUTION
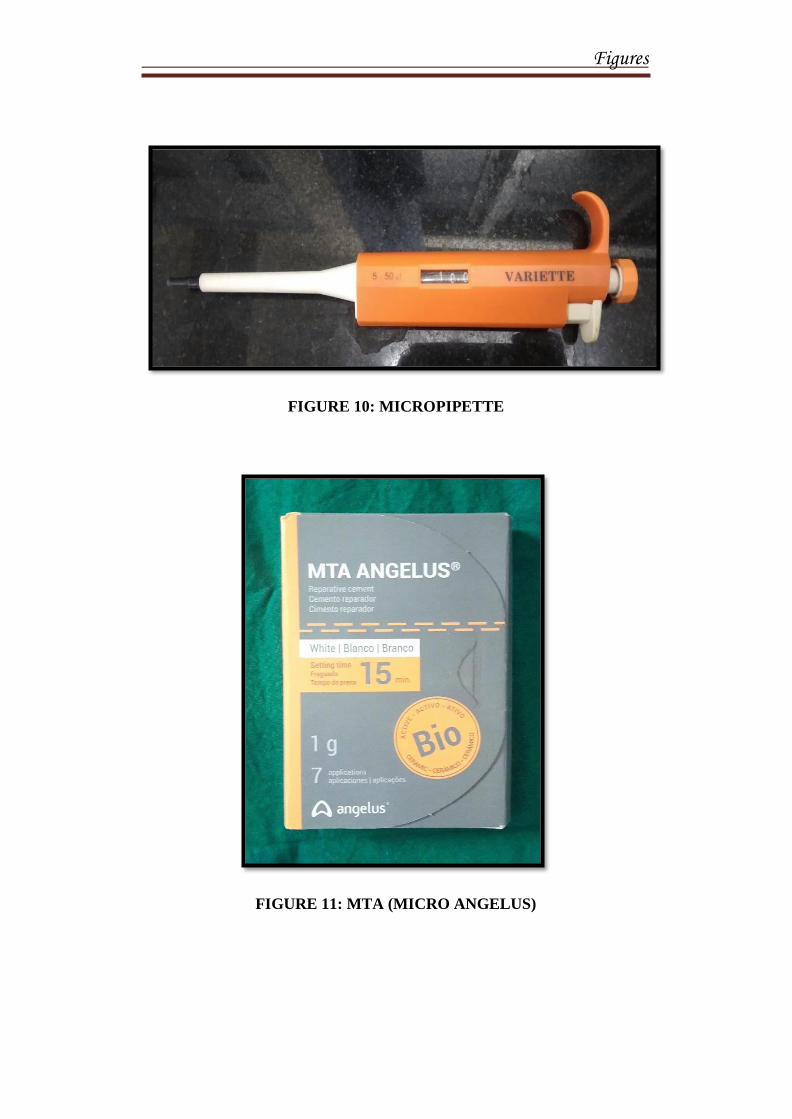
FIGURE 10 MICROPIPETTE
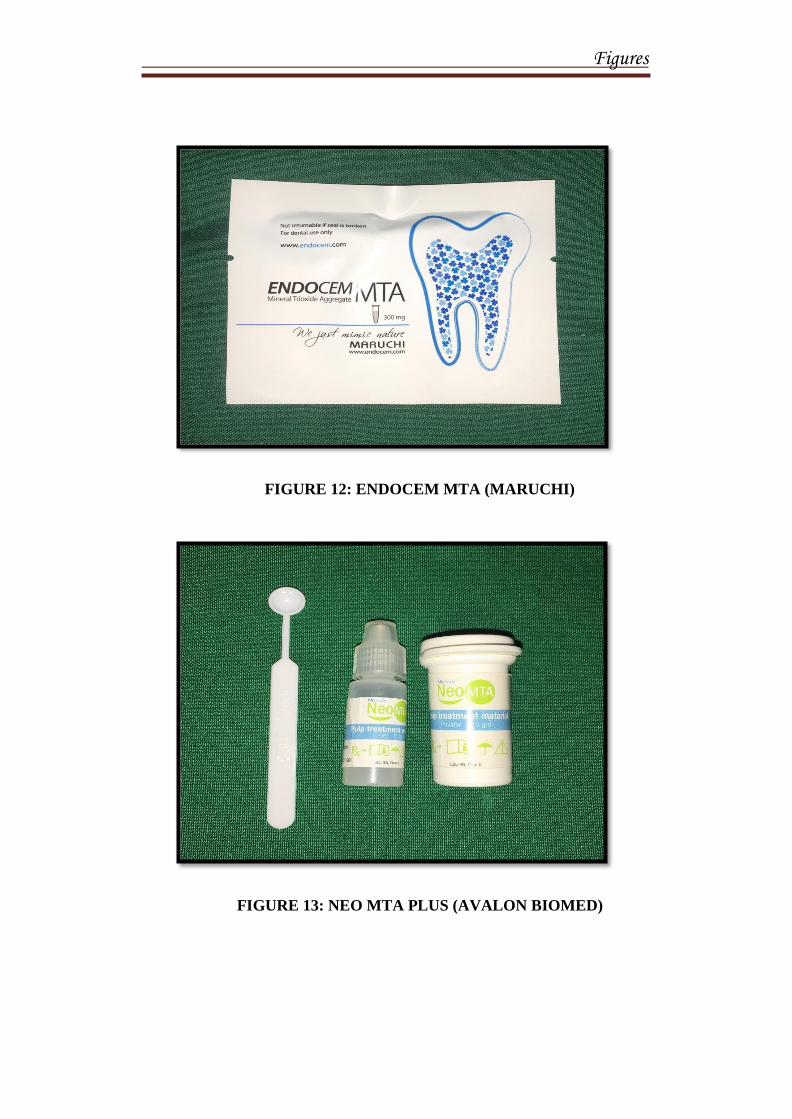
FIGURE 11 MTA (MICRO ANGELUS)
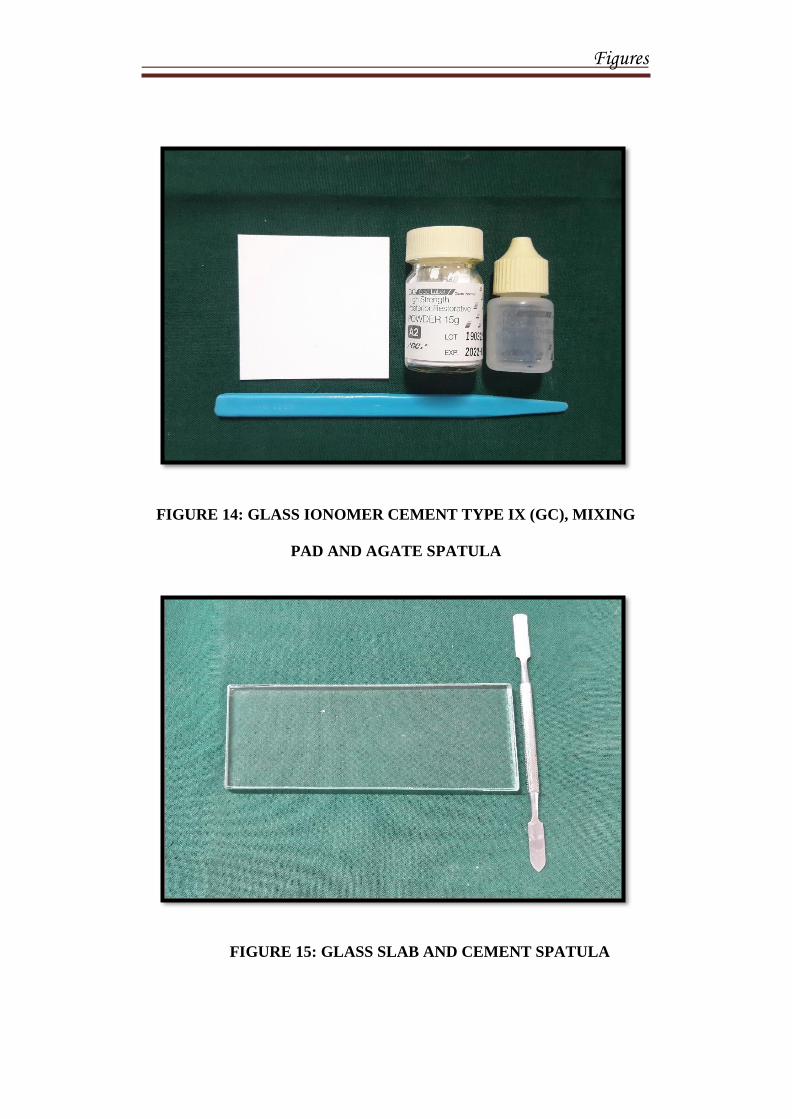
FIGURE 12 ENDOCEM MTA (MARUCHI
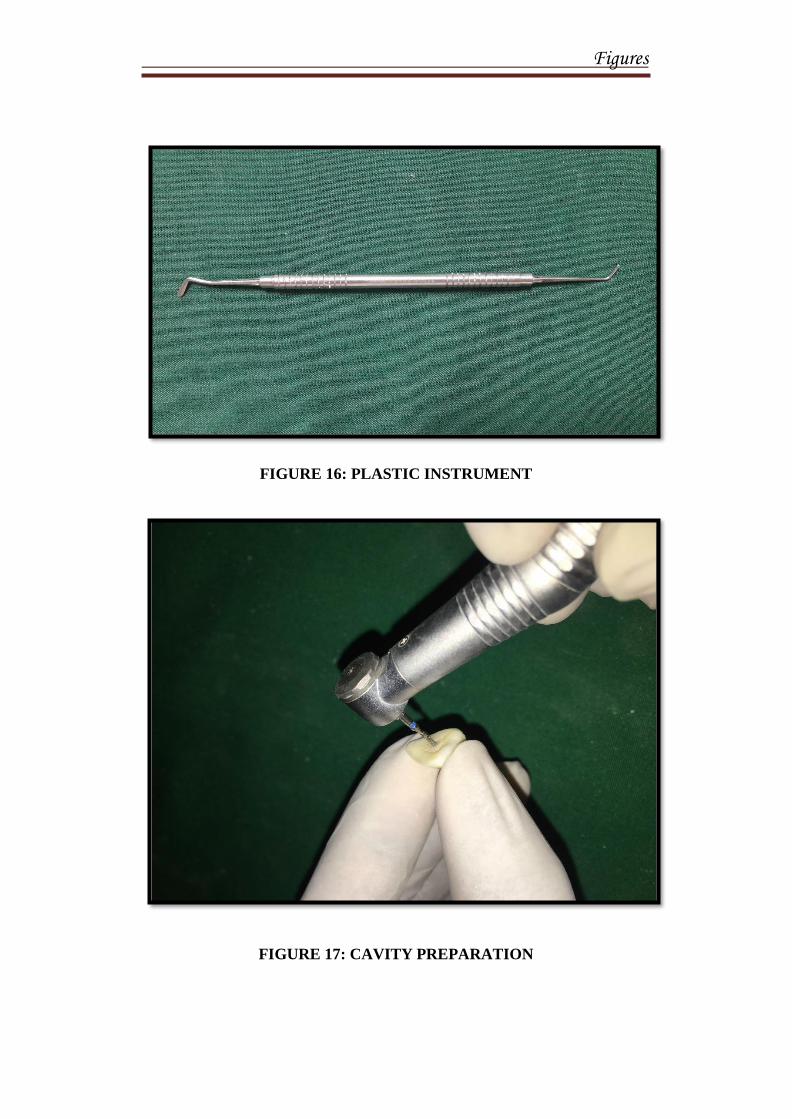
FIGURE 13 NEO MTA PLUS (AVALON BIOMED)
FIGURE 14 GLASS IONOMER CEMENT TYPE IX (GC), MIXING
PAD AND AGATE SPATULA
FIGURE 15 GLASS SLAB AND CEMENT SPATULA
FIGURE 16 PLASTIC INSTRUMENT
FIGURE 17 CAVITY PREPARATION
FIGURE 18 SPECTROPHOTOMETER
FIGURE 19 MANIPULATION OF MTA ANGELUS
FIGURE 20 MANIPULATION OF ENDOCEM MTA
FIGURE 21 MANIPULATION OF NEO MTA
FIGURE 22 BLOOD ONLY GROUP
FIGURE 23 MTA ANGELUS GROUP
FIGURE 24 ENDOCEM MTA GROUP
FIGURE 25 NEO MTA GROUP
FIGURE 26 POST OPERATIVE SAMPLES

Introduction
Introduction
1
INTRODUCTION
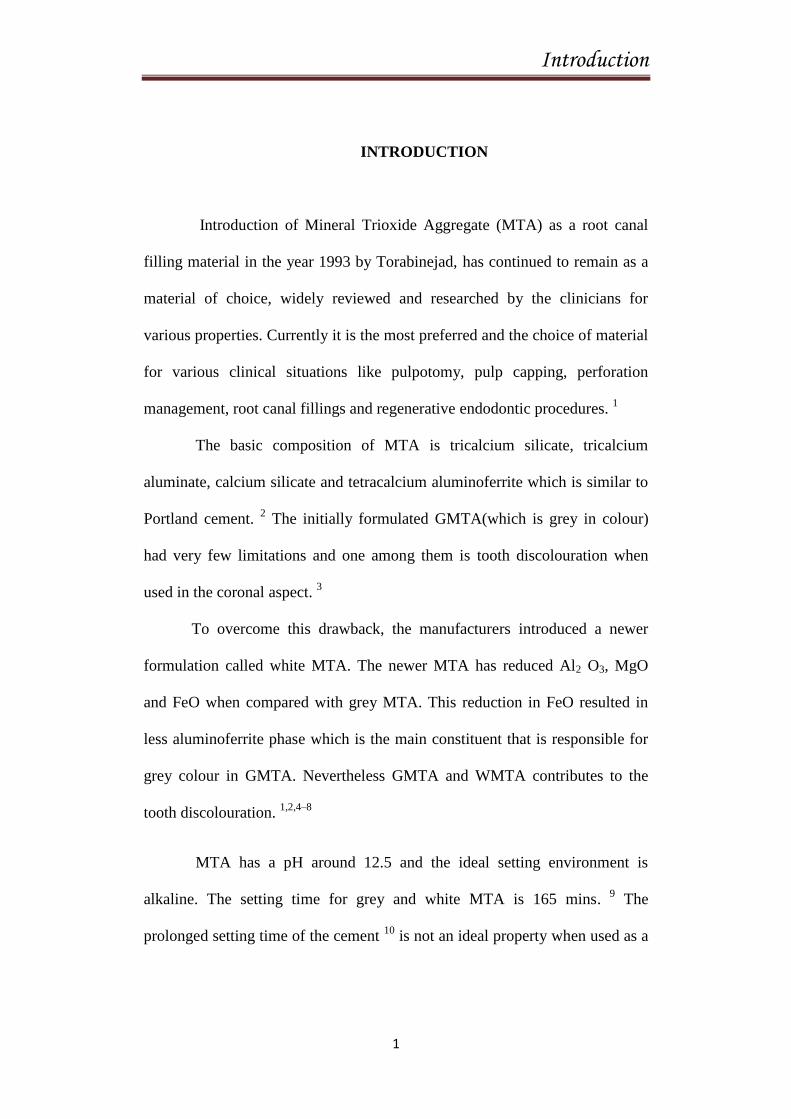
Introduction of Mineral Trioxide Aggregate (MTA) as a root canal
filling material in the year 1993 by Torabinejad, has continued to remain as a
material of choice, widely reviewed and researched by the clinicians for
various properties. Currently it is the most preferred and the choice of material
for various clinical situations like pulpotomy, pulp capping, perforation
management, root canal fillings and regenerative endodontic procedures. 1
The basic composition of MTA is tricalcium silicate, tricalcium
aluminate, calcium silicate and tetracalcium aluminoferrite which is similar to
Portland cement. 2 The initially formulated GMTA(which is grey in colour)
had very few limitations and one among them is tooth discolouration when
used in the coronal aspect. 3
To overcome this drawback, the manufacturers introduced a newer
formulation called white MTA. The newer MTA has reduced Al2 O3, MgO
and FeO when compared with grey MTA. This reduction in FeO resulted in
less aluminoferrite phase which is the main constituent that is responsible for
grey colour in GMTA. Nevertheless GMTA and WMTA contributes to the
tooth discolouration. 1,2,4–8
MTA has a pH around 12.5 and the ideal setting environment is
alkaline. The setting time for grey and white MTA is 165 mins. 9 The
prolonged setting time of the cement 10
is not an ideal property when used as a
Introduction
2
root end filling material, as it is in contact with blood and tissues which
reduces the pH too. There is a drop in pH and results in washout of the
material. 11
This initiated in introducing newer cements with less setting time
which was brought about by adjusting the original composition of the
cement.12
The ideal property of the MTA cement is not achieved when there is
an interference with the setting time. When MTA is placed in contact with
blood, discolouration occurs by haemolysis of the erythrocytes.4 Also altered
pH influence the setting time and final set property of the MTA material.13
This is eliminated by newer introduction of MTA like MTA Angelus,
Endocem MTA and Neo MTA.
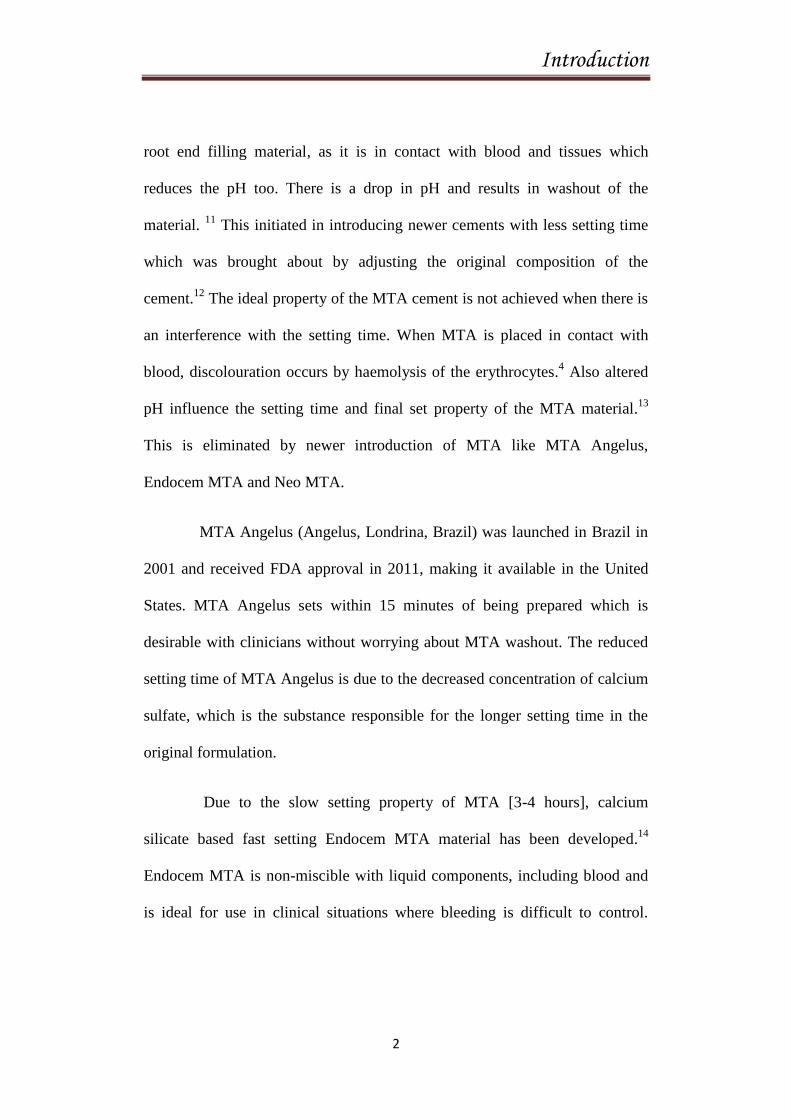
MTA Angelus (Angelus, Londrina, Brazil) was launched in Brazil in
2001 and received FDA approval in 2011, making it available in the United
States. MTA Angelus sets within 15 minutes of being prepared which is
desirable with clinicians without worrying about MTA washout. The reduced
setting time of MTA Angelus is due to the decreased concentration of calcium
sulfate, which is the substance responsible for the longer setting time in the
original formulation.
Due to the slow setting property of MTA [3-4 hours], calcium
silicate based fast setting Endocem MTA material has been developed.14
Endocem MTA is non-miscible with liquid components, including blood and
is ideal for use in clinical situations where bleeding is difficult to control.
Introduction
3
Endocem MTA employs the pozzolanic reaction, possessing cementitious
properties and known to reduce the setting time of Portland cement.14
Neo MTA Plus (Avalon Biomed Inc, Bradenton, FL), a new material
similar to MTA has been marketed for use in pulpotomies as it does not
discolour the tooth.15
MTA contains bismuth oxide which has been reported to
discolour, this is replaced by tantalum oxide in Neo MTA. These radiopacifers
were inert and showed no interference with the hydration of the material
without phase changes and did not result in discolouration.15
Discolouration caused by MTA is exacerbated by its contact with
blood.4
Most theories are related to:
The presence of bismuth oxide in the WMTA formulation which
causes the discolouration.16
Collagen in dentin matrix, reacted with bismuth oxide, resulting in
greyish discolouration.17
The release of heavy metal ions from MTA is also reported to cause
discolouration.
The slow setting reaction of MTA permits the absorption and
haemolysis of erythrocytes, resulting in material and subsequent tooth
discolouration when in contact with blood.4
Introduction
4
This in vitro study was done to compare the potential discolouration
effect of MTA Angelus, Endocem and Neo MTA since only few studies have
been done on the discolouration potential.

Aim and Objectives

Aim and Objectives
5
AIM AND OBJECTIVES
AIM:
The aim of this study is to compare the potential discoloration effect of
MTA Angelus, Endocem and Neo MTA on natural teeth.
OBJECTIVES:
1. This study is designed to evaluate the discoloration potential of
MTA when placed in contact with blood.
2. To compare the discoloration potential among MTA Angelus, Endocem
and Neo MTA when placed in contact with blood using a
Spectrophotometer.

Review of Literature
Review of Literature
6
REVIEW OF LITERATURE
Van der Burgt and Plasschaert et al (1985)18
investigated the
staining potential of different materials like Cavit, Durelon, Dycal, Fletcher’s
cement, IRM, AH26-silver free, gutta-percha, Duo Percha, Fuji ionomer. and
zinc phosphate cement by means of a visual method. The standards were
arranged according to hue, value, and chroma as recommended by Munsell.
Seghi et al (1990)19
evaluated the effects of instrument-measuring
geometry on color-difference assessments made on dental porcelains. The
results indicate that a high degree of correlation can exist between color-
difference measurements regardless of the design of the instrument-measuring
geometry. This work suggests that the development of clinically useful
devices need not be restricted to more traditional integrating-sphere-type
designs and that more photometrically efficient alternative designs should be
explored.
Mahmoud Torabinejad et al (1994)13
investigated mineral trioxide
aggregate (MTA), as a potential alternative restorative material to the
presently used materials in endodontics. Several in vitro and in vivo studies
have shown that MTA prevents microleakage, is biocompatible, and promotes
regeneration of the original tissues when it is placed in contact with the dental
pulp or periradicular tissues. He described the clinical procedures for
Review of Literature
7
application of MTA in capping of pulps with reversible pulpitis, apexification,
repair of root perforations nonsurgically and surgically, as well as its use as a
root-end filling material.
Thomas R. Pitt Ford et al (1995)20
investigated the histologic
response to intentional perforation in the furcations of mandibular premolars
in seven dogs. In half the teeth, the perforations were repaired immediately
with either amalgam or mineral trioxide aggregate; in the rest the perforations
were left open to salivary contamination before repair. Results showed that the
mineral trioxide aggregate is a far more suitable material than amalgam for
perforation repair, particularly when used immediately after perforation.
Marin et al (1997)21
investigated tooth staining following pulpal
haemorrhage. Samples of whole blood, erythrocytes, plasma and platelet
concentrate and saline were individually placed in the pulp chambers of
groups of five teeth and centrifuged twice daily for 25 min over a period of 3
consecutive days. He confirmed that the blood pigment responsible for the
staining was found only in those samples containing erythrocytes. The tests
done by Marin et al showed that, following haemolysis of erythrocytes within
dentine, haemoglobin was found either intact or as one of the haematin
molecules with no further breakdown of the haem structure and no evidence of
any free ferric ions or haemosiderin.

Review of Literature
8
D.C.N. Chan et al (1999)22
studied the radiopacity of tantalum oxide
in filled resins at varying percentage loadings. Ta2O5 nanoparticles were
dissolved in methanol or powder forms were mixed into either glycerol
dimethacrylate (GDMA) or a bisGMA and specimens were made in a split
brass mold and compared with an aluminum step wedge (99.5% pure Al) and
a dentin slice of the same thickness. The radiopacity increased significantly
with tantalum loading and reached that of 70% enamel opacity.
Moir et al (2003)23
describes the nature of Portland (calcium
silicate-based) cements and outlines the manufacturing process and the quality
control procedures employed. Portland cement is essentially calcium silicate
cement, which is produced by firing to partial fusion, at a temperature of
approximately 1500°C, a well-homogenized and finely ground mixture of
limestone or chalk (calcium carbonate) and an appropriate quantity of clay or
shale. The composition is commonly finetuned by the addition of sand and/or
iron oxide. Cement making is essentially a chemical process industry and has
much in common with the manufacture of so-called heavy chemicals, such as
sodium hydroxide and calcium chloride. Close control of the chemistry of the
product is essential if cement with consistent properties is to be produced. This
control applies not only to the principal oxides which are present but also to
impurities, which can have a marked influence on both the manufacturing
process and cement properties.

Review of Literature
9
Asgary et al (2004)24
compared the composition of white mineral
trioxide aggregate (WMTA) and two different white Portland cements
(WPCs). The samples were prepared and then imaged in a JEOL JSM6400
scanning electron microscope, equipped with an Oxford Instruments light
element energy dispersive spectrometer detector for determining the elemental
composition. The electron probe microanalysis showed that lime (CaO) and
silica (SiO) were the dominant compounds in each case but with no detectable
trace of bismuth oxide (BiO) in WPCs. He concluded that, there is no
significant difference between the dominant compounds in both WMTA and
WPCs except the presence of bismuth oxide in WMTA.
L. Turanli et al (2004)25
studied the effect of three different natural
pozzolans from Turkish deposits on the properties of blended cements
produced by intergrinding cement clinker with a high volume of natural
pozzolan (55 wt.% of the cementitious material). The particle size distribution
of blended cements, setting time, heat of hydration, and compressive strength
of blended cement mortars were determined. Experimental results showed that
the hardness of the pozzolanic material strongly influenced the particle size
distribution and the related properties of the blended cements by affecting the
fineness of the components of the blended product. The early strength of the
mortars was strongly affected by the particle size distribution of blended
cements, whereas the strength development performance of the mortars was
Review of Literature
10
more related to the pozzolanic activity of the natural pozzolan present in the
blended cement.
Ahmed Al-Kahtani et al (2005)26
evaluated the seal created by
varying depths of mineral trioxide aggregate (MTA) plugs placed in an
orthograde fashion in five groups of 10 teeth. One group received a 2 mm
thick orthograde apical plug of MTA, the second group a 5 mm apical MTA
plug, and the third group a 2 mm apical MTA plug with a second 2 mm
increment, 24 h later. The remaining portion of the canal in these groups was
left unfilled. Group four received a 2 mm MTA plug that set for 24 h and the
canal was then back-filled with gutta percha and eugenol based sealer. Group
five was a positive control without an MTA plug. The apical seal was tested
using a bacterial leakage model of Actinomyces viscosus. Results showed a
statistically significant difference in only the 5 mm apical plug, which
completely prevented bacterial leakage.
W. T. Felippe et al (2006)27
evaluated the influence of mineral
trioxide aggregate (MTA) on apexification and periapical healing of teeth in
dogs with incomplete root formation and previously contaminated canals and
to verify the necessity of employing calcium hydroxide paste before using
MTA. He concluded that Mineral trioxide aggregate used after root canal
preparation favoured the occurrence of the apexification and periapical
healing. The initial use of calcium hydroxide paste was not necessary for
Review of Literature
11
apexification to occur, and has shown to be strongly related to the extrusion of
MTA and formation of barriers beyond the limits of the root canal walls.
Iwamoto et al (2006)28
evaluated teeth clinically and histologically
using white proroot MTA in direct pulp capping. white MTA were diagnosed
as clinically successful, i.e. an absence of clinical symptoms and did not show
evidence of periapical pathosis. Histologically dentin bridge had developed.
Iwamoto et al concluded that white ProRoot MTA was equally successful as
calcium hydroxide when used for direct pulp capping in mechanically exposed
teeth.
Song et al (2006)29
observed that difference between white and gray
MTA was the lack of iron ions in white MTA. the principal components of the
gray-colored formula are tricalcium silicate, bismuth oxide, dicalcium silicate,
tricalcium aluminate, tetracalcium aluminoferrite, and calcium sulfate
dehydrate, and the white-colored formula lacks the tetracalcium
aluminoferrite. The fluxing agent is used for production of the white version to
remove the ferrite phase during the clinkering process. Portland cement
differed from MTA by the absence of bismuth ions and presence of potassium
ions.
Bozeman et al (2006)30
stated that crystal growth and elemental
dissolution characteristics of gray Mineral Trioxide Aggregate (GMTA), white
MTA (WMTA), and an experimental material, Dentalcrete, were compared.
Review of Literature
12
For part A, comparing amount and composition of surface crystal growth,
twelve cylinders of each material were suspended in Phosphate Buffered
Saline (PBS) solution without Ca. The crystals were analyzed by Scanning
Electron Microscopy (SEM), X-ray Diffraction (XRD), and Inductively
Coupled Plasma—Atomic Emission Spectroscopy (ICP-AES). For part B,
three cylinders of each material were suspended in distilled, deionized water.
The water was analyzed by ICP-AES for Ca content at 24 h, 72 h, and 5, 7, 10,
and 14 days. Data were analyzed using one-way ANOVA and Tukey test.
Both MTA materials released more Ca initially, followed by a decline and
then rise in elution. GMTA produced the most surface crystal, which may be
clinically significant. The crystals on GMTA and WMTA were chemically
and structurally similar to hydroxyapatite (HA).
Lindsey et al (2007)31
determined the perceptibility and acceptability
of tooth color differences using computer-generated pairs of teeth with
simulated gingival displayed on a calibrated color monitor using appropriate
signal detection theory methodology. Responses to tooth color differences
(DE) were measured on each of the three principal axes of CIELAB color
space (L*, a*, and b*). No group differences among subjects were found. All
gave 50% match or acceptance points that averaged about 1.0 DE units in the
L* and a* directions, and 2.6 units in the b* direction.
Kim-Pusateri et al (2009)32
evaluated the reliability and accuracy of 4
dental shade-matching instruments in a standardized environment. Four shade-
Review of Literature
13
matching devices were tested: SpectroShade, ShadeVision, VITA Easyshade,
and ShadeScan. Color measurements were made of 3 commercial shade
guides (Vitapan Classical, Vitapan 3D-Master, and Chromascop). Shade tabs
were placed in the middle of a gingival matrix (Shofu GUMY) with shade tabs
of the same nominal shade from additional shade guides placed on both sides.
Measurements were made of the central region of the shade tab positioned
inside a black box. For the reliability assessment, each shade tab from each of
the 3 shade guide types was measured 10 times. For the accuracy assessment,
each shade tab from 10 guides of each of the 3 types evaluated was measured
once. Accuracy of devices was as follows: VITA Easyshade - 92.6%;
ShadeVision - 84.8%; SpectroShade - 80.2%; and ShadeScan - 66.8%.
Schembri et al (2010)33
studiedPortland cement with a four to one
addition of bismuth oxide marketed as mineral trioxide aggregate (MTA),
which is used mainly as a dental material.Measurements of arsenic, lead, and
chromium in hydrated gray and white Portland cement, ProRoot MTA, and
MTA Angelus were conducted with graphite furnace atomic absorption
spectrophotometry becauseheavy metal inclusion was a concern as MTA is in
contact with hard and soft tissues. It was concluded that both MTAs released
more arsenic than the amount specified. Portland cements and MTAs showed
evidence of heavy metals in the acid-soluble form as well as leaching in
deionized water and SBF. MTA contained levels of arsenic higher than the
safe limit specified.
Review of Literature
14
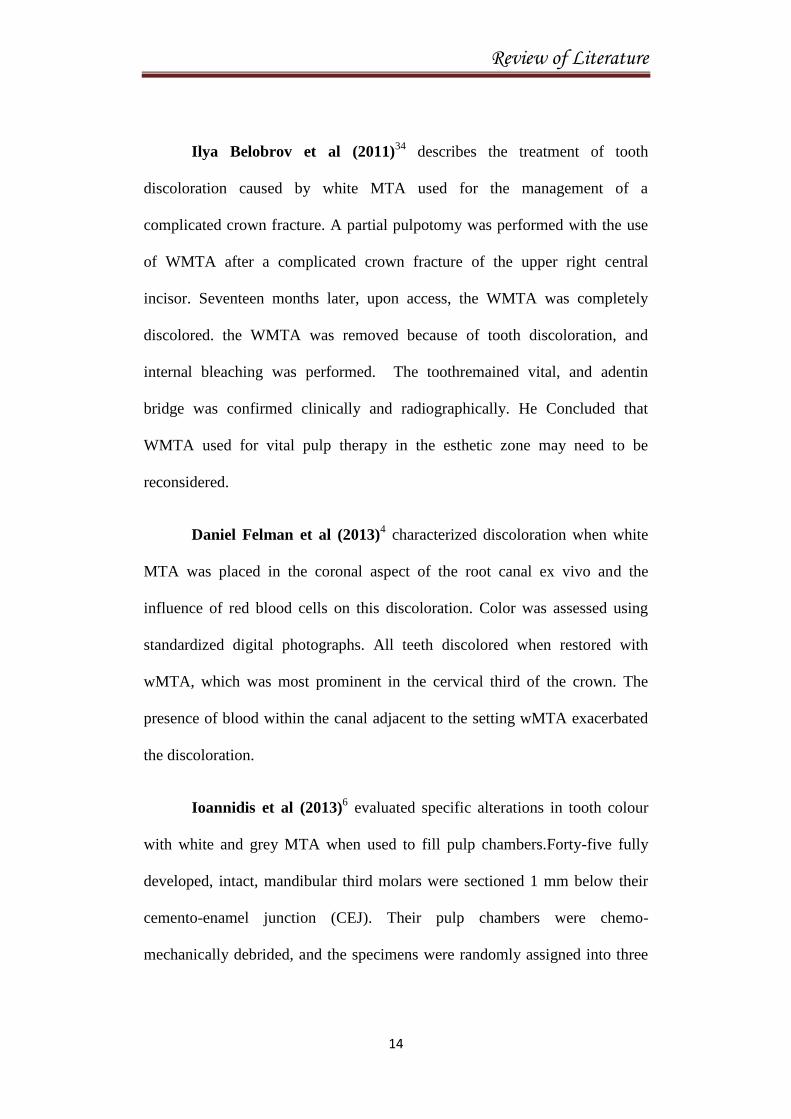
Ilya Belobrov et al (2011)34
describes the treatment of tooth
discoloration caused by white MTA used for the management of a
complicated crown fracture. A partial pulpotomy was performed with the use
of WMTA after a complicated crown fracture of the upper right central
incisor. Seventeen months later, upon access, the WMTA was completely
discolored. the WMTA was removed because of tooth discoloration, and
internal bleaching was performed. The toothremained vital, and adentin
bridge was confirmed clinically and radiographically. He Concluded that
WMTA used for vital pulp therapy in the esthetic zone may need to be
reconsidered.
Daniel Felman et al (2013)4 characterized discoloration when white
MTA was placed in the coronal aspect of the root canal ex vivo and the
influence of red blood cells on this discoloration. Color was assessed using
standardized digital photographs. All teeth discolored when restored with
wMTA, which was most prominent in the cervical third of the crown. The
presence of blood within the canal adjacent to the setting wMTA exacerbated
the discoloration.
Ioannidis et al (2013)6 evaluated specific alterations in tooth colour
with white and grey MTA when used to fill pulp chambers.Forty-five fully
developed, intact, mandibular third molars were sectioned 1 mm below their
cemento-enamel junction (CEJ). Their pulp chambers were chemo-
mechanically debrided, and the specimens were randomly assigned into three
Review of Literature
15
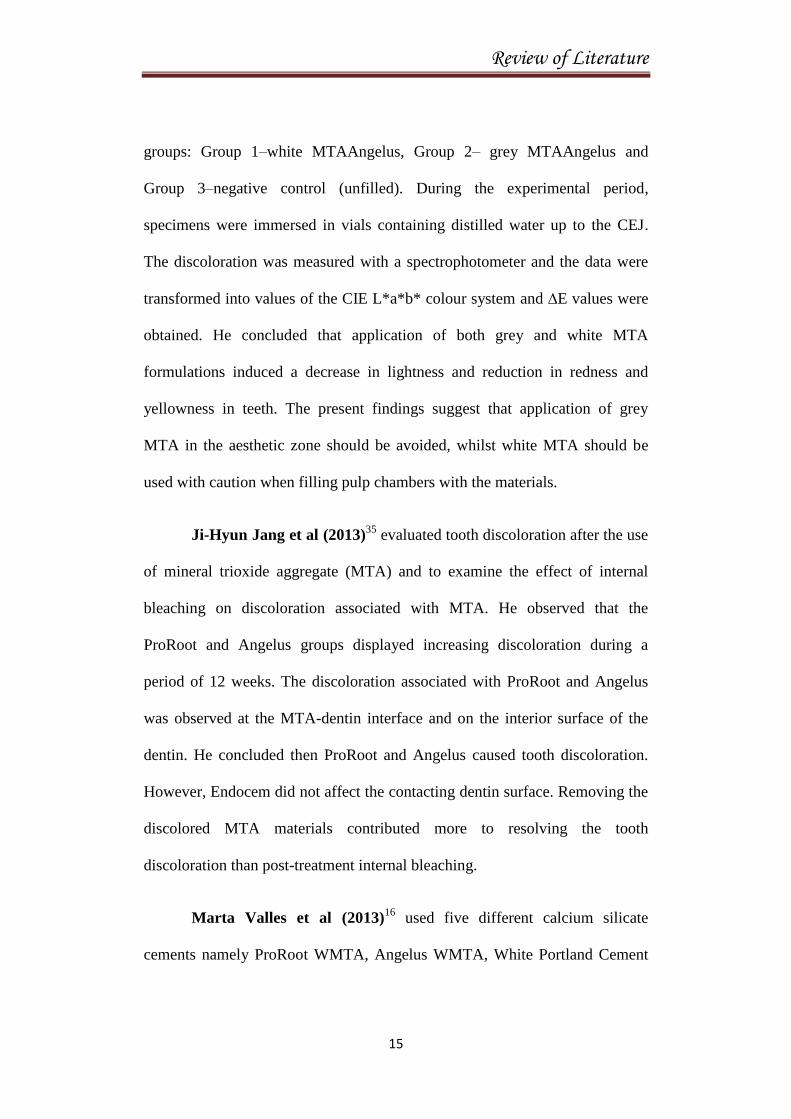
groups: Group 1–white MTAAngelus, Group 2– grey MTAAngelus and
Group 3–negative control (unfilled). During the experimental period,
specimens were immersed in vials containing distilled water up to the CEJ.
The discoloration was measured with a spectrophotometer and the data were
transformed into values of the CIE L*a*b* colour system and ∆E values were
obtained. He concluded that application of both grey and white MTA
formulations induced a decrease in lightness and reduction in redness and
yellowness in teeth. The present findings suggest that application of grey
MTA in the aesthetic zone should be avoided, whilst white MTA should be
used with caution when filling pulp chambers with the materials.
Ji-Hyun Jang et al (2013)35
evaluated tooth discoloration after the use
of mineral trioxide aggregate (MTA) and to examine the effect of internal
bleaching on discoloration associated with MTA. He observed that the
ProRoot and Angelus groups displayed increasing discoloration during a
period of 12 weeks. The discoloration associated with ProRoot and Angelus
was observed at the MTA-dentin interface and on the interior surface of the
dentin. He concluded then ProRoot and Angelus caused tooth discoloration.
However, Endocem did not affect the contacting dentin surface. Removing the
discolored MTA materials contributed more to resolving the tooth
discoloration than post-treatment internal bleaching.
Marta Valles et al (2013)16
used five different calcium silicate
cements namely ProRoot WMTA, Angelus WMTA, White Portland Cement

Review of Literature
16
[PC], PC with bismuth oxide, and Biodentine. They exposed each group of
cements to combined environment of light and anaerobic condition and
evaluated the color change in each specimens in different time period through
spectrophotometer. From the results he concluded Biodentine and Portland
cement demonstrated color stability than the other cements such as ProRoot
WMTA, Angelus WMTA, White Portland with bismuth oxide.
Marina Angélica Marciano et al (2014)17
studied if the increase in
radiopacity provided by bismuth oxide is related to the color alteration of
calcium silicate-based cement. Calcium silicate cement was mixed with 0%,
15%, 20%, 30% and 50% of bismuth oxide (BO), determined by weight and
Mineral trioxide aggregate was the control group. The assessments were
performed using a spectrophotometer to obtain the ΔE, Δa, Δb and ΔL values.
He concluded that increase in radiopacity provided by bismuth oxide has no
relation to the color alteration of calcium silicate-based cements.
Todd Berger et al (2014)36
investigated the role of bismuth oxide, a
constituent of contemporary mineral trioxide aggregate (MTA) materials,
andits response to various solutions that may contribute to the potential
discoloration. He observed thatall forms of ProRoot MTA showed
discoloration and concluded that exposing MTA in various forms to a variety
of liquids has determined that bismuth oxide in combination with other
chemical moieties is the prime cause of staining.

Review of Literature
17
Josette Camilleri et al (2014)37
viewed that Immersion of white MTA
and bismuthoxide in sodium hypochlorite resulted in the formation of a dark
brown discoloration. This change was not observed in Portland cement. He
concluded that Contact of white MTA and other bismuth-containing materials
with sodium hypochlorite solution should be avoided.
Hannah Beatty et al (2015)38
compared tooth discoloration between
ProRootMTA, Biodentine, and EndoSequenceRoot Repair Material. She used
bovine mandibular incisors and prepared them from the apical aspect after root
resection. Canals were prepared with sequentially larger ParaPost drills
coronal to the cementoenamel junction. Experimental materials were
condensed into the crowns and the access sealed. Color was assessed at
various times up to 2 months according to the CIE L*a*b* color space system
and concluded that BioDentine and EndoSequence root repair material
discolor bovine tooth structure to a perceptible degree. At 8 weeks, this was
significantly more than ProRootMTA.
Josette Camilleri et al (2015)15
evaluated three materials namely Neo
MTA Plus (Avalon Biomed Inc, Bradenton, FL), MTA Plus(Avalon Biomed
Inc), and Biodentine (Septodont, Saint-Maur-des-Foss_es, France) that are
used for pulpotomy procedures in immature permanent teeth to view their
color stability in the presence of sodium hypochlorite. He compared the color
stability using photography, spectrophotometry, and X-ray diffraction
analysis. He concluded all materials used in the study are suitable to be used
Review of Literature
18
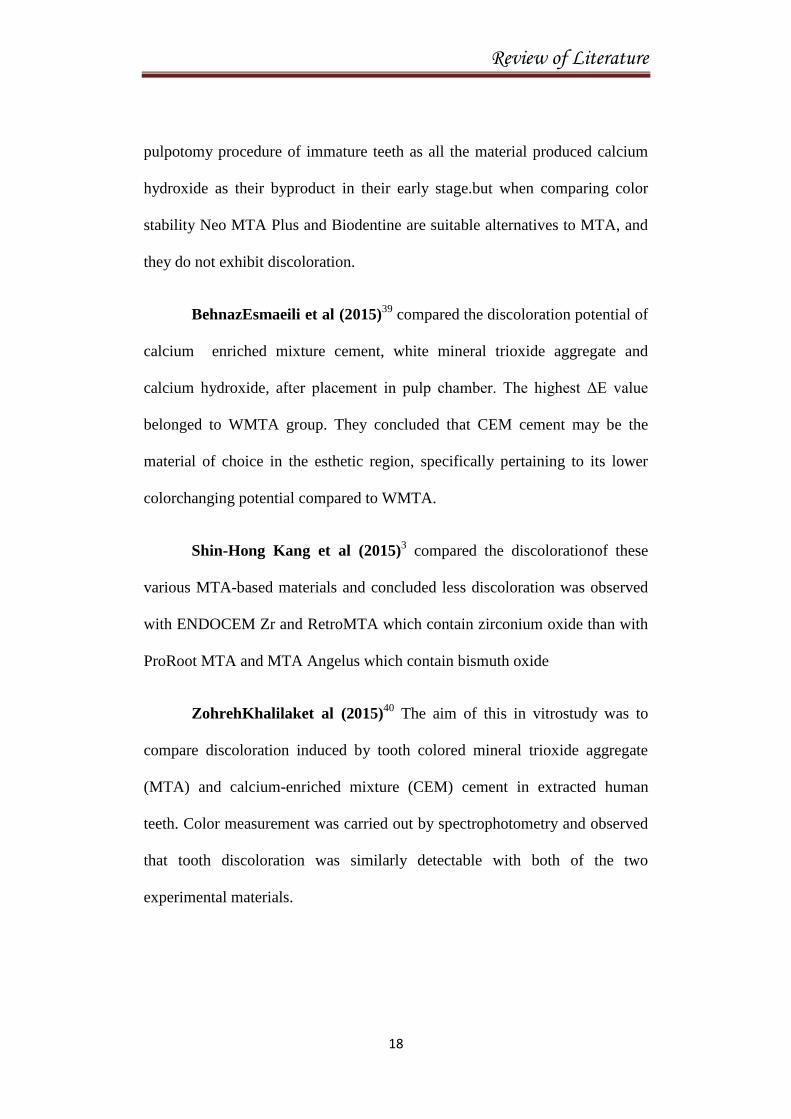
pulpotomy procedure of immature teeth as all the material produced calcium
hydroxide as their byproduct in their early stage.but when comparing color
stability Neo MTA Plus and Biodentine are suitable alternatives to MTA, and
they do not exhibit discoloration.
BehnazEsmaeili et al (2015)39
compared the discoloration potential of
calcium enriched mixture cement, white mineral trioxide aggregate and
calcium hydroxide, after placement in pulp chamber. The highest ΔE value
belonged to WMTA group. They concluded that CEM cement may be the
material of choice in the esthetic region, specifically pertaining to its lower
colorchanging potential compared to WMTA.
Shin-Hong Kang et al (2015)3 compared the discolorationof these
various MTA-based materials and concluded less discoloration was observed
with ENDOCEM Zr and RetroMTA which contain zirconium oxide than with
ProRoot MTA and MTA Angelus which contain bismuth oxide
ZohrehKhalilaket al (2015)40
The aim of this in vitrostudy was to
compare discoloration induced by tooth colored mineral trioxide aggregate
(MTA) and calcium-enriched mixture (CEM) cement in extracted human
teeth. Color measurement was carried out by spectrophotometry and observed
that tooth discoloration was similarly detectable with both of the two
experimental materials.
Review of Literature
19
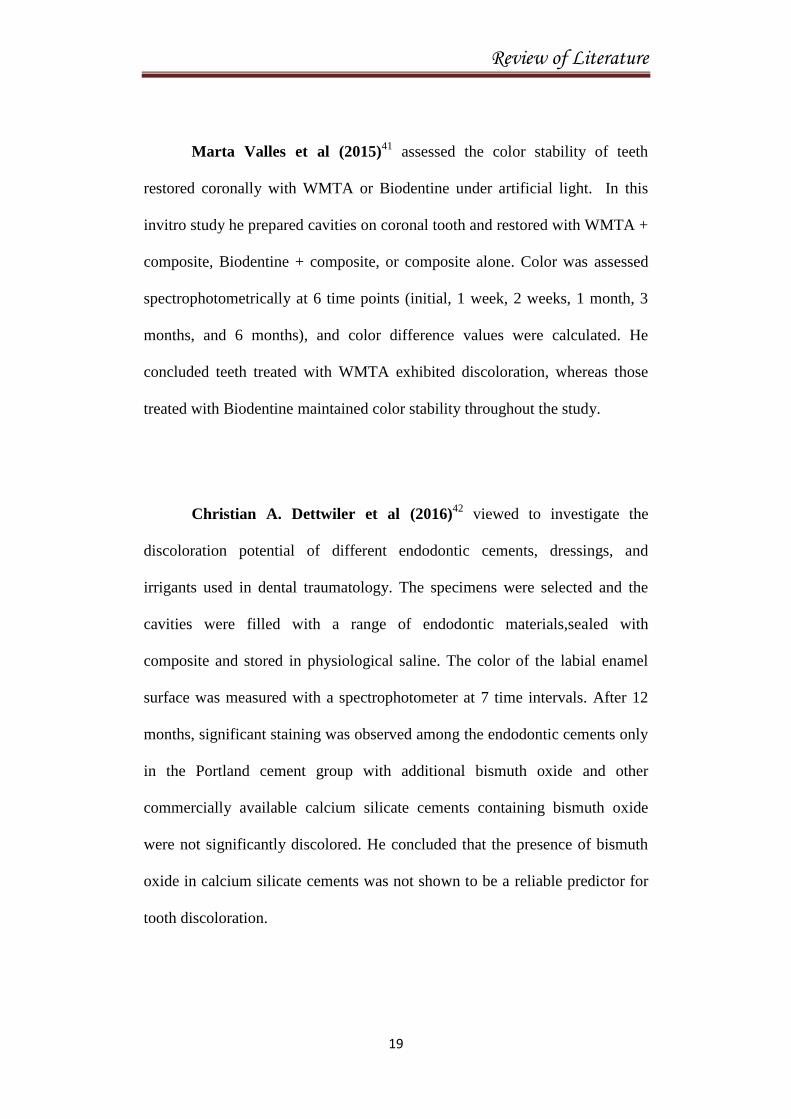
Marta Valles et al (2015)41
assessed the color stability of teeth
restored coronally with WMTA or Biodentine under artificial light. In this
invitro study he prepared cavities on coronal tooth and restored with WMTA +
composite, Biodentine + composite, or composite alone. Color was assessed
spectrophotometrically at 6 time points (initial, 1 week, 2 weeks, 1 month, 3
months, and 6 months), and color difference values were calculated. He
concluded teeth treated with WMTA exhibited discoloration, whereas those
treated with Biodentine maintained color stability throughout the study.
Christian A. Dettwiler et al (2016)42
viewed to investigate the
discoloration potential of different endodontic cements, dressings, and
irrigants used in dental traumatology. The specimens were selected and the
cavities were filled with a range of endodontic materials,sealed with
composite and stored in physiological saline. The color of the labial enamel
surface was measured with a spectrophotometer at 7 time intervals. After 12
months, significant staining was observed among the endodontic cements only
in the Portland cement group with additional bismuth oxide and other
commercially available calcium silicate cements containing bismuth oxide
were not significantly discolored. He concluded that the presence of bismuth
oxide in calcium silicate cements was not shown to be a reliable predictor for
tooth discoloration.
Review of Literature
20
Noushin Shokouhinejad et al (2016)43
compared the discoloration
potential of MTA namely ProRoot MTA (Dentsply Tulsa Dental Products,
Tulsa, OK) and calcium silicate based material such as Biodentine (Septodont,
Saint Maur des Foss_es, France), OrthoMTA (BioMTA, Seoul, Korea), and
EndoSequence Root Repair Material (ERRM; Brasseler, Savannah, GA) in the
presence or absence of blood. He concluded all materials showed discoloration
in the presence of blood butbiodentine and ERRM showed significantly less
tooth discoloration in the absence of blood.
Yoldas et al (2016)1 evaluated and compared the discoloration
potential of 3 different tricalcium cements using a bovine tooth model. He
used 4 groups namely BioAggregate, Biodentine, mineral trioxide aggregate
Angelus, and only blood.Crowns separated from the roots and materials have
been placed to the standardized cavities on the lingual surfaces of the crowns,
and their contact with blood has been provided. The color values of the
samples were measured with a digital tooth shade before the placement of the
materials, after the placement of the materials, in the 24th hour, in the first
week, in the first month, in the third month, and in the first year. Results
showed all groups displayed increasing discoloration during a period of the
first year. The ‘‘only blood group’’ showed the highest color change values,
and it was followed as Bio-Aggregate, mineral trioxide aggregate Angelus,
and Biodentine, respectively. He finally concluded that Biodentine is found to
have the least discoloration potential among the tested materials.
Review of Literature
21
Marina Angelica Marciano et al (2017)44
investigated the addition of
variable amounts of zinc oxide to inhibitdental discoloration caused by
mineral trioxide aggregate.He used MTA Angelus andMTA with additions of
5%, 15%, and 45% zinc oxide in weight were tested the set cements using a
combination of scanning electronmicroscopy, energy dispersive spectroscopy,
and x-raydiffraction. The pH and calcium ion releasewere measured after 3
hours, 24 hours, and 28 days.Dental discoloration in contact with the cements
wasmeasured after 24 hours, 28 days, and 90 days. The results showed
addition ofZnO did not alter significantly the radiopacity, settingtime, volume
change, pH, and biocompatibility compared with MTA Angelus. He
concluded the addition of 5%, 15%, or 45% zinc oxide to MTAAngelus
inhibits dental discoloration without modifyingthe radiopacity, setting time,
volume change, pH, andbiocompatibility.
Bansode et al (2018)45
reviewed tricalcium silicate based cements like
MTA though initially introduced as root end filling materials, have found wide
acceptance in other treatment modalities like pulp capping, pulpotomies,
apexification, perforation repairs because of their biocompatibility, sealing
abilities etc. At the same time its limitations like longer setting time, difficult
handling characteristics, potential to cause tooth discoloration have led to the
exploration of modifications of the material. This article reviews a newer
modification ‘Pozzolan Dental Cement’ which has been evaluated and
compared with the existing tricalcium silicate-based cement.

Review of Literature
22
Ivan Odler et al (2019)46
studied the hydration, setting and hardening
of Portland cement. There are various factors that determine the mechanism of
PC setting reaction. He has studied the chemistry in depth and given and
overview of the cement.
Jiménez-Sánchez et al (2019)47
studied the physicochemical
parameters with those of ProRoot MTA White (Pro) and NeoMTA Plus.
Setting time was assessed according using a scanning electron microscope.
Bioactivity evaluation in vitro was carried out, by soaking processed cement
disk in simulated body fluid (SBF) during 168 h. HP showed shorter initial
setting time compared to Pro and Neo and produce a quick and effective
bioactive response in vitro in terms of phosphate phase surface coating
formation which improved the outcome of vital pulp therapy.

Materials and Method
23
MATERIALS AND METHODS
ARMAMENTARIUM AND MATERIALS
1. 40 Extracted Human Upper Central Incisors
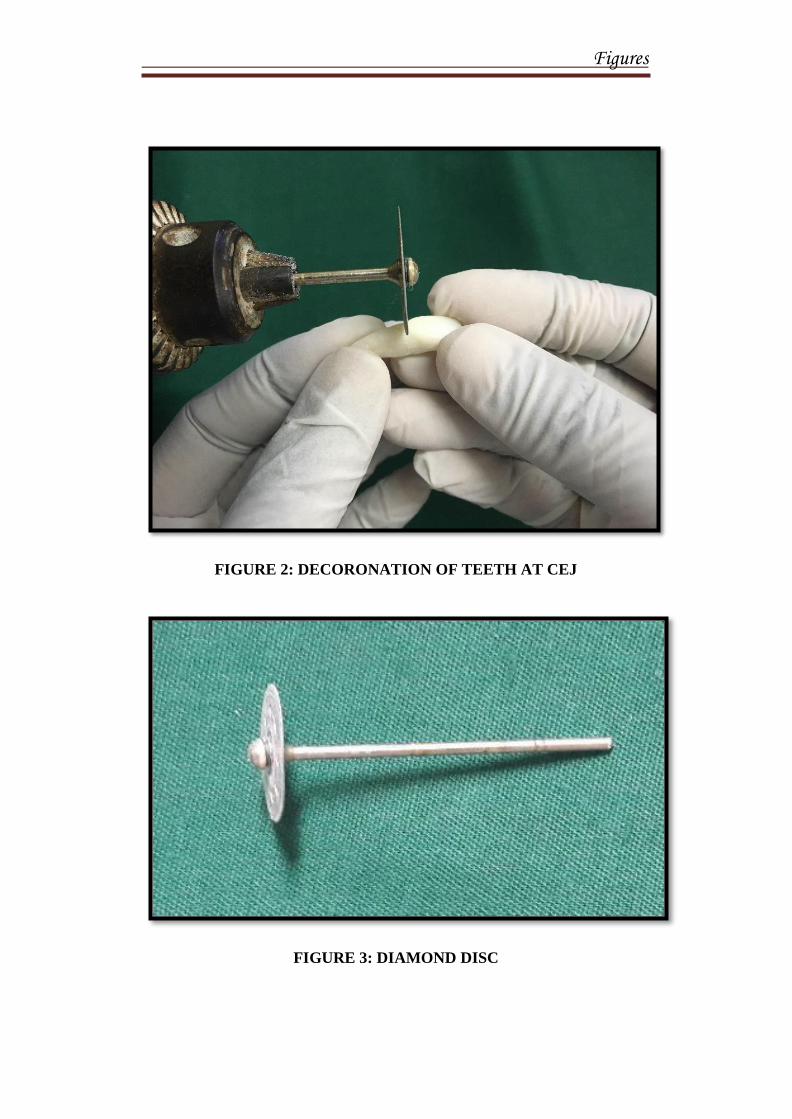
2. Diamond disc
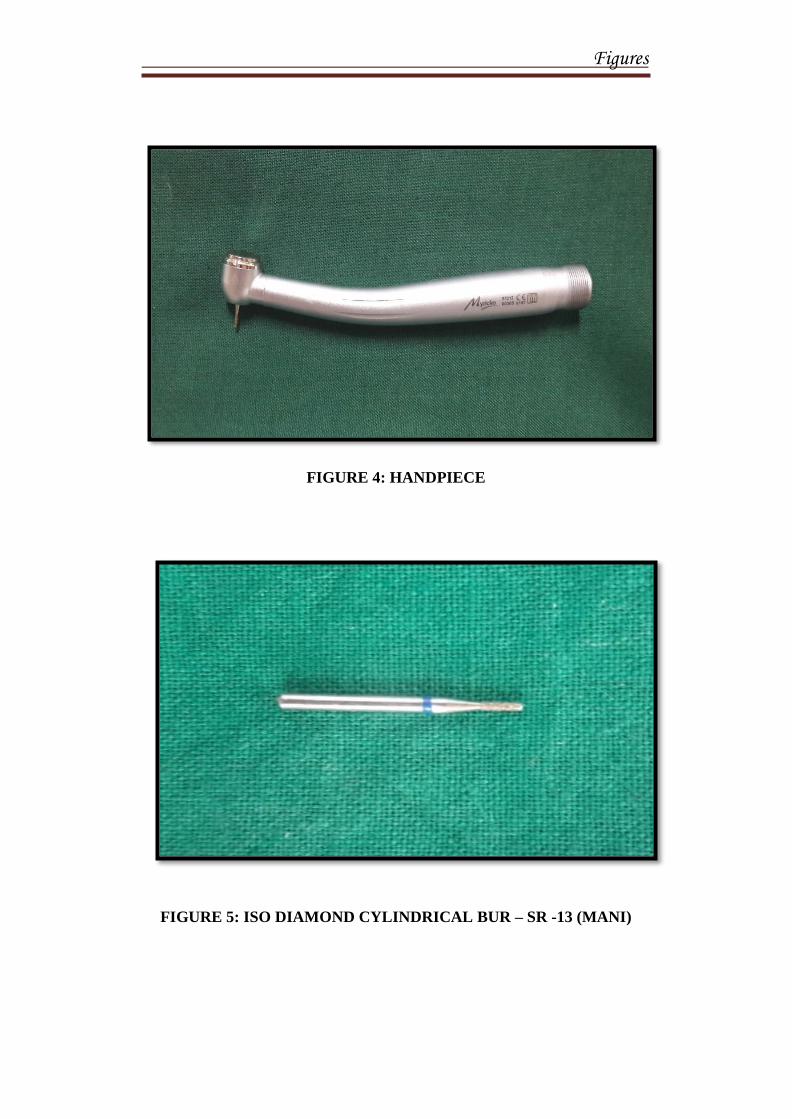
3. Handpiece
4. ISO Diamond Cylindrical Bur – SR -13 (Mani)
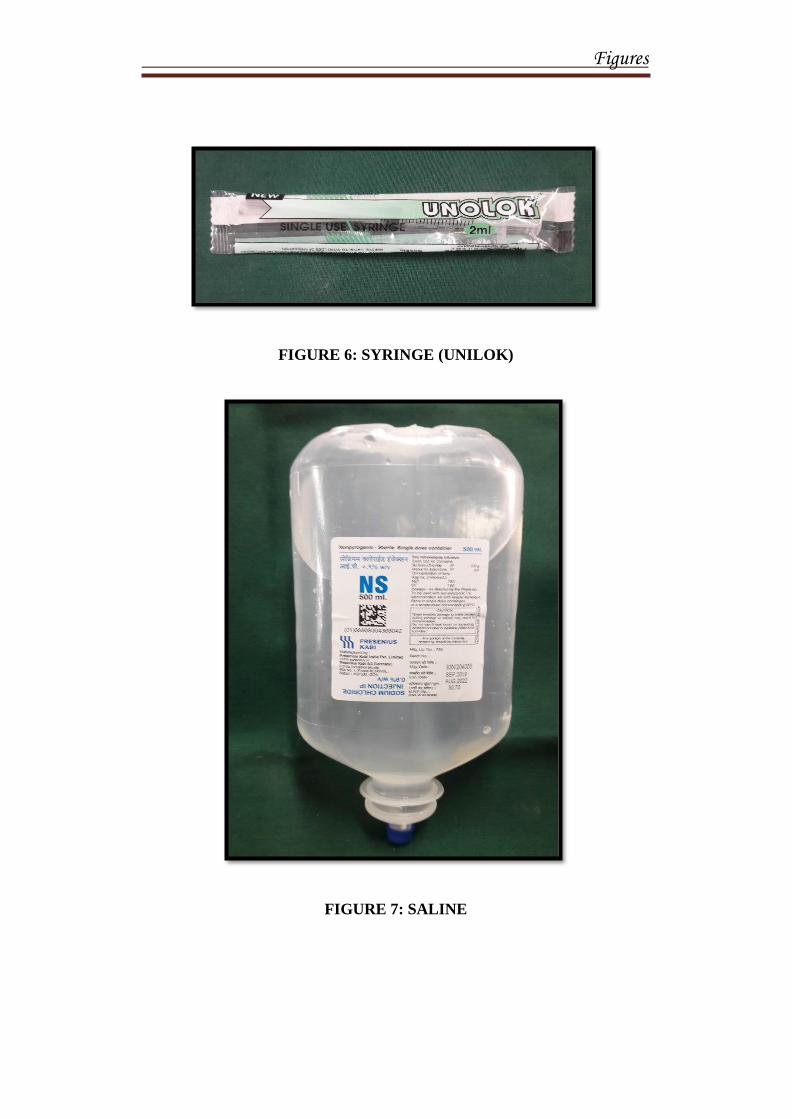
5. Saline
6. Syringe (Unolok)
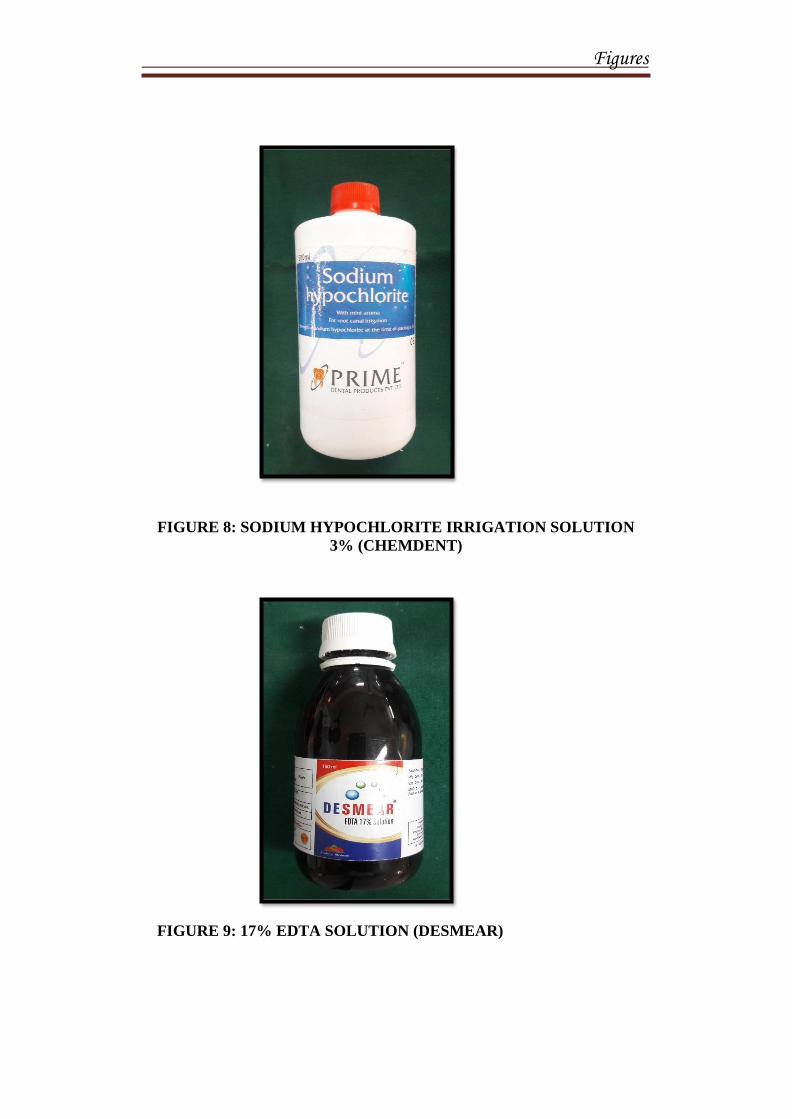
7. Sodium hypochlorite irrigation solution 3% (Chemdent)
8. 17% EDTA solution (Desmear)
9. Human Blood
10. Micropipette
11. MTA Angelus (Angelus)
12. Endocem MTA (Maruchi)
13. Neo MTA plus (Avalon Biomed)
14. Glass ionomer cement Type IX (GC)

24
15. Mixing pad and Agate spatula
16. Glass slab and Cement spatula
17. Plastic instrument
18. Spectrophotometer (Vita Easyshade Compact)

25
FLOW CHART ILLUSTRATING THE METHODOLOGY OF THE
STUDY
All the 40 teeth’s root were removed and crowns were
retained for the study.
A 3mm depth cavity was prepared with a cylindrical bur
(SR-13) on the palatal surface of the teeth.
40 extracted upper central incisors were collected.
The teeth were cleaned with pumice, rinsed and dried.
The teeth are then place in 3% sodium hypochlorite
solution for 30 mins, dried and placed in 17% EDTA
solution for another 2 mins for smear layer removal.
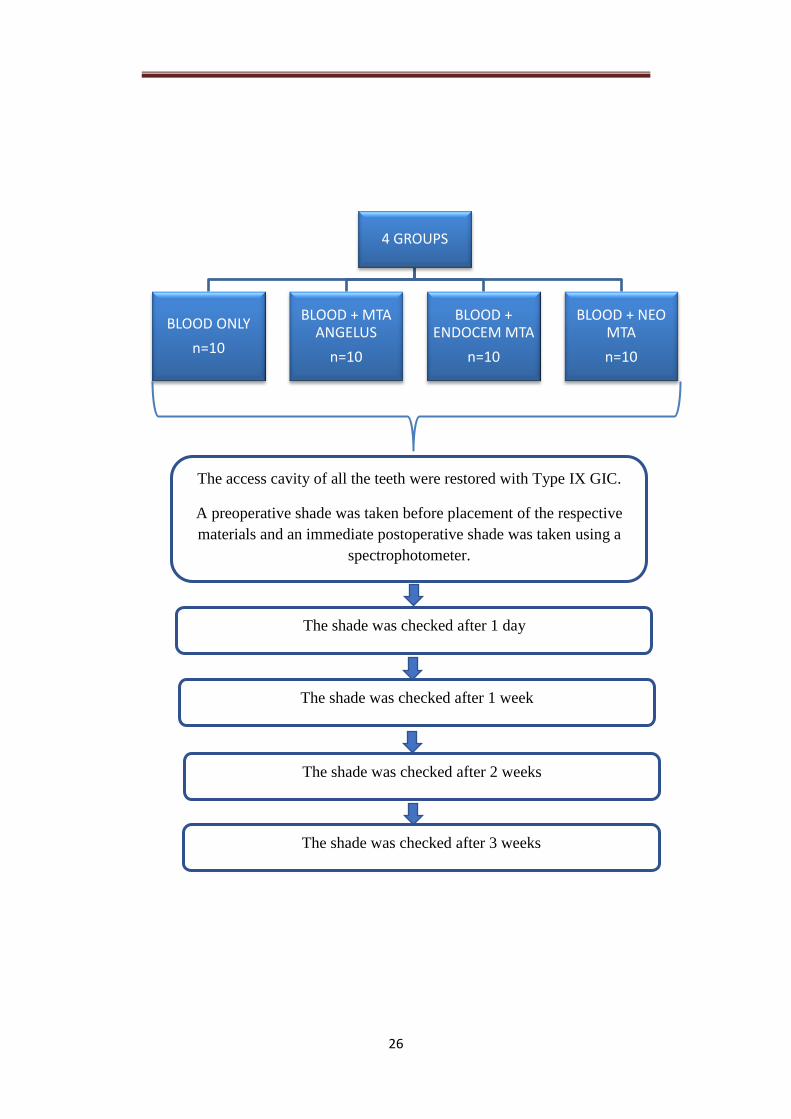
The teeth are divided into 4 groups
26
4 GROUPS
BLOOD ONLY
n=10
BLOOD + MTA ANGELUS
n=10
BLOOD + ENDOCEM MTA
n=10
BLOOD + NEO MTA
n=10
The access cavity of all the teeth were restored with Type IX GIC.
A preoperative shade was taken before placement of the respective
materials and an immediate postoperative shade was taken using a
spectrophotometer.
The shade was checked after 1 day
The shade was checked after 1 week
The shade was checked after 2 weeks
The shade was checked after 3 weeks
27
SELECTION AND PREPARATION OF THE SAMPLES:
BLOOD COLLECTION:
5ml blood was collected by venipuncture from a volunteer in an
anticoagulant spray coated tube that were sterile.
PROCEDURE:
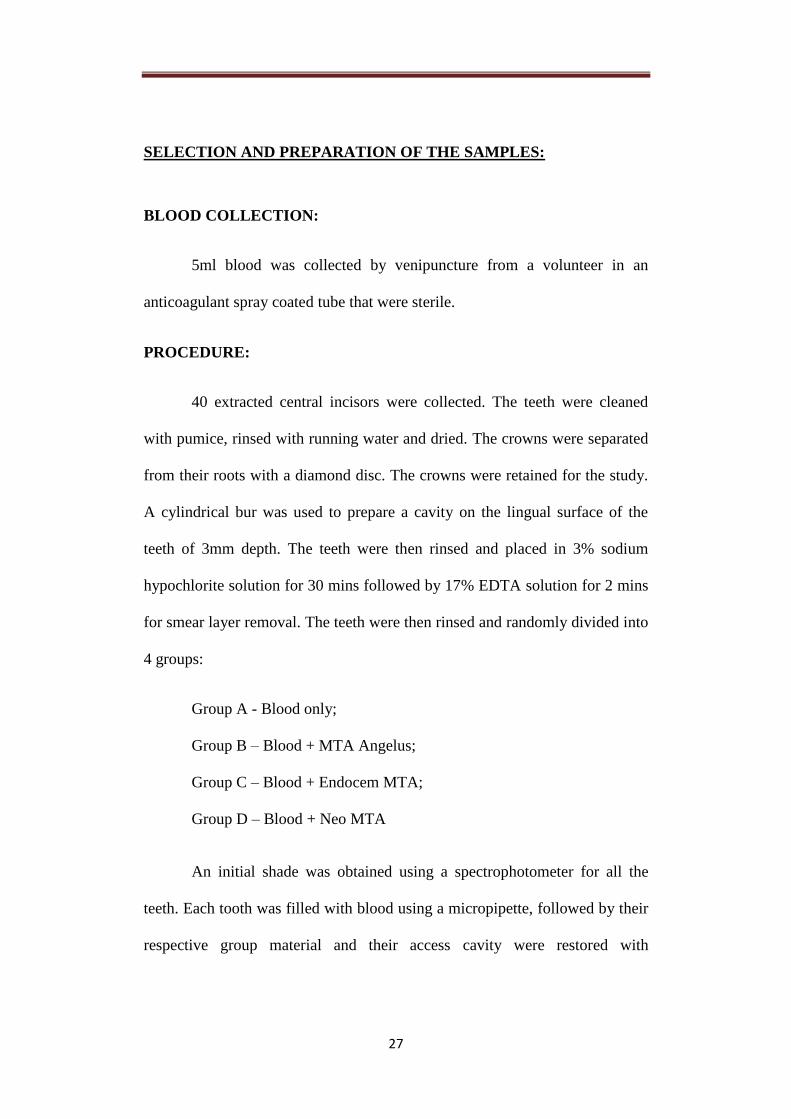
40 extracted central incisors were collected. The teeth were cleaned
with pumice, rinsed with running water and dried. The crowns were separated
from their roots with a diamond disc. The crowns were retained for the study.
A cylindrical bur was used to prepare a cavity on the lingual surface of the
teeth of 3mm depth. The teeth were then rinsed and placed in 3% sodium
hypochlorite solution for 30 mins followed by 17% EDTA solution for 2 mins
for smear layer removal. The teeth were then rinsed and randomly divided into
4 groups:
Group A - Blood only;
Group B – Blood + MTA Angelus;
Group C – Blood + Endocem MTA;
Group D – Blood + Neo MTA
An initial shade was obtained using a spectrophotometer for all the
teeth. Each tooth was filled with blood using a micropipette, followed by their
respective group material and their access cavity were restored with
28
Type IX GIC. In Group A, the cavities were filled only with 2.0μL blood
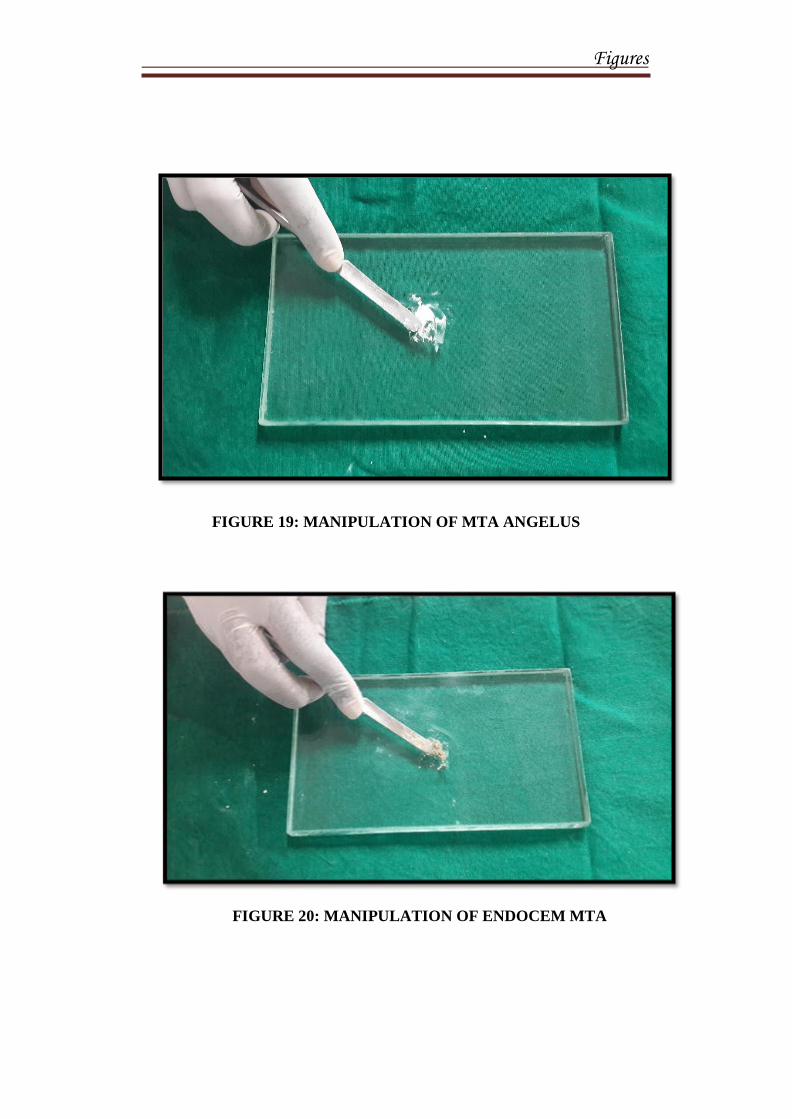
followed by GIC restoration. In Group B, the cavities were filled with 0.5μL
blood followed by MTA Angelus using a plastic instrument and restored with
GIC. MTA Angelus was mixed as per the manufacturer’s instructions and
placed within the cavity with the plastic instrument. In Group C, the cavities
were filled with 0.5μL blood, then Endocem MTA was mixed and placed in
the cavity with a plastic instrument followed by GIC restoration. In Group D,
the cavities were filled with 0.5μL blood followed by Neo MTA, which was
mixed and placed within the cavity with a plastic instrument. After which the
access cavities were restored with type IX GIC. An immediate postoperative
shade was obtained with the Spectrophotometer. The samples were then stored
in tap water at room temperature. Each group’s shade was measured after one
day, 1 week, 2 weeks and 3 weeks. ∆E values were obtained from the samples
and analysed.
∆E Measurements:
The Spectrophotometer is a device used to measure the shade of the
tooth. The conducting end is placed on the middle third of the tooth’s labial
surface and the device is activated to measure the ∆E value. This value
consists of L (Lightness), c (chroma), h (hue) measurements.
L*c*h = ∆E
29
Statistical Analysis:
One -way ANOVA (analysis of variance) – to assess significant
differences between the tested materials.
Bonferroni multiple - comparison test

Figures
Figures
FIGURE 1: EXTRACTED HUMAN UPPER CENTRAL INCISORS
Figures
FIGURE 2: DECORONATION OF TEETH AT CEJ
FIGURE 3: DIAMOND DISC
Figures
FIGURE 4: HANDPIECE
FIGURE 5: ISO DIAMOND CYLINDRICAL BUR – SR -13 (MANI)
Figures
FIGURE 6: SYRINGE (UNILOK)
FIGURE 7: SALINE
Figures
FIGURE 8: SODIUM HYPOCHLORITE IRRIGATION SOLUTION
3% (CHEMDENT)
FIGURE 9: 17% EDTA SOLUTION (DESMEAR)
Figures
FIGURE 10: MICROPIPETTE
FIGURE 11: MTA (MICRO ANGELUS)
Figures
FIGURE 12: ENDOCEM MTA (MARUCHI)
FIGURE 13: NEO MTA PLUS (AVALON BIOMED)
Figures
FIGURE 14: GLASS IONOMER CEMENT TYPE IX (GC), MIXING
PAD AND AGATE SPATULA
FIGURE 15: GLASS SLAB AND CEMENT SPATULA
Figures
FIGURE 16: PLASTIC INSTRUMENT
FIGURE 17: CAVITY PREPARATION

Figures
FIGURE 18: SPECTROPHOTOMETER
Figures
FIGURE 19: MANIPULATION OF MTA ANGELUS
FIGURE 20: MANIPULATION OF ENDOCEM MTA

Figures
FIGURE 21: MANIPULATION OF NEO MTA
Figures
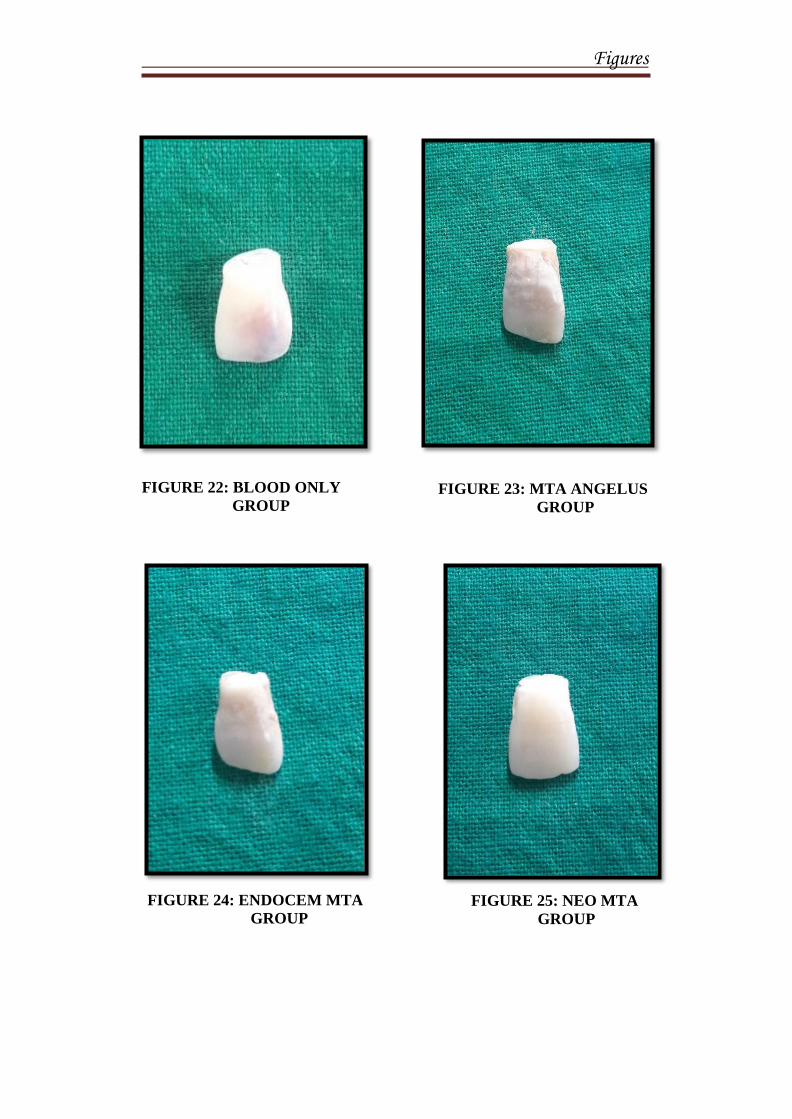
FIGURE 22: BLOOD ONLY
GROUP FIGURE 23: MTA ANGELUS
GROUP
FIGURE 24: ENDOCEM MTA
GROUP FIGURE 25: NEO MTA
GROUP

Figures
A
B
C
FIGURE 26: POSTOPERATIVE SAMPLES
D

Results
Results
30
RESULTS
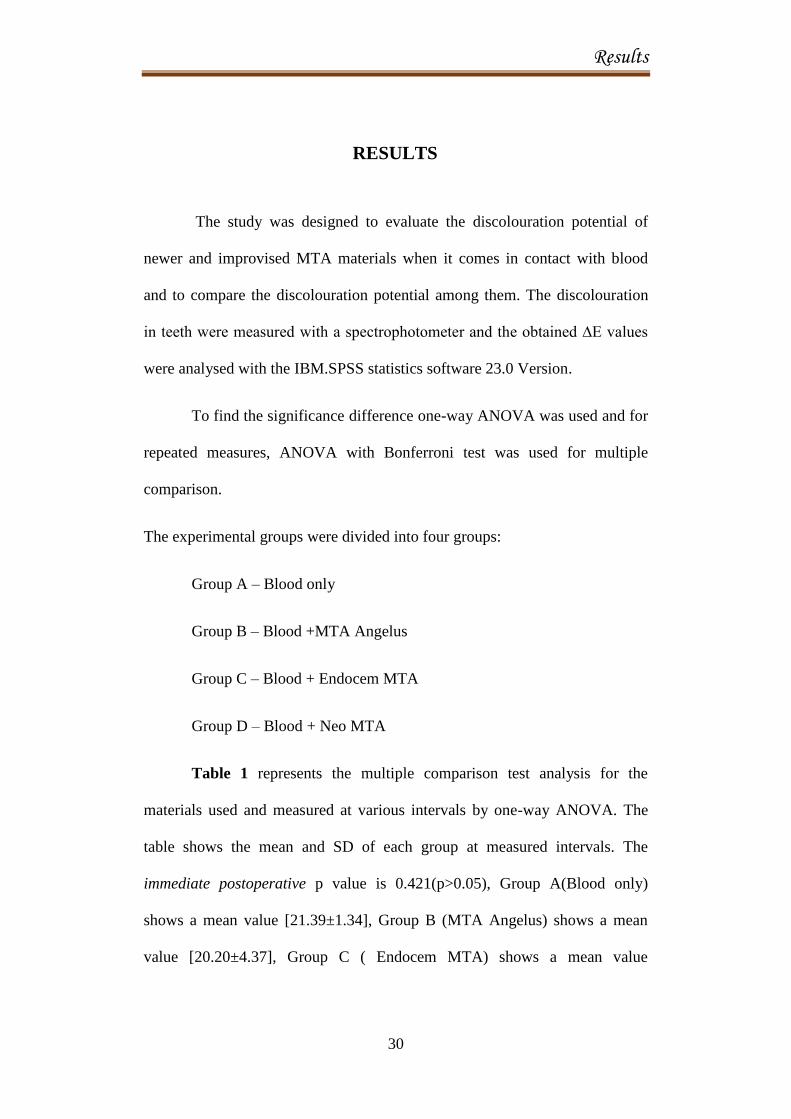
The study was designed to evaluate the discolouration potential of
newer and improvised MTA materials when it comes in contact with blood
and to compare the discolouration potential among them. The discolouration
in teeth were measured with a spectrophotometer and the obtained ∆E values
were analysed with the IBM.SPSS statistics software 23.0 Version.
To find the significance difference one-way ANOVA was used and for
repeated measures, ANOVA with Bonferroni test was used for multiple
comparison.
The experimental groups were divided into four groups:
Group A – Blood only
Group B – Blood +MTA Angelus
Group C – Blood + Endocem MTA
Group D – Blood + Neo MTA
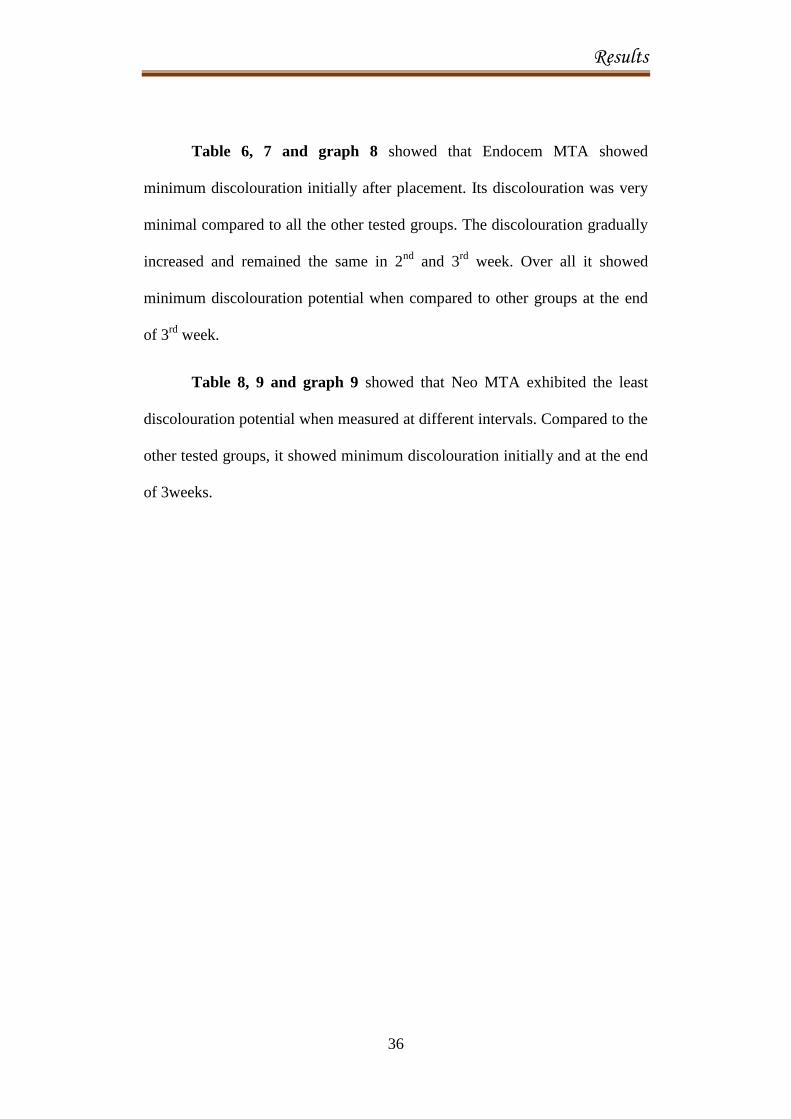
Table 1 represents the multiple comparison test analysis for the
materials used and measured at various intervals by one-way ANOVA. The
table shows the mean and SD of each group at measured intervals. The
immediate postoperative p value is 0.421(p>0.05), Group A(Blood only)
shows a mean value [21.39±1.34], Group B (MTA Angelus) shows a mean
value [20.20±4.37], Group C ( Endocem MTA) shows a mean value
Results
31
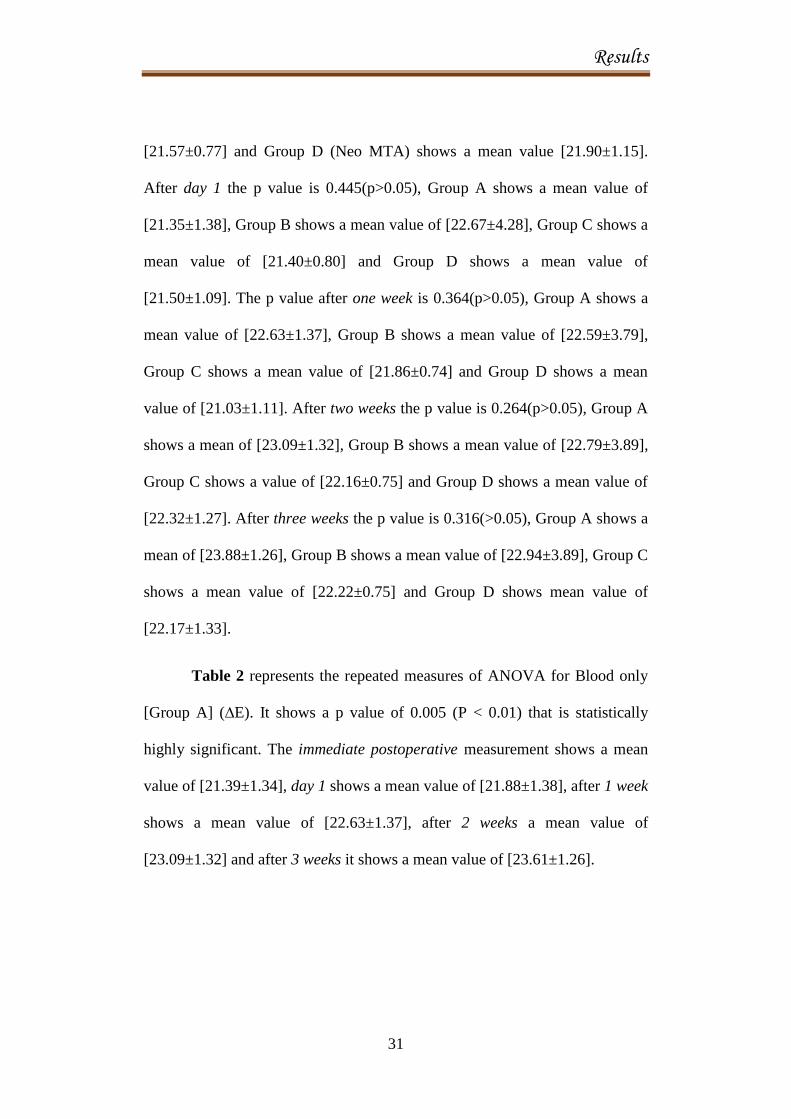
[21.57±0.77] and Group D (Neo MTA) shows a mean value [21.90±1.15].
After day 1 the p value is 0.445(p>0.05), Group A shows a mean value of
[21.35±1.38], Group B shows a mean value of [22.67±4.28], Group C shows a
mean value of [21.40±0.80] and Group D shows a mean value of
[21.50±1.09]. The p value after one week is 0.364(p>0.05), Group A shows a
mean value of [22.63±1.37], Group B shows a mean value of [22.59±3.79],
Group C shows a mean value of [21.86±0.74] and Group D shows a mean
value of [21.03±1.11]. After two weeks the p value is 0.264(p>0.05), Group A
shows a mean of [23.09±1.32], Group B shows a mean value of [22.79±3.89],
Group C shows a value of [22.16±0.75] and Group D shows a mean value of
[22.32±1.27]. After three weeks the p value is 0.316(>0.05), Group A shows a
mean of [23.88±1.26], Group B shows a mean value of [22.94±3.89], Group C
shows a mean value of [22.22±0.75] and Group D shows mean value of
[22.17±1.33].
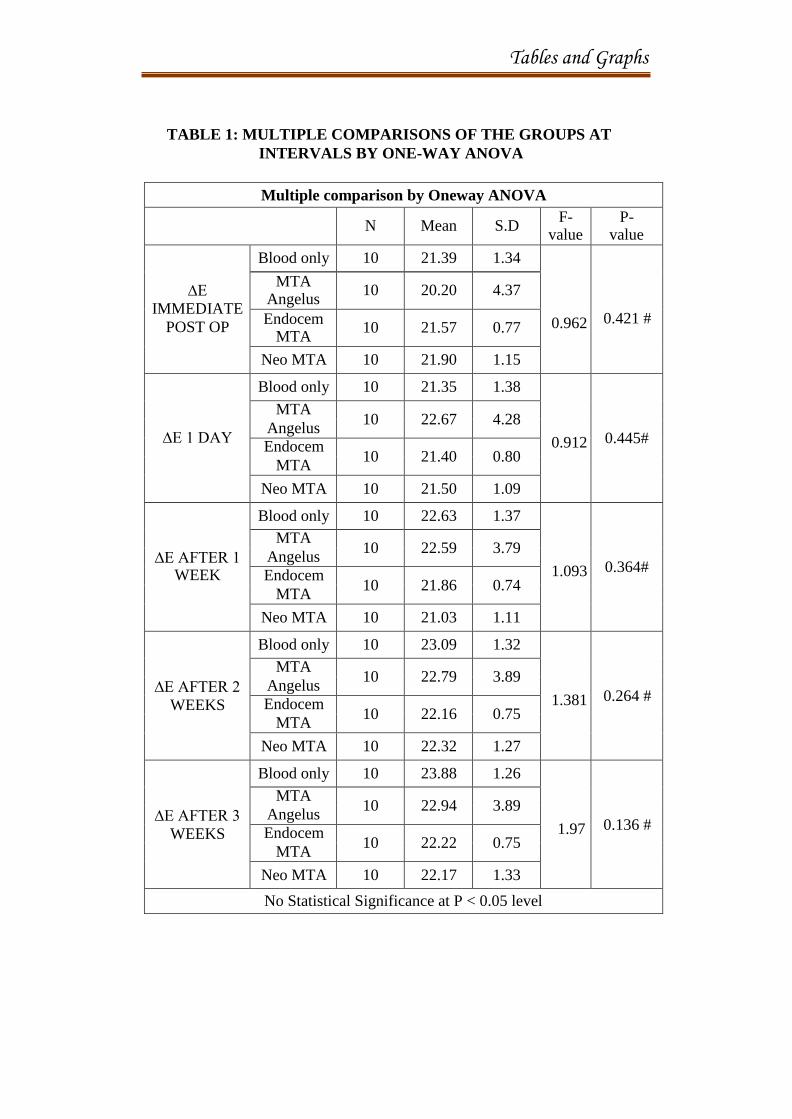
Table 2 represents the repeated measures of ANOVA for Blood only
[Group A] (∆E). It shows a p value of 0.005 (P < 0.01) that is statistically
highly significant. The immediate postoperative measurement shows a mean
value of [21.39±1.34], day 1 shows a mean value of [21.88±1.38], after 1 week
shows a mean value of [22.63±1.37], after 2 weeks a mean value of
[23.09±1.32] and after 3 weeks it shows a mean value of [23.61±1.26].
Results
32
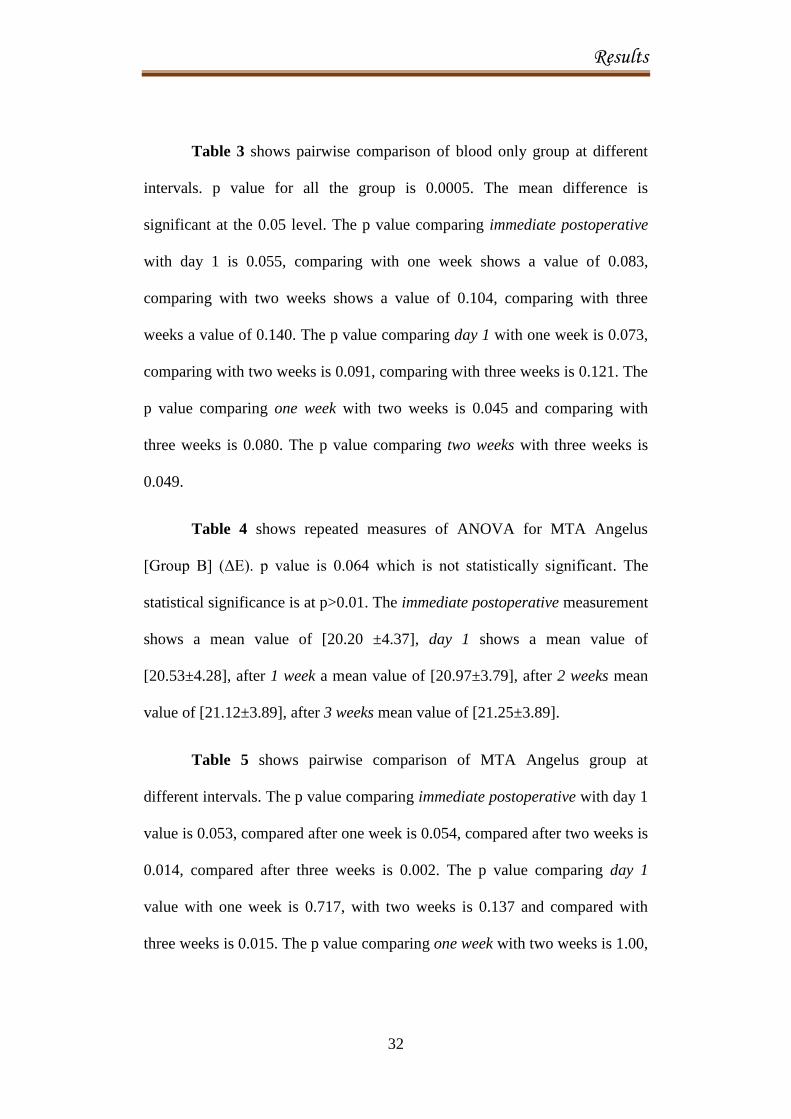
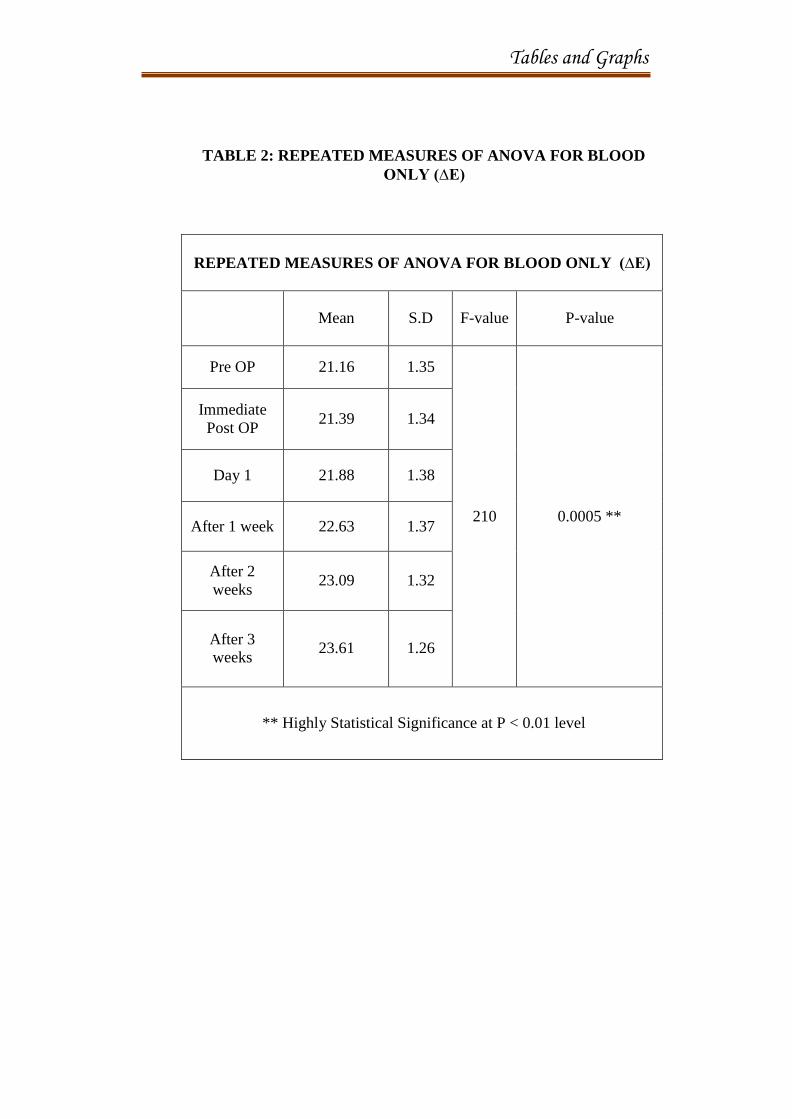
Table 3 shows pairwise comparison of blood only group at different
intervals. p value for all the group is 0.0005. The mean difference is
significant at the 0.05 level. The p value comparing immediate postoperative
with day 1 is 0.055, comparing with one week shows a value of 0.083,
comparing with two weeks shows a value of 0.104, comparing with three
weeks a value of 0.140. The p value comparing day 1 with one week is 0.073,
comparing with two weeks is 0.091, comparing with three weeks is 0.121. The
p value comparing one week with two weeks is 0.045 and comparing with
three weeks is 0.080. The p value comparing two weeks with three weeks is
0.049.
Table 4 shows repeated measures of ANOVA for MTA Angelus
[Group B] (ΔE). p value is 0.064 which is not statistically significant. The
statistical significance is at p>0.01. The immediate postoperative measurement
shows a mean value of [20.20 ±4.37], day 1 shows a mean value of
[20.53±4.28], after 1 week a mean value of [20.97±3.79], after 2 weeks mean
value of [21.12±3.89], after 3 weeks mean value of [21.25±3.89].
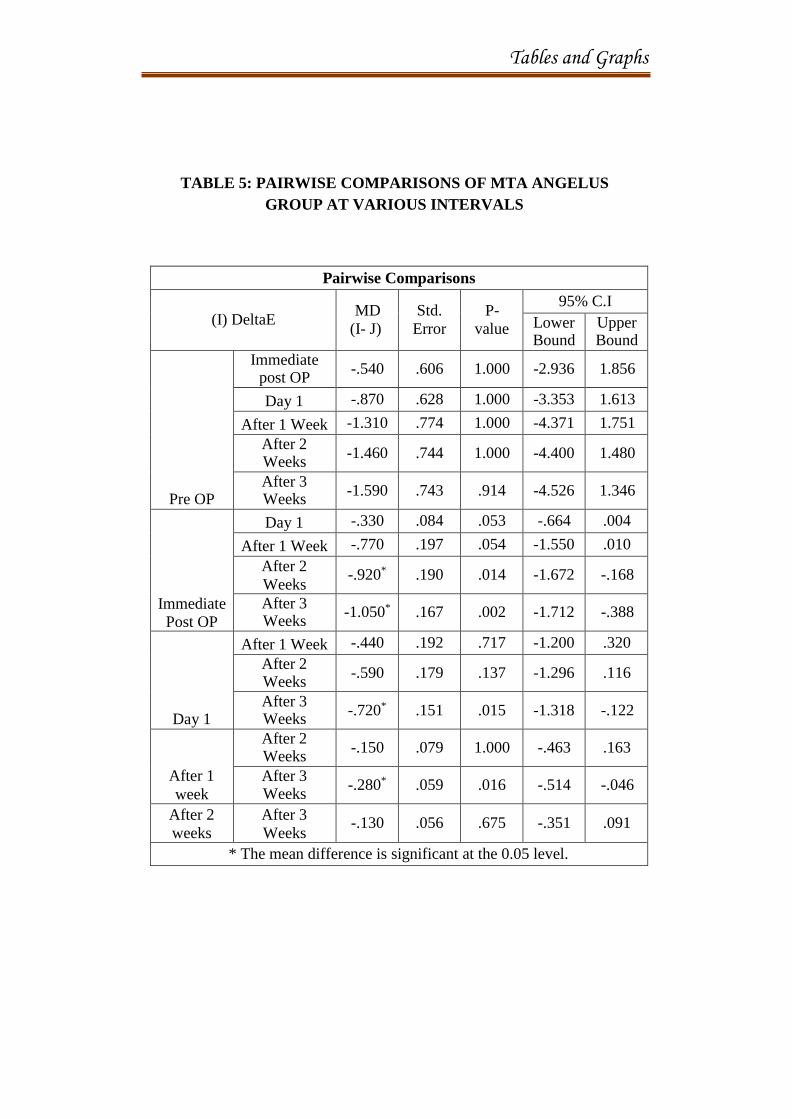
Table 5 shows pairwise comparison of MTA Angelus group at
different intervals. The p value comparing immediate postoperative with day 1
value is 0.053, compared after one week is 0.054, compared after two weeks is
0.014, compared after three weeks is 0.002. The p value comparing day 1
value with one week is 0.717, with two weeks is 0.137 and compared with
three weeks is 0.015. The p value comparing one week with two weeks is 1.00,
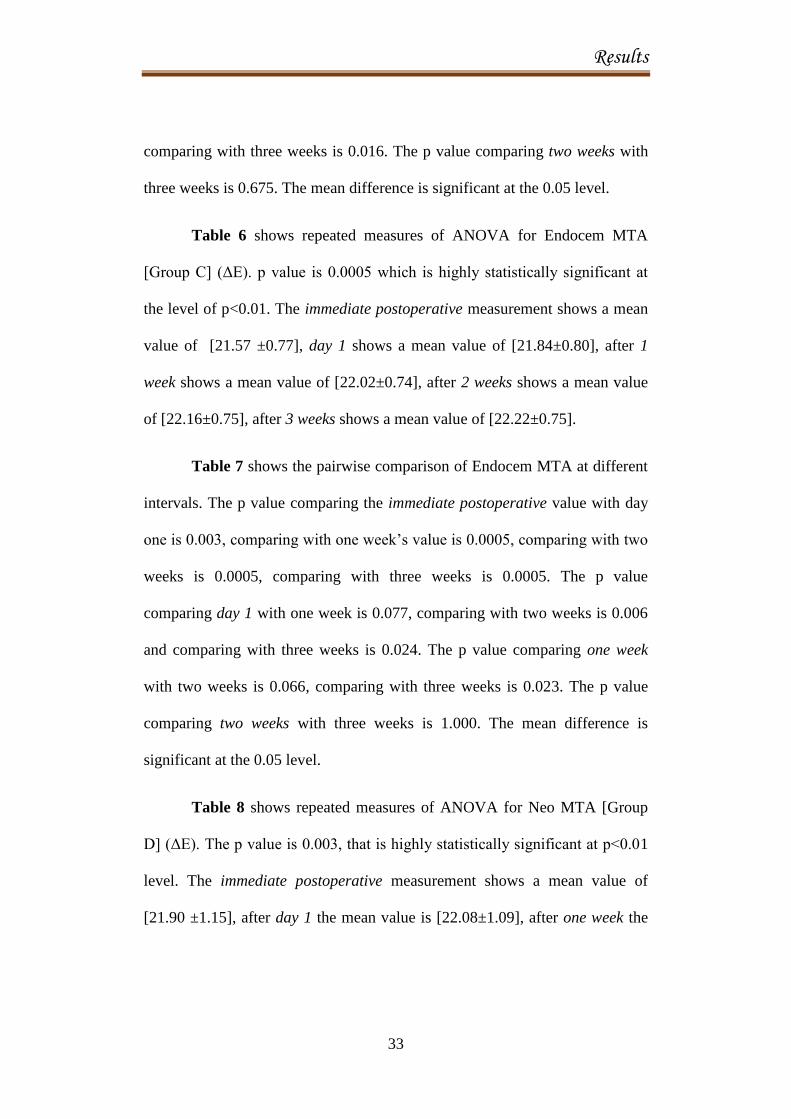
Results
33
comparing with three weeks is 0.016. The p value comparing two weeks with
three weeks is 0.675. The mean difference is significant at the 0.05 level.
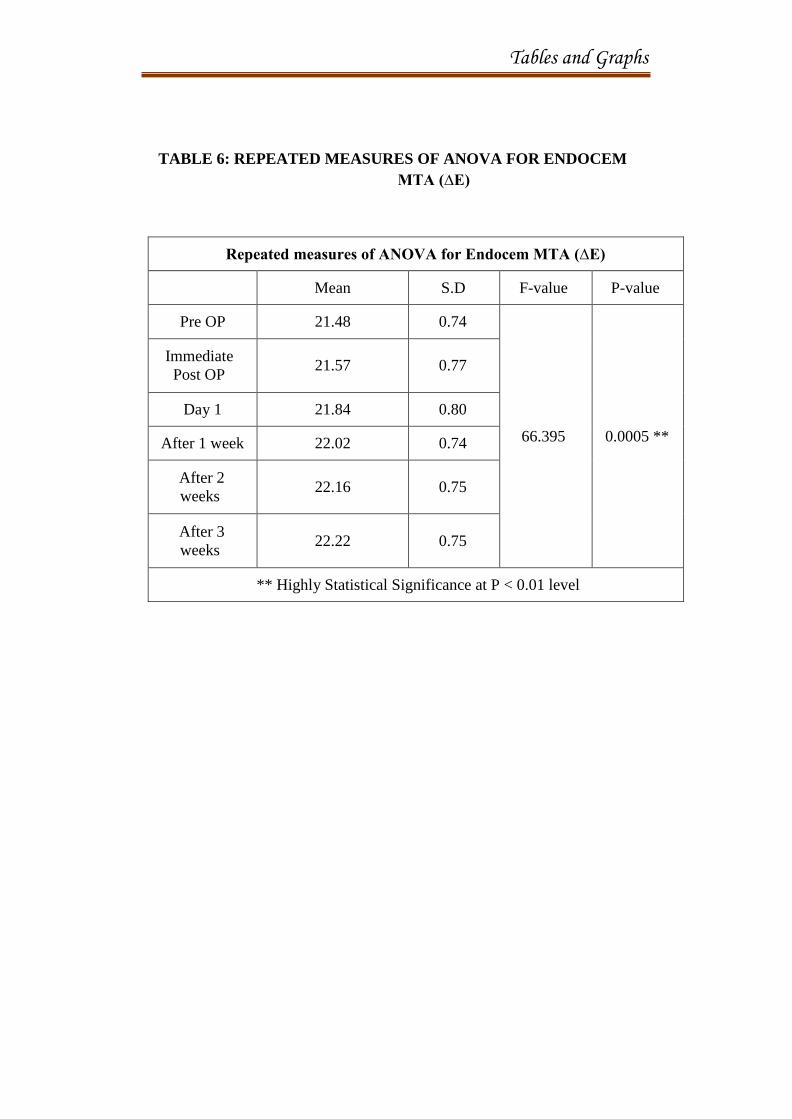
Table 6 shows repeated measures of ANOVA for Endocem MTA
[Group C] (ΔE). p value is 0.0005 which is highly statistically significant at
the level of p<0.01. The immediate postoperative measurement shows a mean
value of [21.57 ±0.77], day 1 shows a mean value of [21.84±0.80], after 1
week shows a mean value of [22.02±0.74], after 2 weeks shows a mean value
of [22.16±0.75], after 3 weeks shows a mean value of [22.22±0.75].
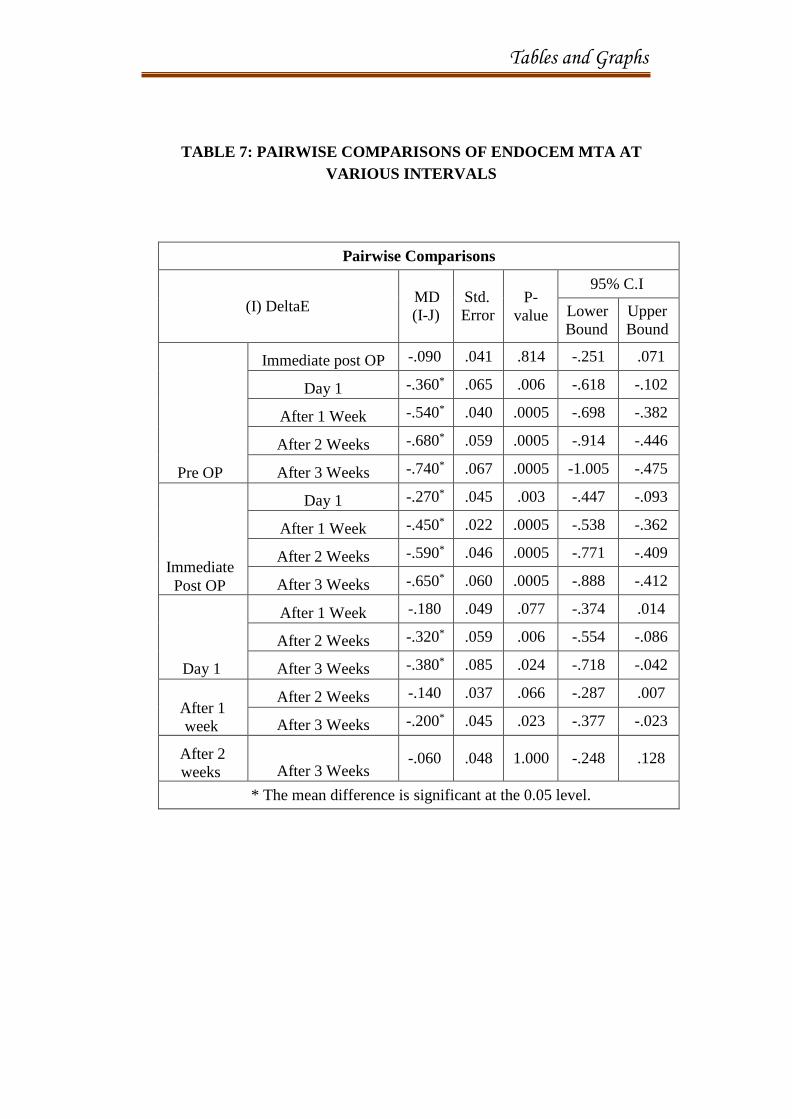
Table 7 shows the pairwise comparison of Endocem MTA at different
intervals. The p value comparing the immediate postoperative value with day
one is 0.003, comparing with one week’s value is 0.0005, comparing with two
weeks is 0.0005, comparing with three weeks is 0.0005. The p value
comparing day 1 with one week is 0.077, comparing with two weeks is 0.006
and comparing with three weeks is 0.024. The p value comparing one week
with two weeks is 0.066, comparing with three weeks is 0.023. The p value
comparing two weeks with three weeks is 1.000. The mean difference is
significant at the 0.05 level.
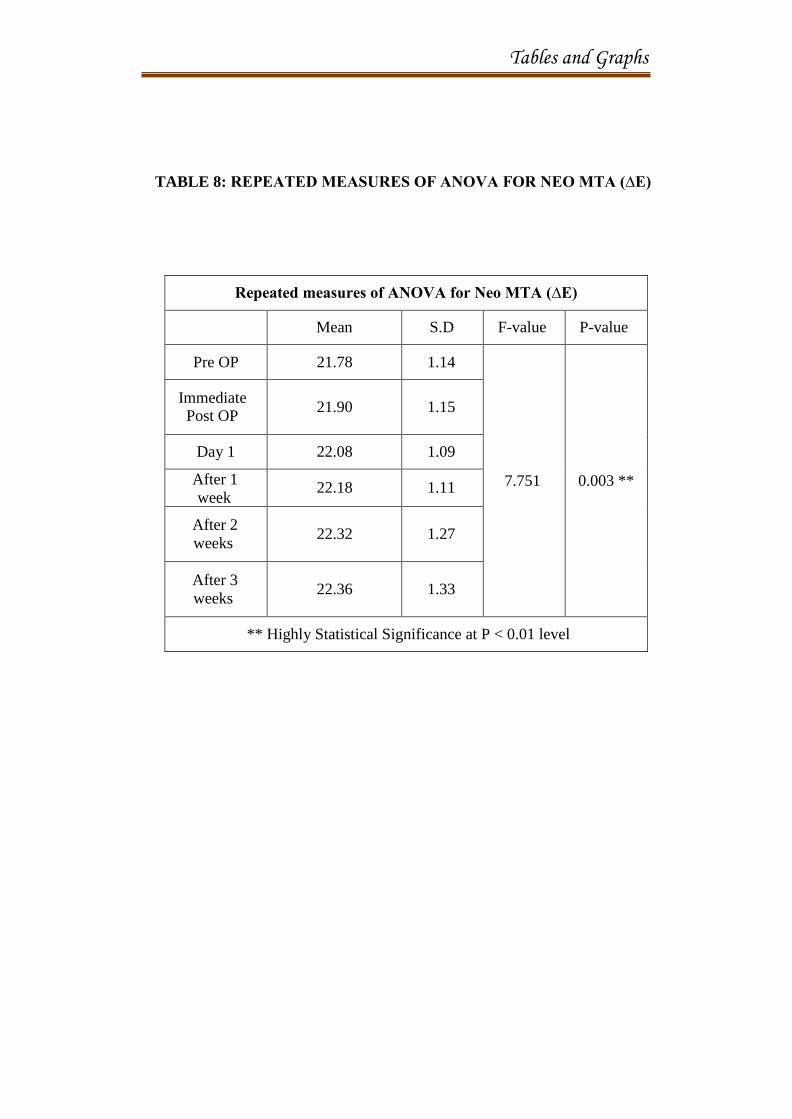
Table 8 shows repeated measures of ANOVA for Neo MTA [Group
D] (ΔE). The p value is 0.003, that is highly statistically significant at p<0.01
level. The immediate postoperative measurement shows a mean value of
[21.90 ±1.15], after day 1 the mean value is [22.08±1.09], after one week the
Results
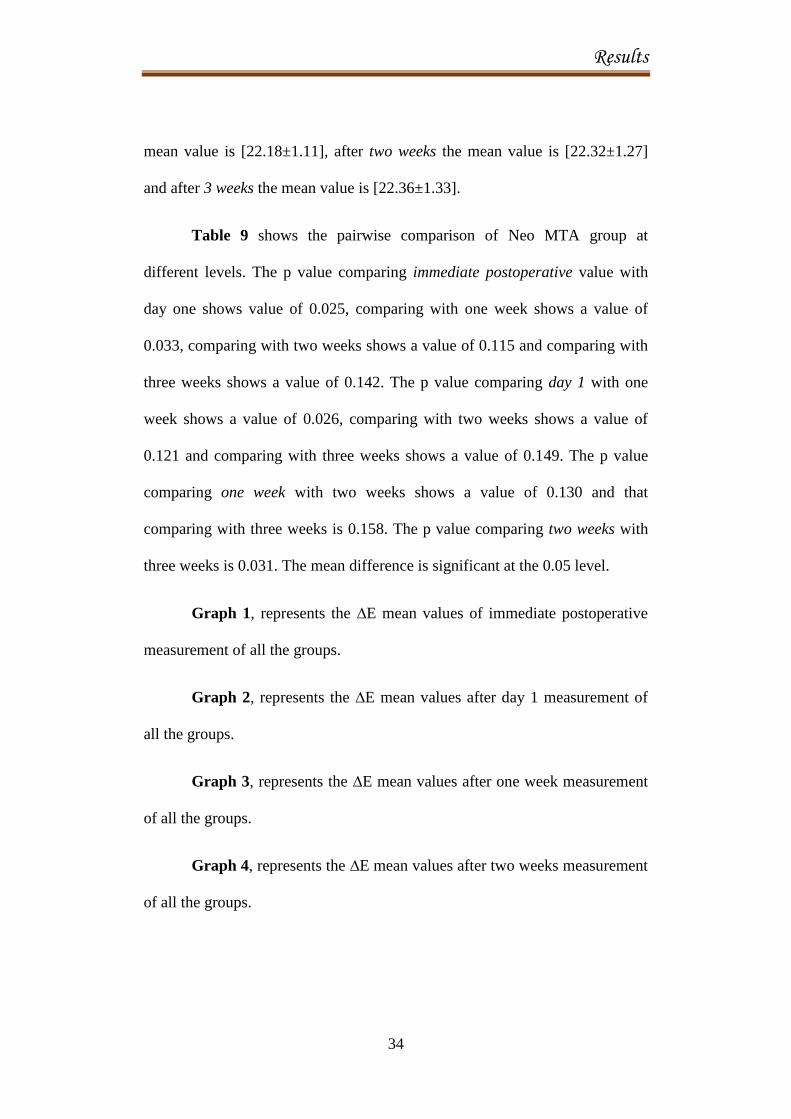
34
mean value is [22.18±1.11], after two weeks the mean value is [22.32±1.27]
and after 3 weeks the mean value is [22.36±1.33].
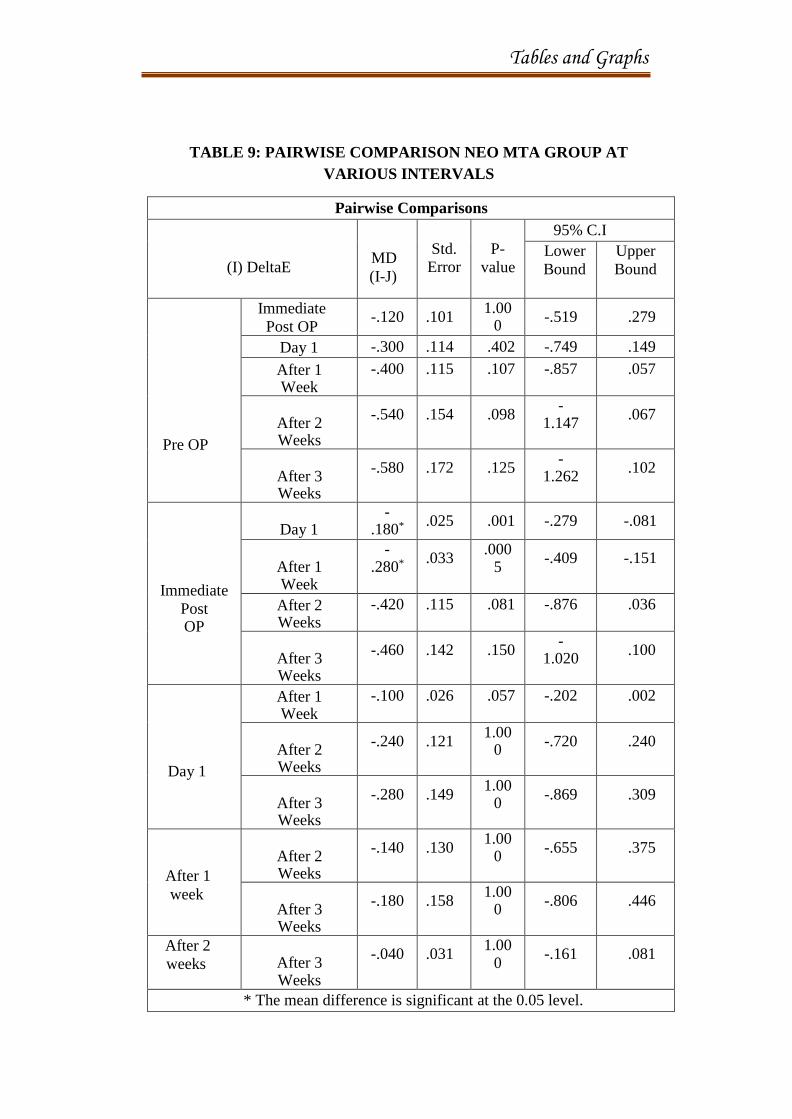
Table 9 shows the pairwise comparison of Neo MTA group at
different levels. The p value comparing immediate postoperative value with
day one shows value of 0.025, comparing with one week shows a value of
0.033, comparing with two weeks shows a value of 0.115 and comparing with
three weeks shows a value of 0.142. The p value comparing day 1 with one
week shows a value of 0.026, comparing with two weeks shows a value of
0.121 and comparing with three weeks shows a value of 0.149. The p value
comparing one week with two weeks shows a value of 0.130 and that
comparing with three weeks is 0.158. The p value comparing two weeks with
three weeks is 0.031. The mean difference is significant at the 0.05 level.
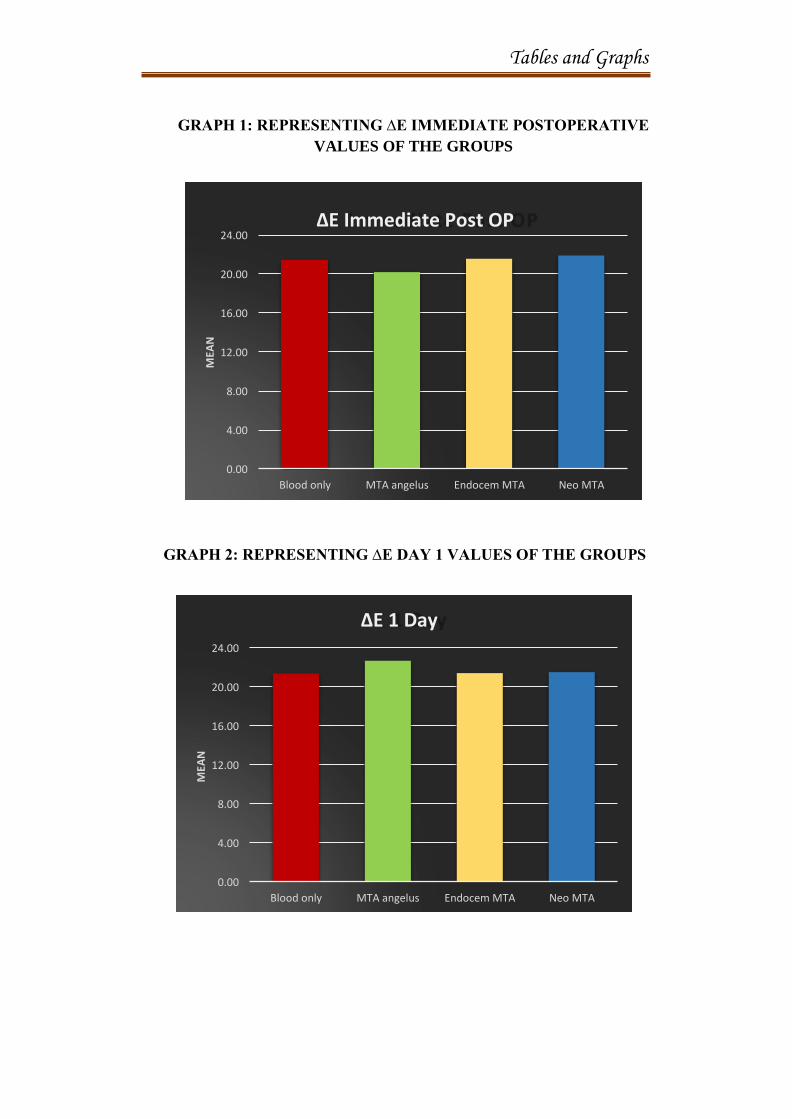
Graph 1, represents the ∆E mean values of immediate postoperative
measurement of all the groups.
Graph 2, represents the ∆E mean values after day 1 measurement of
all the groups.
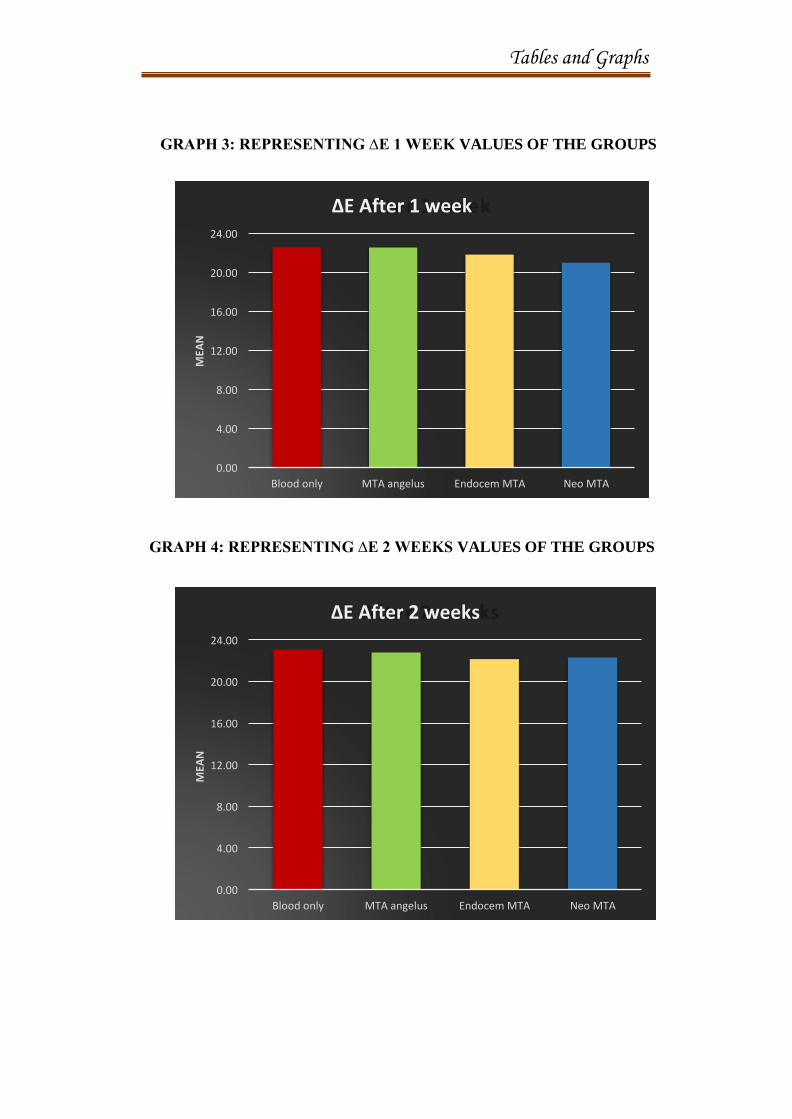
Graph 3, represents the ∆E mean values after one week measurement
of all the groups.
Graph 4, represents the ∆E mean values after two weeks measurement
of all the groups.
Results
35
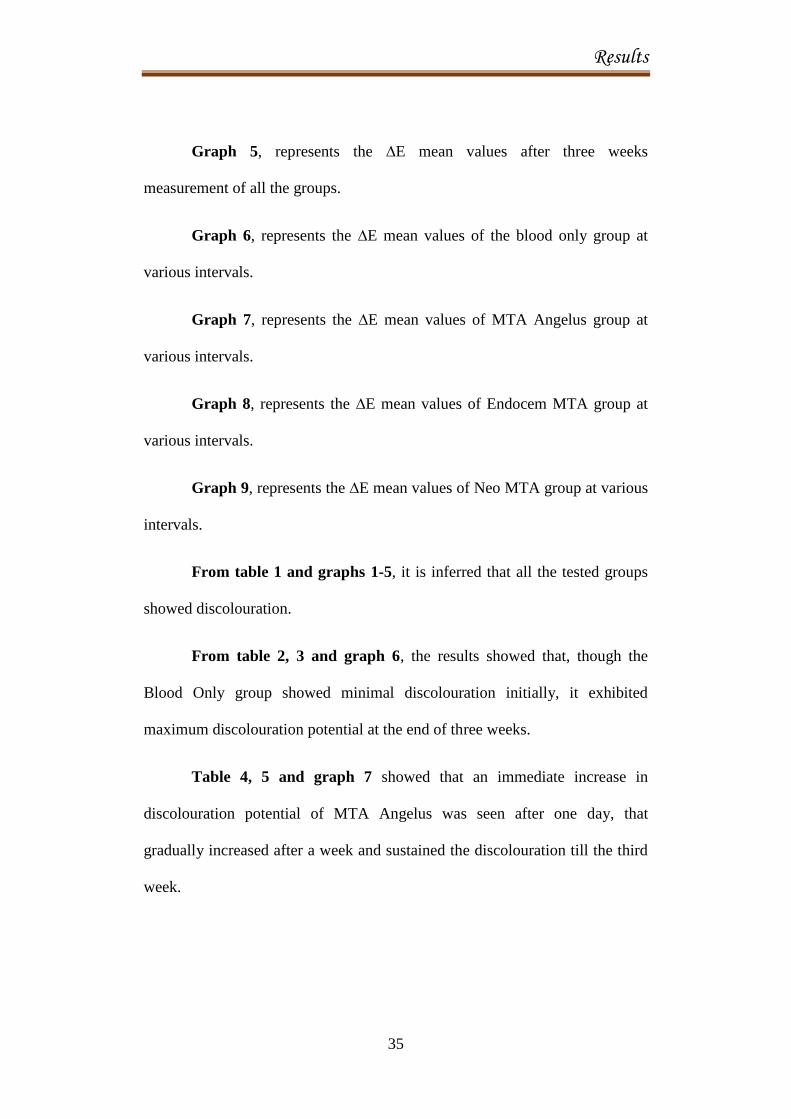
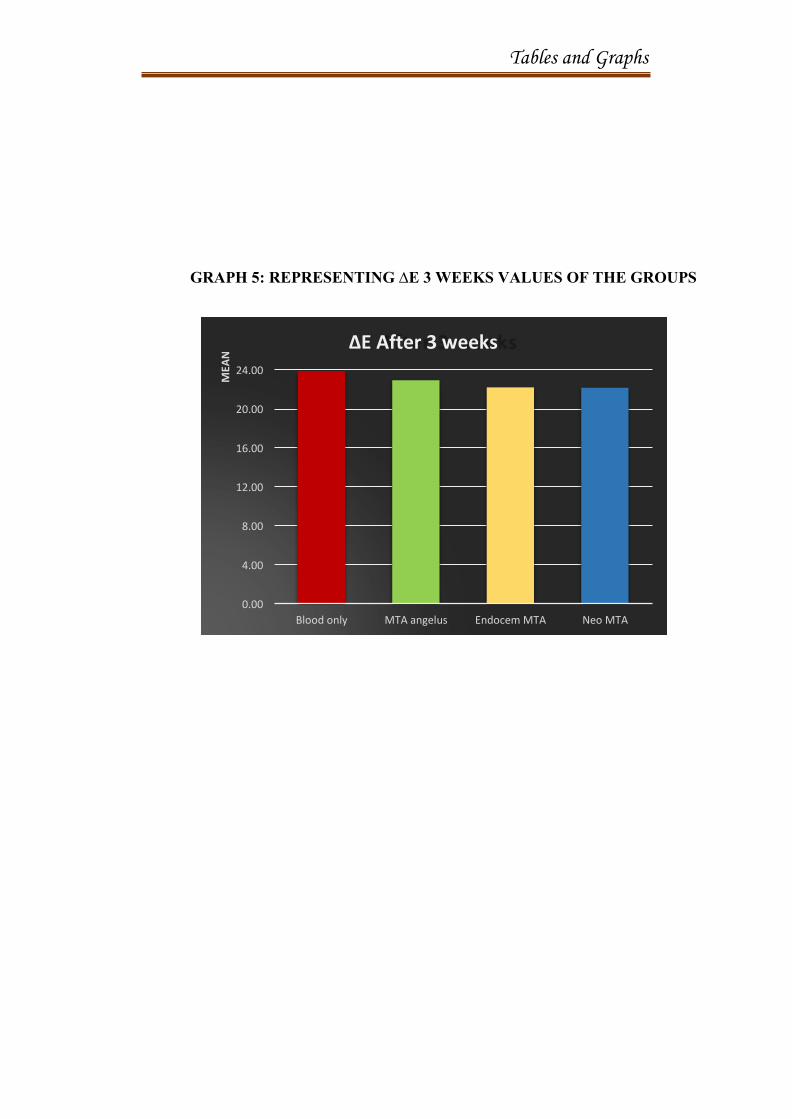
Graph 5, represents the ∆E mean values after three weeks
measurement of all the groups.
Graph 6, represents the ∆E mean values of the blood only group at
various intervals.
Graph 7, represents the ∆E mean values of MTA Angelus group at
various intervals.
Graph 8, represents the ∆E mean values of Endocem MTA group at
various intervals.
Graph 9, represents the ∆E mean values of Neo MTA group at various
intervals.
From table 1 and graphs 1-5, it is inferred that all the tested groups
showed discolouration.
From table 2, 3 and graph 6, the results showed that, though the
Blood Only group showed minimal discolouration initially, it exhibited
maximum discolouration potential at the end of three weeks.
Table 4, 5 and graph 7 showed that an immediate increase in
discolouration potential of MTA Angelus was seen after one day, that
gradually increased after a week and sustained the discolouration till the third
week.
Results
36
Table 6, 7 and graph 8 showed that Endocem MTA showed
minimum discolouration initially after placement. Its discolouration was very
minimal compared to all the other tested groups. The discolouration gradually
increased and remained the same in 2nd
and 3rd
week. Over all it showed
minimum discolouration potential when compared to other groups at the end
of 3rd
week.
Table 8, 9 and graph 9 showed that Neo MTA exhibited the least
discolouration potential when measured at different intervals. Compared to the
other tested groups, it showed minimum discolouration initially and at the end
of 3weeks.

Tables and Graphs
Tables and Graphs
Multiple comparison by Oneway ANOVA
N Mean S.D
F- value
P- value
Blood only 10 21.39 1.34
∆E
IMMEDIATE
POST OP
MTA Angelus
10 20.20 4.37
0.962
0.421 # Endocem MTA
10 21.57 0.77
Neo MTA 10 21.90 1.15
Blood only 10 21.35 1.38
MTA 10 22.67 4.28
∆E 1 DAY Angelus
0.912 0.445# Endocem
10 21.40 0.80 MTA
Neo MTA 10 21.50 1.09
Blood only 10 22.63 1.37
MTA 10 22.59 3.79
∆E AFTER 1 WEEK
Angelus 1.093 0.364#
Endocem 10 21.86 0.74
MTA
Neo MTA 10 21.03 1.11
Blood only 10 23.09 1.32
MTA 10 22.79 3.89
∆E AFTER 2
WEEKS
Angelus 1.381 0.264 #
Endocem 10 22.16 0.75
MTA
Neo MTA 10 22.32 1.27
Blood only 10 23.88 1.26
MTA 10 22.94 3.89
∆E AFTER 3
WEEKS
Angelus 1.97 0.136 #
Endocem 10 22.22 0.75
MTA
Neo MTA 10 22.17 1.33
No Statistical Significance at P < 0.05 level
TABLE 1: MULTIPLE COMPARISONS OF THE GROUPS AT
INTERVALS BY ONE-WAY ANOVA
Tables and Graphs
REPEATED MEASURES OF ANOVA FOR BLOOD ONLY (∆E)
Mean
S.D
F-value
P-value
Pre OP 21.16 1.35
210
0.0005 **
Immediate
Post OP
21.39
1.34
Day 1
21.88
1.38
After 1 week 22.63 1.37
After 2
weeks
23.09
1.32
After 3 weeks
23.61
1.26
** Highly Statistical Significance at P < 0.01 level
TABLE 2: REPEATED MEASURES OF ANOVA FOR BLOOD
ONLY (∆E)
Tables and Graphs
Pairwise Comparisons
(I) DeltaE
MD (I-
J)
Std.
Error
P-value
95% C.I
Lower
Bound
Upper
Bound
Pre OP
Immediate post OP
-.230*
.026
.0005
-.333
-.127
Day 1 -.720* .071 .0005 -1.001 -.439
After 1 Week -1.470* .101 .0005 -1.870 -1.070
After 2 Weeks -1.930* .123 .0005 -2.416 -1.444
After 3 Weeks -2.450* .159 .0005 -3.080 -1.820
Immediate
Post OP
Day 1 -.490* .055 .0005 -.706 -.274
After 1 Week -1.240* .083 .0005 -1.569 -.911
After 2 Weeks -1.700* .104 .0005 -2.113 -1.287
After 3 Weeks -2.220* .140 .0005 -2.772 -1.668
Day 1
After 1 Week -.750* .073 .0005 -1.040 -.460
After 2 Weeks -1.210* .091 .0005 -1.571 -.849
After 3 Weeks -1.730* .121 .0005 -2.209 -1.251
After 1
week
After 2 Weeks -.460* .045 .0005 -.639 -.281
After 3 Weeks -.980* .080 .0005 -1.296 -.664
After 2
weeks
After 3 Weeks
-.520*
.049
.0005
-.714
-.326
* The mean difference is significant at the 0.05 level.
TABLE 3: PAIRWISE COMPARISONS OF BLOOD ONLY
GROUP AT VARIOUS INTERVALS

Tables and Graphs
Repeated measures of ANOVA for MTA angelus (∆E)
Mean S.D F-value P-value
Pre OP 19.66 6.12
4.199
0.064 #
Immediate
Post OP 20.20 4.37
Day 1 20.53 4.28
After 1 week 20.97 3.79
After 2 weeks 21.12 3.89
After 3 weeks 21.25 3.89
** Highly Statistical Significance at P < 0.01 level
TABLE 4: REPEATED MEASURES OF ANOVA FOR MTA
ANGELUS (∆E)
Tables and Graphs
Pairwise Comparisons
(I) DeltaE
MD
(I- J)
Std.
Error
P-
value
95% C.I
Lower Bound
Upper Bound
Pre OP
Immediate post OP
-.540 .606 1.000 -2.936 1.856
Day 1 -.870 .628 1.000 -3.353 1.613
After 1 Week -1.310 .774 1.000 -4.371 1.751
After 2 Weeks
-1.460 .744 1.000 -4.400 1.480
After 3 Weeks
-1.590 .743 .914 -4.526 1.346
Immediate
Post OP
Day 1 -.330 .084 .053 -.664 .004
After 1 Week -.770 .197 .054 -1.550 .010
After 2
Weeks -.920*
.190 .014 -1.672 -.168
After 3 Weeks
-1.050* .167 .002 -1.712 -.388
Day 1
After 1 Week -.440 .192 .717 -1.200 .320
After 2 Weeks
-.590 .179 .137 -1.296 .116
After 3 Weeks
-.720* .151 .015 -1.318 -.122
After 1
week
After 2 Weeks
-.150 .079 1.000 -.463 .163
After 3 Weeks
-.280* .059 .016 -.514 -.046
After 2
weeks
After 3
Weeks -.130 .056 .675 -.351 .091
* The mean difference is significant at the 0.05 level.
TABLE 5: PAIRWISE COMPARISONS OF MTA ANGELUS
GROUP AT VARIOUS INTERVALS
Tables and Graphs
Repeated measures of ANOVA for Endocem MTA (∆E)
Mean S.D F-value P-value
Pre OP 21.48 0.74
66.395
0.0005 **
Immediate
Post OP
21.57
0.77
Day 1 21.84 0.80
After 1 week 22.02 0.74
After 2
weeks
22.16
0.75
After 3
weeks
22.22
0.75
** Highly Statistical Significance at P < 0.01 level
TABLE 6: REPEATED MEASURES OF ANOVA FOR ENDOCEM
MTA (∆E)
Tables and Graphs
Pairwise Comparisons
(I) DeltaE
MD
(I-J)
Std.
Error
P-
value
95% C.I
Lower
Bound
Upper
Bound
Pre OP
Immediate post OP -.090 .041 .814 -.251 .071
Day 1 -.360* .065 .006 -.618 -.102
After 1 Week -.540* .040 .0005 -.698 -.382
After 2 Weeks -.680* .059 .0005 -.914 -.446
After 3 Weeks -.740* .067 .0005 -1.005 -.475
Immediate
Post OP
Day 1 -.270* .045 .003 -.447 -.093
After 1 Week -.450* .022 .0005 -.538 -.362
After 2 Weeks -.590* .046 .0005 -.771 -.409
After 3 Weeks -.650* .060 .0005 -.888 -.412
Day 1
After 1 Week -.180 .049 .077 -.374 .014
After 2 Weeks -.320* .059 .006 -.554 -.086
After 3 Weeks -.380* .085 .024 -.718 -.042
After 1
week
After 2 Weeks -.140 .037 .066 -.287 .007
After 3 Weeks -.200* .045 .023 -.377 -.023
After 2
weeks
After 3 Weeks
-.060 .048 1.000 -.248 .128
* The mean difference is significant at the 0.05 level.
TABLE 7: PAIRWISE COMPARISONS OF ENDOCEM MTA AT
VARIOUS INTERVALS
Tables and Graphs
Repeated measures of ANOVA for Neo MTA (∆E)
Mean S.D F-value P-value
Pre OP 21.78 1.14
7.751
0.003 **
Immediate Post OP
21.90
1.15
Day 1 22.08 1.09
After 1
week 22.18 1.11
After 2
weeks
22.32
1.27
After 3
weeks
22.36
1.33
** Highly Statistical Significance at P < 0.01 level
TABLE 8: REPEATED MEASURES OF ANOVA FOR NEO MTA (∆E)
Tables and Graphs
Pairwise Comparisons
(I) DeltaE
MD
(I-J)
Std.
Error
P-
value
95% C.I
Lower
Bound
Upper
Bound
Pre OP
Immediate
Post OP -.120 .101
1.00 0
-.519 .279
Day 1 -.300 .114 .402 -.749 .149
After 1 Week
-.400 .115 .107 -.857 .057
After 2 Weeks
-.540 .154 .098 -
1.147 .067
After 3 Weeks
-.580 .172 .125 -
1.262 .102
Immediate
Post OP
Day 1 -
.180*
.025 .001 -.279 -.081
After 1 Week
- .280*
.033
.000 5
-.409 -.151
After 2 Weeks
-.420 .115 .081 -.876 .036
After 3 Weeks
-.460 .142 .150 -
1.020 .100
Day 1
After 1 Week
-.100 .026 .057 -.202 .002
After 2 Weeks
-.240 .121 1.00
0 -.720 .240
After 3 Weeks
-.280 .149 1.00
0 -.869 .309
After 1
week
After 2 Weeks
-.140 .130 1.00
0 -.655 .375
After 3 Weeks
-.180 .158 1.00
0 -.806 .446
After 2
weeks
After 3 Weeks
-.040 .031 1.00
0 -.161 .081
* The mean difference is significant at the 0.05 level.
TABLE 9: PAIRWISE COMPARISON NEO MTA GROUP AT
VARIOUS INTERVALS
Tables and Graphs
GRAPH 1: REPRESENTING ∆E IMMEDIATE POSTOPERATIVE
VALUES OF THE GROUPS
GRAPH 2: REPRESENTING ∆E DAY 1 VALUES OF THE GROUPS
Neo MTA MTA angelus Endocem MTA Blood only
0.00
4.00
8.00
12.00
16.00
20.00
24.00 ∆E Immediate Post OP
Neo MTA MTA angelus Endocem MTA Blood only
0.00
4.00
8.00
12.00
16.00
20.00
24.00
∆E 1 Day
MEA
N
MEA
N
Tables and Graphs
GRAPH 3: REPRESENTING ∆E 1 WEEK VALUES OF THE GROUPS
GRAPH 4: REPRESENTING ∆E 2 WEEKS VALUES OF THE GROUPS
Neo MTA Endocem MTA MTA angelus Blood only
0.00
4.00
8.00
12.00
16.00
20.00
24.00
∆E After 1 week
Neo MTA Endocem MTA MTA angelus Blood only
0.00
4.00
8.00
12.00
16.00
20.00
24.00
∆E After 2 weeks
MEA
N
MEA
N
Tables and Graphs
GRAPH 5: REPRESENTING ∆E 3 WEEKS VALUES OF THE GROUPS
Neo MTA Endocem MTA MTA angelus Blood only
0.00
4.00
8.00
12.00
16.00
20.00
24.00
∆E After 3 weeks
MEA
N
Tables and Graphs
∆E of Blood only
24.00 23.50 23.00 22.50 22.00 21.50 21.00 20.50 20.00 19.50
∆E of MTA angelus
21.50
21.00
20.50
20.00
19.50
19.00
18.50
GRAPH 6: REPRESENTING ∆E VALUES OF BLOOD ONLY GROUP
AT VARIOUS INTERVALS
GRAPH 7: REPRESENTING ∆E VALUES OF MTA ANGELUS
GROUP AT VARIOUS INTERVALS
Mea
n
Mea
n

Tables and Graphs
∆E of Endocem MTA
22.40
22.20
22.00
21.80
21.60
21.40
21.20
21.00
∆E of Neo MTA
22.50 22.40 22.30 22.20 22.10 22.00 21.90 21.80 21.70 21.60 21.50 21.40
GRAPH 8: REPRESENTING ∆E VALUES OF ENDOCEM MTA GROUP AT
VARIOUS INTERVALS
GRAPH 9: REPRESENTING ∆E VALUES OF NEO MTA GROUP AT
VARIOUS INTERVALS
Mea
n
Mea
n

Discussion
Discussion
37
DISCUSSION
The aim of this study was to compare the potential discolouration
effect of MTA Angelus, Endocem MTA and Neo MTA on natural teeth.
MTA is used in pulp capping, pulpotomy, regenerative endodontic
procedures and perforation repairs. One major drawback is the discoloration
potential when it interacts with blood, especially when placed in the anterior
teeth, which is of a discernible concern. Hence the study was carried out
constituting three newer and improvised MTA materials. Group A – Blood only
(control), Group B – Blood + MTA Angelus, Group C – Blood + Endocem
MTA and Group D – Blood + Neo MTA, wherein MTA is placed in direct
contact with blood.
Discolouration effect of Pro root MTA and MTA Angelus are
identified and confirmed by previous studies.48,17,3 The reason for these
discolourations have been widely discussed and proved by various authors. A
new version of MTA with modification in the composition have been recently
introduced3,49,11, which are Endocem MTA and Neo MTA. Endocem MTA has
been evaluated for its ability to discolour tooth by Ji-Hyun Jang et al 35. PubMed
search on Neo MTA resulted in 13 articles but Neo MTA has not been tested
for its ability to discolour teeth in clinical conditions,15 hence in this study we
are testing the discolouration potential of newer MTA(Neo MTA) along with
Endocem MTA and MTA Angelus.
Discussion
38
Discolouration in teeth are usually measured by visual assessment
with a shade guide and by computer analysis of digital images.50 However,
commercially available shade guides contain a limited selection of colours when
compared to those found in natural teeth 51 and visual shade matching is affected
by variable viewer interpretation and environmental influences.52 Recently
electronic devices such as colourimeters and spectrometers are being used for
measurement of tooth discolouration. Colourimeter is an instrument for
psychophysical analysis, which measures human eye-brain perception. A
spectrometer separates and measures spectral components of a physical
phenomenon. It measures a continuous variable of a phenomenon where the
spectral components are somehow mixed, such as a beam of white light.
Spectrometers are of two types: Spectrophotometer and Spectroradiometer. A
spectroradiometer is a light measurement tool that is able to measure both the
wavelength and amplitude of the light emitted from a light source. The
colour and translucency values of irregularly shaped objects are measured by
means of a spectroradiometer. Spectroradiometer provides clinically relevant
values because this measurement can eliminate the edge-loss effect, closely
simulate clinical viewing conditions, and also provide optical values of a
specified area.53 Spectrophotometer is an instrument for physical analysis,
which analyses the reflecting transmitting properties of objects without human
interpretation. According to Ishikawa-nagai et al, spectrophotometers,
generally, can provide more systematic and precise measurements than
colourimeters because of their ability to measure the amount of light reflected
Discussion
39
from objects throughout the visible spectra range.54 This is because a colour-
measuring instrument with computerized colour analysis allows standardized
and accurate colour matching compared with other conventional techniques.
In the present study a spectrophotometer was used for analysis of
the tooth discolouration. A spectrophotometer measures the spectral reflectance
or transmittance curve of an object. Light is released from a light source in the
spectrophotometer and then dispersed by a prism into a spectrum of different
wavelengths between 380-780 nm. The spectrophotometer then measures the
amount of the light reflected from the specimen for each wavelength in the
visible light and converts the data into numerical values of colour coordinates
CIE L*, c* and h*.55 It measures the space coordinates on any spectrum. The
main advantage of spectrophotometer over spectroradiometer is that they have
a stable light source (LED). Because of which the spectrophotometer was used
for this study.56 In the CIE L*c*h system, the idea was to create a linear colour
space in which the distance between the points defining individual colours
would be proportional to the perceptual difference between them (perceptual
colour spaces) and to present colours with the coordinates describing one of
their key attributes, ie: lightness, chroma (saturation) and hue (ie. L, C, h).57
ΔE is the colour stimulus that can be represented as a point in space, it is
calculated as the distance between the points representing these stimuli.
The change ΔE of each specimen was calculated using the following equation
Discussion
40
ΔE =[(ΔL)2+(ΔC)2+(ΔH)2]1/2
Where ΔL parameter indicates lightness and ranges in value from 0 (black) to
100 (white), ΔC indicates green/red. Here negative value indicates green and
positive value indicates red and ΔH indicates blue/yellow where blue value
indicates negative value and yellow indicates positive value.
In this study the Vita Easyshade Compact (Vita Zahnfabrik,
BadSackingen, Germany), which is a cordless, small, portable, cost efficient,
battery operated, contact-type spectrophotometer that provides enough shade
information to help aid in the colour analysis process. Different measurement
modes are possible with Easyshade Compact: tooth single mode, tooth area
mode (cervical, middle and incisal shades), restoration colour verification
(includes lightness, chroma and hue comparison) and shade tab mode
(practice/training mode).58
40 upper human central incisors were taken as the sample, with 10
teeth in each group. Anterior teeth were selected because they had wide root
canal diameter which would facilitate placement of the test materials easily1 and
discolouration is of more concern in the anterior teeth than posterior teeth. Also
MTA is frequently used in anterior teeth as they are commonly involved in
traumatic injury and may require vital pulp therapy procedures like pulp
capping, pulpotomy, regenerative procedures and apexification.59,60 Human
teeth were preferred for better reproducibility and clinical significance.21
Previous studies have reported the use of bovine teeth, because they have
Discussion
41
increased number of dentinal tubules next to the pulp, that simulate the human
teeth (21,343 ± 7290 per mm2 ± SD for human permanent teeth and 20,980 ±
4198 for bovine teeth).61,62,63,64 According to Schilke et al, bovine incisor crown
dentine is a suitable substitute for human teeth, whereas bovine incisor root
dentine appears less suitable due to its significantly higher tubule density.61
Whole blood was collected from a volunteer by venipuncture. The
collection tubes were sterile and spray coated with the anticoagulant K2EDTA
to prevent clotting in order to facilitate the experiment 13,4,65. Blood was placed
with a micropipette in the prepared cavities of all sample teeth, followed by their
respective group materials, Group A – Blood only, Group B – Blood followed
by MTA Angelus placement, Group C – Blood followed by Endocem MTA,
and Group D – Blood followed by Neo MTA placement. The pH of blood is
7.4. A study by Namazikhah reported that MTA when in contact with butyric
acid (byproduct of anaerobic bacteria metabolism, used to simulate the clinical
environmental conditions of periradicular infection) had distinctive crystalline
structures embedded within a more uniform matrix partially covered by
colloidal gel that may have been involved in the bonding of the various phases
of the cement.66 A low pH could potentially inhibit the setting reaction or
increase the solubility of calcium silicate-based materials, which could affect
the mechanical properties of the material including the surface microhardness.
Studies conducted by Elnaghy et al 67 and Namazikhah et al 66 stated that MTA
might be more sensitive to acidic pH environment inhibiting crystallization in
Discussion
42
hydration reaction.68 MTA has an initial pH around 10.2 that further increases
to 12.5 which is an alkaline setting environment.13 Surfaces exposed to a pH
value of 7.4 showed an amorphous poorly crystallized superficial gel structure
containing globular aggregate particles and microchannels. But these structures
disappeared when the cement hardened in an acidic environment with a
selective loss of matrix.67
After the placement of the respective materials, the access of the teeth was
restored with type IX glass ionomer cement and an immediate postoperative
measurement was taken. This was done to find out which group reported
discolouration immediately after the procedure. The teeth were then stored in
tap water (Tap water has a pH of 7.4 to 7.79 and an osmolality of 30 mOsm/kg)69
and the following measurements were taken after a day, 1 week, 2 weeks and 3
weeks. The ∆E values for all the groups at each interval were noted.
The collected data were analysed with IBM.SPSS statistics software 23.0
Version. To describe about the data descriptive statistics frequency analysis was
used, percentage analysis was used for categorical variables and the mean &
S.D were used for continuous variables. To find the significant difference
between the multivariate analysis the one-way ANOVA was used and for
repeated measures ANOVA was used with Bonferroni correction to control the
type I error on multiple comparison. The results of the present study showed
that there was statistically significant difference of the tooth in all coordinates
(L*, c*, h*) for all the 4 groups tested at all the time intervals. The amount of
Discussion
43
change in the value of color shift as measured by color difference (ΔE) was also
found to be statistically significant.
All the tested groups showed some amount of discoloration with
varying percentage at the measured intervals (Table 1). From Table 2, it is
observed that ΔE value measured preoperatively is 21.16(mean), postoperative
measurements - immediately is 21.39 (mean), after one day it is 21.88(mean),
after a week it is 22.63(mean), after two weeks a value of 23.09(mean) and after
3 weeks it shows a mean value of 23.61(mean). From the above values it is
inferred that the blood only group showed the maximum discolouration at the
end of 3 weeks. This is substantiated by a study conducted by Marin et al, where
he concluded that the major cause of discolouration was the accumulation of
hemoglobin or other forms of hematin molecules such as hemosiderin, hemin,
hematin and haematopinid.21,70,71,72 The flowing of blood components into the
dentinal tubules could be a possible reason for the maximum discolouration
potential in this group.1 The pigments responsible for discolouration are found
within the dentinal tubules and not in the intertubular dentin.21 According to
Marin et al, majority of the blood staining was confined to dentine but there was
also some discoloration of the enamel produced. This enamel staining was not
as pronounced as that observed in the coronal and radicular dentine; rather, it
appeared as a pinkish hue. It may be determined by the length of exposure of
the blood pigments to the tooth structure. The hemolysis and catabolism of
erythrocytes in the pulp chamber differ from other parts of the body as the pulp
Discussion
44
chamber is surrounded by dentine and cementum, which isolates it from any
inflammatory or healing response from adjacent tissues.21
When blood comes in contact with MTA the discolouration
potential is exaggerated, though, not as pronounced as in the blood only group.4
From Table 4, the preoperative ΔE value 19.66(mean) shows a significant
difference immediately after the placement of MTA Angelus of ΔE value
20.20(mean), that sustains the increase in discolouration even after day 1 (ΔE-
20.53). After a week’s time the measured value is 20.97 and the following
week’s mean values are 21.12 and 21.25 respectively, that resulted in a
significant increase in the discoloration potential of MTA Angelus. Average
difference of 1.6 is observed from the preoperative ΔE value and postoperative
3rd week ΔE value. This signifies that when the material comes in contact with
blood, the discoloration potential is increased to a certain extent. The following
could be the reasons for discolouration: The presence of bismuth oxide in the
MTA Angelus formulation causes the discoloration.16,73 Collagen, present in
dentin matrix, reacts with bismuth oxide, resulting in a grayish
discoloration.17,37 Release of heavy metal ions from MTA and the slow setting
reaction of MTA permits the absorption and hemolysis of erythrocytes, resulting
in material discoloration and subsequent tooth discoloration when in contact
with blood. 4,74,75 MTA Angelus contains bismuth oxide as a radiopacifier which
could be a major contributing factor for its discolouration potential and its slow
Discussion
45
setting time provides contamination with blood, that makes the material porous
leading to less dimensional stability too.76,77
From table 6, the discoloration potential of Endocem MTA is
observed as follows, preoperative ΔE mean value is 21.48, immediate
postoperative mean value is 21.57, after one day the mean value is 21.84, one
week later the value is 22.02, after two weeks the value is 22.16 and after three
weeks the value is 22.22. A difference of 0.7% is observed from the immediate
postoperative measurement to the final week measurement, which shows the
discoloration potential of Endocem MTA to be least, followed by MTA Angelus
and blood only groups. Endocem MTA is composed of the tricalcium silicates,
and bismuth oxide, which is used as the radiopacifier.78 The unique property of
Endocem MTA is its rapid setting time and ease in manipulation.35 Furthermore,
the biocompatibility and osteogenicity of Endocem are similar to those of
conventional MTA.78 The small particle size of Endocem increases the surface
contact of the particles while mixing with sterilized water, resulting in faster
setting time and ease of manipulation.78,2 As the contact surface area increases,
the reactivity of the calcium silicate particles to form calcium hydroxide and
calcium silicate hydrate phases also increases.35 A study by Choi et al compared
the setting time of Endocem MTA with ProRoot MTA, which reported a final
setting time of 4 minutes ± 30 seconds for Endocem MTA and that of 261 ± 21
minutes for ProRoot MTA.78 The setting time of Endocem MTA provides a
Discussion
46
sufficient working time when performing retro- grade filling or perforation
repairs.11
From table 8, Neo MTA group showed the following ΔE mean
values, preoperative mean value is 21.78, immediate postoperative value is
21.90, after day one 22.08 is the value, one week later 22.18 is the value, after
the second and third week 22.32 and 22.36 are the values respectively. A
minimal difference of 0.5 is observed from the immediate postoperative
measurement and final week ΔE mean values, that signified the least
discolouration potential of Neo MTA when compared to MTA Angelus and
Endocem MTA. Studies have concluded that bismuth oxide as a radiopacifier
was a major factor for the discoloration potential of MTA, hence in Neo MTA
tantalum oxide was replaced as the radiopacifier.49 A study conducted by
Camilleri et al showed that Neo MTA had clusters rich in tantalum and oxygen
in the scanning electron micrograph images,15 this relatively produced lesser
discolouration and did not interfere in the hydration mechanism. Tantalum
oxide provides adequate radiopacity and showed least discoloration.15,79 Oh et
al also reported that tantalum is a biomaterial with applications in tissue
regeneration and has excellent radiopacity with low cytotoxicity
properties.80,79Aluminum has a strong effect on setting reaction of MTA. It
rapidly reacts with the formed calcium hydroxide in the presence of water
forming calcium aluminate hydrate. The presence of relatively high amount of
gypsum and aluminium in Neo MTA Plus accounts for its rapid setting as
Discussion
47
observed during mixing where it sets into a hard mass within few minutes,
whereas the setting of MTA Angelus takes several hours.49 Due to the faster
setting time of Neo MTA, the contamination of tissue fluids does not alter the
property of the set material. Even though when Neo MTA is placed in a low pH
environment, the faster setting time helps the material to attain the alkaline pH
which withstands washout and disintegration of the material.81,82
A comparative analysis of intergroups Group A and Group B (Blood
and MTA Angelus) revealed that on day 1, there was an immediate increase in
the ∆E value of MTA Angelus group when compared to the Blood only group.
This was in accordance with the study conducted by Felman and Parashos, that
contamination of MTA with blood exaggerated the discolouration potential
immediately. According to Marciano et al, bismuth oxide present in the
composition of MTA Angelus was a major discolouration contributing factor ,
furthermore, when contacted with sodium hypochlorite , it produced a dark
brown precipitate.83,5 Bismuth oxide undergoes oxidation and destabilises the
oxygen, which reacts with carbondioxide producing bismuth carbonate
resulting in a black precipitate.43,3,16
Blood when in contact with Group C material (Endocem MTA),
produced significantly lesser discoloration when compared to Group A (Blood
only). This is because of the hydration mechanism that differs due to its fine
particle size.35,78,2 Particle size ranges from less than 1μm to more than 30μm
and particle size of bismuth oxide in MTA was reported to be between 10 and
Discussion
48
30μm.84 Hydration of Endocem MTA results in decreased amount of free
calcium hydroxide and increase in the formation of stable crystals of calcium
silicate hydrate and calcium aluminate hydrate, which confers mechanical
strength of the material.14,25 Endocem MTA possessed increased washout
resistance due to its fast setting property without any chemical accelerators.78
Comparison of Group A (Blood only) with Group D (Neo MTA),
showed that Neo MTA results in the least discoloration with 1.87 standard
deviation. According to Felman, Neo MTA and Endocem MTA did not
discolour as severely as the blood only group as the material limited the
diffusion of erythrocytes from the canal into the coronal dentin by an increased
setting time.4,15 It has fine particles, which improves its handling characteristics
and increases the speed of hydration process.82 The presence of tantalum
pentoxide provided the adequate radiopacity and was inert as it did not produce
discoloration.15,85 Due to its high atomic number (72), inherently it possesses
the radiopaque property.86 Tantalum has a long history as a biomaterial and
used in dentistry.22,86 In a study where MTA plus and Neo MTA were compared
for alkaline activity, Siboni reported that the alkalinity of Neo MTA did not
decrease for about three days and only MTA plus showed a rapid decrease in its
alkalinity. This provides an antibacterial environment and also promotes apatite
nucleation.87
Comparison of Group B (MTA Angelus) with Group C (Endocem
MTA) and Group D (Neo MTA) showed that MTA Angelus showed the
Discussion
49
maximum discoloration, followed by Endocem MTA and Neo MTA. The
hydration mechanism of Endocem MTA and Neo MTA is different from that of
MTA Angelus. MTA Angelus has a similar hydration mechanism to that of
Portland cement. The setting of MTA usually occurs in 4 stages: Pre induction
period, Induction (dormant period), Acceleration period and Post acceleration
period.76,46,23 These stages were reduced to a 2stage mechanism, resulting in a
faster setting time from 3-4 hours to 10-15 mins.78,88 Neo MTA consists of
tricalcium and dicalcium silicates, calcium sulphate and tantalum oxide wherein
MTA Angelus consists of tricalcium silicate, dicalcium silicate, tricalcium
aluminate, calcium aluminoferrite and bismuth oxide.89,47,2,76 During the
hydration process Neo MTA does not produce ferrous oxide as the
aluminoferrite phase is not present and bismuth oxide is replaced by tantalum
oxide.47,15 Moreover minor components that caused discolouration on leaching
such as arsenic, lead and chromium are in lesser percentages in Neo MTA when
compared to MTA Angelus.33,90,91
On a comparative analysis of the inter groups, from table 1 it is
observed that all the tested groups showed a certain amount of discolouration in
a span of one month. Group A (Blood only) showed the maximum
discolouration, which is similar to the previous studies by Yoldas et al and
Marin et al.1,21 Marin et al observed the ability of blood components to
penetrate dentine and induce discolouration of enamel which are more
pronounced with longer exposure times. Although enamel has no tubular
Discussion
50
morphology, its organic structural features at the dentino-enamel junction, may
play a role in the discolouration process.21 According to Ahmed et al, the
erythrocytes in the pulp chamber or dentinal tubules degrade into haem
molecules and these release iron during hemolysis.70 Hattab et al suggested
that the iron released can be converted to black ferric sulphide with hydrogen
sulphide produced by bacteria and this may cause grey discolouration of the
tooth.71 Attin et al also suggested that the degrading proteins of necrotic pulp
tissue may also cause staining of the tooth.72 Group B (MTA Angelus) showed
an escalated discolouration at day 1 (Graph 3) and its discolouration potential
was sustained up to 3 weeks of the study. This is similar to other in-vitro and
in-vivo studies. According to Felman and Parashos, the slow hydrating
process of MTA Angelus may permit the absorption and subsequent hemolysis
of erythrocytes from the adjacent pulpal tissue, thus resulting in both material
and subsequent tooth discoloration.4 According to Yoldas et al and Marciano
et al, the possible mechanism of MTA Angelus discolouration may be due to
the oxidation and incorporation of the iron content within the MTA powder into
the calcium aluminoferrite phase of the set MTA cement.1 Additionally, the
release of heavy metal ions and the presence of bismuth oxide as a radiopacifier
within MTA could lead to discoloration.83 Valles et al reported in studies that
when bismuth oxide is exposed to high temperatures or light irradiation in an
oxygen-free environment, it undergoes dissociation to produce metallic bismuth
and oxygen. The reduced bismuth atoms form black crystals that darken the
tooth.16,73 Studies conducted by Camilleri et al reported that zirconium oxide
Discussion
51
as a radiopacifier in biodentine proved to be inert when compared to bismuth
oxide present in MTA Angelus.77 He also concluded in another study that
bismuth oxide affected the hydration mechanism, as it formed a part of calcium
silicate hydrate and also affected the precipitation of calcium hydroxide.76
Group C (Endocem MTA) showed discolouration after day one that did not
differ even after 3 weeks of the study.35,43 Choi et al stated that, longer setting
time led to the material washout due to its contact with tissue fluids before the
material could set, hence faster setting cement Endocem MTA may overcome
this drawback.78 In a study by Jang et al reported that Endocem MTA showed
an initial significant discolouration after one week but showed minimum
discolouration during the course of the remaining 11 weeks.35 Kim et al
reported that Endocem MTA up regulated OPN production that helped in wound
healing and inflammatory reactions when compared to Proroot MTA.11 Group
D (Neo MTA) showed the least discoloration at the end of three weeks.92,4,57 A
study conducted by Camilleri et al showed that Neo MTA had clusters rich in
tantalum and oxygen in the scanning electron micrograph images.15 According
to Shokouhinejad. Neo MTA has fine powder particles, which improves its
handling properties and increases the speed of hydration.82,23 In a study by
Walsh et al, Neo MTA Plus had similar effects on inflammation, pulp response,
periodontal ligament and cementum formation, and apical tissue healing in
dogs, also Neo MTA Plus had superior dentin bridge quality.81 Group C
(Endocem MTA) showed a little higher discoloration than Group D (Neo MTA)
throughout the study measurements (Graphs 2-6). On a descending order of
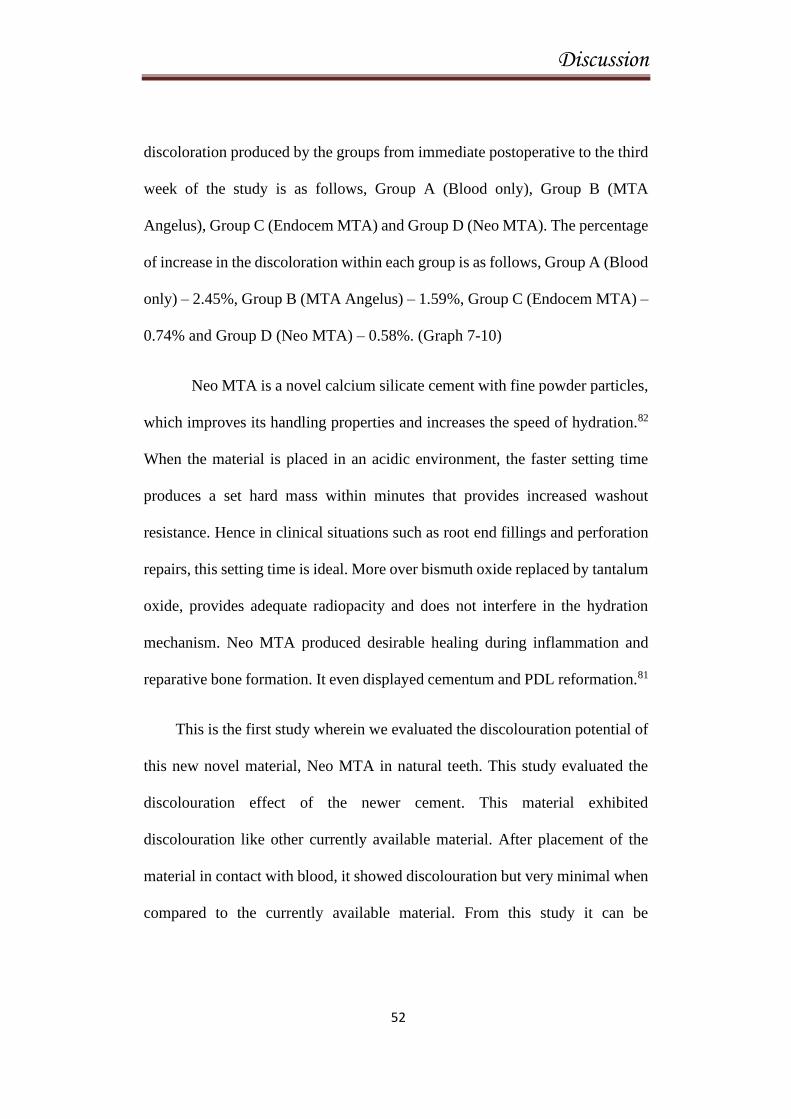
Discussion
52
discoloration produced by the groups from immediate postoperative to the third
week of the study is as follows, Group A (Blood only), Group B (MTA
Angelus), Group C (Endocem MTA) and Group D (Neo MTA). The percentage
of increase in the discoloration within each group is as follows, Group A (Blood
only) – 2.45%, Group B (MTA Angelus) – 1.59%, Group C (Endocem MTA) –
0.74% and Group D (Neo MTA) – 0.58%. (Graph 7-10)
Neo MTA is a novel calcium silicate cement with fine powder particles,
which improves its handling properties and increases the speed of hydration.82
When the material is placed in an acidic environment, the faster setting time
produces a set hard mass within minutes that provides increased washout
resistance. Hence in clinical situations such as root end fillings and perforation
repairs, this setting time is ideal. More over bismuth oxide replaced by tantalum
oxide, provides adequate radiopacity and does not interfere in the hydration
mechanism. Neo MTA produced desirable healing during inflammation and
reparative bone formation. It even displayed cementum and PDL reformation.81
This is the first study wherein we evaluated the discolouration potential of
this new novel material, Neo MTA in natural teeth. This study evaluated the
discolouration effect of the newer cement. This material exhibited
discolouration like other currently available material. After placement of the
material in contact with blood, it showed discolouration but very minimal when
compared to the currently available material. From this study it can be

Discussion
53
concluded that, it can be recommended as an ideal material for vital pulp
therapies and root end filling procedures.

Summary
Summary
54
SUMMARY
The purpose of this study was to compare and evaluate the
discoloration potential of three MTA materials, MTA Angelus, Endocem
MTA and Neo MTA in coronal portion of natural teeth when placed in contact
with blood using a Spectrophotometer.
The sample size collected was 40 human extracted upper central
incisors. The teeth were cleaned with pumice after which the crowns were
separated from their roots with a diamond disc and the crowns were retained
for the study. A cylindrical bur was used to prepare a cavity on the lingual
surface of the teeth of 3mm depth. The teeth were then rinsed and placed in
3% sodium hypochlorite solution for 30 minutes followed by 17% EDTA
solution for 2 minutes for smear layer removal. The teeth were then rinsed and
randomly divided into 4 groups: Group A - Blood only; Group B – Blood +
MTA Angelus; Group C – Blood + Endocem MTA; Group D – Blood + Neo
MTA. An initial shade was obtained using a spectrophotometer for all the
teeth. Each tooth was filled with blood using a micropipette, followed by the
testing material and their access cavity were restored with Type IX GIC. In
Group A, the cavities were filled only with 2.0μL blood followed by GIC
restoration. In Group B, the cavities were filled with 0.5μL blood followed by
MTA Angelus using a plastic instrument and restored with GIC. In Group C,
the cavities were filled with 0.5μL blood, then Endocem MTA was placed in
Summary
55
the cavity followed by GIC restoration. In Group D, the cavities were filled
with 0.5μL blood followed by Neo MTA and restored with GIC. An
immediate postoperative shade was obtained with the Spectrophotometer. The
samples were then stored in tap water at room temperature. Each group’s
shade was measured after one day, 1 week, 2 weeks and 3 weeks. ∆E values
were obtained from the samples and analysed.
The Spectrophotometer is a device used to measure the shade of the
tooth. The conducting end is placed on the middle third of the tooth’s labial
surface and the device is activated to measure the ∆E value. This value
consists of L (Lightness), c (chroma), h (hue) measurements.
L*c*h = ∆E
The collected data was analysed statistically by one-way ANOVA and
Bonferroni tests. The results showed P value = 0.0005 [P < 0.01] for the
Group A (Blood only) which is highly significant. P value = 0.064 [P > 0.01]
for Group B (MTA Angelus), P value = 0.0005 [P < 0.01] for Group C
(Endocem MTA) which has high statistical significance and P value = 0.003
[P < 0.01] for Group D (Neo MTA). All the tested group showed
discolouration. The blood only group showed maximum discolouration
initially and at the end of 1st week, 2
nd week, 3
rd week. The MTA Angelus
group showed maximum discolouration (22.9±3.89). Initially after placement,
increase in discolouration is observed after day 1 (22.6±4.28), after one week
the value is (22.59±3.79), after two weeks (22.79±3.89) and third week
Summary
56
(22.94±3.89) which showed its discolouration potential. MTA Angelus
showed maximum discolouration at the end of 3rd
week. Endocem MTA
showed discolouration but less when compared to the blood and MTA
Angelus group. The postoperative value after the placement is (21.40±0.80), at
the end of 1st week (22.02±0.74), 2
nd week (22.16±0.75), 3
rd week
(22.22±0.75). There is an initial discolouration which is less when compared
to Group A and Group B. Neo MTA showed very minimal discolouration. The
initial discolouration after placement is (21.90±1.15) which is the least when
compared to Group A, Group B and Group C. The 2nd
and 3rd
week values
(22.32±1.27) and (22.36±1.33) respectively also showed least discolouration
when compared to the other groups. On a concluding note, among the four
groups, blood only group (Group A) showed the maximum discoloration at all
the stages and reached its maximum after the 3rd
week. When compared to
other groups, MTA Angelus (Group B) showed marked discolouration, though
it was not higher than that of blood only (Group A). After one day it showed
significant discolouration (higher than the blood only group) and continued to
increase its discolouration. Discolouration was observed after 1st and 2
nd week
and was higher after the 3rd
week. Endocem MTA showed minimal
discoloration. After one day Endocem MTA exhibited less discolouration
when compared to other groups. The minimal discolouration remained the
same in the 1st, 2
nd and 3
rd week (did not exhibit sustained discolouration
potential). Endocem MTA when compared to Neo MTA exhibited slightly
higher discolouration potential. Neo MTA (Group D) showed the least
Summary
57
discolouration when compared to other groups. Initially after day one Neo
MTA showed less discolouration. After the 1st week the discolouration was
sustained without any increase. This trend continued in the 2nd
and 3rd
week.
The discolouration potential is as follows in the descending order, blood only
(Group A) > MTA Angelus (Group B) > Endocem MTA (Group C) > Neo
MTA (Group D). The newer MTA, Neo MTA can thus be used for vital pulp
therapies and regenerative procedures especially in anterior teeth where
esthetic is of a concern with ease of handling and better outcomes.

Conclusion
Conclusion
58
CONCLUSION
1. All the four groups, Blood only, Blood + MTA Angelus, Blood +
Endocem MTA and Blood + Neo MTA used in this study showed
discolouration.
2. Blood only group showed discolouration immediately. The
discolouration gradually increased after day one and progressed till the
end of first week. The same trend continued till 2nd
week and reached
its maximum in the 3rd
week.
3. MTA Angelus group showed a significant increase in discolouration
immediately. especially after day one. After one week its
discolouration potential gradually increased. Discolouration increased
significantly in the 2nd
week. It showed a marked discolouration
potential after the 3rd
week of the study.
4. Endocem MTA group showed minimum discolouration after initial
placement and a very minimal increase in discolouration was observed
after day one. The discolouration potential after one week was
minimum. The discolouration produced is sustained in the 2nd
week. Its
discoloration potential after the 3rd
week did not show any significant
increase.
5. Neo MTA showed very minimal discolouration initially. Further
increase in its discolouration potential was not observed after day one.
Conclusion
59
The attained discolouration remained the same in the 1st
week.
There was no significant increase in discolouration after 2nd
week.
Discolouration potential of Neo MTA was very minimum after the 3rd
week.
6. Blood only group when compared to MTA Angelus, showed lesser
discolouration initially. But at the end of 3 weeks Blood only group
exhibited maximum discolouration. MTA Angelus showed an
immediate increase in discolouration after day one that was higher than
that of blood only group. But towards the 3rd
week, MTA Angelus
exhibited lesser discolouration than blood only group.
7. Blood only group when compared to Endocem MTA and Neo MTA
groups exhibited the maximum discolouration initially, after one day,
one week, two weeks and three weeks.
8. MTA Angelus compared to Endocem MTA showed maximum
discolouration when the material was placed in contact with blood.
Throughout the study Endocem MTA exhibited minimal
discolouration when compared to MTA Angelus.
9. MTA Angelus when compared to Neo MTA group showed maximum
discolouration initially and up to the 3rd
week of study.
10. Endocem MTA when compared to Neo MTA exhibited slightly
increased discolouration. Initially both the groups showed more or less
the same discolouration potential. By the end of one week Neo MTA
Conclusion
60
exhibited least discolouration when compared to Endocem MTA and
remained the same till the 3rd
week.
11. On an ascending order of discolouration potential of the groups tested
is as follows,
Neo MTA > Endocem MTA > MTA Angelus > Blood only group
12. Spectrophotometer served as a source for discoloration analysis which
showed reliability.
This is the first study wherein we evaluated the discolouration potential
of this new novel material, Neo MTA in natural teeth. This study evaluated the
discolouration effect of the newer cement. This material exhibited
discolouration potential like any other currently available MTA group of
materials. After placement of the material in contact with blood, it showed
discolouration but very minimal when compared to the currently available
material. From this study it can be concluded that, it can be recommended as
an ideal material for vital pulp therapies, root end filling procedures,
perforation repairs and where ever the material is in contact with blood.

Bibliography
Bibliography
61
BIBLIOGRAPHY
1. Yoldaş SE, Bani M, Atabek D, Bodur H.
Comparison of the Potential Discoloration Effect of Bioaggregate,
Biodentine, and White Mineral Trioxide Aggregate on Bovine Teeth:
In Vitro Research.
J Endod. 2016 Dec 1;42(12):1815–8.
2. Parirokh M, Torabinejad M.
Mineral Trioxide Aggregate: A Comprehensive Literature Review-Part
I: Chemical, Physical, and Antibacterial Properties.
Vol. 36, Journal of Endodontics. 2010. p. 16–27.
3. Kang SH, Shin YS, Lee HS, Kim SO, Shin Y, Jung IY, et al.
Color Changes of Teeth after Treatment with Various Mineral Trioxide
Aggregate-based Materials: An Ex Vivo Study.
J Endod [Internet]. 2015;41(5):737–41. Available from:
http://dx.doi.org/10.1016/j.joen.2015.01.019
4. Felman D, Parashos P.
Coronal tooth discoloration and white mineral trioxide aggregate.
J Endod [Internet]. 2013;39(4):484–7.
Bibliography
5. Krastl G, Allgayer N, Lenherr P, Filippi A, Taneja P, Weiger R.
Tooth discoloration induced by endodontic materials: A literature
review.
Dent Traumatol. 2013;29(1):2–7.
6. Ioannidis K, Mistakidis I, Beltes P, Karagiannis V.
Spectrophotometric analysis of coronal discolouration induced by grey
and white MTA.
Int Endod J. 2013 Feb;46(2):137–44.
7. Watts JD, Holt DM, Beeson TJ, Kirkpatrick TC, Rutledge RE.
Effects of pH and Mixing Agents on the Temporal Setting of Tooth-
colored and Gray Mineral Trioxide Aggregate.
J Endod. 2007 Aug;33(8):970–3.
8. Tsujimoto M, Ookubo A, Wada Y, Matsunaga T, Tsujimoto Y,
Hayashi Y.
Surface changes of mineral trioxide aggregate after the application of
bleaching agents: Electron microscopy and an energy-dispersive X-ray
microanalysis.
J Endod. 2011 Feb;37(2):231–4.
Bibliography
9. Camilleri J, Han L, Kodama S, Okiji T, Camilleri J, Montesin FE,
et al.
A Novel Accelerator for Improving the Handling Properties of Dental
Filling Materials.
J Endod [Internet]. 2013;29(1):737–40. Available from:
https://doi.org/10.1016/j.ceramint.2017.11.058
10. Asgary S, Eghbal MJ, Parirokh M, Ghoddusi J, Kheirieh S, Brink
F.
Comparison of Mineral Trioxide Aggregate’s Composition with
Portland Cements and a New Endodontic Cement.
J Endod [Internet]. 2009;35(2):243–50. Available from:
http://dx.doi.org/10.1016/j.joen.2008.10.026
11. Kim M, Yang W, Kim H, Ko H.
Comparison of the biological properties of ProRoot MTA, OrthoMTA,
and endocem MTA cements.
J Endod [Internet]. 2014;40(10):1649–53. Available from:
http://dx.doi.org/10.1016/j.joen.2014.04.013
Bibliography
12. Húngaro Duarte MA, de Oliveira El Kadre GD ar., Vivan RR,
Guerreiro Tanomaru JM, Filho MT, de Moraes IG.
Radiopacity of Portland Cement Associated With Different
Radiopacifying Agents.
J Endod. 2009;35(5):737–40.
13. Torabinejad M, Higa RK, Mckendry DJ, Pitt Ford TR.
Dye Leakage of Four Root End Filling Materials: Effects of Blood
Contamination.
Vol. 20. 1994.
14. Han L, Kodama S, Okiji T.
Evaluation of calcium-releasing and apatite-forming abilities of fast-
setting calcium silicate-based endodontic materials.
Int Endod J. 2015;48(2):124–30.
15. Camilleri J.
Staining Potential of Neo MTA Plus, MTA Plus, and Biodentine Used
for Pulpotomy Procedures.
J Endod [Internet]. 2015;41(7):1139–45. Available from:
http://dx.doi.org/10.1016/j.joen.2015.02.032
Bibliography
16. Vallés M, Mercadé M, Duran-Sindreu F, Bourdelande JL, Roig M.
Color stability of white mineral trioxide aggregate.
Clin Oral Investig. 2013;17(4):1155–9.
17. Marciano MA, Costa RM, Camilleri J, Mondelli RFL, Guimarães
BM, Duarte MAH.
Assessment of color stability of white mineral trioxide aggregate
angelus and bismuth oxide in contact with tooth structure.
J Endod. 2014;40(8):1235–40.
18. van der Burgt TP, Plasschaert AJM.
Tooth discoloration induced by dental materials.
Oral Surgery, Oral Med Oral Pathol. 1985;60(6):666–9.
19. Seghi RR.
Effects of Instrument-measuring Geometry on Colorimetric
Assessments of Dental Porcelains.
Vol. 69, J Dent Res. 1990.
20. Pitt Ford TR, Torabinejad M, McKendry DJ, Hong CU,
Kariyawasam SP.
Use of mineral trioxide aggregate for repair of furcal perforations.

Bibliography
Oral Surgery, Oral Med Oral Pathol Oral Radiol. 1995;79(6):756–63.
21. Marin et al,
Endodontics & Dental Traumatology. 1997;
22. Chan DCN, Titus HW, Chung KH, Dixon H, Wellinghoff ST, Rawls
HR.
Radiopacity of tantalum oxide nanoparticle filled resins.
Dent Mater. 1999;15(3):219–22.
23. Moir G.
Cements.
Adv Concr Technol. 2003;3–45.
24. Asgary S, Parirokh M, Eghbal MJ, Brink F.
A Comparative study of white mineral trioxide aggregate and white
portland cements using X-ray microanalysis.
Aust Endod J. 2004 Dec;30(3):89–92.
25. Turanli L, Uzal B, Bektas F.
Effect of material characteristics on the properties of blended cements
containing high volumes of natural pozzolans.
Cem Concr Res. 2004;34(12):2277–82.
Bibliography
26. Al-Kahtani A, Shostad S, Schifferle R, Bhambhani S.
In-vitro evaluation of microleakage of an orthograde apical plug of
mineral trioxide aggregate in permanent teeth with simulated immature
apices.
J Endod. 2005;31(2):117–9.
27. Felippe WT, Felippe MCS, Rocha MJC.
The effect of mineral trioxide aggregate on the apexification and
periapical healing of teeth with incomplete root formation.
Int Endod J. 2006;39(1):2–9.
28. Iwamoto CE, Adachi E, Pameijer CH, Barnes D, Romberg EE,
Jefferies S.
Clinical and histological evaluation of white ProRoot MTA in direct
pulp capping.
Am J Dent. 2006;19(2):85–90.
29. Song JS, Mante FK, Romanow WJ, Kim S.
Chemical analysis of powder and set forms of Portland cement, gray
ProRoot MTA, white ProRoot MTA, and gray MTA-Angelus. Oral
Surgery,
Oral Med Oral Pathol Oral Radiol Endodontology. 2006

Bibliography
Dec;102(6):809–15.
30. Bozeman TB, Lemon RR, Eleazer PD.
Elemental Analysis of Crystal Precipitate from Gray and White MTA.
J Endod. 2006;32(5):425–8.
31. Lindsey DT, Wee AG.
Perceptibility and acceptability of CIELAB color differences in
computer-simulated teeth.
J Dent. 2007 Jul;35(7):593–9.
32. Kim-Pusateri S, Brewer JD, Davis EL, Wee AG.
Reliability and accuracy of four dental shade-matching devices.
J Prosthet Dent. 2009 Mar;101(3):193–9.
33. Schembri M, Peplow G, Camilleri J.
Analyses of heavy metals in mineral trioxide aggregate and Portland
cement.
J Endod [Internet]. 2010;36(7):1210–5.
34. Belobrov I, Parashos P.
Treatment of tooth discoloration after the use of white mineral trioxide
aggregate.
Bibliography
J Endod [Internet]. 2011;37(7):1017–20.
35. Jang JH, Kang M, Ahn S, Kim S, Kim W, Kim Y, et al.
Tooth discoloration after the use of new pozzolan cement (Endocem)
and mineral trioxide aggregate and the effects of internal bleaching.
J Endod [Internet]. 2013;39(12):1598–602.
36. Berger T, Baratz AZ, Gutmann JL.
In vitro investigations into the etiology of mineral trioxide tooth
staining.
J Conserv Dent. 2014;17(6):526–30.
37. Camilleri J.
Color stability of white mineral trioxide aggregate in contact with
hypochlorite solution.
J Endod. 2014 Mar;40(3):436–40.
38. Beatty H, Svec T.
Quantifying Coronal Tooth Discoloration Caused by Biodentine and
EndoSequence Root Repair Material.
J Endod [Internet]. 2015;41(12):2036–9.

Bibliography
39. Esmaeili B, Alaghehmand H, Kordafshari T, Daryakenari G,
Ehsani M, Bijani A.
Coronal discoloration induced by calcium-enriched mixture, mineral
trioxide aggregate and calcium hydroxide: A spectrophotometric
analysis.
Iran Endod J. 2016;11(1):23–8.
40. Javidi M, Zarei M, Omidi S, Ghorbani A, Gharechahi M, Shayani
Rad M.
Cytotoxicity of a new nano zinc-oxide eugenol sealer on murine
fibroblasts.
Iran Endod J. 2015;10(4):231–5.
41. Vallés M, Roig M, Duran-Sindreu F, Martínez S, Mercadé M.
Color Stability of Teeth Restored with Biodentine: A 6-month in Vitro
Study.
J Endod. 2015;41(7):1157–60.
42. Dettwiler CA, Walter M, Zaugg LK, Lenherr P, Weiger R, Krastl
G.
In vitro assessment of the tooth staining potential of endodontic
materials in a bovine tooth model.
Bibliography
Dent Traumatol. 2016;32(6):480–7.
43. Shokouhinejad N, Nekoofar MH, Pirmoazen S, Shamshiri AR,
Dummer PMH.
Evaluation and Comparison of Occurrence of Tooth Discoloration after
the Application of Various Calcium Silicate-based Cements: An Ex
Vivo Study.
J Endod [Internet]. 2016;42(1):140–4.
44. Marciano MA, Camilleri J, Costa RM, Matsumoto MA, Guimarães
BM, Duarte MAH.
Zinc Oxide Inhibits Dental Discoloration Caused by White Mineral
Trioxide Aggregate Angelus.
J Endod. 2017;43(6):1001–7.
45. Bansode P V, Pathak SD, Wavdhane MB, Bhalerao VU. Pozzolan
Dental Cement : A review.
2018;17(4):7–9.
46. Beaudoin J, Odler I.
Hydration, Setting and Hardening of Portland Cement. Lea’s
Chem Cem Concr. 2019;157–250.
Bibliography
47. Jiménez-Sánchez M del C, Segura-Egea JJ, Díaz-Cuenca A.
Higher hydration performance and bioactive response of the new
endodontic bioactive cement MTA HP repair compared with ProRoot
MTA white and NeoMTA plus.
J Biomed Mater Res - Part B Appl Biomater. 2019;107(6):2109–20.
48. Marconyak LJ, Kirkpatrick TC, Roberts HW, Roberts MD,
Aparicio A, Himel VT, et al.
A comparison of coronal tooth discoloration elicited by various
endodontic reparative materials.
J Endod [Internet]. 2016;42(3):470–3.
49. Zeid STA, Alamoudi NM, Khafagi MG, Abou Neel EA.
Chemistry and Bioactivity of NeoMTA PlusTM
versus MTA Angelus®
Root Repair Materials.
J Spectrosc. 2017;
50. Joiner A.
Tooth colour: A review of the literature.
J Dent. 2004;32(SUPPL.):3–12.
Bibliography
51. Odaira C, Itoh S, Ishibashi K.
Clinical evaluation of a dental color analysis system: The Crystaleye
Spectrophotometer®.
J Prosthodont Res [Internet]. 2011;55(4):199–205.
52. Dagg H, O’Connell B, Claffey N, Byrne D, Gorman C.
The influence of some different factors on the accuracy of shade
selection.
J Oral Rehabil. 2004;31(9):900–4.
53. Lee YK, Bin Y.
Translucency and color match with a shade guide of esthetic brackets
with the aid of a spectroradiometer.
Dental Press J Orthod. 2016;21(2):81–7.
54. Ishikawa-Nagai S, Yoshida A, Da Silva JD, Miller L.
Spectrophotometric analysis of tooth color reproduction on anterior all-
ceramic crowns: Part 1: Analysis and interpretation of tooth color.
J Esthet Restor Dent. 2010;22(1):42–52.
Bibliography
55. Aljawad AJSR.
Retrospective Study of the Survival and Patient Satisfaction with
Composite Dahl Restorations in the Management of Localised Anterior
Tooth Wear.
Eur J Prosthodont Restor Dent [Internet]. 2013;21(1):44–8.
56. Lehmann KM, Igiel C, Schmidtmann I, Scheller H.
Four color-measuring devices compared with a spectrophotometric
reference system.
Journal of Dentistry. 2010.
57. Graphics M.
Color difference Delta E - A survey Colour difference ∆ E - A survey.
2016;(May).
58. Chu SJ, Trushkowsky RD, Paravina RD.
Dental color matching instruments and systems. Review of clinical and
research aspects.
J Dent. 2010;38(SUPPL. 2):2–16.
Bibliography
59. Koroluk LD, Tulloch JFC, Phillips C,
Wolf GR. Incisor trauma and early treatment for Class II Division 1
malocclusion.
Am J Orthod Dentofac Orthop. 2003;123(2):117–25.
60. Bauss O, Röhling J, Schwestka-Polly R.
Prevalence of traumatic injuries to the permanent incisors in candidates
for orthodontic treatment.
Dent Traumatol. 2004;20(2):61–6.
61. Schilke R, rg Lisson JA, Bauû O, Geurtsen W.
Comparison of the number and diameter of dentinal tubules in human
and bovine dentine by scanning electron microscopic investigation
[Internet]. Available from: www.elsevier.com/locate/archoralbio
62. Tanaka JLO, Medici Filho E, Salgado JAP, Salgado MAC, de
Moraes LC, de Moraes MEL, et al.
Comparative analysis of human and bovine teeth: Radiographic density.
Braz Oral Res. 2008;22(4):346–51.
Bibliography
63. Nakamichi I, Iwaku M, Fusayama T.
Bovine Teeth as Possible Substitutes in the Adhesion Test.
J Dent Res. 1983;62(10):1076–81.
64. Yu XY, Joynt RB, Davis EL, Wieczkowski G.
Adhesion to dentin.
J Calif Dent Assoc. 1993;21(6):23–9.
65. Nekoofar MH, Davies TE, Stone D, Basturk FB, Dummer PMH.
Microstructure and chemical analysis of blood-contaminated mineral
trioxide aggregate.
Int Endod J. 2011;44(11):1011–8.
66. Namazikhah MS, Nekoofar MH, Sheykhrezae MS, Salariyeh S,
Hayes SJ, Bryant ST, et al.
The effect of pH on surface hardness and microstructure of mineral
trioxide aggregate.
Int Endod J. 2008;41(2):108–16.
67. Elnaghy AM.
Influence of acidic environment on properties of Biodentine and white
mineral trioxide aggregate: A comparative study.
Bibliography
J Endod [Internet]. 2014;40(7):953–7.
68. Wang Z, Ma J, Shen Y, Haapasalo M.
Acidic pH weakens the microhardness and microstructure of three
tricalcium silicate materials.
Int Endod J. 2015;48(4):323–32.
69. Khinda VI, Brar GS, Kallar S, Khurana H.
Clinical and Practical Implications of Storage Media used for Tooth
Avulsion.
Int J Clin Pediatr Dent. 2017;10(2):158–65.
70. Ahmed HMA, Abbott P V.
Discolouration potential of endodontic procedures and materials: A
review.
Int Endod J. 2012 Oct;45(10):883–97.
71. Hattab FN, Qudeimat MA, Al-Rimawi HS.
Dental discoloration: An overview.
J Esthet Restor Dent. 1999;11(6):291–310.
Bibliography
72. Attin T, Paqué F, Ajam F, Lennon ÁM.
Review of the current status of tooth whitening with the walking bleach
technique.
Int Endod J. 2003;36(5):313–29.
73. Vallés M, Mercadé M, Duran-Sindreu F, Bourdelande JL, Roig M.
Influence of light and oxygen on the color stability of five calcium
silicate-based materials.
J Endod. 2013 Apr;39(4):525–8.
74. S. N, A.H. H.
Mineral trioxide aggregate as a pulpotomy agent in primary molars: An
in vivo study.
J Indian Soc Pedod Prev Dent [Internet]. 2005;23(1):13–6.
75. Jacobovitz M, De Pontes Lima RK.
The use of calcium hydroxide and mineral trioxide aggregate on
apexification of a replanted tooth: A case report.
Dent Traumatol. 2009;25(3):32–6.
Bibliography
76. Camilleri J.
Hydration mechanisms of mineral trioxide aggregate.
Int Endod J. 2007;40(6):462–70.
77. Camilleri J, Sorrentino F, Damidot D.
Investigation of the hydration and bioactivity of radiopacified
tricalcium silicate cement, Biodentine and MTA Angelus.
Dent Mater. 2013;29(5):580–93.
78. Choi Y, Park SJ, Lee SH, Hwang YC, Yu MK, Min KS.
Biological effects and washout resistance of a newly developed fast-
setting pozzolan cement.
J Endod. 2013 Apr;39(4):467–72.
79. Andrade AS, Rodrigues EM, Viola KS, Faria G, As A, Em R, et al.
Biocompatibility and mineralized nodule formation of Neo MTA Plus
and an experimental tricalcium silicate cement containing tantalum
oxide. 2017;31–9.
80. Oh MH, Lee N, Kim H, Park SP, Piao Y, Lee J, et al.
Large-scale synthesis of bioinert tantalum oxide nanoparticles for X-ray
computed tomography imaging and bimodal image-guided sentinel
Bibliography
lymph node mapping.
J Am Chem Soc. 2011;133(14):5508–15.
81. Walsh RM, Woodmansey KF, He J, Svoboda KK, Primus CM,
Opperman LA.
Histology of NeoMTA Plus and Quick-Set2 in Contact with Pulp and
Periradicular Tissues in a Canine Model.
J Endod [Internet]. 2018;44(9):1389–95.
82. Aktemur Türker S, Uzunoğlu E, Bilgin B.
Comparative evaluation of push-out bond strength of Neo MTA Plus
with Biodentine and white ProRoot MTA.
J Adhes Sci Technol. 2017;31(5):502–8.
83. Marciano MA, Duarte MAH, Camilleri J.
Dental discoloration caused by bismuth oxide in MTA in the presence
of sodium hypochlorite.
Clin Oral Investig. 2015 Dec 1;19(9):2201–9.
84. Komabayashi T, Spångberg LSW.
Particle Size and Shape Analysis of MTA Finer Fractions Using
Portland Cement.
Bibliography
J Endod. 2008;34(6):709–11.
85. Palareti G, Legnani C, Cosmi B, Antonucci E, Erba N, Poli D, et al.
Comparison between different D-Dimer cutoff values to assess the
individual risk of recurrent venous thromboembolism: Analysis of
results obtained in the DULCIS study.
Int J Lab Hematol. 2016;38(1):42–9.
86. Mohandas G, Oskolkov N, McMahon MT, Walczak P, Janowski M.
Porous tantalum and tantalum oxide nanoparticles for regenerative
medicine.
Acta Neurobiol Exp (Wars). 2014;74(2):188–96.
87. Siboni F, Taddei P, Prati C, Gandolfi MG.
Properties of NeoMTA plus and MTA plus cements for endodontics.
Int Endod J. 2017;50(Special Issue 2):e83–94.
88. Pulp NN.
Pulpotomy and Apexogenisis.
89. Preparation F, Camilleri J.
Mineral Trioxide Aggregate in Dentistry.2014.
Bibliography
90. Camilleri J, Kralj P, Veber M, Sinagra E.
Characterization and analyses of acid-extractable and leached trace
elements in dental cements.
Int Endod J. 2012;45(8):737–43.
91. Chang SW, Baek SH, Yang HC, Seo DG, Hong ST, Han SH, et al.
Heavy metal analysis of ortho MTA and ProRoot MTA.
J Endod [Internet]. 2011;37(12):1673–6.
92. Tran D, He J, Glickman GN, Woodmansey KF.
Comparative analysis of calcium silicate-based root filling materials
using an open apex model.
J Endod [Internet]. 2016;42(4):654–8.

Annexures
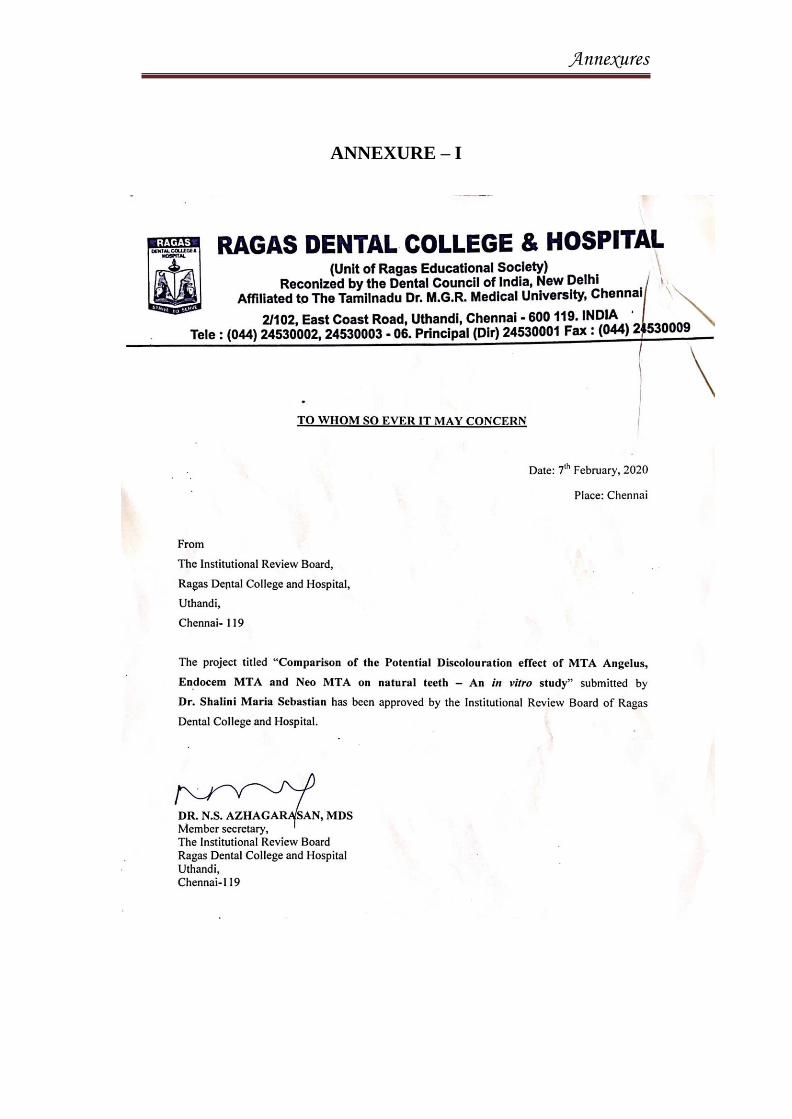
Annexures
ANNEXURE – I
Annexures
ANNEXURE –II