Dissertation - EPrints@Tamil Nadu Dr MGR Medical University
143
Dissertation Submitted to THE TAMILNADU Dr. M.G.R MEDICAL UNIVERSITY In partial fulfilment of the requirements for the award of the degree of M.D COMMUNITY MEDICINE Branch XV May 2019 “PREVALENCE AND SOCIAL FACTORS ASSOCIATED WITH ALCOHOL USE AMONG MEN IN THIRUVATTAR”
-
Upload
khangminh22 -
Category
Documents
-
view
1 -
download
0
Transcript of Dissertation - EPrints@Tamil Nadu Dr MGR Medical University

Dissertation
Submitted to
THE TAMILNADU Dr. M.G.R MEDICAL
UNIVERSITY
In partial fulfilment of the requirements for
the award of the degree of
M.D COMMUNITY MEDICINE
Branch XV
May 2019
“PREVALENCE AND SOCIAL FACTORS ASSOCIATED
WITH ALCOHOL USE AMONG MEN IN THIRUVATTAR”

CERTIFICATE
This is to certify that this dissertation entitled “Prevalence And Social Factors
Associated With Alcohol Use Among Men In Thiruvattar” is a bonafide record
of the work done by Dr.M.S.Praythiesh Bruce during the period 2016-2019. This
has been submitted in the partial fulfilment of the award of M.D. Degree in
Community Medicine [Branch-XV] by the Tamilnadu Dr. MGR Medical
University Chennai.
Dr.M.C Vasantha Mallika.M.D.,DPH.
Professor and Head
Department of Community Medicine
Sree Mookambika Institute of
Medical Sciences
Kulasekharam
Kanyakumari District
Tamil Nadu -629161
Dr.Rema.V.Nair.M.D., D.G.O.
Director
Sree Mookambika Institute of
Medical Sciences
Kulasekharam
Kanyakumari District
Tamil Nadu -629161

CERTIFICATE
This is to certify that this dissertation entitled “Prevalence And Social
Factors Associated With Alcohol Use Among Men In Thiruvattar”hereby
submitted by Dr. M.S.Praythiesh Bruce for the M.D. Degree in Community
Medicine [Branch-XV] in the Tamilnadu Dr. MGR Medical University is a
record of bonafide research work carried out by him under our guidance and
supervision during the period 2016-2019.
Dr.Austoria A.J.M.D.
[Co-guide]
Assistant Professor
Department of Community Medicine
Sree Mookambika Institute of
Medical Sciences
Kulasekharam
Kanyakumari District
Tamil Nadu -629161
Dr.M.C Vasantha Mallika.M.D.,DPH.
Professor and Head
Department of Community Medicine
Sree Mookambika Institute of
Medical Sciences
Kulasekharam
Kanyakumari District
Tamil Nadu -629161

DECLARATION
I Dr. M.S.Praythiesh Bruce hereby submit the dissertation titled
“PREVALENCE AND SOCIAL FACTORS ASSOCIATED WITH
ALCOHOL USE AMONG MEN IN THIRUVATTAR” done in partial
fulfilment for the award of the degree M.D Community medicine
[Branch-XV] in Sree Mookambika Institute of Medical Sciences,
Kulasekharam.
This is an original work done by me under the guidance and supervision
of Dr. M.C.Vasantha Mallika M.D., DPH. and Dr. Austoria A.J.M.D.
Dr.M.S.Praythiesh Bruce
Postgraduate
Department of Community
medicine
Sree Mookambika Institute of
Medical Sciences
Kulasekharam
Kanyakumari District
Tamil Nadu -629161
Dr. M.C. Vasantha Mallika.M.D., DPH.
Professor and Head
Department of Community Medicine
Sree Mookambika Institute of
Medical Sciences
Kulasekharam
Kanyakumari District
Tamil Nadu -629161


ACKNOWLEDGEMENT
My foremost thanks goes to the God Almighty who has blessed me abundantly with
His grace, for giving me the strength that I needed to complete this thesis.
I extend my sincere heartfelt thanks to Dr. Velayuthan Nair, Chairman and Dr.
Rema. V. Nair, Director, for providing facilities to accomplish my dissertation work. I also
thank the Principal of the Institution Dr. Padmakumar and vice principal Dr.Mookambika
R.V and Deputy Medical Superindent Dr. Vinu Gopinath for their valuable support
extended to me.
I express my sincere thanks and gratitude to my professor, mentor and guide Dr.M.C
Vasantha Mallika, Head of the Department, for her valuable and constant guidance,
supervision and support throughout the study. Her constant motivation has helped me to
overcome all the challenges and difficulties that I came across during this research work.
I am very much grateful to my co-guide Dr. Austoria .A.J., Assistant Professor, for
her tremendous help, valuable support and guidance in carrying out the study. Her constant
encouragement helped me to overcome obstacles during the study.
I wish to express my sincere thanks to Dr.Sudhir Ben Nelson Assistant Professor,
for his help and valuble suggestions during the study period
I wish to express my sincere thanks to Dr.Vishnu.G.Ashok Assistant Professor, for
his help and valuble suggestions during the study period.
I also thank Dr.Priya, Assistant Professor, for the help during the study period.
I humbly thank Ms.Jossy John, Lecturer in Statistics, Department of Community
Medicine, for the support, guidance and help at each stage of my dissertation work.
I also thank my Junior Post Graduates for their help and support.
I am very grateful for the support, encouragement and care given by parents and
friends whenever I needed most.
Mrs. Ambika Kumari deserves special mention for her help and cooperation.

DEDICATED TO MY PARENTS, BROTHER,
SISTER, TEACHERS, FRIENDS,
COLLEGUES & MY DEAR WIFE
Without whom I would have never reached to this
stage of life.

CONTENTS
SL.NO TITLE PAGE NO.
1 INTRODUCTION 1
2 AIMS & OBJECTIVES 4
3 REVIEW OF LITERATURE 5
4 MATERIALS & METHODS 33
5 RESULTS 40
6 DISCUSSION 76
7 SUMMARY & CONCLUSION 90
8 LIMITATIONS 91
9 RECOMMENDATIONS 92
10 REFERENCES -
11 ANNEXURES -

LIST OF TABLES
Prevalence of alcohol use among Men in states and union territories in India 11
Table 1: Distribution of study population based on age 41
Table 2: Distribution of study population based on religion 42
Table 3: Distribution of study population based on marital status 42
Table 4: Distribution of study population based on educational qualification 43
Table 5: Distribution of study population based on occupation 44
Table 6: Distribution of study population based on income 44
Table 7: Distribution of study population based on Modified Kuppuswamy socio
economic classification 45
Table 8: Alcohol use among the study population 46
Table 9: Distribution of ever alcohol users 46
Table 10: Alcohol use disorder according to AUDIT category 47
Table 11: Dependence category for current alcoholics 48
Tables 12: Frequency of alcohol use among ever and current alcohol users 49
Table 13: AUDIT score among current alcohol users (n = 232) 50
Table14: Age of initiation of alcohol and awareness about it. 50
Tables 15: Place of alcohol use among ever and current alcohol users 51
Tables 16: Company for alcohol use among ever and current alcohol users 52
Tables 17: Type of alcohol use among ever and current alcohol users 53
Table 18: Reason for Starting Alcohol among Ever and Current Alcohol user 54
Table19: Reason for continuing alcohol use in ever and current alcohol user. 55
Table 20: Efforts to stop alcohol use among ever and current alcohol users 56
Table 21: Factors Associated with alcohol use among ever and never alcohol users 58
Table 22: Factors Associated with alcohol use among ever and never alcohol
users-Odds (95%CI)
61
Table 23: Factors associated with alcohol use among current alcohol users 64
Table 24: Factors associated with alcohol use among current alcohol users-
Odds(95%CI)
67
Table 25: Factors associated with alcohol dependence among current 70
Table 26: Factors associated with alcohol dependence among current users-
Odds(95%CI)
74

LIST OF FIGURES
Figure 1 Total alcohol per capita(15+ years) consumption; in liters
of pure alcohol, 2010
7
Figure 2 Proportion (%) of recorded alcohol per capita (15+)
years consumption consumed in the form of beer, wine,
spirit and other beverages by WHO region and world
29
Figure 3 Flow chart depicting the prevalence of alcohol use
among men in Thiruvattar block aged 18 and above
40

1. INTRODUCTION
Alcoholic beverages have been consumed from the beginning of the
recorded history of human society1. Both the developed and underdeveloped
countries have been suffering from the abuse of alcohol2. As per World Health
Organization[WHO] Global status report 76.3 million are diagnosed with alcohol
use disorders in 2 billion people consuming alcohol3. Due to harmful use of
alcohol 5.9 % of all deaths that occur worldwide. Globally, 3.3 million deaths
occur every year. Alcohol is a causal factor in more than 200 disease and injury
conditions. Overall 5.1 % of the global burden of disease and injury are due to
Alcoholism, as measured in disability-adjusted life years (DALYs). Death and
disability occur early in life and it is mainly seen in 20-39 years and 25 % of the
total deaths among this age group are attributable to alcohol. There is a causal
relationship between the harmful use of alcohol and a range of mental and
behavioural disorders and other non-communicable diseases and injuries. Harmful
use of alcohol brings significant social and economic losses to individuals and
society4. Some countries in the South-East Asia Region are moving to a higher
level of alcohol use in the last decade.
The globalization of the economies in the South-East Asia Region (SEAR)
is increasing and so it leads to increase alcohol consumption which leads to
abuse/harmful use and also addiction (dependence) . The alcohol industry is
expanding hugely in the Region. In the period between 1993-94 the total annual
estimated alcohol production was 642 million litres and it has doubled to 789
million litres in 2 years during 1994-1995 5 . In 2006 – 2007 in Tamilnadu 13.6%

of the total state revenue was generated through the sale of alcohol. Tamil Nadu
Government took over the retail sales of alcohol in a policy change in 2003. Illicit
alcohol trade was wiped out through a series of measures. The Tamil Nadu State
Marketing Corporation (TASMAC) was the sale outlets, apart from a few high-
end bars and hotels. An increase of 40.34% in turnover was noted and an
additional revenue of Rs. 15.64 billion was generated in the first 11 months when
retail alcohol sales were taken over by the Government6
The revenue earned through a special fee on imported foreign liquor sales
was increased in TASMAC from 1.86 crores [2010-2011] to 10.80 crores in
[2016-17 ]6.The export of beer from Tamilnadu to other states has been increased
from 1,15,00[2015-16] to 1,27,150 cases [2017-18]7.
The prevalence of alcohol use among men in India as per National Family
Health Survey[NFHS]-4 [2015-16] was 29.2%8.The highest prevalence was seen
in Arunachal Pradesh (59%) and lowest prevalence was seen in New Delhi ( 0.7%
) as per NFHS-4 [2015-16]. The prevalence of alcohol use in Tamilnadu as per
NFHS-4 was 46.7% [2015-16]8. The magnitude and pattern of alcohol behavior,
alcohol exposure (volume, patterns, and quality of alcohol consumed), economic
development, culture, and existing alcohol-related policies are determined by a
number of factors associated with individual and social levels like
poverty,illiteracy3
The rapid proliferation of city bars and nightclubs lead to increase in sale
of alcohol to 8 % in the past three years in India due to which about 14 million

people are dependent drinkers. The average age of initiation of alcohol use has
dropped down from 19 years to 13 years in the past two decades9. The spectrum of
alcohol use ranges from one- time use, regular use, hazardous use and harmful use
The quantity of alcohol consumed in each individual also have varying strength as
per alcohol consumption occur in different quantity, frequency, type of beverage
and alcohol concentration across type of beverage. In developing country alcohol
consumption is on the rise adding to the burden of the alcohol-attributable disease.
WHO formulated a tool called [Alcohol Use Disorder Identification Test] AUDIT
tool which is used widely across the world in primary care levels to quantify
alcohol use and disorder associated with it. The AUDIT is the simple method of
screening for excessive drinking and to assist in brief assessment. AUDIT helps to
identify excess drinking and provide a framework of intervention to help
hazardous and harmful drinkers reduce or cease alcohol consumption and avoid
the harmful consequences of their drinking10,11.
Various surveys had been done to find the each individual’s drinking
pattern .An individual’s drinking pattern can be related to other personal
characteristics and behaviour12--15.
Hence knowing the prevalence and social factors associated with alcohol
use, it will be helpful to suggest control measures. So this study was conducted to
estimate the prevalence and social factors associated with alcohol use among adult
men in Thiruvattar block of Kanyakumari District, Tamil Nadu in South India.

2. OBJECTIVES
1. To estimate the prevalence of alcohol use among adult men in Thiruvattar block.
2. To identify the patterns of alcohol use by using the AUDIT scoring system
3. To find the social factors associated with alcohol use

3. REVIEW OF LITERATURE
3.1 HISTORY:
Alcohol is the oldest and the most widely used drug according to the old
Arabic dictionaries. Al- Kol (Al- ghol) means any drug or substance that takes
away the mind or covers it. Moderate amounts of alcohol stimulate the mind and
relax the muscles.
The Greeks had employed wine and vinegar in wound care. Alcohol-
containing beverages played a vital part in the daily lives of ancient people. Beer is
the fermented form of barley, the earliest known alcoholic drink to man10.In 1790
The East India Company for the first time imposed excise duty on alcohol as a
regular source of revenue. 19th century, the policy of the Government of India was
to minimize temptation among those who did not drink, and discourage excess use
among those who were drinking ’. After independence, the prohibition movement
survived till the mid-1960s, when several states lifted the prohibition. The
prohibition orders were soon reversed as states lost nearly 20-25% of alcohol-
related Revenue16-19.
Although the Constitution of India upholds prohibition in its directive
principles, the liberalization in the production, distribution, and consumption of
alcohol is well known in most states. Since the trade liberalization in 1992–93, the
attitudes of the Central and State governments to alcohol have changed
dramatically with the previous restrictions on consumption and production being
relaxed. Alcohol multinationals eagerly took advantage of India's economic
liberalization and relaxation of regulations in order to invest in local beverage
production for the country's market. Improved fermentation and distillation
process and packing technology resulted in alcoholic beverages belonging to a
mass-produced commercial item. Improved intra country transport facility
contributed to its easy availability16-19
3.2 CURRENT PATTERNS OF ALCOHOL USE:
3.2.1 WORLD SCENARIO:
According to WHO data, globally, individuals above 15 years of age drink
on an average 6.2 litres of pure alcohol per year ( Figure 1 ). There is a wide
variation in total alcohol consumption across WHO regions and Member States (
Figure 1). The highest consumption levels continue to be found in the developed
world, especially in the WHO European Region (EUR) and the WHO Region of
the Americas (AMR). Intermediate levels of consumption are found in the WHO
Western Pacific Region (WPR) and the WHO African Region (AFR) The lowest
consumption levels are found in the WHO Eastern Mediterranean Region(EMR)
(Figure 2).

( Figure 1 )3 shows Total alcohol per capita(15+ years) consumption; in liters of
pure alcohol, 2010

Geographical differences exist regarding the type of alcohol people consume [
beer, wine, spirits or other alcoholic beverages (e.g. fortified wines, rice wine or
other fermented beverages made of sorghum, millet or maize)].Globally, 50.1% of
total recorded alcohol is consumed in the form of spirits, the most consumed
beverage types in the WHO South-East Asia and Western Pacific regions (Figure
2). The second most consumed beverage types is beer, which accounts for 34.8%
of all recorded alcohol consumed in the world. It is the most consumed type of
beverage in the WHO Region of the Americas (55.3%). 8.0% of total recorded
alcohol is consumed in the form of wine. The consumption of wine represents one-
fourth of total consumption in the WHO European Region (25.7%) and one-ninth
of total consumption the WHO Region of the Americas (11.7%) "Other" beverages
only represent 7.1% of all consumption, but constitute the most popular beverage
type in the African Region (51.6% of total recorded consumption)3.

3.3 INDIAN SCENARIO:
India has seen a rapid proliferation of city bars and nightclubs in recent
years. It has led to undocumented rise in alcohol abuse not only among the poorer
classes, but also in sections of society that were previously considered dry. The
increasing production, distribution, and promotion of alcohol has led to drink-
related problems emerging as a major public health concern in India. Sales of
alcohol have seen a growth rate of 8% in the past 3 years. 21% of adult men and
around 2% of women drink. But up to a fifth of this group are dependent
drinker20-23.
3.3.1 PREVALENCE OF ALCOHOL USE
1.1 INDIA:
As per NFHS -4 (2015-2016) prevalence of alcohol use among Men in India
is 29.2%8.

Prevalence of alcohol use among Men in various states and union territories
in India is listed below in the table8.
States /union territories Prevalence of alcohol among men (%)
HIMACHAL PRADESH 39.7%
HARYANA 24.5%
DAMAN &DIO 35.8%
ARUNACHAL PRADESH 59.0%
TAMILNADU 46.7%
WEST BENGAL 28.7%
UTTARKAND 35.2%
UTTAR PRADESH 22.1%
TRIPURA 57.6%
TELUNGANA 53.9%
SIKKIM 51.2%
RAJASTHAN 15.9%
PUDHUCHERRY 41.0%
PUNJAB 34%
NAGALAND 39%
MIZORAM 49.6%
MADHYAPRADESH 29.6%
MANIPUR 52.6%
MEGHALAYA 44.0%
MAHARASHTRA 20.5%
LAKSHADWEEP 6.8%
KERALA 37%
KARNATAKA 29.3%
JAMMU &KASHMIR 10.5%
JHARKHAND 39.3%
GUJARAT 11.1%
GOA 44.7%
DADRA &NAGAR HAVELI 33.9%
NCT DELHI 0.7%
CHATTISGARH 52.7%
CHANDIGARH 39.3%
BIHAR 28.9%
ASSAM 37.8%
ANDRA PRADESH 34.9%

3.3.1.2 PREVALENCE IN TAMILNADU:
As per NFHS -4 (2015-2016) prevalence of alcohol use among Men in
Tamilnadu is 46.7%8.
3.4.1 PATTERNS OF DRINKING IN INDIA20-23:
There has been a rapid change in patterns and trends of alcohol use in India.
The most important among them is the initiation of drinking at an younger age.
The percentage of the drinking population aged under 21 years has increased from
2% to more than 14% in the past 15 years. The “average age of initiation” had
dropped from 19 years to 13 years in the past two decades. The local industry has
introduced flavoured alcohol drinks to attract previously non-drinking women and
young men. Multinational companies have identified India as one of the world’s
most sought after places for investment. Two thirds of the alcohol drunk in India is
unrecorded because it is either illicit liquor or has been smuggled into the country.
Employers in poor, marginalised communities sometimes pay wages in alcohol
rather than cash, according to WHO. The hazards of spurious liquor can be fatal,
with frequent reports of death, disability, and hospitalisation resulting from its
consumption across the country20-23.
3.4.2A.AGE OF INITIATION OF ALCOHOL USE :
The average age of initiation had dropped from 19 years to 13 years in the
past two decades in India20-23.

3.5. SPECTRUM OF ALCOHOL USE:
In different societies and in the proportions of population in different
groups the drinking spectrum of alcohol varies considerably11.
3.5.1 HARMFUL USE:
Harmful use refers to alcohol consumption that results in consequences to
physical and mental health and social consequences among the harms caused by
alcohol11
Harmful alcohol use pattern causes serious damage to health. That can be
physical (prolonged use of alcohol can cause hepatitis) or mental (e.g. heavy
alcohol consumption can lead to episode of depressive disorder)11.
Ganesh Kumar et al in a rural community based cross-sectional study
revealed that the prevalence of alcohol use was found to be 9.4%. Prevalence was
more among males (16.8%) as compared to that among females Among those who
used alcohol, 29.2% (26) were possible hazardous drinkers, 33.7%(30) had a
probable alcohol dependence and 56.2% (50) had experienced harmful effects,
based on AUDIT item analysis24-27.
In a community-based cross-sectional analytical study done by
Purushothaman Vaithiyanathan et al (April 2016 to March 2017) among adult
residents of the coastal villages of Puduchery, south India reported that the
prevalence of alcohol use was 152 (61.5%, 95% CI- 55.4%-67.5%), 63 (25.5%,
95% CI- 20.4%-31.2%) had harmful use of alcohol and 20 (8.1%, 95% CI- 5.2%-

12.0%) had probable dependence to alcohol. The study showed very high
prevalence of alcohol use and harmful use of alcohol in coastal villages. Stringent
regulatory approaches and effective health education approaches were much
needed for the control of alcohol use and harmful use of alcohol28-31.
A community-based, cross-sectional study by Santanu Ghosh et al during
(May 2008–April 2009) at a Slum in Kolkata, India revealed that 65.8% (150/228)
were current consumers of alcohol; 14% were alcohol-dependents; 8% were
hazardous or harmful to consumers, and 78% were nonhazardous non-harmful
consumers32-35.
3.5.2. HAZARDOUS ALCOHOL USE:
Hazardous alcohol use is a pattern of alcohol consumption that increases
the risk of harmful consequences for the user or others 11.
A cross sectional study from Goa by Melvin Chagas Silva et al found that
the prevalence of hazardous drinking, defined as per AUDIT score of more than 8
was 21%. There was a significant association with Common Mental Disorders (OR
2, P = 0.003). Hazardous drinking was significantly associated with severe health
problems, such as head injuries and hospitalization, whereas Common Mental
Disorders was found to be a confounder in its association with adverse economic
outcomes36-39.
A Case-control study conducted by John et al in Kaniyambadi block,
Vellore district, Tamil Nadu among adult men found that the in the past year
prevalence of lifetime use was 46.7% and alcohol hazardous use was 14.2%. The

risk factors for hazardous use of alcohol were using Indian made foreign liquor
(OR 20.51; 95% CI 8.81–47.75) and living in a village which brewed illicit alcohol
(OR 2.82; 95% CI 1.39–5.72)40-43.
3.5.3. DEPENDENCE SYNDROME:
This includes a cluster of physiological, behavioural, and cognitive
phenomena in which the use of a substance or a class of substances takes on a
much higher priority than other behaviours that once had greater value for a given
individual. A character of the dependence syndrome is the desire (often strong,
sometimes overpowering) to take the psychoactive drugs (which may or not have
been medically prescribed), alcohol, or tobacco44-47..
Rakshase Bal et al in a cross-sectional, descriptive study done at
Thiruvananthapuram reported that Alcohol Dependence among males in
Thiruvananthapuram was as high as 38.41%. Alcohol Dependence was associated
with socio-demographic factors such as marital disharmony, poor income, poor
education, and unemployment. Alcohol use was influenced by religious factors. By
addressing the issue of social deprivation at a macro level alcohol Dependence can
be curbed48-51.
A hospital-based cross-sectional descriptive study by Santhosh Kumar et al
in Psychiatry Out Patient Department of a tertiary care Medical institute at Bareilly
in Uttar pradesh done among 50 male patients of alcohol dependence syndrome
show that in comparison to normal controls, the patients of alcohol dependence
syndrome had significantly higher mean scores on the Scale for Suicide Ideation

(t=2.858, df=98, p<0.01), Beck Depression Inventory-Short Form (t=3.082, df=98,
p<0.01) and the State subscale (t=3.465, df=98, p<0.01) as well as the Trait
subscale (t=3.508, df=98, p<0.01) of State Trait Anxiety Inventory. So the male
patients of the alcohol dependence syndrome had significantly higher suicidal
ideation ,depression ,and state and trait anxiety scores as compared to normal
controls52-55.
A study conducted by Surjit Kumar Sen et al at Silchar Medical College
and Hospital, Silchar, in December 2015 to February 2016 found that the
Majority of alcohol dependence cases were from the age range of 35 to 44 years
(44%) while their primary caregivers from 30 to 39 years (44%). Most of the cases
had their spouses (74%) as the primary caregivers and 10–14 years of alcohol
dependence (34%). The higher family burden was associated with equal to or more
than 15 years of alcohol dependence which was statistically significant in most of
the areas The severity of family burden was greatly influenced by the duration of
the alcohol dependence of the cases52-55.
A cross-sectional study undertaken in the various wards of Jabalpur
Cantonment in India by Rajendra Harnagle et al in an urban community of
Jabalpur found that among 3586, 434 (12.10%) were found to have a Alcohol
dependence syndrome (ADS) i.e. 7.96 % of the total strength was found to be
problem drinkers. Persons improved at the end of 12 months were 280 out of 434
by Alcoholic Anonymous counseling. 64.51%. were available for the complete
follow-up study . The ADS had significantly reduced by Alcoholic Anonymous
counseling at six months itself (p<0.000). This improvement not only sustained at

12 months, but further improved upon (p<0.004). So the improvement was highly
significant (p<0.000). The prevalence of alcohol dependence syndrome was
increasing globally. In India the ADS had been significantly reduced by alcoholic
anonymous counseling.56.
3.5.4. RECENT CHANGES IN ALCOHOL CONSUMPTION
PATTERNS:
There has been a rapid change in alcohol consumption patterns in India.
Important among them is people are beginning to drink at ever-younger ages. The
minimum legal age for starting alcohol consumption in India was 21 years. The
percentage of the drinking population aged under 21 years has increased from 2%
to more than 14% in the past 15 years9,57-60.
3.6. EFFECTS OF ALCOHOL:
Alcohol has many uses in human life. These include beverage use (fuel,
solvent) and non beverage use and also used as medicine, religious sacrament
,food stuff and thirst quencher. Alcohol acts as a depressant. It can also affect
mood and feelings, impairs physical coordination, cognition, attention, resulting in
accidents and injury. Prolonged alcohol use can cause death and disability1,61-64.
Nidhi Goel et al in a multicentre cross-sectional study among medical
undergraduates and postgraduate medical residents of eight medical colleges
across India reported that substance use adversely affected their skills in 90% of
study participants.25-27 .

Bhullar et al in a study done among second-year medical students found
that almost all cases showed degeneration in the form of delirium tremens,
Korsakoff’s psychosis or acute hallucinosis. The study also found that 25% of the
cases had suffered from road accidents while under the effect of alcohol. Only a
minority of the cases (3%) were members of Alcoholic Anonymous or other such
Organizations involved in encouraging people to give up alcohol.57.
3.6.1. HEALTH CONSEQUENCES OF ALCOHOL USE:
As per World Health Organization [WHO] Global status report 76.3
million are diagnosed with alcohol use disorders among 2 billion people who are
consuming alcohol. Due to harmful use of alcohol 5.9 % of all deaths occur
worldwide and 3.3 million deaths occur every year. Alcohol is a causal factor in
more than 200 disease and injury conditions. Overall 5.1 % of the global burden of
disease and injury are due to Alcoholism, as measured in disability-adjusted life
years (DALYs). Death and disability come early in life and it is mainly seen in 20-
39 years and 25 % of the total deaths among this group are attributable to alcohol.
There is a causal relationship between the harmful use of alcohol and a range of
mental and behavioral disorders and other non-communicable disease and injuries.
The latest reports show relationships between harmful drinking and diseases like
tuberculosis and HIV/AIDS. Harmful use of alcohol brings significant social and
economic losses to individuals and society3,65,66.

3.6.2 SOCIAL PROBLEMS ASSOCIATED WITH ALCOHOL USE:
Alcohol consumption can cause many problems for the individual, his
immediate environment and society. The social consequences are workplace-
related problems, family and domestic problems, and interpersonal violence. The
effects of alcohol aggravate the causes of poverty by increasing malnutrition,
absenteeism at work, road traffic accidents and loss of productivity. Social
consequences due to alcohol can affect individuals other than the drinker e.g.
passengers involved in traffic casualties, or family members affected by failure to
fulfill social role obligations, or incidences of violence in the family67
Vijay Ramanan et al in a rural cross sectional study done at Thirubuvanai
and Nettapakkam PHC areas in pudhucherry reported that the overall prevalence
of alcohol use among ≥18 years of age was 9.7% and exclusively among males
was 17.1%. The highest prevalence (17.1%) was among 46–55 year age groups
and the residents of joint families (37.0%). One third of the users began drinking
before 20 years of age and half of them consumed in getting relief from
pain/strain/tiredness. About half of the users had strained relations with their
family members and neighbours both. The majority had alcohol dependence
problems and about one fifth had chronic health problems such as diabetes
mellitus, and hypertension. The prevalence of alcohol use was high among males
and low among uneducated farmers67.

3.6.3. ALCOHOL AND FAMILY:
A Cross-Sectional Study done by Gayathri Vijaya Lakshmi et al at a
Tertiary Care Setting among 100 patients and their spouses showed that Co-
morbid psychiatric disorders were found in sixty-two percent of the participants.
68% had medical co-morbidities. Spouses who were physically abused (67%) also
experienced other forms of abuse at similar rates viz., Emotional abuse (63%),
Economic abuse (52%), and Sexual abuse (65%). Among women reporting
domestic violence, 11% had attempted suicide. The majority of those reporting
domestic violence exceeded cut-off scores for a depressive disorder. The severity
of violence correlated positively with the Brief Psychiatric Rating Scale
(psychopathology) scores. These findings highlight the importance of screening
alcohol dependent patients for psychopathology, spouse for domestic violence and
its complications in mental health settings58.
Shridevi Kotina et al in a community-based cross-sectional study among
244 persons revealed that Prevalence of substance abuse to be 66%. 48.54% were
consuming alcohol and 23.36% were smoking. Skilled workers (67%) were
addicted. 87.66% of illiterates were addicted. 52% of subjects started alcohol use
due to peer pressure and 41% started only as experimenting 62.
A cross-sectional study by Avi Singh et al among medical college students
in September 2016-October 2016 reported that 61.29% males and 8.24% females
showed both tobacco use and alcohol abuse. In the case of alcohol consumption,
80.65% males and 35.29% of females consumed some form of alcohol. Overall

43% of respondents abused alcohol and tobacco to relieve stress. The alcohol and
tobacco are major substances being abused by young medical graduates in spite of
universal knowledge that they are source of major non communicable diseases63.
3.6.4. ALCOHOL CONSUMPTION AND WORKPLACE:
Persons who consume alcohol have higher rates of sickness absence than
other employees. Alcohol consumption can lead to decrease productivity in
industries. Heavy alcohol drinking can lead to unemployment, but loss of work can
also result in increased drinking, which may lead to heavy alcohol drinking68.
A cross-sectional study conducted by Subhash Chakraborty et al in the
psychiatric department of an urban industrial hospital in Southern India among
urban industrial employees found that out of 43 subjects, absenteeism was present
in 18 while those who did not have absenteeism was 25. Comparing the two
groups, interstate migration, having more than one previous job, commuting time
more than an hour, co‑morbid anxiety/depression, and alcohol abuse was
significantly associated with absenteeism (P < 0.05).68 .
Giridhara Ret al in a cross-sectional online study done among software
professionals revealed that the Subjects who were professionally stressed had 5.9
times higher prevalence of harmful alcohol use compared to those who were not
professionally stressed. Subjects who were at risk for developing depression had
4.1 times higher prevalence of harmful alcohol use compared with those who were
not at risk for developing depression69.

3.6.5. ALCOHOL CONSUMPTION AND FAMILY:
The functioning capacity is impaired by alcohol among its consumers.
Alcohol consumption affects the drinker’s partner as well as the children. Alcohol
consumption during pregnancy in women can lead to fetal alcohol syndrome.
Parental drinking can lead to child abuse and affects the child’s social,
psychological and economic environment. Drinking costs money and can impact
upon resources of a poor family. Diversion of money for alcohol use that could
have otherwise been used for seeking medical care, may lead to delay in seeking
health care70.
Surjit, Kumar Sen et al in a cross-sectional single interview case study
done at the Silchar Medical College and Hospital Assam revealed that majority of
alcohol dependence cases were from the age range of 35 to 44 years (44%) while
their primary caregivers from 30 to 39 years (44%). Most of the cases had their
spouses (74%) as the primary caregivers and had 10–14 years of alcohol
dependence (34%). Majority of the primary caregivers suffered from a moderate
type of family burden, especially in areas such as disruption of routine family
activity, recreation, and family interaction. The higher family burden was
associated with equal to or more than 15 years of alcohol dependence which was
statistically significant in most of the areas. The severity of family burden was
greatly influenced by the duration of the substance dependence of the cases70.
A cross-sectional study by Alok Tyagi et al done among 30 subjects who
were wives of alcohol-dependent men admitted to the de-addiction ward of a

hospital in Jaipur, India found out that the majority of the sample were housewives
(66.7%), of the Hindu religion (83.3%), had received at least primary education
and were living in a nuclear family (53.3%). Mean duration of alcohol
consumption by the husbands was 9.60 years (SD 2.79). Among the alcohol users,
the mean AUDIT score was 11.47 ± 4.05. The mean Patient Health Questionnaire-
9 score among the wives was 4.87 ± 5.49. The correlation between variables
measuring alcohol intake and PHQ-9 and MSSI scores showed that depressive
symptomatology in the wife was significantly and positively correlated with the
AUDIT scores. There was a strong correlation between AUDIT scores and suicidal
ideation in wives measured by the Modified Scale for Suicidal Ideation. Those
with suicidal ideation stated that concerns about their children's upbringing and
their future were the main reasons which prevented them from killing themselves.
There was a significant positive correlation between alcohol consumption in
husbands and depressive symptoms and suicidal ideation in their wife71.
3.6.6. ALCOHOL USE AND ECONOMIC CONSEQUENCES:
The expenditures related to alcohol are high in poor marginalised areas.
Money is spent on alcohol, and also drinker suffers other expenditures. The direct
cost includes medical cost and lost earnings due to death and disability. The
indirect costs include loss of work, loss of school, meeting the burden, loss of
savings, extra loans made, assets sold, work replacement/support, cost of the
employer/society and low self-esteem. In road traffic accidents due to alcohol the
accidental injuries, vehicle and property damages are huge72.

A Population survey by Aravind Pillai et al done in rural and urban
communities in northern Goa, India reported that 732 male drinkers were
screened from 1,899 men, aged 18 to 49 years who were randomly selected. Lower
education and a Lower standard of living (Standard Living Index) were associated
with a higher usual quantity of alcohol consumption.72.
3.6.7. ALCOHOL AND DOMESTIC VIOLENCE:
The behavior of the alcoholics may cause physical, psychological or sexual
harm to those in their relationship. It includes acts of physical aggression
(slapping, hitting, kicking or beating), psychological abuse (intimidation, constant
belittling or humiliation), forced sexual intercourse or any other controlling
behaviour (isolating a person from family and friends, monitoring their movements
and restricting access to information or assistance73.
A Cross-sectional study by Dixit Sanjay et al done at Domestic Violence
counselling centre in the Psychiatry Department of Maharaja Yeshwantrao
Hospital OPD reported that the common type of domestic violence faced was
physical (80%) followed by mental (8%), social (8%) and sexual (4%). Monetary
issues (26%) and alcoholism (22%) were the two most important causes of
domestic violence. Other causes were extramarital affair (6%), family conflicts
(6%) and dowry (6%). 64% victims were either illiterate or primary pass; 34%
were skilled workers; 56% victims had their per capita income between 980 and
2935; 76% had their modified Kuppuswami score between 5-10. 56 % victims face

domestic violence daily. The monetary problems, alcoholism, illiteracy,
extramarital affairs, and dowry were the causes of domestic violence73.
A population-based cross-sectional study was carried out by Ajay k.
Jawarkar et al done from 1 May 2015 to 31 July 2015 in the field practice area of
the Rural Health Training Centre of Dr. Panjabrao Deshmukh Memorial Medical
College, Nerpinglai in Amravati district of Maharashtra state. Out of 400 study
participants interviewed, 161 (40.25%) reported some type of violence i.e. either in
the form of physical, emotional or sexual violence in their lifetime or in the recent
past. The most common type of violence reported was physical violence. The most
common cause of domestic violence reported in their study was financial problems
followed by influence under alcohol58-60.
3.6.8. ALCOHOL AND POVERTY:
Shekhar saxena et al reports that the poor people take refuge in alcohol to
alleviate the unendurable suffering of their lives. In some circles drinking was
explained as the natural and expected response to misery. Alcohol was popularly
assumed to be a way of temporarily escaping for a short while the harsh realities
were associated with poverty. Quite apart from whether alcohol itself alleviates
suffering, the simple formulation that the poor drank because it helped them
alleviate their suffering 74.
A study done by Shekhar saxena et al between May and July 1997 in a
poor urban community (‘slum’) located in the southern part of Delhi, North India,
shows that family with at least one adult consuming alcoholic drink at least three

times every week in the previous one month. They spent 14 times more on alcohol
per month and had financial debt significantly higher than family with no adult
consuming alcoholic drinks more than once in the previous one month. Family
with at least one adult consuming alcoholic drinks at least three times every week
in the previous one month reported significantly more cases of major illnesses.
They perceived significantly less severe health, social and economic effects of
drinking than those from family with no adult consuming alcoholic drinks more
than once in the previous one month74.
3.7. ALCOHOL USE DISORDERS IDENTIFICATION TEST
The World Health Organisation developed the AUDIT questionnaire which
was used for screening for excessive drinking and to assist in brief assessment
AUDIT helps to identify excessive drinking and also provide framework for
intervention to help hazardous and harmful drinkers reduce or cease alcohol
consumption and thereby avoid the harmful consequences of their drinking.
The AUDIT will help the practitioner to identify whether the person has
Hazardous (or risky) drinking, Harmful drinking, or Alcohol dependence.
The test has the following domains: (i) Harmful use of alcohol (items:
frequency of drinking, quantity, frequency of heavy drinking), (ii) Dependence
symptoms (items: impaired control over drinking, increased salience of drinking,
morning drinking), (iii) Harmful alcohol use (items: guilt after drinking, blackouts,
alcohol-related injuries, others concerned about drinking). It is a simple method for
screening and classifying consumers of alcohol.

AUDIT scores >8 suggest harmful and hazardous drinking and require advice on
reduction; scores >16 suggest severe alcohol problems and demand brief
counseling while those >20 mandate detailed assessment and treatment for alcohol
dependence. The questionnaire is brief and flexible11.
3.7.1 SCORING AND INTERPRETATION OF AUDIT:
AUDIT questionnaire by WHO was used for collecting data on the
prevalence of alcohol use and alcohol use disorder. Audit questionnaire has 10
questions, first 3 on consumption quantity and frequency, next 3 to assess drinking
behaviour and dependence and last 4 on consequences and problems related to
drinking.
The first 8 questions are scored 0,1,2,3 or 4 and the last two questions are
scored 0, 2 or 4. Total score on AUDIT is 40. People who obtain scores of 0-7 are
considered to have low risk of alcohol use. People obtaining 8-15 come under
hazardous alcohol use, 16 – 19 under harmful alcohol use and scores of 20 and
above are termed high risk alcohol use.
The combined score for questions 4, 5, and 6 is termed the dependence
score. If the dependence score is 4 or more, or if the total AUDIT score is 16 or
more (with any dependence score), the individual should be assessed for
dependence. Individuals with a dependence score of 3 or less with a total AUDIT
score of 15 or less are considered not dependent. 11.

3.7.2. STUDY ON VALIDITY OF AUDIT SCORE:
A large community-based cross-sectional study conducted in Goa by Paige
endsley et al among adults aged 18-49 years and residing in the study area between
2006 and 2008 found that AUDIT showed high internal reliability and acceptable
criteria on validity with adequate psychometric properties for the detection of
alcohol abuse and dependence75.
A study by Pal HR et al done among 297 consecutive subjects who had
used alcohol in the previous year recruited from a de-addiction center shows that
the AUDIT alcohol use disorders identification test had very high internal
reliability (alpha 0.92) in this Indian sample. . The AUDIT alcohol use disorders
identification (area under the curve [AUC] = 0.883) and SMAST Short Michigan
Alcoholism Screening Test (AUC = 0.870) were similar in detecting harmful use
of alcohol76.
3.8. ALCOHOL RELATED POLICIES75 :
To reduce the public health burden of alcohol consumption the policy
options are available which are divided into three main groups namely
,Population-based policies, Problem-directed policies, and Direct interventions
I. Population-based policies
These policies are aimed at altering levels of alcohol consumption among the
population. They include
1) Policies on taxation,

2) Advertising,
3) Availability,
4) Controls including prohibition,
5) Rationing and state monopolies,
6) Promotion of beverages with low or no alcohol content,
7) Regulation of density of outlets, hours and days of sale,
8) Drinking locations and minimum age of initiation of drinking, health
promotion campaigns, and school-based education.
One of the most effective ways to prevent alcohol-attributable disease is by
reducing the overall availability of alcohol, which can generally impact the
average amount of alcohol consumed.
There is evidence that taxation and pricing policies can disproportionately
impact lower-income drinkers by making alcohol less affordable for them and
reducing their consumption.
II. Policies is aimed at specific alcohol-related problems
This group of policies are directed to problems,
1. Such as drunken driving (e.g. promoting widespread random breath testing)
2. Alcohol-related offenses

III Policies involves interventions directed at individual drinkers
1. These include brief interventions,
2. Treatment and rehabilitation programmes.
Except for the brief interventions, many such ‘treatments’ are administered
only to those individuals with the most severe problems75.
3.8.1 ALCOHOLICS ANONYMOUS (AA)77:
Alcoholics Anonymous is an nonprofessional, self-supporting,
nondenominational, apolitical organisation. There are no age or educational
requirements for joining in it. It was started in 1935 by a New York stock broker,
Bill Wilson and an Ohio surgeon Dr. Bob Smith, who had drinking problems.
They founded this organization in an effort to help others who suffered from the
disease of alcoholism and to stay sober themselves. This organization grew with
the formation of autonomous groups, first in the United States and then around the
world. In India it was started in Mumbai in 195777.
Alcoholics Anonymous: Twelve Step program of spiritual and character
development.
The relative success of this programme seems to be due to the fact that an
alcoholic who no longer drinks has an exceptional faculty for “reaching” and
helping an uncontrolled drinker.In simplest form, this programme operates when a
recovered alcoholic passes along the story of his or her own problem drinking,
describes the sobriety he or she has found in Alcoholic Anonymous and invites the
newcomer to join the informal Fellowship.

1. We admitted we were powerless over alcohol that our lives had become
unmanageable
2. Came to believe that a Power greater than ourselves could restore us to
sanity.
3. Made a decision to turn our will and our lives over to the care of God as we
understood Him.
4. Made a searching and fearless moral inventory of ourselves.
5. Admitted to God, to ourselves and to another human being the exact nature
of our wrongs.
6. Were entirely ready to have God remove all these defects of character.
7. Humbly asked Him to remove our shortcomings.
8. Made a list of all persons we had harmed, and became willing to make
amends to them all.
9. Made direct amends to such people wherever possible, except when to do
so would injure them or others.
10. Continued to take personal inventory and when we were wrong promptly
admitted it.
11. Sought through prayer and meditation to improve our conscious contact
with God as we understood Him, praying only for knowledge of His will for
us and the power to carry that out.
12. Having had a spiritual awakening as the result of these steps, we tried to
carry this message to alcoholics and to practice these principles in all our
affairs

Newcomers are not asked to accept or follow these Twelve Steps if they
feel unwilling or unable to do so.New comers will usually be asked to keep an
open mind and also advised to attend meetings at which recovered alcoholics
describe their personal experiences in achieving sobriety, and advised to read the
literature describing and interpreting the Alcoholic Anonymous programme77.
3.9. POLICY NEED IN INDIA78:
As per Indian Constitution ‘The State shall endeavor to bring about prohibition
of the consumption of intoxicating drinks.’ Growing awareness of the problem of
alcohol consumption in India has been reflected in many policy initiatives. Except
for a few states, which have promulgated prohibition there is increasing
liberalization in alcohol production and availability. Prohibition was undertaken in
some states, but it has failed to reduce alcohol-related problems and gave rise to
some additional problems. In India alcohol prohibition is a state subject with each
state having full control of alcohol legislation, state excise rates and production
and sale of alcohol.
Prohibition policies are of 3 main types:
1. Complete prohibition of production and consumption;
2. Partial prohibition where one or more types of liquor (usually arrack) is
prohibited
3. In certain days of the week or month dry days is followed in which the
consumption is prohibited
Most states enforce a few ‘days’ in the year as ‘dry’ (no alcohol sales) and
restrict the time for sale on other days78.

4. MATERIALS AND METHODS
4.1 STUDY DESIGN:
Community based Cross Sectional Study.
4.2 STUDY SETTING:
Thiruvattar block of Kanyakumari district, Tamilnadu state, South India.
4.3 STUDY PERIOD:
March 2017 to July 2018(1 ½ year).
4.4 STUDY SUBJECTS:
Men aged more than 18 years residing in Thiruvattar block area for more
than last 6 months.
4.5 INCLUSION CRITERIA:
Men aged more than 18 years who were residents of Thiruvattar block for
more than last 6 months.
4.6 EXCLUSION CRITERIA:
a. Mentally challenged.
b. Seriously ill /bed ridden patients.
c. Men who were not present in the residence during data collection.
d. Men satisfying the inclusion criteria, but not giving informed
consent.

4.7 SAMPLE SIZE :
The prevalence of alcohol use among men in Tamil Nadu as per NFHS-4
report was 46.7%6
Sample size was calculated using the formula Sample size (n) =Zα2pq/d2
Where,
Zα = 1.96
P = 46.7%
q=100-p=100-46.7=53.3
d is the relative precision = (10 % of p ), i.e. 4.67
n=1.962pq/d2
= 438
Giving a 10 % non response rate, Sample size was 482.
4.8 SAMPLING TECHNIQUE:
Two stage Sampling Technique was used.
Stage 1:
Thiruvattar block consist of 16 panchayats namely Ayacode, Aruvikkara,
Cherukole, Surulode, Kannaoor, Kumarankudy, Yettacode, Pechipparai,
Kattathurai, Balamore, Attoor, Kulasekharam, Ponmanai, Thiruvattar, Thripparapu

and Verkizhambi. In each panchayat there are about 15 wards. One ward from
each panchayat was selected randomly by lottery method.
Stage 2:
The list of house from the panchayat was used as the sampling frame from
the selected ward, 32 houses were chosen by computer generated random number
method. From the selected house one adult male was selected for the study. If there
was more than one man in the house,one of them was chosen by lottery method.
If no man was present in the house, the next house was chosen by random number
technique and was visited till the sample size was obtained.
4.9 STUDY VARIABLES:
Age
Education level
Occupation
Relation with the head of the family
Socio- economic variables
Alcohol use in the family
Availability of alcohol
Alcohol in use in daily life
Alcohol use by the participant

Factors influencing alcohol use
AUDIT score
4.10. STUDY TOOLS:
The following instruments were used:
Pretested Questionnaire
AUDIT questionnaire
AUDIT questionnaire by WHO was used for collecting data on the prevalence
of alcohol use and alcohol use disorder. Audit questionnaire has 10 questions, first
3 on consumption quantity and frequency, next 3 to assess drinking behaviour and
dependence and last 4 on consequences and problems related to drinking.
The first 8 questions are scored 0,1,2,3 or 4 and the last two questions are
scored 0, 2 or 4. Total score on AUDIT is 40. People who obtain scores of 0-7 are
considered to have low risk of alcohol use. People obtaining 8-15 come under
hazardous alcohol use, 16 – 19 under harmful alcohol use and scores of 20 and
above are termed high risk alcohol use.
The combined score for questions 4, 5, and 6 is termed the dependence
score. If the dependence score is 4 or more, or if the total AUDIT score is 16 or
more (with any dependence score), the individual should be assessed for
dependence. Individuals with a dependence score of 3 or less with a total AUDIT
score of 15 or less are considered not dependent. 11. AUDIT scores >8 suggest
harmful and hazardous drinking and require advice on reduction; scores >16

suggest severe alcohol problems and demand brief counseling while those >20
mandate detailed assessment and treatment for alcohol dependence. The
questionnaire is brief and flexible11
(i) Harmful use of alcohol (items: frequency of drinking, quantity,
frequency of heavy drinking), (ii) Dependence symptoms (items: impaired control
over drinking, increased salience of drinking, morning drinking), (iii) Harmful
alcohol use (items: guilt after drinking, blackouts, alcohol-related injuries, others
concerned about drinking). It is used as a simple method for screening and
classifying consumers of alcohol.
The audit original questionnaire was in English version and it was
translated in Tamil, and Malayalam
Short pilot study was done among 40 people
4.11 OPERATIONAL DEFINITIONS:
1) Standard drink (SD) = 1 can beer (330 ml at 5%) = 1 glass wine (140 ml at
12%) = 1 shot spirit (40 ml at 40%) = 12.6 grams of pure alcohol
2) Abstainers: adult men who reported never drinking in their life,
3) Ex-drinkers: adult men who had not consumed alcohol in the previous 12
months.
4) Drinkers: adult men who reported drinking alcohol at least once during the
previous 12 months.
5) Binge drinking: Binge drinking is defined as the consumption of 5 or more
standard alcoholic drinks on one occasion

6) Current alcohol users- Men who continued to consume the alcohol during
the last one year of study.
7) Ever alcohol users- Men who were consuming alcohol.
8) Never alcohol users- Men who never consumed alcohol in their life time.
9) Harmful use: A pattern of alcohol consumption that causes damage to
health. The damage may be physical (as in cases of hepatitis from
prolonged use of alcohol) or mental (e.g. episodes of depressive disorder
secondary to heavy consumption of alcohol).
10) Hazardous use: Hazardous use is a pattern of alcohol consumption carrying
with it a risk of harmful consequences to the drinker.
11) The damage may be to health–physical, or mental, or they may include
social consequences to the drinker or others. This is therefore called alcohol
abuse
12) Alcohol abuse, also called “problem drinking”, is a pattern of excessive
drinking that result in adverse health and social consequences to the drinker,
and often to those around the drinker9
4.12 PROCEDURE IN DETAIL:
The study commenced after obtaining permission from Institutional
Research Committee and Institutional Human Ethical Committee, The study was
conducted among 464 adult men who were residing in Thiruvattar block for
more than last 6 months and the subjects qualifying the inclusion and exclusion
criteria were interviewed with a pre tested semi structured questionnaire by the
principal investigator after getting informed consent. The responses were filled up

by the investigator. Any translation or explanation required was done by the
investigator Privacy was ensured before conducting the interview. Data on socio-
cultural practices, family history, utilization of alcohol in daily life, age of starting,
frequency, and type of alcohol consumption were collected. WHO AUDIT
questionnaire was filled along with it to screen for excessive drinking among
alcohol users and to classify the consumers of alcohol.
Data collection was done using the pretested semi-structured interview
schedule and information on variables such as age, income, education, marital
status and type of family, family history, age at first drink, use of alcohol in the
past year and preferred type of alcohol were recorded.
4.13 DATA ENTRY AND STATISTICAL ANALYSIS:
Software used for data entry: Study parameters were entered in Microsoft
Office Excel 2013
Software used for statistical analysis: IBM SPSS trial Version 20.0
All quantitative variables were expressed in terms of mean with standard
deviation and median with inter quartile range. All qualitative variables were
expressed as proportions Factors associated with alcohol use and alcohol use
disorder were determined by bivariate analyses using chisquare test for qualitative
variables. Multi variable analyses were done using binary logistic regression for
determining the independent risk factor of alcohol use and alcohol use disorder.

5. RESULTS
A cross-sectional study was done to find the prevalence of alcohol use
among men aged 18 and above in the Thiruvattar block , Kanyakumari District,
Tamilnadu from March 2017 to July 2018., using AUDIT questionnaire. Required
sample size was calculated to be 482, About 482 individuals were eligible out of
which 464 responded making the response rate of 96.46% for the present study.
Non response rate was 3.54%.
Figure 3: Flow chart depicting the prevalence of alcohol use among men in Thiruvattar
block aged 18 and above
TOTAL NUMBER OF PARTICIPANTS-
464
EVER ALCOHOL USERS-258
CURRENT ALCOHOL USERS-
232
LOW RISK ALCOHOL USE-101
ALCOHOL USE DISORDERS-131
HAZARDOUS ALCOHOL USE-70
HARMFUL/SEVERE ALCOHOL USE-27 HIGH RISK USE-34
CURRENT NON ALCOHOL USERS -
26
NEVER ALCOHOL USERS-206

5.1.BASELINE CHARACTERISTICS:
5.1.1AGE:
The median age of the 464 study participants were 32.50 with an
interquartile range of 71 and the mean age was 37.63 with a standard deviation of
17.121.The minimum age is 18 years and maximum age 89 years. The age of the
study participants was classified into 5 categories. Out of the 464 study
participants 196 (42.2%) belong to the age category of 18-29 years, 129 (27.8%) of
them belong to 30-44 years, 71 (15.3%) participants belong to 45-59 years, 68
(14.7%) are above 60 years of age [Table 1].
Table 1: Distribution of study population based on age
Age category ( in years of age ) Number (%)
18 – 29 196(42.2%)
30- 44 129(27.8%)
45 – 59 71(15.3%)
60 and above 68(14.7%)
Total 464(100%)
Among the participants 196(42.2%) are in age group 18-29 followed by
129(27.8%).

5.1.2 RELIGION :
Out of 464 study participants, 168 (36.2%) belonged to Christian religion
and 151 (32.5%) were of Hindu religion and 145 (31.3%) were of Muslim religion
[Table 2].
Table 2: Distribution of study population based on religion
Religion Number (%)
Hindu 151(32.5%)
Christian 168(36.2%)
Muslim 145(31.3%)
Total 464(100%)
Among the participants 168(36.2%) are Christians followed by Hindus
151(32.5%).
5.1.3 MARITAL STATUS:
Out of 464 study participants, 320(69%) were married and 89 (18.2%) were
divorced and 55 (11.9%) were unmarried. [Table 3]
Table 3: Distribution of study population based on marital status
Marital status Number (%)
Married 320(68.96%)
Unmarried 55(11.85%)
Divorced 89(19.19%)
Total 464(100%)
Most of the participants 320(68.96%) were married followed by unmarried
89(19.18%).

5.1.4 EDUCATIONAL QUALIFICATION:
Among 464 study participants, 78 (16.8%) completed graduate or post
graduate, 78 (16.8%) completed post high school (11th-12th), 135(29.1%)
completed high school education (8th - 10th), 60 (12.9%) completed middle school
(5th -7th), 56(12.1%) completed primary (up to 4th) and 57 (12.3%) were illiterate.
[Table 4]
Table 4: Distribution of study population based on educational qualification
Education Number (%)
Illiterate 57 (12.3%)
primary school Certificate 56(12.1%)
Middle school certificate 60 (12.9%)
High school certificate 135(29.1%)
Post high school certificate 78 (16.8%)
Graduate or postgraduate 78(16.8%)
Total 464(100%)
Among the participants 135(29.1%) are high school certificate followed by
78 (16.8%) post high school certificate and graduate or post graduate.
5.1.5 OCCUPATION:
Among 464 study participants 108 (23.3%) of them are unemployed and
70(15.1%) of them are un skilled and 108(23.3%) of them are skilled and 43(9.3%)
of them are clerical and 22(4.7%) of them are semi-profession and 30(6.5%) of
them are profession. [Table 5]

Table 5: Distribution of study population based on occupation
Occupation Number (%)
Unemployed 108 (23.3%)
Unskilled 70(15.1%)
Semiskilled 83(17.8%)
Skilled 108(23.3%)
Clerical 43(9.3%)
Semi-profession 22(4.7%)
Profession 30(6.5%)
Total 464(100%)
5.1.6 INCOME:
Among 464 study participants 24(5.1%) Less than 2009 rupees, and
89(19.18%) 2010-5968 rupees and 59(12.71%) 5969-9947 rupees, and 77(16.59%)
9948-14,921 rupees, and 156(33.62)14922-19895 rupees and 45(9.69%) 19896-
39,790 rupees and 14(3.0%) 39,791 rupees and above [Table 6]
Table 6: Distribution of study population based on income
Income Number (%)
Less than 2009 rupees 24(5.12%)
2010-5968 rupees 89(19.18%)
5969-9947 rupees 59(12.71%)
9948-14921 rupees 77(16.59%)
14922-19895 rupees 156(33.62%)
19896-39,790 rupees 45(9.69%)
39791 rupees and above 14(3.09%)
Total 464(100%)
Among the participants 156(33.62%) are having a income of 14922-19895
followed by 89(19.18%) having a income of 2010-5968 rupees.

5.1.7 SOCIOECONOMIC STATUS:
As per modified kuppuswamy classification 13(2.8%) belong to lower
class(less than 5), 179(38.5%) belong to upper lower class(5-10), 181(39.0%)
belong to lower middle class(11-15), 87(18.7%) belong to upper middle class(16-
25), 4(0.8%) belong to upper class(26-29) [Table 7]
Table 7: Distribution of study population based on modified kuppuswamy
socio economic classification
Modified Kuppuswamy
Socioeconomic status classification
Number (%)
Lower Class(less than 5) 13(2.8%)
Upper Lower Class(5-10) 179(38.7%)
Lower Middle Class(11-15) 181(39.0%)
Upper Middle Class(16-25) 87(18.7%)
Upper Class(26-29) 4(0.8%)
Total 464(100%)
The majority of the participants 181(39.0%) belong to lower middle class followed
by 179(38.5%) belong to upper lower class.

5.2 PREVALENCE OF ALCOHOL USE:
5.2.1 PREVALENCE OF ALCOHOL USE AMONG THE STUDY
POPULATION:
Of the 464 study participants, 258(55.6%) were ever alcohol users and 206
(44.44%) were never users that they had never used alcohol in their life time.
[Table 8]
Table 8: Alcohol use among the study population
Alcohol Use Frequency(N=464) Percentage (%)
Ever alcohol user (n=258) 55.6%
Never user (n=206) 44.4%
5.2.2 EVER ALCOHOL USE
Of the 464 study participants the ever alcohol users were 258(55.6%)
among the ever alcohol users 232(50%) were current alcohol users that is those
who continue to consume alcohol and 26 were those who were previously
consuming alcohol but had stopped consuming it for more than one year in the
study period[Table 9].
Table 9: Distribution of ever alcohol users
Alcohol Use Frequency(N=258) Percentage (%)
Current alcohol user (n=232) 89.93%
Current non alcohol user (n=26) 10.07%
Out of 258 ever users the current alcohol users is 232(89.92%) and current
non alcohol users is 26(10.07%).

5.2.3 ALCOHOL USE DISORDER
The AUDIT scores was introduced for the 232 current alcohol users .The
mean audit score for 232 current alcohol users was 11.59 with a standard deviation
of 8.502. Median Audit score was 9 with an interquartile range of 35.
These 232 current alcohol users were categorized into low risk alcohol use and
those with alcohol use disorder according to AUDIT scores.
Out of the 232 current alcohol users, 101 (44%) of them were having low
risk alcohol use and 131(56%) had alcohol use disorder.
Out of the total of 464 subjects, proportion of those with alcohol use
disorder was found to be 28.23%. [Table 10]
Table 10: Alcohol use disorder according to AUDIT category
SL
NO
Alcohol use disorder Frequency (%)
1 Hazardous Drinking 70(53.5)
2 Harmful/Severe Drinking 27(20.6)
3 High Risk /Alcohol dependent 34(25.9)
4 Total (Alcohol use disorder ) 131(100)
The most of them 70(53.43) belongs to hazardous drinking followed by
34(25.95) belongs to high risk/alcohol dependent.

5.2.4 ALCOHOL DEPENDENCE
The combined AUDIT score for questions 4,5,6 is termed the dependence
score if the dependence score is 4 or more or if the total AUDIT score is 16 or
more (with any dependence score ) the individual should be assessed for
dependence. Individuals with a dependence score of 3 or less with a total AUDIT
score of 15 or less are considered non independent. Current alcoholics (N=232)
were assessed for dependence using AUDIT score. It was found that 160 (68.9%)
out of 232 were not dependent and 72(31.03%) needed to be assessed for
dependence. When the dependence scores were analyzed, it was found that 11
(4.74%) out of 232 had dependent score higher than 4 and 61 (26.29%) out of 232
had dependent score less than 4 with an audit score of 16 or higher. Hence these 72
participants need to be assessed for dependence. [Table 11]
Considering the total 232 subjects, prevalence of those who should be assessed for
dependence was 31.03%. [Table 11]
Table 11: Dependence category for current alcoholics
SL
NO
Dependence category Frequency (%)
1 Not dependent 160(68.96)
2 Should assess for dependence 72(31.04)
3 Total 232(100%)
The majority was 160(68.96%) non dependent followed by 72(31.03%) those who
should be assessed for dependence.

Tables 12: Frequency of alcohol use among ever and current alcohol users
Ever alcohol users Current alcohol users
Pattern Of Alcohol Use Frequency
Percent
(%)
Frequency Percent (%)
Monthly or less 54 20.9 54 23.3
2 to 4 times a Month 65 25.2 65 28
2 to 4 times a Week 55 21.3 47 20.3
4 or more times aWeek 84 32.6 66 28.4
Total 258 100 232 100
Among 258 ever alcohol users the frequency of alcohol use among most of
them was 84(32.6%) are using alcohol four or more times a week followed by
65(25.2%) are using alcohol two to four times a month.
Among 232 current alcohol users the frequency of alcohol use among most of
them was 66(28.4%) are using alcohol four or more times a week followed by
65(28%) are using alcohol two to four times a month.
5.3 AUDIT SCORE
The table 19 shows pattern among current alcohol users. Thirty four
individuals in this group are in need of special alcohol de-addiction care (14.7 %)

Table 13: AUDIT score among current alcohol users (n = 232)
AUDIT score zones Frequency Percentage
1-7(with in harmless zone) 101 43.5
8-15(hazardous drinking) 70 30.2
16-19(Severe alcohol problem) 27 11.6
20-40(alcohol dependent) 34 14.7
Total 232 100
The most of them 101(43.5 %) belongs to low risk zone (1-7) AUDIT score
followed by 70(30.2%) belongs to hazardous drinking AUDIT score (8-15).
5.4 INDIVIDUAL PATTERN OF ALCOHOL USE AMONG THE STUDY
GROUP:
5.4.1 AGE OF INITIATION OF ALCOHOL AND AWARENESS ABOUT
IT:
Table14: Age of initiation of alcohol and awareness about it.
Variable
Ever alcoholic(n=183)
mean age in years
Never alcoholic(n=132)
mean age in years
Age at First awareness
about alcohol
12.63±2.53 15.30±2.02
Age at First use of
alcohol
24.32±2.99 22.66±1.781

5.4.2 PLACE OF ALCOHOL USE AMONG EVER AND CURRENT
ALCOHOL USERS:
Tables 15: Place of alcohol use among ever and current alcohol users
Ever alcohol users Current alcohol users
Place of alcohol
consumption
Frequency (%) Frequency (%)
Home 57(22.13) 57(24.6)
Restaurant 19(7.36) 19(8.2)
Friends room 71(27.51) 71(30.6)
Hide Out 55(21.31) 55(23.7)
Social Gathering 26(10.07) 26(11.2)
Hostel & Other 30(11.62) 4(1.7)
Total 258(100) 232(100)
Among 258 ever alcohol users the most of them 71(27.51%) are using
friends room as the place of alcohol use followed by 57(22.09%) are using home
as their place of alcohol consumption.
Among 258 ever alcohol users the most of them 71(30.6%) are using
friends room as the place of alcohol use followed by 57(24.6%) are using home as
their place of alcohol consumption.

5.4.3 COMPANY FOR ALCOHOL USE AMONG EVER AND CURRENT
ALCOHOL USERS:
Tables 16: Company for alcohol use among ever and current alcohol users
Company for alcohol use Ever alcohol users Current alcohol users.
Frequency (%) Frequency (%)
Alone 41(15.90) 40(17.2)
Friends 87(33.72) 87(37.5)
Family Members 40(15.50) 20(8.6)
Others/specify-family
relatives
90(34.88) 85(36.7)
Total 258(100) 232(100)
Among 258 ever alcohol users, the most of them 90 (34.88%) are having
company as family relatives followed by friends 87(33.72%) are having company
of alcohol consumption.
Among 232 current alcohol users, the most of them 87 (37.5%) are having
company as family relatives followed by friends 85(36.5%) are having company of
alcohol.
5.4.4 TYPE AND FREQUENCY OF ALCOHOL USE AMONG EVER AND
CURRENT ALCOHOL USERS TABLE (23 & 24):

Tables 17: Type of alcohol use among ever and current alcohol users
Type of Alcohol use Ever alcohol users Current alcohol
users
Brand Frequency (%) Frequency (%)
1.Whisky 51(19.76) 51(22)
2. Rum 42(16.27) 42(18.1)
3.Beer 32(12.44) 32(13.8)
4.Toddy 25(9.68) 25(10.8)
5.Brandy 42(16.27) 42(18.1)
6.All Type 29(11.24) 29(12.5)
7.Others (More Than one
Brand)
37(14.34) 11(4.7)
Total 258(100) 232(100)
Among 258 ever alcohol users the most of them 51(19.76%) are using
whisky as the type of alcohol use followed by 42(16.27%) are using rum and
brandy brand as the type of alcohol consumption.
Among 232 ever alcohol users the most of them 51(22%) are using whisky as
the type of alcohol use followed by 42(18.1%) are using rum and brandy brand as
the type of alcohol consumption.

5.4.5 REASON FOR STARTING AND CONTINUING ALCOHOL AMONG
EVER AND CURRENT ALCOHOL USERS (TABLE 18) (TABLE
19):
Table 18: Reason for Starting Alcohol among Ever and Current Alcohol user
Reason For Starting Alcohol Use Ever alcohol
users
Current alcohol users
Frequency(%) Frequency(%)
Peer pressure 69(26.7) 51(22.0)
Curiosity 64(24.8) 53(22.8)
Curiosity and peer pressure 48(18.6) 32(13.8)
To feel with the crowd 24(9.3) 25(10.8)
To work more 24(9.3) 42(18.1)
Others 29(11.3) 29(12.5)
Total 258(100) (100)
Among 258 ever alcohol users the reason for starting alcohol use among
most of them was peer pressure 69(26.7%) followed by 64(24.8%) curiosity.
Among 258 ever alcohol users the reason for starting alcohol use among
most of them was Curiosity 53(22.8%) followed by 51(22.0%) peer pressure.

Table19: Reason for continuing alcohol use in ever and current alcohol user.
Reason for continuing
alcohol use
Ever alcohol users Current alcohol users
Frequency (%) Frequency (%)
Peer pressure 59(22.8) 59(25.4)
Like the effects 55(21.3) 55(23.7)
Can work more 36(14.0) 36(15.5)
Withdrawal symptoms 33(12.8) 33(14.2)
Maintain social status 19(7.4) 19(8.2)
To get good sleep 25(9.7) 25(10.8)
To forget problems 17(6.6) 5(2.2)
Others 14(5.4) 0(0)
Total 258(100) 232(100)
Among 258 ever alcohol users the reason for continuing of alcohol use
among majority of them was peer pressure 59(22.9%) followed by 55(21.3%) like
the effects of alcohol.
Among 232 current alcohol users the reason for continuing of alcohol use
among majority of them was peer pressure 59(25.4%) followed by 55(23.7%) like
the effects of alcohol.

5.4.6 EFFORTS TO STOP ALCOHOL USE AMONG EVER AND
CURRENT ALCOHOL USERS (TABLE 20):
Table 20: Efforts to stop alcohol use among ever and current alcohol users
Ever alcohol user
(N=258)
Current alcohol user (N=232)
Tried to stop
alcohol use
Frequency Percentage Frequency Percentage
Yes 125 48.4 125 53.9
No 133 51.6 107 46.1
Reason for attempted
cessation of alcohol use
(n=125) (48.4%)
Reason for attempted cessation of
alcohol use (n=125)(53.9%)
Family
resistance
82(31.7%) 82(35.4%)
Adverse
effect
43(16.7%) 43(18.5%)

Among 258 ever alcohol users the 125(48.4%) had tried to stop alcohol use
of which 82(35.3%) is due to family resistance and 43(18.5%) due to adverse
effects of alcohol.
Among 232 current alcohol users the 125(53.9%) had tried to stop alcohol
use of which 82(35.3%) is due to family resistance and 43(18.5%) due to adverse
effects of alcohol.
5.5. DETERMINANTS OF EVER AND NEVER ALCOHOL USE:
BIVARIATE ANALYSIS:
To obtain the determinants of alcohol use, men were classified as ever
alcohol user and never alcohol user. Factors which were tested for association
were married, type of family , head of the family, others stay with you, morbidity,
awareness about alcohol, any alcohol user in the family, relation with the user,
whether current user, special source of alcohol, wife objects it, distance between
house and outlet, wine manufacturing in home, supply alcohol work place office,
place of alcohol consumption, reason for continuing alcohol use, measures to stop
alcohol, reason for cessation of alcohol, frequency of alcohol use, alcohol in
friends gathering and alcohol in social gathering .

Table 21: Factors Associated with alcohol use among ever and never alcohol
users
Factor
ALCOHOL USERS CHI SQUARE/
FISHERS
EXACT
p Value EVER NEVER
Type of family
Nuclear
Family
171
0
226.40
<0.001
Extended
family
82
206
Joint family 5 0
No family 0 0
Married
Married 230 90 146.27 <0.001
Divorced 0 89
Never
married
28 27
Widowed 0 0
Separated 0 0
Head of the
family
Yes 240 206 14.95 <0.001
No 18 0
Staying with
Children 0 0 100.48 <0.001
Wife 159 206
Parents 99 0
Alone 0 0
Awareness
about alcohol
0-14 188 89 <0.001
15-29 70 117
30-44 0 0
45-59 0 0
≥ 60 0 0
Morbidity
Yes 137 62 24.74 <0.001
No 121 144

Any alcohol
user in the
family
Yes 145 62 31.589 <0.001
No 113 144
Relation with
user
Son 145 62 31.58 <0.001
Family
relative
113 144
Specify 0 0
Whether a
current user
Yes 45 0 39.789 <0.001
No 213 206
Distance
between house
and outlet
Less than one
km
189 35 145.22 <0.001
More than
one km
69 171
Wine
manufactured
in home
Yes 19 0 15.818 <0.001
No 239 206
Special source
of alcohol
Abroad 126 42 42.44 <0.001
Military 40 50
Private shop 24 41
Others 68 73
Supplying
alcohol in
work place/
office
Yes 158 81 22.034 <0.001
No 100 125
Objection
from wife
Yes 200 61 106.82 <0.001
No 58 145
Supplying
alcohol in
gathering of
friends
Yes 163 91 16.69 <0.001
No 95 115
Supplying
alcohol in
social
gathering
Yes 32 0 27.44 <0.001
No 226 206

Place of
alcohol
consumption
House 57 9 238.30 <0.001
Restaurant 19 9
Friends home 71 11
Hide out 55 12
Social
gathering
0 0
Hostel 30 0
Others 26 165
Reason for
continuing
alcohol use
peer pressure 59 8 272.48 <0.001
withdrawal
symptoms
55 7
to work more 36 9
to get rid of
symptoms
33 6
maintain social
status
19 169
to get good
sleep 25 0
to get rid of
worries
17 0
Others 14 7
Attempts done
to stop alcohol
Yes 125 0 136.60 <0.001
No 133 206
Reason for
cessation of
alcohol
Family
resistance
82 0 79.52 <0.001
Side effects 43 0
Frequency of
alcohol use
One month or
less
54 0 222.28 <0.001
2 to 4 times a
month
65 0
2 to 4 times a
week
55 0
4 or 7 times a
week
84 206
Among this 21 variables were statistically significant. (p<0.001) (Table21).

Table 22: Factors Associated with alcohol use among ever and never alcohol
users- Odds (95%CI)
Factor
Odds
(95%CI)
p Value
Head Of The Family 1.858(1.705,2.025) <0.001
Staying with others 0.436(0.388,0.490) <0.001
Alcohol user 8.923(6.212,12.818) <0.001
Morbidity 2.630(1.789,3.866) <0.001
Alcohol User In The Family 2.980(2.026,4.385) <0.001
Current User 1.967(1.790,2.161) <0.001
Distance Between House And Outlet 13.383(8.479,21.121) <0.001
Wine Manufactured In Home 1.862(1.708,2.030) <0.001
Wife Objects alcohol use 8.197(5.395,12.453) <0.001
Supplies Alcohol In Friends
Gathering
2.168(1.492,3.151) <0.001
Supplies Alcohol In Social Gathering 1.912(1.747,2.092) <0.001
Attempts to Stop Alcohol 2.549(2.233,2.910) <0.001
Reason for Cessation of Alcohol 2.170(1.947,2,419) <0.001
The association between factors associated with alcohol use among ever
and never alcohol users and ‘distance between house and outlet’was statistically
significant (p<0.001).

The association between factors associated with alcohol use among ever
and never alcohol users and ‘current user’ was statistically significant (p<0.001).
The association between factors associated with alcohol use among ever
and never alcohol users and ‘head of the family’ was statistically significant
(p<0.001).
The association between factors associated with alcohol use among ever
and never alcohol users and ‘alcohol user in the family’ was statistically significant
(p<0.001).
The association between factors associated with alcohol use among ever
and never alcohol users and ‘morbidity’ was statistically significant (p<0.001).
The association between factors associated with alcohol use among ever
and never alcohol users and ‘wife objects alcohol use’ was statistically significant
(p<0.001).
The association between factors associated with alcohol use among ever
and never alcohol users and ‘supply of alcohol in social gathering’ was statistically
significant (p<0.001).
DETERMINANTS OF EVER AND NEVER ALCOHOL USE:
MULTIVARIATE ANALYSIS
All the variables significant in bivariate analysis were included in binary
logistic regression analysis. but no factors were statistically significant in
predicting alcohol use independently.
5.6 DETERMINANTS OF CURRENT ALCOHOL USE: BIVARIATE
ANALYSIS
To obtain the determinants of alcohol use, men were classified as current
alcohol user and current non alcohol user. factors which were tested for association
were religion, others who stay with, any chronic disease, morbidity, morbidity
duration, smoking, alcohol users in the family ,whether current user, number of
current alcohol users in the family, any alcoholics in work place, distance between
home and outlet, supply alcohol in family, parents objects it, wife objects it, supply
of alcohol in work place, outlet open in holidays, object liquor in office by
superiors, object liquor in friend gathering, supply of alcohol in social gathering,
object for liquor by colleagues, outlet open on working days, alcoholic in social
circles, anybody forced, anything done to stop alcohol, the reason for cessation of
alcohol
Use, object for liquor by colleagues, frequency of alcohol use, any alcoholic
in close circles.

Table 23: Factors associated with alcohol use among current alcohol users
VARIABLES
CURRENT
ALCOHOL
CHI
SQUARE/
FISHERS
EXACT
p
VALUE USERS
NON
USERS
Religion
Christian 74 26 45.684 <0.001
Hindu 77 0
Muslim
81
0
Others Who Stay With
You
Wife 133 26 18.003 <0.001
Parents
99
0
Any Chronic Disease Yes 96 26 32.23 <0.001
No 136 0
Morbidity Yes 111 26
25.537 <0.001
No 121 0
Morbidity Duration
Ten Years 66 10 31.918 <0.001
Five Years 45 16
Nil 121 0
Smoking Yes 88 26 36.523 <0.001
No 144 0
Alcohol Users In The
Family
Yes 119 26 22.533 <0.001
No 113 0
Is He A Current User
Yes
29 16
39.045 <0.001
No
203 10
How Many Current
Alcohol Users In The
None 110 0 48.792 <0.001
One 52 0

Family Nil 70 26
Any Alcoholics In
Work Place
Yes 61 24 46.121 <0.001
No 171 2
Distance Between
Home And Outlet
Less Than
1 Km 189 0
79.199 <0.001
More Than
1 Km 43 26
Supply Alcohol In
Family
Yes 123 26 21.152 <0.001
No 109 0
Parents Objects alcohol Yes 142 26 15.490 <0.001
No 90 0
Wife Objects alcohol Yes 174 26 8.385 <0.001
No 58 0
Supply Of Alcohol In
Work Place
Yes 132 26 18.300 <0.001
No 100 0
Outlet Open In
Holidays
24 Hours 62 26 55.85 <0.001
Day Time
Only 55 0
Night
Time Only 55 0
Specific
Timings 60 0
Superiors
object Liquor In Office
Yes 132 26 18.300 <0.001
No 100 0
Friends Object Liquor
In Friend Gathering
Yes 142 26 15.490 <0.001
No 90 0
Supply Of Alcohol In
Social Gathering
Yes 23 9 13.130 <0.001
No 209 17
Colleagues Object
Liquor
Yes 189 0
79.19 <0.001
No 43 23

Outlet Open On
Working Days
24 Hours 62 26 55.85 <0.001
Day
Timings 55 0
Night
Timings 55 0
Specific
Timings 60 0
Alcoholic In Social
Circles
Yes 61 24 46.121 <0.001
No 171 2
Any Force from others Yes 37 23
68.881 <0.001
No 195 3
Attempts to Stop
Alcohol
Yes 125 0 27.175 <0.001
No 107 26
Reason For Cessation
Of Alcohol
Health
Problem 82
0
0
13.471 <0.001
Family
Resistance 43 0
Colleagues object
Liquor
Yes 142 26 15.49 <0.001
No 90 0
Frequency Of Alcohol
Use
Less Than
A Month 54 0
26.491 <0.001
2 To 4
Month 65 0
2 To 4
Week 47 8
4 Or 7
Times A
Week
66 18
Any Alcoholic In Close
Circles
Yes 37 23 68.881 <0.001
No 195 3
Among this 28 variables were statistically significant (p<0.001) (Table 23).

Table 24 : Factors associated with alcohol use among current alcohol users-
Odds (95%CI)
Factor Odds
(95%CI) pValue
Any chronic disease 0.836(0.717,0.863) <0.001
Others Stay With you 0.787(0.781,0.896) <0.001
Smoking 0.772(0.699,0.853) <0.001
Morbidity 0.810(0.747,0.879) <0.001
Any Alcohol User In The Family 0.821(0.761,0.886) <0.001
Is he Current User 0.89(0.037,0.215) <0.001
Alcoholic in social circles 0.030(0.007,0.130) <0.001
Distance between house and
outlet
1.605(1.336,1.928) <0.001
Supply of alcohol in family
function
0.826(0.767,0.889) <0.001
Parents objects it 0.845(0.792,0.902) <0.001
Wife objects it 0.870(0.825,0.918) <0.001
Supply of alcohol in work place 0.835(0.780,0.895) <0.001
Object for liquor by superiors 0.835(0.780,0.895) <0.001
Object for liquor by friends 0.845(0.792,0.902) <0.001
Supply of alcophol in social
gathering
0.208(0.083,0.519) <0.001
Object for liquor by collegues 1.605(1.336,1.928) <0.001
Any body forced you 0.025(0.007,0.087) <0.001
Object for liquor by collegues 1.605(0.792,0.902) <0.001
Anything done to stop alcohol 1.243(1.143,1.352) <0.001
If yes what is the reason for
cessation of alcohol
1.173(1.103,1.248) <0.001
Alcoholic in close circles 0.025(0.007,0.087) <0.001
The association between factors associated with alcohol use among current
alcohol users and ‘distance between house and outlet’ was statistically significant
(p<0.001).
The association between factors associated with alcohol use among current
alcohol users and ‘object for liquor by collegues’ was statistically significant
(p<0.001).
The association between factors associated with alcohol use among current
alcohol users and ‘anything done to stop alcohol’ was statistically significant
(p<0.001).
DETERMINANTS OF CURRENT ALCOHOL USE: MULTIVARIATE
ANALYSIS
All the variables significant in bivariate analysis were included in binary
logistic regression analysis and no factors were statistically significant in
predicting alcohol use independently.

5.7 DETERMINANTS OF ALCOHOL DEPENDENCE: BIVARIATE
ANALYSIS
To obtain the determinants of alcohol dependence, AUDIT score were
classified as of less than 7 and more than 7 factors which were tested for
association were religion, marital status ,education, occupation, type of family,
others stay with you ,any chronic disease, , morbidity, morbidity duration smoking,
awareness about alcohol, any alcohol user in the family, your relation with user, is
he a current user, how many current alcohol users in family, alcoholics in your
work place, alcoholics in your social circle ,distance between your house and
outlet, outlet open working day, outlet open holidays, type of outlet, special source
alcohol, supply alcohol family function, parents object it, wife objects it, supply
alcohol work place office, object liquor in office function by superiors, supplies
alcohol in friends gathering, supplies alcohol in social gathering, object liquor by
colleagues group in social gathering, anybody forced you to consume alcohol,
alcoholic in close circles, with whom you drink, anything done to stop alcohol, if
yes what is reason for cessation of alcohol, object liquor by colleagues, frequency
of alcohol use.
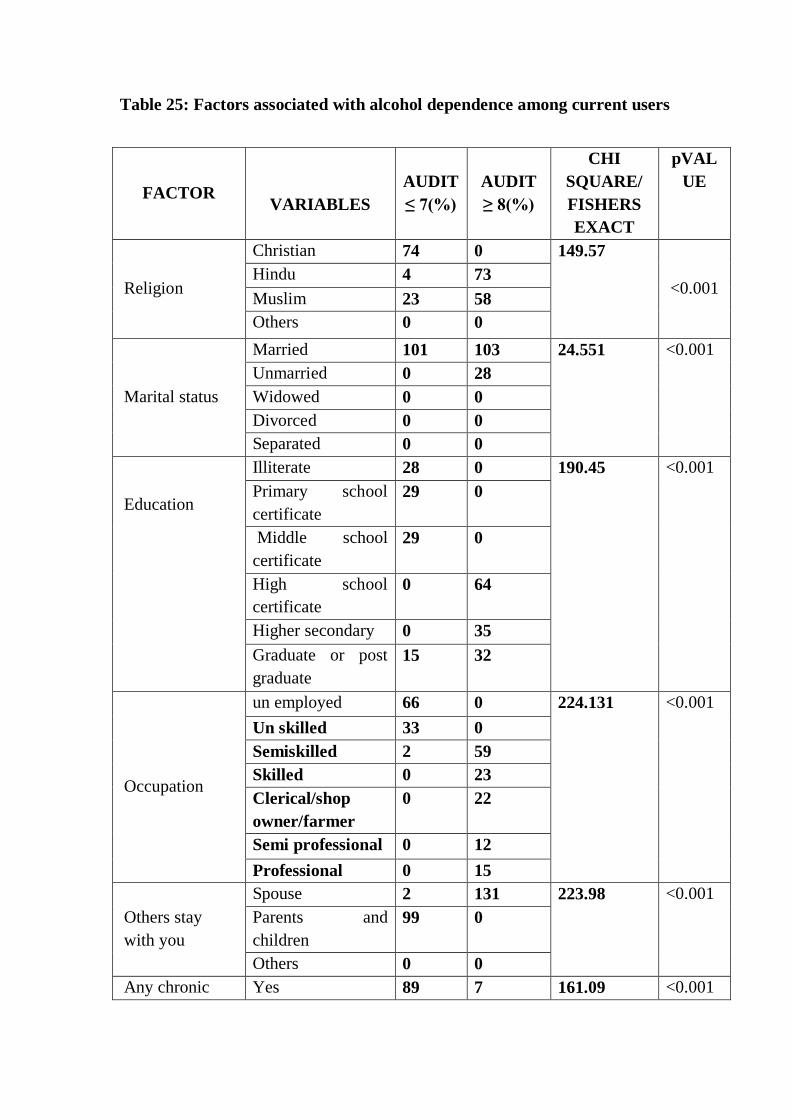
Table 25: Factors associated with alcohol dependence among current users
FACTOR
VARIABLES
AUDIT
≤ 7(%)
AUDIT
≥ 8(%)
CHI
SQUARE/
FISHERS
EXACT
pVAL
UE
Religion
Christian 74 0 149.57
<0.001 Hindu 4 73
Muslim 23 58
Others 0 0
Marital status
Married 101 103 24.551 <0.001
Unmarried 0 28
Widowed 0 0
Divorced 0 0
Separated 0 0
Education
Illiterate 28 0 190.45 <0.001
Primary school
certificate
29 0
Middle school
certificate
29 0
High school
certificate
0 64
Higher secondary 0 35
Graduate or post
graduate
15 32
Occupation
un employed 66 0 224.131 <0.001
Un skilled 33 0
Semiskilled 2 59
Skilled 0 23
Clerical/shop
owner/farmer
0 22
Semi professional 0 12
Professional 0 15
Others stay
with you
Spouse 2 131 223.98 <0.001
Parents and
children
99 0
Others 0 0
Any chronic Yes 89 7 161.09 <0.001

disease No 12 124
Morbidity Yes 101 10 194.98 <0.001
No 0 121
Morbidity
duration
Nil 0 121 197.48 <0.001
5 years 45 0
10 years 56 10
Smoking Yes 88 0 183.89 <0.001
No 13 131
Any alcohol
user in the
family
Yes 101 18 169.85 <0.001
No 0 113
Your relation
with user
Son 22 0 172.36 <0.001
Relative/family
member
79 18
Specify 0 113
Is he a current
user
Yes 22 7 14.09 <0.001
No 79 124
How many
current alcohol
users in the
family
Nil 31 79 141.43 <0.001
One 0 52
Two 70 0
Alcoholics in
your work
place
Yes 54 7 68.146 <0.001
No 47 124
Alcoholics in
your social
circle
Yes 54 7 68.14 <0.001
No 47 124
Distribution
between your
house and
outlet
Less than one km 101 88 40.69 <0.001
More than one km 0 43
Outlet open
working day
24 hours 54 8 175.84 <0.001
Only in the
morning
47 8
Only in the night 0 55
Specific timings 0 60
Outlet open
holidays
24 hours 54 8 175.84 <0.001
Only in the
morning
47 8

Only in the night 0 55
Specific timings 0 60
Type of outlet
Govt bar 54 8 175.84 <0.001
Private bar 47 8
Private bar with
restaurant
0 55
Others 0 60
Special source
alcohol
Abroad 100 0
228.03
<0.001
Military 1 39
Private shop 0 24
Others 0 68
Supply alcohol
family function
Yes 101 22 158.51 <0.001
No 0 109
Parents object
it
Yes 101 41 113.36 <0.001
No 0 90
Wife objects it Yes 101 73 59.62 <0.001
No 0 58
Supply alcohol
work place
office
Yes 101 31 135.50 <0.001
No 0 100
Object liquor in
office function
by superiors
Yes 101 31 135.50 <0.001
No 0 100
Supplies
alcohol in
friends
gathering
Yes 101 42 111.32 <0.001
No 0 89
Supplies
alcohol in
social gathering
Yes 15 8 4.88 <0.001
No 86 123
Object liquor
by collegues
group in social
gathering
Yes 101 88 40.69 <0.001
No 0 43

Any body
forced you to
consume
alcohol
Yes 29 8 21.74 <0.001
No 72 123
Alcoholic in
close circles
Yes 29 8 21.74 <0.001
No 72 123
With whom
you drink
Alone 40 0 157.84 <0.001
Friends 0 20
Relative 61 26
Spouse 0 20
Others/specify 0 65
Anything done
to stop alcohol
Yes 101 24 153.11 <0.001
No 0 107
Reason for
cessation of
alcohol
Family resistance 82 0 164.49 <0.001
Get rid of side
effects
19 0
Object liquor
by colleagues
Yes 41 101 113.36 <0.001
No 90 0
Frequency of
alcohol use
One month or less 54 0 118.75 <0.001
2 to 4 times a
month
32 33
2 to 4 times a
week
0 47
4 or 7 times a week 15 51
Among this 37 factors were statistically significant. (p<0.001) (Table 25)

Table 26: Factors associated with alcohol dependence among current users-
Odds (95%CI)
Factor Odds Ratio
(95%CI)
p value
Marital status
0.505(0.441,0.578) <0.001
Others stay with you 0.015(.004,0.060) <0.001
Any chronic disease 131.38(49.74,346.95) <0.001
Morbidity 0.090(0.050,0.163) <0.001
Smoking 11.077(6.595,18.603) <0.001
Any alcohol user in the family 0.151(0.099,0.232) <0.001
Is he a current user 4.933(2.013.12.086) <0.001
Alcoholics in your work place 20.353(8.647,47.901) <0.001
Distance between your house and
outlet 0.466(0.400,0.0542) <0.001
Supply alcohol family function 0.179(0.122,0.261) <0.001
Parents object 0.289(0.223,0.374) <0.001
Wife objects 0.420(0.352,0.500) <0.001
Supply of alcohol in work place 0.235(0.173,0.320) <0.001
Alcoholics in social circle 20.353(8.647,47.901) <0.001
Object liquor in office function by
superiors 0.235(0.173,0.320) <0.001
Supplies alcohol in friends gathering 0.294(0.228,0.379) <0.001
Supplies alcohol in social gathering 2.682(1.089,6.604) <0.001
Object liquor by colleagues group in
social gathering 0.466(0.400,0.542) <0.001
Anybody forced to consume alcohol 6.193(2.687,14.273) <0.001
Alcoholic in close circles 6.193(2.687,14.273) <0.001
Reason for cessation of alcohol 7.895(5.186,12.018) <0.001
Object for liquor by colleagues 0.289(0.223,0.374) <0.001
Object liquor by colleagues group in
social gathering
0.466(0.400,0.542) <0.001
Anybody forced you 6.193(2.687,14,273) <0.001
Anything done to stop alcohol
consumption
0.192(0.134,0.275) <0.001

The odds of developing alcohol dependence is 131 times higher among
those who have chronic disease compared to that of those who do not have chronic
disease.
The odds of developing alcohol dependence are 11 times higher among
smokers compared to that of non smokers.
The odds of developing alcohol dependence are 4.9 times higher among
current users in family compared to that of non current users in the family.
The odds of developing alcohol dependence is 20 times higher among those
who have alcoholics in their work place compared to that of those who do not have
alcoholics in their work place.
The odds of developing alcohol dependence is 20 times higher among those
who have alcoholics in their social circle compared to that of those who do not
have alcoholics in their social circle.
DETERMINANTS OF ALCOHOL DEPENDENCE: MULTIVARIATE
ANALYSIS
When all the significant variables of bivariate analysis were subjected to
binary logistic regression, no factors were found statistically significant.

6. DISCUSSION
A cross-sectional study was done with the primary objective to estimate the
prevalence of alcohol use among men aged 18 and above in the Thiruvattar block,
Kanyakumari District, Tamilnadu using AUDIT questionnaire, administered by
the researcher after getting informed consent. Associated social factors were also
studied. The findings of this study provide insight into the burden of alcohol use
and the social factors associated with it.
We have done a cross sectional study for estimating the prevalence of
alcohol use in Thiruvattar block as the primary objective. Associated social factors
were also found out. The prevalence of current alcohol use among men for the
state of Tamilnadu was 46.7%8. The national prevalence of alcohol use in India
was 29.2% according to NFHS-48.The prevalence among men population in
Thiruvattar Block was generally considered high. So assuming a minimum
prevalence of 46.7% which is the state prevalence, sample size was calculated.
Two stage Sampling Technique was used. One ward out of 15 wards from each of
the 16 panchayats in Thiruvattar block was selected randomly by lottery method
to ensure adequate representation. In the Second Stage, the houses enlisted from
the selected ward, of panchayat was used as the sampling frame. 32 houses were
chosen by computer generated random number method. From the selected houses
one male adult subject was chosen for the study. If there was more than one man
in the house, one of them was chosen by lottery method. If no man was present in
the house, the next house chosen by random number technique and was visited.

Thus a sample of 464 men satisfying the inclusion and exclusion criteria was
studied.
Alcohol consumption is difficult to quantify due to various reasons like
frequency and type of beverage consumed, quantity of alcohol used, and alcohol
concentration. Data collection was done using a pretested questionnaire including
WHO endorsed tool AUDIT [Alcohol use Disorder Identification Test] to quantify
alcohol consumption and alcohol use disorder.
Our study revealed that 12.7% did not have any formal education, giving an
effective literacy rate of 87.3%. Literacy rate of Tamilnadu as per 2011 census was
80.33% and Male Literacy rate was 86.81 %79. India‘s literacy rate was 74.04%
and male literacy rate was 82.14%79. Comparing with this, the literacy rate of men
in Thiruvattar block was found higher than the national average Government of
India sees education as one of the best tools in helping general population.
Among 464 study participants (23.3%) of our study participants were
unemployed and 70(15.1%) of them were un skilled (Domestic Servant, Peon,
Watchman)and 108(23.3%) of them were skilled(Driver, Telephone Operator,
Manson, Carpenter) and 43(9.3%) of them were clerical and 22(4.7%) of them
were semi-profession(High School Teachers, College Lecturers, Junior
Administrators), and 30(6.5%) of them were professionals (Doctors, Advocates,
Engineers, Architects, Directors, Managers, Senior Administrators, News Paper
Editors, College Principals, Bank Managers). As Thiruvattar block consist of many
manual labourers, the skilled participants was 108((23.3%) is very high.

The mean monthly family income of the study participants was 12983.26.
This could be an under estimation of the fact that it is self-reported. This might be
due to the incentives they were currently availing. Also, there is a general tendency
among humans not to reveal their true income from various sources. The daily
wage offered for manual labourer varied from Rs. 500 to 1000.
As per modified Kuppuswamy classification 9(1.9%) belong to lower class,
146(31.5%) belong to upper lower class, 228(49.1%) belong to lower middle class,
77(16.6%) belong to upper middle class, 4(0.9%) belong to upper class.
The median age of initiation of alcohol use in our study among ever users
was 24 years and mean age was 24.32 years, the minimum being 18 years and
maximum being 31 years. Younger persons have began to drink and percentage of
those who were aged below 21 years taking drinks has increased from 2 % to more
than 14 % in the past 15 years. The average age of initiation has dropped from 19
years to 13 years in the past 20 years81. In a study done by Ganesh kumar et al at
vanur taluk in villupuram district Tamilnadu among 1000 people the mean age of
initiation was found to be 25.3 years (SD 9.0)24,80. In another study done in a
Kolkata slum, the mean age of initiation of drinking alcohol was 20.8 years32 .In
our study, among 258 ever users the friends were the first source for initiating the
alcohol consumption for 69 (26.7%) of alcohol users, followed by curiosity for 64
(24.8%) of them. In another study done comparing Kerala and Arunachal Pradesh
college men, most of the male students in Arunachal Pradesh initiated with a
family member (63.3 percent) while some with friends (32.9 percent) . In Kerala,
most of them initiated with their friends (74.8 percent), and only some with family

members (24.5 percent)the special source of alcohol supply was from abroad
126(48.8%)and next source from military 10(15.5%) and the others 68(26.4%)81.
The prevalence of alcohol use in men aged 18 years and above in our study
was 55.6% with a 95% confidence interval of 51.07 to 60.12 for ever alcohol use.
The prevalence of current alcohol use was 50 % with a 95% confidence interval of
54.54 to 45.45. According to NFHS-4 in 2015-16, percentage of men who
consume alcohol in Tamilnadu was 46.7%8, The prevalence of current alcohol use
among men aged 18 years and above in Thiruvattar block (50%) was almost
similar to prevalence of alcohol use among men in the Tamilnadu. In India, among
men, prevalence of alcohol use was found to be 29.2%. This high prevalence of
50% in Thiruvattar block is alarming. In a study conducted in 2012 at rural area of
Tamilnadu by Ruma Dutta et al the prevalence of alcoholism among the study
participants was 35.7%82.
In a study conducted in May 2012 to march 2013 at rural pudhucherry by
Vijay Ramanan, the overall prevalence of alcohol use among ≥18 years of age was
9.7% and exclusively among males was 17.1%. the highest prevalence (17.1%)
was among 46–55 years age groups and the residents of joint families (37.0%)67.
In an epidemiological study in urban area conducted from october 2008 to
september 2009 by Arun kumar Pandey, the prevalence of alcohol abuse was
found to be 9.48%83.In a study conducted in urban slums of southern India from
December 2010 to May 2011 by Sinmin kim among all men, it was estimated
that 46.1% consumed alcohol and 31.4% were hazardous drinkers (19% increased-
risk, 7.7% high-risk and 4.7% dependent drinkers)84. In a study conducted in

Thiruvananthapuram district, Kerala from 1st april to 31st may, 2014 by Rakshase
bal, the alcohol dependence among males in Thiruvananthapuram was as high as
38.41%48. A study conducted by Jaisoorya et al on alcohol use among adolescents
in Ernakulam, Kerala State found out that the overall prevalence of lifetime
alcohol use among adolescents was 15% (23.2% among boys and 6.5% among
girls). The prevalence was increasing with age, and 25.3% of drinkers reported to
have hazardous alcohol use85.
The prevalence in this age group could also be an underestimation as
adolescents might not disclose their alcohol status due to fear of parents knowing it
and getting scolded or punished.
The prevalence of alcohol use disorder obtained in our study was 28.23%
with a 95% confidence interval of 19.67 -36.78.
In a population-based cross-sectional survey was conducted by Emilene Reisdorfer
et al among adults (20 to 59 years) in a medium-sized city in southern brazil the
prevalence of alcohol use disorders in the population was 18.4%86.
Comparing with the studies, the prevalence of alcohol use disorder in Thiruvattar
block among men (28.23%) was very high and needs to be noticed, especially the
age group of 40-49 years which had an alcohol use disorder prevalence of 37.4%.
A cross-sectional study was undertaken by Rajendra Harnagle et al in an
urban community of the various wards of Jabalpur Cantonment in India shows
that among 3586, about 434 (12.10%) were found to have a Alcohol dependence
syndrome (ADS)56.

In a study done among males more than 18 years of age in a Kolkata slum
by Santanu Ghosh , 65.8% were current users of alcohol,14% were alcohol
dependents,8% were hazardous or harmful users32.In our study the prevalence of
those who should be assessed for dependence among current alcohol users was
obtained as 31.03 % with a confidence interval of 26.82 – 35.23.Comparable to
other studies the prevalence of alcohol dependence in Thiruvattar block was high.
Age plays a vital role in assessing the prevalence of alcohol use. Our results
revealed that 55.6 % of our sample was ever alcohol users and 50% were current
alcohol users and 28.23% had alcohol use disorder. 20.5% of subjects in the age
group of 40-49 years were ever alcohol users and 22.8% were current alcohol users
and 37.4% were showing alcohol use disorder. Only 23.2% in the age group of 18-
29 years were ever alcohol users which give us an opportunity to control alcohol
use in future, if adequate measures are taken by the Government and local
governing bodies to catch them young. A cross-sectional survey done by Beauty
Mahanta et al among school-going adolescent students in an industrial town of
Assam showed that the majority of the students that 36% out of 1285 students had
tasted/ homemade alcoholic drinks (HADs) and 12.3% used commercially
available alcoholic drinks (CADs)87.
In our study out of 258 ever alcohol study participants 51% used whisky
and 42% used rum and 32% used beer and 42 % used brandy Toddy was not
tapped due to prohibition on production of alcohol but as our state is near to Kerala
about 25 % of them use toddy. This could be due to fear as they know producing
toddy is illegal. In our study out of the 232 current alcohol users, 23.7% procured

alcohol from private outlet just beyond Kerala-Tamil Nadu border while they go
for work and this showed significant association with having alcohol use disorder.
The money earned by people of Thiruvattar block was also found flowing to
Kerala through private alcohol shops in Kerala.
Nearly 55.4% of the study subjects in the present study was of the opinion
that there was no history of alcohol use in the family. There could also be a
reluctance to say the truth due to social desirability and a possible social stigma.
In our study the ‘Alcohol users in the family’ was found to be a statistically
significant risk factor for current alcohol users. Our study found out that the family
with alcohol users were consuming more alcohol 119(51.29%)
Prevalence of current smoking was 36.2% in our study .The prevalence of
smoking in Thiruvattar was higher than the prevalence of smoking (31.7% ) in
Tamilnadu8. In India according to NFHS-4 it was 39.2% 8.
In our study the ‘education status’ was a statistically significant risk factor
for alcohol dependence as our study found out that those having high school
certificate (64(48.85%) )were under alcohol dependence as these students could
join in bad company and become addicted to alcohol due to various reasons like
broken family, peer pressure ,love failure, failure in exams comparing to study
done by Shasi Prabha Tomar et al done among 214 villagers in Mandla district
Madhya Pradesh reveals that alcohol consumption was more prevalent among
illiterate (6.7%) 88.

In our study the ‘occupation’ was a statistically significant risk factor for
alcohol dependence as our study found out that majority of the unemployed were
under low risk of alcohol dependence 66(65.34%) followed by semi skilled
59(45.03%) were under alcohol dependence . This might be because the un
employed did not have money to buy alcohol and the semi skilled workers
consume alcohol due to various reasons like body pain,problem family,bad
company comparing to study done by Rakshase Bal et al conducted among 302
people at Thiruvanan tha puram found that un employment is significantly
associated with alcohol dependence48.
In our study the ‘Any chronic disease’ was s a statistically significant risk
factor (p<0.001) for alcohol dependence as our study found out that those who
did’t have any chronic disease were alcohol dependents 124(94.65%) . As those
who did not have chronic problems were healthy and they were likely to consume
more alcohol.
In our study the ‘Outlet open on working day’ was a statistically significant
risk factor(p<0.001) for alcohol dependence as our study found out that majority
of them 60(45.80%) who follow specific timings were alcohol dependence as some
people who would come after work consume alcohol before going to their home
due to reasons like body pain.
In our study the ‘Supply of alcohol in family functions’ was a statistically
significant risk factor(p<0.001) for alcohol dependence as our study found out that
alcohol dependence was more among persons where the supply of alcohol in

family function 195(84.05%).In our study the ‘Parents objects it’ is a statistically
significant risk factor for alcohol dependence(p<0.001) as our study found out that
majority of the persons were low risk 101(100%) followed by those whom parents
had not objected were alcohol dependent. 90(68.70%).
In our study the ‘Object for liquor in office function by superiors’ was a
statistically significant risk factor(p<0.001) for alcohol dependence as our study
found out that majority of them were low risk 101(100%) followed by those who
had no objection for liquor in office function by superiors were alcohol dependent
100(76.33%). In our study the ‘anything done to stop alcohol’ was a statistically
significant risk factor(p<0.001) for alcohol dependence as our study found out that
majority of them who had not done anything to stop alcohol were alcohol
dependent 107(81.67%). In our study the ‘Frequency of alcohol use’ was a
statistically significant risk factor(p<0.001) for alcohol dependence as our study
found out that majority of them were low risk 101(100%) one month or less
followed by 51(50.49%) for whom the frequency of alcohol use was 4 or 7 times a
week and were alcohol dependent. .In our study the ‘Others who stay with ’ was a
statistically significant risk factor(p<0.001) for current alcohol users as our study
found out that alcohol consumption was less among those who stay with parents
99(42.67%).In our study presence of ‘Any chronic disease’ was a statistically
significant risk factor(p<0.001) for current alcohol users as our study found out
that alcohol consumption was less among those who have morbid illness like
diabetes ,hypertension as these people would be un healthy and so they would
avoid alcohol 136(58.62%) comparing to a study done by Ganesh kumar et al in

rural Tamilnadu done among 946 subjects showed that presence of chronic
diseases was significantly associated with alcohol use24.
In our study the ‘Distance between house and outlet’ was a statistically
significant risk factor(p<0.001) for current alcohol users as our study found out
that if the distance was less than 1 km then alcohol consumption was more
189(81.46%).In our study the ‘Supply of alcohol in the family function’ was a
statistically significant risk factor(p<0.001) for current alcohol users as our study
found out that if there was supply of alcohol in the family function then alcohol
consumption was more among them 123(53.01%).In our study the ‘Supply of
alcohol in work place’ also was a statistically significant risk factor(p<0.001) for
current alcohol users as our study found out that if there was supply of alcohol in
the work place then alcohol consumption was more among them 132(56.89%).In
our study the ‘Outlet open on holidays’ was a statistically significant risk
factor(p<0.001) for current alcohol users as our study found out that if the outlet
was open for 24 hours then alcohol consumption was more among them as they
could go at any time and consume as much as they want 62(26.72%). In our study
the ‘Outlet open on working days’ was also a statistically significant risk
factor(p<0.001) for current alcohol users62(26.72%). In our study the ‘Frequency
of alcohol use’ was a statistically significant risk factor(p<0.001) for current
alcohol users as our study found out that if the frequency of alcohol use was 4 or 7
times a week then alcohol consumption was more among them 66(28.44%).In our
study the ‘Type of family’ was a statistically significant risk factor(p<0.001) for
ever and never alcohol users as our study found out that men in nuclear family

consuming more alcohol as they were dominant in the family 171(66.27%) which
is similar to the study done by Shashi Prabha Tomar et al among 214 villagers in
Mandla district Madhya Pradesh showed that alcohol consumption was more in
nuclear families88.
In our study the ‘married’ is a statistically significant risk factor(p<0.001)
for ever and never alcohol users as our study found out that alcohol consumption
was more among those men who are married 230(89.14%) as they were dominant
and decision makers in the family comparing to study done by Rakshase bal et al
conducted among 302 people at Thiruvanan tha puram found that marital
disharmony was significantly associated (P<0.05)with alcohol dependence. In our
study the ‘head of the family’ was a statistically significant risk factor for ever and
never alcohol users as our study found out that alcohol consumption was more
among those who were the head of the family 240(93.02%) as they go for job and
spent the money for buying alcohol. The present study found out that alcohol
consumption was less among those who stay with their wife 206(100%). In our
study the ‘any alcohol user in the family’ is a statistically significant risk
factor(p<0.001) for ever and never alcohol users as our study found out that those
who have alcohol user in the their family the alcohol consumption was more
145(56.20%) as both of them drink they used to go and drink together. In our
study the ‘your relation with the user’ is a statistically significant risk
factor(p<0.001) for ever and never alcohol users as our study found out that if the
user is son then alcohol consumption among them is more 145(56.20%) as they
together will go for work or share money and their problems and consume alcohol.

In our study the ‘Distance between your house and outlet’ is a statistically
significant risk factor(p<0.001) for ever and never alcohol users as our study
found out that if the distance is less than 1 km then alcohol consumption is more
189(73.25%) .In our study the ‘Wine manufacturing at home’ is a statistically
significant risk factor(p<0.001) for ever and never alcohol users as our study
found out that if the wine is not manufactured at home then alcohol consumption
were more among them 239(92.63%) .
In our study the ‘Special source of alcohol’ is statistically significant risk
factor (p<0.001) for ever and never alcohol users as our study found out that
alcohol is obtained from abroad then alcohol consumption were more among them
126(48.83%).In our study the ‘Supply of alcohol in work place/office’ was a
statistically significant risk factor(p<0.001) for ever and never alcohol users as our
study found out that if the supply of alcohol in work place /office is there then
alcohol consumption was more among them 158(61.24%) as they drink with
them. In our study the ‘Supply of alcohol in friends gathering’ is statistically
significant risk factor for ever and never alcohol users as our study found out that
if there is supply of alcohol in the friends gathering then alcohol consumptionwere
more among ever users 163 (63.17%) . In our study the ‘Place of alcohol
consumption’ is a statistically significant risk factor(p<0.001) for ever and never
alcohol users as our study found out that majority of the ever alcohol users use
their friends home as the place of alcohol consumption 71(27.51%) as they
consider it safe and comfortable. In our study the ‘Reason for continuing alcohol
use’ was a statistically significant risk factor (p<0.001) for ever and never alcohol

users as our study found out that majority of the ever alcohol users are continuing
the alcohol use due to peer pressure 59(22.86%) as the friends will compel him to
drink or they will not join him in their company .
In our study the ‘Anything done to stop alcohol’ is statistically significant
risk factor (p<0.001) for ever and never alcohol users as our study found out that if
nothing was done to stop alcohol use then alcohol consumption were more among
ever users 133(51.55%).
STRENGTHS OF THE STUDY:
The use of a WHO formulated tool AUDIT in quantifying the alcohol
consumption Single researcher doing the whole data collection ensures uniformity
and avoids bias due to multiple researchers.
The methodology and reporting of this study has been adhered to STROBES
guidelines
EXTERNAL VALIDITY:
1. GENERALIZABILITY: This study can be very well generalized to
Thiruvattar block male population as the sample is representative.
2. CONCEPT TILTING: The findings of this study can be sent to State
authorities and central authorities including Ministry of health and family welfare.
This study provides data on the prevalence, reasons and factors associated with
alcohol use, which in turn would facilitate policy makers in charting out and
implementing effective prevention strategies.

3. UTILITY: This study creates baseline evidence, thus enabling the authorities to
focus on those factors and reasons responsible for high prevalence and to initiate
proper monitoring and evaluation.
4. PUBLIC HEALTH SIGNIFICANCE:
The main strategy should be focusing on de-addiction and also decreasing the
demand for alcohol. In Thiruvattar block, the awareness about de-addiction and
harmful effects of alcohol is also low and there is a need for creating awareness as
population of Thiruvattar block is also very much vulnerable to be influenced by
giving alcohol during elections and festival seasons.

7. SUMMARY AND CONCLUSION
This cross sectional survey carried out among 464 men aged above 18 years
of Thiruvattar block in Kanyakumari district, Tamilnadu estimated a high
prevalence of alcohol use (55.6% ).
Most of the current alcohol users are in borderline scores of AUDIT.
Thirty point two percent (30.2%) of them were above the score of 8 (
hazardous drinking range ) . fourteen point two percent (14.2%) of men in this
study group were already alcohol dependent needing specialist care for alcohol
related harm. Alcohol use was most prevalent among the age group of less than
40 year old. Fourty three point five percent of the men who were alcoholic had
AUDIT score of 7 or less than that i.e. harm less zone of drinking. If consumption
in this group continues they get them self promoted for Harm full Zones.
The significant risk factors of alcohol use of (current, ever and never,
alcohol dependence) that is ( p<0.001) were ‘any alcohol user in the family’, ‘a
current user’, ‘supply of alcohol in social gathering/ friends gathering, in work
place’, ‘frequency of alcohol use’, ‘morbidity’, ‘distance between home and
outlet’, ‘objection from wife ’, ‘any attempts done to stop alcohol’, ‘if yes reason
for cessation of alcohol’.

8. LIMITATIONS
Consumption of alcohol could not be quantified due to variance in consumption,
quantity, frequency, and type of beverage.
Varying strength of alcohol concentration across the type of beverage also
add to the difficulty in quantifying it.
Due to the social norms in answering the questions of alcohol use reporting
bias among young adults occur.
There is a chance for re call bias regarding the age of initiation and the age
at which the participants first came to know about alcohol .

9. RECOMMENDATIONS
As there is a high prevalence of alcohol use among men in Thiruvattar
block, various public health measures should be taken to prevent alcohol abuse.
A. Specialist care and awareness regarding alcohol use:
The prevalence of hazardous alcohol use (30.2%) among current alcohol
users in Thiruvattar block could be an under estimation due to reporting bias.
Specialist care and deaddiction centres in the block are much needed to decrease
the alcohol related social and economic problems. The Thiruvattar block
community should be educated for the treatment of alcohol dependence through
the monthly clinics (psychiatry) in Community health centre of Thiruvattar block.
B. Strengthen the existing Legislation and policy related to alcohol:
The legal age of minimum 21 should be enforced for the sale of alcohol in
alcoholic outlets.
Random breath testing can be implemented for alcohol related offences in
drunken driving.
C. Availability/supply of alcohol:
Some of the significant risk factors of alcohol use (current, ever and never,
alcohol dependence) were availability/supply of alcohol in work place. Necessary
guidelines should be implemented through community participation and also strict
rules should be implemented in the work place.

D. Health education:
The general public, especially the men of Thiruvattar block should be
educated regarding Alcohol- related harms .
Early intervention regarding the risk of alcohol consumption and its
addiction can be conducted in monthly clinics in Thiruvattar block community
health centre.
Periodic screening for men who are working and attending community
health centre should be done.
Awareness about ill effects of alcohol use, emphasizing on de-addiction
should be conducted for all men, women and children. So it will be able to
decrease the interest in using alcohol and create desire to quit alcohol, thereby
reducing the demand for alcohol. So that ‘the alcohol user’ at home will quit
alcohol and his friends will prevent him from consuming more alcohol in friends
and social gathering, and also the frequency of alcohol use will also come down
preventing alcohol dependence.

10. REFERENCES
1. Roger Detels Oxford Textbook of public health 5Ed Volume 3 Pages 1323-
1333 Pages 1323-1333 [Internet]. [cited 2018 Jul 12]. Available from:
https://publishing.cdlib.org/ucpressebooks/view?docId=kt4r29q2tg&chunk.
id=ss2.07&toc.id=&brand=eschol
2. Adarsh P. LS. Textbook Of Community Medicine Preventive And Social
Medicine 5Ed (Pb 2017) | 9789386217554 | Lal S [Internet]. [cited 2018 Jul
12]. Available from: http://www.cbspd.co.in/textbook-of-community-
medicine-preventive-and-social-medicine-5ed-pb-2017-9789386217554-
lal-s.html
3. Global status report on alcohol and health, 2014 [Internet]. 2014 [cited 2018
Jul12].Availablefrom:http://apps.who.int/iris/bitstream/10665/112736/1/978
9240692763_eng.pdf?ua=1
4. Alcohol [Internet]. World Health Organization. [cited 2018 Jul 12].
Available from: http://www.who.int/news-room/fact-sheets/detail/alcohol
5. World Health Organization, Regional Office for South-East Asia. Public
health problems caused by harmful use of alcohol: gaining less or losing
more?. New Delhi: World Health Organization, Regional Office for South-
East Asia; 2006.
6. Government Of Tamilnadu Prohibition And Excise Department Policy Note
2006-2007 Demand No 36 &37 [Internet]. [Cited 2018 Jul 12]. Available
From:Http://Cms.Tn.Gov.In/Sites/Default/Files/Documents/Prohibition_Ex
cise_0.Pdf

7. Government Of Tamilnadu Prohibition And Excise Department Policy Note
2017-2018 Demand No 37 [Internet]. [Cited 2018 Jul 12]. Available From:
Http://Cms.Tn.Gov.In/Sites/Default/Files/Documents/Prohibition_Excise_0
8. National Family Health Survey [Internet]. [cited 2018 Jul 12]. Available
from: http://rchiips.org/NFHS/factsheet_NFHS-4.shtml
9. Prasad R. Alcohol use on the rise in India. The Lancet. 2009
Jan;373(9657):17–8.
10. Hajar R. Alcohol: Friend Or Foe? A Historical Perspective. 1(9):5.
11. Babor TF, Higgins-Biddle JC, Saunders JB, Monteiro MG. Audit The
Alcohol Use Disorder Identification Test Fuidelines For Use In Primary
Care Second Edition. :41.
12. Midanik LT, Room R. The epidemiology of alcohol consumption. Alcohol
Health Res World. 1992 Jun 22;16(183):90. [Internet]. [cited 2018 Jul 13].
Availablefrom:https://www.researchgate.net/publication/232583945_The_e
pidemiology_of_alcohol_consumption
13. Girish N, Kavita R, Gururaj G, Benegal V. Alcohol use and implications for
public health: patterns of use in four communities. Indian journal of
community medicine: official publication of Indian Association of
Preventive & Social Medicine. 2010 Apr;35(2):238.
14. Gupta PC, Saxena S, Pednekar MS, Maulik PK. Alcohol consumption
among middle-aged and elderly men: a community study from western
India. Alcohol and Alcoholism. 2003 Jul 1;38(4):327-31.

15. Varma D, Chandra PS, Thomas T, Carey MP. Intimate partner violence and
sexual coercion among pregnant women in India: relationship with
depression and post-traumatic stress disorder. Journal of affective disorders.
2007 Sep 1;102(1-3):227-35.
16. Benegal V, Nayak M, Murthy P, Chandra P, Gururaj G, Obot I. Women and
alcohol use in India. Alcohol, gender and drinking problems: Perspectives
from low and middle income countries. 2005;89:123.
17. Chowdhury AN, Ramakrishna J, Chakraborty AK, Weiss MG. Cultural
context and impact of alcohol use in the Sundarban Delta, West Bengal,
India. Social Science & Medicine. 2006 Aug 1;63(3):722-31.
18. Ahmed, M.V., Gururaj, N.A., Nirgude, A.S. and Akram, M.S., 2015.
Prevalence and patterns of alcohol intake among industrial workers in
mangalore: an appraisal by alcohol use disorder identification test (audit).
Journal Of Evolution Of Medical And Dental Sciences-Jemds, 4(66),
pp.11446-11452.
19. Thapa P, Kamath R, Shetty BK, Monteiro A, Sekaran VC. Prevalence and
associated factors of alcoholism among tuberculosis patients in Udupi
Taluk, Karnataka, India: a cross sectional study. J Nepal Health Res Counc.
Nepal. 2014 Sep 1;12:177-81
20. Barik A, Rai RK, Chowdhury A. Alcohol Use-Related Problems Among a
Rural Indian Population of West Bengal: An Application of the Alcohol
Use Disorders Identification Test (AUDIT). Alcohol Alcohol Oxf Oxfs.
2016 Mar;51(2):215–23.

21. Dasgupta A, Ray S, Pal J, Biswas R, Ray D, Ghosal A. Alcohol
Consumption by workers in automobile repair shops of a slum of Kolkata:
An assessment with AUDIT instrument. Nepal Journal of Epidemiology.
2013 Jul 1;3(3):269-74.
22. Yadav D, Hawes RH, Brand RE, Anderson MA, Money ME, Banks PA,
Bishop MD, Baillie J, Sherman S, DiSario J, Burton FR. Alcohol
consumption, cigarette smoking, and the risk of recurrent acute and chronic
pancreatitis. Archives of internal medicine. 2009 Jun 8;169(11):1035-45.
23. Yadav, D., Chakrapani, V., Goswami, P., Ramanathan, S., Ramakrishnan,
L., George, B., Sen, S., Subramanian, T., Rachakulla, H. and Paranjape,
R.S., 2014. Association between alcohol use and HIV-related sexual risk
behaviors among men who have sex with men (MSM): findings from a
multi-site bio-behavioral survey in India. AIDS and Behavior, 18(7),
pp.1330-1338.
24. Kumar S. G, K.C. P, L. S, E. S, Vinayagamoorthy, Kumar V. Prevalence
and Pattern of Alcohol Consumption using Alcohol Use Disorders
Identification Test (AUDIT) in Rural Tamil Nadu, India. J Clin Diagn Res
JCDR. 2013 Aug;7(8):1637–9.
25. Govindappa L, Pankajakshi B. A community study on violence among
wives of. Religion.;5:100.
26. Goel N, Khandelwal V, Pandya K, Kotwal A. Alcohol and tobacco use
among undergraduate and postgraduate medical students in India: A

multicentric cross-sectional study. Central Asian journal of global health.
2015;4(1).
27. Chopra A, Dhawan A, Sethi H, Mohan D. Association between parental and
offspring's alcohol use--population data from India. Journal of Indian
Association for child and Adolescent Mental Health. 2008;4(2):38-43.
28. Vaithiyanathan P, Thekkur P, C. K, Datta SS. Alcohol use, harmful use of
alcohol and probable dependence among residents of a selected fishermen
community in South India: A community based cross-sectional analytical
study. Int J Community Med Public Health. 2018 Jan 24;5(2):520.
29. Sachdeva S, Nagar M, Tyagi A, Sachdeva R. Alcohol consumption
practices amongst adult males in a rural area of Haryana.
30. Gupta A, Priya B, Williams J, Sharma M, Gupta R, Jha DK, Ebrahim S,
Dhillon PK. Intra-household evaluations of alcohol abuse in men with
depression and suicide in women: a cross-sectional community-based study
in Chennai, India. BMC public health. 2015 Dec;15(1):636.
31. Katulanda P, Ranasinghe C, Rathnapala A, Karunaratne N, Sheriff R,
Matthews D. Prevalence, patterns and correlates of alcohol consumption
and its’ association with tobacco smoking among Sri Lankan adults: a
cross-sectional study. BMC public health. 2014 Dec;14(1):612.
32. Ghosh S, Samanta A, Mukherjee S. Patterns of Alcohol Consumption
among Male Adults at a Slum in Kolkata, India. J Health Popul Nutr. 2012
Mar;30(1):73–81.

33. Kaundal PK, Sharma I, Jha T. Assessment of psychosocial factors
associated with relapse in patients with alcohol dependence: a retrospective
observational study. International Journal of Basic & Clinical
Pharmacology. 2016;5(3):969-74.
34. Mohan D, Chopra A, Ray R, Sethi H. Alcohol consumption in India: a
cross-sectional study. Surveys of drinking patterns and problems in seven
developing countries. Geneva: World Health Organization. 2001;59:103-14.
35. D'costa G, Nazareth I, Naik D, Vaidya R, Levy G, Patel V, King M.
Harmful alcohol use in Goa, India, and its associations with violence: a
study in primary care. Alcohol and alcoholism. 2006 Dec 15;42(2):131-7.
36. Chagas Silva M, Gaunekar G, Patel V, Kukalekar DS, Fernandes J. The
prevalence and correlates of hazardous drinking in industrial workers: a
study from Goa, India. Alcohol Alcohol Oxf Oxfs. 2003 Feb;38(1):79–83.
37. Bonu S, Rani M, Jha P, Peters DH, Nguyen SN. Household tobacco and
alcohol use, and child health: an exploratory study from India. Health
policy. 2004 Oct 1;70(1):67-83.
38. Muwonge R, Ramadas K, Sankila R, Thara S, Thomas G, Vinoda J,
Sankaranarayanan R. Role of tobacco smoking, chewing and alcohol
drinking in the risk of oral cancer in Trivandrum, India: a nested case-
control design using incident cancer cases. Oral oncology. 2008 May
1;44(5):446-54.
39. Cancela MD, Ramadas K, Fayette JM, Thomas G, Muwonge R, Chapuis F,
Thara S, Sankaranarayanan R, Sauvaget C. Alcohol intake and oral cavity

cancer risk among men in a prospective study in Kerala, India. Community
dentistry and oral epidemiology. 2009 Aug;37(4):342-9.
40. John A, Barman A, Bal D, Chandy G, Samuel J, Thokchom M, Joy N,
Vijaykumar P, Thapa S, Singh V, Raghava V. Hazardous alcohol use in
rural southern India: nature, prevalence and risk factors. The National
medical journal of India. 2009;22(3):123-5. [Internet]. [cited 2018 Jul 13].
Available from: https://www.ncbi.nlm.nih.gov/pubmed/19764687
41. Nayak MB, Patel V, Bond JC, Greenfield TK. Partner alcohol use, violence
and women's mental health: population-based survey in India. The British
journal of psychiatry. 2010 Mar;196(3):192-9.
42. Stanley S. Interpersonal violence in alcohol complicated marital
relationships (A study from India). Journal of family violence. 2008 Nov
1;23(8):767.
43. Subramanian SV, Nandy S, Irving M, Gordon D, Smith GD. Role of
socioeconomic markers and state prohibition policy in predicting alcohol
consumption among men and women in India: a multilevel statistical
analysis. Bulletin of the World Health Organization. 2005;83:829-36.
44. WHO | Dependence syndrome [Internet]. [cited 2018 Sep 12]. Available
from: http://www.who.int/substance_abuse/terminology/definition1/en/
45. Madhivanan P, Hernandez A, Gogate A, Stein E, Gregorich S, Setia M,
Kumta S, Ekstrand M, Mathur M, Jerajani H, Lindan CP. Alcohol use by
men is a risk factor for the acquisition of sexually transmitted infections and

human immunodeficiency virus from female sex workers in Mumbai, India.
Sexually transmitted diseases. 2005 Nov;32(11):685.
46. Mohanan P, Swain S, Sanah N, Sharma V, Ghosh D. A study on the
prevalence of alcohol consumption, tobacco use and sexual behaviour
among adolescents in urban areas of the Udupi District, Karnataka, India.
Sultan Qaboos University Medical Journal. 2014 Feb;14(1):e104.
47. Khosla V, Thankappan KR, Mini GK, Sarma PS. Prevalence & predictors
of alcohol use among college students in Ludhiana, Punjab, India. Indian
Journal of Medical Research. 2008 Jul 1;128(1):79.
48. Mathew R, Bal R. Prevalence of Alcohol Dependence among Males in
Thiruvananthapuram District, Kerala. Indian Journal Of Psychological
Science. 2016 Jul 1;7(1):1-1.
49. Suhadev M, Thomas BE, Murugesan P, Chandrasekaran V, Charles N,
Durga R, Auxilia M, Mathew TA, Wares F. Alcohol use disorders (AUD)
among tuberculosis patients: a study from Chennai, South India. PloS one.
2011 May 17;6(5):e19485.
50. Gajalakshmi V, Hung RJ, Mathew A, Varghese C, Brennan P, Boffetta P.
Tobacco smoking and chewing, alcohol drinking and lung cancer risk
among men in southern India. International journal of cancer. 2003 Nov
10;107(3):441-7.
51. Singh SK, Schensul JJ, Gupta K, Maharana B, Kremelberg D, Berg M.
Determinants of alcohol use, risky sexual behavior and sexual health

problems among men in low income communities of Mumbai, India. AIDS
and Behavior. 2010 Aug 1;14(1):48-60.
52. Kumar S, Kuchhal A, Dixit V, Jaiswal S. Suicidal Ideation and its
Correlates in Patients of Alcohol Dependence Syndrome. 2016;3(5):6.
53. Kumar S, Jeyaseelan L, Suresh S, Ahuja RC. Domestic violence and its
mental health correlates in Indian women. the British journal Of psychiatry.
2005 Jul;187(1):62-7.
54. Kaur P, Rao SR, Radhakrishnan E, Ramachandran R, Venkatachalam R,
Gupte MD. High prevalence of tobacco use, alcohol use and overweight in
a rural population in Tamil Nadu, India. Journal of postgraduate medicine.
2011 Jan 1;57(1):9.
55. Rathod SD, Nadkarni A, Bhana A, Shidhaye R. Epidemiological features of
alcohol use in rural India: a population-based cross-sectional study. BMJ
open. 2015 Dec 1;5(12):e009802.
56. Harnagle R, Kumar R. A study of prevalence of alcoholics dependence
syndrome and role of alchoholics anonymous in prevention and deaddiction
in a urban community of Jabalpur Cantonment, Madhya Pradesh, India.
2014;8.
57. Bhullar DS, Singh SP, Thind AS, Aggarwal KK, Goyal A. Alcohol
Drinking Patterns: A Sample Study. 2013;35(1):3.
58. Jawarkar AK, Shemar H, Wasnik VR, Chavan MS. Domestic violence
against women: a crossectional study in rural area of Amravati district of
Maharashtra, India. Int J Res Med Sci. 2017 Jan 3;4(7):2713–8.

59. Pillai A, Nayak MB, Greenfield TK, Bond JC, Nadkarni A, Patel V.
Patterns of alcohol use, their correlates, and impact in male drinkers: a
population-based survey from Goa, India. Social psychiatry and psychiatric
epidemiology. 2013 Feb 1;48(2):275-82.
60. Verma RK, Saggurti N, Singh AK, Swain SN. Alcohol and sexual risk
behavior among migrant female sex workers and male workers in districts
with high in-migration from four high HIV prevalence states in India. AIDS
and Behavior. 2010 Aug 1;14(1):31-9.
61. Darshan MS, Raman R, Rao TS, Ram D, Annigeri B. A study on
professional stress, depression and alcohol use among Indian IT
professionals. Indian journal of psychiatry. 2013 Jan;55(1):63.
62. Kotina S, Sawant GV, Kokiwar PR. A study to determine causes,
prevalence and knowledge regarding consequences of substance abuse: a
community based cross sectional study. International Journal Of
Community Medicine And Public Health. 2017 Feb 1;3(3):730-4.
63. Singh A, Gupta P, Srivastava MR, Zaidi ZH. A cross sectional study on
tobacco and alcohol abuse among medical college students. International
Journal Of Community Medicine And Public Health. 2017 Aug
23;4(9):3372-5. [Internet]. [cited 2018 Jul 13]. Available from:
http://www.ijcmph.com/index.php/ijcmph/article/view/1777
64. Chavan BS, Arun P, Bhargava R, Singh GP. Prevalence of alcohol and drug
dependence in rural and slum population of Chandigarh: A community
survey. Indian journal of Psychiatry. 2007 Jan;49(1):44.

65. Chandra PS, Krishna VA, Benegal V, Ramakrishna J. High-risk sexual
behaviour & sensation seeking among heavy alcohol users. Indian Journal
of Medical Research. 2003 Feb 1;117:88-92.
66. Barros MB, Botega NJ, Dalgalarrondo P, Marín-León L, Oliveira HB.
Prevalence of alcohol abuse and associated factors in a population-based
study. Revista de Saúde Pública. 2007 Aug;41(4):502-9
67. Ramanan VV, Singh SK. A study on alcohol use and its related health and
social problems in rural Puducherry, India. J Fam Med Prim Care.
2016;5(4):804–8.
68. Chakraborty S, Subramanya AHC. Socio-demographic and clinical
predictors of absenteeism - A cross-sectional study of urban industrial
employees. Ind Psychiatry J. 2013;22(1):17–21.
69. Babu GR, Sudhir PM, Mahapatra T, Das A, Rathnaiah M, Anand I, et al.
Association of quality of life and job stress in occupational workforce of
India: Findings from a cross-sectional study on software professionals.
Indian J Occup Environ Med. 2016;20(2):109–13.
70. Sen S, Victor R, Saxena K. Family burden in alcohol dependence: A study
in north-eastern India. Int J Med Sci Public Health. 2016;5(11):2402.
71. Tyagi A, Mehta S. ‘I drink, you suffer’: impact of partner’s alcohol
consumption on spouse. Sri Lanka Journal of Psychiatry. 2013 Dec 29;4(2).
72. World Health Organization, editor. Burden and socio-economic impact of
alcohol: the Bangalore study. New Delhi: World Health Organization,
Regional Office for South-East Asia; 2006. 72 p. (Alcohol control series).

73. Sanjay D, Puranik A, Saroshe S, Gupta G, Sirohi S, Rohit B. A study of the
nature and causes of domestic violence among the attendees of a domestic
violence counseling center of a tertiary level hospital of a city of central
India. Int J Med Sci Public Health. 2013 Jan 1;3:728.
74. Saxena S, Sharma R, Maulik PK. Impact of alcohol use on poor families: a
study from north India. Journal of substance use. 2003 Jan 1;8(2):78-
84.Available from: https://www.researchgate.net/publication/232062168
75. Endsley P, Weobong B, Nadkarni A. Psychometric properties of the
AUDIT among men in Goa, India. Asian J Psychiatry. 2017 Oct 1;29:54–8.
76. Pal HR, Jena R, Yadav D. Validation of the Alcohol Use Disorders
Identification Test (AUDIT) in urban community outreach and de-addiction
center samples in north India. Journal of Studies on Alcohol. 2004
Nov;65(6):794-800.Available from: https:// www.ncbi. nlm. nih.gov/
pubmed/ 15700518
77. Alcoholics Anonymous India - Get help for your Drinking Problem
[Internet]. [cited 2018 Jul 13]. Available from: http://www.aagsoindia.org/
78. Das SK, Balakrishnan V, Vasudevan DM. Alcohol: its health and social
impact in India. National Medical Journal of India. 2006 Mar 1;19(2):94.
Available from: https:// www. researchgate.net/ publication/7027233
79. Census of India Website : Office of the Registrar General & Census
Commissioner, India [Internet]. [cited 2018 Sep 22]. Available from:
http://censusindia.gov.in/

80. Chaudhary V, Katyal R, Singh SP, Joshi HS, Upadhyay D, Singh A. A
Study on Pattern of Alcohol Use using AUDIT among the College Students
in a Medical College of North India. National Journal of Community
Medicine. 2015;6 (2):253-7.
Available from: https:// www. researchgate.net/ publication/ 280923937
81. Tumge L. Prevalence And Patterns Of Alcohol Use Among College
Students: Comparing Scenario In Arunachal Pradesh And Kerala(Doctoral
Dissertation, SCTIMST).
82. Dutta R, Gnanasekaran S, Suchithra S, Srilalitha V, Sujitha R, Sivaranjani
SS, et al. A Population based Study on Alcoholism among Adult Males in a
Rural Area, Tamil Nadu, India. J Clin Diagn Res JCDR. 2014
Jun;8(6):JC01–3.
83. Pandey AK, Kumar S. Epidemiological Study Of Alcohol Abuse-An Urban
Perspective. Journal of Evidence Based Medicine and Healthcare. 2016 Jan
1;3(85):4668-72.
84. Kim S, Rifkin S, John SM, Jacob KS. Nature, prevalence and risk factors of
alcohol use in an urban slum of southern India. Natl Med J INDIA.
2013;26(4):7.
85. Jaisoorya TS, Beena KV, Ravi GS, Thennarasu K, Benegal V. Alcohol
harm to adolescents from others’ drinking: A study from Kerala, India.
Indian J Psychiatry. 2018 Jan 1;60(1):90.

86. Reisdorfer E, Büchele F, Pires ROM, Boing AF. Prevalence and associated
factors with alcohol use disorders among adults: a population-based study
in southern Brazil. Rev Bras Epidemiol. 2012 Sep;15(3):582–94.
87. Mahanta B, Mohapatra PK, Phukan N, Mahanta J. Alcohol use among
school-going adolescent boys and girls in an industrial town of Assam,
India. Indian J Psychiatry. 2016;58(2):157–63.
88. Tomar S, Kasar P, Tiwari R, Rajpoot S, Nayak S. Study of alcohol
consumption and its sociodemographic determinants in a tribal village in
Mandla district. Int J Med Sci Public Health. 2016;5(5):989.

ANNEXURES I

ANNEXURE II
ABBREVATIONS
SL NO
ACRONYM EXPANSION
1 AA Alcoholics Anonymous
2 ADS Alcohol Dependence Syndrome
2 AFR WHO Region Of Africa
3 AMR WHO Region Of Americans
4 AUC Area Under Curve
5 AUD Alcohol Use Disorders
6 AUDIT Alcohol Use Disorder Identification Test
7 CADs Commercially available alcoholic drinks
8 CI Confidence Interval
9 CMD Common Mental Disorders
10 DALY Disability adjusted life years
11 EMR WHO eastern Mediterranean region
12 EUR WHO Region Of Europe
13 HADs Home made alcoholic drinks
14 MSSI Modified scale for suicidal ideation
15 NFHS National Family Health Survey
16 OPD Out Patient Department
17 OR Odds Ratio
18 PHC Primary Health Centre
18 PHQ Physical Health Quality
19 SD Standard Deviation
20 SEAR South East Asian Region
21 SES Socioeconomic Status
22 SLI Standard Living Index
23 SMAST Short Michigan Alcohol Screening Test
24 SPSS Statistical package for social sciences
25 SSI Scale For Suicide Ideation
26 TASMAC Tamil Nadu State Marketing Corporation
27 WHO World health Organization
28 WPR WHO western pacific region

ANNEXURE III
PARTICIPANTS CONSENT FORM
The details of the study have been explained to me in writing and the details
have been fully explained to me. I am aware that the results of the study may not
be directly beneficial to me but will help in the advancement of medical sciences. I
confirm that I have understood the study and had the opportunity to ask questions.
I understand that my participation in the study is voluntary and that I am free to
withdraw at any time, without giving any reason, without the medical care that will
normally be provide by the hospital being affected. I agree not to restrict the use of
any data or results that arise from this study provided such a use is only for
scientific purpose(s). I have been given an information sheet giving details of the
study. I fully consent to participate in the study titled ‘Prevalence and Social
Factors associated with alcohol use among adult Men in Thiruvattar’.
Serial No/Reference no :
Name of the Participant :
Address of the Participant :
Contact number of the Participant :
Signature/Thumb impression of the participant/Legal guardian
Witnesses :
1
Date :
Place :


ANNEXURE –VI
INTERVIEW SCHEDULE
1) Id no:
2) Age in completed years ?
3) Religion : 1)Christian 2)Hindu 3)Muslim 4) Others
4) Type of family? 1)nuclear 2)extended 3)joint 4)no family
5) Marital status : 1)Married 2)Divorced 3) Never married 4)Widowed 5)
Separated
6) Educational status: 1)illiterate 2) primary school certificate 3)middle
school certificate 4) High school certificate 5) PUC or higher secondary
6)Graduate or post graduate 7) Professional
7) Current Occupation: 1) unemployed 2) unskilled 3) semiskilled 4)skilled
5) clerical/shop owner/farmer 6) semiprofessional 7) Professional
8) Income:
9) Are you the head of the family? A) yes b)no
10) Number of family members? 1)1 2)2 3)specify
11) What is your source of income? 1)Pension 2)Farming/from land 3)Job 4)
Remittance 5)None 6) earning of someone else in the family 7) others,
specify
12) Who is the owner of your residence? 1)self 2)children 3) Rent 4)parents
13) Who are the others staying with you currently? 1)Children 2)Spouse 3)
parents 4)Alone

14) Any chronic disease or morbidity? a)yes b) no if yes type of
morbidity,duration?
15) Have you ever smoked tobacco ? a) yes b) no
16) At what age did you come to know about alcohol? 1)0-14 2)15-29 3)30-
44 4)45-59 5)>60
17) Have you ever consumed alcohol? a ) yes b) no
18) Do u currently consume alcohol? a) yes b) no
19) Any alcohol users in the family a) yes b) no
20) If yes relation of the user to responder 1)Son 2)family relative 3)specify
21) If yes is he a current user a) yes b) no
22) No. of current alcohol users in the family 1) none 2)1 c) 2
Begin the AUDIT by saying “Now I am going to ask you some questions
about your use of alcoholic beverages during this past year.”
23) How often do you have a drink containing alcohol? (0) Never [Skip to Qs
33-34](1) Monthly or less(2) 2 to 4 times a month(3) 2 to 3 times a
week(4) 4 or more times a week
24) How many drinks containing alcohol do you have on a typical day when
you are drinking? (0)1 or 2(1)3 or 4(2)5 or 6(3)7, 8, or 9(4)10 or more
25) How often do you have six or more drinks on one occasion?
(0)Never(1)Less than monthly(2)Monthly(3)Weekly(4)Daily or almost
daily Skip to Questions 9 and 10 if Total Score for Questions 25 and 26= 0

26) How often during the last year have you found that you were not able to
stop drinking once you had started? (0)Never(1)Less than
monthly(2)Monthly(3)Weekly(4)Daily or almost daily
27) How often during the last year have you failed todo what was normally
expected from you because of drinking? (0)Never(1)Less than
monthly(2)Monthly(3)Weekly(4)Daily or almost daily
28) How often during the last year have you needed a first drink in the morning
to get yourself going after a heavy drinking session? (0)Never(1)Less
than monthly(2)Monthly(3)Weekly(4)Daily or almost daily
29) How often during the last year have you had a feeling of guilt or remorse
after drinking? (0)Never(1)Less than
monthly(2)Monthly(3)Weekly(4)Daily or almost daily
30) How often during the last year have you been unable to remember what
happened the nightbefore because you had been drinking? (0)Never(1)Less
than monthly(2)Monthly(3)Weekly(4)Daily or almost daily
31) Have you or someone else been injured as a result of your drinking?
(0)No(2)Yes, but not in the last year(4)Yes, during the last year
32) Has a relative or friend or a doctor or another health worker been
concerned about your drink-ing or suggested you cut down? (0)No(2)Yes,
but not in the last year(4)Yes, during the last year
33) Any alcohol users in the work place 1) yes 2) no
34) Any alcohol users in the social circle 1) yes 2) no

35) Average distance of alcohol out let from your house 1)less than 1 km
2)more than 1 km
36) What time this out let will be open on working days a) 24hrs b)Day time
only c)night only d) specify timings
37) What time this outlet will be open on holidays a) 24hrs b)Day time only
c)night only d) Specify timings
38) What type of most common out let is that a) govt b)private bar c) private
bar in restaurant d) others
39) Will you prepare wine in your home a) yes b) no
40) Special source of alcohol a) abroad b) military camp c) private shop d)
others
41) Will there be supply of alcohol during family function at your house a) yes
b) no
42) Is there opposition for use of alcohol in your family by parents a) yes b) no
43) Is there opposition for use of alcohol in your family by spouse a) yes b) no
44) Will there be supply of alcohol during your office function a) yes b) no
45) Is there opposition of use of alcohol in office a) yes b) no
46) Will there be supply of alcohol during your friends gathering a) yes b) no
47) Is there any opposition of use of alcohol during friends gathering by any
friends a) yes b) no
48) Will there be supply of alcohol during social gatherings a) yes b) no
49) Is there any opposition for use of alcohol during social gathering by any
one among your group A) yes b) no

50) Has anyone forced to take alcohol ever a) yes b) no
51) Was anybody alcoholic in your close circles when you were young
a)neighbor b) relatives c) friends d) teacher 5)specify 6 none
52) Age of responders at first use of alcohol 1. less than and 15 2. 16-30 3. 31-
45 4.46-60 5. more than 60 6. none
53) The place of alcohol consumption a) home b) Restaurant c) friends place d)
hideout e)Social gathering f) hostel g) others/specify
54) With whom do you most commonly consume alcohol with a) alone b)
friends c) family member d) spouse e) others/specify
55) How frequently are you consuming alcohol ? How much?
1. less than a month 2. 2 to 4 month 3. 2 to 4 week 4.4 or 7 times a week
56) Reason for starting alcohol consumption a) curious b) peer pressure c)
curious +peer pressure d) to feel with the crowd e) to work more h) others
57) Reason for continuing alcohol consumption a) peer pressure b) withdrawal
symptoms c) ) to work more c) to work more d) to get rid of symptoms e)
maintain social status f) to get good sleep 7)to get rid of worries 8) others
58) Have you ever tried to stop alcohol consumption? 1)yes 2) no
59) If yes then what is the reason? 1 health problem 2 finance problem 3
none
60) Type of beverage usually consumed a) whisky b) rum c) beer d) toody e)
brandy f) others g) none

MASTER CHART
ANNEXURE : IX Sl
.No
AG
E
REL
IGIO
N
TYP
E O
F F
AM
ILY
MA
RR
IED
EDU
CA
TIO
N
OC
CU
PATI
ON
FAM
ILY
MEM
BER
S
INC
OM
ESO
UR
CE
OW
NER
OFT
HEH
OU
SE
OTH
ERSS
TAY
WIT
HU
AN
YCH
RO
NIC
DIS
EASE
MO
RB
IDIT
Y
SMO
KIN
G
AW
AR
ENES
SAB
OU
TALC
OH
OL
DO
YOU
CO
NSU
MEA
LCO
HO
L
AN
YALC
OH
OLU
SER
INFA
MIL
Y
ISH
ECU
RR
ENTU
SER
ALC
OH
OLI
CSI
NU
RW
OR
KP
LAC
E
ALC
OH
OLI
CSI
NU
RSO
CIA
L
DIS
TBW
UR
HO
USE
OU
TLET
OU
TLET
OP
ENW
KN
GD
AY
OU
TLET
OP
ENH
OLI
DA
YS
TYP
EOFO
UTL
ET
WIN
EMA
NU
INH
OM
E
SPEC
IALS
OU
RC
EALC
OH
OL
SUP
PLY
AM
ILY
FUN
CTI
ON
PAR
ENTS
OB
JEC
TIT
WIF
EOB
JEC
TSIT
1 18 3 3 1 1 1 5 3 1 3 1 1 1 9 1 1 1 1 1 1 1 1 1 1 1 1 1 1 1 1
2 18 3 3 1 1 1 7 3 4 3 1 1 1 9 1 1 1 1 1 1 1 1 1 1 1 1 1 1 1 1
3 18 3 2 1 1 1 5 3 4 3 1 1 1 9 1 1 1 1 1 1 1 1 1 1 1 1 1 1 1 1
4 18 3 1 1 1 1 5 3 1 3 1 1 1 9 1 1 1 1 1 1 1 1 1 1 1 1 1 1 1 1
5 38 3 3 1 1 1 4 7 1 3 1 1 1 9 1 1 1 2 2 1 1 1 1 1 1 1 1 1 1 1
6 39 3 1 1 1 1 4 3 1 3 1 1 1 9 1 1 1 1 1 1 1 1 1 1 1 1 1 1 1 1
7 19 3 1 1 1 1 5 3 4 3 1 1 1 9 1 1 1 1 1 1 1 1 1 1 1 1 1 1 1 1
8 19 3 1 1 1 1 4 7 1 3 1 1 1 9 1 1 1 2 2 1 1 1 1 1 1 1 1 1 1 1
9 39 3 1 1 1 1 4 3 1 3 1 1 1 9 1 1 1 1 1 1 1 1 1 1 1 1 1 1 1 1
10 19 3 1 1 1 1 3 3 1 3 1 1 1 9 1 1 1 1 1 1 1 1 1 2 1 1 1 1 1 1
11 20 3 1 1 1 1 3 3 1 3 1 1 1 9 1 1 1 1 1 1 1 1 1 2 1 1 1 1 1 1
12 20 3 1 1 1 1 3 3 1 3 1 1 1 9 1 1 1 1 1 1 1 1 1 2 1 1 1 1 1 1
13 48 3 2 1 1 1 6 3 1 3 1 1 1 9 1 1 1 1 1 1 1 1 1 2 1 1 1 1 1 1
14 46 3 1 1 1 1 4 3 1 3 1 1 1 9 1 1 1 1 1 1 1 1 1 2 1 1 1 1 1 1
15 45 3 2 1 1 1 5 7 1 3 1 1 1 9 1 1 1 2 2 1 1 1 1 2 1 1 1 1 1 1
16 44 3 1 1 1 1 5 7 1 3 1 1 1 9 1 1 1 2 2 1 1 1 1 2 1 1 1 1 1 1
17 35 3 2 1 1 1 4 3 1 3 1 1 1 9 1 1 1 1 1 1 1 1 1 2 1 1 1 1 1 1
18 34 3 1 1 1 1 2 3 1 3 1 1 1 9 1 1 1 1 1 1 1 1 1 2 1 1 1 1 1 1
19 33 3 2 1 1 1 6 3 1 3 1 1 1 9 1 1 1 1 1 1 1 1 1 2 1 1 1 1 1 1
20 32 3 1 1 1 1 4 3 1 3 1 1 1 9 1 1 1 1 1 1 1 1 1 2 1 1 1 1 1 1
21 31 3 1 1 1 1 4 3 1 3 1 1 1 9 1 1 1 1 1 1 1 1 1 2 1 1 1 1 1 1
22 22 3 1 1 1 1 4 3 1 3 1 1 1 9 1 1 1 1 1 1 1 1 1 2 1 1 1 1 1 1
23 23 3 1 1 1 1 4 3 1 3 1 1 1 9 1 1 2 1 1 1 1 1 1 2 1 1 1 1 1 1
24 24 1 1 1 1 1 5 3 1 3 1 1 1 9 1 1 2 1 1 1 1 1 1 2 1 1 1 1 1 1
25 25 1 1 1 1 1 5 3 1 3 1 1 1 9 1 1 2 1 1 1 1 1 1 2 1 1 1 1 1 1
26 26 1 1 1 1 1 3 3 1 3 1 1 1 9 1 1 2 1 1 1 1 1 1 2 1 1 1 1 1 1
27 27 1 1 1 1 1 5 3 1 3 1 1 1 9 1 1 2 1 1 1 1 1 1 2 1 1 1 1 1 1
SUP
PLY
ALC
OH
OLW
OR
KP
LAC
EO
FFIC
E
OB
JEC
TLIQ
UO
RIN
OFF
ICEF
UN
CTI
ON
BY
SUP
ERIO
RS

MASTER CHART
28 28 1 1 1 1 1 3 3 1 3 1 1 1 9 1 1 2 1 1 1 1 1 1 2 1 1 1 1 1 1
29 29 1 1 1 2 1 4 3 4 3 1 1 1 9 1 1 2 1 1 1 1 1 1 2 1 1 1 1 1 1
30 30 1 1 1 2 1 5 3 1 3 1 1 1 9 1 1 2 1 1 1 1 1 1 2 1 1 1 1 1 1
31 20 1 1 1 2 1 3 3 1 3 1 1 1 9 1 1 2 1 1 1 1 1 1 2 1 1 1 1 1 1
32 20 1 1 1 2 1 4 3 1 3 1 1 1 9 1 1 2 1 1 1 1 1 1 2 1 1 1 1 1 1
33 23 1 1 1 2 1 4 3 1 3 1 1 1 9 1 1 2 1 1 1 1 1 1 2 1 1 1 1 1 1
34 24 1 1 1 2 1 4 3 1 3 1 1 1 9 1 1 2 1 1 1 1 1 1 2 1 1 1 1 1 1
35 25 1 1 1 2 1 4 3 1 3 1 1 1 10 1 1 2 1 1 1 1 1 1 2 1 1 1 1 1 1
36 26 1 1 1 2 1 3 3 4 3 1 1 1 10 1 1 2 1 1 1 1 1 1 2 1 1 1 1 1 1
37 27 1 1 1 2 1 4 3 1 3 1 1 1 10 1 1 2 1 1 1 1 1 1 2 1 1 1 1 1 1
38 28 1 1 1 2 1 2 3 4 3 1 1 1 10 1 1 2 1 1 1 1 1 1 2 1 1 1 1 1 1
39 29 1 1 1 2 1 2 3 4 3 1 1 1 10 1 1 2 1 1 1 1 1 1 2 1 1 1 1 1 1
40 30 1 1 1 2 1 4 2 1 3 1 1 1 10 1 1 2 2 2 1 1 1 1 2 1 1 1 1 1 1
41 22 1 1 1 2 1 4 3 1 3 1 1 1 10 1 1 2 1 1 1 1 1 1 2 1 1 1 1 1 1
42 22 1 1 1 2 1 4 3 1 3 1 1 1 10 1 1 2 1 1 1 1 1 1 2 1 1 1 1 1 1
43 23 1 3 1 2 1 4 3 1 3 1 1 1 10 1 1 2 1 1 1 1 1 1 2 1 1 1 1 1 1
44 24 1 1 1 2 1 4 3 1 3 1 1 1 10 1 1 2 1 1 1 1 1 1 2 1 1 1 1 1 1
45 25 1 1 1 2 1 3 3 1 3 1 1 1 10 1 1 2 1 1 1 1 1 1 2 1 1 1 1 1 1
46 26 1 1 1 2 1 4 3 1 3 1 1 1 10 1 1 2 1 1 1 1 1 1 2 1 1 1 1 1 1
47 27 1 2 1 2 1 5 3 1 3 1 1 1 10 1 1 2 1 1 1 1 1 1 2 1 1 1 1 1 1
48 28 1 2 1 2 1 4 1 1 3 1 1 1 10 1 1 2 1 1 1 1 1 1 2 1 1 1 1 1 1
49 29 1 2 1 2 1 4 3 1 3 1 1 1 10 1 1 2 1 1 1 1 1 1 2 1 1 1 1 1 1
50 30 1 1 1 2 1 5 3 1 3 1 1 1 10 1 1 2 1 1 1 1 1 1 2 1 1 1 1 1 1
51 21 1 1 1 2 1 3 3 4 3 1 1 1 10 1 1 2 1 1 1 1 1 1 2 1 1 1 1 1 1
52 22 1 2 1 2 1 4 3 4 3 1 1 1 10 1 1 2 1 1 1 1 1 1 2 1 1 1 1 1 1
53 23 1 1 1 2 1 4 3 1 3 1 1 1 10 1 1 2 1 1 1 1 1 1 2 1 1 1 1 1 1
54 24 1 1 1 2 1 4 3 1 3 1 1 1 10 1 1 2 1 1 1 1 1 1 2 1 1 1 1 1 1
55 25 1 3 1 2 1 5 3 1 3 1 1 1 10 1 1 2 1 1 1 2 2 2 2 1 1 1 1 1 1
56 26 1 1 1 2 1 3 3 4 3 1 1 1 10 1 1 2 1 1 1 2 2 2 2 1 1 1 1 1 1
57 27 1 2 1 2 1 5 3 1 3 1 1 1 10 1 1 2 1 1 1 2 2 2 2 1 1 1 1 1 1
58 28 1 1 1 3 1 3 3 1 3 1 1 1 10 1 1 2 1 1 1 2 2 2 2 1 1 1 1 1 1
59 29 1 1 1 3 1 3 3 1 3 1 1 1 10 1 1 2 1 1 1 2 2 2 2 1 1 1 1 1 1
60 30 1 1 1 3 1 3 3 1 3 1 1 1 10 1 1 2 2 2 1 2 2 2 2 1 1 1 1 1 1
61 21 1 1 1 3 1 3 3 1 3 1 1 1 10 1 1 2 2 2 1 2 2 2 2 1 1 1 1 1 1
62 22 1 1 1 3 1 4 3 1 3 1 1 1 10 1 1 2 2 2 1 2 2 2 2 1 1 1 1 1 1
63 23 1 1 1 3 1 4 7 1 3 1 1 1 10 1 1 2 2 2 1 2 2 2 2 1 1 1 1 1 1
64 24 1 1 1 3 1 4 3 1 3 1 1 1 10 1 1 2 2 2 1 2 2 2 2 1 1 1 1 1 1

MASTER CHART
65 25 1 2 1 3 1 7 3 1 3 1 1 1 10 1 1 2 2 2 1 2 2 2 2 1 1 1 1 1 1
66 26 1 2 1 3 1 6 3 4 3 1 1 1 10 1 1 2 2 2 1 2 2 2 2 1 1 1 1 1 1
67 27 1 1 1 3 2 4 3 1 3 1 1 1 10 1 1 2 2 2 1 2 2 2 2 1 1 1 1 1 1
68 28 1 1 1 3 2 4 3 1 3 1 1 1 10 1 1 2 2 2 1 2 2 2 2 1 1 1 1 1 1
69 29 1 2 1 3 2 5 3 1 3 1 1 1 10 1 1 2 2 2 1 2 2 2 2 1 1 1 1 1 1
70 30 1 1 1 3 2 3 3 4 3 1 1 1 11 1 1 2 2 2 1 2 2 2 2 1 1 1 1 1 1
71 21 1 1 1 3 2 3 3 1 3 1 1 1 11 1 1 2 2 2 1 2 2 2 2 1 1 1 1 1 1
72 22 1 1 1 3 2 4 3 1 3 1 1 1 11 1 1 2 2 2 1 2 2 2 2 1 1 1 1 1 1
73 23 1 1 1 3 2 4 3 1 3 1 1 1 11 1 1 2 2 2 1 2 2 2 2 1 1 1 1 1 1
74 24 1 1 1 3 2 4 3 1 3 1 1 1 11 1 1 2 2 2 1 2 2 2 2 1 1 1 1 1 1
75 25 1 1 1 3 2 6 3 1 3 1 1 1 11 1 1 2 2 2 1 2 2 2 2 1 1 1 1 1 1
76 26 1 1 1 3 2 2 3 1 3 1 1 1 11 1 1 2 2 2 1 2 2 2 2 1 1 1 1 1 1
77 61 1 1 1 3 2 4 3 1 3 1 1 1 11 1 1 2 2 2 1 2 2 2 2 1 1 1 1 1 1
78 62 1 1 1 3 2 4 3 1 3 1 1 1 11 1 1 2 2 2 1 2 2 2 2 1 1 1 1 1 1
79 63 1 1 1 3 2 2 3 1 3 1 1 1 11 1 1 2 2 2 1 2 2 2 2 1 1 1 1 1 1
80 64 1 1 1 3 2 5 3 1 3 1 1 1 11 1 1 2 2 2 1 2 2 2 2 1 1 1 1 1 1
81 52 1 1 1 3 2 3 3 1 3 1 1 1 11 1 1 2 2 2 1 2 2 2 2 1 1 1 1 1 1
82 52 1 2 1 3 2 7 3 4 3 1 1 1 11 1 1 2 2 2 1 2 2 2 2 1 1 1 1 1 1
83 52 1 2 1 3 2 5 3 1 3 1 1 1 11 1 1 2 2 2 1 2 2 2 2 1 1 1 1 1 1
84 52 1 2 1 3 2 5 3 4 3 1 1 1 11 1 1 2 2 2 1 2 2 2 2 1 1 1 1 1 1
85 52 1 1 1 3 2 4 3 1 3 1 1 1 11 1 1 2 2 2 1 2 2 2 2 1 1 1 1 1 1
86 52 1 1 1 3 2 5 3 1 3 1 1 1 11 1 1 2 2 2 1 2 2 2 2 1 1 1 1 1 1
87 52 1 2 1 6 2 6 3 4 3 1 1 1 11 1 1 2 2 2 1 2 2 2 2 1 1 1 1 1 1
88 52 1 2 1 6 2 3 7 1 3 1 1 1 11 1 1 2 2 2 1 2 2 2 2 1 1 1 1 1 1
89 52 1 1 1 6 2 4 3 1 3 1 1 2 11 1 1 2 2 2 1 2 2 2 2 1 1 1 1 1 1
90 30 1 1 1 6 2 3 3 1 3 2 1 2 11 1 1 2 2 2 1 2 2 2 2 1 1 1 1 1 1
91 52 1 2 1 6 2 6 3 1 3 2 1 2 11 1 1 2 2 2 1 2 2 2 2 1 1 1 1 1 1
92 52 1 1 1 6 2 4 3 1 3 2 1 2 11 1 1 2 2 2 1 2 2 2 2 1 1 1 1 1 1
93 52 1 1 1 6 2 3 3 1 3 2 1 2 11 1 1 2 2 2 1 2 2 2 2 1 1 1 1 1 1
94 52 1 1 1 6 2 4 3 1 3 2 1 2 11 1 1 2 2 2 1 2 2 2 2 1 1 1 1 1 1
95 52 1 2 1 6 2 6 3 1 3 2 1 2 11 1 1 2 2 2 1 2 2 2 2 1 1 1 1 1 1
96 52 1 1 1 6 2 4 3 1 3 2 1 2 11 1 1 2 2 2 1 2 2 2 2 1 1 1 1 1 1
97 52 1 1 1 6 2 5 3 1 3 2 1 2 11 1 1 2 2 2 1 2 2 2 2 1 1 1 1 1 1
98 52 2 1 1 6 2 4 3 1 3 2 1 2 11 1 1 2 2 2 1 2 2 2 2 1 1 1 1 1 1
99 52 2 1 1 6 2 2 3 1 3 2 1 2 11 1 1 2 2 2 1 2 2 2 2 1 1 1 1 1 1
100 30 2 1 1 6 3 2 3 1 2 2 1 2 12 1 1 2 2 2 1 2 2 2 2 1 1 1 1 1 1
101 21 2 1 1 6 3 4 3 1 2 2 1 2 12 1 1 2 2 2 1 2 2 2 2 2 1 1 1 1 1

MASTER CHART
102 52 2 1 1 4 3 4 3 1 2 2 1 2 12 1 1 2 2 2 1 2 2 2 2 2 1 1 1 1 1
103 52 2 1 1 4 3 4 3 1 2 2 1 2 12 1 1 2 2 2 1 2 2 2 2 2 1 1 1 1 1
104 52 2 1 1 4 3 5 3 1 2 2 1 2 12 1 1 2 2 2 1 2 2 2 2 2 1 1 1 1 1
105 52 2 1 1 4 3 3 3 1 2 2 1 2 12 1 1 2 2 2 1 2 2 2 2 2 1 1 1 1 1
106 52 2 1 1 4 3 2 3 1 2 2 1 2 12 1 1 2 2 2 1 2 2 2 2 2 1 1 1 1 1
107 52 2 1 1 4 3 2 7 1 2 2 1 2 12 1 1 2 2 2 1 2 2 2 2 2 1 1 1 1 1
108 52 2 1 1 4 3 3 3 1 2 2 1 2 12 1 1 2 2 2 1 2 2 2 2 2 1 1 1 1 1
109 52 2 1 1 4 3 4 3 1 2 2 1 2 12 1 1 2 2 2 1 2 2 2 2 2 1 1 1 1 1
110 40 2 1 1 4 3 5 3 1 2 2 1 2 12 1 1 2 2 2 1 3 3 3 2 2 1 1 1 1 1
111 31 2 1 1 4 3 2 3 1 2 2 1 2 12 1 1 2 2 2 1 3 3 3 2 2 2 1 1 1 1
112 32 2 1 1 4 3 5 7 1 2 2 2 2 12 1 1 2 2 2 1 3 3 3 2 2 2 1 1 1 1
113 33 2 2 1 4 3 5 7 1 2 2 2 2 12 1 1 2 2 2 1 3 3 3 2 2 2 1 1 1 1
114 34 2 2 1 4 3 5 7 1 2 2 2 2 12 1 1 2 2 2 1 3 3 3 2 2 2 1 1 1 1
115 35 2 1 1 4 3 3 3 1 2 2 2 2 12 1 1 2 2 2 1 3 3 3 2 2 2 1 1 1 1
116 36 2 1 1 4 3 2 3 1 2 2 2 2 12 1 1 2 2 2 1 3 3 3 2 2 2 1 1 1 1
117 37 2 2 1 4 3 4 3 1 2 2 2 2 12 1 1 2 2 2 1 3 3 3 2 2 2 1 1 1 1
118 38 2 2 1 4 3 7 7 1 2 2 2 2 12 1 1 2 2 2 1 3 3 3 2 2 2 1 1 1 1
119 39 2 2 1 4 3 6 3 1 2 2 2 2 12 1 1 2 2 2 1 3 3 3 2 2 2 1 1 1 1
120 40 2 1 1 4 3 4 3 1 2 2 2 2 12 1 2 2 2 2 1 3 3 3 2 2 2 1 1 2 1
121 31 2 1 1 4 3 4 3 1 2 2 2 2 12 1 2 2 2 2 1 3 3 3 2 2 2 1 1 2 1
122 32 2 1 1 4 3 4 3 1 2 2 2 2 12 1 2 2 2 2 1 3 3 3 2 2 2 1 1 2 1
123 33 2 1 1 4 3 4 3 1 2 2 2 2 12 1 2 2 2 2 1 3 3 3 2 2 2 1 1 2 1
124 34 2 1 1 4 3 5 3 1 2 2 2 2 12 1 2 2 2 2 1 3 3 3 2 2 2 1 1 2 1
125 35 2 1 1 4 3 5 3 1 2 2 2 2 12 1 2 2 2 2 1 3 3 3 2 2 2 1 1 2 1
126 36 2 1 1 4 3 4 3 1 2 2 2 2 12 1 2 2 2 2 1 3 3 3 2 2 2 1 1 2 1
127 37 2 1 1 4 3 3 3 1 2 2 2 2 12 1 2 2 2 2 1 3 3 3 2 2 2 1 1 2 1
128 38 2 1 1 4 3 3 3 1 2 2 2 2 12 1 2 2 2 2 1 3 3 3 2 2 2 1 1 2 1
129 39 2 1 1 4 3 2 3 1 2 2 2 2 12 1 2 2 2 2 1 3 3 3 2 2 2 1 1 2 1
130 40 2 2 1 4 3 10 3 1 2 2 2 2 13 1 2 2 2 2 1 3 3 3 2 2 2 1 1 2 2
131 31 2 1 1 4 3 3 3 1 2 2 2 2 13 1 2 2 2 2 1 3 3 3 2 2 2 2 1 2 2
132 32 2 1 1 4 3 3 3 1 2 2 2 2 13 1 2 2 2 2 1 3 3 3 2 2 2 2 1 2 2
133 33 2 1 1 4 3 3 3 1 2 2 2 2 13 1 2 2 2 2 1 3 3 3 2 2 2 2 1 2 2
134 34 2 1 1 4 3 2 3 1 2 2 2 2 13 1 2 2 2 2 1 3 3 3 2 2 2 2 1 2 2
135 35 2 1 1 4 3 3 3 1 2 2 2 2 13 1 2 2 2 2 1 3 3 3 2 2 2 2 1 2 2
136 36 2 1 1 4 3 3 3 1 2 2 2 2 13 1 2 2 2 2 1 3 3 3 2 2 2 2 1 2 2
137 37 2 1 1 4 3 4 3 1 2 2 2 2 13 1 2 2 2 2 1 3 3 3 2 2 2 2 1 2 2
138 38 2 1 1 4 3 3 3 1 2 2 2 2 13 1 2 2 2 2 1 3 3 3 2 2 2 2 1 2 2

MASTER CHART
139 39 2 1 1 4 3 3 3 1 2 2 2 2 13 1 2 2 2 2 1 3 3 3 2 2 2 2 1 2 2
140 40 2 1 1 4 3 5 3 1 2 2 2 2 13 1 2 2 2 2 1 3 3 3 2 2 2 2 1 2 2
141 31 2 1 1 4 3 4 3 1 2 2 2 2 13 1 2 2 2 2 1 3 3 3 2 3 2 2 1 2 2
142 32 2 1 1 4 3 3 3 1 2 2 2 2 13 1 2 2 2 2 1 3 3 3 2 3 2 2 1 2 2
143 33 2 1 1 4 3 3 3 1 2 2 2 2 13 1 2 2 2 2 1 3 3 3 2 3 2 2 2 2 2
144 34 2 1 1 4 3 6 3 1 2 2 2 2 13 1 2 2 2 2 1 3 3 3 2 3 2 2 2 2 2
145 35 2 1 1 4 3 6 3 1 2 2 2 2 13 1 2 2 2 2 1 3 3 3 2 3 2 2 2 2 2
146 36 2 1 1 4 3 5 3 1 2 2 2 2 13 1 2 2 2 2 1 3 3 3 2 3 2 2 2 2 2
147 37 2 1 1 4 3 5 3 1 2 2 2 2 13 1 2 2 2 2 1 3 3 3 2 3 2 2 2 2 2
148 38 2 1 1 4 3 5 3 1 2 2 2 2 13 1 2 2 2 2 1 3 3 3 2 3 2 2 2 2 2
149 39 2 1 1 4 3 4 3 1 2 2 2 2 13 1 2 2 2 2 1 3 3 3 2 3 2 2 2 2 2
150 40 2 1 1 4 3 3 3 1 2 2 2 2 13 1 2 2 2 2 1 3 3 3 2 3 2 2 2 2 2
151 41 2 1 1 4 3 4 3 1 2 2 2 2 13 1 2 2 2 2 1 3 3 3 2 3 2 2 2 2 2
152 42 2 1 1 4 3 2 2 1 2 2 2 2 13 1 2 2 2 2 1 3 3 3 2 3 2 2 2 2 2
153 43 2 1 1 4 3 3 1 1 2 2 2 2 13 1 2 2 2 2 1 3 3 3 2 3 2 2 2 2 2
154 44 2 1 1 4 3 3 3 5 2 2 2 2 13 1 2 2 2 2 1 3 3 3 2 3 2 2 2 2 2
155 45 2 1 1 4 3 4 3 1 2 2 2 2 13 1 2 2 2 2 1 3 3 3 2 3 2 2 2 2 2
156 46 2 1 1 4 3 3 3 1 2 2 2 2 13 1 2 2 2 2 1 3 3 3 2 3 2 2 2 2 2
157 47 2 1 1 4 3 3 3 1 2 2 2 2 13 1 2 2 2 2 1 3 3 3 2 3 2 2 2 2 2
158 48 2 1 1 4 3 4 3 1 2 2 2 2 13 1 2 2 2 2 1 3 3 3 2 3 2 2 2 2 2
159 49 2 1 1 4 3 3 3 1 2 2 2 2 13 1 2 2 2 2 1 3 3 3 2 3 2 2 2 2 2
160 50 2 1 1 4 3 5 3 1 2 2 2 2 14 1 2 2 2 2 1 3 3 3 2 3 2 2 2 2 2
161 41 2 1 1 4 4 6 3 1 2 2 2 2 14 1 2 2 2 2 1 3 3 3 2 3 2 2 2 2 2
162 42 2 1 1 4 4 4 3 1 2 2 2 2 14 1 2 2 2 2 1 3 3 3 2 3 2 2 2 2 2
163 43 2 1 1 4 4 5 3 1 2 2 2 2 14 1 2 2 2 2 1 3 3 3 2 3 2 2 2 2 2
164 44 2 1 1 4 4 2 3 1 2 2 2 2 14 1 2 2 2 2 1 3 3 3 2 3 2 2 2 2 2
165 45 2 2 1 4 4 5 3 4 2 2 2 2 14 1 2 2 2 2 1 4 4 4 2 4 2 2 2 2 2
166 46 2 1 1 5 4 4 3 1 2 2 2 2 14 1 2 2 2 2 1 4 4 4 2 4 2 2 2 2 2
167 47 2 1 1 5 4 4 3 1 2 2 2 2 14 1 2 2 2 2 1 4 4 4 2 4 2 2 2 2 2
168 48 2 1 1 5 4 3 3 1 2 2 2 2 14 1 2 2 2 2 1 4 4 4 2 4 2 2 2 2 2
169 49 2 1 1 5 4 3 3 1 2 2 2 2 14 1 2 2 2 2 1 4 4 4 2 4 2 2 2 2 2
170 50 2 2 1 5 4 5 3 1 2 2 2 2 14 1 2 2 2 2 1 4 4 4 2 4 2 2 2 2 2
171 41 2 1 1 5 4 3 3 1 2 2 2 2 14 1 2 2 2 2 1 4 4 4 2 4 2 2 2 2 2
172 42 2 1 1 5 4 3 3 1 2 2 2 2 14 1 2 2 2 2 1 4 4 4 2 4 2 2 2 2 2
173 43 2 1 1 5 4 4 3 1 2 2 2 2 14 1 2 2 2 2 1 4 4 4 2 4 2 2 2 2 2
174 44 2 1 1 5 4 2 3 1 2 2 2 2 14 1 2 2 2 2 1 4 4 4 2 4 2 2 2 2 2
175 45 3 1 1 5 4 3 3 1 2 2 2 2 14 1 2 2 2 2 1 4 4 4 2 4 2 2 2 2 2
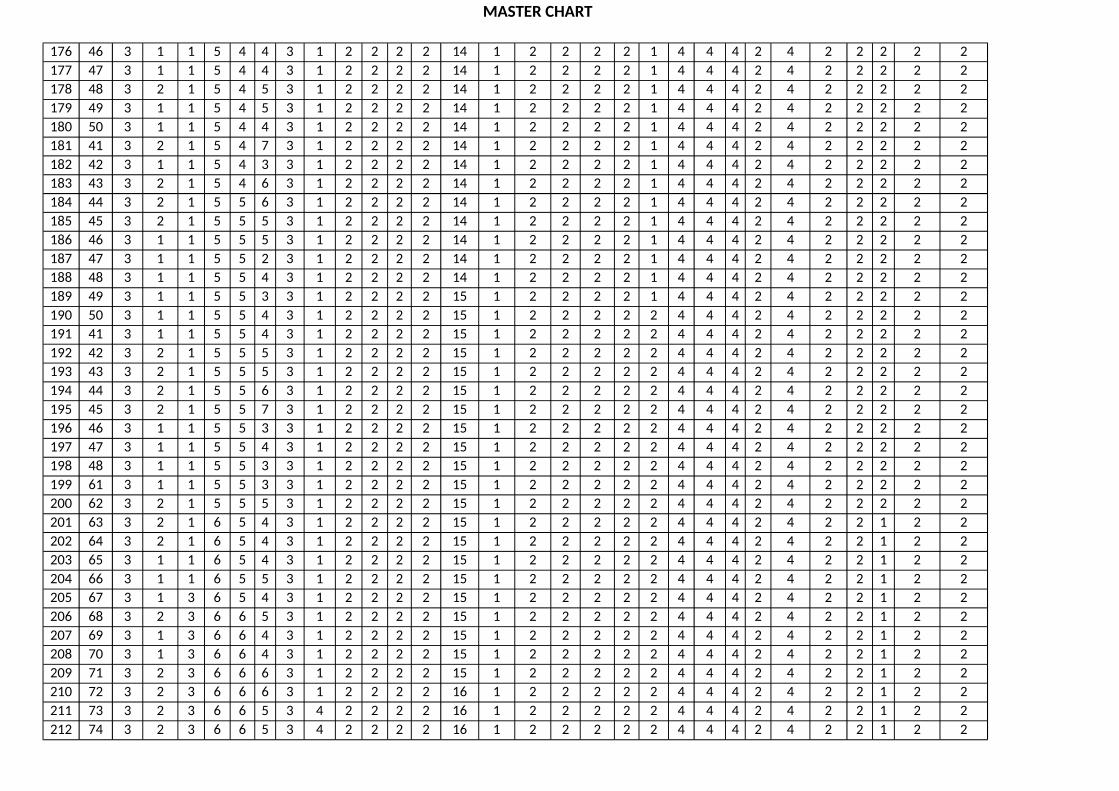
MASTER CHART
176 46 3 1 1 5 4 4 3 1 2 2 2 2 14 1 2 2 2 2 1 4 4 4 2 4 2 2 2 2 2
177 47 3 1 1 5 4 4 3 1 2 2 2 2 14 1 2 2 2 2 1 4 4 4 2 4 2 2 2 2 2
178 48 3 2 1 5 4 5 3 1 2 2 2 2 14 1 2 2 2 2 1 4 4 4 2 4 2 2 2 2 2
179 49 3 1 1 5 4 5 3 1 2 2 2 2 14 1 2 2 2 2 1 4 4 4 2 4 2 2 2 2 2
180 50 3 1 1 5 4 4 3 1 2 2 2 2 14 1 2 2 2 2 1 4 4 4 2 4 2 2 2 2 2
181 41 3 2 1 5 4 7 3 1 2 2 2 2 14 1 2 2 2 2 1 4 4 4 2 4 2 2 2 2 2
182 42 3 1 1 5 4 3 3 1 2 2 2 2 14 1 2 2 2 2 1 4 4 4 2 4 2 2 2 2 2
183 43 3 2 1 5 4 6 3 1 2 2 2 2 14 1 2 2 2 2 1 4 4 4 2 4 2 2 2 2 2
184 44 3 2 1 5 5 6 3 1 2 2 2 2 14 1 2 2 2 2 1 4 4 4 2 4 2 2 2 2 2
185 45 3 2 1 5 5 5 3 1 2 2 2 2 14 1 2 2 2 2 1 4 4 4 2 4 2 2 2 2 2
186 46 3 1 1 5 5 5 3 1 2 2 2 2 14 1 2 2 2 2 1 4 4 4 2 4 2 2 2 2 2
187 47 3 1 1 5 5 2 3 1 2 2 2 2 14 1 2 2 2 2 1 4 4 4 2 4 2 2 2 2 2
188 48 3 1 1 5 5 4 3 1 2 2 2 2 14 1 2 2 2 2 1 4 4 4 2 4 2 2 2 2 2
189 49 3 1 1 5 5 3 3 1 2 2 2 2 15 1 2 2 2 2 1 4 4 4 2 4 2 2 2 2 2
190 50 3 1 1 5 5 4 3 1 2 2 2 2 15 1 2 2 2 2 2 4 4 4 2 4 2 2 2 2 2
191 41 3 1 1 5 5 4 3 1 2 2 2 2 15 1 2 2 2 2 2 4 4 4 2 4 2 2 2 2 2
192 42 3 2 1 5 5 5 3 1 2 2 2 2 15 1 2 2 2 2 2 4 4 4 2 4 2 2 2 2 2
193 43 3 2 1 5 5 5 3 1 2 2 2 2 15 1 2 2 2 2 2 4 4 4 2 4 2 2 2 2 2
194 44 3 2 1 5 5 6 3 1 2 2 2 2 15 1 2 2 2 2 2 4 4 4 2 4 2 2 2 2 2
195 45 3 2 1 5 5 7 3 1 2 2 2 2 15 1 2 2 2 2 2 4 4 4 2 4 2 2 2 2 2
196 46 3 1 1 5 5 3 3 1 2 2 2 2 15 1 2 2 2 2 2 4 4 4 2 4 2 2 2 2 2
197 47 3 1 1 5 5 4 3 1 2 2 2 2 15 1 2 2 2 2 2 4 4 4 2 4 2 2 2 2 2
198 48 3 1 1 5 5 3 3 1 2 2 2 2 15 1 2 2 2 2 2 4 4 4 2 4 2 2 2 2 2
199 61 3 1 1 5 5 3 3 1 2 2 2 2 15 1 2 2 2 2 2 4 4 4 2 4 2 2 2 2 2
200 62 3 2 1 5 5 5 3 1 2 2 2 2 15 1 2 2 2 2 2 4 4 4 2 4 2 2 2 2 2
201 63 3 2 1 6 5 4 3 1 2 2 2 2 15 1 2 2 2 2 2 4 4 4 2 4 2 2 1 2 2
202 64 3 2 1 6 5 4 3 1 2 2 2 2 15 1 2 2 2 2 2 4 4 4 2 4 2 2 1 2 2
203 65 3 1 1 6 5 4 3 1 2 2 2 2 15 1 2 2 2 2 2 4 4 4 2 4 2 2 1 2 2
204 66 3 1 1 6 5 5 3 1 2 2 2 2 15 1 2 2 2 2 2 4 4 4 2 4 2 2 1 2 2
205 67 3 1 3 6 5 4 3 1 2 2 2 2 15 1 2 2 2 2 2 4 4 4 2 4 2 2 1 2 2
206 68 3 2 3 6 6 5 3 1 2 2 2 2 15 1 2 2 2 2 2 4 4 4 2 4 2 2 1 2 2
207 69 3 1 3 6 6 4 3 1 2 2 2 2 15 1 2 2 2 2 2 4 4 4 2 4 2 2 1 2 2
208 70 3 1 3 6 6 4 3 1 2 2 2 2 15 1 2 2 2 2 2 4 4 4 2 4 2 2 1 2 2
209 71 3 2 3 6 6 6 3 1 2 2 2 2 15 1 2 2 2 2 2 4 4 4 2 4 2 2 1 2 2
210 72 3 2 3 6 6 6 3 1 2 2 2 2 16 1 2 2 2 2 2 4 4 4 2 4 2 2 1 2 2
211 73 3 2 3 6 6 5 3 4 2 2 2 2 16 1 2 2 2 2 2 4 4 4 2 4 2 2 1 2 2
212 74 3 2 3 6 6 5 3 4 2 2 2 2 16 1 2 2 2 2 2 4 4 4 2 4 2 2 1 2 2

MASTER CHART
213 75 3 2 3 6 6 5 3 1 2 2 2 2 16 1 2 2 2 2 2 4 4 4 2 4 2 2 1 2 2
214 76 3 1 3 6 6 3 3 1 2 2 2 2 16 1 2 2 2 2 2 4 4 4 2 4 2 2 1 2 2
215 77 3 2 3 6 6 5 3 4 2 2 2 2 16 1 2 2 2 2 2 4 4 4 2 4 2 2 1 2 2
216 78 3 1 3 6 6 4 3 1 2 2 2 2 16 1 2 2 2 2 2 4 4 4 2 4 2 2 1 2 2
217 79 3 2 3 6 6 6 3 1 2 2 2 2 16 1 2 2 2 2 2 4 4 4 2 4 2 2 1 2 2
218 80 3 1 3 6 7 4 3 1 2 2 2 2 16 1 2 2 2 2 2 4 4 4 2 4 2 2 1 2 2
219 81 3 1 3 6 7 4 3 1 2 2 2 2 16 1 2 2 2 2 2 4 4 4 2 4 2 2 1 2 2
220 82 3 1 3 6 7 5 3 1 2 2 2 2 16 1 2 2 2 2 2 4 4 4 2 4 1 2 1 1 2
221 83 3 1 3 6 7 3 3 1 2 2 2 2 16 1 2 2 2 2 2 4 4 4 2 4 1 1 1 1 2
222 84 3 1 3 6 7 3 3 1 2 2 2 2 16 1 2 2 2 2 2 4 4 4 2 4 1 1 1 1 2
223 85 3 1 3 6 7 5 3 1 2 2 2 2 16 1 2 2 2 2 2 4 4 4 2 4 1 1 1 1 2
224 86 3 2 3 6 7 4 3 4 2 2 2 2 16 1 2 2 2 2 2 4 4 4 2 4 1 1 1 1 2
225 87 3 1 3 6 7 4 3 1 2 2 2 2 16 1 2 2 1 1 2 1 1 1 1 4 1 1 1 1 2
226 88 3 2 3 6 7 5 3 1 2 1 2 2 16 1 2 1 2 2 2 1 1 1 1 4 1 1 1 1 2
227 89 3 2 3 6 7 4 3 1 2 1 2 2 16 1 2 1 1 1 2 1 1 1 1 4 1 1 1 1 2
228 61 3 2 3 6 7 5 3 1 2 1 2 2 16 1 2 1 1 1 2 1 1 1 1 4 1 1 1 1 2
229 62 3 2 3 6 7 5 3 1 2 1 2 2 16 1 2 1 1 1 2 1 1 1 1 4 1 1 1 1 2
230 63 3 2 3 6 7 2 3 1 2 1 2 2 16 1 2 1 1 1 2 1 1 1 1 4 1 1 1 1 1
231 64 3 2 3 6 7 2 3 1 2 1 2 2 16 1 2 1 1 1 2 1 1 1 1 4 1 1 1 1 1
232 65 3 2 3 6 7 2 3 1 2 1 2 2 16 1 2 1 1 1 2 1 1 1 1 4 1 1 1 1 1
233 66 1 2 1 1 1 4 3 1 2 1 1 1 16 1 1 1 1 1 2 1 1 1 1 1 1 1 1 1 1
234 67 1 2 1 1 1 4 3 1 2 1 1 1 16 1 1 1 1 1 2 1 1 1 1 1 1 1 1 1 1
235 68 1 2 1 1 1 5 3 1 2 1 1 1 16 1 1 1 1 1 2 1 1 1 2 1 1 1 1 1 1
236 69 1 2 1 1 1 9 3 1 2 1 1 1 16 1 1 1 1 1 2 1 1 1 2 1 1 1 1 1 1
237 70 1 2 1 1 1 4 3 1 2 1 1 1 16 1 1 1 1 1 2 1 1 1 2 1 1 1 1 1 1
238 71 1 2 1 1 1 4 3 1 2 1 1 1 16 1 1 1 1 1 2 1 1 1 2 1 1 1 1 1 1
239 72 1 2 1 1 1 4 3 1 2 1 1 1 16 1 1 1 1 1 2 1 1 1 2 1 1 1 1 1 1
240 73 1 2 1 1 1 5 3 1 2 1 1 1 16 1 1 1 1 1 2 1 1 1 2 1 1 1 1 1 1
241 74 1 2 1 1 1 1 3 1 2 1 1 1 17 1 1 1 1 1 2 1 1 1 2 1 1 1 1 1 1
242 75 1 2 1 1 1 1 3 1 2 1 1 1 17 1 1 1 1 1 2 1 1 1 2 1 1 1 1 1 1
243 53 1 2 1 1 1 2 3 1 2 1 1 1 17 1 1 1 1 1 2 1 1 1 2 1 1 1 1 1 1
244 54 1 2 1 1 1 4 3 1 2 1 1 1 17 1 1 1 1 1 2 1 1 1 2 1 1 1 1 1 1
245 55 1 2 1 1 1 4 3 1 2 1 1 1 17 1 1 1 1 1 2 1 1 1 2 1 1 1 1 1 1
246 56 1 2 1 1 1 4 3 1 2 1 1 1 17 1 1 1 1 1 2 1 1 1 2 1 1 1 1 1 1
247 57 1 2 1 1 1 4 3 1 2 1 1 1 17 1 1 1 1 1 2 1 1 1 2 1 1 1 1 1 1
248 58 1 2 1 1 1 4 3 1 2 1 1 1 17 1 1 1 1 1 2 1 1 1 2 1 1 1 1 1 1
249 59 1 2 1 1 1 4 3 1 2 1 1 1 17 1 1 2 1 1 2 1 1 1 2 1 1 1 1 1 1

MASTER CHART
250 60 1 2 1 1 1 4 3 1 2 1 1 1 17 1 1 2 1 1 2 1 1 1 2 1 1 1 1 1 1
251 51 1 2 1 1 1 2 3 1 2 1 1 1 17 1 1 2 1 1 2 1 1 1 2 1 1 1 1 1 1
252 52 1 2 1 1 1 3 3 1 2 1 1 1 17 1 1 2 1 1 2 1 1 1 2 1 1 1 1 1 1
253 53 1 2 1 1 1 6 3 1 2 1 1 1 17 1 1 2 1 1 2 1 1 1 2 1 1 1 1 1 1
254 54 1 2 1 1 1 5 3 1 2 1 1 1 17 1 1 2 1 1 2 1 1 1 2 1 1 1 1 1 1
255 55 1 2 1 1 1 9 3 1 2 1 1 1 17 1 1 2 2 2 2 1 1 1 2 1 1 1 1 1 1
256 56 1 2 1 1 1 4 3 1 2 1 1 1 17 1 1 2 1 1 2 1 1 1 2 1 1 1 1 1 1
257 71 1 2 1 1 1 3 3 1 2 1 1 1 17 1 1 2 1 1 2 1 1 1 2 1 1 1 1 1 1
258 71 1 2 1 1 1 2 3 1 2 1 1 1 17 1 1 2 2 2 2 1 1 1 2 1 1 1 1 1 1
259 71 1 2 1 1 1 2 3 1 2 1 1 1 17 2 1 2 2 2 2 1 1 1 2 1 1 1 1 1 1
260 71 1 2 1 1 1 4 3 1 2 1 1 1 17 2 1 2 1 1 2 1 1 1 2 1 1 1 1 1 1
261 81 1 2 1 1 1 6 3 1 2 1 1 1 17 2 1 2 1 1 2 1 1 1 2 1 1 1 1 1 1
262 81 1 2 1 2 1 5 3 1 2 1 1 1 17 2 1 2 2 2 2 1 1 1 2 1 1 1 1 1 1
263 81 1 2 1 2 1 6 3 1 2 1 1 1 17 2 1 2 1 1 2 1 1 1 2 1 1 1 1 1 1
264 62 1 2 1 2 1 3 3 1 2 1 1 1 17 2 1 2 1 1 2 1 1 1 2 1 1 1 1 1 1
265 62 1 2 1 2 1 4 3 1 2 1 1 1 17 2 1 2 1 1 2 1 1 1 2 1 1 1 1 1 1
266 62 1 2 1 2 1 7 3 1 2 1 1 1 17 2 1 2 1 1 2 1 1 1 2 1 1 1 1 1 1
267 62 1 2 1 2 1 5 3 1 2 1 1 1 17 2 1 2 1 1 2 1 1 1 2 1 1 1 1 1 1
268 62 1 2 1 2 1 4 3 1 2 1 1 1 17 2 1 2 1 1 2 1 1 1 2 1 1 1 1 1 1
269 62 1 2 1 2 1 4 3 1 2 1 1 1 17 2 1 2 1 1 2 1 1 1 2 1 1 1 1 1 1
270 61 1 2 1 2 1 5 3 1 2 1 1 1 18 2 1 2 1 1 2 1 1 1 2 1 1 1 1 1 1
271 61 1 2 1 2 1 5 3 1 2 1 1 1 18 2 1 2 1 1 2 1 1 1 2 1 1 1 1 1 1
272 61 1 2 1 2 1 6 3 1 2 1 1 1 18 2 1 2 2 2 2 1 1 1 2 1 1 1 1 1 1
273 61 1 2 1 2 1 6 3 1 2 1 1 1 18 2 1 2 1 1 2 1 1 1 2 1 1 1 1 1 1
274 61 1 2 1 2 1 3 3 1 2 1 1 1 18 2 1 2 1 1 2 1 1 1 2 1 1 1 1 1 1
275 61 1 2 1 2 2 3 3 1 2 1 1 1 18 2 1 2 1 1 2 1 1 1 2 1 1 1 1 1 1
276 51 1 2 1 2 2 9 3 1 2 1 1 1 18 2 1 2 2 2 2 1 1 1 2 1 1 1 1 1 1
277 25 1 2 1 2 2 3 3 1 2 1 1 1 18 2 1 2 1 1 2 1 1 1 2 1 1 1 1 1 1
278 25 1 2 1 2 2 4 3 1 2 1 1 1 18 2 1 2 1 1 2 1 1 1 2 1 1 1 1 1 1
279 25 1 2 1 2 2 4 3 1 2 1 1 1 18 2 1 2 1 1 2 1 1 1 2 1 1 1 1 1 1
280 25 1 2 1 2 2 4 3 1 2 1 1 1 18 2 1 2 1 1 2 2 2 2 2 1 1 1 1 1 1
281 25 1 2 1 2 2 4 3 1 2 1 1 1 18 2 1 2 1 1 2 2 2 2 2 1 1 1 1 1 1
282 25 1 2 1 2 2 3 3 1 2 1 1 1 18 2 1 2 1 1 2 2 2 2 2 1 1 1 1 1 1
283 25 1 2 1 2 2 5 3 1 2 1 1 1 18 2 1 2 1 1 2 2 2 2 2 1 1 1 1 1 1
284 24 1 2 1 2 2 4 3 1 2 1 1 1 18 2 1 2 1 1 2 2 2 2 2 1 1 1 1 1 1
285 24 1 2 1 2 2 4 3 1 2 1 1 1 18 2 1 2 2 2 2 2 2 2 2 1 1 1 1 1 1
286 24 1 2 1 2 2 4 3 1 2 1 1 1 18 2 1 2 2 2 2 2 2 2 2 1 1 1 1 1 1

MASTER CHART
287 24 1 2 1 2 2 6 3 1 2 1 1 1 18 2 1 2 2 2 2 2 2 2 2 1 1 1 1 1 1
288 24 1 2 1 2 2 2 3 1 2 1 1 1 18 2 1 2 2 2 2 2 2 2 2 1 1 1 1 1 1
289 24 1 2 1 3 2 8 3 1 2 1 1 1 18 2 1 2 2 2 2 2 2 2 2 1 1 1 1 1 1
290 23 1 2 1 3 2 5 3 1 2 1 1 1 18 2 1 2 2 2 2 2 2 2 2 1 1 1 1 1 1
291 23 1 2 1 3 2 7 3 1 2 1 1 1 18 2 1 2 2 2 2 2 2 2 2 1 1 1 1 1 1
292 23 1 2 1 3 2 7 3 1 2 1 1 1 18 2 1 2 2 2 2 2 2 2 2 1 1 1 1 1 1
293 23 1 2 1 3 2 7 3 1 2 1 1 1 18 2 1 2 2 2 2 2 2 2 2 1 1 1 1 1 1
294 23 1 2 1 3 2 6 3 1 2 1 1 1 18 2 1 2 2 2 2 2 2 2 2 1 2 1 1 1 1
295 23 1 2 1 3 2 3 3 1 2 1 1 1 18 2 1 2 2 2 2 2 2 2 2 1 2 1 1 1 1
296 22 1 2 1 3 2 8 3 1 2 1 1 1 18 2 1 2 2 2 2 2 2 2 2 1 2 1 1 1 1
297 22 1 2 1 3 2 8 3 1 2 1 1 1 18 2 1 2 2 2 2 2 2 2 2 1 2 1 1 1 1
298 22 1 2 1 3 2 3 3 1 2 1 1 1 18 2 1 2 2 2 2 2 2 2 2 1 2 1 1 1 1
299 22 1 2 1 3 2 4 3 1 2 1 1 1 18 2 1 2 2 2 2 2 2 2 2 1 2 1 1 1 1
300 22 1 2 1 3 2 3 3 1 2 1 1 1 19 2 1 2 2 2 2 2 2 2 2 1 2 1 1 1 1
301 22 1 2 1 3 2 3 3 1 2 1 1 1 19 2 1 2 2 2 2 2 2 2 2 2 2 1 1 1 1
302 21 1 2 1 3 2 5 3 1 2 1 1 1 19 2 1 2 2 2 2 2 2 2 2 2 2 1 1 1 1
303 21 1 2 1 3 2 2 3 1 2 1 1 1 19 2 1 2 2 2 2 2 2 2 2 2 2 1 1 1 1
304 21 1 2 1 3 2 4 3 1 2 1 1 1 19 2 1 2 2 2 2 2 2 2 2 2 2 1 1 1 1
305 21 1 2 1 3 2 2 3 1 2 1 1 1 19 2 1 2 2 2 2 2 2 2 2 2 2 1 1 1 1
306 21 1 2 1 3 2 4 3 1 2 1 1 1 19 2 1 2 2 2 2 2 2 2 2 2 2 1 1 1 1
307 20 1 2 1 3 2 4 3 1 2 1 1 1 19 2 1 2 2 2 2 2 2 2 2 2 2 1 1 1 1
308 20 1 2 1 3 2 5 3 1 2 1 1 1 19 2 1 2 2 2 2 2 2 2 2 2 2 1 1 1 1
309 20 1 2 1 3 2 6 3 1 2 1 1 1 19 2 1 2 2 2 2 2 2 2 2 2 2 1 1 1 1
310 20 1 2 1 3 2 6 3 1 2 1 1 1 19 2 1 2 2 2 2 2 2 2 2 2 2 1 1 1 1
311 20 1 2 1 3 2 1 3 1 2 1 1 1 19 2 1 2 2 2 2 2 2 2 2 2 2 1 1 1 1
312 19 1 2 1 3 3 6 3 1 2 1 1 1 19 2 1 2 2 2 2 2 2 2 2 2 2 1 1 1 1
313 19 1 2 1 3 3 4 3 1 2 1 1 2 19 2 1 2 2 2 2 2 2 2 2 2 2 1 1 1 1
314 19 1 2 1 3 3 6 3 1 2 1 1 2 19 2 1 2 2 2 2 2 2 2 2 2 2 1 1 1 1
315 19 1 2 1 3 3 5 3 1 2 1 1 2 19 2 1 2 2 2 2 2 2 2 2 2 2 1 1 1 1
316 19 1 2 1 3 3 4 3 1 2 2 1 2 13 2 1 2 2 2 2 2 2 2 2 2 2 1 1 1 1
317 19 1 2 1 3 3 6 3 1 2 2 1 2 13 2 1 2 2 2 2 2 2 2 2 2 2 1 1 1 1
318 18 1 2 1 3 3 8 3 1 2 2 1 2 13 2 1 2 2 2 2 2 2 2 2 2 2 1 1 1 1
319 18 1 2 1 3 3 6 3 1 2 2 1 2 13 2 1 2 2 2 2 2 2 2 2 2 2 1 1 1 1
320 18 1 2 1 4 3 4 3 1 2 2 1 2 13 2 1 2 2 2 2 2 2 2 2 2 2 1 2 1 1
321 18 1 2 1 4 3 4 3 1 2 2 2 2 13 2 2 2 2 2 2 2 2 2 2 2 2 1 2 1 1
322 18 1 2 1 4 3 4 3 1 2 2 2 2 13 2 2 2 2 2 2 2 2 2 2 2 2 1 2 1 1
323 18 1 2 1 4 3 5 3 1 2 2 2 2 13 2 2 2 2 2 2 2 2 2 2 2 2 1 2 1 1

MASTER CHART
324 38 1 2 1 4 3 4 3 1 2 2 2 2 13 2 2 2 2 2 2 2 2 2 2 2 2 1 2 1 1
325 38 1 2 1 4 3 4 3 1 2 2 2 2 13 2 2 2 2 2 2 2 2 2 2 2 2 1 2 1 1
326 38 1 2 1 4 3 6 3 1 2 2 2 2 14 2 2 2 2 2 2 2 2 2 2 2 2 1 2 1 1
327 38 2 2 1 4 3 4 3 1 2 2 2 2 14 2 2 2 2 2 2 2 2 2 2 2 2 1 2 1 1
328 38 2 2 1 4 3 5 3 1 2 2 2 2 14 2 2 2 2 2 2 2 2 2 2 2 2 1 2 1 1
329 37 2 2 1 4 3 4 3 1 2 2 2 2 14 2 2 2 2 2 2 2 2 2 2 2 2 1 2 1 1
330 37 2 2 1 4 3 4 3 1 2 2 2 2 14 2 2 2 2 2 2 2 2 2 2 2 2 1 2 1 1
331 37 2 2 1 4 3 4 3 1 2 2 2 2 14 2 2 2 2 2 2 2 2 2 2 2 2 1 2 1 1
332 37 2 2 1 4 3 4 3 1 2 2 2 2 14 2 2 2 2 2 2 2 2 2 2 2 2 1 2 1 1
333 37 2 2 1 4 3 5 3 1 2 2 2 2 14 2 2 2 2 2 2 2 2 2 2 2 2 1 2 1 1
334 36 2 2 1 4 3 2 3 1 2 2 2 2 14 2 2 2 2 2 2 2 2 2 2 2 2 1 2 1 1
335 36 2 2 1 4 3 4 3 1 2 2 2 2 13 2 2 2 2 2 2 3 3 3 2 2 2 1 2 1 1
336 36 2 2 1 4 3 2 3 1 2 2 2 2 13 2 2 2 2 2 2 3 3 3 2 2 2 1 2 1 1
337 36 2 2 1 4 3 3 3 1 2 2 2 2 13 2 2 2 2 2 2 3 3 3 2 2 2 1 2 1 1
338 36 2 2 1 4 3 3 3 1 2 2 2 2 15 2 2 2 2 2 2 3 3 3 2 2 2 1 2 1 1
339 36 2 2 1 4 3 4 3 1 2 2 2 2 15 2 2 2 2 2 2 3 3 3 2 2 2 1 2 1 1
340 35 2 2 1 4 3 3 3 1 2 2 2 2 15 2 2 2 2 2 2 3 3 3 2 2 2 1 2 2 1
341 35 2 2 1 4 3 3 3 1 2 2 2 2 15 2 2 2 2 2 2 3 3 3 2 2 2 1 2 2 1
342 35 2 2 1 4 3 5 3 1 2 2 2 2 15 2 2 2 2 2 2 3 3 3 2 2 2 1 2 2 1
343 35 2 2 1 4 3 4 3 1 2 2 2 2 15 2 2 2 2 2 2 3 3 3 2 2 2 1 2 2 1
344 35 2 2 1 4 3 4 3 1 2 2 2 2 15 2 2 2 2 2 2 3 3 3 2 2 2 1 2 2 1
345 34 2 2 1 4 3 5 3 1 2 2 2 2 13 2 2 2 2 2 2 3 3 3 2 2 2 1 2 2 1
346 34 2 2 1 4 3 7 3 1 2 2 2 2 13 2 2 2 2 2 2 3 3 3 2 2 2 1 2 2 1
347 34 2 2 1 4 3 2 3 1 2 2 2 2 13 2 2 2 2 2 2 3 3 3 2 2 2 1 2 2 1
348 34 2 2 1 4 3 2 3 1 2 2 2 2 16 2 2 2 2 2 2 3 3 3 2 2 2 1 2 2 1
349 34 2 2 2 4 3 2 3 1 2 2 2 2 16 2 2 2 2 2 2 3 3 3 2 2 2 1 2 2 1
350 34 2 2 2 4 3 1 3 1 2 2 2 2 16 2 2 2 2 2 2 3 3 3 2 2 2 1 2 2 2
351 33 2 2 2 4 3 3 3 1 2 2 2 2 16 2 2 2 2 2 2 3 3 3 2 3 2 1 2 2 2
352 33 2 2 2 4 3 5 3 1 2 2 2 2 16 2 2 2 2 2 2 3 3 3 2 3 2 1 2 2 2
353 33 2 2 2 4 3 4 3 1 2 2 2 2 16 2 2 2 2 2 2 3 3 3 2 3 2 1 2 2 2
354 33 2 2 2 4 3 4 3 1 2 2 2 2 16 2 2 2 2 2 2 3 3 3 2 3 2 1 2 2 2
355 33 2 2 2 4 3 3 3 1 2 2 2 2 13 2 2 2 2 2 2 3 3 3 2 3 2 1 2 2 2
356 33 2 2 2 4 3 3 3 1 2 2 2 2 13 2 2 2 2 2 2 3 3 3 2 3 2 1 2 2 2
357 32 2 2 2 4 3 2 3 1 2 2 2 2 13 2 2 2 2 2 2 3 3 3 2 3 2 1 2 2 2
358 32 2 2 2 4 3 3 3 1 2 2 2 2 14 2 2 2 2 2 2 3 3 3 2 3 2 1 2 2 2
359 32 2 2 2 4 4 2 3 1 2 2 2 2 14 2 2 2 2 2 2 3 3 3 2 3 2 1 2 2 2
360 32 2 2 2 4 4 2 3 1 2 2 2 2 14 2 2 2 2 2 2 3 3 3 2 3 2 1 2 2 2

MASTER CHART
361 32 2 2 2 4 4 2 3 1 2 2 2 2 14 2 2 2 2 2 2 3 3 3 2 3 2 1 2 2 2
362 32 2 2 2 4 4 3 3 1 2 2 2 2 14 2 2 2 2 2 2 3 3 3 2 3 2 1 2 2 2
363 31 2 2 2 4 4 3 3 1 2 2 2 2 14 2 2 2 2 2 2 3 3 3 2 3 2 1 2 2 2
364 31 2 2 2 4 4 3 3 1 2 2 2 2 14 2 2 2 2 2 2 3 3 3 2 3 2 1 2 2 2
365 31 2 2 2 4 4 7 3 1 2 2 2 2 14 2 2 2 2 2 2 3 3 3 2 3 2 1 2 2 2
366 31 2 2 2 4 4 2 3 1 2 2 2 2 14 2 2 2 2 2 2 3 3 3 2 3 2 1 2 2 2
367 31 2 2 2 4 4 5 3 1 2 2 2 2 13 2 2 2 2 2 2 3 3 3 2 3 2 1 2 2 2
368 31 2 2 2 4 4 3 3 1 2 2 2 2 13 2 2 2 2 2 2 3 3 3 2 3 2 1 2 2 2
369 31 2 2 2 4 4 3 3 1 2 2 2 2 13 2 2 2 2 2 2 3 3 3 2 3 2 1 2 2 2
370 30 2 2 2 4 4 3 3 1 2 2 2 2 15 2 2 2 2 2 2 3 3 3 2 3 2 1 2 2 2
371 30 2 2 2 4 4 2 3 1 2 2 2 2 15 2 2 2 2 2 2 3 3 3 2 3 2 2 2 2 2
372 30 2 2 2 4 4 1 3 1 2 2 2 2 15 2 2 2 2 2 2 3 3 3 2 3 2 2 2 2 2
373 30 2 2 2 4 4 5 3 1 2 2 2 2 15 2 2 2 2 2 2 3 3 3 2 3 2 2 2 2 2
374 30 2 2 2 4 4 3 3 1 2 2 2 2 15 2 2 2 2 2 2 3 3 3 2 3 2 2 2 2 2
375 30 2 2 2 4 4 4 3 1 2 2 2 2 15 2 2 2 2 2 2 3 3 3 2 3 2 2 2 2 2
376 29 2 2 2 4 4 3 3 1 2 2 2 2 15 2 2 2 2 2 2 3 3 3 2 3 2 2 2 2 2
377 29 2 2 2 4 4 1 3 1 2 2 2 2 15 2 2 2 2 2 2 3 3 3 2 3 2 2 2 2 2
378 29 2 2 2 4 4 2 3 1 2 2 2 2 15 2 2 2 2 2 2 3 3 3 2 3 2 2 2 2 2
379 29 2 2 2 4 4 2 3 1 2 2 2 2 13 2 2 2 2 2 2 3 3 3 2 3 2 2 2 2 2
380 29 2 2 2 4 4 5 3 1 2 2 2 2 13 2 2 2 2 2 2 3 3 3 2 3 2 2 2 2 2
381 29 2 2 2 4 4 5 3 1 2 2 2 2 13 2 2 2 2 2 2 3 3 3 2 3 2 2 2 2 2
382 28 2 2 2 4 4 2 3 1 2 2 2 2 16 2 2 2 2 2 2 3 3 3 2 3 2 2 2 2 2
383 28 2 2 2 4 4 3 3 1 2 2 2 2 16 2 2 2 2 2 2 3 3 3 2 3 2 2 2 2 2
384 28 2 2 2 4 4 2 3 1 2 2 2 2 16 2 2 2 2 2 2 3 3 3 2 3 2 2 2 2 2
385 28 2 2 2 4 4 2 3 1 2 2 2 2 16 2 2 2 2 2 2 3 3 3 2 3 2 2 2 2 2
386 28 2 2 2 4 4 1 3 1 2 2 2 2 16 2 2 2 2 2 2 3 3 3 2 3 2 2 2 2 2
387 28 2 2 2 4 4 4 3 1 2 2 2 2 16 2 2 2 2 2 2 3 3 3 2 3 2 2 2 2 2
388 28 2 2 2 4 4 2 3 1 2 2 2 2 13 2 2 2 2 2 2 3 3 3 2 3 2 2 2 2 2
389 27 2 2 2 4 4 4 3 1 2 2 2 2 13 2 2 2 2 2 2 3 3 3 2 3 2 2 2 2 2
390 27 2 2 2 4 4 4 3 1 2 2 2 2 13 2 2 2 2 2 2 4 4 4 2 3 2 2 2 2 2
391 27 2 2 2 5 4 2 3 1 2 2 2 2 14 2 2 2 2 2 2 4 4 4 2 3 2 2 2 2 2
392 27 2 2 2 5 4 6 3 1 2 2 2 2 14 2 2 2 2 2 2 4 4 4 2 4 2 2 2 2 2
393 27 2 2 2 5 4 6 3 1 2 2 2 2 14 2 2 2 2 2 2 4 4 4 2 4 2 2 2 2 2
394 27 2 2 2 5 4 4 3 1 2 2 2 2 14 2 2 2 2 2 2 4 4 4 2 4 2 2 2 2 2
395 26 2 2 2 5 4 6 3 1 2 2 2 2 14 2 2 2 2 2 2 4 4 4 2 4 2 2 2 2 2
396 26 2 2 2 5 4 2 3 1 2 2 2 2 14 2 2 2 2 2 2 4 4 4 2 4 2 2 2 2 2
397 26 2 2 2 5 4 4 3 1 2 2 2 2 13 2 2 2 2 2 2 4 4 4 2 4 2 2 2 2 2

MASTER CHART
398 26 2 2 2 5 4 1 3 1 2 2 2 2 13 2 2 2 2 2 2 4 4 4 2 4 2 2 2 2 2
399 26 2 2 2 5 4 4 3 1 2 2 2 2 13 2 2 2 2 2 2 4 4 4 2 4 2 2 2 2 2
400 26 2 2 2 5 4 5 3 1 2 2 2 2 15 2 2 2 2 2 2 4 4 4 2 4 2 2 2 2 2
401 26 3 2 2 5 4 6 3 1 2 2 2 2 15 2 2 2 2 2 2 4 4 4 2 4 2 2 2 2 2
402 25 3 2 2 5 4 3 3 1 2 2 2 2 15 2 2 2 2 2 2 4 4 4 2 4 2 2 2 2 2
403 25 3 2 2 5 4 10 3 1 2 2 2 2 15 2 2 2 2 2 2 4 4 4 2 4 2 2 2 2 2
404 25 3 2 2 5 4 4 3 1 2 2 2 2 15 2 2 2 2 2 2 4 4 4 2 4 2 2 2 2 2
405 25 3 2 2 5 4 4 3 1 2 2 2 2 15 2 2 2 2 2 2 4 4 4 2 4 2 2 2 2 2
406 25 3 2 2 5 4 4 3 1 2 2 2 2 13 2 2 2 2 2 2 4 4 4 2 4 2 2 2 2 2
407 25 3 2 2 5 4 6 3 1 2 2 2 2 13 2 2 2 2 2 2 4 4 4 2 4 2 2 2 2 2
408 25 3 2 2 5 4 2 3 1 2 2 2 2 16 2 2 2 2 2 2 4 4 4 2 4 2 2 2 2 2
409 25 3 2 2 5 4 5 3 1 2 2 2 2 16 2 2 2 2 2 2 4 4 4 2 4 2 2 2 2 2
410 24 3 2 2 5 4 4 3 1 2 2 2 2 16 2 2 2 2 2 2 4 4 4 2 4 2 2 2 2 2
411 24 3 2 2 5 4 4 3 1 2 2 2 2 16 2 2 2 2 2 2 4 4 4 2 4 2 2 2 2 2
412 24 3 2 2 5 4 4 3 1 2 2 2 2 16 2 2 2 2 2 2 4 4 4 2 4 2 2 2 2 2
413 24 3 2 2 5 4 4 3 1 2 2 2 2 16 2 2 2 2 2 2 4 4 4 2 4 2 2 2 2 2
414 24 3 2 2 5 4 2 3 1 2 2 2 2 16 2 2 2 2 2 2 4 4 4 2 4 2 2 2 2 2
415 24 3 2 2 5 4 7 3 1 2 2 2 2 16 2 2 2 2 2 2 4 4 4 2 4 2 2 2 2 2
416 24 3 2 2 5 4 3 3 1 2 2 2 2 13 2 2 2 2 2 2 4 4 4 2 4 2 2 2 2 2
417 23 3 2 2 5 4 1 3 1 2 2 2 2 13 2 2 2 2 2 2 4 4 4 2 4 2 2 2 2 2
418 23 3 2 2 5 4 2 3 1 2 2 2 2 13 2 2 2 2 2 2 4 4 4 2 4 2 2 2 2 2
419 23 3 2 2 5 5 6 3 1 2 2 2 2 14 2 2 2 2 2 2 4 4 4 2 4 2 2 2 2 2
420 23 3 2 2 5 5 5 3 1 2 2 2 2 14 2 2 2 2 2 2 4 4 4 2 4 2 2 2 2 2
421 23 3 2 2 5 5 2 3 1 2 2 2 2 14 2 2 2 2 2 2 4 4 4 2 4 2 2 2 2 2
422 23 3 2 2 5 5 2 3 1 2 2 2 2 14 2 2 2 2 2 2 4 4 4 2 4 2 2 2 2 2
423 23 3 2 2 5 5 2 3 1 2 2 2 2 14 2 2 2 2 2 2 4 4 4 2 4 2 2 2 2 2
424 22 3 2 2 5 5 5 3 1 2 2 2 2 14 2 2 2 2 2 2 4 4 4 2 4 2 2 2 2 2
425 22 3 2 2 5 5 4 3 1 2 2 2 2 14 2 2 2 2 2 2 4 4 4 2 4 2 2 2 2 2
426 22 3 2 2 5 5 2 3 1 2 2 2 2 14 2 2 2 2 2 2 4 4 4 2 4 2 2 2 2 2
427 22 3 2 2 5 5 5 3 1 2 2 2 2 14 2 2 2 2 2 2 4 4 4 2 4 2 2 2 2 2
428 22 3 2 2 5 5 6 3 1 2 2 2 2 13 2 2 2 2 2 2 4 4 4 2 4 2 2 2 2 2
429 22 3 2 2 5 5 5 3 1 2 2 2 2 13 2 2 2 2 2 2 4 4 4 2 4 2 2 2 2 2
430 22 3 2 2 5 5 4 3 1 2 2 2 2 13 2 2 2 2 2 1 4 4 4 2 4 2 2 2 2 2
431 21 3 2 2 5 5 5 3 1 2 2 2 2 13 2 2 2 2 2 1 4 4 4 2 4 2 2 2 2 2
432 21 3 2 2 5 5 4 3 1 2 2 2 2 15 2 2 2 2 2 1 4 4 4 2 4 2 2 2 2 2
433 21 3 2 2 5 5 4 3 1 2 2 2 2 15 2 2 2 2 2 1 4 4 4 2 4 2 2 2 2 2
434 21 3 2 2 6 5 6 3 1 2 2 2 2 15 2 2 2 2 2 1 4 4 4 2 4 2 2 2 2 2

MASTER CHART
435 21 3 2 2 6 5 2 3 1 2 2 2 2 15 2 2 2 2 2 1 4 4 4 2 4 2 2 2 2 2
436 21 3 2 2 6 5 4 3 1 2 2 2 2 15 2 2 2 2 2 1 4 4 4 2 4 2 2 2 2 2
437 21 3 2 2 6 5 2 3 1 2 2 2 2 15 2 2 2 2 2 1 4 4 4 2 4 2 2 2 2 2
438 21 3 2 3 6 5 4 3 1 2 2 2 2 15 2 2 2 2 2 1 4 4 4 2 4 2 2 2 2 2
439 21 3 2 3 6 5 6 3 1 2 2 2 2 15 2 2 2 2 2 1 4 4 4 2 4 2 2 2 2 2
440 20 3 2 3 6 6 3 3 1 2 2 2 2 13 2 2 2 2 2 1 4 4 4 2 4 2 2 2 2 2
441 20 3 2 3 6 6 5 3 1 2 2 2 2 13 2 2 2 2 2 1 4 4 4 2 4 2 2 2 2 2
442 20 3 2 3 6 6 4 3 1 2 2 2 2 13 2 2 2 2 2 1 4 4 4 2 4 2 2 2 2 2
443 20 3 2 3 6 6 5 3 1 2 2 2 2 13 2 2 2 2 2 1 4 4 4 2 4 2 2 2 2 2
444 20 3 2 3 6 6 1 3 1 2 2 2 2 13 2 2 2 2 2 1 4 4 4 2 4 2 2 2 2 2
445 20 3 2 3 6 6 2 3 1 2 2 2 2 13 2 2 2 2 2 1 4 4 4 2 4 2 2 2 2 2
446 20 3 2 3 6 6 4 3 1 2 2 2 2 13 2 2 2 2 2 1 4 4 4 2 4 2 2 2 2 2
447 19 3 2 3 6 6 3 3 1 2 2 2 2 13 2 2 2 2 2 1 4 4 4 2 4 2 2 2 2 2
448 19 3 2 3 6 6 6 3 1 2 2 2 2 13 2 2 2 2 2 1 4 4 4 2 4 2 2 2 2 2
449 19 3 2 3 6 6 4 3 1 2 2 2 2 16 2 2 2 2 2 1 4 4 4 2 4 2 2 2 2 2
450 19 3 2 3 6 7 5 3 1 2 2 2 2 16 2 2 2 2 2 1 4 4 4 2 4 2 2 2 2 2
451 19 3 2 3 6 7 4 3 1 2 2 2 2 16 2 2 2 2 2 1 4 4 4 2 4 2 2 2 2 2
452 19 3 2 3 6 7 4 3 1 2 2 2 2 16 2 2 2 2 2 1 4 4 4 2 4 2 2 2 2 2
453 19 3 2 3 6 7 4 3 1 2 2 2 2 16 2 2 2 2 2 1 4 4 4 2 4 2 2 2 2 2
454 19 3 2 3 6 7 4 3 1 2 2 2 2 16 2 2 2 2 2 1 4 4 4 2 4 2 2 2 2 2
455 19 3 2 3 6 7 4 3 1 2 2 2 2 16 2 2 2 2 2 1 4 4 4 2 4 2 2 2 2 2
456 18 3 2 3 6 7 4 3 1 2 2 2 2 16 2 2 2 2 2 1 4 4 4 2 4 2 2 2 2 2
457 18 3 2 3 6 7 4 3 1 2 2 2 2 16 2 2 2 2 2 1 4 4 4 2 4 2 2 2 2 2
458 18 3 2 3 6 7 4 3 1 2 2 2 2 13 2 2 2 2 2 1 4 4 4 2 4 2 2 2 2 2
459 18 3 2 3 6 7 4 3 1 2 2 2 2 13 2 2 2 2 2 1 4 4 4 2 4 2 2 2 2 2
460 18 3 2 3 6 7 4 3 1 2 2 2 2 13 2 2 2 2 2 1 4 4 4 2 4 2 2 2 2 2
461 18 3 2 3 6 7 4 3 1 2 2 2 2 13 2 2 2 2 2 1 4 4 4 2 4 2 2 2 2 2
462 18 3 2 3 6 7 4 3 1 2 2 2 2 13 2 2 2 2 2 1 4 4 4 2 4 2 2 2 2 2
463 18 3 2 3 6 7 4 3 1 2 2 2 2 13 2 2 2 2 2 1 4 4 4 2 4 2 2 2 2 2
464 18 3 2 3 6 7 4 3 1 2 2 2 2 13 2 2 2 2 2 1 4 4 4 2 4 2 2 2 2 2