An extended model of phosphorus metabolism in growing ruminants
14
S. R. Peçanha, E. Kebreab and J. France R. S. Dias, S. López, R. M. P. Patiño, T. S. Silva, J. C. Silva Filho, D. M. S. S. Vitti, M. R. An extended model of phosphorus metabolism in growing ruminants doi: 10.2527/jas.2010-3669 originally published online July 15, 2011 2011, 89:4151-4162. J ANIM SCI http://jas.fass.org/content/89/12/4151 the World Wide Web at: The online version of this article, along with updated information and services, is located on www.asas.org at University of California, Davis on December 30, 2011 jas.fass.org Downloaded from
Transcript of An extended model of phosphorus metabolism in growing ruminants
S. R. Peçanha, E. Kebreab and J. FranceR. S. Dias, S. López, R. M. P. Patiño, T. S. Silva, J. C. Silva Filho, D. M. S. S. Vitti, M. R.
An extended model of phosphorus metabolism in growing ruminants
doi: 10.2527/jas.2010-3669 originally published online July 15, 20112011, 89:4151-4162.J ANIM SCI
http://jas.fass.org/content/89/12/4151the World Wide Web at:
The online version of this article, along with updated information and services, is located on
www.asas.org
at University of California, Davis on December 30, 2011jas.fass.orgDownloaded from
An extended model of phosphorus metabolism in growing ruminants1
R. S. Dias,* S. López,†2 R. M. P. Patiño,‡ T. S. Silva,§ J. C. Silva Filho,# D. M. S. S. Vitti,§ M. R. S. R. Peçanha,§ E. Kebreab,‖ and J. France*
*Centre for Nutrition Modelling, University of Guelph, Guelph, Ontario N1G 2W1, Canada; †Instituto de Ganadería de Montaña (IGM) CSIC–Universidad de León, Departamento de Producción Animal,
Universidad de León, E-24071 León, Spain; ‡Facultad de Ciencias Agropecuarias, Universidad de Sucre, Carrera 28 5-267, Sincelejo, Sucre, Colombia; §Centro de Energia Nuclear na Agricultura,
University of Sao Paulo, CEP 13400-970, Piracicaba, São Paulo, Brazil; #Departamento de Zootecnia, Universidade Federal de Lavras, CEP 37200-000, Lavras, Minas Gerais, Brazil;
and ‖Department of Animal Science, University of California, Davis 95616
ABSTRACT: A major objective of this study was to extend the Vitti-Dias model used to describe P me-tabolism in ruminants, by adding 2 new pools to the original model to represent the rumen and saliva. An experiment was carried out using 24 male sheep, ini-tial BW of 34.5 kg, aged 8 mo, fed a basal diet sup-plied with increasing amounts of dicalcium phosphate to provide 0.14, 0.32, 0.49, and 0.65% P in the diet. Sheep were individually housed indoors in metabolic cages and injected with a single dose of 7.4 MBq of 32P into a jugular vein. Feed intake and total fecal and urinary outputs were recorded and sampled daily for 1 wk, and blood samples were obtained at 5 min, and 1, 2, 4, 6, 24, 48, 72, 96, 120, 144, and 168 h after 32P injection. Saliva and rumen fluid samples were taken on d 6, 7, and 8. Then, animals were slaughtered and samples from liver, kidney, testicle, muscle, and heart (soft tissue) and bone were collected. Specific radioac-tivity and inorganic P were then determined in bone, soft tissue, plasma, rumen, saliva, and feces, and used to calculate flows between pools. Increased P intake positively affected total P (r = 0.97, P < 0.01) and endogenous P excretion in feces (r = 0.85, P < 0.01), P
flow from plasma to saliva (r = 0.73, P < 0.01), from saliva to rumen (r = 0.73, P < 0.01), and from lower gastrointestinal tract to plasma (r = 0.72, P < 0.01). Urinary P excretion was similar for all treatments (P = 0.35). It was, however, related to plasma P (r = 0.63, P < 0.01) and to net P flow to bone (accretion – resorp-tion; r = −0.64, P < 0.01). Phosphorus intake affected net P flow to soft tissue (P = 0.04) but not net P flow to bone (P = 0.46). Phosphorus mobilized from bone was directed toward soft tissue, as suggested by the cor-relations between P flow from bone to plasma and net P flow to soft tissue (r = 0.89, P < 0.01), and P flow from plasma to soft tissue and net P flow to bone (r = −0.76, P < 0.01). The lack of effect of dietary P on net P accretion in bone suggests that P demand for bone formation was low and surplus P was partially used by soft tissue. In conclusion, the model resulted in appro-priate biological description of P metabolism in sheep and added knowledge of the effects of surplus dietary P on P metabolism. Additionally, the model can be used as a tool to assess feeding strategies aiming to mitigate P excretion into the environment.
Key words: bone, modeling, phosphorus, rumen, saliva, soft tissue
©2011 American Society of Animal Science. All rights reserved. J. Anim. Sci. 2011. 89:4151–4162 doi:10.2527/jas.2010-3669
INTRODUCTION
A large number of ruminant producers provide di-etary P supplementation in excess of requirements to guarantee animal performance, owing to the impor-tance of this mineral in maintaining metabolic func-tions. Consequently, P excreted in feces represents a risk to the environment (Tamminga, 1996). Moreover, inorganic P supplemented to animal diets is a limited and expensive resource (Gilbert, 2009).
1 The authors thank the Fundacao de Amparo a Pesquisa do Es-tado de Sao Paulo (FAPESP Proc. 2004/14532-5) for financial sup-port. Funding was provided, in part, by the Canada Research Chairs Program. J. France and S. López gratefully acknowledge receipt of collaborative grant no. SAB2010-0151 from the Spanish Ministerio de Educación under the program “Programa Nacional de Movilidad de Recursos Humanos del Plan Nacional de I+D+i 2008-2011—sub-programa EXTESP-EDU” to undertake this work.
2 Corresponding author: [email protected] November 5, 2010.Accepted June 22, 2011.
4151
at University of California, Davis on December 30, 2011jas.fass.orgDownloaded from
It is well established that, in ruminants, dietary P is mainly absorbed from the small intestine, with feces being the main route for disposing of unabsorbed P. Although the amount of urinary P excreted by rumi-nants is considered negligible, excretion of P in urine can represent a compensatory mechanism to eliminate surplus P when P secretion through saliva is not suf-ficient to maintain P homeostasis (Scott and Buchan, 1985, 1987).
When the ruminant is P deficient, P is mobilized from bone to attend to demands of various body tis-sues. Conversely, dietary P in excess of the require-ments of an animal will affect P metabolism by increas-ing P in plasma, which in turn stimulates salivary P secretion into the rumen (Tomas et al., 1967) and hence the excretion of endogenous P in feces in addition to unabsorbed dietary P (Dias et al., 2009). There are still gaps in knowledge of the fates of dietary P, namely par-tition of retained P between bone and soft tissue and its involvement with P from other pools such as plasma, rumen, and saliva.
Mathematical models have been used for many years as tools to aid scientists gain information on P metabo-lism in ruminants (Lofgreen and Kleiber, 1953; Schnei-der et al., 1987; Vitti et al., 2000). In this context, a primary objective of this study was to extend the Vitti-Dias model (Dias et al., 2006) by including the ru-men and saliva as additional, explicit pools to provide a more detailed and accurate description of the com-partmentalization involved in P metabolism in growing sheep fed different amounts of dietary P.
MATERIALS AND METHODS
The experiment was conducted using a protocol ap-proved by the Commission of Ethics in Experimenta-tion with Animals and the Commission of Environmen-tal Ethics of Centre for Nuclear Energy in Agriculture, University of Sao Paulo, Brazil.
Animals and Diets
Twenty-four Santa Inês male sheep [initial BW = 34.5 kg (SD = 1.38), aged 8 mo] were randomly al-located to 4 groups of 6 animals according to a com-pletely random design. The sheep had an adequate nutritional status at the commencement of the trial, after being raised on pasture with access to mineral supplements. During the experiment, sheep were fed a basal diet supplemented with different amounts of dicalcium phosphate to provide increasing P and Ca intakes. The experimental basal diet consisted of 890 g/d of roughage (chopped coast cross hay) and 249 g/d of a concentrate mixture (cassava meal, soybean meal, sugarcane molasses, urea, and a mineral supplement; Table 1). Experimental treatments corresponded to di-ets supplemented with 0, 12.5, 25.0, and 37.5 g of dical-cium phosphate/d, thus providing 0.14, 0.32, 0.49, and 0.65% P in the diet to achieve daily P intakes ranging
from 1.5 to 7.5 g/d. Intake of P with the diet contain-ing 0.14% P (low-P diet, LP) was, on average, 1.5 g/d, less than the P requirement for growing rams accord-ing to NRC (2007), whereas for diets with 0.32, 0.49, and 0.65% P [moderate (MP), high (HP), and surplus (SP) P diets, respectively], P intakes (3.5, 5.5, and 7.5 g of P/d, respectively) were greater than the require-ments (2.9 g of P/d is the requirement for growing rams aged 8 mo with BW gain of 200 g/d).
Experimental Procedures
Animals were placed initially in lot stalls where they received the corresponding experimental diet for 7 d, in 2 equal meals each day, at 0800 and 1700 h. Then, animals were transferred to individual cages specially designed for isotope studies. After a 7-d adaptation pe-riod for the sheep to become accustomed to the meta-bolic cages, animals received a single dose of 7.4 MBq of 32P injected into the right jugular vein, and subse-quently blood samples (10 mL) were collected by veni-puncture from the left jugular vein at 5 min, and 1, 2, 4, 6, 24, 48, 72, 96, 120, 144, and 168 h (first to seventh day of sampling period) after 32P dosing, and trans-ferred to glass tubes containing heparin. Feed intake and total fecal and urinary outputs were recorded daily for 1 wk during the sampling period. Diets and feed refusals were weighed and sampled daily. All the feed refusal samples of each animal were combined, so that at the conclusion of the experimental period, feed and feed refusal composites were obtained for composition analyses. Total fecal output was collected and weighed daily, and representative samples of feces (10% of daily output) were collected and bulked at the end of the experimental period for further analysis of inorganic P and 32P. Urine was collected in buckets containing 10 mL of concentrated sulfuric acid, and after weigh-ing total daily output, samples (10% of daily output) were frozen at −20°C. At the end of the collection pe-riod, the preserved urine samples were composited by animal for further P and 32P analyses. Mixed saliva samples and rumen fluid samples were taken only on d 6, 7, and 8 of the experiment to minimize stress to the animals. Saliva was collected using a pair of pin-cers and small pieces of plastic sponge, put directly into the mouth of the animal before feeding without impairing chewing movements. Rumen contents were collected in the morning before the first feeding using a stomach tube and a syringe to pump out ruminal fluid. To avoid excess saliva contamination of ruminal samples, the tube was inserted as quickly as possible by an experienced operator well into the rumen be-fore fluid was collected. Then, the first approximately 200 mL withdrawn were discarded to minimize saliva contamination before a 50-mL sample was taken. On d 8, after samplings of feces, urine, saliva, and rumen fluid, animals were slaughtered by exsanguination via carotid arteries after intravenous injection of 0.05 mg of xylazine (Rompum; Bayer, Sao Paulo, Brazil)/kg of
4152 Dias et al.
at University of California, Davis on December 30, 2011jas.fass.orgDownloaded from

BW. Samples from various soft tissues (liver, kidney, testicle, muscle, and heart) and bone (twelfth rib) were collected from each animal. Kidneys, heart, liver, and testicles were weighed to determine the percentage of these tissues in animal BW, whereas muscle was con-sidered to be 26.9% of BW. For determination of the bone pool, total skeleton weight was assumed to be 8% of BW. Information regarding percentages of muscle and bone in BW was obtained from studies carried out using Santa Inês sheep at Centro de Energia Nuclear na Agricultura (D. M. S. S. Vitti, CENA, University of São Paulo, Brazil, unpublished data). These percent-ages are in close agreement with literature data (e.g., Butterfield, 1988).
Analytical Methods
Samples of feed and feed refusals were dried at 60°C for 48 h, ground through a 1-mm screen in a Wiley mill and analyzed for DM, ash, CP, and ADF concen-trations following recommendations of the Association of Official Analytical Chemists (AOAC, 1995). Crude protein was determined by the Kjeldahl method, and NDF according to Mertens (2002), without using amy-lase or sodium sulfite. Dried samples (1 g) were ashed at 500°C for 8 h, and then 5 mL of concentrated HCl (12 M) was added and heated to dissolve the ash com-pletely. The mixture was filtered through P-free filter paper and P content in feed samples was determined by colorimetry using vanadate-molybdate reagent (Sar-ruge and Haag, 1974), whereas Ca was determined by
atomic absorption spectrometry (Zagatto et al., 1979). The colorimetric determination of P was an adaptation of method 965.17 of AOAC (1995). A vanadate solu-tion was prepared by dissolving 2.5 g of ammonium vanadate (NH4VO3) in 500 mL of boiling water. After cooling, 350 mL of concentrated HNO3 was added and the solution was diluted to 1 L with distilled water. For the molybdate aqueous solution, 50 g of ammonium molybdate [(NH4)6Mo7O24] was dissolved in hot dis-tilled water. Cooled vanadate and molybdate solutions were combined (1:1, vol/vol) to obtain the vanadate-molybdate reagent. Ash solution (2 mL) was mixed thoroughly with 2 mL of vanadate-molybdate reagent and 3 mL of distilled water. The mixture was allowed to stand for 5 min and absorbance was read at 420 nm against a standard P curve (using solutions of potas-sium dihydrogen phosphate) to estimate the P concen-tration in samples.
Inorganic P was determined in feces, urine, plasma, saliva, rumen, bone, and soft tissue samples. Fecal samples were dried at 60°C for 48 h. A sample (1 g) of dried feces was ashed at 500°C for 8 h, and then 5 mL of concentrated HCl (12 M) were added for wet ashing digestion. The mixture was filtered through P-free filter paper and P content was determined by the colorimet-ric method of Sarruge and Haag (1974). Thawed urine samples were processed as described by Morse et al. (1992), and inorganic P was analyzed by colorimetry according to the method of Fick et al. (1979). Blood samples were diluted in a solution of trichloroacetic acid (TCA; 100 g of TCA/L of distilled water), mix-
Table 1. Composition of experimental diets
Item
P content in diet, %
0.14 0.32 0.49 0.65
Experimental diet, g/d Hay 890 890 890 890 Concentrate 249 249 249 249 Dicalcium phosphate 0 12.5 25.0 37.5Ingredient,1 % of diet (as fed) Hay 78.1 77.3 76.5 75.6 Cassava meal 13.9 13.7 13.6 13.4 Soybean meal 4.7 4.6 4.6 4.5 Urea 1.4 1.4 1.4 1.3 Sugarcane molasses 1.0 1.0 1.0 1.0 Trace mineral premix2 0.9 0.9 0.9 0.9 Dicalcium phosphate — 1.09 2.15 3.19Analyzed nutrient composition, % of dietary DM OM 92.1 92.2 92.3 92.3 CP 10.9 10.8 10.6 10.5 NDF 64.2 63.5 62.8 62.1 ADF 35.1 34.7 34.4 34.0 ME,3 Mcal/kg of DM 2.05 2.03 2.01 1.99 P 0.143 0.315 0.484 0.649 Ca 0.394 0.714 1.072 1.422
1Diets were supplemented with vitamin A, 1,000,000 IU/kg; vitamin D, 250,000 IU/kg; and vitamin E, 6,250 IU/kg.
2Trace mineral premix composition per kilogram: Mg, 30 g; S, 30 g; Cu, 3 g; Mn, 5 g; Zn, 12 g; Se, 80 mg; and I, 180 mg.
3Calculated from NRC (2007) tables of composition of feedstuffs.
4153Phosphorus metabolism model
at University of California, Davis on December 30, 2011jas.fass.orgDownloaded from
ing 1 mL with 9 mL of TCA, and then centrifuged at 1,100 × g for 10 min at room temperature for plasma separation and protein precipitation. Concentration of inorganic P in plasma was determined by colorimetry (Fiske and Subbarow, 1925). Samples of saliva and ru-men fluid were diluted in a solution of TCA (100 g of TCA/L of distilled water) for protein precipitation (0.5 mL of saliva + 9.5 mL of TCA and 0.5 mL of rumen fluid + 4.5 mL of TCA), and then centrifuged at 1,800 × g for 10 min at room temperature. The supernatant was used for the colorimetric analysis of inorganic P (Fiske and Subbarow, 1925). Samples (1 g) of liver, kidney, testicle, heart, and muscle from each animal were acid-digested on a hot plate with the addition of an aqueous solution of nitric acid (500 mL of HNO3/L), and then ashed in a muffle furnace at 550°C. The ash residues were further digested using 10 mL of an aque-ous solution of HCl (100 mL of HCl/L) and filtered into a 25-mL volumetric flask through P-free filter paper. The same procedure was used for bone (twelfth rib), after being cleaned and degreased with diethyl ether. Inorganic P was determined in soft tissue and bone samples according to Sarruge and Haag (1974).
Radioactivity (32P) was measured in feces, plasma, saliva, rumen, soft tissue, and bone samples. Samples (1 mL) of centrifuged and filtered plasma, saliva, and rumen fluid were directly dispensed into borosilicate vials. Feces, bone, and soft tissue samples were ashed as for inorganic P determination. Ash samples obtained from fecal, bone, and soft tissue samples (1 g) were dis-solved in 18 N H2SO4, and then 1 mL of each hydroly-sate was transferred to counting vials for radioactivity measurement. All samples were diluted with a scintilla-tion solution to 1:10 or 1:20 depending on the expected radioactivity values in each case. Finally, the radioac-tivity of 32P in each sample was measured in a liquid scintillation spectrometer (Beckman model LS 500-TA; Beckman-Coulter Inc., Fullerton, CA) using Cerenkov radiation. To improve the efficiency of radioactivity readings, an external standard calibration procedure of quench correction was used (Nascimento Filho, 1977).
The mean values of 32P counting determined in sa-liva and rumen samples collected on d 6, 7, and 8 were used for the model calculations. Radioactivity of each soft tissue was measured and a mean value (considering the relative weight of each organ) was determined. For the calculation of the pool size of soft tissue, P concen-tration was determined in each organ and the relative weight of each tissue in the animal BW was considered for the calculation.
Model Description
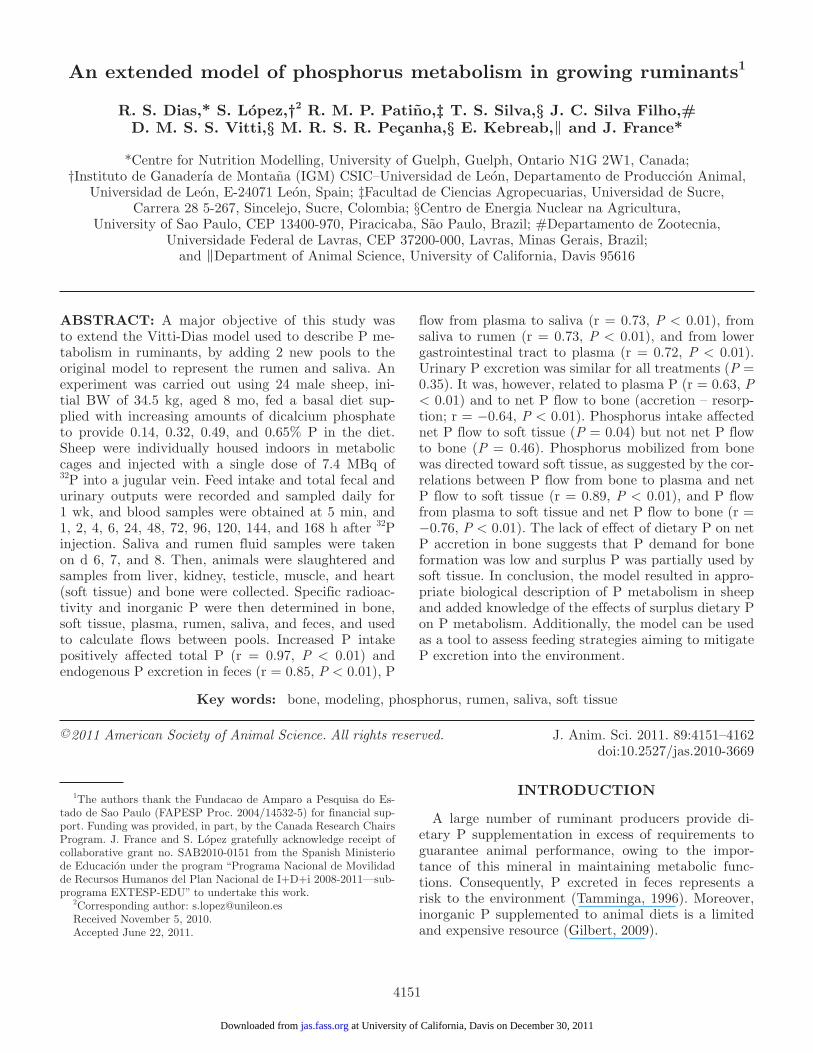
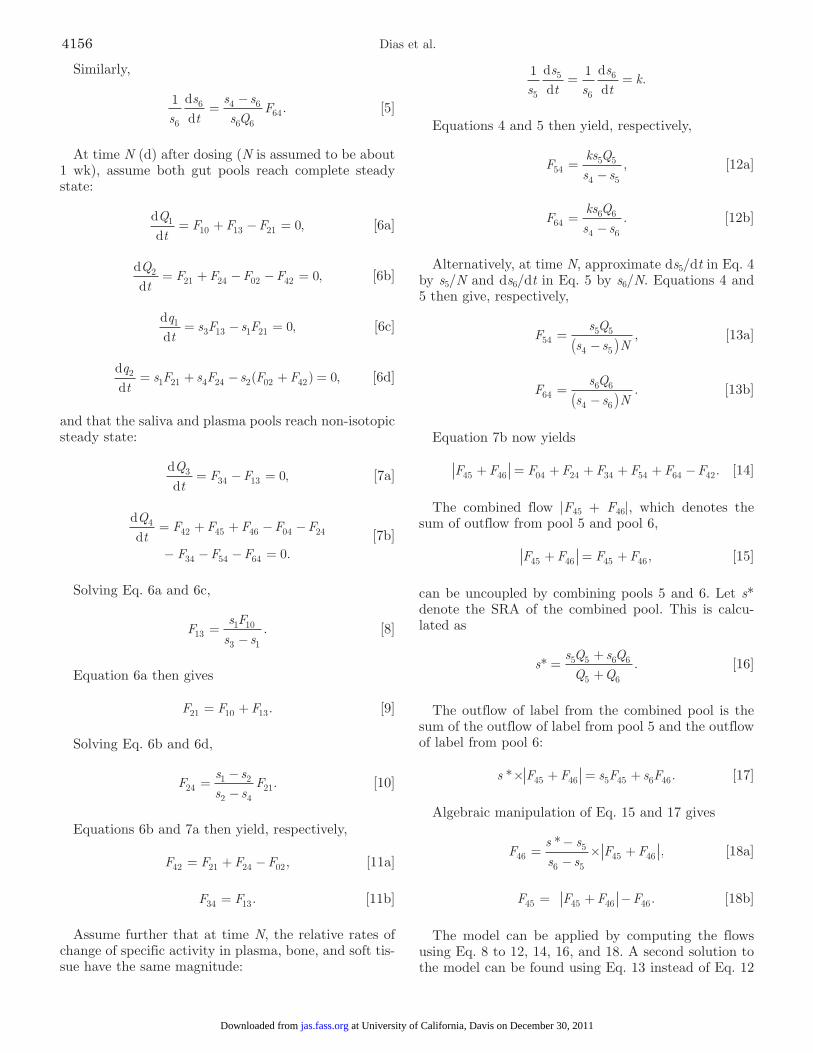
The model of whole-body P metabolism is an exten-sion of the one proposed by Vitti et al. (2000) and re-vised by Dias et al. (2006) for use with ruminants (see France et al., 2010 for review). The extended model is illustrated in Figure 1. The 6 pools of P are 1) ru-
men, 2) lower gastrointestinal tract (GIT), 3) saliva, 4) plasma, 5) bone, and 6) soft tissue. The entry of P to the system is via intake (F10), and exit via feces (F02) and urine (F04). These 3 flows are experimental mea-surements. A single dose of 32P (D, MBq) is adminis-tered into systemic blood at time zero, and specific 32P radioactivity (SRA, MBq/g of P in sample) of all pools monitored [s1, s2, s3, s4, s5, and s6 for SRA in rumen, GIT (measured in feces), saliva, plasma, bone, and soft tissue, respectively]. The Q1 to Q6 are the quantities of P in the respective pools, and q1 to q6 are the quantities of labeled P in the respective pools. The Fij is the flow of P to pool i from j, Fi0 denotes an external flow into pool i, and F0j denotes a flow from pool j out of the sys-tem. The scheme assumes there is no re-entry of labeled P from external sources. Basic mathematical notation is summarized in Table 2.
Conservation of mass principles can be applied to each pool in Figure 1 to generate differential equations. For unlabelled P,
ddQt
F F F110 13 21= + − , [1a]
ddQt
F F F F221 24 02 42= + − − , [1b]
ddQt
F F334 13= − , [1c]
ddQt
F F F
F F F F F
442 45 46
04 24 34 54 64
= + +
− − − − − , [1d]
ddQt
F F554 45= − , [1e]
ddQt
F F664 46= − , [1f]
and for 32P,
ddqt
s F s F13 13 1 21= − , [2a]
ddqt
s F s F s F F21 21 4 24 2 02 42= + − +( ), [2b]
ddqt
s F s F34 34 3 13= − , [2c]
ddqt
s F s F s F s F F
F F F
42 42 5 45 6 46 4 04 24
34 54 64
= + + − +
+ + +
(
), [2d]
4154 Dias et al.
at University of California, Davis on December 30, 2011jas.fass.orgDownloaded from
ddqt
s F s F54 54 5 45= − , [2e]
ddqt
s F s F64 64 6 46= − . [2f]
Let
s t s kt4 4( ) ,= −(0)e
where s4(0) is SRA at time of dosing, k (d−1) is a rela-tive rate constant, and t is time (d) after dosing. Then,
dd
(0)est
ks kt44= − −
and
1
4
4
sst
kdd= − .
Consider
dd
dd
dd
dd
st
q Qt
Qqtq Q
Qt
5 5 51
51 5
5 52 5= = −
−− −( )
. [3]
Using Eq. 1e and 2e in Eq. 3 gives
1
5
5 4 5
5 554s
st
s ss Q
Fdd=
−. [4]
Figure 1. Whole-body P metabolism model for growing ruminants. The circles identify the measured flows: F10 = P intake, F02 = P excreted in feces, and F04 = P in urine. The arrows represent the flows between pools: F21 = from rumen to lower gastrointestinal tract (GIT), F42 = from GIT to plasma, F24 = from plasma to GIT, F64 = from plasma to soft tissue, F46 = from soft tissue to plasma, F54 = from plasma to bone, F45 = from bone to plasma, F34 = from plasma to saliva, F13 = from saliva to rumen.
Table 2. Principal symbols used in the model
Symbol Definition
Fij Flow of P to pool i from j; Fi0 denotes an external flow into pool i and F0j denotes a flow from pool j out of the system; g/dD Dose of labeled P administered to plasma at time zero, MBqQi Quantity of P in pool i, gqi Quantity of labeled P in pool i, MBqsi Specific 32P radioactivity of pool i ( = qi/Qi), MBq/gk Relative rate of change of plasma specific activity, per dayN Number of days, d
4155Phosphorus metabolism model
at University of California, Davis on December 30, 2011jas.fass.orgDownloaded from
Similarly,
1
6
6 4 6
6 664s
st
s ss Q
Fdd=
−. [5]
At time N (d) after dosing (N is assumed to be about 1 wk), assume both gut pools reach complete steady state:
ddQt
F F F110 13 21 0= + − = , [6a]
ddQt
F F F F221 24 02 42 0= + − − = , [6b]
ddqt
s F s F13 13 1 21 0= − = , [6c]
ddqt
s F s F s F F21 21 4 24 2 02 42 0= + − + =( ) , [6d]
and that the saliva and plasma pools reach non-isotopic steady state:
ddQt
F F334 13 0= − = , [7a]
ddQt
F F F F F
F F F
442 45 46 04 24
34 54 64 0
= + + − −
− − − = . [7b]
Solving Eq. 6a and 6c,
Fs Fs s13
1 10
3 1=
−. [8]
Equation 6a then gives
F F F21 10 13= + . [9]
Solving Eq. 6b and 6d,
Fs ss s
F241 2
2 421=
−−
. [10]
Equations 6b and 7a then yield, respectively,
F F F F42 21 24 02= + − , [11a]
F F34 13= . [11b]
Assume further that at time N, the relative rates of change of specific activity in plasma, bone, and soft tis-sue have the same magnitude:
1 1
5
5
6
6
sst s
st
kdd
dd
= = .
Equations 4 and 5 then yield, respectively,
Fks Qs s54
5 5
4 5=
−, [12a]
Fks Qs s64
6 6
4 6=
−. [12b]
Alternatively, at time N, approximate ds5/dt in Eq. 4 by s5/N and ds6/dt in Eq. 5 by s6/N. Equations 4 and 5 then give, respectively,
Fs Qs s N54
5 5
4 5=
−( ), [13a]
Fs Qs s N64
6 6
4 6=
−( ). [13b]
Equation 7b now yields
F F F F F F F F45 46 04 24 34 54 64 42+ = + + + + − . [14]
The combined flow |F45 + F46|, which denotes the sum of outflow from pool 5 and pool 6,
F F F F45 46 45 46+ = + , [15]
can be uncoupled by combining pools 5 and 6. Let s* denote the SRA of the combined pool. This is calcu-lated as
ss Q s QQ Q
* .=++
5 5 6 6
5 6 [16]
The outflow of label from the combined pool is the sum of the outflow of label from pool 5 and the outflow of label from pool 6:
s F F s F s F* .× + = +45 46 5 45 6 46 [17]
Algebraic manipulation of Eq. 15 and 17 gives
Fs ss s
F F465
6 545 46=
−−
× +*
, [18a]
F F F F45 45 46 46= + − . [18b]
The model can be applied by computing the flows using Eq. 8 to 12, 14, 16, and 18. A second solution to the model can be found using Eq. 13 instead of Eq. 12
4156 Dias et al.
at University of California, Davis on December 30, 2011jas.fass.orgDownloaded from

to compute the flows F54 and F64. Radioactive measure-ments of 32P and inorganic P determination used to calculate SRA were determined accurately to minimize errors in output flow calculations. Endogenous P in fe-ces may be calculated as F02end, g of P/d = (s2/s4)F02.
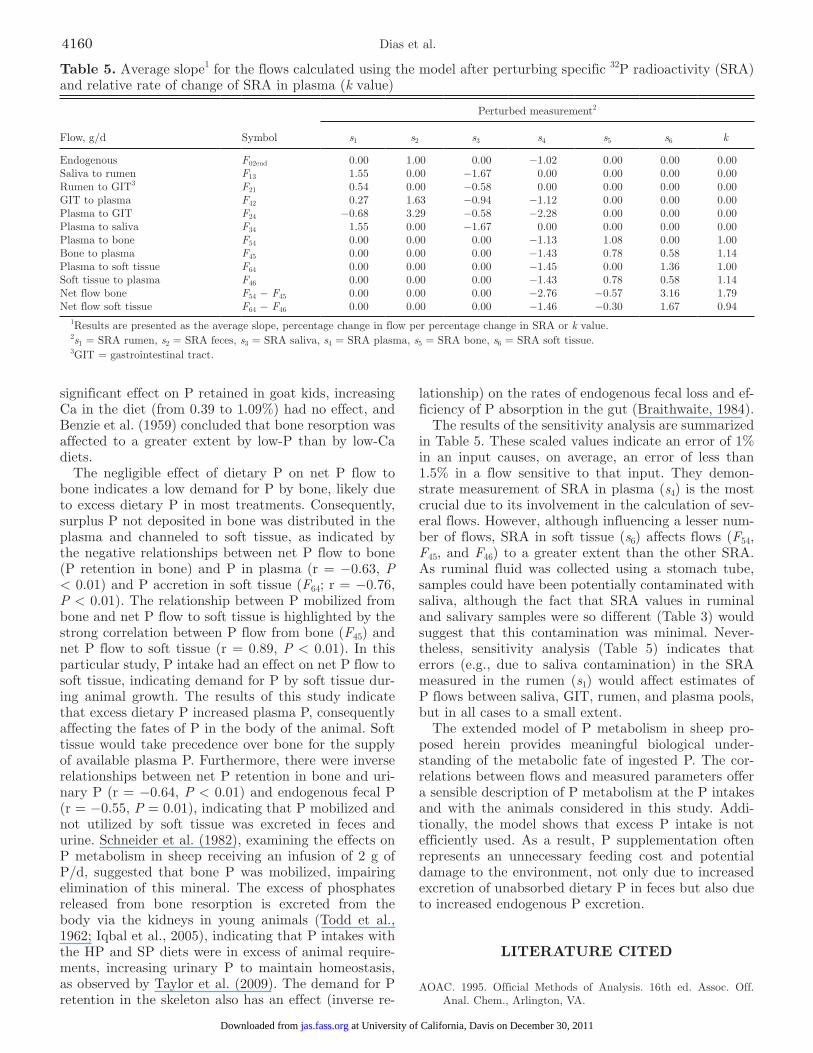
Sensitivity Analysis
A sensitivity analysis was conducted by ascribing the mean values across all animals to each measurement. The model was solved by perturbing each SRA and the k value in turn by 0, ±10, and ±20%. Each calculated flow (y, g/d) was then plotted against perturbation (x, %), and a 5-point linear regression of y on x performed to determine the average slope of the line produced. Each average slope was subsequently scaled by its cor-responding unperturbed average flow value, to give the scaled slopes dimensions of percentage change in y per percentage change in x.
Statistical Analysis
Experimental measurements of P intake, and P con-centrations in rumen, saliva, bone, and soft tissue, SRA in rumen, feces, saliva, plasma, bone, and soft tissue, and P flows given by the model were analyzed as a one-way completely random design. Animals (6 per experi-mental group) were the experimental units. Analysis of variance was performed using the GLM procedure (SAS Inst. Inc., Cary, NC.) with P content in the diet as the only source of variation. Polynomial orthogonal contrasts were performed and probability values for lin-ear and quadratic components are reported. The pair-wise correlations between variables were determined using PROC CORR of SAS.
RESULTS AND DISCUSSION
P Intake, Excretion, and Secretion
The basal diet was supplemented with dicalcium phosphate to provide increasing P intake. Dry matter intakes were 1.041, 1.118, 1.130, and 1.156 kg/d for LP, MP, HP, and SP, respectively. Except for LP, DMI were statistically similar for all the other 3 treatments (P = 0.07). Feed intake in animals fed the LP diet was de-creased by 8% (P < 0.01), probably due to an induced P deficiency (Ternouth et al., 1993; NRC, 2007). As the mineral supplement used was dicalcium phosphate, not only P but also Ca provision was increased across the LP to SP diets. The experiment was designed so that the Ca:P ratio was similar for supplemented diets (2.27, 2.21, and 2.19 for MP, HP, and SP diets, respectively) and greater for LP so that this diet would be below P requirements (2.9 g of P/d) but sufficient to match Ca requirements (3.9 g of Ca/d) for lambs of this age and BW (NRC, 2007). When P is adequate, the Ca:P ratio is not influential, but if P is limiting, a Ca:P ratio
greater than 3.6 can be detrimental for sheep (Wan Zahari et al., 1990).
Greater P intakes (F10) were associated with in-creased total (F02; r = 0.97) and endogenous (F02end; r = 0.85) P excretion in feces. Urinary P excretion (F04) was similar for all treatments (Table 3) and was related to P concentration in plasma (r = 0.63, P < 0.01). Al-though it is considered negligible, P excretion in urine of ruminants contributes to P homeostasis. According to various studies (Field et al., 1983; Scott et al., 1984; Scott and Buchan, 1985), when plasma P increases above a concentration threshold (about 2 mmol/L), the reabsorptive capacity of kidney tubules is exceeded and extra P is excreted in urine. In this study, plasma P concentrations were above this concentration (2.15, 2.55, 2.83, and 2.81 mmol/L for LP, MP, HP, and SP, respectively). Therefore, it would seem reasonable to suggest that P excretion via urine was regulated to ad-just plasma P even though urinary P excretion was modest. Calcium intake varied among diets, but the Ca:P ratio was similar for diets providing P above re-quirements. Vitti et al. (2010) pointed out that adverse effects of impaired Ca:P ratios on Ca or P absorption could be critical only when P is inadequate. Even with the LP diet, the Ca:P ratio of the diets used in this experiment was within a range causing no adverse ef-fects on P absorption or fecal and urinary P excretion in sheep (Wan Zahari et al., 1990; Vitti et al., 2010).
Plasma P concentration was affected linearly by P intake (r = 0.52, P = 0.01). According to Bravo et al. (2003), only 17% of the variation in plasma P con-centration was explained by differences in P intake in ruminants. Vitti et al. (2010) concluded that plasma is not a reliable indicator of P status because of ho-meostatic responses, as P is mobilized from bone to maintain normal concentrations in blood when animals suffer severe P deficiency. Thus, factors that can af-fect P concentration in plasma such as P mobilization from bone and soft tissue may also interfere in the re-lationship between plasma P and dietary P intake. For example, in our study P concentration in plasma was inversely related to net P flow to bone (r = −0.63, P < 0.01) suggesting that plasma P was affected by other factors besides P intake. Furthermore, P concentration in plasma was related to endogenous P excreted in fe-ces (F02end; r = 0.71, P < 0.01), indicating greater P in plasma might have induced a greater secretion of en-dogenous P (Mañas-Almendros et al., 1982; Scott et al., 1984) and, consequently, a greater excretion in feces. In agreement with Preston and Pfander (1964) and Vitti et al. (2005), endogenous (also called metabolic) fecal P increased with increasing dietary P. Endogenous fecal P can be derived either from inevitable fecal losses or from fecal excretion of surplus P (Pfeffer et al., 2005). Although it is impossible to differentiate both sources, the increase in endogenous fecal P between LP and the other diets can be attributed in part to inevitable fe-cal losses significantly related to DMI (Spiekers et al.,
4157Phosphorus metabolism model
at University of California, Davis on December 30, 2011jas.fass.orgDownloaded from
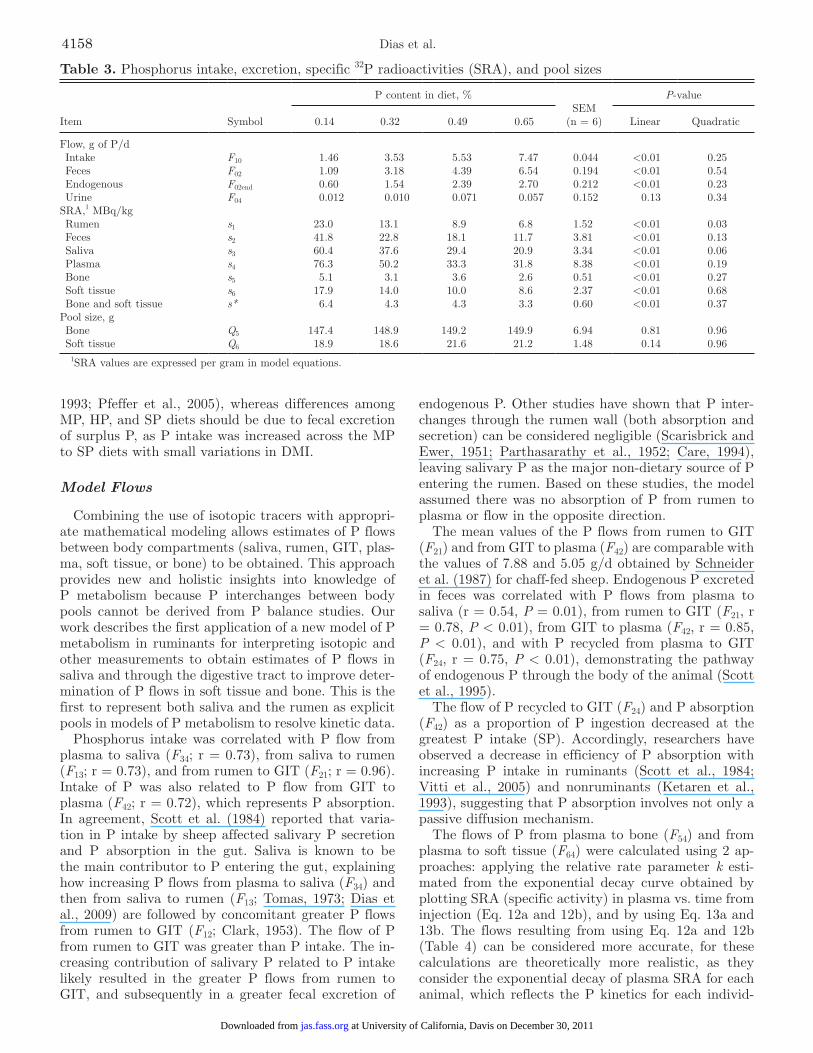
1993; Pfeffer et al., 2005), whereas differences among MP, HP, and SP diets should be due to fecal excretion of surplus P, as P intake was increased across the MP to SP diets with small variations in DMI.
Model Flows
Combining the use of isotopic tracers with appropri-ate mathematical modeling allows estimates of P flows between body compartments (saliva, rumen, GIT, plas-ma, soft tissue, or bone) to be obtained. This approach provides new and holistic insights into knowledge of P metabolism because P interchanges between body pools cannot be derived from P balance studies. Our work describes the first application of a new model of P metabolism in ruminants for interpreting isotopic and other measurements to obtain estimates of P flows in saliva and through the digestive tract to improve deter-mination of P flows in soft tissue and bone. This is the first to represent both saliva and the rumen as explicit pools in models of P metabolism to resolve kinetic data.
Phosphorus intake was correlated with P flow from plasma to saliva (F34; r = 0.73), from saliva to rumen (F13; r = 0.73), and from rumen to GIT (F21; r = 0.96). Intake of P was also related to P flow from GIT to plasma (F42; r = 0.72), which represents P absorption. In agreement, Scott et al. (1984) reported that varia-tion in P intake by sheep affected salivary P secretion and P absorption in the gut. Saliva is known to be the main contributor to P entering the gut, explaining how increasing P flows from plasma to saliva (F34) and then from saliva to rumen (F13; Tomas, 1973; Dias et al., 2009) are followed by concomitant greater P flows from rumen to GIT (F12; Clark, 1953). The flow of P from rumen to GIT was greater than P intake. The in-creasing contribution of salivary P related to P intake likely resulted in the greater P flows from rumen to GIT, and subsequently in a greater fecal excretion of
endogenous P. Other studies have shown that P inter-changes through the rumen wall (both absorption and secretion) can be considered negligible (Scarisbrick and Ewer, 1951; Parthasarathy et al., 1952; Care, 1994), leaving salivary P as the major non-dietary source of P entering the rumen. Based on these studies, the model assumed there was no absorption of P from rumen to plasma or flow in the opposite direction.
The mean values of the P flows from rumen to GIT (F21) and from GIT to plasma (F42) are comparable with the values of 7.88 and 5.05 g/d obtained by Schneider et al. (1987) for chaff-fed sheep. Endogenous P excreted in feces was correlated with P flows from plasma to saliva (r = 0.54, P = 0.01), from rumen to GIT (F21, r = 0.78, P < 0.01), from GIT to plasma (F42, r = 0.85, P < 0.01), and with P recycled from plasma to GIT (F24, r = 0.75, P < 0.01), demonstrating the pathway of endogenous P through the body of the animal (Scott et al., 1995).
The flow of P recycled to GIT (F24) and P absorption (F42) as a proportion of P ingestion decreased at the greatest P intake (SP). Accordingly, researchers have observed a decrease in efficiency of P absorption with increasing P intake in ruminants (Scott et al., 1984; Vitti et al., 2005) and nonruminants (Ketaren et al., 1993), suggesting that P absorption involves not only a passive diffusion mechanism.
The flows of P from plasma to bone (F54) and from plasma to soft tissue (F64) were calculated using 2 ap-proaches: applying the relative rate parameter k esti-mated from the exponential decay curve obtained by plotting SRA (specific activity) in plasma vs. time from injection (Eq. 12a and 12b), and by using Eq. 13a and 13b. The flows resulting from using Eq. 12a and 12b (Table 4) can be considered more accurate, for these calculations are theoretically more realistic, as they consider the exponential decay of plasma SRA for each animal, which reflects the P kinetics for each individ-
Table 3. Phosphorus intake, excretion, specific 32P radioactivities (SRA), and pool sizes
Item Symbol
P content in diet, %SEM
(n = 6)
P-value
0.14 0.32 0.49 0.65 Linear Quadratic
Flow, g of P/d Intake F10 1.46 3.53 5.53 7.47 0.044 <0.01 0.25 Feces F02 1.09 3.18 4.39 6.54 0.194 <0.01 0.54 Endogenous F02end 0.60 1.54 2.39 2.70 0.212 <0.01 0.23 Urine F04 0.012 0.010 0.071 0.057 0.152 0.13 0.34SRA,1 MBq/kg Rumen s1 23.0 13.1 8.9 6.8 1.52 <0.01 0.03 Feces s2 41.8 22.8 18.1 11.7 3.81 <0.01 0.13 Saliva s3 60.4 37.6 29.4 20.9 3.34 <0.01 0.06 Plasma s4 76.3 50.2 33.3 31.8 8.38 <0.01 0.19 Bone s5 5.1 3.1 3.6 2.6 0.51 <0.01 0.27 Soft tissue s6 17.9 14.0 10.0 8.6 2.37 <0.01 0.68 Bone and soft tissue s* 6.4 4.3 4.3 3.3 0.60 <0.01 0.37Pool size, g Bone Q5 147.4 148.9 149.2 149.9 6.94 0.81 0.96 Soft tissue Q6 18.9 18.6 21.6 21.2 1.48 0.14 0.96
1SRA values are expressed per gram in model equations.
4158 Dias et al.
at University of California, Davis on December 30, 2011jas.fass.orgDownloaded from
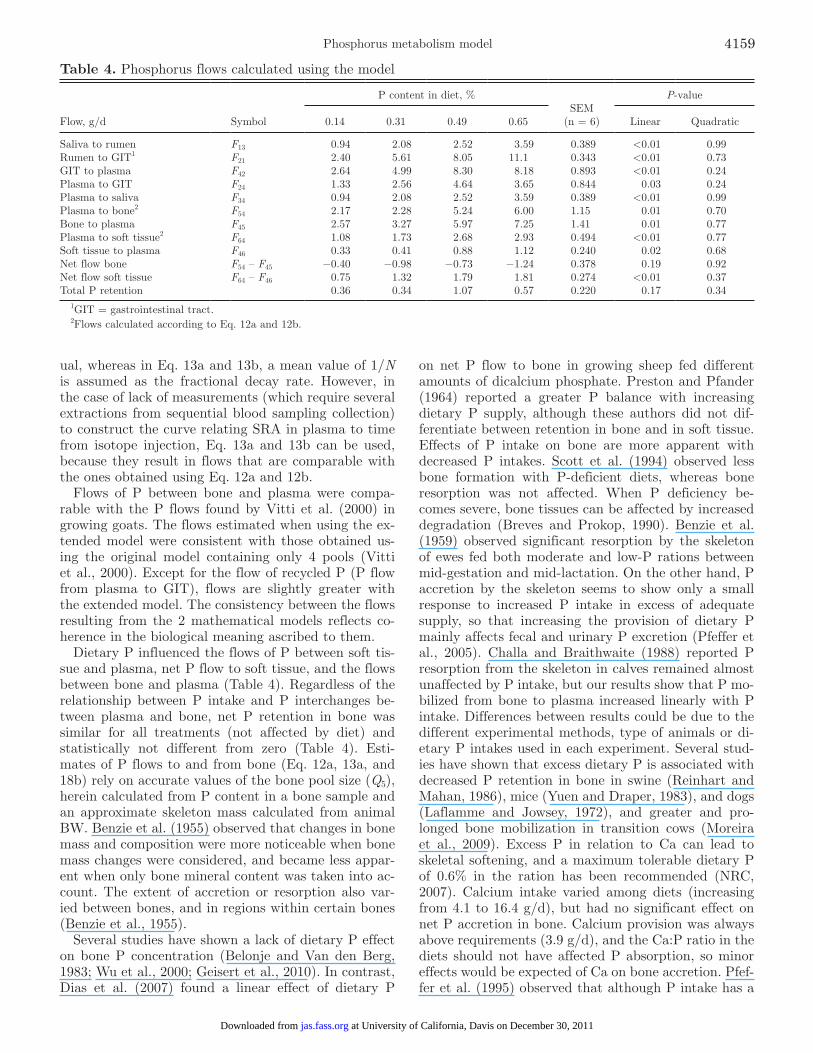
ual, whereas in Eq. 13a and 13b, a mean value of 1/N is assumed as the fractional decay rate. However, in the case of lack of measurements (which require several extractions from sequential blood sampling collection) to construct the curve relating SRA in plasma to time from isotope injection, Eq. 13a and 13b can be used, because they result in flows that are comparable with the ones obtained using Eq. 12a and 12b.
Flows of P between bone and plasma were compa-rable with the P flows found by Vitti et al. (2000) in growing goats. The flows estimated when using the ex-tended model were consistent with those obtained us-ing the original model containing only 4 pools (Vitti et al., 2000). Except for the flow of recycled P (P flow from plasma to GIT), flows are slightly greater with the extended model. The consistency between the flows resulting from the 2 mathematical models reflects co-herence in the biological meaning ascribed to them.
Dietary P influenced the flows of P between soft tis-sue and plasma, net P flow to soft tissue, and the flows between bone and plasma (Table 4). Regardless of the relationship between P intake and P interchanges be-tween plasma and bone, net P retention in bone was similar for all treatments (not affected by diet) and statistically not different from zero (Table 4). Esti-mates of P flows to and from bone (Eq. 12a, 13a, and 18b) rely on accurate values of the bone pool size (Q5), herein calculated from P content in a bone sample and an approximate skeleton mass calculated from animal BW. Benzie et al. (1955) observed that changes in bone mass and composition were more noticeable when bone mass changes were considered, and became less appar-ent when only bone mineral content was taken into ac-count. The extent of accretion or resorption also var-ied between bones, and in regions within certain bones (Benzie et al., 1955).
Several studies have shown a lack of dietary P effect on bone P concentration (Belonje and Van den Berg, 1983; Wu et al., 2000; Geisert et al., 2010). In contrast, Dias et al. (2007) found a linear effect of dietary P
on net P flow to bone in growing sheep fed different amounts of dicalcium phosphate. Preston and Pfander (1964) reported a greater P balance with increasing dietary P supply, although these authors did not dif-ferentiate between retention in bone and in soft tissue. Effects of P intake on bone are more apparent with decreased P intakes. Scott et al. (1994) observed less bone formation with P-deficient diets, whereas bone resorption was not affected. When P deficiency be-comes severe, bone tissues can be affected by increased degradation (Breves and Prokop, 1990). Benzie et al. (1959) observed significant resorption by the skeleton of ewes fed both moderate and low-P rations between mid-gestation and mid-lactation. On the other hand, P accretion by the skeleton seems to show only a small response to increased P intake in excess of adequate supply, so that increasing the provision of dietary P mainly affects fecal and urinary P excretion (Pfeffer et al., 2005). Challa and Braithwaite (1988) reported P resorption from the skeleton in calves remained almost unaffected by P intake, but our results show that P mo-bilized from bone to plasma increased linearly with P intake. Differences between results could be due to the different experimental methods, type of animals or di-etary P intakes used in each experiment. Several stud-ies have shown that excess dietary P is associated with decreased P retention in bone in swine (Reinhart and Mahan, 1986), mice (Yuen and Draper, 1983), and dogs (Laflamme and Jowsey, 1972), and greater and pro-longed bone mobilization in transition cows (Moreira et al., 2009). Excess P in relation to Ca can lead to skeletal softening, and a maximum tolerable dietary P of 0.6% in the ration has been recommended (NRC, 2007). Calcium intake varied among diets (increasing from 4.1 to 16.4 g/d), but had no significant effect on net P accretion in bone. Calcium provision was always above requirements (3.9 g/d), and the Ca:P ratio in the diets should not have affected P absorption, so minor effects would be expected of Ca on bone accretion. Pfef-fer et al. (1995) observed that although P intake has a
Table 4. Phosphorus flows calculated using the model
Flow, g/d Symbol
P content in diet, %SEM
(n = 6)
P-value
0.14 0.31 0.49 0.65 Linear Quadratic
Saliva to rumen F13 0.94 2.08 2.52 3.59 0.389 <0.01 0.99Rumen to GIT1 F21 2.40 5.61 8.05 11.1 0.343 <0.01 0.73GIT to plasma F42 2.64 4.99 8.30 8.18 0.893 <0.01 0.24Plasma to GIT F24 1.33 2.56 4.64 3.65 0.844 0.03 0.24Plasma to saliva F34 0.94 2.08 2.52 3.59 0.389 <0.01 0.99Plasma to bone2 F54 2.17 2.28 5.24 6.00 1.15 0.01 0.70Bone to plasma F45 2.57 3.27 5.97 7.25 1.41 0.01 0.77Plasma to soft tissue2 F64 1.08 1.73 2.68 2.93 0.494 <0.01 0.77Soft tissue to plasma F46 0.33 0.41 0.88 1.12 0.240 0.02 0.68Net flow bone F54 – F45 −0.40 −0.98 −0.73 −1.24 0.378 0.19 0.92Net flow soft tissue F64 – F46 0.75 1.32 1.79 1.81 0.274 <0.01 0.37Total P retention 0.36 0.34 1.07 0.57 0.220 0.17 0.34
1GIT = gastrointestinal tract.2Flows calculated according to Eq. 12a and 12b.
4159Phosphorus metabolism model
at University of California, Davis on December 30, 2011jas.fass.orgDownloaded from
significant effect on P retained in goat kids, increasing Ca in the diet (from 0.39 to 1.09%) had no effect, and Benzie et al. (1959) concluded that bone resorption was affected to a greater extent by low-P than by low-Ca diets.
The negligible effect of dietary P on net P flow to bone indicates a low demand for P by bone, likely due to excess dietary P in most treatments. Consequently, surplus P not deposited in bone was distributed in the plasma and channeled to soft tissue, as indicated by the negative relationships between net P flow to bone (P retention in bone) and P in plasma (r = −0.63, P < 0.01) and P accretion in soft tissue (F64; r = −0.76, P < 0.01). The relationship between P mobilized from bone and net P flow to soft tissue is highlighted by the strong correlation between P flow from bone (F45) and net P flow to soft tissue (r = 0.89, P < 0.01). In this particular study, P intake had an effect on net P flow to soft tissue, indicating demand for P by soft tissue dur-ing animal growth. The results of this study indicate that excess dietary P increased plasma P, consequently affecting the fates of P in the body of the animal. Soft tissue would take precedence over bone for the supply of available plasma P. Furthermore, there were inverse relationships between net P retention in bone and uri-nary P (r = −0.64, P < 0.01) and endogenous fecal P (r = −0.55, P = 0.01), indicating that P mobilized and not utilized by soft tissue was excreted in feces and urine. Schneider et al. (1982), examining the effects on P metabolism in sheep receiving an infusion of 2 g of P/d, suggested that bone P was mobilized, impairing elimination of this mineral. The excess of phosphates released from bone resorption is excreted from the body via the kidneys in young animals (Todd et al., 1962; Iqbal et al., 2005), indicating that P intakes with the HP and SP diets were in excess of animal require-ments, increasing urinary P to maintain homeostasis, as observed by Taylor et al. (2009). The demand for P retention in the skeleton also has an effect (inverse re-
lationship) on the rates of endogenous fecal loss and ef-ficiency of P absorption in the gut (Braithwaite, 1984).
The results of the sensitivity analysis are summarized in Table 5. These scaled values indicate an error of 1% in an input causes, on average, an error of less than 1.5% in a flow sensitive to that input. They demon-strate measurement of SRA in plasma (s4) is the most crucial due to its involvement in the calculation of sev-eral flows. However, although influencing a lesser num-ber of flows, SRA in soft tissue (s6) affects flows (F54, F45, and F46) to a greater extent than the other SRA. As ruminal fluid was collected using a stomach tube, samples could have been potentially contaminated with saliva, although the fact that SRA values in ruminal and salivary samples were so different (Table 3) would suggest that this contamination was minimal. Never-theless, sensitivity analysis (Table 5) indicates that errors (e.g., due to saliva contamination) in the SRA measured in the rumen (s1) would affect estimates of P flows between saliva, GIT, rumen, and plasma pools, but in all cases to a small extent.
The extended model of P metabolism in sheep pro-posed herein provides meaningful biological under-standing of the metabolic fate of ingested P. The cor-relations between flows and measured parameters offer a sensible description of P metabolism at the P intakes and with the animals considered in this study. Addi-tionally, the model shows that excess P intake is not efficiently used. As a result, P supplementation often represents an unnecessary feeding cost and potential damage to the environment, not only due to increased excretion of unabsorbed dietary P in feces but also due to increased endogenous P excretion.
LITERATURE CITED
AOAC. 1995. Official Methods of Analysis. 16th ed. Assoc. Off. Anal. Chem., Arlington, VA.
Table 5. Average slope1 for the flows calculated using the model after perturbing specific 32P radioactivity (SRA) and relative rate of change of SRA in plasma (k value)
Flow, g/d Symbol
Perturbed measurement2
s1 s2 s3 s4 s5 s6 k
Endogenous F02end 0.00 1.00 0.00 −1.02 0.00 0.00 0.00Saliva to rumen F13 1.55 0.00 −1.67 0.00 0.00 0.00 0.00Rumen to GIT3 F21 0.54 0.00 −0.58 0.00 0.00 0.00 0.00GIT to plasma F42 0.27 1.63 −0.94 −1.12 0.00 0.00 0.00Plasma to GIT F24 −0.68 3.29 −0.58 −2.28 0.00 0.00 0.00Plasma to saliva F34 1.55 0.00 −1.67 0.00 0.00 0.00 0.00Plasma to bone F54 0.00 0.00 0.00 −1.13 1.08 0.00 1.00Bone to plasma F45 0.00 0.00 0.00 −1.43 0.78 0.58 1.14Plasma to soft tissue F64 0.00 0.00 0.00 −1.45 0.00 1.36 1.00Soft tissue to plasma F46 0.00 0.00 0.00 −1.43 0.78 0.58 1.14Net flow bone F54 − F45 0.00 0.00 0.00 −2.76 −0.57 3.16 1.79Net flow soft tissue F64 − F46 0.00 0.00 0.00 −1.46 −0.30 1.67 0.94
1Results are presented as the average slope, percentage change in flow per percentage change in SRA or k value.2s1 = SRA rumen, s2 = SRA feces, s3 = SRA saliva, s4 = SRA plasma, s5 = SRA bone, s6 = SRA soft tissue.3GIT = gastrointestinal tract.
4160 Dias et al.
at University of California, Davis on December 30, 2011jas.fass.orgDownloaded from
Belonje, P. C., and A. Van den Berg. 1983. Failure of bone phos-phorus levels to indicate dietary intake of phosphorus by sheep. Onderstepoort J. Vet. Res. 50:1–2.
Benzie, D., A. W. Boyne, A. C. Dalgarno, J. Duckworth, and R. Hill. 1959. Studies of the skeleton of the sheep. III. The re-lationship between phosphorus intake and resorption and re-pair of the skeleton in pregnancy and lactation. J. Agric. Sci. 52:1–12.
Benzie, D., A. W. Boyne, A. C. Dalgarno, J. M. Duckworth, R. Hill, and D. M. Walker. 1955. Studies of the skeleton of the sheep. I. The effect of different levels of dietary calcium during pregnancy and lactation on individual bones. J. Agric. Sci. 46:425–440.
Braithwaite, G. D. 1984. Changes in phosphorus metabolism of sheep in response to the increased demands for P associated with an intravenous infusion of calcium. J. Agric. Sci. 102:135–139.
Bravo, D., D. Sauvant, C. Bogaert, and F. Meschy. 2003. III. Quan-titative aspects of phosphorus excretion in ruminants. Reprod. Nutr. Dev. 43:285–300.
Breves, G., and M. Prokop. 1990. Dietary phosphorus depletion in sheep: Longterm effects on bone structure. J. Anim. Physiol. Anim. Nutr. (Berl.) 64:74–79.
Butterfield, R. M. 1988. New Concepts of Sheep Growth. Univ. Syd-ney, Sydney, Australia.
Care, A. D. 1994. The absorption of phosphate from the digestive tract of ruminant animals. Br. Vet. J. 150:197–205.
Challa, J., and G. D. Braithwaite. 1988. Phosphorus and calcium metabolism in growing calves with special emphasis on phos-phorus homoeostasis: 1. Studies of the effect of changes in the dietary phosphorus intake on phosphorus and calcium metabo-lism. J. Agric. Sci. 110:573–581.
Clark, R. 1953. A study of the water-soluble phosphate concentra-tion of the ruminal contents in normal and phosphorus deficient animals. Onderstepoort J. Vet. Res. 26:137–140.
Dias, R. S., E. Kebreab, D. M. S. S. Vitti, F. P. Portilho, H. Lou-vandini, and J. France. 2007. Phosphorus kinetics in lambs fed different levels of dicalcium phosphate. J. Agric. Sci. 145:509–516.
Dias, R. S., E. Kebreab, D. M. S. S. Vitti, A. P. Roque, I. C. S. Bueno, and J. France. 2006. A revised model for studying phos-phorus and calcium kinetics in growing sheep. J. Anim. Sci. 84:2787–2794.
Dias, R. S., T. Silva, R. M. P. Pardo, J. C. Silva Filho, D. M. S. S. Vitti, E. Kebreab, S. López, and J. France. 2009. Rumen phosphorus metabolism in sheep. J. Agric. Sci. 147:391–398.
Fick, K. R., L. R. McDowell, P. H. Miles, N. S. Wilkinson, J. D. Funk, and J. H. Conrad. 1979. Methods of Mineral Analysis for Plant and Animal Tissues. 2nd ed. Univ. Florida, Gainesville.
Field, A. C., J. Kamphues, and J. A. Woolliams. 1983. The effect of dietary intake of calcium and phosphorus on the absorption and excretion of phosphorus in chimaera-derived sheep. J. Agric. Sci. 101:597–602.
Fiske, C. H., and Y. Subbarow. 1925. The colorimetric determina-tion of phosphorus. J. Biol. Chem. 66:375–400.
France, J., R. S. Dias, E. Kebreab, D. M. S. S. Vitti, L. A. Cromp-ton, and S. López. 2010. Kinetic models for the study of phos-phorus metabolism in ruminants and monogastrics. Pages 18–44 in Phosphorus and Calcium Utilization and Requirements in Farm Animals. D. M. S. S. Vitti and E. Kebreab, ed. CAB International, Wallingford, UK.
Geisert, B. G., G. E. Erickson, T. J. Klopfenstein, C. N. Macken, M. K. Luebbe, and J. C. MacDonald. 2010. Phosphorus require-ment and excretion of finishing beef cattle fed different concen-trations of phosphorus. J. Anim. Sci. 88:2393–2402.
Gilbert, N. 2009. The disappearing nutrient. Nature 461:716–718.Iqbal, M. U., Q. Bilal, G. Muhammad, and M. S. Sajid. 2005. Ab-
sorption, availability, metabolism and excretion of phosphorus in ruminants. Int. J. Agric. Biol. 7:689–693.
Ketaren, P. P., E. S. Batterham, and E. White. 1993. Phosphorus studies in pigs. 1. Available phosphorus requirements of grow-er/finisher pigs. Br. J. Nutr. 70:249–268.
Laflamme, G. H., and J. Jowsey. 1972. Bone and soft tissue changes with oral phosphate supplements. J. Clin. Invest. 51:2834–2840.
Lofgreen, G. P., and M. Kleiber. 1953. The availability of phospho-rus in alfalfa hay. J. Anim. Sci. 12:366–371.
Mañas-Almendros, M., R. Ross, and A. D. Care. 1982. Factors af-fecting the secretion of phosphate in parotid saliva in the sheep and goat. Q. J. Exp. Physiol. 67:269–280.
Mertens, D. R. 2002. Gravimetric determination of amylase-treated neutral detergent fiber in feeds using refluxing in beakers or crucibles: Collaborative study. J. AOAC Int. 85:1217–1240.
Moreira, V. R., L. K. Zeringue, C. C. Williams, C. Leonardi, and M. E. McCormick. 2009. Influence of calcium and phosphorus feeding on markers of bone metabolism in transition cows. J. Dairy Sci. 92:5189–5198.
Morse, D., H. H. Head, C. J. Wilcox, H. H. Van Horn, C. D. His-sem, and B. Harris. 1992. Effects of concentration of dietary phosphorus on amount and route of excretion. J. Dairy Sci. 75:3039–3049.
Nascimento Filho, V. F. 1977. Métodos de Determinação de Eficiên-cia de Detecção em Cintilação Líquida e Efeito Cerenkov. Bo-letim Didático No. 020. Centro de Energia Nuclear na Agricul-tura (CENA) USP-CNEN, Piracicaba, São Paulo, Brazil.
NRC. 2007. Nutrient Requirements of Small Ruminants: Sheep, Goats, Cervids, and New World Camelids. Natl. Acad. Press, Washington, DC.
Parthasarathy, D., G. A. Garton, and A. T. Phillipson. 1952. The passage of phosphorus across the rumen epithelium of sheep. Biochem. J. 52:xvi–xvii.
Pfeffer, E., and D. K. Beede, and H. Valk. 2005. Phosphorus metab-olism in ruminants and requirements of cattle. Pages 195–231 in Nitrogen and Phosphorus Nutrition of Cattle and the Environ-ment. E. Pfeffer and A. Hristov, ed. CAB Int., Wallingford, UK.
Pfeffer, E., M. Rodehutscord, and G. Breves. 1995. Effects of re-ducing dietary calcium and/or phosphorus on performance and body composition in male kids. J. Anim. Physiol. Anim. Nutr. (Berl.) 74:243–252.
Preston, R. L., and W. H. Pfander. 1964. Phosphorus metabolism in lambs fed varying phosphorus intakes. J. Nutr. 83:369–378.
Reinhart, G. A., and D. C. Mahan. 1986. Effect of various calcium:phosphorus ratios at low and high dietary phosphorus for starter, grower and finishing swine. J. Anim. Sci. 63:457–466.
Sarruge, J. R., and H. P. Haag. 1974. Colorimetric determination of phosphorus. Pages 6–58 in Chemical Analysis of Plants. Chemistry Department, Escola Superior de Agricultura Luiz de Queiroz (ESALQ), Piracicaba, Brazil.
Scarisbrick, R., and T. K. Ewer. 1951. The absorption of inorganic phosphate from the rumen of the sheep. Biochem. J. 49:LXX-IX. (Abstr.)
Schneider, K. M., R. C. Boston, and D. D. Leaver. 1982. The me-tabolism of phosphorus and calcium in sheep during intrave-nous infusion of phosphorus. Aust. J. Agric. Res. 33:827–842.
Schneider, K. M., R. C. Boston, and D. D. Leaver. 1987. Quantita-tion of phosphorus excretion in sheep by compartmental analy-sis. Am. J. Physiol. 252:R720–R731.
Scott, D., and W. Buchan. 1985. The effects of feeding either rough-age or concentrate diets on salivary phosphorus secretion, net intestinal phosphorus absorption and urinary phosphorus ex-cretion in the sheep. Q. J. Exp. Physiol. 70:365–375.
Scott, D., and W. Buchan. 1987. The effects of feeding either hay or grass diets on salivary secretion, net intestinal phosphorus ab-sorption and on the partition of phosphorus excretion between urine and faeces in the sheep. Q. J. Exp. Physiol. 72:331–338.
Scott, D., A. F. McLean, and W. Buchan. 1984. The effect of varia-tion in phosphorus intake on net intestinal phosphorus absorp-tion, salivary phosphorus secretion and pathway of excretion in sheep fed roughage diets. Q. J. Exp. Physiol. 69:439–452.
Scott, D., A. A. J. Rajaratne, and W. Buchan. 1995. Factors affect-ing faecal endogenous phosphorus loss in the sheep. J. Agric. Sci. 124:145–151.
4161Phosphorus metabolism model
at University of California, Davis on December 30, 2011jas.fass.orgDownloaded from
Scott, D., S. P. Robins, P. Nicol, X. B. Chen, and W. Buchan. 1994. Effects of low phosphate intake on bone and mineral metabo-lism and microbial protein synthesis in lambs. Exp. Physiol. 79:183–187.
Spiekers, H., R. Brintrup, M. Balmelli, and E. Pfeffer. 1993. Influ-ence of dry matter intake on faecal phosphorus losses in dairy cows fed rations low in phosphorus. J. Anim. Physiol. Anim. Nutr. (Berl.) 69:37–43.
Tamminga, S. 1996. A review on environmental impacts of nutri-tional strategies in ruminants. J. Anim. Sci. 74:3112–3124.
Taylor, M. S., K. F. Knowlton, M. L. McGilliard, W. S. Swecker, J. D. Ferguson, Z. Wu, and M. D. Hanigan. 2009. Dietary calcium has little effect on mineral balance and bone mineral metabo-lism through twenty weeks of lactation in Holstein cows. J. Dairy Sci. 92:223–237.
Ternouth, J. H., B. P. McLachlan, J. M. Clarke, and B. J. Thomas. 1993. Effects of dietary phosphorus and nitrogen deficiencies on the intake, growth and metabolism of lambs. J. Agric. Sci. 121:409–419.
Todd, A. S., O. T. Fosgate, R. G. Cragle, and T. H. Kamal. 1962. Parathyroid action on calcium, phosphorus, magnesium, and citric acid in dairy cattle. Am. J. Physiol. 202:987–990.
Tomas, F. M. 1973. Parotid salivary secretion in sheep: Its measure-ment and influence on phosphorus in rumen fluid. Q. J. Exp. Physiol. 58:131–138.
Tomas, F. M., R. J. Moir, and M. Somers. 1967. Phosphorus turn-over in sheep. Aust. J. Agric. Res. 18:635–645.
Vitti, D. M. S. S., E. Kebreab, J. B. Lopes, A. L. Abdalla, F. F. R. De Carvalho, K. T. De Resende, L. A. Crompton, and J.
France. 2000. A kinetic model of phosphorus metabolism in growing goats. J. Anim. Sci. 78:2706–2712.
Vitti, D. M. S. S., E. Kebreab, J. B. Lopes, A. L. Abdalla, and J. France. 2005. Effects of dietary supplementation on phosphorus metabolism in sheep. J. Anim. Vet. Advances 4:349–355.
Vitti, D. M. S. S., J. C. Silva-Filho, H. Louvandini, R. S. Dias, I. C. S. Bueno, and E. Kebreab. 2010. Phosphorus and calcium utilization in ruminants using isotope dilution technique. Pages 45–67 in Phosphorus and Calcium Utilization and Require-ments in Farm Animals. D. M. S. S. Vitti and E. Kebreab, ed. CAB Int., Wallingford, UK.
Wan Zahari, M., J. K. Thompson, D. Scott, and W. Buchan. 1990. The dietary requirements of calcium and phosphorus for grow-ing lambs. Anim. Prod. 50:301–307.
Wu, Z., L. D. Satter, and R. Sojo. 2000. Milk production, reproduc-tive performance, and fecal excretion of phosphorus by dairy cows fed three amounts of phosphorus. J. Dairy Sci. 83:1028–1041.
Yuen, D. E., and H. H. Draper. 1983. Long-term effects of excess protein and phosphorus on bone homeostasis in adult mice. J. Nutr. 113:1374–1380.
Zagatto, E. A. G., F. J. Krug, H. Bergamin, S. S. Jorgensen, and B. F. Reis. 1979. Merging zones in flow injection analysis: 2. Determination of calcium, magnesium and potassium in plant material by continuous-flow injection atomic-absorption and flame emission spectrometry. Anal. Chim. Acta 104:279–284.
4162 Dias et al.
at University of California, Davis on December 30, 2011jas.fass.orgDownloaded from

Referenceshttp://jas.fass.org/content/89/12/4151#BIBLThis article cites 49 articles, 12 of which you can access for free at:
at University of California, Davis on December 30, 2011jas.fass.orgDownloaded from