An experimental study of surface coatings to limit the impact of ...
55
Master of Science Thesis KTH School of Industrial Engineering and Management Energy Technology EGI-2018-711 Division of Applied Thermodynamics and Refrigeration SE-100 44 STOCKHOLM An experimental study of surface coatings to limit the impact of frosting Carl Andersson
-
Upload
khangminh22 -
Category
Documents
-
view
0 -
download
0
Transcript of An experimental study of surface coatings to limit the impact of ...

Master of Science Thesis
KTH School of Industrial Engineering and Management
Energy Technology EGI-2018-711
Division of Applied Thermodynamics and Refrigeration
SE-100 44 STOCKHOLM
An experimental study of surface
coatings to limit the impact of
frosting
Carl Andersson
Master of Science Thesis EGI 2018:711
An experimental study of surface coatings to
limit the impact of frosting
Carl Andersson
Approved
2018-10-18
Examiner
Björn Palm
Supervisor
Erik Björk
Commissioner
Contact person

i
Abstract
Heat pumps are commonly used as a way to efficiently meet heating demands. The efficiency and
flexibility of Air-source heat pumps (ASHPs) have improved in recent years and is an attractive heating
solution suitable for houses with lower heating demands, as it is inexpensive to purchase and install
compared to other heating solutions. However, ASHPs have a significant drawback as frost builds up on
the evaporator surface in certain conditions, reducing both the heating capacity and efficiency, and
therefore requiring regular defrosting to restore performance. Moreover, improvements for heat
exchanger designs allowing for more compact and efficient units have not been able to be fully utilized in
frosting conditions, as they are more quickly blocked by the buildup of frost and have poor meltwater
drainage during defrosting.
This thesis aims to experimentally investigate the potential of hydrophilic and hydrophobic surface
coatings to minimize the negative performance impact of frosting in Air-source heat pumps. A literature
study was performed as a basis for the experiments, covering previous research on how frosting affects
the performance of heat exchangers and ASHPs, methods, and control strategies for defrosting as well as
a theoretical background of the mechanisms governing condensation, frost formation and growth, wetting
and intended working principles of the tested surface treatments.
A test rig consisting of a wind tunnel inside a climate chamber was modified, and an automated defrost
control was implemented based on the reduction in air velocity. Seven different surfaces: one
superhydrophobic, five hydrophilic (one superhydrophilic, four hydrophilic foils), and one uncoated
aluminum surface were tested in frosting conditions over multiple cycles of frosting and defrosting. Test
conditions were held stable at a climate chamber set-point of 2 °C, 84 % RH and an initial air velocity
over the test plate of 2 m/s. Data was collected, and the performance was compared in terms of duty
cycle, (defined as the quotient between time operating in cooling mode and the time for a full cycle) and
observations were made regarding differences in behavior during frosting and defrosting.
Test results showed that there was a clear difference between the different types of surfaces. Over cycles
10 - 25 the five hydrophilic surfaces performed the best, having an average duty cycle of 0.83, compared
to the uncoated aluminum surface (0.69) and the superhydrophobic surface performing the worst with a
duty cycle of 0.56. A gradual drop in duty cycle was observed for all of the tested surfaces, both from a
shorter runtime and increased defrosting time. The variance in defrosting time was small between cycles.
However, there was a larger variation in runtime between individual cycles. Some visual observations of
the behavior during frosting and defrosting on the surfaces, such as the buildup of remaining meltwater
after several defrosting cycles were analyzed and discussed in relation to the measured performance.
ii
Sammanfattning
Värmepumpar används vanligtvis som ett sätt att effektivt uppfylla värmebehov. Effektiviteten och
flexibiliteten hos luftvärmepumpar (ASHP) har förbättrats de senaste åren och det är en attraktiv
uppvärmningslösning som är lämplig för hus med lägre värmebehov, bland annat eftersom det är billigt att
köpa och installera jämfört med andra uppvärmningslösningar. ASHPs har emellertid en betydande
nackdel eftersom frost byggs upp på förångarens yta under vissa förhållanden, vilket reducerar både
uppvärmningskapaciteten och effektiviteten, och därmed kräver regelbunden avfrostning för att återställa
prestandan. Dessutom har förbättringar för värmeväxlare och förångare möjliggjort mer kompakta och
effektiva enheter som inte kunnat utnyttjas fullt ut under förhållanden då frost bildas, eftersom de snabbt
blockeras av den växande frosten och har dålig avrinning av smältvatten vid avfrostning.
Denna avhandling syftar till att experimentellt undersöka potentialen hos hydrofila och hydrofoba
ytbeläggningar för att minimera den negativa påverkan av frostning på luftvärmepumpar. En
litteraturstudie utfördes som underlag för experimenten. Studien täckte tidigare forskning om hur frosting
påverkar luftberörda förångare och luftvärmepumpar, metoder och kontrollstrategier för avfrostning samt
en teoretisk bakgrund av mekanismerna för kondensation, frostbildning och frosttillväxt ,vätning samt
avsedda ändringar i egenskaper för de testade ytbehandlingarna.
En provrigg bestående av en vindtunnel inuti en klimatkammare modifierades och en automatiserad
avfrostningskontroll implementerades baserat på minskningen av lufthastigheten i vindtunneln. Sju olika
ytor, en superhydrofob, fem hydrofila (en superhydrofil samt fyra hydrofila folier) och en obelagd
aluminiumyta testades under frostningsförhållanden över flera cykler av frostning och avfrostning.
Testförhållandena hölls stabila vid ett börvärde i klimatkammare på 2 ° C, 84% RH och en initial
lufthastighet över testplattan av 2 m/s. Uppgifterna samlades in och prestanda jämfördes med avseende
på intermittensfaktor (definierad som kvoten mellan tiden som körs i kylningsläge och tiden för en
fullständig cykel) och observationer gjordes beträffande skillnader i beteende under frostning och
avfrostning.
Testresultaten visade att det var en tydlig skillnad mellan de olika typerna av ytor. Under cyclerna 10 - 25
presterade de fem hydrofila ytorna bäst, med en genomsnittlig intermittensfaktor på 0,83; jämfört med den
obelagda aluminiumytan (0,69) och den superhydrofoba ytan som hade den lägsta intermittensfakorn på
0,56. En gradvis minskning av intermittensfaktorn observerades för alla de testade ytorna, både på grund
av en kortare körtid och en ökad avfrostningstid. Avfrostningstiden varierade relativt lite mellan
individuella cykler, medan det var en större variation i körtid i kylningsläge mellan individuella cykler.
Vissa visuella observationer av beteendet under frostning och avfrostning på ytorna, såsom uppbyggnad
av återstående smältvatten efter flera avfrostningscykler, analyserades och diskuterades i förhållande till
den uppmätta prestandan.

iii
Preface
This master thesis was performed at the Division of Applied Thermodynamics and Refrigeration at the
Department of Energy Technology at KTH Royal Institute of Technology. The subject of this thesis was
part of a larger Effsys-Expand project, Effektivare avfrostning av luftberörda förångare headed by Professor
Björn Palm and Erik Björk at KTH in collaboration with Electrolux AB with the aim of evaluating several
different methods of increasing the efficiency of heat pumps operating in frosting conditions.
First of all I would like to thank my supervisor Erik Björk for giving me the opportunity to perform this
master thesis and for taking time to discuss new ideas or concepts and answer the many questions I had,
as well as your patience during the whole process. I would also like to thank Joachim Claesson, Peter Hill
and all the others at the department for your discussions where you have shared your knowledge and
given me invaluable tips during lunch and coffee breaks. Additionally, I would like extend another thanks
to Peter Hill for the help with learning and using Agilent VEE, which was used for the data collection and
defrost software. Furthermore, I would like to thank Benny Sjöberg for helping me use the equipment for
manufacturing the test plates. I would also like to thank Mikael Järn, Kenth Johansson and Mikko
Tuominen at RISE for manufacturing some of the tested surfaces as well as answering my questions
regarding surface science.
Lastly, I would like to thank my family, my girlfriend Johanna and my closest friends for their continuous
support and patience during the whole time, I truly appreciate it.
Stockholm, July 2018
Carl Andersson
iv
Table of Contents
Abstract ............................................................................................................................................................................ i
Sammanfattning ............................................................................................................................................................. ii
Preface ............................................................................................................................................................................ iii
List of figures ................................................................................................................................................................ vi
List of tables .................................................................................................................................................................. vi
Nomenclature............................................................................................................................................................... vii
Abbreviations .......................................................................................................................................................... vii
Symbols .................................................................................................................................................................... vii
1 Introduction .....................................................................................................................................................- 1 -
1.1 Background .............................................................................................................................................- 1 -
1.2 Aims and Purpose ..................................................................................................................................- 2 -
1.3 Methods ...................................................................................................................................................- 2 -
1.4 Limitations ..............................................................................................................................................- 2 -
2 Literature study ................................................................................................................................................- 4 -
2.1 Air source heat pumps ..........................................................................................................................- 4 -
2.1.1 Evaporators ....................................................................................................................................- 4 -
2.2 Wetting of a surface ...............................................................................................................................- 6 -
2.2.1 Contact angle .................................................................................................................................- 6 -
2.2.2 Surface tension ..............................................................................................................................- 7 -
2.2.3 Contact Angle Hysteresis .............................................................................................................- 7 -
2.2.4 Different wetting regimes on rough surfaces ...........................................................................- 8 -
2.2.5 Criticism of the Wenzel and Cassie-Baxter theories ...............................................................- 9 -
2.2.6 Droplet mobility ......................................................................................................................... - 10 -
2.3 Condensation and Frost formation .................................................................................................. - 12 -
2.3.1 Nucleation ................................................................................................................................... - 13 -
2.3.1.1 Homogenous nucleation ...................................................................................................... - 13 -
2.3.1.2 Heterogeneous nucleation ................................................................................................... - 15 -
2.3.1.3 Important considerations regarding nucleation ................................................................ - 16 -
2.3.2 Different stages of the early condensation frosting process ............................................... - 17 -
2.3.2.1 Supercooled condensation ................................................................................................... - 18 -
2.3.2.2 Onset of freezing ................................................................................................................... - 19 -
2.3.2.3 Frost halos .............................................................................................................................. - 19 -
2.3.2.4 Inter-droplet ice bridging and dry zones ........................................................................... - 19 -
2.3.2.5 Percolation clusters and frost densification ...................................................................... - 20 -
2.3.3 Frost thickness growth and frost properties.......................................................................... - 20 -
2.4 Defrosting ............................................................................................................................................ - 22 -
v
2.4.1 Different stages during the defrosting process ..................................................................... - 22 -
2.4.2 Control of defrosting ................................................................................................................. - 23 -
2.4.3 Different defrosting techniques ............................................................................................... - 24 -
2.4.4 Impact of surface treatments on defrosting efficiency ........................................................ - 24 -
2.5 Summary and Conclusions ................................................................................................................ - 25 -
3 Experiment .................................................................................................................................................... - 26 -
3.1 Experimental apparatus and instrumentation................................................................................. - 26 -
3.1.1 Climate chamber ........................................................................................................................ - 26 -
3.1.2 Wind tunnel ................................................................................................................................ - 27 -
3.1.3 Instrumentation .......................................................................................................................... - 28 -
3.1.4 Data acquisition software and defrost control ...................................................................... - 28 -
3.2 Tested surfaces .................................................................................................................................... - 29 -
3.3 Test procedure ..................................................................................................................................... - 31 -
3.3.1 Cleaning and mounting ............................................................................................................. - 32 -
3.3.2 Startup procedure....................................................................................................................... - 32 -
4 Results and discussion ................................................................................................................................. - 33 -
5 Conclusion ..................................................................................................................................................... - 40 -
6 Future work ................................................................................................................................................... - 40 -
References ............................................................................................................................................................... - 41 -

vi
List of figures
Figure 2.1 Contact angle of a drop resting on a surface, modified from[29]. .................................................- 6 -
Figure 2.2 Representation of the cohesive forces behind surface tension in a drop of water[31]. .............- 7 -
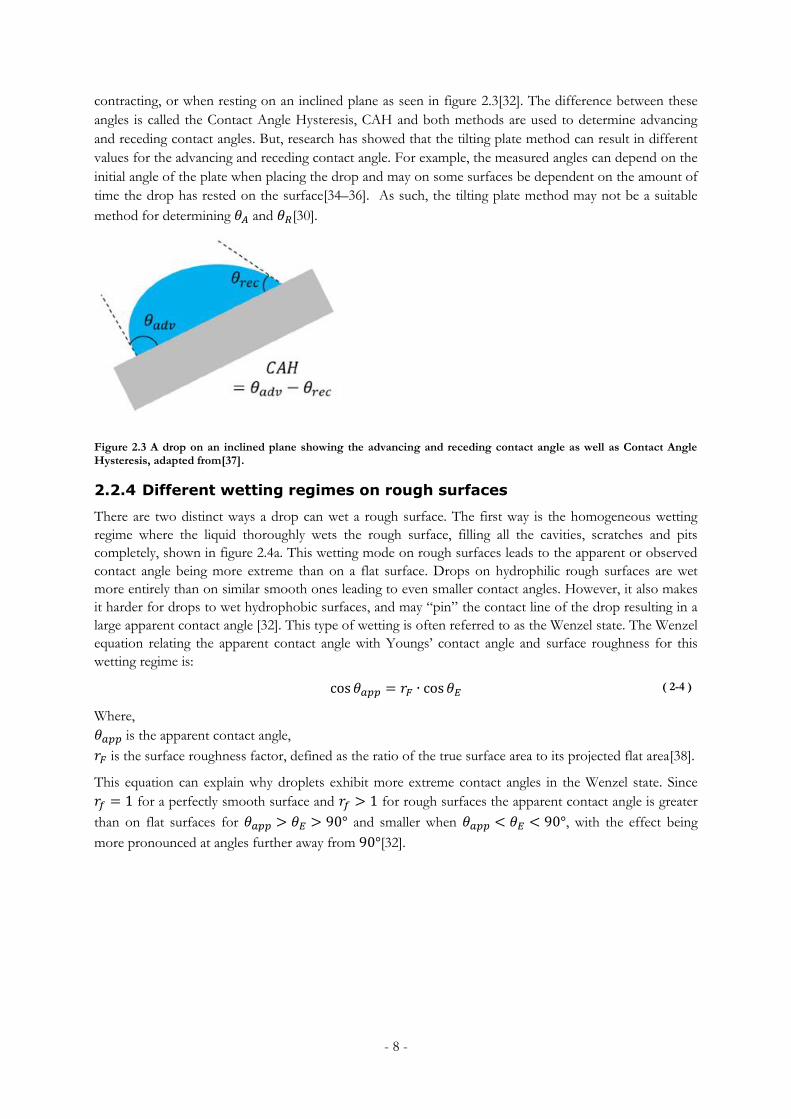
Figure 2.3 A drop on an inclined plane showing the advancing and receding contact angle as well as
Contact Angle Hysteresis, adapted from[37]. ......................................................................................................- 8 -
Figure 2.4 Schematic representation of two different wetting modes a) Homogeneous wetting and b)
Heterogeneous wetting, adapted from[39]. ..........................................................................................................- 9 -
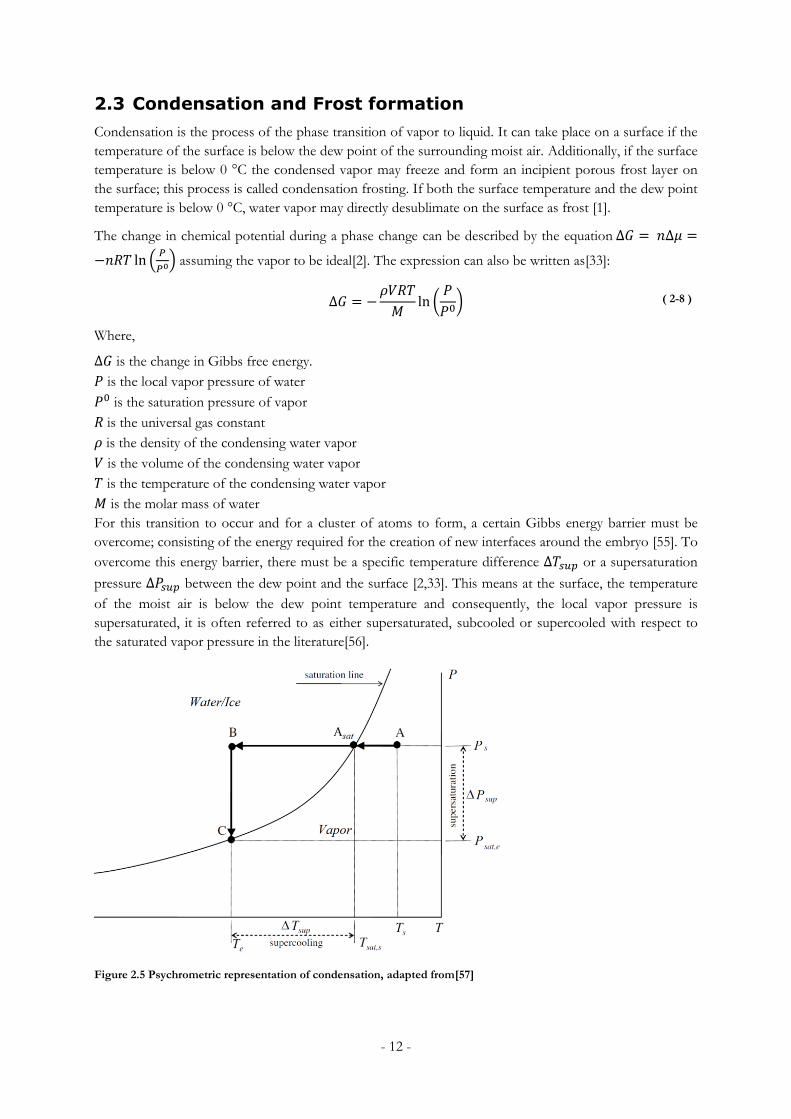
Figure 2.5 Psychrometric representation of condensation, adapted from[57] ............................................ - 12 -
Figure 2.6 Change in Gibbs free energy as a function of nuclei radius, adapted from [58] ...................... - 14 -
Figure 2.7 The different stages of dropwise condensation frosting, with each stage in chronological order.
The diagram on the left side indicates the different stages that may occur and the conditions necessary for
them to occur. Reprinted from[18]. ................................................................................................................... - 18 -
Figure 2.8 Typical frost structures of a hydrophilic and a hydrophobic surface. ........................................ - 21 -
Figure 2.9 Typical defrost temperature profile during a passive defrost. During active defrosting, there is
also a vaporizing and dry-heating stage with much higher temperatures after the frost has melted. ...... - 22 -
Figure 2.10 Frosting map; showing frosting regions based on temperature and humidity, constructed by
Zhu et al.[79] .......................................................................................................................................................... - 23 -
Figure 2.11 Common defrosting methods, adapted from[85]. ...................................................................... - 24 -
Figure 3.1 Schematic illustration of the climate chamber. The heating and cooling unit on the left side is
mounted to the roof. ............................................................................................................................................. - 26 -
Figure 3.2 Schematic illustration of the wind tunnel. ...................................................................................... - 27 -
Figure 3.3 Picture of the wind tunnel. ................................................................................................................ - 27 -
Figure 3.4 Schematic illustration of the cooling module and test plate. ....................................................... - 28 -
Figure 3.5 Simplified flowchart of the data collection and defrost control program ................................. - 29 -
Figure 3.6 Test plate dimensions and features. ................................................................................................. - 30 -
Figure 4.1 Test plate temperature for three of the tested surfaces ................................................................ - 33 -
Figure 4.2 Percentage of time spent running for each of the 30 first cycles................................................ - 34 -
Figure 4.3 Cycle times for the 30 first cycles .................................................................................................... - 35 -
Figure 4.4 Runtime for the 30 first cycles ......................................................................................................... - 35 -
Figure 4.5 Defrost time for the 30 first cycles .................................................................................................. - 35 -
Figure 4.6 Duty cycle for each surface over cycles 10-25 with a standard deviation ................................. - 36 -
Figure 4.7 Retained water after defrosting for 4 of the tested surfaces, a) after 1 cycle, b) after 3 cycles, c)
after 5 cycles, d) after 10 cycles, d) after 20 cycles. The image on the left shows a zoomed in view and the
image on the right shows a view of the rightmost part of the test plate from top to bottom. ................. - 38 -
Figure 4.8 Observation of different freezing behavior. Top row shows an image during freezing and the
bottom row shows the uncoated and superhydrophilic surface 30 seconds later, and the superhydrophobic
surface 5 minutes later. ......................................................................................................................................... - 39 -
List of tables
Table 1 Contact angles of the tested surfaces ................................................................................................... - 31 -
Table 2 Test conditions during experiments ..................................................................................................... - 31 -
Table 3 Test conditions and settings used during testing. .............................................................................. - 31 -
Table 4 Summary of test runs for the seven tested surfaces .......................................................................... - 33 -

vii
Nomenclature
Abbreviations
ASHP Air-Source Heat Pump
CAH Contact Angle Hysteresis
CNT Classical Nucleation Theory
COP Coefficient of Performance
SAM Self-Assembled Monolayer
Symbols
𝐴 Interface area [m2]
𝐴𝑙𝑣 Area of the liquid-vapor interface [m2]
𝐴𝑠𝑙 Area of the solid-liquid interface [m2]
𝐶𝑂𝑃1𝐶𝑎𝑟𝑛𝑜𝑡 Coefficient of Performance of heating for a Carnot cycle
𝑓 Solid surface area fraction
𝑔 Gravitational acceleration [m/s2]
∆𝐺 Change in Gibbs free energy [J]
∆𝐺𝑐 Critical energy barrier for successful nucleation [J]
𝐼 Pre-exponential factor
𝐽 Embryo formation rate
𝑘𝐵 Boltzmann constant [J/K]
𝐿 Effective contact line length [m]
𝑚 Mass [kg]
𝑀 Molar mass [kg/mol]
𝑃𝑣 Local vapor pressure [Pa]
𝑃𝑣0 Saturation pressure of vapor [Pa]
∆𝑃 Pressure difference between the inside and the outside of the drop [Pa]
𝑟 Radius [m]
𝑟𝑐 Critical droplet radius [m]

viii
𝑟𝐹 Surface roughness factor
𝑅 Universal gas constant [J/mol∙K]
𝑅1−2 Radius of curvature [m]
𝑇 Temperature [K]
𝑇𝐶 Temperature at the cold side [K]
𝑇𝐻 Temperature at the hot side [K]
𝑉 Volume [m3]
𝑊𝑎𝑑ℎ Work of adhesion required to remove a drop from a surface
𝛾𝑙𝑣 Liquid-vapor surface tension [N/m]
𝛾𝑠𝑙 Solid-liquid surface tension [N/m]
𝛾𝑠𝑣 Solid-vapor surface tension [N/m]
𝜃𝐴 Advancing contact angle [°]
𝜃𝑎𝑝𝑝 Apparent contact angle [°]
𝜃𝐸 Static contact angle or Young’s angle [°]
𝜃𝑅 Receding contact angle [°]
𝜃𝑇 Tilt angle of the plate [°]
𝜌 Density of the condensing water vapor [kg/m3]
𝜎 Surface free energy [J/m2]
𝜎𝑙𝑣 Liquid-vapor surface energy [J/m2]
𝜎𝑠𝑙 Solid-liquid surface energy [J/m2]
𝜎𝑠𝑣 Solid-vapor surface energy [J/m2]
- 1 -
1 Introduction
1.1 Background
Condensation can occur on a surface if the temperature of the surface is below the dew point of the
surrounding moist air. Additionally, if the temperature of the surface is below 0 °C, frost will start to form
on the surface; either by condensing and then freezing (called condensation frosting), or by directly
desublimating on the surface[1]. In many engineering applications involving heat transfer, condensation is
often favorable since it can lead to significantly increased heat transfer. Frost, which is also commonly
occurring is generally not preferable[2]. The accretion of frost and ice has a negative impact on the
performance or safety in many different fields, for example, wind turbines, aviation, power lines, and
refrigerant-to-air heat exchangers[3–6]. Although the mechanisms governing the formation of frosting and
icing are different, they share many similarities and objects exposed to frosting conditions may experience
icing from supercooled rain or fog as well.
For low-energy houses, air-source heat pumps (ASHPs) are an attractive heating solution because of the
low installation cost and low heating capacity requirement. As the usability, efficiency and capacity of
ASHPs improve and heating requirements decrease, heating solutions with a lower investment cost such
as ASHPs are expected to become more attractive[7].
Despite being frequently used in other climates; air source heat pumps have one major problem during
certain conditions. When the evaporator temperature is below 0°C, which happens with an outdoor
temperature a bit over 0°C and especially during humid conditions there is a significant buildup of frost
on the heat exchanger fins. This buildup of frost can cause several problems in the heat exchangers,
leading to a reduced performance or even damage[8]. Frost buildup may reduce or obstruct the airflow
over the heat exchanger, leading to a higher pressure drop and reduced air flow. This leads to a decrease in
heat transfer[9]. The frost also acts as an insulating layer, lowering the heat transfer between the air and
the evaporator. These two effects can lead to a heat transfer reduction in the heat exchanger by as much
as 50 – 75 %, and a capacity decrease of 29 %[5,10]. The lowered heat transfer also leads to lower energy
efficiency for the heat pump and unless defrosted, can make the heat pump unable to meet the heating
demand.
Improvements in modern heat exchangers consisting of flat multichannel tubes and louvered fins have
increased the heat transfer and have allowed heat exchangers to become more compact and efficient. In
addition to this, microchannel heat exchangers require less refrigerant charge than conventional fin-and-
tube heat exchangers, because of their much smaller refrigerant channels and more compact size [11]. One
major drawback of these new heat exchangers is that they are much more susceptible to frosting for two
major reasons. Firstly, frost builds up and obstructs the airflow between the fins more quickly because of
the tight fin spacing. Secondly, heat exchangers with flat tubes and louvered fins generally have poor
drainage of water during defrosting cycles which allow the remaining water to quickly freeze again[12–14].
Many areas of Sweden experience conditions where frosting occurs, with temperatures between 6 °C and
-15 °C and over 50 % humidity during as much as 34 - 73 % of all hours annually [15]. In these areas, the
reduction in efficiency of ASHPs with traditional heat exchanger designs during frosting conditions is
around 10 %[16]. Using the modern design of heat exchangers with flat multichannel tubes and tightly
spaced louvered fins the percentage of efficiency decrease during frosting is expected to be increased and
may negate the possible efficiency improvements compared to traditional evaporator designs. Thus,
reducing these problems allows manufacturers to use these new types of heat exchangers in environments
where frosting may occur.
The majority of research on frosting has historically been focused on modeling the growth and properties
of the frost layer thickness, and often ignored or simplified the different incipient modes of frosting. For
example, the incipient stages of frost formation from dropwise condensation frosting, film condensation
frosting and deposition differ and results in frost with different properties. A study by Sommers et al.
- 2 -
showed that the frost density on hydrophilic surfaces was 20 - 26 % higher and hydrophobic surfaces had
a 37 - 41 % reduced frost density compared to an uncoated aluminum surface[17]. The focus of many
previous studies has been from an engineering standpoint of correlating environmental properties such as
temperature, humidity and air velocity with properties of the frost such as thermal properties, density and
growth rate to find useable models for predicting performance under frosting characteristics. However,
many earlier models have ignored the incipient stage; condensation and the onset of freezing, as well as
not included the surface wettability, focusing predominantly on modeling the properties during the frost
thickness growth and the mature frost growth stage[17].
In recent years, with the breakthroughs in nanotechnology and ease of manufacturing functional surface
coatings with hydrophilic or hydrophobic properties, more research has been done on the effect of
surface coatings during frosting conditions. Older studies have mainly been on untreated surfaces, and
often without taking surface characteristics into consideration.
The hydrophilic or hydrophobic characteristics of a surface affect the incipient stages of condensation and
frost formation; before it is completely covered and the frost layer begins to grow in the thickness
direction. There have also been some studies concerning the incipient stages of frosting in the last years
focusing on the mechanisms governing the incipient stages of frosting[1,18,19].
1.2 Aims and Purpose
The aim of this thesis is to investigate the potential of surface treatments to minimize the impact of
defrosting in heat pumps. This thesis is done as a part of a larger project in order to increase the efficiency
of ASHPs in conditions where frosting can occur and in a broader perspective contribute to a reduced
energy usage. Lastly, this thesis aims to contribute to the knowledge of what types of surface
characteristics are desirable to minimize the impact of frost formation.
1.3 Methods
As a first step, a literature study was performed investigating how frosting affects ASHPs, what different
methods for defrosting are used and different control strategies for initiating defrost cycles. The
mechanisms governing condensation, frost formation, nucleation and frost thickness growth, as well as
wetting and hydrophobic and hydrophilic surface treatments have been studied to gain a deeper
understanding of the problem and the different approaches used to minimize the impact of frosting.
Previous research in this area is also studied and compared.
Next, experiments were performed. A wind tunnel used for the experiments was modified with additional
measurement probes, and a number of test runs were performed to ensure steady conditions could be
achieved at the desired level. In addition to this, a program was created in the software Agilent VEE to
collect the measurements and to automate the test procedure to ensure reliable initiation and ending of
defrosting cycles. After this, seven different surfaces were tested in multi-cycle tests during frosting
conditions and data was collected and evaluated.
In the end, the experimental results from the tests such as duty cycle, the time between defrosting and
time spent defrosting as well as visual observations for the different surfaces was compared and analyzed.
1.4 Limitations
This degree project is conducted in one semester and has therefore been limited to correspond to this
timeframe. The work has been limited to investigating only frost formation resulting from condensation
frosting on a flat vertical plate in a wind tunnel and not on an actual evaporator surface of an air heat
pump in operation. These experiments aim to demonstrate a general potential for mitigating the effect of
frosting and reducing energy use for an air heat pump and for a more general result that can then be used
as a basis for future studies on air heat pumps.

- 3 -
A delimitation was made when the study only examines the kind of frost formation that occurs when the
moisture first condenses on the surface and then freezes (condensation frosting). Other types of frost
formation, by desublimation or ice formation coming from supercooled rain or fog, are not examined.
The study was performed on seven different surfaces.
The size and scope of the research surrounding the various stages of frost formation, heat and mass
transfer and thermal properties of frost, surface treatments, and strategies to minimize the impact of
frosting are immense, and the research area is not exhausted. This is indicated by the fact that no practical
passive solution to avoid frost formation has been found that doesn’t disrupt operation; despite the fact
that the problem of frost formation has always existed, and been known in areas where the climate allows
this to happen.
As such, this thesis is limited in its extent.
- 4 -
2 Literature study
Several different concepts are of importance for understanding and characterizing the behavior during
condensation frosting and defrosting. This chapter has been divided into different parts, covering
different subjects related to the performance of different surfaces during frosting and defrosting and the
connections between the different parts. The parts are mainly presented in chronological order, as they
occur during frosting and then defrosting. In addition, the impact of surface characteristics during the
individual stages of condensation frosting and defrosting is discussed.
2.1 Air source heat pumps
A heat pump works by extracting heat from a lower temperature source and rejects heat to a higher
temperature heat sink. Air source heat pumps use the outside air as a low-temperature heat source to heat
the inside of a house.
The main components of a heat pump operating a vapor compression cycle are the compressor,
evaporator, condenser and an expansion device, usually a valve. The heat transfer is done by using an
appropriate working fluid, often called a refrigerant that circulates between the hot and cold side of the
heat pump.
The basic principle of a heat pump is that the compressor maintains two pressure levels and temperatures
at either side of the heat pump. At the lower temperature and pressure side, the refrigerant is allowed to
evaporate in the evaporator and thus absorb latent heat from the low-temperature source. The vaporized
refrigerant is then compressed and enters the high-temperature side where it condenses and rejects the
heat to the high-temperature heat sink. The refrigerant then passes through the expansion device and
enters the low-pressure side to complete the cycle.
The maximum theoretical heating efficiency of an ASHP can be calculated by its Coefficient of
Performance, (COP).
𝐶𝑂𝑃1𝐶𝑎𝑟𝑛𝑜𝑡 =𝑇𝐻
𝑇𝐻 − 𝑇𝐶 ( 2-1 )
Where,
𝐶𝑂𝑃1𝐶𝑎𝑟𝑛𝑜𝑡 is the Coefficient of Performance of heating for a Carnot cycle
𝑇𝐻 is the temperature at the hot side in Kelvin.
𝑇𝐶 is the temperature at the cold side in Kelvin.
During frosting the frost acts both as an insulating layer evaporator increasing the thermal resistance and
blocks airflow over the evaporator, further decreasing heat transfer[20]. The lowered heat transfer leads to
a decrease in the rate of evaporation in the evaporator, and a decrease of the evaporator superheat;
causing a pressure and temperature drop in the evaporator. This, in turn, causes a lower refrigerant flow
and a lower compressor work; however, the decrease in evaporator heat transfer is much more significant
than the reduction in compressor work[21]. In summary, this leads to a drop in both heating capacity and
a lower COP of the system[20].
2.1.1 Evaporators
In an ASHP, as the name implies the evaporator uses air as a heat source. Evaporators are usually
designed with the refrigerant flowing in tubes and the air passing over them. Since the heat transfer
coefficient of air is much lower than the refrigerant flowing in the tube, fins are used to increase the air-
side heat transfer area, and a fan is used to further increase the heat transfer by forced convection.
The types of heat exchangers used are usually categorized by the shape of the section in which the
refrigerant flows in, either a tube or a plate and the shape of the fins surrounding the tube or plate[22].
- 5 -
To further increase the heat transfer, rather than having straight fins, modern heat exchangers fins are
wavy or have strips cut and lifted in them; so called louvered fins to reduce the boundary air film thickness
[23,24].
Older designs for ASHPs used in areas that may experience frosting conditions had evaporators with a fin
spacing of around 5-6 mm to improve the time between defrosting, but modern designs utilizing a more
effective defrosting process can have fin spacing as close as 1.3 to 2.5 mm[23].
In summary, heat exchangers with tighter fin spacing are more affected by frosting than fins with wider fin
spacing. An experiment performed by E. Macchi et al. on fin-tube evaporators with different fin spacing
(2, 4.5 and 7 mm) showed that the reduction in performance was more significant for the evaporator with
closely spaced fins compared to the one with a wider fin spacing[25]. The most important factor behind
the performance drop was the reduction in air velocity and mass flow over the evaporator from the frost
which was more severe for the tighter spaced fins[25,26]. In line with this, compact microchannel
evaporators were shown to be less effective than conventional fin-and-tube coil evaporators during
frosting conditions[13,14].
- 6 -
2.2 Wetting of a surface
Wettability describes the tendency of a liquid to spread out when placed on a solid or another liquid. This
happens because of an imbalance of forces when two materials contact[27]. This imbalance causes the
liquid drop to either increase the contact area by spreading out on the surface or balling up, minimizing
the contact area with the surface. Theories relating to wetting and in particular the wetting of rough
surfaces and droplet mobility are reviewed as well as the difference between different contact angles and
their correlation with different properties such as droplet mobility. As such, the theory and concepts
presented in this section are important in many different aspects that determine the performance of a
surface during frosting conditions and defrosting. For example, a surface with high droplet mobility (low
hysteresis) should have excellent drainage characteristics, allowing condensate droplets to slide off before
freezing and leave less water on the surface after defrosting, whereas a surface with a low droplet mobility
(large hysteresis) may retain a lot of meltwater after defrosting that quickly refreezes and reduces
performance
2.2.1 Contact angle
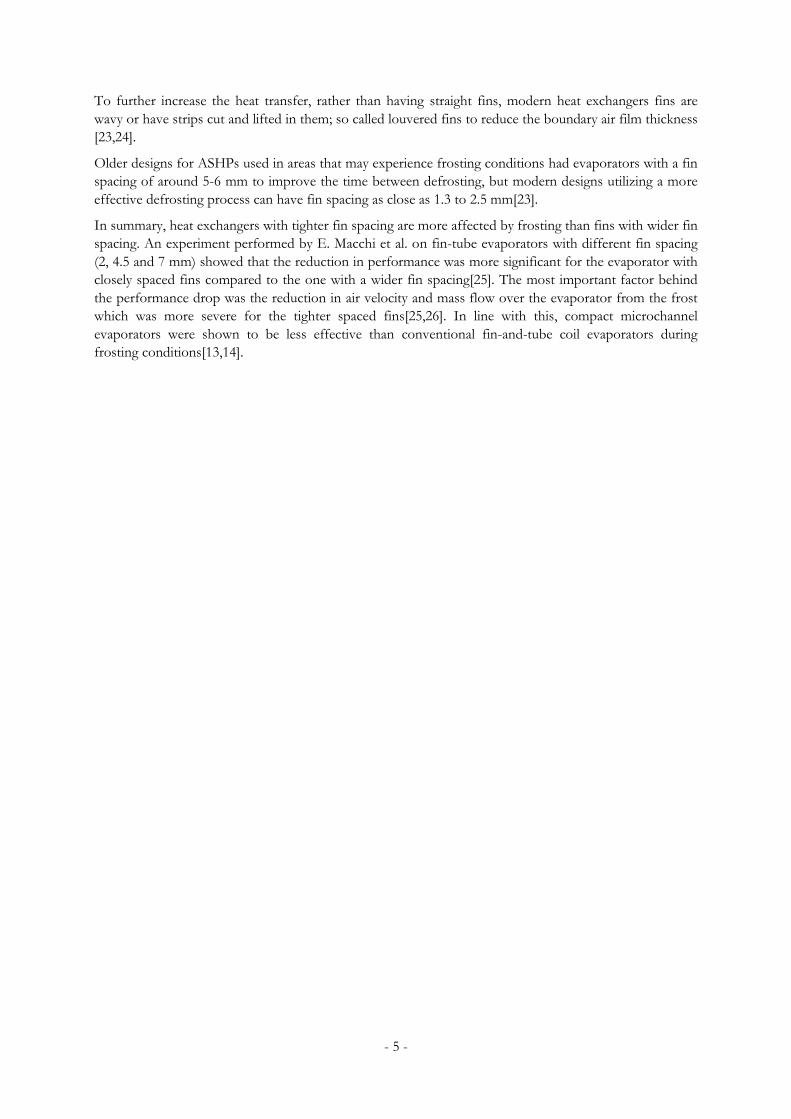
In the case of a pure liquid on a perfectly flat surface, the liquid drop will have a particular angle at the
intersection of the liquid-solid and liquid-vapor interface measured by the tangent line from the three
phase contact line and along the liquid-vapor interface as shown in figure 2.1[28].
Figure 2.1 Contact angle of a drop resting on a surface, modified from[29].
This angle, 𝜃 called the static contact angle is an often used measurement to determine the wettability of a
surface. Drops with a small contact angle (𝜃 < 90°) have a tendency to lay flat and spread over a large
area, indicating low wettability while drops while drops with a large contact angle (𝜃 > 90°) will tend to
not spread out and is said to have a poor wettability[28]. The angle is the result of a mechanical
equilibrium of the different forces acting on the three-phase contact line. When stationary, in mechanical
equilibrium the forces on the drop are described by Young’s equation [30].
𝛾𝑠𝑣 − 𝛾𝑠𝑙 − 𝛾𝑙𝑣 cos 𝜃𝐸 = 0 ( 2-2 )
Where,
𝛾𝑠𝑣 is the solid-vapor surface tension
𝛾𝑙𝑣 is the liquid-vapor surface tension, often simply referred to as the surface tension
𝛾𝑠𝑙 is the solid-liquid surface tension
𝜃𝐸 is the static contact angle or Young’s angle
- 7 -
2.2.2 Surface tension
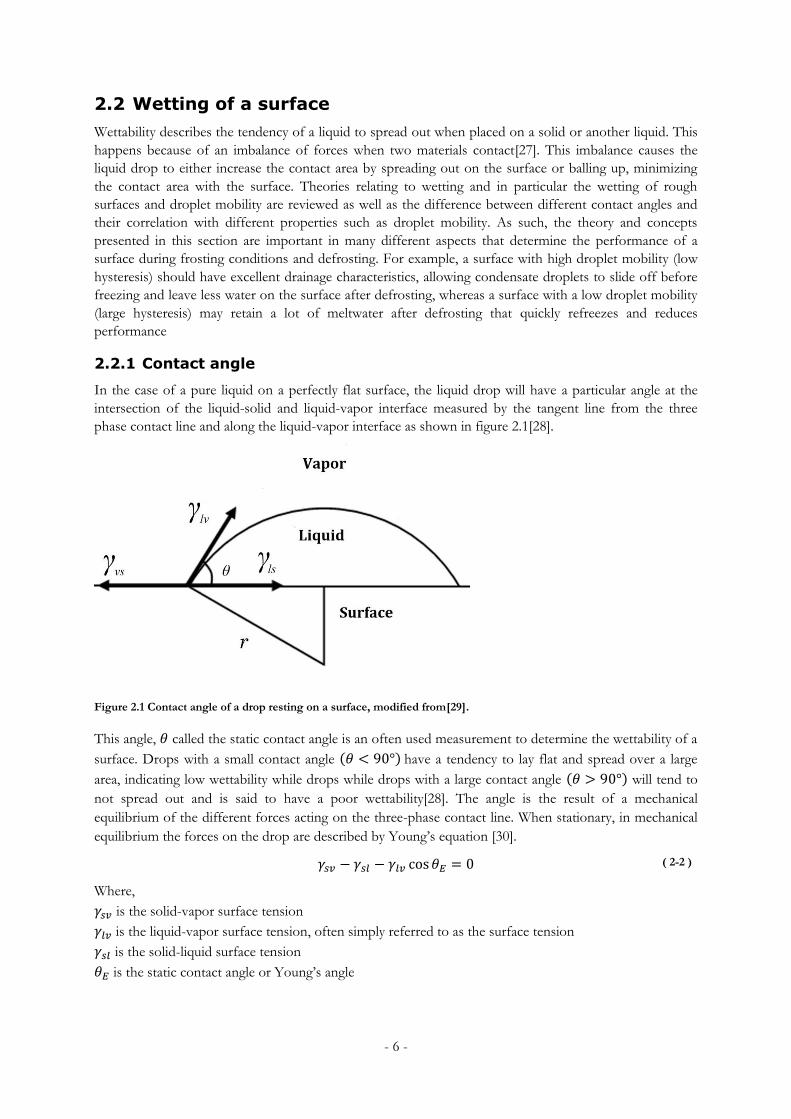
The surface tension of the liquid mainly determines the shape of a droplet. In a single-component liquid
such as pure water, each molecule in the interior of the droplet is pulled in by the surrounding molecules
equally from all directions. But the molecules at the surface of the droplet are pulled in by the cohesive
forces from the surrounding molecules towards the center, creating an internal pressure as shown in figure
2.2. Other external forces such as gravity also influence the shape of a drop, and as such, the contact angle
is dependent on both surface tension (interfacial forces) and external forces[28].
Figure 2.2 Representation of the cohesive forces behind surface tension in a drop of water[31].
The increased pressure in a drop due to the surface tension is called Laplace pressure and is determined by
the Young-Laplace equation, which for a spherical drop (𝑟 = 𝑅1 = 𝑅2) becomes:
∆𝑃 = 𝛾𝑙𝑣 (1
𝑅1+
1
𝑅2) =
2𝛾
𝑟 ( 2-3 )
Where,
∆𝑃 is the pressure difference between the inside and the outside of the drop [Pa]
𝛾𝑙𝑣 is the surface tension of the drop [N/m]
A result of the Young-Laplace is that the pressure is larger in smaller drops as they have a smaller radius
curvature than larger drops[32]. The effect provides an explanation for the ability of water vapor to
supersaturate before a phase change is initiated. The phase change that occurs when water vapor
condenses on a plate starts with microscopic droplets or clusters that then grow in size before they are
visible to the human eye. The microscopic droplets have a large internal pressure and require a certain
activation energy to form the surface of the new droplet[33].
2.2.3 Contact Angle Hysteresis
In the above examples, it has been assumed that the liquid droplets consist of pure water and are placed
on an ideal, perfectly homogenous and flat surface without defects. In that case, the angle observed for a
drop resting on the surface is the correct contact angle according to Young’s equation. However, in reality
a surface has chemical or physical imperfections such as dirt or scratches. A drop resting on a non-ideal
surface may show a contact angle greater or smaller than the theoretical contact angle. A drop resting on
the real, non-ideal surface will show a changing contact angle without spreading or moving when water is
added or removed from the drop or the drop is tilted. The drop will show a maximum or a minimum
angle, known as advancing contact angle 𝜃𝐴 and receding contact angle 𝜃𝑅 (RCA) before spreading or
- 8 -
contracting, or when resting on an inclined plane as seen in figure 2.3[32]. The difference between these
angles is called the Contact Angle Hysteresis, CAH and both methods are used to determine advancing
and receding contact angles. But, research has showed that the tilting plate method can result in different
values for the advancing and receding contact angle. For example, the measured angles can depend on the
initial angle of the plate when placing the drop and may on some surfaces be dependent on the amount of
time the drop has rested on the surface[34–36]. As such, the tilting plate method may not be a suitable
method for determining 𝜃𝐴 and 𝜃𝑅[30].
Figure 2.3 A drop on an inclined plane showing the advancing and receding contact angle as well as Contact Angle Hysteresis, adapted from[37].
2.2.4 Different wetting regimes on rough surfaces
There are two distinct ways a drop can wet a rough surface. The first way is the homogeneous wetting
regime where the liquid thoroughly wets the rough surface, filling all the cavities, scratches and pits
completely, shown in figure 2.4a. This wetting mode on rough surfaces leads to the apparent or observed
contact angle being more extreme than on a flat surface. Drops on hydrophilic rough surfaces are wet
more entirely than on similar smooth ones leading to even smaller contact angles. However, it also makes
it harder for drops to wet hydrophobic surfaces, and may “pin” the contact line of the drop resulting in a
large apparent contact angle [32]. This type of wetting is often referred to as the Wenzel state. The Wenzel
equation relating the apparent contact angle with Youngs’ contact angle and surface roughness for this
wetting regime is:
cos 𝜃𝑎𝑝𝑝 = 𝑟𝐹 ∙ cos 𝜃𝐸 ( 2-4 )
Where,
𝜃𝑎𝑝𝑝 is the apparent contact angle,
𝑟𝐹 is the surface roughness factor, defined as the ratio of the true surface area to its projected flat area[38].
This equation can explain why droplets exhibit more extreme contact angles in the Wenzel state. Since
𝑟𝑓 = 1 for a perfectly smooth surface and 𝑟𝑓 > 1 for rough surfaces the apparent contact angle is greater
than on flat surfaces for 𝜃𝑎𝑝𝑝 > 𝜃𝐸 > 90° and smaller when 𝜃𝑎𝑝𝑝 < 𝜃𝐸 < 90°, with the effect being
more pronounced at angles further away from 90°[32].

- 9 -
Figure 2.4 Schematic representation of two different wetting modes a) Homogeneous wetting and b) Heterogeneous wetting, adapted from[39].
In the second mode of wetting a textured surface on which the droplet rests on is heterogeneous. Since
the surface is a composite, i.e., from two or more materials (or air), each with their own corresponding
Young’s contact angle, the apparent contact angle is a result of all of the different materials[32]. If a rough
material is hydrophobic it is possible for liquid to not completely wet the surface; instead, pockets of air
can become trapped in the cavities and pores of the surface forming a heterogeneous, composite solid-air
interface. Droplets rest on the bumps of the surface and the trapped pockets of air as shown in figure
2.4b. Droplets in this wetting state typically exhibit very large contact angles and low contact angle
hysteresis[30]. As such only a fraction of the contact is between the liquid and the solid surface, and the
rest is between the liquid and the trapped air. This wetting regime is often referred to as the Cassie-Baxter
state. The equation describing the apparent contact angle in this example is a particular case of an equation
called Cassie’s law that applies to wetting of composite surfaces. When a liquid droplet rests on a
composite interface of trapped air and a homogeneous solid surface the Cassie-Baxter equation
becomes:[30]
cos 𝜃𝑎𝑝𝑝 = 𝑓 ∙ cos 𝜃𝐸 + (𝑓 − 1) ( 2-5 )
Where,
𝑓 is defined as the solid surface area fraction.
As seen from this equation, a low solid surface area fraction leads to a significantly increased apparent
contact angle. In some cases, the equation is also presented with the addition of a surface roughness factor
similar to the one in the Wenzel equation added to 𝑓 ∙ cos 𝜃𝐸 , to account for geometry and roughness
factors on the structure[40,41].
A droplet resting on a rough surface can exhibit either of the two wetting states or a combination and can
transition from one state to the other.
Surface roughness on hydrophobic materials leads to higher contact angles in both of the wetting modes.
The highest contact angles reported on smooth surfaces is approximately 120°, surfaces exhibiting higher
contact angles have some form of surface roughness that leads to a higher apparent contact angle[42].
2.2.5 Criticism of the Wenzel and Cassie-Baxter theories
Both theories by Wenzel and Cassie have been criticized in many papers as early as 1945 for the premise
that the contact angle is a result of the solid-liquid contact area, and not the three-phase contact line[30]. A
paper titled “How Wenzel and Cassie Were Wrong” published in 2007 by McCarthy and Gao aimed at
bringing attention to the fact that the contact angle is determined by the forces acting on the three-phase
line and employed an experiment designed to illustrate this[43]. The experiment was similar to a previous
experiment done by Extrand in 2003, both using specially prepared surfaces with a different surface in a
- 10 -
small area that would be entirely inside the contact area of the drop[30,44]. Extrand used two surfaces,
one hydrophilic surface with a hydrophobic spot in the middle and a mildly hydrophobic surface with a
mildly hydrophilic spot, and Gao and McCarthy used a mildly hydrophobic surface with a
superhydrophobic spot inside the contact area of the droplet. Both experiments showed that the
conditions at the three-phase line determined the contact angle and not the contact area[30]. From this,
McCarthy and Gao argued that the knowledge that the contact area approach made by Wenzel and Cassie
were wrong was nothing new; as shown by earlier publications. But, since nothing has changed in the field
and that the belief that the characteristics of contact area determined contact angle still exist, they felt that
it was necessary to try and correct this misconception[45,46].
However, most researchers agree that Wenzel’s and Cassie’s theories are of great importance in surface
science and that they are useful, even if the derived equations are faulty, and in order to successfully use
them their inaccuracies should be known[30,43,45,46]. Since then several different approaches have been
proposed, such as using a modified version of the original Wenzel and Cassie-Baxter equations using the
specific roughness or area fractions along the three-phase contact line[43].
2.2.6 Droplet mobility
An important aspect in wetting studies is the ability of a drop to resist movement. The amount of force
needed for a drop to start moving or the tilt angle needed on an inclined plate for a drop to slide off is
critical in many situations both in nature and in engineering applications, for example in the case of water
drainage on evaporator surfaces. The force or tilt angle required to move a drop along a surface is a
function of the contact angle hysteresis and have been expressed by many similar equations, where one of
the notable early expressions were proposed in 1962 by Furmidge[45]. Below is a more recent example
from a 2013 article by Wu et al. including a coefficient for the effective contact line length[47]
𝐹 = 𝑚𝑔 sin 𝜃𝑇 = 𝐿𝛾(cos 𝜃𝑅 − cos 𝜃𝐴) ( 2-6 )
Where;
𝑚 is the mass of the liquid droplet
𝑔 is the gravitational acceleration
𝜃𝑇 is the tilt angle of the plate
𝐿 is the effective contact line length
𝜃𝑅 is the receding contact angle
𝜃𝐴 is the advancing contact angle
Here, L is dependent on the surface geometry of the surface roughness and determines the effective
length on which surface tension forces are applied along the contact line[47]. This variable, the effective
contact line length, exists in several variants and is also expressed as the drop diameter or radius times a
geometry factor[36,48].
The work required to remove a drop from a surface is also important, often referred to as the work of
adhesion. The work can be calculated by the Young-Dupré equation and relates the work of adhesion to
Young’s contact angle. However, since drops resting on real surfaces exhibit hysteresis and the receding
contact angle is the minimum contact angle drops exhibit when shrinking; the work of adhesion is
sometimes expressed by the receding contact angle instead of the static contact angle[49]. Both versions
continue to be used, and it seems that there is no clear consensus on which is correct as seen by a
comment on and a subsequent reply on a recent publication[50–52].
𝑊𝑎𝑑ℎ = 𝛾(1 + cos 𝜃𝑅) ( 2-7 )
Where,
𝑊𝑎𝑑ℎ is the work of adhesion required to remove a drop from a surface.
In summary, these two equations (2-6 and 2-7) show that droplet sliding and adhesion are different
mechanisms, and that a surface exhibiting a very high contact angle may not necessarily mean that
- 11 -
droplets can slide off easily. Since only the static contact angle is used in almost all cases to define whether
a surface is hydrophobic or hydrophilic, the terms may be misleading since there is no direct behavior
related to the terms[53]. A hydrophilic surface with low contact angle hysteresis may very well be
“slippery,” requiring a very low tilt angle or force for droplets to slide off and a hydrophobic surface can
be “sticky,” pinning droplets in place[45]. Because of this, other terms have been proposed, for example,
shear hydrophobicity, relating to the force required for a drop to slide contact angle hysteresis and tensile
hydrophobicity, relating to the work required to remove a droplet from the surface to better describe and
characterize surfaces[54].
- 12 -
2.3 Condensation and Frost formation
Condensation is the process of the phase transition of vapor to liquid. It can take place on a surface if the
temperature of the surface is below the dew point of the surrounding moist air. Additionally, if the surface
temperature is below 0 °C the condensed vapor may freeze and form an incipient porous frost layer on
the surface; this process is called condensation frosting. If both the surface temperature and the dew point
temperature is below 0 °C, water vapor may directly desublimate on the surface as frost [1].
The change in chemical potential during a phase change can be described by the equation ∆𝐺 = 𝑛∆𝜇 =
−𝑛𝑅𝑇 ln (𝑃
𝑃0) assuming the vapor to be ideal[2]. The expression can also be written as[33]:
∆𝐺 = −𝜌𝑉𝑅𝑇
𝑀ln (
𝑃
𝑃0) ( 2-8 )
Where,
∆𝐺 is the change in Gibbs free energy.
𝑃 is the local vapor pressure of water
𝑃0 is the saturation pressure of vapor
𝑅 is the universal gas constant
𝜌 is the density of the condensing water vapor
𝑉 is the volume of the condensing water vapor
𝑇 is the temperature of the condensing water vapor
𝑀 is the molar mass of water
For this transition to occur and for a cluster of atoms to form, a certain Gibbs energy barrier must be
overcome; consisting of the energy required for the creation of new interfaces around the embryo [55]. To
overcome this energy barrier, there must be a specific temperature difference ∆𝑇𝑠𝑢𝑝 or a supersaturation
pressure ∆𝑃𝑠𝑢𝑝 between the dew point and the surface [2,33]. This means at the surface, the temperature
of the moist air is below the dew point temperature and consequently, the local vapor pressure is
supersaturated, it is often referred to as either supersaturated, subcooled or supercooled with respect to
the saturated vapor pressure in the literature[56].
Figure 2.5 Psychrometric representation of condensation, adapted from[57]

- 13 -
This condensation process with supersaturated vapor over a flat plate can be represented in a
psychrometric chart, shown in figure 2.5. Humid air (A) flowing over a cold plate is cooled down past the
dew point (𝐴𝑠𝑎𝑡) until the free energy barrier is overcome, which happens at point (B). From (B) the
supersaturated vapor condenses, i.e., the phase change from vapor to liquid takes place (B-C) and the
liquid embryo forms. The travel between different points (A-B) and (B-C) represents the combined energy
removal occurring during the process in terms of sensible heat (A-B) and latent heat (B-C)[57].
2.3.1 Nucleation
The amount of energy required for the creation of the new interfaces is dependent on the surrounding air
and surface conditions. That is; the activation energy required for the formation of new interfaces depends
on the surface energy for a given interface and the area of the interfaces, i.e., the surface area between the
nucleating embryo and the air or the surface[55]. This is the basis for Classical Nucleation Theory (CNT)
used to describe why supersaturated conditions are needed before nucleation occurs[55]. This applies to
phase transitions in general; water can be subcooled before freezing and superheated before boiling for
the same reason, that there exists a free energy barrier that must be surpassed in order for successful
nucleation and a subsequent phase transition to occur[2].
An important distinction is that a phase transition initiated by the formation of a tiny particle (nuclei) of
the new phase can happen in two different ways; either entirely within the surrounding environment of
the parent phase called homogeneous nucleation or at a particle or surface acting as a nucleation site called
heterogeneous nucleation[55]. Since the concept of homogeneous nucleation is more straightforward, it is
used to describe the general concepts in classical nucleation theory even though heterogeneous nucleation
is relevant in this thesis. Although the description in the following sections is from the perspective of
condensation the same principle applies to the freezing of the droplets.
2.3.1.1 Homogenous nucleation
Because of the energy required for the creation of new interfaces in the case of nucleation, the expression
∆𝐺 for the phase transition must also include the surface free energy. In the case of homogeneous
nucleation this becomes[33]:
∆𝐺 = −𝜌𝑉𝑅𝑇
𝑀ln (
𝑃
𝑃0) + 𝐴𝜎 ( 2-9 )
Where,
𝐴 is the area of the interface
𝜎 the surface free energy per unit area.
Assuming the nuclei to be a sphere with radius 𝑟 equation (2-9) gives[33]:
∆𝐺 = −4
3
𝜋𝑟3𝜌𝑅𝑇
𝑀ln (
𝑃
𝑃0) + 4𝜋𝑟2𝜎 ( 2-10 )
The equation (2-10) has a maximum at one point for 𝑟 > 0 as 𝑟 increases since 𝑟2 > 𝑟3 for small 𝑟, and
𝑟2 < 𝑟3for large 𝑟 as seen in figure 2.6.

- 14 -
Figure 2.6 Change in Gibbs free energy as a function of nuclei radius, adapted from [58]
Figure 2.6 shows the change in the Gibbs free energy associated with a nucleating sphere with radius 𝑟.
The volume free energy change is the driving energy in the phase transition and the surface free energy for
the creation of the new interface is the hindering factor.
For a system to be in equilibrium the change in the Gibbs free energy is a minimum, and according to the
second law of thermodynamics, all mechanical or chemical systems will tend to spontaneously proceed
towards a state that results in a lower free energy of the system.
If a condensation drop has a radius smaller than 𝑟𝑐, then it is expected to get smaller and smaller until it
disappears since spontaneous processes that minimize the Gibbs free energy is favored. Conversely, if the
embryo has a radius greater than 𝑟𝑐 it is expected to grow indefinitely. This happens as at a critical
supersaturation a nuclei of radius 𝑟𝑐 is in an unstable equilibrium with the supersaturated vapor, and if it
were to increase in radius past 𝑟𝑐, then ∆𝐺 would decrease as it grows, favoring the further growth of the
drop[2,33]. Using equation (2-10) and setting 𝑑∆𝐺/𝑑𝑟 = 0 the critical radius 𝑟𝑐 can be found:
𝑑∆𝐺
𝑑𝑟= −
𝑟𝑐𝜌𝑅𝑇
𝑀ln (
𝑃
𝑃0) + 2𝜎 = 0 → 𝑟𝑐 =
2𝑀𝜎
𝜌𝑅𝑇 ln (𝑃
𝑃0) ( 2-11 )
Substituting into equation (2-11) to find the minimum energy required for successful nucleation gives:
∆𝐺𝑐 =
16𝜋
3
𝜎3
[𝜌𝑅𝑇
𝑀 ln (𝑃
𝑃0)]2 ( 2-12 )
Where,
∆𝐺𝑐 is the critical, minimum energy barrier to be overcome for successful nucleation.
This can also explain why the vapor needs to be subcooled for a phase transition to first occur.
Considering a bulk system, and thus without considering interfaces a phase transition might be favorable,
however for a nucleus with 𝑟 < 𝑟𝑐, nucleation is unfavorable and only favorable for embryos larger than
𝑟𝑐[2].
- 15 -
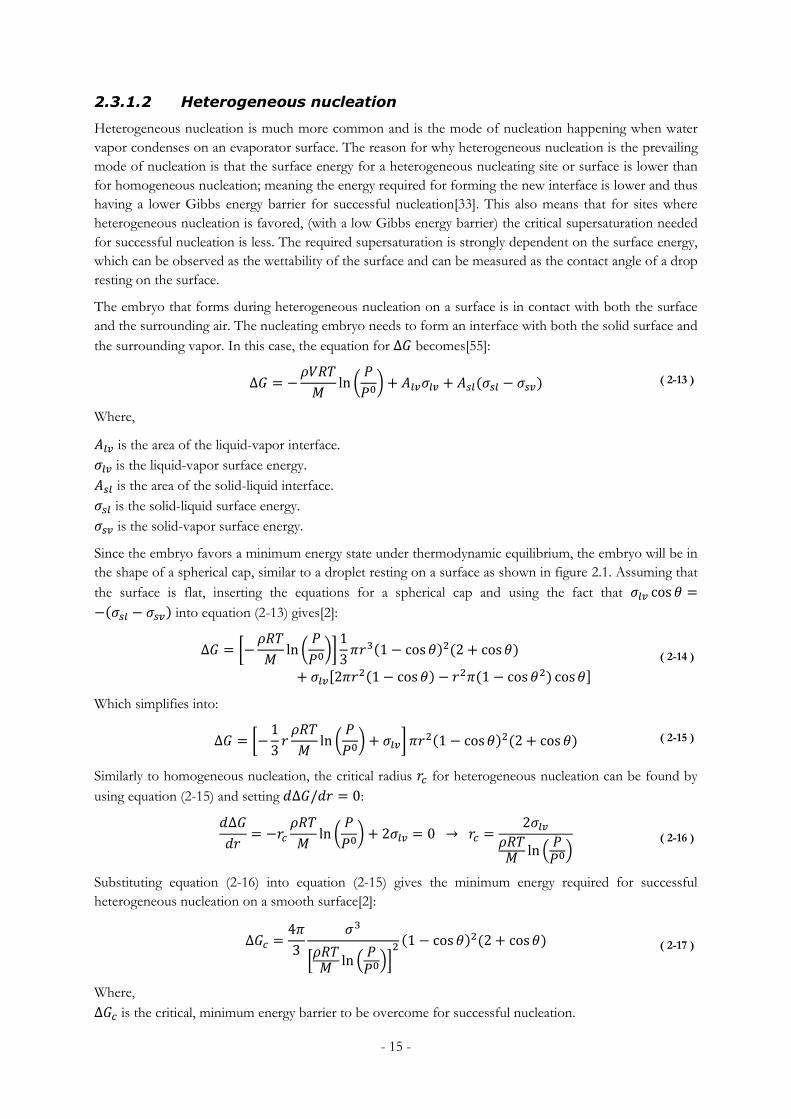
2.3.1.2 Heterogeneous nucleation
Heterogeneous nucleation is much more common and is the mode of nucleation happening when water
vapor condenses on an evaporator surface. The reason for why heterogeneous nucleation is the prevailing
mode of nucleation is that the surface energy for a heterogeneous nucleating site or surface is lower than
for homogeneous nucleation; meaning the energy required for forming the new interface is lower and thus
having a lower Gibbs energy barrier for successful nucleation[33]. This also means that for sites where
heterogeneous nucleation is favored, (with a low Gibbs energy barrier) the critical supersaturation needed
for successful nucleation is less. The required supersaturation is strongly dependent on the surface energy,
which can be observed as the wettability of the surface and can be measured as the contact angle of a drop
resting on the surface.
The embryo that forms during heterogeneous nucleation on a surface is in contact with both the surface
and the surrounding air. The nucleating embryo needs to form an interface with both the solid surface and
the surrounding vapor. In this case, the equation for ∆𝐺 becomes[55]:
∆𝐺 = −𝜌𝑉𝑅𝑇
𝑀ln (
𝑃
𝑃0) + 𝐴𝑙𝑣𝜎𝑙𝑣 + 𝐴𝑠𝑙(𝜎𝑠𝑙 − 𝜎𝑠𝑣) ( 2-13 )
Where,
𝐴𝑙𝑣 is the area of the liquid-vapor interface.
𝜎𝑙𝑣 is the liquid-vapor surface energy.
𝐴𝑠𝑙 is the area of the solid-liquid interface.
𝜎𝑠𝑙 is the solid-liquid surface energy.
𝜎𝑠𝑣 is the solid-vapor surface energy.
Since the embryo favors a minimum energy state under thermodynamic equilibrium, the embryo will be in
the shape of a spherical cap, similar to a droplet resting on a surface as shown in figure 2.1. Assuming that
the surface is flat, inserting the equations for a spherical cap and using the fact that 𝜎𝑙𝑣 cos 𝜃 =
−(𝜎𝑠𝑙 − 𝜎𝑠𝑣) into equation (2-13) gives[2]:
∆𝐺 = [−
𝜌𝑅𝑇
𝑀ln (
𝑃
𝑃0)]
1
3𝜋𝑟3(1 − cos 𝜃)2(2 + cos 𝜃)
+ 𝜎𝑙𝑣[2𝜋𝑟2(1 − cos 𝜃) − 𝑟2𝜋(1 − cos 𝜃2) cos 𝜃]
( 2-14 )
Which simplifies into:
∆𝐺 = [−1
3𝑟
𝜌𝑅𝑇
𝑀ln (
𝑃
𝑃0) + 𝜎𝑙𝑣] 𝜋𝑟2(1 − cos 𝜃)2(2 + cos 𝜃) ( 2-15 )
Similarly to homogeneous nucleation, the critical radius 𝑟𝑐 for heterogeneous nucleation can be found by
using equation (2-15) and setting 𝑑∆𝐺/𝑑𝑟 = 0:
𝑑∆𝐺
𝑑𝑟= −𝑟𝑐
𝜌𝑅𝑇
𝑀ln (
𝑃
𝑃0) + 2𝜎𝑙𝑣 = 0 → 𝑟𝑐 =
2𝜎𝑙𝑣
𝜌𝑅𝑇𝑀 ln (
𝑃𝑃0)
( 2-16 )
Substituting equation (2-16) into equation (2-15) gives the minimum energy required for successful
heterogeneous nucleation on a smooth surface[2]:
∆𝐺𝑐 =
4𝜋
3
𝜎3
[𝜌𝑅𝑇
𝑀 ln (𝑃
𝑃0)]2
(1 − cos 𝜃)2(2 + cos 𝜃) ( 2-17 )
Where,
∆𝐺𝑐 is the critical, minimum energy barrier to be overcome for successful nucleation.
- 16 -
The resulting equation is similar to the one obtained for homogeneous nucleation, equation (2-12). The
equation for homogeneous nucleation is larger by a factor of 4 but without the (1 − cos 𝜃)2(2 + cos 𝜃)
term which has a maximum value of 4 at 𝜃 = 𝜋. This shows that the energy barrier for successful
nucleation is smaller for heterogeneous nucleation and that condensation can happen much earlier on high
energy surfaces (high 𝜎𝑠𝑣) exhibiting a low contact angle, 𝜃.
The rate of steady state nucleation, i.e., the rate of nuclei of critical size formed can be written in the form
of an Arrhenius-type equation[33]:
𝐽 = 𝐼 ∙ 𝑒−∆𝐺𝑐𝑘𝐵𝑇
( 2-18 )
Where:
𝐽 is the rate of embryo formation
𝐼 is a pre-exponential factor
𝑘𝐵 is the Boltzmann constant
𝑇 is the temperature
In this equation, ∆𝐺𝑐 is the activation energy, the free energy barrier for successful nucleation. Many
different expressions and values for 𝐼 have been proposed, based on both Classical Nucleation Theory
and other approaches and are beyond the scope of this thesis[2,33,59]. However, the exponential term has
by far the most significant impact on the calculated nucleation rate[33]. A certain threshold value for 𝐽
before nucleation can be observed has also been proposed ranging from 106 to 1012, depending on if the
phase transition is boiling, condensing of freezing; but the value can be chosen rather arbitrarily as the
function has such a large dependence on the supercooling or supersaturation. A change of temperature, 𝑇
by as little as 1 °C can increase or decrease the rate of formation by as much as three to four orders of
magnitude[2,57]. This can also help explain why although the chance for successful nucleation to occur is
a statistical phenomenon, the transition from no condensation being observed to when condensation can
be observed occurs almost immediately at a very narrow range of temperature for any given vapor
pressure[2].
2.3.1.3 Important considerations regarding nucleation
From the reasoning of classical nucleation theory, it is apparent why vapors may be supersaturated
without condensation occurring. However, this only applies to the incipient stages of condensation on dry
surfaces; as soon as a surface is wet, a vapor-liquid interface already exists, and condensation occurs at the
saturation pressure. This would normally be the case for evaporator surfaces during operation as some
moisture would be expected remain after defrosting.
An interesting result of the fact that supersaturation only occurs over dry surfaces is the fact that there can
exist a vapor pressure gradient around condensing droplets and because of this gradient, which depends
on the diffusion rate of water vapor there exists a critical distance from a droplet where new nucleation
does not occur[60].
When condensate nucleates on normal structured superhydrophobic surfaces, the critical radius is so small
that the droplets form in between the structures in a Wenzel state[61]. On normal superhydrophobic
surfaces, this condensate layer stays in an impaled state as it freezes and shows a higher ice adhesion than
compared to flat surfaces[62,63]. Ice adhesion is not of great importance in this study since the frost layer
formed on an evaporator is not expected to detach under its own weight as it may be possible in other
cases, such as rime or glaze ice on wind turbines or aircraft [42]. As the frost layer melts, the droplets stay
impaled in a Wenzel state and do not transition into a Cassie-Baxter state even when mechanically
vibrated, leaving impinged droplets after defrosting cycles[64]. On the other hand, superhydrophobic
surfaces with multiple length scale (nano- and microscale) textures have shown to be able to shed
- 17 -
meltwater formed from condensate in certain conditions[61]. As such, conventional superhydrophobic
surfaces do not seem like a promising solution to the frosting problem in real-use, multi-cycle
applications[63].
Additionally; in reality, dust particles or surface imperfections serve as nucleation sites leading to
successful nucleation much earlier than what the presented examples of nucleation may suggest[2]. In
almost all practical cases it is impossible to avoid these types of nucleation sites; especially during long-
term use on surfaces that aren’t rigorously cleaned and maintained. In the application studied in this thesis;
air-side evaporator surfaces in ASHPs it is unlikely that any significant long-term nucleation suppression
effect can be observed, especially as any remaining moisture after defrosting will quickly freeze again and
act as a nucleation site[61].
2.3.2 Different stages of the early condensation frosting process
The process of condensation frosting involves many steps, each with different mechanics and different
characteristics. A more general description of the condensation frosting process has been made where it
was divided into three stages, suitable both for dropwise and filmwise condensation. These three steps can
be summarized briefly as, (1) condensation where droplets or a film form, grow and supercool over time,
(2) a nucleation stage where the supercooled droplets or film freeze and (3) a crystal growth stage and
frost growth in the thickness direction[1].
It has recently been shown that individual heterogeneous ice nucleation in each droplet is not the
dominant mechanism of freezing during dropwise condensation frosting, where most droplets freeze via a
process called inter-droplet ice bridging, where frozen droplets grow ice bridges towards neighboring
liquid droplets which freezes upon contact with the ice bridge[1]. This, along with other recent
advancements of our understanding of condensation frosting process was summarized in a recent review
performed by Nath et al. where they present five different stages in the dropwise condensation frosting
process and the mechanics that govern each stage[18]. These five stages occur during dropwise
condensations and subsequent freezing which happens on hydrophobic surfaces. The frosting process
that starts with film-wise condensation does not exhibit all of these stages, and although not all of the
stages are of great importance in this thesis, they help explain the rationale behind some of the approaches
towards achieving anti-icing surfaces.
The five stages are, (1) Supercooled condensation, (2) Onset of freezing, (3) Frost Halos, (4) inter-droplet
ice bridging and dry zones and (5) Percolation clusters and frost densification[18]. These five stages are
briefly described below and illustrated in figure 2.7.
- 18 -
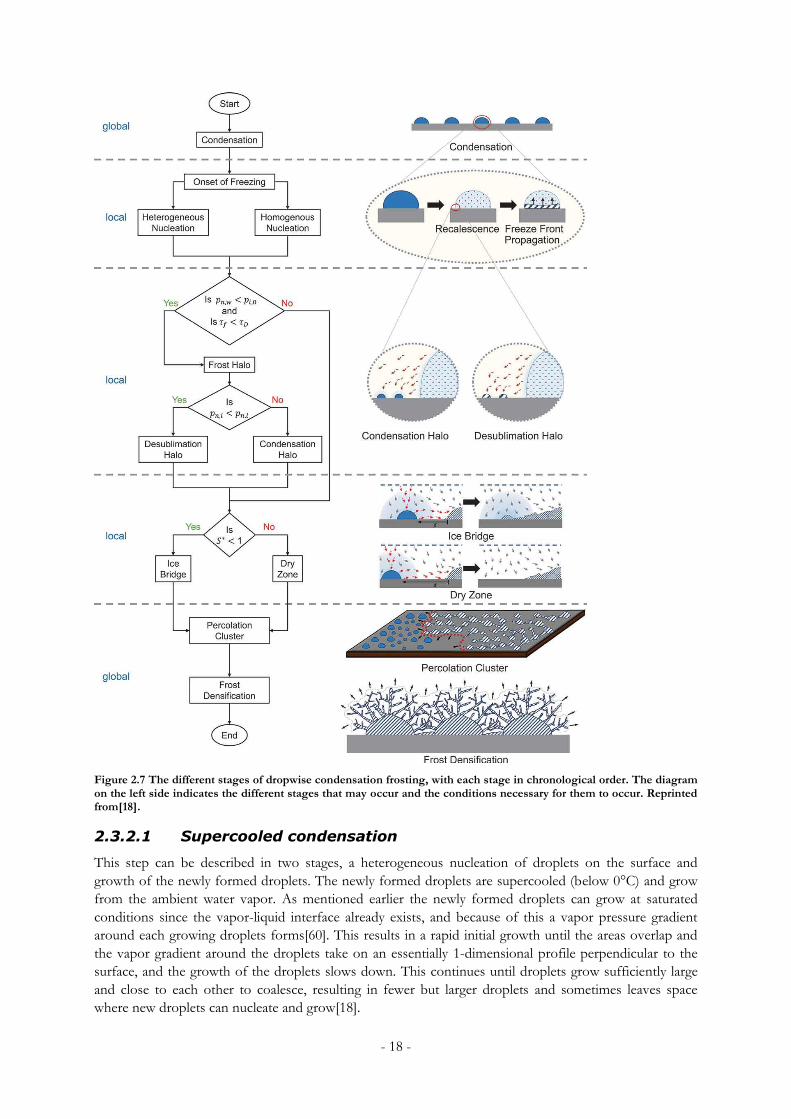
Figure 2.7 The different stages of dropwise condensation frosting, with each stage in chronological order. The diagram on the left side indicates the different stages that may occur and the conditions necessary for them to occur. Reprinted from[18].
2.3.2.1 Supercooled condensation
This step can be described in two stages, a heterogeneous nucleation of droplets on the surface and
growth of the newly formed droplets. The newly formed droplets are supercooled (below 0°C) and grow
from the ambient water vapor. As mentioned earlier the newly formed droplets can grow at saturated
conditions since the vapor-liquid interface already exists, and because of this a vapor pressure gradient
around each growing droplets forms[60]. This results in a rapid initial growth until the areas overlap and
the vapor gradient around the droplets take on an essentially 1-dimensional profile perpendicular to the
surface, and the growth of the droplets slows down. This continues until droplets grow sufficiently large
and close to each other to coalesce, resulting in fewer but larger droplets and sometimes leaves space
where new droplets can nucleate and grow[18].
- 19 -
2.3.2.2 Onset of freezing
After condensation and successful growth, the supercooled droplets may freeze. The freezing of the
droplet is also a nucleation event, as described in the above section and is thus a probabilistic event
requiring a certain degree of subcooling. As the droplets are resting on the cold surface, they gradually
cool from the bottom until the water near the surface reach a temperature where ice nucleation occurs[18].
Since droplets exhibiting a higher contact angle has less contact with the surface, and even less if they are
resting in a Cassie state, the conductive heat transfer area from the cold surface is minimized, and they
cool slower, resulting in delayed freezing of droplets[65]. The delayed freezing of the droplets also has an
additional benefit since it may allow the droplets to grow large enough to slide off the surface before
freezing[65].
The freezing itself starts with a rapid recalescence where the temperature of the drop jumps up to 0 °C,
and the liquid in the drop becomes a slushy mix of water and ice followed by a much slower internal
freeze front propagating through the drop, the speed of which depends on the heat transfer away from
the freezing drop[66].
2.3.2.3 Frost halos
Since the temperature of the drop during recalescence jumps from its supercooled temperature to 0 °C,
the droplet will evaporate so that the local vapor pressure around the droplet becomes the saturation
pressure of water vapor over ice at 0 °C. If the vapor pressure required for nucleation is less than the
saturation pressure of vapor over ice at 0 °C, a ring of newly nucleated condensate droplets will form
around the freezing droplet[18,66].
2.3.2.4 Inter-droplet ice bridging and dry zones
When the droplet has frozen and cooled the saturated vapor pressure over itself (over ice at its
temperature) is much lower than that around surrounding unfrozen droplets, since the saturation pressure
over ice is lower than that over water[67]. Unless the surrounding condensate halo that formed during
recalescence has frozen, it will evaporate, and be harvested by the larger frozen droplet[66]. This will also
create a local dry zone around the frozen droplet where all the liquid droplets will evaporate[60].
The frozen drop will act as a local humidity sink, harvesting water from other nearby droplets[60]. When
doing this the frozen droplet will form an ice bridge towards the liquid droplet, that will grow until it
either touches the liquid droplet and freezes it, or entirely evaporates the liquid drop before the ice bridge
can reach it, or the liquid droplet is frozen by another ice bridge growing towards it[1]. This is illustrated
in the flowchart in figure 2.7, where 𝑆∗ is a spreading parameter indicating successful ice bridging
when 𝑆∗ < 1.
This phenomenon is responsible for the dominant freezing mechanism of droplets formed during
dropwise condensation, and is also why a “freezing front” can be observed moving over a plate of
freezing condensate droplets, which would not happen if the droplets would freeze in isolation as a result
of a nucleation event inside each drop[1].
This can help explain why superhydrophobic surfaces can retard frost formation for such an extended
time in some instances. Superhydrophobic surfaces exhibiting easy and early droplet removal and a low
droplet surface coverage can have unsuccessful ice bridging, significantly slowing the freezing process.
The freezing process, (ice bridging) is usually started at the edges of a surface due to edge defects and
freeze in towards the plate. A more deliberate approach towards anti-icing surfaces aims to exploit this
phenomenon, either by tuning the distance between droplets by designing nucleation sites to achieve
unsuccessful ice bridging or surrounding the nucleation sites with a film of antifreeze liquid to disrupt ice
bridging[18].
- 20 -
2.3.2.5 Percolation clusters and frost densification
As the droplets freeze a network of interconnected frozen droplets forms on the surface, frost starts to
grow in the thickness direction, up towards the ambient air away from the surface. This marks the end of
the incipient stage of frost formation. Moreover, the layer of frost will grow in thickness and density
depending on the ambient conditions such as surface temperature, air humidity, temperature, and velocity.
2.3.3 Frost thickness growth and frost properties
The frost thickness growth stage has been studied more extensively by engineers and researchers than the
incipient stage. Much of this effort has been directed determining the frost properties and the rate of
growth under different conditions to better predict and model frost growth and the impact of frost,
mainly to improve or predict the performance of heat transfer equipment in frosting conditions. In
general, the trend has been towards constructing more physics-based models rather than based on
empirical correlations[68].
During this stage, the frost will go through two different growth patterns, one monotonic growth pattern
and a cyclic growth pattern. During monotonic growth, the frost thickness and density will increase
simultaneously over time until the top surface of the frost reaches 0 °C (given that the surrounding air is
warmer than 0 °C). When this occurs a thin water layer forms on the outer surface of the frost and
permeates all of the frost layer, resulting in a rapid increase in density and also an increase in thermal
conductivity, freezing the frost surface and leading to a continued thickness growth until the process
repeats itself in a cyclic pattern[8].
During the frost growth, environmental conditions such as air velocity, plate temperature, and humidity
have a significant influence on the frost properties. Several researchers have studied the thickness and
mass growth of frost over time as well as its density during different plate temperature, humidity, and
velocity. Higher humidity leads to a faster thickness growth and faster mass increase, while increased air
velocity results in a higher mass growth while the change in thickness growth rate is negligible and finally a
lower plate temperature results in a faster thickness growth while the rate of frost mass growth is
unchanged[8,9]. However, different results have been reported for the change in frost density for different
relative humidity. For example, Östin and Andersson as well as Hermes et al. reported that an increase in
relative humidity results in a higher frost density but experimental data from El Cheikh and Jacobi showed
the opposite[8,69,70].
Depending on the environmental conditions the morphology of the frost also changes. Hayashi et al.
observed frost formation under different conditions and classified different frost types. Conditions leading
to less dense frost showed needle-like frost crystals growing almost directly out from the plate with little
growth in other directions, while dense frost seems to grow more uniformly in all directions, leading to a
more compact and smooth layer[71].
Naturally, the wetting characteristics of the surface also impact the frost properties. Experiments have
shown that hydrophilic surfaces, i.e., surfaces with a low contact angle result in a more dense frost with a
slightly lower thickness growth rate in the early stages of the frost growth[72,73]. One study reported a 37-
41 % lower frost density on a hydrophilic surface and a 20-26 % increased frost density on a hydrophilic
surface compared to a baseline uncoated aluminum surface at normal indoor air temperature[17]. The
reason for the difference in frost density is reported to be because the shape of the freezing condensate
droplets on surfaces with high contact angles results in rougher and more irregular crystals than on low-
contact angle surfaces [74]. Figure 2.8 shows typical frost structures observed during tests on a hydrophilic
and a hydrophobic surface. Both pictures have the same magnification and are taken during the first
frosting cycle during the frost thickness growth stage.

- 21 -
Figure 2.8 Typical frost structures of a hydrophilic and a hydrophobic surface.
The frost acts as an insulating layer, lowering the heat transfer. A combination of thick frost with a low
density has a lower thermal conductivity, and thus a more significant loss in performance compared to a
thinner frost layer with a higher density. Thus, denser frost should be preferable during frosting from a
performance standpoint even though the increased frost mass requires more energy to melt during
defrosting[17].
It should be noted that the effects of surface treatments on the rate of frost growth are relatively minor
compared to other factors as humidity and surface temperature. Since humidity is dependent on the
ambient conditions, the surface temperature is the only factor practically able to be controlled; done by
sizing and designing the evaporator, which can be done in conjunction with surface coatings[75].
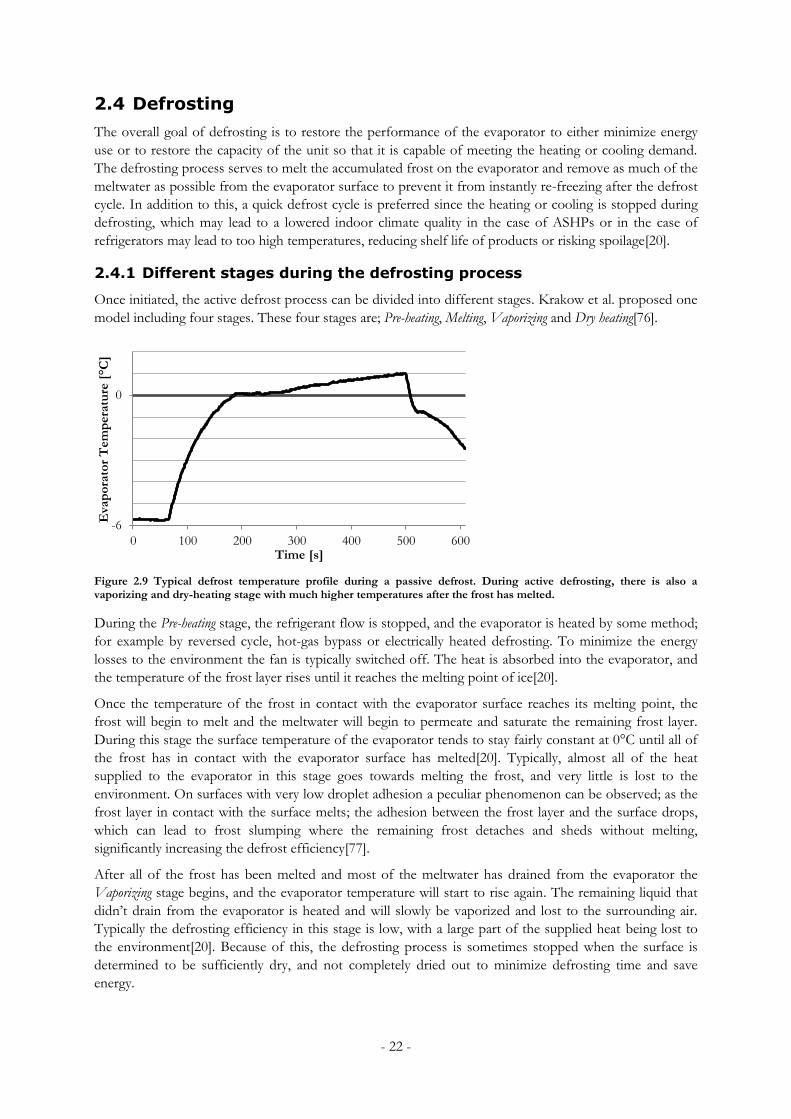
- 22 -
2.4 Defrosting
The overall goal of defrosting is to restore the performance of the evaporator to either minimize energy
use or to restore the capacity of the unit so that it is capable of meeting the heating or cooling demand.
The defrosting process serves to melt the accumulated frost on the evaporator and remove as much of the
meltwater as possible from the evaporator surface to prevent it from instantly re-freezing after the defrost
cycle. In addition to this, a quick defrost cycle is preferred since the heating or cooling is stopped during
defrosting, which may lead to a lowered indoor climate quality in the case of ASHPs or in the case of
refrigerators may lead to too high temperatures, reducing shelf life of products or risking spoilage[20].
2.4.1 Different stages during the defrosting process
Once initiated, the active defrost process can be divided into different stages. Krakow et al. proposed one
model including four stages. These four stages are; Pre-heating, Melting, Vaporizing and Dry heating[76].
Figure 2.9 Typical defrost temperature profile during a passive defrost. During active defrosting, there is also a vaporizing and dry-heating stage with much higher temperatures after the frost has melted.
During the Pre-heating stage, the refrigerant flow is stopped, and the evaporator is heated by some method;
for example by reversed cycle, hot-gas bypass or electrically heated defrosting. To minimize the energy
losses to the environment the fan is typically switched off. The heat is absorbed into the evaporator, and
the temperature of the frost layer rises until it reaches the melting point of ice[20].
Once the temperature of the frost in contact with the evaporator surface reaches its melting point, the
frost will begin to melt and the meltwater will begin to permeate and saturate the remaining frost layer.
During this stage the surface temperature of the evaporator tends to stay fairly constant at 0°C until all of
the frost has in contact with the evaporator surface has melted[20]. Typically, almost all of the heat
supplied to the evaporator in this stage goes towards melting the frost, and very little is lost to the
environment. On surfaces with very low droplet adhesion a peculiar phenomenon can be observed; as the
frost layer in contact with the surface melts; the adhesion between the frost layer and the surface drops,
which can lead to frost slumping where the remaining frost detaches and sheds without melting,
significantly increasing the defrost efficiency[77].
After all of the frost has been melted and most of the meltwater has drained from the evaporator the
Vaporizing stage begins, and the evaporator temperature will start to rise again. The remaining liquid that
didn’t drain from the evaporator is heated and will slowly be vaporized and lost to the surrounding air.
Typically the defrosting efficiency in this stage is low, with a large part of the supplied heat being lost to
the environment[20]. Because of this, the defrosting process is sometimes stopped when the surface is
determined to be sufficiently dry, and not completely dried out to minimize defrosting time and save
energy.
-6
0
0 100 200 300 400 500 600
Eva
po
rato
r T
em
pera
ture
[°C
]
Time [s]
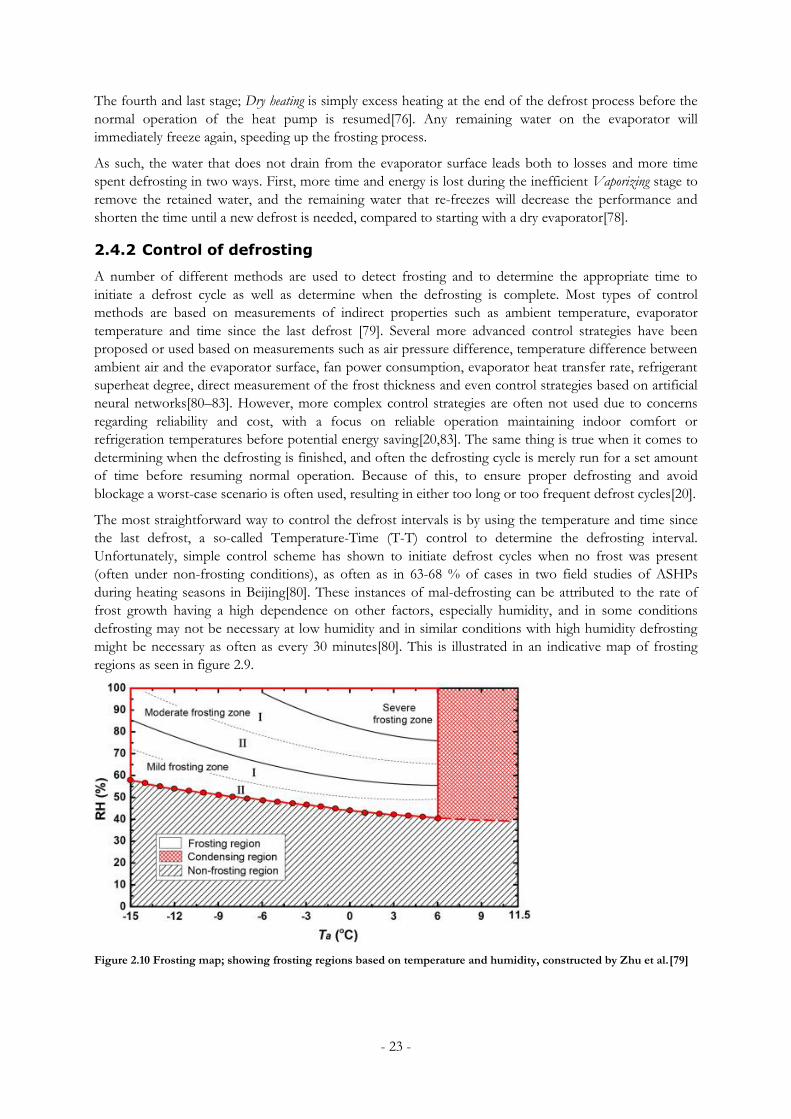
- 23 -
The fourth and last stage; Dry heating is simply excess heating at the end of the defrost process before the
normal operation of the heat pump is resumed[76]. Any remaining water on the evaporator will
immediately freeze again, speeding up the frosting process.
As such, the water that does not drain from the evaporator surface leads both to losses and more time
spent defrosting in two ways. First, more time and energy is lost during the inefficient Vaporizing stage to
remove the retained water, and the remaining water that re-freezes will decrease the performance and
shorten the time until a new defrost is needed, compared to starting with a dry evaporator[78].
2.4.2 Control of defrosting
A number of different methods are used to detect frosting and to determine the appropriate time to
initiate a defrost cycle as well as determine when the defrosting is complete. Most types of control
methods are based on measurements of indirect properties such as ambient temperature, evaporator
temperature and time since the last defrost [79]. Several more advanced control strategies have been
proposed or used based on measurements such as air pressure difference, temperature difference between
ambient air and the evaporator surface, fan power consumption, evaporator heat transfer rate, refrigerant
superheat degree, direct measurement of the frost thickness and even control strategies based on artificial
neural networks[80–83]. However, more complex control strategies are often not used due to concerns
regarding reliability and cost, with a focus on reliable operation maintaining indoor comfort or
refrigeration temperatures before potential energy saving[20,83]. The same thing is true when it comes to
determining when the defrosting is finished, and often the defrosting cycle is merely run for a set amount
of time before resuming normal operation. Because of this, to ensure proper defrosting and avoid
blockage a worst-case scenario is often used, resulting in either too long or too frequent defrost cycles[20].
The most straightforward way to control the defrost intervals is by using the temperature and time since
the last defrost, a so-called Temperature-Time (T-T) control to determine the defrosting interval.
Unfortunately, simple control scheme has shown to initiate defrost cycles when no frost was present
(often under non-frosting conditions), as often as in 63-68 % of cases in two field studies of ASHPs
during heating seasons in Beijing[80]. These instances of mal-defrosting can be attributed to the rate of
frost growth having a high dependence on other factors, especially humidity, and in some conditions
defrosting may not be necessary at low humidity and in similar conditions with high humidity defrosting
might be necessary as often as every 30 minutes[80]. This is illustrated in an indicative map of frosting
regions as seen in figure 2.9.
Figure 2.10 Frosting map; showing frosting regions based on temperature and humidity, constructed by Zhu et al.[79]

- 24 -
2.4.3 Different defrosting techniques
This can be done in several different ways. In general, the defrosting process is either passive; meaning
that the system is simply shut off, and no heat is supplied, the frost melts only in the ambient air or active;
where heat is supplied to the evaporator to melt the frost more quickly. In the case of ASHPs and
refrigeration applications active defrosting is used since a short defrost cycle is preferred to maintain the
climate indoor or in the refrigerated area[20].
Electric defrosting is done by switching off the heat pump and defrosting with resistive electric heating
elements in the evaporator as seen in figure 2.10a[76]. The benefit of using this method is its simplicity
and relatively low installation cost. However, it is less efficient than hot-gas defrosting[84].
Hot-gas defrosting is mainly done in two different ways, either by bypassing the hot refrigerant vapor
from the compressor past the condenser and expansion valve, straight to the evaporator as seen in figure
2.10b. Hot-gas bypass defrosting is often used in industrial applications, but is slower since the heat losses
from running compressor is used to defrost the evaporator[85]. The second method is done by reversing
the heat pump cycle, usually done by a four-way valve, and thus making the outdoor coil act as a
condenser, using indoor heat to defrost as seen in figure 2.10c. The main advantage of this method is that
it is quick and efficient while being relatively simple; with the drawback that indoor comfort might be
affected during defrosting cycles. Reverse cycle defrosting is also the most common way of defrosting
ASHPs[85].
Figure 2.11 Common defrosting methods, adapted from[85].
2.4.4 Impact of surface treatments on defrosting efficiency
The goal of a defrosting cycle is to restore the performance of the unit completely, and any retained water
after defrosting has a negative impact, instantly forming an initial frost layer and speeding up frost growth.
In particular, compact heat exchangers with tighter fin spacing that are more susceptible to the negative
effects of frosting (mainly blockage reducing air flow) require effective condensate drainage or more
complete drying to be effective during frosting conditions; something surface treatments seek to
achieve[25,63].
To do this, an additional characteristic of active defrosting is being used to improve defrosting efficiency
with surface treatments: the fact that the frost layer melts from the inside, at the evaporator surface and
not the air-side of the frost. Using nanostructured superhydrophobic surfaces promoting a Cassie state
wetting during condensation and with low liquid adhesion; efficient frost slumping and shedding where
large parts of the frost layer detach before melting [77]. This leads to a significantly improved defrosting
process using less energy since the energy supplied doesn’t need to be used to overcome the latent heat of
fusion all of the frost layer and vaporization for and the remaining water[61]. Though, this effect was only
achieved with thicker frost layers (≥ 3 mm) that shed more easily and drained more completely than
thinner frost layers, where several small droplets tended to remain[61]. Several studies have shown that
both hydrophilic and hydrophobic surfaces retain less water than an untreated surface[86,87].
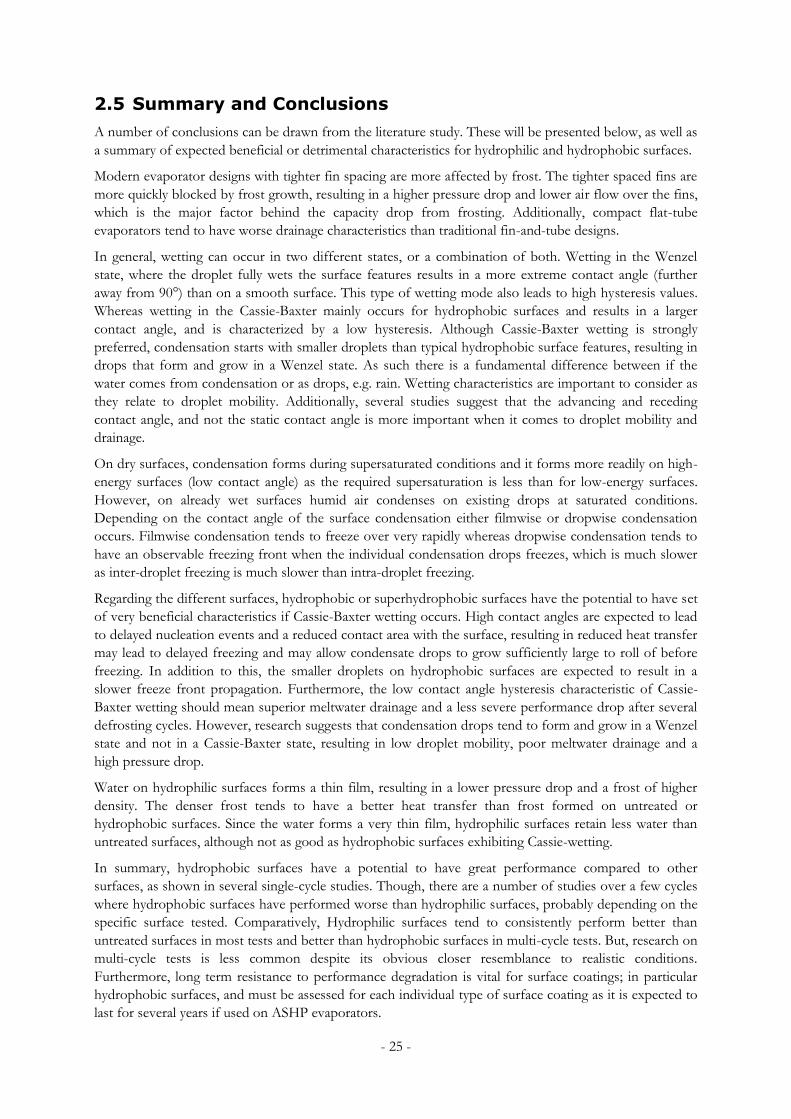
- 25 -
2.5 Summary and Conclusions
A number of conclusions can be drawn from the literature study. These will be presented below, as well as
a summary of expected beneficial or detrimental characteristics for hydrophilic and hydrophobic surfaces.
Modern evaporator designs with tighter fin spacing are more affected by frost. The tighter spaced fins are
more quickly blocked by frost growth, resulting in a higher pressure drop and lower air flow over the fins,
which is the major factor behind the capacity drop from frosting. Additionally, compact flat-tube
evaporators tend to have worse drainage characteristics than traditional fin-and-tube designs.
In general, wetting can occur in two different states, or a combination of both. Wetting in the Wenzel
state, where the droplet fully wets the surface features results in a more extreme contact angle (further
away from 90°) than on a smooth surface. This type of wetting mode also leads to high hysteresis values.
Whereas wetting in the Cassie-Baxter mainly occurs for hydrophobic surfaces and results in a larger
contact angle, and is characterized by a low hysteresis. Although Cassie-Baxter wetting is strongly
preferred, condensation starts with smaller droplets than typical hydrophobic surface features, resulting in
drops that form and grow in a Wenzel state. As such there is a fundamental difference between if the
water comes from condensation or as drops, e.g. rain. Wetting characteristics are important to consider as
they relate to droplet mobility. Additionally, several studies suggest that the advancing and receding
contact angle, and not the static contact angle is more important when it comes to droplet mobility and
drainage.
On dry surfaces, condensation forms during supersaturated conditions and it forms more readily on high-
energy surfaces (low contact angle) as the required supersaturation is less than for low-energy surfaces.
However, on already wet surfaces humid air condenses on existing drops at saturated conditions.
Depending on the contact angle of the surface condensation either filmwise or dropwise condensation
occurs. Filmwise condensation tends to freeze over very rapidly whereas dropwise condensation tends to
have an observable freezing front when the individual condensation drops freezes, which is much slower
as inter-droplet freezing is much slower than intra-droplet freezing.
Regarding the different surfaces, hydrophobic or superhydrophobic surfaces have the potential to have set
of very beneficial characteristics if Cassie-Baxter wetting occurs. High contact angles are expected to lead
to delayed nucleation events and a reduced contact area with the surface, resulting in reduced heat transfer
may lead to delayed freezing and may allow condensate drops to grow sufficiently large to roll of before
freezing. In addition to this, the smaller droplets on hydrophobic surfaces are expected to result in a
slower freeze front propagation. Furthermore, the low contact angle hysteresis characteristic of Cassie-
Baxter wetting should mean superior meltwater drainage and a less severe performance drop after several
defrosting cycles. However, research suggests that condensation drops tend to form and grow in a Wenzel
state and not in a Cassie-Baxter state, resulting in low droplet mobility, poor meltwater drainage and a
high pressure drop.
Water on hydrophilic surfaces forms a thin film, resulting in a lower pressure drop and a frost of higher
density. The denser frost tends to have a better heat transfer than frost formed on untreated or
hydrophobic surfaces. Since the water forms a very thin film, hydrophilic surfaces retain less water than
untreated surfaces, although not as good as hydrophobic surfaces exhibiting Cassie-wetting.
In summary, hydrophobic surfaces have a potential to have great performance compared to other
surfaces, as shown in several single-cycle studies. Though, there are a number of studies over a few cycles
where hydrophobic surfaces have performed worse than hydrophilic surfaces, probably depending on the
specific surface tested. Comparatively, Hydrophilic surfaces tend to consistently perform better than
untreated surfaces in most tests and better than hydrophobic surfaces in multi-cycle tests. But, research on
multi-cycle tests is less common despite its obvious closer resemblance to realistic conditions.
Furthermore, long term resistance to performance degradation is vital for surface coatings; in particular
hydrophobic surfaces, and must be assessed for each individual type of surface coating as it is expected to
last for several years if used on ASHP evaporators.
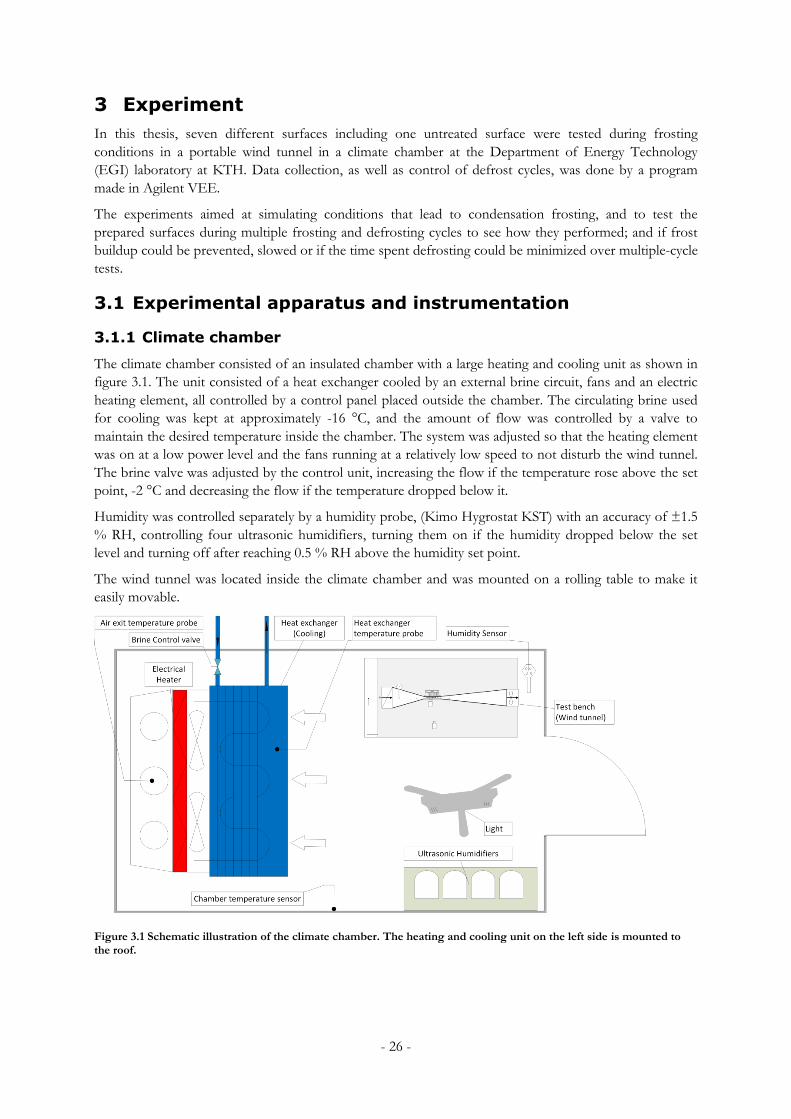
- 26 -
3 Experiment
In this thesis, seven different surfaces including one untreated surface were tested during frosting
conditions in a portable wind tunnel in a climate chamber at the Department of Energy Technology
(EGI) laboratory at KTH. Data collection, as well as control of defrost cycles, was done by a program
made in Agilent VEE.
The experiments aimed at simulating conditions that lead to condensation frosting, and to test the
prepared surfaces during multiple frosting and defrosting cycles to see how they performed; and if frost
buildup could be prevented, slowed or if the time spent defrosting could be minimized over multiple-cycle
tests.
3.1 Experimental apparatus and instrumentation
3.1.1 Climate chamber
The climate chamber consisted of an insulated chamber with a large heating and cooling unit as shown in
figure 3.1. The unit consisted of a heat exchanger cooled by an external brine circuit, fans and an electric
heating element, all controlled by a control panel placed outside the chamber. The circulating brine used
for cooling was kept at approximately -16 °C, and the amount of flow was controlled by a valve to
maintain the desired temperature inside the chamber. The system was adjusted so that the heating element
was on at a low power level and the fans running at a relatively low speed to not disturb the wind tunnel.
The brine valve was adjusted by the control unit, increasing the flow if the temperature rose above the set
point, -2 °C and decreasing the flow if the temperature dropped below it.
Humidity was controlled separately by a humidity probe, (Kimo Hygrostat KST) with an accuracy of ±1.5
% RH, controlling four ultrasonic humidifiers, turning them on if the humidity dropped below the set
level and turning off after reaching 0.5 % RH above the humidity set point.
The wind tunnel was located inside the climate chamber and was mounted on a rolling table to make it
easily movable.
Figure 3.1 Schematic illustration of the climate chamber. The heating and cooling unit on the left side is mounted to the roof.
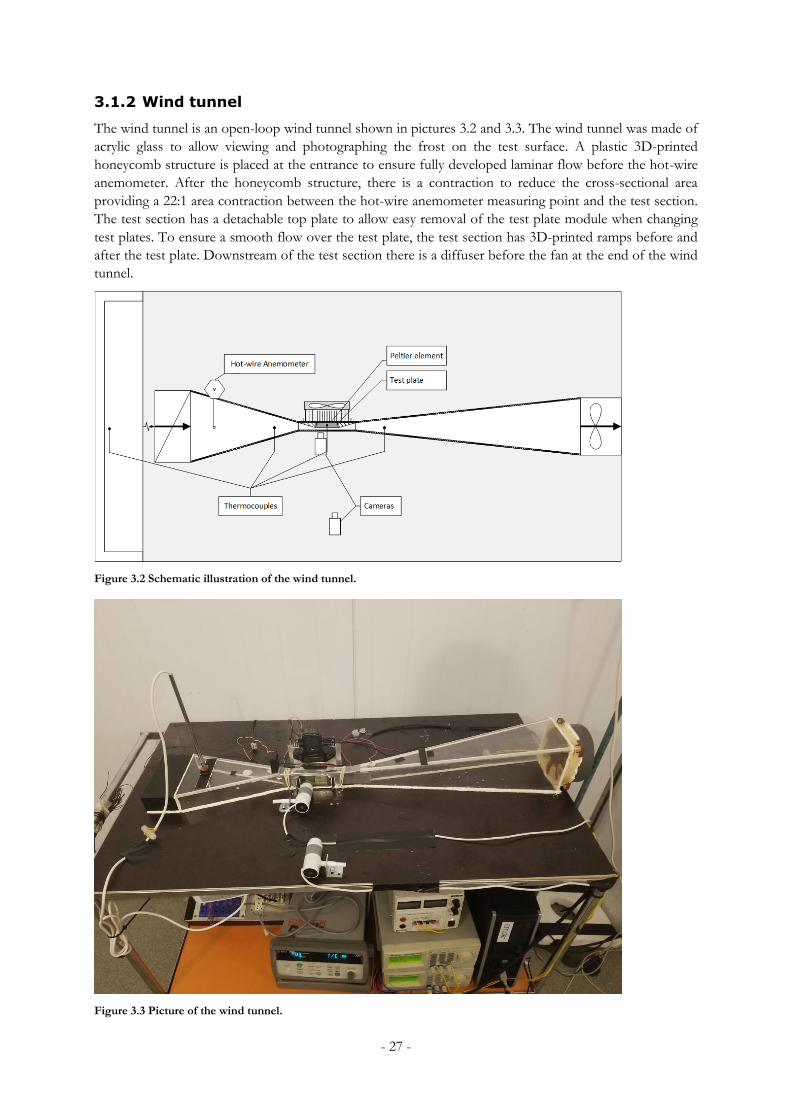
- 27 -
3.1.2 Wind tunnel
The wind tunnel is an open-loop wind tunnel shown in pictures 3.2 and 3.3. The wind tunnel was made of
acrylic glass to allow viewing and photographing the frost on the test surface. A plastic 3D-printed
honeycomb structure is placed at the entrance to ensure fully developed laminar flow before the hot-wire
anemometer. After the honeycomb structure, there is a contraction to reduce the cross-sectional area
providing a 22:1 area contraction between the hot-wire anemometer measuring point and the test section.
The test section has a detachable top plate to allow easy removal of the test plate module when changing
test plates. To ensure a smooth flow over the test plate, the test section has 3D-printed ramps before and
after the test plate. Downstream of the test section there is a diffuser before the fan at the end of the wind
tunnel.
Figure 3.2 Schematic illustration of the wind tunnel.
Figure 3.3 Picture of the wind tunnel.

- 28 -
The module consist of a Peltier device used to cool the test plate, with an aluminum heat sink and a fan
on the hot side and the test plate on the cold side, with machine screws clamping the Peltier device
between the heat sink and the test plate as can be seen in figure 3.4.
Figure 3.4 Schematic illustration of the cooling module and test plate.
During testing, the module was mounted so that the test plate was placed between the ramps in the wind
tunnel, with a foam strip around the back of the heat sink acting as a gasket to avoid leakage. The top
piece of the wind tunnel was placed back and clamped in place, with a silicon seal and taped with
aluminum foil tape along the edges to avoid leakage.
3.1.3 Instrumentation
Four type T thermocouples with an accuracy of ±0.5 °C were used; before the wind tunnel entrance,
upstream of the test plate, inside a blind hole of the test plate temperature measurements and downstream
of the test plate as illustrated in figure 3.2. In addition to this, a PT100 RTD was used as a reference for
Cold junction compensation. A hot-wire anemometer with an accuracy of ±3 % was used to measure the
air velocity at a known cross-sectional area, scaling it up to obtain the velocity in the test section.
The frost layer was photographed every 30 seconds with two digital USB microscopes with a zoom
capability ranging from 60x to 250x, one placed as close as possible to the test section of the wind tunnel
and one further away that captured the plate from top to bottom. In addition to this, a web camera was
mounted on top of the heat exchanger, taking pictures every two minutes of the frost thickness from the
top. This camera is not shown in figure 3.2 and 3.4 since it obstructs most of the view of the test plate but
can be seen in figure 3.3.
3.1.4 Data acquisition software and defrost control
Both the thermocouples and the hot-wire anemometer was connected to an Agilent 34972A Data
Acquisition/Switch unit which in turn was connected to a computer running an Agilent VEE program for
data logging and defrost control. The automated defrost control was created to avoid having to enter the
climate chamber during tests; avoiding temperature fluctuations and allowing for longer test runs as well
as testing overnight. The reduction in air velocity was chosen as the control parameter as previous
research indicates that it is the major factor behind the reduction in heat transfer, as well as being practical
to measure and integrate into the software.
The program scans all of the temperatures and the output signal from the anemometer from the Agilent
data logger once every second (1 HZ), converting it to a vector containing temperatures and velocity. All
of this information, including a timestamp for the scan, was continuously saved in a .CSV file. In addition
to this, the program checked whether the Peltier element was switched on or off, i.e., frosting or
defrosting mode. If the Peltier element was on, it checked if the mean air velocity of the last five scans was
below the defrosting criteria, and turned it off if that was the case. If the Peltier element was switched off,
it checked if the plate temperature was above 1 °C, indicating a completed defrosting cycle and turning on
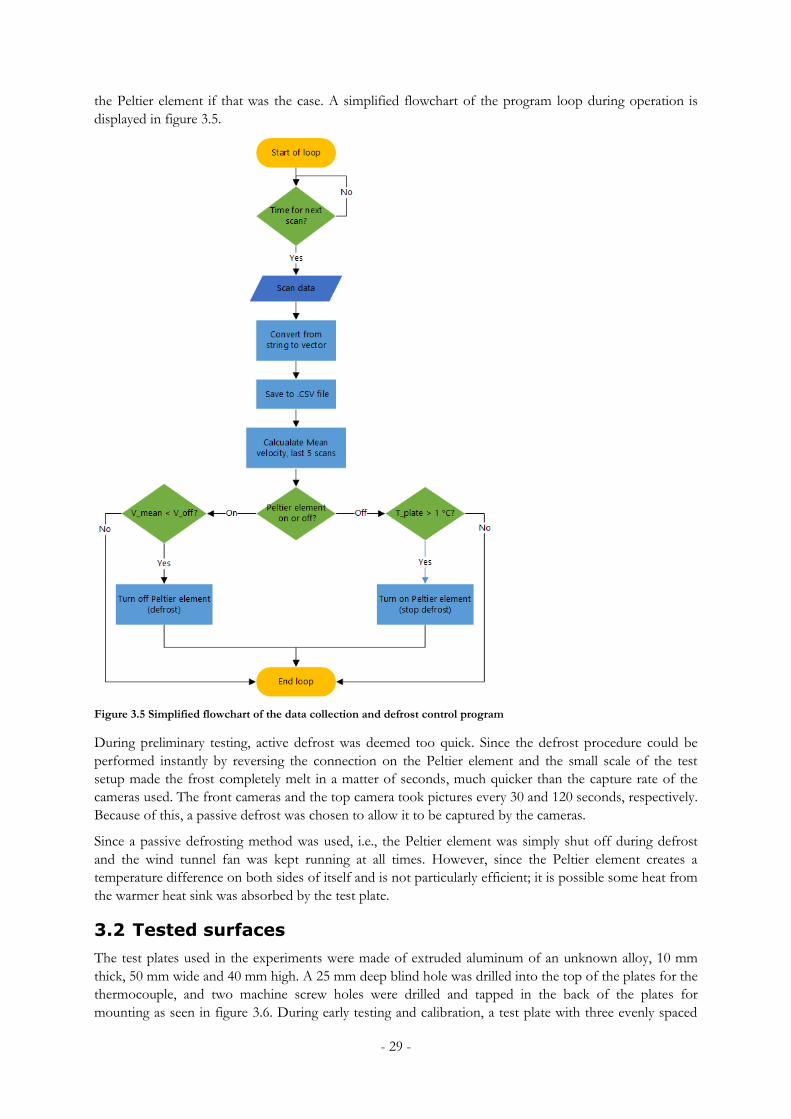
- 29 -
the Peltier element if that was the case. A simplified flowchart of the program loop during operation is
displayed in figure 3.5.
Figure 3.5 Simplified flowchart of the data collection and defrost control program
During preliminary testing, active defrost was deemed too quick. Since the defrost procedure could be
performed instantly by reversing the connection on the Peltier element and the small scale of the test
setup made the frost completely melt in a matter of seconds, much quicker than the capture rate of the
cameras used. The front cameras and the top camera took pictures every 30 and 120 seconds, respectively.
Because of this, a passive defrost was chosen to allow it to be captured by the cameras.
Since a passive defrosting method was used, i.e., the Peltier element was simply shut off during defrost
and the wind tunnel fan was kept running at all times. However, since the Peltier element creates a
temperature difference on both sides of itself and is not particularly efficient; it is possible some heat from
the warmer heat sink was absorbed by the test plate.
3.2 Tested surfaces
The test plates used in the experiments were made of extruded aluminum of an unknown alloy, 10 mm
thick, 50 mm wide and 40 mm high. A 25 mm deep blind hole was drilled into the top of the plates for the
thermocouple, and two machine screw holes were drilled and tapped in the back of the plates for
mounting as seen in figure 3.6. During early testing and calibration, a test plate with three evenly spaced
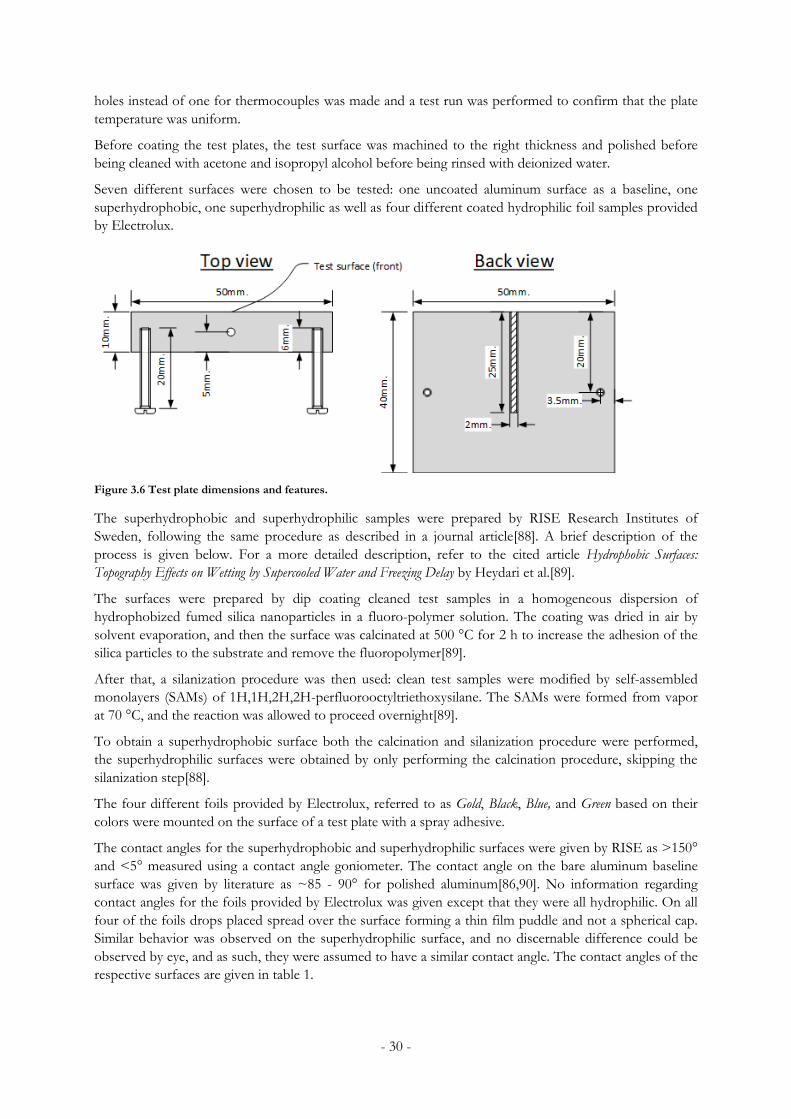
- 30 -
holes instead of one for thermocouples was made and a test run was performed to confirm that the plate
temperature was uniform.
Before coating the test plates, the test surface was machined to the right thickness and polished before
being cleaned with acetone and isopropyl alcohol before being rinsed with deionized water.
Seven different surfaces were chosen to be tested: one uncoated aluminum surface as a baseline, one
superhydrophobic, one superhydrophilic as well as four different coated hydrophilic foil samples provided
by Electrolux.
Figure 3.6 Test plate dimensions and features.
The superhydrophobic and superhydrophilic samples were prepared by RISE Research Institutes of
Sweden, following the same procedure as described in a journal article[88]. A brief description of the
process is given below. For a more detailed description, refer to the cited article Hydrophobic Surfaces:
Topography Effects on Wetting by Supercooled Water and Freezing Delay by Heydari et al.[89].
The surfaces were prepared by dip coating cleaned test samples in a homogeneous dispersion of
hydrophobized fumed silica nanoparticles in a fluoro-polymer solution. The coating was dried in air by
solvent evaporation, and then the surface was calcinated at 500 °C for 2 h to increase the adhesion of the
silica particles to the substrate and remove the fluoropolymer[89].
After that, a silanization procedure was then used: clean test samples were modified by self-assembled
monolayers (SAMs) of 1H,1H,2H,2H-perfluorooctyltriethoxysilane. The SAMs were formed from vapor
at 70 °C, and the reaction was allowed to proceed overnight[89].
To obtain a superhydrophobic surface both the calcination and silanization procedure were performed,
the superhydrophilic surfaces were obtained by only performing the calcination procedure, skipping the
silanization step[88].
The four different foils provided by Electrolux, referred to as Gold, Black, Blue, and Green based on their
colors were mounted on the surface of a test plate with a spray adhesive.
The contact angles for the superhydrophobic and superhydrophilic surfaces were given by RISE as >150°
and <5° measured using a contact angle goniometer. The contact angle on the bare aluminum baseline
surface was given by literature as ~85 - 90° for polished aluminum[86,90]. No information regarding
contact angles for the foils provided by Electrolux was given except that they were all hydrophilic. On all
four of the foils drops placed spread over the surface forming a thin film puddle and not a spherical cap.
Similar behavior was observed on the superhydrophilic surface, and no discernable difference could be
observed by eye, and as such, they were assumed to have a similar contact angle. The contact angles of the
respective surfaces are given in table 1.

- 31 -
Surface Contact angle
bare aluminum, polished ~85 – 90°
Superhydrophobic >150°
Superhydrophilic <5°
Gold, foil ~5°
Black, foil ~5°
Blue, foil ~5°
Green, foil ~5°
Table 1 Contact angles of the tested surfaces
3.3 Test procedure
The tests were performed in conditions based on standard application rating conditions for ASHPs in SS-
EN 14511-2:2018 at a dry-bulb temperature of 2 °C and a wet-bulb temperature of 1 °C, shown in table 2
[91]. These test conditions are in the worst zone, the “severe frosting zone” according to the frosting map
shown in figure 2.9, indicating rapid frost growth where frequent defrosts are necessary. Due to the
different placement of the chamber temperature sensor and the wind tunnel (see figure 3.1) this resulted
in a temperature inside the wind tunnel of around 2.4 - 2.5 °C
Climate chamber set-points
Dry-bulb temperature 2 °C
Wet-bulb temperature 1 °C
Corresponding humidity 84 %
Table 2 Test conditions during experiments
In addition to this, all of the test runs were performed at the same air velocity, Peltier element voltage, the
same defrost criteria, scanning interval and time-lapse camera settings, summarized in table 3.
Test condition/setting Value Comment
Air velocity before test start 0.095 m/s Corresponding to 2 m/s at the test section
Peltier element voltage 2.5 V
Defrost initiation criteria 0.05 m/s Corresponding to ~1 m/s at the test section
without frost, an average of 5 latest values.
Peltier module cooling fan voltage 12 V
Scanning interval 1 HZ The rate of data collection
Digital microscopes time-lapse interval 30 s Front cameras, wait time between each picture
Web camera time-lapse interval 120 s Top camera, wait time between each picture
Table 3 Test conditions and settings used during testing.
Before testing, the climate chamber was started in advance and was allowed to run at least 24 hours before
test runs were performed to allow temperature and humidity to stabilize; or, since the cooling was
generally kept on while the humidifiers were not, the humidifiers were allowed to run at least overnight
(Min. ~10 hours) before any test run was performed. If consecutive tests were performed the climate was
already kept at a steady level, and the only wait time was to allow the test module to cool from room
temperature to the climate chamber temperature after installing a new test surface before a new test was
started.
To ensure a fair comparison between each test a test procedure was developed. This procedure was
divided into two stages, (1) cleaning and mounting test surfaces on the Peltier module and (2) startup.
These were performed after reaching a stable temperature and humidity in the chamber as described
above.

- 32 -
3.3.1 Cleaning and mounting
Before testing, the surface was cleaned with isopropyl alcohol and then rinsed off with distilled water
before allowed to air-dry. The Peltier element, the back of the test plate and the aluminum heat sink were
wiped clean with isopropyl alcohol and allowed to dry before assembling as shown in figure 3.4.
During cleaning and mounting special care was taken not to touch the test surfaces, to avoid
contaminating the surface (creating nucleation sites) and damaging the surface preparation.
A very thin layer of thermal paste (ZP-360) was applied on all contacting surfaces to ensure full contact on
both sides of the Peltier element. The module was clamped together with machine screws and excess
thermal paste was wiped off. Thermal paste was applied into the top hole for the thermocouple. The top
camera was attached to the heat sink before the module was mounted to the wind tunnel, a thermocouple
was inserted into the top hole, and a cooling fan was attached to the heat sink. A gap of 5 mm between
the test surface and the wall was ensured using a Vernier caliper with an accuracy of ±0.1 mm. The top
Plexiglas cover was then clamped in place and edges taped with foil tape to seal it, and a piece of butyl
rubber sealant was placed over the exposed parts of the top of the test plate to insulate and cover it.
3.3.2 Startup procedure
After mounting the test plate, the following startup procedure was followed.
1. Turn on the extra camera light.
2. Start the data acquisition software and start a test run.
3. Test that the Peltier element is correctly installed by connecting it for 1-2 seconds and observing
if the test plate temperature drops.
4. Check that chamber temperature and humidity are stable at 2 °C and 84 %RH.
5. Check function and water level on humidifiers, fill up if necessary.
6. Check that temperatures measured by the thermocouples are in proper range.
7. Check that the wind tunnel fan is running at the correct voltage and is stable at the correct speed
(~0.095 m/s) corresponding to a speed of 2 m/s at the narrow test section.
8. Check that the set voltage for the Peltier element is at the correct value (2.5 V).
9. Create new storage folders for the test.
10. Turn on the webcam and digital microscopes and check focus.
11. Arrange storage folders for the cameras, setup time-lapse shots.
12. Make sure that the temperature of the test plate has cooled and stabilized close to room
temperature.
13. Restart the data acquisition software and make sure it is set at the correct scanning interval (1 HZ)
and the correct defrost criteria (0.05 m/s) and start the time-lapse shots.
14. Connect the Peltier element.
Each test was left to run for 22.4 to 27 hours, entering defrosting mode when the air velocity dropped
below the set criteria and turning on the Peltier element, resuming normal operation when the plate
temperature reached 1 °C.
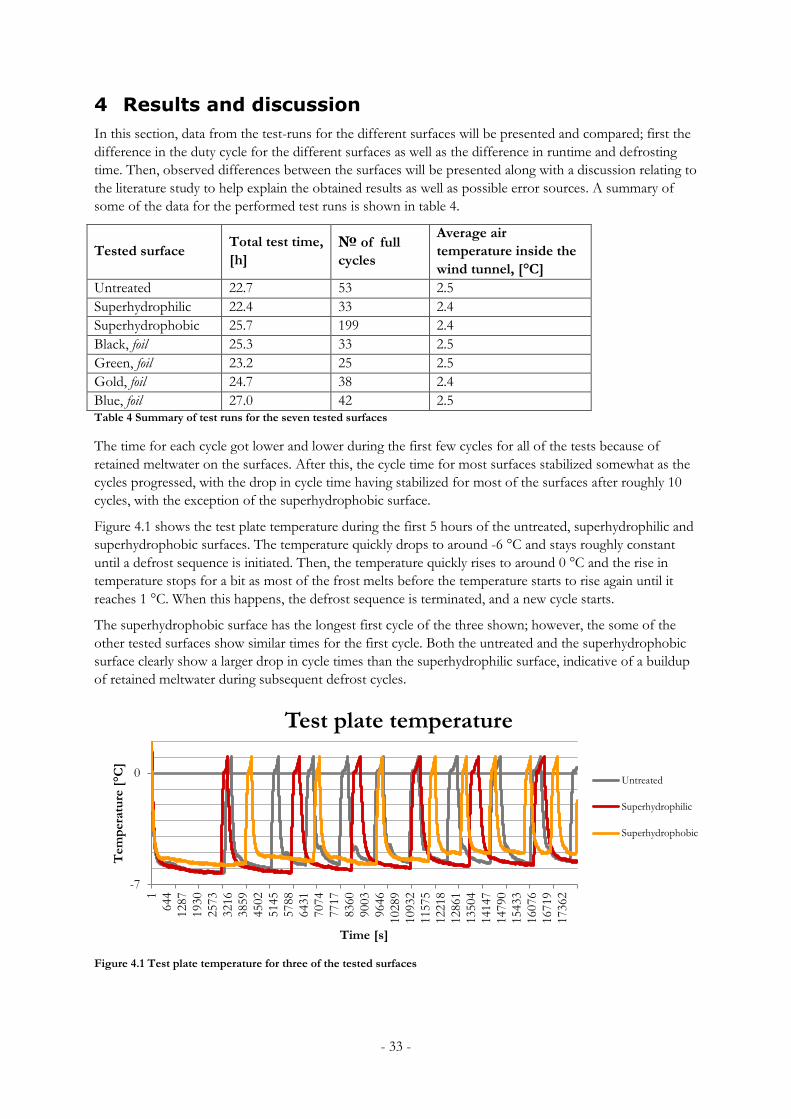
- 33 -
4 Results and discussion
In this section, data from the test-runs for the different surfaces will be presented and compared; first the
difference in the duty cycle for the different surfaces as well as the difference in runtime and defrosting
time. Then, observed differences between the surfaces will be presented along with a discussion relating to
the literature study to help explain the obtained results as well as possible error sources. A summary of
some of the data for the performed test runs is shown in table 4.
Tested surface Total test time,
[h]
№ of full
cycles
Average air
temperature inside the
wind tunnel, [°C]
Untreated 22.7 53 2.5
Superhydrophilic 22.4 33 2.4
Superhydrophobic 25.7 199 2.4
Black, foil 25.3 33 2.5
Green, foil 23.2 25 2.5
Gold, foil 24.7 38 2.4
Blue, foil 27.0 42 2.5 Table 4 Summary of test runs for the seven tested surfaces
The time for each cycle got lower and lower during the first few cycles for all of the tests because of
retained meltwater on the surfaces. After this, the cycle time for most surfaces stabilized somewhat as the
cycles progressed, with the drop in cycle time having stabilized for most of the surfaces after roughly 10
cycles, with the exception of the superhydrophobic surface.
Figure 4.1 shows the test plate temperature during the first 5 hours of the untreated, superhydrophilic and
superhydrophobic surfaces. The temperature quickly drops to around -6 °C and stays roughly constant
until a defrost sequence is initiated. Then, the temperature quickly rises to around 0 °C and the rise in
temperature stops for a bit as most of the frost melts before the temperature starts to rise again until it
reaches 1 °C. When this happens, the defrost sequence is terminated, and a new cycle starts.
The superhydrophobic surface has the longest first cycle of the three shown; however, the some of the
other tested surfaces show similar times for the first cycle. Both the untreated and the superhydrophobic
surface clearly show a larger drop in cycle times than the superhydrophilic surface, indicative of a buildup
of retained meltwater during subsequent defrost cycles.
Figure 4.1 Test plate temperature for three of the tested surfaces
-7
0
1
644
1287
1930
2573
3216
3859
4502
5145
5788
6431
7074
7717
8360
9003
9646
10289
10932
11575
12218
12861
13504
14147
14790
15433
16076
16719
17362
Tem
pera
ture
[°C
]
Time [s]
Test plate temperature
Untreated
Superhydrophilic
Superhydrophobic
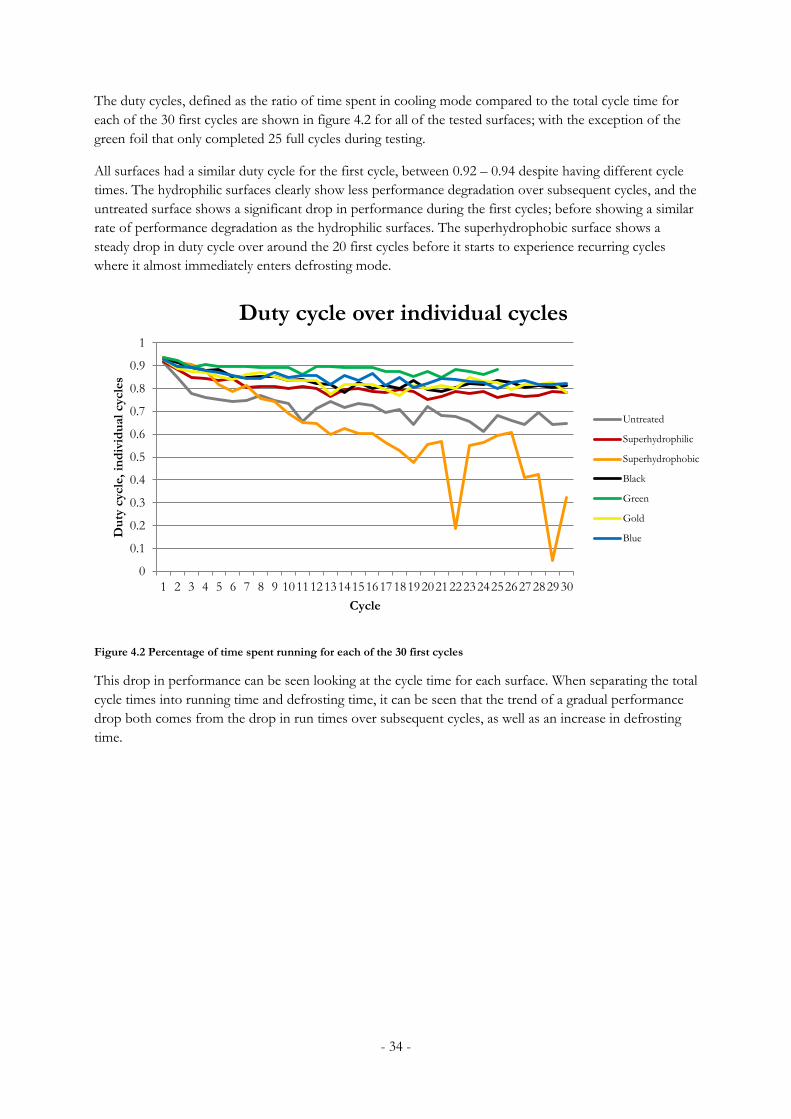
- 34 -
The duty cycles, defined as the ratio of time spent in cooling mode compared to the total cycle time for
each of the 30 first cycles are shown in figure 4.2 for all of the tested surfaces; with the exception of the
green foil that only completed 25 full cycles during testing.
All surfaces had a similar duty cycle for the first cycle, between 0.92 – 0.94 despite having different cycle
times. The hydrophilic surfaces clearly show less performance degradation over subsequent cycles, and the
untreated surface shows a significant drop in performance during the first cycles; before showing a similar
rate of performance degradation as the hydrophilic surfaces. The superhydrophobic surface shows a
steady drop in duty cycle over around the 20 first cycles before it starts to experience recurring cycles
where it almost immediately enters defrosting mode.
Figure 4.2 Percentage of time spent running for each of the 30 first cycles
This drop in performance can be seen looking at the cycle time for each surface. When separating the total
cycle times into running time and defrosting time, it can be seen that the trend of a gradual performance
drop both comes from the drop in run times over subsequent cycles, as well as an increase in defrosting
time.
0
0.1
0.2
0.3
0.4
0.5
0.6
0.7
0.8
0.9
1
1 2 3 4 5 6 7 8 9 101112131415161718192021222324252627282930
Du
ty c
ycle
, in
div
idu
al
cycle
s
Cycle
Duty cycle over individual cycles
Untreated
Superhydrophilic
Superhydrophobic
Black
Green
Gold
Blue

- 35 -
Figure 4.3 Cycle times for the 30 first cycles
Figure 4.4 Runtime for the 30 first cycles
Figure 4.5 Defrost time for the 30 first cycles
0
500
1000
1500
2000
2500
3000
3500
4000
4500
1 2 3 4 5 6 7 8 9 10 11 12 13 14 15 16 17 18 19 20 21 22 23 24 25 26 27 28 29 30
Tim
e [
s]
Cycle
Cycle time
Untreated
Superhydrophilic
Superhydrophobic
Black
Green
Gold
Blue
0
500
1000
1500
2000
2500
3000
3500
4000
4500
1 2 3 4 5 6 7 8 9 101112131415161718192021222324252627282930
Tim
e [
s]
Cycle
Runtime, frosting mode
Untreated
Superhydrophilic
Superhydrophobic
Black
Green
Gold
Blue
0
100
200
300
400
500
600
1 2 3 4 5 6 7 8 9 101112131415161718192021222324252627282930
Tim
e [
s]
Cycle
Defrost time
Untreated
Superhydrophilic
Superhydrophobic
Black
Green
Gold
Blue

- 36 -
From figure 4.2 to 4.5 it can be seen that there is some variance between each cycle, and that the variance
mainly comes from the difference in runtime; the curves for the defrost time are much smoother. The
very short defrosting cycles (cycle 22 and 29 in particular) for the superhydrophobic surface is a result of
the very short runtimes in frosting mode, where the test surface did not have enough time to cool and
reach a stable temperature. Thus, very little to no new frost formed on the plate, and only the remaining
droplets froze. This behavior continued intermittently throughout the whole test and will be discussed
further below.
Looking at figure 4.3 to 4.5, the green foil shows longer cycle times than the rest of the surfaces.
However, the air velocity for the green foil increased directly after starting the test, and kept returning to a
higher value after subsequent defrosts; although still showing a gradual decrease similar to all of the other
tested hydrophilic surfaces. This hints at the possibility of an incorrect test, possibly due to an incorrect
gap at the test section when the test plate was mounted, since the fan also had to be run at a slightly lower
voltage get a correct air velocity at the start of the test, which still proved to be too high.
Figure 4.6 shows the average duty cycle for cycles 10-25. There is a clear separation between the different
types of surfaces (Hydrophilic, untreated and hydrophobic) with the hydrophilic surfaces showing the
highest duty cycle with an average of 0.83 compared to the bare aluminum with 0.69 and the hydrophilic
with 0.56.
Figure 4.6 Duty cycle for each surface over cycles 10-25 with a standard deviation
Regarding the performance drop for the surfaces, and mainly the superhydrophobic surface; remaining
water after defrosting could explain this performance drop, causing a pressure drop over the test section
and lowering the measured air velocity. Poor drainage in the wind tunnel itself contributed to this,
moisture can be seen in the bottom of the right images in figure 4.7 e, which built up after several cycles
of frosting and defrosting. It is possible that any remaining water on the bottom of the wind tunnel and
the bottom edge of the surface contributed to the increased defrosting time and thus in a small part to the
observed gradual drop in duty cycle.
Figure 4.7 shows the front view of the remaining meltwater on four of the tested surfaces after 1, 3, 5, 10
and 20 cycles. The both of the hydrophilic surfaces show good drainage, with only a thin film of
meltwater remaining during the tests. Disruptions in the film can be seen more clearly in the leftmost
bottom corner of the more zoomed in view in the last picture for both of the superhydrophilic surface
0
0.2
0.4
0.6
0.8
1
Du
ty c
ycle
Duty cycle
Uncoated
Superhydrophilic
Superhydrophobic
Black
Green
Gold
Blue

- 37 -
and the blue foil. The bare aluminum surface drains poorly; after the first defrost several medium-sized
drops remain and after the 3rd defrost smaller droplets remain between the larger ones all over the surface.
Images of later cycles are similar and can help explain why the bare aluminum surface had the most
significant initial drop in cycle length of all of the tested surfaces before the curve flattens to a lower rate
of a performance drop. The superhydrophobic surface shows an almost clean surface after the first
defrosting, with only a small number of droplets remaining on the surface. But, as the test progresses,
more and more droplets remain on the surface, indicating that they are in a Wenzel state, in line with the
more gradual drop in cycle length. Additionally, water drops can be seen on the Plexiglas on the other side
of the test section during the superhydrophobic test. As the frost layer melted and slid down, it detached
and tipped over, hitting the other side of the test section, leaving droplets. These can be seen in the right
view, in the bottom of the images of the superhydrophobic surface in figure 4.7 b)-e) and in figure 4.8.
These should also have contributed pressure drop and thus to the poor performance of the
superhydrophobic surface, further reducing the air velocity.
During the later stages of the test (20+ cycles), the amount of remaining droplets leads to the air velocity
continually dropping below the defrost criteria and initiating a defrost cycle over and over again.
This behavior is in part a result of the chosen defrost control. Had another defrost control method been
used, either with a set minimum defrosting time or not using the air velocity as the parameter to trigger
defrosting; this issue could possibly be less severe. It was observed on certain occasions that the defrosting
was terminated early, before the meltwater had drained completely, i.e., water-ice slush was still slowly
moving down the surface but re-froze before it could drain from the plate. This early termination of the
defrost cycle could be explained by the fact that there also was some heat transfer from the surface to the
frost, since the Peltier element created a temperature difference between both sides, and when it was
turned off some of the heat from the hot side was transferred to the test plate. Because of this, the plate
temperature could have reached 1 °C before the frost had completely melted and had time to drain. This
would probably be less of a problem in larger setups with active defrosting since they also try to dry off
the evaporator surface during defrosting.
Another possible way to avoid this could be to let more frost build up on the plate before defrosting so
that larger droplets coalesce and clear the area below when rolling off the surface. The relatively small
droplets observed were not large enough to move by themselves, and when the system started cycling
between frosting and defrosting there was not enough time for the pinned droplets to grow large enough
to roll off, so they remained for several cycles. Allowing a thicker frost layer to grow may lead to larger
droplets that could coalescence, and roll of the surface. However, this might not be possible for
evaporators with tight fin spacing.
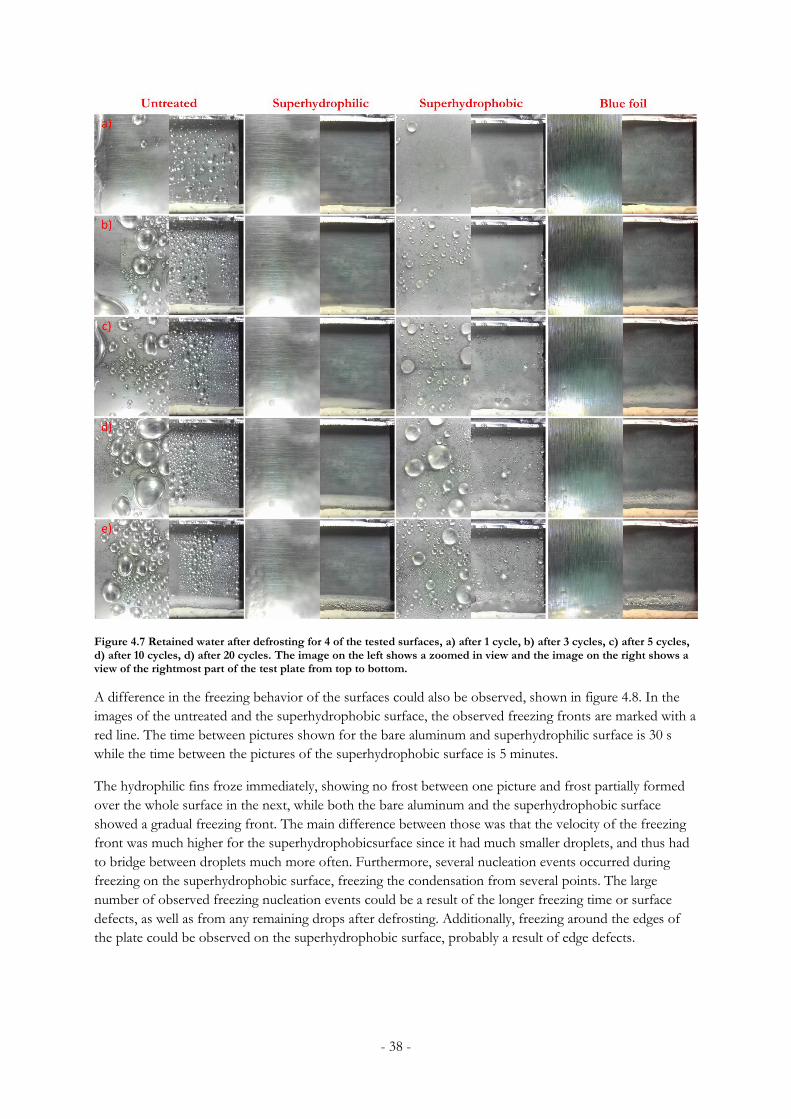
- 38 -
Figure 4.7 Retained water after defrosting for 4 of the tested surfaces, a) after 1 cycle, b) after 3 cycles, c) after 5 cycles, d) after 10 cycles, d) after 20 cycles. The image on the left shows a zoomed in view and the image on the right shows a view of the rightmost part of the test plate from top to bottom.
A difference in the freezing behavior of the surfaces could also be observed, shown in figure 4.8. In the
images of the untreated and the superhydrophobic surface, the observed freezing fronts are marked with a
red line. The time between pictures shown for the bare aluminum and superhydrophilic surface is 30 s
while the time between the pictures of the superhydrophobic surface is 5 minutes.
The hydrophilic fins froze immediately, showing no frost between one picture and frost partially formed
over the whole surface in the next, while both the bare aluminum and the superhydrophobic surface
showed a gradual freezing front. The main difference between those was that the velocity of the freezing
front was much higher for the superhydrophobicsurface since it had much smaller droplets, and thus had
to bridge between droplets much more often. Furthermore, several nucleation events occurred during
freezing on the superhydrophobic surface, freezing the condensation from several points. The large
number of observed freezing nucleation events could be a result of the longer freezing time or surface
defects, as well as from any remaining drops after defrosting. Additionally, freezing around the edges of
the plate could be observed on the superhydrophobic surface, probably a result of edge defects.

- 39 -
Figure 4.8 Observation of different freezing behavior. Top row shows an image during freezing and the bottom row shows the uncoated and superhydrophilic surface 30 seconds later, and the superhydrophobic surface 5 minutes later.
- 40 -
5 Conclusion
The aim of this thesis was to experimentally investigate the potential of hydrophilic and hydrophobic
surface coatings to minimize the negative performance impact of frosting in Air-source heat pumps.
Tests were performed in a wind tunnel inside a climate chamber under steady conditions. Seven different
surfaces, one superhydrophobic, five hydrophilic (one superhydrophilic, 4 hydrophilic foils), and one
uncoated surface were tested. Each surface was tested in an climate chamber set point air temperature of 2
°C and a relative humidity of 84 %, resulting in a wind tunnel air temperature of 2.5 °C.
The results show the need for multiple-cycle testing, as the performance differs between the first cycles
and later cycles since some surfaces may perform well during the first cycles, and perform worse over later
cycles. Single-cycle or few-cycle test does not show performance degradation and the effect of water
retention and buildup over several cycles. As such, it is important to be aware of the difference between
single or few-cycle tests compared to longer tests over multiple cycles of frosting and defrosting. Single
cycle tests may give different results than longer tests that better represents real operating conditions.
All of the tested surfaces showed a trend of a gradual drop in performance over subsequent cycles.
The experiments showed that hydrophilic surface coatings performed the best during frosting conditions
with an average duty cycle of 0.83 over all five surfaces. The superhydrophilic surface performed worse
than the uncoated aluminum surface with a duty cycle of 0.56 compared to 0.69 for the uncoated. It was
observed that droplets remained pinned on the superhydrophobic surface over several cycles, obstructing
the air flow and leading to repeated defrosting.
6 Future work
Despite the numerous studies in this field, there is a need for future research to advance the science and to
improve the knowledge of the effects of surface coatings. There is a need for more comprehensive
studies, over a wider range of conditions, configurations, coatings and in particular longer tests over
multiple cycles.
Additionally, research is performed on multiple different test setups, from flat plate studies to full scale
evaporators, and different surface coatings, where the information regarding the coatings are often limited
to a static contact angle before testing. More information could help better compare the results from
different studies to allow studies build towards a more general understanding, both of the difference
between test methods employed, surfaces and surface characteristics and how they affect results.
As such, this research could be furthered by expanding the tests over a wider range of test conditions.
Tests during different conditions (air temperature, humidity, plate temperature)
Tests with active defrost instead of passive
Test other defrost control methods
Tests on other geometries, e.g. parallel plates or on actual heat exchangers
Test other surface coatings and couple these tests with additional contact angle measurements
(Contact angles before and after testing, hysteresis values)
Integrate automatic frost thickness measurements, weighting of frost and meltwater during cycles
and heat transfer measurements to measure actual capacity and efficiency
Field testing
Test other solutions for improving defrost efficiency in combination with surface coatings

- 41 -
References
[1] J.B. Dooley, Determination and Characterization of Ice Propagation Mechanisms on Surfaces Undergoing Dropwise Condensation, Ph.D. Thesis, Texas A&M University, 2011. http://oaktrust.library.tamu.edu/handle/1969.1/ETD-TAMU-2010-05-8038 (accessed December 8, 2017).
[2] V.P. Carey, Liquid-vapor phase-change phenomena: an introduction to the thermophysics of vaporization and condensation processes in heat transfer equipment, 2. ed., Taylor & Francis, New York, 2008.
[3] I. Baring-Gould, R. Cattin, M. Durstewitz, M. Hulkkonen, A. Krenn, T. Laakso, A. Lacroix, E. Peltola, G. Ronsten, L. Tallhaug, T. Wallenius, 2 IEA Wind Recommended Practice 13: Wind Energy in Cold Climates, 2012. https://ieawind.org/index_page_postings/June%207%20posts/task%2019%20cold_climate_%20rp_approved05.12.pdf (accessed November 10, 2017).
[4] T. Cebeci, F. Kafyeke, Aircraft Icing, Annual Review of Fluid Mechanics. 35 (2003) 11–21. doi:10.1146/annurev.fluid.35.101101.161217.
[5] A.F. Emery, B.L. Siegel, Experimental measurements of the effects of frost formation on heat exchanger performance, American Society of Mechanical Engineers, Heat Transfer Division. 139 (1990) 7.
[6] L. Makkonen, Models for the growth of rime, glaze, icicles and wet snow on structures, Philosophical Transactions of the Royal Society A: Mathematical, Physical and Engineering Sciences. 358 (2000) 2913–2939. doi:10.1098/rsta.2000.0690.
[7] NEEP, Northeast/Mid-Atlantic Air-Source Heat Pump Market Strategies Report - 2016 Update | NEEP, Northeast Energy Efficiency Partnerships, 2017. http://www.neep.org/northeastmid-atlantic-air-source-heat-pump-market-strategies-report-2016-update (accessed May 23, 2018).
[8] R. Östin, S. Andersson, Frost growth parameters in a forced air stream, International Journal of Heat and Mass Transfer. 34 (1991) 1009–1017. doi:10.1016/0017-9310(91)90012-4.
[9] A. Léoni, M. Mondot, F. Durier, R. Revellin, P. Haberschill, State-of-the-art review of frost deposition on flat surfaces, International Journal of Refrigeration. 68 (2016) 198–217. doi:10.1016/j.ijrefrig.2016.04.004.
[10] W. Wang, J. Xiao, Q.C. Guo, W.P. Lu, Y.C. Feng, Field test investigation of the characteristics for the air source heat pump under two typical mal-defrost phenomena, Applied Energy. 88 (2011) 4470–4480. doi:10.1016/j.apenergy.2011.05.047.
[11] S. Garimella, Innovations in energy efficient and environmentally friendly space-conditioning systems, Energy. 28 (2003) 1593–1614. doi:10.1016/S0360-5442(03)00120-8.
[12] J.-S. Park, J. Kim, K.-S. Lee, Thermal and drainage performance of a louvered fin heat exchanger according to heat exchanger inclination angle under frosting and defrosting conditions, International Journal of Heat and Mass Transfer. 108 (2017) 1335–1339. doi:10.1016/j.ijheatmasstransfer.2017.01.043.
[13] J.-H. Kim, E.A. Groll, Performance Comparisons of a Unitary Split System Using Microchannel and Fin-Tube Outdoor Coils, ASHRAE Transactions; Atlanta. 109 (2003) 219–229.
[14] S. Padhmanabhan, L. Cremaschi, D. Fisher, Comparison of Frost and Defrost Performance Between Microchannel Coil and Fin-and-Tube Coil for Heat Pump Systems, International Journal of Air-Conditioning and Refrigeration. 19 (2011) 273–284. doi:10.1142/S2010132511000600.
[15] D. Johannsson, N. Ljung, Frostbildning på luftberörda värmepumpar, Bachelor of science thesis, KTH, Royal Institute of Technology, 2018.
[16] P. Fahlén, Frosting and defrosting of air-coils, KTH, 1996. [17] A.D. Sommers, N.L. Truster, A.C. Napora, A.C. Riechman, E.J. Caraballo, Densification of frost on
hydrophilic and hydrophobic substrates – Examining the effect of surface wettability, Experimental Thermal and Fluid Science. 75 (2016) 25–34. doi:10.1016/j.expthermflusci.2016.01.008.
[18] S. Nath, S.F. Ahmadi, J.B. Boreyko, A Review of Condensation Frosting, Nanoscale and Microscale Thermophysical Engineering. 21 (2017) 81–101. doi:10.1080/15567265.2016.1256007.
[19] N. Seki, S. Fukusako, K. Matsuo, S. Uemura, An analysis of incipient frost formation, Warme- Und Stoffubertragung. 19 (1985) 9–18. doi:10.1007/BF01682542.

- 42 -
[20] W.F. Mohs, F.A. Kulacki, Heat and Mass Transfer in the Melting of Frost, Springer, Cham, 2015. https://link-springer-com.focus.lib.kth.se/book/10.1007%2F978-3-319-20508-3 (accessed May 21, 2018).
[21] S.A. Tassou, C.J. Marquand, Effects of evaporator frosting and defrosting on the performance of air-to-water heat pumps, Applied Energy. 28 (1987) 19–33. doi:10.1016/0306-2619(87)90038-9.
[22] J.E. Hesselgreaves, Chapter 2 - INDUSTRIAL COMPACT EXCHANGERS, in: Compact Heat Exchangers, Pergamon, Oxford, 2001: pp. 27–81. doi:10.1016/B978-008042839-0/50004-5.
[23] R. and A.-C.E. American Society of Heating Inc., 2016 ASHRAE Handbook - Heating, Ventilating, and Air-Conditioning Systems and Equipment (SI Edition), (n.d.). http://app.knovel.com/hotlink/toc/id:kpASHRAEM6/ashrae-handbook-heating/ashrae-handbook-heating.
[24] M.B. Pate, Design Considerations for Air-Conditioning Evaporator and Condenser Coils, in: Two-Phase Flow Heat Exchangers, Springer, Dordrecht, 1988: pp. 849–884. doi:10.1007/978-94-009-2790-2_28.
[25] E. Macchi, Studies on the influence of frost formation on evaporator heat surfaces, Scanref. (1992) 14, 16–19.
[26] N.F. Aljuwayhel, D.T. Reindl, S.A. Klein, G.F. Nellis, Experimental investigation of the performance of industrial evaporator coils operating under frosting conditions, International Journal of Refrigeration. 31 (2008) 98–106. doi:10.1016/j.ijrefrig.2007.05.010.
[27] W. Abdallah, J. S. Buckley, A. Carnegie, J. Edwards, B. Herold, E. Fordham, A. Graue, T. Habashy, N. Seleznev, C. Signer, H. Hussain, B. Montaron, M. Ziauddin, Fundamentals of Wettability (Oilfield Review) | Schlumberger, Oilfield Review. 19 (2007) 44–61.
[28] Y. Yuan, T.R. Lee, Contact Angle and Wetting Properties, in: Surface Science Techniques, Springer, Berlin, Heidelberg, 2013: pp. 3–34. doi:10.1007/978-3-642-34243-1_1.
[29] X.F. Zhang, K.S. Zhou, C.M. Deng, M. Liu, Z.Q. Deng, C.G. Deng, J.B. Song, Gas-deposition mechanisms of 7YSZ coating based on plasma spray-physical vapor deposition, Journal of the European Ceramic Society. 36 (2016) 697–703. doi:10.1016/j.jeurceramsoc.2015.10.041.
[30] K.-Y. Law, H. Zhao, Surface Wetting Characterization, Contact Angle, and Fundamentals, Springer, Cham, 2016. doi:/10.1007/978-3-319-25214-8.
[31] 11.3: Some Properties of Liquids, Chemistry LibreTexts. (2014). https://chem.libretexts.org/Textbook_Maps/General_Chemistry_Textbook_Maps/Map%3A_Chemistry%3A_The_Central_Science_(Brown_et_al.)/11%3A_Liquids_and_Intermolecular_Forces/11.3%3A_Some_Properties_of_Liquids (accessed January 24, 2018).
[32] P.-G. de Gennes, F. Brochard-Wyart, D. Quéré, Capillarity and Wetting Phenomena Drops, Bubbles, Pearls, Waves, Springer, New York, NY, 2004. doi:10.1007/978-0-387-21656-0.
[33] A.W. Adamson, Physical chemistry of surfaces, Wiley, 1990. https://books.google.se/books?id=1z9RAAAAMAAJ.
[34] B. Krasovitski, A. Marmur, Drops Down the Hill: Theoretical Study of Limiting Contact Angles and the Hysteresis Range on a Tilted Plate, Langmuir. 21 (2005) 3881–3885. doi:10.1021/la0474565.
[35] R. Tadmor, K. Chaurasia, P.S. Yadav, A. Leh, P. Bahadur, L. Dang, W. R. Hoffer, Drop Retention Force as a Function of Resting Time, Langmuir. 24 (2008) 9370–9374. doi:10.1021/la7040696.
[36] E. Pierce, F.J. Carmona, A. Amirfazli, Understanding of sliding and contact angle results in tilted plate experiments, Colloids and Surfaces A: Physicochemical and Engineering Aspects. 323 (2008) 73–82. doi:10.1016/j.colsurfa.2007.09.032.
[37] M. Nosonovsky, R. Ramachandran, Geometric Interpretation of Surface Tension Equilibrium in Superhydrophobic Systems, Entropy. 17 (2015) 4684–4700. doi:10.3390/e17074684.
[38] M. Nosonovsky, R. Ramachandran, Geometric Interpretation of Surface Tension Equilibrium in Superhydrophobic Systems, 2015. doi:10.3390/e17074684.
[39] S. Shin, J. Seo, H. Han, S. Kang, H. Kim, T. Lee, Bio-Inspired Extreme Wetting Surfaces for Biomedical Applications, Materials. 9 (2016) 116. doi:10.3390/ma9020116.
[40] A. Marmur, Wetting on Hydrophobic Rough Surfaces: To Be Heterogeneous or Not To Be?, Langmuir. 19 (2003) 8343–8348. doi:10.1021/la0344682.
[41] N. Michael, B. Bhushan, Hierarchical roughness makes superhydrophobic states stable, Microelectronic Engineering. 84 (2007) 382–386. doi:10.1016/j.mee.2006.10.054.
- 43 -
[42] A.J. Meuler, J.D. Smith, K.K. Varanasi, J.M. Mabry, G.H. McKinley, R.E. Cohen, Relationships between Water Wettability and Ice Adhesion, ACS Appl. Mater. Interfaces. 2 (2010) 3100–3110. doi:10.1021/am1006035.
[43] H.Y. Erbil, The debate on the dependence of apparent contact angles on drop contact area or three-phase contact line: A review, Surface Science Reports. 69 (2014) 325–365. doi:10.1016/j.surfrep.2014.09.001.
[44] C.W. Extrand, Contact Angles and Hysteresis on Surfaces with Chemically Heterogeneous Islands, Langmuir. 19 (2003) 3793–3796. doi:10.1021/la0268350.
[45] L. Gao, T.J. McCarthy, Wetting 101°, Langmuir. 25 (2009) 14105–14115. doi:10.1021/la902206c. [46] L. Gao, T.J. McCarthy, How Wenzel and Cassie Were Wrong, Langmuir. 23 (2007) 3762–3765.
doi:10.1021/la062634a. [47] J. Wu, J. Xia, W. Lei, B. Wang, Advanced understanding of stickiness on superhydrophobic surfaces,
Scientific Reports. 3 (2013) 3268. doi:10.1038/srep03268. [48] F. Schellenberger, N. Encinas, D. Vollmer, H.-J. Butt, How Water Advances on Superhydrophobic
Surfaces, Phys. Rev. Lett. 116 (2016) 096101. doi:10.1103/PhysRevLett.116.096101. [49] E.J. De Souza, L. Gao, T.J. McCarthy, E. Arzt, A.J. Crosby, Effect of Contact Angle Hysteresis on
the Measurement of Capillary Forces, Langmuir. 24 (2008) 1391–1396. doi:10.1021/la702188t. [50] R. Tadmor, R. Das, S. Gulec, J. Liu, H. E. N’guessan, M. Shah, P. S. Wasnik, S.B. Yadav, Solid–
Liquid Work of Adhesion, Langmuir. 33 (2017) 3594–3600. doi:10.1021/acs.langmuir.6b04437. [51] C.W. Extrand, Comment on “Solid–Liquid Work of Adhesion,” Langmuir. 33 (2017) 9241–9242.
doi:10.1021/acs.langmuir.7b02476. [52] S. Gulec, S. Yadav, R. Das, R. Tadmor, Reply to Comment on “Solid–Liquid Work of Adhesion,”
Langmuir. 33 (2017) 13899–13901. doi:10.1021/acs.langmuir.7b03350. [53] P. Roach, N.J. Shirtcliffe, M.I. Newton, Progess in superhydrophobic surface development, Soft
Matter. 4 (2008) 224–240. doi:10.1039/B712575P. [54] L. Gao, T.J. McCarthy, Teflon is Hydrophilic. Comments on Definitions of Hydrophobic, Shear
versus Tensile Hydrophobicity, and Wettability Characterization, Langmuir. 24 (2008) 9183–9188. doi:10.1021/la8014578.
[55] N.H. Fletcher, The Chemical Physics of Ice, Cambridge University Press, Cambridge, 1970. [56] B. Na, R.L. Webb, A fundamental understanding of factors affecting frost nucleation, International
Journal of Heat and Mass Transfer. 46 (2003) 3797–3808. doi:10.1016/S0017-9310(03)00194-7. [57] R.O. Piucco, C.J.L. Hermes, C. Melo, J.R. Barbosa, A study of frost nucleation on flat surfaces,
Experimental Thermal and Fluid Science. 32 (2008) 1710–1715. doi:10.1016/j.expthermflusci.2008.06.004.
[58] E. Amiri Rad, M.R. Mahpeykar, A.R. Teymourtash, Evaluation of simultaneous effects of inlet stagnation pressure and heat transfer on condensing water-vapor flow in a supersonic Laval nozzle, Scientia Iranica. 20 (2013) 141–151. doi:10.1016/j.scient.2012.12.009.
[59] Particle Formation: Theory of Nucleation and Systems, (n.d.). http://www.mpikg.mpg.de/colloid-chemistry/lecture-scripts (accessed February 26, 2018).
[60] S. Nath, J.B. Boreyko, On Localized Vapor Pressure Gradients Governing Condensation and Frost Phenomena, Langmuir. 32 (2016) 8350–8365. doi:10.1021/acs.langmuir.6b01488.
[61] K.R. Murphy, W.T. McClintic, K.C. Lester, C.P. Collier, J.B. Boreyko, Dynamic Defrosting on Scalable Superhydrophobic Surfaces, ACS Appl. Mater. Interfaces. 9 (2017) 24308–24317. doi:10.1021/acsami.7b05651.
[62] S.A. Kulinich, S. Farhadi, K. Nose, X.W. Du, Superhydrophobic Surfaces: Are They Really Ice-Repellent?, Langmuir. 27 (2011) 25–29. doi:10.1021/la104277q.
[63] J.B. Boreyko, B.R. Srijanto, T.D. Nguyen, C. Vega, M. Fuentes-Cabrera, C.P. Collier, Dynamic Defrosting on Nanostructured Superhydrophobic Surfaces, Langmuir. 29 (2013) 9516–9524. doi:10.1021/la401282c.
[64] J.B. Boreyko, C.H. Baker, C.R. Poley, C.-H. Chen, Wetting and Dewetting Transitions on Hierarchical Superhydrophobic Surfaces, Langmuir. 27 (2011) 7502–7509. doi:10.1021/la201587u.
[65] L.B. Boinovich, A.M. Emelyanenko, Anti-icing Potential of Superhydrophobic Coatings, Mendeleev Communications. 23 (2013) 3–10. doi:10.1016/j.mencom.2013.01.002.
[66] S. Jung, M.K. Tiwari, D. Poulikakos, Frost halos from supercooled water droplets, PNAS. 109 (2012) 16073–16078. doi:10.1073/pnas.1206121109.
- 44 -
[67] E. Granryd, Refrigerating Engineering Part II, Department of Energy Technology, Division of Applied Thermodynamics and Refrigeration, Royal Institute of Technology, KTH, Stockholm, Sweden, 2005.
[68] J. Iragorry, Y.-X. Tao, S. Jia, Review Article: A Critical Review of Properties and Models for Frost Formation Analysis, HVAC&R Research. 10 (2004) 393–420. doi:10.1080/10789669.2004.10391111.
[69] C.J.L. Hermes, R.O. Piucco, J.R. Barbosa, C. Melo, A study of frost growth and densification on flat surfaces, Experimental Thermal and Fluid Science. 33 (2009) 371–379. doi:10.1016/j.expthermflusci.2008.10.006.
[70] A. El Cheikh, A. Jacobi, A mathematical model for frost growth and densification on flat surfaces, International Journal of Heat and Mass Transfer. 77 (2014) 604–611. doi:10.1016/j.ijheatmasstransfer.2014.05.054.
[71] Y. Hayashi, A. Aoki, S. Adachi, K. Hori, Study of Frost Properties Correlating With Frost Formation Types, J. Heat Transfer. 99 (1977) 239–245. doi:10.1115/1.3450675.
[72] H. Lee, J. Shin, S. Ha, B. Choi, J. Lee, Frost formation on a plate with different surface hydrophilicity, International Journal of Heat and Mass Transfer. 47 (2004) 4881–4893. doi:10.1016/j.ijheatmasstransfer.2004.05.021.
[73] K. Kim, K.-S. Lee, Frosting and defrosting characteristics of a fin according to surface contact angle, International Journal of Heat and Mass Transfer. 54 (2011) 2758–2764. doi:10.1016/j.ijheatmasstransfer.2011.02.065.
[74] A.D. Sommers, A.C. Napora, N.L. Truster, E.J. Caraballo, C.J.L. Hermes, A semi-empirical correlation for predicting the frost density on hydrophilic and hydrophobic substrates, International Journal of Refrigeration. 74 (2017) 313–323. doi:10.1016/j.ijrefrig.2016.10.025.
[75] E. Moallem, T. Hong, L. Cremaschi, D.E. Fisher, Effects of surface coating and water retention on frost formation in microchannel evaporators (ASHRAE RP-1589), HVAC&R Research. 19 (2013) 347–362. doi:10.1080/10789669.2013.781056.
[76] W. Donnellan, Investigation and optimisation of demand defrost strategies for transport refrigeration systems, (2007). https://core.ac.uk/display/51065123 (accessed May 21, 2018).
[77] Y. Liu, F.A. Kulacki, An experimental study of defrost on treated surfaces: Effect of frost slumping, International Journal of Heat and Mass Transfer. 119 (2018) 880–890. doi:10.1016/j.ijheatmasstransfer.2017.12.018.
[78] C. Liang, F. Wang, Y. Lü, M. Yang, X. Zhang, Experimental and theoretical study of frost melting water retention on fin surfaces with different surface characteristics, Experimental Thermal and Fluid Science. 71 (2016) 70–76. doi:10.1016/j.expthermflusci.2015.10.015.
[79] J.H. Zhu, Y.Y. Sun, W. Wang, S.M. Deng, Y.J. Ge, L.T. Li, Developing a new frosting map to guide defrosting control for air-source heat pump units, Applied Thermal Engineering. 90 (2015) 782–791. doi:10.1016/j.applthermaleng.2015.06.076.
[80] J. Zhu, Y. Sun, W. Wang, Y. Ge, L. Li, J. Liu, A novel Temperature–Humidity–Time defrosting control method based on a frosting map for air-source heat pumps, International Journal of Refrigeration. 54 (2015) 45–54. doi:10.1016/j.ijrefrig.2015.02.005.
[81] Y. Jiang, J. Dong, M. Qu, S. Deng, Y. Yao, A novel defrosting control method based on the degree of refrigerant superheat for air source heat pumps, International Journal of Refrigeration. 36 (2013) 2278–2288. doi:10.1016/j.ijrefrig.2013.05.016.
[82] J. Xiao, W. Wang, Q.C. Guo, Y.H. Zhao, An experimental study of the correlation for predicting the frost height in applying the photoelectric technology, International Journal of Refrigeration. 33 (2010) 1006–1014. doi:10.1016/j.ijrefrig.2010.03.002.
[83] J.M.W. Lawrence, J.A. Evans, Refrigerant flow instability as a means to predict the need for defrosting the evaporator in a retail display freezer cabinet, International Journal of Refrigeration. 31 (2008) 107–112. doi:10.1016/j.ijrefrig.2007.05.015.
[84] M. Amer, C.-C. Wang, Review of defrosting methods, Renewable and Sustainable Energy Reviews. 73 (2017) 53–74. doi:10.1016/j.rser.2017.01.120.
[85] M. Song, S. Deng, C. Dang, N. Mao, Z. Wang, Review on improvement for air source heat pump units during frosting and defrosting, Applied Energy. 211 (2018) 1150–1170. doi:10.1016/j.apenergy.2017.12.022.
[86] L. Liu, A.M. Jacobi, Air-Side Surface Wettability Effects on the Performance of Slit-Fin-and-Tube Heat Exchangers Operating Under Wet-Surface Conditions, J. Heat Transfer. 131 (2009) 051802-051802–9. doi:10.1115/1.2994722.

- 45 -
[87] L.T. Li, W. Wang, Y.Y. Sun, Y.C. Feng, W.P. Lu, J.H. Zhu, Y.J. Ge, Investigation of defrosting water retention on the surface of evaporator impacting the performance of air source heat pump during periodic frosting–defrosting cycles, Applied Energy. 135 (2014) 98–107. doi:10.1016/j.apenergy.2014.07.028.
[88] M. Järn, preparering av superhydrofoba o superhydrofila ytor, [E-mail], (2018). [89] G. Heydari, E. Thormann, M. Järn, E. Tyrode, P.M. Claesson, Hydrophobic Surfaces: Topography
Effects on Wetting by Supercooled Water and Freezing Delay, J. Phys. Chem. C. 117 (2013) 21752–21762. doi:10.1021/jp404396m.
[90] J.D. Bernardin, I. Mudawar, C.B. Walsh, E.I. Franses, Contact angle temperature dependence for water droplets on practical aluminum surfaces, International Journal of Heat and Mass Transfer. 40 (1997) 1017–1033. doi:10.1016/0017-9310(96)00184-6.
[91] Kommittén för Värmepumpar, SIS / TK 467, SS-EN 14511-2:2018 Air conditioners, liquid chilling packages and heat pumps for space heating and cooling and process chillers, with electrically driven compressors - Part 2: Test conditions, SIS, Swedish Standards Institute, Stockholm, Sverige, 2018. https://enav-sis-se.focus.lib.kth.se/sv/Standard/?std=STD-80002948 (accessed June 6, 2018).