An examination of the toxic properties of water extracts in the vicinity of an oil sand extraction...
12
An examination of the toxic properties of water extracts in the vicinity of an oil sand extraction site F. Gagn e, * a C. Andr e, a M. Douville, a A. Talbot, ab J. Parrott, b M. McMaster b and M. Hewitt b Received 22nd July 2011, Accepted 9th August 2011 DOI: 10.1039/c1em10591d The industrial extraction of oil sands (OS) in northern Alberta, Canada, has raised concerns about the quality of the Athabasca River. The purpose of this study was to examine the toxic properties of various water extracts on Oncorhynchus mykiss trout hepatocytes. The water samples were fractionated on a reverse-phase C 18 cartridge and the levels of light-, medium- and heavy-weight polycyclic aromatic hydrocarbons (PAHs) were determined by fluorescence spectroscopy. Primary cultures of trout hepatocytes were exposed for 48 h at 15 C to increasing concentrations of the C 18 extract corresponding to 0.02, 0.1, 0.5 and 2.5X concentrations from upstream/downstream sites in the Athabasca River, lake and groundwater samples, OS tailings and interceptor well-water samples. Changes in cell viability, phase I and phase II biotransformation enzymes (cytochrome P4501A and glutathione S-transferase activities), oxidative damage (lipid peroxidation LPO) and genotoxicity (single and double DNA strand breaks) were monitored in post-exposure cells. The water samples decreased cell viability and increased all the above endpoints at thresholds of between 0.02 and 0.1X the water concentration. The most responsive biomarker was DNA damage but it also offered the least discrimination among sites. LPO was higher at sites downstream of the industrial operations compared to upstream sites. A decision tree analysis was performed to formulate a set of rules by which to identify the distinctive properties of each type of water samples. The analysis revealed that OS tailings and interceptor waters were characterized by an increased concentration in light PAHs (>42 mgL 1 ) and this fraction represented more than 85% of the total PAHs. These samples also inhibited GST activity, which could compromise the elimination of genotoxic PAHs present in the system. An analysis of groundwater samples revealed a contamination pattern similar to that for OS tailings. There is a need for more research into specific biomarkers of toxicity from OS tailings compounds such as naphthenic acids, light PAHs among others, which are a characteristic fingerprint of OS extraction activities. Introduction Oil sands (OS) are a sandy matrix rich in bitumen and containing heavy lipophilic aliphatic and aromatic hydrocarbons. These hydrocarbons make up most of the crude oil and are recovered by either surface mining or in situ steam injection. The industrial production of crude oil from bitumen is estimated at more than 1.3 million barrels per day in an area covering 530 km 2 wherein a Fluvial Ecosystem Research, Aquatic Ecosystem Protection Division, Water Science and Technology, Environment Canada, 105 McGill Street, Montr eal, Quebec, Canada H2Y 2E7. E-mail: [email protected] b Aquatic Ecosystem Protection Research Division, Water Science and Technology, Environment Canada, 867 Lakeshore Rd., Burlington, Ontario, Canada L7R 4A6 Environment impact This work examines the toxic effects of surface water extracts from an oil sand rich area supporting intense extraction activities. The understanding on the release and toxic properties of various water samples collected upstream and downstream the oil sand extraction area is mandatory to understand the impact of mining activities in the Athabasca River system (Alberta, Canada). Rainbow trout hepatocytes were used as an alternative to whole fish following a protocol that is currently used to monitor the quality of industrial and municipal effluents and single substances and to provide insights on the toxic mode of action of environmental pollutants. This journal is ª The Royal Society of Chemistry 2011 J. Environ. Monit. Dynamic Article Links C < Journal of Environmental Monitoring Cite this: DOI: 10.1039/c1em10591d www.rsc.org/jem PAPER Downloaded by RSC Internal on 14 September 2011 Published on 14 September 2011 on http://pubs.rsc.org | doi:10.1039/C1EM10591D View Online
-
Upload
independent -
Category
Documents
-
view
1 -
download
0
Transcript of An examination of the toxic properties of water extracts in the vicinity of an oil sand extraction...

Dynamic Article LinksC<Journal ofEnvironmentalMonitoringCite this: DOI: 10.1039/c1em10591d
www.rsc.org/jem PAPER
Dow
nloa
ded
by R
SC I
nter
nal o
n 14
Sep
tem
ber
2011
Publ
ishe
d on
14
Sept
embe
r 20
11 o
n ht
tp://
pubs
.rsc
.org
| do
i:10.
1039
/C1E
M10
591D
View Online
An examination of the toxic properties of water extracts in the vicinity of anoil sand extraction site
F. Gagn�e,*a C. Andr�e,a M. Douville,a A. Talbot,ab J. Parrott,b M. McMasterb and M. Hewittb
Received 22nd July 2011, Accepted 9th August 2011
DOI: 10.1039/c1em10591d
The industrial extraction of oil sands (OS) in northern Alberta, Canada, has raised concerns about the
quality of the Athabasca River. The purpose of this study was to examine the toxic properties of various
water extracts on Oncorhynchus mykiss trout hepatocytes. The water samples were fractionated on
a reverse-phase C18 cartridge and the levels of light-, medium- and heavy-weight polycyclic aromatic
hydrocarbons (PAHs) were determined by fluorescence spectroscopy. Primary cultures of trout
hepatocytes were exposed for 48 h at 15 �C to increasing concentrations of the C18 extract
corresponding to 0.02, 0.1, 0.5 and 2.5X concentrations from upstream/downstream sites in the
Athabasca River, lake and groundwater samples, OS tailings and interceptor well-water samples.
Changes in cell viability, phase I and phase II biotransformation enzymes (cytochrome P4501A and
glutathione S-transferase activities), oxidative damage (lipid peroxidation LPO) and genotoxicity
(single and double DNA strand breaks) were monitored in post-exposure cells. The water samples
decreased cell viability and increased all the above endpoints at thresholds of between 0.02 and 0.1X the
water concentration. The most responsive biomarker was DNA damage but it also offered the least
discrimination among sites. LPO was higher at sites downstream of the industrial operations compared
to upstream sites. A decision tree analysis was performed to formulate a set of rules by which to identify
the distinctive properties of each type of water samples. The analysis revealed that OS tailings and
interceptor waters were characterized by an increased concentration in light PAHs (>42 mg L�1) and
this fraction represented more than 85% of the total PAHs. These samples also inhibited GST activity,
which could compromise the elimination of genotoxic PAHs present in the system. An analysis of
groundwater samples revealed a contamination pattern similar to that for OS tailings. There is
a need for more research into specific biomarkers of toxicity from OS tailings compounds such as
naphthenic acids, light PAHs among others, which are a characteristic fingerprint of OS extraction
activities.
aFluvial Ecosystem Research, Aquatic Ecosystem Protection Division,Water Science and Technology, Environment Canada, 105 McGill Street,Montr�eal, Quebec, Canada H2Y 2E7. E-mail: [email protected] Ecosystem Protection Research Division, Water Science andTechnology, Environment Canada, 867 Lakeshore Rd., Burlington,Ontario, Canada L7R 4A6
Environment impact
This work examines the toxic effects of surface water extracts from a
understanding on the release and toxic properties of various wa
extraction area is mandatory to understand the impact of mining
Rainbow trout hepatocytes were used as an alternative to whole fish
of industrial and municipal effluents and single substances and to
pollutants.
This journal is ª The Royal Society of Chemistry 2011
Introduction
Oil sands (OS) are a sandy matrix rich in bitumen and containing
heavy lipophilic aliphatic and aromatic hydrocarbons. These
hydrocarbons make up most of the crude oil and are recovered
by either surface mining or in situ steam injection. The industrial
production of crude oil from bitumen is estimated at more than
1.3 million barrels per day in an area covering 530 km2 wherein
n oil sand rich area supporting intense extraction activities. The
ter samples collected upstream and downstream the oil sand
activities in the Athabasca River system (Alberta, Canada).
following a protocol that is currently used to monitor the quality
provide insights on the toxic mode of action of environmental
J. Environ. Monit.
Dow
nloa
ded
by R
SC I
nter
nal o
n 14
Sep
tem
ber
2011
Publ
ishe
d on
14
Sept
embe
r 20
11 o
n ht
tp://
pubs
.rsc
.org
| do
i:10.
1039
/C1E
M10
591D
View Online
tailings ponds take up approximately 20% of the area.1,2 It is
estimated that the production of crude oil from OS will reach
a volume on the order of 2.9 million barrels per day by 2020.3
While the increasing activity of OS extraction by industry is of
great economic interest for Canadians, it also raises some
concerns about potential harmful impacts on the environment,
given the tremendous scale of the development area.
Crude oil is obtained by an industrial process involving alka-
line hot water extractions wherein the crude oil forms an emul-
sion at the top of the aqueous alkaline water phase. This aqueous
phase is made up of fine particles and alkali-labile organic
compounds from bitumen and represents the bulk material
contained in tailing ponds. Indeed, the tailings are composed of
fine suspended particles, metals, anionic aromatic and aliphatic
hydrocarbons. For metals, concentrations of a number of
elements such as cadmium, copper, lead, mercury, nickel, silver,
and zinc are found at higher concentrations near the develop-
ment area than upstream of it.4 Moreover, a significant
proportion of metals are bound to the organic matrix involving
protoporphyrin-metal complexes.5,6 Naphthenic acids (NAs) are
a family of compounds composed mostly of carboxylated cyclic
aliphatic hydrocarbons. This important organic family has been
demonstrated to account for the main toxic properties of tail-
ings.7–9 NAs represent the major class of alkali-extractable
organics in OS tailings, reaching levels as high as 50 mg/L.10 NAs
are a complex class of compounds governed by the general
formula CnH2n+zOx whose specific measurements represent huge
analytical challenges because of their homogeneous physical and
chemical properties. A recent study used 2-dimensionnal gas-
chromatography and time of flight mass spectrometry to detect
bi and tri pentacyclic acids fitting the formula for NAs.11 Some
NAs have aromatic rings permitting detection by synchronous
fluorescence spectroscopy.12 The presence of aromatic
compounds is associated with both commercial mixtures of NAs
and OS tailing water samples. The above study also revealed that
1–3 aromatic ring polycyclic aromatic hydrocarbons (i.e. light
PAHs) were found at much higher concentrations in tailing
ponds than at upstream sites in the river. These upstream river
sites contained more of the heavy (and highly genotoxic) PAHs
(four or more aromatic rings) from the natural leaching of OS in
the river. Dissolved PAHs concentrations in the tributaries of the
Athabasca River increased from 0.009 mg L�1 upstream to 0.2 mg
L�1 downstream of the OS mining sites in the summer.8 This
study corroborated the contention that water samples from these
sites are contaminated by the high density of naturally occurring
OS, with industrial extraction activities contributing to the
increased mobilization of total PAHs in the area. A previous
study also showed that snow is an important vector of PAH-
contaminated dust in this ecosystem, with snow samples con-
taining up to 4.8 mg L�1 of PAHs at the end of winter and could
represents another source of contamination to the river systems.8
The release of light PAHs and other compounds into an
ecosystem already contaminated by naturally occurring and/or
industrially disturbed OS heavy PAHs might represent a risk on
aquatic ecosystems. The discrimination of ecotoxicological
effects between natural and anthropogenic release of OS-derived
contaminants is a challenge. In a previous study, adult Yellow
Perch Perca flavescens were exposed to aged OS tailings water
contained in experimental ponds for up to 10 months in an
J. Environ. Monit.
attempt to determine the potential toxic effects of OS tailings
contamination.13 Following the exposure period, severe gill
erosion and viral-induced tumours were observed. The frequen-
cies of these observations were correlated to concentrations of
OS-related compounds such as the major ions and total naph-
thenate concentrations. Medium (3–4 aromatic rings) and heavy
PAHs such as pyrene and benzo(a)pyrene are well-known
immunosuppressive, genotoxic and carcinogenic substances to
aquatic animals.14–16 The manifestation of genotoxicity requires
phase 1 biotransformation by cytochrome P450 1A1 to produce
DNA-reactive intermediates.17 The conjugating activity of
glutathione S-transferase (GST) activity is also involved in the
elimination of hydroxylated PAH intermediates by the bile.16
The activity of cytochrome P4501A1 (7-ethoxyresorufin O-dee-
thylase, EROD) was induced by heavy PAHs in the Nile tilapia
but not by light PAHs.18 Interestingly, GST activity was induc-
ible by smaller PAHs such as phenanthrene (three aromatic
rings), fluoranthrene (three aromatic rings) and chrysene (four
aromatic rings). No information exists on the effects of light
PAHs and NAs on both EROD and GST activities. The toxicity
of PAHs also involves oxidative stress during biotransformation,
which could lead to major cell damage in the form of lipid per-
oxidation (LPO) or genotoxicity.19 In fathead minnow Pime-
phales promelas larvae exposed to OS, larval mortality was
directly correlated to the cytochrome P4501A1 activity that fol-
lowed exposure to oil sands.20 This suggests that three or more
aromatic ring PAHs were responsible, at least in part, for the
observed toxicity. In mature goldfish Carassius auratus, the basal
levels of testosterone were reduced in both males and female
exposed to an OS-contaminated pond compared to a control
pond, suggesting compromised steroidogenic capacity in the
gonad.21 In addition, fathead minnows held in an aged OS water
pond (>15 years but still containing 10 mg L�1 NAs with
a conductivity of 2000 mS*cm�1) completely inhibited spawning
and diminished male secondary sexual characteristics.22
The purpose of this study was to examine the sub-lethal effects
of water extracts from an intensive OS-extraction area on
primary cultures of rainbow trout hepatocytes. The sub-lethal
biomarkers examined were biotransformation activity (cyto-
chrome P4501A1 and GST activity), oxidative stress LPO and
genotoxicity (DNA strand breaks). The water samples comprised
a selection of OS tailings, OS tailing pond interceptor wells,
a reference lake, groundwater and Athabasca River sites
following an upstream-downstream gradient. The relative levels
of light, medium and heavy PAHs in the water extracts were also
examined by scanning fluorescence spectroscopy to highlight
signatures with respect to the levels and proportion of light and
heavy PAHs. An attempt was made to formulate a set of rules
based on biomarker responses and PAH concentrations by which
to characterize the various types of water samples (river, lake,
groundwater, OS tailing ponds) in this OS-rich area.
Methods
Water sample collection and preparation
Grab-water samples (120 L) were collected at five sites in the
Athabasca River, two oil sands tailing ponds (OS1 and OS2) and
interceptor well samples, one surface-water sample fromGregoire
This journal is ª The Royal Society of Chemistry 2011

Dow
nloa
ded
by R
SC I
nter
nal o
n 14
Sep
tem
ber
2011
Publ
ishe
d on
14
Sept
embe
r 20
11 o
n ht
tp://
pubs
.rsc
.org
| do
i:10.
1039
/C1E
M10
591D
View Online
Lake and groundwater samples. The reference sites were one site
upstream of Fort McMurray on the Athabasca River (near the
intakeof adrinkingwater treatment plant) and surfacewater from
Gregoire Lake. This lake (N 56 26.237; W 111 05.179) is located
approximately 15 km south of Fort McMurray, Alberta. The
upstream Athabasca River site is located about 2–3 km from the
city centre of FortMcMurray and the Northland sawmill site was
located just downstream the city of Fort McMurray below the
municipal sewage treatment plant discharge. The exact
geographic locations and basic physical and chemical properties
of the water samples are shown in Table 1. The samples were
transported to the laboratory, kept at 4 �C in the dark, and
immediately sent to various laboratories over the following days.
Upon reception in our laboratory, the water samples were frac-
tionated on C18 solid-phase mini-columns (Sep-Pak C18, Waters
Associates, Inc)whichwere activatedwith 2mLof ethanol (100%)
and with 10 mL bidistilled water. Before the extraction step, the
water samples were filtered on a 0.4-mm-pore polycarbonate
membrane filter to remove suspended solids andmicroorganisms.
A volume of 500 mL was passed through a reverse-phase C18
cartridge (360 mg) under vacuum (5 psi), washed with 10 mL of
bidistilled water and the material eluted with 1 mL of analytical-
grade ethanol (Absolute; Sigma-Aldrich Chemical Co., Ontario,
Canada). The ethanol fraction was kept at �20 �C until analysis.
Fixed wavelength fluorescence polycyclic aromatic hydrocarbon
(PAH) analysis
The levels of PAH were determined by fixed-wavelength fluores-
cence spectroscopy.23,24Avolumeof 50mLof each of the ethanolic
C18 water extracts was mixed with 150 mL of ethanol in a dark
microplate and analyzed by fluorescence using a dual mono-
chromator-basedmicroplate reader (Biotek Inc.,USA).The light-
weight PAH group includes PAHs containing 2–3 rings (e.g.
naphthalene andphenanthrene) andwas determined by excitation
at 290 nm and emission at 340 nm. Standard additions of naph-
thalene were used for calibration. Medium-weight PAHs (3–4
rings) include fluoranthene and chrysene; theywere determinedby
excitation at 325 nm and emission at 370 nm. Calibration was
achieved with standard additions of pyrene. The heavy-weight
PAH group includes PAHs with more than four rings, such as
benzo(a)pyrene and benzo(k)fluoranthene; they were determined
at 385 nm for excitation and at 440 nm for emission. Standard
Table 1 Site location and general physico-chemical characteristics of tailing
Sites Geographical location Date of co
Upstream N56 43 28.20; W111 24 06.90 Sept. 2009Northland N56 52 11.2; W111 26 26.5 Sept. 2009OS1 downstream N57 03 45.9; W111 31 11.8 Sept. 2009Muskegg N57 07 45.4; W111 36 22.4 Sept. 2009Ells N57 18 45.69; W111 39 98.6 Sept. 2009OS 1 interceptor well N 56 58 56.11; W 111 26 46.17 June 2010OS 2 interceptor well N 57 5 48.19; W 111 37 22.80 June 2010OS1 tailing pond N 56 53 56.19; W 111 23 3.23 Sept. 2009OS2 tailing pond N 57 4 46.54; W 111�3806.17 Sept. 2009Surface Water Gregoire Lake N 56 28.59 17; W 111 10 51 68 June 2010Groundwater OS2 Mildred Lake N56 99 16.3; W111 04 4.7 June 2010
a Not determined.
This journal is ª The Royal Society of Chemistry 2011
additions of benzo(a)pyrene were used for calibration at the cor-
responding wavelengths. The above wavelengths were selected to
avoid spectral overlap where the analytical signal from each PAH
group was measured independently.23 The data were expressed as
mg L�1 naphthalene, pyrene and benzo(a)pyrene equivalents for
the light, medium and heavy PAHs, respectively.
Preparation and exposure of rainbow trout hepatocytes
Primary cultures of rainbow trout (Oncorhynchus mykiss) hepa-
tocytes were freshly prepared using the double perfusion method
developed by Klauning et al.25 with some modifications.26
Young-of-the-year trout (15–20 cm fork length) were humanely
euthanized in 100 mg L�1 tricaine methanesulphonate (MS-222)
buffered with 100 mg L�1 NaHCO3, pH 7, for 5 min at 15 �C in
accordance with the recommendations of the Canadian animal
care committee. The liver of three fish were dissected, immedi-
ately transferred to a Petri dish and perfused with 20 mL of ice-
cold phosphate buffered saline containing 10 mM EDTA at
a flow rate of 2 ml/min. The perfusion buffer was then replaced
with phosphate buffered saline containing 1.5 mM CaCl2 and
100 units/ml collagenase, pH 7.4 and the livers perfused with
25 ml at a 5 ml min�1 flow rate followed by a 5–10 min incubation
at room temperature. The livers were then transferred in ice-cold
Leibovitz L-15 Medium (L15) supplemented with antibiotics
(100 mg mL�1 streptomycin and 100 units/mL penicillin), an
antimycotic (0.025 mg mL�1 amphotericin B), 10% Fetal Bovine
Serum (FBS) and 10 mM Hepes-NaOH, pH 7.4 and shaken
gently on ice for 30 min. The resulting suspension was dissociated
and filtered through a 100-mm stainless-steel mesh (Tissue
Dissociation Kit, Sigma-Aldrich Chemical Co., Ontario, Can-
ada) and cells were collected by centrifugation at 72� g for 2 min
at 4 �C, the medium removed and the cells washed with Dul-
becco’s phosphate buffered saline at pH 7.4. The cells were then
resuspended in 10 mM Tricine, 0.85% NaCl, pH 7.4 and purified
by iodixanol density barrier (OptiPrep�, Axis-Shield, Norway).
The hepatocytes were finally washed in Dulbecco’s phosphate
buffered saline, centrifuged (72 � g for 2 min at 4 �C) and the
pellet resuspended in L-15 medium without serum. The cell yield
was assessed by the use of an hemocytometer and the viability
was determined in the presence of 0.2% Trypan blue under
microscopic examination (dead cells retain the blue-coloured
dye). The initial cell viability was >96%. The cells were plated in
ponds, surface and groundwatera
llection Ammonia mg L�1 pH Conductivity uSx cm-1 DOC mg L�1
< 0.05 8.3 191 —< 0.05 7.7 200 —< 0.05 8.3 198 —< 0.05 8.3 190 —< 0.05 8.1 182 —— 7.6 1420 45— 7.6 3190 673 8.77 1920 —6 8.23 2150 —< 0.05 6.9 130 10.5— 7.3 2640 43
J. Environ. Monit.

Dow
nloa
ded
by R
SC I
nter
nal o
n 14
Sep
tem
ber
2011
Publ
ishe
d on
14
Sept
embe
r 20
11 o
n ht
tp://
pubs
.rsc
.org
| do
i:10.
1039
/C1E
M10
591D
View Online
24-well microplates at a density of 1 � 106 cells per mL of L-15
medium and incubated overnight at 15 �C in a dark and humid
atmosphere prior to replacement of half the initial volume of
culture medium by medium containing the test extracts or
controls. The cells were exposed to increasing concentrations of
ethanol extracts (0.004, 0.02, 0.1 and 0.5%) using ethanol as the
solvent control. The exposure period was 48 h at 15 �C. Cellswere also exposed to positive controls such as a mixture of 0.1 mg
mL�1 b-naphtoflavone to control for between batch of hepato-
cyte preparations. After the exposure period, the plates were
centrifuged briefly at 100 � g (5 min) at 4 �C and the exposure
media removed by aspiration. The cells were washed with 1ml of
D-PBS and resuspended in 0.5 ml of D-PBS.
Cytotoxicity and genotoxicity assessments
Cell viability was determined according to the fluorescein
retention test using carboxylfluorescein diacetate as the fluores-
cent probe.25 The activity of cytochrome P4501A1 was deter-
mined using the 7-ethoxyresorufin assay in hepatocyte
aggregates.27 An aliquot of hepatocyte suspension (5 � 104 cells)
was mixed with 20 mM of 7-ethoxyresorufin and 100 mM of
reduced NADPH. The incubation mixture was allowed to incu-
bate at 30 �C for 0, 10, 20 and 30 min and fluorescence
measurements were taken at 520 nm excitation and 590 nm
emission wavelengths (Biotek multiplate reader, USA). Standard
solutions of 7-hydroxyresorufin were used for calibration.
Fluorescence data were normalized with cell density or total
proteins using the protein dye binding assay.28 DNA damage
(single and double stranded DNA breaks) was assessed in
exposed hepatocytes by the alkaline precipitation assay modified
for the fluorescent quantification of DNA strand breaks in the
presence of trace amounts of detergent.29,30 The assay principle is
based on K-assisted SDS precipitation of genomic DNA (asso-
ciated with proteins), which leaves protein-free DNA breaks
(single and double stranded) in the supernatant. Salmon sperm
DNA standards were used for DNA calibration using the SYTO
dye methodology. The results were expressed as mg of superna-
tant DNA/cell density. LPO was determined by a spectrofluoro-
metric assay, which uses thiobarbituric acid for the
determination of malonaldehyde.31 Briefly, 20 mL of hepatocyte
Table 2 Fluorescence PAH analysisac
SitesLight PAHs(mg L�1)
Me(mg
Control < dL < dUpstream 12.8 � 0.8 24Northland 32 � 0.9 36Downstream OS1 14.8 � 0.9 28Muskeg River confluence 10.8 � 0.8 22Ells River confluence 24 � 1 12Gregoire Lake surface water 31.4 � 6 15.Mildred Lake groundwater 372 � 40 42OS1 tailings 1 970 � 87 60OS1 Interceptor well 972 � 63 136OS2 tailings 5 000 � 660 232OS2 Interceptor well 11 000 � 380 188
a Fluorescence analysis was performed on C18 SPE ethanol extracts. Light, mepyrene equivalents (mg L�1) respectively.b % light PAHs/(# light + medium +shown in bold.
J. Environ. Monit.
suspension was mixed with 130 mL of bi-distilled water and
mixed with 25 mL of 10% trichloroacetic acid solution containing
1 mM FeSO4 and 50 mL of 0.67% thiobarbituric acid. The
mixture then stood in a hot-water bath (70–80 �C) for 10 min,
cooled at room temperature for 15 min and fluorescence
measured at 540 nm excitation and 600 nm emission (Biotek
microplate reader, USA). Blanks and standards of tetrame-
thoxypropane (stabilized form of malonaldehyde) were prepared
in the presence of the PBS solution. Because the reagent could
react with other aldehydes, results were expressed as mg of thi-
obarbituric acid reactants (TBARS)/cell density. Glutathione
S-transferase (GST) was determined a spectrophotometric
methodology using 2,4-dichloronitrobenzene as the co-substrate
and reduced GSH.32 The data were expressed as the increase in
absorbance at 340 nm min�1/total proteins.
Data analysis
Rainbow trout hepatocytes were exposed to the surface-water
extracts in quadriplicate (n ¼ 4) and the exposure experiments
were repeated twice using a different water sample. The data
were normalized and reported as fold changes in the solvent (i.e.
ethanol) control group: value of treatment/mean value of
controls. The difference between treatments was determined
using ANOVA and critical differences between treatment groups
were appraised using the Mann-Whitney U test. Correlation
analyses were performed using the Pearson-moment procedure.
Significance was set at p < 0.05 but marginal changes (0.05 <
p < 0.1) were reported. A discriminant function analysis and
a decision tree analysis were performed for site classification
purposes and to identify which of the water properties (i.e., PAH
measurements and measured biomarkers) were associated with
the type of water sample.
Results
Fluorescence spectroscopic analyses
The levels of PAH in the water extracts were determined by
scanning fluorescence spectroscopy (Table 2). The data revealed
that all water extracts contained detectable amounts of light
dium PAHsL�1)
Heavy PAHs(mg L�1) % light PAHsb
L <dL —� 0.9 14 � 0.2 25� 0.9 14 � 0.2 39� 0.4 18 � 0.2 24� 0.25 22 � 0.2 20� 0.25 11.2 � 0.2 516 � 1 4 � 0.1 63� 5 6 � 0.3 89� 2 18 � 0.2 95� 14 10 � 0.7 87� 5 20 � 0.7 69� 9 8 � 0.5 98
dium and heavy PAHs are expressed as naphthalene, pyrene and benzo(a)heavy PAHs).c Water extracts from industrial extraction activities are
This journal is ª The Royal Society of Chemistry 2011

Table
3Cytotoxicityandsublethaleffectsofriver
surface
waterandoilsandtailingsa
bc
Sites
Upstream
Northland
OS1downstream
Muskeg
River
confluence
EllsRiver
confluence
OS1/O
S2
0.004
0.02
(0.1)
0.5%
0.004
0.02
0.1
0.5%
0.004
0.02
0.1
0.5%
0.004
0.02
0.1
0.5%
0.004
0.02
0.1
0.5%
0.004
0.02
0.1
0.5%
Viability
10.96
0.98
1.1
0.91
0.99
1.0
0.89
0.96
0.94
0.93
0.90
0.95
1.04
1.05
10.9
0.92
0.9
11
0.95
0.9
0.8*
(0.15)
(0.2)
(0.1)
(0.2)
(0.1)
(0.2)
(0.1)
(0.15)
(0.1)
(0.2)
(0.1)
(0.2)
(0.1)
(0.1)
(0.2)
(0.1)
(0.1)
(0.1)
(0.1)
(0.1)
(0.1)
(0.1)
(0.2)
(0.2)
0.95
11
0.85*
(0.1)
(0.1)
(0.1)
(0.05)
DNA
damage
1.6*
1.5*
1.5*
1.3*
1.3
1.2
1.9*
0.8*
1.1
1.4*
1.3*
1.6*
1.6*
2*
1.8*
2.3*
11.2
1.4*
1.7*
1.6*
1.3
0.8*
0.6*
(0.2)
(0.2)
(0.2)
(0.1)
(0.1)
(0.1)
(0.2)
(0.1)
(0.1)
(0.1)
(0.1)
(0.2)
(0.2)
(0.2)
(0.2)
(0.2)
(0.1)
(0.1)
(0.1)
(0.2)
(0.1)
(0.1)
(0.1)
(0.1)
1.1
1.2
1.5*
2.3*
(0.1)
(0.1)
(0.2)
(0.2)
LPO
1.2
0.95
1.1
0.92
1.8*
0.91
1.0
0.8*
1.9*
0.8
0.74*
1.1
2.6*
1.6*
2.1*
1.5*
1.1
0.9
1.4*
1.9*
2.2*
1.2
0.91
0.68*
(0.1)
(0.1)
(0.1)
(0.1)
(0.2)
(0.1)
(0.1)
(0.05)
(0.2)
(0.1)
(0.1)
(0.1)
(0.25)
(0.2)
(0.25)
(0.2)
(0.1)
(0.1)
(0.2)
(0.2)
(0.2)
(0.1)
(0.1)
(0.1)
1.4*
0.8
0.86
0.78*
(0.1)
(0.1)
(0.1)
(0.07)
GST
0.85
0.85
0.86
0.91
0.83
0.81
0.81
0.81
0.85
0.74*
0.83*
0.83*
0.9
0.95
10.95
0.7*
0.7*
0.7*
0.9
0.81
0.51*
0.49*
0.58*
(0.1)
(0.1)
(0.1)
(0.1)
(0.1)
(0.1)
(0.1)
(0.1)
(0.1)
(0.2)
(0.1)
(0.1)
(0.1)
(0.1)
(0.1)
(0.1)
(0.1)
(0.1)
(0.1)
(0.1)
(0.1)
(0.1)
(0.15)
(0.15)
0.80
0.67*
0.52*
0.5*
(0.1)
(0.1)
(0.1)
(0.1)
EROD
0.9
0.82
0.93
0.9
11.4*
1.3*
0.42*
0.96
1.1
1.2
1.3*
0.87
1.1
1.05
0.94
1.1
1.0
0.97
1.2
1.4*
3*
2*
1(0.2)
(0.1)
(0.05)
(0.1)
(0.1)
(0.2)
(0.15)
(0.2)
(0.1)
(0.05)
(0.1)
(0.1)
(0.1)
(0.1)
(0.15)
(0.05)
(0.05)
(0.1)
(0.1)
(0.05)
(0.1)
(0.25)
(0.25)
(0.1)
10.95
0.75*
0.45*
(0.05)
(0.1)
(0.1)
(0.15)
aThedata
are
expressed
asmean(�
standard
deviation)oftheresponse
factor,i.e.,activityofthetreatm
ent/meanvalueofsolventcontrols.bSignificantdifferencesare
highlightedin
bold
andwiththe*
symbol.cTheexposure
concentrationsare
expressed
in%
v/v
oftheethanolicC18extract.
This journal is ª The Royal Society of Chemistry 2011 J. Environ. Monit
Dow
nloa
ded
by R
SC I
nter
nal o
n 14
Sep
tem
ber
2011
Publ
ishe
d on
14
Sept
embe
r 20
11 o
n ht
tp://
pubs
.rsc
.org
| do
i:10.
1039
/C1E
M10
591D
View Online
.
Table
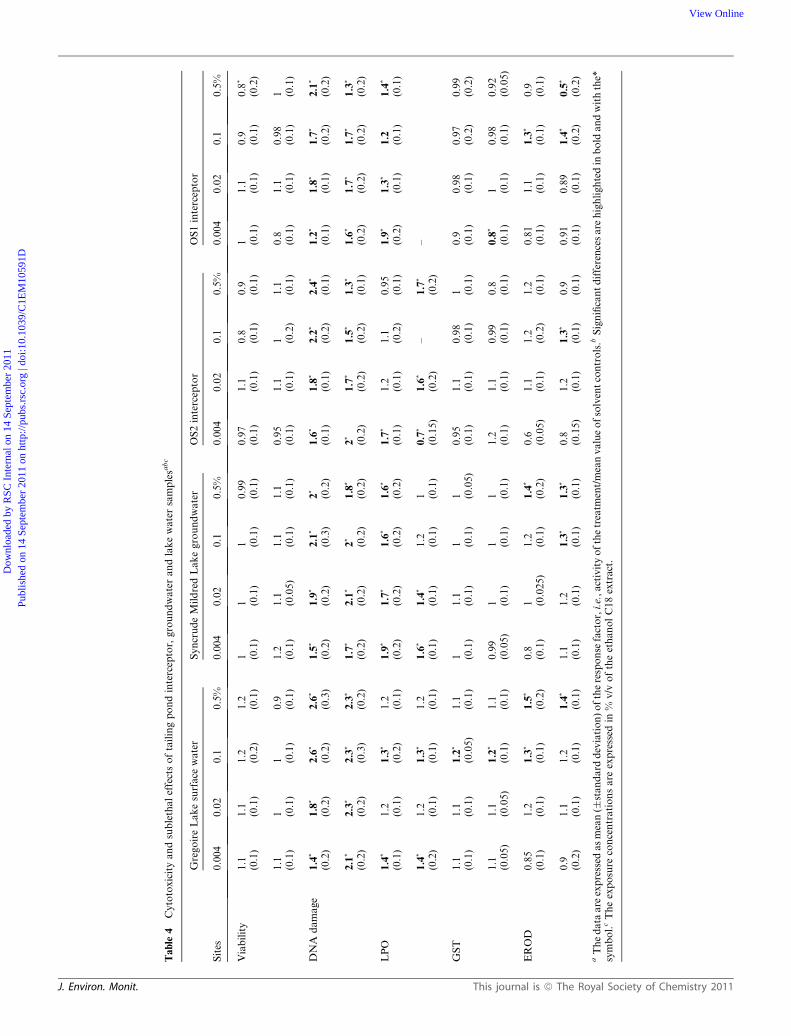
4Cytotoxicityandsublethaleffectsoftailingpondinterceptor,groundwaterandlakewatersamplesa
bc
Sites
GregoireLakesurface
water
SyncrudeMildredLakegroundwater
OS2interceptor
OS1interceptor
0.004
0.02
0.1
0.5%
0.004
0.02
0.1
0.5%
0.004
0.02
0.1
0.5%
0.004
0.02
0.1
0.5%
Viability
1.1
1.1
1.2
1.2
11
10.99
0.97
1.1
0.8
0.9
11.1
0.9
0.8
*
(0.1)
(0.1)
(0.2)
(0.1)
(0.1)
(0.1)
(0.1)
(0.1)
(0.1)
(0.1)
(0.1)
(0.1)
(0.1)
(0.1)
(0.1)
(0.2)
1.1
11
0.9
1.2
1.1
1.1
1.1
0.95
1.1
11.1
0.8
1.1
0.98
1(0.1)
(0.1)
(0.1)
(0.1)
(0.1)
(0.05)
(0.1)
(0.1)
(0.1)
(0.1)
(0.2)
(0.1)
(0.1)
(0.1)
(0.1)
(0.1)
DNA
damage
1.4
*1.8
*2.6
*2.6
*1.5
*1.9
*2.1
*2*
1.6
*1.8
*2.2
*2.4
*1.2
*1.8
*1.7
*2.1
*
(0.2)
(0.2)
(0.2)
(0.3)
(0.2)
(0.2)
(0.3)
(0.2)
(0.1)
(0.1)
(0.2)
(0.1)
(0.1)
(0.1)
(0.2)
(0.2)
2.1
*2.3
*2.3
*2.3
*1.7
*2.1
*2*
1.8
*2*
1.7
*1.5
*1.3
*1.6
*1.7
*1.7
*1.3
*
(0.2)
(0.2)
(0.3)
(0.2)
(0.2)
(0.2)
(0.2)
(0.2)
(0.2)
(0.2)
(0.2)
(0.1)
(0.2)
(0.2)
(0.2)
(0.2)
LPO
1.4
*1.2
1.3
*1.2
1.9
*1.7
*1.6
*1.6
*1.7
*1.2
1.1
0.95
1.9
*1.3
*1.2
1.4
*
(0.1)
(0.1)
(0.2)
(0.1)
(0.2)
(0.2)
(0.2)
(0.2)
(0.1)
(0.1)
(0.2)
(0.1)
(0.2)
(0.1)
(0.1)
(0.1)
1.4
*1.2
1.3
*1.2
1.6
*1.4
*1.2
10.7
*1.6
*–
1.7
*–
(0.2)
(0.1)
(0.1)
(0.1)
(0.1)
(0.1)
(0.1)
(0.1)
(0.15)
(0.2)
(0.2)
GST
1.1
1.1
1.2
*1.1
11.1
11
0.95
1.1
0.98
10.9
0.98
0.97
0.99
(0.1)
(0.1)
(0.05)
(0.1)
(0.1)
(0.1)
(0.1)
(0.05)
(0.1)
(0.1)
(0.1)
(0.1)
(0.1)
(0.1)
(0.2)
(0.2)
1.1
1.1
1.2
*1.1
0.99
11
11.2
1.1
0.99
0.8
0.8
*1
0.98
0.92
(0.05)
(0.05)
(0.1)
(0.1)
(0.05)
(0.1)
(0.1)
(0.1)
(0.1)
(0.1)
(0.1)
(0.1)
(0.1)
(0.1)
(0.1)
(0.05)
EROD
0.85
1.2
1.3
*1.5
*0.8
11.2
1.4
*0.6
1.1
1.2
1.2
0.81
1.1
1.3
*0.9
(0.1)
(0.1)
(0.1)
(0.2)
(0.1)
(0.025)
(0.1)
(0.2)
(0.05)
(0.1)
(0.2)
(0.1)
(0.1)
(0.1)
(0.1)
(0.1)
0.9
1.1
1.2
1.4
*1.1
1.2
1.3
*1.3
*0.8
1.2
1.3
*0.9
0.91
0.89
1.4
*0.5
*
(0.2)
(0.1)
(0.1)
(0.1)
(0.1)
(0.1)
(0.1)
(0.1)
(0.15)
(0.1)
(0.1)
(0.1)
(0.1)
(0.1)
(0.2)
(0.2)
aThedata
are
expressed
asmean(�
standard
deviation)oftheresponse
factor,i.e.,activityofthetreatm
ent/meanvalueofsolventcontrols.bSignificantdifferencesare
highlightedin
bold
andwiththe*
symbol.cTheexposure
concentrationsare
expressed
in%
v/v
oftheethanolC18extract.
J. Environ. Monit. This journal is ª The Royal Society of Chemistry 2011
Dow
nloa
ded
by R
SC I
nter
nal o
n 14
Sep
tem
ber
2011
Publ
ishe
d on
14
Sept
embe
r 20
11 o
n ht
tp://
pubs
.rsc
.org
| do
i:10.
1039
/C1E
M10
591D
View Online

Dow
nloa
ded
by R
SC I
nter
nal o
n 14
Sep
tem
ber
2011
Publ
ishe
d on
14
Sept
embe
r 20
11 o
n ht
tp://
pubs
.rsc
.org
| do
i:10.
1039
/C1E
M10
591D
View Online
(2–3 aromatic rings), medium (4 aromatic rings) and heavy (5
aromatic rings) PAHs. In general, the extracts of surface water
from the Athabasca River contain relatively low levels of PAHs:
in descending order, heavy PAHs > medium PAHs > light
PAHs. However, water extracts taken from OS tailing ponds
and interceptor waters contained significantly higher levels of
light and medium PAHs: in descending order, light PAHs [
medium PAHs > heavy PAHs. This suggests that water samples
from an OS-rich area bring about the release of heavy PAHs to
the water column while the wastewaters from the industrial
extraction process bring about the release of light and medium
PAHs to the tailing ponds. Indeed, the proportion of light PAHs
from tailing ponds OS1 and OS2 represented 70–98% of total
PAHs, in contrast to the surface-water samples, in which light
PAHs represented on the order of 32% of PAHs. The proportion
of light PAHs in the surface-water extracts from Gregoire Lake
was 63%of totalPAHs, indicatingadifferent contaminationpattern
from the surface water in this area. The groundwater samples from
Mildred Lake near OS2 contained 89% of light PAHs, suggesting
a similar contamination to that of OS tailings water.
Cytotoxicity and sublethal effects of river water and OS tailings
samples
The cytotoxic properties of surface water and OS tailings water
extracts are reported in Tables 3 and 4. First, exposure to b-NF
at 0.1 mg mL�1 significantly reduced cell viability by 25% in cells
and increased EROD activity and DNA strand breaks levels in
cells. Cell viability was significantly reduced in OS tailings at
a threshold concentration of 0.2%. The concentration of 0.2% of
the ethanol extracts corresponds to the undiluted sample water
i.e., 1X. The surface water and OS extracts displayed strong
genotoxic responses. In the OS ponds, a significant increase in
DNA strand-break levels was observed for OS1 at the lowest
concentration (0.004% or 0.02X) in trout hepatocytes, which was
followed by a significant drop in DNA strand breaks indicative
of reduced DNA repair activity. In OS2, an increase in DNA
strand breaks was observed at a threshold concentration of 0.02
to 0.1X. A correlation analysis revealed that the cell viability
index was positively related to DNA strand breaks for both OS
tailings. In surface waters, DNA damage was also apparent at all
sites, with no significant upstream or downstream effect (Mann-
Whitney U test with upstream and downstream sites p > 0.1). A
correlation analysis revealed that cell viability and DNA damage
were significantly correlated at the Northland, OS1 downstream
and Muskeg sites; the strongest correlation was observed at the
second closest downstream site from OS1 (i.e. at the Muskeg
confluence site in the Athabasca River).
Oxidative stress in rainbow trout hepatocytes exposed to the
various types of water samples were also examined by measuring
LPO (Tables 3 and 4). OS tailings samples readily increased LPO
at the lowest exposure concentration (0.02X). OS1 was more
potent than OS2 in increasing LPO in exposed hepatocytes, with
a 2.2-fold increase in LPO for OS1 at the lowest exposure
concentration (0.02X). A correlation analysis revealed that LPO
was marginally correlated with cell viability (r ¼ 0.31; p < 0.1);
however, it was highly correlated with DNA strand breaks (r ¼0.74; p < 0.001). For surface waters, LPO levels were significantly
affected by almost all sites except the upstream site. The levels of
This journal is ª The Royal Society of Chemistry 2011
LPO were significantly higher at the downstream sites at the
confluence of the Ells and Muskeg rivers compared with the
upstream sites (upstream, Northland, OS1 downstream) (Mann-
Whitney U test; p < 0.05). A correlation analysis of the surface-
water extracts revealed that LPO was significantly correlated
with DNA damage at the upstream, Muskeg and Ells sites.
The activity of the phase-2 xenobiotic conjugating enzyme
GST was also examined (Tables 3 and 4). In OS tailings, GST
activity was significantly inhibited at 0.02% (0.1X) extract
concentrations. A correlation analysis revealed that GST activity
was marginally correlated with LPO (r ¼ 0.31; p < 0.1) and with
cell viability (r ¼ 0.31; p < 0.1) in OS2. In surface waters, GST
activity was apparently lower but not at the significance level
(p < 0.05) for most sites. At the farthest downstream site (Ells),
GST activity was significantly lower at the lowest concentration
tested (<0.04% v/v or < 0.2X). No significant upstream/down-
stream effects were observed but the downstream Ells site
exhibited significant decreases in GST activity. Nevertheless,
GST activity at the surface-water sites was systematically higher
than at OS1 and OS2. GST activity at the surface-water sites was
significantly correlated with cell membrane permeability at the
Northland, downstream OS1, Muskeg and Ells sites. GST
activity was significantly correlated with DNA damage (r ¼�0.33; p ¼ 0.05) at the downstream OS1 site. However at the
next downstream site (Muskeg), GST activity was no longer
negatively correlated with DNA damage (r ¼ 0.31; p < 0.1).
The activity of EROD was measured to detect the effects of
medium and heavy PAHs (Tables 3 and 4). In the OS samples,
EROD activity was significantly induced at OS1 only. The
activity of EROD at OS1 was negatively correlated with DNA
strand breaks (r ¼ �0.36; p ¼ 0.05) and positively so with GST
activity (r ¼ 0.42; p < 0.05). For the surface-water samples,
EROD activity was induced at the Northland and OS1 down-
stream sites, indicating the presence of heavy PAHs. Thus,
activity was significantly and positively correlated with DNA
strand breaks at all sites except the upstream site, where the
correlation was not significantly negative (r¼�0.31; p < 0.1) but
positively correlated with GST activity (r¼ 0.35; p < 0.1); EROD
and GST activities were also correlated at all river locations.
Cytotoxicity and sublethal effects of lake water, groundwater
and OS pond well water
Similar effects were also measured for lake surface water, ground-
water and interceptor well water samples (Table 4). DNA damage
was readily induced in all water samples with no clear difference
among them. The levels of LPO were also influenced by these
samples but less so than the other biomarkers. LPO was readily
induced by the groundwater samples drawn fromMildred Lake.
GST activity was not significantly affected in the surface-water
samples. However, a positive correlation between GST and
DNA strand breaks was apparent in all water samples, the
strongest being observed in the sample fromGregoire Lake; GST
activity was also significantly correlated with LPO at this site.
EROD activity was significantly induced at 0.1 and 0.5X
extract concentrations in the surface water and groundwater
samples, respectively. We found only a passing increase in
EROD activity at 0.1X for OS2 interceptor well water samples.
EROD activity was significantly and positively correlated with
J. Environ. Monit.

Dow
nloa
ded
by R
SC I
nter
nal o
n 14
Sep
tem
ber
2011
Publ
ishe
d on
14
Sept
embe
r 20
11 o
n ht
tp://
pubs
.rsc
.org
| do
i:10.
1039
/C1E
M10
591D
View Online
GST activity at the surface-water site, with DNA damage in the
groundwater samples and LPO in the OS1 interceptor water
samples.
Site discrimination and properties by multivariate analysis
In an attempt to provide an overall picture of the observed
properties of the surface-, groundwater and tailings water
extracts in an OS-rich area supporting intensive industrial
extraction activity, discriminant function and decision tree
analyses were performed on the relative PAH distribution (light,
medium and heavy) and on the five cellular toxicity endpoints.
First, a general correlation analysis revealed the following trends
(all sites combined). Cell viability was positively correlated with
DNA strand breaks (r ¼ 0.3; p < 0.001) and GST activity (r ¼0.34; p < 0.001). Cell viability was negatively correlated with
medium (r ¼ �0.33; p < 0.001) and heavy (r ¼ �0.19; p < 0.05)
PAHs. DNA strand breaks were significantly correlated with
LPO (r ¼ 0.27; p < 0.001) and GST activity (r ¼ 0.53; p < 0.001)
but not with the PAHs found in the extracts. LPO levels were
correlated with GST (r ¼ 0.23; p < 0.01), light PAHs (r ¼ �0.37;
p < 0.001), medium PAHs (r¼�0.22; p < 0.01) and heavy PAHs
(r ¼ 0.15; p ¼ 0.07 marginal). GST activity was significantly
correlated with medium PAHs (r ¼ �0.26; p < 0.01) and heavy
PAHs (r¼�0.47; p < 0.001). EROD activity was correlated with
medium PAHs (r ¼ 0.2; p < 0.05). The levels of light PAHs
followed the levels of medium PAHs (r¼ 0.65; p < 0.001) and the
levels of medium PAHs, in turn, followed the levels of heavy
PAHs (r¼ 0.28; p¼ 0.001). A discriminant function analysis was
used to examine the capacity of the above noted markers to
classify sites and determine which sites show similarities (Fig. 1).
The analysis revealed that most sites were correctly classified
with $75% efficiency. Only two sites were less well classified
using this procedure. Both the Northland and OS1 interceptor
Fig. 1 Discriminant function analysis of the cytotoxic responses and PAH
differences or similarities between the water sample sites based on the biomar
performance of each site is shown in parentheses. The dotted ellipse represen
J. Environ. Monit.
sites were correctly classified only 50% of the time. The North-
land site was sometimes mistaken for the upstream site, while the
OS1 interceptor site was misclassified evenly between Gregoire
Lake surface water and Mildred Lake groundwater. The most
important biomarkers on the X-axis were the heavy PAHs,
medium PAHs, light PAHs, EROD and GST activity. On the Y-
axis, the principal biomarkers were medium PAHs, EROD
activity, GST activity, DNA damage and light PAHs. The close
proximity between the OS1 tailings and the OS1 downstream
sites was noted and suggested some mutual influence. There is
also close proximity between the OS2 interceptor water and the
Mildred Lake groundwater samples located near OS2, suggesting
the influence of OS2 tailings water. It was noteworthy that the
interceptor waters from OS1 and OS2 were different from the
OS1 and OS2 tailing ponds water.
A decision tree analysis was also performed in an attempt to
highlight the most important water properties by establishing
a set of rules that enable site identification (Fig. 2A and 2B). The
analysis revealed that each site was properly identified by a given
set of rules that mainly involved PAH profiles and, occasionally,
the cellular toxic responses of the extract samples. The light-PAH
profile was the most important characteristic, with a perfor-
mance rate of 100%, followed by medium PAHs, with a perfor-
mance rate of about 92%. The four sublethal cytotoxic effects
measurements had performance criteria of > 52%, suggesting
that the endpoints used were less discriminatory among the water
properties. EROD activity was the most performing biomarker,
with a performance of 62%. The rules underpinning the site
characterization are summarized in Table 5. The control solvent
was characterized mainly by low levels of light, medium, and
heavy PAHs and by the lack of toxic effects. The upstream site in
the Athabasca River was close to the solvent control group but
showed increased GST and EROD activities (above 0.9-fold of
the controls) and contained low amounts of light (<42 mg L�1),
profiles. Discriminant function analysis was performed to highlight the
ker responses with the rainbow trout hepatocyte tests. The classification
ts the 90% confidence interval of the mean discriminant function value.
This journal is ª The Royal Society of Chemistry 2011

Fig. 2 Decision tree analysis of PAH profiles and in vitro toxicity data. Decision tree analysis was provided to generate rules that could discriminate the
sites from each other and determine which effects endpoints are the major contributors for site classification. Decision tree analysis A) and the
contribution of each biomarker or PAH B) is shown.
Dow
nloa
ded
by R
SC I
nter
nal o
n 14
Sep
tem
ber
2011
Publ
ishe
d on
14
Sept
embe
r 20
11 o
n ht
tp://
pubs
.rsc
.org
| do
i:10.
1039
/C1E
M10
591D
View Online
medium (<8.6 mg L�1) and heavy (< 10 mg L�1) PAHs. At the
Northland site, a slight increase in medium PAHs was observed
with no changes in light or heavy PAHs or in cytotoxic response.
At the downstream OS1 site, a decrease in GST activity was
observed, with a slight increase in medium (>15 mg L�1) and
heavy (>10 mg L�1) PAHs. At the downstream sites near the
confluence of both the Ells and Muskeg rivers, no changes in the
patterns of PAHs were observed, indicating that the relative
proportion of light, medium and heavy PAHs did not change
significantly, although a slight decrease in GST activity was
observed at the Ells site. In the OS tailings from industries 1 and
2, a characteristic drastic rise in light PAHs (>797 mg L�1) and in
medium PAHs (<73 mg L�1) was found. The surface water from
Gregoire Lake was seemingly close to the solvent control and to
the upstream site, but the light PAHs ranged from 5 to 42 mg L�1.
This journal is ª The Royal Society of Chemistry 2011
The groundwater sample from Mildred Lake near OS2 was
characterized by a PAH distribution of 13 to 76 mg L�1 for
medium PAHs and between 42 and 797 mg L�1 for light PAHs.
This site showed evidence of contamination by light and medium
PAHs that is characteristic of OS tailings. Finally, the interceptor
waters from OS1 and OS2 showed significant amounts of light
PAHs (above 379 mg L�1) that are characteristic of OS tailings
water.
Discussion
The Athabasca River is located in an OS-rich area where the
release of PAHs to the water column occurs. The industrial
extraction process, which is intended to remove heavy weight
petroleum products (crude oil), contributes to raising the levels
J. Environ. Monit.

Table 5 Decision tree rule analysis of sample sites
Sites Decision tree rules Water properties
Solvent control A water sample that shows light PAHs < 5 mg L�1,heavy PAHs < 4 mg L�1 and 4 PAHs < 17 mg L�1 isconsidered equivalent to the solvent control.
The solvent corresponds to the baseline datawhere PAH levels are very low.
Upstream A water sample that shows normal GST activity,EROD activity > 0.9, heavy PAHs < 10 mg L�1,medium PAHs < 9 mg L�1 and light PAHs < 42 mgL�1 is considered an upstream site.
The increased proportion of PAHs compared tothe solvent control is a natural occurrence. ERODand GST activities are also naturally occurring.
Northland sawmill A water sample that shows medium PAHs > 17 mgL�1 but light PAHs < 42 mg L�1 is considered theNorthland site downstream of the city of FortMcMurray.
The site near the Northland sawmill locateddownstream of the city of Fort McMurrayreleases more medium PAHs compared to theupstream site.
OS1 downstream A water sample that shows GST activity < 0.85,EROD activity > 0.9, medium PAHs > 15 mg L�1,heavy PAHs > 10 mg L�1 and light PAHs < 42 mgL�1 is considered downstream OS1.
The proximity of OS1 brings about less GSTactivity than the upstream sites.
Muskeg A water sample showing medium PAHs < 9,heavy PAHs > 10, and light PAHs < 42 mg L�1 ischaracteristic of river water samples fromMuskegRiver.
The release of heavy PAHs is a characteristic ofthe confluence of the Muskeg and Athabascarivers.
Ells A water sample that shows medium PAHs < 17 mgL�1, heavy PAHs > 3.6 mg L�1 and light PAHs <42 mg L�1 is characteristic of the Ells Riverconfluence site
The release of heavy PAHs is a characteristic ofthe confluence of Ells and Athabasca rivers.
OS1 tailings A water sample that shows 17 < medium PAHs <73 mg L�1 and light PAHs > 800 mg L�1 isconsidered a tailing pond.
The industrial extraction process brings aboutmajor releases of light PAHs (2–3 rings) in thetailing water samples.
OS2 tailings A water sample that has medium PAHs >73 mgL�1 and light PAHs > 800 mg L�1 is considereda tailing pond at OS2.
Same as OS1 but contains more medium PAHs(4 rings).
Gregoire Lake surface water A water sample that has between 5 < light PAHs< 42, medium PAHs < 17 and medium PAHs < 4mg L�1 is considered a lake water sample.
Similar to the solvent control and upstream site.
OS1 Interceptor A water sample containing significant amounts oflight PAHs at concentrations > 380 mg/L.
Diluted OS tailings but still contains significantamounts of light PAHs.
OS2 interceptor A water sample containing 42 < light PAHs < 800mg L�1 is considered the Mildred Lake interceptorof OS2.
This interceptor sample shows dilution but stillexhibits elevated light PAH levels.
Mildred Lake groundwater (OS2) A water sample showing 13 < medium PAHs < 76and 42 < light PAHs < 800 mg L�1 isa groundwater sample.
Similar to OS2 interceptor water. Thegroundwater samples show evidence ofcontamination with OS2 because the high levels oflight and medium PAHs.
Dow
nloa
ded
by R
SC I
nter
nal o
n 14
Sep
tem
ber
2011
Publ
ishe
d on
14
Sept
embe
r 20
11 o
n ht
tp://
pubs
.rsc
.org
| do
i:10.
1039
/C1E
M10
591D
View Online
and the proportions of dissolved of more polar organic
compounds in the tailing ponds. This was corroborated by the
significant increase in light PAHs in the OS tailing water extracts.
The prevalence of light PAHs in OS tailings agrees with previous
findings using synchronous fluorescence spectrometry, in
contrast to river water, which contains proportionally heavier
PAHs.12 Thus, where there is contamination by OS tailings water
in the surrounding environment; we might also expect a gradual
increase in the proportion and concentration of light PAHs
among other alkali-extractable compounds in the tailings. In this
context, the cumulative toxic effects of a water sample would be
the result of the natural release of heavy PAHs, with the possible
leaching of alkali-extractible organics including the light PAHs
fraction from tailing ponds. The search for specific biomarkers to
discriminate between natural and industrial (OS tailings) inputs
is important, especially for the purpose of relating the toxic
impacts observed in the field with industrial OS extraction
activities. Interestingly the release of the heavy fraction of PAHs
to the OS tailings ponds was not significantly different from the
upstream river water samples, suggesting that the tailings would
not significantly contribute to the ambient levels of heavy PAHs
in our hands. This generalisation needs further validation since
J. Environ. Monit.
the water was collected during one season. In a previous study,
the increased presence of heavy PAHs was reported at sites
downstream of OS extraction operations.8 These authors also
found that snow (entrapping fine dust particles) is a significant
vector for the entry of PAHs to the Athabasca River system. The
release of dust particles into the atmosphere could also be
a pathway of entry.
Clear differences were observed with the concentration and
relative proportion of light PAHs (2 to 3 aromatic rings). The
increased proportion of light PAHs was also found in the Mil-
dred Lake groundwater and Ells River samples, which could
indicate contamination from OS tailings. However, a decision
tree analysis integrating the toxic responses with the levels and
distribution of PAH data revealed inputs from the natural release
of heavier PAHs rather than from OS tailings. Indeed, the
proportion of light PAHs was below 42 mg L�1-slightly elevated,
but still characteristic of river water in this system. The
proportion of light PAHs cannot, on its own, be a definitive
criterion for tracking the contamination by OS tailings; the
actual concentration in the water is also of importance. The
analysis of the surface water from Gregoire Lake led us to the
same conclusion: although the proportion of light PAHs was
This journal is ª The Royal Society of Chemistry 2011

Dow
nloa
ded
by R
SC I
nter
nal o
n 14
Sep
tem
ber
2011
Publ
ishe
d on
14
Sept
embe
r 20
11 o
n ht
tp://
pubs
.rsc
.org
| do
i:10.
1039
/C1E
M10
591D
View Online
high, the actual levels of 2–3 aromatic ring PAHs (i.e. < 42 mg
L�1) revealed a closer similarity to the Athabasca upstream site.
The Mildred Lake groundwater is close to the OS2 interceptor
well water, suggesting a positive input of OS tailing water to the
groundwater.
It is noteworthy that DNA damage (genotoxicity) was the
effects endpoint that exhibited the strongest responses in the
various water samples. However, this endpoint was the least
discriminatory between either the types of waters or upstream/
downstream trends indicating a more generalized response in this
area. It is well known that PAHs are potent genotoxic if not
carcinogenic compounds, especially those belonging to the
medium and heavy PAH groups, such as benzo(a)pyrene.33 The
genotoxic potential of heavy PAHs has to undergo biotransfor-
mation by cytochrome P4501A (EROD) to yield DNA-reactive
metabolites. This is in keeping with the positive correlation
between DNA strand breaks and EROD activity for the
upstream and downstream river site samples, which contain
proportionally more of the heavy PAHs (Table 3). Interestingly,
no significant correlations between DNA damage and EROD
were found in OS tailings water suggesting that other compounds
than EROD inducers were at play. In a study of the polar cod
Boreogadus saida exposed for four weeks to crude oil (i.e. con-
taining more of the heavy PAHs), DNA damage was significant
at PAH exposure concentrations < 15 mg L�1 and positively
correlated with the medium-weight (pyrene) and heavy-weight
(benzo[a]pyrene) PAHs.34 The effects of light PAHs such as
naphthalene on metabolic biotransformation, oxidative stress
and DNA damage is not well understood in aquatic organisms at
the present time. In Anguilla anguilla L. eels, both b-naphtho-
flavone (a medium weight PAH) and naphthalene (a light PAH)
were strong inducers of cytochrome P4501A1 activity, with the
latter requiring a longer exposure time to induce enzymatic
activity.35,36 Interestingly, no evidence of DNA damage was
observed in the naphthalene exposure group as determined by
erythrocytic nuclear abnormalities. In a follow-up study of eels,
an early naphthalene-induced genotoxicity was observed at <8 h
post-exposure but the DNA damage returned to control values at
higher exposure times, demonstrating naphthalene-induced
DNA repair capacity in fish.36 Studies of the genotoxicity of
NAs, an important contaminant family found in OS tailings, are
virtually nonexistent in aquatic organisms. NA-rich processed
light oil was shown to produce DNA adducts as determined
by32P post-labelling of nucleotides in treated mouse skin and the
light oil was positive with a bacterial mutagenicity index of 1.3–
4.3.37 Closer examination of the radiograms in the above study
revealed some differences between mouse skin exposed to either
bitumen or the untreated heavy paraffinic distillate aromatic
extract, suggesting that NAs could have adducted to DNA in
mice. A recent study revealed that NAs decreased the SOSDNA
repair activity of Escherichia coli using a microbial genome-wide
live cell reporter array system.38 The decrease in the SOS
response was observed at environmentally realistic concentra-
tions of NAs and after only a few hours of exposure. Although
not related to OS tailings, the water-soluble fraction of gasoline
was genotoxic to the bivalve Corbicula fluminea.39 Significantly
higher levels of micronuclei in hemocytes were detected after only
short-term (6–96 h) exposure to the gasoline water-soluble
fraction.
This journal is ª The Royal Society of Chemistry 2011
It was observed that GST activity was readily inhibited in OS
tailing wastewaters. The explanation for this inhibition remains
elusive at the present time, although characteristic of OS tailings.
GST activity was positively correlated with EROD activity,
suggesting that conjugation of PAH hydroxylated metabolites
was still at play in the treated hepatocytes. However, GST
activity was strongly correlated with DNA damage in the various
water samples, indicating a bioactivation mechanism. The co-
substrate GSH of GST could be depleted by sustained oxidative
stress but this was not apparent since we did not observe
a negative trend with LPO although LPOwas significantly higher
at the downstream sites from the OS extraction industries. There
is evidence that some organometallic compounds are potent
inhibitors of GST activity. Organic complexes of elements from
the IVA family of the periodic table of elements such as germa-
nium, lead and tin were potent inhibitors of hepatic GST activity
in the rat.40 This inhibition was potent enough to block the
biliary excretion of GSH conjugate of sulfobromophthalein.
Metal protoprophyrin complexes were found in bitumen
involving nickel and iron.6 If this is the case in OS tailings, the
presence of organometallic compounds could compromise the
natural elimination processes of many xenobiotics by blocking
GST activity, a major xenobiotic-conjugating enzyme family
involved in the (biliary) excretion of foreign compounds.
In conclusion, water extracts from this OS-rich area were able
to induce cytochrome P4501A and GST, which are involved in
the biotransformation of PAHs. The increased detoxifying
activity did not prevent the manifestation of important DNA
strand breaks and LPO levels in cells. All the types of water
sampled (river, surface water, groundwater, OS tailings) were
able to induce all the observed effects, with the exception of GST
activity, which was significantly inhibited by OS tailings and
some OS interceptor water. Moreover, DNA damage was not
related to cytochrome P4501A1 activity in OS tailings water
samples. A PAH profile analysis by scanning fluorescence
revealed that OS tailings could potentially be a significant source
of light PAH inputs to this river system. A decision tree analysis
revealed that concentrations of light PAHs (>42 mg L�1) on the
order of 87% of total PAHs are a clear sign of OS tailings
contamination. This study provides some insight into the
potential toxic effects of naturally occurring PAHs and the
contribution of the OS industry to the toxic potential of water.
Acknowledgements
The authors thank the following people for sample collection:
Gerald Tetreault, Jim Bennett, Adrienne Bartlett, for field
collections of water samples. The authors acknowledge the
technical help provided by Sarah-Ann Quesnel for performing
the biomarker analyses. The English editing of the manuscript
was done by Patricia Potvin from Environment Canada. This
research was supported by the Aquatic Ecosystem Protection
Research Division of Environment Canada.
References
1 Government of Alberta. 2008. Environmental Management ofAlberta’s Oil Sands. Oil Sands Management Division, Governmentof Alberta, Alberta, Canada.
J. Environ. Monit.

Dow
nloa
ded
by R
SC I
nter
nal o
n 14
Sep
tem
ber
2011
Publ
ishe
d on
14
Sept
embe
r 20
11 o
n ht
tp://
pubs
.rsc
.org
| do
i:10.
1039
/C1E
M10
591D
View Online
2 M. Price, 11 Million Litres a Day the Tar Sands’ Leaking Legacy.Environmental Defense, 2008, Toronto, Ont., Canada.
3 CAPP -; Canadian Association of Petroleum Producers. 2009. CrudeOil Forecast, Markets and Pipeline Expansions. Canadian Associationof Petroleum Producers.
4 E. Kelly, D. W. Schindler, P. V. Hodson, J. W. Short,R. Radmanovich and C. C. Nielsen, Oil sands developmentcontributes elements toxic at low concentrations to the AthabascaRiver and its tributaries, Proc. Natl. Acad. Sci. U. S. A, 2010, 10.1073.
5 D. H. Freeman, R. M. Angeles, S. Keller, Determination ofgeoporphyrins in Athabasca tar sands using semi-automatedchromatographic deasphaltation. American Chemical Society,Division of Petroleum Chemistry, 1988, 33, 231–238.
6 A. K. Lee, A. M. Murray and J. G. Reynolds,Metallopetroporphyrins as process indicators: Separation ofpetroporphyrins in green river oil shale pyrolysis products, Fuel Sci.Technol. Internat., 1995, 13, 1081–1097.
7 R. A. Frank, R. Kavanagh, B. K. Burninson, G. Arsenault,J. V. Headley, K. M. Peru, G. J. van der Kraak andK. R. Solomon, Toxicity assessment of collected fractions from anextracted naphthenic acid mixture, Chemosphere, 2008, 72, 1309–1314.
8 E. N. Kelly, J. W. Shoort, D. W. Schindler, P. V. Hodson, M. Ma,A. K. Kwan and B. L. Fortin, Oil sands development contributespolycyclic aromatic compounds to the Athabasca River and itstributaries, Proc. Natl. Acad. Sci. U. S. A., 2009, 106, 22346–22351.
9 N. Puttaswamy, D. Turcotte and K. Liber, Variation in toxicityresponse of Ceriodaphnia dubia to Athabasca oil sands cokeleachates, Chemosphere, 2010, 80, 489–497.
10 J. S. Clemente and P. M. Fedorak, A review of the occurrence,analyses, toxicity, and biodegradation of naphthenic acids,Chemosphere, 2005, 60, 585–600.
11 S. J. Rowland, A. G. Scarlett, D. Jones, C. E. West and R. A. Frank,Diamonds in the Rough: Identification of Individual NaphthenicAcids in Oil Sands Process Water, Environ. Sci Technol., 2011, Inpress.
12 R. J. Kavanagh, B. K. Burninson, R. A. Frank, K. R. Solomon andG. van Der Kraak, Detecting oil sands process-affected waters in theAlberta oil sands region using synchronous fluorescencespectroscopy, Chemosphere, 2009, 76, 120–126.
13 M. R. van den Heuvel, M. Power, J. Richards, M. MacKinnon andD. G. Dixon, Disease and gill lesions in yellow perch (Percaflavescens) exposed to oil sands mining-associated waters,Ecotoxicol. Environ. Saf., 1999, 46, 334–341.
14 E. A. Carlson, Y. Li and J. T. Zelikoff, Exposure of Japanese medaka(Oryzias latipes) to benzo[a]pyrene suppresses immune function andhost resistance against bacterial challenge, Aquat. Toxicol., 2002,56, 289–301.
15 N. Machella, F. Regoli and R. M. Santella, Immunofluorescentdetection of 8-oxo-dG and PAH bulky adducts in fish liver andmussel digestive gland, Aquat. Toxicol., 2005, 71, 335–343.
16 A. E. Pinkney, J. C. Harshbarger, E. B. May and M. J. Melancon,Tumor prevalence and biomarkers of exposure in brown bullhead(Ameiurus nebulosus) from Back River, Furnace Creek, andTuckahoe River, Maryland, Arch. Environ. Contam. Toxicol., 2004,46, 492–501.
17 J. J. Stegeman and J. J. Lech, Cytochrome P-450 monooxygenasesystems in aquatic species: Carcinogen metabolism and biomarkersfor carcinogen and pollutant exposure, Environ. Health Perspect.,1991, 90, 101–109.
18 A. Pathiratne and C. K. Hemachandra, Modulation ofethoxyresorufin O-deethylase and glutathione S-transferaseactivities in Nile tilapia (Oreochromis niloticus) by polycyclicaromatic hydrocarbons containing two to four rings: Implicationsin biomonitoring aquatic pollution, Ecotoxicology, 2010, 19, 1012–1018.
19 C. F. Bravo, L. R. Curtis, M. S. Myers, J. P. Meador, L. L. Johnson,J. Buzitis, T. K. Collier, J. D. Morrow, C. A. Laetz, F. J. Loge andM. R. Arkoosh, Biomarker responses and disease susceptibility injuvenile rainbow trout Oncorhynchus mykiss fed a high molecularweight PAH mixture, Environ. Toxicol. Chem., 2010, 30, 704–714.
20 M. V. Colavecchia, P. V. Hodson and J. L. Parrott, The relationshipsamong CYP1A induction, toxicity and eye pathology in early lifestages of fish exposed to oil sands, J. Toxicol. Environ. Health, PartA, 2007, 70A, 1542–1555.
J. Environ. Monit.
21 A. Lister, V. Nero, A. Farwell, D. G. Dixon and G. J. van Der Krank,Reproductive and stress hormone levels in goldfish (Carassiusauratus) exposed to oil sands process-affected water, Aquat.Toxicol., 2011, 87, 170–177.
22 R. J. Kavanagh, R. A. Frank, K. D. Oakes, M. R. Servos,R. F. Young, P. M. Fedorak, M. D. MacKinnon, K. R. Solomon,D. G. Dixon and G. van Der Kraak, Fathead minnow (Pimephalespromelas) reproduction is impaired in aged oil sands process-affected waters, Aquat. Toxicol., 2011, 101, 214–220.
23 E. Aas, J. Beyer and A. Goksoyr, PAHhs in fish bile detected by fixedwavelength fluoresecence, Mar. Environ. Res., 1995, 46, 225–228.
24 I. G. Kozin, R. S. Brown, T. Truong and S. P. Tabsoh, Rapidfluorescence screening method for determination of polycyclichydrocarbons in contaminated soils. Procceedings of the SecondBiennial International Conference on Chemical Measurement andMonitoring of the Environment. Edited by Clement, R.and Burk, B.Environmental Analysis, 1998, Ottawa, Ontario, Canada.
25 J. E. Klauning, R. J. Ruch and P. J. Goldblatt, Trout hepatocyteculture: Isolation and primary culture, In Vitro, 1985, 21, 221–228.
26 F. Yanhong, H. Chenghua, L. Guofang and Z. Haibin, Optimizationof the isolation and cultivation of Cyprinus carpio primaryhepatocytes, Cytotechnology, 2008, 58, 85–92.
27 G. Flouriot, G. Monod, Y. Valotaire, A. Devaux and J.-P. Cravedi,Xenobiotic metabolizing enzyme activities in aggregate culture ofrainbow trout hepatocytes, Mar. Environ. Res., 1995, 39, 293–297.
28 M. M. Bradford, A sensitive method for the total proteindetermination using the principle of protein-dye binding, Anal.Biochem., 1976, 72, 249–251.
29 P. L. Olive, DNA precipitation assay: A rapid and simple method fordetecting DNA damage in mammalian cells, Environ. Mol. Mutagen.,1988, 11, 487–495.
30 M. J. Bester, H. C. Potgieter and W. J. H. Vermaak, Cholate and pHreduce interference by SDS in the determination of DNA withHoescht, Anal. Biochem., 1994, 223, 299–305.
31 E. D. Wills, Evaluation of lipid peroxidation in lipids and biologicalmembranes. In: Snell, K., Mullock, B. (ed.), BiochemicalToxicology: A Practical Approach. IRL Press, Washington, USA,1987, pp. 127–150.
32 M. Boryslawskyj, A. C. Garrood and J. T. Pearson, Elevation ofglutathione-S-transferase activity as a stress response toorganochlorine compounds in the freshwater mussel, Mar. Environ.Res., 1988, 24, 101–104.
33 M. E. J€onsson, B. Brunstr€om, K. Ingebrigtsen and I. Brandt, Cell-specific CYP1A expression and benzo[a]pyrene adduct formation ingills of rainbow trout (Oncorhynchus mykiss) following CYP1Ainduction in the laboratory and in the field, Environ Toxicol Chem.,2004, 23, 874–882.
34 J. Nahrgang, L. Camus, M. G. Carls, P. Gonzalez, M. J€onsson,I. C. Taban, R. K. Bechmann, J. S. Christiansen and H. Hop,Biomarker responses in polar cod (Boreogadus saida) exposed to thewater soluble fraction of crude oil, Aquat. Toxicol., 2010, 97, 234–242.
35 M. Pacheco and M. A. Santos, Naphthalene and b-naphthoflavoneeffects on Anguilla anguilla L. hepatic metabolism and erythrocyticnuclear abnormalities, Environ. Int., 2002, 28, 285–293.
36 M. Teles, M. Pacheco and M. A. Santos, Anguillaanguilla L. liverethoxyresorufin O-deethylation, glutathione S-transferase,erythrocytic nuclear abnormalities, and endocrine responses tonaphthalene and beta-naphthoflavone, Ecotoxicol. Environ. Saf.,2003, 55, 98–107.
37 E. D. Booth, H. C. A. Brandt, R. W. Loose and W. P. Watson,Correlation of 32P-postlabelling-detection of DNA adducts inmouse skin in vivo with the polycyclic aromatic compound contentand mutagenicity in Salmonella typhimurium of a range of oilproducts, Arch. Toxicol., 1998, 72, 505–513.
38 X. Zhang, S. Wiseman, H. Yu, H. Liu, J. P. Giesy and M. Hecker,Assessing the toxicity of naphthenic acids using a microbial genomewide live cell reporter array system, Environ. Sci. Technol., 2011, 45,1984–1991.
39 R.P.Fedato, J.D.Simonato,C.B.R.Martinez andS.H.Sofia,Geneticdamage in the bivalve mollusk Corbicula fluminea induced by thewater-soluble fraction of gasoline,Mutat. Res., 2011, 700, 80–85.
40 K. H. Byington and E. Hansbrough, Inhibition of the enzymaticactivity of ligandin by organogermanium, organolead or organotincompounds and the biliary excretion of sulfobromophthalein by therat, J. Pharm. Exp. Ther., 1979, 208, 248–253.
This journal is ª The Royal Society of Chemistry 2011