Preliminary Study on the electronic provision of certificates ...
Upload
independentCategory
view
3download
0
ARTICLE IN PRESS
0301-4215/$ - se
doi:10.1016/j.en
�CorrespondE-mail addr
Energy Policy 35 (2007) 1147–1163
www.elsevier.com/locate/enpol
An ex-ante evaluation of a White Certificates scheme in TheNetherlands: A case study for the household sector
Vlasis Oikonomoua,�, Martijn Rietbergenb, Martin Patelb
aSOM, University of Groningen, PO Box 800, 9700 AV Groningen, The NetherlandsbCopernicus Institute, Utrecht University, Heidelberglaan 2, PO Box 80.115, 3508 TC, Utrecht, The Netherlands
Available online 17 April 2006
Abstract
Increased efficiency of energy demand is generally recognized as a very cost-effective strategy to reduce energy requirements and the
related environmental impacts (e.g. the greenhouse effect). In order to improve energy efficiency the use of innovative market
mechanisms, such as the White Certificates (WhC), has been proposed. The basic idea underlying this policy instrument is that specific
energy saving targets are set for energy suppliers or energy distributors. These requirements must be fulfilled in a predefined time frame.
The focus of this paper is on the effect on energy efficiency improvement, on the behavior of the end consumers and the market of energy
efficiency measures. Furthermore, we study the possible effects of WhC in The Netherlands by means of a theoretical analysis and an
empirical bottom-up model. We compare concrete energy efficient technologies in terms of cost-effectiveness and energy efficiency
improvement. In combination with existing Dutch policies for energy efficiency improvement in the built environment, the contribution
of this innovative scheme could enhance the accomplishment of energy efficiency targets. In this paper, two packages of energy saving
measures of a WhC scheme are studied for Dutch households. The costs of these technologies are estimated through the use of different
discount rates, which imply overcoming of the market barriers through the use of the WhC. A scheme that includes all available
technologies as flexible options appears as a realistic solution and can generate cost effectively up to 180 PJ primary energy savings and
4550Mh cumulative net savings in the year 2020, at a discount rate of 5%, under the precondition that the policy and administrative
costs can be kept low.
r 2006 Elsevier Ltd. All rights reserved.
Keywords: Energy efficiency; White Certificates; Households
1. Introduction
In 2003, the European Commission proposed a Directiveon end-use energy efficiency and energy services (EC,2003a). The Directive sets specific energy efficiency targetsfor the EU member states. The basic objective is energyefficiency improvement in the domestic and tertiary sector,industry (except for energy-intensive industry sectors,which are included in the EU Emissions Trading Directive(EC, 2003b)), and transport (excluding aviation andinternational shipping). The proposed Directive is aimingat an annual energy efficiency improvement of 1% p.a. forthe final users for a period of 6 years.
e front matter r 2006 Elsevier Ltd. All rights reserved.
pol.2006.02.017
ing author. Tel.: +31206625340; fax: +31205254254.
ess: [email protected] (V. Oikonomou).
In the past, various national and international policieshave been implemented in EU countries in order toimprove energy efficiency (Oikonomou and Patel, 2004).A relatively new policy instrument is the White Certificates(WhC), named also as Energy Efficiency Titles. The basicidea underlying this policy instrument is that specificenergy saving targets are set for energy suppliers or energydistributors who must fulfill these requirements byimplementing energy efficiency measures among theirclients within a specific time frame. The fulfillment isacknowledged by means of (White) certificates. Energysuppliers or distributors, who overfulfill their targets, cansell their unused energy efficiency equivalents in the formof WhC to suppliers/distributors who have implementedfewer measures than according to their target. In this way,WhC ensure high flexibility and thus contribute to theimplementation of measures that are more cost-effective.

ARTICLE IN PRESSV. Oikonomou et al. / Energy Policy 35 (2007) 1147–11631148
The WhC can furthermore be traded between eligible
parties; these are not only energy suppliers and energydistributors (with obligations) but also Energy ServiceCompanies (ESCOs) (without obligations). This innovativeconcept is also supported in the Proposal for a Directive onend-use energy efficiency (2003): ‘‘the Commission con-siders this to be a possible next step in a few years time andmay then come forward with a proposal based on theexperiences in some Member States currently developingand implementing such certification schemes’’.
The concept of the WhC and its implications are ratherlimited in the existing literature so far, mainly due to thelack of experience with this instrument. Some studies onWhC schemes refer to the identification of the participants,their possible outcome in terms of energy savings andpossible market bottlenecks due to the interactions withother policy instruments (see Farinelli et al., 2005;Oikonomou, 2004; Mundaca and Santi, 2004; Quirion,2004; Guardiola et al., 2004; Pablo et al., 2004; Pagliano etal., 2003). However, with the exception of the EU SAVE‘‘White and Green’’ project, the lack of studies on the totalcosts for single sectors of the economy and implications ofthe WhC warrants further research on this field.
In this paper, a theoretical economic and techno-economic analysis is prepared, with the goal of identifyingthe effects of specific technologies implemented throughWhC in terms of effectiveness and efficiency. In Section 2,the general economics of the WhC scheme are explainedand its effects on the prices of the energy efficienttechnologies. Furthermore, it discusses the behavior ofthe end consumer as an investor purchasing the energyefficient measures. This paper does not deal with institu-tional issues, transaction costs and externalities. In Section3, we provide an overview of the experience so far withWhC schemes in France, UK and Italy. The aspectsdiscussed are the selection of suitable technologies, thedesign complexities, cost-effectiveness and goal achieve-ment. This is followed by the case study of implementingsuch a domestic scheme for households in The Nether-lands. Households have been chosen because they representone of the target groups (next to the non-energy-intensivesectors) and because they account for a significantpercentage (17%) of the final energy consumption in TheNetherlands (CBS, 2003). In Section 4 a selection oftechnologies that can generate meaningful energy savingsin the context of WhC is studied for The Netherlands.Using the Dutch ICARUS database,1 the effectiveness andefficiency of two different packages of measures is tested.For both packages, calculations of the cost efficiency ofenergy conservation technologies are performed, using fivedifferent discount rates. Finally, in the last section,
1Information system on Conservation and Application of Resources
Using a Sector approach (ICARUS) contains information on the saving
potential and costs of a large number of technologies for improving energy
efficiency in all sectors of the Dutch economy (Alsema and Nieuwlaar,
2001).
conclusions from the evaluation of a possible WhC schemeare drawn.
2. Description of WhC scheme
2.1. Mechanism of WhC
WhC is a new policy instrument to increase energyefficiency using market-based mechanisms. The basicprinciple of this policy measure is that the authoritiesimpose energy efficiency obligations on electricity and/orgas suppliers and distributors, who can then decidewhether to implement energy efficiency measures or topurchase WhC, depending on their marginal costs. WhCare generated when energy savings are realized andcertified. The purpose of the WhC as a policy instrumentis twofold (Oikonomou, 2004):
�
As an accounting tool, which proves that the requestedamount of energy savings has been realized within thetime frame agreed. The owners of WhC declare theirsavings in energy value before or after surrendering theWhC to the appropriate authorities, depending on thedesign of the scheme. � For commodity trading either bilaterally or on the WhCmarket (Pavan, 2002), in order to provide cost-effectiveoptions for existing and new participants.
The philosophy underlying this system is to combine theguaranteed results of setting obligations (it can also beconsidered as a smart way of regulation) with the economicefficiency of market-based mechanisms (Pavan, 2002;Oikonomou, 2004). This will be explained in detail inSections 2.2 and 2.3.As shown in Fig. 1 the WhC market consists of the
following participants: regulatory authority, suppliers and/or distributors of gas and electricity, ESCOs, householdsand brokers.The regulatory authority plays the principal role in
distributing the obligations among the participants andissuing the certificates. The participants that can requestand trade WhC are:
�
The suppliers and the distributors of gas and electricity,who have an obligation, set by the regulatory authority,to save a certain amount of energy within a specifiedperiod. To this end, the suppliers have to promotespecific energy efficiency projects to the end consumers.Suppliers and distributors receive WhC and can tradethem on the market. � The ESCOs, who are companies that offer to reduce aclient’s energy cost, often by taking a share of suchreduced costs as repayment for installing the energyefficiency measure and financing its upgrades. They donot receive an obligation, but can participate in thescheme after achieving energy savings and receivingWhC (Oikonomou, 2004). ESCOs participate in the
ARTICLE IN PRESS
Electricity/Gast
White Certificatesmarket
RegulatoryAuthority
Energ
y Sav
ings
Obliga
tion Energy Service
Energ
ySer
vicer
Reduced feed
Reque
st/Iss
ue
WhC
Brokers ESCO’s
Risk
Electricity and gassuppliers
Other participants
Fig. 1. White Certificate energy market.
V. Oikonomou et al. / Energy Policy 35 (2007) 1147–1163 1149
Italian and French WhC scheme, while they are notincluded in the UK.
� The ‘‘other participants’’ indicated in Fig. 1 are entitiesthat do not receive an obligation but can purchase andsell WhC, providing thus the necessary liquidity in themarket. Examples for such entities are brokers andfinancing institutions, which facilitate the transactionsand reduce the risk of the investments, while speculatingon the price of WhC and receiving a commission fromthe transaction costs. The eligibility and the role of theseentities differ among the existing WhC schemes. Theseentities are included in the UK and French WhCscheme.
Depending on the design of such a scheme the relation-ships among the participants differ (in theory, obligationscould be also be given to the end consumers, who wouldthen be a trading party). The consumers and end users,who are the recipients of the energy efficiency measures,benefit from lower energy bills and decreasing costs ofmeasures, as the supply of energy efficient technologiesincreases and prices fall (EC, 2003a). According to markettheory, the cost-effectiveness of the instrument as a wholeis at its maximum, given that no externalities appear, whenthe marginal costs are as low as possible. In theory, themarginal costs decline with a rising number of participantsand with a high number of measures, which provide greaterflexibility of the WhC, and hence lower marginal abate-ment costs for the energy suppliers and for the economy asa whole.
The energy saving targets set for a WhC scheme arespecified either in absolute terms or relative to energyconsumption at the start of the timeframe. The most usualform is to set a quota. As an alternative, energy efficiency
goals can be set in relative terms (e.g. MWh saved insteadof % saved of sold electricity or gas; see Quirion, 2004). Inany case, the target is divided among all the distributors/suppliers, resulting in concrete energy efficiency goals foreach obligated participant.
2.2. Economics of energy market
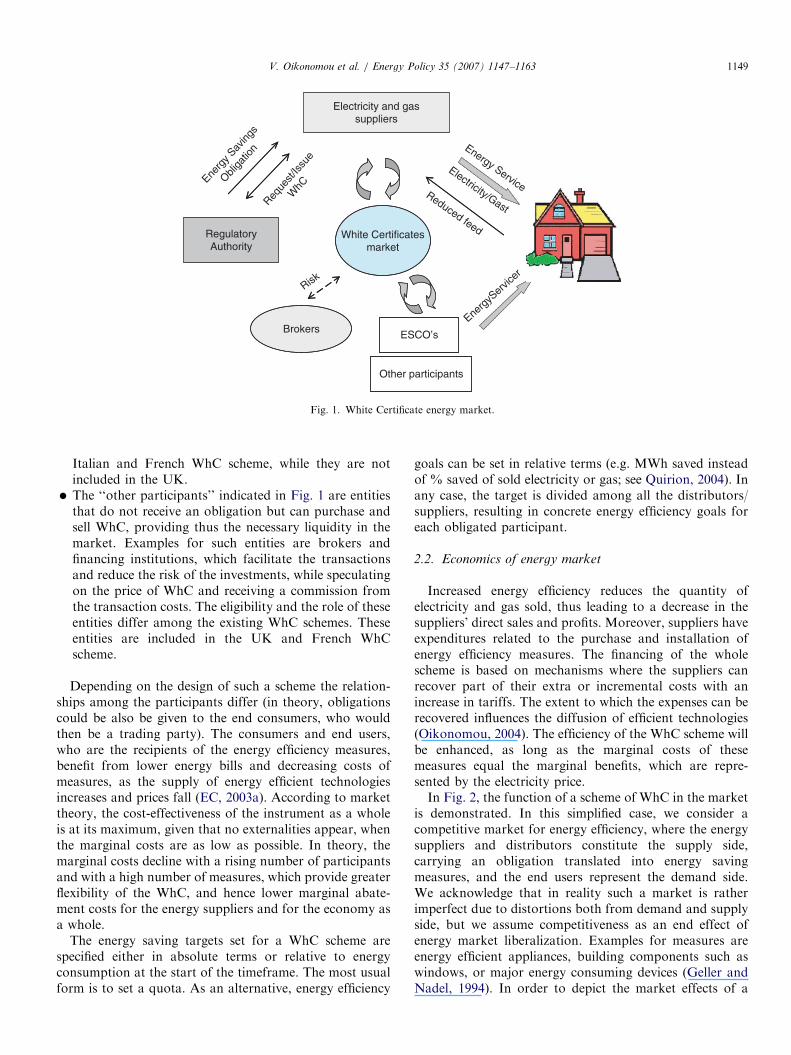
Increased energy efficiency reduces the quantity ofelectricity and gas sold, thus leading to a decrease in thesuppliers’ direct sales and profits. Moreover, suppliers haveexpenditures related to the purchase and installation ofenergy efficiency measures. The financing of the wholescheme is based on mechanisms where the suppliers canrecover part of their extra or incremental costs with anincrease in tariffs. The extent to which the expenses can berecovered influences the diffusion of efficient technologies(Oikonomou, 2004). The efficiency of the WhC scheme willbe enhanced, as long as the marginal costs of thesemeasures equal the marginal benefits, which are repre-sented by the electricity price.In Fig. 2, the function of a scheme of WhC in the market
is demonstrated. In this simplified case, we consider acompetitive market for energy efficiency, where the energysuppliers and distributors constitute the supply side,carrying an obligation translated into energy savingmeasures, and the end users represent the demand side.We acknowledge that in reality such a market is ratherimperfect due to distortions both from demand and supplyside, but we assume competitiveness as an end effect ofenergy market liberalization. Examples for measures areenergy efficient appliances, building components such aswindows, or major energy consuming devices (Geller andNadel, 1994). In order to depict the market effects of a
ARTICLE IN PRESS
Cost(C/MWh)
Energy (MWh/y)EA
PB
A
SA
SB
D
PA
B
EB
C
Pp
Fig. 2. Supply and demand of energy efficiency.
V. Oikonomou et al. / Energy Policy 35 (2007) 1147–11631150
WhC scheme, we present a base case (SA) and an energysavings case (SB). In the base case, the suppliers, withoutobligation, sell electricity to the consumers at an equili-brium market price PA. Due to the implementation ofenergy efficiency measures (as a consequence of the WhCscheme) the amount of electricity decreases from EA to EB.The supply curve (SB) depicts the obligation to carry outenergy efficiency projects so that the new supply curve inthis case can act as a constraint at a higher cost for thesupplier. According to economic theory, the electricityprice decreases with lower demand; as a consequence, theconsumers should pay the price C for the electricity theypurchase. Since, however, the consumers are supposed tocontribute to the energy efficiency projects they pay a priceranging from C to PB. In another case, if the heaviestburden of realizing these projects is left to the suppliers andthey cannot pass this cost to consumers via electricity orgas tariffs, for the part EB the consumers contribute atprice level of C. Finally, if markets are fully liberalized, thesuppliers can request a cost recovery (from the consumersor the relevant authorities) for EB (this will be analyzedfurther), which, if it is a full recovery, can reach up to PB.They also acquire WhC, which they can trade with otherparties in order to cover their obligations, at a price PB�C,or pay a penalty instead at a price Pp.
The effectiveness of the WhC increases if they arebundled, among others, with information campaigns andother means to promote opportunities of energy saving(Farinelli et al., 2005) in order to drive the consumersdemand for energy efficient measures. In a parallel marketof these measures, the introduction of the WhC wouldreduce the relative price of the energy efficiency measuresresulting in an increased demand for these goods. How-ever, the rise of the demand may be limited. The reasonsare firstly the rebound effect on the consumers behavior,which is expected to range from 5% to 50% (according to aMARKAL study for Italy on the WhC it reaches 27%,
Farinelli et al., 2005. For more information see Greeninget al., 2000; Binswanger, 2001; Oikonomou, 2004). Thesecond reason is that short-term elasticity of energy use, ascomplemented with durable equipment, is much smallerthan long-term elasticity (Velthuijsen and Worrell, 1999).
2.3. Consumer’s behavior
Several literature studies have attempted to identify theconsumer’s preferences on energy efficiency (see Lutzenhi-ser, 1992; Sweeney, 1994; Nyboer and Bataille, 2000;Poortinga et al., 2003). Two basic approaches exist, assummarized by Sanstad and Howarth (1994): The neo-classical economic approach is based on the boundedrationality and the consumers choice under an incomeconstraint and therefore assumes that in a competitivemarket the preferences should shift to energy efficientgoods that are cost-effective; however, this is not observedin reality due to the ‘‘efficiency gap’’ and this may be aresult of mismeasurement of costs and benefits (Sutherland,1991). According to other authors, the main reason is theexistence of market barriers and imperfections that do notallow the diffusion of efficient technologies. Marketbarriers are all factors that explain why consumers donot take up energy efficient technologies that are cost-effective at current prices (OECD, 2003). These obstaclesinclude:
�
lack of knowledge, know-how and technical skills, � lack of access to capital and historically or sociallyformed investment patterns,
� disparity of profitability expectations of supply anddemand (i.e. uncertainty of profit margins due to marketforces),
� legal and administrative obstacles, � other market barriers (investor-user dilemma, suppliersprefer activities in their core business instead of energyefficiency, etc.).
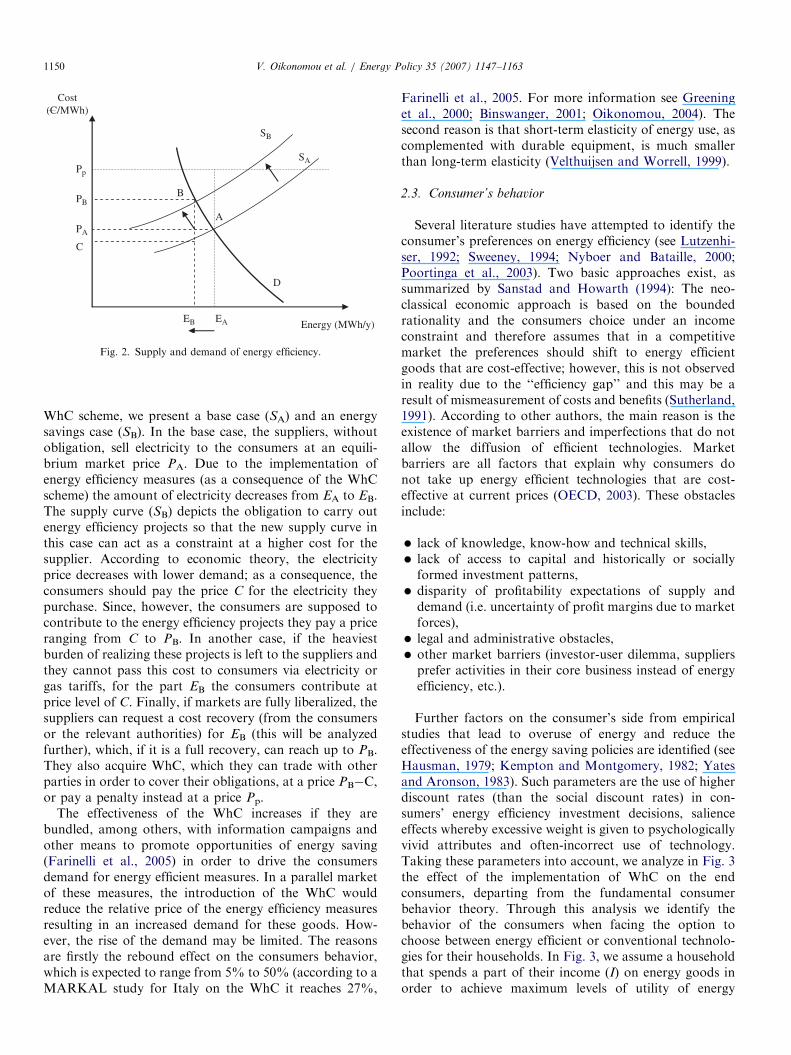
Further factors on the consumer’s side from empiricalstudies that lead to overuse of energy and reduce theeffectiveness of the energy saving policies are identified (seeHausman, 1979; Kempton and Montgomery, 1982; Yatesand Aronson, 1983). Such parameters are the use of higherdiscount rates (than the social discount rates) in con-sumers’ energy efficiency investment decisions, salienceeffects whereby excessive weight is given to psychologicallyvivid attributes and often-incorrect use of technology.Taking these parameters into account, we analyze in Fig. 3the effect of the implementation of WhC on the endconsumers, departing from the fundamental consumerbehavior theory. Through this analysis we identify thebehavior of the consumers when facing the option tochoose between energy efficient or conventional technolo-gies for their households. In Fig. 3, we assume a householdthat spends a part of their income (I) on energy goods inorder to achieve maximum levels of utility of energy
ARTICLE IN PRESS
Conventionalenergy goods (X)
Energy efficiencygoods(Z)
U1 U2
A
B
C
X1
X3
X2
Z1 Z2 Z3
I/PX
I/PZ I/P’Z
I/PX1
I/PZ1
Fig. 3. Consumer’s behavior in a WhC scheme.
V. Oikonomou et al. / Energy Policy 35 (2007) 1147–1163 1151
services (heat, light, etc.).2 This disposable income can bespent between several durable energy goods (i.e. referringto appliances and technologies) that all generate a level ofutility from energy services (U1). For our analysis weassume two general bundles of goods; the energy efficientmeasures and technologies that are being promoted by theWhC scheme (Z) and the standard conventional ones (X).Pz and Px are the respective purchasing prices. Accordingto the market conditions and the existing policies, most ofthe energy efficient goods are sold at higher prices, whichexplain the steep angle of income constraint line in thefigure (I/Px4I/Pz).
3 We furthermore assume that both X
and Z are normal goods (although Z has higher incomeelasticity and could also be considered as a luxury good, seePoortinga et al., 2003) and entail a high degree ofsubstitution4 (see also Binswanger, 2001). The directrelationship of energy conservation with higher incomehouseholds for various reasons (for instance higher incomeend users more probably own rather than rent the home) ispresented in many studies (Tonn and Berry, 1986; Hirst etal., 1981; Wirtshafter, 1985). In the initial allocation of thegoods, the end user maximizes his utility by purchasing Z1
and X1 units of the energy service goods (point A). Thisanalysis assumes the Uniformed Consumer Hypothesis(Brill et al., 1999), whereas the consumer is not fully awareof the potential high returns in investment from purchasing
2This hypothesis could also be set inversely set as given a level of utility
from energy services, how can the expenses of the end consumer can be
minimized.3The points I/Px and I/Pz on the income constraint line represent the
quantities of energy efficient and conventional goods that a consumer can
purchase, when I is the income I and Px and Pz are the prices of the two
groups of goods.4In this figure we assume a Cobb-Douglas utility function
uðx; zÞ ¼ X aZb, where a and b are positive numbers that describe the
consumer preferences on energy goods. This function is the standard
example of indifferent curves that are referred as ‘‘well behaved’’ (Varian,
2003).
Z goods. As presented in Section 2.2, one possible effect ofthe WhC scheme is the introduction of the energy efficientgoods to the consumer through the reduction of their price(as a small percentage of the upfront investment cost),better information and overcoming traditional marketbarriers. The positive effect of information on energysaving behavior is tested in several studies (Brandon andLewis, 1999; Van Houwelinegen and Van Raaij, 1989;Midden et al., 1983; Boardman, 2004). This price reductionwill incur two effects on the demand response of theconsumer. The energy efficient goods, hence, are at relativecompetitive prices with the other energy goods, which leadto the substitution effect. The consumer responds to themarket signs and can partly substitute some energy efficientgoods for other goods: the number of conventional goodsdecreases from X1 to X2, while the number of energyefficient goods increases from Z1 to Z2 (point B).Furthermore, as the disposable income (orientated forenergy services) grows, the consumer increases consump-tion for both bundles of energy goods (Z2Z3 and X2X3;point C), achieving a higher level of utility (U2).
5 Due tothe nature of these goods, one outcome is that the incomeeffect is higher than the substitution effect, meaning thusthat the price decrease of the energy efficient goods is notan adequate parameter for shifting consumption patterns,but the rise of the real income is still considered todominate the opportunity cost (consumers value a higherincome more than shifting their consumption). Throughthe WhC scheme, bundled with information campaigns, thebasic target is the market transformation with the diffusionof more energy efficient technologies for the end consumersof different income levels. As analyzed above, a determin-ing parameter in the effectiveness of the scheme is the priceof energy, since together with the price of the energy goodsthey compose the final price of the energy services. Anincrease in the price of energy results in a reduction of thedisposable income and graphically shifts the incomeconstraint line (I/Px I/Pz) to lower values without leadingto a significant substitution effect (new line I=Px1
I=Pz1 ).Finally, an important parameter that can alter at somedegree the effect of the end-user’s choice is the proprietyhousing status, i.e. if the end consumer is a tenant orowner, widely known as the landlord/tenant dilemma (seeSchleich, 2004; Levinson and Nieman, 2004).
3. Experience from White Certificate schemes
Within the EU, only UK and Italy have so farimplemented WhC schemes in the portfolio of policyinstruments to improve energy efficiency, while France andother countries are in the preparation phase.6 A basic
5This practically implies that the consumer prefers an increase of his
income, rather than a decrease of the prices of energy efficient goods, in
order to shift his preference towards more energy efficient purchases.6The IEA-DSM group is dealing with White Certificates and their
potential implementation in the EU (see http://dsm.iea.org/NewDSM/
Work/Tasks/14/WhiteCertificates.htm).
ARTICLE IN PRESSV. Oikonomou et al. / Energy Policy 35 (2007) 1147–11631152
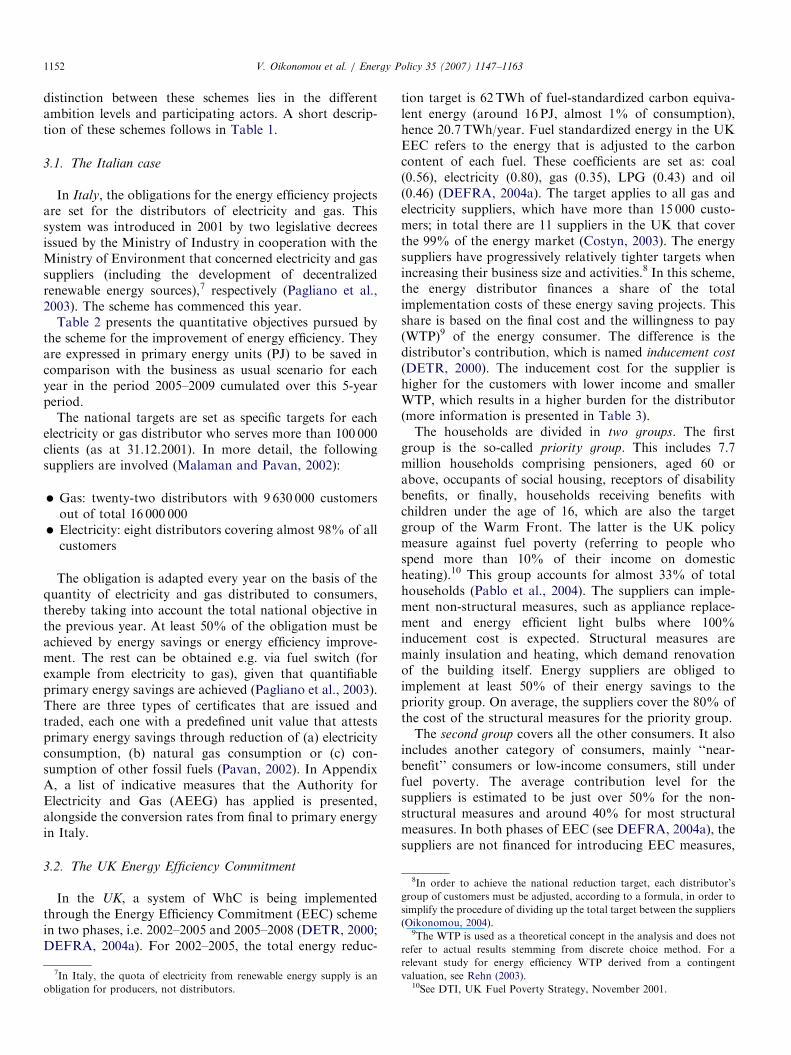
distinction between these schemes lies in the differentambition levels and participating actors. A short descrip-tion of these schemes follows in Table 1.
3.1. The Italian case
In Italy, the obligations for the energy efficiency projectsare set for the distributors of electricity and gas. Thissystem was introduced in 2001 by two legislative decreesissued by the Ministry of Industry in cooperation with theMinistry of Environment that concerned electricity and gassuppliers (including the development of decentralizedrenewable energy sources),7 respectively (Pagliano et al.,2003). The scheme has commenced this year.
Table 2 presents the quantitative objectives pursued bythe scheme for the improvement of energy efficiency. Theyare expressed in primary energy units (PJ) to be saved incomparison with the business as usual scenario for eachyear in the period 2005–2009 cumulated over this 5-yearperiod.
The national targets are set as specific targets for eachelectricity or gas distributor who serves more than 100 000clients (as at 31.12.2001). In more detail, the followingsuppliers are involved (Malaman and Pavan, 2002):
�
7
obl
Gas: twenty-two distributors with 9 630 000 customersout of total 16 000 000
�8In order to achieve the national reduction target, each distributor’s
group of customers must be adjusted, according to a formula, in order to
simplify the procedure of dividing up the total target between the suppliers
(Oikonomou, 2004).9The WTP is used as a theoretical concept in the analysis and does not
refer to actual results stemming from discrete choice method. For a
Electricity: eight distributors covering almost 98% of allcustomers
The obligation is adapted every year on the basis of thequantity of electricity and gas distributed to consumers,thereby taking into account the total national objective inthe previous year. At least 50% of the obligation must beachieved by energy savings or energy efficiency improve-ment. The rest can be obtained e.g. via fuel switch (forexample from electricity to gas), given that quantifiableprimary energy savings are achieved (Pagliano et al., 2003).There are three types of certificates that are issued andtraded, each one with a predefined unit value that attestsprimary energy savings through reduction of (a) electricityconsumption, (b) natural gas consumption or (c) con-sumption of other fossil fuels (Pavan, 2002). In AppendixA, a list of indicative measures that the Authority forElectricity and Gas (AEEG) has applied is presented,alongside the conversion rates from final to primary energyin Italy.
3.2. The UK Energy Efficiency Commitment
In the UK, a system of WhC is being implementedthrough the Energy Efficiency Commitment (EEC) schemein two phases, i.e. 2002–2005 and 2005–2008 (DETR, 2000;DEFRA, 2004a). For 2002–2005, the total energy reduc-
In Italy, the quota of electricity from renewable energy supply is an
igation for producers, not distributors.
tion target is 62TWh of fuel-standardized carbon equiva-lent energy (around 16PJ, almost 1% of consumption),hence 20.7 TWh/year. Fuel standardized energy in the UKEEC refers to the energy that is adjusted to the carboncontent of each fuel. These coefficients are set as: coal(0.56), electricity (0.80), gas (0.35), LPG (0.43) and oil(0.46) (DEFRA, 2004a). The target applies to all gas andelectricity suppliers, which have more than 15 000 custo-mers; in total there are 11 suppliers in the UK that coverthe 99% of the energy market (Costyn, 2003). The energysuppliers have progressively relatively tighter targets whenincreasing their business size and activities.8 In this scheme,the energy distributor finances a share of the totalimplementation costs of these energy saving projects. Thisshare is based on the final cost and the willingness to pay(WTP)9 of the energy consumer. The difference is thedistributor’s contribution, which is named inducement cost
(DETR, 2000). The inducement cost for the supplier ishigher for the customers with lower income and smallerWTP, which results in a higher burden for the distributor(more information is presented in Table 3).The households are divided in two groups. The first
group is the so-called priority group. This includes 7.7million households comprising pensioners, aged 60 orabove, occupants of social housing, receptors of disabilitybenefits, or finally, households receiving benefits withchildren under the age of 16, which are also the targetgroup of the Warm Front. The latter is the UK policymeasure against fuel poverty (referring to people whospend more than 10% of their income on domesticheating).10 This group accounts for almost 33% of totalhouseholds (Pablo et al., 2004). The suppliers can imple-ment non-structural measures, such as appliance replace-ment and energy efficient light bulbs where 100%inducement cost is expected. Structural measures aremainly insulation and heating, which demand renovationof the building itself. Energy suppliers are obliged toimplement at least 50% of their energy savings to thepriority group. On average, the suppliers cover the 80% ofthe cost of the structural measures for the priority group.The second group covers all the other consumers. It also
includes another category of consumers, mainly ‘‘near-benefit’’ consumers or low-income consumers, still underfuel poverty. The average contribution level for thesuppliers is estimated to be just over 50% for the non-structural measures and around 40% for most structuralmeasures. In both phases of EEC (see DEFRA, 2004a), thesuppliers are not financed for introducing EEC measures,
relevant study for energy efficiency WTP derived from a contingent
valuation, see Rehn (2003).10See DTI, UK Fuel Poverty Strategy, November 2001.

ARTICLE IN PRESS
Table 1
Characteristics of existing WhC schemes in Europe
UK EEC 2002–2005 Energy Efficiency
Commitment
ITALY WhC Titoli di Efficienza
Energetica
French WhC Certificats d’ economie d’
energie
Stakeholders Electricity suppliers and (after 8 years)
gas suppliers
Electricity and gas distributors Electricity, gas, heat and fuel suppliers
Compliance period 2002–2005, 2005–2008y Annual (2005–2009) 2006–2008
Obligation (plan) 50% from ‘‘priority group’’, 62 TWh
cumulated fuel standardized energy
savings (equivalent of a carbon target)
(2005–2008)
50% from electricity/gas savings, 243 PJ
(5.8Mtoe) primary energy saved
54.7 TWh (197 PJ) lifetime discounted
cumulated final energy savings over 3
years
Threshold X15 000 domestic customers X100 000 customers 4400GWh/year (juridical persons)
None (residential, fuel suppliers)
Reference Number of domestic customers Electricity/Gas distributed Electricity/gas/heat/fuel oil distributed
Criteria Progressively tighter for companies of
increasing capacity
Linear Update of targets every year according to
market conditions
Eligible sectors and
technologies
� Households
� Pre-approved list of measures, can
extend to new measures
� All end-use sectors
� No pre-approval yet
All end-use sectors (building, industry
and transport, but not measures on
sites covered by EU ETS)
Pre-approved measures but not fully
decided
Project evaluation Annual reports by Ofgem to Government.
Following Ofgem’s final report on EEC
2002–2005, Government will consider its
impact, including carbon abatement.
� Deemed-savings approach
� Engineering savings approach
� Direct measurement approach
For standard measures ex ante
evaluation based on data on
technologies and sales of equipment
Correction after the realization of
savings (receipt of certificates)
Additionality Suppliers must demonstrate that projects
are additional (deadweight removed from
targets)
� Dealt with baseline definition
� Other adjustments foreseen but not
yet implemented
Additionality must be demonstrated by
suppliers
� Obliged: any eligible action is
additional
� Non-obliged: turnover must not be
increased or they install very
innovative products
Certificates � Savings (for gas, electricity, oil or
solid fuel)
� Obligations (all of part of)
� White Certificates for electricity
� White Certificates for gas
� White Certificates for other fossil fuels
White Certificates
Certificates lifetime 3 years 5 years (banking with quota) 10 years (banking and adjusted according
to regional factor coefficient)
Trading parties Responsible electricity and gas suppliers All electricity and gas distributors and
ESCOs
Responsible suppliers, eligible owners (i.e.
building owners), other bodies
(manufacturers, traders)
Penalty Calculated as a 10% of the supplier’s
turnover
Proportional and greater than the
investment required to compensate the
non-compliance (estimated higher than
150–200 h/toe primary energy saved, i.e.
3.6–4.8 h/GJ)
At least the same price of the purchase of
a certificate, estimated around 2 ch/kWh
final energy, i.e. 5.6 h/GJ
Scheme financing Cost-recovery via electricity and gas
tariffs
Cost-recovery via electricity and gas
tariffs (unique or differentiated,
updatable)
Cost-recovery via electricity or gas
tariffs
Consumer’s contribution expected up
to 0.3–0.5% increase of their energy
bill
Link with other
schemes
ETS: only surplus Not yet decided Not yet decided
Source: Oikonomou (2004).
V. Oikonomou et al. / Energy Policy 35 (2007) 1147–1163 1153

ARTICLE IN PRESS
Table 2
Energy and gas savings targets in Italy in primary terms
Year Objectives (PJ/year) Objectives (MTOE/year)
Electricity
saving
Gas saving Electricity
saving
Gas saving
2005 4.2 4.2 0.1 0.1
2006 8.4 8.4 0.2 0.2
2007 16.7 16.7 0.4 0.4
2008 33.5 29.3 0.8 0.7
2009 67 54.4 1.6 1.3
Cumulative 129.8 113 3.1 2.7
Source: Legislative Decrees, July 2004, Gestore Mercato Elettrico (5/12/
2003).
12Besides Ofgem (2003), there has been no recent evaluation of the
second phase of the EEC yet.13For future energy savings, a discount rate of 3.5% is used in order to
account for the fact that savings in the future are less certain than now.
The EEC 2005–2008 target is roughly equivalent to annual net delivered
energy savings of 37 PJ (or almost 2% of consumption), taking account of
business-as-usual deadweight and theoretical-to-actual savings (such as
comfort taking). These figures depend e.g. on how suppliers actually
achieve their targets in terms of the mix of measures. (C. Rohr, October
2004, pers. comm.).14In the UK there is a list of predetermined indicative measures, for
which the overall energy saving target is set. Information about the
measures implemented is presented by the suppliers in the form of
equipment and measures sold. During the course of the scheme these
formed the main measures implemented, partly because energy savings
V. Oikonomou et al. / Energy Policy 35 (2007) 1147–11631154
since they are not anymore price controlled (no tariffstructure) and they can decide the amount they can charge.
3.2.1. Impact of the EEC
Sorrell (2003) calculated that the price increase in energyexpected after the implementation of the WhC can affectthe consumers, since in real terms, the electricity and gaselectricity suppliers in the market are still in an oligopolisticand monopolistic position and they can still applydifferentiated pricing policies. Concerning the EEC2002–2005, a price increase was estimated at h4.8 per fuelper year for all final consumers (around 3 h/t CO2),excluding the priority group (Sorrell, 2003).11 The invest-ment costs evaluated amount to 225 million h per year,equivalent to 10h investment per saved MWh of electricityand gas over the lifetime (Tabet, 2003). The benefits underthis scheme will be returned only to the direct participatingconsumers in the form of energy efficient measures, whileall consumers will contribute in the scheme through theprice increase. For the period 2005–2008, the consumers’financial benefit from the EEC measures, in the form oflower energy bills (or increased comfort), is estimated ataround 22h per year for the lifetime of the measures. Thepotential non-ongoing costs to consumers (if passed on infull by energy suppliers) are estimated to be maximum13.2h per customer per year for both electricity and gas(DEFRA, 2004a).
In the UK, the energy suppliers have completed the thirdyear of the program of the EEC and participate in thesecond phase of the scheme (2005–2008). The total energysaving objective of the EEC was 62TWh for the period2002–2005. The suppliers delivered 17.1 TWh of energysavings in the first year, 30.2 TWh in the second and39.5 TWh in 2005, which in total amount to 76.8 TWh.Roughly 60% of the savings were achieved by insulation,20% from lighting schemes and 20% from both heating
11This should be compared with reductions in real terms of 32% in
electricity bills and 22% in gas bills between 1995 and 2002.
and appliances.12 There has been no actual trading betweensuppliers in the first year of the EEC (Ofgem, 2003).The second phase of the EEC (2005–2008), foresees a
doubling of the size of the scheme in order to achieve thehigher saving targets of 130TWh (fuel standardizedlifetime discounted) or 53.6 PJ (DEFRA, 2004b).13 Suitablemeasures to reach this goal have been indicated but they donot need to be further quantified since their energy savingsare preset.14 For all other measures, suppliers mustdemonstrate additionality in order to get the energysavings accredited. Table 3 presents the measures suggestedon the basis of the target and expected annual savings,alongside with the relative burden of the households on thecost of each measure.In Table 3, new measures, or higher ambition level
between the two phases of the EEC, reveal the enhancedefficiency of the scheme. Furthermore, the cost sharingfulfills the criterion of equity, since for the most expensivemeasures (i.e. fuel switching) the burden of the prioritygroup is rather limited, while for cheaper options compactfluorescent lamps (CFLs) the burden is equally shared. Thetotal cumulative investment costs for the implementationof all the measures can rise up to 5565Mh, where 566Mh
could be the extra burden for the priority group, while theother groups can contribute up to 1563Mh.
3.3. The French White Certificates
In France, the WhC are under current discussion on agovernmental level and a preliminary planning has alreadybeen suggested in the White Paper of the French Ministryof Industry (Fontaine, 2003). According to the proposedscheme, the obligations will be set to the suppliers ofelectricity and gas, who must either promote energy savingsor purchase certificates. Energy savings can be realized inall sectors (including transport). The overall target in finalenergy terms is 194 PJ (54TWh) reduction over a period of3 years, with 122 PJ (34TWh) from electricity, 38 PJ(10.5 TWh) from gas, 5.4 PJ (1.5 TWh) from heating andthe rest from other domestic fuels. These targets will beadjusted annually, depending on the market conditions of
had been established for them. Nevertheless, other measures can be also
implemented, as long as their energy savings are independently verified
and approved by the regulatory body (Ofgem).

ARTICLE IN PRESS
Table
3
EEC
2002–2005and2005–2008measuresin
theUK
Projects
Total
installations
from
EEC
(M)
Lifetim
ein
years
Primary
EnergySavings
per
year(G
J/unit/year)
basisoftarget
TotalEEC
target-fuel
standardized
andlifetime
discounted(PJ)-basisof
target
Annualnet
primary
energy
savings(PJ/
year)
Totalcost
per
measure
(h)
Consumer
contributionto
measure
Priority
group
Other
groups
2002–2005
2005–2008
2002–2005
2005–2008
2005–2008
2005–2008
%%
Cavitywallinsulationprivate
1.00
40
18.86
18.54
66.24
155.52
23.33
462
028.2
Cavitywallinsulationsocial
0.70
40
18.00
105.84
455
33.4
35.8
Loftinsulationprivate
0.70
30
6.62
9.76
10.44
49.68
7.14
380
028.4
Loftinsulationsocial
1.42
30
6.73
20.52
383
32.9
35.3
LoftinsulationDIY
0.46
30
12.02
39.96
2.43
194
25.8
27.4
GlazingEto
Crated
4.50
20
-0.11
2.52
0.38
15
13.6
27.3
Boiler
end-of-life
replacementwith
condensingboiler,A/B
ratedboilers
0.20
15
9.22
11.16
16.56
9.36
2.60
283
11.7
29.3
Bto
Aratedboilers
1.00
15
4.14
16.92
4.36
73
00
Fuel
switching
0.06
15
28.48
18.36
2.34
2637
6.7
44.4
Heatingcontrols—upgradewithboiler
replacement
0.50
15
2.45
4.32
1.26
120
10
29.1
Heatingcontrols-extra
0.09
15
6.77
2.88
0.80
196
10.2
29.5
Fridgesaver-Typeschem
es0.10
10to
12
0.4
0.5
0.72
0.72
0.29
176
17
0
Appliance
replacement—
higher
efficiency
models
0.60
10
0.4
1.44
Applicanecold
0.88
12
0.22
2.52
1.08
29
00
Appliance
wet
1.17
12
0.07
0.72
0.29
15
00
Appliance
settopbox
0.50
80.04
0.36
0.01
20
0
Compact
fluorescentlamps
CFL’s(extrabulbs)
17.60
14
0.11
0.04
12.60
7.20
0.94
547.7
47.7
CFL’s(new
bulbs)
12.60
80.25
0.04
24.48
5.15
60
34.1
CFL’sretail
9.75
16
CFL’sdirect
32.64
16
Hotwatertankinsulation
Tankinsulation-new
0.17
20
8.32
1.62
15.48
2.52
0.36
19
10.5
26.2
Tankinsulation-topup
0.46
10
1.62
Draughtproofing
0.31
20
2.66
5.04
4.68
0.72
139
10
28.7
Total
130
469
53
So
urc
es:DETR
(2000,pp.25–27),DEFRA
(2004b),CarstenR.(pers.comm.)
No
tes:ThedatabasesusedfortheUK
originate
from
thedocumentationaccompanyingtheEnergyEfficiency
Commitment(D
EFRA,2004b)andthecostsare
convertedto
hunder
therate
£/h¼
1.47.
Oneim
portantassumptionisthatthe2005–2008EEC
isdiscountedat3.5%,asdecided
byHM
Treasury
inJanuary
2003in
order
toreflectprevailingcircumstancesrather
than6%
asin
2002–2005.
Thisdifferentiationfavors
themeasureswithlonger
life
cycle(i.e.cavitywallinsulation)(D
EFRA,2004a).
V. Oikonomou et al. / Energy Policy 35 (2007) 1147–1163 1155
ARTICLE IN PRESS
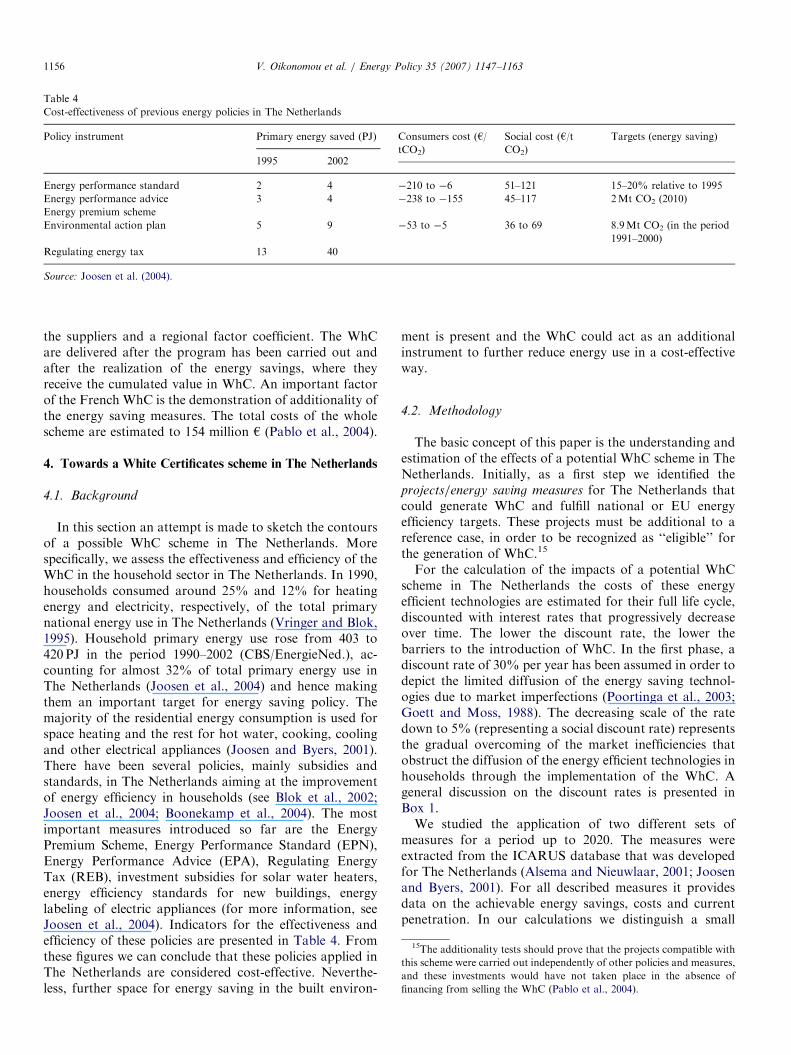
Table 4
Cost-effectiveness of previous energy policies in The Netherlands
Policy instrument Primary energy saved (PJ) Consumers cost (h/
tCO2)
Social cost (h/t
CO2)
Targets (energy saving)
1995 2002
Energy performance standard 2 4 �210 to �6 51–121 15–20% relative to 1995
Energy performance advice 3 4 �238 to �155 45–117 2Mt CO2 (2010)
Energy premium scheme
Environmental action plan 5 9 �53 to �5 36 to 69 8.9Mt CO2 (in the period
1991–2000)
Regulating energy tax 13 40
Source: Joosen et al. (2004).
15The additionality tests should prove that the projects compatible with
this scheme were carried out independently of other policies and measures,
and these investments would have not taken place in the absence of
financing from selling the WhC (Pablo et al., 2004).
V. Oikonomou et al. / Energy Policy 35 (2007) 1147–11631156
the suppliers and a regional factor coefficient. The WhCare delivered after the program has been carried out andafter the realization of the energy savings, where theyreceive the cumulated value in WhC. An important factorof the French WhC is the demonstration of additionality ofthe energy saving measures. The total costs of the wholescheme are estimated to 154 million h (Pablo et al., 2004).
4. Towards a White Certificates scheme in The Netherlands
4.1. Background
In this section an attempt is made to sketch the contoursof a possible WhC scheme in The Netherlands. Morespecifically, we assess the effectiveness and efficiency of theWhC in the household sector in The Netherlands. In 1990,households consumed around 25% and 12% for heatingenergy and electricity, respectively, of the total primarynational energy use in The Netherlands (Vringer and Blok,1995). Household primary energy use rose from 403 to420 PJ in the period 1990–2002 (CBS/EnergieNed.), ac-counting for almost 32% of total primary energy use inThe Netherlands (Joosen et al., 2004) and hence makingthem an important target for energy saving policy. Themajority of the residential energy consumption is used forspace heating and the rest for hot water, cooking, coolingand other electrical appliances (Joosen and Byers, 2001).There have been several policies, mainly subsidies andstandards, in The Netherlands aiming at the improvementof energy efficiency in households (see Blok et al., 2002;Joosen et al., 2004; Boonekamp et al., 2004). The mostimportant measures introduced so far are the EnergyPremium Scheme, Energy Performance Standard (EPN),Energy Performance Advice (EPA), Regulating EnergyTax (REB), investment subsidies for solar water heaters,energy efficiency standards for new buildings, energylabeling of electric appliances (for more information, seeJoosen et al., 2004). Indicators for the effectiveness andefficiency of these policies are presented in Table 4. Fromthese figures we can conclude that these policies applied inThe Netherlands are considered cost-effective. Neverthe-less, further space for energy saving in the built environ-
ment is present and the WhC could act as an additionalinstrument to further reduce energy use in a cost-effectiveway.
4.2. Methodology
The basic concept of this paper is the understanding andestimation of the effects of a potential WhC scheme in TheNetherlands. Initially, as a first step we identified theprojects/energy saving measures for The Netherlands thatcould generate WhC and fulfill national or EU energyefficiency targets. These projects must be additional to areference case, in order to be recognized as ‘‘eligible’’ forthe generation of WhC.15
For the calculation of the impacts of a potential WhCscheme in The Netherlands the costs of these energyefficient technologies are estimated for their full life cycle,discounted with interest rates that progressively decreaseover time. The lower the discount rate, the lower thebarriers to the introduction of WhC. In the first phase, adiscount rate of 30% per year has been assumed in order todepict the limited diffusion of the energy saving technol-ogies due to market imperfections (Poortinga et al., 2003;Goett and Moss, 1988). The decreasing scale of the ratedown to 5% (representing a social discount rate) representsthe gradual overcoming of the market inefficiencies thatobstruct the diffusion of the energy efficient technologies inhouseholds through the implementation of the WhC. Ageneral discussion on the discount rates is presented inBox 1.We studied the application of two different sets of
measures for a period up to 2020. The measures wereextracted from the ICARUS database that was developedfor The Netherlands (Alsema and Nieuwlaar, 2001; Joosenand Byers, 2001). For all described measures it providesdata on the achievable energy savings, costs and currentpenetration. In our calculations we distinguish a small

ARTICLE IN PRESS
Box 1General discussion on the discount rates.
The choice of proper and representative discount rate for consumers has been extensively analyzed inexisting papers (Lutzenhiser, 1992; Train, 1985). Nyboer and Bataille (2000) have conducted a literatureoverview of the consumers’ purchase behavior concerning energy appliances. They dealt with the issue asto whether high discount rates for the consumers represent only market failures, or whether they representthe real costs of making an energy efficiency investment. Sanstad and Howarth (1994) present a similarsurvey, analyzing the theories around consumer rationality in energy efficiency choices. Other studies, likeRuderman et al. (1987) have even revealed that the consumers can use excessive rates (as high as 88% peryear) when making energy related decisions. Hausman (1979) has found a discount rate from 89%progressively reducing to 5.1% following an inverse order of household income levels. The 30% ratechosen in our analysis is much higher than the social discount rate of 5% as observed in the EU (Farinelliet al., 2004). We argue that through the use of the WhC scheme, implemented parallel with well structuredinformation-marketing campaigns and also with flexible financial mechanisms that permit easy access tocredit, the discount rate will tend to decrease and reach the level of the social rate. This methodology wasapplied also in the calculations performed by the MARKAL model in the EU SAVE ‘‘White and Green’’project (Farinelli et al., 2004) in order to depict the effects of the WhC in Italy and Western Europe.
Table 5
WhC measures for the case of The Netherlands (small package)
Cavity construction Dwelling status
Before 1995 After 1995
Wall insulation
Cavity construction | |Internal/external | |Upgrade to Rc 3, 3,5 and 5 | |
Roof insulation
Heated/unheated attic | |Upgrade to Rc 2,5 | |Upgrade to Rc 3, 4 and 5 | |
Floor insulation
Upgrade to Rc 2,5 | |Upgrade to Rc 3, 3, 5 and 5 | |
Window insulation
Single to double glazing | |Washing machine (technical pot. 2010/
2020)
| |
Dryer (technical pot. 2010/2020) | |Dishwasher (technical pot. 2010/2020) | |Refrigerator (technical pot. 2010/2020) | |Deep Freeze (technical pot. 2010/2020) | |Combi (technical pot. 2010/2020) | |Washing machine based on space heating
system
| |
Hot fill washing machine (based on hot
water system)
| |
Dryer based on space heating system | |Hot fill dishwasher (based on hot water
system)
| |
Heatpump dryer | |Gas heated dryer | |Compact fluorescent lamps | |Reduce standby: brown appliances | |
V. Oikonomou et al. / Energy Policy 35 (2007) 1147–1163 1157
package of measures and an extended package. The small
package (see Table 5) only includes the standard technol-ogies applied in the UK’s EEC (2005–2008). These arearound 30 measures, which could represent a simplifieddesign of a WhC scheme for The Netherlands, especially interms of monitoring and verification costs. In addition tothe UK’s EEC measures we have included behavioralmeasures, i.e. measures that aim at reducing the standbypower consumption of domestic appliances, since low-income households can more easily implement (Poortingaet al., 2003). The extended packages comprises 140measures, including the measures from the small package,which were also taken from the ICARUS database(Alsema and Nieuwlaar, 2001; Joosen and Byers, 2001).The scheme in this case is therefore more complex andtechnologies that are expensive are also taken intoaccount.16 Cost calculations in ICARUS-4 are based onthe environmental cost method (VROM, 1998). They areperformed based on the end-user approach, using end-userenergy prices (taxes and VAT included) (Alsema andNieuwlaar, 2001).
4.3. ICARUS adaptations
All the technologies are tested separately for olderhouses (before 1996) and for newer residences (after1996). The number of the dwellings in The Netherlands isassumed to increase from 6.2 million in 1995 by an average6% every 10 years, up to 7.8 million in 2020. In 2002,indicatively, out of 6.6 million dwellings, around 46% aretenants and almost 20% belong to households with
Improve current brown appliances | |Condensing boilers | |Replace electric by gas boilers | |
Source: Alsema and Nieuwlaar (2001)—ICARUS-4 database.
Note: Rc is defined as Resilient Channel.
16However, the efficiency of the measures, translated in energy savings,
is rather different between the countries and households, due to a number
of factors. For instance, an energy efficient heating system can be more
effective in a poorly insulated house than a well-insulated house
(Poortinga et al., 2003).
ARTICLE IN PRESS
0
5
10
15
20
Discountrate (%)
0102030
Cum
ulat
ive
Cos
t effe
ctiv
een
ergy
sav
ings
(P
J)
0
50
100
150
200
250
Cum
ulat
ive
cost
effe
ctiv
eC
O2
redu
ctio
n (M
t)
22
7
28 3640
526811
1315
19
13
25 15 5
Energy savings for additional measuresEnergy savings for small package of measuresCO2 reduction for additional measuresCO2 reduction for small package
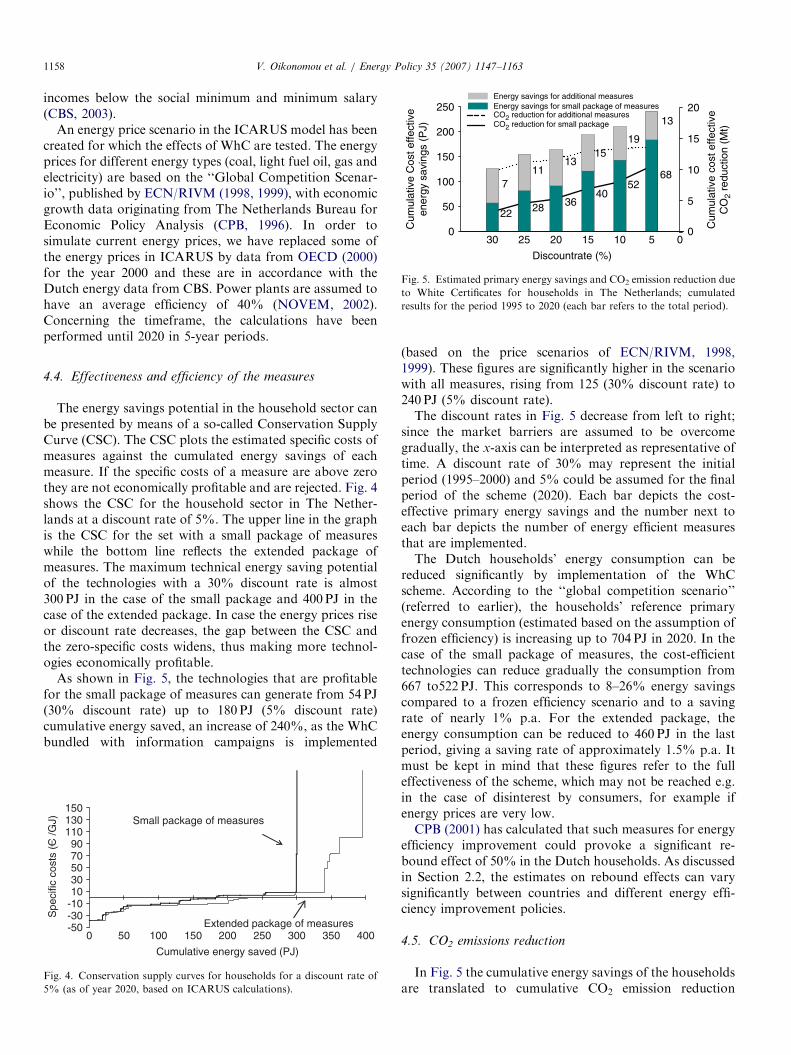
Fig. 5. Estimated primary energy savings and CO2 emission reduction due
to White Certificates for households in The Netherlands; cumulated
results for the period 1995 to 2020 (each bar refers to the total period).
V. Oikonomou et al. / Energy Policy 35 (2007) 1147–11631158
incomes below the social minimum and minimum salary(CBS, 2003).
An energy price scenario in the ICARUS model has beencreated for which the effects of WhC are tested. The energyprices for different energy types (coal, light fuel oil, gas andelectricity) are based on the ‘‘Global Competition Scenar-io’’, published by ECN/RIVM (1998, 1999), with economicgrowth data originating from The Netherlands Bureau forEconomic Policy Analysis (CPB, 1996). In order tosimulate current energy prices, we have replaced some ofthe energy prices in ICARUS by data from OECD (2000)for the year 2000 and these are in accordance with theDutch energy data from CBS. Power plants are assumed tohave an average efficiency of 40% (NOVEM, 2002).Concerning the timeframe, the calculations have beenperformed until 2020 in 5-year periods.
4.4. Effectiveness and efficiency of the measures
The energy savings potential in the household sector canbe presented by means of a so-called Conservation SupplyCurve (CSC). The CSC plots the estimated specific costs ofmeasures against the cumulated energy savings of eachmeasure. If the specific costs of a measure are above zerothey are not economically profitable and are rejected. Fig. 4shows the CSC for the household sector in The Nether-lands at a discount rate of 5%. The upper line in the graphis the CSC for the set with a small package of measureswhile the bottom line reflects the extended package ofmeasures. The maximum technical energy saving potentialof the technologies with a 30% discount rate is almost300 PJ in the case of the small package and 400 PJ in thecase of the extended package. In case the energy prices riseor discount rate decreases, the gap between the CSC andthe zero-specific costs widens, thus making more technol-ogies economically profitable.
As shown in Fig. 5, the technologies that are profitablefor the small package of measures can generate from 54PJ(30% discount rate) up to 180 PJ (5% discount rate)cumulative energy saved, an increase of 240%, as the WhCbundled with information campaigns is implemented
-50-30-101030507090
110130150
0 50 100 150 200 250 300 350 400
Cumulative energy saved (PJ)
Spe
cific
cos
ts (
C /G
J) Small package of measures
Extended package of measures
Fig. 4. Conservation supply curves for households for a discount rate of
5% (as of year 2020, based on ICARUS calculations).
(based on the price scenarios of ECN/RIVM, 1998,1999). These figures are significantly higher in the scenariowith all measures, rising from 125 (30% discount rate) to240 PJ (5% discount rate).The discount rates in Fig. 5 decrease from left to right;
since the market barriers are assumed to be overcomegradually, the x-axis can be interpreted as representative oftime. A discount rate of 30% may represent the initialperiod (1995–2000) and 5% could be assumed for the finalperiod of the scheme (2020). Each bar depicts the cost-effective primary energy savings and the number next toeach bar depicts the number of energy efficient measuresthat are implemented.The Dutch households’ energy consumption can be
reduced significantly by implementation of the WhCscheme. According to the ‘‘global competition scenario’’(referred to earlier), the households’ reference primaryenergy consumption (estimated based on the assumption offrozen efficiency) is increasing up to 704 PJ in 2020. In thecase of the small package of measures, the cost-efficienttechnologies can reduce gradually the consumption from667 to522 PJ. This corresponds to 8–26% energy savingscompared to a frozen efficiency scenario and to a savingrate of nearly 1% p.a. For the extended package, theenergy consumption can be reduced to 460 PJ in the lastperiod, giving a saving rate of approximately 1.5% p.a. Itmust be kept in mind that these figures refer to the fulleffectiveness of the scheme, which may not be reached e.g.in the case of disinterest by consumers, for example ifenergy prices are very low.CPB (2001) has calculated that such measures for energy
efficiency improvement could provoke a significant re-bound effect of 50% in the Dutch households. As discussedin Section 2.2, the estimates on rebound effects can varysignificantly between countries and different energy effi-ciency improvement policies.
4.5. CO2 emissions reduction
In Fig. 5 the cumulative energy savings of the householdsare translated to cumulative CO2 emission reduction
ARTICLE IN PRESS
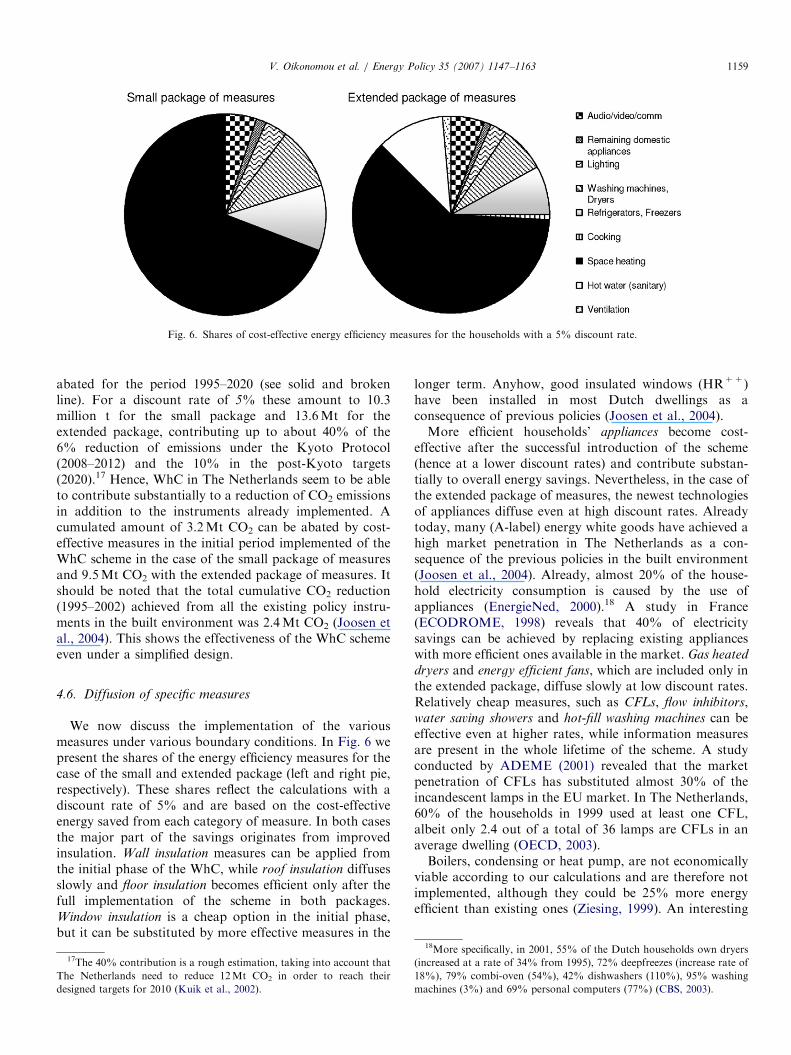
Fig. 6. Shares of cost-effective energy efficiency measures for the households with a 5% discount rate.
V. Oikonomou et al. / Energy Policy 35 (2007) 1147–1163 1159
abated for the period 1995–2020 (see solid and brokenline). For a discount rate of 5% these amount to 10.3million t for the small package and 13.6Mt for theextended package, contributing up to about 40% of the6% reduction of emissions under the Kyoto Protocol(2008–2012) and the 10% in the post-Kyoto targets(2020).17 Hence, WhC in The Netherlands seem to be ableto contribute substantially to a reduction of CO2 emissionsin addition to the instruments already implemented. Acumulated amount of 3.2Mt CO2 can be abated by cost-effective measures in the initial period implemented of theWhC scheme in the case of the small package of measuresand 9.5Mt CO2 with the extended package of measures. Itshould be noted that the total cumulative CO2 reduction(1995–2002) achieved from all the existing policy instru-ments in the built environment was 2.4Mt CO2 (Joosen etal., 2004). This shows the effectiveness of the WhC schemeeven under a simplified design.
4.6. Diffusion of specific measures
We now discuss the implementation of the variousmeasures under various boundary conditions. In Fig. 6 wepresent the shares of the energy efficiency measures for thecase of the small and extended package (left and right pie,respectively). These shares reflect the calculations with adiscount rate of 5% and are based on the cost-effectiveenergy saved from each category of measure. In both casesthe major part of the savings originates from improvedinsulation. Wall insulation measures can be applied fromthe initial phase of the WhC, while roof insulation diffusesslowly and floor insulation becomes efficient only after thefull implementation of the scheme in both packages.Window insulation is a cheap option in the initial phase,but it can be substituted by more effective measures in the
17The 40% contribution is a rough estimation, taking into account that
The Netherlands need to reduce 12Mt CO2 in order to reach their
designed targets for 2010 (Kuik et al., 2002).
longer term. Anyhow, good insulated windows (HR++)have been installed in most Dutch dwellings as aconsequence of previous policies (Joosen et al., 2004).More efficient households’ appliances become cost-
effective after the successful introduction of the scheme(hence at a lower discount rates) and contribute substan-tially to overall energy savings. Nevertheless, in the case ofthe extended package of measures, the newest technologiesof appliances diffuse even at high discount rates. Alreadytoday, many (A-label) energy white goods have achieved ahigh market penetration in The Netherlands as a con-sequence of the previous policies in the built environment(Joosen et al., 2004). Already, almost 20% of the house-hold electricity consumption is caused by the use ofappliances (EnergieNed, 2000).18 A study in France(ECODROME, 1998) reveals that 40% of electricitysavings can be achieved by replacing existing applianceswith more efficient ones available in the market. Gas heated
dryers and energy efficient fans, which are included only inthe extended package, diffuse slowly at low discount rates.Relatively cheap measures, such as CFLs, flow inhibitors,water saving showers and hot-fill washing machines can beeffective even at higher rates, while information measuresare present in the whole lifetime of the scheme. A studyconducted by ADEME (2001) revealed that the marketpenetration of CFLs has substituted almost 30% of theincandescent lamps in the EU market. In The Netherlands,60% of the households in 1999 used at least one CFL,albeit only 2.4 out of a total of 36 lamps are CFLs in anaverage dwelling (OECD, 2003).Boilers, condensing or heat pump, are not economically
viable according to our calculations and are therefore notimplemented, although they could be 25% more energyefficient than existing ones (Ziesing, 1999). An interesting
18More specifically, in 2001, 55% of the Dutch households own dryers
(increased at a rate of 34% from 1995), 72% deepfreezes (increase rate of
18%), 79% combi-oven (54%), 42% dishwashers (110%), 95% washing
machines (3%) and 69% personal computers (77%) (CBS, 2003).
ARTICLE IN PRESS
20%
15%
10%
5%
ou
nt
rate
Smallpackage of measuresAdditional measures
V. Oikonomou et al. / Energy Policy 35 (2007) 1147–11631160
point from our calculations is that the efficient measuresare applied mostly in the older dwellings (o1995), at a rateof 63 (first policy period) to 58% (last period) of thebuilding stock during the policy timeframe. Furthermore,only the newest technologies on appliances (technicalpotential 2020) appear to be installed.
0 1000 2000 3000 4000 5000
30%
25%Dis
c
Cumulative Net Cost savings MC
Fig. 7. Cost savings of a WhC scheme.
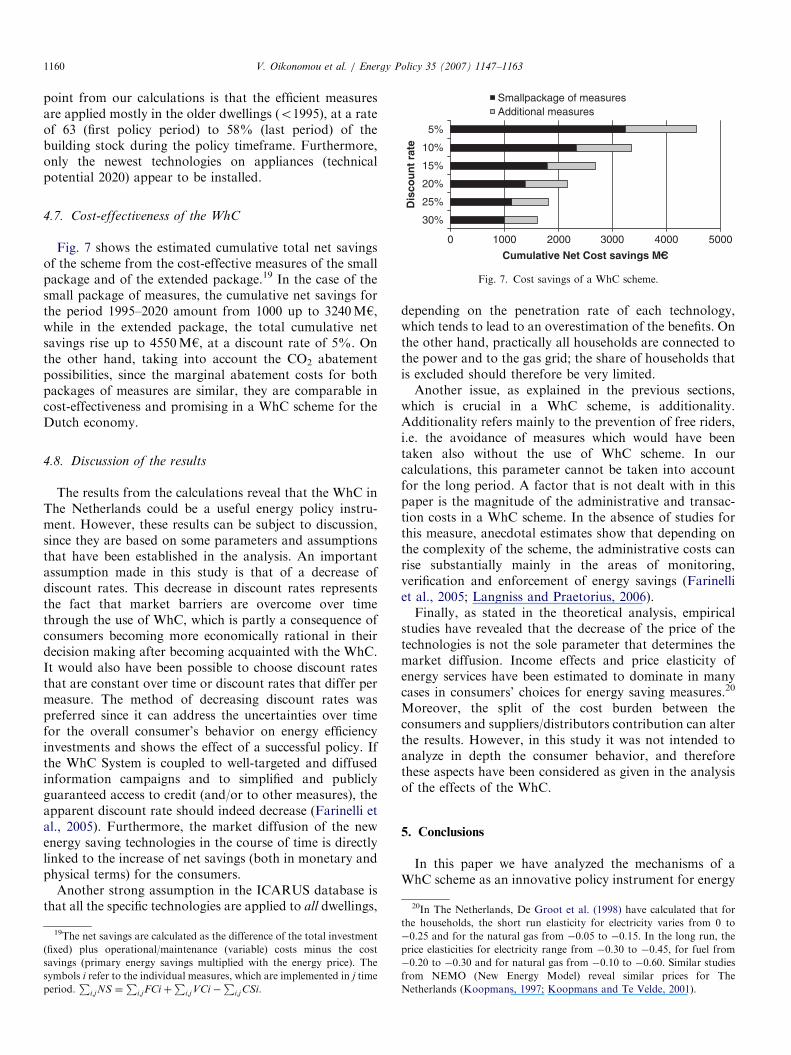
4.7. Cost-effectiveness of the WhC
Fig. 7 shows the estimated cumulative total net savingsof the scheme from the cost-effective measures of the smallpackage and of the extended package.19 In the case of thesmall package of measures, the cumulative net savings forthe period 1995–2020 amount from 1000 up to 3240Mh,while in the extended package, the total cumulative netsavings rise up to 4550Mh, at a discount rate of 5%. Onthe other hand, taking into account the CO2 abatementpossibilities, since the marginal abatement costs for bothpackages of measures are similar, they are comparable incost-effectiveness and promising in a WhC scheme for theDutch economy.
20In The Netherlands, De Groot et al. (1998) have calculated that for
4.8. Discussion of the results
The results from the calculations reveal that the WhC inThe Netherlands could be a useful energy policy instru-ment. However, these results can be subject to discussion,since they are based on some parameters and assumptionsthat have been established in the analysis. An importantassumption made in this study is that of a decrease ofdiscount rates. This decrease in discount rates representsthe fact that market barriers are overcome over timethrough the use of WhC, which is partly a consequence ofconsumers becoming more economically rational in theirdecision making after becoming acquainted with the WhC.It would also have been possible to choose discount ratesthat are constant over time or discount rates that differ permeasure. The method of decreasing discount rates waspreferred since it can address the uncertainties over timefor the overall consumer’s behavior on energy efficiencyinvestments and shows the effect of a successful policy. Ifthe WhC System is coupled to well-targeted and diffusedinformation campaigns and to simplified and publiclyguaranteed access to credit (and/or to other measures), theapparent discount rate should indeed decrease (Farinelli etal., 2005). Furthermore, the market diffusion of the newenergy saving technologies in the course of time is directlylinked to the increase of net savings (both in monetary andphysical terms) for the consumers.
Another strong assumption in the ICARUS database isthat all the specific technologies are applied to all dwellings,
19The net savings are calculated as the difference of the total investment
(fixed) plus operational/maintenance (variable) costs minus the cost
savings (primary energy savings multiplied with the energy price). The
symbols i refer to the individual measures, which are implemented in j time
period.P
i;jNS ¼P
i;jFCi þP
i;jVCi �P
i;jCSi.
depending on the penetration rate of each technology,which tends to lead to an overestimation of the benefits. Onthe other hand, practically all households are connected tothe power and to the gas grid; the share of households thatis excluded should therefore be very limited.Another issue, as explained in the previous sections,
which is crucial in a WhC scheme, is additionality.Additionality refers mainly to the prevention of free riders,i.e. the avoidance of measures which would have beentaken also without the use of WhC scheme. In ourcalculations, this parameter cannot be taken into accountfor the long period. A factor that is not dealt with in thispaper is the magnitude of the administrative and transac-tion costs in a WhC scheme. In the absence of studies forthis measure, anecdotal estimates show that depending onthe complexity of the scheme, the administrative costs canrise substantially mainly in the areas of monitoring,verification and enforcement of energy savings (Farinelliet al., 2005; Langniss and Praetorius, 2006).Finally, as stated in the theoretical analysis, empirical
studies have revealed that the decrease of the price of thetechnologies is not the sole parameter that determines themarket diffusion. Income effects and price elasticity ofenergy services have been estimated to dominate in manycases in consumers’ choices for energy saving measures.20
Moreover, the split of the cost burden between theconsumers and suppliers/distributors contribution can alterthe results. However, in this study it was not intended toanalyze in depth the consumer behavior, and thereforethese aspects have been considered as given in the analysisof the effects of the WhC.
5. Conclusions
In this paper we have analyzed the mechanisms of aWhC scheme as an innovative policy instrument for energy
the households, the short run elasticity for electricity varies from 0 to
�0.25 and for the natural gas from �0.05 to �0.15. In the long run, the
price elasticities for electricity range from �0.30 to �0.45, for fuel from
�0.20 to �0.30 and for natural gas from �0.10 to �0.60. Similar studies
from NEMO (New Energy Model) reveal similar prices for The
Netherlands (Koopmans, 1997; Koopmans and Te Velde, 2001).
ARTICLE IN PRESSV. Oikonomou et al. / Energy Policy 35 (2007) 1147–1163 1161
efficiency improvement. Our main interest was the finalconsumers that are the recipients of energy services fromthe energy suppliers and distributors. The basic ideaunderlying this policy instrument is to set specific energysaving targets for energy suppliers/distributors that mustbe fulfilled in a specific time frame. The suppliers carry outenergy efficiency projects for their consumers in order toachieve these targets. After the implementation of theseprojects they generate and receive WhC, in return for theirrealized energy savings. Such certificates can be exchangedand traded on the market.
Through the analysis of the energy consumer’s behavior,we conclude that the major benefit of such a scheme is thatit helps to overcome the ‘‘efficiency gap’’, i.e. theunwillingness of the consumers to purchase energyefficiency goods even though they are cost-effective andcan generate energy savings. According to this analysis, thesubstitution effect caused by the relative change in price ofthe energy efficient goods seems to be outweighed by theincome effect, i.e. higher consumption due to larger incomeovercompensates the positive effect of decreasing prices ofenergy efficient goods, despite the fact that both areconsidered normal goods. This finding underlines the needfor policies and measures promoting energy efficiency.
Based on the current experiences acquired so far fromWhC schemes in Europe, we studied two packages oftechnologies (measures) that could be used in a possiblescheme in The Netherlands. Focusing on Dutch house-holds, although this scheme can be applied to all non-energy-intensive sectors of the economy, we examined the
overall effects of a possible scheme, without taking intoaccount policy implementation and other administrativecosts.Based on the findings for the two packages of measures
we conclude that this scheme has the potential to achievehigh effectiveness in terms of energy savings and efficiency.The maximum economically viable cumulated primaryenergy savings for the period 1995 to 2020 can rise up to240 PJ. The primary energy consumption of the Dutchhouseholds after the implementation of the WhC can bereduced by 26% (in 2020), compared to a frozen efficiencyscenario. These savings stem from the use of newtechnologies that can be diffused in the market throughthe application of the scheme. The net cost savings in thelast phase of the WhC scheme are three times higher thanthe initial phase of the scheme. Based on these findings weconclude that WhC are a policy instrument that could beuseful for the design of future energy policy in parallel withthe existing instruments and policies already applied in TheNetherlands.
Acknowledgements
This paper originates from the work accomplishedduring the EU SAVE ‘‘White and Green’’ project and isextended for the Dutch case study. The authors would liketo thank Rene Moor (Ministry of Economic Affairs, TheNetherlands) and Franco Becchis (University of Turin,Italy) for their valuable comments.
Appendix A. Italian WhC measures
Replacement of incandescent lamps with CFLsReplacement of electric hot-water heaters with gas heatersInstallation of new high-efficiency gas boilersReplacement of gas heaters for hot water with more efficient gas heatersReplacement of single-glazing window panes with double glazingIncreased thermal insulation of external walls of buildingsInstallation of photovoltaic systems with peak power below 20 kWInstallation of solar heaters for sanitary hot water production.Re-phasing of electrical lines in industrial plants supplied at high voltageInstallation of air operated, electric heat pumps in new or re-structured buildings replacing gas boilersCo-generation plants with unit power (per module) greater than 0.5MWMedium-low power co-generation plantsInstallation of electronic frequency-regulation systems in electric motorsEnergy recuperation from the de-compression of natural gasInstallation of higher-efficiency motors and mechanisms for mechanical power transmissionReplacement of refrigerators, freezers, combined fridge-freezers, laundry machines, dishwashers with similar productshaving higher efficiencyLow flux showersAerated jet breakers for water taps.
Source: Oikonomou (2004), Gracceva and Contaldi (2004).
ARTICLE IN PRESSV. Oikonomou et al. / Energy Policy 35 (2007) 1147–11631162
Primary
FinalEnergy coversion factors
For electricity 1 toe ¼ 4.545 kWhe For heat 1 toe ¼ 11.628 kWhtEnergy rates (average 2003, taxincluded)
Electricity residential
1 toe ¼ 900 hNat. Gas residential
1 toe ¼ 801 hNat. Gas non-residential:
1 toe ¼ 435 hReferences
ADEME, 2001. Monitoring of energy efficiency trends of European
domestic refrigerators, freezers, washing machines, washer-dryers and
household lamps sold in the EU. ADEME and PW Consulting, SAVE
Contract No. XVII/4.103/Z/98-269 for DG-TREN, Belgium.
Alsema, E., Nieuwlaar, E., 2001. ICARUS-4 a database of energy-
efficiency measures for The Netherlands, 1995–2020, Utrecht Centre
for Energy Research (UCE), Report No. NWS-E-2001-21.
Binswanger, M., 2001. Technological progress and sustainable develop-
ment: what about the rebound effect? Ecological Economics 36,
119–132.
Blok, K., de Groot, L.F., Luiten, E., Rietbergen, M., 2002. The
Effectiveness of Policy Instruments For Energy Efficiency Improve-
ment in Firms—The Dutch Experience. Kluwer Academic Publishers,
Boston/Dordrecht/London.
Boardman, B., 2004. New directions for household energy efficiency:
evidence from the UK. Energy Policy 32, 1921–1933.
Boonekamp, P.G.M., Daniels, B.W., Dril, A.W.N. van, Kroon, P.,
Ybema, J.R., Wijngaart, R.A. van den, 2004. Sectoral CO2 emissions
in The Netherlands up to 2010: Update of the Reference Projection for
Policy-making on Indicative Targets, ECN Policy Studies, ECN-C–
04-029, The Netherlands.
Brandon, G., Lewis, A., 1999. Reducing household energy consumption: a
qualitative and quantitative field study. Journal of Environmental
Psychology 19, 75–85.
Brill, A.M, Hassett, K.A., Metcalf, G., 1999. Household energy
conservation investment and the uniformed consumer hypothesis,
Discussion Papers Series, Department of Economics, Tuft University.
CBS, 2003. Sociaal-economische maandstatistiek. Centraal Bureau voor
de Statistiek, Voorburg/Heerlen, The Netherlands.
Costyn, J., 2003. Certificate trading for the UK’s Energy Efficiency
Commitment, Ofgem, IEA-presentation, Milan.
CPB, Centraal Plan Bureau, 1996. Omgevingsscenario’s Lange Termijn
Verkenningen, Werkdocument No. 89, Centraal Plan Vureau, Den
Haag, The Netherlands.
CPB, Centraal Plan Bureau, 2001. Neveneffecten van het verlenen van
subsidies voor energiebesparing, Commissie Interdepartementaal
Beleidsonderzoek Energiesubsidies, The Netherlands.
De Groot, A., Muskens, J., Velthuijsen, J.W., 1998. De prijselasticiteit van
de energie vraag: stand van zaken 1998, SEO-support 483, Stichting
voor Economisch Onderzoek, Amsterdam.
DEFRA, 2004a. Energy Efficiency Commitment from April 2005,
Consultation Proposals, Product Code PB 9658, London, UK.
DEFRA, 2004b. Energy Efficiency Commitment 2005–08: Illustrative Mix
of Possible Measures, London, UK.
DETR, 2000. Energy Efficiency Commitment 2002–2005 (formerly
EESOP 4), Product Code 00 EP 1037, London, UK.
ECN/RIVM, 1998. Optiedocument voor emissiereductie van broeikasgas-
sen, ECN/RIVM, Petten/Bilthoven, The Netherlands.
ECN/RIVM, 1999. Vervolg optiedocument, ECN/RIVM, Bilthoven/
Petten, The Netherlands.
ECODROME, 1998. Etude experimentale des appareils electromenagers a
haute efficacite energetique en situation reelle, SAVE Programme
4.1031/S/94-03, Auteur Cabinet Olivier Sidler, Partenaire: DGXVII,
ADEME, OSRAM, Groupe Brant, Electrolux, Liebher.
EnergieNed, 2000. Basisonderzoek Elektriciteitsverbruik Kleinverbrui-
kers, 1999, EnergieNed, Arnhem.
European Commission (EC), 2003a. Proposal for a Directive of the
European Parliament and of the Council on energy end-use efficiency
and energy services, COM(2003) 739 final.
European Commission (EC), 2003b. Directive 2003/87/EC of the
European Parliament and of the Council establishing a scheme for
greenhouse gas emission allowance trading within the Community and
amending Council Directive 96/61/EC, Official Journal of the
European Union, 25.10.2003.
Farinelli, U., Johansson, T., McCormick, K., Mundaca, L., Oikonomou,
V., Ortenvik, M., Patel, M., Santi, F., 2005. ‘‘White and Green’’:
comparison of market-based instruments to promote energy efficiency.
Journal of Cleaner Production 13 (10–11), 1015–1026.
Fontaine, N., 2003. Livre Blanc sur les Energies, Ministry of Industry,
7 November 2003, France.
Geller, H., Nadel, S., 1994. Market Transformation Strategies to Promote
End-Use Efficiency. American Council for an Energy-Efficient
Economy, Washington, DC.
Goett, A., Moss, W., 1988. Implicit discount rates in residential customer
choices, investments in conservation measures, EM-5587, Research
Project 2574-1, Electric Power Research Institute, Palo Alto, CA.
Gracceva, F., Contaldi, M., 2004. Scenari Energetici Italiani, Valutazione
di misure di politica energetica. ENEA, Italy.
Greening, L.A., Greene, D.L., Difiglio, C., 2000. Energy efficiency and
consumption—the rebound effect—a survey. Energy Policy 28 (6–7),
389–401.
Guardiola, M., Naturel, B., Perret, L., Renaudie, G., 2004. Les Certificats
d’Economie d’energie, Rapport pour l’atelier changement climatique,
Ecole Nationale des Ponts et Chausses, France.
Hausman, J., 1979. Individual discount rates and the purchase and
utilization of energy-using durables. The Bell Journal of Economics 10
(1), 33–54.
Hirst, E., Goeltz, R., Carney, J., 1981. Residential Energy Use and
Conservation Actions: Analysis of Disaggregate Household Data, Oak
Ridge National Laboratory, ORNL/CON-68.
Joosen, B., Byers, C., 2001. ICARUS-4 Sector study for the Households,
Ecofys, Utrecht Centre for Energy Research (UCE).
Joosen, S., Harmelink, M., Blok, K., 2004. Evaluatie van het klimaatbe-
leid in de gebouwde omgeving 1995–2002, ECOFYS, EEP03007.
Kempton, W., Montgomery, L., 1982. Folk quantification of energy.
Energy—The International Journal 7 (10), 817–828.
Koopmans, C., 1997. NEMO: CPB’s new energy model. CPB Report
1997/2, Den Haag.
Koopmans, C., Te Velde, D.W., 2001. Bridging the energy efficiency gap:
using bottom-up information in a top down energy model. Energy
Economics 23 (1), 57–75.
Kuik, O., Mulder, M., Verbruggen, H., 2002. CO2 emissions trading in
The Netherlands. An assessment of the proposal of the Dutch CO2
ARTICLE IN PRESSV. Oikonomou et al. / Energy Policy 35 (2007) 1147–1163 1163
trading commission, Paper Presented at the second CATEP Work-
shop, University College London.
Langniss, O., Praetorius, B., 2006. How much market do market-based
instruments create? An analysis for the case of ‘‘White’’ Certificates.
Energy Policy 34 (2), 200–211.
Levinson, A., Nieman, S., 2004. Energy use by apartment tenants when
landlords pay for utilities. Resource and Energy Economics 26 (1),
51–75.
Lutzenhiser, L., 1992. A cultural model of household energy consumption.
Energy 17 (1), 47–60.
Malaman, R., Pavan, M., 2002. Energy efficiency certificate trading: food
for thought from a recently launched Italian scheme, IEA-DSM
Workshop.
Midden, C.J., Meter, J.E., Weenig, M.H., Zievering, H.J., 1983. Using
feedback, reinforcement and information to reduce energy consump-
tion in households: a field experiment. Journal of Economic
Psychology 3 (1), 65–86.
Mundaca, L., Santi, F., 2004. Quantitative assessment of selected policy
instruments using the Western European MARKAL model, Phase III
of the EU SAVE ‘‘White and Green’’ project, International Institute
for Industrial Environmental Economics, University of Lund.
NOVEM, 2002. Handreiking Monitoring MJA2, Toelichting op het
Protocol Monitoring en Energiezorg, Brochurenummer: 3MJAF02.01.
Nyboer, J., Bataille, C., 2000. Energy equipment purchasing behaviour: a
review of the literature, CIEEDAC, Simon Fraser University.
OECD/IEA, 2000. Energy Prices and Taxes, Quarterly Statistics, second
Quarter, Paris Cedex, France.
OECD/IEA, 2003. Cool appliances: Policy strategies for energy efficient
homes, Energy Efficiency Policy Profiles, Paris Cedex, France.
OFGEM, 2003. A review of the first year of the Energy Efficiency
Commitment, UK.
Oikonomou, V., 2004. A qualitative analysis of White, Green Certificates
and EU CO2 allowances, Phase II of the EU SAVE ‘‘White and
Green’’ project, Copernicus Institute, NWS-E-2004-112, Utrecht
University.
Oikonomou, V., Patel, M., 2004. An inventory of innovative policies and
measures for energy efficiency, Phase I of the EU SAVE ‘‘White and
Green’’ project, Copernicus Institute, NWS-E-2004-113, Utrecht
University.
Pablo, G.M., Benoit, N., Loic, P., Guilhem, R., 2004. Les Certificats
d’Economie d’Energie, EPNC, France (downloaded at www.enpc.fr/
fr/formations/ecole_virt/traveleves/cc/cc0304/certificats/certifi-
cats.htm)
Pagliano, L., Alari, P., Ruggieri, G., 2003. The Italian Energy saving
obligation to gas and electricity distribution companies, ECEEE
Summer Study.
Pavan, M., 2002. What’s up in Italy? Market liberalisation, tariff
regulation and incentives to promote energy efficiency in end-use
sectors, ACEEE.
Poortinga, W., Steg, L., Vlek, C., Wiersma, G., 2003. Household
preferences for energy saving measures: a conjoint analysis. Journal
of Economic Psychology (24), 49–64.
Quirion, P., 2004. Les Certificats blancs face aux autres instruments de
politique publique pour les economies d’energie: Bilan de literature
economique et priorites de recherche, Institut Francais de l’Energie.
Rehn, E., 2003. Willingness to pay for extra services and consumer
behavior in the Swedish Electricity Market—a contingent valuation,
Master’s Thesis, Lund University.
Ruderman, H., Levine, M., McMahon, J., 1987. The behavior of the
market for energy efficiency in residential appliances including heating
and cooling equipment. The Energy Journal 8 (1), 101–124.
Sanstad, A., Howarth, R., 1994. Consumer Rationality and Energy
efficiency. In: Proceedings of the ACEEE 1994 Summer Study on
Energy Efficiency in Buildings.
Schleich, J., 2004. Do energy audits help reduce barriers to energy
efficiency? An empirical analysis for Germany. International Journal
of Energy Technology and Policy 2 (3), 226–239.
Sorrell, S., 2003. Who owns the carbon. Interactions between the EU ETS
and the UK RO and EEC, SPRU Working Paper 100.
Sutherland, R.J., 1991. Market barriers to energy-efficiency investments.
Energy Journal 12, 15–34.
Sweeney, J.L., 1994. Comments on energy efficiency: lessons from the
past, strategies for the future. In: Proceedings of the World Bank 1993
Development Conference.
Tabet, J.P., 2003. A new EE Policy measure: The White Certificates
Schemes, ADEME, Presentation at WEC Workshop on EE Policies,
Paris.
Tonn, B., Berry, L., 1986. Determinants of participation in home energy
audit/loan programs: discrete choice model results. Energy 11 (8),
785–795.
Train, K., 1985. Discount rates in consumers’ energy-related decisions: a
review of the literature. Energy 10 (12), 1243–1253.
Van Houwelinegen, J., Van Raaij, W., 1989. The effect of goal setting and
daily electronic feedback on in home energy use. Journal of Consumer
Research 16, 98–105.
Varian, H.R., 2003. Intermediate Microeconomics, A Modern Approach,
Sixth ed. Norton & Company, New York.
Velthuijsen, J.-W., Worrell, E., 1999. The economics of energy. In: van
den Bergh, J.C.J.M. (Ed.), Handbook of Environmental and Resource
Economics. Edward Elgar Publishers, Cheltenham, UK.
Vringer, K., Blok, K., 1995. The direct and indirect energy requirements of
households in The Netherlands. Energy Policy 23 (10), 893–910.
VROM, 1998. Kosten en baten in het milieubeleid, Definities en
berekeningsmethoden (costs and benefits in environmental policy,
definitions and calculation methods), Report No. Publicatiereeks
milieustrategie 1998/6, Den Haag.
Wirtshafter, R., 1985. Non-participants in utility energy conservation
programmes. Energy Policy 13 (2), 143–155.
Yates, S.M., Aronson, E., 1983. A social psychological perspective on
energy conservation in residential buildings. American Psychologist 38
(4), 435–444.
Ziesing, H., 1999. Scenarios and measures for mitigating CO2 emissions in
Germany until 2005. In: Stein, G., Strobe,l B. (eds.), Policy Scenarios
for Climate Protection, Germany.
Copyright © 2022 FDOKUMEN