Targeting Non-obvious Errors in Death Certificates - DiVA Portal
106
ACTA UNIVERSITATIS UPSALIENSIS UPPSALA 2008 Digital Comprehensive Summaries of Uppsala Dissertations from the Faculty of Medicine 305 Targeting Non-obvious Errors in Death Certificates LARS AGE JOHANSSON ISSN 1651-6206 ISBN 978-91-554-7075-3 urn:nbn:se:uu:diva-8420
-
Upload
khangminh22 -
Category
Documents
-
view
0 -
download
0
Transcript of Targeting Non-obvious Errors in Death Certificates - DiVA Portal
ACTA
UNIVERSITATIS
UPSALIENSIS
UPPSALA
2008
Digital Comprehensive Summaries of Uppsala Dissertationsfrom the Faculty of Medicine 305
Targeting Non-obvious Errors inDeath Certificates
LARS AGE JOHANSSON
ISSN 1651-6206ISBN 978-91-554-7075-3urn:nbn:se:uu:diva-8420
���������� �������� �� ������ �������� � �� �������� ������� � ������������������������������ ��� ������������� ��� ��� ������� !������� "������� �#� ���$ ��#%&#' (� �!� ������ ( ���� ( )!����!� *"������ ( +������,- !� �������� .��� ��������� � /����!-
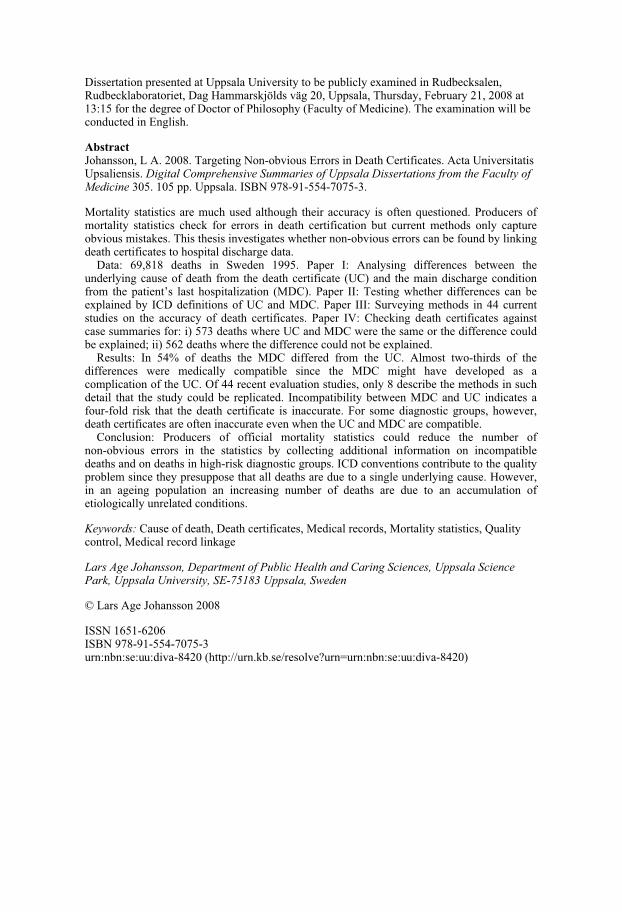
��������
0!���� 1 2- ���$- ������� 34����� /���� � ����! 5����(������- 2��� ����������� ���������- ������� ��� � ���� ����� � � ������� ���� ������� �� �� ������� �� ����� %�'- #�' ��- ������- 6783 9:$49#4'';4:�:'4%-
+������� ���������� ��� ���! ���� ���!��! �!��� �������� �� (�� <�������- )������� (�������� ���������� �!��� (� ����� � ����! �����(����� ��� ������ ���!�� �� ������������ ��������- !�� �!���� ����������� .!��!�� 4����� ����� �� �� (�� �� ���������! �����(������ � !������ ����!���� ����-����& =9�$#$ ����!� � 7.��� #99'- )���� 6& 2������ ��((������ ���.�� �!�
�������� ����� ( ����! (�� �!� ����! �����(����� * 5, �� �!� ��� ����!���� �����(�� �!� ������>� ���� !�������?��� *+�5,- )���� 66& ����� .!��!�� ��((������ �� ���������� �� 65� ��(����� ( 5 �� +�5- )���� 666& 7������� ���!�� � ;; ������������� �!� �������� ( ����! �����(������- )���� 6@& 5!����� ����! �����(������ ���������� ��������� (�& �, ':% ����!� .!��� 5 �� +�5 .��� �!� ���� � �!� ��((����� ������ ��������A ��, '=� ����!� .!��� �!� ��((����� ���� � �� ��������-�������& 6 ';B ( ����!� �!� +�5 ��((���� (�� �!� 5- 2���� �.4�!���� ( �!�
��((������ .��� ��������� ��������� ���� �!� +�5 ���!� !��� �������� �� ���������� ( �!� 5- C( ;; ����� �������� �������� �� $ �������� �!� ���!�� � ���!������ �!�� �!� ����� ���� �� ����������- 6������������ ���.�� +�5 �� 5 �������� �(��4(�� ���� �!�� �!� ����! �����(����� �� ���������- "� ��� �������� ������ !.���������! �����(������ ��� (�� ��������� ��� .!� �!� 5 �� +�5 ��� ���������-5�����& )������� ( ((����� �������� ���������� ���� ������ �!� ����� (
4����� ����� � �!� ���������� �� �������� �������� �(����� ��������������!� �� ����!� � !��!4���� �������� �����- 65� ������ �������� � �!� <������������ ���� �!�� ��������� �!�� ��� ����!� ��� ��� � � ����� �������� �����- �.������ � ����� ������� � �������� ����� ( ����!� ��� ��� � � ���������� (����������� �������� ������-
� ������ 5���� ( ����!� ����! �����(������� +������ ������� +������� ����������� D����������� +������ ����� ������
���� �� ������! � ���� �� � "�#��� $ ���� ��� ������ ��� �� �! ������� ��� �� "��%! ������� ���� �����! �&'()*+, �������! �� � �
E 1��� 2�� 0!��� ���$
6773 #='#4=��=6783 9:$49#4'';4:�:'4%��&�&��&��&����4$;�� *!���&FF��-��-��F������G��H��&�&��&��&����4$;��,

And a conscientious government will have accomplished much when it is made evident how diseases behave, these most implacable enemies of population growth … This has been the effect of [mortality lists], where they have been kept continuously and with proper care.
Wargentin, Notes on the usefulness of annual tables of deaths and births in a country (1755)
– La terza figlia io vi domando. – Che terza figlia mi va figliando? Ella morì! – Eppur nel codice non è così!
[– Please present your third daughter. What third daughter am I made the father of? She is dead! – And yet the register doesn’t say so!]
Ferretti – Rossini, La Cenerentola. Act I, No 5 (1817) Cover picture: Judgement of the dead (from the Book of the Dead of Hunefer, Egypt, 19th Dynasty, c 1275 BC). To the left, jackal-headed Anubis leads the deceased to the hall of judgement. In the centre, Anubis supervises the scales and the deceased’s heart is being weighed against Justice, represented by the feather of Maat. To the right, ibis-headed Thoth records the outcome. (© The Trustees of the British Museum)

List of papers
The thesis is based on the following papers, referred to in the text by their Roman numerals:
I Johansson LA, Westerling R. Comparing Swedish hospital discharge records with death certificates: implications for mortality statistics. Int J Epidemiol. 2000;29:495–502
II Johansson LA, Westerling R. Comparing hospital
discharge records with death certificates: can the differ-ences be explained? J Epidemiol Community Health. 2002; 56:301–8
III Johansson LA, Westerling R, Rosenberg HM. Methodology
of studies evaluating death certificate accuracy were flawed. J Clin Epidemiol. 2006;59(2):125–3
IV Johansson LA, Björkenstam C, Westerling R. Underlying
cause of death and hospital discharge condition: unex-plained differences indicated mistakes in death certifica-tion. An investigation of 1094 deaths in Sweden during 1995. Submitted manuscript
Reprints were made with permission from the publishers.


Contents
Background...................................................................................................13 Mortality statistics: Widely used and often criticized ..............................13
Introduction .........................................................................................13 Context: Producing mortality statistics, and for what purpose ............14
Producing mortality statistics – main stages ............................................15 Establishing the cause of death............................................................15 Complete the death certificate .............................................................18 Code and classify.................................................................................25 Plausibility checks: Querying unsatisfactory death certificates...........27
The concept of “underlying cause of death” ............................................29 Previously: Strong link between single underlying cause and death...30 Current situation: Increasingly complex causes of death ....................31 The “underlying cause” concept - what could be done?......................33
Contents and focus of mortality statistics - which is the most useful statistic?....................................................................................................34
Avoidable causes? ...............................................................................34 Causes amenable to therapy?...............................................................35
Different understandings of quality..........................................................36 Contrasting quality assessments ..........................................................36 Required level of detail........................................................................36 “Underestimation” ...............................................................................37
Analyses based on multiple causes of death ............................................39 Multiple causes of death: Towards a standardized approach...............40
Linking hospital and death certificate data...............................................40 Main hospital discharge condition and underlying cause of death ......40 Relationships between main hospital discharge condition and underlying cause of death ....................................................................42
Aim of the thesis ......................................................................................44
Material and methods....................................................................................46 Data sources .............................................................................................46
Data linkage through the Swedish Personal Identification Number ....47 The Cause-of-Death Register ..............................................................47 The Hospital Discharge Register .........................................................48 Case summaries ...................................................................................49
The project data base................................................................................49 Agreement between hospital discharge condition and underlying cause of death .........................................................................................................50 Testing medical compatibility: ACME and “dummy death certificates”.50
Evaluating the compatibility between hospital and death certificate data – ACME .......................................................................................50 Creating dummy death certificates ......................................................52
Towards a standardized methodology for assessing medical records ......56 Surveying current methodology ..........................................................56
Incompatible cases – a greater risk for mistakes in certification?............58 Developing a standardized methodology for assessing the accuracy of death certificates ..................................................................................59 Assessing the accuracy of hospital records..........................................60 Comparing death certificates and case summaries ..............................60
Results...........................................................................................................62 Paper I ......................................................................................................62
Agreement between hospital discharge condition and underlying cause of death ................................................................................................62
Paper II .....................................................................................................64 Testing medical compatibility between underlying cause of death and main hospital discharge condition .......................................................64
Paper III....................................................................................................66 Surveying current methodology for assessing medical records...........66
Paper IV ...................................................................................................67 Incompatible cases – a greater risk for mistakes in certification? .......67
Discussion .....................................................................................................71 Findings and interpretations .....................................................................71
Comparing hospital discharge condition and underlying cause of death.............................................................................................................71 ICD definitions and differences between underlying cause and main hospital discharge condition ................................................................73 Assessing the accuracy of death certificates – current status of methodology ........................................................................................74 Comparing death certificates to case summaries for 1094 deaths: Incompatible cases and risk for mistakes in classification ..................77
Strengths and limitations of the studies....................................................82 Strengths ..............................................................................................82 Limitations...........................................................................................83
Specific methodological considerations...................................................84 Why the hospital discharge register? ...................................................84 Quality of the hospital discharge register ............................................84 Judging compatibility: ACME less than perfect? ................................84

Comparing death certificates and case summaries ..............................85 Statistical measures – conforming to conventions of official statistics86
Record linkage and querying procedures: Future directions....................86 Improved data edits at the statistics agency.........................................86 Reference mortality data set ................................................................88
Conclusions...................................................................................................90 Targeting non-obvious errors ...................................................................90 ICD definitions: shortcomings and possible improvements.....................91 Assessing the accuracy of mortality statistics ..........................................91
Acknowledgements.......................................................................................92
References.....................................................................................................95

Abbreviations and key terms
ACME Automated Classification of Medical Enti-ties, a software developed by the National Center for Health Statistics, USA. From a set of ICD codes, corresponding to themultiple causes of death reported on thedeath certificate, ACME selects the under-lying cause of death according to the instructions in the ICD.
BTL Basic Tabulation List, a shortlist for tabu-
lation of underlying cause of death included in ICD-9. Paper I, II and IV use the Swedish extended version which has 286 groups ofcauses of death.
HOSPREG Hospital Discharge Register
ICD International Classification of Diseases (9th
revision, if not stated otherwise)
MORTREG Cause of Death Register
OR Odds ratio
NCHS National Center for Health Statistics. Thefederal agency responsible for the USmortality statistics. Maintains the ACME software.
PNR Personal identification number
WHO World Health Organization

Underlying cause of death In mortality statistics prepared according tothe WHO rules and guidelines, each death isattributed to one single underlying cause. Defined since ICD-6 (1948) as “(a) the disease or injury which initiated the train ofmorbid events leading directly to death, or(b) the circumstances of the accident orviolence which produced the fatal injury.” However, the ICD sometimes instructs the coder to classify the death to an ICD category denoting a specific complication or a combination with another condition.
Originating cause of death The condition that initiated the train ofevents leading to death. In the majority ofcases, the originating cause will be the same as the underlying cause, but when a specific complication or a combination with anothercondition is selected as underlying cause, the originating cause and the underlyingcause will not be the same.
Multiple cause of death All causes of death mentioned on a death
certificate: underlying cause, complications, contributing causes.
Main discharge condition Described in ICD-9 (1977) as “the main
condition treated or investigated during therelevant episode of care”.
Discharge condition and underlying cause compatible
The main discharge condition reported toHOSPREG is the same as the underlyingcause reported on the death certificate, orthe main discharge condition could havedeveloped as a complication of the reported underlying cause.
Discharge condition and underlying cause incompatible
The main discharge condition reported toHOSPREG is not the same as the under-lying cause reported on the death certificate,and the main discharge condition could nothave developed as a complication of the reported underlying cause.

Outlier An infrequent data value that is conspicu-ously different from the rest of the data andtherefore very likely to be erroneous; for example prostate cancer reported as thecause of death of a woman. Outliers are easy to spot through computerized datachecks.
Inlier A data value that is similar to the rest of the
data but still erroneous, for example prostate cancer reported as the cause of death of aman who died from cancer of the bladder.Since the value is compatible with othervariables, for example age and sex, inliererrors are non-obvious and will not be discovered through routine data checks.

13
Background
Mortality statistics: Widely used and often criticized Introduction Although they are far from the only medical statistics available, mortality data are widely used for medical research, monitoring of public health and planning and follow-up of health care. They are cheap, comprehensive, available from a wide range of countries, collected on an ongoing basis and cover long periods of time.1,2
One would also expect mortality statistics to be better coordinated inter-nationally than most other medical statistics since the WHO has included detailed instructions on collection, classification and dissemination of mortality data in the ICD for almost 60 years, and WHO member countries pledge themselves to prepare mortality statistics according to these specifi-cations.3 Bearing this in mind, it is not surprising that an editorial in the March 2006 issue of the Bulletin of the World Health Organization states that “information on deaths by cause is the key” to “planning, implementa-tion and evaluation of health programmes at national and international levels”, and that, consequently, assessment of the number and causes of deaths is a top priority in developing countries.4 Mortality data are also much used and cited by non-specialists, and a Google search on “mortality statis-tics” returns over 600,000 hits.
Still, concerns about the accuracy of mortality statistics, and consequently about their usefulness in research and for prevention, are as old as the statis-tics themselves.5 Sweden provides a case in point. Swedish mortality statis-tics date from 1749, when the Parliament decided to implement a nation-wide system for collection of vital statistics.5,6 The astronomer and demo-grapher Pehr Wargentin (1717-1783) was the first to publish a systematic review of the newly available population statistics. In his 1755 report to the Swedish Academy of Science, he noted that “inexperience and lack of expertise in recognizing and discriminating between diseases ... make the figures [on causes of death] less reliable”. He hoped, however, that the situation would improve once those reporting causes of death had gained more experience.5
Unfortunately, even a cursory literature review shows that the quality problem has endured even in countries with a long tradition of mortality
14
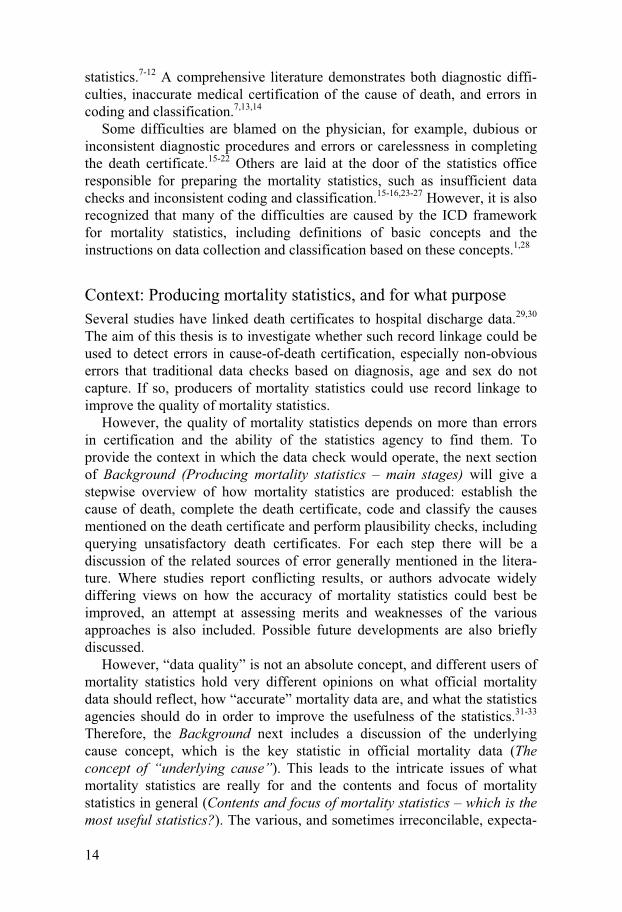
statistics.7-12 A comprehensive literature demonstrates both diagnostic diffi-culties, inaccurate medical certification of the cause of death, and errors in coding and classification.7,13,14
Some difficulties are blamed on the physician, for example, dubious or inconsistent diagnostic procedures and errors or carelessness in completing the death certificate.15-22 Others are laid at the door of the statistics office responsible for preparing the mortality statistics, such as insufficient data checks and inconsistent coding and classification.15-16,23-27 However, it is also recognized that many of the difficulties are caused by the ICD framework for mortality statistics, including definitions of basic concepts and the instructions on data collection and classification based on these concepts.1,28
Context: Producing mortality statistics, and for what purpose Several studies have linked death certificates to hospital discharge data.29,30 The aim of this thesis is to investigate whether such record linkage could be used to detect errors in cause-of-death certification, especially non-obvious errors that traditional data checks based on diagnosis, age and sex do not capture. If so, producers of mortality statistics could use record linkage to improve the quality of mortality statistics.
However, the quality of mortality statistics depends on more than errors in certification and the ability of the statistics agency to find them. To provide the context in which the data check would operate, the next section of Background (Producing mortality statistics – main stages) will give a stepwise overview of how mortality statistics are produced: establish the cause of death, complete the death certificate, code and classify the causes mentioned on the death certificate and perform plausibility checks, including querying unsatisfactory death certificates. For each step there will be a discussion of the related sources of error generally mentioned in the litera-ture. Where studies report conflicting results, or authors advocate widely differing views on how the accuracy of mortality statistics could best be improved, an attempt at assessing merits and weaknesses of the various approaches is also included. Possible future developments are also briefly discussed.
However, “data quality” is not an absolute concept, and different users of mortality statistics hold very different opinions on what official mortality data should reflect, how “accurate” mortality data are, and what the statistics agencies should do in order to improve the usefulness of the statistics.31-33 Therefore, the Background next includes a discussion of the underlying cause concept, which is the key statistic in official mortality data (The concept of “underlying cause”). This leads to the intricate issues of what mortality statistics are really for and the contents and focus of mortality statistics in general (Contents and focus of mortality statistics – which is the most useful statistics?). The various, and sometimes irreconcilable, expecta-
15
tions on mortality data that can be found in the literature are then reviewed (Different understandings of quality). These issues deserve special attention now since in April 2007 the WHO officially initiated the process that will lead to the eleventh revision of the ICD.
The Background then moves on to discuss the use of multiple causes of death, which has been suggested as an alternative to statistics based on underlying cause of death only (Analyses based on multiple causes of death). Finally, some basic concepts related to the linkage of hospital and death certificate data are introduced, concepts that are central to the studies on which this thesis is based (Linking hospital and death certificate data).
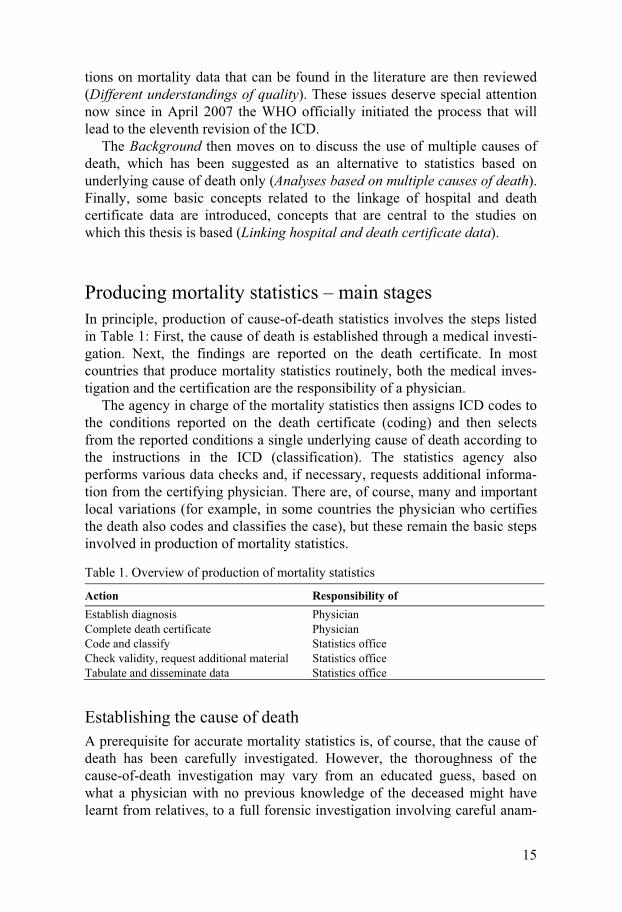
Producing mortality statistics – main stages In principle, production of cause-of-death statistics involves the steps listed in Table 1: First, the cause of death is established through a medical investi-gation. Next, the findings are reported on the death certificate. In most countries that produce mortality statistics routinely, both the medical inves-tigation and the certification are the responsibility of a physician.
The agency in charge of the mortality statistics then assigns ICD codes to the conditions reported on the death certificate (coding) and then selects from the reported conditions a single underlying cause of death according to the instructions in the ICD (classification). The statistics agency also performs various data checks and, if necessary, requests additional informa-tion from the certifying physician. There are, of course, many and important local variations (for example, in some countries the physician who certifies the death also codes and classifies the case), but these remain the basic steps involved in production of mortality statistics.
Table 1. Overview of production of mortality statistics
Action Responsibility of Establish diagnosis Complete death certificate
Physician Physician
Code and classify Statistics office Check validity, request additional material Statistics office Tabulate and disseminate data Statistics office
Establishing the cause of death A prerequisite for accurate mortality statistics is, of course, that the cause of death has been carefully investigated. However, the thoroughness of the cause-of-death investigation may vary from an educated guess, based on what a physician with no previous knowledge of the deceased might have learnt from relatives, to a full forensic investigation involving careful anam-

16
nesis, review of medical records, comprehensive autopsy and toxicological examinations. Consequently, the reliability of the diagnosis varies with the thoroughness of the investigations carried out while the patient was still alive and those performed on the body of the deceased.
Few statistics offices collect information on the diagnostic methods involved in establishing the cause of death. Autopsy, however, is an impor-tant exception, and statistics offices often report autopsy rate. Moreover, in many studies on the accuracy of mortality statistics, a high autopsy rate is seen as a necessary prerequisite for accurate death certificates.13,19,34-37
Autopsies The number of studies calling for more autopsies is impressive.13,19,35-46 However, most countries have seen a decline in autopsy rate. In Sweden, the autopsy rate was at its highest in 1974, when 46% of women and 53% of men were autopsied. In 2004, the autopsy rate was 10% for women and 19% for men.47 Similar trends are seen in most other countries. Explanations for the decrease in autopsy rate vary, but include financial constraints,36,39 increasingly negative attitudes to autopsy among both relatives34,35,41 and clinicians, who tend to believe that clinical investigations are now so sophis-ticated that an autopsy has little to add,36,37,39 but paradoxically might still fear the legal consequences of an unexpected autopsy finding.36,37,39
Relating autopsy findings to clinical diagnosis Doubtlessly a high autopsy rate contributes to better data quality, but a high autopsy rate alone does not guarantee flawless death certificates. Sometimes an over-reliance on autopsy results might even result in less than optimal death certificates.
Some pathologists feel so confident in autopsy results that they do not see any need to take clinical findings into account when they pronounce on the cause of death.19 This might seem surprising, but Maudsley and Williams,7 along with Roulson et al,37 see it necessary to argue that death certificates should not be based on autopsy results alone, but that the certifier should always correlate clinical data and autopsy findings. Hollins et al, reporting on death certificates for people with learning disabilities, support that view. In their opinion, the failure to take clinical data into consideration results in poor death certificates, since “[p]ostmortem certificates are extremely detailed regarding pathology contributing to the immediate cause of death. They appear to be incomplete in the documentation of chronic conditions, such as epilepsy.” In fact, there were fewer mentions of the learning disability when there had been an autopsy than in deaths where no autopsy had been performed.48 According to Salib, Tadros and Ambrose, death certificates based on autopsies often omit clinically important conditions: “[a]utopsy has very little or no value in ensuring higher rates of recording conditions such as dementia, particularly Alzheimer’s disease, but may be of
17
some value in providing more information regarding any underlying cause of death in elderly psychiatric patients”.38
There are two main reasons why a certificate that simply enumerates morphological changes is not satisfactory. First, even a detailed account of the morphological changes observed at the autopsy does not always point clearly towards a specific clinical diagnosis, and mortality statistics are built on diagnostic entities. Second, autopsy findings alone do not provide a sequence of events, and that information is essential to establishing the underlying cause of death. This might explain why Svartbo et al, in a study on the accuracy of pneumonia as underlying cause of death, found that “clinical autopsy did not guarantee a high level of agreement” between the death certificate and the review panel.12
Thus, a pathologist who believes that autopsy findings are the only “objective” facts in the case, and disregards clinical information, might produce a death certificate that says less about the underlying cause of death than a certificate written by an attending physician with no knowledge of the autopsy results, but who is familiar with the deceased’s medical history.
Autopsy rate as a quality measure Autopsy rate is often used as a quality measure for mortality statistics. However, autopsies vary much in scope, quality and precision.49,50 For example, a forensic autopsy carried out as a part of a murder investigation is far more meticulous than a routine clinical autopsy that might not even comprise all major organs. Studies on autopsy results also classify both autopsy findings and errors in clinical diagnosis differently. In a review of 18 papers on differences between cause of death according to the clinician and cause of death based on autopsy, Roulson, Benbow and Hasleton report that “[d]espite around 100 years of research it is still difficult to compare results, as various studies look at different aspects and types of discrepancy and classify discrepancies in different ways.” For example, some studies count all discrepancies found as diagnostic errors, whether they would have changed the underlying cause of death or not.37
Most studies still maintain that a low autopsy rates pose a serious quality problem. However, autopsy studies deal with heavily biased samples. A wide range of matters – cultural, religious, ethical, medical, legal and finan-cial – will always influence the selection and availability of cases for autopsy, and it is hardly ever possible to obtain a true random sample. There-fore, it is not surprising that studies present very different estimates of diag-nostic errors detected at autopsy.39,51 In an interesting study where 53 autopsy series have been pooled, Shojania et al claim that “the possibility that a given autopsy will reveal important unsuspected diagnoses has decreased over time”. They acknowledge that other studies have arrived at a different conclusion, but argue that this is mainly because of biased samples and insufficient statistical power. The number of unexpected findings is still

18
high enough to warrant autopsies, and the authors suggest that “a small number of hospitals funded to perform autopsies in a high percentage of deaths and according to a uniform protocol could generate accurate error rates appropriate for correcting the information contained in routinely gener-ated death certificates”.52
Zhang et al, who found a comparatively low error rate in a series of 158 autopsies, suggest that autopsies should be limited to cases where other diagnostic methods did not lead to a plausible diagnosis.39
It would seem, then, that the value of autopsy varies with the cause of death. An autopsy reveals more in sudden or otherwise unexplained deaths than in deaths resulting from long-term effects of chronic diseases. Conse-quently, the kind of deaths that are investigated by autopsy is more important for the quality of cause-of-death data than the autopsy rate itself. A high autopsy rate does not automatically lead to good data quality, and a low autopsy rate may be fully compatible with high quality – provided that an autopsy is performed when other investigations have been inconclusive.
Autopsies – what can the statistics agencies do? Autopsy rate and practices are governed by multiple factors, such as legisla-tion, public attitudes, availability of pathologists and the financing of autop-sies. Most of these are not within the control of the agency responsible for the cause-of-death statistics. According to a Swedish study of non-hospital deaths, 26% of deaths due to violence and poisoning had not been reported to the police although current legislation states very clearly that all non-natural deaths must be reported.53 The statistics agency should at least keep track of such cases and alert the appropriate authority.
When an autopsy is carried out, it is important that the physician who issues the final death certificate takes both the autopsy findings and the patient’s clinical history into account. If the death certificate does not relate the morphological findings to a clinical diagnosis, the statistics agency should ask for clarification, preferably from the hospital department where the patient was treated. In due time, this might contribute to better coopera-tion between pathologists and clinicians on death certification
Complete the death certificate Once the patient’s conditions have been correctly diagnosed, the physician is to report the causes of death to the mortality registry. For this reporting, the WHO has designed a standardized procedure. If carried out correctly, the procedure allows the registry staff to identify the most important condition of the case, which the WHO calls the “underlying cause of death”.3,54

19
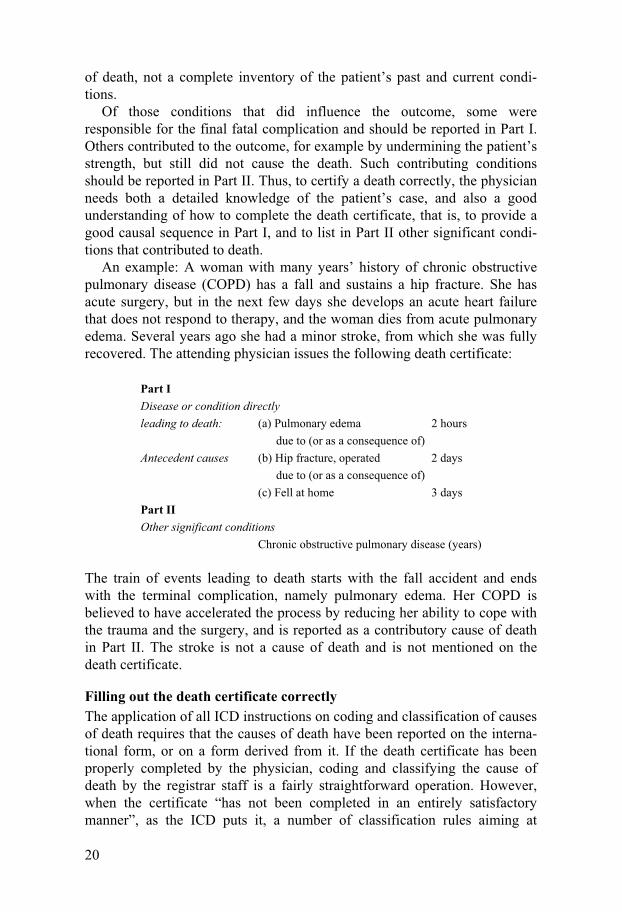
The International Form of Medical Certificate of Cause of Death According to the WHO regulations, member countries are to use death certificate forms based on the International Form of the Medical Certificate of Cause of Death (Figure 1). The international form, which is included in the ICD,3,54 has two parts. In Part I, the certifier describes the main stages of the train of events that lead to death. The events are reported in causal order with the final complication on line (a). If the certifier uses more than one line in Part I, the emergence of a condition should be fully explained by the condition entered on the line below. This means that Part I will contain a point-by-point description of the train of events leading to death, with the originating cause stated on the lowest used line and the final complication stated on line (a).
In Part II, the certifier enters conditions that might have accelerated the process but do not belong to the train of events reported in Part I.
Figure 1. The international Form of Medical Certificate of Cause of Death. From Manual of the International Statistical Classification of Diseases, Injuries, and Causes of Death, 9th revision.
To fill out the death certificate properly, the certifier thus has to make a distinction between those conditions that in some way or another brought about or contributed to the death and other conditions that the patient might have had but that did not influence the outcome. According to the WHO definitions, conditions that did not influence the outcome should not be included on the death certificate – the death certificate is a report on causes
20
of death, not a complete inventory of the patient’s past and current condi-tions.
Of those conditions that did influence the outcome, some were responsible for the final fatal complication and should be reported in Part I. Others contributed to the outcome, for example by undermining the patient’s strength, but still did not cause the death. Such contributing conditions should be reported in Part II. Thus, to certify a death correctly, the physician needs both a detailed knowledge of the patient’s case, and also a good understanding of how to complete the death certificate, that is, to provide a good causal sequence in Part I, and to list in Part II other significant condi-tions that contributed to death.
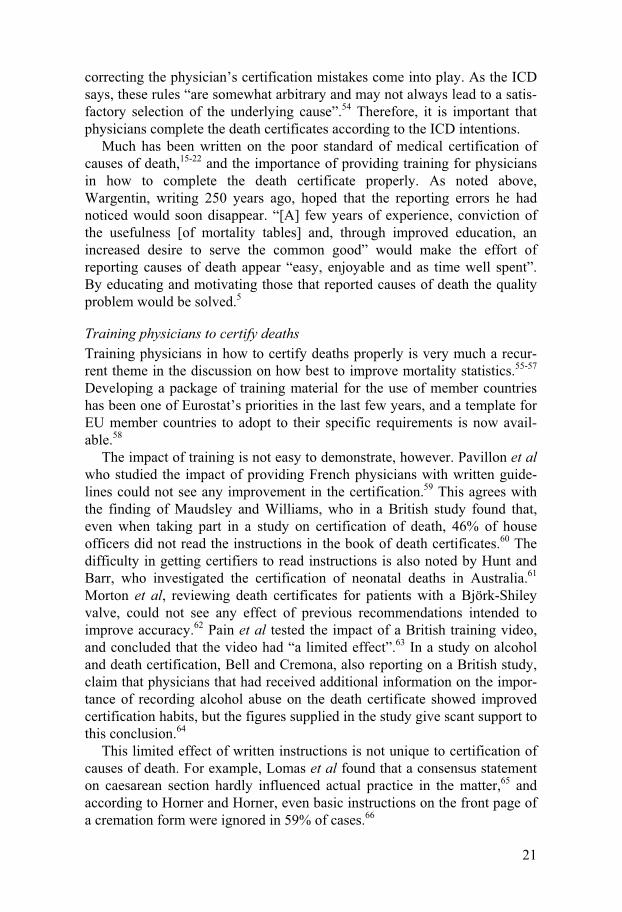
An example: A woman with many years’ history of chronic obstructive pulmonary disease (COPD) has a fall and sustains a hip fracture. She has acute surgery, but in the next few days she develops an acute heart failure that does not respond to therapy, and the woman dies from acute pulmonary edema. Several years ago she had a minor stroke, from which she was fully recovered. The attending physician issues the following death certificate:
Part I Disease or condition directly leading to death: (a) Pulmonary edema 2 hours
due to (or as a consequence of) Antecedent causes (b) Hip fracture, operated 2 days
due to (or as a consequence of) (c) Fell at home 3 days
Part II Other significant conditions
Chronic obstructive pulmonary disease (years)
The train of events leading to death starts with the fall accident and ends with the terminal complication, namely pulmonary edema. Her COPD is believed to have accelerated the process by reducing her ability to cope with the trauma and the surgery, and is reported as a contributory cause of death in Part II. The stroke is not a cause of death and is not mentioned on the death certificate.
Filling out the death certificate correctly The application of all ICD instructions on coding and classification of causes of death requires that the causes of death have been reported on the interna-tional form, or on a form derived from it. If the death certificate has been properly completed by the physician, coding and classifying the cause of death by the registrar staff is a fairly straightforward operation. However, when the certificate “has not been completed in an entirely satisfactory manner”, as the ICD puts it, a number of classification rules aiming at
21
correcting the physician’s certification mistakes come into play. As the ICD says, these rules “are somewhat arbitrary and may not always lead to a satis-factory selection of the underlying cause”.54 Therefore, it is important that physicians complete the death certificates according to the ICD intentions.
Much has been written on the poor standard of medical certification of causes of death,15-22 and the importance of providing training for physicians in how to complete the death certificate properly. As noted above, Wargentin, writing 250 years ago, hoped that the reporting errors he had noticed would soon disappear. “[A] few years of experience, conviction of the usefulness [of mortality tables] and, through improved education, an increased desire to serve the common good” would make the effort of reporting causes of death appear “easy, enjoyable and as time well spent”. By educating and motivating those that reported causes of death the quality problem would be solved.5
Training physicians to certify deaths Training physicians in how to certify deaths properly is very much a recur-rent theme in the discussion on how best to improve mortality statistics.55-57 Developing a package of training material for the use of member countries has been one of Eurostat’s priorities in the last few years, and a template for EU member countries to adopt to their specific requirements is now avail-able.58
The impact of training is not easy to demonstrate, however. Pavillon et al who studied the impact of providing French physicians with written guide-lines could not see any improvement in the certification.59 This agrees with the finding of Maudsley and Williams, who in a British study found that, even when taking part in a study on certification of death, 46% of house officers did not read the instructions in the book of death certificates.60 The difficulty in getting certifiers to read instructions is also noted by Hunt and Barr, who investigated the certification of neonatal deaths in Australia.61 Morton et al, reviewing death certificates for patients with a Björk-Shiley valve, could not see any effect of previous recommendations intended to improve accuracy.62 Pain et al tested the impact of a British training video, and concluded that the video had “a limited effect”.63 In a study on alcohol and death certification, Bell and Cremona, also reporting on a British study, claim that physicians that had received additional information on the impor-tance of recording alcohol abuse on the death certificate showed improved certification habits, but the figures supplied in the study give scant support to this conclusion.64
This limited effect of written instructions is not unique to certification of causes of death. For example, Lomas et al found that a consensus statement on caesarean section hardly influenced actual practice in the matter,65 and according to Horner and Horner, even basic instructions on the front page of a cremation form were ignored in 59% of cases.66
22
Some studies report greater success, however. Gispert et al achieved some improvement in certification practices after a training seminar on death certi-fication in Catalonia, but also observe that motivating physicians to attend the seminar is difficult.67 Myers and Farquhar conducted an ambitious train-ing programme at a major Canadian hospital, and concluded that training does have an effect – even in a notoriously difficult field such as internal medicine.18 A tentative interpretation might be that general training initia-tives, such as providing instruction booklets and other training packages, have very limited effect but that local training programmes where trainers and certifiers interact directly may improve certification practices.
Some comfort derives in the finding that, contrary to expectations, younger doctors generally write better death certificates than their more experienced colleagues, and are less likely to modify the death certificate to avoid distressing relatives.60,68,69 A trend towards better certification is also observed in the USA1 and, before the introduction of ICD-10, in Spain.70
Perhaps the greatest problem concerning certification is that most physi-cians issue comparatively few death certificates60,67 and even fewer for complex cases, and do not see any greater need to spend time on formal training on how to complete the certificate. Therefore, it is difficult to avoid the conclusion of Maudsley and Williams that urging more education is no solution to the quality problem. More would be gained by rethinking about what kind of data we wish to collect, and for what purpose.7,28
Training – what can the statistics agencies do? Most statistics agencies provide instructions and other training material for certifiers. The impact of such training packages should be tested. Moreover, the statistics agencies should check their training material for time-effi-ciency, and aim at producing material that covers the essentials in as short a time as possible.
Producers of mortality statistics would also need to think more about feedback to certifiers. Among mortality statisticians, it is a common view that physicians do not realise that mortality statistics, and with them much epidemiology and public health research, are based on death certificates. The foundation of this allegation might be mainly anecdotal, but better and more frequent feedback would show certifiers that what they put on the death certificate does make a difference to, for example, reimbursement71 and assessment of health care quality.72 Queries from the statistics office to the certifying physician when the death certificate is incomplete or otherwise deficient could be used to provide feedback to the certifiers (see below, Plausibility checks: Querying unsatisfactory death certificates).
We cannot blame all “bad” death certificates on the doctor alone, however. Mortality statistics are unlikely ever to be perfect. Sometimes the case is far from clear, and despite earnest attempts at establishing a diag-nosis, the cause of death cannot be identified. Perhaps the patient died before

23
any conclusive results were reached, or the patient’s condition was too poor to allow any diagnostic interventions. If that is the case, an unspecific or general cause of death, such as “pulmonary edema”, is justified. Both producers and users of mortality statistics have to accept that a “good” cause of death is not always to be had.
Electronic death certificates with online validity checks Several countries are in the process of implementing or developing elec-tronic certification of causes of death. An electronic and interactive certifi-cate is seen as a way of improving certification. For example, it would be possible to check that physicians enter plausible sequences and that they do not only report general symptoms.56,57
Judging in real time whether a sequence of medical events is acceptable might be a challenge, however. As can be seen from the discussions in the Mortality Forum (an international email group for issues related to classifi-cation of causes of death),73 opinions on what is an acceptable medical sequence differ widely. Further, an electronic death certificate with too rigid an in-built evaluation of conditions and reported sequences might not be able to cope with rare cases or recently recognized conditions, which might discourage physicians from reporting unusual or unexpected causes of death. That would decrease the value of the mortality statistics since such cases are often interesting from the epidemiological and public health point of view. Similar experiences have been reported of other types of IT decision support systems in medical care, for example on therapy guidelines in primary care,74 on drug prescription75 and decision support systems for nurses at medical call centres.76,77
Electronic certification - what can the statistics agencies do? Electronic certification might not solve all difficulties related to poor certifi-cation, and certainly not at once. However, a well-functioning electronic patient system that gives the physician easy access to all relevant data would probably contribute to more correct diagnostic information on the death certificates.
We should also remember that electronic decision support systems are still in their infancy and medical computer systems will undoubtedly get more sophisticated in the future. Taking part in the development of elec-tronic reporting systems and monitoring their impact will be a major task for producers of mortality data. This would involve not only validity checks, but also definitions, instructions and tutorials that would be made available online.
Specialist certification teams In 1987, Davis et al presented an interesting idea on how to improve death certification, 78 based on a system originally suggested by Remington for
24
clinical trials.79 Death certificates would be completed by specially trained doctors, working in teams. Certification would be based on data from medical records, collected according to a set standard. Any differences on how to certify a particular death should be resolved at a consensus meeting. Hanzlick describes a somewhat similar pilot programme at an Atlanta hospital.80 A death certificate worksheet is completed by the clinician and checked by pathology staff, who, if necessary, correct errors and omissions after review of the medical record. This approach ensures feedback to the clinician and a more consistent approach to certification of causes of death. Hanzlik also describes a similar arrangement tested in Fulton County, Georgia, where a review team checks all death certificates before they are released to the funeral home.81
Assigning the task of certifying deaths to a specialist or specialist team would also have the advantage of making it easier to implement specific instructions on certification since fewer individuals would be involved. For example, the method recommended by Hanzlick to avoid having “mecha-nisms of death” reported on the death certificate is rather complex82 and would be difficult to implement nationwide in a consistent manner. However, a designated specialist in cause-of-death certification should have no difficulty in following the algorithm.
Some Nordic countries have or have had data collection systems involv-ing peer review, but with varying outcomes. For example, in Norway all death certificates are reviewed by a medical officer before they are forwarded to Statistics Norway. According to the assessment of Statistics Norway, which produces the Norwegian mortality statistics, the impact is not overwhelming. Denmark had a similar system and similar experiences, and decided to abolish the peer review.83 In Finland, however, where all death certificates are also reviewed by a medical officer, the experiences are far more encouraging. Here, the body is not released for cremation or burial until the medical officer has approved the death certificate. Furthermore, the medical officer is a forensic pathologist with the authority to order an autopsy, if deemed necessary. The peer review is seen as an important reason why Statistics Finland encounters comparably few low-quality death certificates.84
It would seem that involving a review team or a specialist in death certifi-cation does improve the accuracy of cause-of-death certification – provided that those responsible for the review have sufficient resources and recognize the importance of the review. However, review by a specialist team pre-supposes not only considerable resources and commitment at local level but also that the medical records are complete. If important facts or documents are missing, the specialist team may not understand the disease process as well as a certifier who is familiar with the patient’s history.
25
Code and classify The statistics office is responsible for coding, classification and validation of the death certificates. When speaking of causes of death “coding” usually means that the registry staff assigns an ICD code to each condition mentioned on the certificate. “Classification”, on the other hand, means that for each death one single cause of death is selected for statistical tabulation.
Accurate coding and classification does not necessarily mean good mortality data, however. The statistics office must also apply plausibility checks to the data, and as far as possible identify erroneous death certificates and endeavour to collect the additional data required to correct them.
Different interpretations of the ICD rules and guidelines The ICD includes numerous rules and guidelines on coding and classi-
fication of mortality. These instructions have developed over a long time and are very detailed, but still far from complete and sometimes open to very different interpretations. This has profound repercussions on the compara-bility of mortality statistics, both between countries that interpret the instructions differently and within a country when the ICD rules or their application changes over time.
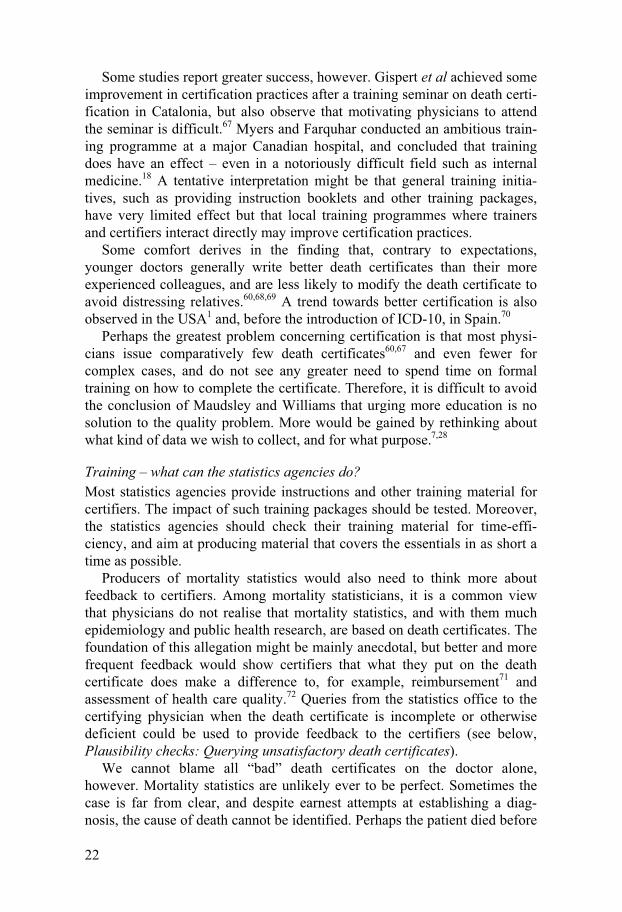
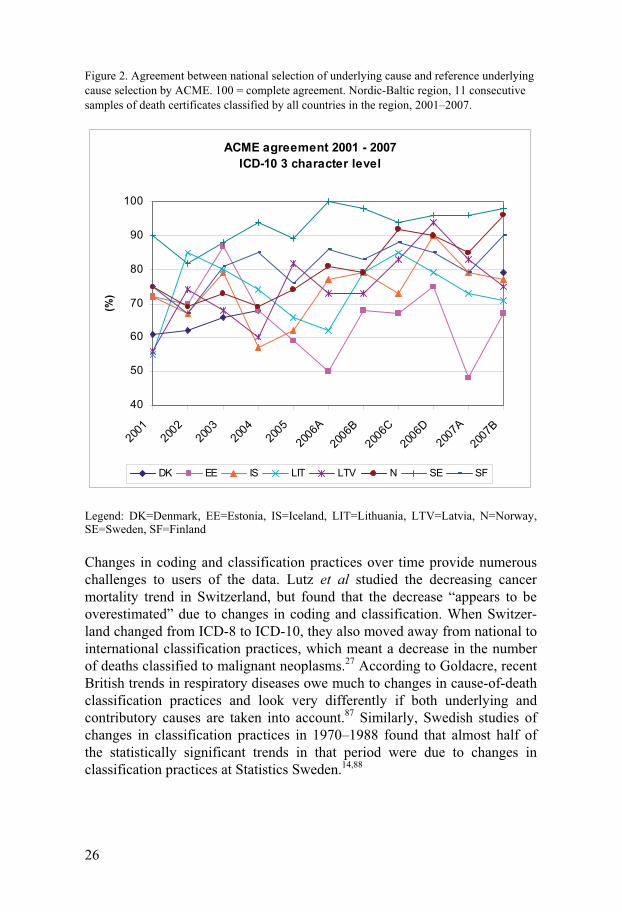
In a study on certification and statistical classification of diabetes, Jougla et al found that both certification and classification practices vary between countries, but that national classification habits differ more than how doctors certify diabetes deaths.23 Other examples of how national classification traditions impair international comparability involve cancer mortality15,25,26,85 and injuries.14,24 An ongoing study on coding and classification practices in the eight countries in the Nordic-Baltic region show a difference of as much as 50% between the underlying cause selected by the participating countries and the reference underlying cause provided by the ACME software (Figure 2).86 Clearly such differences do not facilitate statistical comparisons between countries.
26
Figure 2. Agreement between national selection of underlying cause and reference underlying cause selection by ACME. 100 = complete agreement. Nordic-Baltic region, 11 consecutive samples of death certificates classified by all countries in the region, 2001–2007.
Legend: DK=Denmark, EE=Estonia, IS=Iceland, LIT=Lithuania, LTV=Latvia, N=Norway, SE=Sweden, SF=Finland
Changes in coding and classification practices over time provide numerous challenges to users of the data. Lutz et al studied the decreasing cancer mortality trend in Switzerland, but found that the decrease “appears to be overestimated” due to changes in coding and classification. When Switzer-land changed from ICD-8 to ICD-10, they also moved away from national to international classification practices, which meant a decrease in the number of deaths classified to malignant neoplasms.27 According to Goldacre, recent British trends in respiratory diseases owe much to changes in cause-of-death classification practices and look very differently if both underlying and contributory causes are taken into account.87 Similarly, Swedish studies of changes in classification practices in 1970–1988 found that almost half of the statistically significant trends in that period were due to changes in classification practices at Statistics Sweden.14,88
ACME agreement 2001 - 2007ICD-10 3 character level
40
50
60
70
80
90
100
2001
2002
2003
2004
2005
2006A
2006B
2006C
2006D
2007A
2007B
(%)
DK EE IS LIT LTV N SE SF

27
Code and classify - what can the statistics agencies do? To ensure a consistent application of the ICD instructions on coding and classification, an increasing number of countries have implemented computer software that automatically selects the underlying cause according to the ICD specifications. The most well-known system is ACME, devel-oped and maintained by the US National Center for Health Statistics (NCHS). According to the NCHS, the software is now distributed to 18 countries. ACME has also been recommended by Eurostat as the European standard for selection of the underlying cause of death. Member countries that have not yet implemented ACME are encouraged to do so, which would ensure a basic level of comparability within the European Union.89 However, ACME is not perfect, but countries using ACME cooperate on the evaluation and improvement of ACME. The “International Collaborative Effort on Automating Mortality Statistics”, led by the US National Center for Health Statistics, provides a framework for this.90
Changes in coding and classification might bring about shifts in statistical trends, and to monitor the impact a number of countries routinely perform comparability studies. Such studies compare a set of mortality data coded and classified according to different procedures, for example different revi-sions of the ICD or a manual versus a computerized production system. By comparing the number of deaths classified to specific causes of death according to the different procedures involved, it is possible to calculate “comparability ratios” that reflect the impact of the change in coding and classification procedures on specific causes of death. These comparability ratios can then be used to adjust for these changes, for example in time series. A Eurostat working group has developed a manual on comparability studies and the use of comparability ratios.91
Plausibility checks: Querying unsatisfactory death certificates Most statistics offices spend much time and effort on validating the certifi-cates they receive, and on requesting additional information from certifiers if the death certificates are found wanting, a process generally referred to as “querying”. Traditionally, the validity checks are based on diagnosis, sex and age.
As was evident from the Eurostat report on quality improvement of mortality statistics,55 querying strategies differ widely between countries. Some countries have a far more ambitious querying programme than others, which reflects not only different opinions on what is an acceptable cause of death, but also the resources available for querying and the possibility of getting in touch with the certifier. Data protection legislation may also influ-ence national practices, and in some countries data protection provisions are so strict as to make querying impossible altogether.
28
The US state of Oregon has implemented an ambitious programme of querying and request additional information in about 10% of deaths. Of the queries issued between August 1986 and July 1987, the additional informa-tion obtained changed the underlying cause in more than half of cases. Most changes were in line with previous quality studies, and the number of deaths due to commonly under-reported causes of death, such as liver cirrhosis and alcohol abuse, increased because of the querying.92
Although querying might influence death rates of underlying causes specifically targeted by local querying instructions, the impact on the general mortality pattern is less significant. A US study found that adjusted death rates for the five leading causes of death did not change significantly as a result of the queries, and that queries do not change the general mortality pattern.93 A Finnish study arrived at a similar conclusion. Although almost half of the replies received changed the underlying cause, there was no statistically significant impact on the official statistics.84
This reflects a general problem with targeted queries, namely that few producers of mortality statistics can afford to query a large number of death certificates. Even with computerized standard letters, sending a query letter to the certifier and processing the reply takes time. Therefore, producers tend to only query certificates that obviously or most probably are wrong.
“Outliers”, “inliers” and statistical bias Obvious inconsistencies or extremely uncommon data values are referred to as “outliers” in literature on statistical editing techniques. For example, prostate cancer certified as the cause of death in a woman is an outlier. The stated condition is not compatible with the decedent’s sex, and it is obvious that the death certificate is not correct. However, all outliers are not errors. The value may be correct although extremely uncommon, for example cholera as a cause of death in Sweden.
Errors that are not inconsistent with other available information on the case are generally referred to as “inliers”. Hepatoma reported as the cause of death in someone who in fact had liver metastases from stomach cancer is an inlier type error. Hepatoma is a possible cause of death in anyone so the error will not be detected in checks based on diagnosis, sex and age. Unfor-tunately, inliers are far more common than outliers, and they have a far greater impact on the statistics. Since they are not obviously wrong, they also are much harder to detect.94,95
Traditional editing and querying techniques are aimed at outlier type errors and only capture obvious or probable errors.96 Death certificates that look correct, but still do not state the facts of the case accurately, escape detection. As mentioned above, between 1986 and 1987, the state of Oregon returned about 10% of death certificates to the certifiers because the infor-mation supplied appeared inadequate. In about half of these, the additional information obtained from the certifier lead to a change in the underlying
29
cause of death. This means that certificates for about 5% of all deaths were corrected. However, most studies comparing death certificates to other source data report a far higher error rate, typically between 10% and 40%.97-100 This strongly suggests that most certification errors are not obvious – and that the statistics agency will not detect them through tradi-tional data checks based on diagnosis, age and sex.
Plausibility checks - what can the statistics agencies do? The great challenge in designing editing and querying strategies for mortality statistics is how to identify the inliers, certificates that are erroneous even if they look correct. In principle, to detect and correct all inliers, those producing the statistics would have to verify every single death certificate, even those that look correct. This could be done by, for example, comparing the certificate to medical records or requesting additional infor-mation from the certifier. Clearly very few, if any, producers of official mortality statistics have the resources to do that.
One way to find inliers in mortality data might be to link death certificate data to other routinely collected data and then check for conflicts between the two data sets. In the studies that form the basis of this thesis we tried to do exactly that. We compared death certificate and hospital discharge data, and assessed to which extent differences between main hospital discharge condition and underlying cause of death are explained by differences in the ICD definitions for mortality and morbidity statistics respectively. We then checked samples of medical summaries and assessed the risk that a death certificate is defective, if there is an unexplained discrepancy between main hospital discharge condition and underlying cause of death. If such an unex-plained difference does indeed indicate a higher risk that the certificate is wrong, this would be a way of finding inliers, and statistics agencies could base a data validity check on such unexplained cases.
The concept of “underlying cause of death” – Well, what in the nation do they call it the mumps for? – Why, because it IS the mumps. That's what it starts with. – Well, ther’ ain’t no sense in it. A body might stump his toe, and take pison, and fall down the well, and break his neck, and bust his brains out, and somebody come along and ask what killed him, and some numskull up and say, ‘Why, he stumped his TOE.’ Would ther’ be any sense in that? NO.
Mark Twain, Huckleberry Finn, Chapter 28
As mentioned briefly above, defective mortality statistics cannot be blamed on physicians and coders alone. Shortcomings in the fundamental statistical

30
definitions involved also contribute to the difficulties. Especially, this concerns the concept of “underlying cause of death”.
Epidemiology rests on comparisons, for example between different points in time and between different places or environments. To allow comparisons between countries, the statistics used in the comparison must be based on an international standard. The definitions and instructions issued by the WHO in the ICD manuals is the only standard for mortality statistics that is univer-sally accepted, and all WHO member countries have pledged themselves to follow that standard.
The central concept in the WHO standard for classifying causes of death is the “underlying cause of death”. The ICD instructs certifiers how to report the underlying cause, coders how to classify it, and statisticians how to prepare and publish statistics based on it. According to the ICD definition, the underlying cause of death is “(a) the disease or injury which initiated the train of morbid events leading directly to death, or (b) the circumstances of the accident or violence which produced the fatal injury”.3,54
Two important points should be made. First, the definition implies that each death has only one underlying cause. Second, it presupposes that the train of events leading to death is clear enough to allow the certifier to iden-tify the originating cause.
Previously: Strong link between single underlying cause and death As far as can be established, the requirement to state both originating cause and complications first appears in a death certificate form introduced in the Seine prefecture, which at that time included Paris, in 1822. This form requires the certifier to specify both “the nature of the disease” and “the antecedent causes and the complications that supervened”. A death certificate form introduced in England in 1837 also makes a similar distinc-tion between “primary” and “secondary” causes of death. The idea of distin-guishing between the originating cause and its complications caught on, and in 1855 the International Statistical Congress in Paris recommended that forms distinguishing between primary and secondary causes of death be introduced internationally.101
In the early 1800s, when this early version of the “underlying cause of death” was introduced, preventing the spread of epidemic diseases was still a major public health concern. To prevent or curtail an epidemic, the authori-ties needed a well-functioning early warning system.
This was nothing new. Since 1592, the London authorities had compiled figures on the numbers of burials, and classified the deaths in two groups: plague and death from other causes. As observed by William Graunt in 1662, “the occasion of keeping the accompt of burials arose first from the
31
plague”.101 The scope was soon extended, but Wargentin, writing in 1755, recognized the need to discover and prevent outbreaks of plague and other epidemics as one of the major benefits of mortality reports: “contagious diseases are often fully forestalled or subdued in time, through wholesome measures, as in all well-governed countries has now been done against the plague”.5
The wish to collect information on the underlying cause of death should be seen against this background. To get an early alert of an epidemic outbreak, it was important to have the cause of death clearly certified as due to the epidemic disease itself rather than as due to one or another of the complications, which generally are not sufficiently differentiating. For example, a victim of cholera will suffer from massive diarrhea. If untreated, the diarrhea leads to severe dehydration because of the massive fluid loss. The dehydration causes hypotension, which may bring about a circulatory failure that kills the patient. If causes of death reported on death certificates are to function as an early alert system, it is extremely important that such a death is certified as due to cholera, and not as due to dehydration or circula-tory failure.*
Current situation: Increasingly complex causes of death Although the underlying cause concept is clear enough in cases of epidemic diseases, it is often difficult to apply when the death is the result of several etiologically independent conditions, or if the death results from a protracted process where the causal link between the underlying cause and its compli-cations is not immediately evident. To deal with such cases the US Bureau of the Census in 1914 compiled an Index of Joint Causes of Death. The sheer bulk of the Index – 308 pages – testifies to the complexity of the problem.104
As has been pointed out repeatedly, the concept of underlying cause of death is even more problematic today.1,105-109 As Rosenberg says, “[b]efore the twentieth century ... the link between serious illness and death was a strong one”. The link between the underlying cause and the final complica-tion was usually clear, and mortality statistics based on the underlying cause supplied sufficient information on the most serious public health problems. 1
In the developed world this has changed, however, and causes of death are now not as clear-cut as they used to be. This is partly because far more
* In this context, it is interesting to note that in some countries the authorities have now re-discovered mortality statistics as a tool for monitoring unexpected threats to public health. A dramatic illustration is the August 2003 heat wave in France, which is estimated to have caused the death of almost 15 000 people.102 In 2003 the French mortality statistics were delayed and the authorities did not discover the increase in deaths until the funeral directors complained to the press that they were running out of coffins. After the disaster, the French mortality statistics got funding for a major project on electronic death certification.103 This will provide a far better early warning system.

32
people survive to an advanced age and finally die from “an accumulation of diseases” rather than from one single cause.1 Selecting one of them as the principal cause of death might appear as falsifying the truth. Moreover, the dividing line between disease and health is not as clear as before. White, writing on Alzheimer’s disease, describes this change. “Diseases and causes of death used to be relatively unambiguous: myocardial infarction, stroke, and cancer were easy to identify and name as our most important enemies. With such enemies our goal was clear: to organize and expand medical knowledge and practice so as to minimize premature mortality and suffering, with everyone ultimately dying a ‘natural’ death. Today, however, the line between what is natural and what is disease has been made ambiguous by improvements in medical diagnosis and our growing sophistication regard-ing ageing and the pathogenesis of disease.”106
In the opinion of those that are interested in the total burden on society of a particular disease, statistics based on a single cause per each death system-atically “underestimates” the impact of many conditions present at death. Although some underlying causes, such as myocardial infarction, are good measures of “prevalence at death”,110 others, and in particular chronic condi-tions, are often left out from the death certificate altogether.111 Therefore, calculations of the burden of disease based on underlying cause data often do not show the full impact on public health of such chronic diseases.30
A further difficulty with the traditional underlying cause is that, because of advances in diagnostics and therapy, the train of events from the origi-nating cause to the final fatal complication is now far longer and more complex than in most deaths in the early 1800s. As is evident from discus-sions in the international e-mail forum for mortality classification issues73 and the issues dealt with by the international Mortality Reference Group,112 the underlying cause might be something that occurred 20 or 30 years ago, or even more. For example, a woman might have had surgery for ovary cancer 30 years ago, the surgery might have caused intestinal adhesions, and she might have gone through several episodes of intestinal obstruction. Finally, she dies in postsurgical heart failure after yet another episode of intestinal strangulation. According to the ICD selection rules, the underlying cause is ovary cancer since that condition started the train of events that finally lead to her death. A clinician who feels that it does not make much sense to blame the death on a cancer that was successfully removed decades ago certainly has a point. From a preventive or public health perspective as well, it would appear more useful to record a condition that is still operative or amenable.113,114
As was illustrated by a debate recently published in the Bulletin of the World Health Organization, even experienced users of mortality data do not always understand the difficulties in clearly identifying a single underlying cause of death in complex cases. WHO staff had evaluated the “quality” of official mortality statistics in countries that report mortality data to the WHO

33
by calculating the percentage of deaths attributed to less specific causes.115 The author of this thesis and 11 other statisticians involved in production of mortality statistics objected. We argued, among other things, that the evaluation did not take the effect of an ageing population into account. 116 Forcing certifiers always to assign a “good” underlying cause, such as myocardial infarction or a well-defined malignant neoplasm, might result in statistics that look good on the page. However, for many deaths in the elderly there is no obvious underlying cause, and vague statements such as “old age” or “general weakness” might in fact be closer to the truth. Thus, in developed countries with a long life expectancy a high number of less specific underlying causes might rather point at a difficulty with the under-lying cause concept itself than with the data.
The purpose and intended use of mortality data are not clearly identified in the ICD, except that a general preventive purpose is mentioned in passing when the concept of “underlying cause” is introduced. Through the succes-sive ICD revisions from the sixth revision onwards, the WHO has tried to respond to the changing demands on mortality statistics by introducing exceptions to the underlying cause principle. The ICD code selected for statistical tabulation might express a more advanced stage of the underlying condition or a combination of several conditions, and some conditions are highlighted at the expense of others. In ICD-10, for example, HIV is selected as underlying cause even if the infection was caused by a blood transfusion for haemophilia. The result of such exceptions to the main idea of underlying cause is a discrepancy between the definition of underlying cause and what the statistical tables actually contain. This does not contribute to the clarity of the “underlying cause” concept. Moreover, the fundamental difficulty, the assumption that each death is due to a single and easily identifiable under-lying cause and that this cause is the medically most relevant, remains unsolved.28
The “underlying cause” concept - what could be done? In spite of the difficulties besetting the traditional underlying cause, few attempts have been made at developing alternative methods of routine tabu-lation of causes of death. Statistical presentation and analysis are far easier to perform if the statistics are based on one principal cause of death per person than if several causes have to be weighted into a compound measure. More-over, many countries have produced statistics based on the underlying cause of death for almost a century, and long time series are of great value in epidemiological research. It should also be noted that the traditional under-lying cause is still useful in many third world countries, who now find them-selves in a public health situation similar to what Europe had in the early 1800s. Therefore, it is hardly feasible or advisable to replace the underlying cause with a completely different statistical measure. Yet, supplementary
34
statistics based on clinical relevance would add to the usefulness of mortality statistics in developed countries.
Contents and focus of mortality statistics - which is the most useful statistic? The WHO has now launched the process that will lead to the eleventh revi-sion of ICD,117 which will be an excellent opportunity to thoroughly discuss the purpose and usefulness of mortality statistics, and which statistics to collect.
To improve the quality and usefulness of mortality data, the WHO first needs to decide what to focus on. Mortality statistics should not be seen as an epidemiological maid of all work, but should focus on those aspects where causes of death can have a clear and reliable function. There are several alternatives, such as avoidable causes of death, deaths in younger people, specific causes of death in the elderly that might indicate poor senior care quality, complications of medical care or causes of death that in a specific setting are amenable to therapy. Each of these would require differ-ent approaches to data collection and classification of cause of death. There-fore, solving the issue of what mortality statistics are for is an urgent priority for ICD-11.
Avoidable causes? The study of “avoidable causes”, causes of death for which efficient prophylactic or therapeutic measures are available, has a long tradition in mortality statistics. Although the term has been used to refer to different sets of conditions,118 important efforts have been made towards standardizing methods and interpretations.119
As pointed out earlier, the main concepts underlying official mortality statistics, “sequence” and “underlying cause of death”, were developed in an era when monitoring the occurrence and spread of epidemic diseases were major concerns. However, the underlying cause concept works well for other kinds of untimely deaths as well, and some findings indicate that data on premature deaths are more reliable than data on other deaths occurring at higher ages. For example, Lahti and Penttila noted that Finnish death certifi-cates for people in the 35–64 age span require fewer queries to the certifiers than deaths in the elderly.84 Producers of mortality statistics might want to pay special attention to deaths that might have been avoidable, and make sure that they have been correctly certified and classified.
35
Causes amenable to therapy? As mentioned above, the concept of underlying cause of death might not be as clinically relevant as it used to be. In contemporary medicine, it might be easier to prevent a fatal complication than the underlying cause itself. Pulmonary embolism in pregnancy is a case in point. Preventing all preg-nancies is neither feasible nor desirable, but preventing pulmonary embo-lisms certainly is.113,114
Statistics on avoidable causes are generally derived from statistics on underlying causes. This means that the limitations of traditional underlying cause statistics also carry over to statistics on avoidable causes, for example that the attention is directed to the first step in the train of events leading to death, and tends to ignore what could have been done at a later stage to prevent or treat fatal complications. It is significant that the current Swedish list of avoidable causes, which is based on the Eurostat Atlas of avoidable mortality, does not include common but often preventable complications, such as pneumonia, pulmonary embolism and urinary tract infection.47 However, if the ultimate purpose of mortality statistics is to reduce the number of untimely deaths, that goal might be easier to reach if, in addition to statistics on the underlying cause, we also had statistics on complications amenable to clinical intervention.120
What is amenable varies with the practical circumstances, however. Optimal health care is not available to everyone and everywhere. To prevent deaths that are unnecessary in a particular setting, one has to define “amena-ble” according to the resources available in that particular setting. Therefore, what is the most practical and efficient strategy in a developed country with advanced health care will be different from what can be done in a developing country with more basic health amenities.
Since a list of amenable causes of death will vary with geographical region, social class and point in time, statistical comparisons will be both risky and complicated. However, such supplementary statistics on amenable causes would add considerably to the usefulness of mortality statistics.
In this context special attention should be given to errors in medical procedures. It is well known that mistakes in and complications of medical care are often left out from death certificates.121,122 Persuading certifiers to report mistakes and procedural accidents more openly would be an important step towards improved patient safety and would also reduce the number of untimely deaths.

36
Different understandings of quality
Contrasting quality assessments Researchers have judged the quality of mortality statistics very differently, and their verdicts range from “good” to “completely useless”. For example, Nyström et al found that for breast cancer, the relative risk estimates based on the official Swedish mortality statistics were very close to those based on the classification of an independent endpoint committee, and concluded that data from the Swedish mortality register “can be safely used for evaluation of Swedish screening trials of breast cancer”.123 Gjersø et al, when evaluat-ing death certificates from a department of internal medicine, arrived at the diametrically opposite conclusion that “the reproducibility of diagnoses on death certificates is so poor that information from the [Danish] Registry of Causes of Death is of little use for administrative or scientific purposes”.8
Nyström assessed the accuracy of one single malignancy as the cause of death, whereas Gjersø tested the variability of cause of death statements in the very complex field of internal medicine. These differing approaches explain their conflicting assessments of the accuracy of mortality data. As Sørensen et al point out, the importance of various quality issues – notably completeness, accuracy, detail, accessibility – depends on the use of the data. Users of administrative data always have to evaluate whether the data meet their requirements,31 and mortality data is no exception.
In particular, mortality data should not be used for purposes they were never intended for. For example, mortality statistics are supposed to reflect causes of death, not disease prevalence at death. However, Goldacre found it necessary to remind users of mortality data that one reason why a hospital condition is not reported on the death certificate might be that this condition was not a cause of death.30 Similarly, Chow and Devesa, writing on urinary tract cancer, make the very sensible observation that “...when the death certificate is used as the only source of case ascertainment ... a large propor-tion of cancer patients may be missed, notably those who survived”.124
Required level of detail Mortality statistics are not suitable for studies requiring very detailed infor-mation, especially if the piece of information sought is not the underlying cause.125 Opinions differ on the degree of accuracy required. For example, when assessing mortality in ischemic heart disease in the Framingham Heart Study, Lenfant, Friedman and Thom found mortality data sufficiently correct.126 In contrast, in a review of validity studies for cardiovascular disease (CVD), Smith, Scott and Wagner were not impressed by the reliability of death certificate data: “There is an urgent need to reassess the
37
current dependence on death certificates and other inadequate sources of CVD incidence.”36 Lauer et al also argue that the quality of diagnostic information available from routine data sources is so poor that “clinical investigators should rely on all-cause death as an objective, unbiased end point” rather than on cause-specific mortality, since “determination of cause of death is inherently difficult owing to the presence of concurrent co-morbid illnesses, a low autopsy rate and an inadequate understanding of complex disease processes”.127 It is important to remember, of course, that the quality needed depends on the purpose of the study. Thus, Tabar et al strongly argue that cause-specific mortality data should be used in cancer screening trials. Cancer mortality data are good enough, and using all-cause mortality as the end point would dilute the findings.128
“Underestimation” As noted above, mortality statistics are not intended to describe disease prevalence at death. Therefore, if mortality data are used to assess the total burden on society of a particular condition, this will result in underesti-mation. Many people die with several diseases, but in official mortality statistics only one of them counts as the underlying cause of death. The inevitable consequence is underestimation, especially if the analysis is not extended to the multiple causes of death.30
However, including multiple causes in the analysis might not always help. Some users of mortality data expect official mortality statistics to reflect the total burden of disease at death, whether the condition contributed to the death or not, and there are far more publications on underreporting than on overreporting. Thus, a PubMed search on 25 April 2007 returned 405 hits for the combination “cause of death” and “underreported” or “underestimated”, but only 106 hits for “cause of death” and “overreported” or “overesti-mated”.
A paper on mentions of diabetes on death certificates provides an exam-ple of such a “total burden” expectations on mortality statistics. The paper considers it an error that diabetes is left out from 64% of death certificates for people with a diagnosed diabetes.129 The authors do not discuss the possibility that although diabetes might have been present at death, it still was not a cause of death. Some authors go further and argue that a specific disease, if present, should always count as the underlying cause of death. For example, in a study on underestimation of mortality due to chronic obstruc-tive pulmonary disease (COPD), the authors maintain that if COPD has been reported as contributory cause of death and heart disease as underlying cause, this is generally wrong and COPD should have been reported as underlying cause.130
Varying opinions on what should count as a cause of death lead to differ-ent assessments of how serious the presumed underreporting is. According to

38
a Swedish study on certified cause of death in known alcoholics, alcohol is underreported in more than 40% of deaths, 21.8% as underlying cause and 19.8% as contributory cause.131 In contrast, Daula and Hanzlick state that alcohol is often omitted as a risk factor, but not when it has a direct relation-ship with the cause of death.132
A further illustration of the impact of the individual researchers’ focus of interest is provided by two studies involving diabetes and cardiovascular disease. In an Australian study the authors lament that in 1948 the WHO decided to introduce the concept of underlying cause of death. Until then, the statistics office had applied priority lists for deaths when the certificate mentioned more than one cause of death. After the introduction of the underlying cause concept, the statistics office would instead select the cause of death indicated by the physician as the starting point of the train of events leading to death. This, in the opinion of the authors, meant that diabetes as a cause of death was “arbitrarily downgraded”, since diabetes had a high priority according to the priority lists but was more seldom indicated as the underlying cause of death by the certifiers.17 The reader might think that classification practices based on priority tables are even more arbitrary than following the physician’s statement, but the authors argue forcefully that physicians often miss the link between diabetes and other conditions. Espe-cially, they believe that cardiovascular diseases in a diabetic should always be reported as due to diabetes. Failure to do so, they maintain, means under-reporting of diabetes. This is not the view of Luepker, who in a study of cardiovascular diseases among Mexican Americans considers it an error that cardiovascular deaths are sometimes certified as due to diabetes. This, in his opinion, means that cardiovascular deaths are underreported.133
The impact of making a distinction between “dying with” and “dying from” a condition is also clearly illustrated by two studies on hip fracture mortality. In one British study the authors recalculated mortality SMRs assuming that the hip fracture was the underlying cause of death in every case of death within two years after admission to hospital for hip fracture. In Britain, SMRs derived from death certificate data are used in resource allo-cation, and the revised SMRs would have increased hospital revenue by 2 million pounds.71 However, according to another British study, the “true” mortality of hip fractures is about 15%, which would have given a far lower estimate of increased hospital revenue.134
It should be strongly emphasized that mortality statistics are supposed to show what people die from, and not prevalence of disease at death. From the Sixth Revision of the ICD, published in 1948, the international rules and guidelines on the compilation, classification and dissemination of mortality statistics have been based on the concept of underlying cause of death, which means that causes of death are classified according to their importance in the individual case, and not according to a set order of priorities.135 Apparently this message is hard to get through to the data users.

39
Analyses based on multiple causes of death As stated in the previous section, underlying cause statistics only record one cause of death per person, and this inevitable leads to underreporting of conditions present at death. However, several interesting examples show that multiple causes (all conditions reported on the death certificate and not just the underlying cause) can be used to avoid shortcomings and biases in statistics based on underlying cause alone.
Multiple causes of death have many uses. Fuhrman et al used multiple cause data to analyse trends in mortality from chronic obstructive pulmonary diseases at death. This yielded a far better estimate than the underlying cause alone since a chronic condition such as chronic obstructive pulmonary disease is often reported as a contributory cause of death rather than as underlying cause.136 Gittlesohn and Senning showed how multiple causes can be used to get a better picture of deaths occurring in connection with surgery.29 Lindahl and the author of this thesis used multiple causes to screen for changes in underlying cause selection practices.88 Like Goldacre et al, who applied a similar method,137,138 we found that statistics based on multiple causes may show a completely different trend from statistics based on the underlying cause alone. This is because the underlying cause is susceptible to changes in WHO rules for selecting the underlying cause of death, but the multiple causes are not influenced by any selection rules.
Using multiple causes does not always have such a dramatic impact, however. Jougla et al, when analysing the impact of competing causes of death of suicide statistics, found that although suicide levels increased when multiple causes were taken into account, trends over time and ranking between geographical areas remained more or less the same.139 Similarly, Westerling in an analysis of small-area mortality for asthma, diabetes, hypertension and cerebrovascular disease, compared results based on underlying cause to those based on multiple cause data. He found few differences in the main results although the multiple causes contributed to more stable estimates.140
Multiple causes of death have their pitfalls, and reporting of multiple causes on the death certificate varies with, among other things, race, sex, place of death and how the body was disposed of.141 The multiple conditions themselves also have an impact, and some are more likely to be reported on the death certificates than others.48 For example, chronic diseases tend to be excluded from certificates, especially if the cause of death was something acute or dramatic,142 or if the certifier was not familiar with the patient’s medical history.111,143

40
Multiple causes of death: Towards a standardized approach To some extent the shortcomings of mortality statistics based on a single underlying cause can be addressed by wider use of multiple causes of death. Multiple cause data have their own difficulties, however. There is no inter-nationals standard for reporting, coding and classification of multiple causes of death since the ICD definitions and instructions do not cover multiple causes. Moreover, routine tabulation of multiple causes of death is more difficult than tabulation of a single underlying cause. For example, both Redelings, Wise and Sorvillo108 and d’Amico et al discuss methods for using multiple causes when studying selected conditions, but not for standard tabulation. 109 This reflects both the main advantage and the main weakness of multiple causes of death: multiple causes greatly improve statistical analysis of selected conditions, but are difficult to use in overview tabula-tions of all causes of death. Statistics based on the underlying cause have the very great advantage of providing an instantly comprehensible picture of the distribution of causes of death.
Newens, Forster and Kay suggest that chronic conditions present at death should always be included in the death certificate, whether the physician believed that they contributed to the death or not.107 Implementing such a recommendation would require a change to the international form of the medical certificate of death. Moreover, some users of mortality data might not be enthusiastic about the idea of including conditions that are not causes of death on the death certificate. Using other data sources, such as medical records or follow-back inquiries to the certifying physician, might be a better way of assessing the impact of chronic diseases with a low fatality rate.
The ICD guidelines are extremely vague on contributory causes, and both the international death certificate form and the coding and classification instructions need further development in that respect. Further, fairly little has been written on the use of multiple causes in standard tabulation. Although some work has been done,144 more method development is needed.
More research is also needed to assess whether register linkage could be used to improve the reporting of multiple causes of death.
Linking hospital and death certificate data
Main hospital discharge condition and underlying cause of death Several studies have linked hospital data to death certificates. For example, Goldacre used data from the Oxford linkage study to analyse differences between hospital diagnosis and certified cause of death,30 and Gittelsohn and Senning, working on Vermont data, suggested that sources of discrepancies
41
be investigated.29 Most comparisons between hospital and death certificate data are based on main hospital discharge condition and underlying cause of death.
Main hospital discharge condition, which is reported by the hospital to the hospital discharge register, is defined in the ICD as “the main condition treated or investigated during the relevant episode”. In contrast, the under-lying cause of death, which is derived from the death certificate, is defined by the ICD as “(a) the disease or injury which initiated the train of morbid events leading directly to death, or (b) the circumstances of the accident or violence which produced the fatal injury”.3,54 The ICD prescribes different procedures for coding and classifying these two conditions.
ICD-9 was the first revision of the ICD that included rules for classifying morbidity. The morbidity classification rules, while still rather rudimentary, include a definition of main condition and some rules for selecting the main condition. Thus, if no diagnosis is made, the main symptom investigated is selected as the main condition. If several conditions have been treated during the relevant spell of care, the condition consuming the greater amount of medical resources is selected. A minor, longstanding or incidental condition should not be recorded as main condition if a more significant condition is present and is more relevant to the specialty that cared for the patient. Symptoms should not be recorded as the main condition but rather the condition that caused the symptom. Less specific descriptions should be avoided.
In contrast to the rudimentary rules for coding and classifying morbidity, the ICD rules for selecting and classifying the underlying cause of death have evolved over the better part of a century. They are now very detailed and, in their application, complex. Sometimes they even appear to be incon-sistent.
When selecting the underlying cause of death, the coder is instructed to first identify the condition that initiated the train of events leading to death. Second, the coder is to check whether any particular instructions apply to this particular case and whether that might change the underlying cause of death. Such instructions typically have the effect that either a specific mani-festation of the originating cause is selected as underlying cause of death, or that the originating cause is combined with another condition mentioned on the certificate and classified to a category for that specific combination.
For example, a patient with an ongoing alcohol problem who develops an alcohol-induced liver cirrhosis is classified to alcoholic liver cirrhosis, which is a specific complication of alcoholism (ICD-9 571.2). An example of a combination category is “diseases of mitral and aortic valves” (ICD-9 396). According to an instruction on classification of cardiac valvular conditions, a patient with mitral valve stenosis who also has an aortic valve condition is classified to the combination category 396.
42
Relationships between main hospital discharge condition and underlying cause of death Even for patients that die at hospital, the underlying cause of death some-times differs from the main hospital discharge condition. Such a difference might indicate that either the underlying cause or the main discharge condi-tion is wrong. However, the disparity may be fully explainable, and both underlying cause and hospital discharge condition may be correct, even though they are not the same.
An important difference between morbidity and mortality classification rules is that the mortality rules try to trace the sequence of events back to the originating cause, while the morbidity rules are concerned with the condi-tions treated during the current episode of care. For example: A man is immobilized due to a spinal injury sustained in a car crash. For several years he is cared for at a nursing home. Finally he develops a massive urinary tract infection due to his inlaying catheter. He is admitted to hospital with a severe urinary sepsis. Antibiotic therapy has no effect, and the patient dies.
According to the rules for classification of mortality the car crash is the underlying cause of death since the accident initiated the train of events leading to death. However, according to the morbidity rules, the urinary sepsis is the main hospital discharge condition since this is the main condi-tion treated during the relevant episode of care.
Because of this difference of focus, underlying cause of death and main hospital condition may be different, but still both correct. However, a closer analysis of the relationship between the underlying cause stated on the death certificate and the main condition reported to the hospital discharge register may reveal incompatibilities that cannot be explained by differences between mortality and morbidity classification rules. Such unexplainable differences may indicate that either the underlying cause or the main hospital condition is wrong.
An overview of the various relationships between stated underlying cause and reported main hospital condition, and in which cases a difference might indicate erroneous death certification, is given in Table 2 and the list below.
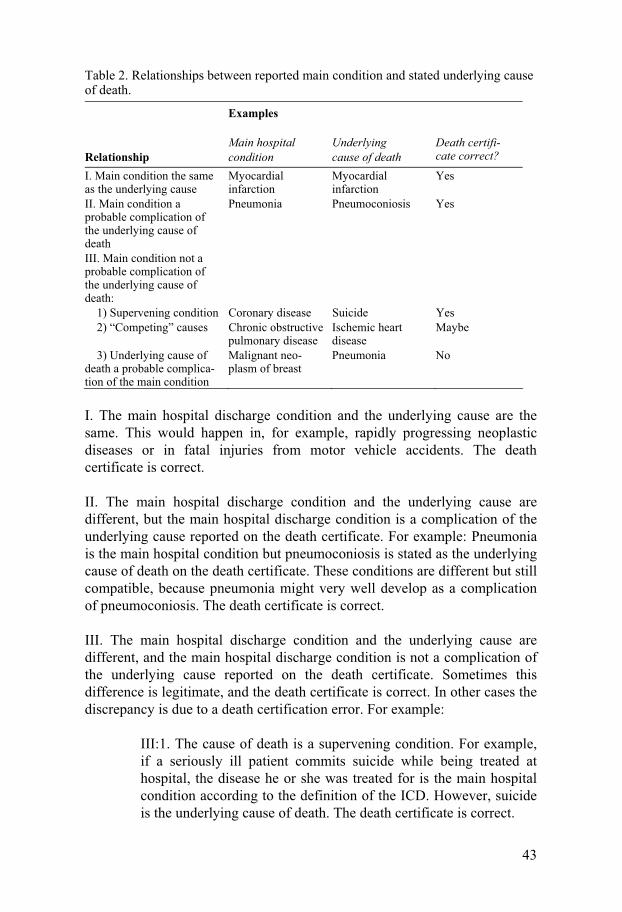
43
Table 2. Relationships between reported main condition and stated underlying cause of death.
Relationship
Examples Main hospital condition
Underlying cause of death
Death certifi-cate correct?
I. Main condition the same as the underlying cause
Myocardial infarction
Myocardial infarction
Yes
II. Main condition a probable complication of the underlying cause of death
Pneumonia Pneumoconiosis Yes
III. Main condition not a probable complication of the underlying cause of death:
1) Supervening condition Coronary disease Suicide Yes 2) “Competing” causes Chronic obstructive
pulmonary disease Ischemic heart disease
Maybe
3) Underlying cause of death a probable complica-tion of the main condition
Malignant neo-plasm of breast
Pneumonia No
I. The main hospital discharge condition and the underlying cause are the same. This would happen in, for example, rapidly progressing neoplastic diseases or in fatal injuries from motor vehicle accidents. The death certificate is correct. II. The main hospital discharge condition and the underlying cause are different, but the main hospital discharge condition is a complication of the underlying cause reported on the death certificate. For example: Pneumonia is the main hospital condition but pneumoconiosis is stated as the underlying cause of death on the death certificate. These conditions are different but still compatible, because pneumonia might very well develop as a complication of pneumoconiosis. The death certificate is correct.
III. The main hospital discharge condition and the underlying cause are different, and the main hospital discharge condition is not a complication of the underlying cause reported on the death certificate. Sometimes this difference is legitimate, and the death certificate is correct. In other cases the discrepancy is due to a death certification error. For example:
III:1. The cause of death is a supervening condition. For example, if a seriously ill patient commits suicide while being treated at hospital, the disease he or she was treated for is the main hospital condition according to the definition of the ICD. However, suicide is the underlying cause of death. The death certificate is correct.

44
III:2. The cause of death and the main hospital condition are “competing” causes. A patient might suffer from several conditions, and die from the consequences of one of them while being treated for another. For example, if someone with an advanced ischemic heart disease also suffers from a serious chronic obstructive pulmonary disease, it is a moot point if the death was caused by ischemic heart disease or chronic pulmonary disease. The death certificate might or might not be correct.
III:3. The cause of death is a complication of the main hospital discharge condition. For example, a patient with an advanced breast cancer is admitted for terminal care. After two weeks she develops a pneumonia and dies a few days later. The hospital discharge condition is breast cancer. The physician certifying the death states pneumonia as the cause of death. The death certificate is incorrect, and the physician should have reported breast cancer as the condition causing the pneumonia.
When scanning for possibly incorrect death certificates, deaths where the underlying cause and main condition are the same (type I) and where the main condition is a probable complication of the underlying cause (type II) could be presumed correct and need not be further investigated. In theory, the same is true also when the death is due to a supervening condition (type III:1). However, although the distinction between III:1, III:2 and III:3 is clear in theory, it is often difficult to decide whether the death certificate is correct by just looking at the ICD codes for main condition and underlying cause. Therefore, when scanning for possibly incorrect death certificates, all deaths of type III should be included. How we solved this from the technical point of view is described in more detail in the Material and Methods section.
Aim of the thesis The usefulness of mortality statistics in research, prevention, monitoring of public health and follow-up of health care interventions is dependent on accurate death certification and the ability of those involved in the produc-tion of mortality statistics to detect and correct certification errors. Data edits are routinely applied by most statistics agencies. Traditional edits, however, detect obvious or probable errors, such as extremely rare conditions or inconsistencies between reported condition and the decedent’s age and sex, but they do not capture non-evident certification errors. The aim of this thesis is to assess whether an apparent inconsistency between reported cause

45
of death and the patient’s last main hospital discharge condition is a useful indicator of inaccurate cause-of-death certification. If it is, an additional data editing process could be developed that covers non-obvious errors as well.
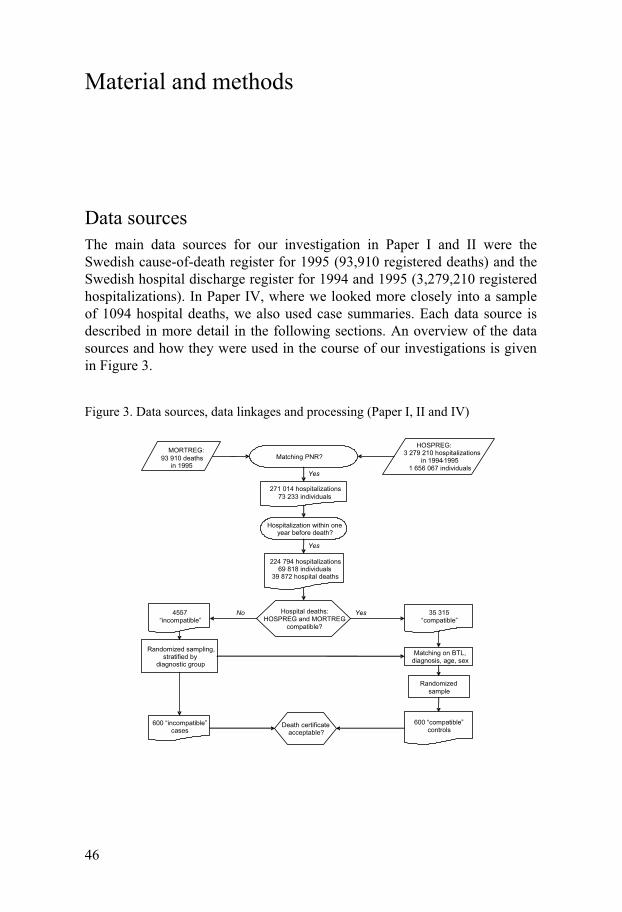
46
Material and methods
Data sources The main data sources for our investigation in Paper I and II were the Swedish cause-of-death register for 1995 (93,910 registered deaths) and the Swedish hospital discharge register for 1994 and 1995 (3,279,210 registered hospitalizations). In Paper IV, where we looked more closely into a sample of 1094 hospital deaths, we also used case summaries. Each data source is described in more detail in the following sections. An overview of the data sources and how they were used in the course of our investigations is given in Figure 3.
Figure 3. Data sources, data linkages and processing (Paper I, II and IV)
MORTREG:93 910 deaths
in 1995
HOSPREG: 3 279 210 hospitalizations
in 1994-19951 656 067 individuals
Hospitalization within one year before death?
271 014 hospitalizations73 233 individuals
224 794 hospitalizations69 818 individuals
39 872 hospital deaths
4557“incompatible”
Randomized sampling,stratified by
diagnostic group
Randomized sample
Matching on BTL,diagnosis, age, sex
600 “incompatible” cases
600 “compatible” controls
No Yes
Yes
Yes
Matching PNR?
Hospital deaths:HOSPREG and MORTREG
compatible? 35 315
“compatible”
Death certificate acceptable?
47
Data linkage through the Swedish Personal Identification Number We linked data from the three sources by the personal identification number (PNR). The PNR is unique to each Swedish resident. It is administered by the National Tax Board and assigned either at birth or, for immigrants, when they are granted residence permit. With very rare exceptions, such as a sex change or when a complete change of identity is necessary for reasons of personal security, the PNR remains unchanged throughout the individual’s lifetime.
The PNR consists of date of birth plus a four-digit birth registration number. The second last digit also indicates the sex of the individual, and is even for women and odd for men. The last digit of the PNR is a check digit, which is calculated from both date of birth and birth registration number.
The PNR is widely used in Sweden, both by the authorities and by private service providers. Linking data at the individual level is thus technically easy although the Personal Data Act places severe restrictions on the use of data linkage. In principle, all data linkage involving live subjects requires informed consent from the individuals involved, except for such purposes that are expressly specified in the Act. Deceased individuals are not covered by the Personal Data Act, but even so register data on deceased people, for example from the cause-of-death and hospital discharge registers, can only be used for research purposes or to produce statistics.
The Cause-of-Death Register Sweden has produced national mortality statistics since 1749. Data on indi-vidual deaths are available in computerized form from 1952 onwards. The National Board of Health and Welfare has been in charge of the statistics since 1994 although the annual cause-of-death data sets were prepared by Statistics Sweden till 2001. From 2002, the annual files have been produced by the Board of Health and Welfare.47
Under Swedish law, the physician attending or confirming a death must report the event to the National Tax Board “without delay”. This report does not state the cause of death. The Tax Board then registers the death in the national population register, and also forwards a notification to Statistics Sweden, which keeps a copy of the national population register.
A medical certificate of death must be sent to the Board of Health and Welfare within three weeks. The responsibility for this lies with the physi-cian who reported the death to the Tax Board. Another physician who knows the case better can be asked to certify the death, but the physician who reported the death still has to ensure that a death certificate has been issued.
The cause-of-death register (MORTREG) covers all deaths of Swedish residents, whether occurring in Sweden or abroad. The Board of Health and
48
Welfare routinely checks the completeness of the MORTREG against the deaths reported to the national population register. If the national population register has been notified of a death but the Board of Health and Welfare has not received a corresponding death certificate, the Board requests a death certificate from the physician who notified the national population register of the death. This ensures a very high coverage, and in 1995 the Board obtained death certificates for 99.7% of all deaths occurring in that year.145
The computerized register has one record for each death. The demo-graphic data (personal identification number, date of death, age, sex, civil status, place of residence, nationality, country of birth) are lifted from the national population register. The medical information (all causes of death, underlying cause of death, main injury, autopsy, clinical examination or other diagnostic method for establishing the cause of death) is taken from the death certificate. Causes of death are checked, coded and classified centrally by the Registry’s staff. If the medical data are incomplete, the Board asks the certifier to provide the missing information. In 1995, the Registry used the international (English) version of ICD-9.54 The record format allowed a maximum of 33 causes of death for each individual.145
The Hospital Discharge Register The Hospital Discharge Register (HOSPREG) covers all hospital discharges from 1987 onwards. HOSPREG has one record for each spell of care. The data are collected first at county level by the regional health administrative authorities, who then deliver the data to the Board of Health and Welfare once a year. According to the Board’s estimates, about 99% of all public hospitalizations are included in HOSPREG. In 1995, discharges from private hospitals were not included, but since Sweden had very few private providers of inpatient care, the vast majority of hospitalizations were still covered.146,147
In contrast to MORTREG, the diagnostic information in HOSPREG is coded and classified locally at each hospital, generally by the physician who discharged the patient. The hospitals use a Swedish adaptation of the ICD, prepared by the Board of Health and Welfare.148
The 1995 register included personal identification number, identification of hospital and department, date of admission and discharge, type of discharge (to other hospital or department, to assisted living, to other type of habitation, deceased), main diagnosis, up to five secondary diagnoses, external cause code in cases of injury or poisoning, and up to six codes for surgical procedures, coded according to the Swedish Classification of Surgical Procedures.146,149
49
Case summaries When a patient is released from a Swedish hospital, the physician in charge of the patient is required to write a case summary which is then added to the patient’s medical records. Typically, a case summary covers one or two pages, in which the attending physician describes the patient’s previous medical history, cause of the current hospitalization, examinations, findings, treatments, the course of events and the final outcome. Generally, the summary also states the main and additional discharge conditions, and thus forms the basis of the hospital’s reporting to HOSPREG.
The project data base Our investigation would require many comparisons between MORTREG and HOSPREG data. We used the Paradox data base manager (version 4.5) and the associated programming language PAL to create a project data base that would allow us both easy access to individual records and to link data from the two registers by the personal identification number.
The project data base included mortality and hospital discharge informa-tion on all deaths in 1995 where the decedent had been hospitalized within one year before death. To create the data base we first extracted all personal identification numbers from the 1995 MORTREG. We then obtained all HOSPREG records for 1994 and 1995 with personal identification numbers matching those extracted from MORTREG.
Some editing was necessary before we could enter HOSPREG data into the project data base. For example, we eliminated duplicates from HOSP-REG and also discarded records with a discharge date earlier than one year before death, or where the discharge date was either missing or clearly incor-rect. We also assigned sequence numbers to the hospitalizations to individuals that had been hospitalized more than once during their last year of life, so that we could easily identify the last spell of care. All analyses included in Paper I, II and IV were based on the last spell of care.
The Swedish adaptation of ICD-9 used in HOSPREG did not completely follow the English original. For example, the fourth character is a digit in the original, but a letter in the Swedish adaptation, and for a few codes in the Swedish version there is no equivalent in the English original. As far as possible, we converted the Swedish ICD codes into codes of the English ICD-9. To facilitate code comparisons at a broader level, we also assigned codes according to the ICD-9 Basic Tabulation List (BTL) and ICD chapter codes.
The BTL is a shortlist of about 230 diagnostic groups, which corresponds fairly well to the level of detail at which mortality statistics are generally used. The BTL as published in Volume 1 of ICD-9 does not include all detail
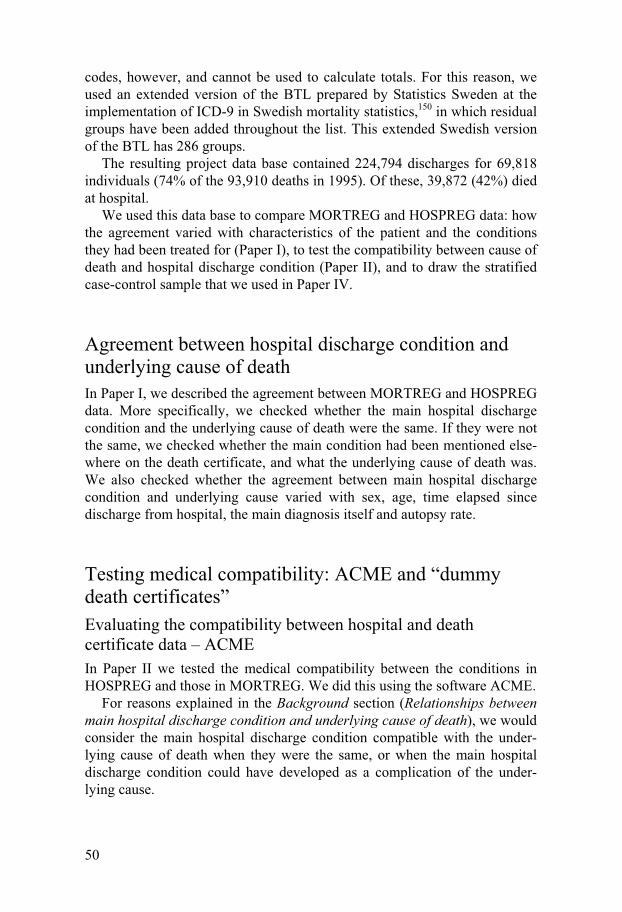
50
codes, however, and cannot be used to calculate totals. For this reason, we used an extended version of the BTL prepared by Statistics Sweden at the implementation of ICD-9 in Swedish mortality statistics,150 in which residual groups have been added throughout the list. This extended Swedish version of the BTL has 286 groups.
The resulting project data base contained 224,794 discharges for 69,818 individuals (74% of the 93,910 deaths in 1995). Of these, 39,872 (42%) died at hospital.
We used this data base to compare MORTREG and HOSPREG data: how the agreement varied with characteristics of the patient and the conditions they had been treated for (Paper I), to test the compatibility between cause of death and hospital discharge condition (Paper II), and to draw the stratified case-control sample that we used in Paper IV.
Agreement between hospital discharge condition and underlying cause of death In Paper I, we described the agreement between MORTREG and HOSPREG data. More specifically, we checked whether the main hospital discharge condition and the underlying cause of death were the same. If they were not the same, we checked whether the main condition had been mentioned else-where on the death certificate, and what the underlying cause of death was. We also checked whether the agreement between main hospital discharge condition and underlying cause varied with sex, age, time elapsed since discharge from hospital, the main diagnosis itself and autopsy rate.
Testing medical compatibility: ACME and “dummy death certificates” Evaluating the compatibility between hospital and death certificate data – ACME In Paper II we tested the medical compatibility between the conditions in HOSPREG and those in MORTREG. We did this using the software ACME.
For reasons explained in the Background section (Relationships between main hospital discharge condition and underlying cause of death), we would consider the main hospital discharge condition compatible with the under-lying cause of death when they were the same, or when the main hospital discharge condition could have developed as a complication of the under-lying cause.

51
There were two reasons why we wanted a computerized assessment of the compatibility between the underlying cause of death and the main hospital discharge condition. First, the sheer number of cases – 39,872 deaths – precluded a manual review. Second, many published assessments of death certificates show conflicting results that very likely are due to nothing more than differences in opinion between different reviewers.151-153 By using an internationally recognized software, we would get an “objective” assessment of the relationship.
ACME (Automated Classification of Medical Entities) is a software programme developed by the US National Center for Health Statistics and automatically selects the underlying cause of death. ACME has been used in routine production of mortality statistics in the US since 1968,89,154 and is increasingly regarded as the de facto international standard for classification of the underlying cause.55
ACME requires that the cause-of-death data have been reported according to the “international form of medical certificate of cause of death” (Figure 1). When processing a record, the programme first tests if the conditions reported in Part I of the death certificate form a valid causal sequence, and then moves on to check whether the train of events leading to death did in fact start with something reported in the “wrong” place on the death certifi-cate, for example in Part II. It also applies the numerous ICD instructions on particular codes, known as “modification rules” in mortality classification parlance (Table 3).
Table 3. Main steps of ACME processing
1. Reported sequence correct? Can condition A be due to condition B? 2. Obvious consequence? Is condition B an obvious consequence (“direct sequel”) of condition C? 3. Modification of underlying cause code ICD code modified if – Underlying cause is ill-defined or unlikely to cause death (“trivial”) – Underlying cause combines with code for other reported condition (“linkage”) – Other reported condition describes the underlying cause more exactly (“specificity”) – Subject to other ICD instructions (“late effect”, “early and late stages”, ...)
ACME has undergone many changes since its first mainframe version in 1968. We used the PC version developed for ICD-9 (ACME.EXE file created on 17 August 1994).

52
Creating dummy death certificates Compatibility between main discharge condition and underlying cause of death When ACME checks if a reported sequence of conditions is correct, it does so by comparing the ICD codes for the conditions in the sequence to a vast data base of “acceptable” medical relationships. This feature allowed us to use ACME to evaluate whether the main hospital condition could be seen as a complication of the underlying cause of death.
ACME starts by judging whether the conditions reported in Part I of the death certificate have been entered in correct causal order. The evaluation procedure is complex, but in principle ACME breaks down the medical rela-tionships stated on the death certificate into pairs of conditions, and then tests if the condition reported on the higher line in Part I of the certificate can be due to the condition reported on the lower line in Part I (Example 1).
Example 1. ACME testing
ICD-9 code Death certificate 1 a) Pneumonia 486 due to (or as a consequence of) b) Pulmonary embolism 415.1 due to (or as a consequence of) c) Stomach cancer 151.9 ACME testing: Can 486 be due to 1519? YES Can 4151 be due to 1519? YES
To evaluate whether the main hospital discharge condition could be a complication of the underlying cause of death, we simply had to construct dummy “death certificates” with the main hospital discharge condition placed on the upper line and the underlying cause of death on the lower line.
For each individual in the project data base, we extracted the main hospital discharge condition from the last episode of hospital care and the underlying cause of death. We then constructed a dummy “death certificate” with the main hospital discharge condition placed as direct cause of death on line a) in Part I of the certificate, and the underlying cause of death on line b) in Part I. This is equivalent to stating that the main discharge condition was caused by the underlying cause of death. If ACME accepted the sequence, we assessed the relationship between main hospital discharge condition as “compatible” (Example 2).
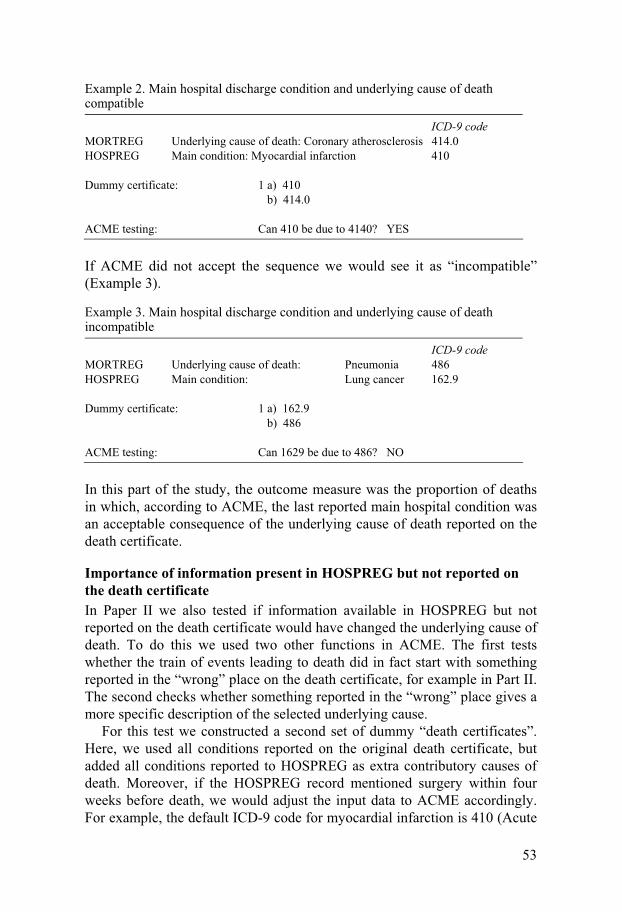
53
Example 2. Main hospital discharge condition and underlying cause of death compatible
ICD-9 code MORTREG Underlying cause of death: Coronary atherosclerosis 414.0 HOSPREG Main condition: Myocardial infarction 410 Dummy certificate: 1 a) 410 b) 414.0 ACME testing: Can 410 be due to 4140? YES
If ACME did not accept the sequence we would see it as “incompatible” (Example 3).
Example 3. Main hospital discharge condition and underlying cause of death incompatible
ICD-9 code MORTREG Underlying cause of death: Pneumonia 486 HOSPREG Main condition: Lung cancer 162.9 Dummy certificate: 1 a) 162.9 b) 486 ACME testing: Can 1629 be due to 486? NO
In this part of the study, the outcome measure was the proportion of deaths in which, according to ACME, the last reported main hospital condition was an acceptable consequence of the underlying cause of death reported on the death certificate.
Importance of information present in HOSPREG but not reported on the death certificate In Paper II we also tested if information available in HOSPREG but not reported on the death certificate would have changed the underlying cause of death. To do this we used two other functions in ACME. The first tests whether the train of events leading to death did in fact start with something reported in the “wrong” place on the death certificate, for example in Part II. The second checks whether something reported in the “wrong” place gives a more specific description of the selected underlying cause.
For this test we constructed a second set of dummy “death certificates”. Here, we used all conditions reported on the original death certificate, but added all conditions reported to HOSPREG as extra contributory causes of death. Moreover, if the HOSPREG record mentioned surgery within four weeks before death, we would adjust the input data to ACME accordingly. For example, the default ICD-9 code for myocardial infarction is 410 (Acute
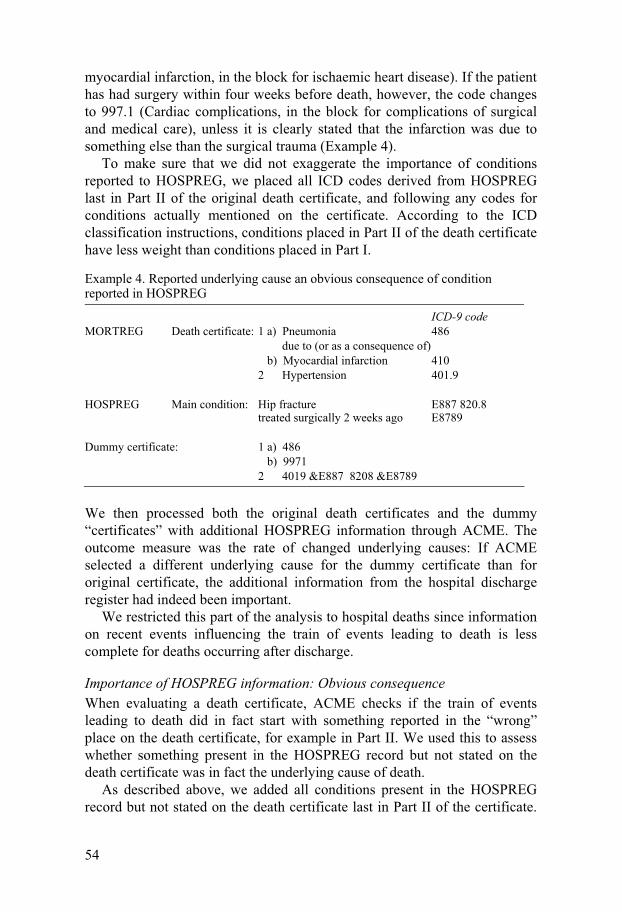
54
myocardial infarction, in the block for ischaemic heart disease). If the patient has had surgery within four weeks before death, however, the code changes to 997.1 (Cardiac complications, in the block for complications of surgical and medical care), unless it is clearly stated that the infarction was due to something else than the surgical trauma (Example 4).
To make sure that we did not exaggerate the importance of conditions reported to HOSPREG, we placed all ICD codes derived from HOSPREG last in Part II of the original death certificate, and following any codes for conditions actually mentioned on the certificate. According to the ICD classification instructions, conditions placed in Part II of the death certificate have less weight than conditions placed in Part I.
Example 4. Reported underlying cause an obvious consequence of condition reported in HOSPREG
ICD-9 code MORTREG Death certificate: 1 a) Pneumonia 486 due to (or as a consequence of) b) Myocardial infarction 410 2 Hypertension 401.9 HOSPREG Main condition: Hip fracture E887 820.8 treated surgically 2 weeks ago E8789 Dummy certificate: 1 a) 486 b) 9971 2 4019 &E887 8208 &E8789
We then processed both the original death certificates and the dummy “certificates” with additional HOSPREG information through ACME. The outcome measure was the rate of changed underlying causes: If ACME selected a different underlying cause for the dummy certificate than for original certificate, the additional information from the hospital discharge register had indeed been important.
We restricted this part of the analysis to hospital deaths since information on recent events influencing the train of events leading to death is less complete for deaths occurring after discharge.
Importance of HOSPREG information: Obvious consequence
When evaluating a death certificate, ACME checks if the train of events leading to death did in fact start with something reported in the “wrong” place on the death certificate, for example in Part II. We used this to assess whether something present in the HOSPREG record but not stated on the death certificate was in fact the underlying cause of death.
As described above, we added all conditions present in the HOSPREG record but not stated on the death certificate last in Part II of the certificate.
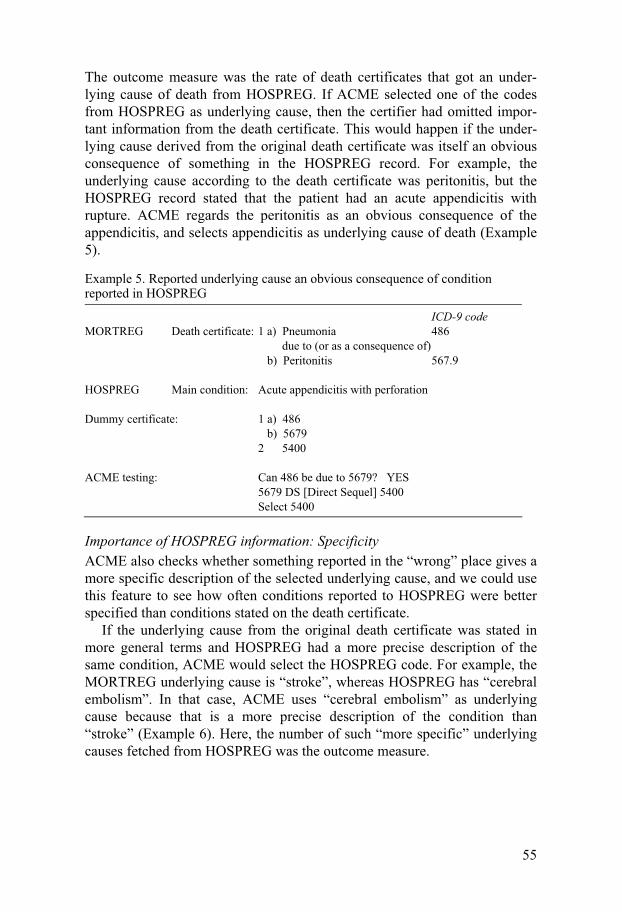
55
The outcome measure was the rate of death certificates that got an under-lying cause of death from HOSPREG. If ACME selected one of the codes from HOSPREG as underlying cause, then the certifier had omitted impor-tant information from the death certificate. This would happen if the under-lying cause derived from the original death certificate was itself an obvious consequence of something in the HOSPREG record. For example, the underlying cause according to the death certificate was peritonitis, but the HOSPREG record stated that the patient had an acute appendicitis with rupture. ACME regards the peritonitis as an obvious consequence of the appendicitis, and selects appendicitis as underlying cause of death (Example 5).
Example 5. Reported underlying cause an obvious consequence of condition reported in HOSPREG
ICD-9 code MORTREG Death certificate: 1 a) Pneumonia 486 due to (or as a consequence of) b) Peritonitis 567.9 HOSPREG Main condition: Acute appendicitis with perforation Dummy certificate: 1 a) 486 b) 5679 2 5400 ACME testing: Can 486 be due to 5679? YES 5679 DS [Direct Sequel] 5400 Select 5400
Importance of HOSPREG information: Specificity ACME also checks whether something reported in the “wrong” place gives a more specific description of the selected underlying cause, and we could use this feature to see how often conditions reported to HOSPREG were better specified than conditions stated on the death certificate.
If the underlying cause from the original death certificate was stated in more general terms and HOSPREG had a more precise description of the same condition, ACME would select the HOSPREG code. For example, the MORTREG underlying cause is “stroke”, whereas HOSPREG has “cerebral embolism”. In that case, ACME uses “cerebral embolism” as underlying cause because that is a more precise description of the condition than “stroke” (Example 6). Here, the number of such “more specific” underlying causes fetched from HOSPREG was the outcome measure.
56
Example 6. More specific condition in HOSPREG
ICD-9 code MORTREG Death certificate: 1 a) Pneumonia 486 due to (or as a consequence of) b) Stroke 436 2 Hypertension 401.9 HOSPREG Main condition: Cerebral embolism Dummy certificate: 1 a) 486 b) 436 2 4019 4341 ACME testing: Can 486 be due to 436? YES 436 SMP [Specificity, Mention, Preferred] 4341 Select 4341
Towards a standardized methodology for assessing medical records Surveying current methodology Through the ACME processing (Paper II) we had identified a number of deaths where the death certificate and the HOSPREG information were incompatible. Next, we wanted to assess whether this incompatibility meant a higher risk that the certificate was inaccurate, and we started collecting case summaries for samples of both “compatible” and “incompatible” deaths (see Paper IV below). To assess the accuracy of the death certificates, we would need a transparent and consistent method for comparing case summa-ries to death certificates. Therefore, we decided to survey the current litera-ture on the accuracy of death certificates.
We searched PubMed for studies comparing death certificates to other data published from 1998 onwards (Paper III).
Our selection criteria required a mention of comparison of death certifi-cates to medical records, or a mention of death certificates in combination with under- or overreporting (Table 4).
By 2 February 2004 we had found 383 papers satisfying the search criteria. After checking the abstracts, or in some cases the full text of the study, we excluded studies that did not involve a comparison of individual death certificates to data from other sources. In the end, 40 papers describing 39 studies remained. By examining the reference lists of these 40 papers we found five more relevant studies. All in all, we had 44 studies described in 45 papers.

57
Table 4. Selection criteria for PubMed search
All-field search for a) “death certificates” and (“data + primary/clinical/discharge” or “records + medical/hospital/clinical”) and (“compared/comparing/comparison” or “review”); b) (“death certificates” or “cause of death”) and (“underreported” or “underrated” or “underestimated”); c) (“death certificates” or “cause of death”) and (“overreported” or “overrated” or “overestimated”)
For each paper, we characterized the methodology according to a structured protocol (Table 5). We listed data collection methods, review procedures, procedures for identifying the principle cause of death, and how well these procedures agreed with the international standard as described in the ICD.
Table 5. Description of study methodology
Data collection: – Number of cases evaluated – Setting (case selection, period, location) – Source material used for evaluating the reported cause of death – Any assessment of the quality of the source material? Review procedures: – Number of reviewers – Independent review or panel consensus? – Reliability test performed? If so, result stated? – Reviewer blinded to original death certificate? – Comparison of results to similar studies? If so, figures cited and differences discussed? Definition and identification of the principal cause of death: – Distinction made between principal cause and other causes of death? – If distinction made, panel’s principal cause of death compared to original death certificate or to official mortality register? – Criteria for identifying the principal cause stated? – Criteria for identifying the principal cause compatible with the ICD instructions for selection of the underlying cause of death? – If not compatible: explanation given or specific purpose stated? – If focussing on a particular condition: diagnostic criteria stated? – Validation of diagnosis reproducible? – Identification of principal cause reproducible?
We also assessed whether the methodology was so well explained that the study could be replicated. They were rated as replicable if they met three criteria: 1) they must describe the composition of the panel judging the death certificates, 2) they must describe how competing causes of death were
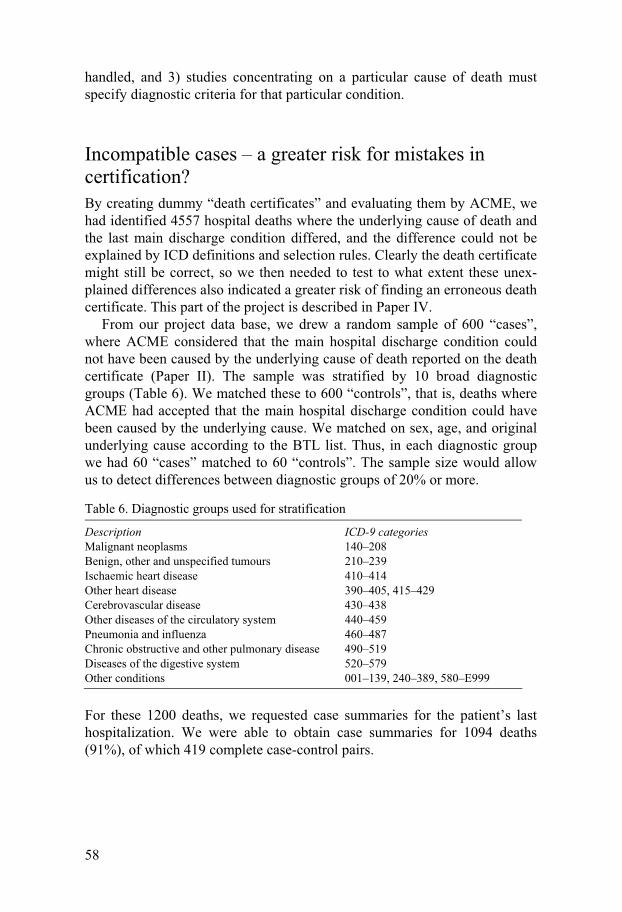
58
handled, and 3) studies concentrating on a particular cause of death must specify diagnostic criteria for that particular condition.
Incompatible cases – a greater risk for mistakes in certification? By creating dummy “death certificates” and evaluating them by ACME, we had identified 4557 hospital deaths where the underlying cause of death and the last main discharge condition differed, and the difference could not be explained by ICD definitions and selection rules. Clearly the death certificate might still be correct, so we then needed to test to what extent these unex-plained differences also indicated a greater risk of finding an erroneous death certificate. This part of the project is described in Paper IV.
From our project data base, we drew a random sample of 600 “cases”, where ACME considered that the main hospital discharge condition could not have been caused by the underlying cause of death reported on the death certificate (Paper II). The sample was stratified by 10 broad diagnostic groups (Table 6). We matched these to 600 “controls”, that is, deaths where ACME had accepted that the main hospital discharge condition could have been caused by the underlying cause. We matched on sex, age, and original underlying cause according to the BTL list. Thus, in each diagnostic group we had 60 “cases” matched to 60 “controls”. The sample size would allow us to detect differences between diagnostic groups of 20% or more.
Table 6. Diagnostic groups used for stratification
Description ICD-9 categories Malignant neoplasms 140–208 Benign, other and unspecified tumours 210–239 Ischaemic heart disease 410–414 Other heart disease 390–405, 415–429 Cerebrovascular disease 430–438 Other diseases of the circulatory system 440–459 Pneumonia and influenza 460–487 Chronic obstructive and other pulmonary disease 490–519 Diseases of the digestive system 520–579 Other conditions 001–139, 240–389, 580–E999
For these 1200 deaths, we requested case summaries for the patient’s last hospitalization. We were able to obtain case summaries for 1094 deaths (91%), of which 419 complete case-control pairs.
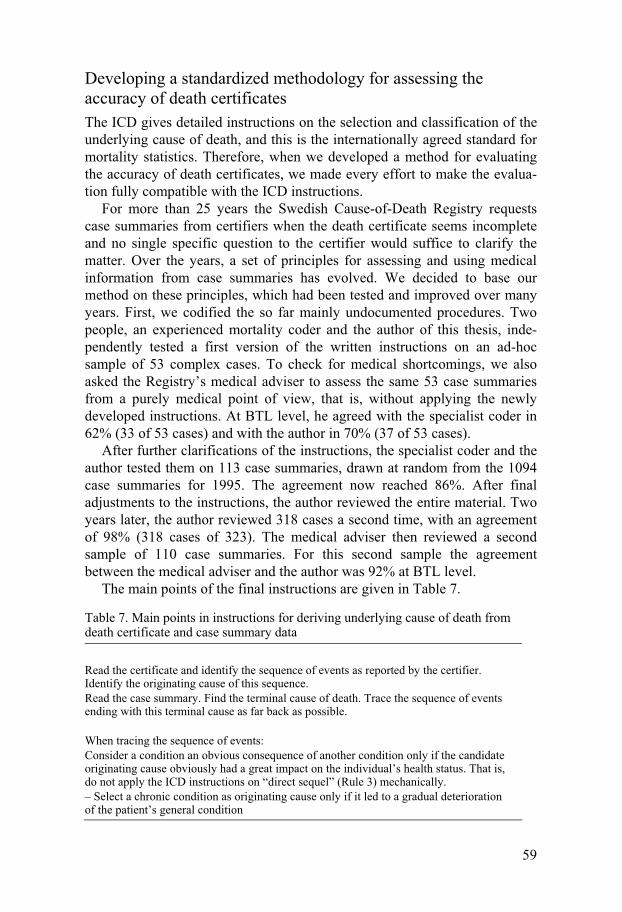
59
Developing a standardized methodology for assessing the accuracy of death certificates The ICD gives detailed instructions on the selection and classification of the underlying cause of death, and this is the internationally agreed standard for mortality statistics. Therefore, when we developed a method for evaluating the accuracy of death certificates, we made every effort to make the evalua-tion fully compatible with the ICD instructions.
For more than 25 years the Swedish Cause-of-Death Registry requests case summaries from certifiers when the death certificate seems incomplete and no single specific question to the certifier would suffice to clarify the matter. Over the years, a set of principles for assessing and using medical information from case summaries has evolved. We decided to base our method on these principles, which had been tested and improved over many years. First, we codified the so far mainly undocumented procedures. Two people, an experienced mortality coder and the author of this thesis, inde-pendently tested a first version of the written instructions on an ad-hoc sample of 53 complex cases. To check for medical shortcomings, we also asked the Registry’s medical adviser to assess the same 53 case summaries from a purely medical point of view, that is, without applying the newly developed instructions. At BTL level, he agreed with the specialist coder in 62% (33 of 53 cases) and with the author in 70% (37 of 53 cases).
After further clarifications of the instructions, the specialist coder and the author tested them on 113 case summaries, drawn at random from the 1094 case summaries for 1995. The agreement now reached 86%. After final adjustments to the instructions, the author reviewed the entire material. Two years later, the author reviewed 318 cases a second time, with an agreement of 98% (318 cases of 323). The medical adviser then reviewed a second sample of 110 case summaries. For this second sample the agreement between the medical adviser and the author was 92% at BTL level.
The main points of the final instructions are given in Table 7.
Table 7. Main points in instructions for deriving underlying cause of death from death certificate and case summary data
Read the certificate and identify the sequence of events as reported by the certifier. Identify the originating cause of this sequence. Read the case summary. Find the terminal cause of death. Trace the sequence of events ending with this terminal cause as far back as possible. When tracing the sequence of events: Consider a condition an obvious consequence of another condition only if the candidate originating cause obviously had a great impact on the individual’s health status. That is, do not apply the ICD instructions on “direct sequel” (Rule 3) mechanically. – Select a chronic condition as originating cause only if it led to a gradual deterioration of the patient’s general condition
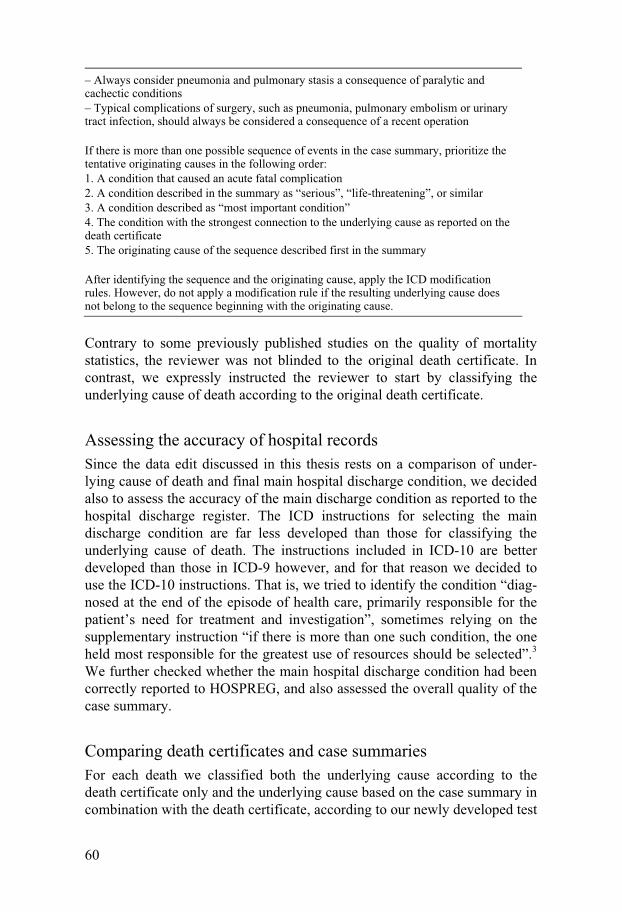
60
– Always consider pneumonia and pulmonary stasis a consequence of paralytic and cachectic conditions – Typical complications of surgery, such as pneumonia, pulmonary embolism or urinary tract infection, should always be considered a consequence of a recent operation If there is more than one possible sequence of events in the case summary, prioritize the tentative originating causes in the following order: 1. A condition that caused an acute fatal complication 2. A condition described in the summary as “serious”, “life-threatening”, or similar 3. A condition described as “most important condition” 4. The condition with the strongest connection to the underlying cause as reported on the death certificate 5. The originating cause of the sequence described first in the summary After identifying the sequence and the originating cause, apply the ICD modification rules. However, do not apply a modification rule if the resulting underlying cause does not belong to the sequence beginning with the originating cause.
Contrary to some previously published studies on the quality of mortality statistics, the reviewer was not blinded to the original death certificate. In contrast, we expressly instructed the reviewer to start by classifying the underlying cause of death according to the original death certificate.
Assessing the accuracy of hospital records Since the data edit discussed in this thesis rests on a comparison of under-lying cause of death and final main hospital discharge condition, we decided also to assess the accuracy of the main discharge condition as reported to the hospital discharge register. The ICD instructions for selecting the main discharge condition are far less developed than those for classifying the underlying cause of death. The instructions included in ICD-10 are better developed than those in ICD-9 however, and for that reason we decided to use the ICD-10 instructions. That is, we tried to identify the condition “diag-nosed at the end of the episode of health care, primarily responsible for the patient’s need for treatment and investigation”, sometimes relying on the supplementary instruction “if there is more than one such condition, the one held most responsible for the greatest use of resources should be selected”.3
We further checked whether the main hospital discharge condition had been correctly reported to HOSPREG, and also assessed the overall quality of the case summary.
Comparing death certificates and case summaries For each death we classified both the underlying cause according to the death certificate only and the underlying cause based on the case summary in combination with the death certificate, according to our newly developed test

61
protocol. Here as well we decided to follow the ICD-10 instructions rather than those for ICD-9 since ICD-10 contains more detail. If more than one underlying condition could have caused the death, we recorded alternative underlying causes but also selected one of them as the first-hand choice.
As main outcome measures we used the agreement at BTL level between the underlying cause according to the death certificate only and the under-lying cause assigned at the review; and odds ratios for agreement by the possible explanatory variables case/control, diagnostic group of original underlying cause, completeness of case summary data, alternative under-lying cause, autopsy performed, age and sex. We also fitted a logistic regres-sion model using the SAS (version 8.2) Logistic procedure with forward selection and a significance level of entry at 95%.
When comparing the original underlying cause of death to the cause of death based on case summary data we used all 1094 observations. The logistic regression model was based on the 419 complete case-control pairs.
62
Results
Paper I Agreement between hospital discharge condition and underlying cause of death Aims The study reported in Paper I aimed at describing the agreement between the main hospital discharge condition and the underlying cause of death derived from the death certificate, and factors that might influence the agreement. A further aim was to open a discussion on the implications of this agreement, or disagreement, for routine production of mortality statistics.
Results
General agreement At Basic Tabulation List (BTL) level, the last main hospital discharge condition and the underlying cause of death agreed in 46% of all deaths where the deceased had been hospitalized within one year before death (46% for men and 45% for women).
Time elapsed The agreement varied with time elapsed since discharge. For hospital deaths the agreement was 59%, but the level decreased rapidly after dismissal. After 11 months the agreement was only 17%.
The agreement varied considerably between ICD chapters. We found the highest agreement for main hospital discharge conditions in Chapter II of ICD, Malignant neoplasms (78% for hospital deaths), and the lowest for Chapter XVI, Symptoms, signs and ill-defined conditions (42% for hospital deaths).
Three groups of discharge conditions As regards likelihood that the main hospital discharge condition would appear as underlying cause of death on the death certificate, we could distin-guish between three groups of conditions. One group of discharge conditions often appeared as underlying cause. These were acute or otherwise dramatic
63
conditions, such as aggressive malignant neoplasms, acute myocardial infarction, aortic aneurysm, traffic accidents and subarachnoid haemorrhage.
A second group of main hospital discharge conditions often appeared as contributory causes on the death certificate. This group was dominated by “secondary” conditions likely to develop as complications of other condi-tions, for example circulatory insufficiency, complications of medical care, pulmonary embolism and nephrotic syndrome.
A third group of main hospital discharge conditions were very often omitted from the death certificate. Some conditions in this group are general symptoms, for example abdominal pain and respiratory failure. However, mental disorders are often omitted from the death certificate, such as affec-tive psychoses and schizophrenia, and so are several chronic conditions, for example chronic obstructive lung disease and late effects of accidents and cerebrovascular disease.
Sex and age The agreement varied with sex and age of the deceased, with the best agree-ment for women aged 45-64 (65%). We found the lowest agreement for women aged 85 and above (33%). In general, differences between the sexes were smaller than differences between age groups.
Autopsy rate and ill-defined discharge condition The autopsy rate was somewhat higher for deaths where the main hospital discharge condition did not agree with the underlying cause of death (17% versus 22%). We also noted that in 13% of cases the death certificate gave a more specific diagnosis in the same broad diagnostic group as the discharge condition reported to HOSPREG.
Non-agreement: Convergence towards common underlying causes Finally, we found that if the main hospital discharge condition and under-lying cause of death did not agree, the certified underlying cause tended to be one or other of the most common causes of death, such as ischaemic heart disease, pulmonary embolism or pneumonia.
Main findings There are important differences between the last main hospital discharge condition and the underlying cause of death according to the death certifi-cate. The agreement is higher if the patient died at hospital, and if the discharge condition is acute or dramatic. Certain types of discharge condi-tions tend to be stated as contributory causes of death rather than as underlying causes, whereas others are often excluded from the death certifi-cate altogether. If the discharge condition and underlying cause do not agree, the physician tends to certify the death as due to one of the most common causes of death.
64
Paper II Testing medical compatibility between underlying cause of death and main hospital discharge condition Aims As reported in Paper I, the main hospital discharge condition differed at BTL level from the death certificate’s underlying cause of death in 54% of hospital deaths. However, as described in Background (Relationships between main hospital discharge conditions and underlying cause of death), the two statements might still be compatible, for example if the main discharge condition developed as a complication of the underlying cause.
In Paper II we had two principal objectives. The first was to quantify the medical compatibility between the underlying cause of death and the main hospital discharge condition, that is, how often differences between under-lying cause and discharge condition can be explained by differences in ICD definitions and instructions for classification. The second was to assess the importance of information included in the patient’s last hospital discharge record, but not included on the death certificate. Here, we measured how often information that was present in the hospital record but not included on the death certificate would have influenced the selection of the underlying cause of death.
Results I: Compatibility ACME, the software we used to do the comparison, assessed that in 37% of the 38,023 deaths where the main hospital discharge condition and the underlying cause of death from the death certificate were different, the main hospital discharge condition could not be due to the underlying cause. Consequently, the discharge condition was medically incompatible with the underlying cause. This corresponds to 20% of all 69,818 decedents with a hospitalization within one year before death.
Certified underlying cause Deaths originally certified as due to conditions in Chapter XVI of ICD-9, Symptoms, signs and ill-defined conditions, had the highest number of incompatibilities (84%). Excluding ICD chapters with less than 100 deaths according to the original death certificate, we found the lowest incompati-bility – and consequently the best agreement between underlying cause and hospital discharge data – for Chapter XIV, Congenital anomalies (21%).
Time elapsed since discharge The proportion of “incompatible” deaths increased with the time elapsed since the patient was discharged from hospital. According to ACME, the last main hospital discharge condition could not be due to the death certificate’s
65
underlying cause in 11% of all hospital deaths. For those who died more than four months after discharge the proportion of “incompatible” deaths was much higher, and in 47% the discharge condition could not be due to the underlying cause of death.
Age and sex We did not find more “incompatible” deaths in the older age groups than at younger ages. Instead, “incompatible” deaths were most common in the 15–44 age span (51%) and lowest in the 65–74 group (34%). For most diag-nostic groups with more than 100 deaths there were only small differences between the sexes.
Results II: Importance of hospital discharge data not present on the death certificate For the 39,872 hospital deaths we supplemented the original death certificate with all diagnostic information included in the hospital discharge record but not mentioned on the certificate (main condition, additional conditions, recent surgery and external cause of injury, if applicable). ACME now selected a different underlying cause in 4225 deaths (11% of all hospital deaths). This was either because ACME “upgraded” a condition reported as a contributory cause on the original death certificate (23% of the 4225 deaths) to underlying cause of death, or because ACME preferred something from the discharge record to the original underlying cause (77% of the 4225 deaths). When ACME selected a condition from the hospital discharge record, this was either because the hospital discharge condition was more specific than the original underlying cause (23% of 4225), or that ACME considered that the original underlying cause was an obvious consequence of something mentioned in the discharge record but not included in the death certificate (54% of 4225).
Statistical impact For some diagnostic groups the effect of including additional information from HOSPREG was substantial. For example, misadventures in medical care increased by 962%, alcohol dependence by 467%, chronic obstructive lung disease by 66% and accidental falls by 58%.
Main points According to our first study (Paper I) the last main hospital discharge condi-tion and the underlying cause of death did not agree in 54% of deaths. We found in this study that almost two-thirds of the discordant conditions were still medically compatible since the discharge condition might well have been a complication of the underlying cause of death. The compatibility was better if the patient had died at hospital than for deaths after discharge.
66
In 11% of deaths occurring at hospital, the underlying cause of death changed when all diagnostic information reported to HOSPREG was taken into consideration. For some diagnostic groups the statistical impact was considerable.
Paper III Surveying current methodology for assessing medical records Aims We planned to assess the accuracy of a sample of death certificates by collecting case summaries and comparing them to the death certificates. To do this we would need a standardized procedure for comparing case summa-ries to death certificates. In our third study (Paper III) we surveyed the methods used in recently published papers on the accuracy of death certifi-cates, in which the authors had compared death certificates to other data. Especially, we were interested to see whether the study design and com-parison procedures were so well described that they could be reproduced, and whether they were compatible with the framework for international mortality statistics established by the WHO in the ICD.
Results Data collection We found 45 papers describing 44 evaluation studies published between January 1998 and February 2004. The studies varied considerably in scope, from an assessment of 21 injury deaths in children to 10,098 cases in a study on colorectal cancer. Moreover, the source material used to assess the accuracy of the death certificates varied within wide limits although most studies (39 of 44) used all available hospital records, sometimes supplemented by interviews with physicians or relatives.
Review procedures The number of people reviewing the material was not stated in 14 of the 44 studies, and only 13 studies described how they had dealt with different opinions among the reviewers. Of the 44 studies, 6 mentioned some kind of reliability or consistency test.
Assessing which cause of death? Of the 44 studies, 9 had used the underlying cause of death registered in the official mortality register when they assessed the accuracy of the mortality statistics. In the majority of studies the research team had themselves selected an underlying cause of death from the original death certificate.
67
This underlying cause of death was then used to assess the accuracy of the death certificate.
Identifying a principal cause of death Twelve studies included all causes of death and aimed at showing what the mortality pattern would look like if the official mortality statistics had been based on accurate death certificates. Only 3 of these 12 studies made a distinction between underlying and contributing cause of death, and none of them specified the criteria by which they had arrived at the principal cause of death when the decedent had suffered from more than one potentially lethal condition (“competing causes of death”).
Reproducibility and consistency with the ICD standard Of the 12 studies that included all causes of death none specified how they had handled competing causes of death. Consequently, their method of evaluating death certificates could not be reproduced, and we could not determine whether their approach was consistent with the ICD standard or not.
Half of the studies on a specific cause of death stated the diagnostic criteria that they had applied. These 16 studies are reproducible as far as the presence of the condition is concerned. Eight studies also described how they had resolved the problem of competing causes of death, and are repro-ducible. However, only five were also consistent with the ICD standard for mortality statistics.
Main points Only 8 of the 44 studies we reviewed had described the methods applied in such detail that the studies could have been replicated. However, three of these had used methods that were not consistent with the international standard of certification and classification of the underlying cause of death as set out by the WHO in the ICD.
The five studies that were both reproducible and consistent with the ICD standard were all on specific causes of death.
Paper IV Incompatible cases – a greater risk for mistakes in certification? Aims In Paper II we had found that in 11% of hospital deaths, the underlying cause of death was incompatible with the main hospital discharge condition (that is, the discharge condition was different from the underlying cause and also could not have been a complication of it).
68
In this study (Paper IV) we compared death certificates to case summa-ries. Our first aim was to test whether incompatibility between underlying cause and discharge condition indicated a greater risk of finding an inaccu-rate death certificate. A further objective was to analyse the impact of possible explanatory variables. Finally, we estimated the impact of certifica-tion errors on the official mortality statistics for 1995.
Results Attrition The response rate was 91%. There were no systematic differences in attrition between diagnostic groups or between cases and controls.
Contents and quality of case summaries Swedish case summaries follow a generally agreed template, but the actual contents vary within wide limits. This applies both to the length and preci-sion of the text and to the style of reporting, which ranges from uncom-mented enumerations of clinical findings to elaborate musings on alternative diagnostic possibilities.
In 65% of deaths the course of events was sufficiently well described for our purposes, and we had no doubts about the underlying cause of death. In the 35% of deaths where the underlying cause was not clear, this was because the information included in the case summary was insufficient (23%), the cause of the patient’s symptoms had not been investigated (10%), or the investigation had been inconclusive (3%). There had been an autopsy in 25% of deaths where the case summary did give sufficient information on the underlying cause, and in 14% of deaths in which the information in the case summary was insufficient.
In 21% of deaths more than one condition could be seen as the starting point of the train of events leading to death.
We assessed that the main hospital discharge condition had been correctly identified in 87% (BTL level). The discharge condition had been correctly reported to the central hospital discharge register in 96%.
Assessed accuracy of certified underlying cause The overall proportion of accurately certified underlying causes of death was 77% at BTL level. “Cases”, where the main hospital discharge condition was incompatible with the original underlying cause of death, were accurate in 50%. Compatible “controls” had an accurate underlying cause in 81%.
Malignant neoplasms and ischaemic heart disease had the highest accu-racy at 90% and 87% respectively. We found the lowest accuracy for benign, other and unspecified tumours (40%) and chronic obstructive and other pulmonary disease (47%). We could not see any significant difference
69
between the sexes or between deaths where an autopsy had been performed and those without autopsy.
Of the 106 certificates stating an underlying cause regarded as “ill-defined” by the authors of the WHO paper on quality of mortality statis-tics,115 48 were assessed as correct, corresponding to 66.7% (weighted). The autopsy rate was lower in this group (14%) than in deaths assigned to an underlying cause not considered ill-defined (22%).
Underlying cause and hospital discharge conditions the same, but both wrong A screening method based on compatibility between hospital discharge condition and underlying cause of death will not capture cases were the two coincide, but are both wrong. When reviewing the case summaries we found 14 such deaths, corresponding to 0.6% of all hospital deaths.
Explaining the differences: Logistic regression model The logistic regression model fitted to our data by the SAS Logistic proce-dure identified four explanatory variables: diagnostic group, case or control, alternative underlying causes and case summary completeness. Of these, diagnostic group and case or control had much greater explanatory impact (Wald �2 59.01 and 30.45 respectively) than alternative underlying causes (Wald �2 10.00) and case summary completeness (Wald �2 7.71).
The adjusted OR of coming across a deficient death certificate was eight times higher for other and unspecified tumours (OR 8.15) and seven times higher for chronic obstructive pulmonary disease (OR 7.13) than for the reference group, malignant tumours. At the other end of the spectrum, there was no significant difference between the reference and the adjusted ORs for ischaemic heart disease (OR 1.45), cerebrovascular disease (OR 1.86), pneumonia and influenza (OR 2.19), and “other” circulatory diseases (OR 2.29).
Certificates for incompatible “cases” were four times as likely to be erro-neous as certificates for compatible “controls” (adjusted OR 3.99). Insuffi-ciently informative case summaries had an OR of 1.74 in relation to suffi-ciently complete case summaries. In contrast to the crude ORs for age group, the adjusted ORs for age and sex did not show any significant difference.
Diagnostic groups in relation to “cases” and “controls” Of the 10 diagnostic groups, 6 had significantly more errors when there was an unexplained difference between main hospital discharge conditions and certified underlying cause of death, namely malignant neoplasms, benign, other and unspecified tumours, cerebrovascular diseases, other diseases of the circulatory system, pneumonia and influenza and diseases of the diges-tive system.
70
However, some diagnostic groups had poor accuracy for both “cases” and “controls”. For example, deaths certified to conditions in the “other heart disease” group were accurate in 49% for “cases” and in 62% for “controls”, and those certified to chronic obstructive and other pulmonary disease were accurate in 54% of “cases” and in 52% of the “controls”.
Effects on overall mortality pattern Although we changed the underlying cause of death in 23% of deaths, the impact on the overall mortality pattern was not dramatic. Changes tended to cancel each other out, and most diagnostic groups remained fairly stable. However, benign, other and unspecified tumours had a net decrease of 48%, and chronic obstructive and other pulmonary disease lost 15% of deaths assigned to that group. The two groups that gained most from the reassign-ments were other diseases of the circulatory system (+17%) and diseases of the digestive system (+14%).
ACME’s use of hospital discharge record data not reported on the death certificate In Paper II we checked the importance of information included in the discharge record but not stated on the death certificate. In 11% of hospital deaths ACME selected a new underlying cause of death because of the new information. Our sample of case summaries included 276 of such deaths, 188 “cases” and 88 “controls” (data not included in Paper IV).
The confirmation rate was low. At BTL level, the new underlying cause selected by ACME was confirmed by the case summaries in only 25% of deaths. The confirmation rate was higher for incompatible “cases” (47%) than for compatible “controls” (16%).
Main points The overall proportion of accurately certified underlying causes of death was 77% at BTL level. Incompatibility between main hospital discharge condi-tion and certified underlying cause of death does indicate a higher risk that the death certificate is inaccurate. However, for some diagnostic groups death certificates are often inaccurate also when the discharge condition is compatible with the underlying cause.
71
Discussion
Findings and interpretations Comparing hospital discharge condition and underlying cause of death In Paper I, we found important differences between the last main hospital discharge condition and the underlying cause of death according to the death certificate. This was no surprise since hospital and mortality data are collected for different purposes and according to different definitions and procedures. We also found that the agreement between hospital discharge condition and underlying cause is higher if the patient died at hospital. This too seems reasonable since new conditions might develop after discharge. Moreover, if someone dies after discharge, perhaps the death certificate is issued by another physician than the one who discharged the patient from hospital, and who sees the patient’s health problems in a different light.
Three groups of hospital discharge conditions An important finding is that hospital discharge conditions fall into three main groups as to their presence on the death certificate: some often occur as underlying causes, some often occur as contributory causes, and a third group of discharge conditions are often not mentioned at all.
It is hardly surprising that dramatic conditions, such as multiple injuries from a transport accident or a ruptured aortic aneurysm, will appear both as main hospital discharge condition and underlying cause of death. It is also makes sense that “secondary” conditions, such as pulmonary embolism and pneumonia, more often appear as a contributory cause of death than as underlying cause. It is more difficult to explain why chronic conditions, for example schizophrenia and chronic obstructive pulmonary disease, serious enough to be reported as the patient’s last main discharge condition, are often omitted from the death certificate.
However, this is fully consistent with other studies. Goldacre, who worked on data from the Oxford linkage study,30 also describes the three groups of discharge conditions mentioned above. Hansell, Walk and Soriano found that when chronic obstructive pulmonary disease (COPD) is mentioned on a death certificate, it is the underlying cause in 59.8% of cases, in contrast to myocardial infarction, which is selected as underlying cause in
72
94% of cases where it is mentioned on a death certificate.155 That chronic conditions are often left out from the death certificate has been pointed out elsewhere,38,48,107,111,142,143,156 and in particular for conditions such as Alzheimer’s disease,157 alcoholism64,131,132 and other psychiatric condi-tions,138 COPD,155 respiratory diseases except lung cancer,87 diabetes129 and systemic lupus erythematosus.111
A possible explanation of the absence of chronic conditions from the death certificate might be that physicians intuitively do not consider the chronic condition itself a cause of death, but rather the final complication caused by the chronic condition. After all, the patient has lived with the condition for years and it might seem more natural to blame the death on the complication rather than on the chronic condition underlying it. Conse-quently, the complication is reported on the death certificate, but not the chronic condition. In contrast, when previously healthy people die from something that befell them unexpectedly, the connection between the main condition and the cause of death is instantly clear. Intuitively – and correctly – the physician will report the main condition on the death certificate. The implication of this, of course, is that the “underlying cause” concept cannot be expected to work very well for deaths resulting from chronic diseases.
One interesting difference between our results and those of Goldacre30 probably reflects different national attitudes to involving the police in cause-of-death investigations. In the Oxford linkage material, hip fracture was mentioned on only 17% of death certificates for patients hospitalized because of hip fracture, whereas in Sweden hip fracture was the underlying cause of death in 42% of cases when reported as the main discharge condi-tion. This is probably because English legislation requires the certifier to refer the death to a coroner if an accident or other external cause is involved. Since an inquest would put further strain on the relatives, the physician might wish to avoid reporting the death to the coroner. A simple way of escaping that obligation is to omit the hip fracture from the death certifi-cate.158 In principle, similar legislation applies in Sweden, and all deaths from external causes should be reported to the police. A practice has evolved, however, not to report hip fractures to the police,53 and in Sweden mentioning a hip fracture on the death certificate does not impose any addi-tional burden on either relatives or certifier.
It should not be taken for granted that a fall injury necessarily is the underlying cause of death, even if the patient was hospitalized because of the injury. According to Koehler et al, using mortality data only gives an under-estimation of the “true” mortality from fall injuries since clinicians often do not see the connection between the accident and, for example, a pneumonia that develops weeks later. On the other hand, relying on hospital data would give an overestimation since hospitals often register fall accidents even when they have not lead to a serious injury.159 As usual, the truth is to be found between the extremes.

73
Convergence towards common underlying causes Like Goldacre30 we found that when main hospital discharge condition and underlying cause do not agree, the underlying cause tends to be one of the most common causes of death, such as ischemic heart disease or pneumonia. A similar result is reported by Hansell, Walk and Soriano. They found that patients with chronic obstructive pulmonary disease (COPD) who according to the death certificate died from something other than COPD, tended to have ischemic heart disease, lung cancer or bronchopneumonia as under-lying cause of death.155 Similarly, Kircher, Nelson and Burdo found that circulatory disorders, ill-defined conditions and respiratory disease were the most commonly over-diagnosed causes of death.40 A charitable explanation would be that these conditions are often present in people suffering from multiple conditions, and that the physician believed that they were more important in bringing about the death. A more critical interpretation would be that in difficult cases, where physicians are not sure about what to write on the death certificate, they choose a cause of death that feels “safe” and defensible, whether there is evidence that this particular condition killed the patient or not. A Swedish study lends strong support to this more critical interpretation: in a study of 537 death certificates, less than half of all mentions of ischemic heart disease were confirmed by autopsy or clinical records.131
ICD definitions and differences between underlying cause and main hospital discharge condition In the second study (Paper II), we found that most discrepancies between underlying cause of death and hospital discharge condition were in fact medically compatible and could be explained by differences in the ICD defi-nitions. The compatibility was better if the patient had died at hospital than for deaths occurring after discharge. When checking the importance of information present in the hospital discharge register but not mentioned on the death certificate, we found that in 11% of deaths occurring at hospital, the underlying cause of death changed when all diagnostic information reported to the hospital discharge register was taken into consideration.
Underlying cause and main discharge condition compatible? Our data base comprised 39,872 hospital deaths. In only 4557 cases (11.4%) the underlying cause and the main hospital discharge condition were not medically compatible. That is, they were not the same or the main condition could not have developed as complication of the underlying cause stated on the death certificate.
The number of incompatible cases is fairly small, but this does not mean that the remaining differences were negligible. Two points should be made.
74
First, the incompatible cases were not randomly distributed. If incompati-bility does indicate a higher risk of errors, investigating and possibly correcting the incompatible cases might have a great statistical impact on some causes of deaths even if the total number is low. Second, the small number of incompatible cases still indicates that far from all certification errors can be captured in this way. As mentioned above, several studies on the accuracy of mortality statistics have arrived at a far higher error rate.97-100 A higher number of incompatible cases would have been more in line with these findings (see also below, Comparing death certificates and hospital data: An efficient scanning method?).
Importance of hospital discharge information left out from the death certificate We got a strong indication that important information is sometimes omitted from the death certificate when we used ACME to check whether informa-tion included in the hospital discharge register, but not mentioned on the death certificate, would change the underlying cause of death. Although the underlying cause changed in rather few deaths (11% of all hospital deaths), the impact on some causes was dramatic. For example, medical misadven-tures rose by almost 1000% and alcohol dependence by almost 500%.
The direction of these and similar changes are consistent with other studies,64,121,122,131,132 but when we checked a sample of such deaths against case summaries (Paper IV) the actual confirmation rate was low, only 25%. Clearly linking death certificates to the hospital discharge register is no substitute for more detailed clinical information on the death.
Assessing the accuracy of death certificates – current status of methodology In Paper III we reviewed 44 studies evaluating the quality of mortality statistics. Only eight of them had described the methods applied in such detail that the studies could have been replicated. Furthermore, three of these that could have been repeated had used methods that were not consistent with the international standard of certification and classification of the underlying cause of death, as set out by the WHO in the ICD.
No common standard of assessing accuracy of death certificates To quote Maudsley and Williams, “the question ‘How inaccurate are causes of death data?’ is harder to answer than the literature suggests. Deriving a useful estimate is difficult because of inter-study differences in (1) defini-tion, measurement (how and by whom?) and practical importance of error, and standards used; (2) focus (e.g. death certificate or mortality data),

75
observing everyday practice or simulation exercises, diagnostic and/or semantic issues.”7
Instead of evaluating whether the death certificates had been completed in accordance with the WHO instructions, most studies assessed if mortality data would serve some specific research purpose, regardless of whether this was consistent with WHO’s international instructions or not. Although this is a completely legitimate way of conducting a study on the usefulness of any set of data, it is not an evaluation of the accuracy of the official mortality statistics. “Accuracy”, in this context, cannot mean anything other than that the statistics have been compiled according to the WHO specifications. Studies that judge cases as “misclassified” according to criteria of their own, even though both the death certificate was correctly completed and the statistics agency had classified the death according to the ICD instructions, do not help users of mortality data to assess how well the official mortality statistics conform to the international standard. Studies on the quality of mortality data should specify exactly what they have validated.
Call for standardized methods – an unrecognized plea We were not the first to call for a standardized approach, and over the years several papers have argued for standardized methods of arriving at the cause of death and assessing the accuracy of mortality data. For example, in 1984 Remington observed that there had “been little standardization of the approach to determining cause of death”, and suggested a standardized set up for both review panel, adjudication of differences and coding and classification, all with aim to “generate reproducible information”.79 Start et al reviewed 223 papers published in 1994 that used cause of death as outcome. How this had been done was “either unstated or stated without explanation of the method of ascertainment” for almost half of them. The authors concluded that “all clinical research in which deaths are expected or represent outcome events should include protocols for evaluating deaths”.160
Similarly, Brown et al found that physicians relying on their clinical assessment and not on a standardized protocol would often disagree on whether a stroke was the cause of death. However, they found some conso-lation in the fact that “although there was much disagreement with regard to the cause of death of individual cases by the two reviewers, the proportions of the total deaths determined to be from stroke ... were quite similar”.161
Autopsy, which is often used as gold standard in studies on the accuracy of death certificates, has similar problems. Roulson, Benbow and Hasleton noticed that studies using autopsy results are difficult to compare because a standardized method for evaluating death certificates against autopsy does not exist.37 This is consistent with a study by Shojania et al. Of 45 studies comparing autopsy results to clinical diagnosis, only 5 “addressed the issue of reproducibility for the classification of autopsy-detected diagnostic errors,

76
and none provided sufficient detail to permit calculation of formal measures of agreement”.52
The situation is not encouraging. In a study on assessment of medical errors, Weingart et al say that there is a “serious need for researchers to use consistent definitions and methods”,162 which sounds as no overstatement. Again, it should be emphasized that for official mortality data there exists only one internationally recognized standard, namely the definitions and instructions set out in the ICD.
Insufficient knowledge of the ICD and international conventions regulating mortality statistics We found that many studies had not applied ICD criteria when assessing the accuracy of the death certificates. Deficiencies in the ICD selection system might be one cause, but many reviewers also seemed to be unaware of the ICD definitions and instructions, at least beyond a quotation of the official ICD definition of underlying cause. Thus, several papers had invented a terminology of their own,125,163-165 although the ICD offers a terminology for the various aspects of data collection, classification and dissemination.
The ICD defines underlying cause of death as “(a) the disease or injury which initiated the train of morbid events leading directly to death, or (b) the circumstances of the accident or violence which produced the fatal injury”. However, the definition of underlying cause does not apply without excep-tions, and the ICD rules and guidelines specify many situations where something other than the originating cause is selected as underlying cause of death. In fact, according to an estimate of the Swedish Cause-of-Death Registry, exceptions from the general principle apply in about 20% of deaths.47
The ICD has numerous detailed instructions for specific situations, which is why mortality coders need several years to learn their profession and computerized coding and classification is seen as essential in ensuring that the ICD instructions are applied consistently across countries.89 As has been pointed out by at least some studies, researchers working on mortality data should enlist a professional nosologist (ICD coding and classification expert) to avoid pitfalls that such ICD instructions on specific conditions might cause.79
Sometimes insufficient knowledge of the data collection and classifica-tion steps cause authors to make rather strange suggestions for “improve-ments” to the international form of medical certificate of death. For example, one study suggests that the form should have three lines rather than four, as recommended by the WHO in 1994, since with more lines on the certificate the certifiers will have more opportunities to make mistakes.22 That certifi-cate forms with a fourth line in Part I have been shown to capture the underlying cause better than certificates with three lines had evidently escaped the authors,166 and they also do not comment on the possibility that
77
cases with more lines filled in might be more complex than those where the certifier has stated a single cause of death.
Occasionally researchers or patients’ organisations suggest the introduc-tion of tick boxes for disorders felt to be especially important although criteria for how to select these disorders are seldom given. However, a Euro-stat working group is currently considering a recommendation to countries not to introduce such standing items on the death certificate forms because of the data collection bias this would inevitably introduce.167
Authors present very different opinions on how to identify the “correct” cause of death. Some are more interested in certain complications than in the condition that started the train of events, which, of course, might better reflect the clinical situation most certifiers find themselves in.113 Others concentrate on missed preventive measures168 and others feel that some conditions are so important that they should always count as the underlying cause of death, regardless of whatever other conditions the deceased might have suffered from.169 Others do not specify what they mean by “cause of death” – underlying cause, or a complication.41,170,171 Again, if the aim is to assess the accuracy of mortality statistics, adherence to the international norms is essential.
As observed in the Background section (The concept of “underlying cause of death”), an international standard is necessary to make international comparisons possible. It was exactly the need to achieve international conformity that in 1948 led the WHO to promulgate a number of definitions and regulations related to mortality statistics.135 Against this background, it is rather surprising that so few authors discuss the procedures by which they identified the “correct” cause of death, and its relationship to the underlying cause of death as defined by the WHO. Thankfully, some authors give a clear description of why they found another cause of death than the under-lying cause more useful for their research.113
Reproducibility and consistency Reproducibility and transparency of methods are generally considered hall-marks of scientific work. It would seem obvious that procedures used to assess the accuracy of reported causes of death should themselves be subject to, or at least allow, quality assurance. However, in more than two-thirds of the studies that evaluated the certifier’s choice of underlying cause, the method was not described well enough to allow a replication of the study.
Comparing death certificates to case summaries for 1094 deaths: Incompatible cases and risk for mistakes in classification In the study reported in Paper IV, we compared case summaries and death certificates for 1094 deaths. According to our assessment, the risk of finding

78
an erroneous death certificate is four times higher when the underlying cause and main hospital discharge condition were incompatible. By “incompatible” we meant that the main condition was not likely to be a complication of the reported underlying cause.
Quality of hospital records According to our evaluation, the main hospital discharge condition recorded in the hospital discharge register was correct in 87%. This does not mean that the main hospital condition could be used to routinely correct the underlying cause, as has been suggested.172 The hospital discharge register and the mortality register were created for different purposes, and the condi-tions reported to them are selected according to different criteria. Thus, the main hospital discharge condition and the underlying cause may be different, but still both correct according to the criteria governing the selection and classification of hospital conditions and underlying cause respectively.
Like Percy, Stanek and Gloeckler,85 we found that the hospital records sometimes contained more specific diagnostic detail than the death certifi-cate. Even so, 35% of the case summaries contained so little diagnostic detail that it was difficult to form an opinion on the underlying cause of death. Partly, this might be due to omissions, so that the case summary did not mention important examinations and finds that were described in the complete medical record. However, even detailed case summaries did not always give a proper diagnosis. Sometimes the patient died before a diag-nosis had been established or the patient’s general condition did not allow any thorough examination. According to current legislation, an autopsy should take place if the cause of death is not clear. In practice, elderly people are seldom autopsied even if the cause of death is unknown, and almost never against the wishes of the relatives.
The main question as concerns our study is whether the case summary data were good enough to warrant the conclusion that an unexplained differ-ence between underlying cause and main hospital discharge condition indi-cates an increased risk that the death certificate is erroneous. In all prob-ability, the conclusion holds even if the case summaries were less than perfect. First, in two-thirds of deaths the case summaries were informative enough to allow us to decide on the cause of death with sufficient certainty. Second, the overrisk of finding an inaccurate death certificate was substan-tial: unadjusted 4.15, adjusted 3.99. It is unlikely that the result would have been substantially different even if all case summaries had been satisfactory.
Accuracy of underlying causes in the 1995 mortality register We estimated that the underlying cause from the original death certificate was correct in 77% of hospital deaths. We found the best accuracy for malignant neoplasms and ischemic heart disease, conditions likely to domi-nate the clinical picture. This agrees with previous studies on the accuracy of
79
these conditions, at least when finer diagnostic details of clinical manifesta-tion or site are not required.123,165,173
Competing underlying causes In 21% of deaths the patient had more than one condition serious enough to lead to death on its own. Maudsley and Williams, working on a British mate-rial, arrived at a very similar figure and estimated that about 20% of deaths had multiple underlying causes. In their opinion, selecting one of these causes is arbitrary, which they see as a major deficiency of official mortality statistics.60 This difficulty is also described by Lu et al.156
As mentioned in the Background section (Different understandings of quality; “Underestimation”), mortality statistics based on a single under-lying cause of death systematically “underestimates” conditions that often occur together with other conditions since by definition the certifier has to choose one of them at the expense of the others.30 In our material, this is illustrated by the finding that death certificates with chronic obstructive and other pulmonary disease as underlying cause of death obtained a very low accuracy score. Similar results are reported in other studies.40,87,174
Competing causes of death is a serious epidemiological challenge, espe-cially since the number of such “alternative” underlying causes varies with the certified underlying cause, and with age.105 The ICD gives implicit guidelines on how to prioritize between some competing conditions, and generally acute conditions take precedence over chronic diseases. For example, a patient suffering from chronic obstructive lung disease gets an acute peritonitis due to a ruptured gallbladder. Surgery is necessary but a few days later the patient develops pneumonia and dies. Both the chronic obstructive lung disease and the ruptured gallbladder could be seen as the cause of the pneumonia. The ICD, however, states that pneumonia occurring within four weeks after surgery should be considered a consequence of the surgery, and that the reason why the surgery was performed should be selected as the underlying cause of death. Consequently, ruptured gall-bladder is the underlying cause of death, not the chronic obstructive lung disease.
The ICD instructions are, of course, arbitrary conventions rather than the medical “truth”, albeit conventions that have been found useful.175 When assessing the case summaries we followed the ICD standards, and generally a chronic condition was not selected as underlying cause of death if an acute but etiologically unrelated condition supervened. This explains the low accu-racy score for deaths certified as due to chronic obstructive lung disease.
Pneumonia as underlying cause of death Somewhat unexpectedly, we found that pneumonia is more reliable as an underlying cause of death than was stated in a previous study of Swedish death certificates. Of a sample of 226 deaths in 1984 with pneumonia as the
80
underlying cause of death, only 53 (23%) were confirmed by the review panel.12 According to our study of death certificates for 1995, however, an underlying cause of pneumonia was correct in 83% of deaths. One factor contributing to this difference might be that the Swedish Cause-of-Death Registry increased the number of queries in the late 1980s, and that most deaths with an underlying cause of pneumonia in the cause-of-death register have been queried and validated. Probably, the improved ICD instructions for classification of underlying cause of death is another part of the explana-tion. The ICD-10 classification rules, which we used when assessing the accuracy of the original death certificates, now have detailed instructions on death certificates with pneumonia as the underlying cause. A preliminary study carried out at the Swedish Cause-of-Death Registry compared the underlying cause selected according to the new pneumonia instructions to the underlying cause derived from case summaries. The new instructions were capable of correctly identifying the underlying cause of death in about 60% of cases where pneumonia has erroneously been reported by the certi-fier as the underlying cause of death.176 This improvement in classification practices probably explains the difference between 1985 and 1995.
Accuracy of “ill-defined” underlying causes As mentioned in the Background section (The concept of “underlying cause of death”; Current situation: Increasingly complex causes of death), WHO staff published a study on the quality of official mortality data, in which the ratio of ill-defined or less informative underlying causes was used as an indicator of data quality.115 Interestingly, we found that about 2/3 of certifi-cates with an “ill-defined” underlying cause, as defined by the authors, were in fact correct according to the case summaries. The WHO indicator might indeed need some refinement, but our result might also show how difficult it is to identify a clear-cut underlying cause in elderly people with several chronic diseases. A general term, such as “old age” or “cachexia”, might best describe the case, and is certainly preferable to a trumped-up diagnostic term denoting a condition that the patient did not have. What looks nice in the statistical table is not always the most truthful underlying cause of death.
Comparing death certificates and hospital data: An efficient scanning method? As pointed out repeatedly above, non-obvious errors in death certification pose a major problem to producers of official mortality statistics. Such errors are likely to reduce the usefulness of the statistics but are not easy to detect. By comparing hospital records to death certificates, however, we were able to identify groups of death certificates with a high risk of certification errors. Thus, we found that incompatibility between main hospital discharge condi-tion and underlying cause indicates a four-fold risk that the death certificate is erroneous. However, the error rate was quite as high for some diagnostic

81
groups, whether the main condition and underlying cause were compatible or not. Consequently, if a statistics agency wishes to verify all death certificates at high risk of being wrong, the agency has to request additional information for both “incompatible” deaths and for all deaths in one of the high-risk diagnostic groups.
The cost of requesting additional information might be substantial. For example, a statistics office might decide that an error rate higher of 20% or higher is not acceptable, and that death certificates with a higher risk of being erroneous should be queried. “High risk of being erroneous” includes certificates in diagnostic groups where “incompatible” cases had an error rate of 20% or more, plus all certificates in diagnostic groups with an overall error rate of 20% or more.
If Sweden had applied the 20% limit to all hospital deaths in 1995, almost 15,300 death certificates would have belonged to groups with a 20% risk of error or higher. Of these 15,300 “high risk” death certificates, an estimated 5,900 certificates would have proved wrong, if Statistics Sweden had collected additional information on all of them (Table 8).
Table 8. Assessed numbers of death certificates in high risk groups, based on a sample of 1094 deaths. Sweden, hospital deaths, 1995. N = 39,872
Type of Diagnostic group Error rate Estimated number deaths N (%) of errors Incompatible Cerebrovascular disease (CVD) 726 (61) 443 Incompatible Circulatory diseases other than CVD and IHD 288 (52) 150 Incompatible Malignant neoplasms 984 (45) 443 Incompatible Ischemic heart disease (IHD) 733 (30) 220 All Benign tumours 303 (60) 182 All Chronic obstructive lung disease 1494 (53) 792 All “Other” conditions 4380 (42) 1840 All Heart disease other than IHD 2953 (35) 1034 All Pneumonia and influenza 1472 (27) 397 All Diseases of the digestive system 1925 (20) 385 Total 15,258 5886
Sending out that number of query letters and processing the replies would have demanded far larger resources than the Registry had at its disposal, or ever has had.
If it still had been possible to query that number of deaths, the underlying cause of death would have been corrected in 15% of all hospital deaths. However, we estimated that 23% of all hospital deaths were incorrectly certified. The filter described in Table 8 would capture 65% of these errors, less than two-thirds.
82
The error rate limit could, of course, be placed at another level. If the Registry was to query groups with more than 50% errors, 2528 query letters would have been needed and about 1600 errors would have been detected. That, however, is only 17% of the estimated number of errors in hospital deaths.
That said, sending query letters to the certifier might still have an impor-tant general impact on the quality of death certification since queries show the certifiers that someone actually reads the death certificates and is concerned about their contents. In that way, queries contribute to the general quality of mortality statistics even though effect on the mortality rates for specific causes of death is limited. To have this general effect, however, the frequency of querying must not be too low.7,177
Whether the improvement of the overall quality of the cause-of-death data would justify the cost and the effort remains an open question. The “screening efficiency”178 – the proportion of errors identified and corrected by the screening procedure – might still leave something to be desired, but if the diagnostic groups could be made smaller and more homogeneous, the filter would probably be more efficient. Moreover, this kind of data filter could and should be combined with other measures to improve the accuracy of the mortality statistics.
Strengths and limitations of the studies Strengths The project data base covered all hospital deaths in Sweden for a complete data year and included almost 70,000 individuals. This is substantially more than in most comparable studies and provides a sound basis for the studies.
Because of the Swedish personal identification number, linking records from different data bases presented no or few difficulties. This might be an obstacle in other countries, where an equivalent to the personal identification number is not available. Moreover, many countries do not have a national data base of hospitalizations. Such data might be easier to obtain in the future, however. Soaring health care costs is a major concern, and more countries are likely to develop national data bases similar to the Swedish Hospital Discharge Register.
Using the ACME software to assess the medical compatibility between hospital and death certificate data has two advantages. First, by using a soft-ware programme rather than a panel of reviewers we were able to process far more records than a panel could have handled in the same space of time. Second, the assessment was fully standardized.
In Paper IV, where we reviewed a sample of case summaries, we had a high response rate (91%) and no conspicuous differences in attrition between
83
the sampling groups. We used a standardized protocol for reviewing the case summaries, which means that the procedure followed is clearly documented and can be replicated. We were also able to demonstrate that the protocol had been consistently applied.
Limitations We did not attempt to obtain data on decedents that had not been hospital-ized during their last year of life. To cover decedents with no hospitalization, we would have needed other data sources, such as the data base of the National Board of Forensic Medicine. Since we conducted our study, the Hospital Discharge Registry has been extended to a National Health Care Registry, and now collects data on both hospital and out-patient care. However, data for out-patient care are still too incomplete to allow the kind of analyses that we performed for hospital deaths. With increasing coverage studies based on out-patient data might be feasible in the future.
The size of the case summary sample was determined by the effort required to collect the material and to review the summaries. The sample size we settled for – 1200 deaths – was the largest we believed ourselves capable of handling within reasonable time and with the resources available. We tried to compensate for the relatively small sample by using a case-control approach. Even so, the sample is too small to allow any conclusions on particular diagnoses, and we had to limit ourselves to broad diagnostic groups.
We also decided to request copies of just the case summaries and not of the complete medical records. Judging by experiences from the Swedish Cause-of-Death Registry, requesting complete medical records would have resulted in a lower response rate because many hospital archives would not have had the time to copy bulky medical records. According to our estimate, in 35% of deaths the information available in the cause summaries was incomplete, and we could not decide on the underlying cause of death with sufficient confidence. Whether access to the full medical records would have solved this difficulty is not clear, however. An unsatisfactory case summary might well be an indication that the other documents in the medical file are also less than perfect. Moreover, a lower response rate would have been an even greater quality problem.
A screening method based on compatibility between hospital discharge condition and underlying cause of death does not capture cases where the two coincide, but are both wrong. We found very few such deaths, and concluded that this is not a major problem.

84
Specific methodological considerations Why the hospital discharge register? Sweden is in the fortunate situation to possess several medical registers covering the entire population, all of which store individual records that can be linked to other data sources by means of the personal identification number. For example, it would also have been possible to compare causes of death to data in the medical birth register, the birth defect register, the cancer register or the register of the National Board of Forensic Medicine. We finally decided to use the hospital discharge register because it includes a wider range of conditions than any of the other registers. Moreover, the conditions covered by the special registers are reported to the hospital discharge register as well if the patient has had hospital treatment for the condition. Thus, if the method could be shown to work for hospital discharge data, it is likely to work for data from the more specific registers as well. A future development of the method might of course include linkage to regis-ters other than the hospital discharge register.
Quality of the hospital discharge register By comparing underlying cause of death to hospital discharge data we do not mean to imply that the hospital discharge register is by definition “better” or “more correct” than the cause-of-death register. In fact, the Swedish hospital discharge register has had a reputation of poor quality although a quality assessment of 1986 data found that the main diagnosis was correct at ICD-8 three character level in 88–90%.179 This was confirmed by our own study of hospital discharge data for 1995 (Paper IV), where we assessed 87% of reported main conditions as correct.
Judging compatibility: ACME less than perfect? In Paper II, we evaluated the compatibility between the last main hospital discharge condition and the underlying cause of death. When deciding how to do this evaluation, there were two important facts to consider. The first was the size of the material, 69,818 deaths. The second was the need for consistency. Both these circumstances pointed very decisively towards using a software programme rather than doing the evaluation manually.
Selection of the underlying cause of death entails an assessment of whether a condition A could be due to a condition B. Therefore, a software programme designed for automated selection of the underlying cause of death would suit our purpose. There have been several attempts to develop such software, but only one has been successful: the ACME system, devel-oped by the National Center for Health Statistics (NCHS).89

85
ACME has become the de facto international standard for automated selection of the underlying cause of death.55-57,89 Even so, ACME has its problems.180,181 According to an evaluation performed at Statistics Sweden in the late 1980s, the ICD-9 version selected the underlying cause correctly in about 97.5% of cases.182 This means that in our material, ACME would have judged the medical relationship between discharge condition and underlying cause erroneously in about 1750 cases. Considering that the total number of “incompatible” cases was 4557, the error rate might seem high. There was no reason to assume, however, that all or most incompatibilities would be due to ACME errors.
Nevertheless, deficiencies in ACME limit the usefulness of the software, both for selection of underlying cause and, as in Paper II, for testing medical compatibility between conditions. In cooperation with the international Mortality Reference Group,112 the NCHS continuously updates the software, and future applications based on later versions of ACME will have less of a problem with software errors.
Comparing death certificates and case summaries Procedures for evaluating the death certificate Studies evaluating the accuracy of death certificates differ in one important aspect, namely whether the reviewer has access to the original death certifi-cate or not. The main reason not to give the reviewer access to original document is, of course, that the reviewer is supposed to deliver an independ-ent verdict on the cause of death. This seems to overlook the fact that the hospital records and the death certificate are not independent data sources. If the attending physician issues the death certificate, the same person is responsible for both the death certificate and much of the contents of the medical records. If someone else than the attending physician issues the death certificate, the information in the medical records still largely deter-mines what is stated on the death certificate. Moreover, the death certificate might contain medical information that is not present in the medical records, but that is still necessary for the interpretation of the case. Not allowing the reviewer access to the original death certificate also conflicts with the ICD regulations on cause-of-death statistics, which explicitly state that the certi-fier’s opinion should not be disregarded. It is hardly possible to take the certifier’s opinion into account without access to the death certificate. For these reasons, we decided to include the certificate in the material available to the reviewer.

86
Statistical measures – conforming to conventions of official statistics In Paper I and II we used a complete data year, and in accordance with the conventions for official statistics we have treated our data as a complete data set rather than as a sample. One consequence is that we did not calculate confidence ranges for the rates and ratios.
In Paper IV, when we tabulate our estimates of the accuracy of the death certificates, we give the re-distribution of causes of death rather than calcu-lations of sensitivity and specificity. This is in accordance with the “compa-rability ratio” method, which in official statistics is the preferred way of showing differences between published statistics and statistics that have been corrected or produced by a different statistical procedure. Although compa-rability ratios do not give a direct measure of the statistics’ ability to capture a specific disease, they give a clearer picture of the presumed correct distri-bution between causes of deaths than sensitivity and specificity figures. They are also very helpful to data users that wish to calculate mortality rates adjusted for observed errors or changes in classification practices.
Record linkage and querying procedures: Future directions Improved data edits at the statistics agency The present difficulties of official mortality statistics can be blamed on many things, including insufficient investigation of the cause of death, careless certification, inconsistent coding and classification and defects in the conceptual framework underlying the statistics. The Background section includes a review of these issues. The record linkage studies (Paper I, II and IV) described in the Material and methods, Results and Discussion sections have a direct bearing on data editing techniques employed by the statistics agency responsible for compiling the mortality statistics. It is now time to consider editing issues in some more detail.
Data edits: at local or central level? It is a truth universally acknowledged that checks on statistical data should be placed as early in the production chain as possible. Preferably, data should be checked already when they are first recorded.96,183 For causes of death, this would mean that the causes of death should be checked by the certifier, or at least before the death certificate leaves the institution where the certificate has been issued.
As has been demonstrated by a large number of studies on the accuracy of mortality statistics, certifiers can hardly be relied on to check their own
87
data.15-22 At larger institutions, however, it might be possible to charge for example a medical records officer with the task to check that the diagnostic terms on the death certificate correspond to the contents of the patients medical record.
However, the ICD rules for selection of underlying cause of death are based on the etiological relationship between the deceased’s various condi-tions, and if these relationships have not been reported correctly on the death certificate form the wrong condition may be selected as the underlying cause of death. Unfortunately, as we noted in Paper IV, medical records do not often contain clear statements on the etiological relationships between the patient’s conditions. The patient’s medical history might be well docu-mented, but the records seldom say that disease A developed as a conse-quence of disease B. Consequently, checking at local level that the sequence of event has been satisfactorily described on the death certificate would be far more challenging than checking that each individual diagnostic is correct.
The staff checking the sequence of events would also need in-depth knowledge of the ICD definitions and conventions and would need specific training to do their job properly. Training the staff, maintaining their know-ledge and coordinating their evaluation practices nation-wide would demand considerable resources. Consequently, although checking at local level would be valuable to ensure that the diagnostics are correct, checking state-ments on the relationships between the deceased’s conditions might be more efficiently done at central level.
Targeting non-obvious errors As has been argued in the Background section (Producing mortality statistics – main stages; Plausibility checks: Querying unsatisfactory death certificates), traditional editing methods based on the compatibility between diagnosis, sex and age are biased. They only capture evident errors although the majority of errors are non-obvious.94,95 Nonetheless these traditional edits are essential since they filter out critical errors – errors that would undermine the credibility of official statistics if they were not corrected. For example, if the official statistics state that an infant died from senile dementia, users of the statistics might well ask themselves if anything in the statistics can be trusted.
Traditional edits are not enough, however. Other editing methods are needed to capture the majority of errors, namely those that are not obvious. The few errors captured and corrected through traditional data edits do not change the overall mortality pattern.84,93 The statistical distribution of causes of death will not be correct until the non-obvious errors too are found and amended.
In Paper IV we evaluated one such method for identifying possibly erro-neous death certificates, based on a comparison between hospital discharge data and the cause of death reported on the death certificate. This is in line

88
with strategies recommended for financial statistics: try to turn inliers to outliers by stratifying more and by linking to other sources of information.183
A data editing method based on the findings from Paper IV, where we evaluated the accuracy of death certificates by ten broad diagnostic groups, would not be discriminating enough, however. The diagnostic groups are too broad and heterogeneous, and requests for additional information would not be sufficiently well targeted. Many faulty certificates would not be included in the high risk groups identified, and at the same time many perfectly correct certificates would be queried. This is a waste of time both for the statistics agency and for the physicians that would be asked to provide the additional information.
To be cost-effective in actual production of mortality statistics, the editing method must be based on smaller and more homogeneous diagnostic groups. With smaller groups the high risk certificates could be narrowed down more accurately, and the editing method would be more efficient.
Establishing error rates for reasonably homogeneous diagnostic groups would demand a big sample of certificates and case summaries or other additional information. Collecting and analysing the material would require considerable resources. Again, this brings the issue of cost-effectiveness to the fore, but since death certification habits are not likely to change dramati-cally from one year to the next, the efforts and costs for estimating error rates could be spread over several years.
Of course, data other than hospital discharges could be used when screening for possibly erroneous death certificates, especially when the focus is on a particular condition. For example, Leweden et al combined the general cause-of-death register, a special register of HIV deaths and the French hospital database on HIV infections, and then used a capture-recap-ture method to assess the number of HIV deaths in France.184 A study by Li, Cass and Cunningham that combined death certificates and a register of renal transplant and dialysis gives another example.185 Such comparisons between causes of death and specialized data sources may give further possibilities to narrow down groups of death certificates that are very likely to be incorrect, and should be explored. This will also lead to more efficient querying strategies.
In sum, then, the studies in Paper I, II and IV have showed that an editing method targeting high-risk groups could work. However, to be efficient in routine production of mortality statistics, the groups must be smaller and more homogeneous than the groups we were able to use in Paper IV.
Reference mortality data set Querying clearly improves the data and also provides much needed feedback to the certifiers. Still, querying is biased and does not necessarily result in a better estimate of the statistical distribution of the leading causes of

89
death.84,93 To achieve an estimate of the correct statistical distribution, we need a method that is less targeted to obviously erroneous death certificates.
For example, a sample of deaths could be used to establish a small, but correct reference data base. This data base would consist of randomly selected and thoroughly queried deaths, and could be used to assess whether the proportions of various causes of death in the general mortality data base are correct. The size of the data base would depend on the degree of detail that is required. A similar approach is suggested by Shojania et al for autop-sies.52
90
Conclusions
Targeting non-obvious errors � Mortality statistics are widely used in research, monitoring of public
health and in health care planning and follow-up. � For Swedish hospital deaths in 1994, the certified underlying cause was
correct in 77% (BTL level). � However, inaccurate cause-of-death certification might seriously under-
mine the usefulness of the statistics. � Requesting additional information from the certifier when the death
certificate is unsatisfactory improves the mortality statistics and provides feedback to certifiers.
� Traditional data edits based on diagnosis, age and sex capture obvious certification errors. However, most errors are not obvious. Therefore, producers of mortality statistics also need to identify and correct non-obvious certification errors.
� Incompatibility between certified cause of death and hospital discharge condition indicates a four times higher risk that the death certificate is inaccurate.
� For some diagnostic groups the death certificate is often inaccurate even when discharge condition and underlying cause are compatible.
� By querying deaths where certified cause of death and main hospital discharge condition are incompatible, and on all deaths in diagnostic groups for which the underlying cause is often inaccurate, producers of official mortality statistics could reduce the number of non-obvious errors in official mortality statistics and improve the usefulness of the statistics.
� The diagnostic groups used to narrow down certificates at high risk of being wrong should be medically homogeneous, otherwise high-risk certificates will not be targeted with sufficient precision and cost-effec-tiveness.
91
ICD definitions: shortcomings and possible improvements
� The ICD definitions and instructions for mortality statistics assume that the deceased died from one single originating cause. However, deaths in the elderly are often due to an accumulation of diseases. Selecting one of them is counter-intuitive.
� Moreover, in medical practice a complication of the originating cause might be easier to control than the originating cause itself.
� Therefore, supplementary statistics should be developed for deaths that are caused by an accumulation of diseases or in which a complication is more amenable to clinical intervention than the originating cause.
� WHO has recently launched the process that will lead to the publication of ICD-11. Concepts, definitions and instructions for mortality statistics should be thoroughly reviewed.
Assessing the accuracy of mortality statistics � Data quality requirements vary with the use of the data. � In studies of mortality data quality, the intended use of the data should be
stated. � Studies on the accuracy of mortality statistics often apply criteria that are
not consistent with the ICD instructions on certification and classification of cause of death.
92
Acknowledgements
As more people than me have discovered, writing a doctoral thesis is diffi-cult to combine with a full-time job. It has been a lengthy process. I started working on the study reported in Paper I more than fourteen years ago, but at that time I had been deeply involved in the subject matter for several years already.
Over this long period I have met many people who in different ways have influenced and helped me in my thesis project. About twenty-five years ago Professor Emeritus Lars Olov Bygren, former medical adviser to the Swedish Cause-of-Death registry, suggested that I might consider writing a thesis on the quality of mortality statistics. Although I did not enrol as a postgraduate until much later, Lars Olov’s sometimes provocative but always engaging views on research certainly got me interested in the matter. As a beginner at the Cause-of-Death registry I also had the good luck of seeing thesis work at close hand. At that time B Ingemar B Lindahl, now Associate Professor at the Stockholm University Department of Philosophy, completed a thesis on the concept of causality in deaths involving rheuma-toid arthritis. Ingemar’s dissecting of the ICD selection rules was a further impulse towards some scientific work of my own. We have stayed in touch over the years, and I am much indebted to Ingemar for carefully reading a draft of my thesis and for his very helpful suggestions.
In 1994, Professor Måns Rosén, former head of the Centre for Epidemi-ology at the Swedish National Board of Health and Welfare, commissioned me to conduct the studies that form the basis of this thesis. I am grateful for his encouragement and for the help of my then superior at Statistics Sweden, Ulla-Brith Rimén, in navigating the administrative waters of obtaining tech-nical support and funding for the work. I would also like to thank my colleagues at Statistics Sweden for their support, and especially Ingrid Florén for invaluable help in collecting the case summaries for Paper IV.
In 1995 Professor Emeritus Björn Smedby, former head of the Nordic WHO Collaborating Centre for Classifications in Health Care, invited me to join the Centre as expert adviser on classification of mortality. I am deeply grateful to Björn for several reasons. First, he has given me his full support from the moment I first mentioned to him that I might write a thesis, not at least in developing and testing the evaluation method used in Paper IV. I am also grateful to Björn that he introduced me to mortality specialists from other parts of the world. He guided me through all aspects of international

93
collaboration, from how to present a scientific paper to an audience with a somewhat variable command of English to Japanese etiquette on eating with chopsticks.
Thanks to Björn I met Dr Harry Rosenberg, former chief of the US mortality statistics. Harry’s contributions to the vital statistics field are legendary, and my tutor Ragnar Westerling and I were proud indeed that Harry agreed to co-author Paper III with us. For many years Harry was my tutor and mentor in mortality statistics, and I was deeply honoured when he chose me to succeed him as chair of the international Mortality Reference Group. I owe Harry thanks for reading and commenting on big parts of an early draft of the thesis, which helped me to find a better structure for my text. Besides, for all these years Harry has remained such a wonderful friend!
In my international work I have met many other people who in different ways have contributed to my thesis. Dr Gérard Pavillon, head of the French Collaborating Centre for Classifications in Health Care, has continually encouraged me to get on with my thesis, even though this often meant that he had to take on more than his equitable share of our common projects. He also found me important information on the early history of mortality statis-tics that is generally not included in English-language overviews. Dr Susan Cole, former medical adviser to the General Register Office for Scotland, taught me that a little pragmatism does not hurt when dealing with the quality of mortality data. I owe special thanks to my very efficient co-chair of the Mortality Reference Group, Dr Donna Hoyert of the US National Center for Health Statistics, who has provided initiated information on the current status of US data quality and also supplied documents that are not readily available through usual library channels. Further, I would like to thank Dr Rosa Gispert of the Catalonia Mortality Registry who sent me papers on quality improvement efforts in Spain; and Sabine Gagel, Eurostat, for guiding me through the intricacies of the Eurostat website and promptly providing information on Eurostat projects on the improvement of mortality data. I am also grateful to Dr Cleone Rooney of the British Office of National Statistics for helping me to make Paper II somewhat easier to follow and for many lively and engaging exchanges on mortality issues.
Six years ago I moved from Statistics Sweden to the National Board of Health and Welfare. There, my former superior Curt-Lennart Spetz some-how found resources for me to complete the time-consuming review of the 1094 case summaries. The encouragement of the present head of the Centre for Epidemiology, Dr Petra Olausson-Otterblad, has been important to me, and I am most grateful to Kristina Bränd Persson, head of the Classifications and Terminology Unit, for telling me in no uncertain words to put some of my regular tasks aside in order to complete my thesis. I am also thankful to Charlotte Björkenstam, Peeter Fredlund and Mats Talbäck for helping me with the regression analysis in Paper IV, and to Professor Bengt Haglund for

94
sound advice at several stages of the project. The experience of specialist coder Ylva Sundin was crucial when we developed the method for reviewing case summaries used in Paper IV. I would also like to thank Edit Orem and her colleagues at the library of the Board of Health and Welfare for their impressively efficient service.
The encouragement and example of Associate Professor Inger Holmström at the Uppsala University Department of Public Health and Caring Sciences, whom I first met as a fellow research student seven years ago, inspired me to keep working at a time when the prospects of completing the thesis seemed very bleak indeed. My tutor, Associate Professor Ragnar Westerling, has patiently guided me through the entire process of conducting research, writ-ing papers and synthesizing the results with scientific rigour, prudence – and quite a lot of humour. I am very thankful indeed that Ragnar did not listen when six or seven years ago I thought of downscaling my thesis and going for a Licentiate degree rather than a PhD. I would also like to thank my fellow research students at the University Department for their support and constructive suggestions. Steve Scott Robson undertook the unenviable task of reviewing my English, and I have much appreciated his efficient help.
In my day-to-day work at the Cause-of-Death Registry I have had the opportunity to discuss the purpose and usefulness of routine mortality statis-tics with a wide range of data users, and some of the ideas put forward in this thesis have originated from such discussions. In particular, I would like to thank Dr Anna Fugelstad, Karolinska Institute, for useful suggestions on how to improve reporting of causes of death, and Dr Eva Samuelsson, Umeå University, and Dr Lilja Sigrún Jónsdóttir, Statistics Iceland, for sharing their thoughts on the pros and cons of traditional underlying cause statistics with me.
Finally I would like to thank my family for their support, especially my indulgent partner Björn Fromén who has not only borne with me for all these years, but also helped me proof-reading reams of material that hardly belongs to his favourite literature.

95
References
1. Rosenberg HM. Cause of death as a contemporary problem. J Hist Med Allied Sci. 1999;54(2):133-53.
2. Hansell AL. Lies, damned lies and mortality statistics? Thorax. 2006;61(11): 923-4.
3. International Statistical Classification of Diseases and Related Health Problems, Tenth Revision. Geneva: World Health Organization; 1992-1994.
4. Hill K. Making deaths count, Bulletin of the World Health Organization. 2006;84(3):162.
5. Wargentin P. Anmärkningar om nyttan af årliga förtekningar på födda och döda i et land. Sjette stycket [Notes on the usefulness of annual lists of deaths and births in a country. Part six] [In Swedish, excerpts in my translation]. Kongl. Svenska Vetenskapsakademiens Handlingar [Proceedings of Swedish Academy of Science]. 1755;(10-12):241-53. Facsimile in Pehr Wargentin - den svenska statistikens fader. [Pehr Wargentin, father of Swedish statistics] Ed. Erland Hofsten. Stockholm: Statistics Sweden; 1983.
6. Nyström E. Den svenska dödsorsaksstatistikens framväxt och tidiga historia [The emergence and early history of Swedish mortality statistics] [In Swedish]. In Hälsa, Sjukdom, Dödsorsak [Health, Disease, Cause of Death]. Malmö: Liber; 1986.
7. Maudsley G, Williams EM. ‘Inaccuracy’ in death certification - where are we now? J Public Health Med. 1996;18(1):59-66.
8. Gjersø P, Andersen SE, Mølbak AG, Wulff HR, Østergaard Thomsen O. Pålideligheden af dødsattester. [The reliability of death certificates] [In Danish] Ugeskr Læger. 1998;160(35):5030-4.
9. Chen L, Walker S, Tong S. The impact of the variation in death certification and coding practices on trends in mortality from ischaemic heart disease. Aust Health Rev. 2002;25(4):189-97.
10. Crowcroft N, Majeed A. Improving the certification of death and the usefulness of routine mortality statistics. Clin Med. 2001;1(2):122-5.
11. Rodriguez SR, Mallonee S, Archer P, Gofton J. Evaluation of death certificate-based surveillance for traumatic brain injury--Oklahoma 2002. Public Health Rep. 2006;121(3):282-9.
12. Svartbo B, Nilsson L, Eriksson A, Bucht G, Johansson LA, Bygren LO. Accu-racy in Using Pneumonia as an Underlying Cause in the Cause-of-Death Register. Journal of Official Statistics, 2000; 16(4):435-44.
13. Kircher T. The autopsy and vital statistics. Hum Pathol. 1990;21(2):166-73. 14. Jansson B, Johansson LA, Rosen M, et al. National adaptations of the ICD rules
for classification - - a problem in the evaluation of cause-of-death trends. J Clin Epidemiol. 1997;50:367-75.

96
15. Kelson MC, Farebrother M. The effect of inaccuracies in death certification and coding practices in the European Economic Community (EEC) on international cancer mortality statistics. Int J Epidemiology. 1987;16(3): 411-4.
16. Balkau B, Jougla E, Papoz L, Eurodiab Subarea C Study Group. European study of the certification and coding of six clinical case histories of diabetic patients. Int J Epidemiology. 1993;22(1):116-126.
17. Whittall DE, Glatthaar C, Knuiman MW, et al. Deaths from diabetes are under-reported in national mortality statistics. Med J Aust. 1990;152:598-600.
18. Myers KA, Farquhar DR. Improving the accuracy of death certification. CMAJ. 1998;158(10):1317-23.
19. Ravakhah K. Death certificates are not reliable: revivification of the autopsy. South Med J. 2006;99(7):728-33.
20. Lakkireddy DR, Gowda MS, Murray CW, Basarakodu KR, Vacek JL. Death certificate completion: how well are physicians trained and are cardiovascular causes overstated? Am J Med. 2004;117(7):492-8.
21. Mant J, Wilson S, Parry J, Bridge P, Wilson R, Murdoch W, Quirke T, Davies M, Gammage M, Harrison R, Warfield A. Clinicians didn’t reliably distinguish between different causes of cardiac death using case histories. J Clin Epidemiol. 2006;59(8):862-7.
22. Swift B, West K. Death certification: an audit of practice entering the 21st century. J Clin Pathol. 2002;55(4):275-9.
23. Jougla E, Papoz L, Balkau B, Maugin P, Hatton F, Eurodiab Subarea C Study Group. Death certificate coding practices related to diabetes in European countries--The ‘EURODIAB Subarea C’ Study. Int J Epidemiology. 1992;21(2): 343-51.
24. Melinder K, Andersson R. Differences in injury mortality between the Nordic countries--with special reference to differences in coding practices. Scand J Soc Med .1998;26(3):190-7.
25. Percy C, Dolman A. Comparison of the coding of death certificates related to cancer in seven countries. Public Health Rep. 1978;93(4):335-50.
26. Percy C, Muir C. The international comparability of cancer mortality data. Results of an international death certificate study. Am J Epidemiol. 1989;129(5): 934-46.
27. Lutz JM, Pury P, Fioretta G, Raymond L. The impact of coding process on observed cancer mortality trends in Switzerland. Eur J Cancer Prev. 2004; 13(1):77-81.
28. Lindahl BI, Glattre E, Lahti R, Magnusson G, Mosbech J. The WHO principles for registering causes of death: suggestions for improvement. J Clin Epidemiol. 1990;43(5):467-74.
29. Gittelsohn A, Senning J. Studies on the reliability of vital and health records: I. Comparison of cause of death and hospital record diagnoses. Am J Public Health 1979;69(7):680-9.
30. Goldacre MJ. Cause-specific mortality: understanding uncertain tips of the iceberg. J Epidemiol Community Health. 1993;47:491-6.
31. Sorensen HT, Sabroe S, Olsen J. A framework for evaluation of secondary data sources for epidemiological research. Int J Epidemiol. 1996;25(2):435-42.
32. Glasser JH. The quality and utility of death certificate data. Am J Public Health. 1981;71(3):231-3.
33. McKenzie K, Walker S, Casey R. Some issues to consider when assessing concordance of death certificates with registry reports. Aust N Z J Public Health. 2004;28(1):87.
97
34. Burton JL, Underwood JC. Necropsy practice after the "organ retention scandal": requests, performance, and tissue retention. J Clin Pathol. 2003;56(7): 537-41.
35. Kock KF, Vestergaard V, Hardt-Madsen M, Garne E. Declining autopsy rates in stillbirths and infant deaths: results from Funen County, Denmark, 1986-96. J Matern Fetal Neonatal Med. 2003;13(6):403-7.
36. Smith CJ, Scott SM, Wagner BM. The necessary role of the autopsy in cardiovascular epidemiology. Hum Pathol. 1998;29(12):1469-79.
37. Roulson J, Benbow EW, Hasleton PS. Discrepancies between clinical and autopsy diagnosis and the value of postmortem histology; a meta-analysis and review. Histopathology. 2005;47(6):551-9.
38. Salib E, Tadros G, Ambrose A. Autopsy in elderly psychiatric inpatients: a retrospective review of autopsy findings of deceased elderly psychiatric inpatients in north Cheshire 1980-1996. Med Sci Law. 2000;40(1):20-7.
39. Zhang JR, Shenoy V, Mangano WE, Chang HH. Hospital autopsies: still valuable in their traditional role but in need of reform. W V Med J. 2000;96(4): 507-11.
40. Kircher T, Nelson J, Burdo H. The autopsy as a measure of accuracy of the death certificate. N Engl J Med. 1985;313(20):1263-9.
41. Behrendt N, Heegaard S, Fornitz GG. Hospitalsobduktionen. En væsentlig faktor i sygehusenes kvalitetssikring [The hospital autopsy. An important factor in hospital quality assurance] [In Danish]. Ugeskr Læger. 1999;161(40):5543-7.
42. Hodgson NF, Stewart TC, Girotti MJ. Autopsies and death certification in deaths due to blunt trauma: what are we missing? Can J Surg. 2000;43(2):130-6.
43. Di Bonito L, Stanta G, Delendi M, Peruzzo P, Gardiman D, Cocchi A, Patriarca S, Giarelli L. Comparison between diagnoses on death certificates and autopsy reports in Trieste: gynaecological cancers. IARC Sci Publ. 1991;(112):63-71.
44. Tsokos M, Schmoldt A. Contribution of nonsteroidal anti-inflammatory drugs to deaths associated with peptic ulcer disease: a prospective toxicological analysis of autopsy blood samples. Arch Pathol Lab Med. 2001;125(12):1572-4.
45. Kircher TL. Autopsy and mortality statistics: making a difference. JAMA. 1992;267(9):1264,1268.
46. Taggart MW, Craver R. Causes of death, determined by autopsy, in previously healthy (or near-healthy) children presenting to a children’s hospital. Arch Pathol Lab Med. 2006;130(12):1780-5.
47. Dödsorsaker 2004. [Causes of death 2004] [In Swedish with English summary] Stockholm: Socialstyrelsen, Epidemiologiskt Centrum [National Board of Health and Welfare, Centre for Epidemiology]; 2007.
48. Hollins S, Attard MT, von Fraunhofer N, McGuigan S, Sedgwick P. Mortality in people with learning disability: risks, causes, and death certification findings in London. Dev Med Child Neurol. 1998;40(1):50-6.
49. Dufková J. Sektionstechnik und rechtliche Grundsatzfragen zur Sektion [Autopsy technique and basic legal aspects of autopsy] [In German] Beitr Gerichtl Med. 1990;48:93-101.
50. Byard RW, Krous HF. Research and sudden infant death syndrome: definitions, diagnostic difficulties and discrepancies. J Paediatr Child Health. 2004;40(8): 419-21.
51. Saracci R. Problems with the use of autopsy results as a yardstick in medical audit and epidemiology. Qual Assur Health Care. 1993;5:339-44.
52. Shojania KG, Burton EC, McDonald KM, Goldman L. Changes in rates of autopsy-detected diagnostic errors over time: a systematic review. JAMA. 2003;289(21):2849-56.
98
53. Rammer L, Gustavsson E, Forsberg M, Ahlm K, Eriksson A. Brister i handlägg-ningen av dödsfall utanför sjukhus [Shortcomings in the coverage of deaths occurring outside hospitals] [In Swedish] Läkartidningen. 1997;94(50):4759-63.
54. Manual of the International Statistical Classification of Diseases, Injuries, and Causes of Death, 9th revision. Geneva: World Health Organization; 1977.
55. Jougla E (project leader). Comparability and Quality Improvement of European Causes of Death Statistics. European Commission DG Sanco Agreement. Final report July 2001. EDC DGV/F3 SOC 98 20108.
56. Minino AM, Rosenberg HM (ed). Proceedings of the International Collabora-tive Effort on Automating Mortality Statistics, Volume II. U.S. Department of Health and Human Services. Centres for Disease Control and Prevention, National Center for Health Statistics. Hyattsville, Maryland, September 2001. DHHS Publication No. 2002-1252.
57. Minino AM, Rosenberg HM (ed). Proceedings of the International Collabora-tive Effort on Automating Mortality Statistics, Volume III. U.S. Department of Health and Human Services. Centres for Disease Control and Prevention, National Center for Health Statistics. Hyattsville, Maryland, November 2006. DHHS Publication No. 2006-1252.
58. See http://ec.europa.eu/comm/eurostat/deathcert/, retrieved on 1 October 2007. 59. Pavillon G, Jougla E, Cherie-Challine L, Hatton F. Assessment of two
alternative methods (guidelines or examples) in completing death certificates. Meeting of WHO Collaborating Centres for the Classification of Diseases, Tokyo 1996. WHO/ESS/ICD/C/96.29.
60. Maudsley G, Williams EM. Death certification by house officers and general practitioners--practice and performance. J Public Health Med. 1993;15(2): 192-201.
61. Hunt R, Barr P. Errors in the certification of neonatal death. J Paediatr Child Health. 2000;36(5):498-501.
62. Morton L, Omar R, Carroll S, Beirne M, Halliday D, Taylor KM. Incomplete and inaccurate death certification--the impact on research. J Public Health Med. 2000;22(2):133-7.
63. Pain CH, Aylin P, Taub NA, Botha JL. Death certification: production and evaluation of a training video. Med Educ. 1996;30(6):434-9.
64. Bell G, Cremona A. Alcohol and death certification: influencing current practice and attitudes. Br J Addict. 1989;84(12):1523-5.
65. Lomas J, Anderson GM, Domnick-Pierre K, Vayda E, Enkin MW, Hannah WJ. Do practice guidelines guide practice? The effect of a consensus statement on the practice of physicians. N. Engl. J. Med. 1989;321(19):1306-11.
66. Horner JS, Horner JW. Do doctors read forms? A one-year audit of medical certificates submitted to a crematorium. J R Soc Med. 1998;91(7):371-6.
67. Gispert R, Arnau JM, Segura A, Procupet A, Domenech J. La eficacia de un seminario informativo sobre la certificación de las causas de defunción [The efficacy of an information seminar on certification of the causes of death] [In Spanish] Gac Sanit. 1988;2(7):185-9.
68. James DS, Bull AD. Death certification: is correct formulation of cause of death related to seniority or experience? J R Coll Physicians Lond. 1995;29(5):424-8.
69. Laurenti R, Lobo da Costa M, Gamboa D, Franco RC. Quality of information declared on the death certificates according to the physician=s length of practice. WHO/HST/ICD/C/96.32.
70. Perez-Gomez B, Aragones N, Pollan M, Suarez B, Lope V, Llacer A, Lopez-Abente G. Accuracy of cancer death certificates in Spain: a summary of available information. Gac Sanit. 2006;20(Supl.3):42-51.

99
71. Donaldson LJ, Parsons L, Cook AJ. Death certification in fractured neck of femur. Public Health. 1989;103:237-43.
72. [No author stated] Öppna jämförelser av hälso- och sjukvårdens kvalitet och effektivitet. Jämförelser mellan landsting 2006. [Open comparisons of health care quality and efficiency. Comparisons between county councils 2006.] [In Swedish] Stockholm: Socialstyrelsen [National Board of Health and Welfare]; 2006.
73. Available through http://www.nordclass.uu. se/index_e.htm, retrieved on 1 October 2007.
74. Rousseau N, McColl E, Newton J, Grimshaw J, Eccles M. Practice based, longitudinal, qualitative interview study of computerised evidence based guidelines in primary care. BMJ. 2003;326(7384):314.
75. Sjoborg B, Backstrom T, Arvidsson LB, Andersen-Karlsson E, Blomberg LB, Eiermann B, Eliasson M, Henriksson K, Jacobsson L, Jacobsson U, Julander M, Kaiser PO, Landberg C, Larsson J, Molin B, Gustafsson LL. Design and implementation of a point-of-care computerized system for drug therapy in Stockholm metropolitan health region--Bridging the gap between knowledge and practice. Int J Med Inform. 2007;76(7):497-506.
76. Holmstrom I. Decision aid software programs in telenursing: not used as intended? Experiences of Swedish telenurses. Nurs Health Sci. 2007;9(1):23-8.
77. Greatbatch D, Hanlon G, Goode J, O’Cathain A, Strangleman T, Luff D. Telephone triage, expert systems and clinical expertise. Sociol Health Illn. 2005;27(6):802-30.
78. Davis BR, Curb JD, Tung B, Hawkins CM, Ehrman S, Farmer J, Martin M. Standardized Physician Preparation of Death Certificates. Control Clin Trials. 1987;8(2):110-20.
79. Remington RD. Who should code cause of death in a clinical trial? Control Clin Trials. 1984;5(3):241-4.
80. Hanzlick R. Pathologists, the death certificate, and hospital quality. Am J Clin Pathol. 1995;104(4 Suppl 1):S128.
81. Hanzlick R. Quality assurance review of death certificates: a pilot study. Am J Forensic Med Pathol. 2005;26(1):63-5.
82. Hanzlick R. Principles for including or excluding ‘mechanisms’ of death when writing cause-of-death statements. Arch Pathol Lab Med. 1997;121(4):377-80.
83. Johansson LA, Bille H, Ahonen H, et al. Cause-of- Death Statistics. In Health Statistics in the Nordic Countries 1997, pp 175-208. Copenhagen: Nordisk Medicinalstatistisk Komité 56:1999.
84. Lahti RA, Penttila A. Cause-of-death query in validation of death certification by expert panel; effects on mortality statistics in Finland, 1995. Forensic Sci Int. 2003;131(2-3):113-24.
85. Percy C, Stanek E 3rd, Gloeckler L. Accuracy of cancer death certificates and its effect on cancer mortality statistics. Am J Public Health. 1981;71(3):242-50.
86. Meeting Report, 2006 Regional Mortality Meeting. Nordic Collaborating Centre for Classifications in Health Care, Uppsala 2006. Available at http://www.nordclass.uu.se/index_e.htm, retrieved on 1 October 2007. The updated graph is available from the Nordic Collaborating Centre for Classifications in Health Care, http://www.nordclass.uu.se.
87. Goldacre MJ, Duncan M, Cook-Mozaffari P, Griffith M. Mortality rates for common respiratory diseases in an English population 1979-1998: artefact and substantive trends. J Public Health (Oxf). 2004;26(1):8-12.

100
88. Lindahl BI, Johansson LA. Multiple cause-of-death data as a tool for detecting artificial trends in the underlying cause statistics: a methodological study. Scand J Soc Med. 1994;22(2):145-58 .
89. Pavillon G, Coleman M, Johansson LA, Jougla E, Kardaun J. Coding of causes of death in the European Community. Final report on automated coding in member states. Eurostat 1998, OS/E3/98/COD/3 en.
90. See http://www.cdc.gov/nchs/about/major/dvs/iceii.htm. Retrieved on 1 October 2007.
91. See http://circa.europa.eu/Public/irc/dsis/health/library – Methodologies – Causes of Death.– ICD-10 Updates – Guidelines for bridge coding studies. Retrieved on 11 November 2007.
92. Hopkins DD, Grant-Worley JA, Bollinger TL. Survey of cause-of-death query criteria used by state vital statistics programs in the US and the efficacy of the criteria used by the Oregon Vital Statistics Program. Am J Public Health. 1989; 79(5):570-4.
93. Hoyert DL, Lima AR. Querying of death certificates in the United States. Public Health Rep. 2005;120(3):288-93.
94. Winkler WE. Problems with inliers. Statistical Commission and Economic Commission for Europe. ECE/STAT/WS/97/82 GE.97- 31639.
95. Van den Broeck J, Cunningham SA, Eeckels R, Herbst K. Data cleaning: detecting, diagnosing, and editing data abnormalities. PLoS Med. 2005; 2(10):e267.
96. Granquist L, Kovar JG. Editing of Survey Data: How much is enough? in Survey Measurement and Process Quality. Wiley, New York 1997, pp 415-35.
97. Lu TH, Chang HY, Hwu CM, Chiu HC, Yin WH, Pan WH. Comparison of official coders versus physician panel in assignment of underlying cause of death. J Formos Med Assoc. 2001;100(6):365-9.
98. Smith Sehdev AE, Hutchins GM. Problems with proper completion and accuracy of the cause-of-death statement. Arch Intern Med. 2001;161(2):277-84.
99. Peach HG, Brumley DJ. Death certification by doctors in non-metropolitan Victoria. Aust Fam Physician. 1998;27(3):178-82.
100. Cordeiro R, Penaloza ER, Cardoso CF, Cortez DB, Kakinami E, Souza JJ, Souza MT, Fernandes RA, Guercia RF, Adoni T. Validity of information on occupation and principal cause on death certificates in Botucatu, Sao Paulo [In Portuguese with English summary] Cad Saude Publica. 1999;15(4):719-28.
101. Fagot-Largeault A. Les causes de la mort - histoire naturelle et facteurs de risque. Paris: Librairie Philosophique J. Vrin; 1989.
102. Rey G, Jougla E, Fouillet A, Pavillon G, Bessemoulin P, Frayssinet P, Clavel J, Hémon D. The impact of major heatwaves on all-cause and cause-specific mortality in France from 1971 to 2003. Int Arch Occup Environ Health. 2007;8(7): 615-26.
103. See http://www.certdc.inserm.fr, retrieved on 1 October 2007. 104. Bureau of the Census. Index of Joint Causes of Death. Washington: Govern-
ment Printing Office; 1914. 105. Mackenbach JP, Kunst AE, Lautenbach H, Bijlsma F, Oei YB. Competing
causes of death: an analysis using multiple-cause-of-death data from The Netherlands. Am J Epidemiol. 1995;141(5):466-75.
106. White L. Alzheimer’s disease: the evolution of a diagnosis. Public Health Rep. 1997;112(6):495-6. (Comment on: Public Health Rep. 1997 Nov-Dec;112(6): 497-505.)
107. Newens AJ, Forster DP, Kay DW. Death certification after a diagnosis of presenile dementia. J Epidemiol Community Health. 1993;47(4):293-7.
101
108. Redelings MD, Wise M, Sorvillo F. Using multiple cause-of-death data to investigate associations and causality between conditions listed on the death certificate. Am J Epidemiol. 2007;166(1):104-8.
109. D’Amico M, Agozzino E, Biagino A, et al. Ill-defined and multiple causes on death certificates - a study of misclassification in mortality statistics. Eur J Epidemiol. 1999;15:141-8.
110. Goldacre MJ, Roberts SE, Griffith M. Multiple-cause coding of death from myocardial infarction: population-based study of trends in death certificate data. J Public Health Med. 2003;25(1):69-71.
111. Calvo-Alen J, Alarcon GS, Campbell R Jr, Fernandez M, Reveille JD, Cooper GS. Lack of recording of systemic lupus erythematosus in the death certificates of lupus patients. Rheumatology (Oxford). 2005;44(9):1186-9.
112. Described in http://www.who.int/classifications/committees/ mrg.pdf, retrieved on 2 October 2007.
113. Samuelsson E, Hedenmalm K, Persson I. Mortality from venous thrombo-embolism in young Swedish women and its relation to pregnancy and use of oral contraceptives--an approach to specifying rates. Eur J Epidemiol. 2005;20(6): 509-16.
114. Hedenmalm K, Samuelsson E. Fatal venous thromboembolism associated with different combined oral contraceptives: a study of incidences and potential biases in spontaneous reporting. Drug Saf. 2005;28(10):907-16.
115. Mathers CD, Fat DM, Inoue M, Rao C, Lopez AD. Counting the dead and what they died from: an assessment of the global status of cause of death data. Bull World Health Organ. 2005;83(3):171-7.
116. Johansson LA, Pavillon G, Anderson R, Glenn D, Griffiths C, Hoyert D, Jackson G, Notzon FS, Rooney C, Rosenberg HM, Walker S, Weber S. Counting the dead and what they died of. Bull World Health Organ. 2006;84(3):254.
117. Announced at http://www.who.int/mediacentre/news/releases/2007/pr13/en/ index.html, retrieved on 1 October 2007.
118. Westerling R. Studies of avoidable factors influencing death: a call for explicit criteria. Qual Health Care. 1996;5(3):159-65.
119. Holland WW, ed. European Community atlas of avoidable death, 2nd ed. Vol 1. Oxford: Commission of the European Communities Health Services Medical Publications, Research series No 3; 1991.
120. Thomas EJ, Brennan TA. Incidence and types of preventable adverse events in elderly patients: population based review of medical records. BMJ. 2000;320(7237):741-4.
121. Pietro DA, Shyavitz LJ, Smith RA, et al. Detecting and reporting medical errors: why the dilemma? BMJ. 2000;320(7237):794-6.
122. Barach P, Small SD. Reporting and preventing medical mishaps: lessons from non-medical bear miss reporting systems. BMJ. 2000;320(7237):759-63.
123. Nystrom L, Larsson LG, Rutqvist LE, et al. Determination of cause of death among breast cancer cases in the Swedish randomized mammography screening trials. A comparison between official statistics and validation by an endpoint committee. Acta oncologica. 1995;34(2):145-52.
124. Chow WH, Devesa SS. Underreporting and misclassification of urinary tract cancer cases on death certificates. Epidemiology. 1996;7:517-20.
125. Muhlhauser I, Sawicki PT, Blank M, Overmann H, Richter B, Berger M. Reliability of causes of death in persons with Type I diabetes. Diabetologia. 2002;45(11):1490-7.

102
126. Lenfant C, Friedman L, Thom T. Fifty years of death certificates: the Framingham Heart Study. Ann Intern Med. 1998;129(12):1066-7.
127. Lauer MS, Blackstone EH, Young JB, Topol EJ. Cause of death in clinical research: time for a reassessment? J Am Coll Cardiol. 1999;34(3):618-20.
128. Tabar L, Duffy SW, Yen MF, Warwick J, Vitak B, Chen HH, Smith RA. All-cause mortality among breast cancer patients in a screening trial: support for breast cancer mortality as an end point. J Med Screen. 2002;9(4):159-62.
129. Weng C, Coppini DV, Sönksen PHl. Linking a hospital diabetes database and the National Health Service Central Register: a way to establish accurate mortality and movement data. Diabet Med. 1997;14:877-83.
130. Hughes TS, Muldoon SB, Tollerud DJ. 331-9.Underestimation of mortality due to chronic obstructive pulmonary disease (COPD) in Kentucky. J Ky Med Assoc. 2006;104(8):331-9.
131. Agren G, Jakobsson SW. Validation of diagnoses on death certificates for male alcoholics in Stockholm. Forensic Sci. Int. 1987;33(4):231-41.
132. Daula M, Hanzlick R. Evaluation of certifier practices regarding alcohol-related deaths: Fulton County Medical Examiner’s Center, Atlanta, Georgia, 2004. Am J Forensic Med Pathol. 2006;27(4):355-8.
133. Luepker RV. Cardiovascular disease among Mexican Americans. Am J Med. 2001;110(2):147-8.
134. Parker MJ, Anand JK. What is the true mortality of hip fractures? Public Health. 1991;105(6):443-6.
135. [No author stated] History of the development of the ICD. In International Statistical Classification of Diseases and Related Health Problems. Tenth Revision. Volume 2. Geneva: World Health Organization; 1993.
136. Fuhrman C, Jougla E, Nicolau J, Eilstein D, Delmas MC. Deaths from chronic obstructive pulmonary disease in France, 1979-2002: a multiple cause analysis. Thorax. 2006;61(11):930-4.
137. Goldacre MJ, Duncan ME, Cook-Mozaffari P, Neil HA. Trends in mortality rates for death-certificate-coded diabetes mellitus in an English population 1979-99. Diabet Med. 2004;21(8):936-9.
138. Goldacre MJ, Duncan ME, Griffith M, Cook-Mozaffari P. Psychiatric disorders certified on death certificates in an English population. Soc Psychiatry Psychiatr Epidemiol. 2006;41(5):409-14.
139. Jougla E, Pequignot F, Chappert J, Rossollin F, Le Toullec A, Pavillon G. La qualité de données de mortalité sur le suicide [Quality of suicide mortality data] [In French] Rev Epidemiol Sante Publique. 2002;50(1):49-62.
140. Westerling R. Small-area variation in multiple causes of death in Sweden--a comparison with underlying causes of death. Int J Epidemiol. 1995;24(3):552-8.
141. Wall MM, Huang J, Oswald J, McCullen D. Factors associated with reporting multiple causes of death. BMC Med Res Methodol. 2005;5(1):4.
142. Iezzoni LI, Foley SM, Daley J, Hughes J, Fisher ES, Heeren T. Comorbidities, complications, and coding bias. Does the number of diagnosis codes matter in predicting in-hospital mortality? JAMA. 1992;267(16):2197-203.
143. Hanzlick R. Improving the accuracy of death certificates. JAMA. 1995;274(7): 537-8.
144. Pavillon G, Jougla E, Maguin P. Multiple causes of death analysis - proposition of routine data publication. Meeting on Multiple causes of morbidity and mortality. World Health Organisation, Meeting on Multiple Causes of Morbidity and Mortality. ESS/ICD/MC/94.13, London, April 1994.
145. Dödsorsaker 1995. [Causes of Death 1995] Stockholm: Statistiska Centralbyrån [Statistics Sweden]; 1997.

103
146. The Swedish Hospital Discharge Register 1987-1995. Stockholm: National Board of Health and Welfare, Centre for Epidemiology; 1997.
147. Blomqvist P, Ekbom A, Carlsson P, Ahlstrand C, Johansson JE. Benign prostatic hyperplasia in Sweden 1987 to 1994: changing patterns of treatment, changing patterns of cost. Urology. 1997;50(2):214-20.
148. KS87. [Swedish version of International Classification of Diseases, Ninth Revision] Stockholm: Socialstyrelsen [National Board of Health and Welfare]; 1986.
149. Klassifikation av operationer. Sjätte upplagan [Classification of operations, Sixth edition.] Stockholm: Socialstyrelsen [National Board of Health and Welfare]; 1993.
150. Klassificering av dödsorsaker i svensk statistik [Classification of Causes of Death in Swedish Statistics] [In Swedish]. Stockholm: Statistiska centralbyrån [Statistics Sweden]. Reports on Statistical Co-ordination 1990:3.
151. Sidenius KE, Munch EP, Madsen F, Lange P, Viskum K, Soes-Petersen U. Accuracy of recorded asthma deaths in Denmark in a 12-months period in 1994/95. Respir Med. 2000;94(4):373-7.
152. Jorgensen IM, Bulow S, Jensen VB, Dahm TL, Prahl P, Juel K. Asthma mortality in Danish children and young adults, 1973-1994: epidemiology and validity of death certificates. Eur Respir J. 2000;15(5):844-8.
153. May KL. Death certificates in asthma and COPD patients (survey of statistical data in Warsaw). Monaldi Arch Chest Dis. 2002;57(5-6):253-7.
154. The Mortality Medical Data System, MICAR, ACME and TRANSAX. National Center for Health Statistics, 1990.
155. Hansell AL, Walk JA, Soriano JB. What do chronic obstructive pulmonary disease patients die from? A multiple cause coding analysis. Eur Respir J. 2003;22(5):809-14.
156. Lu TH, Shih TP, Lee MC, Chou MC, Lin CK. Diversity in death certification: a case vignette approach. J Clin Epidemiol. 2001;54(11):1086-93.
157. Thomas BM, Starr JM, Whalley LJ. Death certification in treated cases of presenile Alzheimer’s disease and vascular dementia in Scotland. Age Ageing. 1997;26(5):401-6.
158. Calder SJ, Anderson GH, Gregg PJ. Certification of cause of death in patients dying soon after proximal femoral fracture. BMJ. 1996;312:1515.
159. Koehler SA, Weiss HB, Shakir A, Shaeffer S, Ladham S, Rozin L, Dominick J, Lawrence BA, Miller TR, Wecht CH. Accurately assessing elderly fall deaths using hospital discharge and vital statistics data. Am J Forensic Med Pathol. 2006;27(1):30-5.
160. Start RD, Bury JP, Strachan AG, Cross SS, Underwood JC. Evaluating the reliability of causes of death in published clinical research. BMJ. 1997; 314(7076):271.
161. Brown DL, Al-Senani F, Lisabeth LD, Farnie MA, Colletti LA, Langa KM, Fendrick AM, Garcia NM, Smith MA, Morgenstern LB. Defining Cause of Death in Stroke Patients: The Brain Attack Surveillance in Corpus Christi Project. Am J Epidemiol. 2006;165(5):591-6.
162. Weingart SN, Wilson RM, Gibberd RW, Harrison B. Epidemiology of medical error. BMJ. 2000;320(7237):774-7.
163. Nath U, Thomson R, Wood R, Ben-Shlomo Y, Lees A, Rooney C, Burn D. Population based mortality and quality of death certification in progressive supranuclear palsy (Steele-Richardson-Olszewski syndrome). J Neurol Neurosurg Psychiatry. 2005;76(4):498-502.

104
164. Moy CS, Albert DM, Diener-West M, McCaffrey LD, Scully RE, Willson JK. Cause-specific mortality coding. methods in the collaborative ocular melanoma study. COMS report no. 14. Control Clin Trials. 2001;22(3):248-62.
165. Laplanche A. Qualité des certificats de décès en cas de décès par cancer en France. [Quality of death certificates in cases of cancer death in France] [In French] Bull Cancer. 1998;85(11):967-9.
166. Hoyert D, MacDorman M, Rosenberg H: Effect of changes in death certificate format on cause-specific mortality trends, US, 1972-92. WHO/HST/ICD/c/ 96.46.
167. Eurostat 2006. European COD statistics - Recommendations for items to be collected for the national mortality file. Final report of the Task Force on “Minimum Requirements for the European Death Certificate / European COD statistics”, 29 September 2006. Eurostat, Luxembourg. Available at http://circa.europa.eu/Public/irc/dsis/health/library, “Methodologies and data collections”, “Causes of death”.
168. Rimsza ME, Schackner RA, Bowen KA, Marshall W. Can child deaths be prevented? The Arizona Child Fatality Review Program experience. Pediatrics. 2002;110(1 Pt 1):e11.
169. Crowcroft NS, Andrews N, Rooney C, Brisson M, Miller E. Deaths from pertussis are underestimated in England. Arch Dis Child. 2002;86(5):336-8.
170. Sington JD, Cottrell BJ. Analysis of the sensitivity of death certificates in 440 hospital deaths: a comparison with necropsy findings. J Clin Pathol. 2002; 55(7):499-502.
171. Arudo J, Gimnig JE, ter Kuile FO, Kachur SP, Slutsker L, Kolczak MS, Hawley WA, Orago AS, Nahlen BL, Phillips-Howard PA. Comparison of government statistics and demographic surveillance to monitor mortality in children less than five years old in rural western Kenya. Am J Trop Med Hyg. 2003;68(4 Suppl):30-7.
172. Alderson MR, Meade TW. Accuracy of diagnosis on death certificates compared with that in hospital records. Brit J pre soc Med. 1967;21(1):22-9.
173. [No author stated] Värdering av diagnoskvaliteten för akut hjärtinfarkt i patientregistret 1987 och 1995 [Evaluation of diagnostic quality of acute myocardial infarction in the hospital discharge register] [In Swedish]. Stockholm: Socialstyrelsen, Epidemiologiskt Centrum. [National Board of Health and Welfare, Centre for Epidemiology]; 2000.
174. Jensen HH, Godtfredsen NS, Lange P, Vestbo J. Potential misclassification of causes of death from COPD. Eur Respir J. 2006;28(4):781-5.
175. Laurenti R, S. Giannella, CM Buchalla, de Mello Jorge MHP, Gotlieb SLD, Zoca de Oliveira B, Chiavegatto A. Are the rules for selection of the cause of death useful for the selection of the “true” underlying cause? Annual meeting of Heads of WHO Collaborating Centers for the Family of International Classifications. Cologne, Germany. WHO/HFS/CAS/03.88.
176. Johansson LA, Strand E. Rule 3 and pneumonia – Selecting an underlying cause by applying the selection rules compared to deriving an underlying cause from case summaries. Internal report, Socialstyrelsen, Stockholm 2006. Availabale at http://www.socialstyrelsen.se/NR/rdonlyres/989F2672-19B9-420C-A72A-097519FFAD44/0/PneumRule3_2003.doc. Retrieved on 7 December 2007.
177. Bloor MJ. A minor office: the variable and socially constructed character of death certification in a Scottish city. Health Soc Behav. 1991;32(3):273-87.
178. Donabedian A. Criteria and standards for quality assessment and monitoring. QRB Qual Rev Bull. 1986;12(3):99-108.

105
179. Nilsson AC, Spetz CL, Carsjö K, et al: Slutenvårdsregistrets tillförlitlighet [The reliability of the Hospital Discharge Register] [In Swedish]. Läkartidningen 1994;91:598-605.
An English version was presented at the 1998 meeting of the Heads of the Collaborating Centres for the Classification of Diseases: Carsjö K, Spetz CL, Smedby B. Evaluation of the Data Quality in the Swedish National Hospital Discharge Register. WHO/GPE/ICD/C/98.34.
180. Lu TH, Tsau SM, Wu TC. The Automated Classification of Medical Entities (ACME) system objectively assessed the appropriateness of underlying cause-of-death certification and assignment. J Clin Epidemiol. 2005;58(12): 1277-81.
181. Johansson LA, Pavillon G, Trotter M. A comparison and analysis of ICD-10 underlying cause coding differences among three coding systems: manual coding, ACME system, and Styx system. In Proceedings of the International Collaborative Effort on Automating Mortality Statistics, Volume II. U.S. Department of Health and Human Services. Centres for Disease Control and Prevention, National Center for Health Statistics. Hyattsville, Maryland, September 2001. DHHS Publication No. 2002-1252.
182. Dödsorsaker 1987. [Causes of Death 1987] Stockholm: Statistiska Centralbyrån [Statistics Sweden]; 1989.
183. Mazur C. A statistical edit for livestock slaughter data. United States Depart-ment of Agriculture. National Agricultural Statistics Service, Research and Applications Division. SRB Research Report Number SRB-90-01. October 1990.
184. Lewden C, Jougla E, Alioum A, Pavillon G, Lievre L, Morlat P, Salmon D, May T, Chene G, Costagliola D; the Mortalite 2000 Study Group. Number of deaths among HIV-infected adults in France in 2000, three-source capture-recapture estimation. Epidemiol Infect. 2006;134(6):1345-52.
185. Li SQ, Cass A, Cunningham J. Cause of death in patients with end-stage renal disease: assessing concordance of death certificates with registry reports. Aust N Z J Public Health. 2003;27(4):419-24.

Acta Universitatis UpsaliensisDigital Comprehensive Summaries of Uppsala Dissertationsfrom the Faculty of Medicine 305
Editor: The Dean of the Faculty of Medicine
A doctoral dissertation from the Faculty of Medicine, UppsalaUniversity, is usually a summary of a number of papers. A fewcopies of the complete dissertation are kept at major Swedishresearch libraries, while the summary alone is distributedinternationally through the series Digital ComprehensiveSummaries of Uppsala Dissertations from the Faculty ofMedicine. (Prior to January, 2005, the series was publishedunder the title “Comprehensive Summaries of UppsalaDissertations from the Faculty of Medicine”.)
Distribution: publications.uu.seurn:nbn:se:uu:diva-8420
ACTA
UNIVERSITATIS
UPSALIENSIS
UPPSALA
2008