An Evaluation of the Getting it Right: Literacy and Numeracy Strategy in Western Australian Schools
144
Australian Council for Educational Research ACEReSearch Evaluation of Educational Policy and Reform Programs Teaching and Learning and Leadership 1-1-2008 An Evaluation of the Getting it Right: Literacy and Numeracy Strategy in Western Australian Schools Marion Meiers ACER, [email protected] Lawrence Ingvarson ACER, [email protected] Adrian Beavis ACER, [email protected] John Hogan ACER Elizabeth Kleinhenz ACER, [email protected] This Report is brought to you for free and open access by the Teaching and Learning and Leadership at ACEReSearch. It has been accepted for inclusion in Evaluation of Educational Policy and Reform Programs by an authorized administrator of ACEReSearch. For more information, please contact [email protected]. Recommended Citation Meiers, Marion; Ingvarson, Lawrence; Beavis, Adrian; Hogan, John; and Kleinhenz, Elizabeth, "An Evaluation of the Getting it Right: Literacy and Numeracy Strategy in Western Australian Schools" (2008). Evaluation of Educational Policy and Reform Programs. http://research.acer.edu.au/policy_reform/2
-
Upload
independent -
Category
Documents
-
view
0 -
download
0
Transcript of An Evaluation of the Getting it Right: Literacy and Numeracy Strategy in Western Australian Schools

Australian Council for Educational ResearchACEReSearchEvaluation of Educational Policy and ReformPrograms Teaching and Learning and Leadership
1-1-2008
An Evaluation of the Getting it Right: Literacy andNumeracy Strategy in Western Australian SchoolsMarion MeiersACER, [email protected]
Lawrence IngvarsonACER, [email protected]
Adrian BeavisACER, [email protected]
John HoganACER
Elizabeth KleinhenzACER, [email protected]
This Report is brought to you for free and open access by the Teaching and Learning and Leadership at ACEReSearch. It has been accepted forinclusion in Evaluation of Educational Policy and Reform Programs by an authorized administrator of ACEReSearch. For more information, pleasecontact [email protected].
Recommended CitationMeiers, Marion; Ingvarson, Lawrence; Beavis, Adrian; Hogan, John; and Kleinhenz, Elizabeth, "AnEvaluation of the Getting it Right: Literacy and Numeracy Strategy in Western Australian Schools"(2008). Evaluation of Educational Policy and Reform Programs.http://research.acer.edu.au/policy_reform/2

An Evaluation of the Getting it Right: Literacy and Numeracy Strategy in Western
Australian Schools
Final Report
Volume 1
Evaluation of the GiR-LNS
Marion Meiers, Lawrence Ingvarson, Adrian Beavis, John Hogan, Elizabeth Kleinhenz


About this report
This evaluation report is presented in two volumes. Volume 1, Evaluation of the GiR-LNS is focused mainly on the survey component of the evaluation. The complete data set from the surveys undertaken in 2003 and 2004 is analysed, and conclusions drawn from these analyses. The concluding sections draw on the survey data, some research literature and the illustrative case studies to report on the effectiveness of the GiR-LNS as a strategy for professional development, and as a strategy for change. Volume 2, Getting it Right in Context, presents the findings from the illustrative case studies. Twenty schools from across Western Australia were selected for the case studies, in consultation with the Department of Education. Ten of these schools had GiR-LNS literacy Specialist teachers and ten had GiR-LNS numeracy Specialist Teachers. Researchers visited these schools on three occasions over the two years. The reports of the case studies describe how the Getting it Right: Literacy and Numeracy Strategy had been implemented in schools.
ACER Evaluation of the GIR-LNS in WA Schools
iii


ACKNOWLEDGEMENTS
ACER Evaluation Team Dr Lawrence Ingvarson, Research Director, Teaching and Learning Research Program Ms Marion Meiers, Senior Research Fellow, Project Director Dr Adrian Beavis, Principal Research Fellow Dr Elizabeth Kleinhenz, Research Fellow Mr John Hogan, WA, Consultant ACER Administrative Support Ms Lucy Bastecky, Administrative Officer Dr Emma Curtin, Administrative Officer Clare Ozolins ACER Project Support Services Mr Jim Carrigan and staff The evaluation team also wishes to acknowledge the contribution made by Ms Elaine Robinson, Ms Lyn Beeley (Victoria) and Ms Wendy Devlin (WA) in 2004 and 2005 in assessing all written survey responses, including the literacy and numeracy scenarios. The project team acknowledges the significant advice and support provided by all members of the Getting it Right central project team in the Western Australian Department of Education. The contribution of principals, Specialist Teachers, and classroom teachers to the surveys and case studies is very much appreciated. The case study schools welcomed the evaluators’ presence in their schools and classrooms, and supported the evaluation with their practical experience, observations and insights.
ISBN 978-0-86431-607-3
ACER Evaluation of the GIR-LNS in WA Schools
v


CONTENTS
ACKNOWLEDGEMENTS ................................................................ v
LIST OF TABLES ....................................................................... ix
LIST OF FIGURES ..................................................................... xii
EXECUTIVE SUMMARY .................................................................1
Evaluation of the Getting it Right - Literacy and Numeracy Strategy...................... 1
Data gathering methods............................................................................................. 1
Survey responses ....................................................................................................... 2
The implementation of the GiR-LNS........................................................................ 2
Training for Specialist Teachers ............................................................................... 3
The impact of the GiR-LNS...................................................................................... 4
Looking ahead ........................................................................................................... 4 1. INTRODUCTION: THE GETTING IT RIGHT - LITERACY AND NUMERACY STRATEGY ...............................................................................7
Developing expertise................................................................................................. 7
Specialist Teachers.................................................................................................... 8
Student achievement data.......................................................................................... 9
Evaluating the Getting it Right - Literacy and Numeracy Strategy .......................... 9
The evaluation questions......................................................................................... 10
The evaluation model .............................................................................................. 10
Intermediate Outcomes ........................................................................................... 12
Data gathering ......................................................................................................... 13 2. THE SURVEY STUDY.............................................................. 17
The data ................................................................................................................... 17 3. THE GiR-LNS IN SCHOOLS: IMPLEMENTATION .............................. 21
Working with the Getting it Right-Literacy and Numeracy Strategy ..................... 21
Selection of teachers to work with the Specialist Teacher...................................... 26
Resources to support the work of Specialist Teachers............................................ 27
Connections between the GiR-LNS and other school programs............................. 28
Setting targets.......................................................................................................... 29
Summary ................................................................................................................. 31 4. THE GETTING IT RIGHT TRAINING FOR SPECIALIST TEACHERS .......... 33
Literacy Specialist Teachers.................................................................................... 33
Numeracy Specialist Teachers ................................................................................ 35
ACER Evaluation of the GIR-LNS in WA Schools
vii

5. WORKING ‘SHOULDER TO SHOULDER’........................................ 37
Implementation of the ‘Shoulder to Shoulder’ concept .......................................... 37
Diagnosis, planning and reflection.......................................................................... 38
Patterns of working shoulder to shoulder at the classroom level ............................ 42
Working at the school level..................................................................................... 47 6. IMPACT OF THE GIR-LNS ON THE PROFESSIONAL KNOWLEDGE OF SPECIALIST TEACHERS AND THEIR COLLEAGUES .............................. 55
Impact on knowledge and understanding................................................................ 56
Impact of GIR-LNS on classroom practices ........................................................... 61
The impact of the GiR-LNS on student assessment strategies and instruments ..... 65
Principals’ views on the impact of the Getting it Right: Literacy and Numeracy Strategy.................................................................................................................... 76
Principals’ and teachers’ views of the impact of the GiR-LNS on teachers’ professional learning ............................................................................................... 79
Effects of working with the Specialist Teacher on teachers’ efficacy .................... 82 7. SUSTAINING THE BENEFITS OF THE GiR-LNS................................ 83
The sustainablity of Getting it Right practices in schools....................................... 83
Numeracy classroom teachers................................................................................. 87
Principals’ views on the sustainability of GiR activities......................................... 89
Factors that facilitated or hindered the Getting it Right strategy in schools ........... 90
How could the Getting it Right strategy be improved?........................................... 93
The most important support that Specialist Teachers received from their school .. 97 8. EFFECTIVE CONDITIONS FOR IN-CLASS SUPPORT .........................107
9. GETTING IT RIGHT AS A REFORM STRATEGY ..............................111
Linking policy to practice ..................................................................................... 111
Comparing the GiR-LNS with research on effective professional learning.......... 112
Concluding comment ............................................................................................ 121 10. CONCLUSION....................................................................123
The focus of the evaluation ................................................................................... 123
The Specialist Teachers and their colleagues........................................................ 123
Working shoulder to shoulder ............................................................................... 124
The impact of the GiR-LNS.................................................................................. 125
Positive outcomes for teaching ............................................................................. 126
Looking ahead ....................................................................................................... 126
ACER Evaluation of the GIR-LNS in WA Schools
viii

LIST OF TABLES
Table 1 Number of respondents to each survey ...................................................................... 17
Table 2 Response rate to each survey...................................................................................... 18
Table 3 Number of respondents linked to a cohort for each survey in 2003 and 2004 ........... 18
Table 4 Time fraction spent working as a Specialist Teacher................................................. 21
Table 5 Literacy - No. of Terms with the Literacy ST (percentage) ....................................... 22
Table 6 Literacy - No. of planning sessions per week with literacy Specialist Teacher ......... 22
Table 7 Literacy - Average duration of collaborative planning sessions (minutes) ................ 22
Table 8 Literacy - No. of sessions per week of in-class support provided by the Specialist Teacher (percentages) ................................................................................................ 23
Table 9 Literacy - Average duration of in-class support sessions (minutes)........................... 23
Table 10 Literacy - Who else assists when classroom teacher and Specialist Teacher work together in the classroom? (percentages) ................................................................ 23
Table 11 Numeracy classroom teachers - No. of terms working with Specialist Teacher ...... 24
Table 12 Numeracy teachers - No. of collaborative planning sessions per week with the Specialist Teacher (percentage) .............................................................................. 24
Table 13 Numeracy - Average length of planning sessions with Specialist Teacher (minutes)25
Table 14 Numeracy - No. of teaching sessions per week with Specialist Teacheer ............... 25
Table 15 Numeracy - Average length of class sessions with the Specialist Teacher (minutes)25
Table 16 Numeracy - Who else assists when classroom teacher and GiR ST work together in the classroom? (percentages) .................................................................................. 26
Table 17 Criteria for selecting teachers to work with the Specialist Teacher 2003 (percentages) ........................................................................................................... 27
Table 18 Involvement in target setting (percentages) ............................................................. 30
Table 19 Data used in setting targets 2003 and 2004 (percentages) ....................................... 31
Table 20 Modifying targets 2003 and 2004 (percentages) ...................................................... 31
Table 21 Literacy Specialist Teachers 2004 - resources used with colleagues (n=63) ........... 38
Table 22 Numeracy Specialist Teachers 2004 - Resources used with colleagues (n=53)...... 38
Table 23 Activities the literacy Specialist Teacher had helped teachers to carry out on which Cohort 1 differed from Cohort 2 ............................................................................. 42
Table 24 Items with statistically significant differences between Cohorts 1 and 2 in 2003 or 2004 of Literacy Specialist Teachers on the mean frequency and mean usefulness of various activities ................................................................................................. 45
Table 25 Statistically significant differences in the mean frequency and usefulness of various activities with literacy Specialist Teachers, as reported by classroom teachers in 2003 and 2004......................................................................................................... 50
Table 26 Statistically significant differences in the mean frequency and usefulness of various activities with literacy Specialist Teachers, as reported by classroom teachers in 2003 and 2004......................................................................................................... 50
ACER Evaluation of the GIR-LNS in WA Schools
ix

Table 27 Sources of ideas for improvements in teaching over past year or two (percentages)56
Table 28 Mean score of literacy Specialist Teachers’ judgments about the impact of GiR-LNS training on their professional knowledge................................................................ 57
Table 29 Mean score of numeracy Specialist Teachers’ judgments about the impact of GiR-LNS training on their professional knowledge ....................................................... 58
Table 30 Mean score of literacy classroom teachers’ judgments about the impact of GiR-LNS Specialist Teachers on their knowledge.................................................................. 60
Table 31 Mean score of numeracy classroom teachers’ judgments about the impact of GiR-LNS Specialist Teachers on their professional knowledge..................................... 61
Table 32 Mean score of literacy classroom teachers’ judgments on the impact of GiR on teaching practice ......................................................................................................62
Table 33 Mean score of numeracy classroom teachers’ judgments on the impact of GiR on teaching practice ......................................................................................................57
Table 34 Task: Working with Students at Risk....................................................................... 67
Table 35 Mean score on literacy subscales and total score for Cohorts 1 and 2 in 2003 and 2004......................................................................................................................... 68
Table 36 Proportion of missing data for each item of Scenario 1, 2003 and 2004 ................. 70
Table 37 Proportion of missing data for each item of Scenario 2, 2003 and 2004 ................. 72
Table 38 Proportion of missing data for each item of Scenario 3, 2003 and 2004 ................. 73
Table 39 Proportion of missing data for each item of Scenario 3, 2003 and 2004 ................. 75
Table 40 Mean score of principal’s judgment on the impact of GiR-LNS on teachers, for 2003 and 2004 (statistically significantly differences in bold type) ................................ 76
Table 41 Principals’ reports of outcomes of the GiR-LNS in 2003 and 2004 (percentages). . 78
Table 42 Impact of the GiR-LNS on principals’ knowledge and understanding in 2003 and 2004 (percentages). ................................................................................................. 79
Table 43 Principal and teacher comparisons of impact of the GiR-LNS experience with impact of best other PD activity over the past three years (percentages)................ 79
Table 44 GiR–LNS meeting important school needs in 2003 and 2004 (percentages)........... 80
Table 45 GiR-LNS meeting important school needs (percentages). ....................................... 80
Table 46 Better ways of meeting school needs 2003 and 2004 (percentages). ....................... 81
Table 47 Influence of GiR on efficacy: Literacy teachers (percentages, n=263).................... 82
Table 48 Influence of GiR on efficacy: Numeracy teachers (percentages, n=256)................ 82
Table 49 Factors that facilitated the GiR-LNS in the school in 2003 and 2004 (percentages) 90
Table 50 Factors that hindered the GiR-LNS in the school (percentages). ............................. 91
Table 51 Plans for sustaining changes in 2003 and 2004 (percentages) ................................. 92
Table 52 Number of valid and missing cases for each of three factors describing how the GiR-LNS could be improved as a strategy for assisting literacy Specialist Teachers to meet the professional learning needs of classroom colleagues, 2003 and 2004 . 94
Table 53 Number of valid and missing cases for each of three factors describing how the GiR-LNS could be improved as a strategy for assisting numeracy Specialist Teachers to meet the professional learning needs of classroom colleagues, 2003 and 2004......................................................................................................................... 94
ACER Evaluation of the GIR-LNS in WA Schools
x

Table 54 Number of valid and missing cases for each of three factors describing the most important support that literacy Specialist Teachers had received from their school, 2003 and 2004......................................................................................................... 97
Table 55 Number of valid and missing cases for each of three factors describing the most important support that numeracy Specialist Teachers had received from their school, 2003 and 2004 ............................................................................................ 98
Table 56 Number of valid and missing cases for each of three factors describing factors that had hindered their capacity to carry out their role as a literacy Specialist Teacher in their school, 2003 and 2004 .................................................................................. 101
Table 57 Number of valid and missing cases for each of three factors describing factors that had hindered their capacity to carry out their role as a numeracy Specialist Teacher in their school, 2003 and 2004 .............................................................................. 102
Table 58 Principles for the Design of Effective Professional Development (Hawley & Valli, 1999) 106
ACER Evaluation of the GIR-LNS in WA Schools
xi

LIST OF FIGURES
Figure 1 Percentage of principals reporting various types of resources provided to support the Special Teacher in 2003 (n=144) and 2004 (n=141) .....................................................28
Figure 2 Extent to which GiR was connected to other programs in the school..............................29
Figure 3 Literacy Specialist Teachers’ views on the extent to which various outcomes were achieved as a result of the GiR-LNS training sessions for Specialist Teachers contrasting 2003 and 2004 – per cent indicating to a moderate or major extent. ..........34
Figure 4 Numeracy Specialist Teachers’ views on the extent to which various outcomes were achieved as a result of the GiR-LNS training sessions for Specialist Teachers contrasting 2003 and 2004 – per cent indicating to a moderate or major extent. ..........35
Figure 5 Mean for how often literacy Specialist Teachers and classroom teachers reported that the Specialist Teacher had helped teachers to carry out various activities in 2004 (1=never, 2=sometimes, 3=often, 4=always) .................................................................................40
Figure 6 Mean for how often numeracy Specialist Teachers and classroom teachers reported that the Specialist Teacher had helped teachers to carry out various activities in 2004 .......41
Figure 7 Mean scores for how often literacy classroom teachers engaged in various activities in the previous month contrasting Specialist Teacher and classroom teachers, 2004 (1=never, 2=once a term, 3=once a month, 4=every week)...........................................44
Figure 8 Mean scores for how often classroom teachers engaged in various activities in the previous month contrasting numeracy Specialist Teacher and classroom teachers, 2004 (1=never, 2=once a term, 3=once a month, 4=every week)...........................................46
Figure 9 Mean scores for how often literacy Specialist Teachers and Classroom teachers reported that activities done with the Specialist Teacher were used in 2004 (1=never, 2=once a term, 3=once a month, 4=every week)...........................................................................48
Figure 10 Mean scores for how frequently numeracy Specialist Teachers and Classroom teachers reported that activities done with the Specialist Teacher were used in 2004 (1=never, 2=once a term, 3=once a month, 4=every week) ...........................................................51
Figure 11 Percentage of literacy classroom teachers reporting they provided students with each of 17 activities (Q21a-q) either most weeks or most lessons in 2003 and 2004 .................63
Figure 12 Percentage of numeracy classroom teachers reporting they provided students with each of 17 activities (Q21a-q) either most weeks or most lessons in 2003 and 2004.............65
Figure 13 Distribution of the score categories for Mathematics Scenario 1, comparing 2003 and 2004................................................................................................................................71
Figure 14 Distribution of the score categories for Mathematics Scenario 2, comparing 2003 and 2004................................................................................................................................72
Figure 15 Distribution of the score categories for Mathematics Scenario 3, comparing 2003 and 2004................................................................................................................................74
Figure 16 Distribution of the score categories for Mathematics Scenario 4, comparing 2003 and 2004................................................................................................................................75
Figure 17 Literacy Specialist Teachers’ views on extent various practices will be continued contrasting 2003 and 2004 – per cent indicating to a moderate or major extent. ..........84
Figure 18 Literacy classroom teachers’ views on extent various practices will be continued contrasting 2003 and 2004 – per cent indicating to a moderate or major extent. ..........85
Figure 19 Numeracy Specialist Teachers’ views on extent various practices will be continued contrasting 2003 and 2004 – per cent indicating to a moderate or major extent. ..........87
ACER Evaluation of the GIR-LNS in WA Schools
xii

Figure 20 Numeracy classroom teachers’ views on extent various practices will be continued 2003 – per cent indicating to a moderate or major extent .............................................88
Figure 21 Numeracy classroom teachers’ views on extent various practices will be continued 2004 – per cent indicating to a moderate or major extent..............................................88
Figure 22 Percentage of principals reporting various types of plans for sustaining changes to teaching practice brought about by the GiR-LNS in 2003 and 2004 .............................90
Figure 23 The percentage of all factors given by literacy Specialist Teachers describing how the GiR-LNS could be improved as a strategy for assisting Specialist Teachers to meet the professional learning needs of classroom colleagues 2003............................................95
Figure 24 The percentage of all factors given by literacy Specialist Teachers describing how GiR could be improved as a strategy for assisting Specialist Teachers to meet the professional learning needs of classroom colleagues in 2004........................................95
Figure 25 The number of times for each statement given by numeracy Specialist Teachers describing how the GiR-LNS could be improved as a strategy for assisting Numeracy Specialist Teachers to meet the professional learning needs of classroom colleagues 2003................................................................................................................................96
Figure 26 The number of times for each statement given by Numeracy Specialist Teachers describing how the GiR-LNS could be improved as a strategy for assisting numeracy Specialist Teachers to meet the professional learning needs of classroom colleagues in 2004................................................................................................................................97
Figure 27 The percentage of all factors given by literacy Specialist Teachers describing the most important support that they had received from their school in their work as a Specialist Teacher in 2003..............................................................................................................99
Figure 28 The percentage of all factors given by literacy Specialist Teachers describing the most important support that they had received from their school in their work as a Specialist Teacher in 2004..............................................................................................................99
Figure 29 The number of times for each statement given by numeracy Specialist Teachers describing the most important support that they had received from their school in their work as a Specialist Teacher in 2003...........................................................................100
Figure 30 The number of times for each statement given by numeracy Specialist Teachers describing the most important support that they had received from their school in their work as a Specialist Teacher in 2004...........................................................................101
Figure 31 The percentage of all factors given by Specialist Teachers describing factors that had hindered their capacity to carry out their role as a Literacy Specialist Teacher in their school, 2003 .................................................................................................................103
Figure 32 The percentage of all factors given by Specialist Teachers describing factors that had hindered their capacity to carry out their role as a Literacy Specialist Teacher in their school, 2004 .................................................................................................................103
Figure 33 The number of times for each statement given by numeracy Specialist Teachers describing factors that had hindered their capacity to carry out their role as a Specialist Teacher in their school, 2003.......................................................................................104
Figure 34 The number of times for each statement given by numeracy Specialist Teachers describing factors that had hindered their capacity to carry out their role as a Specialist Teacher in their school, 2004.......................................................................................105
Figure 35 Path diagram showing strongest direct effects on classroom teachers’ literacy knowledge.....................................................................................................................109
ACER Evaluation of the GIR-LNS in WA Schools
xiii


EXECUTIVE SUMMARY
Evaluation of the Getting it Right - Literacy and Numeracy Strategy
The Australian Council for Educational Research was commissioned in 2003 by the Western Australian Department of Education and Training to undertake an independent evaluation of the Getting it Right - Literacy and Numeracy Strategy (GiR-LNS).
The main purpose of the evaluation was to provide the Department of Education with information about the effectiveness of the GiR-LNS in developing expertise relating to the teaching of literacy and numeracy. The focus was on improvements in teaching literacy and numeracy in the early years of schooling, especially for students at risk of not making satisfactory progress.
The evaluation was conducted during 2003-2005, and involved the schools to which Specialist Teachers had been appointed for 2002-2003, and Specialist Teachers appointed for 2003-2004. These comprised the first two cohorts of GiR-LNS Specialist Teachers and schools. In 2004, many of the schools in the first cohort received a further two-year allocation of a Specialist Teacher. The extended duration of the evaluation made it possible to gather data on the impact of the strategy on schools that had participated in the GiR-LNS for three years.
Key evaluation questions were suggested in the evaluation brief and provided the basis for the evaluation plan. The focus of the evaluation of the GiR-LNS was on the impact of the strategy on changes in school practices; on changes in literacy and numeracy classroom teaching practices; and on the development of expertise in teaching literacy and numeracy.
Data gathering methods
A comprehensive data gathering strategy was required to address these key evaluation questions. The strategy was based upon a framework that linked the key questions to core aspects of the GiR-LNS, defined the data required to measure these concepts, and specified methods for the analysis of these data.
All data gathering methods were designed to take account of the intention of the GiR-LNS to improve literacy and numeracy achievement across all groups of students, especially Aboriginal students, students with a language background other than English (LBOTE), boys and students in rural and remote locations.
Between June 2003 and December 2004, an extensive range of evaluation data was collected through surveys, school visits, interviews, classroom observations, observations of training sessions for GiR Specialist Teachers. Analysis of this data was undertaken during 2005.
As the evaluation took place over a two-year period, data was collected on several occasions throughout the evaluation period. The survey strategy was used twice. Principals, Specialist Teachers and their classroom colleagues were surveyed in Term 4, 2003 and again in Term 4, 2004. The same survey instruments were used on both occasions. Twenty schools were identified as case study schools. Members of the evaluation team visited these schools three times over the school years 2003-2004, and were able to see the GiR-LNS as it developed over time in these schools.
Over the course of the evaluation, evaluation team members, as observers, attended at least one three-day training workshop for both literacy and numeracy Specialist Teachers. These observations clarified the team’s knowledge and understanding of the role of the GiR-LNS
ACER Evaluation of the GiR-LNS in WA Schools
1

Specialist Teachers, and of the strategies and assessment instruments used for identifying the literacy or numeracy needs of individual students, and for selecting activities to support these students’ progress.
Survey responses
The surveys were administered late in the 2003 and 2004 school years. They were designed so that responses made in 2003 could be matched to the same respondents in 2004. The matching was generally good for principals and Specialist Teachers in both 2003 and 2004. However, the matching of classroom teachers’ survey responses in 2003 and 2004 was limited by staff changes within schools. This meant that some caution was exercised when considering the representativeness of the data provided by the classroom teachers.
The implementation of the GiR-LNS
Information collected through the surveys about the implementation of the GiR-LNS in schools indicated that
• Classroom teachers had worked collaboratively with Specialist Teachers for varying periods, ranging from less than one term to more than eight terms.
• Literacy and numeracy Specialist Teachers provided one or two sessions of in-class support per week.
• The reason for selecting teachers to work collaboratively with the Specialist Teacher was most often the year level taught.
• Schools provided adequate resources for the Specialist Teacher, and the resourcing appeared to have improved between 2003 and 2004.
• Strong connections existed between the GiR-LNS and other literacy and numeracy improvement programs.
• Almost all schools in 2003 and 2004 involved the Specialist Teacher in setting targets. Working shoulder to shoulder
The concept of working shoulder to shoulder in classrooms, and in collaboratively identifying students’ learning needs and planning activities to move them forward is central to the GiR-LNS. The evaluation found that this collaborative work enhanced the understandings, confidence and teaching skills of the Specialist Teachers and their colleagues. It made a definite impact on the capacity of teachers to select, apply and develop diagnostic, formative and summative student assessment strategies and instruments so that they were better able to focus on individual learning needs in literacy and numeracy.
In working shoulder to shoulder alongside classroom colleagues Specialist Teachers reported that their work was focused on finding out what children know and what they need to learn next, planning appropriate activities to further student understanding, and planning how they will work together to implement those activities.
Literacy and numeracy Specialist Teachers identified three activities that were particularly useful in their work in classrooms: modelling a whole lesson for the teacher to observe; modelling a strategy for the teacher to observe for part of the lesson; collaboratively teaching the whole lesson with the classroom teacher.
The analysis of the survey data indicated that the amount of time teachers spent in planning with the Specialist Teacher was important, but had most impact when their collaborative work
ACER Evaluation of the GiR-LNS in WA Schools
2

was focussed on individual student outcomes and when the school supported a collegial culture. The analysis also showed that the time the classroom teacher spent with the Specialist Teacher was more likely to lead to a positive outcome, if there was a focus on individual students and if the Specialist Teacher provided modelling.
It was clear, from the analyses of the data, that the amount of time classroom teachers worked collaboratively with a Specialist Teacher had important effects across a range of outcomes – efficacy, sustainability, student attitudes, teaching practice, curriculum and knowledge. This effect was mediated, particularly by the focus of the Specialist Teacher and the classroom teachers on individual students, and collegiality in the school. If the work of the Specialist Teacher is to be effective in terms of teaching and learning outcomes, special attention needs to be given to ensuring these conditions are in place.
Working shoulder to shoulder provides many benefits for teachers. It enables Specialist Teachers to bring useful knowledge to the core teaching tasks of planning and teaching. The Specialist Teachers model new practices frequently and teachers receive plenty of informal feedback as they try the practices out for themselves. Teachers see the benefits of what they are learning in their students’ enjoyment of activities. Teaching practice is deprivatised, and teachers take risks and experience different types of learning.
Diagnosis, planning and reflection
The setting of ‘challenging but realistic’ targets for improvement in literacy and numeracy achievement brought in its train the need for diagnostic assessment, monitoring of progress, assessment of learning outcomes, and planning for further improvement. It also required a deeper understanding of the English and mathematics Curriculum Frameworks. This focus was a key driver of the initiative.
Specialist Teachers and classroom teachers worked together on a range of activities that enabled them to provide better learning opportunities for their students. The reported working together to diagnose the learning needs of students, to use a range of assessment instruments, and to plan learning activities to address the identified needs of students. They also kept records of students’ progress, selected appropriate teaching activities, and prepared relevant teaching resources. In the course of this work, teachers were led to reflect on their teaching, and to identifying specific areas of literacy/numeracy teaching practice that teachers needed to develop.
Training for Specialist Teachers
High quality training was provided for all Specialist Teachers through seven three-day workshops spaced across the two years of their appointment. The training provided to Specialist Teachers was pivotal to the success of the strategy. The high value placed on this training was clearly apparent in the data collected from the surveys of principals, Specialist Teachers and from their classroom colleagues.
When Specialist Teachers were asked about the impact of the GiR-LNS training on their professional knowledge, for a set of 9 items, the mean in 2003 was over 3, on a scale of 4, and in 2004, was at the same level. For example, the mean for literacy Specialist Teachers in cohort 2 in response to a question about the extent to which they now had deeper understanding of literacy content and concepts was 3.61 in 2003 and 3.70 in 2004. The means for numeracy Specialist Teachers’ responses to a question about the extent to which they now
ACER Evaluation of the GiR-LNS in WA Schools
3

had increased knowledge of how students learn mathematics was also high: the mean for cohort 1 was 3.78 in 2003 and the same in 2004.
The impact of the GiR-LNS
Teachers’ positive perceptions about the value of the GiR-LNS were seen in responses to a question about the sources of ideas for improvements in teaching over past year or two. Literacy teachers in 2003 reported that GiR-LNS had been the source of 73% these ideas, and in 2004 the percentage of ideas for improving teaching that was attributed to the GiR-LNS was 75%. Numeracy teachers also attributed the source of ideas for enhancing their teaching of mathematics to the GiR-LNS: 82% in 2003 and 79% in 2004.
Further evidence of the value of the professional learning opportunities provided by the GiR-LNS was garnered by asking principals and teachers to rate the impact of the strategy against the best professional development activity they had ever experienced. Ninety-six per cent of principals in 2003, and 95% of principals in 2004, reported that the GiR-LNS had more or much more impact than other professional development.
Sixty five per cent of literacy teachers in 2003 rated the GiR-LNS as having greater impact than other professional development. This rose to 70% in the 2004 responses to the same question. Almost all numeracy teachers in both 2003 and 2004 reported that the GiR-LNS had had more or much more impact than other professional development.
Principals showed high levels of agreement about the impact of the GiR-LNS on judgments about impact of the GiR-LNS on teachers’ increased understanding of the English or Mathematics Curriculum Frameworks, and the benefits for teachers of working with the Specialist Teachers. In both 2003 and 2004 principals indicated very positive judgments about the increase in teachers’ confidence about teaching literacy/numeracy, and about an improvement in teachers’ capacity to diagnose students’ learning needs.
Looking ahead
The success of the GiR-LNS to date has assured the continuation of the strategy. In order to maintain the effectiveness of the strategy, it will be important to maintain key elements that have been crucial to the effectiveness of the strategy. The model of working shoulder to shoulder, the high quality professional development program and the use of student data combined to create a highly effective strategy for improving learning opportunities for all students, including those at risk of not making progress.
Continued investment in high quality professional development for the Specialist Teachers will be required. The program of twenty-one days of professional development provided in three-day workshops for Specialist teacher in the first two years of their appointment, the continuing professional development opportunities for Specialist Teachers who continue in the role has been crucial to the success of the GiR-LNS. The content of the program, which has had a strong basis in research about effective teaching of literacy and numeracy, has been of major significance in building a considerable body of literacy and numeracy teaching expertise in Western Australian government schools.
The work of the GiR-LNS central team, who have brought considerable knowledge and expertise to the strategy has provided ongoing support to Specialist Teachers, and has contributed in very important ways to their capacity to work effectively with classroom
ACER Evaluation of the GiR-LNS in WA Schools
4

colleagues. The maintenance of these levels of support will be important to the future professional learning of Specialist teachers and their colleagues on schools.
The model of Specialist Teachers working shoulder to shoulder through regular collaborative planning and in-class support should continue. The support of school leadership teams is a crucial factor in the success of the strategy, and will continue to be so.
The use of performance data in a variety of ways will continue to be of major significance. The use of data to set challenging but realistic targets for improving students’ achievement in literacy or numeracy has been a most useful aspect of the strategy. The process of target setting enables schools to monitor their progress, to celebrate achievement, and to adjust teaching programs where necessary.
The fine-grained use of data by teachers, on an ongoing basis, to identify and diagnose students’; learning needs has been critical to the success of the strategy. Teachers are now able to assess students’ knowledge and skills more effectively, and to plan explicit teaching approaches to address the diversity of students’ needs. Not only have students benefited to a considerable degree from this approach, but teachers’ knowledge and understanding of effective teaching practices has been significantly enhanced, and their repertoires of effective teaching strategies have been extended.
This evaluation of the GiR-LNS model was focused on the early years of schooling. The findings of the evaluation suggest that the model has applicability at all levels of schooling.
A feature of the Getting it Right strategy is the depth of understanding it reveals of what it takes for reform policies to penetrate to the level of everyday practice. The GiR-LNS is primarily about enhancing the capacity of existing teachers to meet the needs of children at risk. It is a targeted and coordinated program that directs serious money at a serious problem. The strategy reveals a sophisticated understanding of the complexities of change and the conditions that need to be in place if professional development is to make a difference to student learning outcomes.
ACER Evaluation of the GiR-LNS in WA Schools
5


1. INTRODUCTION: THE GETTING IT RIGHT - LITERACY AND NUMERACY STRATEGY
The Getting it Right - Literacy and Numeracy Strategy (GiR-LNS) is a targeted and coordinated program of additional support for government primary schools in Western Australia. The program provides additional specialist teaching personnel, professional development and support to schools across the government school system.
The key purposes of the strategy are to improve literacy and numeracy outcomes across government schools, and to achieve greater parity of outcomes for all groups of students. The strategy is designed to significantly improve literacy and numeracy outcomes for Aboriginal students, boys, students with a language background other than English, and students attending school in rural or remote locations.
The WA government made an initial 4-year commitment of $27 million to the GiR-LNS, commencing in 2002. Although the initial 4-year commitment ended in July 2005, the strategy will be maintained.
Developing expertise
The GiR-LNS was designed as a model for professional growth, recognising that teachers are able to provide more effective learning opportunities for students when they can draw upon a broad repertoire of teaching and assessment strategies. The model was therefore planned to develop teachers’ expertise in order to improve the learning opportunities for children experiencing difficulties in literacy or numeracy.
Specialist Teachers have been located in schools, to work ‘shoulder-to-shoulder’ in classrooms. Participating schools were required to focus on either literacy or numeracy, so as not to create too much demand on teachers and the school. This element of the model has helped to ensure cohesion in school planning, and in the allocation of school resources.
The role of the Specialist Teacher is to mentor, coach and support classroom colleagues, working ‘shoulder to shoulder’ in mainstream classroom contexts, and modelling effective teaching strategies. A specific focus is on monitoring student learning, and helping colleagues plan for improvement. All Specialist Teachers participated in seven three-day professional development workshops over the two years. Principals of participating schools attended a two-day induction program.
Specialist Teachers received ongoing support between the three-day training workshops from members of a central team who make regular site visits to Specialist Teachers and principals.
In schools, teachers’ professional learning is enhanced by the support provided by Specialist Teachers, who work in classrooms, modelling teaching strategies, planning learning activities to meet the identified needs of students, assisting with the implementation of these activities in classrooms, and providing access to a range of resources. Classroom teachers thus have continuous access to sustained professional learning, to feedback from the Specialist teachers, and to resources and expertise to extend their knowledge about literacy or numeracy, and about how to teach more effectively.
The model includes a strong commitment to building the expertise of the Specialist Teachers throughout the two years of their appointment. The Literacy and Numeracy Curriculum Officers organise and deliver the 21-day Specialist Teacher training program and regularly visit all Specialist Teachers in their schools. All the Curriculum Officers have considerable
ACER Evaluation of the GiR-LNS in WA Schools
7

expertise in literacy or numeracy; for example, the three team members who work with numeracy Specialist Teachers were directly involved in the development of the First Steps in Mathematics resources, which significantly inform the numeracy component of the GiR-LNS.
The program for the training workshops for Specialist Teachers is informed by contemporary research findings, and is designed to improve understandings, confidence and teaching skills in relation to literacy and numeracy. It also focuses on developing thorough understandings of the English and mathematics curriculum areas of the WA Curriculum Framework. The program includes workshops about the collection of credible diagnostic and summative student performance data to inform the planning and teaching cycle. The training program also provides support for Specialist Teachers in working in the role of a collaborative colleague. The program for each group of Specialist teachers is crafted according to the strengths and needs of the group. As new research and resources become available, they are incorporated into the training program. For example, when the second edition First Steps Reading Map of Development was published in 2004, a major part of the first three-day workshop for new group of Specialist Teachers was focused on this new resource.
The Specialist Teachers commence training prior to taking up their role, and receive ongoing training for the duration of the period of their appointment. In the course of an initial two-year appointment, all Specialist Teachers participate in seven three-day professional learning workshops, and, if they continue in the role, they participate in three two-day workshops each year. The collegiality that develops amongst each group of Specialist Teachers during the course of the seven workshops also provides professional support for their role.
Four structural features are central in the model: target setting in schools; collaboration between the Specialist Teachers and classroom colleagues; the focus on literacy or numeracy, and not both; and quality professional learning.
Specialist Teachers
The initial funding commitment included the training and deployment of 200 Full Time Equivalent (FTE) specialist teachers to work in government schools to improve levels of literacy and numeracy among high needs students with a particular focus on Aboriginal students and other students at risk of not making satisfactory progress. Not all schools were involved. Relative school needs were determined from a combination of systemic quantitative data and local qualitative data. The resource was divided equally between literacy and numeracy.
Specialist Teachers (STs) were appointed for two-year periods. They were identified through a merit selection process conducted in participating schools, and, where it was not possible to identify a suitable teacher in a participating school, through the same merit selection process conducted externally. The first cohort of 50 FTE Literacy and Numeracy Specialist Teachers took up their appointments in 2002, and an additional 40 FTE commenced each year between 2003 and 2005. By 2005 the full commitment of 200 FTE had been achieved and 365 literacy or numeracy Specialist Teachers were working, full-time or part-time, in 365 schools across Western Australia.
The role of the Specialist Teacher in the GiR-LNS is central to the achievement of a number of significant outcomes. The work of Specialist Teachers is intended to enhance teachers’ repertoires of instructional practices, and their understanding of outcomes relating to literacy and numeracy. Their work includes the provision of support to colleagues in meeting the needs of identified students, in monitoring student learning, and in planning for improvement in students’ literacy and numeracy achievement.
ACER Evaluation of the GiR-LNS in WA Schools
8

In information provided at the first training session for a group of Specialist Teachers, the role was outlined as follows:
Specialist Teachers
• follow normal duties that apply to classroom colleagues; duty, DOTT (Duties Other Than Teaching) , participate in school activities
• support teachers with the implementation of the Curriculum Framework and the Student Outcomes Statements with a special focus on assisting students identified as at educational risk
• record and report on the progress of the implementation of the Getting it Right Strategy within the school
• are responsible to the principal
• work within the framework of the School Development Plan
• work collaboratively with other school staff to develop improvement targets for students working below benchmark standards
• work ‘shoulder to shoulder’ with colleagues in mainstream classroom contexts
• work no less than 0.1 with each nominated classroom colleague (These parameters are designed to achieve a balance, and to ensuring that the amount of time is worthwhile).
The central office team makes it clear that the Specialist Teacher would not take prime responsibility for a group of students; routinely withdraw students for additional support; or provide DOTT (Duties other than Teaching time) for classroom teachers.
Student achievement data
Within the GiR-LNS there is a focus on informing teacher judgment, and on helping teachers and principals to make more effective use of student achievement data to improve learning. Principals of participating schools were required to set challenging but realistic two-year targets for improvement in literacy or numeracy learning outcomes. Student achievement data available to schools included the Literacy Net, the Numeracy Net, First Steps tools and WALNA data. Specialist Teachers monitored student learning, and helped colleagues plan for improvement. The target-setting process was new to schools, and some support for this process was provided from the central team. Evaluating the Getting it Right - Literacy and Numeracy Strategy
The Australian Council for Educational Research was commissioned by the WA Department of Education and Training to undertake an independent evaluation of the Getting it Right - Literacy and Numeracy Strategy (GiR-LNS). The evaluation commenced in May 2003.
A major purpose of the evaluation was to provide the Department of Education with information about the effectiveness of the GiR-LNS in developing expertise relating to the teaching of literacy and numeracy.
The evaluation was therefore focused on the impact of the GiR-LNS professional development on changes in school practices and on changes in classroom teaching practices. The evaluation of the development of expertise in teaching literacy and numeracy was distinct from the evaluation of the impact of the strategy on the literacy and numeracy outcomes of students in participating schools.
ACER Evaluation of the GiR-LNS in WA Schools
9

The evaluation involved the schools to which Specialist Teachers had been appointed in 2001 for 2002-2003, and Specialist Teachers appointed in 2002 for 2003-2004. These comprised the first two cohorts of GiR Specialist teachers and schools.
The evaluation questions
Ten evaluation questions were identified in the evaluation brief, and these provided the framework for the evaluation.
At the outset of the evaluation these questions were reviewed by the evaluation team in consultation with the GiR-LNS central team. Following this consultation, it was agreed that all questions were appropriate, except for the question about home-school communication (Q6). Within the broad scope of the GiR-LNS initiative, home-school communication had not, by 2003, been a major focus and it was agreed that information would only be gathered incidentally in relation to this question. It was agreed that these questions reflect the major purposes of the GiR-LNS.
1. What impact has the GiR-LNS had upon understandings, confidence and teaching skills of Specialist Teachers and their colleagues?
2. What impact has the GiR-LNS had upon understandings among Specialist teachers and their school colleagues of Curriculum Framework outcomes, especially those for the mathematics and English learning areas?
3. What impact has the GiR-LNS had upon the capacity of teachers to select, apply and develop diagnostic, formative and summative student assessment strategies and instruments?
4. To what extent has student performance data relating to literacy and numeracy been used to inform planning for improvements at individual, classroom and whole school levels?
5. To what extent have connections been made in school literacy and numeracy planning to programs such as the Curriculum Improvement Program, the Students at Educational Risk strategy, Commonwealth Literacy and Numeracy Program and the Aboriginal Education Operational Plan?
6. What impact has the GiR-LNS had upon the extent of two-way, home-school collaboration and communication in support of literacy and numeracy development?
7. To what extent have schools supplemented the Specialist Teacher role with other resources?
8. What provision have schools made to sustain the changes to practice brought about by the Specialist Teacher’s work?
9. What factors are critical for specialist teachers to work effectively in schools?
10. To what extent are the targets that schools have negotiated with their District Director challenging, yet realistic for their own context?
The evaluation model
To address the key evaluation questions, a diverse and comprehensive data gathering strategy was required. The development of such a strategy was based upon a framework that links the key questions to core concepts, defines the data requirements to measure these concepts and
ACER Evaluation of the GiR-LNS in WA Schools
10

ACER Evaluation of the GiR-LNS in WA Schools
11
specifies methods for the analysis of these data. The development of this framework was undertaken at the commencement of the evaluation, in collaboration with Department personnel.
A logic model for the GiR-LNS was developed to clarify the evaluation plan, and identify the logic and rationale behind the program. The logic model helped the evaluation team to clarify the underlying hypotheses about the program and how it would achieve the desired outcomes. The logic model summarised the key elements in the strategy.

ACER Evaluation of the GiR-LNS in WA Schools
12
Getting it Right - Program Logic Planning Guide Resources. System inputs: Department of Education
School-level activities: Specialist Teachers
Initial Outcomes Intermediate Outcomes Intended results
Additional specialist support in literacy and numeracy provided to participating schools. Appointment of Specialist Teachers. Cohort 1, 2002-2003 Cohort 2, 2003-2004
Establish role in school. Identify colleagues with whom to work. Initiate collaborative planning and in-class work with teaching colleagues. Commence target setting.
Increase focus in school on literacy/numeracy instructional practices and on using student performance data to plan for improvement. Consolidate collaborative planning and in-class support.
Increased use of student performance data for planning. Increasing use of recommended teaching practices. More effective learning opportunities for particular groups of students. Strengthening collaborative planning and in-class support.
Enhanced literacy and numeracy instructional practices in GiR schools. Sustained and effective collaborative planning and in-class support. Improved student learning outcomes, including target groups.
21-day GiR literacy/numeracy professional development program. 7 three-day meetings over 15 months. Access to contemporary research and practice in literacy and mathematics.
Collection of student work samples for examination at PD. Deepened understanding of Curriculum Framework. Specialist Teachers work more confidently, shoulder to shoulder with colleagues. Specialist Teachers provide professional development for colleagues: after-school workshops; one-to-one PD sessions; modelling teaching practices; providing relevant professional readings to colleague; presentations to staff meetings.
Knowledge of resources and activities to use in working with classroom colleagues, and how to use them. New professional knowledge about literacy/numeracy and effective teaching /assessment practices shared with colleagues.
Use of resources and strategies with in colleagues’ classrooms More frequent use of new or redesigned literacy/numeracy teaching practices. More effective use of student performance data for planning.
Increased understanding, confidence and teaching skills of classroom teachers. Classroom teachers have deeper understanding of Curriculum Framework. Improved assessment of students’ strengths and needs. Teaching activities planned to meet identified student needs. Effective and continuing use of student performance data to plan for improvement.
Ongoing support from GiR central team members, including regular school visits.
Advice, clarification, support. Discussion of ways of working with colleagues. Support for target setting processes.
Implement advice on ways of working with colleagues, and on target setting.
More effective collaborative planning and ‘shoulder-to-shoulder’ work in classrooms. Refinement of target setting processes.
Enhanced literacy and numeracy instructional practices in GiR schools. Improved student learning outcomes for all students. Improved WALNA assessments.
Statewide network of Specialist Teachers.
Advice, clarification, support.
Access to resources and teaching strategies.
Resources and teaching strategies shared with colleagues.
Enhanced teaching and assessment practices for literacy/numeracy. More effective use of resources.

Data gathering
The evaluation project commenced in May 2003 when a schedule for gathering data about the operation and impact of the GiR-LNS was established, in consultation with the GiR management team. Between June 2003 and December 2004 an extensive range of evaluation data was collected through surveys, school visits, interviews, classroom observations, observations of training sessions for GiR Specialist Teachers. Trends in the survey data were further investigated in the visits to selected schools. Participation in the GiR Symposium, in Perth in November 2004, provided further insights into the GiR-LNS.
At the commencement of the evaluation, a series of videoconferences and meetings with the Department of Education GiR-LNS team enabled the evaluation team to clarify their understanding of the main components of the strategy, how it is meant to work and what it is trying to achieve. Key documentation was provided to the evaluation team, for example, documentation provided to new Specialist Teachers and to principals of participating schools.
Over the course of the evaluation, evaluation team members, as observers, attended at least one three-day training workshop for both literacy and numeracy Specialist Teachers. These observations were crucial in developing the team’s knowledge and understanding of the role of the GiR Specialist Teachers, the materials used in the program (especially the new First Steps in Mathematics materials issued with the numeracy Specialist Teachers). These observations of the GiR-LNS training clarified the evaluation team’s understanding of the strategies and assessment instruments used for identifying the literacy or numeracy needs of individual students, and for selecting activities that enable students to progress in literacy or numeracy.
All data gathering methods were designed to take account of the intention of the GiR-LNS to improve literacy and numeracy achievement across all groups of students, especially Aboriginal students, students with a language background other than English (LBOTE), boys and students in rural and remote locations.
As the evaluation took place over a two-year period, it was possible to collect data on several occasions throughout the evaluation period. The survey strategy was used twice. Principals, Specialist Teachers and their classroom colleagues were surveyed in Term 4, 2003 and again in Term 4, 2004. The same survey instruments were used on both occasions.
Twenty schools were identified as case study schools. Members of the evaluation team visited these schools three times over the school years 2003-2004, and were able to see the GiR-LNS as it developed over time in these schools.
The survey component
A major task in the evaluation was the design and development of the survey questionnaires. These questionnaires were used on two occasions during the course of the evaluation in order to gather evidence of change over time, in order to determine the impact of the Getting it Right initiative. The questionnaires were administered to both the 2002/3 and 2003/4 cohorts on each occasion. The surveys were administered twice – firstly in Term 4 2003 and secondly in Term 4 2004. Surveys were sent to school principals, literacy and numeracy Specialist Teachers, and to classroom teachers.
Five survey questionnaires were prepared – one for principals, one for literacy Specialist Teachers, one for numeracy Specialist Teachers, one for literacy classroom teachers, and one for numeracy classroom teachers. Each questionnaire was tailored to the particular kinds of involvement in the GiR-LNS of each group. While these instruments were tailored to each
13 ACER Evaluation of the GiR-LNS in WA Schools

group, they also included some questions and scales in common. Each survey instrument provided data related to several of the key evaluation questions. (The five questionnaires were included in full in the first progress report provided to the GiR-LNS team in December 2003).
The questionnaires were comprehensive, so that a full picture of school practices and the impact of the work of the Specialist Teacher could be developed. The comprehensive nature of the questionnaires meant that the Specialist Teacher and classroom teacher questionnaires were relatively long, but the benefits of gaining a strong body of information was weighed against the need to ask teachers to spend over an hour completing the questionnaire.
The questionnaires included open-ended questions as well as multiple-choice items. The questionnaires for Specialist Teachers and classroom teachers included scenarios about identifying students’ learning needs, planning learning activities, and monitoring their learning. These scenarios are of particular interest in that they were designed to yield insights into changes in teaching practices resulting from the interactions between the GiR-LNS Specialist Teachers and their classroom colleagues.
For the scenario questions, both classroom teachers and Specialist Teachers were asked to write about their work in diagnosing students’ learning difficulties, and planning activities to address students’ specific needs. This is ‘core business’ for teachers involved in the GiR-LNS, and the scenarios provided a means of tapping into teachers’ knowledge and practices.
The questionnaire for classroom teachers included an instrument for assessing the levels of use of teaching, learning and assessment practices promoted by the Specialist Teachers. It was anticipated that repeated measures on this instrument, over time, would provide evidence of the extent of the impact of the GiR-LNS. However, the information from the repeated measures of levels of use did not show sufficient variation between the two surveys, and was not included with the other surveys data
The evaluation team consulted closely with the GiR-LNS team during the development of the questionnaires.
The distribution of questionnaires to principals, Specialist Teachers, and classroom colleagues in the two cohorts was a complex process. All questionnaires were sent directly to individual teachers listed on the databases of Specialist Teachers and their classroom colleagues provided to the evaluation team by the GiR-LNS team. A covering letter was included, and a Reply Paid envelope was provided for the return of the questionnaires.
Teachers who were unable to return the questionnaires by the end of 2003 were contacted by ACER early in the 2004 school year to remind them of the importance of the evaluation, and inviting them to complete and return the questionnaire. Information derived from this round of data collection provided a baseline for subsequent surveys and the final evaluation analysis, and so it was essential to maximize the number of returns from the first survey.
A major consideration for the second survey was to maximize the collection of responses from respondents to the November 2003 survey. The data base of Specialist Teachers and their classroom colleagues used for the 2003 survey was updated in 2004 at ACER from information provided by the GiR-LNS central team. This information had been collected from Specialist Teachers, who were asked to list the classroom colleagues with whom they had worked in 2003, and in 2004. Questionnaires were sent directly to Specialist Teachers and classroom teachers, and it was important to have accurate lists of teachers who were currently involved in the GiR-LNS. Many staff changes had occurred between 2003 and 2004, making it necessary to gather current information.
14 ACER Evaluation of the GiR-LNS in WA Schools
The 2003 questionnaires were used in the same form in 2004 so that valid comparisons could be made between the two sets of responses.
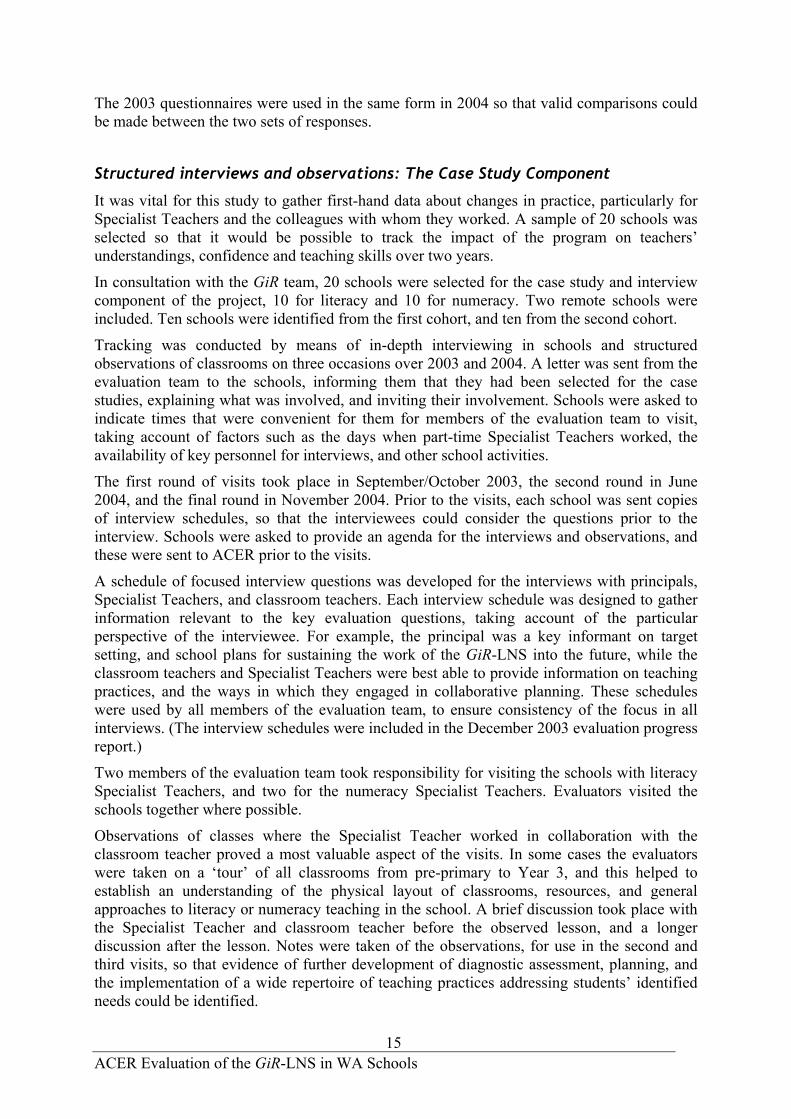
Structured interviews and observations: The Case Study Component
It was vital for this study to gather first-hand data about changes in practice, particularly for Specialist Teachers and the colleagues with whom they worked. A sample of 20 schools was selected so that it would be possible to track the impact of the program on teachers’ understandings, confidence and teaching skills over two years.
In consultation with the GiR team, 20 schools were selected for the case study and interview component of the project, 10 for literacy and 10 for numeracy. Two remote schools were included. Ten schools were identified from the first cohort, and ten from the second cohort.
Tracking was conducted by means of in-depth interviewing in schools and structured observations of classrooms on three occasions over 2003 and 2004. A letter was sent from the evaluation team to the schools, informing them that they had been selected for the case studies, explaining what was involved, and inviting their involvement. Schools were asked to indicate times that were convenient for them for members of the evaluation team to visit, taking account of factors such as the days when part-time Specialist Teachers worked, the availability of key personnel for interviews, and other school activities.
The first round of visits took place in September/October 2003, the second round in June 2004, and the final round in November 2004. Prior to the visits, each school was sent copies of interview schedules, so that the interviewees could consider the questions prior to the interview. Schools were asked to provide an agenda for the interviews and observations, and these were sent to ACER prior to the visits.
A schedule of focused interview questions was developed for the interviews with principals, Specialist Teachers, and classroom teachers. Each interview schedule was designed to gather information relevant to the key evaluation questions, taking account of the particular perspective of the interviewee. For example, the principal was a key informant on target setting, and school plans for sustaining the work of the GiR-LNS into the future, while the classroom teachers and Specialist Teachers were best able to provide information on teaching practices, and the ways in which they engaged in collaborative planning. These schedules were used by all members of the evaluation team, to ensure consistency of the focus in all interviews. (The interview schedules were included in the December 2003 evaluation progress report.)
Two members of the evaluation team took responsibility for visiting the schools with literacy Specialist Teachers, and two for the numeracy Specialist Teachers. Evaluators visited the schools together where possible.
Observations of classes where the Specialist Teacher worked in collaboration with the classroom teacher proved a most valuable aspect of the visits. In some cases the evaluators were taken on a ‘tour’ of all classrooms from pre-primary to Year 3, and this helped to establish an understanding of the physical layout of classrooms, resources, and general approaches to literacy or numeracy teaching in the school. A brief discussion took place with the Specialist Teacher and classroom teacher before the observed lesson, and a longer discussion after the lesson. Notes were taken of the observations, for use in the second and third visits, so that evidence of further development of diagnostic assessment, planning, and the implementation of a wide repertoire of teaching practices addressing students’ identified needs could be identified.
15 ACER Evaluation of the GiR-LNS in WA Schools

Notes were taken of all interviews, and tape recordings were made for the purpose of confirming and elaborating the notes where necessary.
The evaluation team was extremely appreciative of the ways in which school personnel made considerable time available for interviews, and organised the classroom observations.
Reporting
Progress reports were provided to the evaluation team in December 2003, May 2004, and in February 2005. In addition, the project director maintained regular contact with the central office GiR-LNS management team.
The final stage of the evaluation involved detailed analyses of the two waves of survey data, the writing of case studies, and the development of cross-case analyses as well as the identification of answers to the key evaluation questions.
16 ACER Evaluation of the GiR-LNS in WA Schools

2. THE SURVEY STUDY
The data
Data were collected from principals, Specialist Teachers and classroom teachers using self-completed questionnaires that were mailed to schools.
There were five different survey forms for:
• Principals
• Literacy Specialist Teachers
• Numeracy Specialist Teachers
• Literacy classroom teachers
• Numeracy classroom teachers.
The surveys were administered late in the 2003 and 2004 school years. They were designed so that responses made in 2003 could be matched to the same respondents in 2004.
Table 1 shows the number of respondents to each survey for each year and the number of respondents who could be matched from both the 2003 and 2004 surveys (the ‘merged’ respondents). During the processing of the numeracy classroom teachers’ questionnaires, a concern with maintaining confidentiality led to the unintended destruction of identification numbers linking 2003 and 2004. Consequently, responses from only 24 numeracy classroom teachers could be matched. This severely limited the analyses that it was possible to perform using the numeracy classroom teachers’ data when examining change between 2003 and 2004.
The matching of classroom teachers’ survey responses in 2003 and 2004 was also limited by staff changes within schools. Some teachers working with the Specialist Teacher in the second year were new to the schools, and other continuing staff had not worked with the Specialist Teacher in 2003.
Table 1 Number of respondents to each survey
N. in 2003 N. in 2004 N. merged
Principal 116 141 98
Literacy Specialist Teacher 84 78 63
Literacy classroom teacher 261 267 77
Numeracy Specialist Teacher 68 73 53
Numeracy classroom teacher 227 279 24
Table 2 shows the response rates to each survey. It can be seen that these were good for principals and Specialist Teachers in both 2003 and 2004, but only fair for classroom teachers. This means some caution needs to be exercised when considering the representativeness of the data provided by the classroom teachers.
17 ACER Evaluation of the GiR-LNS in WA Schools

Table 2 Response rate to each survey
2003 (%) 2004 (%)
Principal 65 74
Literacy Specialist Teacher 80 72
Literacy classroom teacher 51 43
Numeracy Specialist Teacher 82 78
Numeracy classroom teacher 45 42
There had been two Specialist Teacher intakes into the GiR-LNS at the time of this study – one prior to 2003 and another during 2003 – and these are referred to as Cohorts 1 and 2, respectively, in this report. More have followed since. Cohort 1 participants had a year’s more involvement with the GiR-LNS than Cohort 2.
Table 3 Number of respondents linked to a cohort for each survey in 2003 and 2004
N. in 2003 N. in 2004 N. merged
Cohort1 Cohort2 Cohort1 Cohort2 Cohort1 Cohort2
Literacy Specialist teacher
37 47 37 41 30 33
Literacy classroom teacher
124 137 105 161§ 32 45
Numeracy Specialist Teacher
24 44 28 44+ 18 35
Numeracy classroom teacher
46 39* 119 155** 14 10
§ 1 literacy classroom teacher did not have the relevant cohort identified in 2004
+ 1 numeracy Specialist Teacher did not have their cohort identified in 2004 * 142 numeracy classroom teachers did not have their cohort identified in 2003 ** 5 numeracy classroom teachers did not have their cohort identified in 2004
Table 3 shows the numbers of Specialist Teachers and classroom teachers in each cohort, and the number in each cohort after the 2003-2004 data files were merged. A merged file consisted of only those respondents who provided data in 2003 and in 2004.
The response rates to the surveys were adequate. However, the low number of numeracy classroom teachers who could be matched across 2003 and 2004 limited the extent to which change within this group could be investigated.
18 ACER Evaluation of the GiR-LNS in WA Schools

Classroom teachers
Most classroom teachers who responded to the survey were female (93%). On average, they had been in their current school for six years (Standard Deviation (SD) 5 years) and they had been teaching for a total of 15 years (SD 10 years). Most had no other formal roles in the school apart from being a classroom teacher.
Specialist Teachers
Most Literacy Specialist Teachers were female (96%). They had been teaching for an average of 17 years (SD 8 years) and most (80%) had been a member of staff in the school where they became Specialist Teachers for an average of 6 years (SD 5 years).
About 10% of Specialist Teachers in the 2003 sample were also deputy principals. About 12% were Specialist Teachers in one other school and about 8% were Education Support Teachers. A very small proportion (2%) was either Cluster coordinators or Early Childhood Coordinators. None were deputy principals in our 2004 sample, but 33% were also Upper Years Coordinators in their schools.
The picture is similar for Specialist Numeracy Teachers. About 90% were female. They had been teaching for an average of 16 years (SD 8 years). Nearly 80% were already members of staff in the school, and they had been teaching for an average of six years in that school (SD 4 years). About 16% were GiR STs in one other school, and seven percent were deputy principals.
19 ACER Evaluation of the GiR-LNS in WA Schools


3. THE GIR-LNS IN SCHOOLS: IMPLEMENTATION
This chapter focuses on data about the way in which the GiR strategy operated in schools.
Working with the Getting it Right-Literacy and Numeracy Strategy
Table 4 shows that the majority of literacy and numeracy Specialist Teachers in the sample spent 0.4 to 0.6 of their time fraction in the role. A significant proportion, of between 10-20%, were full-time in the role.
Table 4 Time fraction spent working as a Specialist Teacher
Time fraction in GiR role
Literacy Specialist Teachers
Numeracy Specialist Teachers
Number
2003 Number
2004 Number
2003 Number
2004
0 5
0.2 4 3 4 0.3 2 1 4 6 0.4 10 9 5 5 0.5 30 18 25 17 0.6 15 13 10 14 0.7 8 8 5 6 0.8 5 9 3 6 0.9 2 1 1 3 1.0 8 11 11 16 Total 84 78 68 73
Working with the Specialist Teacher
Literacy teachers
Table 5 shows the make up of the sample of teachers who responded to the surveys in 2003 and in 2004, in terms of how many school terms they had been working with a literacy Specialist Teacher. It can be seen that the majority of Cohort 1 teachers had worked collaboratively with a Specialist Teacher for more that four terms with an ST when first surveyed in 2003. By the end of 2004, a small group (18.8%) had worked collaboratively for another four terms with a Specialist Teacher. Nearly 75% of Cohort 2 teachers had worked for four terms with a Specialist Teacher at the end of 2003. A year later 60% had completed eight terms.
21 ACER Evaluation of the GiR-LNS in WA Schools

Table 5 Literacy - No. of Terms with the Literacy ST (percentage)
Cohort 1 (n=32) Cohort 2 (n=45)
No. of terms 2003 2004 2003 2004
Less than 1 term 3.1 2.3
One term 3.2 3.1 2.3 2.2 Two terms 6.5 3.1 11.6 4.4 Three terms 3.2 9.3 15.6 Four terms 19.4 21.9 74.4 4.4 Six terms 6.5 3.1 8.9 Seven terms 6.5 6.3 4.4 Eight terms 54.8 40.6 60.0 Twelve terms 18.8 Total 100.0 100.0 100.0 100.0
Table 6 shows the number of planning sessions Cohort 1 and Cohort 2 teachers reported engaging in with the Literacy ST in 2003 and in 2004. Most teachers reported having one session per week. Noteworthy is the number reporting that they did not engage in a collaborative planning session each week.
Table 6 Literacy - No. of collaborative planning sessions per week with literacy Specialist
Teacher
Cohort 1 (n=32) Cohort 2 (n=45) 2003 2004 2003 2004 None 40.0 13.3 22.0 30.6 One 50.0 73.3 78.0 58.3 Two or more 9.9 13.4 11.1 Total 100.0 100.0 100.0 100.0
Table 7 indicates that average weekly planning sessions with the ST lasted for about 30 minutes.
Table 7 Literacy - Average duration of collaborative planning sessions (minutes) Cohort N Mean 2003 Mean 2004
1 22 32.64 30.00
2 36 31.81 29.76
Teachers were asked about the number of teaching sessions per week in which the Specialist teacher provided in-class support. Table 8 indicates that most teachers worked collaboratively with the Specialist Teacher for one or two sessions per week. The proportion of teachers
22 ACER Evaluation of the GiR-LNS in WA Schools

having access to more than one session of in-class support per week tends to drop away in the second year.
Table 8 Literacy - No. of sessions per week of in-class support provided by the Specialist Teacher (percentages)
Table 9
indicates that the average length of the weekly in-class support sessions provided by the Specialist Teacher was between 50 to 60 minutes. Table 9 Literacy - Average duration of in-class support sessions (minutes)
Cohort N 2003 Mean N
2004 Mean
1 26 57.12 28 52.86
2 41 51.10 39 53.85
Information was collected about other school staff who regularly assisted the classroom teacher when they worked together with the GiR ST. Table 10 indicates that a variety of other people were often present in the classroom during the class sessions with the Specialist Teacher, most often one of the teacher aides in the school. Table 10 Literacy - Who else assists when classroom teacher and Specialist Teacher work
together in the classroom? (percentages)
Cohort 1 (n=32) Cohort 2 (n=45)
Who assists? 2003 2004 2003 2004
Integration aide 12.5 18.8 15.6 13.3
Aboriginal Education Officer 25.0 15.6 8.9 13.3
Education support teacher 9.4 0 11.1 8.9
ESL specialist 3.1 3.1 2.2 2.2
Special Needs District Staff 3.1 6.3 0.0 0
Parents 6.3 6.3 15.6 11.1
Other 21.9 25.0 31.1 42.2
No one 34.4 40.6 37.8 31.1
N. 32 32 45 45
Cohort 1 (n=32) Cohort 2 (n=45) 2003 2004 2003 2004 None 18.8 13.3 7.0 30.6 One 31.3 73.3 41.9 58.3 Two 34.4 6.7 30.2 11.1 Three 3.1 6.7 9.3 Four 12.5 11.6 Total 100.0 100.0 100.0 100.0
23 ACER Evaluation of the GiR-LNS in WA Schools

Numeracy classroom teachers
Table 11 shows the make up of the sample of teachers who responded to the surveys in 2003 and in 2004, in terms of how many school terms they had been working with a numeracy Specialist Teacher. Unlike the literacy teachers above it is important to keep in mind that the samples from each cohort are not the same teachers for 2003 and 2004. Nevertheless, the pattern of participation is much the same. It can be seen that the majority of Cohort 1 teachers had worked for four terms with a Specialist Teacher when first surveyed in 2003. By the end of 2004, a small group (17.4%) had worked for another four terms with a Specialist Teacher. Nearly 75% of Cohort 2 teachers had worked for four terms with a Specialist Teacher at the end of 2003. A year later 35% had completed eight terms or more.
Table 11 Numeracy classroom teachers- No. of terms working with Specialist Teacher
Cohort 1 Cohort2 2003
(n=46) 2004
n=119 2003 n=39
2004 n=154
Less than 1 term 4.3 .9 2.6
One term 4.3 2.6 Two terms 10.9 4.3 5.1 1.9 Three terms 6.5 6.9 15.4 4.5 Four terms 34.8 31.9 74.4 42.9 Five –six terms 17.4 6.0 11.7
Seven terms 6.5 6.0 3.9 Eight terms 15.2 24.1 2.6 33.1 Nine to Twelve terms 17.4 1.9
Total 100.0 100.0 100.0 100.0
Table 12 shows the number of collaborative planning sessions Cohort 1 and Cohort 2 teachers reported spending with the Specialist Teacher in 2003 and in 2004. Most teachers reported spending one session per week. Cohort 2 teachers were less likely to report that they did not have a regular session with the Specialist Teacher.
Table 12 Numeracy teachers- No. of collaborative planning sessions per week with the Specialist Teacher (percentage)
Cohort 1 Cohort 2
Frequency 2003 N=46
2004 N=119
2003 N=39
2004 n=155
None 21.7 22.1 5.4 7.7 One 76.1 76.0 94.6 91.5 Two 2.2 1.9 .8 Total 100.0 100.0 100.0 100.0
24 ACER Evaluation of the GiR-LNS in WA Schools

Table 13 indicates that average weekly collaborative planning sessions with the Specialist Teacher occupied about 30 minutes.
Table 13 Numeracy teachers- Average length of planning sessions with Specialist Teacher
(minutes)
Cohort N 2003 Mean N 2004 Mean 1
41 33.78 105 35.26
2 38 31.29 144 34.65
Teachers were asked about the number of teaching sessions in which the Specialist teacher provided in-class support each week. Table 14 indicates that, as planned, most teachers had access one or two sessions per week. Unlike the literacy teachers, the proportion of numeracy teachers having two or more sessions per week appears to increase significantly in the second year, but this outcome may be more a function of the differences in the samples for 2003 and 2004.
Table 14 Numeracy - No. of teaching sessions per week with Specialist Teacher
Cohort 1 Cohort 2 2003
46 2004 119
2003 39
2004 155
None 19.6 5.1 5.1 3.9 One 45.7 33.9 25.6 19.5
Two 30.4 49.2 56.4 69.5 Three or more 4.3 12.8 12.8 7.1 Total 100.0 100.0 100.0 100.0
Table 15 indicates that the average length of the weekly in-class support sessions with the Specialist Teacher was between 45 to 50 minutes.
Table 15 Numeracy - Average length of in-class support sessions with the Specialist Teacher
(minutes)
Cohort N 2003 Mean N 2004 Mean 1
41 46.20 114 48.92 2
37 44.19 148 46.16 Information was collected about other school staff who regularly assisted the classroom teacher when they worked with the Specialist Teacher. Table 16 indicates that a variety of
25 ACER Evaluation of the GiR-LNS in WA Schools

other people worked in the classroom for about 50% of the weekly sessions with the Specialist Teacher, most often one of the teacher aides in the school. Table 16 Numeracy - Who else assists when classroom teacher and GiR ST work together in the
classroom? (percentages)
Cohort 1 Cohort 2
2003 2004 2003 2004
Integration aide 8.7 12.6 10.3 10.3 Aboriginal Education Officer 2.2 9.2 2.6 2.6
Education support teacher 15.2 10.9 2.6 2.6 ESL specialist 0 0.8 2.6 2.6
Special Needs District Staff 0 0.8 0 0 Parents 2.2 8.4 15.4 15.4 Other 19.6 21.0 30.8 30.8
No one 58.7 54.6 48.7 48.7 N. 46 119 39 39
Note: the %s in Table 16 total more than 100% because respondents were able to tick more than one option.
Selection of teachers to work with the Specialist Teacher
In the 2003 survey, principals were asked “What were the most important criteria used in selecting classroom teachers to work with the Specialist Teacher?” The collaborative working relationships between the Specialist Teacher and classroom teachers appears to be a critical factor in the effectiveness of the GiR-LNS, and it was interesting to investigate the reasons that principals gave for selecting teachers to work with the Specialist Teacher. It was found that a range of reasons was cited, and it was possible to construct a set of categories from an examination of the responses. Space was provided on the survey to list three criteria, although many principals chose only to list one or two.
Table 17 shows the categories and frequencies for each category, sorted according to the aspect listed first, second and third.
In practice, the fact that schools were asked to focus the GiR-LNS work on the early years of schooling was the main determinant of which teachers were selected. The most frequently cited reason was the year level at which the teachers taught. Student needs was the next most frequently listed criterion. The willingness of teachers to work with the Specialist Teacher was identified by a small number of respondents. This question was not asked in the 2004 survey.
26 ACER Evaluation of the GiR-LNS in WA Schools

Table 17 Criteria for selecting teachers to work with the Specialist Teacher 2003 (percentages)
Selection criteria for teachers to work with Specialist Teachers
First criteria listed % N= 139
Second criteria listed
% N= 103
Third criteria listed % N= 61
Year level/s 45 15 8 Teachers’ willingness to work with ST (choice)
7 9 5
Teachers’ capacity for collaboration
4 5 5
Needs of students in classes 11 18 8 Teachers requesting to be involved 0 1 3 Attitude to the concept of GiR 0 0 0 Teachers’ interest in change in pedagogy
2 2 8
Other 3 11 10 • Availability of common
meeting time 1 Nil 3
• Level of teachers’ needs 2 8 10 • Small school, all involved 2 1 0 • Misread question; described
selection criteria for STs 24 31 39
Resources to support the work of Specialist Teachers
Principals were asked about the levels of practical support schools provided to support the work of the Specialist Teacher. This section of the report examines the extent to which schools supplemented the Specialist Teacher role with other resources. Specifically, principals were asked to indicate if the following had been provided:
• A suitable workspace for the Specialist Teacher
• Phone, computer and email access for the Specialist Teacher
• Timetabling and staffing arrangements to allow for the collaborative planning time needed by the Specialist Teacher and teacher colleagues
• Time, in addition to duties other than teaching (DOTT), for collaborative planning
• A budget for the Specialist Teacher to purchase resources for literacy or numeracy teaching.
27 ACER Evaluation of the GiR-LNS in WA Schools

0
10
20
30
40
50
60
70
80
90
100
a. A suitableworkspace forthe Specialist
Teacher
b. Phone,computer and
email access forthe Specialist
Teacher
c. Timetablingand staffing
arrangements
d. Time forcollaborative
planning
e. A budget forthe Specialist
Teacher
20032004
Figure 1 Percentage of principals reporting various types of resources provided to support the
Special Teacher in 2003 (n=144) and 2004 (n=141)
Figure 1 shows that in 2003 a large majority of schools had provided each type of resource listed. This was further improved upon in 2004. A suitable workspace was provided in almost all cases, but phone, computer and email access were provided less frequently. In both surveys, the majority of principals reported that they had made timetabling arrangements to allow for collaborative planning. In view of the importance of collaborative planning in the GiR-LNS, it is interesting to note that 77% in 2003 and 83% of schools in 2004 provided time in addition to DOTT for collaborative planning. Figure 1 indicates that schools were providing slightly more support for the Specialist Teachers in 2004 than in 2003. On the evidence from principals, schools appear to have provided resources for Specialist Teachers and to have improved this resourcing between 2003 and 2004.
Connections between the GiR-LNS and other school programs
It was seen to be important that the GiR-LNS be strongly connected with other funded school programs. As the GiR-LNS was intended to bring about improved learning opportunities for students, coherence with other school improvement programs was an important consideration.
Principals were asked to identify the extent to which the GiR-LNS was connected to other funded school programs, such as the Curriculum Improvement Program, the Students at Educational Risk strategy, the Commonwealth Literacy and Numeracy Program and the Aboriginal Education Operational Plan. Figure 2 shows the proportion of principals indicating the extent to which the GiR-LNS was connected with four programs in their school. It can be seen that for Curriculum Improvement Program, the Students at Educational Risk Strategy, and, less frequently, the Commonwealth Literacy and Numeracy Program, the GiR-LNS was often connected to a major extent in many schools. Further, there is little difference between 2003 and 2004 for these programs. However, for the Aboriginal Education Operational Plan there were many more principals reporting, especially in 2003, that there was only a connection to a minor extent. There was some evidence of a shift by 2004 for this
28 ACER Evaluation of the GiR-LNS in WA Schools

program, with fewer reporting a connection to a minor extent and more reporting to a moderate or major extent.
Curriculum improvement program
0
10
20
30
40
50
60
70
80
90
Not at all To a minor extent To a mod extent To a major extent
%
`20032004`
Students at Educational Risk
0
10
20
30
40
50
60
70
80
90
To a minor extent To a minor extent To a mod extent To a major extent
%
`20032004`
Commonwealth Literacy and Numeracy Program
The Aboriginal Educational Operational Plan
0
10
20
30
40
50
60
70
80
90
Not at all To a minor extent To a mod extent To a major extent
%
`20032004`
0
10
20
30
40
50
60
70
80
90
Not at all To a minor extent To a mod extent To a major extent
%
`20032004`
Figure 2 Extent to which the GiR-LNS was connected to other programs in the school
An analysis was performed examining the difference in the means between 2003 and 2004 in the extent to which the GiR-LNS was connected to each of these programs. For the Curriculum Improvement Program the increase in the mean from 3.63 in 2003 to 3.81 in 2004 was statistically significant (P=0.01). No other statistically significant differences were found. This may be due to the high level of connection between the GiR-LNS and these other programs reported in 2003. On the evidence from principals, strong connections appear to have been made between the GiR-LNS and many other programs in schools.
Setting targets
Improved target setting literacy and numeracy outcomes within schools was an important aim of the GiR-LNS. Principals played a key role in this process, supporting and working with the Specialist Teacher in the development of realistic and challenging targets, and negotiating these targets with the District Director. Principals were asked about the personnel who had been involved in target setting.
Table 18 shows that in both 2003 and 2004 almost all of the schools involved the Specialist Teacher in target setting. In almost half of the respondents’ schools, all members of the school leadership team or the whole staff were involved. District Office staff and parents were rarely involved.
29 ACER Evaluation of the GiR-LNS in WA Schools

Table 18 Involvement in target setting (percentages)
Who was involved in setting targets? (tick as many boxes as apply)
Year No %
Yes %
N
a) The Specialist Teacher 2003 2004
4 11
96 89
144 141
b) You, the principal, alone 2003 2004
83 87
17 14
144 141
c) All members of the school leadership team 2003 2004
49 55
51 45
144 141
d) A literacy or numeracy working party 2003 2004
69 57
31 43
144 141
e) The whole staff 2003 2004
54 47
46 53
144 141
f) District Office staff 2003 2004
95 92
5 8
144 141
g) Parents 2003 2004
89 90
11 10
144 141
h) District Director 2003 2004
95 94
5 144 141 6
Sources of data in setting targets
The use of data to set targets to improve learning is a key aspect of the GiR-LNS, and so principals were asked about the data that had been used in setting targets. The descriptive results indicate that all the data sources suggested in the survey question had been used to a considerable extent. WALNA data was used to a moderate or major extent in 74% of schools in 2003 and in 86% of schools in 2004. The upward trend from 2003 to 2004 is significant. Eighty one per cent of schools used Curriculum Framework Outcomes to a moderate or major extent in both years. The most frequently used sources of information were ‘other quality student achievement data’ (95% to a moderate or major extent in 2003, and 96% in 2004) and the needs of students (94% in 2003 and 94% in 2004) to a moderate or major extent). The 2004 data confirmed the 2003 data, indicating that schools were drawing on a variety of information in setting targets.
30 ACER Evaluation of the GiR-LNS in WA Schools

Table 19 Data used in setting targets 2003 and 2004 (percentages)
To what extent was each of the following important in setting targets?
Year Not at all
To a minor extent
To a moderate
extent
To a major extent
N
a) WALNA data 2003 2004
9 4
17 10
25 20
49 66
139 137
b) Other quality student achievement data
2003 2004
2 2
3 2
25 25
70 71
131 129
c) Curriculum Framework learning outcomes for English or mathematics
2003 2004
2 5
18 14
40 33
41 47
131 133
d) The needs, experiences and
interests of students in need of help (literacy or numeracy)
2003 2004
1 2
6 5
25 22
69 137 72 135
Principals were asked about the extent to which schools modified the targets once they had been set, and the sources of information and advice leading to modification. Sixty-three per cent of respondents reported that the targets had been modified during 2003, and 66% reported that they had been modified during 2004. Thirty-seven per cent reported that in 2003 the targets had not been modified, and 34% reported that the targets had not been modified in 2004. Table 20 shows the frequencies of responses to suggested reasons for the modification of targets.
Table 20 Modifying targets 2003 and 2004 (percentages)
What led to targets being modified?
Year No %
Yes %
N
a) More information about student performance became available
2003 2004
48 52
52 48
144 141
b) Advice was provided by Getting it Right team members
2003 2004
58 57
42 43
144 141
c) Advice was provided by District Office staff 2003 2004
95 94
5 6
144 141
d) Further review of student achievement data, such as the WALNA data, or information gained from the Literacy/Numeracy Net
2003 2004
58 45
41 144 55 141
The most common reasons for modifying the targets in both 2003 and 2004 were the availability of further information about student performance and further review of the data. Advice from the GiR-LNS team members prompted modification in 42% of schools and 43% in 2004. Advice from District Office staff was almost never involved in either year.
Summary
Information collected through the surveys about the implementation of the GiR-LNS in schools indicated that
• Respondents had worked collaboratively with Specialist Teachers for varying periods, ranging from less than one term to more than eight terms.
• Literacy and numeracy Specialist Teachers provided one or two sessions of in-class support per week.
31 ACER Evaluation of the GiR-LNS in WA Schools

• The reason for selecting teachers to work collaboratively with the Specialist Teacher was most often the year level taught.
• Schools provided adequate resources for the Specialist Teacher, and the resourcing appeared to have improved between 2003 and 2004.
• Strong connections existed between the GiR-LNS and other literacy and numeracy improvement programs.
• Almost all schools in 2003 and 2004 involved the Specialist Teacher in setting targets.
32 ACER Evaluation of the GiR-LNS in WA Schools

4. THE GETTING IT RIGHT TRAINING FOR SPECIALIST TEACHERS
The training provided by the GiR-LNS central team is a significant component of the strategy, designed to further develop teachers’ knowledge and skills relating to the effective teaching of literacy and numeracy. The Specialist Teachers in both cohorts that are the focus of this evaluation attended seven training workshops at a central location over a period of two years, each workshop lasting for three days. These workshops were planned and conducted by the central GiR-LNS team, and included presentations from a range of literacy and numeracy experts. Country teachers stayed in residence for these sessions.
The training sessions drew on a range of contemporary practice and research into the acquisition and development of literacy and numeracy knowledge and skills, and in meeting the diverse needs of students. The central team followed up on the training workshops by visiting Specialist Teachers in their schools once each term.
Members of the central team were very experienced in the fields of literacy and numeracy. For example, all members of the numeracy team, had been involved in the development of First Steps in Mathematics (FSiM). Much of the numeracy training fro Specialist teachers was devoted to familiarising Specialist Teachers with the FSiM materials.
It was anticipated that one of the factors critical in enabling literacy and numeracy Specialist Teachers to work effectively was the training. Accordingly, Specialist Teachers were asked to indicate the extent to which the GiR-LNS training sessions for Specialist Teachers had:
a. provided them with effective strategies for working with teacher colleagues
b. engaged them in actively reflecting on their work with teacher colleagues
c. provided support for their work in helping teacher colleagues to gain a clearer understanding of the English (or Mathematics) Student Outcome Statements
d. built their capacity to support teacher colleagues in meeting the needs of identified students in the mainstream classroom
e. helped them to enhance the repertoire of instructional practices of the teacher colleagues with whom they worked
f. provided opportunities for them to collaborate with colleagues in examining students’ work
g. engaged them in analysing students’ achievement in relation to learning outcomes
h. engaged them in collaborating with colleagues to plan appropriate teaching strategies linked to students’ achievement
i. provided follow-up and ongoing assistance to help them in your work with teacher colleagues
j. enabled them to receive on-going support and advice from other Specialist Teachers.
This section of the report describes Specialist Teachers’ attitudes to the training and support, as reported in the questionnaires. Literacy Specialist Teachers
For most of these outcomes, over 70% of Literacy Specialist Teacher reported that each outcome had been achieved to a moderate or major extent. Figure 3 shows the different proportions of Literacy Specialist Teachers who reported that various outcomes had been
33 ACER Evaluation of the GiR-LNS in WA Schools

achieved to a moderate or major extent as a result of the GiR training sessions for Specialist Teachers. (In this figure, the light toned columns represent 2003 and the darker toned columns represent 2004.)
It can be seen that for all outcomes, except item j – Advice from other Specialist Teachers – there was an increase in 2004 compared with 2003 in the proportion indicating a moderate or major effect.
0102030405060708090
100
a) Effe
ctive
strat
egies
b) Acti
vely
reflec
ting
c) Und
erstan
ding o
f the E
nglish
Studen
t O.S.
d) Sup
port t
each
er co
lleag
ues
e) Enh
ance
the r
epert
oire
f) Exa
mining
stud
ents’
work
g) Ana
lysing
stud
ents’
achie
vemen
t
h) Plan
appro
priate
teac
hing s
trateg
ies
i) Foll
ow-up
j) Adv
ice fro
m othe
r Spe
cialis
t Tea
chers
Figure 3 Literacy Specialist Teachers’ views on the extent to which various outcomes were
achieved as a result of the GiR-LNS training sessions for Specialist Teachers contrasting 2003 and 2004 – per cent indicating to a moderate or major extent.
In both years, the most commonly identified outcomes achieved to a moderate or major extent were:
• the capacity of Specialist Teachers to support teacher colleagues in meeting the needs of identified students in the mainstream classroom (Item d)
• the enhancement of the repertoire of instructional practices of the teacher colleagues with whom the Specialist Teachers worked (Item e)
The largest changes between years were reported in relation to:
• the provision of effective strategies for working with teacher colleagues (Item a)
• support for the Specialist Teachers’ work in helping teacher colleagues to gain a clearer understanding of the English Student Outcome Statements (Item c)
Based on this evidence, the training provided for Literacy Specialist Teachers appear to have been highly effective across a wide range of outcomes.
34 ACER Evaluation of the GiR-LNS in WA Schools

Numeracy Specialist Teachers
The training for the numeracy Specialist teachers was planned and conducted Figure 4 shows the different proportions of Specialist Teachers who reported that various outcomes had been achieved to a moderate or major extent as a result of the GiR training sessions for Specialist Teachers. It can be seen that for all outcomes, there were very similar and high levels of endorsement for the training in both 2003 and 2004.
0.0
20.0
40.0
60.0
80.0
100.0
a) Effe
ctive
strat
egies
b) Acti
vely
reflec
ting
c) Und
erstan
ding o
f the M
aths S
tuden
t O.S
.
d) Sup
port t
each
er co
lleag
ues
e) Enh
ance
the r
epert
oire
f) Exa
mining
stud
ents’
work
g) Ana
lysing
stud
ents’
achie
vemen
t
h) Plan
appro
priate
teac
hing s
trateg
ies
i) Foll
ow-up
j) Adv
ice fro
m othe
r Spe
cialist
Teach
ers
Figure 4 Numeracy Specialist Teachers’ views on the extent to which various outcomes were
achieved as a result of the GiR-LNS training sessions for Specialist Teachers contrasting 2003 and 2004 – per cent indicating to a moderate or major extent.
There were only minor differences in the shapes of the distributions between 2003 and 2004. The largest was for items e and g. On these items, there was a drift towards an increased tendency to report that these outcomes had been achieved to a major extent in 2004 compared with 2003. On the evidence from the Specialist Teachers, the training sessions for Specialist Teachers appear to have been effective across a wide range of outcomes.
35 ACER Evaluation of the GiR-LNS in WA Schools


5. WORKING ‘SHOULDER TO SHOULDER’
The concept of working ‘shoulder to shoulder’ is a central component of the GiR-LNS. Specialist Teachers receive on-going central training over a two-year period to support their work in working alongside colleagues in their schools to improve literacy and numeracy teaching practices.
The focus of collaboration between Specialist Teachers and their classroom colleagues is on finding out what students know and what they need to learn next, planning appropriate activities to further student understanding, planning how they will work together to implement those activities, and collaborating in the classroom. The Specialist Teachers are not support teachers. The regular teacher has final responsibility for the progress of all the students in the class. Specialist Teachers do not regularly withdraw groups of students from a class or take responsibility for one group of students. Rather, the Specialist Teacher and the teacher are expected to use a variety of classroom strategies together, ranging from whole class to small group, depending on the purposes of the lessons.
The intended role that the Specialist Teacher is to play in the school is clearly specified, although the case studies indicate that each school implements the role in slightly different ways. Schools understand that the Specialist Teacher needs regular and on-going collaborative planning time with each teacher with whom they are working. The central GiR-LNS team recommends that Specialist Teacher and teachers have time for a weekly planning session together and time to teach one or two lessons together each week.
Specialist Teachers are also expected to work toward implementing whole school approaches to improvement and to work with the principal in setting and monitoring targets for student learning outcomes.
Implementation of the ‘Shoulder to Shoulder’ concept
The purpose of this chapter is to present data about the nature and extent of implementation of the working ‘shoulder to shoulder’ approach. Before doing so, it is necessary to provide some background information about the groups, or cohorts, of teachers included in the survey. This evaluation gathered data from two cohorts of Specialist Teachers and the classroom teachers with whom they worked: those who joined the GiR Program late in 2001 (Cohort 1) and those who joined late in 2002 (Cohort 2).
Provision of Resources by the GiR Specialist Teacher
Part of the training of the Specialist Teacher included making available a range of resources that they could use with their classroom colleagues. These resources included assessment materials and teaching activities relevant to identifying and monitoring students’ needs and planning appropriate teaching activities. lists relevant resources, asks whether the resources were used or not, and asks about the extent to which the Specialist Teachers considered them useful. This table indicates data from the 2004 survey only. By the time the 2004 survey was conducted, nearly all literacy GiR-LNS Special Teachers reported that they had used the resources,
Table 21
except for the ESL Bandscales. It should be noted that the Kimberley Bandscales for Aboriginal ESL/D Students reflect the language development of Kimberley Aboriginal students who speak English as a second language or dialect (ESL/D). The documents provide Kimberley teachers with a resource to monitor language learning and plan
37 ACER Evaluation of the GiR-LNS in WA Schools

for individual progress. They therefore address the needs of particular groups of students, while the other resources listed are relevant to all students. Almost all (98%) respondents reported that the First Steps in Literacy materials and the Literacy Net were useful or very useful, and the Luke and Freebody four resources model* was reported by 88% of respondents to be useful or very useful.
Table 21 Literacy Specialist Teachers 2004 - resources used with colleagues (n=63)
Not used
Used Not at all
useful
Somewhat useful
Useful Very useful
First Steps in Literacy 2 61 0.0 1.6 24.6 73.8 Assessment instruments such as the Literacy Net
0 63 0.0 1.6 14.3 84.1
Professional readings 2 61 0.0 32.8 32.8 34 The ESL Bandscales 21 42 9.5 59.5 21.4 9.5 The Four Resources of the Reader Model
3 60 0.0 11.7 20.0 68.3
Table 22 provides similar data reported by numeracy Specialist Teachers. It is interesting to note that the new First Steps in Mathematics resources were used by almost all Specialist Teachers, who all reported that they were useful or very useful. The training sessions for Specialist Teacher allocated considerable time to introducing these research-based materials, a new resource for teaching mathematics. The Numeracy Net was rated as useful or very useful by 77% of respondents.
Table 22 Numeracy Specialist Teachers 2004 - Resources used with colleagues (n=53)
Not used Used Not at all
Useful
Somewhat useful
Useful Very useful
First Steps in Mathematics Curriculum Development Resource 2 51 0.0 0.0 13.7 86.3 Assessment instruments such as the Numeracy Net 10 43 8.3 14.6 18.8 58.3 Professional readings 3 50 2.0 34.0 50.0 14.0 The First Steps Diagnostic Map 1 52 0.0 44.2 28.8 26.9
Diagnosis, planning and reflection
This section focuses on diagnostic, planning and reflective activities that Specialist Teachers and classroom teachers worked on together. These included:
a. Diagnosing the learning needs of students
b. Using assessment instruments (such as progress maps or other instruments)
c. Planning learning activities to address identified needs of students
* Luke, A. and Freebody, P., ‘A Map of Possible Practices: further notes on the four resources model’. In Practically Primary Volume 4, Number 2, June 1999, Australian Literacy Educators’ Association
38 ACER Evaluation of the GiR-LNS in WA Schools

d. Keeping records of the progress of students
e. Choosing teaching activities to move students forward
f. Preparing relevant teaching resources for students
g. Reflecting on teaching
h. Identifying specific areas of literacy or numeracy teaching practice needing development
i. Helping teachers to work with parents more effectively.
Specialist Teachers and classroom teachers were asked to look back over the whole period that they had been working together and report on how often they had engaged in each activity and how useful that activity had been in improving practice in the teaching of literacy or numeracy.
Literacy teachers
Figure 5 compares the mean scores (and associated 95% confidence intervals) for how frequently literacy Specialist Teachers and classroom colleagues reported working together on various activities over the whole period of their involvement in the GiR-LNS. It can be seen that the most frequent activities undertaken, on average, were planning learning activities (Item c), and choosing teaching activities (Item e). The least frequent was working with parents (Item i).
39 ACER Evaluation of the GiR-LNS in WA Schools

Specialist Teachers Classroom teachers
Figure 5 Mean scores for how often literacy Specialist Teachers and classroom teachers reported that the Specialist Teacher had helped teachers to carry out various activities in 2004 (1=never, 2=sometimes, 3=often, 4=always)
An examination of Figure 5 shows that the pattern of responses for Literacy Specialist Teachers and classroom teachers are virtually identical. The classroom teachers, however, on average, reported somewhat lower frequencies than the Specialist Teachers. Around 60% said the Specialist Teacher never helped with working with parents.
Specialist Teachers were much more likely to report that an activity had occurred than classroom teachers, particularly as the Specialist Teachers worked with a number of different classroom colleagues. There was a strong correlation between how frequently these activities were undertaken and how useful they were rated, both for Specialist Teachers and teachers. Differences between the two cohorts on these items were small.
Numeracy teachers
Figure 6 compares the mean score (and associated 95% confidence intervals) for how often numeracy Specialist Teachers and classroom colleagues reported working together on various activities during the whole period of their involvement in the GiR-LNS.
For numeracy Specialist Teachers, the most frequent activities undertaken, on average, were planning learning activities (Item c), and choosing teaching activities to move their students forward (Item f). The least frequent was working with parents (Item i). For classroom teachers, the most frequent activities undertaken, on average, were choosing teaching activities to move their students forward (Item e) and diagnosing student learning needs (Item a). There was a strong correlation between how frequently these activities were undertaken and how useful they were rated, both for Specialist Teachers and classroom teachers.
40 ACER Evaluation of the GiR-LNS in WA Schools

Specialist Teachers Classroom teachers
Figure 6 Mean scores for how often numeracy Specialist Teachers and classroom teachers reported that the Specialist Teacher had helped teachers to carry out various activities in 2004 (1=never, 2=sometimes, 3=often, 4=always)
An examination of Figure 6 shows that the pattern of responses is broadly similar for Specialist Teachers and classroom teachers. The classroom teachers, however, on average, reported lower frequencies than the Specialist Teachers.
There were a number of items on which statistically significant differences between Cohorts 1 and 2 were found. These differences were found in 2003 and 2004, and in all cases Cohort 2 had a higher average than Cohort 1, indicating that Cohort 2 classroom teachers had engaged in these activities more often.
For the numeracy Specialist Teachers, there were statistically significant differences between Cohorts 1 and 2 in 2003 for the following items:
• Planning learning activities to address identified needs of their students (Item c). The mean for Cohort 1 was 3.22, and for Cohort 2 the mean was 3.71 (P = 0.019).
• Choosing teaching activities to move their students forward (Item e). The mean for Cohort 1 was 2.89, and for Cohort 2 the mean was 3.71 (P < 0.001).
• Preparing relevant teaching resources for their students (Item f). The mean for Cohort 1 was 2.61, and for Cohort 2 the mean was 3.23 (P = 0.009).
There were, however, no statistically significant differences between the cohorts in 2004.
There were a number of items on which statistically significant differences between Cohorts 1 and 2 were found. These differences were only found in 2003, and in all cases Cohort 1 had a higher average than Cohort 2, indicating that Cohort 1 classroom teachers had engaged in these activities more often. Interestingly, there was only one item on which the cohorts of
41 ACER Evaluation of the GiR-LNS in WA Schools

classroom teachers differed in the usefulness of these activities – Usefulness of reflection (Item g)
Table 23 Activities the literacy Specialist Teacher had helped teachers to carry out on which
Cohort 1 differed from Cohort 2
Cohort N Mean SD
Frequency of learning needs diagnosis (Item a) 1 31 2.81 0.79
2 45 2.31 0.82
Frequency of use of assessment instruments (Item b) 1 32 2.75 0.76
2 44 2.16 0.75
Frequency of learning activity planning (Item c) 1 31 2.97 0.95
2 45 2.58 0.99
Frequency of progress records (Item d) 1 31 2.77 0.96
2 45 2.27 0.84
Frequency of choosing activities (Item e) 1 31 3.00 0.77
2 45 2.62 0.96
Frequency of teaching resource preparation (Item f) 1 31 2.81 0.91
2 45 2.29 0.97
Frequency of reflection (Item g) 1 31 2.77 0.84
2 45 2.27 0.84
Usefulness of reflection (Item g) 1 28 3.54 0.51
2 41 3.05 0.89
There were no statistically significant differences in the mean frequency or usefulness of activities the Specialist Teacher had helped teachers to carry out between classroom teachers in 2003 and 2004.
Patterns of working shoulder to shoulder at the classroom level
This section focuses on the ways in which Specialist Teachers and classroom teachers worked together in the classroom. The data indicates the nature of the in-class support provided by Specialist Teachers. The following possibilities were listed:
a) Specialist Teacher models a whole lesson for the teacher to observe
b) Specialist Teacher models a strategy for the teacher to observe for part of the lesson
c) Specialist Teacher and the teacher separately work with small groups of students
d) Specialist Teacher and the teacher rotate around small groups engaged in different tasks
42 ACER Evaluation of the GiR-LNS in WA Schools

e) Specialist Teacher and the teacher collaboratively teach the whole lesson
f) Specialist Teacher observes the teacher teach the whole lesson
g) Specialist Teacher observes the teacher and provides feedback about their teaching
h) Specialist Teacher regularly withdraws students to provide them with additional support
i) Specialist Teacher works with a small group of students at risk while the teacher teaches the rest of class
j) The teacher works with a small group of students at risk while the Specialist Teacher teaches the rest of class
k) Specialist Teacher conducts diagnostic assessments while the teacher teaches the class
l) The teacher conducts diagnostic assessments while the Specialist Teacher teaches the class
m) Specialist Teacher takes prime responsibility for a group of students.
Specialist Teachers and classroom teachers were asked to look back over the past month that they had been working together and report on how often they had engaged in each activity and how useful that activity had been in improving practice in the teaching of literacy or numeracy.
Literacy teachers
Figure 7 compares the mean scores (and associated 95% confidence intervals) for how often literacy Specialist Teachers and classroom teachers engaged in various activities designed to improve their practice as teachers of literacy. It can be seen that the Specialist Teachers indicated that the most frequent activities, on average, for them were modelling a whole lesson or a teaching strategy for the teacher to observe (Items a & b). Items c, d and e were also reported by literacy Specialist Teachers as occurring frequently. The least frequent, as would be expected since it was inconsistent with the intentions of the GiR-LNS, was Specialist Teacher regularly withdraws students to provide them with additional support (Item h). Also reported infrequently was the Specialist Teacher taking prime responsibility for a group of students (Item m).
Classroom teachers reported that the most frequent activity was that the Specialist Teacher and the teacher separately work with small groups of students (Item c). Item h - Specialist Teacher regularly withdraws students to provide them with additional support – occurs, according to the classroom teachers with the same (in)frequency as many other activities.
43 ACER Evaluation of the GiR-LNS in WA Schools

Specialist Teachers Classroom teachers
Figure 7 Mean scores for how often literacy classroom teachers engaged in various activities in the previous month contrasting Specialist Teacher and classroom teachers, 2004 (1=never, 2=once a term, 3=once a month, 4=every week)
There were many activities that were undertaken relatively infrequently, according to the classroom teachers, (Items f – m). (Substantively most of these occurred between once a term and once a month). This contrasts markedly with the responses given by the Specialist Teachers to the same activities.
For the literacy Specialist Teachers, the most useful activities over the previous month, on average, had been items a and b – modelling lessons and strategies – and item e. The least useful was withdrawing students for additional support (Item h). Fifty per cent of literacy Specialist Teachers reported that withdrawal of students was not at all useful and 40 per cent reported that taking responsibility for a group of students was not at all useful.
Classroom teachers reported similar levels of usefulness for all of these activities – between somewhat useful and useful. This contrasted markedly with the widely varying levels of usefulness reported by the Specialist Teachers for the different activities. Teachers reported that the least useful activity was Specialist Teacher takes prime responsibility for a group of students. Classroom teachers were more likely to find an activity not at all useful compared with the Specialist Teachers.
There were a number of statistically significant differences between Cohorts 1 and 2 in 2003 or 2004 on the mean frequency and mean usefulness of activities that the literacy Specialist Teachers were asked about. These are summarised in Table 24. It can be seen that Cohort 1 more often had a higher average score for these activities than Cohort 2.
44 ACER Evaluation of the GiR-LNS in WA Schools

Table 24 Items with statistically significant differences between Cohorts 1 and 2 in 2003 or 2004 of Literacy Specialist Teachers on the mean frequency and mean usefulness of various activities
2004 2003
Frequency Usefulness Frequency Usefulness
Cohort 1 higher Item g (P=0.023)
Item m (P=0.023)
Item g (P=0.009)
Item k (P=0.029)
Item l (P=0.007) -
Cohort 2 higher Item a (P=0.005)
Item b (P=0.035)
- Item m (P=0.023) -
There were statistically significant differences in the mean between Literacy Specialist Teachers in 2003 and 2004 for two items:
• Specialist Teacher works with a small group of students at risk while the teacher teaches the rest of class (Item j) (P=0.046)
• The teacher works with a small group of students at risk while the Specialist Teacher teaches the rest of class (Item i) (P=0.002)
For both items, the mean in 2004 was higher than in 2003. In other words, the literacy Specialist Teachers were more likely, on average, to engage in these activities in 2004 compared with 2003.
Numeracy teachers
Figure 8 compares the mean score (and associated 95% confidence intervals) for how often numeracy Specialist Teachers and classroom teachers engaged in various activities designed to improve their practice as teachers of numeracy. It can be seen that the Specialist Teachers indicated that the most frequent activities, on average, for them were items a, b, c, d and e. These activities were typically used between once a month and once a week, while the rest were used between once a term and once a month. One of the least frequent was withdrawing students for additional support (Item h). Numeracy Specialist Teachers rated items a, b, c and e as the most useful, on average.
For classroom teachers, the most frequent activity, on average, was the Specialist Teacher and the classroom teacher working separately with small groups (Item c). There were many activities that, according to the classroom teachers were relatively infrequently undertaken (Items f – m). (Substantively most of these occurred between once a term and once a month). This is similar to the responses given by the Specialist Teachers to the same activities. Item h, Specialist Teacher regularly withdraws students to provide them with additional support – an activity inconsistent with the intention of the GiR-LNS to focus on in-class support - occurs, according to the classroom teachers with less frequency, on average, than many other aspects of in-class support.
45 ACER Evaluation of the GiR-LNS in WA Schools

Specialist Teachers Classroom teachers
Figure 8 Mean scores for how often classroom teachers engaged in various activities in the previous month contrasting numeracy Specialist Teacher and classroom teachers, 2004 (1=never, 2=once a term, 3=once a month, 4=every week)
Investigation of those numeracy Specialist Teachers who reported that they had often or always used withdrawal and that this had been very useful was undertaken. There were 11 numeracy Specialist Teachers in this category. This represents about 20 per cent of the numeracy Specialist Teachers. They tended to have been teaching for longer than other Specialist Teachers (23.7 years compared with 15 years – P = 0.004). There was no evidence that being a member of the staff when appointed, the number of years at the school, or the time fraction they spent working as a Specialist Teacher were associated with the frequency of using this activity. There was no statistically significant difference in the average scores of these teachers on the scenarios compared with other numeracy Specialist Teachers.
In summary, a wide range of activities was frequently engaged in by Specialist Teachers over the previous month with their classroom colleagues, and most of these were seen to be useful. A small proportion of numeracy Specialist Teachers reported withdrawing students.
In terms of how useful various kinds of in-class support over the previous month were perceived to have been, classroom teachers reported fairly similar levels of usefulness for each of the activities, except for items f and g, which were typically seen to be somewhat useful. For the other items, the typical response was that these activities were useful.
Typically, Specialist Teachers saw the activities as more useful than classroom teachers. The most noticeable difference were between items f and g, which numeracy Specialist Teachers saw as more useful than they were reported to be by classroom teachers. Classroom teachers saw the Specialist Teacher observing and providing feedback (Item g) as the least useful activity.
There were no statistically significant differences between Cohorts 1 and 2 in 2003. In 2004, there was one item with a statistically significant difference between the cohorts – item k
46 ACER Evaluation of the GiR-LNS in WA Schools

Specialist Teacher conducts diagnostic assessments while the teacher teaches the class. For Cohort 1, the mean was 2.14 and for Cohort 2 the mean was 2.39 (P = 0.025). There was no difference between the Cohorts in 2003 or 2004 on the mean usefulness of activities that the numeracy classroom teachers were asked about.
Investigation of those classroom teachers who reported that they had often used withdrawal and that this had been very useful was undertaken. There were 35 classroom teachers in this category. They tended to have been teaching at their present school for more years than other teachers (8.74 years versus 6.16 years, P = 0.02). There was no evidence that the numbers of sessions per week work with a Specialist Teacher, the number of terms working with the Specialist Teacher, the number of planning sessions spent each week with Specialist Teacher, how long each session with the Specialist Teacher lasted were associated with the frequency of using this activity.
In summary, a wide range of activities was engaged in by classroom teachers over the previous month with numeracy Specialist Teachers, and most of these were seen to be useful.
Working at the school level
This section focuses on the activities that a Specialist Teacher might undertake to promote a ‘whole school’ approach to improving literacy or numeracy teaching. These included:
a. Building professional knowledge about literacy (or mathematics) by talking at staff meetings
b. Providing and promoting professional readings
c. Maintaining a display of literacy (or mathematics) information and materials in the library or staff room
d. Helping teachers get a whole school view of what the children know about key aspects of literacy/mathematics
e. Drawing the attention of teachers to aspects of the literacy (or mathematics) curriculum that need more emphasis
f. Helping teachers develop a shared understanding of the English (or Mathematics) Student Outcome Statements
g. Helping teachers come to a shared understanding of progress through the student outcome levels.
Specialist Teachers and classroom teachers were asked to look back over the whole period that they had been working together in the GiR-LNS and to report on how often they had engaged in each activity and how useful that activity had been in improving practice in the teaching of literacy or numeracy.
Literacy teachers
Figure 9 compares the mean scores (and associated 95% confidence intervals) for how often literacy Specialist Teachers and classroom colleagues reported, in 2004, that they had worked together on various school-wide activities over the whole period of their involvement in the GiR-LNS. It can be seen that that there was very little difference, on average, in the frequency of use of these activities. Substantively, these activities were undertaken, on average, once a month by the literacy Specialist Teachers.
47 ACER Evaluation of the GiR-LNS in WA Schools

Teachers reported that two activities were undertaken somewhat less frequently – Helping teachers develop a shared understanding of the English Student Outcome Statements (Item f), and Helping teachers come to a shared understanding of progress through the student outcome levels (Item g). The classroom teachers reported similarly frequencies to the Specialist Teachers for most activities, but they reported that items f and g were less frequently undertaken than the Specialist Teachers reported.
Specialist Teachers Classroom teachers
Figure 9 Mean scores for how often literacy Specialist Teachers and Classroom teachers reported that activities done with the Specialist Teacher were used in 2004 (1=never, 2=once a term, 3=once a month, 4=every week)
Fourteen per cent of literacy Specialist Teachers reported that they had never maintained a display of literacy materials, and around 10 per cent had never helped teachers get a whole school view of what the children know about key aspects of literacy.
Over 30 per cent of classroom teachers reported that they had never been helped by the Specialist Teacher to develop a shared understanding of the English Student Outcome Statements, and just under 30 per cent had never been helped by the Specialist Teacher to come to a shared understanding of progress through the student outcome levels. There were large differences between Specialist Teachers and classroom teachers in reporting that an activity was never used. Classroom teachers were much more likely to report most activities as never having been used.
There were no statistically significant differences between Cohorts 1 and 2 in either 2003 or 2004 on the mean frequency of any of the activities that the literacy Specialist Teachers were asked about. There were, however, some statistically significant differences in the means between literacy Specialist Teachers in 2003 and 2004. In all cases the mean was higher for 2004 than for 2003. There were statistically significant difference on the frequency of activities described by items c, (P=0.008), d (P=0.038), f (P<0.001) and g (P<0.001).
48 ACER Evaluation of the GiR-LNS in WA Schools

Most literacy Specialist Teachers saw most of the activities listed above as useful. The least useful were items b and c – providing professional reading, and maintaining a display of literacy materials. Less than or close to 5 per cent of Literacy Specialist Teachers found the various activities to be not at all useful for improving literacy in the school.
Classroom teachers typically saw these activities as less useful than the Specialist Teachers. In particular, classroom teachers saw items f and g to be less useful than they were rated by Specialist Teachers. About 20 per cent of classroom teachers reported that activities to do with helping teachers develop a shared understanding of the English Student Outcome Statements or come to a shared understanding of progress through the student outcome levels, were not at all useful.
There were no statistically significant differences in the mean usefulness of any of the activities that the literacy Specialist Teachers were asked about between Cohorts 1 and 2 in 2003, but in 2004 Cohort 1 teachers indicated that talking at staff meetings, on average, proved to be more useful than indicated by Cohort 2 teachers. There were no statistically significant differences in the means between literacy Specialist Teachers in 2003 and 2004 except for item g where in 2004 literacy Specialist Teachers reported, on average, that they found helping teachers to a shared understanding of progress through the student outcome levels was more useful for improving literacy in the whole school than in 2003 (P=0.038).
There was one statistically significant difference between Cohorts 1 and 2 in 2003 on the mean frequency of activities that classroom teachers were asked about – drawing the attention of teachers to aspects of the literacy curriculum that needed more emphasis (Item e, P=0.01). Cohort 1 teachers had a higher average (2.87) than Cohort 2 teachers (2.3). There were no statistically significant differences between the cohorts in 2004.
There were some statistically significant differences in the mean frequency of various activities between classroom teachers in 2003 and 2004. In all cases the mean was higher for 2004 than for 2003. These results are shown in Table 25.
49 ACER Evaluation of the GiR-LNS in WA Schools

Table 25 Statistically significant differences in the mean frequency and usefulness of various
activities with literacy Specialist Teachers, as reported by classroom teachers in 2003 and 2004
Year Mean Probability
2003 2.39 Frequency: Helping teachers get a whole school view of what the children know about key aspects of literacy (Item d)
2004 2.10
0.017
2003 2.58 Frequency: Drawing the attention of teachers to aspects of the literacy curriculum that need more emphasis (Item e)
2004 2.28
0.006
2003 2.51 Frequency: Helping teachers develop a shared understanding of the English Student Outcome Statements (Item f)
2004 2.00
<0.001
2003 3.03
2004 2.40
Frequency: Helping teachers come to a shared understanding of progress through the student outcome levels (Item g)
0.005
Table 25 shows the mean score for how useful various activities had been in 2004. It can be seen that most were seen to be useful. Examination of Table 25 shows that there was a quite different pattern of responses between classroom teachers and Specialist Teachers, with classroom teachers typically seeing these activities as less useful than the Specialist Teachers. In particular, classroom teachers saw items f and g to be less useful compared with Specialist Teachers.
There were no statistically significant differences in the mean usefulness of any of the activities that the classroom teachers were asked about between Cohorts 1 and 2 in 2003, but in 2004, there were two items with a statistically significant difference between the cohorts. Cohort 1 teachers had a higher average than Cohort 2 teachers for both items. This can be seen in Table 26.
There were no statistically significant differences in the mean usefulness of these activities between classroom teachers in 2003 and 2004.
Table 26 Statistically significant differences in the mean frequency and usefulness of various
activities with literacy Specialist Teachers, as reported by classroom teachers in 2003 and 2004
Year Mean Probability
2003 3.2 Usefulness: Helping teachers get a whole school view of what the children know about key aspects of literacy (Item d)
2004 2.44
0.018
2003 3.19 Usefulness: Helping teachers develop a shared understanding of the English Student Outcome Statements (Item f)
2004 2.40
0.002
50 ACER Evaluation of the GiR-LNS in WA Schools

In summary, a wide range of activities was undertaken frequently by literacy Specialist Teachers at the school level to enhance literacy teaching and most of these were seen to be useful. However, it is noteworthy that classroom teachers typically reported that these activities occurred less frequently and were less useful than was reported by the Specialist Teachers.
Numeracy teachers
Figure 10 compares the mean score (and associated 95% confidence intervals) for how often Numeracy Specialist Teachers and classroom colleagues reported working together on various school-wide activities over the whole period of their involvement in the GiR-LNS. It can be seen that that the three activities most often undertaken included:
• Drawing the attention of teachers to aspects of the mathematics curriculum that need more emphasis (Item e)
• Helping teachers develop a shared understanding of the Mathematics Student Outcome Statements (Item f)
• Helping teachers come to a shared understanding of progress through the student outcome levels (Item g)
Substantively, these activities were undertaken by the Specialist Teachers, on average, once a month. Other activities were undertaken between once a term and once a month. The classroom teachers reported similarly frequencies to the numeracy Specialist Teachers. This can be seen in Figure 10.
Specialist Teachers Classroom teachers
Figure 10 Mean scores for how frequently numeracy Specialist Teachers and Classroom teachers reported that activities involving the Specialist Teacher were used in 2004 (1=never, 2=once a term, 3=once a month, 4=every week)
51 ACER Evaluation of the GiR-LNS in WA Schools

There were statistically significant differences between Cohorts 1 and 2 in 2003 for items d, e and g. In all cases the mean for Cohort 2 was higher than for Cohort 1. The means for Cohorts 1 were 1.56, 2.72 and 2.12 respectively, compared with means for Cohort 2 of 2.17, 3.29 and 2.68 respectively (P = 0.035, P = 0.03, P = 0.025). Cohort 2 Specialist Teachers were, therefore, more likely to engage in these activities compared with Cohort 1 Specialist Teachers.
There were also statistically significant differences in the mean between Specialist Teachers in 2003 and 2004. In all cases the mean was higher for 2004 than for 2003. These differences were found for items c, d and g. The means were in 2003 1.56, 1.96, and 2.48, respectively, and in 2004 the means were 1.98, 2.27 and 2.96 (P = 0.008, P = 0.038, P = 0.002).
Most activities were seen to be useful. The least useful were items b and c – providing professional reading, and maintaining a display of mathematics materials.
There were statistically significant difference between Cohorts 1 and 2 in 2003 for the following items:
• Building professional knowledge about numeracy by talking at staff meetings and 2004. The mean for Cohort 1 was 2.44 compared with a mean for Cohort 2 of 1.95 (P = 0.006).
• Providing and promoting professional readings. The mean for Cohort 1 was 2.41 compared with a mean for Cohort 2 of 1.91 (P = 0.020).
• Maintaining a display of mathematics information and materials in the library or staff room. The mean for Cohort 1 was 2.141 compared with a mean for Cohort 2 of 1.58 (P = 0.008).
As can be seen, in all these cases, Cohort 1 teachers reported, on average that they undertook these activities more often than Cohort 2 teachers.
In 2004 there was a statistically significant difference between Cohort 1 and Cohort 2 teachers on the following items:
• Helping teachers get a whole school view of what the children know about key aspects of mathematics. The mean for Cohort 1 was 2.06 compared with a mean for Cohort 2 of 2.35 (P = 0.015).
• Helping teachers develop a shared understanding of the Mathematics Outcome Statements. The mean for Cohort 1 was 2.48 compared with a mean for Cohort 2 of 2.80 (P = 0.005).
• Helping teachers come to a shared understanding of progress through the student outcome levels. The mean for Cohort 1 was 2.41 compared with a mean for Cohort 2 of 2.67 (P = 0.031).
For these three items, the mean for Cohort 2 was higher than for Cohort 1, indicating that on average, Cohort 2 teachers engaged in these activities more frequently than Cohort 1 teachers.
Most activities were seen by teachers to be useful. There was a similar pattern of responses between classroom teachers and numeracy Specialist Teachers, with classroom teachers, however, typically seeing these whole school activities as less useful than the Specialist Teachers.
The proportion of classroom teachers who found various activities to be not at all useful for improving numeracy in the whole school was typically quite low – around 5 per cent.
52 ACER Evaluation of the GiR-LNS in WA Schools

However, around 20 per cent found maintaining a display of mathematics information to be not at all useful.
In summary, a wide range of activities was undertaken frequently over the duration of GiR by Specialist Teachers to improve numeracy learning across the whole school and most of these were seen to be useful.
53 ACER Evaluation of the GiR-LNS in WA Schools


6. IMPACT OF THE GIR-LNS ON THE PROFESSIONAL KNOWLEDGE OF SPECIALIST TEACHERS AND THEIR COLLEAGUES
This chapter examines the impact of the GiR-LNS on the understandings, confidence and teaching skills of Specialist Teachers and their colleagues. It includes results based on not only on surveys of Specialist Teachers and classroom teachers, but principals as well. Within these survey instruments, several different methods were used to gather evidence of impact. The results in this chapter should be seen as complementary to the evidence reported in the case studies (see Volume 2).
Information was sought about the impact of the GiR-LNS on teachers’:
• knowledge and understanding
• classroom practices
• approaches to student assessment
• use of Student Outcome Statements
• perception of staff collaboration and collegiality
• efficacy
Teachers were asked the following questions to assess the relative importance of the GiR-LNS in causing improvements to their practice, compared with other sources of influence over teachers’ practice:
• Please think back over the past year or two about improvements you have made in the way you teach literacy (mathematics).
• Please describe briefly two examples of improvements you have made in teaching literacy (mathematics).
• From where did this idea for improvement come?
Table 27 summarises the results. It shows that 238 out of 267 literacy teachers specified examples of improvement they had made. For the first example, 72.7 percent indicated that the source of the idea was the GiR-LNS. For the second example, the GiR-LNS was cited by 74.7 percent of teachers. Similar proportions were obtained from numeracy teachers. Given there was no prompting to mention the GiR-LNS, these results represent a strong endorsement of the influence of the strategy.
55 ACER Evaluation of the GiR-LNS in WA Schools

Table 27 Sources of ideas for improvements in teaching over past year or two (percentages)
Literacy teachers (n=238/267)
Numeracy teachers (n=217/27)
Examples of improvements GiR Other GiR Other
Example 1 72.7 27.3 82.1 17.9
Example 2 74.7 25.3 79.7 20.3
It is interesting to note that in previous surveys where the evaluators had asked this question to assess the impact of professional development programs, the proportion of teachers who specify any kind of professional development program has been about 20%. However, although the context of this survey will have influenced the salience of the GiR-LNS in respondents’ minds, the figures are still remarkably high compared with other studies in which this item has been used.
Impact on knowledge and understanding
Literacy Specialist Teachers
Literacy Specialist Teachers were asked about the extent to which the GiR-LNS training for Specialist Teachers had deepened their knowledge in a range of professional areas, as listed in Table 28.
For many of the items a to h in Table 28, the mean for literacy Specialist Teachers in 2003 was generally over 3 – on a scale ranging from 1 to 4 – indicating that the Specialist Teachers saw their GiR-LNS training as having had a strong positive impact. Table 28 shows that their estimation of the level of impact was maintained in 2004.
Increases in the level of reported impact of the training from 2003 to 2004 for each cohort were investigated. After the high scores of 2003, however, there was little room left on the scale to measure improvement for most of the items, and consequently, none of the differences between the means of each cohort are statistically significant across the years 2003 and 2004. This survey was first administered late in 2003 when Specialist Teachers had already participated in at least one year in the GiR-LNS training program (the learning curve is likely to be steeper and the benefits are likely to be greater in the early stages of reforms such as the GiR-LNS). Nevertheless, there is a common pattern for teachers to report higher levels of impact in 2004 than 2003, suggesting that there they were continuing to gain from the GiR-LNS training.
56 ACER Evaluation of the GiR-LNS in WA Schools

Table 28 Mean score of literacy Specialist Teachers’ judgments about the impact of GiR-LNS training on their professional knowledge
Cohort 1 Cohort 2
To what extent has the GiR-LNS training for Specialist Teachers . . .
Mean 2003
(n=30)
Mean 2004
(n=29)
Mean 2003
(n=33)
Mean 2004 (n=33)
a. deepened your understanding of literacy content and concepts that are taught 3.63 3.59 3.61 3.70
b. increased your knowledge about how students learn literacy 3.33 3.45 3.21 3.42
c. increased your knowledge of learning activities that move students ahead 3.39 3.55 3.36 3.58
d. clarified your understanding of the English Curriculum Framework 3.00 3.38 3.18 3.30
e. increased your knowledge of how to select and apply assessment strategies and instruments
2.97
3.38
3.09
3.30
f. increased your knowledge of how to develop
appropriate assessment strategies and instruments 2.86 3.21 2.94 3.18
g. increased your knowledge about using diagnostic tasks to find out what students know 2.87 2.97 2.85 3.06
h. deepened your understanding of how to use student performance data to inform planning 3.38 3.31 3.18 3.42
i. increased your knowledge of how to plan teaching and learning activities for i) Aboriginal students 2.80 2.76 2.82 2.94 ii) ESL students 2.57 2.69 2.61 2.55 iii) girls 2.37 2.31 2.42 2.55 iv) boys 2.60 2.52 2.52 2.79 v) students with learning difficulties 2.77 2.90 2.97 3.09
(1=not at all, 2=minor extent. 3=moderate extent, 4=major extent)
Compared with most of the items in Table 28, the reported level of impact on the sub-items of item i – outcomes for particular groups of students – were lower in 2003 and there was little evidence of change in 2004.
Overall, Table 28 indicates that literacy Specialist Teachers reported positively on the impact of their training. There were lower levels of impact of this training on literacy Specialist Teachers’ understanding of how to plan teaching and learning activities for specific groups of students.
Numeracy Specialist Teachers
Numeracy Specialist Teachers were also asked to assess the impact of GiR-LNS on their understanding, confidence and teaching skills. They were asked the same questions about the effect of the training as those asked of the literacy Specialist Teachers. The wording for the items can be seen in Table 29.
57 ACER Evaluation of the GiR-LNS in WA Schools

Table 29 shows that for all of items a to g, the mean score of numeracy Specialist Teachers’ judgments on the impact of the GiR-LNS training for Specialist Teachers in 2003 and 2004 was well over 3.1 This indicates that the numeracy Specialist Teacher felt that there had been a strong positive impact of their training on their understandings and knowledge of numeracy and the teaching and learning of numeracy.
The numeracy Specialist Teachers indicated that for the sub-items of item h – outcomes for particular groups of students – their work had been influenced, on average, to a moderate extent at most in 2003 and 2004. This was slightly lower than responses to most of the items seen in Table 29, as was the case with the literacy Specialist Teachers’ responses to these items.
Numeracy Specialist Teachers, thus, reported very positively about the impact of GiR-LNS training on their knowledge and understanding related to the teaching and learning of mathematics. This impact was lower for their understanding on how to plan teaching and learning activities for specific groups of students.
Taking into account the number of comparisons made between the years, within each Cohort, the level of statistical significance was set at 0.004.2 With this criterion, none of the mean differences between the years were statistically significant. Given the high scores observed in 2003, this finding is not surprising for items a to g. The ratings were already very high and, as mentioned above, Specialist Teachers were surveyed after the completion of the first year of training. It does suggest, however, that there was little change across time for either cohorts for the other items about increased knowledge of how to plan teaching and learning activities to address mathematics outcomes for particular groups of students (h_i to h_v).
Table 29 Mean score of numeracy Specialist Teachers’ judgments about the impact of GiR-LNS
training on their professional knowledge
Cohort 1 Cohort 2
To what extent has the GiR training for Specialist Teachers . . .
Mean 2003
(n=24)
Mean 2004
(n=28)
Mean 2003
(n=44)
Mean 2004
(n=44) a. deepened your understanding of the mathematics
content and concepts that you teach? 3.83 3.72 3.83 3.94
b. increased your knowledge of how students learn mathematics? 3.78 3.78 3.83 3.86
c. increased your knowledge of learning activities that move children ahead in their mathematical learning? 3.67 3.78 3.74 3.80
d. increased your understanding of the Mathematics Curriculum Framework? 3.11 3.50 3.34 3.57
e. increased your knowledge of how to select and apply appropriate assessment strategies and instruments? 3.78 3.72 3.57 3.80
f. increased your knowledge of how to develop appropriate assessment strategies and instruments to 3.56 3.72 3.46 3.66
1 Substantively, a score of 3 means that that the aspect of the GiR-LNS training for Specialist Teacher s described by an item was reported as having, on average, an effect to a moderate extent. 2 This probability level was set to avoid the problem of increased probabilities of making a Type 1 error – that is, erroneously identifying a difference when this difference is not real, having arisen by chance. As 12 comparisons were made the level was set by dividing 0.05 by 12.
58 ACER Evaluation of the GiR-LNS in WA Schools

Cohort 1 Cohort 2
To what extent has the GiR training for Specialist Teachers . . .
Mean 2003
(n=24)
Mean 2004
(n=28)
Mean 2003
(n=44)
Mean 2004
(n=44) use with your students?
g. increased your knowledge about how to use diagnostic tasks to find out what students know about particular areas of mathematics? 3.78 3.78 3.83 3.86
h. increased knowledge of how to plan teaching and learning activities to address mathematics outcomes for:
i) Aboriginal students 2.56 2.83 2.91 3.09
ii) ESL students 1.94 2.29 2.35 2.55
iii) girls 2.11 2.61 2.79 2.94
iv) boys 2.11 2.67 2.79 2.97
v) students with learning difficulties 3.06 3.17 3.00 3.23
(1=not at all, 2=minor extent. 3=moderate extent, 4=major extent)
Literacy classroom teachers
Literacy and Numeracy Specialist Teachers applied their training in their schools through working ‘shoulder to shoulder’ with several colleagues – planning, teaching and assessing student progress together. This section focuses on literacy teachers and the impact of the GiR-LNS. Literacy classroom teachers were asked to indicate the extent of the impact of their work with the Specialist Teacher on their knowledge and understanding. The same bank of items3 was used as for the Specialist Teachers, except for item h – the use of student performance data to inform planning for improvement at the individual student, classroom and whole school levels).
Table 30 shows literacy classroom teachers’ responses to these items. A comparison with Table 28 shows that the impact as reported by the classroom teachers is somewhat lower than that reported by the Specialist Teachers. These lower scores in 2003 meant that there was sufficient space along the scales to detect changes by 2004.
The differences in the average scores between 2003 and 2004 for Cohort 1 and Cohort 2 literacy classroom teachers were not statistically significant. (The criterion for statistically significant was set at 0.004.) Typically, in both cohorts and in both years literacy classroom teachers report that the impact of the GiR-LNS Specialist Teacher on their knowledge has been to a moderate extent. Nevertheless, there is a consistent tendency for teachers to report higher levels of impact in 2004 than 2003, suggesting that they were continuing to benefit from the GiR-LNS. For some items – especially those to do with knowledge of how to plan teaching and learning activities for particular groups of students this effect was seen by classroom teachers as minor.
3 These items are those listed in Table 28.
59 ACER Evaluation of the GiR-LNS in WA Schools

Table 30 Mean score of literacy classroom teachers’ judgments about the impact of GiR-LNS Specialist Teachers on their knowledge
Cohort 1 Cohort 2
To what extent has your work with the GiR Specialist Teacher . . .
Mean 2003
Mean 2004
(n=31)
Mean 2003
(n=32) (n=43)
Mean 2004
(n=45) a. deepened your understanding of literacy content
and concepts that they teach 3.06 3.26 2.65 2.80 b. increased your knowledge about how students
learn literacy 2.94 3.13 2.40 2.56 c. increased your knowledge of learning activities
that move students ahead 3.13 3.32 2.67 2.73 d. clarified your understanding of the English
Curriculum Framework 2.69 2.94 2.26 2.49
e. increased your knowledge of how to select and apply assessment strategies and instruments 2.72 2.90 2.26 2.49
f. increased your knowledge of how to develop appropriate assessment strategies and instruments 2.56 2.87 2.21 2.47
g. increased your knowledge about using diagnostic tasks to find out what students know 2.56 2.81 2.21 2.42
h. increased your knowledge of how to plan teaching and learning activities for i) Aboriginal students 2.13 1.36 2.20 1.64 ii) ESL students 1.93 1.29 2.07 1.44 iii) girls 1.97 1.57 2.20 1.81 iv) boys 2.09 1.62 2.37 1.93 v) students with learning difficulties
2.44 2.14 2.81 2.33
(1=not at all, 2=minor extent. 3=moderate extent, 4=major extent)
Numeracy teachers
As part of the assessment of the impact of GiR-LNS on the understandings, confidence and teaching skills of Specialist Teachers and their colleagues, numeracy classroom teachers were asked to indicate the extent of the impact of their work with the Specialist Teacher on their understandings and knowledge (they were asked to respond to the same set of items as the literacy classroom teachers above).
Table 31 shows the mean responses for each of the numeracy teacher cohorts for 2003 and for 2004 for each item.4 Substantively, on average, these teachers in 2003 and 2004 indicated that their work with the GiR-LNS Specialist Teacher had effects on their understandings and knowledge to a moderate extent, except for knowledge of how to plan teaching and learning
4 These summary statistics are taken from unmerged data files, that is from a file containing data from 2003 and another file containing data from 2004. As it was not possible to merge the files such that the same respondent from 2003 and 2004 was linked in the merged file, any differences between the years could be attributable to differences in the membership of the groups compared, rather than in differences arising from changes in individual classroom teachers.
60 ACER Evaluation of the GiR-LNS in WA Schools

activities for particular groups of students. Here the extent of the effect of the Specialist Teacher was broadly seen to be minor.
It was not possible to examine patterns of change between 2003 and 2004 because of the small number of cases on the merged data file for numeracy classroom teachers.
Table 31 Mean score of numeracy classroom teachers’ judgments about the impact of GiR-LNS
Specialist Teachers on their professional knowledge
Cohort 1 Cohort 2
To what extent has your work with the GiR Specialist Teacher . . .
Mean 2003
(n=46)
Mean 2004
(n=119)
Mean 2003
(n=39)
Mean 2004
(n=155) a. deepened your understanding of the mathematics
content and concepts that you teach 3.11 3.33 3.34 3.41
b. increased your knowledge about how students learn mathematics
3.13 3.25 3.24 3.34
c. increased your knowledge of learning activities that move students ahead in their mathematical learning
3.11 3.29 3.37 3.40
d. clarified your understanding of the Mathematics Curriculum Framework
2.89 3.00 2.82 3.11
e. increased your knowledge of how to select and apply assessment strategies and instruments
2.98 3.11 3.00 3.19
f. increased your knowledge of how to develop appropriate assessment strategies and instruments
2.87 3.02 2.92 3.15
g. increased your knowledge about to use diagnostic tasks
3.02 3.15 3.00 3.24
h. increased your knowledge of how to plan teaching and learning activities for: i) Aboriginal students 1.84 1.99 1.86 1.87 ii) ESL students 1.70 1.74 1.35 1.75 iii) girls 1.96 2.09 1.94 2.08 iv) boys 1.98 2.16 1.97 2.11 v) students with learning difficulties
2.36 2.39 2.19 2.68
(1=not at all, 2=minor extent. 3=moderate extent, 4=major extent)
Impact of GIR-LNS on classroom practices
Literacy teachers
Literacy classroom teachers were asked in 2003 and again in 2004 how often – not at all, once a month or less, most weeks, most lessons – they provided their students with opportunities to engage in various teaching and learning practices, as set out in Table 32. This question was designed to measure change that might be attributed to the GiR-LNS.
61 ACER Evaluation of the GiR-LNS in WA Schools

Table 32 Mean score of literacy classroom teachers’ judgments on the impact of GiR on teaching practice
Cohort 1 Cohort 2
How often do your students have opportunities to . . .
Mean 2003
n=
Mean 2004
n=
Mean 2003
n=
Mean 2004
n=
a. Talk about processes and strategies they use when reading, writing, speaking and listening and viewing 3.10 3.20 3.18 3.39
b. Read a variety of texts for different purposes across learning areas 3.40 3.43 3.36 3.43
c. Write for a range of purposes across learning areas 3.35 3.33 3.21 3.34
d. Use language to plan and complete tasks cooperatively in partner or small group activities 3.32 3.27 3.31 3.43
e. Select their own texts for different purposes 2.61 2.80 2.71 2.81 f. Work with their peers in small groups to
formulate questions about a text 2.42 2.39 2.43 2.35 g. Make connections between the text and their
own experiences 3.26 3.39 3.48 3.55 h. Discuss how language use changes in
different situations 2.74 2.89 2.69 3.09 i. Discuss different representations of
characters in books, and non-print texts such as videos 2.42 2.95 2.86 2.70
j. Use informational texts to solve a problem, answer a question 2.77 2.93 2.82 2.77
k. Discuss conventions of language used in different situations 2.74 2.91 3.04 3.12
l. Work in groups of different sizes e.g. partner, small group, whole class 3.42 3.57 3.68 3.60
m. Engage in problem solving activities about aspects of language 2.68 2.84 2.93 2.91
n. Engage in thoughtful conversations about different classroom topics 3.19 3.32 3.32 3.25
o. Code switch between dialects 1.67 1.26 1.79 1.66 p. Demonstrate what they know or have learnt
in a range of different ways 3.06 3.30 3.41 3.16 q. Discuss dialectal language differences seen
through different genres 1.57 1.69 1.88 1.60
These data show, on average, that teachers provided opportunities for students to engage in most of these activities most weeks, except for item o – Code switch between dialects – and item q – discuss dialectical language differences seen through different genres. These were discussed, on average once a month or less. There were no statistically significant differences within each cohort of teachers between 2003 and 2004. (The criterion for statistical significance was set at 0.003).
62 ACER Evaluation of the GiR-LNS in WA Schools

Figure 11 Percentage of literacy classroom teachers reporting they provided students with each
of 17 activities (Q21a-q) either most weeks or most lessons in 2003 and 2004
Three activities were less commonly reported:
• Work with their peers in small groups to formulate questions about a text (Item f)
• Code switch between dialects (Item o)
• Discuss dialectal language differences seen through different genres (Item q)
Overall, literacy classroom teachers appear to have frequently provided their students with a wide range of activities designed to improve student learning outcomes in both 2003 and 2004.
Impact on practice: Numeracy classroom teachers
Numeracy classroom teachers were also asked how often – not at all, once a month or less, most weeks, most lessons – they had provided their students with opportunities to undertake a range of activities (as shown in Table 31). It can be seen that most activities were, on average, undertaken most weeks. Complete pages from pre-prepared commercial worksheets occurred, on average once a month or less. It was not possible to investigate changes over time with the data from numeracy teachers.
63 ACER Evaluation of the GiR-LNS in WA Schools

Table 31 Mean score of numeracy classroom teachers’ judgments on the impact of GiR-LNS on teaching practices
Cohort 1 Cohort 2
How often do you provide opportunities for students to . . .
Mean 2003 n=44
Mean 2004 n=36
Mean 2003
n=118
Mean 2004
n=145 a. Talk about the thinking behind their ideas 3.45 3.56 3.61 3.61 b. Represent a problem in different ways 3.45 3.47 3.53 3.51 c. Choose their own method for doing a
calculation 3.34 3.29 3.39 3.47
d. Visualise number stories and partitions 3.50 3.43 3.30 3.40 e. Use a calculator 2.70 2.54 2.62 2.63 f. Investigate, generalise and reason about
patterns in number 3.16 3.25 3.23 3.14
g. Complete pages from pre-prepared commercial worksheets
2.07 2.20 2.17 2.13
h. Choose materials to answer mathematical questions or problems
3.11 3.17 3.21 3.29
i. Act out or role play to solve mathematical problems
2.68 2.69 2.62 2.60
j. Learn mathematics through activities in other curriculum areas
3.30 3.28 3.08 3.04
k. Talk or write about the mathematics they have learned
3.00 3.14 3.08 3.04
l. Solve problems where the numbers are beyond their current scope
2.59 2.77 2.66 2.62
m. Learn and practice basic number facts 3.14 3.58 3.43 3.38 n. Work with others to solve problems 3.36 3.28 3.34 3.34 o. Use mathematics for real purposes 3.34 3.44 3.42 3.30 p. Pose their own mathematical questions with
your assistance 2.64 2.97 2.63 2.68
q. Take reasonable risks in their learning of mathematics
3.36 3.34 3.36 3.32
Figure 12 shows the percentage of classroom teachers who reported that they provided students with each of the 17 activities – described above in items a to q – either most weeks or most lessons in 2003 and 2004. It can be seen that in both years item g – Complete pages from pre-prepared commercial worksheet – was the least frequently undertaken activity.
64 ACER Evaluation of the GiR-LNS in WA Schools

0
10
20
30
40
50
60
70
80
90
100
a b c d e f g h i j k l m n o p q
20032004
Figure 12 Percentage of numeracy classroom teachers reporting they provided students with
each of 17 activities (Q21a-q) either most weeks or most lessons in 2003 and 2004
Overall, numeracy classroom teachers appear to have frequently provided their students with a wide range of activities designed to improve student learning in both 2003 and 2004. However, there is little indication from this item of a shift in practice from 2003 to 2004 that might be attributable to the GiR-LNS.
The impact of the GiR-LNS on student assessment strategies and instruments
This section of the report examines the impact of GiR-LNS on the capacity of teachers to select, apply and develop diagnostic, formative and summative student assessment strategies and instruments. The case studies conducted in GiR-LNS schools provided opportunities to gather evidence first hand about impact of the strategy on the methods that teachers used to assess student learning.
For the survey, special scenarios were created to probe teachers’ knowledge related to the diagnosis of student understanding and the assessment of student progress, using, for example, key understandings and profiles of student development. The scenarios aimed to be as authentic as possible – that is a close approximation to situations the teachers would face in their normal day-to-day work.
Literacy classroom teachers
Teachers were asked to respond to a scenario about how they would assist students needing support in developing literacy skills and knowledge. The responses to the scenarios provided a measure of the impact of the GiR-LNS on planning and assessment strategies used by literacy classroom teachers.
The scenario asked teachers to respond to a set of six linked questions in relation to a student, or group of students, in their class whom they identified as being at risk of not making adequate progress in literacy. They were asked to write about how they identified their
65 ACER Evaluation of the GiR-LNS in WA Schools
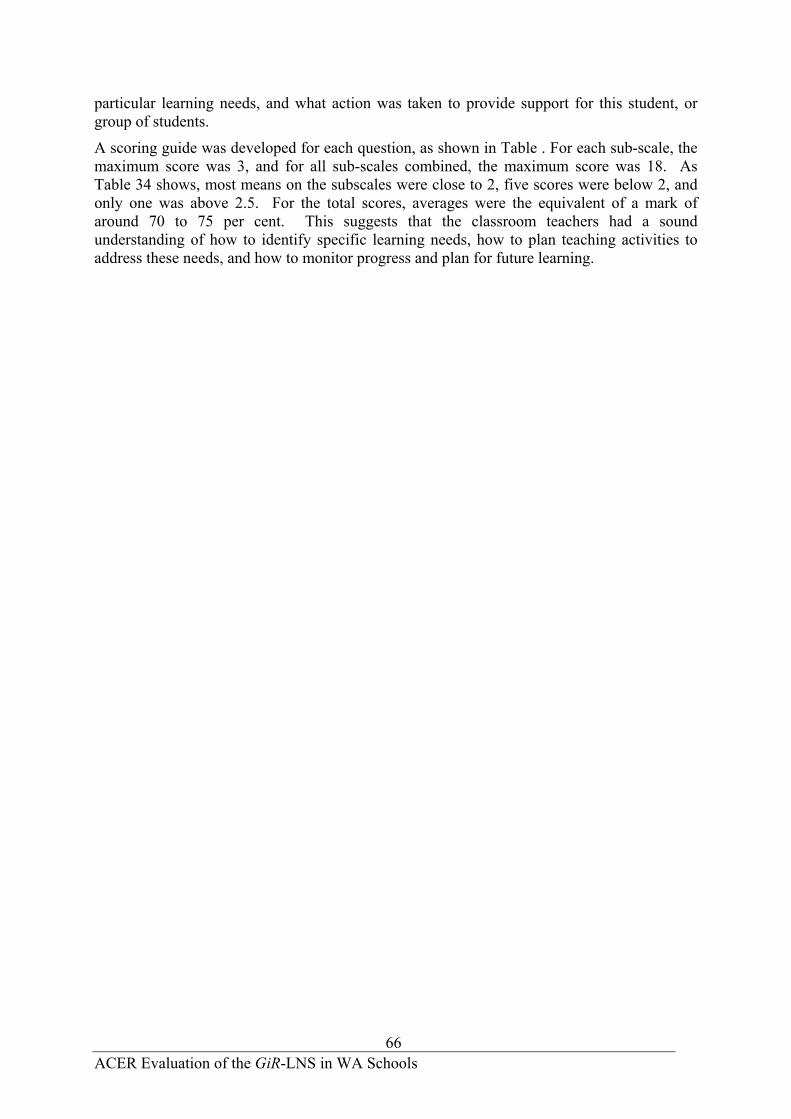
particular learning needs, and what action was taken to provide support for this student, or group of students.
A scoring guide was developed for each question, as shown in Table . For each sub-scale, the maximum score was 3, and for all sub-scales combined, the maximum score was 18. As Table 34 shows, most means on the subscales were close to 2, five scores were below 2, and only one was above 2.5. For the total scores, averages were the equivalent of a mark of around 70 to 75 per cent. This suggests that the classroom teachers had a sound understanding of how to identify specific learning needs, how to plan teaching activities to address these needs, and how to monitor progress and plan for future learning.
66 ACER Evaluation of the GiR-LNS in WA Schools

Table 34 Task: Working with Students at Risk Write about a student, or group of students, in your class this year who you identified as being at risk of not
making adequate progress in literacy.
To what extent does the teacher’s response demonstrate: Criterion 1: effective and appropriate ways of identifying students at risk HIGH identification of students
needing support, and very detailed reference to how specific difficulties were identified
MEDIUM identification of students needing support, and adequate reference to how specific difficulties were identified
LOW identification of students needing support, and limited reference to how specific difficulties were identified
Criterion 4: appropriate selection of activities to meet students’ learning needs HIGH highly appropriate
and perceptive selection of learning activities to address meet students needs
MEDIUM selection of learning activities appropriately to address students needs
LOW limited selection of learning activities to address students needs
Criterion 2: effective selection of a range of monitoring and assessment tools to identify students’ specific learning needs HIGH highly focused selection
of a range of monitoring and assessment tools for relevant and appropriate diagnosis of students’ specific learning needs
MEDIUM appropriate selection of monitoring and assessment tools for diagnosis of students’ specific learning needs
LOW limited selection of monitoring and assessment tools for diagnosing students’ specific learning needs
Criterion 5: effectiveness of classroom observation and monitoring HIGH evidence of explicit
and precise monitoring of students’ learning and appropriate evaluation of learning activities to meet needs
MEDIUM evidence of monitoring of students’ learning and evaluation of learning activities to meet needs.
LOW limited evidence of monitoring of students’ learning and limited evaluation of learning activities to meet needs.
Criterion 3: effectiveness of use of assessment information to interpret students’ specific learning needs HIGH very clear and precise
interpretation of students’ specific learning needs
MEDIUM clear interpretation of students’ specific learning
Criterion 6: effectiveness of planning for students’ future learning HIGH very clear and precise
planning for improvements in students’ future learning
MEDIUM effective planning for
67 ACER Evaluation of the GiR-LNS in WA Schools

needs. LOW generalized or limited
interpretation of students’ specific learning needs
improvements in students’ future learning.
LOW limited planning for students’ future learning.
Table 35 Mean score on literacy subscales and total score for Cohorts 1 and 2 in 2003 and 2004
Cohort N Mean Std. Deviation
2003 Identifying 1 31 2.45 .675 2 40 2.35 .662 2004 Identifying 1 30 2.33 .606 2 42 2.21 .606 2003 Assessment tools 1 31 2.13 .562 2 40 2.15 .736 2004 Assessment tools 1 29 2.21 .726 2 41 2.20 .601 2003 Interpreting needs 1 31 2.06 .727 2 38 2.32 .739 2004 Interpreting needs 1 30 1.83 .699 2 42 2.19 .740 2003 Selecting activities 1 30 2.33 .711 2 39 2.36 .668 2004 Selecting activities 1 28 2.39 .629 2 42 2.57 .590 2003 Observing 1 29 2.03 .626 2 39 2.15 .709 2004 Observing 1 28 2.18 .670 2 42 2.21 .750 2003Planning 1 29 1.72 .751 2 37 1.89 .906 2004Planning 1 28 1.79 .738 2 42 1.86 .783 2003 Total score 1 29 12.83 2.941 2 37 13.35 3.442 2004 Total score 1 28 12.89 2.485 2 41 13.27 2.775
An analysis of the mean scores for Cohort 1 for each of the sub scores and the total score showed there were no statistically significant changes from 2003 to 2004. Similar results were found for the differences between the means for Cohort 2 in 2003 and 2004. From this,
68 ACER Evaluation of the GiR-LNS in WA Schools

it may be inferred that there was no evidence of an increase in the scores on the scenarios across the intervening time period. It might be expected that had the GiR-LNS had an impact on the capacity of teachers to select, apply and develop diagnostic, formative and summative student assessment strategies and instruments, then there would have been, on average, higher scores in 2004 compared with 2003 for each of the cohorts. Thus, this evidence suggests that the impact of the GiR-LNS on this aspect of teachers’ work had already been established by the time of the first survey.
Responses to the question about planning for future learning received the lowest mean scores within the scenario, suggesting that this may be an area of these teachers’ practice that could be further strengthened.
In summary, the evidence suggests that literacy classroom teachers were well able to select, apply and develop diagnostic, formative and summative student assessment strategies and instruments. However, there was little evidence of growth in this capacity during the period of the GiR-LNS.
Numeracy classroom teachers
A set of four scenarios was developed and administered to measure the impact of the GiR-LNS on the assessment strategies used by numeracy classroom teachers. The scenarios were designed to assess teachers’ professional knowledge as it related to planning, teaching and assessment in literacy and mathematics. They were attempting to measure what some researchers call “pedagogical content knowledge” (Shulman, 1987) or “content knowledge for teaching” (Hill, Rowan and Ball, 2005). The scenarios developed for this study asked teachers questions concerning the use of the First Steps in Mathematics Diagnostic Map, number sub-strands, Key understandings, Diagnostic Tasks, identifying ‘at risk’ students, and how to respond to their learning needs.
Scenario 1- Work Sample
The scenario consisted of the following:
There were 13 children in the class and they only had 9 balls. The teacher asked Tammy to work out how many more balls they needed so that everyone could have one. Tammy put out 13 blocks and said “these are the children”. She then got out 9 counters and put 1 counter near each block until she ran out of counters. She then looked at the blocks without a counter and said “4”. Their teacher said “4 what?” She said “4 kids need a ball”.
Respondents were then asked:
• Please identify the phase from the Diagnostic Map that you think this child is likely to be in.
• Please explain why you selected this phase.
• What can this work sample tell you about the number sub-strands and the levels that the child is working towards?
• Please explain why you selected these sub-strands and levels.
• What Key Understanding/s would you need to focus on and what aspect of the Key Understanding/s would you focus on?
69 ACER Evaluation of the GiR-LNS in WA Schools

• Which Diagnostic Tasks would you use to help clarify what mathematics the child knows and needs to know?
For each of these questions, a four-point scale was used, and scores allocated as follows:
1. Inaccurate diagnosis/limited explanation
2. Relevant diagnosis with some relevant explanation
3. Accurate diagnosis with appropriate explanation
4. Accurate diagnosis with precise explanation
These four categories were used to score all the scenarios.
There are two concerns with the data from Scenario 1 and that from each of the other scenarios.
First, there was a high level of missing data, especially the first time these scenarios were used. These are shown in Table 36. Between 50 and 60 per cent of respondents did not respond to the scenario items in 2003. This reduced somewhat in 2004 to between 30 and 50 per cent, possibly because teachers were more confident about their capacity to respond to the scenarios.
It is unknown to what extent the teachers who responded in 2004 were the same teachers who responded in 2003. It is known that 105 (38%) of the 2004 teachers had been working with a Specialist Teacher for eight or more terms, so it is possible that around one third of them had completed both surveys. Therefore the differences observed between 2003 and 2004 may not be attributable to GiR, but to differences between the sample of teachers in these years.
Table 36 Proportion of missing data for each item of Scenario 1, 2003 and 2004
2003 2004
a) Identify phase from diagnostic map 51.5 42.3
b) Explain why selected this phase 52.4 43.4
c) No. of sub-strand child working towards 54.6 44.8
d) Explain why selected these sub-strands 62.1 50.9
e) Key understandings need to be focused on 59.0 48.0
f) Diagnostic tasks needed 61.7 47.7
Figure 13 shows the distribution of numeracy classroom teachers across each of the categories for Mathematics Scenario 1, for 2003 and 2004.
Figure 13 shows that in 2003, around 10 per cent of teachers were able to make an accurate diagnosis and give a precise explanation for this diagnosis for all items except item a. Additionally, between 20 and 40 per cent gave an inaccurate diagnosis. There is a marked contrast between the distribution of scores for 2003 and those for 2004. The proportion of numeracy classroom teachers who made an accurate diagnosis and gave a precise explanation for this diagnosis, for example, increases to around 50 per cent from 10 per cent. This can be seen in Figure 13. The differences are quite marked. Unfortunately, as previously noted, these differences have to be treated circumspectly.
70 ACER Evaluation of the GiR-LNS in WA Schools

0%
20%
40%
60%
80%
100%
Identi
fy ph
ase f
rom di
agno
stic m
ap 20
03
Identi
fy ph
ase f
rom di
agno
stic m
ap 20
04
Explai
n why
selec
ted th
is ph
ase
2003
Explai
n why
selec
ted th
is ph
ase
2004
No. of
sub-s
trand
child
work
ing to
wards 2
003
No. of
sub-s
trand
child
work
ing to
wards 2
004
Explai
n why
selec
ted th
ese s
ub-st
rands
2003
Explai
n why
selec
ted th
ese s
ub-st
rands
2004
Key un
derst
andin
gs ne
ed to
be fo
cuse
d on 2
003
Key un
derst
andin
gs ne
ed to
be fo
cuse
d on 2
004
Diagno
stic t
asks
need
ed 20
03
Diagno
stic t
asks
need
ed 20
04
Accurate diagnosis withprecise explanation
Accurate diagnosis withappropriate explanation
Relevant diagnosis withsome relevant explanation
Inaccurate diagnosis withlimited explanation
Figure 13 Distribution of the score categories for Mathematics Scenario 1, comparing 2003 and
2004
Scenario 2 – Outline a Learning Activity
This scenario presented the following classroom activity:
Children find ways of organising a collection of say, ring pulls, in order to make it easier for someone else to count.
Respondents were asked:
• Describe the mathematics that you might be focusing on if you chose this activity for your class.
• Why would you choose this activity for your class?
• Formulate several key focus questions you would use during this activity to focus the children’s thinking on the mathematics.
Again, there are a number of concerns with the data from Scenario 2. First, there was a high level of missing data. These are shown in Table 37. Around 50 per cent of respondents did not respond to the scenario items in 2003. This reduced somewhat in 2004 to around 30 per cent. Secondly, it is unknown to what extent the teachers who responded in 2004 were the same teachers who responded in 2003. Nevertheless, the higher proportion of teachers in 2004 who were willing to complete this part of the questionnaire might be considered an indication of increased knowledge and, therefore, confidence about the selection of learning activities appropriate to the students’ level of understanding.
71 ACER Evaluation of the GiR-LNS in WA Schools

Table 37 Proportion of missing data for each item of Scenario 2, 2003 and 2004
2003 2004
a) Describe the mathematics that you might be focusing on if you chose this activity for your class.
46.3 26.9
b) Why would you choose this activity for your class? 47.6 28.7
c) Formulate several key focus questions you would use during this activity to focus the children’s thinking on the mathematics
48.0 31.9
Figure 14 shows the distribution of numeracy classroom teachers across each of the categories for Mathematics Scenario 2 for 2003 and for 2004. It will be observed that for each item, the proportion who showed some capacity for accurate planning with some inconsistency increased significantly in 2004, with a corresponding decrease in the proportion who were showing only some or limited capacity. As previously noted, however, these differences have to be treated circumspectly.
0%
20%
40%
60%
80%
100%
Mathem
atics
focu
s 200
3
Mathem
atics
focu
s 200
4
Ration
ale fo
r acti
vity 2
003
Ration
ale fo
r acti
vity 2
004
Focus
ques
tions
2003
Focus
ques
tions
2004
Accurate planning
Accurate planning, someinconsistencySome capacity to plan
Limited capacity to plan
Figure 14 Distribution of the score categories for Mathematics Scenario 2, comparing 2003 and
2004
It can be seen from Figure 14 that, even without being concerned with change over time, very few of the teachers in 2004 demonstrated a limited capacity to plan, perhaps reflecting the fact that most already had a year’s experience of working with a Specialist Teacher.
In summary, the evidence suggests that numeracy classroom teachers were generally able to identify the potentially important mathematical ideas involved in the classroom activity, judge good activities, and were able to formulate key questions indicating that they were capable of accurate and mostly consistent planning in their work with students.
Scenario 3 – Key Understanding
72 ACER Evaluation of the GiR-LNS in WA Schools

This scenario was presented as follows:
This scenario provides you with a Key Understanding from within the booklet Understand Number and asks you about activities and focus questions for students.
Understand Number Key Understanding 4: Predict and name the decades by following the 1 – 9 sequence.
Respondents were then asked:
• Describe a series of three activities you might choose to help students learn this mathematics.
Write some focus questions appropriate to these activities
There are a number of concerns with the data from Scenario 3. First, there was a high level of missing data. These are shown in Table 38. Over 50 per cent of respondents did not respond to the scenario items in 2003. This reduced somewhat in 2004. Secondly, it is unknown to what extent the teachers who responded in 2004 were the same teachers who responded in 2003.
Table 38 Proportion of missing data for each item of Scenario 3, 2003 and 2004
2003 2004
a) Describe a series of three activities you might choose to help students learn this mathematics.
53.7 36.6
b) Write some focus questions appropriate to these activities 57.3 41.9
Figure 15 shows the distribution of numeracy classroom teachers across each of the categories for Mathematics Scenario 3 in 2003 and in 2004. For both items in 2003, most numeracy classroom teachers gave clear or clear and specific descriptions. In 2004 over 60 per cent of teachers gave clear and specific descriptions. This is a significant shift from the pattern seen in 2003. As previously noted, however, these differences have to be treated circumspectly.
73 ACER Evaluation of the GiR-LNS in WA Schools

0%
20%
40%
60%
80%
100%
Activities2003
Activities2004
Focusquestions
2003
Focusquestions
2004
Clear & specific descriptionsClear descriptionsGeneralised descriptionsLimited descriptions
Figure 15 Distribution of the score categories for Mathematics Scenario 3, comparing 2003 and
2004
It is also worth noting how in 2004 less than 20 per cent of the teachers gave generalised or limited descriptions of activities and focus questions compared with nearly 40 per cent in 2003.
In summary, the evidence suggests that a significantly greater proportion of numeracy classroom teachers were generally able to describe with clarity and precision and relevant series of activities to help students learn mathematics. They were also able to develop focus questions appropriate to these activities.
Scenario 4 – ‘At risk’ student
For this scenario, teachers were asked to consider a student whom they have identified as ‘at risk’ in mathematics. They were then asked the following questions:
• What made you think that this child was, or is, at risk?
• Describe how you worked with this child to move him or her on.
• How has this work (described above) affected the child’s learning of mathematics?
• What are your suggestions for future action with this child?
Again, there are a number of concerns with the data from Scenario 4. There was a high level of missing data. These are shown in Table 39. Well over 40 per cent of respondents did not respond to the scenario items in 2003. This reduced somewhat in 2004. Secondly, it is unknown to what extent the teachers who responded in 2004 were the same teachers who responded in 2003.
74 ACER Evaluation of the GiR-LNS in WA Schools

Table 39 Proportion of missing data for each item of Scenario 3, 2003 and 2004
2003 2004
a) What made you think that this child was, or is, at risk? 44.9 20.4
b) Describe how you worked with this child … 44.9 21.1
c) How has this work affected the child’s learning of mathematics... 45.8 21.1
d) What are your suggestions for future action with this child? 47.1 22.2
Figure 16 shows the distribution of numeracy classroom teachers across each of the categories for Mathematics Scenario 4 in 2003 and in 2004. Around 10 per cent of teachers made only limited reference to learning mathematics in their responses in 2003. This figure dropped to well below 10 per cent in 2004. These differences can be seen in Figure 16. These differences have to be treated circumspectly.
0%10%20%30%40%50%60%70%80%90%
100%
Why
child
at ris
k 200
3
Why
child
at ris
k 200
4
How w
orked
with
child
2003
How w
orked
with
child
2004
Effect
of work
2003
Effect
of work
2004
Sugge
stion
s 200
3
Sugge
stion
s 200
4
Consistent reference tolearning mathsReference to learning maths
Some reference to learningmathsLimited reference to learningmaths
Figure 16 Distribution of the score categories for Mathematics Scenario 4, comparing 2003 and
2004
In both 2003 and 2004, most numeracy classroom teachers were able to describe and identify ‘at risk’ students by reference to their mathematics performance, describe their response and suggestions for future directions with these students using explicit reference to the learning of mathematics.
Summary
The results from the scenarios for both literacy and numeracy classroom teachers suggest that the capacity of these teachers to select, apply and develop diagnostic, formative and
75 ACER Evaluation of the GiR-LNS in WA Schools

summative student assessment strategies and instruments increased from 2003 to 2004. However, this conclusion needs to be treated with caution owing to the high proportion of missing cases, particularly for the 2003 data, and the lack of a linkage between the 2003 and 2004 data sets. If it was possible to have more confidence with these data, based on what was observed, it would be possible to conclude that the GiR-LNS has had a strong impact on the quality of literacy and numeracy teaching.
Principals’ views on the impact of the Getting it Right: Literacy and Numeracy Strategy
School principals were well positioned to provide information about the implementation and impact of the work of the GiR-LNS Specialist Teachers in their school.
School principals were interviewed on three occasions in twenty schools, and provided a very positive picture of the responses to Getting it Right. In one school, during the evaluation team’s first visit, the principal noted that teachers’ confidence was ‘going through the roof’, and he reported that the value of having a Specialist Teacher had been mentioned during performance management reviews. The Specialist Teacher’s skills and knowledge, the practicality of her advice and her ‘street credibility’ had affected the school. The Specialist Teacher’s role of providing in-class support was non-negotiable in the school. He noted that finding time for collaborative planning had been difficult, particularly because of the number of teachers working in tandem pairs.
Several months later, in a second interview the same principal described the consolidation of the strategies initiated in connection with Getting it Right in the previous year:
The English policy is giving direction to the whole school … GiR is focusing on writing as a starting point … the Literacy Net is being taken up … We’re not trying to cover too much … without GiR we wouldn’t have been able to implement the policy …. Our Specialist teacher works in class, providing ongoing, accessible support.
The two surveys of principals, conducted with a twelve-month interval, provided a range of detailed evidence about the impact of Getting it Right over time. The descriptive results of the evaluation questionnaires completed by principals in 2003 and 2004 show that the initiative was rated highly, and on some dimensions, rated more highly in the second survey.
To assess the impact of the GiR-LNS on the understandings, confidence and teaching skills of specialist teachers and their colleagues, principals were asked about the extent to which the GiR-LNS had led to the changes set out in Table 40. Table 40 is based on combined data for both literacy and numeracy teachers.
In both 2003 and 2004, a large majority of principals reported that the GiR-LNS had had positive impacts on teachers along each of the dimensions shown in Table 40. There were statistically significant differences between the mean scores on three of four of these dimensions across the years 2003 and 2004 – with the score in 2004 higher than in 2003. This indicates an increasing impact of the program over time. Statistically significant differences are marked in bold. Table 40 Mean score of principal’s judgment on the impact of the GiR-LNS on teachers, for
2003 and 2004 (statistically significantly differences in bold type)
Mean 2003 Mean 2004 Probability*
Teachers having a clearer understanding of 2.93 3.41 <0.001
76 ACER Evaluation of the GiR-LNS in WA Schools

the English or Mathematics student outcomes of the Curriculum Framework Teachers have benefited from working with the Getting it Right Specialist Teacher
3.67 3.78 0.08
Teachers are more confident about teaching literacy/numeracy
3.36 3.59 0.001
Teachers are better at diagnosing students’ learning needs
3.24 3.43 0.015
* Two-tailed paired sample T-test, 95% confidence level
The item Teachers have benefited from working with the Getting it Right Specialist Teacher showed no statistically significant difference between 2003 and 2004. This is probably due to the very high mean score in 2003 – there was little room left on the scale to show improvement in 2004.
Principals, thus, report positively on the impact of GiR-LNS on the understandings, confidence and teaching skills of Specialist Teachers and their colleagues. This impact appears to have been stronger in 2004 than 2003 suggesting that as GiR has become more embedded in the school, so its impact is deepening.
The third section of the questionnaire for principals included a series of questions designed to gather information about the principals’ impressions of the impact of the Getting it Right strategy in the school. These responses provided insights into the initial impact of the strategy, as they refer to the end of the first or second year of operation of the strategy in the schools, and to the impact after another year had passed. The 2004 responses provided information about the longer-term impact of Getting it Right.
The first question in this section of the survey focused on a variety of outcomes in the school that had resulted from the GiR-LNS. These results are shown in Table 41. The greatest impact reported was in relation to teachers and teaching practices. Over 90 per cent of respondents in both the 2003 and 2004 surveys reported that the Getting it Right strategy was, to a moderate or major extent, leading to more effective literacy/numeracy teaching practices, benefits to teachers; teachers being more confident about teaching literacy or numeracy, and teachers being better at diagnosing students’ learning needs.
It is interesting to note the increase in the extent to which principals reported that Getting it Right had influenced several outcomes between 2003 and 2004. These results are indicative of the longer-term impact of the initiative.
In 2004 87 per cent (to a moderate extent and to a major extent) of respondents reported that a coherent whole school literacy or numeracy plan had been implemented, compared with 73 per cent in the previous year.
Principals also reported an increase in the consistent use of the Literacy Net, from 68 per cent (to a moderate or major extent) in 2003 to 82 per cent (to a moderate or major extent) in 2004. The principals reported that teachers’ increased understanding of the English or Mathematics student outcomes of the Curriculum Framework also increased: 73 per cent in 2003, to 92 per cent in 2004 (to a moderate or major extent).
The effective use of student performance data to improve planning had also increased from 84 per cent in 2003 to 91per cent in 2004 (to a moderate or major extent). There was also an increase between 2003 and 2004 in the extent to which it was reported that more reflective use was being made of performance data to improve planning at the whole school level: 78 per cent in 2003, to 92 per cent in 2004, (to a moderate or major extent).
77 ACER Evaluation of the GiR-LNS in WA Schools

In 2004 72 per cent (to a moderate or major extent) of principals reported that school results in WALNA testing had improved across the school, compared to 53 per cent (to a moderate or major extent) in 2003. Overall, these results indicate the principals’ impressions that the GiR-LNS has led to a range of outcomes in their schools.
Table 41 Principals’ reports of outcomes of the GiR-LNS in 2003 and 2004 (percentages).
To what extent has the Getting it Right strategy led to the outcomes listed below?
Year Not at all
To a minor extent
To a moderate
extent
To a major extent
N
a) more effective literacy/numeracy teaching practices
2003 2004
0 0
6 7
39 33
55 60
144 139
b) The implementation of a coherent literacy/numeracy plan for the whole school
2003 2004
5 2
22 11
38 45
35 42
142 138
c) Consistent use of the Literacy/Numeracy Net across the school
2003 2004
14 8
19 11
33 35
35 47
141 139
d) improved learning outcomes for students at risk
2003 2004
0 0
12 8
40 37
48 55
143 139
e) improved learning outcomes for all students
2003 2004
2 1
15 14
49 40
35 45
142 139
f) more effective use of student performance data to plan teaching and learning activities
2003 2004
0 1
16 7
43 38
41 53
143 138
g) Improved school results in WALNA testing
2003 2004
16 7
31 21
36 40
17 32
124 128
h) more effective reporting to parents on students’ improvement in literacy/numeracy skills
2003 2004
11 5
38 31
39 45
12 19
141 139
i) Teachers have a clearer understanding of the English or Mathematics student outcomes of the Curriculum Framework
2003 2004
4 1
23 8
52 47
21 45**
143 139
j) the teachers have benefited from working with the Getting it Right Specialist Teacher
2003 2004
0 0
3 4
22 15
75 81
143 139
k) teachers are more confident about teaching literacy or numeracy
2003 2004
1 0
8 6
41 30
51 64**
142 139
l) teachers are better at diagnosing students’ learning needs
2003 2004
1 1
11 10
48 38
40 51**
142 139
m) more reflective use of performance data to improve planning at the whole school level
2003 2004
3 0
19 9
46 42
32 143 50 137
Principals were asked about the impact of the GiR-LNS on their own understanding of literacy and numeracy curriculum and pedagogy, and how to link performance data to students’ needs. The results are shown in Table 42. Almost none of the principals responded using the not at all option. Responses to the other three options (to a minor, moderate or major extent) were spread across the options. These results indicate that principals were reporting some level of impact on their knowledge and understanding, and that this had increased by the time of the second survey.
78 ACER Evaluation of the GiR-LNS in WA Schools
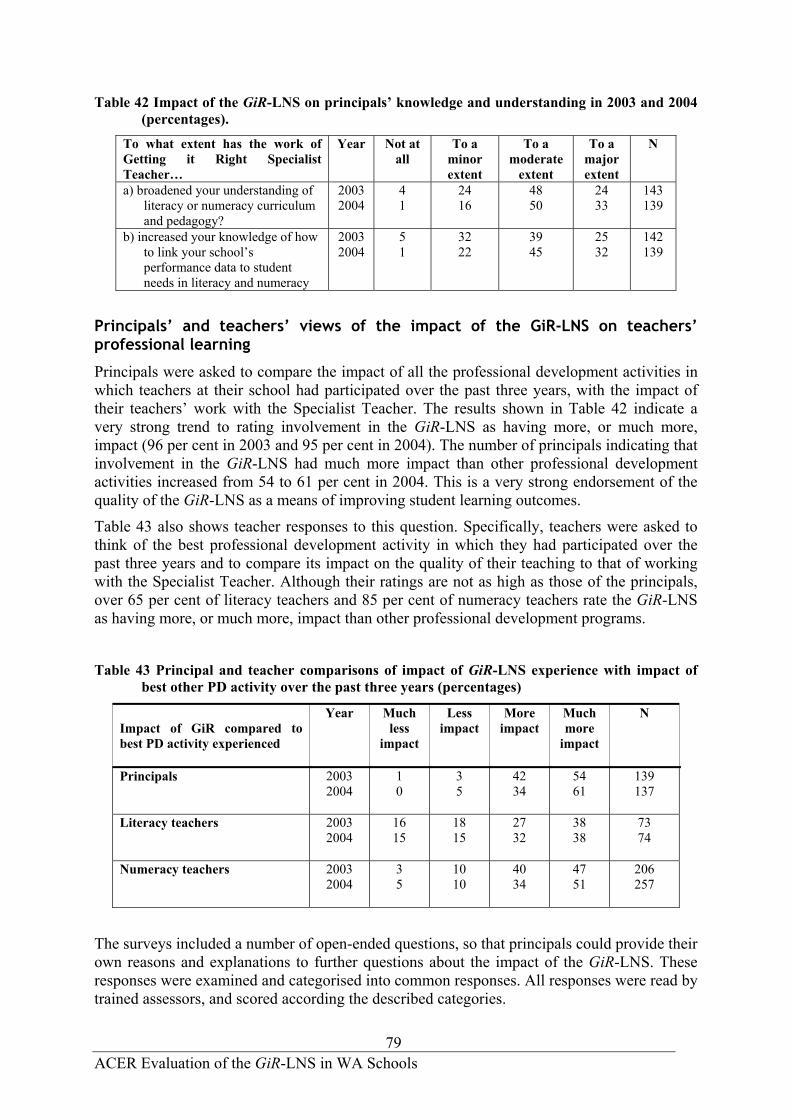
Table 42 Impact of the GiR-LNS on principals’ knowledge and understanding in 2003 and 2004 (percentages).
To what extent has the work of Getting it Right Specialist Teacher…
Year Not at all
To a minor extent
To a moderate
extent
To a major extent
N
a) broadened your understanding of literacy or numeracy curriculum and pedagogy?
2003 2004
4 1
24 16
48 50
24 33
143 139
b) increased your knowledge of how to link your school’s performance data to student needs in literacy and numeracy
2003 2004
5 1
32 22
39 45
25 142 32 139
Principals’ and teachers’ views of the impact of the GiR-LNS on teachers’ professional learning
Principals were asked to compare the impact of all the professional development activities in which teachers at their school had participated over the past three years, with the impact of their teachers’ work with the Specialist Teacher. The results shown in Table 42 indicate a very strong trend to rating involvement in the GiR-LNS as having more, or much more, impact (96 per cent in 2003 and 95 per cent in 2004). The number of principals indicating that involvement in the GiR-LNS had much more impact than other professional development activities increased from 54 to 61 per cent in 2004. This is a very strong endorsement of the quality of the GiR-LNS as a means of improving student learning outcomes.
Table 43 also shows teacher responses to this question. Specifically, teachers were asked to think of the best professional development activity in which they had participated over the past three years and to compare its impact on the quality of their teaching to that of working with the Specialist Teacher. Although their ratings are not as high as those of the principals, over 65 per cent of literacy teachers and 85 per cent of numeracy teachers rate the GiR-LNS as having more, or much more, impact than other professional development programs.
Table 43 Principal and teacher comparisons of impact of GiR-LNS experience with impact of
best other PD activity over the past three years (percentages)
Impact of GiR compared to best PD activity experienced
Year Much less
impact
Less impact
More impact
Much more
impact
N
Principals
2003 2004
1 0
3 5
42 34
54 61
139 137
Literacy teachers 2003
2004
16 15
18 15
27 32
38 38
73 74
Numeracy teachers 2003 2004
3 5
10 10
40 34
47 206 51 257
The surveys included a number of open-ended questions, so that principals could provide their own reasons and explanations to further questions about the impact of the GiR-LNS. These responses were examined and categorised into common responses. All responses were read by trained assessors, and scored according the described categories.
79 ACER Evaluation of the GiR-LNS in WA Schools

Principals were asked whether the GiR-LNS was meeting important needs in their school. As the results in Table 44 indicate, in both surveys almost all (98 per cent) agreed that this was the case.
Table 44 GiR-LNS meeting important school needs in 2003 and 2004 (percentages)
Is the Getting it Right strategy meeting any important needs in your school?
Year Yes
No
N
2003 2004
98 98
2 123 2 136
If the principals responded in the affirmative, they were then asked to list how Getting it Right had helped to meet these needs. Table 45 captures the reasons they listed. Space was provided for three reasons to be listed. Respondents listed a varying number of needs, accounting for the different numbers of responses.
The responses shown in Table 45 indicate that, in 2003 and 2004, two school needs were most commonly reported as having been met by the GiR-LNS. The first of these was the need to identify, diagnose, monitor and assist students at risk. The second need was related to the improvement of pedagogy in literacy or numeracy teaching. Other needs that were identified as being met included increasing teachers’ awareness of strategies to improve learning and the need for teachers to engage in collaborative planning and sharing of expertise.
Table 45 GiR-LNS meeting important school needs (percentages).
GiR meeting school needs
First need listed
N=139/133
Second need listed
N=123/120
Third need listed
N=88/86
Identifying, diagnosing, monitoring and assisting students at risk
18 12
15 8
13 4
Improving pedagogy in literacy/numeracy 26 17
15 8
15 11
Increasing teachers’ awareness of strategies to improve learning
4 11
15 13
6 7
Improving teachers’ content knowledge 4 2
5 2
5 1
Enhancing literacy/numeracy learning 6 10
6 5
3 4
Improving assessment practices 2 1
5 5
5 4
Catering better for a range of student needs 4 2
6 6
3 4
Other 3 6
6 7
7 16
Whole school planning for lit/num development 3 6
6 14
11 12
Improving data gathering and analysis 3 6
2 4
5 7
Focused use of school budget 1 0
1 1
1 2
Helping focus teacher learning (professional development)
8 5
4 3
6 9
80 ACER Evaluation of the GiR-LNS in WA Schools

Availability of ‘on-hand’ expert support; modelling of lit/num strategies
13 11
8 7
5 8
Teachers’ engagement in collaborative planning and sharing expertise
6 11
6 17
16 12
Improving home-school links 0 0
3 1 2 0
Principals were asked if they thought that there were better ways of meeting their school’s needs than the GiR-LNS. Most replied ‘no’ to this question (88 per cent, n-135) suggesting that their impressions of the value of the strategy were positive. A small number responded ‘yes’ there were better ways. The results in 2004 were very similar, with 84 per cent (n=135) replying ‘No’. The responses of the small number who answered this question negatively were categorised, and the results are shown in Table 46.
From the small number of respondents, more opportunities for staff professional learning and more time for the Specialist Teacher were mentioned as better ways of meeting school needs. Table 46 Better ways of meeting school needs 2003 and 2004 (percentages).
Yes. Better ways of meeting school needs than GiR?
First way listed
N=27/23
Second way listed
N=12/5 %
More opportunity for additional professional learning for all staff
19 8 13 0
Need both GiR Literacy and Numeracy STs
4 8 4 0
More FTE 22 17
4 20 More differentiated resourcing 26 8
0 20 Even more support for GiR additional assistance to schools
15 0 0 26
0 17 Linking to other agency support Other 15 42
44 60
Principals were given the opportunity to note the factors that had facilitated or hindered the GiR-LNS in their school.
The range of facilitating factors shown in Table 46 is of interest. They relate to the school context, the effectiveness of the Specialist Teacher, and to aspects of educational change, such as teachers’ receptiveness to change. The pattern of responses is similar for 2003 and 2004. While the frequencies for many categories are small, the range of factors identified by principals provides useful insights into the operation of Getting it Right. The most frequently listed facilitating factor was the general effectiveness of the particular Specialist Teacher in that school. The next most frequently listed factor was the support and cooperation of the whole school staff. Support from the school administration, and school organisational support were mentioned more than other factors.
Although reference to the GiR-LNS training program for Specialist Teachers was limited, the emphasis on the effectiveness of the Specialist Teachers implies the effectiveness of the training received by the Specialist Teachers, as well as the strength of their interpersonal skills and knowledge of literacy and numeracy content and pedagogy.
81 ACER Evaluation of the GiR-LNS in WA Schools
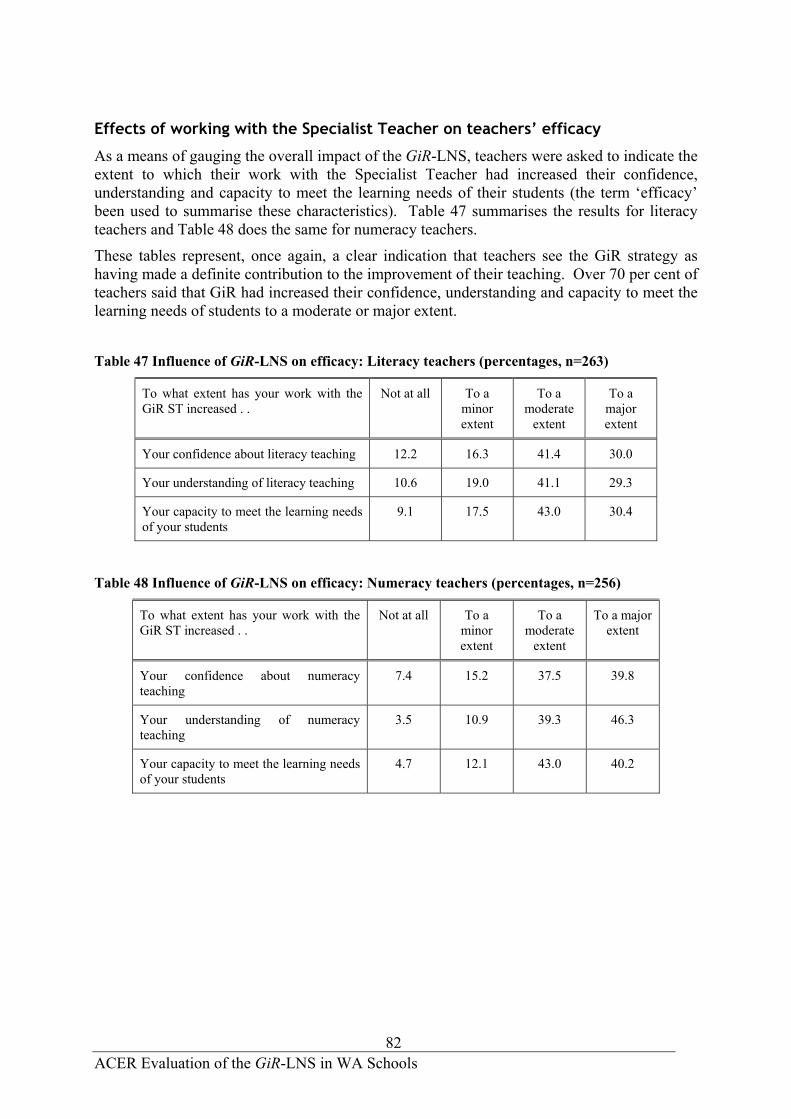
Effects of working with the Specialist Teacher on teachers’ efficacy
As a means of gauging the overall impact of the GiR-LNS, teachers were asked to indicate the extent to which their work with the Specialist Teacher had increased their confidence, understanding and capacity to meet the learning needs of their students (the term ‘efficacy’ been used to summarise these characteristics). Table 47 summarises the results for literacy teachers and Table 48 does the same for numeracy teachers.
These tables represent, once again, a clear indication that teachers see the GiR strategy as having made a definite contribution to the improvement of their teaching. Over 70 per cent of teachers said that GiR had increased their confidence, understanding and capacity to meet the learning needs of students to a moderate or major extent.
Table 47 Influence of GiR-LNS on efficacy: Literacy teachers (percentages, n=263)
To what extent has your work with the GiR ST increased . .
Not at all To a minor extent
To a moderate
extent
To a major extent
Your confidence about literacy teaching 12.2 16.3 41.4 30.0
Your understanding of literacy teaching 10.6 19.0 41.1 29.3
Your capacity to meet the learning needs of your students
9.1 17.5 43.0 30.4
Table 48 Influence of GiR-LNS on efficacy: Numeracy teachers (percentages, n=256)
To what extent has your work with the GiR ST increased . .
Not at all To a minor extent
To a moderate
extent
To a major extent
Your confidence about numeracy teaching
7.4 15.2 37.5 39.8
Your understanding of numeracy teaching
3.5 10.9 39.3 46.3
Your capacity to meet the learning needs of your students
4.7 12.1 43.0 40.2
82 ACER Evaluation of the GiR-LNS in WA Schools

7. SUSTAINING THE BENEFITS OF THE GIR-LNS
The range of new activities in schools that were facilitated by the Getting it Right-LNS and the creation of the Specialist Teacher role have been describe in earlier chapters. In a large proportion of participating schools, the Specialist Teacher had been a staff member in that school. This teacher participated in the training workshops conducted by the GiR-LNS central staff, and was provided with time specifically to work alongside colleagues in ways described earlier on - working ‘shoulder to shoulder.’ This chapter summarises views gathered from Specialist Teachers, classroom teachers and principals about the sustainability of teaching practices and collaborative activities associated with the GiR-LNS. It describes the provision schools have made to sustain the changes to practice brought about by the Specialist Teacher’s work.
The sustainability of Getting it Right practices in schools
Specialist Teachers and classroom teachers were asked: If this school no longer had a GiR Specialist Teacher, to what extent would the following practices be continued at this school?
(a) The setting of targets to improve students’ literacy (mathematics) learning
(b) Use of assessment instruments such as the Literacy Net (Numeracy Net) to identify students’ problems
(c) Planning of teaching activities to assist students with difficulties
(d) Committing regular time for teachers’ collaborative planning to meet students’ needs
(e) Co-ordination of collaboration across the phases of schooling
(f) Discussion amongst teachers about effective literacy (mathematics) teaching approaches
(g) Regular review of school literacy (mathematics) plans
The response categories were: Not at all, To a minor extent, To a moderate extent and To a major extent.
Literacy Specialist Teachers
Figure 17 shows the proportion of literacy Specialist Teachers in 2003 and 2004 who indicated that the various practices would continue to a moderate or major extent. This comparison identifies those practices that are most likely to be continued – based on the judgement of the Specialist Teachers.
83 ACER Evaluation of the GiR-LNS in WA Schools

0
10
20
30
40
50
60
70
80
a) Setting oftargets
b) Use ofassessmentinstruments
c) Planning ofteachingactivities
d) Regulartime for
teachers’ planning
e) Co-ordination ofcollaboration
f) Discussionamongstteachers
g) Review ofschool literacy
plans
%
20032004
Figure 17 Literacy Specialist Teachers’ views on extent various practices will be continued
contrasting 2003 and 2004 – per cent indicating to a moderate or major extent.
Figure 17 shows that in 2003, the activities that were judged to be most likely to continue were:
• Use of assessment instruments such as the Literacy Net to identify students’ problems (Item b)
• Planning of teaching activities to assist students with difficulties (Item c)
The activity that was judged least likely to continue was:
• Co-ordination of collaboration across the phases of schooling (Item e)
In 2004, the activities identified as most likely to continue were:
• Regular review of school literacy plans (Item g)
• Use of assessment instruments such as the Literacy Net to identify students’ problems (Item b)
The activity that was judged least likely to continue was:
• Planning of teaching activities to assist students with difficulties (Item c)
That is, item c moved from being one of the most commonly reported activities likely to continue in 2003, to the activity seen as least likely to continue in 2004. There were, therefore, some substantial changes between 2003 and 2004 seen in these activities. There was a marked increase for item g – Regular review of school literacy plans.
An analysis of differences between the cohorts of the Specialist Teachers indicated that there was only one statistically significant difference (P = 0.01) found – in 2003 Cohort 1 reported it more likely than Cohort 2 that committing regular time for teachers’ collaborative planning to meet students’ needs would be sustained.
84 ACER Evaluation of the GiR-LNS in WA Schools

In summary, according to Literacy Specialist Teachers, there was a wide range of teaching practices brought about by the GiR-LNS that would be likely to continue in schools – in particular, the regular review of school literacy plans and the use of assessment instruments such as the Literacy Net to identify students’ problems. The activity least likely to continue according to the literacy Specialist Teachers was the planning of teaching activities to assist students with difficulties. There was little evidence of differences between the cohorts of literacy Specialist Teachers, but there was some evidence of differences between literacy Specialist Teachers across time, with review of school literacy plans being seen as more likely to continue in 2004 and the planning of teaching activities to assist students with difficulties less likely to continue.
Literacy classroom teachers
Figure 18 shows the proportion of literacy classroom teachers in 2003 and 2004 who indicated that the various practices would continue to a moderate or major extent. This comparison allows those practices to be identified that are most likely to be continued – based on the judgement of the literacy classroom teachers.
0
10
20
30
40
50
60
70
80
90
100
a) Setting oftargets
b) Use ofassessmentinstruments
c) Planning ofteachingactivities
d) Regular timefor teachers'
planning
e) Co-ordiantion ofcollaboration
f) Discussionamongstteachers
g) Review ofschool literacy
plans
20032004
Figure 18 Literacy classroom teachers’ views on extent various practices that would be
continued contrasting 2003 and 2004 – per cent indicating to a moderate or major extent.
Figure 18 shows that in 2003, the activities that were judged by literacy classroom teachers to be most likely to continue were:
• Planning of teaching activities to assist students with difficulties (Item c)
• Use of assessment instruments such as the Literacy Net to identify students’ problems (Item b)
• The setting of targets to improve students’ literacy learning (item a)
85 ACER Evaluation of the GiR-LNS in WA Schools

The activity that was judged least likely to continue was:
• Co-ordination of collaboration across the phases of schooling (Item e)
In 2004, the activities most and least likely to continue were the same as in 2003.
Finally, an analysis of differences between the two cohorts of literacy classroom teachers found that there were no statistically significant differences in the means scores for each of the items between cohorts for either 2003 or 2004.
In summary, according to literacy classroom teachers, there was a wide range of teaching practices brought about by the GiR-LNS that would be likely to continue in schools. In particular, planning of teaching activities to assist students with difficulties, use of assessment instruments such as the Literacy Net to identify students’ problems, and the setting of targets to improve students’ literacy learning. There was no evidence of differences between years or between Cohorts of literacy classroom teachers.
When the views of Literacy Specialist Teachers and classroom teachers were compared, some striking differences are apparent. Classroom teachers were more likely than Specialist Teachers to believe that the setting of targets to improve students’ literacy learning, the use of assessment instruments such as the Literacy Net to identify students’ problems and the planning of teaching activities to assist students with difficulties will continue. One interpretation of this might be that classroom teachers seem more inclined to believe they can carry on these valued activities without a Specialist Teacher.
Numeracy Specialist Teachers
Numeracy Specialist Teachers were asked the same questions as the literacy Specialist Teachers, adjusted for the numeracy content.
Figure 19 shows the proportion of Numeracy Specialist Teachers in 2003 and 2004 who indicated that the various practices would continue to a moderate or major extent. This comparison identifies those practices that are most likely to be continued – based on the judgement of the Specialist Teachers.
An analysis comparing the mean of 2003 and the mean of 2004 for each of these variables showed a consistent positive trend, but the only statistically significant difference was for the item – Discussion amongst teachers about effective numeracy teaching approaches (item f). The mean in 2004 (2.73) was higher than in 2003 (2.42), suggesting that these Specialist Teachers saw discussion about effective numeracy teaching as more sustainable as time passed (P = 0.022). There was no evidence of change, on average, over time for any of the other items.
86 ACER Evaluation of the GiR-LNS in WA Schools

0
10
20
30
40
50
60
70
80
90
100
Setting
of ta
rgets
Asses
smen
t instr
umen
ts
Plannin
g of te
achin
g acti
vities
Committi
ng re
gular
time
Co-ordi
natio
n of c
ollab
oratio
n
Discus
sion a
mongs
t teac
hers
Regula
r rev
iew
20032004
Figure 19 Numeracy Specialist Teachers’ views on extent various practices will be continued
contrasting 2003 and 2004 – per cent indicating to a moderate or major extent.
Figure 19 shows that in 2003, the activities that were judged to be most likely to continue were planning of teaching activities to assist students with difficulties (Item c).
The activity that was judged to be least likely to continue was co-ordination of collaboration across the phases of schooling (Item e).
In 2004, the activities most likely to continue were:
• Planning of teaching activities to assist students with difficulties (Item c)
• Regular review of school literacy plans (Item g)
The activity that was judged in 2004 to be least likely to continue was co-ordination of collaboration across the phases of schooling (Item e).
That is, there is a broadly similar pattern across 2003 and 2004 amongst numeracy Specialist Teachers.
An analysis of differences between the cohorts of the Specialist Teachers indicated that there were no statistically significant differences in 2003 or 2004 between Cohort 1 and Cohort 2 Numeracy Specialist Teachers/
In summary, according to numeracy Specialist Teachers, there was a wide range of teaching practices brought about by the GiR-LNS that would be likely to continue in schools. The activity least likely to continue according to the numeracy Specialist Teachers was the co-ordination of collaboration across the phases of schooling. There was no evidence of differences between the cohorts of Numeracy Specialist Teachers, and only little evidence of differences between Numeracy Specialist Teachers across time. Numeracy classroom teachers
Numeracy classroom teachers were asked the same question with items adjusted for numeracy as in the case of the literacy classroom teachers. For these data, it was not possible to directly
87 ACER Evaluation of the GiR-LNS in WA Schools

compare 2003 with 2004 responses. Figure 20 shows the proportion of numeracy teachers in 2003 indicating that various practices would be likely to continue to a moderate or major extent.
Figure 21 shows the responses to the same questions for 2004.
0
20
40
60
80
100
The setting oftargets
Use ofassessmentinstruments
Planning ofteachingactivities
Committingregular time
Co-ordination ofcollaboration
Discussionamongstteachers
Regular reviewof literacy plans
Figure 20 Numeracy classroom teachers’ views on extent various practices will be continued
2003 – per cent indicating to a moderate or major extent
0
20
40
60
80
100
The setting oftargets
Use ofassessmentinstruments
Planning ofteachingactivities
Committingregular time
Co-ordination ofcollaboration
Discussionamongstteachers
Regular reviewof literacy plans
Figure 21 Numeracy classroom teachers’ views on extent various practices will be continued
2004 – per cent indicating to a moderate or major extent.
88 ACER Evaluation of the GiR-LNS in WA Schools

The distribution of responses is similar for each of the practices listed with the planning of teaching activities seen as most likely to continue, and the co-ordination of collaboration across the phases of schooling as the least likely activity to be sustained. An analysis of differences between the cohorts of the numeracy classroom teachers indicated that there were no statistically significant differences found in 2003 or 2004 for any of the items. The distribution of responses for teachers is similar to that for numeracy Specialist Teachers. Specialist Teachers are a little more optimistic that discussion amongst teachers about effective literacy (mathematics) teaching approaches, and regular review of school mathematics plans will continue.
In summary, according to numeracy classroom teachers, there were a wide range of activities brought about by the GiR-LNS which are be likely to continue in schools – in particular, the regular review of school literacy plans. The activity least likely to continue, according to the numeracy classroom teachers, was the co-ordination of collaboration across the phases of schooling. There was no evidence of differences between the cohorts of numeracy classroom teachers.
Principals’ views on the sustainability of GiR activities
Principals were asked about the types of plans their school had developed for sustaining changes brought about by the GiR-LNS. In total, 93 of 98 principals indicated that at least one plan was in place to sustain these changes.
Figure 22 shows the most common responses by principals in 2003 and 2004. It can be seen that there was a large increase in the proportion of principals reporting that collaborative planning would continue, while there was less formal professional development being planned in 2003 compared with 2004. Two of the other most common plans were to develop a whole school plan in which to embed the GiR-LNS, and to plan to embed collaborative planning and in-class support in the practice of teachers.
89 ACER Evaluation of the GiR-LNS in WA Schools

Figure 22 Percentage of principals reporting various types of plans for sustaining changes to teaching practice brought about by the GiR-LNS in 2003 and 2004
In summary, according to principals, most schools appeared to have plans in place to sustain changes to teaching practice brought about by the GiR-LNS. This can be interpreted to mean that the impact of the GiR-LNS was valued sufficiently highly for principals to wish to sustain the model in some form.
Summary
According to Specialist Teachers and numeracy and literacy classroom teachers a wide range of teaching activities and professional collaboration brought about by the GiR-LNS are likely to continue in schools. According to principals, most schools appear to have plans in place to sustain changes to teaching practice brought about by the strategy.
Factors that facilitated or hindered the Getting it Right strategy in schools
Facilitating factors
Principals were given the opportunity to note the factors that had facilitated or hindered the Getting it Right strategy in their school. All responses were read and a set of categories for coding the responses was developed.
The range of facilitating factors shown in Table 49 is of interest. They relate to the school context, the effectiveness of the Specialist Teacher, and to aspects of educational change, such as teachers’ receptiveness to change. The pattern of responses is similar for 2003 and 2004. While the frequencies for many categories are small, the range of factors identified by principals provides useful insights into the operation of the GiR-LNS. The most frequently listed facilitating factor was the general effectiveness of the particular Specialist Teacher in that school. The next most frequently listed factor was the support and cooperation of the whole school staff. Support from the school administration, and school organisational support were mentioned more than other factors.
Although reference to the GiR-LNS training for Specialist Teachers was limited, the emphasis on the effectiveness of the Specialist Teachers implies the effectiveness of the training provided for these teachers, as well as the strength of their interpersonal skills and knowledge of literacy and numeracy content and pedagogy. Table 49 Factors that facilitated the GiR-LNS in the school in 2003 and 2004 (percentages)
What has facilitated the GiR-LNS in your school?
Year First factor listed
%
N
General effectiveness of the GiR ST 2003 2004
39 22
131 134
Support by school Admin. 2003 2004
8 10
131 134
Data-based incentive from need for school to improve student outcomes
2003 2004
8 10
131 134
School organizational support, including time for collaboration
2003 2004
5 13
131 134
Collaborative planning and review 2003 2004
6 7
131 134
Support and cooperation from whole staff
2003 2004
1 8
131 134
90 ACER Evaluation of the GiR-LNS in WA Schools

Team approach (involving, for example, ST, SAER coord., Admin.)
2003 2004
2 5
131 134
System-level support for GiR 2003 2004
3 5
131 134
The GiR training for STs 2003 2004
4 2
131 134
Additional time provided by school for work of GiR ST
2003 2004
2 4
131 134
Other 2003 2004
3 2
131 134
Use of GiR to focus whole school on improving student outcomes
2003 2004
2 2
131 134
GiR supports local needs & meets system requirements
2003 2004
1 4
131 134
GiR provides resource at point of teaching/ in the classroom
2003 2004
1 1
131 134
Teachers receptiveness to change 2003 2004
2 1
131 134
Teachers’ willingness to ask for help
2003 2004
0 1
131 134
Coherence with other school initiatives
2003 2004
1 0
131 134
Observed effectiveness of strategies promoted by GiR
2003 2004
2 0
131 134
ST from within school 2003 2004
1 131 1 134
Hindering factors
A number of factors were identified by the principals as having hindered the implementation of the GiR-LNS in their schools. The descriptive results are shown in Table 50, and are similar for 2003 and 2004. Two factors were mentioned more often than the others identified. Of all factors listed for the first time, 28 per cent related to lack of time for collaboration. Staff resistance to working with the Specialist Teacher, or to the Getting it Right approach to providing additional assistance accounted for 11 per cent of factors listed for the first time in 2003, and this increased to 26 per cent in 2004.
Table 50 Factors that hindered the GiR-LNS in the school (percentages).
What has hindered GiR? Year First factor listed
%
N
Lack of time (e.g., for collaboration)
2003 2004
28 25
131 122
Lack of direction, poor administration of GiR (at system level)
2003 2004
2 0
131 122
Insufficient funds 2003 2004
7 4
131 122
Short timeline (only 2 years) 2003 2004
2 1
131 122
Timetabling constraints 2003 2004
2 0
131 122
Staff turnover 2003 2004
6 11
131 122
91 ACER Evaluation of the GiR-LNS in WA Schools

Change of ST 2003 2004
3 4
131 122
Other 2003 2004
14 19
131 122
Sharing GiR ST with another school
2003 2004
2 1
131 122
Inappropriate ST 2003 2004
2 5
131 122
Staff resistance 2003 2004
11 26
131 122
Difficult to change some teachers’ practice
2003 2004
5 3
131 122
Staff not focused on students’ learning needs
2003 2004
0 0
131 122
Principal needed more briefing at commencement
2003 2004
3 0
131 122
Negative effects of GiR program title
2003 2004
10 0
131 122
Staff misunderstanding of GiR ST role
2003 2004
8 1
131 122
Student transience 2003 2004
5 1
131 122
Unwillingness to use DOTT for GiR
2003 2004
0 1
131 122
Not whole school (K-7) in focus 2003 2004
1 131 0 122
Sustaining changes to teaching practice brought about by the Getting it Right strategy
Finally, principals were asked about plans that schools had made to sustain changes that may have been brought about by the Getting it Right strategy. The range of plans reported was categorised. The descriptive results for the first and second plans listed are shown in Table 51. The most interesting result is the increase in reports between 2003 and 2004 that collaborative planning and in-class support will be continue: from 9 per cent in 2003 to 24 per cent in 2004. This suggests increasing recognition of the value of this key aspect of the GiR-LNS, affirming one of the strengths of the model of professional learning that underpins the strategy.
Table 51 Plans for sustaining changes in 2003 and 2004 (percentages)
Plans for sustaining GiR changes? Year First plan listed N= 137/136
%
Second plan listed N= 83/87
% Embed GiR changes in school teaching and/or assessment practices
2003 2004
20 16
17 12
Developing whole school literacy/numeracy plan
2003 2004
15 13
10 9
Continue collaborative planning and in-class support
2003 2004
9 24
10 14
Maintain ST role through other funding (e.g., CLNP, or further GiR funding)
2003 2004
7 6
1 2
Providing school resources/funding 2003 2004
7 4
11 6
School will continue to fund ST position 2003 5 4
92 ACER Evaluation of the GiR-LNS in WA Schools

2004 4 7 Continue to treat GiR as integral part of teachers’ learning
2003 2004
4 10
2 1
Ongoing direct monitoring of student outcomes in all classes
2003 2004
1 2
6 3
Other 2003 2004
12 4
15 24
Extend collaborative planning to whole school
2003 2004
4 7
5 8
Increase the number of teachers involved 2003 2004
1 2
1 7
Implement GiR as designed at system level
2003 2004
4 0
1 0
Introduce timetable changes 2003 2004
2 0
0 0
Provide more PD for teachers 2003 2004
9 2
18 0
Share good practice within the school (e.g. staff meetings, visiting other teachers’ classrooms)
2003 2004
2 0 6 1
Summary
Overall, the descriptive results of the responses to the questionnaires completed by principals in 2003 and 2004 present a positive view of the GiR-LNS. The results provide insights into many features of the strategy that principals connect to improved outcomes in their schools.
How could the Getting it Right strategy be improved?
The evaluation aimed to shed light on how the GiR-LNS might be improved, particularly from the perspective of the Specialist Teachers. Accordingly, they were asked to describe how the GiR-LNS could be improved as a strategy for assisting Specialist Teachers, in providing in-class support, to meet the professional learning needs of classroom colleagues.
This information was gathered using an open-ended question format. The first three factors described by the Specialist Teachers were classified. A check was undertaken to see if any Specialist Teachers had provided more than one response that was classified into the same category.
For Literacy, this occurred once in 2003 and in 2004. Further investigation indicated that each of these multiple responses was classified to the ‘Other’ category. Given this low level of double counting, all three responses to the open-ended question were aggregated, giving a total of 98 responses in 2003, and 124 in 2004
Table 52 shows the number of valid and missing cases for each of three factors for 2003 and 2004.
93 ACER Evaluation of the GiR-LNS in WA Schools

Table 52 Number of valid and missing cases for each of three factors describing how the GiR-
LNS could be improved as a strategy for assisting literacy Specialist Teachers to meet the professional learning needs of classroom colleagues, 2003 and 2004
2003 2004
Reason 1 Reason 2 Reason 3 Reason 1 Reason 2 Reason 3
Valid 57 30 11 71 38 15
Missing 21 48 67 7 40 63
For Numeracy, there were no cases where this occurred. Table 53 shows the number of valid and missing cases for each of three factors for 2003 and 2004.
Table 53 Number of valid and missing cases for each of three factors describing how GiR could
be improved as a strategy for assisting numeracy Specialist Teachers to meet the professional learning needs of classroom colleagues, 2003 and 2004
2003 2004
Reason 1 Reason 2 Reason 3 Reason 1 Reason 2 Reason 3
Valid 50 26 6 47 25 6
Missing 3 27 47 6 28 47
Literacy Specialist Teachers
Figure 23 shows the factors offered by Literacy Specialist Teachers for improving the GiR-LNS as a strategy for assisting Specialist Teachers to meet the professional learning needs of classroom colleagues in 2003. Figure 24 shows the same for 2004. It can be seen that for in 2003 greater clarification of the role of the GiR-LNS Specialist Teacher role was the most frequently cited factor. In 2004, however, over 25 per cent of factors nominated by literacy Specialist Teachers referred to the need for more time for collaboration with other teachers.
94 ACER Evaluation of the GiR-LNS in WA Schools

0 5 10 15 20 25 30
Other
More support GiR contact
No improvement needed
Include GiR in Schl plan
Higher profile for GiR
More advice on resources
Reference to content of GiR PD
More funding
GiR PD for all staff
More time for collab'tion ST & class tch
More PD
More support from schl admin
Greater GiR time allocation
More time for colla'tion w/ other tch's
Greater clarification of GiR role
Figure 23 The percentage of all factors given by literacy Specialist Teachers describing how the
GiR-LNS could be improved as a strategy for assisting Specialist Teachers to meet the professional learning needs of classroom colleagues 2003
0 5 10 15 20 25 30
Other
Higher profile for GiR
No improvement needed
Greater clarification of GiR role
More funding
More support GiR contact
More advice on resources
Include GiR in Schl plan
More time for collab'tion ST & class tch
More support from schl admin
Reference to content of GiR PD
More PD
Greater GiR time allocation
GiR PD for all staff
More time for colla'tion w/ other tch's
Figure 24 The percentage of all factors given by literacy Specialist Teachers describing how GiR
could be improved as a strategy for assisting Specialist Teachers to meet the professional learning needs of classroom colleagues in 2004
In summary, greater clarity about the role of the literacy Specialist Teachers was frequently seen as required in 2003, but by 2004 this concern had been met and replaced by more time
95 ACER Evaluation of the GiR-LNS in WA Schools

for collaboration as the most frequently mentioned factor likely to improve the effectiveness of the GiR-LNS.
Figure 25 shows the percentage of all factors given by numeracy Specialist Teachers describing how the GiR-LNS could be improved as a strategy for assisting Specialist Teachers to meet the professional learning needs of classroom colleagues in 2003. Figure 26 shows the same for 2004. It can be seen that for in 2003 more time for collaboration with the Specialist Teacher and the classroom teacher was the most frequently cited factor. In 2004, the most commonly factor nominated by Specialist Teachers referred to the need for more time for collaboration with other teachers. Numeracy Specialist Teachers were less likely than literacy Specialist Teachers to mention the need for greater clarity about their role in schools.
0 5 10 15 20 25
Other
Reference to content of GiR PD
No improvement needed
More time for colla'tion w/ other tch's
More support from schl admin
More advice on resources
Include GiR in Schl plan
Higher profile for GiR
More support GiR contact
Greater clarification of GiR role
GiR PD for all staff
More PD
More funding
Greater GiR time allocation
More time for collab'tion ST & class tch
Figure 25 The number of times for each statement given by numeracy Specialist Teachers
describing how the GiR-LNS could be improved as a strategy for assisting numeracy Specialist Teachers to meet the professional learning needs of classroom colleagues 2003
96 ACER Evaluation of the GiR-LNS in WA Schools

0 5 10 15 20 25
Other
Greater clarification of GiR role
Higher profile for GiR
More support GiR contact
No improvement needed
More time for collab'tion ST & class tch
Include GiR in Schl plan
More advice on resources
GiR PD for all staff
More funding
More support from schl admin
More PD
Greater GiR time allocation
More time for collaboration with other tchrs
Figure 26 The number of times for each statement given by numeracy Specialist Teachers
describing how the GiR-LNS could be improved as a strategy for assisting numeracy Specialist Teachers to meet the professional learning needs of classroom colleagues in 2004
In summary, numeracy Specialist Teachers most frequently saw time for more collaboration within the school as likely to improve the effectiveness of the GiR-LNS.
The most important support that Specialist Teachers received from their school
The effectiveness of the Specialist Teachers is likely to be influenced by the amount of support that they received from their school. Accordingly, Specialist Teachers were asked to describe the most important support that they had received from their school in their work as a Specialist Teacher. An open-ended question was used to gather this information.
For literacy, low double counting was observed, so again, the number of factors given by Specialist Teachers was aggregated. Table 54 shows the number of valid and missing cases for each of three factors for 2003 and 2004. There was a total of 158 reasons given in 2003 and 199 reasons given in 2004 by Literacy Specialist Teachers.
Table 54 Number of valid and missing cases for each of three factors describing the most
important support that literacy Specialist Teachers had received from their school, 2003 and 2004
2003 2004
Reason 1 Reason 2 Reason 3 Reason 1 Reason 2 Reason 3
Valid 62 58 38 77 70 52
Missing 16 20 40 1 8 26
97 ACER Evaluation of the GiR-LNS in WA Schools

For numeracy, Table 55 shows the number of valid and missing cases for each of three factors for 2003 and 2004. Low double counting was observed with these data – two instances in 2003 and one in 2004 – so the number of factors given by Specialist Teachers was aggregated.
Table 55 Number of valid and missing cases for each of three factors describing the most
important support that numeracy Specialist Teachers had received from their school, 2003 and 2004
2003 2004
Reason 1 Reason 2 Reason 3 Reason 1 Reason 2 Reason 3
Valid 50 41 36 50 47 38
Missing 3 12 17 3 6 15
Literacy Specialist Teachers
Figure 27 shows the percentage of all factors listed by literacy Specialist Teachers describing the most important support that they had received from their school for their work as a Specialist Teacher in 2003. Figure 28 shows the same information for 2004. It can be seen that in both 2003 and 2004, administration support, that is, support from the school leaders, was the most frequently cited factor. Support from colleagues and a positive attitude to the GiR-LNS were also commonly cited reasons in 2003 and 2004.
98 ACER Evaluation of the GiR-LNS in WA Schools

GiR support staff in EdDept
0 5 10 15 20 25 30
Other
Time
Involvement in school planning Quality resources Positive feedback
Time in staff meet's for GiR Dedicated GiR ST work area
Support from GiR ST network Flexibility of schl admin
Funding from school
Autonomy in role
Timetable plan time
Positive attitude to GiR Support from colleagues Admin supportive of GiR
Figure 27 The percentage of all factors given by literacy Specialist Teachers describing the most
important support that they had received from their school in their work as a Specialist Teacher in 2003
0 5 10 15 20 25 30
GiR time not used for other purposes
Positive feedback
GiR support staff in EdDept
Involvement in school planning
Dedicated GiR ST work area
Autonomy in role Time in staff meet's for GiR
Quality resources Support from GiR ST network
Flexibility of schl admin Other
Funding from school
Timetable plan time
Positive attitude to GiR
Support from colleagues
Admin supportive of GiR
Figure 28 The percentage of all factors given by Literacy Specialist Teachers describing the most
important support that they had received from their school in their work as a Specialist Teacher in 2004
99 ACER Evaluation of the GiR-LNS in WA Schools

In summary, literacy Specialist Teachers most frequently cited administration or leadership support as the most important support that they had received from their school in their work as a Specialist Teacher.
Numeracy Specialist Teachers
The results for numeracy Specialist Teachers were very similar to those for literacy Specialist Teachers. Figure 29 shows the number of times each factor was identified by numeracy Specialist Teachers, describing the most important support that they had received from their school in their work as a numeracy Specialist Teacher in 2003. Figure 30 shows the same information for 2004. It can be seen that in 2003 and 2004 administration (leadership) support was, as in the case of literacy Specialist Teachers, the most frequently cited factor (including, in 2003, timetabled planning time). Support from colleagues and a positive attitude to the GiR-LNS were also commonly cited reasons in 2003 and 2004.
0 5 10 15 20 25 30
Other
Support from GiR ST network
GiR time not used for other purposes
Time in staff meet's for GiR
GiR support staff in EdDept
Dedicated GiR ST work area
Quality resources
Autonomy in role
Flexibilitiy of schl admin
Positive feedback
Positive attitude to GiR
Funding from school
Support from colleagues
Timetable plan time
Admin supportive of GiR
Figure 29 The number of times for each statement given by numeracy Specialist Teachers
describing the most important support that they had received from their school in their work as a Specialist Teacher in 2003
100 ACER Evaluation of the GiR-LNS in WA Schools

0 5 10 15 20 25 30
GiR time not used for other purposes
Positive feedback
GiR support staff in EdDept
Involvement in school planning
Dedicated GiR ST work area
Autonomy in role
Time in staff meet's for GiR
Quality resources
Support from GiR ST network
Flexibilitiy of schl admin
Other
Funding from school
Timetable plan time
Positive attitude to GiR
Support from colleagues
Admin supportive of GiR
Figure 30 The number of times for each statement given by numeracy Specialist Teachers
describing the most important support that they had received from their school in their work as a Specialist Teacher in 2004
In summary, Numeracy Specialist Teachers cited administrative support and support from their colleagues most frequently as the most important support that they had received from their school in their work as a Specialist Teacher.
Factors that hindered Specialist Teachers
Specialist Teachers were also asked to specify factors had hindered their capacity to carry out their role as a Specialist Teacher in their school.
For literacy, once again, low double counting of responses to an open-ended question was observed, so the number of factors given by the literacy Specialist Teachers was aggregated. Table 56 shows the number of valid and missing cases for each of three factors for 2003 and 2004. There was a total of 148 reasons given in 2003 and 169 reasons given in 2004 by Literacy Specialist Teachers.
Table 56 Number of valid and missing cases for each of three factors describing factors that had
hindered their capacity to carry out their role as a literacy Specialist Teacher in their school, 2003 and 2004
2003 2004
Reason 1 Reason 2 Reason 3 Reason 1 Reason 2 Reason 3
Valid 63 52 33 75 58 36
Missing 15 26 45 3 20 42
101 ACER Evaluation of the GiR-LNS in WA Schools

For numeracy, there was considerable double counting of responses to an open-ended question observed in 2003, so duplicates were removed and then the number of factors listed by Specialist Teachers was aggregated. In 2004 there was only one duplicate case and this was left intact. Table 57 shows the number of valid and missing cases for each of three factors for 2003 and 2004.
Table 57 Number of valid and missing cases for each of three factors describing factors that had
hindered their capacity to carry out their role as a numeracy Specialist Teacher in their school, 2003 and 2004
2003 2004
Reason 1 Reason 2 Reason 3 Reason 1 Reason 2 Reason 3
Valid 52 33 23 50 39 24
Missing 1 20 30 3 14 29
Literacy Specialist Teachers
Figure 31 shows the percentage of all factors specified by literacy Specialist Teachers describing hindrances to their work as a Specialist Teacher in 2003. Figure 32 shows that staff uncertainty about the nature of the GiR-LNS Specialist Teacher role was the most frequently cited hindrance. In 2004, nearly 50 per cent of responses referred to teachers not being receptive to change. This finding highlights the function of the GiR-LNS as a reform strategy, requiring some changes in teaching practices, and can be connected to the Specialist Teachers’ recognition of the importance of the support of the school leadership for their work.
In summary, lack of staff understanding about their role as Specialist Teachers, and more recently and commonly, the resistance of teachers to change, had hindered literacy Specialist Teachers’ capacity to carry out their role in their schools.
102 ACER Evaluation of the GiR-LNS in WA Schools

0 10 20 30 40 50 6
Othe
0
r
Staff misunderstand GiR role
Teachers not receptive to change
Teachers unwilling to give up DOT
Principal/DP-conflicting views Timetabling constraints
Limited/no funding of incidentals No hinderances
Lack of support from admin
ST has other roles
Time consuming diagnostic tasks Teacher transfers
Challenges-extent of stud't prob's
Lack of support from GiR team
Feeling inadequate
Time allocation inadequate
Criticism of GiR PD
Staff uncertainty re GiR role
Figure 31 The percentage of all factors given by Specialist Teachers describing factors that had
hindered their capacity to carry out their role as a Literacy Specialist Teacher in their school, 2003
0 10 20 30 40 50 6
Othe
0
r
Feeling inadequate
Challenges-extent of stud't prob's
Lack of support from admin
Feeling inadequate
Staff uncertainty re GiR role
Teacher transfers
Limited/no funding of incidentals ST has other roles
Teachers unwilling to give up DOT
Timetabling constraints Principal/DP-conflicting views
Time allocation inadequate
Teachers not receptive to change
Figure 32 The percentage of all factors given by Specialist Teachers describing factors that had
hindered their capacity to carry out their role as a Literacy Specialist Teacher in their school, 2004
103 ACER Evaluation of the GiR-LNS in WA Schools

Numeracy Specialist Teachers
Figure 33 shows the frequency of each factor listed by numeracy Specialist Teachers to describe hindrances to their work as a Specialist Teacher in 2003. Figure 34 shows the same information for 2004. It can be seen that teaching colleagues’ uncertainty about the nature of the Specialist Teachers’ role was the most frequently cited hindrance in 2003. In 2004, the most frequent responses referred to a lack of time, and to teachers not being receptive to change.
In summary, as with literacy Specialist Teachers, lack of clarity amongst teacher colleagues about the Specialist Teacher role and, more recently, a lack of time and the resistance of teachers have hindered numeracy Specialist Teachers’ capacity to carry out their role of providing in-class support in their school.
0 10 20 30 40 50 6
Othe
0
rStaff misunderstand GiR role
Teachers not receptive to change
Teachers unwilling to give up DOTPrincipal/DP-conflicting views
Timetabling constraints Limited/no funding of incidentals
No hinderances
Lack of support from admin ST has other roles
Time consuming diagnostic tasks Teacher transfers
Challenges-extent of stud't prob's
Lack of support from GiR team
Feeling inadequate
Time allocation inadequate
Criticism of GiR PD
Staff uncertainty re GiR role
Figure 33 The number of times for each statement given by numeracy Specialist Teachers describing factors that had hindered their capacity to carry out their role as a Specialist Teacher in their school, 2003
104 ACER Evaluation of the GiR-LNS in WA Schools

0 5 10 15 20 25 30
Other
Lack of support from admin Staff uncertainty re GiR role
ST has other roles
Feeling inadequate Challenges-extent of stud't prob's
Limited/no funding of incidentals
Principal/DP-conflicting views
Teacher transfers
Teachers unwilling to give up DOT Timetabling constraints
Teachers not receptive to change
Time allocation inadequate
Figure 34 The number of times for each statement given by numeracy Specialist Teachers describing factors that had hindered their capacity to carry out their role as a Specialist Teacher in their school, 2004
Summary
Specialist Teachers indicated that:
• time for more collaboration within the school was most frequently seen by numeracy Specialist Teachers as likely to improve the effectiveness of the GiR-LNS.
• greater clarity amongst their colleagues about the ST role was frequently seen as a concern of literacy Specialist Teachers in 2003, but by 2004 more time was most frequently seen as likely to improve the GiR-LNS.
• Specialist Teachers most frequently cited support from the school administration and help from their colleagues as the most important support that they had received from their school in their work as a Specialist Teacher.
• a lack of clarity amongst colleagues about the nature and purpose of the Specialist Teacher role, and more recently a lack of time and the resistance of teachers appears to have hindered the capacity of some Specialist Teachers to carry out their role in their school.
105 ACER Evaluation of the GiR-LNS in WA Schools

8. EFFECTIVE CONDITIONS FOR IN-CLASS SUPPORT
Further investigation the data from the 2003 and 2004 surveys using a statistical technique called path analysis provided insights into the conditions that have an effect on in-class support.
The path analysis method provides a way of assessing the effects – both direct and indirect – of variables upon other variables. An indirect effect is one that is mediated by an intervening variable.
For example, path analysis showed that one of the strongest effects on teacher efficacy was the extent to which classroom teachers and Specialist Teachers spent time together diagnosing students’ learning needs, planning activities to meet these needs and keeping records of individual student progress. (The measure of teacher efficacy comprised teachers’ ratings of their confidence and understanding, and their capacity to meet students’ learning needs.) Just under 75% of the effect was direct, and the remaining 25% of the effect was indirect, largely dependent on the strength of collegiality in the school. That is, the joint work done by the literacy classroom teacher and the Specialist Teacher focussing on students, will have a direct and positive effect on teacher efficacy. However, to support this activity, it is also important to ensure that a collegial culture exists in the school.
A series of analyses was conducted using the following as outcome variables:
• Efficacy
• Sustainability
• Student attitudes
• Teaching practice
• Curriculum
• Knowledge
An example of one of these analyses, using the knowledge outcome variable, is shown in Figure 35.
107 ACER Evaluation of the GiR-LNS in WA Schools
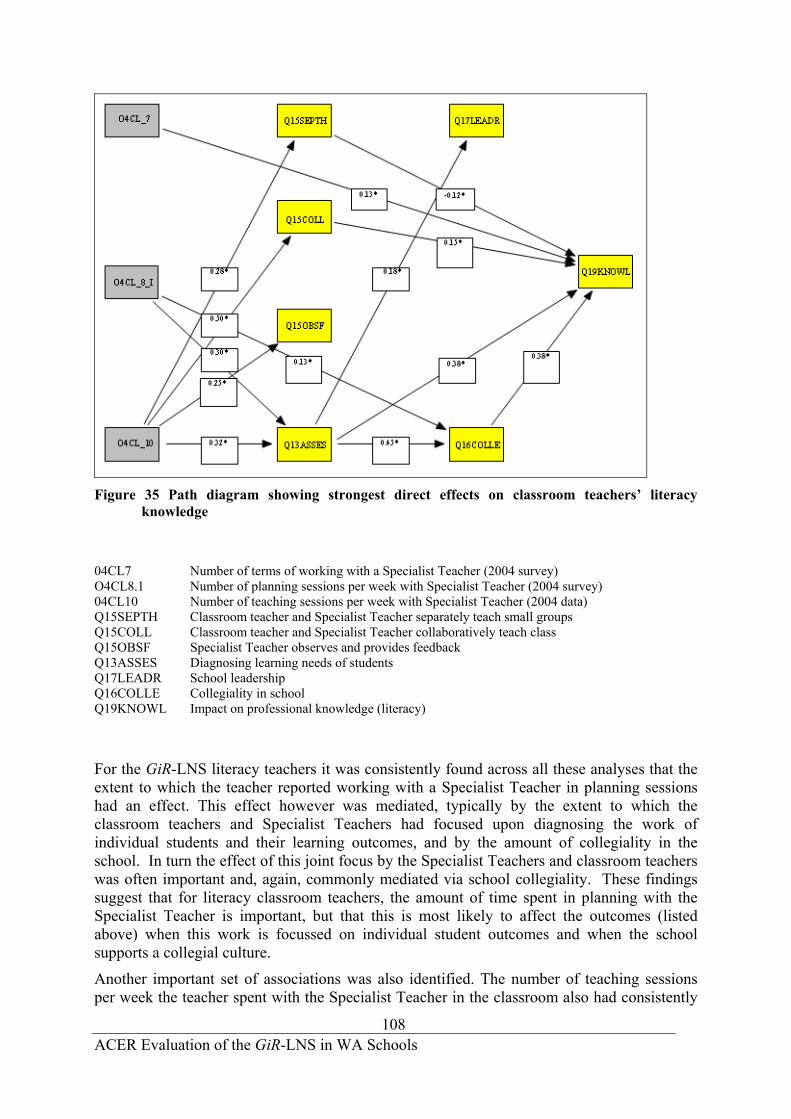
Figure 35 Path diagram showing strongest direct effects on classroom teachers’ literacy
knowledge
04CL7 Number of terms of working with a Specialist Teacher (2004 survey) O4CL8.1 Number of planning sessions per week with Specialist Teacher (2004 survey) 04CL10 Number of teaching sessions per week with Specialist Teacher (2004 data) Q15SEPTH Classroom teacher and Specialist Teacher separately teach small groups Q15COLL Classroom teacher and Specialist Teacher collaboratively teach class Q15OBSF Specialist Teacher observes and provides feedback Q13ASSES Diagnosing learning needs of students Q17LEADR School leadership Q16COLLE Collegiality in school Q19KNOWL Impact on professional knowledge (literacy)
For the GiR-LNS literacy teachers it was consistently found across all these analyses that the extent to which the teacher reported working with a Specialist Teacher in planning sessions had an effect. This effect however was mediated, typically by the extent to which the classroom teachers and Specialist Teachers had focused upon diagnosing the work of individual students and their learning outcomes, and by the amount of collegiality in the school. In turn the effect of this joint focus by the Specialist Teachers and classroom teachers was often important and, again, commonly mediated via school collegiality. These findings suggest that for literacy classroom teachers, the amount of time spent in planning with the Specialist Teacher is important, but that this is most likely to affect the outcomes (listed above) when this work is focussed on individual student outcomes and when the school supports a collegial culture.
Another important set of associations was also identified. The number of teaching sessions per week the teacher spent with the Specialist Teacher in the classroom also had consistently
108 ACER Evaluation of the GiR-LNS in WA Schools

strong effects on the outcome variables listed above. Typically, this effect was mediated, again via the frequency with which the Specialist Teacher and classroom teachers focussed upon individual students, but also by the extent to which the Specialist Teacher modelled effective teaching strategies in the classroom. This implies that the time the classroom teacher spends with the Specialist Teacher is more likely to lead to a positive outcome, if there is a focus on individual students and if Specialist Teacher provides modelling of effective teaching practices.
It was interesting to note also that if the classroom teachers or the Specialist Teacher withdrew students, or taught students separately, the effect on any of the above outcomes was either negative or zero. In other words, when Specialist Teachers and classroom teachers worked in other ways than working shoulder-to-shoulder in class, the effects on teaching and learning outcomes were minimal or negative.
For the numeracy teachers, a smaller set of analyses were conducted using
• Efficacy
• Sustainability
• Student attitudes
• Teaching practice
Similar associations between variables were identified among the numeracy teachers as were seen using the data from the literacy classroom teachers. The benefits accruing to teachers and schools from the amount of time spent with the Specialist Teacher was mediated via the extent to which they focussed upon individual students and the extent to which the Specialist Teacher observed the classroom teacher at work and provided feedback about their teacher. These effects were, in turn mediated by the level of collegiality in the school – the higher the collegiality, the stronger these effects tended to be. Leadership did not tend to mediate the effect of these variables except for sustainability where it was important both for its direct and mediating effects.
Thus, these analyses suggested that the amount of time classroom teachers worked collaboratively with a Specialist Teacher had important effects across a range of outcomes – efficacy, sustainability, student attitudes, teaching practice, curriculum and knowledge. This effect was mediated, particularly by the focus of the Specialist Teacher and the classroom teachers on individual students, and collegiality in the school. If the work of the Specialist Teacher is to be effective in terms of teaching and learning outcomes, special attention needs to be given to ensuring these conditions are in place.
109 ACER Evaluation of the GiR-LNS in WA Schools


9. GETTING IT RIGHT AS A REFORM STRATEGY
The Getting it Right-Literacy and Numeracy Strategy is clearly a comprehensive and well-resourced reform strategy with its main emphasis on building professional capacity among teachers and principals. The data gathered as part of the evaluation, through school and classroom observations, interviews and surveys5, left no doubt that the strategy was highly regarded by teachers and principals, and having a significant impact on practice.
Most teachers observed and interviewed by the evaluation team were readily able to give specific examples of how their work with a GiR-LNS Specialist teacher had transformed their teaching. These comments from teachers are typical:
I don’t set limits to my expectations, or their expectations, for what they can learn any more . . . because I know they can get there. Because of the diagnostic tools, I’m listening much more to their thought processes, to how they work it out. I’m getting them to reflect more, orally, to find out what thought processes they are using. So I can tell much better whether they really understand or not – pen and paper tests don’t tell you that. (Numeracy classroom colleague)
My teaching is different. I use new strategies – the Spelling Journal, and the writing monitoring tool … there’s more explicitness in my planning, and checking that the goal has been achieved … more effective catering for the students at educational risk … I know where they’re at and am better informed to address their needs. (Literacy classroom colleague)
The success of the Getting it Right Strategy, in linking State Government policy to significant change in teachers’ beliefs and practice, suggests it would be worthwhile to examine the main components of the strategy in relation to research on professional learning for teachers and in relation to the literature on educational change in teachers, schools and systems.
Linking policy to practice
The challenge of building strong links between reform policy and implementation is a perennial one in education. A common refrain in evaluation reports of educational reform efforts is the lack of fit between ambitious goals for school improvement and the resources necessary to bring about significant change in practice. Policy makers can also have quite naive expectations about how easy it is to bring about educational change, not understanding that the kinds of change that really matter in education are not structural changes but those that build teacher capacity and professional culture. There are no short cuts to educational improvement.
Peterson, McArthy & Elmore’s (1996) research, for example, cast doubt on the capacity of “restructuring” reforms in the US to benefit classroom practice. This was because:
Changing practice is primarily a problem of teacher learning, not a problem of organisation. . . . School structures can provide opportunities for the learning of new teaching practices and new strategies for student learning, but structures, by
111
5 This section draws on the qualitative data gathered from observations and interviews in 20 schools. Further detail about the implementation of the GiR-LNS in these schools can be found in Volume 2 of this report.
ACER Evaluation of the GiR-LNS in WA Schools

themselves do not cause learning to occur . . . School structure follows from good practice, not vice versa. (p. 149)
This is a lesson understood well in Australia, since the disappointments of school management reforms in the 1990s. There was no logic to these reforms linking changes in school management to teacher learning and new practices. Over the past decade, increasing numbers of researchers have identified the existence of an active, accountable professional community within and across schools as important for effective teacher development and high quality teaching (Little & McLaughlin, 1993; Louis, Kruse & Marks, 1996).
Richard Elmore from Harvard has spent many years studying the problem of “scaling up” good educational practices. In a recent comment on the US No Child Left Behind Act, and the unrelenting pressure to improve schools without corresponding improvement in teachers’ skills, he states:
In its least desirable face, educational reform can become a kind of conspiracy of ignorance: policymakers mandating results they do not themselves know how to achieve, and educators pretending they do know what to do but revealing through their actions that they don’t.
A feature of the WA Getting it Right Literacy and Numeracy Strategy is the depth of understanding it reveals of what it takes for reform policies penetrate to the level of everyday practice. The GiR-LNS is primarily about enhancing the capacity of existing teachers to meet the needs of students at risk. It is a targeted and coordinated program that directs serious money at a serious problem. The strategy reveals a sophisticated understanding of the complexities of change and the conditions that need to be in place if professional development is to make a difference to student learning outcomes.
Comparing the GiR-LNS with research on effective professional learning
There are many lists of characteristics of effective professional development activities. Few are grounded in rigorous research based on examining the effects of professional learning programs on student learning outcomes. This should not be surprising as the methodological problems in tracing the links between teacher professional development and improved student learning are considerable. There is, however, an emerging synthesis of findings from these studies about the conditions that foster professional learning that relates to improved student learning outcomes, particularly in the core areas of literacy and numeracy.
Hawley & Valli (1999) summarise this research in a list of nine principles for the design of effective professional learning (Table 58). The GiR-LNS will be discussed in relation to each of these principles.
112 ACER Evaluation of the GiR-LNS in WA Schools

Table 58 Principles for the Design of Effective Professional Development (Hawley & Valli,
1999)
1. The content of professional development (PD) focuses on what students are to learn and how to address the different problems students may have in learning the material.
2. Professional development should be based on analyses of the differences between (a) actual student performance and (b) goals and standards for student learning.
3. Professional development should involve teachers in the identification of what they need to learn and in the development of the learning experiences in which they will be involved.
4. Professional development should be primarily school-based and built into the day-to-day work of teaching.
5. Professional development should be organized around collaborative problem solving.
6. Professional development should be continuous and on-going, involving follow-up and support for further learning-including support from sources external to the school that can provide necessary resources and new perspectives.
7. Professional development should incorporate evaluation of multiple sources of information on (a) outcomes for students and (b) the instruction and other processes that are involved in implementing the lessons learned through professional development.
8. Professional development should provide opportunities to gain an understanding of the theory underlying the knowledge and skills being learned.
9. Professional development should be connected to a comprehensive change process focused on improving student learning.
1. Hawley & Valli’s first principle for the design of effective professional learning states that:
113 ACER Evaluation of the GiR-LNS in WA Schools

The content of professional development (PD) focuses on what students are to learn and how to address the different problems students may have in learning the material. The content of professional development is critically important to its effectiveness. While the content varies with the goals of the school, the content of PD should deal directly with what students are expected to learn and the instructional strategies that research and experience have shown are effective.
This characteristic of effective professional learning emphasises the overriding importance of what teachers learn, as opposed to how they learn it. As Kennedy (1998) puts it, the form of professional learning turns out to be less important than the what - the substance or content. This finding challenges the strong emphasis that has been placed for many years on the processes or structures used in professional development activities, such as whether they are planned collaboratively or whether they are one off or long term. It turns out that knowledge is the key when it comes to generative professional learning, particularly when it leads to deeper understanding of the content that students are to learn, the research on how students learn that content, and the nature of the problems different students have in learning that content. The Getting it Right Strategy is firmly based in this kind of content focus. The “what” that occupies most of the GiR professional learning is knowledge about literacy and mathematics, research about how students learn that content and the stages in their developing understanding. Training sessions for Specialist Teachers are rich with opportunities to deepen understanding about literacy and mathematics concepts, and to become more perceptive about the nature of learning difficulties. Specialist Teachers are provided with access to recent research studies. In schools, the Specialist Teachers work with teaching colleagues to find out what the children know and what they need to learn next, then plan how they will work together to bring about that learning. These meetings focus on selecting appropriate learning activities for children that will progress specific skills and understandings in literacy and mathematics. The focus is on strengthening, not supplanting, the professional judgement of the teacher. 2. Hawley and Valli’s second principle of effective professional learning states that:
Professional development should be based on analyses of the differences between actual student performance and goals and standards for student learning. Professional development that is based on analysis of student learning helps teachers close the gap between actual student performance and goals for student learning. Goals for student learning also provide a basis for defining what teachers need to learn and a yardstick for improving professional development.
This principle emphasises the importance of focusing professional learning around data and feedback from teachers’ own students, especially data about where those students are at in relation to where they could be, or should be, in their development. Contrary perhaps to initial concerns about standards for student learning expressed some years ago, research-based standards have proved to be an important lever for fostering productive dialogue about the purposes of education and have given teachers something to be collegial about. Some of the most effective professional learning now comes through activities that help teachers to
114 ACER Evaluation of the GiR-LNS in WA Schools

“moderate” or compare their own students’ work and development with that of other teachers’ students. These activities provide a valuable means of ‘deprivatising’ teachers’ practices and opening up more avenues for feedback and professional accountability. This principle is at the very heart of the GiR-LNS. At almost every meeting between a Specialist Teachers and a classroom teacher, they will be examining the work that students did the previous week in response to the learning activities they chose. Numeracy Specialist Teachers and the classroom teacher will interpret this work, making use of Diagnostic Maps from the First Steps in Mathematics resources, student outcomes levels and Key Understandings. They use this work to sort students into groups according to the difficulties they are having and their phase of development with respect to the mathematical concepts in question. They will then plan appropriate learning activities for the following week to help the children to overcome those difficulties. Literacy Specialist Teachers make extensive use of the Literacy Net, and other tools such as the First Steps Reading Map of Development, or running records, to identify what students know and can do, and what kinds of literacy learning activities will enable the students to move ahead in their learning. The Specialist Teachers and their classroom colleagues draw from their repertoires of practice to identify those activities that will best support the identified needs of the students. Although there is not enough space to document it here, extensive research underpins the diagnoses of student learning and the learning activities to promote better understanding. As an aside, it was common to hear teachers in GiR-LNS schools express considerable surprise about the expertise and confidence they had accumulated in analysing student performance when they met with teachers from non- GiR-LNS schools at ‘Making consistent judgements’ meetings. 3. Hawley and Valli’s third principle links to the previous two principles.
Professional development should involve teachers in the identification of what they need to learn and in the development of the learning experiences in which they will be involved. Adherence to this principle ensures that professional development is relevant. When teachers help design their own learning, they are likely to feel a greater sense of involvement in the professional development experience. Teachers are most likely to use what they learn when professional development is focused on solving problems in their particular contexts.
Together these first three principles stress the importance of making practice, and evidence about practice, the site for professional learning. Practice-based professional learning represents a major shift from traditional views of professional learning based on participation in ‘courses’. This is not to imply that courses and other activities such as workshops, conferences and seminars do not have an important role in supporting professional learning. But these kinds of activities are only the ‘front end’ of the change process. We have known for a long time that the ‘back end’, the implementation stage, of the change process is where the hard work has to be done – supporting teachers as they test new approaches in their own classrooms (Fullan, 1982). Very few professional development strategies put the level of resources into the implementation and follow through stages that the GiR-LNS does.
115
The third principle runs counter to conventional wisdom about professional development in some respects. Getting it Right identifies what teachers need to know and be able to do to
ACER Evaluation of the GiR-LNS in WA Schools
teach literacy and mathematics more effectively, rather than what they might want to know. But what they need to know in the GiR-LNS has a strong foundation in research and proven practice. Spending more time on mathematics may not be the highest priority for some teachers. In fact, they may avoid professional development courses in mathematics and, as some teachers we interviewed admitted, they may cover the mathematics part of the curriculum in a less than enthusiastic manner. With the GiR-LNS, the Specialist Teachers take the knowledge and the professional learning to the teacher where they work and where they can test it out. The GiR strategy deliberately avoids telling teachers how to teach, but it does aim to provide teachers with deeper knowledge about (and interest in) the mathematics they are expected to teach and the means to be more discerning about their student’s learning of that content. As one would expect, teachers varied in their openness to First Steps in Mathematics, but the benefits reported by other teachers and the availability of the Specialist Teacher as an extra resource in planning and teaching usually proved difficult to resist.
Most WA primary school teachers have had some contact with the First Steps Language resources, and this was part of the GiR-LNS training, in combination with more recent research and practice. This included Mapping the Territory (Louden et al 2000); In Teachers’ Hands (Louden, Rohl et al, 2005); the ABC of Two-way Literacy Learning (Malcolm et al, 1997); and The Four Roles of a Literate Person (Luke and Freebody, 1997). The training for the literacy Specialist Teachers extended their knowledge about literacy, and effective teaching approaches, and provided them with a rich repertoire of strategies to share with classroom colleagues in schools. ‘Working in the classroom, I can provide more help with reading strategies – explicit teaching of decoding, monitoring meaning and comprehension, spelling strategies’ (Specialist Teacher).
Many teachers interviewed by the evaluation team in the course of the evaluation made comments along the lines that the GiR-LNS numeracy strategy made them feel more like a ‘professional’. When pressed as to what they meant, they would say they felt more like ‘experts’. They now had knowledge that gave them a stronger basis for interpreting student learning outcomes and deciding what students needed next.
4. Hawley and Valli’s fourth principle states that:
Professional development should be primarily school-based and built into the day-to-day work of teaching.
Teachers learn from their work. Learning how to teach more effectively on the basis of experience requires that such learning be planned for and evaluated. Learning needs arise and should be met in real contexts. Curriculum development, assessment, and decision-making processes are all occasions for learning. When built into these routine practices, PD powerfully addresses real needs.
This principle has been promoted for many years. Over thirty years ago, people were promoting ‘school-based in-service education’, or ‘school-focused professional development’. It can mean little, as in simply transferring passive course modes of professional development into the school on curriculum days. The difficulty is in building opportunities for teachers to be actively engaged as professional learners in the context of their day-to-day work. The Getting it Right Strategy achieves this penetration to the level of practice. However, the availability and the training of the Specialist Teachers are crucial – and the fact that the Specialist Teacher was frequently another teacher from the same school. The ‘shoulder to shoulder’ concept is irresistible to most teachers who do not want to be told what to do, but do want to know anything that helps them help their students learn better. The Specialist
116 ACER Evaluation of the GiR-LNS in WA Schools

Teacher have the kind of in-depth training from the GiR-LNS central team that makes them a valuable resource in selecting appropriate literacy activities to meet specific needs, or negotiating the complex First Steps in Mathematics Resources. The shoulder-to-shoulder notion captures the partnership well - that “we are going to work together”. Teachers in the case study schools placed high value on the opportunity to work with the Specialist Teacher in their school. She’s a bit more knowledgeable, but she is still one of us. It is easy to go to her. We know she is there to change the way we teach maths, but that’s OK. In referring to the work of the literacy Specialist Teacher in her school, one teacher noted that ‘… The Specialist Teacher’s skill and expertise is hugely beneficial I’ve learnt more this year … I now have a deeper understanding of planning for specific kids.
5. Hawley and Valli’s fifth principle relates closely to the fourth:
Professional development should be organized around collaborative problem solving.
Without collaborative problem solving, individual change is possible, but school change is not. Collaborative problem-solving activities allow educators to work together to identify both problems and solutions. Activities may include interdisciplinary teaming, curriculum development and critique, collaborative action research, and study groups.
The GiR-LNS builds on long experience that effective professional learning opportunities arise from collaborative work on authentic teaching tasks and problems. Motivation to engage in this kind of learning increases with evidence of improved student understanding and enjoyment. The fact that there is a brief time span between when Specialist Teacher works with a colleague in a planning meeting, and when they teach together and meet again to examine student work and review the learning activities greatly helps. There is a direct connection between learning, application and feedback.
What becomes possible with the resources that the GiR-LNS makes available is a movement toward the notion of the school as a professional organisation. Professional organisations, as described by Weick and McDaniel (1992), recognise that professional work is not just ‘up front’ work. Professional work requires ‘back room’ work of interpretation to inform decision-making. Work structures in professional organisations recognise that effective teaching requires time during the workday to bring values and expertise to bear on the non-routine problems involved in meeting the learning needs of all students. This principle, like the others, requires strong leadership at the school level to ensure collaborative work is actively supported and that the Specialist Teachers are able to say no to other demands on their time.
6. Hawley and Valli’s sixth research-based principle states that:
Professional development should be continuous and on-going, involving follow-up and support for further learning-including support from sources external to the school that can provide necessary resources and new perspectives.
Adoption and implementation of effective practices requires continued learning. Therefore, the design of professional development must provide time to apply new ideas and, sometimes, must draw on additional outside expertise. Such
117 ACER Evaluation of the GiR-LNS in WA Schools

follow-up and support ensures that professional development contributes to real change and continuous improvement.
This component of professional learning design is probably one of the major strengths of the GiR-LNS for improving learning opportunities for disadvantaged students. Perhaps the greatest weakness of professional learning for teachers is the lack of funding for follow up and support when teachers come to implement the innovation in their own classrooms. This is when the need for support is at its highest if professional learning is to translate into practice.
Effective literacy teaching requires teachers who are deeply knowledgeable about literacy and literacy learning, who have developed extensive repertoires of teaching practices, and who use assessments that measure students’ growth over a range of aspects of literacy. Teachers need to be able to tailor teaching practices to meet the diverse needs of individual children and contexts. They need knowledge about texts and language, and about how to use this knowledge in their teaching in different contexts, for example, in helping students create and respond to the new texts that arise from Information Communication Technologies. The collaborative planning and in-class support provided through the GiR-LNS creates the kind of on-going professional learning, with follow-up and support constantly available, that Hawley and Valli have identified as a key principle.
Teachers were able to describe the impact of this ongoing professional learning on their literacy teaching practices: My teaching has changed … I previously used First Steps outlines, students wrote rough copies and good copies, and I assumed that they knew how we write and why we write. … Now I take one text type, and work on it in depth for a couple of months … I know how to teach the author cycle, and definitely teach more explicitly. … The strategies and the writing process have been critical for me … and I’m confident that it’s the right way. It’s great to have an expert! I have told the principal how much I’m getting from the (GiR-LNS) process … and can provide better learning opportunities. My enjoyment of teaching has increased, and I have more up to date ideas.
First Steps in Mathematics is a complex package of resources for diagnosing students’ developing understanding of mathematics and planning and implementing teaching programs to improve student learning. Left at the school door, or even explained at some central professional development event, it is very unlikely that teachers would use these resources. At first reading, the FSiM material is vast and rather impenetrable. Working shoulder-to-shoulder with the Specialist Teacher turns the learning process into many small achievable steps.
The GiR-LNS has an ambitious vision for mathematics classes. Students will be actively engaged in constructing their own mathematical knowledge. Teachers will know how to tap into this thinking. Teachers will be adept at promoting mathematical thinking and maintaining high quality discussion of mathematical ideas. The need for props like worksheets and textbooks will fade away. This kind of pedagogy will not develop without a deep understanding of mathematics and how children learn mathematics. Neither will it happen without the other key ingredients in acquiring new skills, modelling of the theory and opportunities to practice the ideas yourself and receive feedback. The Specialist Teacher brings these opportunities into the classroom.
Research has indicated it may take two to three years for the kind of significant changes in pedagogy that the GiR-LNS calls for to take hold (Hodges,1996). The GiR-LNS provided funding for schools for two years, and, when the need was demonstrated, for subsequent two-year allocations of the GiR-LNS funding. Schools often used additional funding of their own to extend the number of teachers that Specialist Teachers could work with.
118
ACER Evaluation of the GiR-LNS in WA Schools

7. Hawley and Valli’s seventh research-based principle states that:
Professional development should incorporate evaluation of multiple sources of information on (a) outcomes for students and (b) the instruction and other processes that are involved in implementing the lessons learned through professional development.
When done right, evaluation of professional development yields important lessons for refining professional development. Without such evaluation, future opportunities for teachers to learn may not be productive. Multiple sources of information should be used, including teacher portfolios, observations of teachers, peer evaluations, and student performance. Lessons become most clear when evaluators collect data during different stages of the change process.
A valuable aspect of the GiR-LNS was the realisation that evaluation should be built into the strategy early on. ACER was contracted to conduct the evaluation in mid 2003 fro a period of two years when new cohorts of Specialist Teachers were being trained. Schools remain eligible, on the basis of demonstrated need, for subsequent two-year allocations, and so schools involved in the first cohort continued into a third year during the period of the evaluation, This made it possible to track changes over time and for the evaluation team to feed information back to the GiR-LNS team.
The key questions for the evaluation concerned the impact of the GiR-LNS on teachers’ knowledge and practice, though not on student outcomes. Funding for the evaluation enabled several sources of data about the impact of the strategy to be gathered. These sources included visits to schools to conduct structured classroom observations and interviews with teachers, Specialist Teachers and principals. The ACER team visited twenty schools on three occasions in an attempt to trace changes that could be attributed to the GiR-LNS. Surveys of teachers, Specialist Teachers and principals were also conducted on two occasions – late in 2003 and late in 2004. The surveys included innovative methods for gathering information about the impact of the Strategy on teachers’ knowledge and practice. Teachers were presented with scenarios that called for them to apply what they had learned from the GiR-LNS; for example, about diagnosing students’ skills and understanding, and selecting learning activities to promote key understandings and further learning. Later in the evaluation, it was common for Specialist Teachers and principals to show the evaluation team evidence about improved outcomes in literacy and numeracy that they attributed to the GiR-LNS.
8. Hawley and Valli’s eighth research-based principle states that:
Professional development should provide opportunities to gain an understanding of the theory underlying the knowledge and skills being learned.
Because beliefs filter knowledge and guide behaviour, professional development must address teachers' beliefs, experiences, and habits. Furthermore, specific knowledge and skills that work in one setting, sometimes do not work in others. When teachers have a good understanding of the theory behind particular practices and programs, they can adapt the strategy they learned about to the circumstances in which the teacher is trying to use it.
This principle relates closely to Principle 1 and the central importance of the content that is learned in professional development. Change in practice is more likely to be pervasive when it is informed by theory in which the educator involved has confidence.
119 ACER Evaluation of the GiR-LNS in WA Schools

Reforms such as the implementation of the English and Mathematics Curriculum Frameworks set ambitious goals for many teachers, and require the development of significant understandings of the Frameworks. The training workshops for literacy Specialist Teachers drew extensively on current and recent research into effective literacy teaching and also drew on the work of expert teachers to demonstrate effective practices. In turn, the Specialist Teachers drew on their increased knowledge of theory and research to develop a wide range of innovative teaching practices, which they shared with other Specialist Teachers, and with the teaching colleagues. A central; focus of the training workshops has been on how to select, collect and analyse valid and reliable diagnostic and summative student performance data to inform the teaching and learning cycle, whole school planning and resource allocation.
The introduction of First Steps in Mathematics means that mathematics lessons will be characterised more by lively discussion of significant mathematical ideas. More teachers will help students test their own mathematical constructions and think critically about mathematical procedures. For some teachers, this involves a transformation in their knowledge, beliefs and practices that goes to the heart of their identity as a teacher. It was common for teachers to state in interviews that, “I’ll never teach maths the same way again”, as a result of their work with the Specialist Teacher.
Earlier research, on which First Steps in Mathematics draws (E.g. Carpenter et al. 1993; Fennema, et al 1996) showed the futility of professional development that focused on teaching techniques, as opposed to deepening teachers’ understanding of research about the development of children’s mathematical thinking within particular content domains. Expansion and elaboration of the professional knowledge base is a necessary condition for ‘generative’ or sustained change in teachers’ beliefs and practices (Franke, et al. 1998). Effective and challenging pedagogy depended on knowledge of subject matter and how students learned it.
The GiR-LNS provides Specialist Teachers with 21 days, over two years, of professional development focused on this kind of knowledge. The experience of gaining this knowledge led several Specialist Teachers to say spontaneously that, ‘I’m feeling like a professional for the first time. Specialist Teachers draw on this knowledge in their schools in working with classroom teachers. Collaborative planning meetings, where they may examine student work from the previous week, identify types of misunderstanding and select learning activities appropriate to those students, provide an authentic context in which to link the research to practice. This real-work context brings teachers' current beliefs, experiences, and habits to the fore – a necessary condition for change to happen.
Working shoulder to shoulder with classroom colleagues means the Specialist Teacher can bring useful knowledge to the core teaching tasks of planning and teaching. Practice is deprivatised. In the best situations, Specialist Teachers model new practices frequently and teachers receive plenty of informal feedback as they try the practices out for themselves. This protected environment enables teachers to take risks and experience different types of learning themselves. Teachers see the benefits of what they are learning in their students’ enjoyment of the activities.
9. Hawley and Valli’s ninth research-based principle states that:
Professional development should be integrated with a comprehensive change process focused on improving student learning.
120 ACER Evaluation of the GiR-LNS in WA Schools

Improving teacher capabilities without changing the conditions that influence the opportunities to use these capabilities is often counter-productive. These conditions include time and opportunities to try new practices, adequate funding, technical assistance, and sustained central office follow through. Thus, unless professional development is designed as part of a larger change process, it is not likely to be effective.
The fact that the professional learning that is central to the GiR-LNS is part of a broader reform strategy is clearly a strength of the strategy. Data about student learning outcomes has been used systematically to identify an undeniable need, consistent with planning at all levels of the Department of Education and Training in WA involving careful and deliberate analysis of performance data. The strategy has been planned on several levels, from the centre to the district, the school and the classroom - and over an extended time-period. It has strong political and financial backing from the Minister. The focus on building professional capacity as the means of improving learning outcomes across government schools, and achieving greater parity of outcomes for all groups of students is clear. Funding providing 200 FTE for government schools is substantial. There is a strong and expert central team to provide training for the Specialist Teachers over an extended period of time. Principals engage in customised briefings about the intentions of the GiR-LNS, the role of Specialist Teachers and training in the kind of support they can provide to enable these teachers to work effectively. Collaborative planning time and regular in-class support has become a priority in schools.
Concluding comment
The GiR-LNS is consistent with research about the characteristics of effective designs for professional learning. It illustrates how far we have come over the last thirty years or so since professional development was equated mainly with one-off workshops. It is interesting to draw attention to one interesting aspect of the GiR Strategy that take us beyond Hawley and Valli’s list of principles.
Freeing up expertise: the role of the Specialist Teacher in the GiR-LNS
The role of a well-trained Specialist Teacher is pivotal to the success of the GiR-LNS. Without the Specialist Teacher, it is hard to see how any of the Hawley and Valli principles could be implemented, yet, they make no mention of such a role in their list of conditions that appear to nurture effective professional development.
The Specialist Teacher concept points to a new teacher leadership role that is worth considering as a more permanent component of school staffing. Specialist Teachers do what formally appointed school leaders ought to do, but rarely actually do. They make the concept of an accountable professional community a reality. In being free to work alongside colleagues, the Specialist Teacher makes it more possible for the school to review in depth how well students are being served. The Specialist Teachers act as a bridge between research and the ‘dailiness” of teaching. They help to break down isolation and the persistence of privacy in teaching. While we found variation from school to school in the way the role was implemented, the role itself was greatly valued in every case. It was surprising to see how most specialist teachers, who often came from within the ranks of the staff, were accepted and valued in their new role. When asked how she saw the Specialist Teacher in her school, one teacher expressed the views of many teachers we spoke with: ‘She’s a bit more
121 ACER Evaluation of the GiR-LNS in WA Schools

knowledgeable, but she is still one of us. It is easy to go to her. We know she is there to change the way we teach maths, but that’s OK’.
One way to think about the role of the Specialist Teacher role is as a means of ‘freeing up expertise’ in the school and making it more available. Observation of a Specialist Teacher at work with individual teachers and with year level teams of teachers, assisting with the diagnostic maps, with the Numeracy Net, the rotation of classroom activities and so on, prompts speculation about why this role and this type of leadership has not been a normal part of school staffing before. Teachers think that the most important source of useful ideas for their teaching is other teachers, yet school organisation often makes that expertise inaccessible. It is locked away in the isolation of their own classrooms, or the lack of time to talk about teaching. One thing that young teachers value highly is the chance to see expert teachers at work and to get helpful feedback from them about their own teaching. Greater opportunities for modelling and feedback are key features of the GiR-LNS.
The GiR-LNS puts resources where they are most likely to have an impact on student opportunities to learn. In the UK, consideration has been given to ‘remodelling’ teaching (Collarbone, 2004). Part of the motivation for this arose from studies of teacher workload and stress. Remodelling includes stripping non-teaching clerical and administrative tasks that limit the time and energy that teachers have for teaching. It has also included a very large investment in new teaching assistant roles in schools. The WA GiR-LNS raises the question about whether a more effective approach might be to place extra resources into freeing up expert teachers from time to time to work shoulder to shoulder in the way that the GiR-LNS developers have insisted on. The GiR-LNS legitimates the deprivatisation of teaching. Some teachers found this uncomfortable at first, but by the second year, when it had become obvious that colleagues were gaining a great deal from the partnership, they usually came on board. Most teachers and principals in WA GiR-LNS schools were in no doubt that the strategy was giving them a greater opportunity to improve student learning outcomes than any other strategy they had experienced.
122 ACER Evaluation of the GiR-LNS in WA Schools

10. CONCLUSION
The evidence collected over two years from the evaluation surveys, as well as from observations and interviews in schools, provided a positive picture of the implementation of the Getting it Right - Literacy and Numeracy Strategy in government schools in Western Australia. The model for the GiR-LNS is based on recognition that teachers make the difference to students’ learning, and enables Specialist Teachers to work shoulder-to-shoulder with colleagues in classrooms.
High quality training is provided for all Specialist Teachers through seven three-day workshops spaced across the two years of their appointment. The strength of the model was clearly apparent in the data collected from principals, Specialist Teachers and from their classroom colleagues, through questionnaires that probed all aspects of the implementation of the model.
The focus of the evaluation
The focus of the evaluation of the GiR-LNS, conducted between 2003-2005, was on the impact of the strategy on changes in school practices; on changes in literacy and numeracy classroom teaching practices; and on the development of expertise in teaching literacy and numeracy.
The evaluation involved the schools to which GiR-LNS Specialist Teachers had been appointed in 2001 for 2002-2003, and the schools to which GiR-LNS Specialist Teachers had been appointed in 2002 for 2003-2004. These two groups comprised the first two cohorts of GiR-LNS Specialist Teachers and schools. In 2004, many of the schools in the first cohort received a further two-year allocation of a Specialist Teacher. The extended duration of the evaluation made it possible to gather data on the impact of the strategy on schools that had participated in the GiR-LNS for three years (cohort 1) or two years (cohort 2).
Surveys of principals, Specialist Teachers and their classroom colleagues conducted in 2003 and 2004 provided a substantial set of qualitative data about the operation and impact of the GiR-LNS. The analyses of these surveys are reported in this volume of the report. Case studies of twenty schools, ten for literacy and ten for numeracy are reported and discussed in Volume 2.
Principals reported that the GiR-LNS was connected to other initiatives, including the Curriculum Improvement Program, the Students at Educational Risk program, the Commonwealth Literacy and Numeracy Program, and, to a lesser extent, to the Aboriginal Educational Operational Plan
The Specialist Teachers and their colleagues
The teachers and Specialist Teachers had a variety of teaching experience, but, on average, the classroom teachers who responded to the survey had been in their current school for six years, and had been teaching for a total of 15 years. Most had no other formal roles in the school apart from being a classroom teacher.
Most literacy Specialist Teachers had been teaching for an average of 17 years, and most (80%) had been a member of staff in the school where they became Specialist Teachers for an average of 6 years. The numeracy Specialist Teachers had been teaching for an average of 16
123 ACER Evaluation of the GiR-LNS in WA Schools

years (SD 8 years), and nearly 80% were already members of staff in the school, having taught for an average of six years in that school.
Schools provided resources and support for Specialist Teachers, including a suitable work place, time for collaborative planning, and a budget. The evaluation data showed that the level of resourcing provided by schools increased slightly over the two years.
The training provided to Specialist Teachers was pivotal to the success of the strategy, and the data showed that it was highly valued. When Specialist Teachers were asked about the impact of the GiR-LNS training on their professional knowledge, for a set of 9 items, the mean in 2003 was over 3, on a scale of 4, and in 2004, was at the same level. For example, the mean for literacy Specialist Teachers in cohort 2 in response to a question about the extent to which they now had deeper understanding of literacy content and concepts was 3.61 in 2003 and 3.70 in 2004. The means for numeracy Specialist Teachers responses to a question about the extent to which they now had increased knowledge of how students learn mathematics, the mean for cohort 1 was 3.78 in 2003 and the same in 2004.
Working shoulder to shoulder
The concept of working shoulder to shoulder in classrooms, and in collaboratively identifying students’ learning needs and planning activities that will move them forward, is central to the GiR-LNS. This collaborative work has enhanced on the understandings, confidence and teaching skills of the Specialist Teachers and their colleagues. It has made a definite impact on the capacity of teachers to select, apply and develop diagnostic, formative and summative student assessment strategies and instruments so that they are now better able to focus on individual learning needs in literacy and numeracy.
Principals reported positively on the impact of GiR-LNS on the understandings, confidence and teaching skills of Specialist Teachers and their colleagues. According to their responses, this impact appears to have become stronger as GiR has become more embedded in the school. Specialist Teachers also report positively on the impact of GiR-LNS on their understandings, confidence and teaching skills. As with the data from the principals, there was some evidence that, in some domains, longer engagement with the GiR-LNS was associated with the development of deeper understandings
In working shoulder to shoulder alongside classroom colleagues Specialist Teachers reported that their work was focused on finding out what children know and what they need to learn next, planning appropriate activities to further student understanding, and planning how they will work together to implement those activities. The Specialist teachers acknowledged that while they were collaborating in the classroom, the regular teacher has final responsibility for the progress of all the students in the class. Modelling was widely reported as being a useful strategy. In both 2003 and 2004 literacy and numeracy Specialist Teachers reported that it was one the activities they used most frequently to help teachers build a broader repertoire of strategies. .
I work in the classroom, and model the whole process across a couple of weeks. I think that’s what is powerful, having someone to show teachers how it’s done. I review it with them, we always talk, and I encourage talk between teachers. (Specialist Teacher)
The in-class support that is central to the GiR-LNS is highly valued. Teachers were asked about the activities, for literacy and numeracy, that were used when working collaboratively in the classroom with the Specialist teachers and reported that they had engaged in a wide
124 ACER Evaluation of the GiR-LNS in WA Schools

range of different activities, and rated them as being useful. The following comment captures one teacher’s recognition of the value of the in-class support:
It’s one thing to read about a strategy, but having the Specialist Teacher in the class is a wonderful resource. She gives me feedback , mainly generally, and we jointly review lessons. For example, when I started using the small group meetings with this class, some kids didn’t cope, so we talked to them, and did a goldfish bowl group meeting. (Teacher)
Literacy and numeracy Specialist Teachers identified that three activities were particularly useful in their work in classrooms: modelling a whole lesson for the teacher to observe; modelling a strategy for the teacher to observe for part of the lesson; collaboratively teaching the whole lesson with the classroom teacher.
Working shoulder to shoulder provides many benefits for teachers. It enables Specialist Teachers to bring useful knowledge to the core teaching tasks of planning and teaching. The Specialist Teachers model new practices frequently and teachers receive plenty of informal feedback as they try the practices out for themselves. Teachers see the benefits of what they are learning in their students’ enjoyment of activities. Teaching practice is deprivatised, and teachers take risks and experience different types of learning
Diagnosis, planning and reflection
Specialist Teachers and classroom teachers worked together on a range of activities that enabled them to provide better learning opportunities for their students. The reported working together to diagnose the learning needs of students, to use a range of assessment instruments, and to plan learning activities to address the identified needs of students. They also kept records of students’ progress, selected appropriate teaching activities, and prepared relevant teaching resources. In the course of this work, teachers were led to reflect on their teaching, and to identifying specific areas of literacy/numeracy teaching practice that teachers needed to develop.
The impact of the GiR-LNS
One striking piece of evidence about teachers’ perceptions about the value of the GiR-LNS was provided by responses to a question about the sources of ideas for improvements in teaching over past year or two. Literacy teachers in 2003 reported that GiR-LNS had been the source of 73% these ideas, and in 2004 the percentage of ideas for improving teaching that was attributed to the GiR-LNS was 75%. Numeracy teachers also attributed the source of ideas for enhancing their teaching of mathematics to the GiR:-LNS: 82% in 2003 and 79% in 2004.
Further evidence of the value of the professional learning opportunities provided by the GiR-LNS was garnered by asking principals and teachers to rate the impact of the strategy against the best professional development activity they had ever experienced. Ninety-six per cent of principals in 2003, and 95% of principals in 2004, reported that the GiR-LNS had more or much more impact than other professional development.
Sixty five per cent of literacy teachers in 2003 rated the GiR-LNS as having greater impact than other professional development. This rose to 70% in the 2004 responses to the same question. Almost all numeracy teachers in both 2003 and 2004 reported that the GiR-LNS had had more or much more impact than other professional development.
125 ACER Evaluation of the GiR-LNS in WA Schools

Principals showed high levels of agreement about the impact of the GiR-LNS on judgments about impact of the GiR-LNS on teachers’ increased understanding of the English or Mathematics Curriculum Frameworks, and the benefits for teachers of working with the Specialist Teachers. In both 2003 and 2004 principals indicated very positive judgments about the increase in teachers’ confidence about teaching literacy/numeracy, and about an improvement in teachers’ capacity to diagnose students’ learning needs.
This evaluation was conducted over a period when many of the Specialist Teachers had not completed their training, and were still only learning about new approaches to teaching literacy and numeracy. In the case of numeracy, the Specialist Teachers were still learning about the content of First Steps in Mathematics, and were in the process of introducing this to their colleagues. The evaluation brief did not require the collection of student achievement data that would indicate the impact of the initiative on student learning. However, as the GiR:LNS continues, and more teachers have increased knowledge about literacy and numeracy, and effective teaching strategies, it will be important to look at relevant performance data, such as WALNA results over several years, to identify evidence of the impact on students’ learning. It will also be important to investigate variations in students’ experience, for example, when their teachers are still learning about the content of First Steps in Mathematic. The impact on student learning will need to be investigated over time in order to understand the ultimate effects of the initiative.
Positive outcomes for teaching
The analysis of the survey data indicated that the amount of time teachers spent in planning with the Specialist Teacher was important, but had most impact when their collaborative work was focussed on individual student outcomes and when the school supported a collegial culture. The analysis also showed that the time the classroom teacher spends with the Specialist Teacher was more likely to lead to a positive outcome, if there was a focus on individual students and if the Specialist Teacher provided modelling. Therefore, if the work of the Specialist Teacher is to be effective in terms of teaching and learning outcomes, special attention needs to be given to ensuring that these conditions are in place.
Looking ahead
The success of the GiR-LNS to date has assured the continuation of the strategy. In order to maintain the effectiveness of the strategy, it will be important to maintain key elements that have been crucial to the effectiveness of the strategy. The model of working shoulder to shoulder, the high quality professional development program and the use of student data have combined to create a highly effective strategy for improving learning opportunities for all students, including those at risk of not making progress.
Firstly, there must be continued investment in high quality professional development for the Specialist Teachers. The program of twenty-one days of professional development provided in three-day workshops for Specialist teacher in the first two years of their appointment, the continuing professional development opportunities for Specialist Teachers who continue in the role has been crucial to the success of the GiR-LNS. The content of the program, which has had a strong basis in research about effective teaching of literacy and numeracy has been of major significance in building a considerable body of literacy and numeracy teaching expertise in Western Australian government schools.
126 ACER Evaluation of the GiR-LNS in WA Schools

The work of the GiR-LNS central team, who have brought considerable knowledge and expertise to the strategy has provided ongoing support to Specialist Teachers, and has contributed in very important ways to their capacity to work effectively with classroom colleagues. The maintenance of these levels of support will be important to the future professional learning of Specialist teachers and their colleagues on schools.
Secondly, the model of Specialist Teachers working shoulder to shoulder through regular collaborative planning and in-class support should continue. Clear specification of the nature of the Specialist Teacher role is important to ensure that principals and teachers in schools fully understand the model, and can obtain maximum benefit from it. There are many factors that enable teachers and Specialist Teachers to work shoulder-to-shoulder in effective ways, and there is now a significant number of principals, teachers and Specialist teachers who understand these factors. Briefings for principals of schools that have not previously participated in the strategy will assist in maintaining clear understanding of the nature and benefits of the model. The support of school leadership teams is a crucial factor in the success of the strategy, and will continue to be so.
Finally, the use of performance data in a variety of ways will continue to be of major significance. The use of data to set challenging but realistic targets for improving students’ achievement in literacy or numeracy has been a most useful aspect of the strategy. The process of target setting enables schools to monitor their progress, to celebrate achievement, and to adjust teaching programs where necessary.
The fine-grained use of data by teachers, on an ongoing basis, to identify and diagnose students’; learning needs has been critical to the success of the strategy. Teachers are now able to assess students’ knowledge and skills more effectively, and to plan explicit teaching approaches to address the diversity of students’ needs. Not only have students benefited to a considerable degree from this approach, but teachers’ knowledge and understanding of effective teaching practices has been significantly enhanced, and their repertoires of effective teaching strategies have been extended.
Issues of continuity and sustainability of the GiR:LNS initiative will require investigation in further evaluations. To what extent will the benefits of the initiative be sustained if staff mobility means that some high needs schools will lose teachers who have worked shoulder to shoulder with a Specialist Teacher? What capacity will schools, and the system, have to induct and mentor incoming teachers into ways of working introduced as a result of Getting it Right? How might the lessons from Getting it Right be sustained when schools no longer have a Specialist Teacher? The trained Specialist Teachers constitute a valuable resource for the education system as a whole: how might this resource best be utilised in the long term?
This evaluation of the GiR-LNS model was focused on the early years of schooling. The findings of the evaluation suggest that the model has applicability at all levels of schooling.
127 ACER Evaluation of the GiR-LNS in WA Schools


11. REFERENCES
Carpenter, A., Ansell, E., Franke, M., Fennema, E. & Weisbeck, L. (1993). A study of children’s’ problem solving processes. Journal for Research in Mathematics Education, 24, 428-441.
Collarbone, P. (2004). Touching tomorrow: Remodelling in English Schools. Paper presented at Making Schools Better Conference, August 2004, Melbourne.
Fennema, E., Carpenter, A., Franke, M., Levi, L., Jacobs, V. & Empson, S. (1996). A longitudinal study of learning to use children’s thinking in mathematics instruction. Journal of Research in Mathematics Education, 27, 403-434.
Franke, M., Carpenter, A., Fennema, E., Ansell, E. & Behrend, J. (1998). Understanding teachers’ self-sustaining generative change in the context of professional development. Teaching and Teacher Education, 14(1), 67-80.
Fullan, M. (1982). The meaning of educational change. New York: Teachers College Press.
Hawley, W. & Valli, L. (1999). “The essentials of effective professional development: A new consensus” in Darling-Hammond, Linda and Sykes, Gary, Editors (1999) Teaching as the Learning Profession. Handbook of Policy and Practice, Jossey-Bass Publishers, San Francisco.
Hodges, H.L.B., (1996). Using research to inform practice in urban school: 10 key strategies for success. Educational Policy, 10 (2), 223-252.
Kennedy, M. (1999). Form and substance in mathematics and science professional development. NISE Brief 3 (2) Madison, WI: National Institute for Science Education, University of Wisconsin.
Peterson, P.L., McArthy, S.J. & Elmore, R. (1996). Learning form school restructuring. American Educational Research Journal, 3(1), 119- 154.
Little, J. & McLaughlin. M. (Eds.) (1993). Teachers’ work: Individuals, colleagues and context. New York: Teachers College Press.
Louis, K.S., Kruse, S. & Marks, H., (1996). Schoolwide professional community. In F. M. Newman, (ed.) Authentic achievement: Restructuring schools for intellectual quality. San Francisco: Jossey-Bass.
Weick, K. E. and McDaniel, R.R. (1993). How professional organisations work: Implications for school organisation and management. In T. Sergiovanni and J.H. Moore (Eds), Schooling for tomorrow: Directing reform to issues that count. Allyn & Bacon, Boston, pp.330-355.
129 ACER Evaluation of the GiR-LNS in WA Schools