An environment-adjusted evaluation of local police eectiveness: evidence from a conditional Data...
44
An environment-adjusted evaluation of local police effectiveness: evidence from a conditional Data Envelopment Analysis approach Marijn Verschelde Nicky Rogge HUB RESEARCH PAPERS 2012/09 ECONOMICS & MANAGEMENT FEBRUARI 2012
-
Upload
independent -
Category
Documents
-
view
2 -
download
0
Transcript of An environment-adjusted evaluation of local police eectiveness: evidence from a conditional Data...

An environment-adjusted evaluation of local
police effectiveness: evidence from a conditional Data Envelopment Analysis approach
Marijn Verschelde Nicky Rogge
HUB RESEARCH PAPERS 2012/09
ECONOMICS & MANAGEMENT FEBRUARI 2012

An environment-adjusted evaluation of local police
effectiveness: evidence from a conditional Data
Envelopment Analysis approach∗
Marijn Verschelde† Nicky Rogge‡§
October 5, 2011
Abstract
Hard data alone are not sufficient to evaluate local police effectiveness in the new age
of community policing. Citizens can provide useful feedback regarding strengths and weak-
nesses of police operations. However, citizen satisfaction indicators typically fail to accurately
convey the multidimensional nature of local policing and account for characteristics that are
non-controllable for the local police departments. To construct a measure of perceived ef-
fectiveness of community oriented police corpses that accounts for both multidimensional
aspects of local policing and exogenous influences, this paper proposes the use of a multi-
variate conditional, robust order-m version of a non-parametric Data Envelopment Analysis
approach with no inputs. We show the potentiality of the method by constructing and ana-
lyzing effectiveness indicators of local police corpses in Belgium. The findings suggest that
perceived police effectiveness is significantly conditioned by the demographic and socioeco-
nomic environment.
Keywords:Local police effectiveness, Citizen survey, Data envelopment analysis, Conditional
efficiency
JEL classification: C14, D24, H11
∗We sincerely thank the participants of the XII EWEPA congress in Verona, Sietse Bracke, Klaas Mulier, Glenn Rayp
and Koen Schoors for their helpful suggestions and insightful comments on an earlier draft of this paper. Marijn Verschelde
acknowledges financial support from the Fund for Scientific Research Flanders (FWO-Vlaanderen).†Corresponding author, SHERPPA- Department of General Economics, Universiteit Gent, Tweekerkenstraat 2, 9000
Gent (Belgium), e-mail: [email protected], Tel: +32(0)9 264 35 03, Fax: +32(0)9 264 35 99.‡Centre for Economics and Management (CEM), Hogeschool-Universiteit Brussel, Stormstraat 2, 1000 Brussels (Belgium),
e-mail: [email protected], Tel: +32(0)2 608 88 34, Fax: +32(0)2 217 64 64.§Faculty of Business and Economics, Katholieke Universiteit Leuven, Naamsestraat 69, 3000 Leuven (Belgium).
1
1 Introduction
With institutional budgets being tight and resources being scarce, the mainly ‘laissez-
faire’ approach towards police authorities declined considerably in the last decades. Like in
other public sectors, there has been an increasing movement towards accountability. Police
departments are more and more subject to performance evaluations. A good performance
requires that a police department provides services in an efficient (at the least costs) and
effective (conform the objectives) manner.
The efficiency aspect, that is, providing police services at the least costs, has been subject
of multiple studies in the Operations Research literature. Several studies have embraced
the DEA-framework and employed it to study the efficiency of police departments, both at
the level of local police districts and at higher levels (e.g., regions and countries). Examples
include Drake and Simper (2002, 2003, 2004, 2005), Nyhan and Martin (1999), Sun (2002),
Thanassoulis (1995) and Wu et al. (2010).
However, up to now, the effectiveness aspect of policing, i.e., providing services that fit the
purposes, has remained largely unexplored by the Operations Research literature. Effective
policing requires first the support and recognition of the general public (see, among other
things, the “police by consent” idea of Carter (2002)). Second, given the rapidly changing
society, effective policing is found to require that the police organization continuously
seeks to redefine its role in the community and their relationship with the community’s
residents (‘community policing’ idea as in Beck et al. (1999)). In doing so, police officials
and policy makers should ask themselves what lives in the community and what actions
local police corpses could take to make police services more responsive to the needs and
the expectations of the police (that is, transform the local police organization so that
more attention and resources are being dedicated to the relevant functions or activities)
(Hesketh, 1992). Citizens can thus be of crucial use to identify problems in the community
and provide useful feedback regarding strengths and weaknesses with police operations.
Obviously, hard data such as e.g. crime rates and clear up rates are not sufficient to
estimate effectiveness of community oriented police corpses. Subjective citizen satisfaction
data are needed.
A large policing literature is devoted to police satisfaction. However, policing literature
lacks a well-established evaluation methodology to compare the effectiveness of police forces
2

that have multiple tasks and are operating in a heterogeneous environment. As noted
by Schafer et al. (2003, p.442), for instance, a consistent approach to measure police
effectiveness based on citizen surveys has yet to emerge. Existing evaluation practices are
frequently being criticized as overly simplistic and incapable of overcoming some crucial
(and sensitive) issues.
One such an issue is that previous literature (e.g., Webb and Marshall, 1995; Worrall, 1999)
traditionally viewed police effectiveness (and the public’s perceptions of police effectiveness)
as a one-dimensional construct (that is, are citizens generally satisfied with the police
services?), whereas given the multiple tasks of police, it is imperative to consider police
effectiveness as multidimensional. However, developing a multidimensional measure of
police effectiveness is not straightforward. One important question is, for instance, how
one should weight and aggregate citizens’ perceptions on the various police functions into
one overall effectiveness score. This raises the question of the importance of each police
task. Is it legitimate to assign equal weights to the various aspects of policing, thereby
implicitly assuming that all police tasks have an equal importance? Also, is it legitimate
to apply a uniform set of weights to all police departments? The knowledge that each
police department has to cope with own particular problems and specificities, seems to
suggest the opposite. That is, a more flexible weighting approach, one that allows some
specialization in the evaluation of the police effectiveness, is warranted.
Second, numerous studies confirm that the police do not operate in vacuum but in an
environment influenced by multiple actors and factors. As this environment is outside
the control of the police, one should correct for its influences in the evaluation of police
effectiveness. If not, evaluations are very likely to be considered as unfair. Not completely
without reason, disillusioned police departments might argue that they should be evaluated
only on those aspects for which they can be held accountable and not faulted for being
less effective due to less favourable operating environments. However, although several
studies illustrated the impact of the operating environment on citizen perceptions of police
effectiveness (see Section 2 for a brief overview), the idea of actually correcting evaluations
of police effectiveness based on citizen questionnaire data for environmental variables has
remained largely unpursued in the literature.
This paper contributes to the literature in that it proposes a well-established Operation
3

Research framework for evaluating police effectiveness based on citizen survey data that
addresses the above-stated issues. In particular, we propose an adjusted version of the
Data Envelopment Analysis (DEA) methodology for constructing scores of local police ef-
fectiveness which are multidimensional and environment-adjusted. This so-called ‘Benefit-
of-the-Doubt’ (BoD) model (after Melyn and Moesen, 1991) exploits the characteristics of
the linear programming method DEA, namely that it, thanks to its linear programming
formulation, allows for an endogenous weighting of the citizen perceptions on the multiple
aspects of policing into an overall effectiveness score. We design the BoD-model (using
insights from the robust and conditional order-m DEA-framework proposed by Cazals et
al. (2002), Daraio and Simar (2005), (2007a), (2007b), Badin et al. (2010a) and (2010b))
such that it provides multidimensional scores of police effectiveness which are (1) robust to
the influences of local police departments with atypical effectiveness performances in the
data (if present), (2) corrected for differences in the operating environments among police
departments, and (3) allowing for non-parametric statistical inference and a visualization
of the relationships between the environmental characteristics and the estimate of police
effectiveness.
To illustrate the practical usefulness of the approach, we apply the model to citizen survey
data on Belgian local police departments. Since the wake of the thorough police reform in
1998 (the so-called Octopus Agreement signed by eight political parties and, consequen-
tially, the Law on an Integrated Police Corps 07/12/1998), community oriented policing is
top priority of local police zones. Consequently, large (financial) effort is made to construct
detailed and representative data on citizen satisfaction with the (local) police authorities.
The combination of the high policy relevance and data of exceptional quality makes Bel-
gium an interesting place to investigate effectiveness of community oriented local police
corpses.
The Belgian police is structured on two levels: the federal level and the local level. The
federal police carry out missions on the whole Belgian territory (they operate under the
supervision of the Minister of Home Affairs and the Minister of Justice), that is, supra
local police missions which, because of their extent, organization or consequences, cross
the borders of a zone, a district or a country. Examples of such missions are combating
organized crime, drug trafficking, investigating murder cases, etc. The local police corpses
operate in a local police zone, that is, a group of (small) municipalities, one (medium
4

to large) municipality/city, or a subregion of a large city. Their task mainly consists in
providing citizens with community oriented policing. It is stipulated by the Royal Decree
17/09/2001 (’Koninklijk Besluit’ in Dutch or KB) that local police departments should
carry out services and tasks that are related to the following 6 basic police functions:
‘Community policing’, ‘Reception of citizens’, ‘Intervention’, ‘Aid to victims’, ‘Local in-
vestigations and detections’, and ‘Maintenance of public order’.1 All six basic functions
are believed to be very important to the community oriented policing and, as such, they
should be considered in the effectiveness evaluations of local police departments. In this
study, the focus is exclusively on the effectiveness of the community oriented local police
departments.2
This paper is organized as follows. The next section provides a brief literature review. The
focus is on the studies that examined the relationship between the operating environment
of the police and the citizen perceptions of the police effectiveness. In a third section, we
discuss the citizen survey data to measure the police effectiveness for a sample of local po-
lice departments in Belgium. Section 4 presents the basic BoD-methodology as well as its
robust and conditional extension. In section 5, we present the robust estimates of the mul-
tidimensional and environment-adjusted effectiveness scores for our sample of local police
departments in Belgium. Particular attention is given to how these effectiveness scores are
related to a series of environmental variables characterizing the operating environment of
the local police departments. No doubt, this provides information that is useful for police
management and policy makers. In a final section, we make some concluding remarks and
provide some directions for further research.
2 Citizen perceptions and the environment
A growing body of research attempts at measuring and explaining the public’s views and
attitudes toward the police. As a background to this study, some of the findings of pre-
vious studies on the relationship between citizen perceptions of police effectiveness and
1Only recently, the Royal Decree of 16/10/2009 added a 7th basic police function ‘Traffic’ (which was
formerly largely included in the sixth basic function ’Maintenance of public order’). As the studied dataset
only includes data from before 2009, we still employ the structure of the 6 basic police functions.2For a more comprehensive presentation of the police landscape in Belgium, see also www.polfed-
fedpol.be.
5

environmental characteristics are summarized. We mainly focus on the influences of the
demographic, socioeconomic, and neighborhood characteristics for which we correct in our
analysis later on.
Demographic characteristics
Regarding the link between citizen perception of the local police effectiveness and the
demographics of the municipality (or municipalities) in which the police is operational,
it is important to note that several studies found that younger citizens are overall rather
negative about the police as compared to older citizens (e.g., Sullivan et al., 1987; Scaglion
and Condon, 1980; Gaines et al., 1997). There are several possible explanations for this
link. One of the explanations is that younger citizens have a higher probability of having
negative contacts and experiences with the police and, therefore, are more inclined to be
overall negative about the police (Sullivan et al., 1987). Another possible explanation by
Gaines et al. (1997) is that younger citizens value more their individual freedom and that
this may partially explain why they are less positive about police. Somewhat related to
this are the results of other studies that older people are more likely to express positive
attitudes toward the police (Zevitz and Rettammel, 1990; and Worrall, 1999). Examples
of other studies confirming the overall positive relationship between the age of the citizen
and the perception of the police and the police services, are Murty et al. (1990), Reisig
and Correia (1997), and Webb and Marshall (1995).
Socioeconomic characteristics
Examples of environmental characteristics that are related to the socioeconomic status of
the citizens living in the municipality of the local police department include the (un)employment
rate, the percentage of the resided population in the local police zone that is beneficiary
of a subsistence income (hereafter the ‘Subsistence Income Rate’), the median or average
income, index of socioeconomic status (SES), concentrated economic disadvantage (CED),
etc. With respect to the association between income and perception of the police, results
are mixed. That is, whereas some studies (e.g., Marenin, 1983; Scaglion and Condon,
1980, Cao et al., 1996) found that income is positively related to the citizens’ perceptions
of police effectiveness, other studies suggested that the income is insignificantly or only
weakly related (e.g., Cao et al., 1996; Worrall, 1999). Some studies also found more mixed
results with income being related to some tasks of policing but not to other tasks (e.g.,
6

Brandl et al., 1997). Bridenball and Jesilow (2008) found that an index of concentrated
economic disadvantage was not related to the citizen perceptions once other environmental
characteristics were accounted for in the models.
Hwang et al. (2005) reported that socioeconomic status was negatively associated with the
citizen perceptions of the police. That is, citizens in lower socioeconomic groups had more
positive perceptions of the police and the police services compared to citizens in higher
socioeconomic groups (however, this results was only significant in the rural areas). As a
possible explanation for this inverse relationship, Hwang et al. (2005) argued that citizens
with higher socioeconomic status may have higher expectations of the police which makes
that they are more critical when it comes to evaluating the effectiveness of the police
services.
Concerning the association between the (un)employment rate and the citizen perceptions of
police and police services, the beliefs are that a higher employment rate benefits the overall
citizen perception of the police and the police services. The argument is that a higher
employment rate means that a higher percentage of individuals is participating in the
labour market and making themselves (feel) useful. The opposite, a higher unemployment
rate in a municipality means that there are more people not participating in the labour
market, thus, a higher number of citizens being dependent on other types of income such
as unemployment benefits or subsistence income. A higher unemployment rate also means
that there are more citizens with a higher potential for entering into crime. All of this
is related negatively to the citizen perception of the police and police effectiveness. Cao
et al. (1998), however, found that employment is not statistically related to the citizen
perceptions of the police.
Neighbourhood-municipality characteristics
Several studies (e.g., Reisig and Parks, 2000; Sampson and Jeglum-Bartusch, 1998), have
found that citizen perception of the police may differ from neighbourhood to neighbourhood
or from municipality to municipality. Examples of environmental characteristics related to
the neighbourhood/municipality are whether it considers a small to mid-sized municipality
or a large to very large municipality such as an urban city (i.e., the typology of the munic-
ipality) and the population density of the municipality. With respect to the typology of
the municipality, Zamble and Annesley (1987) and Hwang et al. (2005) found that citizens
7

living in smaller municipalities are more likely to have a more positive perception of the
police and police effectiveness than the citizens living in larger municipalities. Hwang et al.
(2005) also showed that residents of municipalities situated in rural areas are in general
more positive of the police compared to citizens living in municipalities situated in small
to mid-sized cities and large urban cities. Somewhat related, Kusow et al. (1997) indicated
that residents of suburbs tend to have a more positive perception and attitude toward the
police than urban residents.
Before concluding this section, it is important to note that the list of environmental char-
acteristics as presented above is non-exhaustive. There are also other demographic, so-
cioeconomic, and neighbourhood characteristics which have been found to be related to
the citizen perception of police and police effectiveness. Examples include the education
level of the citizens living in the municipality (with well-educated citizens typically having
a more positive perception of police, see, e.g., Jesilow and Meyer, 2001 and Murphy and
Worrall, 1999), the ethnicity of the residents in the municipality (with ethnic minorities
being more likely to have a less positive perception of police, see, for instance, Kusow et al.,
1997, Reisig and Parks, 2000, Worrall, 1999, and Schafer et al., 2003), and the crime rate
of the municipality (with the residents of high-crime neighbourhoods and municipalities
being less positive of the police, see, e.g., Schafer et al., 2003, Reisig and Correia, 1997,
Reisig and Park, 2000).
Several studies also argued that the personal contact that citizens had with the police is a
significant determinant of their perception of the police and the police services (e.g., Schafer
et al., 2003; Scaglion and Condon, 1980; Murty et al., 1990; and Webb and Marshall, 1995).
In particular, it was found that the nature, the frequency, and the satisfaction with the
contact that citizens had with the police, may shape their perception of and attitude
toward the police (Schafer et al., 2003). Regarding the nature of the contact, for instance,
it appears that citizens who initiated the contact with the police (that is, voluntary contact)
typically have a more positive perception of the police than citizens who had involuntarily
contact with the police (Murty et al., 1990 and Webb and Marshall, 1995).
However, our non-exhaustive list of environmental variables captures the operating envi-
ronment quite well. First, in Belgium, education and ethnicity are highly related with the
observed socioeconomic and demographic variables. Consequently, we capture the main
8

part of the variation of education and ethnicity at the police department level. Second, a
study of the relationship between police effectiveness and the environmental characteris-
tic ‘crime rate’ is an intricate matter as there are potential endogeneity problems arising
from reverse causality (with the ‘crime rate’ in the local police zone being partially an
outcome of local police effectiveness and police effectiveness being potentially influenced
by (citizens perceptions of) crime). Inclusion of crime rate as an environmental variable
in our BoD-model is thus not advisable. Third, as police contact is a result of policing
policy, ‘police contact’ is discretionary and should not be controlled for in evaluations of
local police departments.
3 Data
We use data on citizen satisfaction with the local police corpses in Belgium that is col-
lected from the Security Monitor (“Veiligheidsmonitor” in Dutch). This Security Monitor
is organized biannually by a project group of the service group Policy Information of the
Directorate of the National Database (‘de Directie van de Nationale Gegevensbank’ in
Dutch) in assignment of the Minister of Home Affairs.3 More precisely, we use data on the
citizen perceptions of local police effectiveness as collected from the last four evaluation
rounds, i.e., the Security Monitor administered in the years 2002, 2004, 2006, and 2008.
That is, the data collected in these four Security Monitors are pooled into one dataset. In
these evaluation rounds, telephone interviews were conducted in respectively 43, 64, 66,
and 36 local police departments. In total 84 different police departments (of a total of
196 police departments) are present in the data set, so some police departments took part
multiple times in several Security Monitors. It concerns the police zones with one or more
municipalities with a safety and prevention contract. The target population were citizens
of 15 years and older that are resided in the examined local police zones. Random samples
were drawn at the level of the individual municipality or police zone using the computer-
assisted telephone interview system (CATI) with random digit dialing (from a database of
3The purpose of the Security Monitor is however broader than collecting data on the citizen satisfaction
with the local police authorities. It concerns a large-scale population survey in which several safety-related
topics such as victimization, neighbourhood problems, feelings of insecurity, assessments of police contact
inside and outside the context of victimization, and assessments of police effectiveness both at the federal
level and the level of the municipality and/or the local police zone, etc. are treated.
9

fixed telephone lines). To get an optimal coverage of the Belgian population of 15 years
and older (and, thus, stated differently, to prevent that some respondent category is under-
or over-represented in the sample), respondents were re-weighted (post-stratification) ac-
cording to a weight that varies depending on the respondent type (in particular, the age
and the gender of the respondent).4
To measure the perceptions of the citizens on the local police effectiveness on the six basic
functions, 21 questionnaire items are selected from the Security monitor (i.e., community
policing (6 items), reception of citizens (3 items), intervention (5 items), aid to victims (1
item), local investigations and detections (4 items), and maintenance of public order (3
items)). For an overview, we refer to Figure 1. All items use Likert scales to measure the
citizen satisfaction. The individual citizen rates on the items are aggregated at the level
of the local police department (the unit of analysis) by computing the relative number of
citizens that rated the performance of the local police department positively. For instance,
when a Likert scale ranging from 1 (Very satisfied) to a rating of 5 (Very dissatisfied) is
used to measure the citizen perceptions, the relative number of respondents that rated
the item with 1 (Very satisfied) and 2 (Satisfied) is computed. For items that use a Likert
scale ranging from a rating of 1 (Very good) to 4 (Very bad), the percentage of respondents
with positive perceptions equals the relative number of citizens that rated the local police
department with 1 (Very good) or 2 (Good).5 The data on the 21 items are first aggregated
as relative scores at the level of the six basic police functions using a standard BoD-model
(see next section). The summary statistics of the relative citizen satisfaction scores at the
level of the six basic police functions can be found in the upper part of Table 1.6
4Additional studies (see Vandersmissen et al. (2008) and De Waele et al. (2008)) examined the non-
coverage and non-response in the dataset and found that particularly young citizens (age between 15-24
years and 24-34 years) are under-represented in the dataset of the Security Monitor whereas older citizens
(age between 50-64 years and 65 years-plus) are over-presented.5For a more comprehensive presentation of the 21 questionnaire items, the Likert scales used to measure
citizen rates on the items and the methodology for aggregating the individual respondent perceptions at
the level of the local police corpses, we refer to Rogge and Verschelde (2011).6We also considered the use of an arithmetic average or first principal component. However, the use
of an arithmetic average requires the imposition of uniform weighting, which we try to avoid. To use the
first principal component as aggregate, correlation between sub-items should be high to avoid internal
inconsistency. For some basic police functions (i.e., community policing, maintenance of public order), this
was clearly not the case.
10

Next to the questionnaire data as collected from the Security Monitor, we also use data on
environmental characteristics of the local police departments from the Directorate-general
Statistics and Economic Information.7 In particular, we include data on the region in
which the police department is located, the year in which the data were collected, the
welfare index of the local police zone, the Subsistence Income Rate, the green pressure in
the police zone, and the typology of the municipality (or group of municipalities) in which
the local police department is active. All of these are environmental characteristics in the
sense that they are non-controllable to the local police department but nevertheless may
influence the opportunities of the local police department to operate effectively.
The first background characteristic ‘Region’ indicates whether the local police department
is operating in Flanders, the Brussels region, or Wallonia (the three main regions of Bel-
gium). The variable ‘Year (02-04-06-08)’ indicates whether the data are from the Security
Monitor administered in 2002, 2004, 2006, or 2008. The ‘welfare index’ is an important
indicator of the socioeconomic status of the local police zone. It compares the average
fiscal income of the citizens in a certain municipality compared to the average income of
citizens in Belgium (the latter is set equal to 100). Thus, a municipality with a welfare in-
dex below (higher than) 100, resides citizens with an average income that is lower (higher)
than the income of the average citizen in Belgium. The variable ‘Subsistence Income Rate’
computes the percentage of citizens in the police zone with an income below the minimum
standard that receive an income allowance. The variables ‘Green pressure’ and ‘Grey pres-
sure’ are demographic indicators that measure per municipality the ratio of respectively
young citizens (age 0-19 years) and older citizens (aged 60-plus) to the so-called productive
population (i.e., citizens with an age between 20-59 years).
Based on the typology and the population in the municipality (municipalities) in the police
zone, police zones were classified in five categories ( ‘Typology of municipality’). Accord-
ing to the standard typology scheme, there are five types of municipalities: municipalities
of type 1 ‘(large) city’, municipalities of type 2 ‘large, regional cities and municipalities
in Brussels (i.e., morphologically strongly urbanized and highly equipped municipalities)’,
municipalities of type 3 ‘metropolitan municipalities and highly equipped small cities’, mu-
nicipalities of type 4 ‘moderately to weakly equipped small city and strongly morphologi-
cally urbanized municipalities’, and municipalities of type 5 ‘morphologically moderately
7Data obtained via statbel.fgov.be and aps.vlaanderen.be/lokaal/lokale statistieken.
11

and weakly urbanized municipalities’.8,9 The summary statistics of the environmental char-
acteristics are displayed in the lower part of Table 1. A visualization of the environmental
characteristics ‘Green pressure’, ‘Subsistence Income Rate’, ‘Welfare index’, and ‘Typology
of municipality’ for the local police departments evaluated in the Security Monitor 2006
can be found in Figure 2.
< Table 1 about here >
< Figure 1 about here >
< Figure 2 about here >
4 Methodology
4.1 The ‘Benefit-of-the-Doubt’ (BoD) model
To estimate the multidimensional measure of local police effectiveness based on the cit-
izen questionnaire rates, we advocate a construction methodology that is rooted in the
popular Data Envelopment Analysis (DEA, hereafter) method. This DEA-method is a
non-parametric efficiency measurement technique originally developed by Farrell (1957)
and put into practice by Charnes et al. (1978), to measure the relative efficiency perfor-
mance of a set of similar entities (organizations, production lines, local police departments,
etc.) which employ (possibly) multiple inputs to produce (possibly) multiple outputs in
complex operating settings typically characterized by no reliable information on the prices
of inputs and outputs and/or no (exact) knowledge about the ‘functional form’ of the
production or cost function.10
The specially tailored version of the DEA-model, the so-called ‘Benefit-of-the-Doubt’ (BoD)
model (after Melyn and Moesen, 1991), that is used here to construct a multidimensional
8The typology of the municipalities was designed by the General Police Support Service and the
Police Service Policy Support (Algemene Politie Steundienst and dienst Politiebeleidsondersteuning, or
APSD/PBO, in Dutch) and is used in various police statistics since 1996.9For police zones with more than one municipality, the municipality with the highest level of urbaniza-
tion determines the category for the police zone (provided that more than 35% of the inhabitants of the
police zone are resident in that municipality).10Readers not familiar with DEA are referred to, amongst others, Cooper et al. (2004) and Fried et al.
(2008)
12

measure of local police effectiveness differs from the traditional DEA-model in that it only
looks at the output dimension without explicitly taking into account the input dimension.
Formally, in the DEA-setting, all evaluated entities (i.e., the local police departments) are
assumed to have a ‘dummy input’ equal to one.11 The application at hand consists of six
outputs, i.e., the six basic functions of the local police departments as discussed in the
previous section.
The conceptual starting point of the BoD-model is that in the aggregation of the outputs
into one composite output score, in the absence of detailed information on the true weights
for the outputs, information on the weights can be retrieved from the observed data them-
selves. The BoD-model determines the weights for the outputs endogenously by looking a
priori at the observed performance data. More precisely, the basic idea of the BoD-model
is to put the data of the evaluated entity in relative perspective to the performance data of
all entities in the sample set, and look for the outputs of relative strength and of relative
weakness.
The notion of the ‘Benefit-of-the-Doubt’ enters into the interpretations of the relative
performances and the specification of the weights that follow from these interpretations.
Particularly, outputs on which the evaluated local police department performs relatively
well (i.e., a relatively high number of citizens rating the performance of the evaluated
local police department positively) are interpreted as basic police functions in which the
local police department is relatively good (i.e., a relative strength in the functioning of
that department) or as basic police functions which are considered to be relatively more
important by that department (thus, with the department assigning more time, resources,
and effort to it). Given this, the effectiveness realized in these basic police functions should
weigh more heavily in the evaluated department’s overall effectiveness score. Therefore, the
BoD-model assigns a high endogenous weight to such basic police functions. The opposite
reasoning holds in the interpretation of outputs on which only a relatively small number
of citizens rated the performance of the evaluated local police department positively. Such
outputs are interpreted by the BoD-model as police functions of relative weakness in the
11The intuitive interpretation (see, amongst others, Cherchye et al., 2007) for this exclusive focus on
outputs in the BoD-model may be obtained by simply looking upon this specific version of the DEA-model
as a tool for summarizing performances in the several components of the evaluated phenomenon, without
explicit reference to the inputs that are used for achieving such performances.
13

overall performance of the evaluated local police department or as police functions that the
evaluated department considers to be relatively less important in its task. Correspondingly,
the BoD-model assigns low endogenous weights to these output criteria. In essence, this
means that the BoD-model grants each local police department the benefit-of-the-doubt
when it comes to assigning weights in the composition of its score of overall effectiveness.
The resulting BoD-weights wc,i are chosen in such a way as to maximize the evaluated
department’s effectiveness score Ec. In formal notations:
Ec = maxwc,1,...,wc,q
q∑i=1
wc,iy+c,i (1)
s.t.q∑i=1
wc,iy+j,i ≤ 1 ∀j = 1, ..., c, ..., n (1a)
wc,i ≥ 0 ∀i = 1, ..., q (1b)
In this notation, n the number of local police departments in the dataset Υ (i.e.,n=209);
Ec the BoD-estimated score of local police effectiveness for the local police department c;
q the number of basic police functions on which the local police departments are evaluated
(here, q=6); y+c,i the citizen satisfaction score of police department c on the basic police
function i; y+j,i the citizen satisfaction score of police department j (j = 1, ..., c, ..., n) on the
basic police task i; and wc,i the optimal BoD-weight assigned to the basic police function
i for the local police department under evaluation.
Note the two constraints in the BoD-model. The restriction (1a) is a normalization con-
straint which imposes that when applying the optimal BoD-weights of the evaluated local
police department to all other departments in the sample set Υ, the overall effectiveness
scores of all departments should be smaller than or equal to one. Thus, it holds that
0 ≤ Ec ≤ 1. In the interpretation of the effectiveness scores Ec, higher scores indicate
better relative effectiveness performances. In addition, when the evaluated local police de-
partment is evaluated with Ec < 1, this indicates that there is at least one (and probably
more than one) other police department in the sample set Υ that realizes a better overall
effectiveness score even when applying the evaluated police department’s most favourable
weights wc,i (i.e., weights which are probably less favourable than the own optimal weights).
14

In other words, based on the observed performances in the dataset, there is still room for
improvement. If the evaluated local police department obtains the maximal score of one
(i.e.,Ec = 1), it is not outperformed by other departments in the dataset when applying
his/her best possible weights wc,i. That is, the evaluated police department is indicated
as its own benchmark. The non-negativity constraint (1b) limits the optimal weights wc,i
to be non-negative. Consequently, an increase in the citizens rating of the local police
department on a particular basic police function, ceteris paribus, will not result in a lower
effectiveness score.
Admittedly, some may criticize the large flexibility in basic BoD-weighting since it could
possibly lead to unfortunate and/or misleading evaluation findings. This criticism is not
completely unfounded: the basic, unrestricted BoD-model as in (1)-(1b) may assign zero
weights and/or unrealistically high weights to one or multiple basic functionalities without
violating the two aforementioned restrictions. As such, the basic BoD-model can ignore
and/or overemphasize one or more of the basic police functions in the composition of
the overall effectiveness score Ec (thus allowing for a too high (undesirable) degree of
“specialization” in the evaluation of the services of the local police departments).
This problem of improper optimal BoD-weights has already been discussed extensively in
the literature (see Thanassoulis et al. (2004) and Cherchye et al. (2007) for an elaborate
discussion of this topic). It has been argued that the problem can be largely alleviated by
consulting a group of stakeholders (e.g., the interviewed police officers, police chiefs, etc.)
on what they believe are proper values for the weights, and incorporating their opinions into
the BoD-model by adding weight restrictions. The idea is then to enforce the installation
of proper weights and let subsidiarity in BoD-weighting only play within the confines set
by the stakeholders.
With an eye towards practical usage, we consulted the parties most involved in the process
of local policing, the chiefs of the local police departments, to gain knowledge on what they
think are appropriate importance weights for the six basic functionalities of local policing.
The police chiefs of a large majority of the local police departments in Belgium were
consulted by email and requested to fill out a questionnaire.12 Each police chief was asked
12Another possibility would be to consult the citizens and include their opinions on the appropriate
importance for the police tasks (see, for instance, Webb and Katz, 1997).
15

to distribute a total of 100 points over the six basic functionalities of local policing, thereby
allocating more points to the functionalities which he/she regards as most important. A
total of 63 police chiefs participated in the study (approximately 1/3 of the contacted police
chiefs). Summary information about the weights so-obtained (i.e., average, minimum, and
maximum weights) is provided in Table 2.
To integrate information on the opinions of the police chiefs of the local police departments
into the BoD-model, we opted for using proportional virtual weight restrictions.13 This
type of weight constraint imposes that the BoD-model can choose the optimal importance
of the policing functions freely within a range specified by a lower bound value αi and an
upper bound value βi.14 Formally, this involves adding the following weight constraints to
the standard BoD-model:
αi ≤wc,iy
+c,i∑q
i=1wc,iy+c,i
≤ βi ∀i = 1, ..., q (1c)
In the application below, the lower bound and upper bound value are set equal to the
minimum and maximum weight specified by the consulted police chiefs. For instance, for
the basic police function ’Community work’ this involves setting αi = 0.03 and βi = 0.40.
< Table 2 about here >
4.2 The robust and conditional BoD-model
The BoD-model as in (1)-(1b) still suffers from two important drawbacks. Firstly, due to
the deterministic nature of the BoD-model, estimated scores of local police effectiveness are
sensitive to the influences of outliers. The practical implications of this drawback can be far-
reaching. Evaluated local police departments are naturally sensitive about being compared
13Note, however, that other types of weight restrictions have been proposed in the DEA/BoD-literature
(for an overview, see, among others, Thanassoulis et al. (2004) and Cherchye et al. (2007)).14One could interpret these confines as indications of the ”zones of disagreement”: stakeholders agree
on that optimal weights should be situated in this zone (that is, there is a consensus among stakeholders
on the lower and upper bound value that is appropriate for the optimal weight), however, they are unable
to reach an agreement on the exact value of the weight (the zone between the confines thus remains a zone
of disagreement). Tighter weight bounds (that is, upper and lower weight bound values are situated more
closely to each other) then ceteris paribus reflect more agreement regarding the appropriate weight values
for the questionnaire items (i.e., the zones of disagreement become smaller).
16

with the performances of other corpses (unless they compare well, of course). This concern
is particularly acute when there is the danger of being compared against departments
with outstanding evaluation outcomes due to other reasons than a high police effectiveness
(as measured by citizen satisfaction in the community). Secondly, estimated effectiveness
scores are not corrected for differences in the operating environments of the local police
departments. As discussed in the introductory section, both the academic literature and the
experiences of the local police men and women indicate that the operation environment
can considerably influence the local police departments’ opportunities to function in an
effective manner (and, thus, to realize a relatively high Ec). Using insights of Cazals et al.
(2002), Daraio and Simar (2005, 2007a,b), Badin et al. (2010a) and (2010b), we tailor the
BoD-model such that it no longer suffers from these limitations. We proceed in two steps.
In a first step, we adjust the BoD-model so as to make it robust to the influences of local
police departments with atypical performances in the data (if present in the sample set).
To do so, we follow the insights of the order-m DEA approach of Cazals et al. (2002). The
essential idea of this approach is to not consider the full sample set of n police departments
in the definition of the effectiveness scores Ec, as in the traditional BoD-computations.
Instead, under a simple Monte Carlo framework, B(b = 1, ..., B) computation rounds are
performed (with B a large number, in casu 500), in each of which a sub sample Υm,bc of
only m observations (randomly and i.i.d. drawn from the full sample of n local police
departments) are used in the estimation of the overall effectiveness score Em,bc . The robust
BoD-method thus estimatesB effectiveness scores Em,bc by means of the linear programming
problem in model (1)-(1c) after replacing Υ by Υm,bc . Having obtained the B effectiveness
scores Em,bc , we compute the robust BoD-based local police effectiveness score Em
c as the
arithmetic average of these B scores. As local police departments with performance data
that are atypical do not form part of the sub sample Υm,bc in every draw, the impact of
such departments on the order-m effectiveness scores Emc is effectively mitigated.
To correct the estimate of local police effectiveness for differences in the operation envi-
ronments of local police departments, in a second step, the order-m BoD-model is further
extended with insights after Daraio and Simar (2005, 2007a,b). Specifically, these authors
propose a methodology that obtains so-called conditional evaluation measures, which con-
dition the performance evaluation on exogenous factors, which we capture by the vector
Z. The computation of these conditional measures involves a slight modification of the ro-
17

bust order-m procedure outlined above. In particular, whereas in the unconditional robust
order-m procedure, in each draw, all local police departments have an equal probability
of being selected for membership in the sub sample (that is, local police departments are
drawn from Υ with uniform probability), in the conditional order-m framework, the prob-
ability for a local police department of being drawn is defined on the basis of a kernel
density function evaluated at the location of the exogenous factors for the evaluated local
police department c (see Appendix 7.1 for technical details on the construction and use of
appropriate kernel density weights). The idea is that local police departments get a greater
probability of being drawn for membership in the sub sample (label the sub samples Υm,z,bc )
if their operation environment (as characterized by the environmental characteristics as de-
scribed in the Section 3) is more similar to the one of the evaluated local police department
c. Intuitively, one could say that the conditional effectiveness measurement accounts for
the operational environment by comparing likes with likes. We denote the estimates of the
conditional BoD-model by Em,zc .
In the interpretation of the outcomes of the conditional and robust BoD-estimation of
local police effectiveness, scores Em,zc can be larger than unity. Indeed, thanks to drawing
a subsample of m observations with replacement from the full sample Υ, the evaluated local
police department c will not always be part of the sub sample Υm,z,bc . As such, “super-
effective” performances (i.e., local police departments with a Em,zc score higher than 1)
could arise. The “super-effective” Em,zc score is interpreted as a local police department
that is doing better than the average m other local police departments in its reference
sample (police departments that operate under largely similar environmental conditions).
We conclude this section with two remarks. First, an important parameter in both the
unconditional and conditional order-m procedure is the parameter m (i.e., the number of
observations against which the effectiveness of the evaluated local police department should
be compared). There is no standard methodology which allows computing the most appro-
priate value for m. However, as pointed out by Cazals et al. (2002) and Daraio and Simar
(2007a), too high and too low values of m should be avoided (for a more comprehensive dis-
cussion of the role of the parameter m, we refer to these studies). In our application, we use
m = 50. However, sensitivity analysis points out that the results are robust with respect to
alternative choices of value of m (i.e. we also considered m = 20, 30, 40, 60, 70, 80, 90, 100).
Second, because of the re-sampling procedure, we can construct confidence intervals and
18

standard deviations for Em,zc .
4.3 Statistical inference and visualization
As a major advantage, the conditional and robust BoD-framework allows for an inter-
pretation of the association between the environmental characteristics Z and effectiveness
of local police departments. In particular, by non-parametrically regressing the ratio of
the conditional [i.e., accounted for heterogeneity; Em,zc ] to the unconditional [i.e., without
accounting for the operating environment; Emc ] order-m estimates on the environmental
characteristics Z, we can learn (1) whether Z is on average statistically significantly re-
lated to the overall performance scores Ec, and (2) whether this relationship is positive
or negative. Daraio and Simar (2005, 2007a) also showed how the conditional order-m
approach allows one to visualize the estimated relationships between the environmental
characteristics Z and Em,zc /Em
c . When Z is univariate, the visualization is clear-cut (i.e.,
a scatter plot with on the horizontal axis the environmental and on the vertical axis the
ratio Em,zc /Em
c . When Z is multivariate (as in our application), the visualization is more
demanding, however, partial regression plots (see Daraio and Simar (2007a), Badin et al.
(2010b) and (2010b)), where only one environmental characteristic is allowed to vary while
all other environmental characteristics are kept at a fixed value (ceteris paribus) provide
an appealing solution. For a technical overview of the Badin et al. (2010a) subsample
approach, we refer to the paper itself. The intuition behind the Badin et al. (2010a)
subsample approach is explained in Appendix 7.2.
In the interpretation of the visualizations, a positive (negative) regression coefficient indi-
cates a negative (positive) association between the effectiveness score and the environmen-
tal characteristic. This opposite interpretation of the slopes has to do with the peculiarity
of the approach of Daraio and Simar (2005, 2007a,b) that inefficiency (in our case ineffec-
tiveness (1/Emc )) is investigated (recall that the BoD-model is essentially an input-oriented
DEA-model that only looks at the output side); a positive (negative) regression coefficient
for an environmental variables has to be interpreted as an indication of a positive (negative)
relationship between the environmental variable and the ‘ineffectiveness’ scores. Under the
framework of Daraio and Simar, environmental variables with a positive regression coeffi-
cient play the role of extra “undesired outputs” to be produced in the process of policing
(thus, detrimental to the police effectiveness), whereas environmental characteristics with
19

a negative coefficient in the non-parametric regression act like “substitutive inputs” in the
process of policing (thus, benefiting the police effectiveness). Analogously, for discrete (or-
dered) variables, a high value of Em,zc /Em
c , holding everything else equal, indicates that it
is more difficult to operate under the condition in question.
5 Results
Before estimating the robust and environment-adjusted BoD-based estimates of the scores
of local police effectiveness, we examine the traditional version of scores of police effective-
ness, that is, a one-dimensional measure of police effectiveness as measured by the global
views that citizens have of the police (i.e., based on the rates given by the respondents on
one global question in the Security Monitor that measures the citizens overall perception of
the police and the police services). The results are presented in Table 3. To be comparable
with the BoD-estimated effectiveness scores, we also divided the scores by its maximum to
obtain relative scores in stead of absolute levels of satisfaction. On average, 86.5% of the
respondents have a positive to very positive perception of the police and the police services
(recall that we focus on the relative number of respondents that rate the police positively).
In other words, most Belgians hold favourable impressions about their local police. Nev-
ertheless, the difference between the minimum value of 68.5% and the maximum value of
95.3% indicates that there is some variation between local police departments, with some
departments showing a very high citizen satisfaction with police services and other zones
showing somewhat lower satisfaction figures. The multidimensional scores confirm this
finding. Similar results of citizens having, in general, positive perceptions of the police
were found by most other studies in the literature (e.g., Bridenball and Jesilow, 2008; Sims
et al., 2002). The relative scores of the 1-dimensional citizen satisfaction score indicate
that the median police zone should be able to increase its satisfaction score by 7%.
< Table 3 about here >
The fourth row of Table 3 presents the summary statistics of the BoD-based estimates of
local police effectiveness for the local police departments, however, without any robusti-
fication or correction for differences in the operating environment (that is, the scores as
20

computed by the BoD-model described in Section 4.1). Four local police departments are
evaluated with an effectiveness score of one. This means that, when not correcting for
the impact of outlying performances and differences in the operating environment of local
police departments, the BoD-model evaluates four local police departments as perfectly
effective (i.e., Ec = 1). The median score of 0.905 is rather high and indicates that the
local police departments in the sample set are rather effective in terms of fulfilling their six
basic police functions (as perceived by the interviewed citizens). Nevertheless, this score
also indicates that there is still some room for further improvement. More precisely, if the
median local police department would perform on the six basic police functions as well as
the best performing police department, it could increase its effectiveness score by ± 9%.
More interesting than the traditional one-dimensional and the basic BoD-based estimates
are the robust and environment-adjusted measures of local police effectiveness as computed
by the robust and conditional order-m version of the BoD-model (see Section 4.2). We
estimate three alternative model specifications. Model 1 includes the demographic variable
‘green pressure’, the neighbourhood characteristic ‘typology of the municipality’, and the
socioeconomic characteristic ‘subsistence income rate’. Model 1 also controls for the region
in which the police department is operational (Flanders, Brussels, or Wallonia) and the
year in which the citizen survey was administered (i.e., 2002, 2004, 2006, or 2008). Model
2 is largely similar to Model 1. The only difference is that Model 2 uses ‘welfare index’
in stead of ‘subsistence income rate’ as socioeconomic background variable. We include in
Model 3 ‘grey pressure’ instead of the variable ‘green pressure’. The results of the three
model specifications are presented in the last three rows of Table 3. The visualizations
of the relationships between the police effectiveness and the environmental characteristics
as computed by Model 1 are displayed in Figure 3. The visualizations of the association
between the effectiveness scores and the operating environments according to Model 2 and
3 are showed in respectively Figure 4 and Figure 5.
In the outcomes of the three model specifications, we notice that when accounting for the
differences in the operating environments among the local police departments (as character-
ized by the selections of environmental variables), the median effectiveness score increases
to approximately 0.938. Thus even after the adjustment for environmental differences, for
half of the local police departments, there is still room for an improvement of more than
6%. The quartile of lower-performers can increase their effectiveness by more than 10%.
21

The lowest performer should be able to increase its effectiveness score by 20%.
Note also that the outcomes of the three model specifications are largely similar. This seems
to suggest that replacing ‘green pressure’ for ‘grey pressure’ as demographic background
characteristic or switching ‘subsistence income rate’ for ‘welfare index’ as socioeconomic
environmental characteristic in the estimations does not alter the results considerably.
As a first class of environmental characteristics, consider the estimated relationship be-
tween the effectiveness score for local police departments and the demographic environ-
mental variables ‘green pressure’ and ‘grey pressure’. Figure 3(b) and Figure 4(b) visualize
the association between the environmental characteristic ‘green pressure’ and local police
effectiveness. Both plots show that the variable ‘green pressure’ is related negatively to
the police effectiveness as measured by citizen perceptions. The opposite applies for the
environmental characteristic ‘grey pressure’ which is found to be positively related to the
overall effectiveness of local police forces for low values of ‘grey pressure’ (see Figure 5(b)).
In other words, police departments active in municipalities with a rather young population
or a relatively low proportion of old citizens receive lower effectiveness rates. These find-
ings are consistent with previous research (e.g., Sullivan et al., 1987; Gaines et al., 1997;
Zevitz and Rettammel, 1990; and Worrall, 1999), which indicated that elder citizens are
more likely to have a positive perception of the police and the police services compared to
younger citizens.
As a second class of environmental characteristics, we focus on the estimated relationships
between the effectiveness of the local police departments and the socioeconomic variables
‘subsistence income rate’ and ‘welfare index’. Figures 3(a) and 5(a)show a negative rela-
tionship between police effectiveness and ’subsistence income rate’. Recall that ‘subsistence
income rate’ can be interpreted as a measure of disadvantage in the sense that a higher
value should be seen as negative. The finding of a significant effect of ‘subsistence income
rate’ is in contrast with what was found in other studies, with, for instance, Bridenball
and Jesilow (2008) showing that an index of concentrated economic disadvantage was not
related to the citizen perceptions once other environmental characteristics were accounted
for in the models. Figure 4(a) shows an insigificant U-verse relationship between police ef-
fectiveness and ’welfare index’ with the slope being negative for lower values of the welfare
index, but positive for higher welfare index values. As the effect of ’welfare index’ is highly
insignificant, we can can conclude that ’subsistence income rate’ is a more appropriate
22

proxy for the socioeconomic environment in comparison to ’welfare index’ in this setting.
As a third class of environmental characteristics, consider the estimated relationship be-
tween the typology of the municipality and the overall effectiveness score of local police
department. Figure 3(e), Figure 4(e) and Figure 5(e) show at first sight that local police
departments in municipalities of typology 3 (i.e., metropolitan municipalities and highly
equipped small cities) are rated more positively by citizens compared to their counterparts
situated in municipalities of more urbanized types. This is in line with other studies that
citizens living in urban police zones (i.e., typology 1 and 2) are typically less positive with
the police and the police services. However, the difference between typologies are only
significant at the 5% significance level in Model 1.
Two other environmental characteristics for which a correction was performed in the es-
timations of the effectiveness scores of local police departments are the region in which
the police department is operational and the year in which the citizen perceptions were
collected. The three plots looking at the association between the region and the police effec-
tiveness in Figure 3(d), 4(d) and 5(d) all show the same picture: local police departments
that are operational in municipalities in Flanders are rated more positively by citizens in
terms of police effectiveness compared to local police department that are located in the
Brussels and the Wallonian region. That is, citizens living in the Flemish region of Belgium
tend to be more satisfied with the local police services in their neighbourhood.15 In addi-
tion, results show that it is more difficult to obtain high perceived police effectiveness in
Brussels than in the Wallonian region. Bandwidth sizes of the variable ’Region’ are almost
always very close to 0 (see Table 4). This means that observations are only compared to
observations from the same region. In other words, the estimation procedure points out
that the 3 regions have an operating environment which is not comparable. Regarding the
impact of the year in which the citizen surveys were collected, the three plots in Figure 3(c),
4(c) and 5(c) as estimated according to the three model specifications indicate that there
was an increasing trend in the effectiveness scores received by local police departments in
the period 2002-2004-2006, with particularly in the year 2006 higher average effectiveness
scores for local police departments based on citizen perceptions. The trend stopped in
the year 2008. These finding are not really a surprise as the official police reports of Van
15Note however that we do not claim that our sample of local police zones is representative at the
regional level. The variable ‘region’ is included as control variable.
23

Den Bogaerde et al. (2007) and (2009) already noted this trend.
< Figure 3 about here >
Figure 6 demonstrates how the robust and environment-adjusted BoD-generated effective-
ness scores (rankings) (based on Model 1) differ from the traditional police effectiveness
scores and the police effectiveness scores as estimated by the basic BoD-model (see Section
4.1). In particular, Figure 6(a) and 6(b) look at how the robust and environment-adjusted
police effectiveness scores (ranks) relate to the traditional scores as measured by one global
question. Given that correlations are rather low (i.e., Spearman rank correlation of 0.613),
the evaluation outcomes seem to differ considerably. The dispersion is to say the least
rather pronounced. In fact, there are some local police departments that obtain low ef-
fectiveness scores (ranks) when using the traditional measure of police effectiveness and
high effectiveness scores (ranks) when employing the conditional and robust version of the
BoD-model in the estimation of local police effectiveness, and vice versa.
Figure 6(c) and 6(d) look at the association between the police effectiveness scores (ranks)
as estimated by the BoD-model with and without a robustification and correction for
differences in the operating environment of local police departments. By robustification
and conditioning on the environment, effectiveness scores increase as we control for the
influence of atypically good performing police departments and in general ‘unfavourable’
environmental variables. The plots show a high overall association (i.e., Spearman rank
correlation of 0.765). However, high correlations between scores (rankings) do not imply
that scores (rankings) are completely equivalent. Quite the contrary, as indicated by both
the scatter plots, individual police department effectiveness scores and ranks clearly depend
on whether or not there was a robustification and correction for differences in the opera-
tion environments of the local police departments. The norm in effectiveness evaluations
of local police departments should thus not only be on differential, ‘Benefit-of-the-Doubt’
weighting, but also on making the scores robust to outliers and correcting the scores for
differences in the operating environments of the local police departments (as represented
by the selection of environmental characteristics).
< Figure 4 about here >
< Figure 5 about here >
24
< Figure 6 about here >
6 Concluding remarks
In this paper, we proposed the use of a specially tailored OR framework to evaluate police
effectiveness of community oriented local police forces. We proposed an adjusted version of
the Data Envelopment Analysis (DEA) methodology. This so-called ‘Benefit-of-the-Doubt’
(BoD) model (after Melyn and Moesen, 1991) exploits the characteristics of DEA that it,
thanks to its linear programming formulation, allows for an endogenous weighting of the
citizen perceptions on the multiple aspects of policing into an overall effectiveness score.
For each local police department, weights for the basic police functions are chosen such that
the highest overall police effectiveness score is realized. Eventually, opinions of stakeholders
such as police chiefs of local departments can be taken into account in the weighting. To
make the BoD-based effectiveness score robust to outliers as well as corrected for differences
in the operating environment, we extend the BoD-model using insights from the robust and
conditional order-m DEA-framework. A major advantage of these extensions is also that
they allow for non-parametric statistical inference and a visualization of the relationships
between the environmental characteristics and the estimate of police effectiveness.
To illustrate the practical usefulness of the approach, we applied the robust and conditional
BoD-model to citizen survey data on Belgian local police departments. We first show that
the median police effectiveness score equals approximately 0.94. This means, that, for most
police departments, there is still room for further improvement.
The estimations of the relationships between the effectiveness scores and the environmental
characteristics reveal that the proportion of young citizens and elder citizens are, respec-
tively, negatively and positively related to the police effectiveness. Regarding the percent-
age of the resided population in the local police zone that is beneficiary of a subsistence
income, results point out respectively a strong negative relationship with the effectiveness
of local police departments. No significant effect was found for an index of welfare. All
results are controlled for effects of urbanization, year effects and regional differences. We
believe that all this information is useful to help policy makers better understand the en-
vironmental factors that influence the citizens’ perceptions with and attitudes toward the
25

police and the police services.
However, there are some important reasons why the results found in this paper should be
interpreted with caution. First of all, whereas we believe that the robust and conditional
BoD-framework has several important benefits in the evaluation of police effectiveness, we
emphasize that one should not generalize the results found here to other countries because
both the existence and significance of relationships between environmental characteristics
and police effectiveness varies without doubt with the particular conditions. Somewhat
related to this remark, we believe it to be interesting to apply the proposed framework in
other settings or to data of previous studies to check for recurrent patterns.
Second, there is a risk of omitted variable bias (i.e., bias in the estimated outcomes that
results from omitted environmental characteristics). That is, although we attempted to
correct the BoD-generated estimates of local police effectiveness, we recognize that not
all environmental characteristics which have been found to relate to citizen perceptions of
the police and the police services (e.g., education level of the citizens living in the mu-
nicipality (Jesilow and Meyer, 2001 and Murphy and Worrall, 1999), the ethnicity of the
residents in the municipality (Kusow et al., 1997 and Schafer et al., 2003), the crime rate
of the municipality (Reisig and Correia, 1997 and Reisig and Park, 2000), and the personal
contact that citizens had with the police (Schafer et al., 2003 and Webb and Marshall,
1995)) have been accounted for in the estimations due to data limitations or endogeneity
issues. As a suggestion for future studies, it would be interesting to expand the selection
of environmental characteristics.
Third, the relationships between the police effectiveness scores and the environmental char-
acteristics as estimated by the conditional version of the BoD-model do not imply causal
interpretations. This limitation is due to the fact that the conditional BoD-model only al-
lows detecting associations between estimated scores and environmental variables. This is
an important limitation, one that practitioners should be very aware of in the interpretation
of the relationships found. As different directions of causality may warrant different police
conclusions, more information on the direction of causality is of high relevance. Clearly
this warrants a profound study of the exact mechanisms by which environmental charac-
teristics shape citizen perceptions of police and police services. Therefore, a more profound
analysis of the direction of causalities, using intertemporal variation, is considered to be
an important scope for further research.
26

7 Appendix
7.1 Conditional BoD score
The basic idea of the conditional BoD-model is that local police departments with a similar
operating environment as police department c get a greater probability of being drawn for
membership in the subsample of benchmark observations. We follow Badin et al. (2010b)
in using the conditional distribution function F (Y |Z = z) as starting point to determine
the probabilities to be drawn.16 This approach has as main advantage that no separability
assumption is imposed as F (Y |Z = z) captures the effect of Z on both the attainable set
as on the distribution of ineffectiveness.
Nonparametric estimation of the conditional distribution function F (Y |Z = z) requires
the specification of weight functions and bandwidths. Kernel weight functions are used
to give more weight to observations near the observation point. Bandwidths impose the
window of localization. Literature shows that the choice of weighting function is far less
important than the choice of the bandwidth - which we will discuss below.
We use kernel weights (lc, lu, lo) with bandwidths (hc, hu, ho) to specify the weight function
for z = [zc, zu, zo], where zc is a vector of continuous values, zu is a vector of unordered
discrete values, zo is a vector of ordered discrete values. In specific, we specify an epanech-
nikov kernel function lc to weight the continuous variable zcp (see (A.1)). An Aitchison
and Aitken (1976) kernel lu is specified to weight discrete unordered variables zul with cl
categories (see (A.2)). In the extreme case of hul = 0, no weight is given to observations
with a different value of Z. The other extreme of hul = (cl − 1)/cl means that observations
with Zjl 6= zl receive equal weight as observations with Zjl = zl. In other words, Z is
ignored by the model. To weight the ordered discrete values zo, we use a Wang and van
16It is well known that in an input-oriented FDH approach with variable returns to scale (VRS), ob-
servation c is benchmarked against observations with Y ≥ yc. In other words, only the subsample with
Y ≥ yc determines the performance score of police department c. Our base ‘BoD’ model can be formulated
as an input-oriented constant returns to scale (CRS) DEA model with a ‘dummy input’ always equal to
1 (see Cherchye et al. (2007)). It can easily be shown that in a CRS DEA model, all observations (thus
not only those with Y ≥ yc) can influence the effectiveness score of observation c. Therefore, in contrast
to the VRS-based order-m approach of Cazals et al. (2002), we draw observations from the whole sample
and not only from the subsample of observations with Y ≥ yc.
27

Ryzin (1981) kernel function (see (A.3)).
lc(Zcjp − zcphcp
)=
3
4√
5
(1− 1
5
(Zcjp−zcphcp
)2)
if(Zcjp−zcphcp
)2
≤ 5
0 otherwise
(A.1)
lu(Zujl, z
ul , h
ul ) =
1− hul if Zujl = zul ,
hul /(cl − 1) otherwise(A.2)
lo(Zoir, z
or , h
or) =
1 if Zojr = zor ,
(hor)|Zo
jr−zor | otherwise(A.3)
To allow for a multivariate estimation, we use - as is common practice - product ker-
nels. The product kernel of zc is Whc(Zcj , z
c) =∏q
p=1(hcp)−1lc((Zc
jp − zcp)/hcp). For zu,
the product kernel is defined as Lhu(Zuj , z
u) =∏v
l=1 lu(Zu
jl, zul , h
ul ). The product kernel
of zo is Lho(Zoj , z
o) =∏s
r=1 lo(Zo
jr, zor , h
or). All together, we can specify a Racine and Li
(2004) generalized kernel function as Kh(Zj, z) = Whc(Zcj , z
c)Lhu(Zuj , z
u)Lho(Zoj , z
o), with
h = (hc, hu, ho).
We estimate the conditional CDF following Li and Racine (2007,p. 184) by smoothing in
direction of both Y as Z (see (A.4)). The optimal level of bandwidth is chosen by minimiza-
tion of the integrated squared error (i.e., leave-one-out Least-Squares Cross-Validation).
F (y|z) =n−1
∑nj=1Why
(Yj−yhy
)Kh(Zj, z)
n−1∑n
j=1Kh(Zj, z)(A.4)
Using the optimal bandwidth vector h, we construct Em(y|z) by performing the following
iteration process17:
[1 ] Draw for a given police department c, a sample of size m with replacement and
with a probability Kh(Zj, z). Denote this sample by{Y b
1 , ..., Ybm
}.
[2 ] Solve the linear program:
17Analogously to Daraio and Simar (2007b)
28

Ez,bm (y) = maxwc,1,...,wc,q
q∑i=1
wc,iybc,i s.t. (A.5)
q∑i=1
wc,iybj,i ≤ 1 ∀j = 1, ..., c, ...,m (A.5a)
wc,i ≥ 0 ∀i = 1, ..., q (A.5b)
αi ≤wc,iy
bc,i∑q
i=1wc,iybc,i
≤ βi ∀i = 1, ..., q (A.5c)
[3 ] Redo [1] and [2] for b=1,...,B.
[4 ] Construct Em(y|z) ≈ 1B
∑Bb=1 E
z,bm (y)
7.2 Inference on the impact of Z
To visualize the effect of Z on the production process, we use a nonparametric local-linear
regression of Z on Q(y) = Em(y|z)/Em(y) as proposed by Daraio and Simar (2005) and
Daraio and Simar (2007a). This can be formulated as a localized least squares regression:
min{a,b}
n∑j=1
(Qj − a− (Zj − z)′b)2Kλ(Zj, z) (A.6)
,with Kλ(Zj, z) the generalized Li-Racine kernel weight function with bandwidth λ =
[λc, λu, λo]. For the evaluation points {z1, ..., zk, ..., zK}, we estimate the fitted values πzk =
E[Qm|Z = zk].18 A πzkm that increases (decreases) with Z, holding everything else equal,
indicates that the environmental variable has a negative (positive) effect on effectiveness.19
Bootstrapping is used to construct confidence regions on the estimated fitted values π. As
we do not observe Q(y|z), but only the estimate Q(y|z), the i.i.d. assumption is invalid
and standard bootstrap theory cannot be applied on the pairs (Zj, Q(Yj|Zj)) (Badin et al.,
2010a). We use the Badin et al. (2010a) subsample bootstrap approach, which draws BB
times M < n observations directly from the observed and i.i.d. sample (Yj, Zj). For each
sample bb of size M, the fitted values π∗,bb,zk , for k = 1, ..., K are estimated. Quantiles
18We also estimate the observation-specific coefficients b, these are available upon request.19We make use of the R package ‘np’ of Hayfield and Racine (2008) to estimate the CDF and local-linear
regression.
29

(q∗,zkM ;α/2, q∗,zkM ;1−α/2) of πzkn − π
∗,bb,zkM are rescaled to correct for the difference in sample size
and determine the 1− α confidence interval of πzk :
πzk(Υ) ∈[πzkn − q
∗,zkM ;α/2, π
zkn − q
∗,zkM ;1−α/2)
]. (A.7)
It is important to note that we have a subsample bootstrap of B replications (to construct
robust conditional effectiveness scores) in a subsample bootstrap of BB replications (to
allow for inference). Logically, computational burden increases dramatically with the size
of B and BB. Preliminary analysis showed that setting B=100 and BB=200 suffices for
robust inference in our setting. M is set to 150. Results are not sensitive for altering the
value of M to 200 and 175.
8 Tables and Figures
Table 1: Summary statistics for the local police departments
Variable Mean St.Dev. Min Q1 Med Q3 Max
Output
Community policing 0.837 0.096 0.608 0.755 0.850 0.915 1.000
Reception of citizens 0.862 0.076 0.664 0.796 0.875 0.926 1.000
Intervention 0.806 0.080 0.607 0.744 0.814 0.861 1.000
Aid to victims 0.866 0.059 0.688 0.826 0.876 0.906 1.000
Local investigation 0.882 0.063 0.701 0.833 0.889 0.927 1.000
Maintenance of public order 0.925 0.041 0.788 0.898 0.929 0.954 1.000
Environmental variables
Subsistence Income Rate (× 100) 0.869 0.727 0.099 0.310 0.659 1.160 3.574
Green Pressure 42.077 4.413 32.474 38.455 42.572 44.817 53.763
Grey Pressure 41.624 7.825 24.762 38.054 40.615 44.376 75.145
Welfare Index 98.317 12.642 70.638 87.716 100.159 107.534 138.00
Variable Groups Mean size St.Dev Min Med Max
Typology 5 41.80 24.87 19 32 69
Region 3 69.67 49.01 20 71 118
Year 4 52.25 15.02 36 53.50 66
Observations 209
30

Table 2: Summary of weights specified by the consulted police chiefs
Comm. pol. Reception Intervention Aid Ivestig. Public order
Average 0.189 0.146 0.245 0.129 0.160 0.131
St.Dev. 0.065 0.042 0.098 0.051 0.051 0.095
Min. 0.030 0.030 0.100 0.020 0.010 0.020
5% perc. 0.100 0.082 0.160 0.030 0.050 0.050
25% perc. 0.150 0.100 0.180 0.100 0.150 0.090
Median 0.200 0.150 0.200 0.150 0.170 0.110
75% perc. 0.210 0.170 0.300 0.170 0.200 0.160
95% perc. 0.300 0.200 0.400 0.200 0.220 0.200
Max. 0.400 0.250 0.700 0.250 0.250 0.650
Table 3: Estimates of local police effectiveness in different model specifications (n=209 local
police forces)
Average St.Dev Min Q1 Median Q3 Max
1-dim. satisfaction score (absolute) 0.865 0.059 0.685 0.822 0.882 0.907 0.953
1-dim. satisfaction score (relative) 0.908 0.062 0.719 0.863 0.926 0.952 1.000
BoD score 0.897 0.061 0.734 0.846 0.905 0.946 1.000
Conditional BoD (1) 0.931 0.045 0.792 0.899 0.938 0.964 1.002
Conditional BoD (2) 0.932 0.044 0.799 0.899 0.938 0.967 1.001
Conditional BoD (3) 0.932 0.044 0.799 0.899 0.938 0.967 1.001
31

Table 4: Estimated optimal bandwidth sizes
Socioeconomic char. Demographic char. Typology Year Region
Conditional BoD
Model 1 1.021e4 5.520 0.702 0.586 7.864e−16
Model 2 17.210 5.428 0.551 0.536 5.860e−16
Model 3 0.017 10.554 0.552 0.503 1.700e−15
Nonparametric regression
Model 1 3.555e3 2.002e6 0.629 0.515 1.610e−15
Model 2 13.075 5.248 0.095 0.328 0.002
model 3 1.506e3 12.206 0.314 0.476 1.600e−14
32

Fig
ure
1:
Th
e6
bas
icp
olic
efu
nct
ion
sof
loca
lp
olic
ed
epart
men
tsin
Bel
giu
m
33

(a)
Su
bsi
sten
ceIn
com
eR
ate
(b)
Wel
fare
Ind
ex
(c)
Gre
enp
ress
ure
(d)
Typ
olo
gy
Fig
ure
2:
Envir
onm
enta
lch
arac
teri
stic
sfo
rlo
cal
pol
ice
dep
artm
ents
34

0.000 0.005 0.010 0.015 0.020 0.025 0.030 0.035
0.99
51.
000
1.00
51.
010
1.01
51.
020
Subsistence Income Rate
Con
ditio
nal B
oD /
BoD
(a) Subsistence Income Rate
35 40 45 50
0.98
50.
990
0.99
51.
000
1.00
51.
010
Green Pressure
Con
ditio
nal B
oD /
BoD
(b) Green Pressure
2002 2004 2006 2008
0.99
60.
998
1.00
01.
002
1.00
4
Year
Con
ditio
nal B
oD /
BoD
●
●
●●
(c) Year
1/FLA 2/BRU 3/WAL
1.00
1.05
1.10
1.15
Region
Con
ditio
nal B
oD /
BoD
●
●
●
(d) Region
●
●
●
●
●
1 2 3 4 5
0.99
60.
997
0.99
80.
999
1.00
0
Typology
Con
ditio
nal B
oD /
BoD
●
●
●
●
●
(e) Typology
Figure 3: Visualization of the results (Model 3)
35

70 80 90 100 110 120 130 140
0.99
00.
995
1.00
01.
005
Welfare Index
Con
ditio
nal B
oD /
BoD
(a) Welfare Index
35 40 45 50
0.98
0.99
1.00
1.01
Green Pressure
Con
ditio
nal B
oD /
BoD
(b) Green Pressure
2002 2004 2006 2008
0.99
00.
992
0.99
40.
996
0.99
81.
000
1.00
2
Year
Con
ditio
nal B
oD /
BoD
●
●
●●
(c) Year
1/FLA 2/BRU 3/WAL
1.00
1.05
1.10
1.15
Region
Con
ditio
nal B
oD /
BoD
●
●
●
(d) Region
●●
●
●
●
1 2 3 4 5
0.99
20.
994
0.99
60.
998
1.00
01.
002
1.00
4
Typology
Con
ditio
nal B
oD /
BoD
●●
●
●
●
(e) Typology
Figure 4: Visualization of the results (Model 1)
36
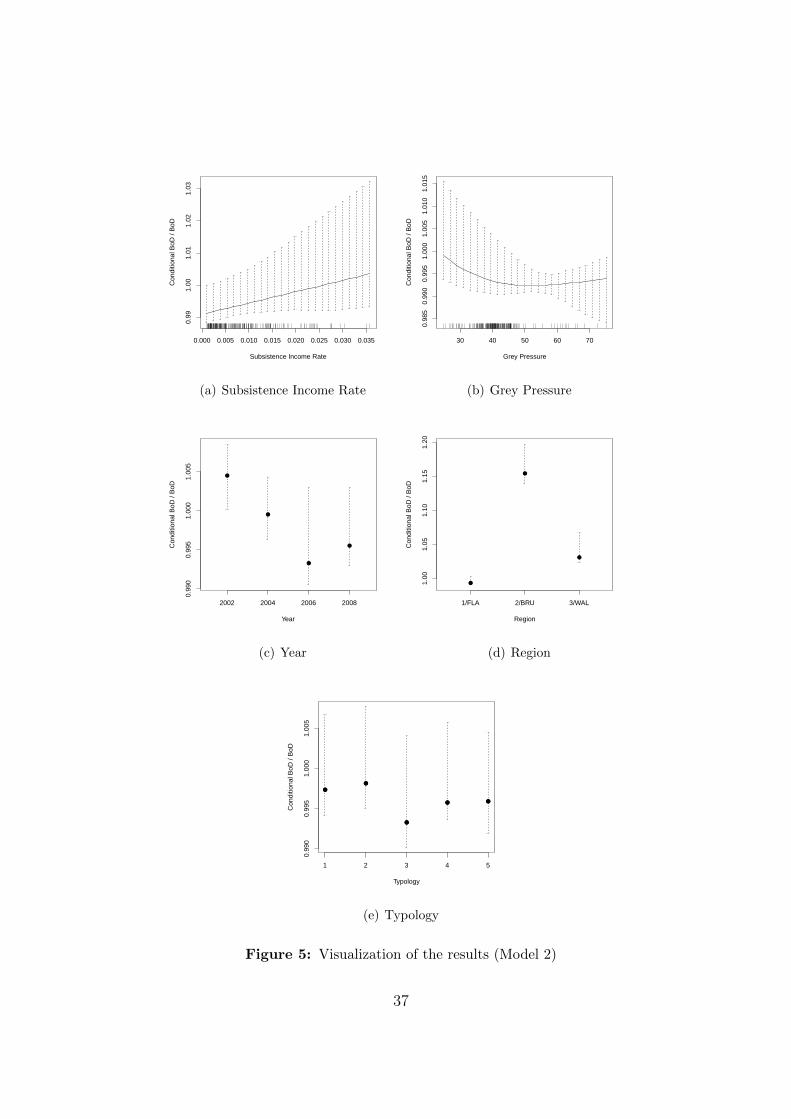
0.000 0.005 0.010 0.015 0.020 0.025 0.030 0.035
0.99
1.00
1.01
1.02
1.03
Subsistence Income Rate
Con
ditio
nal B
oD /
BoD
(a) Subsistence Income Rate
30 40 50 60 70
0.98
50.
990
0.99
51.
000
1.00
51.
010
1.01
5
Grey Pressure
Con
ditio
nal B
oD /
BoD
(b) Grey Pressure
2002 2004 2006 2008
0.99
00.
995
1.00
01.
005
Year
Con
ditio
nal B
oD /
BoD
●
●
●
●
(c) Year
1/FLA 2/BRU 3/WAL
1.00
1.05
1.10
1.15
1.20
Region
Con
ditio
nal B
oD /
BoD
●
●
●
(d) Region
●
●
●
● ●
1 2 3 4 5
0.99
00.
995
1.00
01.
005
Typology
Con
ditio
nal B
oD /
BoD
●
●
●
● ●
(e) Typology
Figure 5: Visualization of the results (Model 2)
37

●
●
●
●
●
●
●
●
●●
●
●
●
●●
●
●
●
●
●
●
●
●● ●
●
●
●
●
●
●
●
●
●
●
●
●
●
●●
●
●●
●
●
●
●
●
●●
●
●
●
●
●
●
●
●
●
● ●
●
●●
●●●
●
●
●
●
●
●
●
●
●
●
●
●●●
●
●●
●
●
●
●
●
●
●
●
●●
●
●
●
● ●
●
●
●
●●
●
●
●
●
●●
●
●
●
●
●●
●
●● ●
●
●●
●
●●
●●●
●
●
●
●
●
●
●
●●●
●
●
●●
●
●
●
●
●●
●
●
●
●
● ●
●
●
●
●
●
●
● ●
●
●●
●
●
●
●
●●
●
●
●
●●
●
●
●
●
●●
●
●
●
●
●
●●
●
●
●●
●●●●
●
●
●
●
●
●
●
●
●
●
●
0.75 0.80 0.85 0.90 0.95 1.00
0.75
0.80
0.85
0.90
0.95
1.00
1−dim. satisfaction socre
Con
ditio
nal B
oD (
Mod
el 1
)
(a) Traditional vs. Conditional BoD
●
●
●
●
●
●
●
●
●●
●
●
●
●
●
●
●
●
●
●
●
●
●
●
●
●
●
●
●
●
●
●
●
●
●
●
●
●
●
●
●
●
●
●
●
●
●
●● ●
●
●
●
●
●
●
●
●
●
●●
●
●●
● ●
●
●
●
●
●
●
●
●
●
●
●
●
●●
●
●
●
●
●
●
●
●
●
●
●
●
●
●
●
●
●
●
●
●
●
●
●●
●
●
●
●
● ●
●
●
●
●
●
●
●
●
●●
●
●
●
●
●●
●●
●
●
●
●
●
●
●
●
●●
●
●
●
●
●
●
●
●
●
● ●
●
●
●
●
●●
●
●
●
●
●
●
●●
●
●
●
●
●
●
●
●
●
●
●
●
●
●
●
●
●
●
●
●
●
●
●
●
●
●●
●
●
●
●
●●
●●
●
●
●
●
●
●
●
●
●
●
●
0 50 100 150 200
050
100
150
200
1−dim. satisfaction score
Con
ditio
nal B
oD (
Mod
el 1
)
(b) Traditional vs. Conditional BoD
●
●
●
●
●
●
●
●
●
●
●
●
●
●●
●
●
●
●
●
●
●
●●
●●
●
●
●
●
●
●
●
●
●
●
●
●
●●
●
●●
●
●
●
●
●
● ●
●
●
●
●
●
●
●
●
●
● ●
●
●●
●●●
●
●
●
●
●
●
●
●
●
●
●
●●●
●
●
●
●
●
●
●
●
●
●
●
●●
●
●
●
●●
●
●
●
●●
●
●
●
●
●●
●
●
●
●
●●
●
●●●
●
●●
●
●●
● ●●
●
●
●
●
●
●
●
●●●
●
●
●●
●
●
●
●
●●
●
●
●
●
●●
●
●
●
●
●
●
●●
●
●●
●
●
●
●
●●
●
●
●
●●
●
●
●
●
●●
●
●
●
●
●
●●
●
●
●●
●●●
●
●
●
●
●
●
●
●
●
●
●
●
0.75 0.80 0.85 0.90 0.95 1.00
0.75
0.80
0.85
0.90
0.95
1.00
BoD
Con
ditio
nal B
oD (
Mod
el 1
)
(c) BoD vs. Conditional BoD
●
●
●
●
●
●
●
●
●●
●
●
●
●
●
●
●
●
●
●
●
●
●
●
●
●
●
●
●
●
●
●
●
●
●
●
●
●
●
●
●
●
●
●
●
●
●
●●●
●
●
●
●
●
●
●
●
●
●●
●
●●
● ●
●
●
●
●
●
●
●
●
●
●
●
●
●●
●
●
●
●
●
●
●
●
●
●
●
●
●
●
●
●
●
●
●
●
●
●
●●
●
●
●
●
●●
●
●
●
●
●
●
●
●
●●
●
●
●
●
●●
●●
●
●
●
●
●
●
●
●
●●
●
●
●
●
●
●
●
●
●
●●
●
●
●
●
●●
●
●
●
●
●
●
●●
●
●
●
●
●
●
●
●
●
●
●
●
●
●
●
●
●
●
●
●
●
●
●
●
●
●●
●
●
●
●
●●
●●
●
●
●
●
●
●
●
●
●
●
●
0 50 100 150 200
050
100
150
200
BoD
Con
ditio
nal B
oD (
Mod
el 1
)
(d) BoD vs. Conditional BoD
Figure 6: Comparison of approaches by scatter plot of scores and ranks
References
Aitchison, J., Aitken, C. G. G., 1976. Multivariate binary discrimination by kernel method.
Biometrika 63 (3), 413–420.
Badin, L., Daraio, C., Simar, L., 2010a. How to measure the impact of environmental
factors in a nonparametric production model? ISBA Discussion Paper Series (1050).
Badin, L., Daraio, C., Simar, L., Mar. 2010b. Optimal bandwidth selection for conditional
38

efficiency measures: A data-driven approach. European Journal of Operational Research
201 (2), 633–640.
Beck, K., Boni, N., Packer, J., 1999. The use of public attitude surveys: what can they tell
police managers? Policing: an International Journal of Police Strategies & Management
22 (2), 191–213.
Brandl, S., Frank, J., Wooldredge, J., Watkins, R., 1997. On the measurement of public
support for the police: A research note. Policing: An International Journal of Police
Strategies & Management 20 (3), 473–480.
Bridenball, B., Jesilow, P., Jun. 2008. What matters the formation of attitudes toward the
police. Police Quarterly 11 (2), 151–181.
Cao, L., Frank, J., Cullen, F., 1996. Race, community context and confidence in the police.
American Journal of Police 15, 3–22.
Cao, L. Q., Stack, S., Sun, Y., Jul. 1998. Public attitudes toward the police: A comparative
study between japan and america. Journal of Criminal Justice 26 (4), 279–289.
Carter, D., 2002. The Police and the Community, 7th Edition. Englewood Cliffs, NJ:
Prentice Hall.
Cazals, C., Florens, J. P., Simar, L., Jan. 2002. Nonparametric frontier estimation: a
robust approach. Journal of Econometrics 106 (1), 1–25.
Charnes, A., Cooper, W. W., Rhodes, E., 1978. Measuring efficiency of decision-making
units. European Journal of Operational Research 2 (6), 429–444.
Cherchye, L., Moesen, W., Rogge, N., Van Puyenbroeck, T., May 2007. An introduction to
’benefit of the doubt’ composite indicators. Social Indicators Research 82 (1), 111–145.
Cooper, W., Seiford, L., Zhu, J., 2004. Handbook on data envelopment analysis. Boston:
Kluwer Academic Publishers, Ch. Data envelopment analysis: History, models and in-
terpretations, pp. 1–39.
Daraio, C., Simar, L., Sep. 2005. Introducing environmental variables in nonparametric
frontier models: A probabilistic approach. Journal of Productivity Analysis 24 (1), 93–
121.
39

Daraio, C., Simar, L., 2007a. Advanced robust and nonparametric methods in efficiency
analysis: methodology and applications. Studies in productivity and efficiency. Springer
Science and Business Media.
Daraio, C., Simar, L., Oct. 2007b. Conditional nonparametric frontier models for convex
and nonconvex technologies: a unifying approach. Journal of Productivity Analysis 28 (1-
2), 13–32.
De Waele, M., Heerwegh, D., Loosveldt, G., 2008. Notesumo: Nonresponse to a telephone
survey such as the security monitor. deel 2: evaluatie van een mixed mode survey de-
sign, onderzoeksverslag surveymethodologie ceso/sm/2008-7. Tech. rep., K.U.Leuven.
Centrum voor Sociologisch Onderzoek (CeSO), 144 p.
Drake, L., Simper, R., Oct. 2002. X-efficiency and scale economies in policing: a compar-
ative study using the distribution free approach and dea. Applied Economics 34 (15),
1859–1870.
Drake, L., Simper, R., May 2003. The measurement of english and welsh police force
efficiency: A comparison of distance function models. European Journal of Operational
Research 147 (1), 165–186.
Drake, L., Simper, R., 2004. The economics of managerialism and the drive for efficiency
in policing. Managerial and Decision Economics 25, 509–523.
Drake, L., Simper, R., 2005. The measurement of police force efficiency: An analysis of uk
home office policy. Contemporary Economic Policy 23, 465–482.
Farrell, M. J., 1957. The measurement of productive efficiency. Journal Of The Royal
Statistical Society Series A-General 120 (3), 253–290.
Fried, H., Lovell, C., Schmidt, S., 2008. The measurement of productive efficiency and
productivity growth. Oxford University Press, USA.
Gaines, L. K., Kappeler, V. E., Vanghn, J. B., 1997. Policing in America, 2nd Edition.
Cincinnati, OH: Anderson Publishing Company.
Hayfield, T., Racine, J., 2008. Nonparametric econometrics: The np package. Journal of
Statistical Software 27 (5).
40

Hesketh, B., 1992. The police use of surveys: valuable tools or misused distractions? Police
Studies 15, 55–61.
Hwang, E. G., McGarrell, E. F., Benson, B. L., Nov. 2005. Public satisfaction with the
south korean police: The effect of residential location in a rapidly industrializing nation.
Journal of Criminal Justice 33 (6), 585–599.
Jesilow, P., Meyer, J., 2001. The effect of police misconduct on public attitudes: A quasi-
experiment. Journal of Crime and Justice 24 (1), 109–121.
Kusow, A., Wilson, L., Martin, D., 1997. Determinants of citizen satisfaction with the
police: The effects of residential location. Policing: An International Journal of Police
Strategy and Management 20, 655–664.
Li, Q., Racine, J., 2007. Nonparametric Econometrics: theory and practice. Princeton
University Press.
Marenin, O., 1983. Supporting the local police: The differential group basis of varieties of
support. Police Studies 6, 50–56.
Melyn, W., Moesen, W., 1991. Towards a synthetic indicator of macroeconomic perfor-
mance: Unequal weighting when limited information is available. Tech. Rep. 17, Public
Economics Research paper, CES, KU Leuven.
Murphy, D. W., Worrall, J. L., 1999. Residency requirements and public perceptions of
the police in large municipalities. Policing: an International Journal of Police Strategies
& Management 22 (3), 327–342.
Murty, K. S., Roebuck, J. B., Smith, J. D., Dec. 1990. The image of the police in black
atlanta communities. Journal of Police Science and Administration 17 (4), 250–257.
Nyhan, R., Martin, L., 1999. Assessing the performance of municipal police service using
data envelopment analysis: An exploratory study. State and Local Government Review
31 (1), 18–30.
Racine, J., Li, Q., 2004. Nonparametric estimation of regression functions with both cate-
gorical and continuous data. Journal of Econometrics 119 (1), 99–130.
41

Reisig, M., Correia, M., 1997. Public evaluations of police performance: An analysis across
three levels of policing. Policing: An International Journal of Police Strategies and Man-
agement 20, 311–325.
Reisig, M. D., Parks, R. B., Sep. 2000. Experience, quality of life, and neighborhood
context: A hierarchical analysis of satisfaction with police. Justice Quarterly 17 (3),
607–630.
Rogge, N., Verschelde, M., 2011. A composite index of citizen satisfaction with local police
services, mimeo.
Sampson, R. J., Bartuch, D. J., 1998. Legal cynicism and (subcultural?) tolerance of
deviance: The neighborhood context of racial differences. Law & Society Review 32 (4),
777–804.
Scaglion, R., Condon, R. G., 1980. Determinants of attitudes toward city police. Criminol-
ogy 17 (4), 485–494.
Schafer, J., Huebner, B., Bynum, T., 2003. Citizen perceptions of police services: Race,
neighbourhood context, and community policing. Policy Quarterly 6, 440–467.
Sims, B., Hooper, M., Peterson, S. A., 2002. Determinants of citizens’ attitudes toward
police - results of the harrisburg citizen survey - 1999. Policing: an International Journal
of Police Strategies & Management 25 (3), 457–471.
Sullivan, P. S., Dunham, R. G., Alpert, G. P., 1987. Attitude structures of different ethnic
and age-groups concerning police. Journal of Criminal Law & Criminology 78 (1), 177–
196.
Sun, S., 2002. Measuring the relative efficiency of police precincts using data envelopment
analysis. Socioeconomic Planning Sciences 36, 51–71.
Thanassoulis, E., Dec. 1995. Assessing police forces in england and wales using data en-
velopment analysis. European Journal of Operational Research 87 (3), 641–657.
Thanassoulis, E., Portela, M., Allen, R., 2004. Handbook on Data Envelopment Analysis.
Kluwer Academic Publishers, Dordrecht, Ch. Incorporating Value Judgements in DEA,
p. 99138.
42

Van Den Bogaerde, E., Van Den Steen, I., De Bie, A., Klinckhamers, P., Vandendriessche,
M., 2009. Veiligheidsmonitor 2008-2009: Analyse van de federale enquete. Tech. rep.,
Federale Politie, Directie Operationele Politionele Informatie, Politiebeleidsondersteun-
ing, 57 p.
Van Den Bogaerde, E., Van Den Steen, I., Klinckhamers, P., Vandendriessche, M., 2007.
Veiligheidsmonitor 2006: Analyse van de federale enquete. Tech. rep., Federale Politie,
Algemene Directie Operationele Ondersteuning, Directie van de nationale gegevensbank,
56 p.
Vandersmissen, V., Thijs, H., De Waele, M., Heerwegh, D., Loosveldt, G., 2008. Note-
sumo: Nonresponse to a telephone survey such as the security monitor. deel 1: algemene
situering en analyse van de representativiteit van de veiligheidsmonitor 2006, onder-
zoeksverslag surveymethodologie ceso/sm/2008-6. Tech. Rep. 6, Leuven: K.U.Leuven.
Centrum voor Sociologisch Onderzoek (CeSO), 106 p.
Wang, M. C., van Ryzin, J., 1981. A class of smooth estimators for discrete-distributions.
Biometrika 68 (1), 301–309.
Webb, V., Katz, C., 1997. Citizen ratings of the importance of community policing activi-
ties. Policing: An International Journal of Police Strategy and Management 20, 7–23.
Webb, V., Marshall, C., 1995. The relative importance of race and ethnicity on citizen
attitudes toward the police. American Journal of Police 14 (2), 45–66.
Worrall, J., 1999. Public perceptions of police efficacy and image: The “fuzziness” of
support for the police. American Journal of Criminal Justice 24, 47–66.
Wu, T. H., Chen, M. S., Yeh, J. Y., Aug. 2010. Measuring the performance of police forces
in taiwan using data envelopment analysis. Evaluation and Program Planning 33 (3),
246–254.
Zamble, E., Annesley, P., Dec. 1987. Some determinants of public-attitudes toward the
police. Journal of Police Science and Administration 15 (4), 285–290.
Zevitz, R., Rettammel, R., 1990. Elderly attitudes about police services. American Journal
of Police 9, 25–39.
43