
An Energy Sector Roadmap to Carbon Neutrality in China - NET
304
An Energy Sector Roadmap to Carbon Neutrality in China
-
Upload
khangminh22 -
Category
Documents
-
view
1 -
download
0
Transcript of An Energy Sector Roadmap to Carbon Neutrality in China - NET

An Energy Sector Roadmap to Carbon Neutrality in China

The IEA examines the full spectrum of energy issues including oil, gas and coal supply and demand, renewable energy technologies, electricity markets, energy efficiency, access to energy, demand side management and much more. Through its work, the IEA advocates policies that will enhance the reliability, affordability and sustainability of energy in its 30 member countries, 8 association countries and beyond.
Please note that this publication is subject to specific restrictions that limit its use and distribution. The terms and conditions are available online at www.iea.org/t&c/
This publication and any map included herein are without prejudice to the status of or sovereignty over any territory, to the delimitation of international frontiers and boundaries and to the name of any territory, city or area.
Source: IEA. All rights reserved.International Energy Agency Website: www.iea.org
IEA member countries:
Australia Austria BelgiumCanadaCzech Republic DenmarkEstoniaFinland France Germany Greece HungaryIreland ItalyJapanKorea Luxembourg Mexico Netherlands New Zealand NorwayPoland Portugal Slovak Republic Spain Sweden Switzerland Turkey United Kingdom United States
The European Commission also participates in the work of the IEA
IEA association countries:
BrazilChinaIndiaIndonesiaMoroccoSingaporeSouth AfricaThailand
INTERNATIONAL ENERGYAGENCY

An Energy Sector Roadmap to Carbon Neutrality in China Abstract
PAGE | 3 IEA,
202
1.
Abstract
In September 2020, President Xi Jinping announced that the People’s Republic of China will “aim to have CO2 emissions peak before 2030 and achieve carbon neutrality before 2060”. Amid the growing wave of governments around the world setting targets for reaching net zero emissions, no pledge is as significant as China’s. The country is the world’s largest energy consumer and carbon emitter, accounting for one-third of global CO2 emissions. The pace of China’s emissions reductions will be an important factor in global efforts to limit global warming to 1.5 °C.
This report, An Energy Sector Roadmap to Carbon Neutrality in China, responds to the Chinese government’s invitation to the International Energy Agency to co-operate on long-term strategies by setting out pathways for reaching carbon neutrality in China’s energy sector. It shows that achieving carbon neutrality fits with China’s broader development goals, such as increasing prosperity and shifting towards innovation-driven growth. The first pathway in this Roadmap – the Announced Pledges Scenario – reflects the enhanced targets China announced in 2020. The report also explores the implications of a faster transition – the Accelerated Transition Scenario – and the socio-economic benefits it would bring beyond those associated with reducing the impact of climate change.
This Roadmap examines the technology challenges and opportunities that this new phase of the clean energy transition will bring for China’s development, with a focus on long-term needs. The technology innovations required in the Chinese context are a key in-depth focus area. The report concludes with a series of policy considerations to inform China’s energy debate.
An Energy Sector Roadmap to Carbon Neutrality in China Acknowledgements
PAGE | 4 IEA,
202
1.
Acknowledgements, contributors and credits
This report was prepared by the Energy Technology Policy Division within the Directorate on Sustainability, Technology and Outlooks of the International Energy Agency. The study was designed and directed by Timur Gül (Head of the Energy Technology Policy Division). The analysis and production was co-ordinated by Araceli Fernández Pales (Head of the Technology Innovation Unit) and Peter Levi.
The main contributors were Thibaut Abergel (buildings, CO2 emissions decomposition), Praveen Bains (bioenergy, geospatial analysis), Simon Bennett (innovation policy), Niels Berghout (CCUS), Jose Miguel Bermudez Menendez (hydrogen), Cyril Cassisa (climate and energy policy), Xiushan Chen (climate and energy policy), Elizabeth Connelly (transport), Chiara Delmastro (buildings, investment), Alexandre Gouy (industry), Insa Handschuch (climate policy), Zoe Hungerford (electricity system flexibility), Jean-Baptiste Le Marois (innovation policy), Hana Mandová (industry), Rebecca McKimm (China policy), Rachael Moore (CCUS), Leonardo Paoli (transport, batteries), Faidon Papadimoulis (data management), Uwe Remme (energy supply), Alan Searl (China policy), Jacopo Tattini (transport), Jacob Teter (transport), Tiffany Vass (industry, material efficiency) and Daniel Wetzel (electricity, employment).
Other contributors were Adam Baylin-Stern, Ekta Bibra, Daniel Crow, Tomas De Oliveira Bredariol, Zhu Erpu, Carlos Fernández Álvarez, Timothy Goodson, Craig Hart, Taku Hasegawa, Paul Hughes, Luo Huilin, Huang Jingyun, Zhu Linxiao, Li Lishuo, Samantha McCulloch, Jeremy Moorhouse, Pawel Olejarnik, Francesco Pavan, Apostolos Petropoulos, Amalia Pizarro, Ryszard Pospiech, Jacques Warichet, Chengwu Xu, Gong Yuanyuan and Yang Ziyi. Caroline Abettan, Reka Koczka, Diana Louis, Per-Anders Widell and Zhang Yang provided essential support.
The work benefited greatly from the collaboration with and input from several Chinese experts: Da Yan (Tsinghua University), Lin Jin (Tsinghua University), Shan Hu (Tsinghua University), Teng Fei (Tsinghua University), Wan Can (Tsinghua University), Zhang Jian (Tsinghua University), Zhang Qiang (Tsinghua University), Jiang Kejun (Energy Research Institute), Zhou Dadi (Energy Research Institute), Chai Qimin (National Center for Climate Change Strategy and International Cooperation), Dang Yanbao (Ningxia Baofeng Energy Group Co

An Energy Sector Roadmap to Carbon Neutrality in China Acknowledgements
PAGE | 5 IEA,
202
1.
Ltd), Jiang Liping (State Grid Energy Research Institute), Li Yongliang (China Petroleum and Chemical Industry Federation), Qin Xiao (China Renewable Energy Engineering Institute), Wang Ke (Renmin University of China), Wang Zhixuan (China Electricity Council), Xiong Xiaoping (Development Research Center of the State Council), Zhang Jiutian (Beijing Normal University), Zhang Longqiang (China Metallurgical Information and Standardization Institute), Zhang Xian (Administrative Center for China's Agenda 21, Ministry of Science and Technology), Zhang Ying (Chinese Academy of Social Science) and Yang Lei (Peking University).
Valuable comments and feedback were provided by IEA senior management and other colleagues within the IEA, in particular, Mechthild Wörsdörfer, Laura Cozzi, Tim Gould, Brian Motherway, An Fengquan, Stéphanie Bouckaert, Peter Fraser, Tom Howes, An Fengquan, Christophe McGlade and Sara Moarif and Brent Wanner. Thanks also go to Jon Custer, Astrid Dumond, Tanya Dyhin, Merve Erdem, Grace Gordon, Christopher Gully, Jad Mouawad, Jethro Mullen, Isabelle Nonain-Semelin, Rob Stone, Julie Puech, Clara Vallois, Therese Walsh and Wonjik Yang of the IEA Communications and Digital Office for their help in producing the report.
We would like to extend our gratitude to Energy Foundation China for providing financial support as well as technical input to this work, in particular Zou Ji, Fu Sha, Du Xuan and Yang Zhuoxiang.
The study also benefits from financial support from the funders of the IEA Clean Energy Transitions Programme, in particular l’Agence Française de Développement. The chapter on innovation for carbon neutrality of the study also benefits from the analysis developed with the financial support provided by the European Commission and European Union's Horizon 2020 research and innovation programme funding under grant Agreement No 952363.
Trevor Morgan carried editorial responsibility and Debra Justus and Erin Crum were the copy-editors.
The analysis and findings in this report draw on strategic guidance, insights and data received during several IEA event and experts’ consultation meetings: a high-level workshop on the opportunities and challenges to reach carbon neutrality in China was held in April 2021.
Many experts from outside the IEA reviewed the report and provided comments and suggestions of great value. They include:

An Energy Sector Roadmap to Carbon Neutrality in China Acknowledgements
PAGE | 6 IEA,
202
1.
Aloncle Hervé Agence Française de Développement Ausfelder Florian DECHEMA Cattier François EDF Chen Xavier Beijing Energy Club Da Zhang Tsinghua University Dabo Guan Tsinghua University Fang Zhang Tsinghua University Feng Wei Lawrence Berkeley National Laboratory Gasc Jeremy Agence Française de Développement Hove Anders GIZ Ishwaran Mallika Shell Jinmiao Xu Asian Development Bank Jones Ayaka US Department of Energy Kan Flora ICF Ku Anthony NICE America Research, Inc Lu Hongyou Lawrence Berkeley National Laboratory Melaina Marc US Department of Energy Myllyvirta Lauri Centre for Research on Energy and Clean Air Ning Wei Chinese Academy of Sciences, Institute of Rock
and Soil Mechanics Philibert Cédric Consultant (former IEA) Ping Zhong MOST/ACCA21 Price Lynn Lawrence Berkeley National Laboratory Qi An Energy Research Institute Saheb Yamina International Panel on Climate Change Sandholt Kaare China National Renewable Energy Centre Shiyan Chang Tsinghua University Sol Aurélie Agence Française de Développement Thomas Wim Consultant (former Shell) Tongbo Sui Sinoma Tu Kevin Columbia University van Hulst Noé International Partnership for Hydrogen and Fuel
Cells in the Economy Voïta Thibaud NDC Partnership Zhong Frank World Steel Association, Beijing Zhou Nan Lawrence Berkeley National Laboratory Zifeng Lu Argonne National Laboratory

An Energy Sector Roadmap to Carbon Neutrality in China Acknowledgements
PAGE | 7 IEA,
202
1.
The individuals and organisations that contributed to this study are not responsible for any opinions or judgements it contains. The views expressed in the study are not necessarily views of the IEA’s member countries or of any particular funder or collaborator. All errors and omissions are solely the responsibility of the IEA.

An Energy Sector Roadmap to Carbon Neutrality in China Table of contents
PAGE | 8 IEA,
202
1.
Table of contents
Abstract ..................................................................................................................................... 3
Acknowledgements, contributors and credits ......................................................................... 4
Table of contents ..................................................................................................................... 8
Executive summary ................................................................................................................ 13
Chapter 1: Vision of a carbon neutral China ....................................................................... 18
Economic and social context .................................................................................................... 19 Energy and emissions trends ................................................................................................... 21 Energy and climate policies ..................................................................................................... 33 References ............................................................................................................................... 49
Chapter 2: The energy transition .......................................................................................... 52
A pathway to carbon neutrality ................................................................................................. 53 CO2 emissions .......................................................................................................................... 55 Energy trends ........................................................................................................................... 61 Environmental co-benefits ........................................................................................................ 68 Energy investment ................................................................................................................... 73 References ............................................................................................................................... 77
Chapter 3: Sectoral pathways ............................................................................................... 78
Power and heat generation ...................................................................................................... 79 Low-emissions fuel supply ....................................................................................................... 90 Industry ................................................................................................................................... 100 Transport ................................................................................................................................ 114 Buildings ................................................................................................................................. 129 References ............................................................................................................................. 143
Chapter 4: Technology needs for the energy transition .................................................. 147
Introduction ............................................................................................................................. 148 Electrification .......................................................................................................................... 148 CCUS ..................................................................................................................................... 160 Hydrogen ................................................................................................................................ 175 Bioenergy ............................................................................................................................... 189 References ............................................................................................................................. 198
Chapter 5: Near-term opportunities for a faster energy transition ................................. 201
Opportunities for a faster transition to 2030 ........................................................................... 202 The Accelerated Transition Scenario ..................................................................................... 202 Benefits of a faster transition .................................................................................................. 214 References ............................................................................................................................. 225

An Energy Sector Roadmap to Carbon Neutrality in China Table of contents
PAGE | 9 IEA,
202
1.
Chapter 6: Innovation for carbon neutrality ...................................................................... 226
Clean energy innovation in China .......................................................................................... 227 China’s approach to energy innovation .................................................................................. 233 Opportunities to accelerate innovation ................................................................................... 252 References ............................................................................................................................. 258
Chapter 7: Policy considerations ....................................................................................... 265
Towards a comprehensive policy framework ......................................................................... 266 Policy approach and priorities ................................................................................................ 267 Reducing emissions from existing assets .............................................................................. 272 Boosting markets for clean technologies ............................................................................... 278 Building clean energy infrastructure ....................................................................................... 283 Fostering clean energy innovation ......................................................................................... 288 International collaboration ...................................................................................................... 292 References ............................................................................................................................. 295
General annex ....................................................................................................................... 297
Abbreviations and acronyms .................................................................................................. 297 Units of measure .................................................................................................................... 300
List of figures Economic and development indicators in China and selected countries ................. 20 Total primary energy demand by fuel in China ........................................................ 23 Fossil fuel consumption by sector in China .............................................................. 24 Selected clean energy technologies in China relative to the rest of the world ......... 25 Greenhouse gas emissions in China and rest of the world, 2020 ........................... 27 CO2 emissions intensity of primary energy demand relative to CO2 emissions per
capita by country/region, 2000 and 2020 ................................................................. 29 CO2 emissions from existing energy-related infrastructure under typical lifetime
assumptions and operating conditions in China ...................................................... 31 Average age of key emissions-intensive assets in China ........................................ 32 Main climate and energy policy institutions in China ............................................... 43
Evolution of selected energy and climate policies and key priorities in China ......... 45 Energy-related CO2 emissions in China by scenario ............................................... 56 Energy sector CO2 emissions by fuel and technology in China in the APS ............. 58 Energy sector CO2 emissions reductions by measure in China in the APS ............ 59 Energy sector CO2 emissions by sector, sub-sector and fuel in China in the APS . 60 Primary energy demand in China by fuel and scenario ........................................... 63 Final energy demand by fuel and sector in China by scenario ................................ 64 Change in final energy demand by fuel and sector in China in the APS, 2020-2060
.................................................................................................................................. 65 Selected energy efficiency indicators in China in the APS ...................................... 66 Air pollutant emissions by type and sector in China in the APS .............................. 69
Illustration of population-weighted mean PM2.5 concentration and fossil fuel share in primary energy demand by selected region in China at carbon neutrality in 2060 .. 71
Annual energy investment by sector and technology area in China in the APS ...... 73

An Energy Sector Roadmap to Carbon Neutrality in China Table of contents
PAGE | 10 IEA,
202
1.
Average annual energy investment in emerging technologies by technology maturity in China in the APS .................................................................................................. 76
CO2 emissions reductions in power generation in China by driver in the APS ........ 79 Electricity demand by sector and generation by fuel in China in the APS ............... 80 Power generation capacity by type nationally and by region in China in the APS... 82 Fossil fuel capacity and generation by region in the APS ........................................ 83 Flexible capacity to ensure system adequacy in China in the APS ......................... 87 Flexible capacity to ensure system adequacy by type and share of variable
renewables in generation in China in the APS ......................................................... 88 Supply of low-emissions fuel by sector and fuel in China in the APS ...................... 91 Biofuels production by type and technology in China in the APS ............................ 93 Electrolyser capacity and CO2 capture from hydrogen production in China in the
APS .......................................................................................................................... 97 Production costs of hydrogen and hydrogen-derived fuels by technology in China in
the APS .................................................................................................................... 98 Industrial CO2 emissions and energy consumption in China in the APS ............... 101 Global production of major bulk materials and China’s share in the APS ............. 102 Technology penetration and energy sector CO2 emissions reductions by measure
and technology maturity in China’s chemicals sector in the APS .......................... 107 Technology penetration and energy sector CO2 emissions reductions by measure
and technology maturity in China’s steel sector in the APS ................................... 110 Clinker production by technology and cement sector CO2 emissions reductions by
measure and technology maturity in China in the APS .......................................... 112 Heating and electric motor technology deployment in light industries in China in the
APS ........................................................................................................................ 113 CO2 emissions from transport in China in the APS ................................................ 114 Modal shares and cumulative CO2 emissions reductions by measure and
technology maturity in surface passenger transport in China in the APS .............. 118 Freight activity and related CO2 emissions by mode in China ............................... 120 Total cost of ownership of heavy-duty trucks in China and Europe in the APS ..... 122 Share of heavy-duty trucks activity by mode and related CO2 emissions reductions
by measure and technology maturity in China in the APS ..................................... 123 Energy consumption and CO2 emissions in international shipping in China in the
APS ........................................................................................................................ 125 Domestic air travel in China and the United States and rail travel in China .......... 126 Share of aviation final energy demand by fuel and related CO2 emissions reductions
by measure and technology maturity in China in the APS ..................................... 128 Energy consumption and energy intensity index in buildings in China in the APS 131 Direct and indirect CO2 emissions in buildings by subsector and buildings
consumption by fuel in China in the APS ............................................................... 132 Share of building CO2 emissions reductions by maturity category and end use in
China in the APS .................................................................................................... 134 Buildings floor area and final energy intensity index for space heating and cooling in
China in the APS .................................................................................................... 135 Space heating equipment sales by type and average energy efficiency of space
heating and cooling equipment sold in China in the APS ...................................... 138 Schematic of a direct current electricity distribution and management in buildings
................................................................................................................................ 140 Average daily solar PV generation in buildings in China in 2060 in the APS ........ 141
CO2 emissions reductions from electrification by sector in China in the APS ....... 149 Growth in electricity consumption in China by sector and scenario, 2020-2060 ... 152 Cumulative CO2 emissions avoided by selected electricity technologies by maturity
category in China in the APS, 2020-2060 .............................................................. 154

An Energy Sector Roadmap to Carbon Neutrality in China Table of contents
PAGE | 11 IEA,
202
1.
EV battery demand and average unit CAPEX ....................................................... 155 Heat pump installed capacity and average unit CAPEX in the APS ...................... 158 Demand for selected critical metals for EVs in China in the APS .......................... 160 CCUS deployment by sector and source of emissions in China in the APS ......... 162 Global CCUS deployment by sector in the APS .................................................... 164 Cumulative CO2 emissions avoided in selected CCUS applications by maturity in
China in the APS, 2020-60 ..................................................................................... 165 Map of CO2 sources and potential geological storage in China ............................. 172 CO2 emissions avoided from hydrogen in China by sector in the APS .................. 175 Hydrogen production by route and hydrogen demand by sector in China in the APS
................................................................................................................................ 176 Existing oil refineries, ammonia and methanol plants, cost of renewables-based
hydrogen production and potential CO2 storage sites in China ............................. 178 Cumulative CO2 emissions avoided for selected low-carbon hydrogen technologies
by maturity in China in the APS ............................................................................. 181 Global electrolyser capacity for dedicated hydrogen production and average unit
CAPEX in the APS ................................................................................................. 183 Global demand for fuel cells for transport and average unit capital costs in the APS
................................................................................................................................ 187 Cumulative CO2 emissions reductions from bioenergy use by sector in China in the
APS ........................................................................................................................ 192 Primary bioenergy demand and share in total energy demand by sector in China in
the APS .................................................................................................................. 193 Cumulative CO2 emissions avoided from selected bioenergy technologies by
technology readiness in China in the APS, 2020-2060 .......................................... 196 Annual change in energy-related CO2 emissions in China, APS and ATS ............ 205 Change in energy sector CO2 emissions by sector and primary energy use in China
in 2030 in the ATS relative to the APS ................................................................... 206 Total coal consumption in 2030 by scenario/case and coal-fired power generation in
China in the APS and ATS ..................................................................................... 207 Indicators of the deployment of selected clean energy technologies in China in 2030
................................................................................................................................ 209 Annual average change in energy intensity in industry and bulk materials production
in China .................................................................................................................. 211 Fuel use by transport mode in China in the APS and ATS in 2030 ....................... 212 Zero-carbon-ready residential building retrofits and new construction in China .... 214 Global manufacturing capacity of selected clean energy technologies ................. 216 Indicators of the deployment of selected innovative clean energy technologies in
China in the APS and the ATS, 2030 ..................................................................... 217 Energy-related employment in China ..................................................................... 219 Additional workers needing clean energy skills or training in the APS and ATS,
2019-2030 .............................................................................................................. 221 Average annual growth rate of primary energy intensity and share of non-fossil fuels
in primary energy demand for the energy sector to achieve net zero CO2 emissions by 2050 in China .................................................................................................... 224
Figure 6.1 CO2 emissions reductions by current technology maturity category in China in the APS ........................................................................................................................ 228
Figure 6.2 China’s share of global public spending on low-carbon energy R&D, venture capital and patenting .......................................................................................................... 232
Figure 6.3 SOE ownership share of power generation capacity in G20 countries .................. 238 Figure 6.4 China’s role in international clean energy technology co-patenting ....................... 251 Figure 6.5 Low-carbon energy technology types mapped according to their general attributes
of size and modularity versus barriers to market entry .......................................... 254

An Energy Sector Roadmap to Carbon Neutrality in China Table of contents
PAGE | 12 IEA,
202
1.
Figure 7.1 Policy priorities for China’s net zero emissions strategy by technology maturity level ................................................................................................................................ 268
Figure 7.2 Energy sector CO2 emissions from existing infrastructure by sector assuming typical lifetimes in China in the APS .................................................................................. 273
Figure 7.3 Cumulative investment in selected energy infrastructure in China in the APS ...... 288
List of boxes Box 1.1 Paris Agreement and net zero emissions ................................................................ 38 Box 1.2 Corporate net zero targets in China ......................................................................... 41 Box 2.1 Modelling approach .................................................................................................. 55 Box 2.2 How does China’s expected emissions peak compare with other countries? ......... 56 Box 2.3 Bringing down fossil methane emissions in China ................................................... 71 Box 3.1 Electricity system flexibility requirements ................................................................. 85 Box 3.2 Implications of lower biofuels supply due to a lack of sustainable biomass ............ 95 Box 3.3 How public transport investments reduce reliance on private cars and domestic
flights in China ........................................................................................................ 117 Box 3.4 Shenzhen’s Future Complex DC building demonstration project .......................... 142 Box 4.1 Electricity system targets and policies ................................................................... 149 Box 4.2 EV battery manufacturing in China ........................................................................ 156 Box 4.3 CCUS deployment targets and policies ................................................................. 161 Box 4.4 China’s role in global hydrogen value chains ......................................................... 182 Box 4.5 Regional hydrogen FCEV strategies in China ....................................................... 185 Box 4.6 Bioenergy deployment targets and policies ........................................................... 191 Box 5.1 The impact of a faster energy transition on fossil methane emissions .................. 207 Box 6.1 Bounty system ........................................................................................................ 231 Box 6.2 Coal conversion: example of large-scale, centrally co-ordinated technology
innovation ............................................................................................................... 235 Box 6.3 Nuclear technology development by SOEs............................................................ 239 Box 6.4 Hydrogen technology development at the sub-national level ................................ 243 Box 6.5 Turbo-charging China’s EV technologies by boosting demand ............................. 246 Box 6.6 China’s transformation from a solar PV technology importer to innovator ............. 251 Box 7.1 Unlocking emissions in China’s heavy industry sectors ......................................... 273 Box 7.2 China’s electricity market reforms .......................................................................... 284
List of tables Selected economic and energy indicators for China ................................................ 21 Recent Five-Year Plan targets and attainment ........................................................ 47 Key projects targeting emissions reductions in heavy industry in China ............... 105 Key projects targeting emissions reductions in heavy industry in China ............... 105 Potential CO2 storage hubs in China ..................................................................... 171 CO2 trunk line deployment strategies towards 2060 .............................................. 174 Average performance of selected end-use indicators in China ............................. 210 Cumulative additions of selected carbon-intensive energy assets in China in the
APS and ATS, 2021-2030 ...................................................................................... 222 Table 6.1 Technology development and key energy innovation priorities outlined in China’s
recent five-year plans ............................................................................................. 229 Table 6.2 Low-carbon energy technology groups relative to possible innovation policy
approaches that build on China’s innovation strengths ......................................... 256

An Energy Sector Roadmap to Carbon Neutrality in China Executive summary
PAGE | 13 IEA,
202
1.
Executive summary There is no plausible path to limiting the global temperature rise to 1.5 °C without China1. In September 2020, President Xi Jinping announced that China will “aim to have CO2 emissions peak before 2030 and achieve carbon neutrality before 2060”. Announced 40 years after the country began its remarkable journey towards economic modernisation, this new vision for China’s future comes amid growing convergence among the world’s major economies on the need to reach net zero emissions globally by mid-century. But no pledge is as significant as China’s: the country is the world’s largest energy consumer and carbon emitter, accounting for one-third of global CO2 emissions. The pace of China’s emissions reductions over the coming decades will be important in determining whether the world succeeds in preventing global warming from exceeding 1.5 °C.
The energy sector is the source of almost 90% of China’s greenhouse gas emissions, so energy policies must drive the transition to carbon neutrality. This Roadmap responds to the Chinese government’s invitation to the IEA to co-operate on long-term strategies by setting out pathways for reaching carbon neutrality in China’s energy sector. It also shows that achieving carbon neutrality fits with China’s broader development goals, such as increasing prosperity, strengthening technology leadership and shifting towards innovation-driven growth. The first pathway in this Roadmap – the Announced Pledges Scenario (APS) – reflects China’s enhanced targets that it declared in 2020 in which emissions of CO2 reach a peak before 2030 and net zero by 2060. The Roadmap also explores the opportunities for an even faster transition and the socio-economic benefits it would bring to China beyond those associated with reducing the impact of climate change: the Accelerated Transition Scenario (ATS).
China can build on its current clean energy momentum
China’s energy sector reflects decades of efforts to lift hundreds of millions of people out of poverty while pursuing other energy policy goals. Energy consumption has doubled since 2005, but the energy intensity of gross domestic product (GDP) has decreased significantly in the same period. Coal accounts for over 60% of power generation – and new coal power plants continue to be built – but solar photovoltaics (PV) capacity additions have outpaced those of any other country. China is the second largest oil consumer in the world, but also home to 70% of global manufacturing capacity for electric vehicle batteries, with Jiangsu province alone accounting for one-third of the country’s capacity. China’s
1 The People’s Republic of China (hereinafter, "China")

An Energy Sector Roadmap to Carbon Neutrality in China Executive summary
PAGE | 14 IEA,
202
1.
contributions to low-carbon technologies, particularly solar PV, were mostly driven by the government’s increasingly ambitious five-year plans, leading to cost reductions that have changed the way the world thinks about the future of clean energy. If the world is to meet its climate goals, then similar clean energy progress is needed – but on a greater scale and in all sectors. For example, China produces more than half the world’s steel and cement, with Hebei province alone accounting for 13% of global steel production in 2020. CO2 emissions from the steel and cement sectors in China alone are higher than the European Union’s total CO2 emissions.
China’s CO2 emissions are rising, but a peak before 2030 is in sight. The sooner the emissions peak comes, the higher China’s chance of reaching carbon neutrality on time. The leading sources of China’s emissions are the power sector (48% of CO2 emissions from energy and industrial processes), industry (36%), transport (8%) and buildings (5%). The specific targets made public so far from the latest Five-Year Plan include an 18% reduction in CO2 intensity and a 13.5% reduction in energy intensity during the period 2021-2025. There is also a non-binding proposal to raise the non-fossil fuel share of total energy consumption to 20% by 2025 (from around 16% in 2020). If China achieves these short-term policy targets, the IEA projects that China’s CO2 emissions from fuel combustion will be on track to plateau in the mid-2020s and then enter a modest decline to 2030. We also note China's commitment at the United Nations General Assembly in September 2021 to discontinue building coal-fired power projects abroad and to step up support for clean energy.
Carbon neutrality demands a rapid and profound transformation of the energy sector
Reaching a peak in China’s CO2 emissions before 2030 relies on progress in three key areas: energy efficiency, renewables and reducing coal use. In the APS, China’s primary energy demand grows much more slowly through 2030 than the overall economy. This is mainly the result of efficiency gains and a shift away from heavy industry. A transforming energy sector leads to rapid improvements in air quality. Solar becomes the largest primary energy source by around 2045. Demand for coal drops by more than 80% by 2060, oil by around 60% and natural gas by more than 45%. By 2060, almost one-fifth of electricity is used to generate hydrogen.
The level of investment required for China to achieve its goals is well within its financial means. Energy sector investment climbs significantly in absolute terms, but falls as a share of overall economic activity. Total annual investment

An Energy Sector Roadmap to Carbon Neutrality in China Executive summary
PAGE | 15 IEA,
202
1.
reaches USD 640 billion (around CNY 4 trillion) in 2030 – and nearly USD 900 billion (CNY 6 trillion) in 2060, almost a 60% increase relative to recent years. Annual energy investment’s share of GDP, which averaged 2.5% in 2016-2020, drops to just 1.1% by 2060.
Every sector has a viable path to deep cuts in emissions A power sector dominated by renewables provides the foundation for China’s clean energy transition. China’s power sector achieves net zero CO2 emissions before 2055 in the APS. Renewables-based generation, mainly wind and solar PV, increases seven-fold between 2020 and 2060, accounting for almost 80% of generation by then. By contrast, the share of coal drops from over 60% to just 5%, and unabated coal-based generation stops in 2050. Renewable capacity rises at least three-fold in all regions by 2060, with the largest growth in China’s northwest and northern regions where solar and onshore wind take advantage of strong resource potential and good availability of land. However, investments in low-carbon flexibility sources to increase the reliability and resilience of electricity systems are highest in China’s coastal provinces.
Efficiency improvements and today’s market-ready technologies can only take the industry sector part of the way to net zero. In the APS, industrial CO2 emissions decline by nearly 95% and unabated coal use by around 90% by 2060, with the residual emissions being offset by negative emissions in the power and fuel transformation sectors. Energy efficiency improvements and electrification drive most of the industrial emissions reductions in the short term, while emerging innovative technologies, such as hydrogen and carbon capture, utilisation and storage (CCUS), take over post-2030.
Electrification is the key to decarbonising transport and buildings. New investments in metro, light-rail and electric buses in cities, and high-speed rail between cities, lower the energy intensity of passenger trips. Emissions reductions in road freight, shipping and aviation come from fuel efficiency gains and use of low-carbon fuels. Direct CO2 emissions in the buildings sector drop by more than 95% by 2060 through electrification, clean district heating and energy efficiency.
Faster progress before 2030 is possible and beneficial An early push reduces the emissions burden faced after 2030. The timing and level of the peak in emissions, as well as the pace of emissions reductions once the peak has been reached, are crucial for the achievement of China’s longer-term goal of carbon neutrality. China has the technical capabilities, economic means and policy experience to accomplish a faster clean energy transition to 2030 than in the APS. Its recently launched emissions trading scheme and its power market

An Energy Sector Roadmap to Carbon Neutrality in China Executive summary
PAGE | 16 IEA,
202
1.
reforms are two clear examples. In the ATS, policy progress accelerates, resulting in a faster decline in coal use in power and industry, stronger deployment of existing low-carbon technologies, and more rapid efficiency gains. In 2030, energy sector CO2 emissions are more than 2 Gt, or nearly 20%, lower in the ATS than their level today. Investment needs are not a major barrier: cumulative investments in the ATS are similar to those in the APS.
Accelerated progress before 2030 delivers socio-economic benefits beyond those linked to addressing climate change. They include bringing greater prosperity to regions that have not yet fully benefited from China’s economic development, its central role in global clean energy technology value chains and its emerging leadership in clean energy innovation. Accelerated domestic action increases employment in China’s clean energy supply by 3.6 million by 2030, compared with the 2.3 million jobs lost in fossil fuel supply and fossil fuel power plants. Net additional jobs in this faster transition are almost 1 million higher than in the announced pledges pathway. Employment could grow even more if China captures some of the raising demand for clean energy technologies driven by other countries’ greater ambition.
Expanding the scope of China’s neutrality target to cover all greenhouse gases would underscore the benefits of an early peak in CO2 emissions. Such an ambition could require the energy sector to reach net zero CO2 emissions well before 2060 to compensate for the non-energy sector emissions that are more difficult to eliminate. This would make accelerated progress in reducing CO2 emissions through to 2030 essential. The longer-term transition challenge would be profound: for example, reaching net zero CO2 emissions as soon as 2050 would imply that the installed capacity of solar PV and wind would be around 1 400 GW, or 20%, higher than it is in the APS in 2050.
Dealing with existing assets helps an orderly transition Even without any further investment in new fossil fuel assets, China’s energy-related emissions would still only decline very slowly. If the existing emissions-intensive infrastructure in China today continues to operate in the same way it has in the recent years, it could result in 175 Gt of CO2 emissions between now and 2060. This is the equivalent of one-third of the remaining global emissions budget that could limit the global temperature rise to 1.5 °C.
The next cycle of heavy industry investment in China could result in a huge amount of additional emissions if cleaner alternatives are not ready in time. In the APS, about 40% of the Chinese energy sector’s CO2 emissions reductions in 2060 come from technologies that are still at the prototype or demonstration stage today. It is essential to have new and emerging low-carbon industrial technologies

An Energy Sector Roadmap to Carbon Neutrality in China Executive summary
PAGE | 17 IEA,
202
1.
available at the time of the planned phase-out of existing capacity so as to avoid the need for a further cycle of emissions-intensive capacity renewal. This alone could avoid emissions from heavy industry in China equivalent to almost 15% of the remaining estimated global carbon budget that is compatible with a 50% chance of limiting the average temperature increase to 1.5°C.
A faster clean energy transition between now and 2030 makes the process easier to navigate for existing assets and their stakeholders. The ATS avoids around 20 Gt of “locked-in” emissions to 2060 from long-lived assets in the power and industry sectors that are built in the period to 2030 in the APS. This early action means that the required average annual pace of emissions reductions to reach carbon neutrality by 2060 is nearly 20% lower over 2030-2060 than in the APS, leaving more time for markets to adjust and businesses and consumers to adapt.
Innovation is essential for the transition to succeed Reaching carbon neutrality by 2060 hinges on a major acceleration in clean energy innovation. China is emerging as a world leader in clean energy innovation: public spending on low-carbon energy research and development (R&D) in China has risen by 70% since 2015. China accounts for nearly 10% of patenting activity in renewables and EVs. In recent years, its start-ups have attracted more than one-third of global early-stage energy venture capital.
But China’s innovation system will need to be harnessed appropriately to stimulate the wide range of low-carbon energy technologies needed. The latest Five-Year Plan aims to shift the focus of innovation to low-carbon technologies and pursue new policy approaches. Current Chinese policy incentives are better suited to large-scale technologies like CCUS and biorefining than network infrastructure and consumer-facing products, which are China’s current manufacturing strengths. Beyond direct R&D funding, policies can incentivise innovators through competitive niche markets, infrastructure investments and other regulatory measures to stimulate technology deployment.
A central actor in the world’s energy and climate future China’s many strengths make it well-placed to successfully carry out its own transition to carbon neutrality while also demonstrating international leadership in technology and energy policy making. China is both the world’s largest emitter and the largest manufacturer of key clean energy technologies such as solar panels and EV batteries. What happens in China will go a long way towards shaping the outcome of global efforts to reduce emissions in time to prevent the worst effects of climate change. For those efforts to succeed, international collaboration with China is essential.

An Energy Sector Roadmap to Carbon Neutrality in China Chapter 1: Vision of a carbon neutral China
PAGE | 18 IEA,
202
1.
Chapter 1: Vision of a carbon neutral China
Highlights
The People’s Republic of China (hereafter, “China”) has been the fastest growing major economy in the world since 1980, with gross domestic product (GDP) expanding more than 30-times. In 2020, its economy was the largest in the world when adjusted for purchasing power parity. Industrialisation and urbanisation have been the principal motors of its economic transformation. Today, China accounts for a quarter of the world’s industrial output by value added, producing more than half its cement and steel.
Rapid growth in the production and use of energy has been both the driver and the consequence of China’s economic growth. China became the world’s largest energy consumer in 2009. Primary demand growth has slowed in recent years, from 8% annual increase over 2000-2010 to just over 3% over 2015-2020. Despite impressive growth in renewables and hydropower since 2000, China remains heavily dependent on fossil fuels, which met around 85% of the its total primary energy needs in 2020 – coal alone accounting for almost 60% and oil for about a fifth. China is by far the largest coal-consumer in the world, as well as the largest market for solar, wind and electric vehicles.
China is the world’s largest emitter of greenhouse gases, at about a quarter of global emissions. Carbon dioxide emissions from fuel combustion and industrial processes reached more than 11 gigatonnes CO2 in 2020, of which around 90%, were from fuel combustion. Coal-fired power stations alone, including combined heat and power plants, were responsible for more than 45% of China’s entire energy and process-related emissions and 15% of global emissions in 2020.
In September 2020, China’s president announced national aims to have CO2 emissions peak before 2030 and to achieve carbon neutrality before 2060. CO2 emissions per unit of GDP are targeted to fall by more than 65% between 2005 and 2030, the share of non-fossil fuels in primary energy use to around 25% and wind and solar capacity to rise to over 1 200 gigawatt (GW) in 2030 (from about 540 GW now). Growth in coal use is to be limited in the period to 2025 and phased out thereafter.
China’s 14th Five-Year Plan (FYP) for 2021-2025 is a key policy instrument. It contains binding targets to reduce energy intensity by 13.5%, carbon intensity by 18% and to reach 20% share of non-fossil fuel in primary energy use by 2025. Further national, sectoral and technology plans are expected to be adopted in the coming years, including for total energy consumption and emissions.
Achieving China’s stated goals is critical to combat climate change. They could lower global average temperature by almost 0.2 °C by the end of the century. The goals require China to be quicker to get from peak to net zero emissions than most other countries, many of whom have already experienced a peak in their CO2 emissions.

An Energy Sector Roadmap to Carbon Neutrality in China Chapter 1: Vision of a carbon neutral China
PAGE | 19 IEA,
202
1.
Economic and social context The People’s Republic of China (herein after China) has accomplished breathtaking rates of economic and social development since the process of transforming its planned socialist system to a more open, market-based economy was launched at the end of the 1970s. China has been the fastest growing major economy in the world since 1980, with GDP now more than 30-times larger than in 1980 and five-times larger than at the turn of the century. In 2020, its economy was the second largest in the world behind the United States in nominal terms and the largest when adjusted for purchasing power parity (PPP). GDP per capita in PPP terms was around US dollars (USD) 17 000 (Yuan renminbi [CNY] 117 300) in 2020 – about 40% of the average for the European Union and Japan, and more than one-quarter of that for the United States. The Covid-19 pandemic caused GDP to contract for all major economies except China, where GDP growth slowed to 2.3% in 2020. China’s GDP growth is projected to rebound by more than 8% in 2021 – the fastest rate of any major economy other than India (IMF, 2021).
Industrialisation has been the principal motor of China’s economic transformation. It has been the world’s largest producer of industrial goods since 2007, with manufacturing output growing particularly rapidly following its accession to the World Trade Organisation in 2001. A series of five-year plans (FYPs) have set ambitious growth targets for industrial sectors (OECD, 2018). Today China accounts for one-quarter of the world’s total industrial production by value added and is the leading producer of steel, cement, aluminium, chemicals, electronics and textiles. It produces more than half of all the world’s cement and steel.
China’s industrial expansion initially was driven principally by exports, but it is increasingly underpinned by a rapidly growing domestic market. The gradual opening of the Chinese economy to foreign investment also helped to boost economic growth through its integration into global value chains. Today, industry accounts for 40% of China’s GDP in PPP terms – one of the highest shares in the world. Industrialisation also affects activities in other sectors such as transport. For example, the development of industrial clusters mainly in the east supplied with raw materials produced in provinces in the west and north contributed to an increase in freight from about 4 trillion t-km in 2000 to about 14 trillion t-km in 2010 and more than 20 trillion t-km in 2020.
Since the early 2010s, economic growth has moderated slightly with a reorientation of China’s development towards higher value manufactured goods and services. Over investment in manufacturing capacity during the earlier period of high domestic economic growth and strong international demand as well as the economic stimulus after the 2008 financial crisis, led to overcapacity and low

An Energy Sector Roadmap to Carbon Neutrality in China Chapter 1: Vision of a carbon neutral China
PAGE | 20 IEA,
202
1.
utilisation rates in some industrial sub-sectors, notably steel, cement, aluminium, chemicals, refining, glass, ship-building, and paper and paperboard. China has stepped up efforts in recent years to address overcapacity, such as by setting targets for closing inefficient plants and limiting new capacity additions in certain sub-sectors, with the aim of upgrading its industries and shifting investment to high value-added manufacturing. The “Made in China 2025” initiative launched in 2015 targeted a four percentage point increase in manufacturing value-added share by 2025 (State Council, 2015). The 14th FYP (2021-2025) aims to increase the share in GDP of strategic emerging sectors, including next-generation information technology, biotechnology, new energy, new materials, high-end equipment and new energy vehicles, from around 12% in 2019 to 17% by 2025 (State Council, 2021).
Economic and development indicators in China and selected countries
IEA, 2021.
Notes: Gross domestic product (GDP) is expressed in purchasing power parity (PPP) terms and constant 2019 values. Sources: IEA analysis based on UNDESA (2019); Oxford Economics (2020); IMF (2020a, 2020b), World Bank (2021)
China has accomplished breathtaking rates of economic and social development, transforming people’s way of life and its standing in the world
Today, the services sector is the main contributor to China’s economic growth, though a shift towards a services-based economy remains at an early stage. The share of services in GDP at current prices rose from 40% in 2000 to 54.5%1 in 2020, just under the target of 56% in China’s 13th FYP (2016-2020). In 2019, more than 367 million Chinese, or 47% of the total workforce, were employed in services (compared with 25% in agriculture and 28% in industry) – up from less than 200 million, or 27%, in 2000.
1 This is equivalent to a rise from 47% in 2000 to 53% in 2020 when services value added and GDP are expressed in purchasing power parity terms at constant USD 2019 values.
0
4
8
12
16
20
2000 2010 2020
Thou
sand
USD
PPP
(201
9) p
er c
apita
Value added and GDP per capita
Agriculture
Industry
Service
China
World
Value added per capita
GDPper capita
0%
2%
4%
6%
8%
0
20
40
60
80
Aver
age
annu
al g
row
th ra
te, 2
000 -
20
(mar
ker)
Thou
sand
USD
PPP
(201
9) p
er c
apita
GDP per capita, 2020

An Energy Sector Roadmap to Carbon Neutrality in China Chapter 1: Vision of a carbon neutral China
PAGE | 21 IEA,
202
1.
Economic development has been accompanied by rapid urbanisation and profound social and cultural changes, transforming people’s way of life as well as China’s standing in the world. The share of the population living in cities jumped from 36% in 2000 to more than 60% in 2020. The fight against poverty has been extraordinarily successful. The share of the population living under the official poverty threshold of around USD 600 (approximately CNY 4 000) at 2020 prices per person per year fell to under 1% in 2020 compared with about 50% just 20 years before. In addition, 430 million people gained access to clean cooking fuels such as modern solid biomass, liquefied petroleum gas, biogas and electricity over that period. Universal access to electricity was achieved in 2014.
The focus of economic development in coastal regions has led to large regional variations in living standards, ranging from extreme poverty to relative prosperity. Roughly two-thirds of the population lives in east and central China, where four of the five most heavily populated provinces – Guangdong, Henan, Jiangsu and Shandong – are located. In much of rural China, most people still rely on subsistence farming, while in major cities like Shanghai and Beijing, a modern services-based economy has emerged. Unlike most other emerging economies, the population increase has not been a major driver of economic growth for the last 20 years. China’s population increased by just 11% since 2000, reaching just over 1.4 billion by 2020. GDP per capita in PPP terms increased by over 9% per year on average from 2000 to 2010 and by more than 6% per year since 2010 despite a slowdown in 2020.
Selected economic and energy indicators for China
Indicator 2000 2010 2020 Change 2000-2020
GDP (USD billion PPP [2019]) 4 790 12 747 24 410 +410%
Share of world GDP 7% 13% 19% +12%-points
GDP per capita (USD PPP [2019]) 3 773 9 479 17 291 +358%
Population (millions) 1 269 1 345 1 412 +11%
Total primary energy demand (EJ) 49 107 148 +200%
Primary energy demand per capita (GJ/capita) 39 80 104 +170%
Import dependency (%) 4% 15% 23%* +19%-points
Energy sector CO2 emissions (Gt CO2) 4 9 11 +218%
Energy intensity (MJ per USD PPP) 10.2 8.4 6.0 -41%
Carbon intensity (g CO2/USD PPP) 655 616 412 -37%
* 2019 values. Notes: GDP = gross domestic product; PPP = purchasing power parity. Import dependency is calculated based on the difference between imports and exports relative to total primary energy demand.
Energy and emissions trends Rapid growth in the production and use of energy – particularly domestic coal – has historically been both the motor and the consequence of China’s economic renaissance. The strong reliance on energy-intensive industries in driving

An Energy Sector Roadmap to Carbon Neutrality in China Chapter 1: Vision of a carbon neutral China
PAGE | 22 IEA,
202
1.
economic development led to China becoming the world’s largest energy consumer in 2009, while its reliance on coal has made it the biggest emitter of energy-related CO2 since 2005. The reorientation of economic development towards less energy-intensive sectors, continuous efficiency improvements and the adoption of stricter environmental standards is starting to curb the country’s voracious appetite for fossil fuel use in many end-use sectors and steer demand towards electricity, though emissions have continued to climb due mainly to the growth in the use of coal for power and heat generation. China has significantly improved air quality in recent years, but air pollution remains a serious health problem, especially in urban agglomerations and industrial clusters (see Chapter 2).
Energy use Changes in the structure of the Chinese economy towards lighter industry and services, combined with efforts to enhance energy efficiency through tighter regulations have helped to substantially slow the rate of growth in energy demand in recent years. Those regulations include the Top 100/1000/10000 programme – an energy conservation initiative covering enterprises that started in 2006 and expanded under the 13th FYP (2016-2020) – and minimum energy performance standards (see Chapter 7). Primary energy demand rose on average by more than 8% per year between 2000 and 2010, slowing to 3.4% in the five years to 2015 and just over 3% over 2015-2020.2 As a result of continued rapid GDP growth, the fall in energy intensity of GDP (energy demand per monetary unit of GDP in PPP terms) accelerated in the 2010s, from an average of 2% in 2000-2010 to over 3% per year between 2010 and 2020.
Despite impressive growth in renewables since 2000, China remains heavily dependent on fossil fuels, which met around 85% of the country’s total primary energy needs in 2020 – coal alone for about 60% and oil for about a fifth. China is by far the largest coal-consuming country in the world, the 3 billion tonnes of coal equivalent it burned in 2020 making up more than 50% of the world market (IEA, 2020a). China’s coal consumption historically increased in parallel with its industrialisation, most rapidly from 2002 to 2013, when coal contributed 77% of the overall increase in the country’s primary energy demand. Cement, chemicals and steel plants alone accounted for half of this increase, 30% of it (or 15% of the total increase in coal demand) indirectly through the use of electricity (generated
2 The IEA and official Chinese energy statistics differ due to methodological differences. The IEA uses the physical energy content method (PEC method) while China uses the partial substitution method (PS method). Unless otherwise stated, all energy data in this report are from the IEA.

An Energy Sector Roadmap to Carbon Neutrality in China Chapter 1: Vision of a carbon neutral China
PAGE | 23 IEA,
202
1.
primarily in coal-fired power plants). Coal use has been broadly flat from 2013 to 2018 as a result of efficiency improvements and policy limits on coal use expansion, but coal demand increased again in 2019 and 2020 and in early 2021.
Total primary energy demand by fuel in China
IEA, 2021.
Despite impressive growth in renewables since 2000, China remains heavily dependent on fossil fuels, with coal alone still meeting 60% of its total primary energy needs
The development of a coal-based economy was made possible by the availability of ample low cost domestic coal resources. China is by far the world’s largest coal producer, accounting for roughly half of global production. Nonetheless, coal consumption exceeds domestic production capacity and the country has become increasingly dependent on imports, which now make up about 8% of total coal consumption. Coal is mainly used for electricity and heat generation, which accounts for 60% of total coal use (industry uses 33%, buildings 3% and agriculture and non-energy use 4%). Coal remains by far the most important fuel in the power and heat sector, accounting for three-quarters of total output in 2020, though its share has fallen from its peak of 90% in 2007. China currently has 1 080 GW of installed coal-fired power capacity – more than half of global coal capacity – and nearly 250 GW at various stages of development (CEC, 2021). Of the 88 GW of capacity that has been officially approved, 37 GW was authorised in 2020 – three-times more than in 2019 (Reuters, 2021).
0
40
80
120
160
2000 2005 2010 2015 2020
EJ Other renewables
Hydropower
Bioenergy and waste
Nuclear
Natural gas
Oil
Coal

An Energy Sector Roadmap to Carbon Neutrality in China Chapter 1: Vision of a carbon neutral China
PAGE | 24 IEA,
202
1.
Fossil fuel consumption by sector in China
IEA, 2021.
Notes: Power sector includes power and heat generation.
Coal still dominates power generation, though its relative importance has declined significantly in recent years with growing capacity additions of renewables and nuclear
Demand for oil and natural gas has also grown considerably since 2000. Oil use has risen at an annual average rate of 5%, complementing the use of coal in heavy industries and meeting rapidly rising demand for personal transport and freight. Gas demand has risen briskly since 2015 with strong policy support, particularly for power generation, industrial uses, and residential and commercial space and water heating. Despite significant domestic production of oil and gas, China relies heavily on imports, which met over 70% of its consumption of oil and 45% of gas in 2020. China surpassed the United States to become the largest importer of oil in 2017 and became the largest net importer of natural gas in 2018, ahead of Japan.
Despite the continued dominance of fossil fuels, the use of modern low-carbon fuel and technologies, including nuclear, hydropower, bioenergy and other renewables, has grown considerably over the last decade, their share of total primary energy demand rising from 9% in 2011 to 14% in 2020.3 Renewables-based electricity and nuclear power made up more than 9% of total primary energy demand in 2020. Hydropower has accounted for 35% of total renewable capacity additions since 2000. Two plants – the Three Gorges and the Xiluodu Dam – contributed the bulk of the increase in hydropower capacity and output.
3 According to China’s National Energy Administration, the share of non-fossil energy in total primary energy demand reached 15.9% by end of 2020, exceeding the 15% target set for 2020.
0 15 30 45 60 75 90
2020
2000
2020
2000
2020
2000
Nat
ural
gas
Oil
Coa
l
EJ
Power
Fuel transformation
Industry
Transport
Buildings
Other

An Energy Sector Roadmap to Carbon Neutrality in China Chapter 1: Vision of a carbon neutral China
PAGE | 25 IEA,
202
1.
Another 60% of renewable capacity additions since 2000 has come from solar photovoltaic (PV) and wind power. Installed capacity of the two sources combined reached about 540 GW in 2020, more than half of which is onshore wind turbines. Total installed capacity of utility-scale solar PV stands at 180 GW today, with rooftop panels and offshore wind capacity accounting for about 90 GW. Most of those solar PV panels were manufactured in China, which has become the world’s leading producer, helping to bring down costs globally (see Chapter 5).
Nuclear power has also increased markedly, with 48 reactors commissioned between 2000 and 2020, taking the total to 51 and boosting the share of nuclear in primary energy demand from 0.4% to 2.7% and the share of power generation from 1.2% to over 5%. Renewables including hydro plus nuclear power accounted for about 30% of power generation in 2020, compared with only 18% in 2000. Their expansion helped drive down the carbon intensity of electricity generation to 610 g CO2/kWh in 2020 from 650 g CO2/kWh five years before and close to 900 g CO2/kWh in 2000.
Selected clean energy technologies in China relative to the rest of the world
IEA, 2021.
China plays a leading role in the deployment of clean energy technologies, accounting for half of the world’s electric car fleet and 70% of solar thermal capacity
Industry is the leading energy end-use sector; its share of energy demand remaining relatively stable over the last decade, accounting for between 59% and 65% of total final energy consumption. Although its use of coal has declined by 17% since 2014, it is still the dominant fuel in industry, accounting for 50% of China’s total industrial energy use in 2020, compared with around 30% in the rest of the world. The steel and cement sub-sectors are responsible for more than 70%
0
500
1 000
1 500
2010 2015 2020
Inst
alle
d ca
paci
ty, G
W Solar PV and wind
China Rest of world
0
4
8
12
2010 2015 2020
Milli
on c
ars
Electric cars
0
100
200
300
400
500
600
2010 2015 2020
GW
ther
mal
Solar thermal

An Energy Sector Roadmap to Carbon Neutrality in China Chapter 1: Vision of a carbon neutral China
PAGE | 26 IEA,
202
1.
of industrial coal use, with the rest used as chemical feedstock (4%) and as boiler fuel in a range of sectors. The use of electricity has risen by nearly 70% and that of natural gas more than doubled since 2010, with both fuels displacing coal for low-temperature heat. Natural gas is also increasingly used in chemicals production.
Transport saw the biggest increase in energy demand in percentage terms over the decade to 2020, though it still only accounts for about 15% of total final energy use in China. Road vehicles account for over 80% of transport energy use, with passenger modes (two/ three-wheelers, cars and buses) consuming slightly more than road freight (trucks, light commercial vehicles). Fuel use in domestic aviation has risen even faster than that for cars, but not as fast as road freight. Oil products account for around 85% of China’s transport energy demand. The recent take-off of electric vehicles (EVs) is tempering the rise in oil demand for road transport. There were more than 4.5 million electric cars on the road in China in 2020 – 45% of the global fleet – of which nearly 80% are battery electric and the rest are plug-in hybrids. The 580 000 electric buses and 240 million electric two/wheelers on the road in China at the end of 2020, made up 98% and 78% of the global fleets respectively, and displaced more oil demand than all the world’s electric cars, China’s included (IEA, 2021a). China is by far the biggest global battery manufacturer, accounting for around 70% of total installed capacity at end-2020 and just under half of electric car battery production worldwide in 2020 (see Chapter 4).
The share of the buildings sector in China’s final consumption has remained roughly stable in recent years at just over one-fifth. Electricity use has risen most rapidly, accounting for 35% of total energy use in buildings in 2020. An increasing share of this electricity is used for heating: every year since 2015 sales of heat pump water heaters have exceeded 1 million units. Installations of groundwater geothermal heat pumps have been rising briskly, supplying more than 1 billion m2 of floor area with heat in 2020 out of a total of almost 65 billion m2 in China. Total installed capacity of solar thermal collectors approached 350 GW in 2020 – almost two-and-a-half times more than in 2010 – thanks to measures introduced by the government to fight against air pollution caused by burning coal, such as the Clean Winter Heating Programme (2017-2021), which applied to Beijing, Tianjin and 26 other cities. The deployment of clean energy building technologies remains heavily dependent on financial incentives. A reduction in incentives led to a fall in solar thermal installations, which peaked in 2013.

An Energy Sector Roadmap to Carbon Neutrality in China Chapter 1: Vision of a carbon neutral China
PAGE | 27 IEA,
202
1.
Energy sector CO2 emissions
Emissions trends China is the world’s largest emitter of greenhouse gases (GHGs), accounting for around a quarter of global emissions. Its emissions totalled about 13 Gt CO2-eq in 2020, equating to 9 t CO2 per capita – 45% higher than in the rest of the world. CO2 emissions from fuel combustion and industrial processes, referred to hereafter as energy sector CO2 emissions, reached more than 11 Gt in 2020 and made up almost 90% of China’s total GHG emissions, compared with under 60% for the rest of the world, reflecting its emissions-intensive energy mix and a large heavy industry sector. About 70% of China’s energy-related emissions in 2020 came from coal, 12% from oil, 6% from natural gas, and about 11% from process emissions. Coal-fired power and heat generation plants alone were responsible for more than 45% of China’s entire emissions and 15% of total global emissions. Emissions of other GHGs, including from non-CO2 emissions from energy sector and GHG emissions from non-energy related activities, e.g. agriculture, were estimated at 2.4 Gt CO2-eq, while emissions from forestry and land-use change were estimated at more than 0.7 Gt CO2-eq of net-negative emissions (such emissions are either net-positive or with smaller net-negative scale in most other countries).
Greenhouse gas emissions in China and rest of the world, 2020
IEA, 2021.
Note: GHG = greenhouse gases; LULUCF = land use, land-use change and forestry. Sources: IEA data for CO2 emissions from fuel combustion and industrial processes. Estimations for other GHG emissions from IEA, FAO (2021); Saunois, M., et al. (2020); Friedlingstein, P., et al. (2020); UNFCCC (2021); He, J. et al. (2021).
China is the world’s largest emitter of greenhouse gases, accounting for around a quarter of global emissions, most of which come from burning fossil fuels
- 10
0
10
20
30
40
50
China Rest of world
Gt C
O2e
q
GHG emissions
CO₂, fuel combustion CO₂, industrial processes
Other GHGs without LULUCF LULUCF
0
5
10
15
20
25
China Rest of world
Gt C
O2
Energy sector CO2 emissions
Industrial processes Natural gas Oil Coal

An Energy Sector Roadmap to Carbon Neutrality in China Chapter 1: Vision of a carbon neutral China
PAGE | 28 IEA,
202
1.
In 2021, China’s energy sector CO2 emissions are likely to increase by over 300 Mt, or 3%, in part due to the economic bounce-back from the impact of the Covid-19 pandemic. With energy demand and emissions continuing to rise in 2020 despite the pandemic, emissions in 2021 are likely to be almost 450 Mt CO2, 4% above 2019 levels. All fossil fuels will contribute to higher CO2 emissions in China in 2021, but coal is expected to be the main contributor, accounting for 60% to the increase over 2020, predominantly due to increased coal use in the power sector (IEA, 2021b).
Although CO2 emissions have grown substantially over the last two decades, they have not risen as fast as GDP. This was mostly due to gradual, structural economic shifts towards sectors with lower emissions intensity combined with policy action to curb the growth in energy demand and promote low-carbon fuels. The carbon intensity of GDP (emissions per unit of GDP in PPP terms) dropped from a peak of nearly 810 g CO2 in 2005 to 450 g CO2 in 2020.4 Due to China’s reliance on fossil fuels, the carbon intensity of primary energy use, on the other hand, has remained above 2000 levels, at nearly 80 g CO2/MJ compared with a world average of under 60 g CO2/MJ. Carbon intensity of primary energy has fallen more rapidly in most advanced economies, as the shift to less carbon-intensive fuels has been more pronounced. For example, carbon intensity of primary energy use has fallen in the United States mostly thanks to a shift from coal to gas-fired power plants and in Europe to a sharp increase in the share of renewables in electricity and heat generation. The combination of the rise in carbon intensity of primary energy use and the two-and-a-half-fold increase in primary energy demand caused total emissions in China to triple over the last two decades. On a per capita basis, energy sector CO2 emissions, at 8 tonnes in 2020, remain lower than in some advanced economies such as the United States or Canada (13-15 t CO2 per capita), but higher in others such as European Union (around 5 t CO2 per capita).
4 CO2 emissions from fuel combustion only.

An Energy Sector Roadmap to Carbon Neutrality in China Chapter 1: Vision of a carbon neutral China
PAGE | 29 IEA,
202
1.
CO2 emissions intensity of primary energy demand relative to CO2 emissions per capita by country/region, 2000 and 2020
IEA, 2021.
Notes: Bubble area represents total energy-related and process-related CO2 emissions.
China’s carbon intensity of primary energy use remains high due to its heavy reliance on fossil fuels, though per capita emissions are lower than some advanced economies
Emissions from existing infrastructure Past and current investments in the vast range of physical assets that produce, transport and consume energy will have an impact on the amount and type of energy that will be used in the future in China. What happens to that energy-related infrastructure – particularly coal-fired power, steel and cement plants under construction or recently deployed – will have a major impact on the success of efforts to accelerate the use of clean energy technologies and achieve carbon neutrality. Recent trends bear this out: despite rapid deployment of renewables and EVs, and strong progress in reducing the energy intensity of GDP, China’s energy sector CO2 emissions have continued to rise in recent years. This is because emissions-intensive infrastructure has been expanding in parallel with the growing adoption of clean energy technologies.
The future energy consumption and emissions of existing infrastructure depends on three main factors: the scope for modifications to assets and their operation regime to lower the amount and CO2 intensity of the energy they use; the scope for capturing emissions (i.e. retrofits with carbon capture, utilisation and storage); and the span of their operational lives. For the owners of energy assets, decisions about whether to continue operation (where permitted under the prevailing regulatory framework), modify how they operate, or replace them with lower carbon alternatives will be based predominantly on relative costs and government decisions in relevant areas of policy making. Indeed, much of the emissions-intensive power sector and industrial infrastructure in China has some
0
25
50
75
100
0 5 10 15 20 25
g C
O2/M
J
t CO2/capita
Bubble size
1 Gt CO2
10 Gt CO2
China
IndiaUnited States
CanadaEuropean Union
RussiaJapan2020
2000

An Energy Sector Roadmap to Carbon Neutrality in China Chapter 1: Vision of a carbon neutral China
PAGE | 30 IEA,
202
1.
form of government oversight, directly in the case of publicly owned infrastructure or indirectly in the case of state-owned enterprises (SOEs). Moreover, private owners of such assets are also subject to government regulations.
Examining the potential emissions trajectories of specific sectors and types of equipment in the absence of action to modify them is a useful starting point to understand the room for manoeuvre in curbing emissions in the future. Without investments in new fossil-fuelled assets, emissions from China’s energy system would decline, but the decline would take a long time. If operated under the typical conditions observed in recent years, i.e., at typical utilisation rates, and if no assets are retired early or modified, existing energy infrastructure would lead to around 175 Gt CO2 of cumulative emissions between 2020 and 2050 – equivalent to around 15 years of CO2 emissions from China’s entire energy sector at the 2020 level. Emissions from existing infrastructure would drop by 30% by 2030 and 95% by 2050.
The bulk of cumulative emissions from existing infrastructure absent any change in the way it operates would come from the power sector (60%), steel making (8%) and cement production (10%), reflecting their large shares of China’s emissions today and the long lifetimes of the assets in these sub-sectors. Other industrial sub-sectors account for an additional 9%, and the transport and buildings sectors combined account for 8%. The share of transport and buildings are much smaller than for the rest of the world, reflecting their smaller shares in China’s current energy sector emissions. Around 30% of the electricity generated in China’s coal-dominated power sector is used in buildings, so on an indirect emissions basis, the buildings sector would account for a significantly larger share.

An Energy Sector Roadmap to Carbon Neutrality in China Chapter 1: Vision of a carbon neutral China
PAGE | 31 IEA,
202
1.
CO2 emissions from existing energy-related infrastructure under typical lifetime assumptions and operating conditions in China
IEA, 2021.
Notes: This analysis is independent of any scenario context presented in this publication. Emissions quantities are projected based on typical operating conditions (e.g., capacity factors, fuel shares and mileages) with 2020 as the base year for the analysis. Numeric area labels in the figure denote cumulative emissions quantities by sub-sector in gigatonnes CO2. Emissions are accounted for on a direct basis. Recent lifetimes observed for coal power plants and heavy industry assets in China of 25-35 years are used to inform this analysis.
Cumulative emissions from existing unmodified energy infrastructure could reach approximately 175 Gt CO2 by 2050
The large share of the power sector in total emissions from existing infrastructure is due to the dominance of coal-fired power plants, which account for over 60% of generation today and more than 95% of potential cumulative power sector emissions from existing plants to 2060. Emissions from existing coal plants decline only slightly through to 2030 as 40% of plants have been built in the last ten years, and then drop by 95% by 2050. This analysis does not include any coal power plants that are planned to be built in the coming years.
Industry is the other major contributor to potential CO2 emissions from China’s existing infrastructure, due to the sector’s high energy intensity, the large share of fossil fuels – especially coal – in energy use and the relatively long operational lifetimes of factories and heavy industrial equipment. Of the roughly 50 Gt of cumulative emissions from industry in this analysis, the steel and cement sub-sectors account for 30% and 35% respectively. While China’s leading steel producers have set targets to achieve a peak in emissions in 2022-2023, the China Metallurgical Industry Planning and Research Institute projects overall output to keep rising to 2025. The China Building Materials Federation has recently put forward a 2023 peaking target for the cement sector as part of an effort to reach a peak in emissions from the broader building materials sector.
0
2
4
6
8
10
12
2020 2030 2040 2050 2060
Gt C
O2
Other
Buildings
Other transport
Road freight
Cars
Other industry
Chemicals
Cement
Steel
Other power
Coal power
8
101
153
18
8
Buildings, 3
Road freight, 4
Cars, 3
Other transport, 4Other, 7

An Energy Sector Roadmap to Carbon Neutrality in China Chapter 1: Vision of a carbon neutral China
PAGE | 32 IEA,
202
1.
The rate of turnover of energy-consuming capital stock strongly influences the opportunities for adopting new energy technologies, including clean ones. That rate varies considerably across the various sectors and types of equipment. Many household appliances and office equipment such as computers usually need to be replaced after a few years, while cars and trucks, heating and cooling systems, and industrial boilers generally last between one and two decades. But most existing buildings, roads, railways and airports and many power plants, oil refineries and pipeline systems are likely still to be in use several decades from now. Globally, coal-fired power plants are typically operated for 40-50 years and cement and steel plants for around 40 years. However, in China, these emissions-intensive assets have tended to be decommissioned and replaced by more efficient capacity much more frequently in recent years, with lifetimes being more in the 25-35 year range (Cui et al., 2020; Cui et al., 2021, IEA, 2020c).
Average age of key emissions-intensive assets in China
IEA, 2021.
Notes: ‘North’ comprises Beijing, Hebei, Inner Mongolia, Shandong, Shanxi and Tianjin; ‘Northeast’ comprises Heilongjiang, Jilin and Liaoning; ‘Northwest’ comprises Gansu, Ningxia, Qinghai, Shaanxi, Tibet and Xinjiang; ‘Central’ comprises Chongqing, Henan, Hubei, Hunan, Jiangxi and Sichuan; ‘East’ comprises Anhui, Fujian Jiangsu, Shanghai and Zhejiang; ‘South’ comprises Guangdong, Guangxi, Guizhou, Hainan and Yunnan. No data for Hong Kong, Macau and Chinese Taipei is shown in this graph. Sources: Platts (2021); Tong et al. (2019); Wang et al. (2019); Liu et al. (2021).
40% of China’s coal-fired power plants, 55% of its cement plants and 15% of its steel plants are less than ten years old, compared with lifetimes in recent years of 25-35 years
China’s most emissions-intensive assets are younger than in most other countries due to the country’s rapid economic development in recent years. The average age of coal plants is just 13 years in China, compared with over 40 years in the
0
100
200
300
400
500
<10 11-20 21-30 31-40 >40
GW
Years
South East CentralNorthwest Northeast North
0.0
0.5
1.0
1.5
2.0
2.5
<10 11-20 21-30 31-40 >40
Gt
Years
Cement Steel
Heavy industry capacityCoal-fired power generation capacity

An Energy Sector Roadmap to Carbon Neutrality in China Chapter 1: Vision of a carbon neutral China
PAGE | 33 IEA,
202
1.
United States and around 35 years in Europe, though China’s plants have a typical operational lifetime that is much lower in recent years (around 25-35 years compared with 40-50 years globally). Of the 2 100 GW of coal-fired capacity in operation worldwide today and the 138 GW under construction, around 1 850 GW could still be operating in 2030, 950 GW of it in China. Five provinces – Jiangsu, Shanxi, Shandong, Xinjiang and Guangdong – account for nearly 40% of all China’s coal plants that are ten years old or younger.
In heavy industry, China holds an even more dominant position globally, accounting for around 60% of steel production from the more emissions-intensive pathway (i.e. using blast furnaces fed with coal, coke and iron ore as opposed to electric furnaces fed with scrap or direct reduced iron produced from natural gas), a similar share of cement production and around 30% of total production of ammonia, methanol and high value chemicals combined in the chemicals sub-sector. Most of this capacity is at the younger end of the age range in each asset class, averaging 10-15 years, compared with lifetimes in recent years of around 25 years in China and typical lifetimes of 30-40 years globally. Around 80% of steel plants and 90% of cement plants are less than 20 years old – the result of the seven-fold growth in steel production and nearly eightfold growth in cement production in China since the turn of the millennium.
While existing trucks, planes, cars, ships and appliances and equipment in buildings account for much smaller shares of projected emissions from existing infrastructure in China due to their lower emissions intensity and shorter lifetimes, they also tend to be at the younger end of the typical age range for such assets worldwide. Around two-thirds of China’s building stock (measured by floor area) has been built since 2000, while three-quarters of cars are less than ten years old. More than half of the commercial aircraft operating in China are less than ten years old.
Energy and climate policies
Carbon neutrality target China’s adoption of a carbon neutrality target marks a turning point in its economic development. The target forms an essential part of a new climate policy vision that calls for a profound long-term transformation in the way the country produces and uses energy, affecting every aspect of the economy and day-to-day life. Making that vision a reality will be important to averting the worst consequences of climate change for the entire world.

An Energy Sector Roadmap to Carbon Neutrality in China Chapter 1: Vision of a carbon neutral China
PAGE | 34 IEA,
202
1.
At the United Nations General Assembly in September 2020, China’s president announced that the country aims to have CO2 emissions peak before 2030 and to achieve carbon neutrality before 2060. This represents a significant stepping-up of the country’s climate ambitions. Previously, China’s nationally determined contribution (NDC) under the 2015 Paris Agreement aimed to achieve a peak in CO2 emissions by “around 2030 and making best efforts to peak early” but did not set a long-term target or goal.
China has since made several announcements of supplementary climate targets and stronger action to accelerate the energy transition in support of the new carbon neutrality target. At the UN Climate Ambition Summit in December 2020, the Chinese government declared that it would: enhance the NDC targets for 2030, including reducing its CO2 emissions per unit of GDP by more than 65% from the 2005 level (compared with a previous target of 60-65% and an announced reduction of over 48% in 2020); increase the share of non-fossil fuels in primary energy consumption to around 25% (up from around 20% in the current NDC and 16% in 2020 based on official data); and increase the forest stock by 6 bcm above 2005 levels (up from the previous target of 4.5 bcm, which was achieved in 2018). A new target of expanding the total installed capacity of wind and solar power to more than 1 200 GW (compared with 535 GW in 2020) was also announced. In March 2021, the ninth meeting of the Central Committee for Financial and Economic Affairs called for building a new power system with solar PV and wind as the main energy sources. In addition, on Earth Day in April 2021 China’s president announced that “China will strictly control coal-fired power generation projects and strictly limit the increase in coal consumption over the 14th FYP period (2021-2025) and phase it down in the 15th FYP period (2026-2030)”.
China’s new climate policy differs in several ways from the previous one, not least in its much greater ambition. It sets out a clear timeline for the country’s path to carbon neutrality, shifting the key policy question from “whether and when” to “how”. And it goes beyond the previous focus on carbon intensity measured by emissions per unit of GDP. The government has since clarified the scope of the carbon neutrality target. China’s Special Climate Envoy noted in a speech in July 2021 that the China’s peak target concerns energy-related CO2 emissions, while the carbon neutrality target has a wider scope, covering economy-wide GHG emissions, including non-CO2 GHGs such as methane and hydrofluorocarbons (NCSC, 2021).
The pathway set out in this report covers all energy sector CO2 emissions including from fuel combustion and industrial processes, which account for

An Energy Sector Roadmap to Carbon Neutrality in China Chapter 1: Vision of a carbon neutral China
PAGE | 35 IEA,
202
1.
nearly 90% of the China’s total GHG emissions today (see Chapter 2). The core scenario of this Roadmap also considers a drastic reduction of methane emissions from the energy sector by 2060.
In May 2021 the central government established a “leadership group on carbon peak and carbon neutrality”, chaired by the executive vice-premier and comprising heads of key national level ministries and agencies to co-ordinate cross-government efforts to achieve the climate goals. The group is developing what it calls a “1+N” policy framework for carbon peak and carbon neutrality, with “1” referring to top level overall guideline and “N” referring to policy packages for key action areas (NCSC, 2021). The carbon peak and neutrality 1+N” policy framework will focus on transformation and innovation in ten areas: changing the energy mix; modernising industry; improving the efficiency of resource use; promoting energy efficiency; building a low-carbon transport system; promoting clean energy technological innovation; developing green finance; introducing supporting economic policies; improving carbon pricing mechanisms and implementing nature-based solutions.
How does carbon neutrality fit with China’s broader economic modernisation strategy? The Chinese government sees the carbon neutrality target as a catalyst for shifting the country’s development model towards higher quality and more sustainable economic growth to protect the environment and health of the population, both in China and globally. The government has set a goal to “basically realise socialist modernisation” by 2035. The goal includes: significantly increasing China’s economic, technological and innovation strength; raising per capita GDP to the level of moderately developed countries; modernising the governance system; advancing culture and health; and reducing urban-rural and regional disparities. The modernisation goals also include advancing eco-friendly work practices and lifestyles, and fundamental improvements in the environment under the aim of “building a beautiful China”. The government has also adopted a goal of turning China into “a great modern socialist country that is prosperous, strong, democratic, culturally advanced, harmonious and beautiful” by 2050 (Xi, 2017; State Council, 2021).
A continued move away from energy-intensive heavy industry and towards higher value-added technologies and services forms a central element of the economic transition in line with both the modernisation agenda and carbon neutrality target (see Chapter 5). The most recent FYPs set targets for this transition, including:

An Energy Sector Roadmap to Carbon Neutrality in China Chapter 1: Vision of a carbon neutral China
PAGE | 36 IEA,
202
1.
• Raising the share of value added from the services sector in total GDP in the 11th (2006-2010), 12th (2011-2015) and 13th (2016-2020) FYPs. The share increased from 41% in 2005 to 54.5% in 2020 (with GDP expressed at current prices5).
• Encouraging innovation through increasing public spending on research and development (R&D) since the 10th FYP (2001-2005). Spending reached USD 354 billion (CNY 2.44 trillion) in 2020, its share of GDP increasing from 1% in 2000 to 2.4% in 2020.
• Increasing the number of patents since the 12th FYP (2011-2015). They rose from less than two per 10 000 people in 2010 to over six in 2020, while the 14th FYP (2021-2025) targets 12 high value patents per 10 000 people for 2025.6
• Boosting the contribution of scientific and technological advances to economic growth in the 13th FYP (2016-2020) and the share of key digital economy sectors in GDP in the 14th FYP (2021-2025).
The national “Made in China 2025” initiative is one example of how the government is seeking to exploit synergies between broader economic development and the carbon neutrality target. As a strategy to enhance China’s manufacturing sector, it seeks to strengthen technology innovation and product quality, and to promote the structural transition to higher value manufacturing and green production. It includes energy efficiency, material efficiency and pollution control goals, and focusses on the development of clean low-carbon materials, energy sources, vehicles and equipment. More recently, China has ramped up its New Infrastructure Initiative as part of its Covid-19 recovery package, involving investment in digitalisation and energy and transport infrastructure, such as ultra-high voltage transmission networks, urban and intercity rail networks and EV charging facilities.
China has been pursuing a more diverse mode of development since 2012 to balance economic growth with environment and public health. At the 18th National Congress of the ruling Communist Party of China in November 2012, China’s president raised the concept of “ecological civilisation” and the vision of “beautiful China”. In 2016, the State Council released the Healthy China 2030 strategy, which stresses the importance of environmental protection, particularly air and water quality to improve public health.
5 This is equivalent to a rise from 49% in 2005 to 53% in 2020 when services value added and GDP are expressed in constant 2019 values at purchasing power parity. 6 Five criteria are specified for high value patents by the China National Intellectual Property Administration: https:// www.cnipa.gov.cn/art/2021/4/2/art_55_158182.html.

An Energy Sector Roadmap to Carbon Neutrality in China Chapter 1: Vision of a carbon neutral China
PAGE | 37 IEA,
202
1.
There are clear signs that climate change is becoming an integral part of China’s development vision and strategy. At the ninth meeting of the Central Financial and Economic Affairs Commission in March 2021, chaired by China’s president, the overall vision and strategic positioning of the carbon peak and carbon neutrality goals were highlighted. The president stressed that achieving carbon neutrality would require a broad and profound systemic economic and social transformation, and that the targets would need to be incorporated into the country’s overall development of “ecological civilisation”, a concept underpinning China’s vision on sustainable development and environmental goals that was written into the Chinese constitution in 2018. The president recognised that the five years to 2025 are critical to achieve the peak in emissions and identified several tasks for that period.
China’s carbon neutrality target in the global context The new climate targets signal a decisive move by China towards more ambitious action to tackle climate change. Given the country’s growing economic and geopolitical clout, as well as its status as the world’s largest CO2 emitter, it is hoped that the change in policy will lead to China playing an active role in global climate governance. International co-operation and sharing of best practices are vital to achieve global net zero emissions in the second-half of the century (IEA, 2020b).
China is not alone in adopting a net zero target. As of September 2021, 52 countries and the European Union have adopted some form of net zero emissions target, covering two-thirds of global GDP and around two-thirds of global energy-related CO2 emissions. Of those countries, 16 have incorporated the target into law, five have proposed legislation and the rest have announced a target in an official policy document. By far, China is the country with the most significant carbon footprint among those that have stated targets, accounting for around 30% of global energy-related CO2 emissions in 2020 and around half of the energy-related emissions covered by a net zero emissions target.
The timeframe for net zero emissions varies across countries, ranging from 2030 to 2070, with the majority setting 2050 as the target year, including the United States, the European Union, Japan, Canada, Korea and South Africa. Among other major emerging economies, Brazil has a target in its NDC for 2060 and has announced its intention to bring it forward to 2050, while Indonesia is exploring opportunity to reach net zero emissions by 2060. The coverage of emissions also varies, with most of the net zero emissions targets to date being economy-wide and including all GHGs.

An Energy Sector Roadmap to Carbon Neutrality in China Chapter 1: Vision of a carbon neutral China
PAGE | 38 IEA,
202
1.
Box 1.1 Paris Agreement and net zero emissions
The Paris Agreement – the most recent major international climate accord, reached at the 21st Conference of the Parties to the UN Framework Convention on Climate Change (COP 21) in December 2015 and formally signed in April 2016 – sets a target of limiting future increases in global temperature to “well below 2 °C” above pre-industrial levels and pursuing efforts to limit the temperature increase to 1.5 °C above pre-industrial levels. To reduce risks of relying heavily on net-negative emissions to reach the 1.5 °C temperature increase target by the end of the century, the Intergovernmental Panel on Climate Change encourages countries to aim for carbon neutrality by 2050 (IPCC, 2018). Article 4 of the Agreement sets out related aims on how to achieve this goal, notably bringing about a peak in global emissions of greenhouse gases “as soon as possible” and realising rapid reductions thereafter to achieve a balance between anthropogenic emissions by sources and removals by sinks of greenhouse gases, i.e., net zero emissions of greenhouse gases, in the second-half of this century.
Nationally Determined Contributions (NDCs) are at the heart of the Agreement and will be critical to its success. They represent the pledges made by the country to reduce national emissions and adapt to the impacts of climate change. Article 4 requires each Party to prepare, communicate and maintain successive NDCs, including measures to mitigate domestic emissions, taking account of its national circumstances and capabilities.
The four annual Conference of the Parties (COP) since the Paris Agreement have focused on developing rules, guidelines and procedures for implementing various aspects of the Agreement, and encouraged countries to enhance the ambition of their NDCs and develop long-term low emission development strategies. The next meeting in Glasgow in November 2021 (COP 26), postponed from the previous year, will review progress in meeting the goals of the Agreement, seek to ratchet up near-term efforts to curb emissions, including by urging countries to submit revised or updated NDCs, and encourage countries to establish long-term plans for achieving net zero emissions. It also aims to finalise the “Paris Rulebook” for implementing the Agreement.
It is hard to overstate the importance of China in reaching global net zero emissions. Given the size of its economy and energy sector, achieving China’s stated climate goals will make a huge contribution to meeting the goals of the Paris Agreement. By meeting its carbon neutrality target in line with the country’s stated goals, China alone could lower global average temperature by almost 0.2 °C by the end of the century. In short, if China fails, the world will fail.

An Energy Sector Roadmap to Carbon Neutrality in China Chapter 1: Vision of a carbon neutral China
PAGE | 39 IEA,
202
1.
Key challenges in China’s quest for carbon neutrality The magnitude of the task in reducing CO2 emissions and the most cost effective and practical way of doing so differ markedly across countries in several respects, notably their stage of economic development, economic structure and existing patterns of energy supply and use. These differences are reflected in the timing of the peak in emissions: it has already been achieved in many advanced economies, in some cases decades ago, but not in China and most other emerging economies, where economic growth is generally much faster and per capita energy use often lower. France, Germany and the United Kingdom were among the first to achieve a peak in energy-related CO2 emissions in the 1970s, while the United States, Italy and Japan followed in 2000, 2005 and 2013 respectively. Brazil reached its emissions peak in 2014 and Korea in 2018. These countries, therefore, would get from peak emissions to net zero emissions over a longer timeframe compared with the timeframe of China’s carbon neutrality pledge.
The degree of economic maturity and prosperity is a critical element in determining the peak in CO2 emissions. Historically, the peak was achieved at an average GDP per capita of between USD 22 000 (CNY 152 000) and USD 30 000 (CNY 207 000) in PPP terms at 2019 prices in those countries that achieved it in the 1970s, and at above about USD 40 000 (CNY 276 000) in countries such as the United States, Korea and Japan that achieved it later. In 2020, China’s GDP per capita approached USD 17 500 (CNY 121 000), which is approaching the level of France, Germany and United Kingdom when they reached their emissions peak. However, China’s economy is still growing strongly – GDP expanded at an average rate of nearly 6% over the five years to 2020 despite the Covid-19 crisis – while that of the three European countries cited was only around 3% in the late 1970s, ahead of a recession at the beginning of the 1980s. Bringing about a peak in emissions at a time of rapid economic growth and rising demand for energy services requires considerable efforts, though the tremendous development of energy technologies in recent years – and China’s potential for leveraging them – offers new opportunities to decouple emissions and growth.
The significance of heavy industry in China’s economy also makes achieving carbon neutrality particularly difficult. The industrial sector as a whole accounted for 36% of energy sector CO2 emissions in 2020. Industrial processes are energy intensive, and few viable low-carbon alternatives to conventional fossil fuel-based technologies are commercially available in some crucial sub-sectors, notably steel and cement. In addition, certain industrial sectors tend to be heavily exposed to

An Energy Sector Roadmap to Carbon Neutrality in China Chapter 1: Vision of a carbon neutral China
PAGE | 40 IEA,
202
1.
international trade, which increases the risk of carbon leakage (the relocation of emissions-intensive industries to countries with laxer emissions constraints). Further increasing the share of services and reducing that of energy-intensive industry, and supporting innovation and cost reduction of low-carbon solutions for industries will undoubtedly facilitate the decarbonisation of China’s energy system.
The transport sector, which accounted for 8% of China’s total energy sector CO2 emissions in 2020, will need to be a major focus of measures to curb emissions. With the country’s meteoric growth in car ownership and road freight, the use of oil products and natural gas for road transport has grown by nearly fourfold over the past two decades (at an annual average rate of over 7%), from a level that in 2000 was roughly equal to the current transport demand for oil products in Canada to a level that is nearly as high as that of the European Union. Oil demand for domestic aviation has grown even faster, on average by more than 9% annually over the same period.
The relatively young age of the building stock, which generated 5% of China’s energy sector emissions in 2020, and the heavy reliance on fossil fuel for heating will also need to be addressed. Energy consumption in the buildings sector has been growing rapidly despite policy efforts that have reduced the average energy intensity of buildings by more than 40% in the last three decades. The average age of the buildings stock is barely above 15 years, nearly half of existing floor area will probably still be standing in 2050, raising the importance of retrofit measures to lower energy use and switch to low-carbon technologies. One-third of total final consumption in buildings is still derived from fossil fuels, with around 50% of space heating produced by fossil fuels using inefficient equipment within the building, a share that rises to 80% in northern China (including district heating generation). The explosive growth of electrical end-uses is also driving up emissions in power generation. For example, ownership of air conditioners has more than doubled in the last two decades in China (IEA, 2019).
China’s relatively heavy dependence on fossil fuels, particularly coal, for power and heat generation, which accounted for nearly 50% of energy sector CO2 emissions in 2020, will need to be central to efforts to achieve a peak in emissions and bring them down rapidly thereafter. In all countries that have already achieved major emissions reductions, one of main drivers has been the transformation of the power sector, involving increased shares of less carbon-intensive technologies in the generation fuel mix; for example, a switch from coal to gas and renewables in the United Kingdom and the United States, from coal to renewables in Germany, and from coal and oil to nuclear power in France. Phasing out unabated coal-fired power and heat generation, which accounts for over 45% of China’s energy sector

An Energy Sector Roadmap to Carbon Neutrality in China Chapter 1: Vision of a carbon neutral China
PAGE | 41 IEA,
202
1.
CO2 emissions and 16% of world emissions in 2020, must be central to efforts to meet the new climate targets. The task is made harder by the young age of China’s fleet of coal plants. Managing the socio-economic impacts of the clean energy transition will be key policy considerations (see Chapter 7).
Nonetheless, China is well placed to accelerate the shift in investment to low-carbon power generation and to avoid locking in additional CO2 emissions from long-lived assets. China is the world leader in the deployment of renewables, including solar PV, wind and hydro, as well as one of the leading countries in nuclear power deployment. Total investment in these clean energy technologies reached about USD 130 billion (around CNY 900 billion) in 2020 – about six-times more than in fossil fuel power plants. Net additions to wind and solar capacity combined have exceeded those of fossil fuel plants every year since 2016. Market and regulatory reforms to facilitate the integration of more renewables into the power system will be crucial to integrate rising shares of variable renewables generation while ensuring cost effectiveness and grid security.
Box 1.2 Corporate net zero targets in China
Several large companies, mostly state-owned, have made carbon neutrality pledges since the government announced its new targets. Industry associations have steered a number of these pledges and several associations are developing sectoral roadmap towards emissions peak and carbon neutrality. Energy-intensive industrial companies that have done so include Sinopec and PetroChina7 (oil and gas, and chemicals), Baowu Steel, HBIS, Ansteel Group and Baotou Steel (iron and steel), most of which are targeting carbon neutrality by 2050. Among the major power generation companies, the Three Gorges Group has announced a goal of carbon neutrality by 2040 and Datang Corporation by 2060.
A larger number of companies have announced commitments or plans to contribute to the national goal, without determining a target year for emissions or proposing a plan yet for achieving it. For example, the State Grid published a carbon peaking and neutrality action plan, with measures such as building additional transmission capacity and smart grids, and increasing the share of renewables in the power it transmits. Several power generation companies, including China Energy Investment Group, China Huaneng Group and SPIC, have announced strategic studies on long-term net zero emissions goals. As of July 2021, of China’s 65 largest energy-consuming companies8, 56 had not announced
7 PetroChina pledged to reach near-zero emissions by 2050. 8 Mainly in chemicals, cement, steel, aluminium, vehicle manufacturing, shipping, aviation, construction, power generation and mining.

An Energy Sector Roadmap to Carbon Neutrality in China Chapter 1: Vision of a carbon neutral China
PAGE | 42 IEA,
202
1.
a net zero commitment with a target year and 53 had yet to specify a target year for a peak in emissions.
The scope of net zero emissions pledges by many Chinese companies have yet to be clarified, though at this stage they are likely to cover direct and some indirect emissions from company operations (known as scope 1 and 2 under the GHG Protocol), rather than the full value chain (scope 1, 2 and 3) given current reporting guidelines and practices.9 Various strategies have been proposed to curb corporate emissions including switching to low-carbon technologies, investing in R&D and using carbon offsets and green bonds. Some technology companies advocate the increased use of digital technologies in government, health systems and education, and promotion of lifestyle changes.
Between 2013 and 2015, the Chinese government published national guidelines for GHG emissions accounting for enterprises in 24 sectors to clarify their scope. It also established an emissions reporting framework for companies that may be covered by the national emissions trading system, which began operating in 2021 (initially covering the power sector with industry to follow). In the Notice on Carbon Emission Report and Verification and Emission Monitoring Plan in 2016 and 2017 and subsequent notices, companies in the power, construction materials, steel, non-ferrous metal, petroleum, chemicals and paper industries are required to report their energy consumption and scopes 1 and 2 CO2 emissions associated with the products they produce. China has also developed green or carbon-intensive taxonomies to support financial institutions and companies in classifying activities and assets contributing to clean energy transitions, and financial risks associated with climate change (IEA, 2021c).
Current policy landscape China has launched a process to develop plans to meet the carbon peak and neutrality targets, building on existing energy and environmental policies. The government announced that the period of the 14th FYP (2021-2025) will be critical and has identified a group of key areas, including: limiting the consumption of fossil fuels; improving energy efficiency; promoting renewables and reforming the electricity system; promoting green manufacturing; raising energy efficiency standards in construction; promoting low-carbon transport; encouraging innovation of low-carbon technologies; strengthening “dual control” of energy (energy consumption and intensity); reforming tax, price, land, finance and
9 Scope 1 covers all direct emissions from the activities of a company or organisation, including onsite fuel combustion and its own transport. Scope 2 covers indirect emissions from electricity, steam, heat and cooling purchased and used by the company. Scope 3 covers all other indirect emissions from the company’s activities occurring from sources that it does not own or control, such as business travel, procurement, waste and water.

An Energy Sector Roadmap to Carbon Neutrality in China Chapter 1: Vision of a carbon neutral China
PAGE | 43 IEA,
202
1.
procurement policies; accelerating carbon emissions trading; developing green finance; promoting more environmentally responsible behaviour; increasing carbon sinks; strengthening international co-operation on climate change and building a green “silk road”.
Institutional arrangements China has complex and dynamic policy-making processes and structures. Under the guidance of the central government, a multitude of bodies at national and sub-national levels, e.g. provincial and municipal, share responsibility for making and implementing energy and climate policy. A number of national ministries in China are involved in formulating and implementing energy and climate policies; there is no single ministry with overall responsibility for these areas of policy. In China, the National Energy Commission and the Leadership Group on Climate Change, Energy Conservation and Emission Reduction, both of which are chaired by the premier and report to the State Council (China’s main governing body), co-ordinate national policy making. As mentioned, a new “Leadership Group” was established in May 2021 to direct the country’s efforts to achieve carbon peaking and carbon neutrality.
Main climate and energy policy institutions in China
IEA, 2021.
Note: The figure does not provide an exhaustive presentation of institutions involved in China’s climate and energy policy processes.
Several national and local bodies share responsibility for making and implementing energy and climate policy

An Energy Sector Roadmap to Carbon Neutrality in China Chapter 1: Vision of a carbon neutral China
PAGE | 44 IEA,
202
1.
Under the guidance of the State Council, national ministries are responsible for developing relevant policies. The main central government ministries involved in energy and climate policy making include: the National Development and Reform Commission (NDRC), which has a broad mandate for formulating and guiding implementation of socio-economic development strategies and policies; the National Energy Administration, managed by the NDRC, which is in charge of designing and implementing energy-related policies; and the Ministry of Ecology and the Environment (MEE), which oversees polices related to the environment, including climate change. Other ministries, including finance (MOF), science and technology (MOST), Industry and Information Technology (MIIT), Natural Resources (MNR) and Foreign Affairs (MFA), are also involved in energy and climate policy making. In addition, the State-owned Assets Supervision and Administration Commission of the State Council (SASAC) supervises and manages SOEs, including large power, oil and gas companies, and industry associations such as the China Electricity Council.
Provincial governments are responsible for implementing national policies as well as developing policies and initiatives at the provincial level. They also participate in national policy-making processes. For example, the central government has called for provincial inputs to the ongoing process to develop an action plan for peak emissions before 2030 and is encouraging provincial initiatives to achieve peak emissions as soon as possible. Shanghai and Hainan provinces have indicated they will strive for peak emissions by 2025. Hainan also indicated a target for carbon neutrality by 2050. Jiangsu and Guangdong plan to reach peak emissions earlier than the national goal. Beijing has already achieved peak emissions, thanks to measures to address air pollution, improve energy efficiency and a pilot emissions trading system (ETS) in the province, and actively draws plans for carbon neutrality. Industrial associations and SOEs are also implementing initiatives to reduce emissions.
The FYPs are the key policy-making process to guide economic and social development. The FYP outline includes the highest level socio-economic guidance and targets and is supplemented by a comprehensive set of sectoral and technological plans such as the Energy Development FYP, Power Development FYP and Environmental Protection FYP. The sectoral FYPs, which are typically released by the relevant ministries within a year of the FYP outline, provide more detailed targets and action plans, and include certain provincial level targets. Provincial FYPs, which are developed by local governments typically within one or two years of the release of the national and sectoral FYP outline, are intended to implement the national FYPs adapted to local circumstances.
In parallel with the regular FYP process, laws, national strategies and action plans are developed for specific sectors or cross-cutting themes with more flexible timeframes. Ongoing strategic priorities are often integrated into the next formulations of FYPs. For example, the Energy Supply and Consumption Revolution Strategy for 2016-2030 is an important long-term strategy that guides

An Energy Sector Roadmap to Carbon Neutrality in China Chapter 1: Vision of a carbon neutral China
PAGE | 45 IEA,
202
1.
the six dimensions of China’s energy sector: energy consumption, supply, technology, system, international co-operation and energy security. It stresses the importance of making energy consumption cleaner and more efficient, as well as encouraging technological innovation. Action plans focus on specific aspects of energy, environment or climate change, such as air quality.
Evolution of energy and climate policies China’s first national programme on climate change was released in 2007, setting out various targets for 2010 and supporting measures. New targets, including a 17% reduction in carbon intensity (CO2 emissions per CNY of GDP), were included in the 12th FYP (2011-2015), accompanied by a work plan on limiting the growth of GHG emissions. The National Plan on Climate Change, released in 2014, provided a basis for negotiating the Paris Agreement and the subsequent preparation of China’s first NDC, which was submitted in June 2015. The targets in the NDC were incorporated into the 13th FYP (2016-2020).
Evolution of selected energy and climate policies and key priorities in China
IEA, 2021.
Notes: FIT = feed-in tariff; ETS = emissions trading system. Sources: IEA policy database; Gallagher et al. (2019).
Energy efficiency and renewables remain central pillars of China’s energy policies, driven by energy security, economic and air quality benefits as well as climate considerations

An Energy Sector Roadmap to Carbon Neutrality in China Chapter 1: Vision of a carbon neutral China
PAGE | 46 IEA,
202
1.
Energy efficiency and renewables have been central pillars of China’s energy policies over the last two decades, driven by energy security, economic and air quality benefits and climate considerations. The 11th FYP (2006-2010) was the first to introduce a target to reduce energy intensity (20% over the period of the plan), which was supplemented by the 2007 Work Plan on energy conservation and pollutant emissions reductions. Energy efficiency has remained a priority in all FYPs since, with a cap on total energy consumption being introduced alongside a target of reducing energy intensity by 16% in the 12th FYP (2011-2015). A new cap on coal consumption was established and the energy intensity target set at 15% for the 13th FYP period (2016-2020). Energy efficiency mandates are a key policy instrument to manage industrial energy consumption. In 2014, MIIT issued a comprehensive cross-sectoral guideline on industrial energy efficiency, including consolidated industrial energy use data, energy efficiency standards and benchmarking values.
The 2005 Renewable Energy Law was the first major law to encourage renewables and requires power grid operators to purchase output from registered renewable energy producers and offers financial incentives, including preferential electricity tariffs for renewable power and discounted lending and tax preferences. The law established a national fund to foster renewable energy development. Feed-in tariffs for renewable energy were introduced in 2006 and strengthened in 2009-2011, and have proved highly successful in boosting renewables capacity, notably wind and solar PV, as well as the development of a domestic turbine and PV panel manufacturing industry which have driven costs down. The cap on coal use introduced in the 13th FYP period (2016-2020) provided strong guidance and certainty for the transition to renewables and other clean energy sources.
Market mechanisms are playing an increasing role in achieving energy and climate policy goals more cost effectively through more efficient allocation of resources. Power market reforms launched in 2015 aim to liberalise electricity pricing mechanisms, lower electricity prices, increase industrial productivity and boost economic growth. Implementation is still underway. The national ETS, which came into operation in 2021, and the provincial schemes, which have been operating for several years, are the main carbon pricing mechanism.
Improving air quality has been a major objective of energy policies in recent years. The Air Pollution Prevention and Control Action Plan (2013-2017) and the subsequent three-year action plan (2018-2020) were adopted to address the deteriorating effects on public health of rising emissions of particulate matter, nitrogen oxides and other pollutants, especially in the largest cities. A third action plan is being developed to continue air quality improvement measures for the 14th

An Energy Sector Roadmap to Carbon Neutrality in China Chapter 1: Vision of a carbon neutral China
PAGE | 47 IEA,
202
1.
FYP period (2021-2025). The plans set emissions reduction targets for key air pollutants and identify priorities for action, including promoting cleaner manufacturing processes, making energy use cleaner and more efficient, developing greener transportation systems and promoting regional co-ordination of pollution prevention and control. In addition to being very effective at alleviating pollution, they have contributed to more efficient energy use and encouraged the transition to clean energy sources, which serve economic, energy security and climate goals.
The 14th FYP (2021-2025) represents a key milestone on the path to carbon neutrality. The plan was released in March 2021, about five months after the announcement of the new 2030 and 2060 climate targets. As with previous plans, it states a binding target to reduce energy intensity, in the current plan by 13.5%, and a target for reducing carbon intensity by 18%. The carbon-intensity target is the same as in the previous FYP, which was slightly exceeded. Unlike previous plans, no explicit GDP growth target for the five-year period was set, though a target of over 6% was set for 2021. The International Monetary Fund projects that China’s GDP will grow on average by around 6% over 2021-2025 and just over 8% in 2021(IMF, 2021a; IMF, 2021b).
Recent Five-Year Plan targets and attainment
Target indicator
2006-2010 2011-2015 2016-2020 2021-2025
11th FYP Attained 12th FYP Attained 13th FYP Attained 14th FYP
CO2 intensity per unit of GDP / / -17% -20% -18% -18.8% -18%
Energy intensity per unit of GDP
about -20% -19% -16% -18.2% -15% -14% -13.5%
TPED (billion tce)* about 2.7 3.3 <4.0 4.3 <5.0 4.98 tbd
Share of non-fossil fuel in
TPED** / / 11.4% 12% 15% 15.9% about
20%
Solar PV capacity (GW) 0.3 0.86 21 43 110 253 tbd
Wind capacity (GW) 10 31 100 131 210 282 tbd
* Total primary energy demand (TPED) cap has been an indicative target since the 12th FYP (2011-2015). ** Measured using the partial substitution method used by China for primary energy data. Notes: TPED = total primary energy demand; tce = tonne of coal equivalent; tbd = to be decided. Sources: China’s various five-year plans; MEE (2021), Report on the State of the Ecology and Environment in China 2020; NBS (2021), Statistical Communique on the 2020 National Economic and Social Development; SCIO (2021), SCIO briefing on China's renewable energy development.
The 14th FYP (2021-2025) stipulates that total energy consumption and total emissions will also be capped but does not state quantitative targets. A possible

An Energy Sector Roadmap to Carbon Neutrality in China Chapter 1: Vision of a carbon neutral China
PAGE | 48 IEA,
202
1.
explanation for the absence of targets for energy use and emissions in the most recent FYP is that an action plan to bring about a peak in CO2 emissions before 2030 is being developed, along with several sectoral FYPs, which will provide further guidance on energy development and climate actions. For instance, preliminary targets for the iron and steel sub-sector reportedly include a peak in emissions before 2025 and a subsequent reduction of 30% (estimated at around 0.42 Gt CO2) by 2030 (Xinhua News, 2021). Another explanation may be the uncertainties about the global economic recovery from the Covid-19 pandemic on China’s domestic economy and its consequences for energy demand. This may also explain the absence of a GDP growth target.
The 14th FYP identifies new energy sources and new vehicle technologies as strategic emerging industries. It stresses the need to step up energy market reforms, pursue investment in low-carbon energy and ensure energy security. It also outlines the main energy infrastructure developments to be completed and launched over the five-year period. For the electricity system these include an increase in hydropower capacity, deployment of smart grid technology, strengthening the transmission system and storage capacity to facilitate the integration of more variable renewables capacity and network connections to remote regions. Other energy infrastructure developments include oil and gas exploration and production, energy storage and transportation.

An Energy Sector Roadmap to Carbon Neutrality in China Chapter 1: Vision of a carbon neutral China
PAGE | 49 IEA,
202
1.
References China Energy Council (CEC) (2021), Analysis and Forecast of China Power Demand-Supply
Situation 2020-2021, https://english.cec.org.cn/detail/index.html?3-1128
Cui, R., Hultman, N., Cui, D. et al. (2021), A plant-by-plant strategy for high-ambition coal power phaseout in China. Nat Commun 12, 1468. https://doi.org/10.1038/s41467-021-21786-0.
Cui, R., N. Hultman, K. Jiang, et al. (2020), A High Ambition Coal Phaseout in China: Feasible Strategies through a Comprehensive Plant-by-Plant Assessment. Center for Global Sustainability: College Park, Maryland. https://cgs.umd.edu/sites/default/files/2020-01/1.13.2020_AHighAmbitionCoalPhaseoutInChina_EN_fullreport%20.pdf, accessed June, 2021.
Food and Agriculture Organisation of the United Nations (FAO) (2021), FAOSTAT Data, http://www.fao.org/faostat/en/#data, accessed August 2021.
Friedlingstein, P., et al. (2020), Global Carbon Budget 2020, Earth System Science Data, 12, 3269–3340, https://doi.org/10.5194/essd-12-3269-2020.
Gallagher, K.S., et al. (2019), Assessing the policy gaps for achieving China’s climate targets in the Paris Agreement, Nature Communications 10, Article number1256, https://doi.org/10.1038/s41467-019-09159-0.
He, J., et al. (2021), Comprehensive report on China's Long-Term Low-Carbon Development Strategies and Pathways, Chinese Journal of Population, Resources and Environment, https://doi.org/10.1016/j.cjpre.2021.04.004.
IEA (International Energy Agency) (2021a), Global EV Outlook 2021, https://www.iea.org/reports/global-ev-outlook-2021.
IEA (2021b), Global Energy Review 2021, https://www.iea.org/reports/global-energy-review-2021.
IEA (2021c), Financing clean energy transitions in emerging and developing economies, https://www.iea.org/reports/financing-clean-energy-transitions-in-emerging-and-developing-economies.
IEA (2020a), Coal 2020, https://www.iea.org/reports/coal-2020.
IEA (2020b), Energy Technology Perspectives 2020, https://www.iea.org/reports/energy-technology-perspectives-2020
IEA (2020c), China’s Emissions Trading Scheme, Designing efficient allowance allocation. https://www.iea.org/reports/chinas-emissions-trading-scheme.
IEA (2019), The Future of Cooling in China: Delivering on Action Plans for Sustainable Air conditioning, https://www.iea.org/reports/the-future-of-cooling-in-china.
IMF (International Monetary Fund) (2021a), World Economic Outlook Update, July 2021, https://www.imf.org/en/Publications/WEO/Issues/2021/07/27/world-economic-outlook-update-july-2021.
IMF (2021b), World Economic Outlook, April 2021: Managing Divergent Recoveries, https://www.imf.org/en/Publications/WEO/Issues/2021/03/23/world-economic-outlook-april-2021.
IMF (2020a), June 2020: A Crisis Like No Other, An Uncertain Recovery, https://www.imf.org/‐/media/Files/Publications/WEO/2020/Update/June/ English/WEOENG202006.ashx.

An Energy Sector Roadmap to Carbon Neutrality in China Chapter 1: Vision of a carbon neutral China
PAGE | 50 IEA,
202
1.
IMF (2020b), World Economic Outlook Database, April 2020 Edition, Washington DC.
IPCC (Intergovernmental Panel on Climate Change) (2018), Global warming of 1.5 °C. An IPCC Special Report on the impacts of global warming of 1.5 °C above pre-industrial levels and related global greenhouse gas emission pathways, in the context of strengthening the global response to the threat of climate change, https://www.ipcc.ch/sr15/download/.
Liu, J. et al. (2021), Carbon and air pollutant emissions from China’s cement industry 1990–2015: Trends, evolution of technologies, and drivers, Atmospheric Chemistry and Physics, V. 21, pp.1627–1647, https://doi.org/10.5194/acp-21-1627-2021.
MEE (Ministry of Ecology and Environment) (2021), Report on the State of the Ecology and Environment in China 2020, http://www.mee.gov.cn/hjzl/sthjzk/zghjzkgb/202105/P020210526572756184785.pdf.
NBS (National Bureau of Statistics) (2021), Statistical Communiqué on the 2020 National Economic and Social Development, http://www.stats.gov.cn/tjsj/zxfb/202102/t20210227_1814154.html.
NCSC (National Center for Climate Change Strategy and International Cooperation) (2021), 全文| 解振华详解制定1+N政策体系作为实现双碳目标的时间表、路线图 [Full text | Xie Zhenhua explained the formulation of a 1+N policy system as a timetable and roadmap for achieving the carbon peak and carbon neutrality goals], http://www.ncsc.org.cn/xwdt/gnxw/202107/t20210727_851433.shtml, accessed July 2021.
OECD (Organisation for Economic Co-operation and Development) (2018), China’s Progress Towards Green Growth: An International Perspective., https://www.oecd-ilibrary.org/environment/china-s-progress-towards-green-growth_76401a8c-en.
Oxford Economics (2020), Oxford Economics Global Economic Model, (database), https://www.oxfordeconomics.com/global‐economic‐model, August 2020 update, Oxford.
Platts (2021), World Electric Power Plant Database (purchase), https://www.spglobal.com/platts/en/commodities/electric-power, (accessed June 2021).
Reuters (2021), China's new coal power plant capacity in 2020 more than 3 times rest of world's – study, https://www.reuters.com/business/energy/chinas-new-coal-power-plant-capacity-2020-more-than-3-times-rest-worlds-study-2021-02-03/.
Saunois, M., et al. (2020), The Global Methane Budget 2000–2017 (2020), Earth System Science Data, 12, 1561–1623, https://doi.org/10.5194/essd-12-1561-2020.
SCIO (State Council Information Office) (2021), SCIO briefing on China's renewable energy development, http://english.scio.gov.cn/pressroom/2021-04/02/content_77372602.htm.
State Council (2021), 14th Five-Year Plan (2021-2025) for National Economic and Social Development and the Long-Range Objectives, http://www.gov.cn/xinwen/2021-03/13/content_5592681.htm.
State Council (2015), Made in China 2025, http://www.gov.cn/zhengce/content/2015-05/19/content_9784.htm.
Tong, D. et al. (2019), Committed emissions from existing energy infrastructure jeopardize 1.5 ℃ climate target, Nature, V. 572, pp. 373-377, https://doi.org/10.1038/s41586-019-1364-3.

An Energy Sector Roadmap to Carbon Neutrality in China Chapter 1: Vision of a carbon neutral China
PAGE | 51 IEA,
202
1.
UNDESA (United Nations Department of Economic and Social Affairs) (2019), 2019 Revision of World Population Prospects, https://population.un.org/wpp/.
UNFCCC (United Nations Framework Convention on Climate Change) (2021), Greenhouse Gas Data, https://unfccc.int/process-and-meetings/transparency-and-reporting/greenhouse-gas-data/ghg-data-unfccc/ghg-data-from-unfccc, accessed August 2021.
Wang, X. et al. (2019), A unit-based emission inventory of SO2, NOx and PM for the Chinese iron and steel industry from 2010 to 2015, Science of The Total Environment, V. 676, pp.18-30, https://doi.org/10.1016/j.scitotenv.2019.04.241.
World Bank (2021), World Bank Open Data, free and open access to global development data, https://data.worldbank.org/country/china.
Xi, J. (2017), Xi Jinping’s report at 19th National Congress of the Communist Party of China, http://www.xinhuanet.com/english/special/2017-11/03/c_136725942.htm.
Xinhua News (2021), 钢铁行业碳达峰及降碳行动方案成型-新华网 [The steel industry’s carbon peak and carbon reduction action plan takes shape], http://www.xinhuanet.com/fortune/2021-03/30/c_1127270603.htm, accessed May 2021.

An Energy Sector Roadmap to Carbon Neutrality in China Chapter 2: The energy transition
PAGE | 52 IEA,
202
1.
Chapter 2: The energy transition
Highlights
The Announced Pledges Scenario (APS) sets out a pathway to carbon neutrality in the People’s Republic of China’s (hereafter, “China”) energy sector in which emissions of CO2 reach a peak before 2030 and fall to net zero in 2060, in line with China’s stated goals. The remaining 610 Mt of emissions, mainly from heavy industry and long-distance transport (road freight, shipping and aviation), are entirely offset by negative emissions produced by bioenergy, in conjunction with carbon capture, utilisation and storage (CCUS), and direct air capture of CO2 with storage.
China’s primary energy demand continues to rise by 18% to 2030; it then falls by 26% by 2060, despite economic activity more than doubling. Primary energy intensity – energy consumption per Yuan renminbi (CNY) of gross domestic product (GDP) – falls by 75% between 2020 and 2060, or 3% per year on average, due to big gains in energy and material efficiency, and a shift away from heavy industry towards less energy-intensive economic activities.
The share of low-carbon energy – solar, wind, hydropower, bioenergy, other renewables and nuclear power – in primary demand jumps from 15% today to 74% in 2060. Solar energy, used for power generation and for heating, becomes the largest primary energy resource by around 2045, accounting for around a quarter of demand in 2060. The use of fossil fuels falls rapidly over the projection period, and most of that remaining in 2060 is in conjunction with CCUS. Demand for coal plunges by more than 80%, oil by around 60% and natural gas by almost 45%.
Achieving carbon neutrality in China also would also bring important other environmental benefits, notably major improvements in air quality. Despite evident progress, air pollution today remains a concern today driven by the fast expansion of China’s vehicle fleet and coal use in heavy industry and power generation. Particulate matter (PM2.5) falls to about 40% of today’s level in 2030 and to just 9% in 2060. NOX emissions fall by 35%, while SO2 emissions fall by around 30% in 2030; by 2060, NOX falls by 90% and SO2 by 80%.
The clean energy transition to carbon neutrality requires a substantial increase in energy-related investment. Total investment reaches around USD 640 billion (CNY 4 trillion) in 2030, more than 10% more than the average for the last five years, and nearly USD 900 billion (CNY 6 trillion) in 2060, almost a 60% increase from recent levels. The electricity and transport sectors account for most of the increase.

An Energy Sector Roadmap to Carbon Neutrality in China Chapter 2: The energy transition
PAGE | 53 IEA,
202
1.
A pathway to carbon neutrality There is no single pathway for energy sector emissions consistent with the goal of China of achieving a peak in CO2 emissions before 2030 and carbon neutrality before 2060.1 There are many paths to both outcomes, involving different rates of change and different aspects of the transformation of the energy system, and many uncertainties surrounding all of them. Innovation and the speed at which new technologies enter the market and are adopted – key underlying drivers of the clean energy transition and the focus of the present roadmap particularly in the long term – are especially uncertain. The required trajectory of energy sector emissions also depends on emissions from outside the energy sector, as well as emissions of other carbon-containing greenhouse gases (GHG) and air pollutants.2 Net zero CO2 emissions for the energy sector mean that any remaining emissions in sectors where abatement is technically difficult or very costly would need to be fully offset by negative emissions through carbon removal technologies.
This roadmap uses the APS to describe one plausible pathway to carbon neutrality in China’s energy sector. It sets out the broad evolution of the energy sector and the underlying technological transformation that would be required to reach a peak in emissions before 2030 and net zero CO2 emissions from the energy sector by 2060. It is designed to follow China’s enhanced targets declared in 2020 related to its nationally determined contribution (NDC) under the Paris Agreement and carbon neutrality goals (see Chapter 1). The Chinese government has since indicated that its target of carbon neutrality in 2060 may cover all GHG emissions, not just CO2 from the energy sector. We have assumed the same target date for energy sector CO2 emissions mainly on the grounds that emissions from that sector make up the overwhelming bulk of China’s total GHG emissions (or almost 90%).
The APS is designed to assess what is needed to meet those goals in a realistic and cost-effective way. It is a path, not the path, to carbon neutrality in China. In addition to the strength of policy action, much depends on the pace of innovation in new and emerging technologies in China and elsewhere, the future lifestyle
1 In this publication, unless otherwise stated, historical and projected CO2 emissions from the energy sector include those from fossil fuel combustion as well as from industrial processes, which are often closely linked to energy use. The combustion of bioenergy is considered to be carbon-neutral (following the Intergovernmental Panel on Climate Change [IPCC] 2006 Guidelines for National Greenhouse Gas Inventories), with energy-related CO2 emissions in the production of bioenergy feedstock or the conversion of biofuels being accounted for within the agriculture and other energy transformation sectors. 2 Emissions of carbon-containing GHGs other than CO2, such as methane (CH4,), and various chemical compounds used in aerosols, originate mainly from non-energy sectors, notably agriculture and waste processing. Variations in the projections from these sectors affect the necessary rates of transformation of the energy sector.

An Energy Sector Roadmap to Carbon Neutrality in China Chapter 2: The energy transition
PAGE | 54 IEA,
202
1.
choices of Chinese citizens, the availability of sustainable bioenergy, and the extent and effectiveness of international collaboration. This Roadmap also explores the opportunities for China to undertake a faster energy transition to 2030 beyond that required by the current official target, involving a faster decline in emissions over the second half of the 2020s, and the broad long-term implications for China and the rest of the world (see Chapter 5).
We also present the results of the Stated Policies Scenario (STEPS) to provide a benchmark for the APS projections. It assesses the evolution of China’s energy system on the assumption that the policies and measures that have already been adopted by the Chinese government with respect to energy and the environment are implemented, including commitments made in the NDC. This scenario does not assume any future changes to existing policies and measures, though it does consider the impact of existing policies on the long-term evolution of clean energy technologies. STEPS does not take into account the 2060 carbon neutrality target, as the policies needed to achieve it have yet to be adopted. Underlying assumptions about economic growth and population are the same as in the APS.
For both the APS and STEPS, the same broad assumptions are applied to other countries. That is, the APS assumes that all announced national net zero pledges are achieved in full and on time, regardless of whether they are currently underpinned by specific policies, while STEPS takes account only of specific policies that are in place or have been announced by governments. Both are built on the principle that the uptake of all available technologies and emissions reduction options is dictated by costs, technology maturity, policy and societal preferences, market conditions, and national circumstances. The energy transition is assumed to take place in an orderly manner, ensuring the security of fuel and electricity supplies, minimising stranded assets where possible and aiming to avoid volatility in energy market.
Neither the APS nor the STEPS should be considered as predictions, but rather as assessments of the impact of different policy approaches on technology choices and their implications for energy and emissions trends. They are intended to serve as a quantitative framework to support decision making and policy making in the energy sector and to improve understanding of the need for technological innovation in energy supply and use.

An Energy Sector Roadmap to Carbon Neutrality in China Chapter 2: The energy transition
PAGE | 55 IEA,
202
1.
Box 2.1 Modelling approach
The projections for both the APS and the STEPS are generated by a hybrid modelling approach that combines the strengths of the International Energy Agency (IEA) Energy Technology Perspectives (ETP) Model and the IEA’s World Energy Model (WEM). The ETP model is a large-scale partial-optimisation model with a detailed technology representation across the energy conversion, industry, transport and buildings sectors. In total, more than 800 technologies are modelled individually including a detailed assessment of technology readiness. The WEM is a large-scale simulation model designed to replicate how competitive energy markets function and examine the implications of policies on a detailed sector-by-sector and region-by-region basis. Both models have been developed over many years, using the latest data for energy demand and supply, costs, and prices. Combining the two models allows us to prepare a unique set of insights on energy markets, investment, technologies and the policies that would be needed for the clean energy transition.
CO2 emissions The significant gap in energy sector CO2 emissions between the STEPS and the APS that opens up especially after 2030 represents the size of the challenge China faces in achieving carbon neutrality through the accelerated deployment of clean energy technologies. In the STEPS, emissions resume their upward trajectory after a decrease in the growth rate in 2020 due to the macroeconomic impacts of the Covid-19 outbreak, reaching a broad plateau in the second half of the current decade with a peak before 2030 before starting a gentle decline and maintaining that trend through to 2060. Emissions reach 6 Gt in 2060, more than 35% below their 2020 level. In the APS, emissions follow a similar path to 2030, but fall much more rapidly thereafter, reaching net zero in 2060. Cumulative emissions over 2021-2060 in the STEPS, at around 400 Gt, are roughly 80% higher than those in the APS.
CO2 emissions from fossil fuel combustion alone reach around 450 Mt by 2060 in the APS. They are entirely offset by negative emissions produced by bioenergy in conjunction with carbon capture and storage (BECCS). The APS falls within the range of scenarios and emissions pathways produced by national institutions for China’s clean energy transition. In the APS, the peak in China’s emissions is reached at a lower level of economic development and per capita emissions than in most of the countries that have already achieved that peak.

An Energy Sector Roadmap to Carbon Neutrality in China Chapter 2: The energy transition
PAGE | 56 IEA,
202
1.
Energy-related CO2 emissions in China by scenario
IEA, 2021.
Notes: Emissions trajectories in scenarios for net zero emissions in 2060 developed by Chinese institutions use different base years. The range shown here relates to energy-related CO2 emissions, i.e. they do not include those from industrial processes. APS = Announced Pledges Scenario; STEPS = Stated Policies Scenario. Source: Emissions trajectories from scenarios developed by Chinese institutions from Energy Foundation China (2020) and Khanna, N. et al. (2021).
The APS falls within the range of scenarios and emissions pathways produced by national institution for China’s clean energy transition
Box 2.2 How does China’s expected emissions peak compare with other countries?
If China’s emissions were to peak before 2030, it would likely mean that the country had achieved this feat at lower levels of economic development and per capita emissions than most other countries that have already passed peak emissions. Most other economies achieved that peak when GDP per capita was between USD 20 000 (about CNY 140 000) and USD 50 000 (about CNY 340 000) at PPP and 2019 prices (see Chapter 1). In the APS, China’s emissions peak before 2030 at just above USD 20 000 (about CNY 140 000) per capita. Similarly, China’s peak per capita emissions are around 7 t CO2 to 8 t CO2, compared with the 7 t CO2 to 15 t CO2 range in most other countries.

An Energy Sector Roadmap to Carbon Neutrality in China Chapter 2: The energy transition
PAGE | 57 IEA,
202
1.
Per capita annual energy-related CO2 emissions and GDP at emissions peak in China and selected other countries
IEA, 2021.
Notes Selected countries include Australia, Canada, Denmark, Finland, France, Germany, Greece, Israel, Italy, Japan, Korea, the Netherlands, New Zealand, Norway, Poland, Portugal, Spain, Sweden, the United Kingdom and the United states (US) . PPP = Purchasing power parity; APS = Announced Pledges Scenario.
Remaining energy sector emissions in 2060, which total around 610 Mt, come mostly from sectors where they are hard to abate, mainly heavy industry and long-distance transport (road freight, shipping and aviation). The share of combustion-related emissions from coal is about 50% lower in 2060 relative to 2020, as unabated coal-fired power plants and coal-based industrial processes are largely phased out. Process emissions (generated inherently as part of chemical reactions in industrial processes) fall by around 90% over 2021-2060, their share of total emissions almost doubling as it proves particularly difficult to eradicate such emissions in certain heavy industries, notably cement and steel. Residual energy sector emissions in 2060 are entirely offset by negative emissions produced by BECCS and direct air capture (DAC) with storage (see Chapter 4 for a detailed discussion of these carbon removal technologies). BECCS alone provides more than 80% of total negative emissions in 2060. Carbon removal technologies could also help compensate for some of the more difficult-to-abate non-CO2 GHG emissions in China’s quest to achieve economy-wide GHG neutrality by 2060.
US
GERMANY
JAPAN
0
5
10
15
20
25
0 10 20 30 40 50 60 70
tonn
e C
O2
per c
apita
thousand USD 2019 at PPP per capita
Other economiesat peak
China at peak(APS)
China historicaltrend
Average*
(other economies)

An Energy Sector Roadmap to Carbon Neutrality in China Chapter 2: The energy transition
PAGE | 58 IEA,
202
1.
Energy sector CO2 emissions by fuel and technology in China in the APS
IEA, 2021.
Notes: STEPS = Stated Policies Scenario; APS = Announced Pledges Scenario.
Emissions from fossil fuel combustion and industrial processes in 2060, at just 0.6 Gt, are entirely offset by negative emissions using carbon removal technologies
As in the rest of the world, no single technology can deliver the emissions reductions required for reaching net zero emissions in China. Decarbonising the entire energy sector requires the deployment of a wide range of technologies, tailored to the needs of individual parts of the energy sector and to China’s circumstances. The clean energy transition to 2030 can build on a range of available technologies as well as proven policies, with the biggest contributions to emissions reductions in the APS initially coming from gains in energy efficiency, particularly in industrial processes, space heating and cooling, and road vehicles (see below). Energy efficiency alone contributes around a quarter of the CO2 emissions reductions in 2030 in the APS. This share drops in the long run once best available technologies dominate the market, but it still accounts for around 12% of the total emissions reductions in 2060. Renewable electricity, mainly wind and solar PV, accounts for a third of total emissions reductions in 2030. The contribution of renewables rises further to almost 40% in 2060 as such energy sources become dominant in electricity generation stocks.
- 2
0
2
4
6
8
10
12
14
2020 2030 2060STEPS
Gt
Coal Oil Gas Bioenergy & waste Direct air capture Process Net CO2 emissions
- 2
0
2
4
6
8
10
12
14
2020 2030 2060APS
Net CO2

An Energy Sector Roadmap to Carbon Neutrality in China Chapter 2: The energy transition
PAGE | 59 IEA,
202
1.
Energy sector CO2 emissions reductions by measure in China in the APS
IEA, 2021.
Notes: Other renewables include in particular solar PV and wind. Energy efficiency accounts for enhanced technology performance. CCUS = carbon capture, utilisation and storage. Avoided demand accounts for emissions reductions from the lowering of energy service demand through technology optimisation (e.g. smart thermostats, material efficiency, eco-driving, etc). Hydrogen includes low-carbon hydrogen and hydrogen-derived fuels such as ammonia and synthetic hydrocarbon fuels. See ETP model documentation for the definition of each abatement measure. (www.iea.org/reports/energy-technology-perspectives-2020/etp-model).
Energy efficiency, solar PV and wind account for almost 60% of the emissions reductions in 2030, while electrification, CCUS, hydrogen, behavioural change and bioenergy play bigger roles in 2060 in the APS
For the long-term transition to carbon neutrality by 2060, however, there are four additional technology opportunities that emerge in the transition over the projection horizon in the APS (they are assessed in detail in Chapter 4):
• Electrification of end-use sectors: The rising share of electricity in total energy use in all sectors accounts for 13% of cumulative CO2 emissions savings over 2021-2060.
• Carbon capture, utilisation and storage: The role of CCUS changes over the projection period. The initial focus is on addressing emissions from young existing assets in the power sector and heavy industry by retrofitting carbon capture equipment. Later, the removal of CO2 from the atmosphere comes into play, offsetting emissions in sectors where emissions are hard to abate. CCUS accounts for 8% of the total cumulative emissions savings to 2060.
• Low-carbon hydrogen and hydrogen-derived fuels: The use of hydrogen and ammonia and synthetic hydrocarbon derived from hydrogen increases over time across different sectors, contributing more than 3% of cumulative emissions savings by 2060.
• Sustainable bioenergy: Biomass and fuels derived from biomass feedstock, including gaseous and liquid biofuels, play an important role in curbing emissions, especially in the near term and in road and air transport. It contributes almost 7% of cumulative emissions savings to 2060.
0
3
6
9
12
15
18
2020 Servicedemand
Mitigationmeasures
2030 Servicedemand
Mitigationmeasures
2060
Gt C
O2
Behaviour
Avoided demand
Energy efficiency
Hydrogen
Electrification
Bioenergy
Other renewables
Other fuel shifts
CCUS

An Energy Sector Roadmap to Carbon Neutrality in China Chapter 2: The energy transition
PAGE | 60 IEA,
202
1.
These four technology areas are generally at an earlier stage of development and deployment than renewables, nuclear power and technologies for increasing the energy efficiency of using fossil fuels. Their contributions to curbing emissions will depend on accelerating innovation and commercialisation. In the absence of relevant policies to support these technologies, such change is unlikely to be achievable (see Chapter 6). Finally, behavioural changes, such as energy conservation and switching to less energy-intensive modes of transport, and avoided demand through a more efficient use of materials, are also important abatement levers in China, accounting jointly for 12% of total emissions reductions in 2060.
Differences in technology maturity explain why the speed of progress towards net zero emissions differs among sectors in the APS. Many clean-electricity-generating technologies are already available today on the market and are deployed rapidly, so that China’s power sector is fully decarbonised before 2055. In other sectors, most low-carbon technology options are still under development and are deployed later, delaying the reduction in emissions. The passenger car fleet and buildings are almost fully decarbonised by 2060, emitting less than 5 % by then compared to current levels. By contrast, long-distance transport modes – heavy road freight, aviation and maritime shipping – still emit significant volumes of CO2 in 2060, despite falling by 60%, as does heavy industry (mainly chemicals, iron and steel and cement), which see a 94% reduction (see Chapter 3). No technology to produce fossil-free iron and steel is commercially available today anywhere in the world, though it is expected to be demonstrated in the present decade.
Energy sector CO2 emissions by sector, sub-sector and fuel in China in the APS
IEA, 2021.
Notes: BECCS = bioenergy with carbon capture and storage. DACS = direct air capture and storage. Other energy transformation includes coal mining, oil and gas extraction, oil refining, coal and gas transformation and liquefaction, production of hydrogen and hydrogen-based fuels, and biofuels production with and without CCS.
The emissions that remain in 2060 are concentrated in sectors where emissions are hard to abate – essentially heavy industry and long-distance transport
-1.0
0.0
1.0
2.0
3.0
4.0
5.0
6.0
2030 2060 2030 2060 2030 2060 2030 2060 2030 2060 2030 2060Power Other energy
transformationIndustry Transport Buildings Direct air
capture andstorage
Gt C
O2 Residential
ServicesAviationShippingRoadOther transportIron and steelCementChemicalsOther industryCoalOilGasBECCSDACS

An Energy Sector Roadmap to Carbon Neutrality in China Chapter 2: The energy transition
PAGE | 61 IEA,
202
1.
Another reason for differences in the projected pace of decarbonisation across sectors in the APS is the age structure of existing energy-related assets. Many of China’s power and industrial plants, which depend heavily on fossil energy, were built only recently. Most were designed to last decades, so shutting them down early would be expensive (see below). In principle, it will be possible to retrofit those plants with CCUS where CO2 storage is available, though the economic competitiveness of doing so will need to be assessed on a case-by-case basis. Ships and aircraft are also expensive assets with long lifetimes. Innovation will be needed to replace existing ones with new low-carbon technologies or fuels in the long term.
Energy trends
Primary energy demand China’s primary energy demand3 increases by 18% between 2020 and 2030, and then falls by 26% by 2060 to a level 12% lower than in 2020 in the APS. This compares with an increase of around 10% over 2020-2060 in the STEPS. Although population declines by around 7%, economic activity more than triples. The decoupling of economic growth and energy demand in the APS represents a significant break with past trends. Primary energy intensity – the amount of energy consumed per CYN of GDP – falls by 75% between 2020 and 2060, or 3% per year on average.
The reduction in energy demand in the APS is largely the result of big gains in energy and material efficiency, as well as a shift away from heavy industry towards less energy-intensive economic activities. Efficiency gains moderate the growth in demand to 18% by 2030, when it begins to decline as heavy industry production peaks within that period. Electrification of end uses contributes to this trend, as electricity can provide many energy services more efficiently than conventional fossil-based technologies. For example, an electric car today is two to four times more efficient than an equivalent internal combustion engine (ICE) car, while an electric heat pump can provide the same amount of useful space heat as a conventional gas-fired boiler using up to 75% less energy.
3 Primary energy refers to energy in its initial form before being subjected to any human-engineered conversion process. Some energy is converted in power stations, refineries, heat plants and other transformation processes. Final consumption refers to energy and feedstock use in final end-use sectors net of losses in transformation and distribution.

An Energy Sector Roadmap to Carbon Neutrality in China Chapter 2: The energy transition
PAGE | 62 IEA,
202
1.
Primary energy demand by fuel in China in the APS (EJ)
2020 2030 2060
Coal 87 86 16
Oil 26 32 11
Natural gas 12 15 7
Nuclear 4 7 19
Renewables 18 32 76
Hydro 5 5 7
Modern bioenergy and waste 4 11 16
Traditional use of biomass 3 0 0
Solar 3 10 33
Wind 2 4 16
Other renewables 1 1 3
Total 147 173 129
Non-fossil fuel share* 15% 23% 74%
Non-fossil fuel share** (PS method) 16% 26% 80%
Net energy sector emissions (Gt CO2) 11 11 0
* Calculated using the IEA methodology based on the physical energy content method. ** Calculated using the partial substitution (PS) method used by China’s National Bureau of Statistics. Note: CO2 emissions from the energy sector include those from fossil fuel combustion as well as from industrial processes.
In the APS, the share of non-fossil fuels in total primary energy demand broadly matches the official target for 2030. 4 The share jumps to around 75% in 2060, almost twice the level reached in the STEPS. The share of renewables jumps from 12% in 2020 to 60% in 2060, near twice the share achieved in the STEPS. Solar energy, which is used for power generation (solar PV) and for heating in buildings and industry (solar thermal), becomes the largest primary energy resource by around 2045, accounting for around a quarter of total demand in 2060. The share of sustainable bioenergy more than doubles by 2060 relative to 2020, in part thanks to its versatility in being able to be used to provide power and heat for buildings and industry or converted into gaseous or liquid fuels for heating or
4 At the United Nations Climate Ambition Summit in December 2020, the Chinese government declared that it would enhance its NDC targets for 2030, including an increase in the share of non-fossil fuels in primary energy consumption to around 25% by 2030 (calculated using China’s National Bureau of Statistics methodology based on the PS method).

An Energy Sector Roadmap to Carbon Neutrality in China Chapter 2: The energy transition
PAGE | 63 IEA,
202
1.
transport. Nuclear power also expands rapidly, almost quintupling between 2020 and 2060. Its share of primary demand reaches around 15% in 2060 compared with 3% today and 9% in the STEPS.
Primary energy demand in China by fuel and scenario
IEA, 2021.
Notes: APS = Announced Pledges Scenario; STEPS = Stated Policies Scenario.
With fossil fuel use falling rapidly, the share of renewables in total demand rises from 12% in 2020 to 60% in 2060; solar energy becomes the largest energy source in the APS
The growth in the use of renewables – largely solar PV, wind power and bioenergy – in the APS represents an acceleration of current trends. It is driven by assumed stronger policies to tackle climate change, enhance energy security and improve air quality in line with China’s long-term goals. Those policies spur faster improvements in technology and cost reductions, encouraging faster deployment in a virtuous circular manner. The integration of much higher shares of variable renewables into the generating mix requires far greater use of novel ways of providing system flexibility, such as battery and hydrogen storage, to ensure electricity security (see Chapter 4). Greater electrification of end uses facilitates this integration by increasing the potential of demand response, such as flexible charging of electric vehicles (EVs).
The use of fossil fuels falls rapidly over the projection period and most of those that are still used in 2060 do not produce emissions thanks to the widespread deployment of CCUS at new and existing industrial and power plants and other fuel transformation facilities. Coal consumption plunges by more than 80%, with around 60% of the remaining coal use in 2060 being used in power plants equipped with carbon capture facilities. In the STEPS, coal use falls by around 40%. Oil demand falls by around 60% below today’s level (5% above in the STEPS) to around 4.8 mb/d in 2060, of which nearly 55% is for non-emitting
0
25
50
75
100
125
150
175
200
2020 2030 2060 2030 2060STEPS APS
EJ Other renewables
Solar
Bioenergy & waste
Wind
Hydro
Nuclear
Natural gas
Oil
Coal

An Energy Sector Roadmap to Carbon Neutrality in China Chapter 2: The energy transition
PAGE | 64 IEA,
202
1.
feedstock and most of the remainder for aviation, shipping and freight road transport. Natural gas demand peaks by around 2035 and falls by almost 45% below today’s levels by 2060 (it rises by 25% in the STEPS). By then, gas is used primarily as a fuel in power generation to provide electricity system flexibility, as a substitute fuel for coal in cement production, and as a fuel and feedstock in hydrogen production, mostly in cases in conjunction with CCUS.
Final energy demand China’s total final energy consumption in the APS increases moderately in the early 2020s and then falls steadily through to 2060 with energy and material efficiency gains – especially in the period to 2030 – and structural economic changes. By 2060, it is around 15% lower than in 2020 and around one-quarter lower than in the STEPS. Electricity consumption increases the most in absolute terms in the APS, almost doubling by 2060, followed by hydrogen, which emerges as a fuel in the 2020s, primarily in the transport sector, but also in the industry and electricity sectors. Liquid synthetic hydrocarbon fuels, derived from hydrogen produced from low-carbon electricity and CO2, begin to be used in aircraft in the first half of the 2030s and reach the equivalent of around 0.35 mb/d in 2060, meeting 26% of China’s total aviation fuel demand.
Final energy demand by fuel and sector in China by scenario
IEA, 2021.
Notes: APS = Announced Pledges Scenario; STEPS = Stated Policies Scenario. Hydrogen includes low-carbon hydrogen and hydrogen-derived fuels (ammonia and synthetic hydrocarbon fuels).
Final energy use increases moderately in the early 2020s and then falls steadily through to 2060 in the APS with energy and material efficiency gains and structural economic changes
Coal demand sees the biggest decline in both absolute and percentage terms in the APS, falling almost 85% between 2020 and 2060. This is largely driven by the transformation of the industrial sector, which is the main final user of coal today.

An Energy Sector Roadmap to Carbon Neutrality in China Chapter 2: The energy transition
PAGE | 65 IEA,
202
1.
Beyond the shift from more coal-intensive heavy industry towards less energy-intensive industries, coal is also replaced as fuel and as reducing agent in heavy industry (see Chapter 3). Coal use in cement production is replaced to a large extent with low-carbon fuels such as bioenergy and waste. Coal-based steel production is progressively displaced by hydrogen-based direct reduced iron routes and scrap-based steel production, mainly fuelled by electricity. Coal use in buildings, which accounted for 7% of total final coal consumption in 2020, disappears by 2060 with the widespread electrification of space heating. Final oil demand falls by almost 60%, with feedstock for petrochemical production absorbing most of the oil still used in 2060. Natural gas use falls by more than 60% over 2020-2060 with its use for generating process heat in industry being reduced by more efficient technologies and for space heating in buildings by electric heat pumps and more energy-efficient building envelopes.
The decline in fossil fuel use is most pronounced in the industry sector, where coal dominates energy needs today, but consumption also falls heavily in the transport and buildings sectors in the APS. In all three sectors, electricity emerges as the leading source of energy. In the transport sector, hydrogen, ammonia and synthetic hydrocarbon fuels cover almost 25% of all energy needs in 2060 and electricity around 55%.
Change in final energy demand by fuel and sector in China in the APS, 2020-2060
IEA, 2021.
Notes: Final consumption refers to energy and feedstock use in final end-use sectors net of losses in transformation and distribution. Synthetic HC fuels = synthetic hydrocarbon fuels.
Electricity, bioenergy, hydrogen and hydrogen-based fuels replace the bulk of fossil fuels in end uses in a carbon-neutral China
- 40 - 30 - 20 - 10 0 10 20
Industry
Transport
Buildings
EJ
CoalOilNatural gasElectricityHeatHydrogenAmmoniaBioenergy & wasteOther renewablesSynthetic HC fuels

An Energy Sector Roadmap to Carbon Neutrality in China Chapter 2: The energy transition
PAGE | 66 IEA,
202
1.
Focus on energy efficiency Improving energy efficiency is crucial to China’s energy transition. It has played an important role in the slowing of CO2 emissions growth in recent years and has the potential to play a leading role in the future, especially in the near term. Primary energy intensity fell by 3% per year on average between 2011 and 2020. In the APS, the average pace of decline accelerates to 2040, slowing thereafter to 2% per year on average in the period to 2060 as the average efficiency of equipment in use approaches that of the most efficient technologies available.
Energy intensity improves considerably in all end-use sectors in the APS. In industry, the national average thermal energy intensity of producing clinker – the main ingredient of cement – falls by 15% between 2020 and 2060 thanks to energy efficiency improvements associated with the adoption of state-of-the-art technology when existing equipment is refurbished or replaced. These improvements are partly offset by additional energy requirements related to the use of other carbon mitigation measures, for instance the installation of carbon capture equipment or the pre-treatment of alternative fuels or raw materials such as biomass, waste or calcined clay. The average energy intensity of steel production falls by 40% between 2020 and 2060, reaching global average best practice levels by 2045, mainly driven by process integration measures to optimise the use of by-products and excess heat in steel works. The best-performing industrial equipment such as electric motors become the norm in all new installations by 2030 (see Chapter 3).
Selected energy efficiency indicators in China in the APS
IEA, 2021.
Note: Steel energy intensity is measured as energy consumption per tonne of steel produced (from iron ore preparation to crude steel production), car average fuel economy as energy consumption per kilometre and buildings energy intensity as energy consumption per square metre of floor area.
Energy efficiency improves enormously across all end-use sectors in China in the APS, especially for passenger cars in the coming decade

An Energy Sector Roadmap to Carbon Neutrality in China Chapter 2: The energy transition
PAGE | 67 IEA,
202
1.
In transport, improved efficiency yields large intensity gains across different modes over 2020-2060 in the APS. On average, the fuel economy (measured by energy consumption per kilometre travelled) of the light-duty vehicle fleet drops by about 4.0% per year between 2020 and 2030, slowing to around 1.8% in 2030-2060. This results from the progressive shift to electric motors in cars, light commercial vehicles and minibuses, which are inherently more efficient than ICEs, as well as more efficient ICEs and powertrains, and improved designs and materials. In the case of trucks, the average fuel economy improves by 2.3% per year to 2030, mostly with more efficient conventional engine trucks, and by 0.5% per year thereafter, mostly due to the steady penetration of EVs and hydrogen-powered fuel-cell EVs.
In buildings, energy consumption per unit of floor area falls at an average annual rate of around 1.4% between 2020 and 2030 in the APS, and to 0.7% thereafter to 2060. This is mainly driven by improvements in the thermal efficiency of building envelopes that reduce energy needs for heating and cooling, as well as more efficient heating and cooling equipment, light ing (including a continued switch to much more efficient light-emitting diodes [LED] light bulbs) and appliances. Electrification is a key pillar of the transformation of the buildings sector in the APS, augmenting energy efficiency gains in heating and cooking. In particular, the deployment of electric heat pumps increases the average efficiency of space heating equipment installed in 2030 by 40% and in 2060 by more than two-fold.
The scale of energy efficiency improvements in the APS requires early policy action to stimulate the adoption of the most efficient technologies already available to avoid locking in inefficient energy use in the long term. While the accelerated deployment of clean and efficient energy technologies is essential to reduce emissions in transport, buildings and industry, changes in consumer behaviour and lifestyles can also make an important contribution, especially in sectors where technical options for cutting emissions are limited. In the APS, behavioural changes by Chinese citizens and companies – reflected in the changes in energy consumption patterns and trends discussed above – are mostly induced by policies and investments made by the government. The Covid-19 pandemic has demonstrated that behaviour can change for the common good if people understand that change is necessary. It is up to the government to explain convincingly why and to provide clear guidance about what changes are needed (see Chapter 7).

An Energy Sector Roadmap to Carbon Neutrality in China Chapter 2: The energy transition
PAGE | 68 IEA,
202
1.
Environmental co-benefits Achieving carbon neutrality in China would not just help avert the worst consequences of climate change; it would also bring important other environmental benefits, notably major improvements in air quality. China has improved air quality considerably in recent years, but pollution – ambient and indoor – remains a serious health problem, especially in urban agglomerations and industrial clusters. Decarbonising the entire energy system would be a major step towards eradicating the problem for good.
The government has taken firm steps to address ambient air pollution over the last decade. The National Ambient Air Quality Standard, first issued in 1982, was revised in 2012 and fully implemented in 2016. It requires cities to achieve by 2030 the national standard for fine PM2.5 of 35 μg/m3, which corresponds to interim target-1 of the World Health Organization (WHO).5 China started publishing an air quality index, which measures PM2.5 in real time in more than 360 cities. The Action Plan on Prevention and Control of Air Pollution, issued by the State Council in September 2013, identified goals to improve the air quality of the entire country by 2017, while imposing stricter air pollution reduction guidelines in three key industrial areas surrounding Beijing, Shanghai and Guangzhou. Among other things, the plan pledged to strictly control coal consumption. A three-year action plan to fight air pollution was launched in 2018.
A new action plan to improve air quality further is being developed for the 14th Five-Year Plan (FYP) period of 2021-2025. That FYP sets a binding target for 337 cities at and above prefecture level for the share of days meeting the national air quality standard at 87% in 2020, which was reinforced for 2025 (standards were met on only 82% of days in 2019 and 84.8% in 2020 when adjusted for the impact of the Covid-19 pandemic). There is also a target of reducing PM2.5 concentration by 10% and eliminating heavy pollution in the same cities by 2025. For key regions, including Beijing-Tianjin-Hebei and surrounding areas (BTHS), the Yangtze River delta, and the Fenwei Plain, a reduction of 10% in emissions of nitrogen oxides (NOX) is targeted.
Progress is evident. According to official figures, 157 of the 337 cities reached the national air quality standard in 2019 – more than twice as many as in 2016. Nationwide, over the past five years, we estimate that emissions of sulphur dioxide (SO2) fell by almost 40%, largely because of pollution controls in the power sector,
5 The WHO air quality guideline sets the maximum concentration of PM2.5 at 10 μg/m3. The WHO has introduced a series of interim targets that are less stringent, but represent an attainable set of milestones towards better air quality.

An Energy Sector Roadmap to Carbon Neutrality in China Chapter 2: The energy transition
PAGE | 69 IEA,
202
1.
while PM2.5 emissions dropped by almost 35%, mainly due to a shift away from traditional use of biomass by households and control measures in industry. Yet air pollution remains a serious problem. Today only about 1% of the population has a level of exposure to PM2.5 concentrations that complies with the WHO guideline, while around 80% of the population is exposed to levels even higher than the most modest WHO interim target-1 (Cheng et al., 2021). Almost 1 million premature deaths are attributable to ambient air pollution today (Yue et al., 2020).
In the APS, massively reduced combustion of fossil fuels allied with continued efforts to control pollution, including stringent emissions standards, leads to rapid improvements in air quality in China. The main reason for this improvement is a sharp drop in PM2.5 emissions, which fall to about 40% of today’s level in 2030 and to just 9% in 2060. NOX emissions fall by around 35%, while SO2 emissions fall by around 30% in 2030; NOx drops by almost 90% in 2060 and SO2 by 80% in 2060.
Air pollutant emissions by type and sector in China in the APS
IEA, 2021.
* Includes the transformation sector (except power and heat). Notes: Air pollutant emissions include indoor pollutants from domestic cooking and heating. TPED = total primary energy demand. SO2 = sulphur dioxide; NOx = nitrogen oxide; PM2.5 = particulate matter with a diameter less than 2.5 micrometres.
Emissions of all the main pollutants fall sharply as fossil energy use is phased out and stringent air pollution standards take effect
Industry and transformation sectors other than power and heat are the largest contributors to air pollutant emissions in China today. Together they are responsible for around 55% of all of the country’s SO2 and one-third of NOX emissions and are the second-largest contributors to PM2.5 emissions after the buildings sector. Equipment to control emissions is widely used, but the technologies are often inefficient. For example, more than two-thirds of coal-related PM2.5 emissions are controlled today by basic and cheap electrostatic precipitator (ESP) devices. In-furnace limestone injection to limit SO2 emissions is used in about half of the
0%
20%
40%
60%
80%
100%
120%
140%
2020 2030 2040 2050 2060
Inde
x (2
015
= 10
0%)
SO2 NOx PM2.5 TPED
0%
25%
50%
75%
100%
2030 2060 2030 2060 2030 2060
SO2 NOx PM2.5
Industry* Transport Buildings Power OtherSO2
SO2 NOX
NOX PM2.5
PM2.5

An Energy Sector Roadmap to Carbon Neutrality in China Chapter 2: The energy transition
PAGE | 70 IEA,
202
1.
industries that use coal, but it removes only about half of the emissions. In the APS, more efficient technology makes significant inroads: the introduction of technologies with higher efficiency (such as advanced ESP and fabric filters) enable more efficient control of PM2.5, while the increasing deployment of wet flue-gas desulphurisation devices, such as wet scrubbing or sulphuric acid processes, remove about 85%. For reducing NOX emissions, low- NOX burners are widely adopted. These efforts result in a fall in SO2 emissions of about 20% by 2030 and more than 75% by 2060, while PM2.5 and NOX emissions are cut by 30-35% by 2030 and 85-88% by 2060.
In recent years, coal-fired power plants have been a major focus of policy efforts to tackle deteriorating air quality, because they are major sources of pollution and usually located close to densely populated urban areas in China’s coastal provinces. A more stringent set of emissions standards for power plants comparable with those in the European Union and the United States were introduced in 2012: 30 mg/m3 for PM2.5, 100 mg/m3 for SO2 from new plants and 200 mg/m3 for existing ones (although it can be higher in some provinces), and 100 mg/m3 to 200 mg/m3 for NOX. In the APS, power sector emissions of SO2 drop by around 25% in 2030 and almost 75% in 2060, NOX by almost 30% and more than 80%, and PM2.5 by almost 50% and more than 90%.
In the transport sector, policy makers have struggled to introduce anti-pollution measures fast enough to keep pace with the expansion of China’s vehicle fleet. But emissions limits for all vehicle types that are among the most stringent in the world are now in place. In the APS, emissions of all pollutants from transport fall heavily through the enforcement of air pollution standards and the electrification of vehicles. NOX emissions drop by more than 35% in 2030 and by more than 95% in 2060, while PM2.5 emissions fall by almost 45% and 75%. Efforts to strengthen fuel quality standards together with the phasing out of conventional ICE vehicles reduce SO2 emissions by 20% by 2030 and more than 95% by 2060.
Around one-third of the Chinese population continues to rely on the use of solid fuels for cooking and heating, mostly in rural areas. This is an important source of household air pollution, which is still cause of premature deaths.6 In the APS, the elimination of traditional biomass and coal use for cooking and heating enables the buildings sector to reduce direct PM2.5 and SO2 emissions by around 95% by 2060 and direct NOx by around 80% over the same period. The number of premature deaths associated with household air pollution falls by almost 80% to less than 160 000 already in 2030 in the APS.
6 China has indoor air quality standards for households, limiting the concentration levels of particulate matter to 150 μg/m3, but most households exceed this limit.

An Energy Sector Roadmap to Carbon Neutrality in China Chapter 2: The energy transition
PAGE | 71 IEA,
202
1.
The extent of the task of reducing PM2.5 pollution varies considerably across regions, reflecting differences in economic structure and patterns of fossil energy use. All regions apart from BTHS would meet the WHO guideline on PM2.5 by 2060 if the carbon neutrality target is met (Cheng et al., 2021). Heavy air pollution in that region today is mainly driven by the large emissions from heavy industry and the residential sector, together with unfavourable topography and meteorological conditions.
Illustration of population-weighted mean PM2.5 concentration and fossil fuel share in primary energy demand by selected region in China at carbon neutrality in 2060
IEA, 2021.
Notes: The five regions selected are the most heavy-polluted and densely-populated. BTHS = Beijing-Tianjin-Hebei and surrounding areas; FWP = Fenwei Plain; YRD = Yangtze River Delta; SCB = Sichuan Basin; PRD = Pearl River Delta. NDC = nationally determined contribution; μg/m3 = micrometres per cubic metre. Source: Reproduced from Cheng et al., 2021.
Carbon neutrality coupled with strict clean air policies would result in all but one of the most polluted and densely populated regions meeting the WHO guideline for PM2.5
Box 2.3 Bringing down fossil methane emissions in China
Methane emissions are the second-largest cause of global warming. While methane tends to receive less attention than CO2, reducing methane emissions is critical for avoiding the worst effects of climate change. Methane has a shorter atmospheric lifetime than CO2 but it absorbs much more energy while it remains in the atmosphere. China is the world’s largest emitter of methane from fossil fuel operations. These amounted to almost 26 Mt (770 Mt CO2-eq) in 2020,
0
20
40
60
80
100
120
China BTHS FWP YRD SCB PRD
µg/m
3
NDC goals Carbon neutrality goals
0%
20%
40%
60%
80%
100%
China BTHS FWP YRD SCB PRD
PM2.5 exposure Fossil fuel share in primary energy

An Energy Sector Roadmap to Carbon Neutrality in China Chapter 2: The energy transition
PAGE | 72 IEA,
202
1.
representing over 20% of global fossil methane emissions or roughly the same as total CO2 emissions from the country’s road transport sector.
Fossil methane emissions in the top-three emitters globally in 2020 and emissions reductions in China in the APS
IEA, 2021.
Note: APS = Announced Pledges Scenario; Mt CH4 = million tonnes of methane.
In the APS, a concerted effort to deploy all available abatement measures in fossil fuel supply as well as changes in fossil fuel consumption lead to a fall of over 80% in methane emissions by 2060. Most of this drop stems from reductions in coal mine methane emissions and achieving this will require overcoming major economic and institutional hurdles. There is a relatively small number of technical solutions to avoid coal mine methane emissions, especially after the start of operations, but all of these are deployed in the APS. Methane can also be emitted in abandoned mines and these emissions must be addressed, especially as domestic coal production starts to fall. In the oil and gas sector, methane emissions fall by almost 75% by 2060, reflecting the availability of a broad range of cost-effective and readily available mitigation technologies, such as vapour recovery units that reduce the need to vent or flare gas, and frequent leak detection and repair programmes, as well as lower production. Chinese policy makers are aware of the importance of addressing methane to achieve climate neutrality. It was included as a priority for mitigation efforts in the 14th FYP (2021-2025), with a national methane action plan expected by early 2022. Some regulations have already been issued. A 2020 notice on environmental impact assessments for coal developments requires improvements in the utilisation rate of coal mine methane: it stipulates the need to use it where concentrations are above 8% and encourages utilisation if concentrations are below that level. In 2021, a policy document called for piloting methane monitoring in oil, gas and coal developments. Government officials also indicated their intention to improve methane emissions standards, promote investments in mitigation measures and support institutions working on methane reduction strategies. China, as a major consumer of oil and natural gas, could also adopt performance standards or similar policy instruments to drive methane reductions in pipeline and storage facilities. Some state-owned companies have begun to tackle methane emissions. The China Oil and Gas Methane Alliance was established this year by seven Chinese
0
5
10
15
20
25
30
China Russia US 2020 Reductions 2030 Reductions 20602020 APS - China
Mt C
H4
Coal mine
Oil and gas
Oil and gas-related
Coal-related
Emissions reductions
Emissions

An Energy Sector Roadmap to Carbon Neutrality in China Chapter 2: The energy transition
PAGE | 73 IEA,
202
1.
companies with the objective of reducing the average methane intensity of natural gas production (the ratio of methane emissions to gas produced) to below 0.25% by 2025. China National Petroleum Corporation, which currently leads the initiative, aims to lower its methane intensity by 50% from the 2019 baseline and achieve international best practice on methane management by 2025. * Methane global warming potential is considered at 30 over 100 years based on IPCC, 2021.
Energy investment The clean energy transition envisioned in the APS requires a major increase in energy-related investment, both in energy supply and in demand-side equipment and infrastructure, yet it is well within China’s financial means. Total energy investment reaches around USD 640 billion (around CNY 4 trillion) in 2030 – more than 10% more than the average for the last five years and nearly USD 900 billion (CNY 6 trillion) in 2060, almost a 60% increase relative to recent years. However, the share of energy investment in China’s GDP, which averaged 2.5% in 2016-2020, drops to 1.6% by 2030 and to just 1.1% by 2060.
Annual energy investment by sector and technology area in China in the APS
IEA, 2021.
Notes: 2016-2020 are annual averages. Left graph: infrastructure includes electricity networks, public EV recharging, CO2 pipelines and storage facilities, direct air capture and storage facilities, hydrogen refuelling stations, and in import, export and liquefaction terminals, storage facilities as well as pipeline systems for hydrogen, fossil fuels pipelines and terminals. Right graph: end‐use efficiency investments are the incremental cost of improving the energy performance of equipment relative to conventional designs. Electricity systems include electricity generation, storage and distribution, and public EV charging. Electrification investments include spending on batteries for vehicles, heat pumps and industrial equipment for electricity‐based material production routes.
Energy investment rises by more than 10% to 2030 and almost 60% by 2060, driven mainly by electricity generation, networks and end-user equipment, though its share of GDP falls progressively
0.2
0.4
0.6
0.8
1.0
2030 2040 2050 2060 2030 2040 2050 2060
Trill
ion
USD
(201
9) OtherFossil fuelsCCUSHydrogenElectricity systemElectrificationEfficiencyOther renewablesBioenergy
BuildingsTransportIndustryInfrastructureElectricity generationFuel production
By sector By technology area
2016-20
Technology area
Sector
2016-20

An Energy Sector Roadmap to Carbon Neutrality in China Chapter 2: The energy transition
PAGE | 74 IEA,
202
1.
Overall supply-side investment increases over 2021-2060 in the APS, despite the projected slowdown in the rate of growth in supply. Its share in total energy investment over that period falls, though, compared with the average for 2016-2020. Power generation accounts for the bulk of the increase in supply-side investment. Investment increases for renewables (despite falling unit costs) as well as for nuclear power, hydrogen and other low-emissions fuels, offsetting the rapid decline in spending on fossil energy production and fossil-based heat and power generation. The share of fossil fuel supply in total energy sector investment drops from an annual average of more than 15% in 2016-2020 to less than 1% in 2060.
Total investment in end-use sectors increases substantially over the projection period. The transport sector sees the biggest increase, rising from an average of almost USD 120 billion (almost CNY 820 billion) in 2016-2020 to around USD 210 billion (CNY 1.4 trillion) in 2060. This stems from increased demand for mobility – boosting demand for cars, trucks, planes and ships – and related transport infrastructure, as well as the higher capital cost of EVs compared with conventional vehicles (despite the projected decline in the cost of batteries) and other means of transport. Policies to reduce travel (e.g. through teleworking) and increase the use of public transport nonetheless reduce investments in road vehicles in the longer term. Investment in transport infrastructure jumps by more than 30 times by 2060 compared with the average for 2016-2020.
Investments in buildings more than doubles from around USD 50 billion (around CNY 350 billion) per year in 2016-20 to almost USD 130 billion (about CNY 890 billion) in 2040, driven mainly by retrofits to building envelopes and spending on more efficient electrical appliances and heating equipment, falling back to around USD 95 billion (almost CNY 650 billion) in 2060. Improvements to building envelopes extend the lifetime of the buildings stock, thereby reducing investment needs in buildings later, which in turn reduces overall demand for construction materials. Investment in industry increases from USD 50 billion (around CNY 345 billion) per year in 2016-2020 to almost USD 110 billion (around CNY 750 billion) in 2060, mainly because of the shift to more expensive low-carbon technologies for producing steel, cement and chemicals.
By technology area, electrification is the principal driver of higher investment in the APS. More capital is needed to transform power generation and expand and modernise electricity networks, as well as for electric appliances and equipment in end uses, including EV batteries, heat pumps and industrial motors. Investment nearly doubles from a yearly average of about USD 280 billion

An Energy Sector Roadmap to Carbon Neutrality in China Chapter 2: The energy transition
PAGE | 75 IEA,
202
1.
(almost CNY 2 trillion) in 2016-2020 to around USD 560 billion (CNY 3.9 trillion) in 2060. Investment in hydrogen, including production facilities, refuelling stations and end-use equipment, rises modestly to around USD 7 billion (CNY 46 billion) in 2030 as production facilities are scaled up, and more rapidly thereafter as use of the fuel in transport expands, reaching more than USD 70 billion (about CNY 495 billion) in 2060. Investment in CCUS reaches more than USD 25 billion (CNY 180 billion), while that in energy efficiency reaches more than USD 90 billion (around CNY 630 billion) in 2060, mostly for deep building retrofits and efficient appliances in the industry and buildings sectors.
Financing the large increase in investment needed to reach carbon neutrality will undoubtedly require greater reliance on private sources. This will hinge on public policies to create incentives for private investors to direct capital to clean energy technologies, such as reforming energy taxes and establishing appropriate regulatory frameworks. Direct government financing will need to focus on developing new infrastructures and accelerating innovation of technologies that are at the demonstration or prototype stage today (see Chapter 6), as well as soft loans, to ensure a predictable flow of bankable projects that can be financed privately. Increased capital investment will be partly compensated by lower operating expenditures, which account for a large share of the total cost of upstream fuel supply projects and fossil fuel generation projects.
Reaching carbon neutrality by 2060 in China requires investing heavily in the development and large-scale deployment of technologies that are not commercially available today, such as carbon capture in cement, hydrogen-based steel production, ammonia-fuelled ships and DAC (see Chapters 3 and 6). They account for nearly 25% of overall investment during the 2030s in the APS, rising to around 40% in the 2050s. The increase in investments in technologies under development today associated with heavy industries and long-distance transport is particularly large, accounting for nearly 75% of the overall annual investment in those technologies in the 2050s.

An Energy Sector Roadmap to Carbon Neutrality in China Chapter 2: The energy transition
PAGE | 76 IEA,
202
1.
Average annual energy investment in emerging technologies by technology maturity in China in the APS
IEA, 2021.
Notes: On the market includes mature and early adoption technologies. The three broad technology maturity categories refer to the status of technology types today.
Investment in technologies at the demonstration or prototype stage today, especially in hard-to-abate industrial and transport sectors, grows fastest to 2060
0 20 40 60 80
2051-2060
2041-2050
2031-2040
Billion USD (2019)
On the market Demonstration Large prototype
0 200 400 600 800
2051-2060
2041-2050
2031-2040
Billion USD (2019)
0 40 80 120 160
2051-2060
2041-2050
2031-2040
Billion USD (2019)
Long-distance transport
Heavy industry
Total

An Energy Sector Roadmap to Carbon Neutrality in China Chapter 2: The energy transition
PAGE | 77 IEA,
202
1.
References Cheng, J. et al. (2021), Pathways of China's PM2.5 air quality 2015-2060 in the context of
carbon neutrality, National Science Review, https://doi.org/10.1093/nsr/nwab078.
Energy Foundation China (2020), China’s New Growth Pathway: From the 14th Five-Year Plan to Carbon Neutrality, www.efchina.org/Attachments/Report/report-lceg-20201210.
IPCC (Intergovernmental Panel on Climate Change) (2021), Climate Change 2021: The Physical Science Basis – Contribution of Working Group I to the Sixth Assessment Report of the Intergovernmental Panel on Climate Change [Masson-Delmotte, V. et al. (eds.)], in press, Cambridge University Press, www.ipcc.ch/report/ar6/wg1/downloads/report/IPCC_AR6_WGI_Full_Report.pdf.
Khanna, N., N. Zhou and L. Price, (2021), Pathways Toward Carbon Neutrality: A Review of Recent Studies on Mid-Century Emissions Transition Scenarios for China. Berkeley, CA: California-China Climate Institute. https://ccci.berkeley.edu/sites/default/files/GTZChina-July52021-FINAL.pdf.
Yue, H. et al. (2020), Stronger policy required to substantially reduce deaths from PM2.5
pollution in China. Nature Communications 11, 1462, 2020; https://doi.org/10.1038/s41467-020-15319-4.

An Energy Sector Roadmap to Carbon Neutrality in China Chapter 3: Sectoral pathways
PAGE | 78 IEA,
202
1.
Chapter 3: Sectoral pathways
Highlights
The People’s Republic of China’s (hereafter, “China”) power sector achieves net zero CO2 emissions before 2055 in the Announced Pledges Scenario (APS). Electricity generation increases by 130% by 2060; its share of total final energy demand more than doubles, reaching over 50%. Renewables-based generation, mainly wind and solar photovoltaics (PV), increases nearly sevenfold between 2020 and 2060, when it accounts for almost 80% of generation. By contrast, the share of coal drops from more than 60% to just 6%. Some unabated coal-based capacity remains for system security but it provides less than 0.1% of electricity generation in 2060.
Electrolytic hydrogen production rises from a few kilotonnes today to more than 70 Mt by 2060, requiring 750 GW of electrolysers, or nearly 40% of global capacity. Hydrogen is predominantly used directly in heavy industry (around 40%) and fuel-cell vehicles (around 25%), as well as for feedstock for making ammonia for shipping and synthetic kerosene for aviation. China remains a world leader in biogas and biomethane production, accounting for around 35% of global production in 2060.
Industrial CO2 emissions decline by almost 95% by 2060 in the APS, with the residual emissions being offset by negative emissions in the power and fuel transformation sectors. Energy efficiency improvements and electrification drive most of the reductions in the short term, while emerging innovative near-zero emissions technologies, particularly hydrogen and carbon capture, utilisation and storage (CCUS) in cement, steel and chemicals, play the leading role in the longer term.
In road transport, around 60% of cumulative emissions reductions come from electrification and 4% from low-carbon hydrogen. Continuing investments in metro, light rail and electric buses in China’s cities and high-speed rail between cities, which displaces air travel, lower the energy intensity of passenger trips. Reduced emissions from road freight, shipping and aviation are driven by gains in vehicle, ship and aircraft fuel efficiency, as well as switching to low-carbon fuels, requiring huge investments in refuelling and recharging infrastructure.
Direct CO2 emissions in the buildings sector are reduced by more than 95% by 2060 through electrification, clean district heat and energy efficiency. On-site generation, mainly with rooftop solar PV panels, grows rapidly. By 2060 nearly 100% of China’s total floor area is zero-carbon ready.

An Energy Sector Roadmap to Carbon Neutrality in China Chapter 3: Sectoral pathways
PAGE | 79 IEA,
202
1.
Power and heat generation The rapid decarbonisation of power supply alongside the electrification of a wide range of energy end uses across all sectors must form an important pillar of China’s strategy for achieving carbon neutrality (see Chapter 4). This requires a massive expansion of renewable electricity generating capacity, as well as of flexible low-carbon resources to maintain electricity system security.
Decarbonisation of electricity supply The power generation sector in China emitted around 5.4 Gt of CO2, or around 47% of the country’s total energy sector emissions, in 2020. Power sector emissions increased by around 2% in 2020, despite the Covid-19 pandemic, and preliminary data point to a continued increase in 2021. In the APS, they reach a peak of 5.6 Gt by around 2025 and then fall to zero before 2055 and are marginally negative in 2060, helping to offset residual hard-to-abate emissions, particularly in the heavy industry and long-distance transport sub-sectors. The rate of decline in the carbon intensity of electricity – CO2 emissions per kilowatt hour generated – averages 3% per year in the 2020s, compared with 1% over the last decade. With CO2 emissions being cut on average by 260 Mt per year over the period 2030-2050, power generation is the first sector to reach net zero emissions in this scenario, as emissions-reduction technologies are generally more advanced today. It is also the leading contributor to the decarbonisation of the Chinese economy, accounting for more than 55% of cumulative emissions reductions over 2020-2060.
CO2 emissions reductions in power generation in China by driver in the APS
IEA, 2021.
Note: CCUS = carbon capture, utilisation and storage, utilisation and storage.
The power sector reaches net zero emissions before 2055 despite generation growing 130%, mainly due to switching to renewables and the phase-out of unabated coal

An Energy Sector Roadmap to Carbon Neutrality in China Chapter 3: Sectoral pathways
PAGE | 80 IEA,
202
1.
Concurrent with rapid decarbonisation, electricity generation increases by 130% during the period 2020-2060, driven by economic growth, increased electrification of energy end uses and, after 2030, increased use of electricity for making hydrogen in the APS. The share of electricity in China’s total final energy consumption reaches over 50% in 2060, compared with only 25% today. By 2060, around a quarter of the overall increase in electricity generation is consumed in industry, one-fifth from transport, driven by electric vehicles (EVs), and just under 15% is consumed in buildings. The production of electrolytic hydrogen accounts for the largest single contributor to growth, and represents almost 20% of electricity demand in 2060 or 3 300 TWh – demanding twice the electricity generated in India today.
Electricity demand by sector and generation by fuel in China in the APS
IEA, 2021.
Note: CCUS = carbon capture, utilisation and storage.
Electricity demand grows briskly, driven by industry, EVs and later by hydrogen production, with renewables displacing fossil fuels in generation
Renewable energy sources – mainly solar PV and wind power – grow rapidly to meet most of the increase in demand and displace much existing fossil-based generation. Their output increases nearly sevenfold by 2060 and their share of total generation rising from around 25% in 2020 to 40% in 2030 and 80% in 2060. The share of solar PV alone in the generation mix reaches almost 45% in 2060, up from just 4% in 2020.
The huge additions of renewables capacity are driven by their cost advantage over other technologies, in most cases, and policy support, including power market and carbon price signals. Solar PV and onshore wind are already able to
0
3 000
6 000
9 000
12 000
15 000
18 000
2020 2030 2040 2050 2060
TWh
Industry Buildings Transport
Hydrogen Other
Electricity demand
0%
20%
40%
60%
80%
100%
2020 2030 2060
Fuel
sha
re (%
)
Renewables Nuclear
Fossil fuels with CCUS Unabated fossil fuels
Fuel mix

An Energy Sector Roadmap to Carbon Neutrality in China Chapter 3: Sectoral pathways
PAGE | 81 IEA,
202
1.
compete with new coal-fired plants today in many regions. The recent switch to renewable auctions in China is expected to further drive down prices and improve siting, design and operation.1 This results in solar and onshore wind undercutting the cost of electricity generated by many existing coal plants between 2025 and 2030, accelerating the phase-out of the least efficient ones in the 2030s. Offshore wind costs continue to fall, making the technology competitive with unabated fossil fuel generators for bulk generation in the 2030s. Between 2030 and 2060, 220 GW of solar PV capacity and 57 GW of wind capacity are added on average each year. Most of this capacity is built in the north and northwest, where there is plenty of land and the best resources. However, regional interests to produce electricity, create jobs and boost GDP locally, as well as make use of provincial government land, mean capacity is added across all regions. In regions where less land is available, such as the east and south, more capacity is built offshore.
Output of nuclear energy and hydropower – the two other main low-carbon generating technologies – also increases substantially in the APS. The share of nuclear in the generation mix jumps from 5% in 2020 to 10% in 2060 – equal to adding four 1 GW reactors every year on average. Construction is focused on coastal regions. China’s fleet of nuclear reactors becomes the largest in the world after 2030. The generation from hydropower in the generation grows by 45% over 2020-2060. Capacity is concentrated in China’s central region and in Yunnan province in the southern region. Policy support for CCUS drives pilot projects, which in turn precipitates substantial cost declines, making it competitive in the 2030s. Rising carbon prices under China’s emissions trading system (ETS) contribute to making low-carbon technologies more competitive, but do not have a huge impact on fossil fuel phase-out until after 2040, when remaining unabated generators are more rapidly removed from the system.
In parallel to the rapid expansion of low-carbon technologies, the share of coal in the generating fuel mix drops sharply, from over 60% today to 45% in 2030 and 5% in 2060, almost all of which is generated in plants equipped with carbon capture facilities. Many coal plants remain online in the first half of the projection horizon, but operate at much lower capacity factors (16% on average in 2040 compared with about 55% today), providing flexibility services rather than operating as baseload plants. By 2045, unabated coal-fired generation approaches zero, with the remaining unabated plants acting as standby units and used only when variable renewables are not available. By 2060, China’s
1 Details of generation costs assumptions can be found in the technical annex that will accompany the final version of this publication.

An Energy Sector Roadmap to Carbon Neutrality in China Chapter 3: Sectoral pathways
PAGE | 82 IEA,
202
1.
existing coal capacity is roughly 65% lower, dropping from nearly 1 030 GW today to less than 360 GW (190 GW of which is retrofitted with CCUS and 170 GW acting as standby capacity). The vast majority of the retired plants will have operated for at least 35 years at the time of their retirement, i.e. exceeding their design lifetime.
Power generation capacity by type nationally and by region in China in the APS
IEA, 2021.
Note: CCUS = carbon capture, utilisation and storage; PV = photovoltaics.
Renewable capacity expands rapidly in all regions as fossil fuel plants are phased out or retrofitted with CCUS, considering heat demand and electrical reliability
Managing the phase-out of coal and other fossil fuel-fired power plants will have to take account of many diverse factors, including operation costs, whether they provide heat for industry or buildings, the potential for switching to cleaner burning fuels or co-firing, their role in ensuring electricity system security, and the proximity of plants to potential CO2 storage sites or potential users of the gas (which affects the economics of retrofitting them with carbon capture equipment). The implications for local communities is another important consideration (see Chapter 6).
We have assessed the optimal scheduling of plant closures and retrofits based on cost considerations and the technical feasibility of meeting heating demand and balancing electricity loads in each of the main regions in China. Thermal plants in 2060 are concentrated largely where industrial and buildings heat
demand is highest, namely China’s northern (华北), eastern (东华), and central
0
2 000
4 000
6 000
8 000
10 000
2020 2035 2060
GW
0
500
1000
1500
2000
2500G
WEnergy storage
Clean fuels, bioenergy,and other renewables
Wind
Solar PV
Hydro
Nuclear
Thermal with CCUS
Unabated thermal
Regional capacity in 2060National capacity

An Energy Sector Roadmap to Carbon Neutrality in China Chapter 3: Sectoral pathways
PAGE | 83 IEA,
202
1.
(中华) regions. These regions account for 60% of remaining thermal capacity in
2060. Many combined heat and power (CHP) plants remain online in 2060, for both district heating and industry, but they are all abated, either by burning cleaner fuels or being retrofitted with carbon capture. While district heating dominates fossil fuel CHP output today, more efficient buildings and clean heating options, including district-level heat pumps, result in most abated fossil fuel CHP capacity serving industry in 2060. CCUS is prioritised for plants near industrial facilities that demand high temperature heat, have high-levels of process emissions, or can make economic use of the CO2 and co-generated heat in neighbouring industries. By 2060, 1300 Mt CO2 (30% of total CO2 stored across all sectors) are being captured and stored in the power sector annually, of which almost 65% comes from coal-fired co-generation plants. Most of this is stored underground, mainly in the coastal regions and the northwest.
Fossil fuel capacity and generation by region in the APS
IEA, 2021.
Note: CCUS = carbon capture, utilisation and storage. Source: Capacity factors for 2020 based on (CEC, 2020), (CEC, 2021), and (IN-EN, 2021a).
Fossil fuel plants are replaced or retrofitted with CCUS or switch to clean fuels. Some unabated coal remains for system security, but provides <0.5% of generation in 2060
0
100
200
300
400
2020 2060 2020 2060 2020 2060 2020 2060 2020 2060 2020 2060Central (华中)
Eastern(华东)
Northern(华北)
Northeast(东北)
Northwest(西北)
Southern(南方)
GW
H₂ switching Thermal with CCUS Unabated thermal (only for critical shortages) Unabated thermal
Inst
alle
d ca
paci
ty
0%
20%
40%
60%
80%
100%
Cap
acity
fact
or

An Energy Sector Roadmap to Carbon Neutrality in China Chapter 3: Sectoral pathways
PAGE | 84 IEA,
202
1.
Electricity market reforms, already underway, play a key role in guiding the growth of renewables and phase-out of fossil fuel plants, as well as laying the foundations for more efficient operation of the power system in the APS. Implementing least-marginal cost dispatch in all regions reduces curtailment, optimises coal plant operation and improves the flexibility of existing assets, reducing power sector CO2 emissions by 31% and operating costs by 14% by 2035 compared with what would happen were current dispatch protocols to remain in place. The development of interprovincial markets raises this to 45% emissions reductions and 26% operating cost reduction, facilitating the sharing of reserve generating capacity and reducing the need for new flexible capacity. Without a change in market protocol, revenues for all generators would deteriorate, and pricing signals would run counter to China’s 2060 ambitions. Market reforms become, accordingly, essential to being able to cost effectively achieve this vision.
Electricity system flexibility Massively increasing the share of variable renewables in the generating mix will call for new ways of ensuring flexibility of the power system by making current generating assets more flexible, making transmission and distribution systems more robust, adding storage capacity, and exploiting the potential flexibility of demand. In traditional power systems in which generation is dominated by fossil fuels, output can be ramped up and down in line with hourly, diurnal, weekly and seasonal fluctuations in load. Solar and wind are inherently inflexible on the upside as their availability at any given time depends on weather conditions. Flexibility resources need to be more diverse in a zero-emissions power system, because fossil fuel plants tacitly provide a range of flexibility services today. Replacing them cost-effectively requires different sources of flexibility, each with a distinct profile able to meet the mix of services required.

An Energy Sector Roadmap to Carbon Neutrality in China Chapter 3: Sectoral pathways
PAGE | 85 IEA,
202
1.
Box 3.1 Electricity system flexibility requirements
All electricity systems, regardless of the generating fuel mix, require different forms of flexibility to ensure uninterrupted supply. Fossil fuel generators provide many of these services today without explicit compensation. The main services are as follows:
Peak capacity (adequacy), i.e. to ensure enough capacity is available to meet the highest expected demand of the year. Adequacy becomes a greater concern as demand rises, the sources of demand change (resulting in different load profiles) and the share of variable renewables increases, affecting the availability of capacity across the day, month and year. For example, demand is highest for heating in the winter and cooling in the summer, while the capacity of wind is often more available in winter, solar in summer and hydro in spring. In the APS, peak capacity is provided by a range of resources, each with different availability and dispatchability profiles, but batteries, pumped hydro storage, and demand response rise to prominence due to their flexibility, making up 40% of all peak capacity reserves by 2060.
Ramping flexibility, i.e. the ability to change output quickly and at short notice (within the hours to minutes) to keep supply and demand in balance. The demand for ramping flexibility proliferates by 2060, as variable renewables increase. By 2060, there is 15-times more capacity available to provide ramping flexibility than 2020. Demand response represents over 50% of this capacity, and is typically used for small, momentary ramping needs, while dispatchable plants and storage, particularly, hydro, meet most of the more sustained ramping requirements.
Stability, i.e. the ability to quickly reduce demand or increase supply when there is a large deviation in system frequency caused by a sudden loss of output or surge in demand. Here storage excels, particularly batteries, given their ability to quickly respond with output over a short-period of time. By 2060, storage provide 40% of stability and dispatchable renewables and hydrogen providing another 50%. In general, abated fossil generators play a lesser role for stability, as CCUS typically hinders units from quickly responding.
Inertia, i.e. the system’s ability to ride-through momentary disturbances in supply or demand without causing cascading failures on the network. Rotational inertia—the energy stored in large spinning motors—is currently the primary provider of this service on today’s grids. Nuclear power, bioenergy, hydropower and fossil fuel plants (with and without CCUS) with high-momentum turbines provide the bulk of stability services by 2060. Other non-spinning sources of inertia, such as grid-forming inverter technology, are being explored to cover for a loss of rotational inertia in the system.

An Energy Sector Roadmap to Carbon Neutrality in China Chapter 3: Sectoral pathways
PAGE | 86 IEA,
202
1.
Flexibility capacity by type in China in the APS
IEA, 2021.
Note: CCUS = carbon capture, utilisation and storage.
Well-designed wholesale and retail markets are crucial to ensuring that flexibility is provided in the most economically efficient manner, including exploiting existing assets. Pricing arrangements need to be established for certain end uses, such as direct access for hydrogen producers to wholesale markets and time-of-use tariffs for household charging of EVs. The adequacy of market revenues to attract new investment rather than just optimise operation is a topic of debate around the world, including in China. Explicit procurement mechanisms or auctions may be needed to stimulate sufficient and timely investment in flexibility.
The sources of flexibility in China’s power system change radically over 2021-2060 in the APS. Today, virtually all flexibility to meet peak load is met by fossil fuel and hydropower plants, including pumped hydro storage. By 2060, storage provides 35% of flexible capacity, dispatchable renewable energy sources such as hydropower provide 24% and demand response – measures to encourage or oblige electricity consumers to make short-term reductions in their consumption in real time during peak periods in response to a price signal, including hydrogen producers – 5%.
0% 20% 40% 60% 80% 100%
Nuclear Hydro Clean fuels and bioenergy StorageUnabated thermal Thermal with CCUS Variable renewables Demand response
0% 20% 40% 60% 80% 100%
2020 2060
Stability
Rampingflexibility
Energy
Peak capacity / adequacy
Inertia

An Energy Sector Roadmap to Carbon Neutrality in China Chapter 3: Sectoral pathways
PAGE | 87 IEA,
202
1.
Flexible capacity to ensure system adequacy in China in the APS
IEA, 2021.
Notes: Capacity available to meet peak load assumes coincident availability during the top 100 demand hours and top 100 net-demand hours. Clean fuels, bioenergy, and other renewables includes hydrogen-fired generators, bioenergy, synthetic fuels, concentrated solar power, and geothermal.
By 2060, total available flexible capacity grows substantially, and is dominated by low-carbon flexibility sources. These are spread across all regions to ensure adequacy. As fossil fuel generating capacity is retired, a host of new low-carbon flexibility sources emerge, led by demand response and batteries
The sources of flexibility in meeting peak load change over time. Prior to 2030, flexibility requirements are met largely by existing power plants in the APS. Demand for hourly ramping grows during this time, while seasonal adequacy and system stability become a concern only in isolated parts of the electricity system. Power market reforms under way in China, namely sub hourly markets and ancillary service markets, exploit additional inter hour ramping capabilities from existing thermal plants. This minimises the need for building dedicated flexibility resources and lays the foundations for using new sources of flexibility, such as battery storage and demand response, cost-effectively. Additional reforms allow distributed energy resources, including batteries, EVs and demand response, to participate in electricity markets, either directly in wholesale markets through aggregators or via dynamic, time-of-use retail rates.
0
200
400
600
800
GW
Demand Response
Energy storage
Clean fuels, bioenergy,and other renewablesVariable renewables
Hydro
Nuclear
Thermal with CCUS
Unabated thermal
Peak Demand
Regional availability during peak in 2060
1 000
2 000
3 000
2020 2060
GW
National availability at peak

An Energy Sector Roadmap to Carbon Neutrality in China Chapter 3: Sectoral pathways
PAGE | 88 IEA,
202
1.
Flexible capacity to ensure system adequacy by type and share of variable renewables in generation in China in the APS
IEA, 2021.
Note: CCUS = carbon capture, utilisation and storage.
Low-carbon flexibility capacity expands rapidly after 2030, displacing and augmenting unabated fossil fuels and facilitating an acceleration in variable solar and wind generation
After 2030, demand for non-fossil sources of flexibility in China increases rapidly, as the share of renewables accelerates and the availability of dispatchable fossil plants diminishes. Batteries and demand response are predominantly used to provide short-term flexibility, while fossil plants with CCUS and hydrogen are used more for seasonal balancing. Battery and pumped hydro capacity can provide 960 GW of peak adequacy by 2060. Fossil fuels with CCUS grow moderately as demand for seasonal firming increases, reaching nearly 275 GW by 2060.
Demand response, which is limited today in China, expands rapidly as new, potentially more flexible electricity uses such as EVs, air conditioners and hydrogen electrolysers grow. Demand response (DR) becomes the largest single source of flexible ramping capacity, with responsive load able to deliver nearly 300 GW of flexibility over short-time frames. During peak hours, around 130 GW of this demand response is available for critical peak regulation. We assume responsive DR is limited to 100 hours per year reflecting the current customer acceptability, but with improved data analytics and smart controls, demand response could, in principle, be deployed daily. For example, smart EVs could manage the timing of recharging based on consumer patterns of vehicle use and in response to real-time price signals. This could ensure that EV owners charge when they need to, coinciding with the availability of renewables and periods of
200
400
600
800
1 000
0% 20% 40% 60% 80%
GW
Share of variable renewables in total electricity generation
Batteries
Demand response,incl. electrolysersFossil fuels withCCUS
2060
2040
2020

An Energy Sector Roadmap to Carbon Neutrality in China Chapter 3: Sectoral pathways
PAGE | 89 IEA,
202
1.
low demand. Net zero-ready building codes could also expand opportunities for demand response and jump-start China’s demand response market (see Chapter 7).
Implications for the electricity grid The expansion and decarbonisation of electricity generating capacity needed to achieve net zero emissions in China involves continuing the rapid expansion of electricity networks. The biggest increase in power flows in the APS over 2021-2060 is from the northwest and the south to the rest of China, with the central regional grid becoming a growing nexus for power exchange. Diurnal flows begin to develop due to solar, in particular from the northern and northwestern regional grids, which often export during the day, and sometimes import at night, especially in colder months. Reinforcing interconnections between regional grids and enhancing scheduling and reserve sharing between regions helps improve system reliability and reduce costs.
The rise in distribution system investment from 60% to 70% of total grid investment in the APS (see Chapter 2) is driven by a need to modernise existing, often outdated, systems and to expand capacity to meet the large increase in electricity demand in dense urban areas. Of the cumulative investment in distribution over the projection horizon, three-quarters is for refurbishing existing grids, including upgrades to meet new demand from recharging EVs, air conditioning, electric heating in homes and switching to electricity in heavy industry (e.g. electric arc furnaces). Distributed energy and storage, including “islandable” microgrids,2 grow in importance, helping to enhance the resiliency of the electricity system – an increasingly important concern as electricity reaches over half of all final energy consumption by the 2050s. Pilot direct-current grids within net zero-ready buildings and districts may require additional investment to exploit opportunities for demand response (see buildings section).
Digital technologies, including smart grids, play an increasing role in the APS, their share of investment rising from around 15% today. These technologies are vital to managing a more dynamic electricity system, maintaining stability, improving cybersecurity and integrating more demand response.
The increased investment in power networks and changes in the way they operate envisioned in the APS hinge on market and pricing reforms and changes in grid
2 An islandable microgrid or distributed generator is able to disconnect from an external electricity network in the event of a power disruption, while operating safely and reliably, and to reconnect in a synchronised way once power operations are restored on the external electricity network.

An Energy Sector Roadmap to Carbon Neutrality in China Chapter 3: Sectoral pathways
PAGE | 90 IEA,
202
1.
codes. Reform of the rules governing interprovincial markets, which have inhibited the full utilisation of interprovincial transmission lines, are of particular importance in providing incentives for provinces with a net imbalance in generation to rely on cheaper power generated from renewables in other provinces. Current operation of the grid, which schedules generators and balances by province instead of over wider regions, results in overbuilding of network assets in certain regions and suboptimal utilisation of generating resources. Enhanced cost recovery regulations could help to minimise costs while providing enough incentives for grid companies to invest. New regulatory models linking investment returns to performance and incentivising innovation could encourage them to steer investment to low-carbon technologies and test new local, distributed ownership models to stimulate competition.
Low-emissions fuel supply Reaching carbon neutrality will require low-emissions fuels where energy needs cannot easily or economically be met by electricity. This is likely to be the case for some modes of long-distance transport, including trucks, aviation and maritime shipping, and for high-temperature heat and feedstock supply in heavy industry. Low-emissions fuels include liquid biofuels, biogas, biomethane and bioLPG,3 hydrogen, and hydrogen-based fuels (ammonia and synthetic hydrocarbon fuels produced using CO2 from biogenic origin or captured from the atmosphere) that do not emit CO2 from fossil fuels directly when used and emit very little when being produced. For example, hydrogen produced from natural gas is considered a low-emissions fuel only if it is in conjunction with CCUS with high capture rates (over 90%) and permanent carbon sequestration. Some low-emissions fuels are effectively drop-in, i.e. they are compatible with the existing fossil fuel distribution infrastructure and end-use technologies, and require few if any modifications to equipment or vehicles.
Low-emissions fuels, mostly in the form of biofuels, today account for less than 1% of final energy demand in China. The share increases to over 1% in 2030 and 9% in 2060 in the APS. Liquid biofuels meet 2% of transport energy demand in 2030 and 9% in 2060, up from 1% in 2020; hydrogen-based fuels meet around one-quarter of transport energy needs by 2060. Low-carbon gases (biomethane
3 Biogas is a mixture of methane, CO2 and small quantities of other gases produced by anaerobic digestion of organic matter in an oxygen-free environment. The precise composition of biogas depends on the type of feedstock and the production pathway. Biomethane, also known as “renewable natural gas”, is a near-pure source of methane produced either by upgrading biogas (a process that removes any CO2 and other contaminants present in the biogas) or through the gasification of solid biomass followed by methanation. BioLPG, or biopropane, is liquid petroleum gases (LPGs) produced from renewable non-petroleum feedstock.

An Energy Sector Roadmap to Carbon Neutrality in China Chapter 3: Sectoral pathways
PAGE | 91 IEA,
202
1.
and hydrogen) meet almost over 15% of demand for gas supplied through networks in 2060, up from almost zero today. China becomes a global leader in the production of low-carbon gases, accounting for more than 30% of hydrogen and 30% of biomethane by 2060. The combined share of low-carbon hydrogen and hydrogen-based fuels in total final energy use in China reaches almost 10% in 2060.4 The industry sector is a major driver of hydrogen demand, absorbing 40% of total hydrogen production in 2060.
Supply of low-emissions fuel by sector and fuel in China in the APS
IEA, 2021.
Notes: TFC = total final consumption. Hydrogen-based fuels refer to the fuel use of hydrogen, synthetic hydrocarbon fuels (synfuels) produced from hydrogen and CO2, and ammonia, and includes also onsite hydrogen production in the industry sector.
The share of low-emissions fuels in final energy demand jumps from less than 1% in 2020 to more than 1% in 2030 and almost 10% in 2060, led by industry and transport
Biofuels In 2020, around 7% of the China’s primary supply of modern bioenergy (biomass excluding traditional uses for cooking) was in the form of liquid biofuels used mostly for road transport, and a further 24% was consumed as gaseous biofuels (mostly biogas), the vast majority used for cooking in the residential sector. The rest was biomass burned directly for heating or used to generate electricity. There is considerable potential to expand the production and use of gaseous and liquid biofuels, though feedstock collection and transportation systems will need to be
4 This includes onsite hydrogen production and use in the industry sector, which consumes 8% of energy demand in industry. Excluding onsite hydrogen production in industry, hydrogen and hydrogen-based fuels meet 5% of China’s energy demand in the APS by 2060.
5% 10% 15% 20%
2020
2030
2060
2020
2030
2060
2020
2030
2060
ShippingAviationRoad transport
BiomethaneHydrogen
BuildingsIndustryTransport - hydrogenTransport - ammoniaTransport - synfuels
Liquid biofuels in transport
Low-carbon gases in gas grid
Hydrogen-based fuels in TFC

An Energy Sector Roadmap to Carbon Neutrality in China Chapter 3: Sectoral pathways
PAGE | 92 IEA,
202
1.
developed to ensure reliable and adequate supplies to support large-scale production using advanced technologies based on a greater variety of biomass inputs, particularly those that do not compete directly for land with food crops.
China is the world leader in biogas production, accounting for almost half of global output in 2020, produced mostly from anaerobic digestion of feedstocks such as livestock manure, crop residues and biogenic municipal solid waste (MSW). In 2018, 70% of all the household biodigesters in the world were in China, the result of government policies to phase out the traditional, inefficient and polluting use of bioenergy for residential clean cooking (IEA, 2020a). Small amounts of biogas are also used in co-generation plants to supply district heating and electricity networks. By contrast, biomethane supply remains tiny. In 2019, China’s National Development and Reform Commission set a target of 30 bcm (just over 1 EJ) for biomethane production by 2030, mainly to replace coal in rural communities, but output today has reached only 1% of that level due to technical difficulties in upgrading biogas to biomethane and blending it into natural gas for distribution through the national gas grid.
China remains a global leader in biogas and biomethane in the APS, with supplies almost doubling to 2030 and more than tripling to 2060. Biogas starts to be used to generate power on a significant scale, using internal combustion engines (a modular technology with relatively high part-load efficiencies) to enhance power system flexibility. Injection of biomethane into gas networks expands from virtually zero in 2020 to almost 3% of total gas supply in 2030 and 15% in 2060. This reduces the emissions intensity of network-based gas by an equivalent amount. Biomethane produced via upgrading biogas created from anaerobically digested manure and biogenic MSW also avoids methane emissions that would otherwise be released. However, as with natural gas, fugitive emissions from biomethane must be minimised along the entire supply chain to ensure the greatest climate benefit.

An Energy Sector Roadmap to Carbon Neutrality in China Chapter 3: Sectoral pathways
PAGE | 93 IEA,
202
1.
Biofuels production by type and technology in China in the APS
IEA, 2021.
Notes: Conventional ethanol refers to production using food energy crops. Advanced ethanol refers to production using wastes and residues and non-food energy crops grown on marginal and non-arable land. Conventional biodiesel includes the fatty acid and methyl esters (FAME) route using food energy crops. Advanced biodiesel includes biomass-based Fischer-Tropsch and hydroprocessed esters and fatty acids (HEFA) routes using wastes, residues and non-food energy crops grown on marginal and non-arable land. Biomethane includes biogas upgrading and biomass gasification-based routes. CCUS = carbon capture, utilisation and storage.
China remains a global leader in biogases as it ramps up its biomethane production, and becomes a major producer of bio-kerosene
China utilises its sizeable supplies of collectable livestock manure, biogenic MSW, crop residues and modest supplies of municipal sewage sludge to provide feedstock for its biogas output through 2060 in the APS. Though the manure and crop residues mostly originate from a handful of provinces such as Sichuan, Henan, Shandong and Heilongjiang, the biomass feedstocks are widely dispersed within these provinces, so their use for making biogas and biomethane will involve building new connections to the gas grid (see Chapter 4).
Liquid biofuels production in China increased by a quarter between 2015 and 2019, yet still accounts for only 3% of global production, despite China being the third-largest producer of bioethanol after the United States and Brazil (IEA, 2020a). China uses corn feedstock to make bioethanol. Output of biodiesel from FAME is small, making up only 0.2% of diesel use in China. Renewable diesel from HEFA, while making up an even smaller share of the diesel pool than biodiesel, accounts for 3% of global production. Both FAME biodiesel and HEFA renewable diesel are produced from used cooking oils (UCOs).
0%
10%
20%
30%
40%
50%
0
1 000
2 000
3 000
4 000
5 000
2020 2030 2040 2050 2060
PJ
Gaseous biofuels
BiogasBiomethaneBiomethane with CCUSShare of global gaseous biofuel production
0%
6%
12%
18%
0
1 000
2 000
3 000
2020 2030 2040 2050 2060
PJ
Liquid biofuels
Advanced biodiesel and bio-kerosene with CCUSAdvanced biodiesel and bio-keroseneConventional biodieselAdvanced ethanol with CCUSAdvanced ethanolConventional ethanolShare of global liquid biofuel production

An Energy Sector Roadmap to Carbon Neutrality in China Chapter 3: Sectoral pathways
PAGE | 94 IEA,
202
1.
Liquid biofuels use fell well below the targets set in the 13th Five-Year Plan (FYP) for 2016-2020 for several reasons. Rapidly declining corn stockpiles, increasing corn prices and a lack of ethanol production capacity held back bioethanol output, prompting the government to relax its national E10 blending mandate (requiring a 10% gasoline blend) in favour of provincial and city mandates (see Chapter 4). Unlike bioethanol, biodiesel, mostly produced from UCOs from restaurants, does not benefit from policy support (only Shanghai has a B5 blending mandate) and remains too expensive to compete with conventional diesel. Significant volumes of FAME biodiesel and HEFA and UCO are exported to Europe, where demand is strong (IEA, 2021a) (NEA, 2020).
Like gaseous biofuels, the production of liquid biofuels expands rapidly in the APS, driven mainly by advanced technologies after 2030. Technology routes such as biomass gasification using the Fischer-Tropsch process (bio-FT) and cellulosic ethanol (produced using cellulosic feedstocks such as crop and wood residues) are used to produce drop-in substitutes for diesel, jet kerosene, gasoline and LPG. Total liquid biofuels output rises from 54 kb/d in 2020 (112 PJ) to 240 kb/d in 2030 (500 PJ) and 1 230 kb/d in 2060 (2 600 PJ), the share of advanced fuels jumping from less than 6% in 2020 to almost 100% in 2060. They continue to be used almost exclusively in road transport initially but a growing share goes to shipping as the rise of EVs and fuel-cell electric vehicles (FCEVs) reduces demand for liquid fuels for cars. After 2040, as low-carbon ammonia production ramps up to fuel ships, liquid biofuels are produced increasingly for the aviation sector. China becomes the second-largest producer of bio-kerosene, which meets 40% of domestic aviation fuel needs in 2060, after the United States. HEFA bio-kerosene provides near-term opportunities to scale up production to 2030, while emerging technology routes such as bio-FT and alcohol-to-jet (ATJ) produced from cellulosic ethanol take off after 2040.
Biofuel production using cellulosic feedstocks is under demonstration today, with China home to several plants, with a combined capacity of 120 million litres of cellulosic ethanol in 2020. China is also trialling the use of advanced energy crops such as cassava and sweet sorghum. These crops can be grown on marginal lands and can provide a diversified product portfolio. For instance, the stalk of sweet sorghum can provide sugar for ethanol fermentation, while the grain can provide flour for human consumption. Bagasse residues can be used as animal feed.
The production of biofuels can be combined with CCUS at a relatively low cost in some biofuel production routes, such as cellulosic ethanol, ATJ, bio-FT and biogas upgrading. This is because the processes involved release very pure streams of CO2. In the APS, the use of biofuels produced with CCUS results in the removal of 130 Mt CO2 in 2060, offsetting residual emissions in transport and industry.
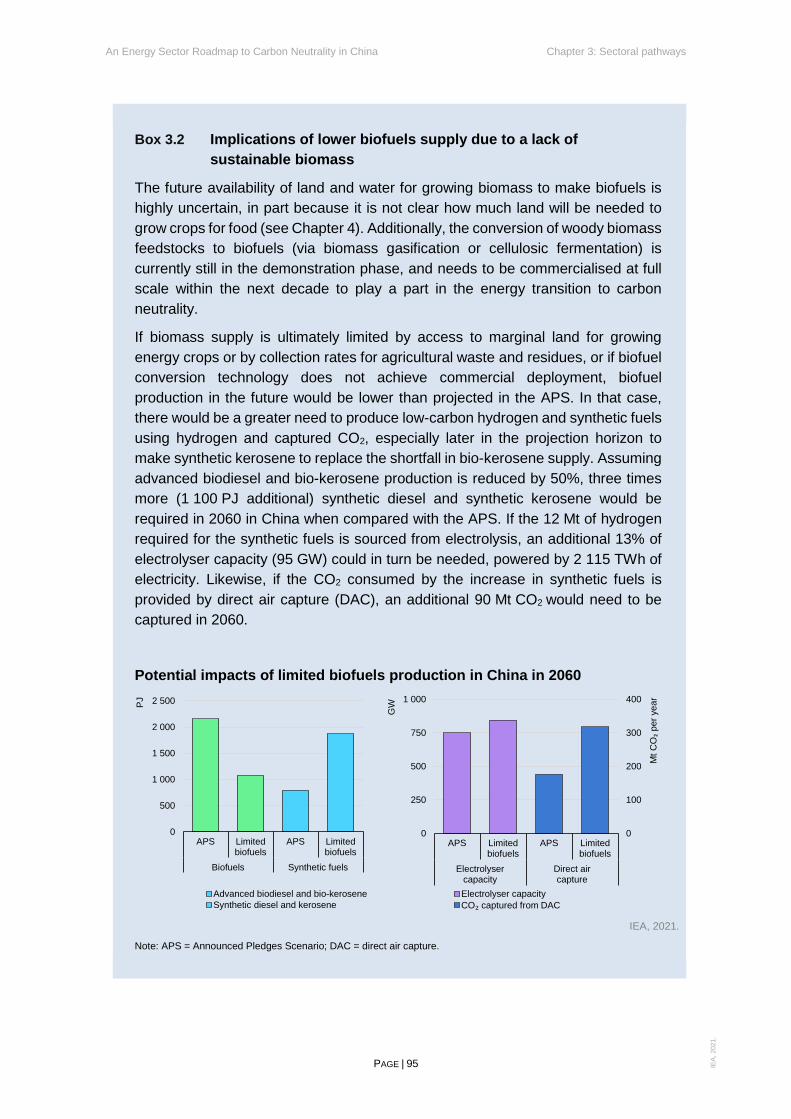
An Energy Sector Roadmap to Carbon Neutrality in China Chapter 3: Sectoral pathways
PAGE | 95 IEA,
202
1.
Box 3.2 Implications of lower biofuels supply due to a lack of sustainable biomass
The future availability of land and water for growing biomass to make biofuels is highly uncertain, in part because it is not clear how much land will be needed to grow crops for food (see Chapter 4). Additionally, the conversion of woody biomass feedstocks to biofuels (via biomass gasification or cellulosic fermentation) is currently still in the demonstration phase, and needs to be commercialised at full scale within the next decade to play a part in the energy transition to carbon neutrality.
If biomass supply is ultimately limited by access to marginal land for growing energy crops or by collection rates for agricultural waste and residues, or if biofuel conversion technology does not achieve commercial deployment, biofuel production in the future would be lower than projected in the APS. In that case, there would be a greater need to produce low-carbon hydrogen and synthetic fuels using hydrogen and captured CO2, especially later in the projection horizon to make synthetic kerosene to replace the shortfall in bio-kerosene supply. Assuming advanced biodiesel and bio-kerosene production is reduced by 50%, three times more (1 100 PJ additional) synthetic diesel and synthetic kerosene would be required in 2060 in China when compared with the APS. If the 12 Mt of hydrogen required for the synthetic fuels is sourced from electrolysis, an additional 13% of electrolyser capacity (95 GW) could in turn be needed, powered by 2 115 TWh of electricity. Likewise, if the CO2 consumed by the increase in synthetic fuels is provided by direct air capture (DAC), an additional 90 Mt CO2 would need to be captured in 2060.
Potential impacts of limited biofuels production in China in 2060
IEA, 2021.
Note: APS = Announced Pledges Scenario; DAC = direct air capture.
0
500
1 000
1 500
2 000
2 500
APS Limitedbiofuels
APS Limitedbiofuels
Biofuels Synthetic fuels
PJ
Advanced biodiesel and bio-kerosene Electrolyser capacitySynthetic diesel and kerosene CO₂ captured from DAC
0
100
200
300
400
0
250
500
750
1 000
APS Limitedbiofuels
APS Limitedbiofuels
Electrolysercapacity
Direct aircapture
Mt C
O₂p
er y
ear
GW

An Energy Sector Roadmap to Carbon Neutrality in China Chapter 3: Sectoral pathways
PAGE | 96 IEA,
202
1.
However, more DAC plants would also need to be built in the western provinces – home to the best solar and wind resources and much of the country’s potential CO2 storage capacity – to compensate for the loss of negative emissions from biofuels production with bioenergy with carbon capture and storage (BECCS). If half of these biofuels negative emissions were lost from reduced liquid biofuels production, then the shortfall of around 50 Mt CO2 would need to be met by DAC and storage, increasing the overall deployment of DAC to 80% above what is projected in 2060 in the APS.
Hydrogen and hydrogen-derived fuels Hydrogen use in the energy sector today is largely confined to oil refining and the production of ammonia and methanol in the chemicals industry. Chinese hydrogen demand was around 25 Mt in 2020, met mainly by domestic production based on fossil fuels (mostly gasification of coal) and directly emitting around 360 Mt CO2.5 Production and use in the APS increase slowly until 2030 to 31 Mt and faster thereafter to 90 Mt in 2060. Around 40% of consumption in 2060 is in heavy industry (mainly steel and chemicals production). The direct use of hydrogen in transport accounts for around one-quarter of total hydrogen demand, and its conversion into other fuels (mainly ammonia for shipping and synthetic kerosene for aviation) accounts for another 20%. The remainder is used in different applications such as refining, gas-fired power plants to balance electricity generation from solar PV and wind, and heating in buildings. In total, hydrogen and fuels derived from hydrogen account for almost 6% of China’s final energy consumption in 2060.6
Most of the increase in hydrogen production in China in the APS is based on low-carbon technologies: water electrolysis using electricity generated from renewables and grid electricity (with significantly lower carbon intensity compared with today) accounts for 80% of total production and coal and natural gas with CCUS account for 9% and 7% respectively in 2060. This switch to low-carbon technologies, and particularly electrolysis, does provide benefits beyond CO2 emissions reduction: renewables-based electrolysis consumes four to nine times less water than coal gasification. As a result, total specific water consumption for
5 This excludes approximately 40 Mt CO2 captured in ammonia production and utilised to manufacture urea, which is re-emitted in the agricultural sector when urea is applied to soils, and around 75 Mt CO2 emitted when methanol is oxidised at its end use. 6 This excludes onsite hydrogen production and use in the industry sector, which accounts for around 8% of industrial energy demand in the APS by 2060. Including on-site hydrogen production in industry, hydrogen and hydrogen-based fuels meet 10% of China’s final energy consumption.

An Energy Sector Roadmap to Carbon Neutrality in China Chapter 3: Sectoral pathways
PAGE | 97 IEA,
202
1.
hydrogen production in 2060 could be up to 60% lower than today. Hydrogen also displaces end-use fossil fuels, which require more water than hydrogen to be produced, helping to alleviate water stress in China – a growing problem in recent decades.
China’s electrolyser capacity reaches close to 25 GW by 2030 and 750 GW by 2060 in the APS, up from less than 100 MW today. China accounts for close to 40% of global electrolyser capacity additions over the projection horizon, its share rising quickly until 2040 and then plateauing. Those plants consume huge amounts of electricity, reaching close to 3 300 TWh in 2060. By contrast, coal use for hydrogen production falls from 115 Mtce in 2020 to less than 90 Mtce in 2060 – 15% of China’s total coal demand – more than 80% of which is in conjunction with CCUS, while the use of natural gas declines from close to 30 bcm to just above 20 bcm in 2060 (more than 90% with CCUS). In total, more than 200 Mt of CO2 is captured in these plants in 2060.
Electrolyser capacity and CO2 capture from hydrogen production in China in the APS
IEA, 2021.
Electrolytic hydrogen output and CO2 capture from fossil fuel-based hydrogen plants grow substantially, the former contributing 80% of total hydrogen production in 2060
Scaling up production capacity and improving technology will be critical to reducing the cost of hydrogen. Alkaline electrolyser technology using the chlor-alkali process (which yields hydrogen as a by-product of chlorine and caustic soda production) is already commercial in China, but low-carbon hydrogen production from fossil fuels using CCUS is at an early stage of development. Two small pilot projects involving the production of methanol from oil and coal with captured CO2 used for enhanced oil recovery are in operation, while other projects to demonstrate the production of hydrogen from coal with CCUS are planned. In
0%
10%
20%
30%
40%
0
200
400
600
800
2020 2030 2040 2050 2060
GW
China share of global capacity
Electrolysis capacity
0%
10%
20%
30%
40%
50%
0
50
100
150
200
250
2020 2030 2040 2050 2060
Mt
CO₂ captured at hydrogen production

An Energy Sector Roadmap to Carbon Neutrality in China Chapter 3: Sectoral pathways
PAGE | 98 IEA,
202
1.
addition to an expansion of electrolysis, the APS envisages retrofitting the fraction of the young existing fleet of coal-based hydrogen plants that will not be retired by 2060. The next decade will be critical to consolidate the development and demonstration of CCUS technologies in China, which will need to be ready by 2030 to be deployed rapidly on a large scale.
The choice between the production of hydrogen from electrolysis or natural gas or coal with CCUS depends on economics and other factors, including whether CO2 storage is available. For natural gas with CCUS, production costs in China are projected to reach around USD 2/kg (CNY14/kg) in 2060 in the APS, with the cost of the gas itself typically accounting for more than 50% of the total. In the case of coal with CCUS, production costs reach around USD 1.2/kg (CNY 8.3/kg). Although the efficiency of coal gasification is lower than that of steam reforming of natural gas, the cost of coal is lower, accounting for around one-third of the total production cost. Costs without CCUS are much higher due to carbon penalties.
Production costs of hydrogen and hydrogen-derived fuels by technology in China in the APS
IEA, 2021.
Notes: NG = natural gas reforming; Coal = coal gasification; CCUS = carbon capture, utilisation and storage. Electrolysis is based on dedicated renewables-based generation. Assumptions for technoeconomic parameters available from IEA (2021b). Fuel price assumptions: natural gas - 2020, USD 23.6/MWh (CNY 163/MWh) and, 2060 USD 23.4/MWh (CNY 162/MWh); coal – 2020, USD 10.7/MWh (CNY 74/MWh) and, 2060 USD 7.4/MWh (CNY 51/MWh); electricity – 2020, USD 25-99/MWh (CNY 172-683/MWh) and, 2060 USD 13-44/MWh (CNY 89-303/MWh). CO2 price assumptions: 2020, USD 0-10/t CO2 (CNY 0-69/t CO2) and USD 0-200/t CO2 (CNY 0-1 380/t CO2).
Coal gasification is expected to remain cheaper than steam reforming of natural gas, but electrolysis emerges as a competitive option in the long term
0
1
2
3
4
5
6
7
2020
2060
2020
2060
2020
2060
2020
2060
2020
2060
NG NG CCUS Coal CoalCCUS
Electrolysis
USD
/kg
Hydrogen
0
100
200
300
400
500
600
2020
2060
Synthetickerosene
USD
/bbl
0.0
0.3
0.6
0.9
1.2
1.5
1.8
2020 2060
Ammonia
USD
/kt
Hydrogen-derived fuels

An Energy Sector Roadmap to Carbon Neutrality in China Chapter 3: Sectoral pathways
PAGE | 99 IEA,
202
1.
For water electrolysis, learning effects and economies of scale drive down capital costs in China by around 55% by 2030 and by 70% by 2060 in the APS. Overall production cost reductions hinge on the cost of low-carbon electricity, as electricity accounts for 45-75% of total production costs. The average cost of producing hydrogen from renewables in China in the APS drops from USD 3.1/kg (CNY 10/kg) to USD 6.7/kg (CNY 46/kg) today to around USD 1.3/kg (CNY 9/kg) to USD 1.8/kg (CNY 12/kg) as early as 2050. Hydrogen produced from water electrolysis reaches cost parity with coal with CCUS.
Ammonia – the main hydrogen-based product today – is currently used exclusively as a feedstock in the chemical industry. In the APS, it is also used increasingly as a low-carbon fuel option for maritime transport, benefiting from its higher volumetric energy density than both hydrogen and electric batteries. China’s ammonia production rises from 54 Mt in 2020 to 80 Mt in 2060, when two-thirds goes to maritime shipping (meeting 40% of the sector’s total energy needs). The use of ammonia as a fuel needs to overcome certain technical barriers, including its toxicity and nitrous oxide emissions. The use of synthetic kerosene derived from hydrogen also expands rapidly, especially after 2030. Synthetic kerosene meets one-quarter of the country’s aviation fuel demand in 2060 in the APS.
Converting hydrogen into ammonia or synthetic hydrocarbon fuels is expensive, but it results in fuels that can be more easily transported and stored. They are also often compatible with existing infrastructure or end-use technologies (as in the case of synthetic kerosene for aviation), lowering overall costs. The cost of making both ammonia and synthetic hydrocarbons produced from electrolytic hydrogen is significantly higher than conventional fuels in shipping and aviation. However, the large potential for low-cost renewables in western regions in China is expected to drive down production costs. In the APS, producing ammonia from electrolytic hydrogen in China falls as much as 70% between 2020 and 2060, by which time the extra step accounts for about 20% to the overall cost relative to hydrogen. In the case of synthetic kerosene, production cost falls up to 60% between 2020 and 2060, with the additional synthesis step more than doubling production costs compared with hydrogen, depending on the cost of the CO2 feedstock, which explains why their use in the APS is largely restricted to aviation where alternative low-carbon options are limited. Synthetic kerosene production costs fall from USD 280/bbl (CNY 1930/bbl) to USD 510/bbl (CNY 3520/bbl) in 2020 to USD 140/bbl (CNY 965/bbl) to USD 200/bbl (CNY 1380/bbl) by 2060 in China thanks to cheaper renewable electricity and CO2 feedstocks, though they remain far higher than the projected USD 55/bbl (CNY 380/bbl) cost of

An Energy Sector Roadmap to Carbon Neutrality in China Chapter 3: Sectoral pathways
PAGE | 100 IEA,
202
1.
conventional kerosene. The carbon-neutral CO2 from BECCS and DAC needed to make these fuels costs around USD 14/bbl (CNY 96/bbl) to USD 70/bbl (CNY 480/bbl) in 2060. As a result, a CO2 price of USD 200 to USD 345 (CNY 1 380 to CNY 2 380) per tonne is needed to make synthetic kerosene competitive with conventional jet kerosene.
Industry Slashing CO2 emissions in industry will be crucial to achieving carbon neutrality in China. Industry is the second-largest source of CO2, accounting for around 35% of the country’s total energy sector emissions in 2020. This reflects the sector’s importance to the economy (see Chapter 1): China produced nearly 60% of the world’s cement and crude steel, around 55-65% of primary steel and aluminium, and 30% of the primary chemicals7 used to make plastics and fertilisers.
CO2 emissions from China’s industrial sector decline by almost 95% between 2020 and 2060 in the APS, with the residual emissions being offset by negative emissions in other sectors. Around 80% of those remaining industrial emissions in 2060 are in heavy industry. The fall in emissions results largely from switching to low-carbon technologies and fuels, though energy savings also contribute. Energy consumption falls by around 20%, mainly due to declines in the volume of output, as China’s economy shifts away from cement and steel production towards higher-value manufacturing industries, which tend to consume less energy per unit of value added. Efficiency gains also play an important role, though many of them are a by-product of the development of inherently less energy-intensive means of production, which are facilitated by increases in secondary (rather than primary) production of steel, aluminium and plastics.
7 Including ethylene, propylene, benzene, toluene, mixed xylenes, ammonia and methanol.

An Energy Sector Roadmap to Carbon Neutrality in China Chapter 3: Sectoral pathways
PAGE | 101 IEA,
202
1.
Industrial CO2 emissions and energy consumption in China in the APS
IEA, 2021.
Notes: Other includes non-metallic minerals besides cement, non-ferrous metals besides aluminium and all non-energy-intensive manufacturing, including non-specified industrial energy consumption. Chemicals includes energy used for feedstock. Steel includes energy used in blast furnaces and coke ovens. Heat and hydrogen refer to energy supplied in these forms by the power and fuel transformation sector that is sold for use in industry; they exclude onsite generation.
Industrial emissions decline by 94% by 2060, thanks to an 83% decline in the use of coal that is largely offset by a near-doubling of that of electricity
Switching away from coal is the main contributor to lowering emissions. Coal use in industry plummets, from around 30 EJ in 2020 – around one-fifth of global coal consumption – to just 5 EJ in 2060. In contrast, oil use stays relatively flat through to 2060, at around 6 EJ. Its share of industrial energy consumption increases over this period, with the vast majority used as chemical feedstock. While the energy used as feedstock is not combusted, it does lead to process emissions, most of which are captured. Gas use drops from 4 EJ to 3 EJ over the same period, with its share of industrial energy use falling from 8% to 6%. Of the remaining 8 EJ of coal and gas demand in industry in 2060, around 70% is in plants equipped with carbon capture or used as feedstock. The overall share of fossil fuels in industrial energy consumption declines from around 70% in 2020 to 30% in 2060.
Electricity forms the backbone of the energy transition in industry. It becomes the largest energy carrier in the sector by 2035 and meets more than half the sector’s total energy needs in 2060. Electricity consumption increases from around 4 000 TWh today to over 7 000 TWh in 2060. The rate of increase is nonetheless slightly lower than for the rest of the world, which sees a twofold increase in total electricity demand over the same period. This is largely due to a shrinking industrial
0
1
2
3
4
5
Gt
Chemicals Steel CementAluminium Paper Other
CO2 emissions
0
10
20
30
40
50
60
70
EJCoal OilNatural gas ElectricityHeat BioenergyOther renewables Hydrogen
Final energy consumption

An Energy Sector Roadmap to Carbon Neutrality in China Chapter 3: Sectoral pathways
PAGE | 102 IEA,
202
1.
sector in China and a high share of heavy industry processes, which are difficult to completely electrify with commercial technologies today. Direct use of bioenergy and renewable heating technologies such as solar thermal and geothermal, together with hydrogen, also expands.
The task of reducing industrial emissions is aided by a projected peaking of the country’s primary production of leading bulk materials in the coming years and subsequent decline in the APS. Global demand for steel and chemicals keeps growing, by 20% and 35% respectively between 2020 and 2060, while demand for cement, aluminium and paper products undergo modest declines from their current levels. China’s share in the global production of these materials generally declines as its economy continues to gradually shift away from heavy industry, towards higher value-added manufacturing segments of the economy. Crude steel production in China is projected to peak in the mid-2020s and then drop by 40% to 2060 compared with 2020 levels. Cement production follows a similar trajectory, with output falling by 45% over the same period. As a result, China’s share of global steel and cement production declines to around 30% in 2060.
Global production of major bulk materials and China’s share in the APS
IEA, 2021.
Notes: Paper includes all major paper categories, including case materials, printing and writing papers, cartonboard, household and sanitary papers, newspaper, packaging paper and board, printing and writing papers, and wrapping paper. Primary chemicals includes ethylene, propylene, benzene, toluene, mixed xylenes, ammonia and methanol.
China currently accounts for over half of global production of many key bulk materials, but these shares are set to decline in the coming decades as its economy restructures
0 200 400 600 800 1 000
2060
2030
2020
2060
2030
2020
2060
2030
2020
Prim
ary
chem
ical
sPa
per
Alum
iniu
m
Mt
ChinaRest of world
0 1 000 2 000 3 000 4 000 5 000
2060
2030
2020
2060
2030
2020
Cem
ent
Cru
de s
teel

An Energy Sector Roadmap to Carbon Neutrality in China Chapter 3: Sectoral pathways
PAGE | 103 IEA,
202
1.
The adoption of material efficiency strategies, such as lightweighting, product life extensions, improved design and construction practices, reuse of products, and increased sorting and collection for recycling, play a crucial role in stemming the rise in demand for these emissions-intensive commodities around the world. Without these strategies, global steel and cement demand in 2060 would be around 15% higher than in the APS. However, for China, increased material efficiency, alongside energy efficiency improvements, are insufficient to put China’s industrial sector on a pathway compatible with its carbon neutrality target. It will also require dramatic reductions in the emissions intensity of production – particularly primary steel, cement and primary chemicals – through the widespread adoption of innovative technologies that are not commercially available today.
Although industrial use of fossil fuels falls sharply in the APS, significant amounts are still consumed – much of it in plants with carbon capture equipment – in 2060 because of difficulties in replacing those fuels in certain applications. Some processes require high temperatures, which can most easily and cost-effectively be provided by fossil energy in China today. Fossil energy is a convenient source of feedstock for primary chemicals, providing both the hydrogen and carbon required. Coal and coke are used as reduction agents for producing steel; hydrogen is being pursued as an alternative in China and other countries, although it is significantly more expensive at present. In the case of cement, direct emissions of CO2 are inherent to the production process, irrespective of whether fossil fuels are used to heat the kiln (which is usually the case because of their low cost). The long lifetimes of industrial assets also slow the pace at which new technologies can be introduced, though they tend to be much lower in China than elsewhere (see Chapter 1). Not all existing assets are suitable for retrofitting low-carbon technologies.
Daunting though the task undoubtedly will be, there are several factors that should help to accelerate the decarbonisation of China’s heavy industry. Despite cuts to low-grade capacity and production bans, overcapacity persists in some sectors, particularly cement production where the national average utilisation rate is around 75%. This presents an opportunity to close the most inefficient, CO2-intensive and polluting plants. In addition, heavy industry is dominated by state-owned enterprises (SOEs), which can be better placed to implement quickly the changes required to slash emissions where there are clear policy signals than private enterprises driven solely by concerns about profitability. And the very steep build-up in production capacity in the 2000s means that a large share of existing capacity will reach the end of its life in the 2030s and 2040s, when innovative low-emissions alternatives to conventional routes for production are expected to

An Energy Sector Roadmap to Carbon Neutrality in China Chapter 3: Sectoral pathways
PAGE | 104 IEA,
202
1.
become widely available on a large scale. A large increase in the availability of scrap materials in the coming decades will also open up opportunities for low-carbon investment.
Innovation will be central to reducing China’s industrial emissions (see Chapter 5). More than one-third of the cumulative reductions in the APS are associated with technologies that are not commercially available today. Several hinge on the large-scale development of supply infrastructure, notably for CCUS (CO2 transport and storage), electricity generation, hydrogen production from electrolysers, and storage.
Chemicals The chemicals industry in China – the largest in the world8 – is central to economic development, providing a range of key products to other sectors and generating large export earnings. Output slowed in the 2010s after several decades of rapid expansion, yet still rose by 85% between 2010 and 2019, contributing about half of the growth of the world chemicals market. It was broadly flat in 2020 despite the Covid-19 crisis. SOEs still dominate the sector, though investment by foreign multinationals, notably in speciality chemicals, has been growing rapidly in recent years.
China’s chemicals sector is unique globally. The country has limited indigenous supplies of oil and gas – the main feedstocks for the global chemical industry – so the development of the industry over the last three to four decades has relied to a significant degree on coal-based technologies, notably coal gasification to produce synthesis gas for making ammonia and methanol. This proved relatively straightforward, as the technology has been widely available for nearly a century and has been used – albeit on a much smaller scale – elsewhere, such as in Germany, South Africa and the United States. Coal gasification technologies tend to be more complex and capital-intensive than those based on natural gas, but after decades of experience with the technology, the best plants using high-quality coal can achieve efficiencies comparable with gas plants. Today, China produces nearly one-third of the world’s ammonia and more than half the world’s methanol.
Producing olefins – key precursor to chemicals for making plastics – from coal is more problematic. A group of catalytic processes termed “methanol to olefins” (MTO) using zeolite catalysts were developed in China to facilitate the production of ethylene and propylene from methanol produced from coal. While much more
8 Primary chemical production is used here as a proxy for the size of the chemical industry as a whole.

An Energy Sector Roadmap to Carbon Neutrality in China Chapter 3: Sectoral pathways
PAGE | 105 IEA,
202
1.
energy-intensive overall, the MTO route negates the need for oil to produce plastics, which form an important input to China’s downstream manufacturing industries. More than two-thirds the methanol China produces is used merely as an intermediate to produce olefins, which would otherwise be produced directly from oil in a steam cracker. Aromatics – more complex petrochemicals – can also be produced from methanol, although this technology is at a much earlier stage of development.
Key projects targeting emissions reductions in heavy industry in China
Technology Maturity Time frame Description
Steel
Utilisation of steel off-gases Mature 2012-2019
Several projects already operating at large scale, designed to extract the valuable components of blast furnace gas and coke oven gas for use in energy applications and the chemicals and transport sectors. Key examples are operated by Hengyang Steel Pipe (Energy Saving of Nonferrous Metallurgy, 2012), Shandong Aside Technology Co. (EESIA, 2019), Baotou Steel (IN-EN, 2012), Sichuan Dagang (Baowu, 2018), Lubao Group and Shanxi SDIC Hydleysen (IN-EN, 2019), LanzaTech and Shougang Group (LanzaTech, 2018).
DRI steelmaking with high shares of hydrogen blending
Demonstration Expected early 2020s
HBIS Group, together with Tenova (Zhong, 2020) announced a 600 kt/year project that will use Energiron technology in Hebei province, with plans to commence operation in 2022. Rizhao Iron and Steel group (Zhao, 2020) have since announced a similar project of 500 kt/year.
Smelting reduction with hydrogen blending
Demonstration Expected 2021
Jianlong Group (IN-EN, 2021a), together with Beijing University of Science and Technology, is exploring the use of hydrogen combined with coal in a smelting reduction furnace in a 300 kt/year plant.
Blast furnace steelmaking with hydrogen blending
Concept Started 2021
Baowu (CNPGN, 2021) is performing a second-stage test of a hydrogen-rich carbon cycle blast furnace with tuyere injection of hydrogen and ultra-high oxygen enrichment. Shanxi Jinnan Iron and Steel Group (Metallurgical Information Network, 2020) and the Central Iron and Steel Research Institute signed an agreement to test hydrogen injection in a 2 000 m3 blast furnace.
Other hydrogen-related Concept Started
2019
Baowu, CNNC and Tsinghua University (QIBEBT, 2020) are exploring the potential of a 600 MW nuclear plant to be used to provide the hydrogen, oxygen and electricity needs for a 1.8 Mt/year steelmaking facility.
CO2 capture Concept Unknown
Shougang Jingtang Iron and Steel United Company (DEEHP, 2021) are exploring the potential to use pressure swing adsorption to separate CO2 produced during the production process of the sleeve kiln.
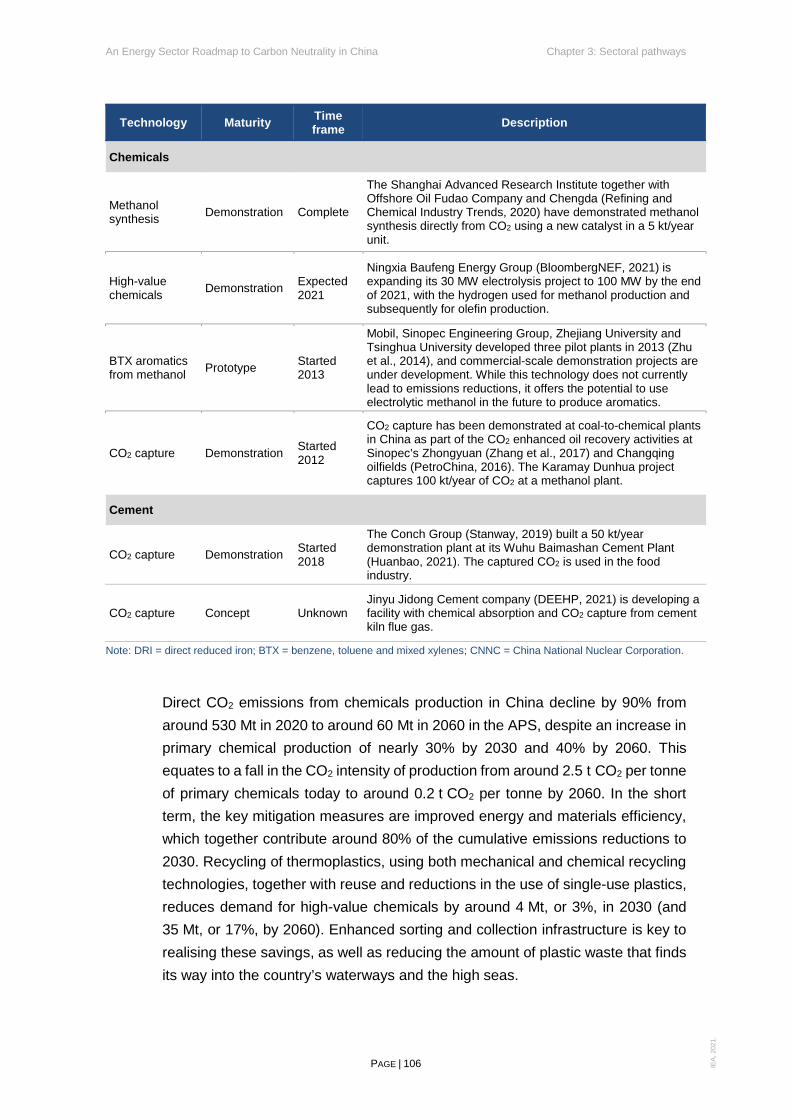
An Energy Sector Roadmap to Carbon Neutrality in China Chapter 3: Sectoral pathways
PAGE | 106 IEA,
202
1.
Technology Maturity Time frame Description
Chemicals
Methanol synthesis Demonstration Complete
The Shanghai Advanced Research Institute together with Offshore Oil Fudao Company and Chengda (Refining and Chemical Industry Trends, 2020) have demonstrated methanol synthesis directly from CO2 using a new catalyst in a 5 kt/year unit.
High-value chemicals Demonstration Expected
2021
Ningxia Baufeng Energy Group (BloombergNEF, 2021) is expanding its 30 MW electrolysis project to 100 MW by the end of 2021, with the hydrogen used for methanol production and subsequently for olefin production.
BTX aromatics from methanol Prototype Started
2013
Mobil, Sinopec Engineering Group, Zhejiang University and Tsinghua University developed three pilot plants in 2013 (Zhu et al., 2014), and commercial-scale demonstration projects are under development. While this technology does not currently lead to emissions reductions, it offers the potential to use electrolytic methanol in the future to produce aromatics.
CO2 capture Demonstration Started 2012
CO2 capture has been demonstrated at coal-to-chemical plants in China as part of the CO2 enhanced oil recovery activities at Sinopec’s Zhongyuan (Zhang et al., 2017) and Changqing oilfields (PetroChina, 2016). The Karamay Dunhua project captures 100 kt/year of CO2 at a methanol plant.
Cement
CO2 capture Demonstration Started 2018
The Conch Group (Stanway, 2019) built a 50 kt/year demonstration plant at its Wuhu Baimashan Cement Plant (Huanbao, 2021). The captured CO2 is used in the food industry.
CO2 capture Concept Unknown Jinyu Jidong Cement company (DEEHP, 2021) is developing a facility with chemical absorption and CO2 capture from cement kiln flue gas.
Note: DRI = direct reduced iron; BTX = benzene, toluene and mixed xylenes; CNNC = China National Nuclear Corporation.
Direct CO2 emissions from chemicals production in China decline by 90% from around 530 Mt in 2020 to around 60 Mt in 2060 in the APS, despite an increase in primary chemical production of nearly 30% by 2030 and 40% by 2060. This equates to a fall in the CO2 intensity of production from around 2.5 t CO2 per tonne of primary chemicals today to around 0.2 t CO2 per tonne by 2060. In the short term, the key mitigation measures are improved energy and materials efficiency, which together contribute around 80% of the cumulative emissions reductions to 2030. Recycling of thermoplastics, using both mechanical and chemical recycling technologies, together with reuse and reductions in the use of single-use plastics, reduces demand for high-value chemicals by around 4 Mt, or 3%, in 2030 (and 35 Mt, or 17%, by 2060). Enhanced sorting and collection infrastructure is key to realising these savings, as well as reducing the amount of plastic waste that finds its way into the country’s waterways and the high seas.

An Energy Sector Roadmap to Carbon Neutrality in China Chapter 3: Sectoral pathways
PAGE | 107 IEA,
202
1.
In the longer term, the burden of emissions reductions shifts to the deployment of innovative technologies, particularly CCUS and electrolytic hydrogen. Those two technology families alone cover 85% of primary chemicals production by 2060 and 40% of the cumulative emissions reductions to 2060 in the APS. Electrolytic production of methanol and ammonia increases from virtually zero today to around 40% of the total output of these commodities by 2060. This entails the construction of around 80 GW of electrolysis capacity – around 800 times the capacity of the world’s largest industrial water-based electrolyser in operation at year-end 2021 (see Chapter 4). Most of the capacity for the remaining production of those chemicals and nearly all the capacity for producing high-value chemicals is equipped with CCUS. This requires around 3 Mt of annual CO2 capture capacity by 2030 and 200 Mt by 2060. The deployment rate required after 2030 is equivalent to one large capture facility with a capacity of 1 Mt CO2 per year being commissioned every two months on average.
Technology penetration and energy sector CO2 emissions reductions by measure and technology maturity in China’s chemicals sector in the APS
IEA, 2021.
Notes: CCUS = carbon capture, utilisation and storage. Conventional include all commercial routes for primary chemical production that are not equipped with CCUS. CCUS-equipped is based on the share of generated CO2 that is captured, including both energy-related and process emissions. Hydrogen-based includes electrolysis- and pyrolysis-based technologies. Other includes bio-based primary chemical production and direct electrification routes, such as electric steam cracking. Maturity categories are assigned based on the detailed assessment of the technology readiness of designs presented in the International Energy Agency (IEA) Clean Energy Technology Guide (IEA, 2020b).
CCUS and hydrogen-based production routes account for 85% of primary chemicals production by 2060 in the APS
Electrolytic hydrogen and CCUS are key pillars of the decarbonisation of the chemicals industry in the APS (see Chapter 4). CCUS is particularly attractive in applications where the presence of carbon in the process must be retained to form the molecular structure of the product, such as methanol and high-value chemicals
0%
20%
40%
60%
80%
100%
2020 2030 2040 2050 2060Conventional CCUS-equippedHydrogen-based Other
Primary chemical production
0% 20% 40% 60% 80% 100%
MatureMarket uptakeDemonstrationPrototype
Technology maturity
Material efficiency ElectrificationHydrogen BioenergyOther renewables Other fuel shiftsEnergy efficiency CCUS
Cumulative emissions reductions, 2020-2060
Mitigation measure
Measure Maturity

An Energy Sector Roadmap to Carbon Neutrality in China Chapter 3: Sectoral pathways
PAGE | 108 IEA,
202
1.
production. CO2 from atmospheric or biogenic sources can be used in place of the carbon contained in fossil fuels, but sustainable supplies are limited and costly. CO2 capture from chemical production rises to 200 Mt per year by 2060, 90% of which is captured from methanol and high-value chemicals plants. Hydrogen produced from variable renewable electricity, twinned with flexible process arrangements in the chemicals sector, becomes a competitive route to produce ammonia and, to a lesser extent, methanol. The cost of hydrogen supplied at a stable load factor with the help of hydrogen storage reaches around USD 1.5/kg by 2060. This is higher than from unabated coal, but is competitive with production from imported natural gas and is viable in more locations than CCUS-equipped coal-based plants.
Steel Steel demand in China has increased sharply over the past two decades, primarily in the construction and manufacturing sectors with surging infrastructure needs. Steel production, which meets export as well as domestic demand, increased by 7% to a record 1.1 Gt in 2020, despite the Covid-19 pandemic, and has continued to rise in 2021, offsetting declines in other parts of the world. Hebei province alone produced around 250 Mt in 2020, or around 13% of global steel production (Mysteel Global, 2021). China’s output has increased by 67% since 2010 and more than eightfold since 2000.
Around 80% of the country’s steel production is from iron ore (i.e. primary production), as opposed to scrap, compared with around 60% for the rest of the world. The use of carbon-based reduction agents to cleave the oxygen from ore (iron oxide) to produce molten iron is the only way of doing this today using commercially available technology; in China, coke and coal are the primary reduction agents. Only 10% of the country’s crude steel production involves electric furnaces, which are typically used when the sole metallic input to steelmaking is scrap. At the early stage of a country’s economic development, when its infrastructure, building stock, vehicles fleets and industry are growing rapidly, it is usually necessary to produce most steel from iron ore as little steel is scrapped. The majority of the scrap currently used in China is blended into primary production, nearly all of which takes place via the blast furnace basic oxygen furnace route.
China’s reliance on scrap steel, which is inherently less energy- and carbon-intensive, will undoubtedly grow in the coming decades as its economy matures and more scrap becomes available. Output from scrap-based electric furnaces in the APS nearly doubles by 2030 and more than triples by 2060, with existing

An Energy Sector Roadmap to Carbon Neutrality in China Chapter 3: Sectoral pathways
PAGE | 109 IEA,
202
1.
induction furnaces being replaced by more efficient electric arc furnaces. By 2060, electric arc furnaces constitute the single-largest avenue for steel production in China, partly facilitating the shift of the sector’s energy inputs towards the use of electricity. In addition, a projected decline in China’s overall steel production also pushes down emissions. However, these factors are unlikely to be sufficient to put the country’s industry on a pathway compatible with reaching carbon neutrality by 2060.
A major hurdle to decarbonising China’s steel sector is the relatively low age of existing production capacity, which averages around 15 years compared with around 35 years in the United States and around 40 years in much of Europe (Tong et al., 2019; Wang et al., 2019; Liu et al., 2021). While emissions-intensive assets in the steel industry, such as blast furnaces, tend to be operated for around 40 years on average globally, the typical lifetimes of these assets in China is much lower, at around 25 years. Facilities are often replaced after a single operating cycle (rather than undergoing a major refurbishment) in China, which eases the prospective burden of replacing its existing stock of assets to avoid locking in emissions. However, China’s steel industry is so large that even a slight misalignment between the end of the operating cycle of existing facilities and the availability of innovative technologies could incur large additional costs and significantly delay progress towards carbon neutrality (see Chapter 5).
CO2 emissions from steel production decline from around 1.5 Gt in 2020 to 1.4 Gt in 2030 and around 120 Mt by 2060 in the APS. Material and energy efficiency measures, largely associated with the increased use of scrap steel, account for around 50% of the cumulative emissions reductions to 2060. The increase in scrap use is driven in large part by economic factors and would occur regardless of efforts to cut emissions. In the longer term, as with the other heavy industrial sectors, the burden of emissions reductions falls to the deployment of innovative technologies which are not available commercially today, primarily CCUS and electrolytic hydrogen, which together account for around 15% of the cumulative emissions reductions. They are associated with two main production routes: hydrogen-based direct reduced iron (DRI), a relatively energy-efficient process that in the future can be twinned directly with low-cost, captive variable-renewables-based electricity production; and the innovative smelting reduction process, which avoids the need for a coke oven and some agglomeration processes, producing a purer CO2 stream that is more amenable to capture. Together, these routes account for more than two-thirds of primary steel production by 2060, with most of the remainder being supplied by conventional blast furnaces nearing the end of their lives. Scrap-based electric arc furnace production accounts for more than half of total steel production by 2060.

An Energy Sector Roadmap to Carbon Neutrality in China Chapter 3: Sectoral pathways
PAGE | 110 IEA,
202
1.
Technology penetration and energy sector CO2 emissions reductions by measure and technology maturity in China’s steel sector in the APS
IEA, 2021.
Notes: Conventional includes all unabated commercial routes for producing steel from iron ore today. CCUS-equipped includes innovative smelting reduction with CCUS and innovative blast furnace steelmaking with CCUS. Hydrogen-based includes a proportion of steelmaking where hydrogen is blended into ironmaking furnaces and all pure hydrogen-based DRI steelmaking. Other includes direct electrolysis of iron ore. Maturity categories are assigned based on the detailed assessment of the technology readiness of designs presented in the IEA Clean Energy Technology Guide (IEA, 2020b). CCUS = carbon capture, utilisation and storage; BF-BOF = Blast Furnace - Basic Oxygen Furnace. Scrap-EF = Scrap-Electric Furnace
More than two-thirds of China’s primary steel is produced using innovative smelting reduction and hydrogen-based DRI routes by 2060 in the APS
Cement Never has an industrial sector expanded at the scale and rate of China’s cement industry since the turn of the millennium. Cement production quadrupled in just 15 years, from around 600 Mt in 2000 to around 2.4 Gt in 2015. Since then, it has remained broadly flat, rising by a modest 2% in 2020. In the APS, Chinese cement production continues to grow slowly in the near term, peaking in 2025 and then entering a progressive decline as its infrastructure and building stocks mature, causing domestic demand to fall.
Cement production technology is well-established and varies very little across countries. Cement cannot be recycled cost-effectively, so all production is from virgin materials (mainly limestone). Dry kilns – usually the most efficient type of kiln – using a range of fuels, are the source of nearly all cement produced around the world. In China, coal accounts for around 75% of the energy inputs to cement kilns, with the remainder comprising electricity, natural gas, and small amounts of oil products, waste and bioenergy.
The production of cement currently emits large amounts of CO2, both from the combustion of fossil energy needed for process heat and from the chemical
0%
20%
40%
60%
80%
100%
2020 2030 2040 2050 2060Conventional (BF-BOF) Conventional (scrap-EF)CCUS-equipped Hydrogen-based
Crude steel production
0% 20% 40% 60% 80% 100%
MatureMarket uptakeDemonstrationPrototype
Technology maturity
Material efficiency ElectrificationHydrogen BioenergyOther renewables Other fuel shiftsEnergy efficiency CCUS
Cumulative emissions reductions, 2020-2060
Mitigation measure
Measure Maturity

An Energy Sector Roadmap to Carbon Neutrality in China Chapter 3: Sectoral pathways
PAGE | 111 IEA,
202
1.
reaction that forms an integral part of the production process. Making cement requires large amounts of energy for process heat to produce a lumpy substance known as clinker from a mixture of limestone and clay in a kiln, which is then mixed with gypsum and sometimes other elements such as slag, fly ash and limestone, and crushed and ground into a fine powder (known as Portland cement).9 Aside from the fuels used, the key parameter that determines the emissions intensity of cement production is the amount of clinker – the active and most emissions-intensive ingredient – used per tonne of cement. In China, the clinker-to-cement ratio today is 0.66, compared with a global average of 0.72. This leads to an average carbon intensity that is about 7% lower than the world average.
Total CO2 emissions from cement production, which currently account for around one-third of China’s overall industrial emissions, decline from around 1.3 Gt in 2020 to around 30 Mt by 2060 in the APS. The emissions intensity of cement production declines from 0.55 t CO2 per tonne of cement today, to a mere 0.03 t by 2060. A number of incremental improvements – reductions in the clinker-to-cement ratio, reductions in demand for cement through material efficiency strategies, declines in the energy intensity of clinker production through energy efficiency measures, and increasing use of natural gas and bioenergy blending in place of coal – together drive nearly all of the emissions reductions achieved by 2030. In the longer term, the deployment of innovative technologies, including CCUS, is the largest contributor. CCUS-equipped kilns increase their share of clinker production from zero today to around 85% by 2060 (equivalent to the installation of twenty 1 Mt CO2 per year plants every year on average over 2030-2060).
Switching to alternative fuels also contributes to the reduction in emissions in the APS. Electrolytic hydrogen is blended into the fuel used in kilns at a rate of around 5% of thermal energy requirements by 2060, along with around 30% on average of bioenergy. Electricity, in specially modified kilns, provides 8% of the heat requirements. Most of the emissions from fossil fuels that are still used then are captured in the same stream as the process emissions. The remaining CO2 that is generated is partly offset by the CO2 captured from the bioenergy that is fired in the kiln (a type of BECCS).
9 Alternative binding materials to Portland cement do not contribute to emissions reductions in the APS as they are at early stages of development. For more information, see the IEA Technology Roadmap - Low-Carbon Transition in the Cement Industry (IEA, 2018).

An Energy Sector Roadmap to Carbon Neutrality in China Chapter 3: Sectoral pathways
PAGE | 112 IEA,
202
1.
Clinker production by technology and cement sector CO2 emissions reductions by measure and technology maturity in China in the APS
IEA, 2021.
Note: CCUS = carbon capture, utilisation and storage. Conventional refers to unabated dry kilns without CCUS. CCUS-equipped comprises kilns with CCUS, calculated as the proportion of CO2 emissions generated that are captured. Hydrogen-based and Other comprise kilns fuelled by a combination of hydrogen and electricity, with the proportions calculated based on the share of energy inputs (where they overlap, the proportion of process emissions captured is allocated to CCUS-equipped). Material efficiency includes reductions in the clinker-to-cement ratio together with cement demand reduction measures. Maturity categories are assigned based on the detailed assessment of the technology readiness of designs presented in the IEA Clean Energy Technology Guide (IEA, 2020b).
More than 80% of China’s cement production is equipped with CCUS by 2060 in the APS
Other industry Industries other than chemicals, steel and cement consume large amounts of energy and generate significant CO2 emissions in China. The most important are aluminium and other non-ferrous metals (e.g. copper), non-metallic minerals besides cement (e.g. lime), pulp and paper, construction, food, vehicle, machinery, mining, textile, wood. The combined emissions from these sectors drop from around 740 Mt in 2020 to just 50 Mt in 2060 in the APS.
Emissions from aluminium production fall by 95% in 2060 despite output falling by just 18%. Increased availability of scrap leading to high shares of secondary production (as in the steel sector) is a major contributor to lower emissions. In addition, process emissions are reduced by replacing carbon electrodes with inert ones. Carbon electrodes, which are currently used in the Hall-Héroult electrolytic smelting process (the leading technology currently in use in China and elsewhere), emit CO2 while being oxidised, unlike inert anodes. In the pulp and paper industry, emissions also fall by around 90% thanks mainly to the increasing share of bioenergy in the sector’s fuel inputs, and increased recycling.
0% 20% 40% 60% 80% 100%
MatureMarket uptakeDemonstrationPrototype
Technology maturity
0%
20%
40%
60%
80%
100%
2020 2030 2040 2050 2060
Conventional CCUS-equippedHydrogen-based Other
Clinker production
Material efficiency ElectrificationHydrogen BioenergyOther renewables Other fuel shiftsEnergy efficiency CCUS
Cumulative emissions reductions, 2020-2060
Mitigation measure
Measure Maturity

An Energy Sector Roadmap to Carbon Neutrality in China Chapter 3: Sectoral pathways
PAGE | 113 IEA,
202
1.
Emissions in the remaining industrial subsectors (referred to here as light industries) increase by almost 40% by 2030 and then fall by 95% by 2060, mainly through electrification. China dominates several light industrial activities. For example, it accounts for almost half of the energy demand of the global machinery sector. Energy use in light industry is for three main services: heat, mechanical work provided via electric motors and other electrical needs such as lighting and refrigeration. Low-temperature heat needs can be met efficiently by industrial heat pumps, while hydrogen and bioenergy can provide high-temperature heat. Commercial heat pumps can easily provide heat at temperatures below 100°C. Industrial heat pumps are being developed that can provide heat at over 160°C using industrial waste heat as an input (Nowak, 2021). Electricity meets around 75% of heat needs in light industry (resistance heaters for lower temperatures, electromagnetic heating for higher temperatures), hydrogen for around 7%, bioenergy for 4%, and other renewables, including concentrated solar and geothermal power, for the remaining 4% in 2060 in the APS.
Heating and electric motor technology deployment in light industries in China in the APS
IEA, 2021.
Notes: VSD = variable speed drive. Light industry excludes non‐specified industrial energy consumption. Other heat sources includes solar thermal and geothermal heaters, as well as imported heat from the power and fuel transformation sector.
The share of electric heating in light industry increases from around a quarter today to three-quarters in 2060, while the share of electric motors equipped with variable speed drives rises sharply, boosting overall efficiency levels
There are no direct emissions from the provision of mechanical energy, which is provided almost entirely by electric motors powered by electricity. Energy needs are nonetheless reduced, alleviating the need for generating low-carbon electricity
0%
20%
40%
60%
80%
100%
2020 2030 2040 2050 2060
Heat provision Heating technologyFossil fuelBioenergyElectricHeat pumpHydrogenOther heat sourcesTemperature level<100°C100-200°C>200°C
2020 2030 2040 2050 2060
Electric motor use
Efficiency classClass 0-1Class 2-3Class 4-5VSD-equipped

An Energy Sector Roadmap to Carbon Neutrality in China Chapter 3: Sectoral pathways
PAGE | 114 IEA,
202
1.
in the APS, thanks to the deployment of more efficient motors. In 2060, 90% of light industry motors in use are class 4 or above (compared with almost zero today) and half are equipped with a more efficient variable speed drive.10 These measures have the combined impact of reducing the electricity needs for light industry by 90 TWh, or 9%, in 2060.
Transport The transport sector in China emitted around 950 Mt of CO2, or around 9% of the country’s total energy sector emissions, in 2020 – marginally lower than in 2019 due to the Covid-19 pandemic. In the APS, transport emissions continue to grow in the near term, reaching a peak of just over 1 Gt by 2030 and then falling to about 100 Mt in 2060 – nearly 90% below the 2020 level. The bulk of the remaining emissions in 2060 are from domestic aviation and shipping and long-distance road freight, where emissions are harder to abate. Putting China’s transport sector on this pathway calls for a major concerted policy effort to drive the adoption of low-carbon technologies across all transport modes and ensure that transport systems operate as efficiently as possible (e.g. by leveraging digitalisation to make intermodal journeys as simple and seamless as possible, and streamline logistics).
CO2 emissions from transport in China in the APS
IEA, 2021.
China’s transport emissions, which have risen more than threefold since 2000, peak by 2030 and then drop by nearly 90% by 2060 thanks to improved efficiency and low-carbon technologies
10 Motor class represents their efficiency level. A motor of class 1 has an efficiency above 75% at 1.1 kW and 50 Hz, while a class 4 motor has an efficiency of around 87%. A variable speed drive controls the frequency and voltage provided to the motor to better control its speed and torque, improving energy efficiency.

An Energy Sector Roadmap to Carbon Neutrality in China Chapter 3: Sectoral pathways
PAGE | 115 IEA,
202
1.
Transport energy use and related emissions have surged in recent decades as mobility of people and goods has risen with growing prosperity and economic activity. The growth in passenger mobility has involved more local and short-distance trips, most of which happen within and/or around cities, and long-distance or intercity voyages, most often by train, high-speed rail, bus or plane (long-distance car travel is still rare in China). The spectacular growth in car ownership presaged a later boom among the middle and upper classes in air travel, both domestic and international. Domestic freight by inland waterway, along the coast, and by rail has expanded, but trucks still account for the bulk of freight activity, energy use and emissions.
Achieving the new carbon neutrality target will hinge on finding ways of decarbonising all the main modes of transport in China, especially motorised road vehicles that power its goods and passenger movements and that account for more than 80% of all transport emissions. Most vehicles, including two- and three-wheelers, passenger cars and light commercial vehicles, can be decarbonised relatively quickly and cost-effectively in China, mostly through direct electrification. Fuel-cell vehicles powered by hydrogen could be a commercially viable technology pathway, especially for commercial fleet vehicles and intercity passenger and freight trains. Modal shifts, including from cars to public transport and, in some cases, to non-motorised modes such as bicycles, are another solution. Eliminating emissions from heavy-freight trucks, inland shipping and aviation, where viable alternatives to fossil fuels are not yet commercially available, will take longer. For those modes, policies will need to catalyse the development and deployment of low-carbon fuels that are currently at the demonstration or prototype stage.
Passenger road transport Although passenger vehicles currently account for only 5% of China’s energy sector CO2 emissions, the share has been growing rapidly as the car fleet has expanded and would grow further without measures to curb the sale of conventional internal combustion engine (ICE) cars. With the emergence of a prosperous middle class, car ownership in China has gone from about one car per 250 residents in the early 2000s and a total of about 7 million cars on the road (Wang, Teter and Sperling, 2011) to one car per 6 residents and nearly 240 million cars today. In 2009, China overtook the United States as the world’s largest car market, with sales reaching nearly 22 million in 2020, though car ownership levels in China remain at one-quarter of US levels. As in many other countries, the share of SUVs, which usually consume more fuel, in China’s

An Energy Sector Roadmap to Carbon Neutrality in China Chapter 3: Sectoral pathways
PAGE | 116 IEA,
202
1.
vehicle sales has risen markedly in recent years, from just less than 16% in 2015 to more than 46% in 2020.11 Road congestion is a major problem in many Chinese cities, especially Beijing, Tianjin and Hangzhou, and along major intercity road arteries. Rising car use has driven up oil demand, with China surpassing the United States as the world’s largest net crude importer in 2017.
The Chinese government has sought to curb rising oil demand, CO2 emissions and air pollution from vehicles through fuel efficiency standards, pollutant emissions standards12 and support for EVs (the Chinese government uses the term “new energy vehicle” [NEV] to describe vehicles capable of being powered by fuels other than oil products). Almost all NEVs in China today are plug-in hybrids or battery EVs, though FCEVs are in the early stages of commercialisation. Despite continuing consolidation, China has more than 100 vehicle manufacturers that supply cars mostly to the domestic market. Many of them are owned or heavily supported by provincial and local governments, and several of the largest and most established state-owned groups (e.g. SAIC, Dongfeng, Beijing Automotive, Chang’an, FAW and Guangzhou Auto) have (often multiple) joint ventures with international vehicle manufacturers. China has also invested heavily in public transport modes, as well as digital solutions to encourage multimodal travel, or “smart mobility”,13 as a way of curbing the growth of road traffic, fuel use and emissions.
11 In the IEA’s database on light-duty vehicle sales, the shares of SUVs according to a globally harmonised definition of vehicle segments are 30% in 2015 and 42% in the latest year for which data are available (IEA, forthcoming). 12 China is unique in having implemented both fuel consumption and pollutant emissions standards for motorcycles, light-duty vehicles and heavy-duty vehicles. It has recently entered the fifth phase of fuel consumption standards for light-duty vehicles and the third phase of standards for heavy-duty vehicles. It also has fuel standards limiting sulphur content to 10 ppm for gasoline and diesel, as well as air quality standards. Beijing’s emissions standards for light- and heavy-duty vehicles have typically anticipated stricter limits for the rest of the country. 13 The smart mobility concept encompasses the use of big data, internet, artificial intelligence, blockchain and supercomputing technology in the transport sector. It involves the use of data to integrate transport infrastructures and modes, as well as the service network and energy network with the information network. “Super apps” such as WeChat (Tencent) and Alipay (Ant Group) allow Chinese citizens to pay for bus, metro, light rail, dockless e-bikes, taxis and ride-hailing services in one go and to plan trips tailored to their preferences and the weather using a smartphone. The same apps can be used to order and track deliveries.

An Energy Sector Roadmap to Carbon Neutrality in China Chapter 3: Sectoral pathways
PAGE | 117 IEA,
202
1.
Box 3.3 How public transport investments reduce reliance on private cars and domestic flights in China
China has invested heavily in public transport infrastructure, which has already brought enormous benefits. In the past decade alone, two-thirds of the world’s new metro lines and nearly 90% of new high-speed rail lines were built in China. These rail lines now make up three-quarters of the world total. The energy used and CO2 emitted per passenger-kilometre travelled by a car is typically at least three times that of a conventional bus and fifteen times that of a train, so these investments have curbed transport emissions enormously (IEA, 2019a; 2020b). In many cities in China, most urban transit buses are already electric. Together with the fact that the occupancy of urban and intercity buses and rail are well above global averages, this means that the energy and emissions savings from shifting travel to public transport are even bigger. In addition, such modes can move far more people, faster and using far less space than a private car. As a result, passenger mobility is far less energy-intensive than in the United States, where cars dominate: total passenger travel (measured in passenger-kilometre) is 45% higher in China than in the United States, yet energy consumption is less than half.
Urban and intercity passenger activity and energy demand in China and the United States, 2020
IEA, 2021.
Thanks to reliance on more efficient modes, domestic passenger activity in China is nearly 25% higher than in the United States, while using nearly half as much energy Continued investments in public transport, including metro rail systems, light rail, high-speed rail and electric buses, together with schemes to subsidise user fees, will be needed to ensure efficient, low-carbon mobility as the country continues to urbanise. Of particular importance, as discussed in the section below on aviation, is providing low-carbon alternatives to short-haul flights, which are far more energy- and carbon-intensive than buses or trains.

An Energy Sector Roadmap to Carbon Neutrality in China Chapter 3: Sectoral pathways
PAGE | 118 IEA,
202
1.
Achieving an early peak in emissions from passenger road transport and eliminating them entirely by 2060, as envisioned in the APS, require even stronger efforts to promote a shift in mobility from cars to other modes alongside a rapid transition to NEVs. The State Council’s release of the NEV Industrial Development Plan for 2021 to 2035 is a promising sign of the importance that the government attaches to NEVs as a means of decarbonising passenger road transport and the role of electrification in a mobility system that will be increasingly autonomous, connected and shared (State Council, 2020).
In China’s megacities, CO2 emissions reductions are driven largely though continued investments in urban rail, together with rapid electrification of 2-wheelers, cars and buses. Currently the majority of urban transit buses sold are electric. Bans on ICE motorcycles in major cities have contributed to the diffusion of their quieter and less polluting electric analogues. Integrated urban planning and development and deployment of “smart city” and “smart mobility” business models and technologies extend upon the foundation of China’s innovation in urban mobility; most of the technologies needed to achieve deep decarbonisation are already commercial or at demonstration stage.
Modal shares and cumulative CO2 emissions reductions by measure and technology maturity in surface passenger transport in China in the APS
IEA, 2021.
Notes: Emissions reductions include those in light commercial vehicles, which are used for a range of commercial activities including road freight. Maturity categories are assigned based on the detailed assessment of the technology readiness of designs presented in the IEA Clean Energy Technology Guide (IEA, 2020b). Aviation is excluded from this figure as modal shift potential for aviation is treated separately in the discussion on aviation. Pkm = passenger kilometre.
Switching to more efficient and less carbon-intensive modes, together with electrification of cars, virtually eliminates emissions from passenger transport by 2060 in the APS

An Energy Sector Roadmap to Carbon Neutrality in China Chapter 3: Sectoral pathways
PAGE | 119 IEA,
202
1.
A range of policies will be needed to drive the energy transition in China’s transport sector. Tolls on major highways, which are already high, could be increased to incentivise low-carbon and more space-efficient bus and train journeys. Decarbonising intercity road journeys will require efforts to move to zero-emissions intercity buses, including plug-in and battery electric powertrains, electric road systems for roadways with consistent and heavy bus and truck traffic, and FCEVs (see below), as well as installing fast-charging EV stations and hydrogen refuelling stations (HRSs) on major highways.
In the early 2010s, China initially relied on heavy subsidies for automakers that produced NEVs, while provincial governments offered additional subsidies that favoured local industrial champions. NEV sales did not initially meet targets due to the absence of a coherent policy and inadequate investment in battery manufacturing, vehicle innovation and recharging infrastructure (Wan, Sperling and Wang, 2015). This began to change in 2015, when the combination of central and local government policies and exemptions for NEVs on city-level vehicle registration quotas or favourable odds in vehicle registration lotteries led to a surge in EV sales. However, huge subsidies given to vehicle makers rather than NEV buyers led to some degree of gaming; it is estimated that as many as 22% of all NEVs sold through 2015 may have been “ghost vehicles” that were never actually put on the road (Wang et al., 2017).
In 2017, China revamped its NEV policies. It announced that its subsidy scheme would be made both more restrictive and targeted at vehicles according to their performance (i.e. based on electric driving range, battery pack rated energy density and vehicle efficiency) and would be gradually phased out. It also coupled NEV sales mandates with its fuel consumption standards in the “dual credits” scheme, comprising a NEV mandate and fuel economy standard. Original equipment manufacturers (OEMs) are mandated to produce a specific percentage of NEVs in their total annual production, and to meet fuel economy standards. Credits are awarded based on NEV sales volumes, and calculated based on vehicle efficiency, battery capacity and electric driving range. Credits effectively relax the stringency of fuel economy standards that each OEM is required to meet. To comply with the scheme, OEMs can buy surplus credits from each other. In 2020, EV subsidies were reduced and conditions for obtaining them made more stringent, with their complete phase-out set for 2023. The national subsidy scheme for FCEVs was discontinued from the end of April 2020 and replaced by rewards-based funding for research, development and demonstration (RD&D) projects in city clusters.
The government is also promoting the development of EV recharging infrastructure. Under the Covid-19 stimulus plan, EV recharging stations are classified as a priority

An Energy Sector Roadmap to Carbon Neutrality in China Chapter 3: Sectoral pathways
PAGE | 120 IEA,
202
1.
alongside 5G and data centres, which are defined as “new infrastructure”. Following the central government’s direction, many provincial and municipal governments have announced recharging station targets in 2020. For example, Beijing announced that it would install 50 000 new public and household chargers, and Shanghai 100 000, between 2020 and 2022. These targets are generally accompanied by local government subsidies for recharging fees and operating costs.
Road freight China’s domestic cargo movements by road, rail and waterway have grown rapidly over the past two decades. The share of road freight in total freight emissions has risen from 65% 2000 to around 80% today, even though its share of freight activity (measured in tonne-kilometres) has declined from just under 40% to less than a third in 2020. Road freight emissions peaked at about 390 Mt in 2019 before dropping slightly in 2020 due to the Covid-19 pandemic. They rebounded in early 2021. Growth in freight activity is projected to continue to 2060 at a more moderate pace than in recent decades, with the share of road freight rising as the transportation of coal, primary materials and bulk commodities, which are usually shipped by rail, falls and that of high-value (and lower-density) goods, more practically moved by trucks, increases.
Freight activity and related CO2 emissions by mode in China
IEA, 2021.
Note: Air cargo accounts for less than 0.1% of activity and less than 3% of total freight emissions, and so is not shown in the left-hand side figure. The methodology for measuring road freight activity was revised in 2008 resulting in revisions to the estimates for 2000 and 2005. Sources: Freight activity from the National Bureau of Statistics of China (2021).
Road freight accounts for about one-third of total freight movements in China but for about 80% of total freight-related CO2 emissions
0
100
200
300
400
500
2000 2005 2010 2015 2020
Mt
CO₂ emissions
Road freight Freight rail Cargo shipping Air cargo
0
2
4
6
8
10
12
2000 2005 2010 2015 2019
Trilli
on to
nne-
kilom
etre
s
Freight activity
An Energy Sector Roadmap to Carbon Neutrality in China Chapter 3: Sectoral pathways
PAGE | 121 IEA,
202
1.
As with passenger road transport, decarbonising road freight will require a combination of measures to encourage shifts to less carbon-intensive modes such as rail and waterways, more efficient low-carbon fuels and powertrains such as biofuels, EVs and FCEVs, and measures to exploit systemic and operational efficiencies (e.g. using digital freight matching solutions [Xu and Peng, 2021]). Accelerating the adoption of zero-emission trucks in all operations is the main technological solution to put the sector on a low-carbon trajectory. With about 6 700 sales in 2020, China leads the world in the commercialisation of battery electric medium- and heavy-duty trucks (IEA, 2021a). Major truck makers in China have put at least 29 medium- and heavy-duty electric truck models on the market to date.14
In addition to direct electrification, there is potential for FCEVs powered by hydrogen to be deployed in heavy-duty vehicle operations, particularly over long distances. China’s FCEV market is still at a very early stage, though it is far more advanced than in any other country, with a total fleet of 3 100 FCEV trucks in operation at the beginning of 2021 (AFC TCP, 2021). Some industrial companies have also started to announce plans to purchase FCEV trucks for mining and other industrial operations. The prospects for expanding the use of these trucks will hinge on subsidy schemes and successful demonstrations under way in several parts of the country (see Chapter 4 for a detailed assessment of FCEVs).
Policy incentives, emissions standards and technological advances are needed to make zero-emissions trucks competitive with conventional diesel trucks, which are the only commercially viable option today. The costs of producing a truck in China are substantially lower than those in Europe, reflecting lower materials and labour costs. The purchase price of a diesel truck can be less than half of that in Europe, making it hard for new powertrains to compete.
On the other hand, battery and electricity prices are currently lower in China, making battery and hybrid electric trucks cheaper relative to Europe. Moreover, battery electric trucks using lithium-iron phosphate chemistries can cost just over USD 100/kWh (CNY 650/kWh), reducing the costs of ownership and operation of battery electric trucks to nearly USD 0.6/km (CNY 3.9/km). They are nonetheless still much more expensive than diesel trucks. More advanced battery chemistries designed for heavy-duty applications can cost more than USD 300.kWh (CNY 1 940/kWh).
14 The actual number of available models is likely to be higher, as there are still a number of smaller truck makers in this yet-to-be-consolidated industry. The majority of these models are battery electric, but a few are plug-in hybrid or fuel-cell electric trucks.

An Energy Sector Roadmap to Carbon Neutrality in China Chapter 3: Sectoral pathways
PAGE | 122 IEA,
202
1.
FCEV trucks are even more costly as many of the components continue to be produced by foreign manufacturers (though fuel cell stacks and systems are assembled domestically).15 The cost of producing, delivering and dispensing hydrogen (and of manufacturing fuel cells and hydrogen tanks) is projected to drop steadily due to economies of scale, making FCEV trucks a more competitive option for trucks that reliably travel more than 500 km/day than electric trucks in the longer term in the APS, on the condition that the associated refuelling infrastructure is heavily utilised to spread the high costs of building, operating and maintaining it.
Total cost of ownership of heavy-duty trucks in China and Europe in the APS
IEA, 2021.
Notes: BEV = battery electric vehicle; HEV = hybrid electric vehicle; LFP = lithium iron phosphate. Current electricity prices are assumed to remain unchanged for the sake of simplicity and comparability. The cost of batteries is assumed to reach USD 60/kWh (CNY 390/kWh) and fuel cells USD 60/kW (CNY 390/kW) in 2060. Low utilisation of infrastructure (clear yellow boxes) illustrate cost increases that would result from suboptimal use of hydrogen refuelling stations or battery charging – at one-third of baseline estimated utilisation rates for FCEVs in today, and half of these estimates for BEVs today and BEVs and FCEVs in 2060.
Zero-emission vehicles struggle to compete on the basis of total cost of ownership today, but technology learning and economies of scale bring down the costs of producing and operating them in the APS
There were more than 100 stations operating in China in mid-2021 (Nengyuanjie, 2021). With targets at the provincial and local government levels, and several companies making pledges to build more, that number will increase rapidly in the coming five years. Like EV recharging points, HRSs are listed as “new infrastructure” under China’s post-Covid stimulus plan, leading many provinces
15 Chinese manufacturers are currently developing domestic manufacturing capacity for all components of fuel cells, including bipolar plates, membrane electrode assembly and proton-exchange membranes, and others needed to integrate fuel cell systems into vehicles. China aims to become a state-of-the-art producer of FCEV components as it is for lithium ion (Li-ion) batteries. In order to accelerate this process, the Chinese government is providing direct subsidies to domestic producers.
0.0
0.4
0.8
1.2
1.6
Europe China Europe China Europe China DieselHEV
FCEV BEV(500 km)
Diesel ICE FCEV BEV(500 km)
Today 2060 - China
USD
/km Low utilisation of infrastructure
Refuelling / Charging
Electricity / Fuel
Operations and maintenance
ICE Engine / Battery / Fuel cell
LFP battery
Base vehicle + Minor components

An Energy Sector Roadmap to Carbon Neutrality in China Chapter 3: Sectoral pathways
PAGE | 123 IEA,
202
1.
and cities to set new HRS targets. For instance, to support its plan to boost the FCEV fleet to 10 000 by 2025, Beijing announced that it would increase the number of HRSs in the city from 3 at present to 37 in 2023 and 74 in 2025. In total, provincial governments have targeted over 830 hydrogen refuelling stations by 2025.
Most HRSs today are built either by hydrogen producers or FCEV manufacturers and operators. The pace of construction will be accelerated by the entrance of traditional energy companies, a process that has already begun. Sinopec, the state-owned oil company, which operates China’s largest petroleum retail network, recently announced that it aims to build 100 new HRSs in 2021 by upgrading its petrol stations, in addition to the 10 it already operates. The company, which is among the largest hydrogen producers in China, is targeting 1 000 stations in 2025.
The rapid deployment of NEV trucks accounts for most of the reduction in emissions between 2020 and 2060 in the APS. The share of NEVs in the heavy-duty truck fleet grows from almost zero today to nearly 20% in 2030 already – over three times the rate of growth of EV passenger cars over the past decade in China and roughly that of Finland. Reduced activity and improved operational efficiency due to improved logistics account for the rest of the emissions reductions.
Share of heavy-duty trucks activity by mode and related CO2 emissions reductions by measure and technology maturity in China in the APS
IEA, 2021.
Notes: Logistics and operational measures include measures to maximise vehicle capacity utilisation (such as backhauling, digital freight matching and others), reduce mileages (e.g. through real-time route optimisation) and improve operation efficiency (e.g. through night-time deliveries). For more on such measures, see The Future of Trucks (IEA, 2017). The figure focuses on the technologies and measures needed to achieve emissions reductions in medium- and heavy-duty trucks. Maturity categories are assigned based on the detailed assessment of the technology readiness of designs presented in the IEA Clean Energy Technology Guide (IEA, 2020b). ICE = internal combustion engine.
Decarbonising road freight hinges on the rapid deployment of zero-emissions trucks and the roll-out of fast electric recharging and HRSs

An Energy Sector Roadmap to Carbon Neutrality in China Chapter 3: Sectoral pathways
PAGE | 124 IEA,
202
1.
Maritime shipping Reducing CO2 emissions from shipping and aviation is one of the hardest tasks facing policy makers in all countries.16 In both sectors, the long distances travelled require a large amount of energy that must be dense enough so as not to take up too much room or weight on board; electric batteries using the most advanced technologies currently available are viable only for short distances and small-scale operations. Biofuels are currently the only low-carbon alternative to petroleum-based fuels, but they will probably be able to play only a limited role in meeting energy needs given global constraints on land availability for growing the biomass feedstock. Curbing emissions in those sectors will therefore hinge on developing and commercialising new low-carbon technologies and fuels.
Tackling emissions from maritime shipping is particularly important in China: of the world’s 50 busiest ports carrying container traffic, 16 are Chinese. More than one-quarter of the world’s container traffic moves through these ports, up from about 18% at the turn of the century. In the APS, CO2 emissions from international shipping in China rise to a peak of just under 145 Mt in 2030 – up from 120 Mt in 2020 – and then fall steadily to around 30 Mt in 2060, thanks to a slowdown in freight volume and advances in the energy efficiency of ship motors (which together lower energy needs) and switching to biofuels and other low-carbon fuels. Oil-based fuels, mainly fuel oil and diesel, still meet over one-quarter of the sector’s total energy needs in 2060, down from almost complete dependence on these fuels today. Ammonia derived from low-carbon hydrogen becomes the leading fuel after 2050, accounting for almost 40% of energy use in 2060, with biofuels providing another fifth. Hydrogen used in fuel cells provides about 10%.
16 This section covers international maritime shipping (and the next section international commercial aviation) in addition to domestic activities, despite the fact that the former are not covered by China’s carbon neutrality target.

An Energy Sector Roadmap to Carbon Neutrality in China Chapter 3: Sectoral pathways
PAGE | 125 IEA,
202
1.
Energy consumption and CO2 emissions in international shipping in China in the APS
IEA, 2021.
Note: International shipping activity, energy use and emissions are allocated by attributing half of incoming international shipping trips into Chinese ports and half of outgoing trips.
Emissions from international shipping decline by around 75% by 2060, driven mainly by switching to low-carbon ammonia, which becomes the dominant fuel after 2050
China is already starting to develop new low-carbon technologies for shipping. Efforts to develop and commercialise hydrogen fuel cell ships are currently focused on medium-sized ships with power ratings below 1 MW. The Wuhan-based Troowin proton-exchange membrane fuel cell supplier was granted the first fuel cell product approval by the China Classification Society in January 2021. The next phase will be to test a purpose-built 2 100 DWT (Dead Weight Tonnes) bulk carrier powered by four 130 kW hydrogen fuel cells. In addition, the world’s first ammonia fuel-ready vessel (a Suezmax tanker of about 160 000 DWT) is under construction at a Chinese shipyard for a Greek ship owner. Three Chinese harbours – Nanjing, Caojing and Zhanjiang – have ammonia terminals with overall storage capacity of around 120 kt. With some modifications, these terminals could be used to refuel vessels powered by ammonia ICEs. China already has six harbours with power supply facilities for cold ironing – the provision of shoreside electrical power to a ship at berth while its main and auxiliary engines are turned off.
The rapid adoption of technologies needed to reduce domestic and international shipping emissions envisioned in the APS hinges on the installation of ammonia bunkering facilities. The highest priority will need to be given to Shanghai,

An Energy Sector Roadmap to Carbon Neutrality in China Chapter 3: Sectoral pathways
PAGE | 126 IEA,
202
1.
Shenzhen and Nanjing – three of the main ports – as they are among the dozen main ports worldwide that will need to lead the transition to ammonia as a low- and eventually zero-emissions substitute for oil-based fuels. China also needs to build power supply facilities for cold ironing and hydrogen bunkering facilities to service ferries, cruise ships and domestic freight ships that switch to electricity and fuels cells. Rigorous policies will be needed in China and elsewhere, including under the International Maritime Organization, to drive these investments.
Aviation The take-off of activity in commercial passenger aviation in China lagged behind personal car ownership, but has increased even more rapidly in recent years. Domestic travel alone, measured by passenger-kilometres, increased about fivefold in the 15 years to 2019. As a result of reduced air travel during the Covid-19 pandemic, domestic air travel in China exceeded that of the United States for the first time in 2020. Prior to the pandemic, China had the world’s second-busiest airport (Beijing Capital), the eighth (Shanghai Pudong) and the eleventh (Guangzhou Baiyun). Domestic air travel dropped somewhat in 2020 but is rebounding strongly and is likely to exceed the 2019 record level in 2021. Although the contribution of domestic aviation to China’s total energy sector CO2 emissions remains small, at around 0.7%, it is growing rapidly and, in the absence of efforts to rein back growth, will undoubtedly continue to do so in the years to come.
Domestic air travel in China and the United States and rail travel in China
IEA, 2021.
Notes: HSR = high-speed railways. United States intercity rail travel is not shown as volumes over the time period shown are well under 40 billion passenger-kilometres annually. Activity has been allocated between conventional and HSR based on the definition of HSR as having an operational cruising speed of at least 250 km/hour. Sources: IEA Mobility Model (August 2021 version); United States Bureau of Transport Statistics (2021); IATA (2020); ICAO (2019).
Domestic air travel grew around fivefold in the 14 years to 2019, though both intercity and high-speed rail travel remain more significant
0.0
0.2
0.4
0.6
0.8
1.0
1.2
1.4
2005 2007 2009 2011 2013 2015 2017 2019
Trilli
on p
asse
nger
-kilo
met
res
China, HSR
China, conventional rail
China, domestic aviation
US, domestic aviation

An Energy Sector Roadmap to Carbon Neutrality in China Chapter 3: Sectoral pathways
PAGE | 127 IEA,
202
1.
The main measure that has limited the rise in aviation emissions to date in China is massive investment in HSR infrastructure, which is an affordable and convenient competitor to domestic flights of less than 1 200 km. HSR travel has grown in parallel with air travel in recent years. While not all HSR lines have been built to connect major population centres, and hence are not guaranteed to service consistent ridership between major urban centres (Pike, 2019) – a prerequisite for paying off the “carbon debt” of steel- and cement-intensive rail lines – we estimate that the development of the HSR network has reduced CO2 emissions by 250 Mt in cumulative terms over the past decade, or about two and a half times the total domestic and international aviation emissions of China in 2019.17
As part of its economic and industrial policy, the Chinese government is cultivating a domestic aviation industry. It plans to continue building new airports, with 30 scheduled to begin operations in 2021-2025 and 209 more due to be commissioned before 2035, nearly doubling their current number. The government is also backing a domestic aircraft maker – the publicly owned Commercial Aircraft Corporation of China (COMAC) – in the hope that it will eventually rival Airbus and Boeing. It has already developed three commercial jets: the short- to mid-range ARJ21, which is already in commercial operation, and the longer-range CR919 and C929.
Start-ups in China have recently joined the ranks of innovators investing heavily in RD&D in electric and hydrogen aircraft. Researchers at COMAC’s Beijing-based Dream Studio piloted a test flight of a small hydrogen-powered aircraft in 2019, and a larger model prototype, the ET480, which uses Li-ion batteries and fuel cells developed by the State Power Investment Corporation, was launched in 2021.
CO2 emissions from domestic aviation grow through to 2030, after which they start to fall back through a combination of efficiency improvements, continuing shifts to HSR and conventional rail, and the adoption of sustainable aviation fuels (SAFs) 18 in the APS. To achieve these long-term emissions reductions, China will need to reconcile its ambition of developing its aviation industry with its climate policies. As in other countries and with the International Air Transport Association (IATA) targets, the emissions and fuel intensity targets set by China’s Civil Aviation Industry Authority and in recent FYPs have consistently been exceeded as a result
17 This estimate is derived by assuming that passengers using HSR would have made the same trips by car, bus or air, and for the sake of simplicity and comparability with the rest of the emissions reported here, uses the weighted average direct (i.e. tank-to-wheel) carbon intensity based on the annual shares of car, bus and air travel, using the IEA Mobility Model. 18 SAFs include biofuels derived from a range of feedstocks and production pathways, as well as synthetic fuels (using hydrogen together with CO2 from either atmospheric or biogenic sources). They can be blended into fossil-derived jet kerosene used by commercial aircraft.

An Energy Sector Roadmap to Carbon Neutrality in China Chapter 3: Sectoral pathways
PAGE | 128 IEA,
202
1.
of efficiency improvements driven as much by the need to reduce fuel costs and maximise profits. The status of the Chinese government’s commitment to the voluntary pilot phase (2021-2023) and first phase (2024-2026) of the Carbon Offsetting and Reduction Scheme for International Aviation (CORSIA) scheme by the International Civil Aviation Organization (ICAO) is still unclear. The government has also not yet announced specific measures to cut aviation-related emissions,19 but some national-level policy directives have emphasised the need to promote RD&D and the adoption of SAFs. Domestic aviation has also been identified as one of the energy-intensive sectors to be covered by the national ETS (it has already been included in the Guangdong pilot ETS project), though the timeline and design of the ETS expansion to these sectors has yet to be determined.
Share of aviation final energy demand by fuel and related CO2 emissions reductions by measure and technology maturity in China in the APS
IEA, 2021.
Note: Maturity categories are assigned based on the detailed assessment of the technology readiness of designs presented in the IEA Clean Energy Technology Guide (IEA, 2020b).
Reduced demand by taxing air travel and shifting travel to railways limits the rise in emissions to 2030, while efficiency gains and large-scale deployment of sustainable aviation fuels drive down emissions in the longer term
19 China’s GHG Voluntary Emission Reduction Program was approved in 2020 as one of the six eligible carbon-offsetting programmes for compliance with CORSIA, the scheme adopted by the ICAO to offset and reduce emissions from international aviation.

An Energy Sector Roadmap to Carbon Neutrality in China Chapter 3: Sectoral pathways
PAGE | 129 IEA,
202
1.
Buildings Energy use and emissions from buildings in China have grown more in absolute terms than in any other country in recent decades in line with urbanisation and rising incomes, especially since the turn of the century. China accounted for more than 17% of global final energy consumption and nearly 25% of CO2 emissions (direct and indirect) in buildings in 2020. Buildings contributed around 20% of China’s total emissions – about 25% from direct use and 75% from the indirect use of fossil fuels in providing heat and electricity consumed in the sector. Despite growing demand for energy services in buildings, per capita consumption is still more than 70% lower than in the United States, and around 45% lower than in Europe and Japan. Demand for energy services has risen in parallel with increasing dwelling size, with residential floor area jumping from less than 20 m2 per person in 2000 to more than 35 m2 in 2020 – close to the European average.
Residential properties dominate total final energy use in buildings, reaching around 18 EJ in 2020, or about 80% of the total; the remaining 5 EJ is consumed in commercial and public buildings. Climatic conditions vary enormously across the country, significantly affecting energy needs for heating and cooling. China’s buildings energy standards identify five climate zones, and around 5% of China’s population live in areas needing mainly cooling and about 15% in areas needing mainly heating, while the remaining 80% require both heating in the winter and cooling in the summer.20 Nationally, space and water heating are responsible for nearly 60% of final buildings energy consumption, followed by cooking (14%), electrical appliances and devices (14%), space cooling (7%), and lighting (5%).
The leading fuel in the sector is electricity, covering more than 35% of buildings final energy use – nearly two and half times the share in 2010. China has contributed about 60% of the global growth in electricity use in buildings worldwide over the last decade. Bioenergy is the next most important fuel in buildings, meeting 15% of the sector’s energy needs, down from just over 30% in 2010. It is used mostly for cooking, but also for space and water heating – predominantly in the form of traditional biomass in rural buildings. The amount of traditional biomass used in buildings has fallen by about 60% since 2000, thanks to policy efforts to increase indoor air quality. The direct use of coal has also fallen sharply in recent years, especially since the introduction of measures to promote switching to electricity and natural gas, and the 2017 Clean Winter Heating Plan, but the fuel still accounts for more than 10% of buildings final energy consumption. Oil and gas hold similar
20 Areas needing mainly cooling is defined as cooling degree days above 5 000 with a base temperature of 10°C and areas needing mainly heating as heating degree days above 5 000 with a base temperature of 18°C. (IEA, 2020c).

An Energy Sector Roadmap to Carbon Neutrality in China Chapter 3: Sectoral pathways
PAGE | 130 IEA,
202
1.
shares of about 10%, that of oil increasing slightly and that of gas more than doubling over the last decade, displacing coal as well as traditional biomass.
The direct use of modern renewables in buildings has also grown significantly in recent years. With more than 70% of global solar collectors capacity cumulatively installed in the country since 2013, China is the world’s leading market for solar thermal collectors, which cover nearly 6% of total buildings energy needs (Huang, Tiang and Fan, 2019). District heat is an important source of energy for space heating, especially in the north, where it has grown sixfold since 2000, accounting for around 8% of total final energy consumption in buildings across the country in 2020. District heat, natural gas and electricity are more commonly used in urban areas.
The rapid transformation of the fuel mix in buildings in recent decades has helped to temper the growth in direct CO2 emissions, though the heavy reliance on coal for generating electricity and district heat has led to a big increase in indirect emissions. Direct emissions increased by around 7% between 2010 and 2020 to about 520 Mt, but indirect emissions increased by more than 70% to 1.6 Gt.
Achieving carbon neutrality in Chinese buildings will be made harder by continued growth in the stock of buildings and floor area. While population is expected to stabilise in the next few years and then fall slowly after 2030, economic growth, increasing per capita floor area and dwelling unit size, and urbanisation will continue to drive construction. In the APS, total buildings floor space is projected to expand by about 40% between now and 2060, reaching nearly 90 billion m2 – which represents more than 10% of the global increase in floor area. Despite the projected increase in floor area and the on-going increase people’s living standards, energy use in buildings levels off in the next few years and then falls back in that scenario, mainly because of improvements in the thermal efficiency of building envelopes that reduce energy needs for heating and cooling, as well as improved efficiency of heating and cooling equipment and appliances. Overall buildings energy intensity falls by 30% between 2020 and 2060.

An Energy Sector Roadmap to Carbon Neutrality in China Chapter 3: Sectoral pathways
PAGE | 131 IEA,
202
1.
Energy consumption and energy intensity index in buildings in China in the APS
IEA, 2021.
Notes: Energy intensity refers to energy consumed per unit of floor area.
Despite the growing demand for services, energy use in buildings starts to fall back in the late 2020s thanks to efficiency improvements in all building end uses
Switching to electricity, alongside major improvements in the efficiency of electrical appliances and equipment, also helps to curb demand. The increased uptake of heat pumps drives the average efficiency of the space heating equipment stock to 110% by 2030 and to more than 150% by 2060 in the APS. In addition, despite an additional 150 million more households using air conditioners in 2060 compared with today, passive building envelope measures combined with improved air conditioner energy performance mean that electricity demand for space cooling in 2060, at around 490 TWh, just 15% above 2020 levels (425 TWh). However, the fall in energy use for space and water heating, lighting, and cooking is partially offset by increased electricity demand for appliances, which almost doubles over 2020-2060.
Increased ownership of appliances and electrical equipment in homes and offices, including the ones still uncommon today such as dishwashers and dryers, is a major driver of the increased share of electricity in buildings energy use through to 2060. Those appliances and equipment, nonetheless, become progressively more energy efficient. By 2030, over 50% of appliances on sale have efficiencies that are comparable on average to existing best available technologies. This share jumps to 100% in 2040. All light bulbs are LEDs from 2030. Minimum energy performance standards (MEPS) are complemented by requirements for smart controls to optimise the operation of appliances and to allow demand response to further shave peaks in electricity demand. Nearly 1000 PJ, or the equivalent of all lighting
0
20
40
60
80
100
0
5
10
15
20
25
2020 2025 2030 2035 2040 2045 2050 2055 2060
Inde
x (2
020
= 10
0)EJ
Other
Appliances
Cooking
Lighting
SpacecoolingWaterheatingSpaceheatingEnergyintensity

An Energy Sector Roadmap to Carbon Neutrality in China Chapter 3: Sectoral pathways
PAGE | 132 IEA,
202
1.
consumption in China today, is saved from appliances and lighting in 2060 thanks to efficiency gains. This requires government working with manufacturers and utilities to deploy new measures and standards which enable buildings equipment and the electricity grid to interact.
Total CO2 emissions from buildings are eliminated by the second half of the 2050s in the APS thanks to the phasing out of fossil fuels in direct uses and the complete decarbonisation of power and heat generation. Direct emissions already peaked by the mid-2010s in both the residential and services sectors and together drop by a quarter between 2020 and 2030, and by more than half by 2040. Indirect emissions, which peak soon after 2020, fall even faster over the projection horizon: by more than 80% by 2040 relative to today, due to the combined effect of building energy efficiency and power sector decarbonisation.
Direct and indirect CO2 emissions in buildings by subsector and buildings consumption by fuel in China in the APS
IEA, 2021.
CO2 emissions from buildings are eliminated by the second half of the 2050s in the APS as fossil fuels in direct uses are phased out and power and heat generation are decarbonised
The accelerated electrification of energy use in buildings is the main driver of reduced emissions in buildings in the APS. The share of electricity in total buildings energy use reaches nearly 60% in 2060 with increased use for heating, cooking and electrical appliances. More than half of total space heating demand is met by electric heat pumps in 2060. In addition, the share of electricity in energy use for cooking almost doubles to around 15% by 2030 and reaches 50% in 2060. The contribution of solar thermal and geothermal energy also grows significantly, their combined share of final energy consumption reaching around 15% in 2060, nearly doubling relative to 2020 levels. The direct use of fossil fuels in buildings falls after
0.5
1.0
1.5
2.0
2.5
2020 2025 2030 2035 2040 2045 2050 2055 2060
GtC
O2
Non-residential (indirect) Non-residential (direct)Residential (indirect) Residential (direct)
CO2 emissions Final energy
5
10
15
20
25
2020 2060
EJ
Coal OilGrid gas HydrogenElectricity District energyRenewables Traditional biomass

An Energy Sector Roadmap to Carbon Neutrality in China Chapter 3: Sectoral pathways
PAGE | 133 IEA,
202
1.
2025 and is completely phased out by 2060. Gas use drops to just 4% in 2060, all of which is low-carbon by then. Thanks to their higher efficiencies compared with traditional gas boilers, gas-fired and hybrid heat pumps help to curb overall gas consumption, especially in the colder northerly parts of the country. Low-carbon district heating networks remain a significant source of space and water heating, their share of heat provision reaching nearly 20% by 2030, remaining broadly constant through to 2060.
Switching to clean modern energy in rural households forms part of the transition to net zero emissions in China’s buildings sector. The use of inefficient stoves relying on traditional biomass is eliminated before 2030, mainly thanks to a shift to distributed solar PV combined with electric pressure cookers. Biogas produced from biomass in digesters and used in more efficient stoves, together with electricity, becomes the dominant cooking fuel later. Modern bioenergy meets nearly 1% of overall residential space heating demand and 35% of cooking energy needs in 2030, and 10% of overall residential space heating demand and nearly 50% of cooking energy in 2060.
This transformation of energy use in buildings is mostly achieved by using technologies that already exist today, such as heat pumps, efficient buildings design and materials, and renewables, though incremental improvements in performance are needed. Around two-thirds of the emissions reductions in buildings to 2060 are obtained from technologies already mature or at the early adoption stage. Technologies at the demonstration and prototype stage account for the rest, mainly after 2040. The greatest need for innovation is in boosting the efficient operation of heating equipment in cold climates and multifamily buildings, deploying demand-side response as well as integrating energy storage into buildings, grid balancing and efficient climate-friendly cooling equipment. New business models will also be essential to encourage more building retrofits and make appliances and equipment responsive to real-time price signals.

An Energy Sector Roadmap to Carbon Neutrality in China Chapter 3: Sectoral pathways
PAGE | 134 IEA,
202
1.
Share of building CO2 emissions reductions by maturity category and end use in China in the APS
IEA, 2021.
Note: Maturity categories are assigned based on the detailed assessment of the technology readiness of designs presented in the IEA Clean Energy Technology Guide (IEA, 2020b).
Nearly 90% of the emissions reductions in buildings to 2030 come from existing technologies, but full decarbonisation of building end uses requires new designs
Zero-carbon-ready buildings Policy action will be crucial in driving the development and deployment of ultra-low-energy and low-carbon buildings. Stricter building energy standards and codes to improve the design of buildings and the performance of building envelope technologies, and make them amenable to switching to low-carbon fuels, play a central role in the APS. They progressively require zero-carbon-ready buildings, which are highly energy efficient and resource efficient, and either use renewable energy directly or are conceived to rely on zero carbon in 2060.21 Improvements to the building envelope – of existing and new buildings – is a key first step towards zero-carbon-ready buildings. There are a broad variety of ways of achieving this depending on climate, from high insulation and airtightness in cold climates to ventilation and shading in warmer climates. Lowering building energy needs helps to reduce overall peaks in heating and cooling demand and, therefore, the need to install capacity to meet those needs in both buildings themselves and in power and heat generation.
Retrofits – structural changes to an existing building or system within it to improve its energy performance – will be particularly important in China because
21Zero-carbon-ready buildings energy codes focus on building operations as well as emissions from the manufacturing of buildings construction materials and components, and include measures which facilitate the decarbonisation of the broader energy system. For instance, such measures include connectivity, automation and energy storage to manage electricity demand (IEA, 2021c).
0%
20%
40%
60%
80%
100%
2030 2060 2030 2060 2030 2060Heating Cooling Other
PrototypeDemonstrationMarket scale-upMature

An Energy Sector Roadmap to Carbon Neutrality in China Chapter 3: Sectoral pathways
PAGE | 135 IEA,
202
1.
most of the building stock is very recent and will be around for a long time (though demolition rates are higher than in Europe and the United States). The existing building stock is relatively young, at around 15 years on average, the result of a tripling of the building stock over the last three decades. Of the 63 billion m2 of floor area in China today, nearly half will probably still be standing in 2050. At present, under 0.3% of buildings are retrofitted each year, but this number is growing since 2010. In the APS, thanks to policies that encourage the development and deployment of replicable retrofit packages,22 nearly all buildings still standing are renovated to zero-carbon-ready levels by 2060.
Building energy standards and codes for new buildings need to incorporate zero-carbon-ready requirements to ensure that buildings built today are able to produce no emissions in the future. In the APS, as a result of these codes and retrofits, nearly all floor area in China is zero-carbon-ready in 2060, leading to a reduction in final energy intensity – or the final energy consumed per square metre – of more than 65% for heating and more than 45% for cooling between 2020 and 2060.
Buildings floor area and final energy intensity index for space heating and cooling in China in the APS
IEA, 2021.
Notes: ZCRB = zero-carbon-ready buildings. Energy intensity of heating/cooling is measured as ratio between the final energy consumption and the heated/ cooled floor area. Compliant buildings are those that comply with building energy codes in place today.
Accelerated retrofits and the construction of new zero-carbon-ready buildings reduce the energy intensity of heating by over 65% and cooling by 45% in 2060
22 For instance, in Europe, Energiesprong is a progressive whole-house approach to retrofitting homes with the aim of limiting the impact on buildings inhabitants and being replicable on a large scale. The approach has been adopted in the United Kingdom, France, Germany and northern Italy and similar initiatives are under way in both New York and California. With the standardisation of construction, modular and replicable retrofit packages can lower costs and increase retrofit rates.
0
20
40
60
80
100
0
20
40
60
80
100
2020 2030 2060
Inde
x (2
020
= 10
0)
Billio
n m
² Other
Compliantbuildings
ZCRB
Retrofit ZCRB
Heating
Cooling
Intensity (right axis):

An Energy Sector Roadmap to Carbon Neutrality in China Chapter 3: Sectoral pathways
PAGE | 136 IEA,
202
1.
Heating and cooling Heating and cooling accounted for 65% of total buildings energy consumption in China in 2020. Heating needs are concentrated in two main areas: northern China, where district heating is the main source of heat (floor area covered by district heating networks has nearly quadrupled since 2000); and central regions with moderate climates (such as the Yangtze River Basin) where demand for space heating is lower but growing rapidly and where heat pumps can play an increasingly important role.
The decarbonisation of heating in China in the APS hinges on a combination of switching to low-carbon fuels and energy efficiency improvements to lower the underlying need for heat. Sales of coal and oil boilers installed in buildings or used for district heating, together with sales of gas heating equipment that is not compatible with hydrogen, are completely phased out by 2035. While an overwhelming majority of new buildings rely on electric heat pumps, this technology also makes inroads in existing buildings, as a substitute for fossil fuel boilers. They meet 14% of total space and water heating consumption (or nearly 45% of heating needs) in 2060. The contribution of renewables (including solar thermal systems, geothermal heat pumps, modern biomass stoves and boilers) to meet heating demand rises from around 20% to nearly 50% in 2060 and that of new hybrid systems that integrate solar PVs with heat pumps exceed 0 million units by 2060. Market penetration of hydrogen boilers and fuel-cell micro co-generation units is limited, taking off in the late 2020s, and fulfils about 5% of heating consumption by 2060. District heating based on low-carbon fuels remains an important source of heating; its share grows from 13% in 2020 to more than 20% in 2060.
Reducing energy losses in district heating and integrating buildings efficiency measures into district heating programmes help to lower indirect emissions. In many cases, district heat is distributed to buildings located far from production sites – sometimes tens of kilometres away – to fully exploit excess heat from industrial processes, waste incineration, as well as fossil, biomass and nuclear power plants. Losses tend to increase with distance. Innovations in distribution pipes, hydronic systems (which use a water solution usually mixed with glycol as the heat-transfer medium) and advanced heating management measures contribute to lower losses and higher heating efficiency in the APS. As long-distance district heat infrastructure is long-lived, the integration of buildings and networks needs to be carefully planned at both the district and city scales, taking account of the future electricity generation mix and availability of waste heat.

An Energy Sector Roadmap to Carbon Neutrality in China Chapter 3: Sectoral pathways
PAGE | 137 IEA,
202
1.
Demand for energy for space cooling in China has increased faster than anywhere else in the world since 2000, rising from 150 PJ to 1 530 PJ in 2020 – an average rate of about 2.5% per year. Cooling now accounts for about 7% of total final energy demand in buildings. Space cooling is mostly provided by individual air-conditioning units, though collective building systems and district cooling networks are common in urban areas in the south. The city of Guangzhou operates one of the world’s largest district cooling systems. Cooling places enormous demands on the electricity system, accounting for 16% of the national peak in demand nationwide on average in 2020 and more than half on extremely hot days (IEA, 2019b).
Air conditioning will inevitably increase with the rising temperatures that climate change will bring and rising affordability with higher household incomes. In the APS, household ownership of at least one unit grows from 70% today to 85% in 2030, more than 90% in 2050. China manufactures 70% of all the room air conditioners sold in the world, 60% of which currently supply the domestic market. The potential of the industry to innovate and improve their energy efficiency is enormous. Gree, a leading Chinese manufacturer, recently won the Global Cooling Prize with a technology that integrates advanced vapour compression cycles, evaporative cooling, ventilation and renewable energy sources.
The growth of electricity consumption for space cooling is limited in the projection horizon in the APS, thanks both to improved building envelopes (see above) and increased air conditioner efficiency and flexibility, driven largely by more stringent MEPS. Already by 2030, the seasonal energy efficiency ratio – the cooling output during a typical cooling season divided by the total electricity input during the same period – increases by one-third compared with 2020 and almost doubles by 2060. This yields cumulative savings of 26 EJ – more than three times all the electricity consumed in buildings in China in 2020.

An Energy Sector Roadmap to Carbon Neutrality in China Chapter 3: Sectoral pathways
PAGE | 138 IEA,
202
1.
Space heating equipment sales by type and average energy efficiency of space heating and cooling equipment sold in China in the APS
IEA, 2021.
Notes: Other electric equipment includes hybrid heat pumps.
Increased sales of heat pumps help drive up the overall efficiency of space heating equipment, while standards underpin cooling efficiency gains
A new electricity paradigm The way electricity is supplied and used is undergoing a profound change throughout the world with the emergence and application of new technologies, including digitalisation. China is very much at the forefront of that change. Zero-carbon-ready buildings make full use of these technologies, which modify radically the way they interact with the public electricity system and patterns of electricity use within buildings. The principal changes concern the potential for auto-generation of power, mainly with rooftop solar PV panels; the use of storage devices in buildings and demand response. All of these changes are being made possible and more attractive by digital technology.
The expansion of solar PV in buildings – a form of distributed generation – reduces the need for drawing on electricity from public networks and creates opportunities for injecting surplus electricity into those networks, reducing the need for centralised generation and modifying the interaction between buildings and the electricity system. Satellite image recognition and analysis shows that about 830 GW of PV capacity could be installed on the roofs of urban buildings today (BERC, 2021a, 2021b). However, accounting for rural buildings, the growing buildings stock and modern construction practices allowing for a greater exploitation of rooftop surfaces, solar PV systems installed on buildings play a growing role in China in the APS, with capacity jumping from 80 GW today to nearly 2 200 GW in 2060. By then, almost 50% of total solar PV capacity will be integrated to buildings.
0%
25%
50%
75%
100%
2020 2060
Heating equipment sales
Coal boilers Gas equipmentOil boilers Hydrogen equipmentElectric heat pumps Other electric equipmentDistrict heat Renewable equipment
1.0
1.5
2.0
2.5
3.0
2020 2030 2040 2050 2060
Inde
x (2
020
= 1)
Efficiency of equipment sold
Heating Cooling

An Energy Sector Roadmap to Carbon Neutrality in China Chapter 3: Sectoral pathways
PAGE | 139 IEA,
202
1.
Growing opportunities for demand response, using advanced controls, building energy management systems and small-scale storage, including thermal storage devices connected to buildings and the batteries of EVs, will also increase interactions with the grid, holding out the promise of exploiting new revenue streams and facilitating the integration of renewables-based electricity into the power system. In 2060, demand response technologies whose effects go unnoticed by the end user are used for power regulation and short-time scale turn-offs. In addition, China’s light-duty EV stock reaches 350 million in 2060, representing an electrochemical storage capacity of around 25 TWh. Part of that capacity is used to absorb surplus solar power generated in buildings or centrally (vehicle from grid, or V1G) or make up for short-term shortfalls in power (vehicle to grid, or V2G), using a technology known as unilateral controlled charging. To put that into perspective, the average daily electricity use by buildings in winter is just over 10 TWh in 2060 in the APS.
DC power distribution and energy management systems present further opportunities with respect to electricity use in buildings. The installation of solar PV systems and the growth of DC appliances (e.g. LEDs, electronics and heat pumps) and battery storage, which store DC power, make it feasible to convert entire buildings to run fully on DC electricity, as self-consumption reduces the need for alternating current (AC) power supplied from the grid. At present, buildings are supplied with AC power, and the conversion to DC occurs at the appliance level. The main advantage of DC systems is that it avoids conversion losses, which in total range from 10% to 20% depending on the converters used in the electricity distribution system and appliances. DC systems could also facilitate demand response in buildings, as DC appliances could respond dynamically to changes in voltage which reflect requirements from the grid to increase or decrease the end-use consumption at a given point in time. Ensuring the mass manufacturing of DC appliances alongside international standardisation is a prerequisite to make such systems viable at scale.

An Energy Sector Roadmap to Carbon Neutrality in China Chapter 3: Sectoral pathways
PAGE | 140 IEA,
202
1.
Schematic of a direct current electricity distribution and management in buildings
IEA, 2021.
Direct current buildings make use of solar PV systems, producing direct current, to power DC appliances and storage devices avoiding the need for current conversion
Assuming rooftop solar PV installations are sized to meet no more than the peak demand of each district-level DC system, about 60% of total buildings PV generation is consumed directly by buildings in China in 2060 in the APS. It would mean that the remaining 40% would either need to be sent back to the AC grid or to local distributed energy storage devices. Allowing market access for DC appliances and promoting innovative business models where aggregators or retailers own and manage consumer-sited grid assets would help regulate power systems at a lower cost and improve distribution systems resiliency. In China, in 2060 under the APS, it represents a daily opportunity for 2 000 to 3 000 GWh of surplus of electricity to manage.
EVs could be a prominent market player, but not all the battery capacity could be used to store the electricity generation surplus. First, only vehicles idling on a DC grid and not fully charged can participate. Vehicles not participating in V2G services have a limited margin for participation, corresponding to average daily

An Energy Sector Roadmap to Carbon Neutrality in China Chapter 3: Sectoral pathways
PAGE | 141 IEA,
202
1.
electricity use for transport, or roughly 15% of the on-board battery capacity. However, if EV batteries are also discharging electricity to other loads in the DC grid, their capacity to store excess rooftop solar PV generation would grow. Around 40% of the EV fleet would be enough to absorb all excess rooftop PV production in the spring and the fall, and 25% in summer and winter. Therefore, the combination of DC systems, distributed PV, EVs and energy storage could not only foster the deployment of renewable electricity production, but also facilitate its integration to power systems and use by demand sectors.
Average daily solar PV generation in buildings in China in 2060 in the APS
IEA, 2021.
Note: Assumes that rooftop solar PV installations are sized to meet no more than the peak demand of each building or district DC system.
In 2060, in the APS, about 60% of building-integrated PV in China could be consumed by buildings themselves, while 40% of the EV fleet could absorb the rest – if the electricity is not directed to the grid or to other distributed energy storage devices
DC buildings are already at the demonstration stage in China. One of the most advanced projects is Shenzhen’s Future Complex building. The development of entire DC districts, combining several buildings and local distributed energy resources, is at the concept stage. Projects in rural areas are under consideration, including in Ruicheng in Shanxi province, which would involve DC microgrids and distributed solar PV to meet local daily needs for household cooking, domestic hot water and heating, as well as some agriculture machinery (Li et al., 2021).
0
1 000
2 000
3 000
4 000
GW
h
Self-consumed Surplus generation
Generation
0
1 000
2 000
3 000
4 000
0% 25% 50% 75%
GW
h
V1G only V1G and V2G
Share of vehicles participating
EV absorption capacity

An Energy Sector Roadmap to Carbon Neutrality in China Chapter 3: Sectoral pathways
PAGE | 142 IEA,
202
1.
Box 3.4 Shenzhen’s Future Complex DC building demonstration project
In Shenzhen, the Future Complex office building, completed at the end of 2020, integrates 150 kW of solar PV capacity on the rooftop, occupying a rooftop area of 1 870 m2. The compactness of the edifice makes the project replicable in multiple urban areas. It is also equipped with DC air-conditioning systems, light-emitting diodes (LED) lighting and multimedia equipment, office equipment, charging piles, and intelligent control systems. The building meets some of the zero-carbon-ready building requirements, particularly:
Energy efficiency: the building meets low-energy consumption standards. Annual electricity intensity approaches 50 kWh/m2, with annual electricity consumption under 300 000 kWh. On top of various energy efficiency measures, DC operations result in a 10-20% electricity saving from the absence of AC/DC conversion losses.
Decarbonisation of energy supply: total annual power generation is expected to be 340 000 kWh, exceeding the expected annual energy needs of the building.
Integration of renewables: DC-enabled responsiveness to changes in voltage signals allows improved adaptation of electricity load to renewable supply, reducing the connection capacity to the AC grid by 80%. Distributed storage devices are connected to a multi-voltage-level power distribution system, from 375 V for a DC bus to 48 V for most appliances.

An Energy Sector Roadmap to Carbon Neutrality in China Chapter 3: Sectoral pathways
PAGE | 143 IEA,
202
1.
References AFC TCP (Advanced Fuel Cells Technology Collaboration Partnership) (2021), AFC TCP
2021 Survey on the Number of Fuel Cell Electric Vehicles, Hydrogen Refuelling Stations and Targets, provided to the IEA (International Energy Agency) by AFC TCP.
Baowu (2018), 钢铁绿色低碳与 CCUS 的宝钢实践 [Green, low-carbon steel and CCUS practice at Baogang], November 2018, https://www.nsd.pku.edu.cn/ccus/docs/20200104145930479290.pdf
BERC (Buildings Energy Research Centre) (2021a), China Building Energy Use 2021, China Building Industry Press, Beijing.
BERC (2021b), Annual Report on China Building Energy Efficiency, China Architecture & Building Press, Beijing, http://book.cabplink.com/bookdetail.jsp?id=66111&nodeid=1439.
BloomberNEF (2021), Baofeng’s Hydrogen Electrolysis Project Stes New Records, 10 May 2021.
CEC (China Electricity Council) (2021), 中国电力行业年度发展报告2021 [China power sector annual development report 2021] https://cec.org.cn/detail/index.html?3-298428
CEC (2020), 中国电力行业年度发展报告2020 [China power sector annual development report 2020] https://cec.org.cn/detail/index.html?3-284175
CNPGN (2021), 富氢碳循环高炉工业试验工程进入冲刺阶段 [Industrial test for Hydrogen-rich Carbon Cycle Blast Furnace enters final stage], https://www.cnpgn.com/news/show.php?itemid=22915.
DEEHP (Department of Ecology and Environment of Hebei province) (2021), 关于公布河北省
第一批二氧化碳捕集利用封存试点项目的通知 [Announcement of the first batch of pilot projects for carbon dioxide capture, utilization and storage in Hebei province], http://hbepb.hebei.gov.cn/hbhjt/zwgk/fdzdgknr/tongzhigonggao/101620801515999.html.
EESIA (Energy and Environment Service Industry Alliance) (2019), 山东石横特钢集团有限公
司转炉煤气制甲酸项目 [Shandong Shiheng Special Steel Group Co., Ltd. formic acid production from Linz-Donawitz converter gas (LDG) project], http://www.eesia.cn/product/details/id/605.html.
Energy Saving of Nonferrous Metallurgy (2012), 中国钢铁行业首次实现高效利用低燃值高炉煤
气 [China's steel industry achieves efficient utilisation of low energy content blast furnace gas for the first time], DOI: CNKI:SUN:YJJN.0.2012-03-027.
Huanbao (2021), 注意!海螺、中材已经动手了!3000多家水泥厂机会来了! [Conch and Sinoma have already started! The opportunity for more than 3,000 cement plants is here!], https://huanbao.bjx.com.cn/news/20210315/1141639.shtml.
Huang, J., Z. Tiang and J. Fan (2019), A comprehensive analysis on development and transition of the solar thermal market in China with more than 70% market share worldwide, Energy, vol. 174, pp. 611-624, https://doi.org/10.1016/j.energy.2019.02.165.

An Energy Sector Roadmap to Carbon Neutrality in China Chapter 3: Sectoral pathways
PAGE | 144 IEA,
202
1.
IATA (International Air Transport Association) (2020), Air passenger monthly analysis, December 2020, www.iata.org/en/iata-repository/publications/economic-reports/air-passenger-monthly-analysis---december-2020/.
ICAO (International Civil Aviation Organization) (2019), Annual Report 2019, www.icao.int/annual-report-2019/Pages/the-world-of-air-transport-in-2019-statistical-results.aspx.
IEA (International Energy Agency) (2021a), China 14th Five-Year Plan on Renewable Energy Development: IEA perspective and suggestions. Chapter 1.
IEA (2021b), Global Hydrogen Review, forthcoming.
IEA (2021c), Net Zero by 2050, IEA, Paris, www.iea.org/reports/net-zero-by-2050.
IEA (2021d), Global EV Outlook 2021, https://www.iea.org/reports/global-ev-outlook-2021IEA
IEA Mobility Model (August 2021 version), https://www.iea.org/areas-of-work/programmes-and-partnerships/the-iea-mobility-model.
IEA (2020a), Outlook for biogas and biomethane: Prospects for organic growth, IEA, Paris https://www.iea.org/reports/outlook-for-biogas-and-biomethane-prospects-for-organic-growth.
IEA (2020b), ETP Clean Energy Technology Guide, IEA, Paris, https://www.iea.org/articles/etp-clean-energy-technology-guide
IEA (2020c), Is cooling the future of heating?, IEA, Paris, www.iea.org/commentaries/is-cooling-the-future-of-heating.
IEA (2019a), The Future of Rail, IEA, Paris www.iea.org/reports/the-future-of-rail.
IEA (2019b), The Future of Cooling in China, IEA, Paris, www.iea.org/reports/the-future-of-cooling-in-china.
IEA (2018), Technology Roadmap - Low-Carbon Transition in the Cement Industry, IEA, Paris, https://www.iea.org/reports/technology-roadmap-low-carbon-transition-in-the-cement-industry
IEA (2017), The Future of Trucks, IEA, Paris www.iea.org/reports/the-future-of-trucks.
IN-EN (International Energy Information Network-Energy News) (2021a), 全球首例氢冶金示范
工程正式启动建设! [The World's first hydrogen metallurgy demonstration project officially started construction!], https://www.in-en.com/article/html/energy-2304270.shtml.
IN-EN (2021b), 谁更高?2020年山东、江苏、广东等31省份火力发电比例数值分享 [Who is higher? Sharing of the proportion of thermal power generation in 31 provinces including Shandong, Jiangsu and Guangdong in 2020], https://power.in-en.com/html/power-2384773.shtml.
IN-EN (2019), 潞宝集团将建万吨级焦炉煤气提纯制氢示范工程 [Shanxi Lubao Coking Group will build a demonstration project for 10,000-ton hydrogen production from coke oven gas purification], https://newenergy.in-en.com/html/newenergy-2364544.shtml.
IN-EN (2012), 包钢建设焦炉煤气制甲醇项目 [Baotou Steel's coke oven gas to methanol project], https://gas.in-en.com/html/gas-1549280.shtml.

An Energy Sector Roadmap to Carbon Neutrality in China Chapter 3: Sectoral pathways
PAGE | 145 IEA,
202
1.
LanzaTech (2018), World’s First Commercial Waste Gas to Ethanol Plant Starts Up, 8 June 2018, https://www.lanzatech.com/2018/06/08/worlds-first-commercial-waste-gas-ethanol-plant-starts/.
Li, Y. et al. (2021), Key technologies of building power supply and distribution system towards carbon neutral development, Distribution & Utilization, vol. 38/01, pp. 32-38.
Liu, J. et al. (2021), Carbon and air pollutant emissions from China’s cement industry 1990-2015: Trends, evolution of technologies and drivers, Atmospheric Chemistry and Physics, vol. 21, pp. 1627-1647.
Metallurgical Information Network (2020), 国内首座2000立级大高炉规模化喷吹氢气项目在晋
南钢铁实施 [Jinnan Steel Group implement China’s first 2,000-cubic metre blast furnace hydrogen injection project], https://www.sohu.com/a/426570676_396209 (accessed 13 September 2021).
Mysteel Global (2021), Hebei retains China’s top steelmaking province in 2020, www.mysteel.net/article/5021660-0503/Hebei-retains-Chinas-top-steelmaking-province-in-2020.html.
National Energy Administration (NEA) (2020), Summary of Reply to Recommendation No. 6074 of the Third Session of the Thirteenth National People's Congress (website): http://zfxxgk.nea.gov.cn/2020-09/17/c_139975338.htm.
National Bureau of Statistics of China (2021), http://www.stats.gov.cn/english/
Nengyuanjie (2021), As of the end of December 2020, China has built a total of 118 hydrogen refuelling stations, 7 January, www.nengyuanjie.net/article/44744.html.
Nowak, T. (2021), Industrial Heat Pumps, DryFiciency, http://dry-f.eu/Industrial-Heat-Pumps, last accessed 13 September 2021.
PetroChina (2016), CCUS, March 2016, http://chinaccus.org/attachs/2016-4-7_1-0-19-206-0.0109572061388554.pdf.
Pike, L. (2019), How green is China’s high-speed rail?, China Dialogue, 5 April, https://chinadialogue.net/en/energy/11174-how-green-is-china-s-high-speed-rail/, accessed 21 June 2021.
QIBEBT (Qingdao Institute of Bioenergy and Bioprocess Technology) (2020), “碳中和”成功
实现的关键:氢能在工业领域的应用式 [The key to successful “carbon neutrality”: the applications of hydrogen in industry], http://www.qibebt.cas.cn/xwzx/kydt/202012/t20201230_5848600.html.
Refining and Chemical Industry Trends (2020), 全球最大!中海油5000吨/年二氧化碳加氢制甲
醇工业示范取得成功 [CNOOC’s 5,000 tons/year hydrogenation of carbon dioxide to methanol industrial demonstration project succeeded and is now the World’s largest], 30 September 2020, https://www.sohu.com/a/421816142_100273878 (accessed 13 September 2021).
Stanway, D. (2019), Concrete steps? For China cement giants, monster carbon footprint smothers climate goals, Reuters, 12 September 2019, https://www.reuters.com/article/us-climate-change-china-cement-idUSKCN1VX0QQ.
State Council (2020), Notice on printing and issuing the development plan for the new energy vehicle industry (2021-2035), www.gov.cn/zhengce/content/2020-11/02/content_5556716.htm.

An Energy Sector Roadmap to Carbon Neutrality in China Chapter 3: Sectoral pathways
PAGE | 146 IEA,
202
1.
Tong, D. et al. (2019), Committed emissions from existing energy infrastructure jeopardize 1.5°C climate target, Nature, vol. 572, pp. 373-377.
United States Bureau of Transport Statistics (2021), online database www.bts.gov/content/us-passenger-miles.
Wan, Z., D. Sperling and Y. Wang (2015), China’s electric car frustrations, Transportation Research Part D: Transport and Environment, vol. 34, pp. 116-121, https://doi.org/10.1016/j.trd.2014.10.014.
Wang, X. et al. (2019), A unit-based emission inventory of SO2, NOx and PM for the Chinese iron and steel industry from 2010 to 2015, Science of the Total Environment, vol. 676, pp. 18-30.
Wang, Y. et al. (2017), China's electric car surge, Energy Policy, vol. 102, pp. 486-490, https://doi.org/10.1016/j.enpol.2016.12.034.
Wang, Y., J. Teter and D. Sperling (2011), China’s soaring vehicle population: Even greater than forecasted?, Energy Policy, vol. 39/6, pp. 3296-3306, https://doi.org/10.1016/j.enpol.2011.03.020.
Xu, X. and T. Peng (2020), Economic Structural Change and Freight Transport Demand in China, KAPSARC, doi: 10.30573/KS--2020-DP26.
Zhang, R. et al. (2017), Sinopec Zhongyuan Oil Field Company Refinery CCS-EOR Project, Energy Procedia, vol. 114, pp. 5869-5873, https://www.sciencedirect.com/science/article/pii/S1876610217319252.
Zhao, Q. (2020), 张惠代表:推动钢铁产业绿色发展 [NPC deputy Zhang Hui: Promoting the green development of the steel industry], Guangming Daily, 27 May 2020, https://news.gmw.cn/2020-05/27/content_33862795.htm.
Zhong, S. (2020), 氢能在中国钢铁工业蓄势待发 [Hydrogen energy is gaining momentum in China‘s steel industry], Worldsteel Association, https://www.worldsteel.org/zh/media-centre/blog/2020/hydrogen-technology-momentum-Chinese-steel-industry.html.
Zhu et al. (2014), 甲醇制芳烃技术研究进展 [Research advances in methanol to aromatics technology], Modern Chemical Industry, https://www.researchgate.net/publication/288374121_Advances_in_methanol_to_aromatics_technology

An Energy Sector Roadmap to Carbon Neutrality in China Chapter 4: Technology needs for the energy transition
PAGE | 147 IEA,
202
1.
Chapter 4: Technology needs for the energy transition
Highlights
The energy pathway to net zero emissions by 2060 in this roadmap involves several pillars that cut across sectors, in particular the electrification of end-use sectors, carbon capture, utilisation and storage (CCUS), low-carbon hydrogen and sustainable bioenergy. For each pillar, innovation is needed to bring new technologies to market and to improve existing ones.
Electrification, both of energy end uses and the production of low-emissions fuels, contributes 13% of the CO2 emissions reductions to 2060 in the Announced Pledges Scenario (APS), around 35% of which come from the transport sector, mainly through the uptake of battery electric vehicles. China is by far the largest electric vehicle battery producer today with 70% of global capacity and home to 55% of global processing and refining capacity for lithium – a key battery metal. China is likely to retain global leadership in battery supply in the medium term based on planned projects. In the long-run, output would increase about 25 times, worth up to USD 250 billion a year, if it was to supply the same share of global EV battery demand by 2060 as it does today.
CCUS accounts for 8% of the cumulative reduction in emissions to 2060 in China in the APS and almost 50% of the cumulative CO2 captured globally. CCUS retrofits allow some of the country’s existing power and industrial plants to continue operating. CCUS also provides a means of generating negative emissions by storing CO2 from bioenergy combustion or directly captured from the air. China could position itself as a leader in CO2 management if it focuses on the widespread development of transport and storage infrastructure in the next decade.
Hydrogen contributes to decarbonising end-use sectors where few alternatives exist, notably in some heavy industries and long-distance transport, and for storing energy from variable renewables. The use of low-carbon hydrogen and hydrogen-based fuels accounts for more than 3% of emissions reductions over 2021-2060 in the APS, with hydrogen demand increasing more than three-fold. Electrolysis capacity reaches 750 GW, or nearly 40% of the world total, by 2060. China is currently a big player in the manufacturing of electrolysers, with around one-third of global capacity today. Most of the world’s fuel cell electric buses and trucks operate on Chinese roads.
The use of sustainable bioenergy accounts for almost 7% of CO2 emissions reductions to 2060, its share in total energy demand more than doubling. The bulk of bioenergy use in 2060 is for power and heat generation, including in industry, a sizeable part of it with CCUS to generate negative emissions. Liquid biofuels use in transport also grows significantly.

An Energy Sector Roadmap to Carbon Neutrality in China Chapter 4: Technology needs for the energy transition
PAGE | 148 IEA,
202
1.
Introduction The energy pathway to net zero emissions by 2060 in this roadmap involves four pillars that cut across sectors: the electrification of the transport, industry and buildings sectors; the deployment of CCUS technologies in power generation, industry and fuels transformation, as well as for carbon removal; the production of low-carbon hydrogen and hydrogen-derived fuels; and the use of sustainable bioenergy for power and heat production and making gaseous and liquid biofuels. All four are essential for carbon neutrality in China.
For each pillar, innovation is needed to bring emerging and completely new technologies to market and to improve existing ones (see Chapter 6). The technology priorities of the APS are consistent with the 14th Five-Year Plan (FYP) (2021-2025), which sets out innovation priorities for the four technology areas, focussing on electric vehicles (EVs), hydrogen and fuel cells, CCUS, bioenergy and advanced biofuels, energy storage, smart electricity systems and traditional renewables.
Electrification
Role in the energy transition Electrification, both of energy end uses and the production of low-emissions fuels, is of particular importance to the Chinese energy transition to carbon neutrality, covering almost the entire energy system and contributing directly to 13% of the cumulative emissions reductions in the APS relative to 2020 over the period to 2060, on top of enabling energy efficiency gains that in turn result in emissions reductions. A near-doubling of China’s electricity demand between 2020 and 2060 in the APS is accompanied by the complete decarbonisation of electricity generation before 2055 – a mammoth task (see Chapter 3). Yet even faster growth of electricity demand has been observed in the past in China. In the period 2000-2020, electricity demand grew on average by around 9% per year. In recent years, demand has been increasing annually by amounts roughly equivalent to the total amount of electricity generated each year in Indonesia (260 TWh).
The largest share of CO2 reductions to 2060 in the APS (45%) from electrification and energy efficiency gains brought by electric technologies occur in industry, led by a shift away from fossil fuel-fired heating towards industrial heat pumps and electric boilers for low and medium-temperature heating needs in light industries, and increasing production of steel from scrap in electric arc furnaces. A further 35% of the emissions reductions from electrification occur in transport, mainly

An Energy Sector Roadmap to Carbon Neutrality in China Chapter 4: Technology needs for the energy transition
PAGE | 149 IEA,
202
1.
through the direct electrification of light-duty vehicles initially and heavy-duty vehicles in the longer term using batteries (the use of hydrogen and hydrogen-derived fuels produced by electrolysis also contributes indirectly to transport emissions reductions, particularly during the second-half of the period to 2060. Electrification is also an important trend in buildings, with the shift away from coal and other fossil fuels for heating and cooking (see Chapter 3)). Electrification of fuels supply, mainly via the production of electrolytic hydrogen for direct use and hydrogen-based fuels production, accounts for less than 10% of the emissions reductions to 2060.
CO2 emissions reductions from electrification by sector in China in the APS
IEA, 2021.
Notes: Avoided emissions from electrification includes emissions avoided by displacing fossil fuels with electric equipment as well as emissions avoided from efficiency gains brought about by electrical equipment. Mt CO2 = million tonnes of carbon dioxide.
Around 45% of the cumulative emissions avoided to 2060 from electrification are in industry, another 35% in transport and 12% in buildings
Box 4.1 Electricity system targets and policies
China has consistently met and exceeded targets set in previous five-year plans for expansion of electricity generation capacity and the reduction in coal shares in primary energy supply. The 14th FYP for 2021-2026 marks a shift in emphasis by highlighting the importance of “extensively expanding” solar and wind. It further sets a target of 70 GW of installed nuclear capacity, up from 52 GW as of mid- 2021, and a non-fossil fuel share of primary energy use of 20% by 2025, up from just under 16% in 2020. The plan sets out a blueprint for investments in the coming five years in nuclear capacity, offshore wind and transmission grids, with the aim of both solar and wind overtaking hydropower soon after 2025 to become the

An Energy Sector Roadmap to Carbon Neutrality in China Chapter 4: Technology needs for the energy transition
PAGE | 150 IEA,
202
1.
leading power generation technologies, after coal. It also recognises the role of natural gas in meeting peak load and responding flexibly to fluctuations from variable renewables. While the plan does not contain an explicit cap on coal capacity expansions, it does emphasise the need for clean and efficient use of coal and leaves open the option of imposing consumption caps on coal soon (NDRC, 2021).
Power sector investment decisions were being shaped by the new targets before they were officially announced. In early 2021, the State Grid Corporation of China announced that it was planning to invest USD 370 billion (CNY 2.4 trillion) over the five years to 2025 on the following projects (State Grid, 2021):
Seven ultra-high voltage direct current transmission lines with a combined capacity of 56 GW.
Increasing interregional transmission capacity to 300 GW, of which half could be used to carry ‘clean’ electricity.
50 MW of new pumped hydro energy storage facilities by 2025.
New peak-shaving gas power plants and distributed solar, with the latter reaching 180 GW by 2025 (up from 72 GW in 2020).
Developing EV charging capacity, including highway fast-charging and networks in 176 cities.
China’s national emissions trading system, which started trading in mid-2021, initially covers coal- and gas-fired power plants, and allocate allowances determined by carbon intensity benchmarks (see Chapter 7).
In parallel to decarbonising the power sector, China has also been pursuing increasing electrification in end-use sectors, with Guiding Opinions on Advancing the Replacement by Electricity issued in 2016 by eight ministries and the Energy Supply and Consumption Revolution Strategy (2016-2030) including urban and rural electrification as a key area in reshaping energy consumption (Government of China, 2016). During the 13th FYP period (2016-2020), China set targets to increase the share of electricity in final energy consumption to 27% in 2020 (from 25.8% in 2015) and for fuel-switching to electricity (across all end-use sectors) to lead to a total of 450 TWh of demand.
The 14th FYP (2021-2025) promotes coal-to-electricity switching, the expansion of recharging infrastructure and clean heating* and industrial furnace management in northern areas. State Grid estimates that the potential for switching to electricity during the 14th FYP period could be 600 TWh (nearly 9% of annual electricity consumption in 2020), while the China Electricity Council estimates that the share of electricity in final energy consumption could reach 38% by 2035 (State Council Information Office of the People’s Republic of China, 2020).

An Energy Sector Roadmap to Carbon Neutrality in China Chapter 4: Technology needs for the energy transition
PAGE | 151 IEA,
202
1.
In the case of transport, China’s New Energy Vehicle (NEV) Industry Development plan sets out a strategy for innovation in automotive technologies, including EVs. In late 2020, the Society of Automotive Engineers (SAE-China) set targets, later confirmed by the State Council, for the share of NEVs (battery, plug-in and fuel-cell electric vehicles [FCEVs]) in light-duty vehicle sales: 20% by 2025 and more than half by 2035 (Randall, 2020).
In the residential sector, electrification efforts focus on replacing standalone coal stoves or coal boilers in areas without district heating networks. The Clean Heating Plan for northern China in Winter (2017-2021) targets 70% of clean heating coverage in northern regions by 2021 (up from 34% in 2016). To tackle air pollution in the provinces of Beijing, Tianjin, Hebei, Henan, Shanxi and Shandong, it sets a specific target for 28 Chinese cities to use 100% clean energy sources for heating by 2021. The plan also set targets for expanding solar, biomass, and geothermal heating in buildings (Government of China, 2017).
For the industry sector, the 2016 Guiding Opinions on Advancing the Replacement by Electricity identified key sectors and regions for electrification, as well as measures to promote industrial electric boilers for steam demand, particularly textiles and wood processing on the south-eastern coast, and electric furnaces in various sectors, including metal processing, ceramics, mineral wool, and glass (Government of China, 2016). * Clean heating includes that by natural gas, electricity, large-scale coal facilities with pollution mitigation, renewables and industrial excess heat.
As in other countries, the accelerated electrification of the Chinese economy reflects both the aim to exploit low-carbon renewable generation technologies – mainly solar and wind – and the environmental and practical advantages of electricity over other low-carbon forms of energy in end-use applications, including the higher energy efficiency of many electric technologies. The share of electricity in China’s total final energy demand grows from 25% in 20201 to 55% in 2060 in the APS. Taking account of the indirect use of electricity for making other final forms of energy, the share reaches 66% in 2060, with the use of electrolysis to produce hydrogen and synthetic fuels accounting for most of the difference. Electricity becomes the main energy carrier in all end-use sectors, though trends vary significantly.
1 These shares differ from Chinese official statistics due to different methodologies to calculate total final consumption (TFC). TFC cited in this report includes energy consumed in blast furnaces and coke ovens in industry, which reduces the reported electricity share.

An Energy Sector Roadmap to Carbon Neutrality in China Chapter 4: Technology needs for the energy transition
PAGE | 152 IEA,
202
1.
Growth in electricity consumption in China by sector and scenario, 2020-2060
IEA, 2021.
Notes: Hydrogen production here only includes merchant hydrogen. APS = Announced Pledges Scenario; STEPS = Stated Policies Scenario.
Electricity accounts for more than half of transport and industry energy demand, 60% of buildings final demand and nearly 90% of hydrogen production by 2060 in the APS
Electricity is already an important fuel for China’s industrial sector today, meeting around a quarter of its total energy needs. In the APS, industrial electricity demand grows by more than 70% between 2020 and 2060. Direct use of electricity grows to satisfy the demand for low- and medium-temperature heat, particularly in light industries for manufacturing, heat pumps and other electric heating technologies. The stock of electric motors in the light industry sectors also grows rapidly, and despite a greater share of higher efficiency classes and greater use of variable speed drives, overall electricity demand doubles. In the energy-intensive steel and aluminium industries, secondary production (using scrap metal) is an important contributor to electricity demand growth, despite falling production of these metals. The other key area of growth is for indirect electrification of primary materials production, mainly in the steel and chemicals sectors, through the use of hydrogen as a reduction agent in the steel industry and as a feedstock for ammonia and methanol production in the chemical industry. Of the 7 000 TWh of electricity consumed in industry in China in 2060 in the APS, around 13% is used to produce electrolytic hydrogen.
Electricity demand in the buildings sector, the second largest user of electricity today, grows by more than 60% between 2020 and 2060 in the APS to nearly

An Energy Sector Roadmap to Carbon Neutrality in China Chapter 4: Technology needs for the energy transition
PAGE | 153 IEA,
202
1.
3 700 TWh, driven mostly by increased use of electrical appliances and switching from traditional biomass and fossil fuels for cooking and water heating. In contrast with the other sectors, electricity demand increases less in the APS than in the STEPS, thanks to stringent buildings energy codes and appliance efficiency standards. Electricity demand for space heating and cooling and lighting increases less, thanks to progressive improvements in buildings performance and equipment efficiency.
Despite leading the world in electrification of road transport (IEA, 2021a), oil products and natural gas still provide about 95% of China’s transport final energy demand today. This changes dramatically in the APS, with electricity overtaking oil as the main transport fuel by 2050. By 2060, electricity accounts for nearly two-thirds of energy use for road transport with improvements in battery technology (see below). EVs dominate the passenger car fleet by then, with many trucks also converting to electric powertrains, though their adoption lags that of cars by more than a decade: the share of electricity in medium and heavy-duty trucks reaches around 50% in 2060.
Technology readiness Low-carbon electricity end-use technologies are generally less mature than those in power generation. Technologies such as EVs and heat pumps are commercially available today but may not yet be fully competitive with alternative non-electric technologies, so their wider application depends on further innovation to improve performance and reduce costs.2 Other end-use technologies are further behind, particularly in heavy industry and long-distance transport. In primary steelmaking, for instance, the use of electricity to convert iron ore into steel through electrolysis is still the subject of research projects and plans for pilot plants. In aviation, prototypes of electric planes are currently being developed and tested by several companies, but they are far from commercial viability, even for small numbers of passengers and short-haul flights, because of the technical limitations associated with the low energy density of batteries.
About 85% of cumulative CO2 emissions reductions in the APS, relative to 2020, come from renewables and nuclear power. Many of these technologies are already mature or already growing steadily on the market, though they will continue to develop as they are deployed more widely. Similarly, many of the end-
2 The need for further technological advances also applies to other areas of the low-carbon electricity value chain. Innovation to develop effective means of providing greater flexibility in adjusting supply to load in low-carbon electricity system is becoming increasingly important. Many of the most promising technologies today are between the early adoption and large prototype stages.

An Energy Sector Roadmap to Carbon Neutrality in China Chapter 4: Technology needs for the energy transition
PAGE | 154 IEA,
202
1.
use technologies that rely on electricity, such as heat pumps for buildings and industrial applications, scrap-based steel production, lithium-ion (Li-ion) batteries for EVs, and electric cook stoves, are already on the market. Other end-use technologies, however, are still under development. Advanced high-energy-density batteries, which are at the prototype stage today, contribute to almost half of the cumulative emissions reductions in road transport to 2060 in the APS. Direct electrification of heavy industry poses an important technical challenge, particularly for those processes with high-temperature thermal needs. Most technologies in this area are also at the prototype stage today. In the APS, electric cement kilns, for instance, have a limited role, delivering just 1% of the cumulative emissions reductions in the cement sub-sector to 2060.
Cumulative CO2 emissions avoided by selected electricity technologies by maturity category in China in the APS, 2020-2060
IEA, 2021.
Note: Maturity category assigned based on detailed assessment of technology readiness levels of individual technology designs presented in the IEA Clean Energy Technology Guide (IEA, 2020a).
Most electric technologies critical for carbon neutrality are on the market today, but further innovation is needed to make them viable for broader applications, particularly in batteries and heavy industrial processes
Focus on EV battery manufacturing Advances in battery technology are central to the deployment of EVs. The energy density of EV batteries increases to over 350 Wh per kg at the cell level – around 50% higher than the current level – during the 2020s in the APS, thanks to the introduction of solid-state batteries (today at prototype stage), which extends driving ranges and makes EVs more competitive with conventional vehicles, especially heavy trucks. The energy density of batteries exceeds 540 Wh per kg by 2060, making electric ships and planes viable over short distances. Total battery demand for all types of vehicle operating in China (and overwhelmingly for road modes) increases forty-fold between 2020 and 2060, consuming 3 TWh in

An Energy Sector Roadmap to Carbon Neutrality in China Chapter 4: Technology needs for the energy transition
PAGE | 155 IEA,
202
1.
2060 and requiring the construction of more than 85 gigafactories, each with a production capacity of 35 GWh, just to meet domestic demand.
China has by far the largest production capacity for EV batteries today, accounting for 70%, or around 470 GWh, of the 660 GWh of global capacity by the end of 2020 (Benchmark minerals intelligence, 2021). Battery production plants in China still operate well below capacity, as roughly 70 GWh of batteries were installed in 2020. Contemporary Amperex Technology Co. Limited (CATL) alone exported around 6 GWh of Li-ion batteries in 2020, meeting roughly 5% of global demand. China’s battery manufacturing is concentrated in the eastern provinces, with Jiangsu alone accounting for one-third.
The capacity of batteries used for energy storage in the electricity network, mainly by utilities, has increased 35-fold since 2015, reaching 10 GWh at the end of 2020. Of that capacity, almost 5 GWh was installed during 2020. Despite this large increase, energy storage accounts for only 7% of total battery installations.
EV battery demand and average unit CAPEX
IEA, 2021.
Notes: CAPEX = capital expenditure; APS = Announced Pledges Scenario. Source: Historic data based on IEA (2021a).
Just under half of all the batteries produced in the world today go to China, with rapid growth in demand for EVs driving down production costs in all regions
The cost of Li-ion batteries, which account for most of the batteries produced and sold in China today, has fallen precipitously since their invention in the early 1990s. The scaling-up of manufacturing and technology learning in China has been a major driver of cost reductions. They were initially used for consumer electronics, with many Chinese companies involved in their manufacturing, thanks to technology agreements with US and Japanese firms. In the mid-2000s, some

An Energy Sector Roadmap to Carbon Neutrality in China Chapter 4: Technology needs for the energy transition
PAGE | 156 IEA,
202
1.
Chinese battery makers began researching and producing batteries for EVs, encouraged later by government subsidies for EV purchases. Until 2019, the domestic battery industry was heavily protected since only vehicles using batteries made by Chinese carmakers could qualify for subsidies, excluding Japanese and Korean battery makers that had a presence in China. The cost of Li-ion batteries dropped by 50% between 2014 and 2016, a period during which battery demand in China increased sevenfold and accounted for 80% of the global battery demand growth. Today, Li-ion battery production costs do not vary widely around the world but they are affected by the raw material needs of each technology, prices can vary according to the volume ordered by carmakers.
Box 4.2 EV battery manufacturing in China
The two main EV battery manufacturers in China are CATL and BYD, in 2019 they had capacities of 53 GWh and 40 GWh and national market shares of roughly 65% and 15% respectively. Korean and Japanese companies also have large production capacities in China: Panasonic has 10 GWh out of its total global capacity of 58 GWh, LG Chem 30 GWh out of 70 GWh and Samsung SDI 10 GWh out of 20 GWh. Most of the other producers are small and focus on local markets.
China has put a particular focus on the development and production of lithium ferro-phosphate (LFP) cathode batteries – a type of Li-ion battery – with the 11th FYP (2006-2010) prioritising R&D of that technology. LFP batteries, almost all of which are made by Chinese manufacturers, are well-suited for buses as they have a relatively long cycle-life, which is ideal for vehicles with high utilisation rates, and because energy density is not as important as for passenger cars as more space is available for batteries relative to vehicle weight. China has by far the biggest market for electric buses. Innovation by Chinese companies of battery pack architecture (cell-to-pack technology) has led to a resurgence in the use of LFP cathodes for light-duty vehicles too.
China is the biggest producer of some key components of Li-ion batteries and dominates the mineral processing industry for battery metals, accounting for 35% of all the refined nickel, 65% of cobalt and 58% of lithium produced worldwide. Chinese mineral suppliers and battery manufacturers co-operate closely.
China could continue to dominate the global EV battery industry in the coming decades. Chinese demand reaches 0.85 TWh in 2030 and 3 TWh in 2060 in the APS, accounting for about one-third of cumulative global battery demand over 2021-2060. Around 85% of China’s demand in 2030 is for light-duty vehicles, with

An Energy Sector Roadmap to Carbon Neutrality in China Chapter 4: Technology needs for the energy transition
PAGE | 157 IEA,
202
1.
the rest mostly for trucks (10%) and buses (5%); in 2060, demand for trucks becomes more important, accounting for about 45% of total demand.
Chinese producers are planning to expand capacity to 2.2 TWh by 2030 (Benchmark Minerals intelligence, 2021), meeting about three-quarters of projected global demand of 3 TWh. Battery requirements in China for energy storage are set to reach 0.08 TWh by 2030 and 3.7 TWh by 2060 – equal to adding 120 GWh of capacity per year on average, or less than 5% of the country’s total battery demand. The share of China in global battery demand falls in the long run as other countries catch up in electrifying road transport, but China will most likely continue to expand manufacturing capacity to meet rising export demand. In the APS, global demand reaches 10 TWh by 2060 – a fifty-fold increase on 2020 levels. If China was to supply the same share of global EV battery demand in 2060 as it does today, the domestic battery manufacturing industry would have a market volume of USD 250 billion – 25 times its current size.
Increased global demand for batteries is expected to lead to further major cost reductions through learning-by-doing, learning-by-searching and economies of scale, in large part thanks to Chinese innovation. Lower costs and better performance will be both the result of and driver of increased electrification of road transport globally. By 2030, in the APS, average costs worldwide drop to around USD 85-90/kWh (CNY 586-621/kW) in 2030 and USD 55-60/kWh (CNY 379-414/kW) in 2060. These cost reductions are only possible if there is no major shortage of the materials needed for battery manufacturing. Given its disproportionate role in the battery material supply, China has a unique role to play in managing supply chains and keeping up innovation in these manufacturing processes (see next section on supply chain infrastructure). This is particularly true for the next decade, as other regions develop their battery manufacturing supply chains.
Focus on heat pumps The use of heat pumps – vapour compression units to produce space heating, space cooling or both – have grown rapidly in China in the last few years, driven mainly by air-conditioning demand. China’s cooling demand has grown faster than anywhere in the world since 2010 and the country now accounts for 23% of global energy use for cooling. In 2020, more than 40% of global air-conditioner sales were in China (ChinaIOL, 2021). Demand for heat pumps for space and water heating, mainly air-source units, is also growing, especially for residential and rural buildings. Reversible units (producing both heating and cooling) are also becoming widespread in urban areas throughout the country. Most of the heat pumps sold in China are domestically produced, with

An Energy Sector Roadmap to Carbon Neutrality in China Chapter 4: Technology needs for the energy transition
PAGE | 158 IEA,
202
1.
output growing steadily in recent years. In parallel, China manufactures over 70% of room ACs globally (LBNL, 2020).
The government uses various policy instruments to improve the efficiency of heat pumps manufactured and sold in China. Minimum Energy Performance Standards (MEPS) cover all types of heat pump. The government tightened MEPS for variable-speed units and introduced a subsidy scheme to support the purchase of efficient units in 2012, which led to a sharp increase in their energy performance in 2013-2014. As efficiency improvements for some type of units levelled off in 2017, there is scope for a further tightening of MEPS (IEA, 2019). In June 2020, a new MEPS (GB21455-2019), which includes for the first time low-temperature air-source heat pumps, was introduced.
Chinese demand for heat pumps will undoubtedly continue to grow with rising temperatures and increased demand for thermal comfort with increasing prosperity. In the APS, heat pump capacity nearly quadruples between 2020 and 2060 to around 5 TW, equal to about 30% of the world total. The share of electric heat pumps in space heating energy consumption in buildings reaches 7% in 2030 and more than 20% in in 2060, compared with nearly 3% today. The share of households owning at least one air conditioner also grows from 70% today to more than 90% already in 2050. Total energy use by heat pumps for heating and cooling reaches 800 TWh in 2060, about 13% of the global total in buildings, and around 60% of total Chinese electricity use in the sector.
Heat pump installed capacity and average unit CAPEX in the APS
IEA, 2021.
Note: CAPEX = capital expenditure. Heat pumps include all vapour compression cycle technologies providing space heating and space cooling, excluding ground source heat pumps. Capacity refers to input capacities.
China accounts for over one-fifth of the global increase in heat pump capacity to 2060, with economies of scale and learning-by-doing driving costs down by more than 15%

An Energy Sector Roadmap to Carbon Neutrality in China Chapter 4: Technology needs for the energy transition
PAGE | 159 IEA,
202
1.
Increased heat pump demand, which allows manufacturers to exploit economies of scale, helps bring down their average cost by 5% in 2030 and nearly 15% in 2060. R&D and technology learning from cooling, e.g. in refrigerant control systems, compressors, low global warming potential or natural refrigerants and hybrid vapour compressors cycles, also contributes to bringing down the cost of pumps for heating applications (IEA, 2020b).
Supply chain infrastructure needs China’s big projected increase in electricity demand over the next four decades in the APS calls for a major expansion and transformation of its electricity network. With the projected decline in fossil-fuel-based generation, the flexibility needed to ensure that the electricity system operates reliably and securely requires alternative sources of dispatchable generation, more short-term and seasonal storage, demand response and reinforcements to the network, alongside enhanced interconnections with neighbouring systems to take advantage of larger geographical areas to help smooth out variations in local loads. These requirements are discussed in detail in Chapter 3.
While electrification of end uses reduces reliance on fossil fuels, it increases demand for the metals and minerals needed to produce the infrastructure and equipment associated with wider deployment of low-carbon electricity. Copper, lithium, cobalt and platinum are at the core of the energy transition: copper is needed for transmission and distribution lines, lithium and cobalt for Li-ion batteries and platinum for fuel cells. The material with the most fragile supply chain is cobalt, resources of which are highly concentrated geographically: the Democratic Republic of Congo currently accounts for almost two-thirds of world primary production. China imports all the pure cobalt it needs. Supply chain risks were highlighted by a very sharp price hike in 2018, which encouraged battery producers to reduce cobalt content. The availability of low-cobalt batteries has since grown rapidly. Lithium is likely to keep its status as a critical material because its physical properties make it hard to replace in high-energy-density batteries.
Copper is used today in construction, vehicles manufacturing and power systems (including cables, for instance in ultra-high voltage transmission lines [See the section on power generation of Chapter 3]). Demand in China is projected to grow significantly between 2020 and 2060, but less than overall electricity demand: faster electrification across end-uses is largely offset by reduced demand for copper in transport due to modal shifts and to more efficient use of materials in vehicle manufacturing and construction. By contrast, demand for lithium, nickel

An Energy Sector Roadmap to Carbon Neutrality in China Chapter 4: Technology needs for the energy transition
PAGE | 160 IEA,
202
1.
and cobalt for making Li-ion batteries increases 50-fold, 44-fold and 22-fold respectively due to the rapid penetration of EVs and increased battery storage in the power sector.
Demand for selected critical metals for EVs in China in the APS
IEA, 2021.
Demand for lithium, nickel and cobalt soars due to the need for Li-ion batteries for the rapidly expanding fleet of EVs and for storage in the power sector
China holds large reserves of some critical materials and much of the world’s minerals processing and refining capacity. It is home to 60% of the global mining capacity of rare-earth metals used in electric motors and wind turbines. It also has 65% of global processing and refining capacity for cobalt, more than 55% for lithium and more than 35% for nickel. China is likely to retain its global leadership in critical material supply in the medium term based on planned projects, putting it at the centre of the global supply chain needed to for the energy transition (IEA, 2021b).
CCUS
Role in the energy transition China has made significant progress in the development of CCUS over the past decade, which could provide the basis for a rapid acceleration in deployment. A growing number of CCUS projects are operating or planned. There are currently at least 21 pilot, demonstration, or commercial projects in operation in China with a combined capture capacity of over 2 Mt of CO2 per year – many of which are associated with enhanced oil recovery involving (EOR) the injection of CO2 to boost oil production (CO2-EOR). The largest is the commercial 600 kt/year China National Petroleum Corporation (CNPC) CO2-EOR project at Jilin that captures

An Energy Sector Roadmap to Carbon Neutrality in China Chapter 4: Technology needs for the energy transition
PAGE | 161 IEA,
202
1.
CO2 from natural gas processing. Two other commercial-scale projects are under construction – a 700 kt/year CO2 capture project at Sinopec’s Qilu refinery in eastern Shandong, and a 400 kt/year CO2 capture project at a coal-to-chemicals plant in Shaanxi owned by Yanchang Petroleum. Both projects will use captured CO2 for EOR in the Shengli Oilfield and Ordos Basin respectively. All CCUS projects are in northern or eastern China where there is a high density of coal-based chemicals and power production as well as good opportunities for CO2-EOR and dedicated geological storage.
Box 4.3 CCUS deployment targets and policies
Policy and regulatory developments over the last decade signal that CCUS is gaining traction in China. Since the 12th FYP (2011-2015), China has included CCUS in its national carbon mitigation strategies and in its nationally determined contribution. The development of large-scale CCUS demonstration projects was included for the first time in the 14th FYP (2021-2025). Several ministries have issued guidance documents to support the development of CCUS technologies through research, development and demonstration (RD&D), such as the 13th Five-Year Special Plan for Climate Change Science and Technology Innovation. Interest for CCUS is also growing at the regional level, with 29 of the country’s 34 administrative divisions issuing CCUS-related policies (Xian, 2021).
In 2019, the Department of Social Development of the Ministry of Science and Technology and the Administrative Centre for China’s Agenda 21 (ACCA21) jointly released a roadmap for the development of CCUS technology in China (ACCA21, 2019). It defines several goals in five-year increments to 2050. By 2030, CCUS should be ready for industrial applications, while long-distance onshore CO2 pipelines with capacities of up to 2 Mt/year should be available. It also aims to reduce the cost and energy consumption of CO2 capture by 10-15% by 2030 and 40-50% by 2040. By 2050, CCUS technology is to be deployed extensively, supported by multiple industrial CCUS hubs across the country.
China’s CCUS policies have so far focused mainly on the science and innovation, leading to major advances in all aspects of the technology. China has not yet enacted any specific laws to encourage the deployment of CCUS and overcome barriers to new projects. That will require the introduction of a legal and policy framework, market incentives including CO2 pricing and subsidies to address the high capital and operating costs of large-scale projects (Jiang et al., 2020).
CCUS is set to play an important role in China’s transition to carbon neutrality in the APS, in large part because of the composition of its existing energy infrastructure

An Energy Sector Roadmap to Carbon Neutrality in China Chapter 4: Technology needs for the energy transition
PAGE | 162 IEA,
202
1.
and large role of coal in the energy mix today. CO2 capture is deployed in industry, fuel transformation and power generation, with the CO2 either permanently stored or used in various ways. Many of the country’s existing power and industrial plants have been built relatively recently and could continue operation with CCUS retrofits, avoiding potentially costly early retirements. CCUS also provides a means of generating negative emissions via bioenergy with carbon capture and storage (BECCS) and direct air capture (DAC) with CO2 storage, both of which are technologies that can remove CO2 from the atmosphere on a net basis.
In total, CCUS contributes 8% of the cumulative reduction in China’s CO2 emissions between now and 2060 with its contribution growing over time. In the APS only small increases in the total volume of CO2 captured from 2020 to 2030 are needed to support China’s enhanced near-term targets declared in 2020 related to its nationally determined contribution under the Paris Agreement. That period is used to ensure that the necessary enabling environment, including advanced regulatory frameworks and transport and storage infrastructure, is in place for widespread deployment. Deployment of CCUS technologies ramps up after 2030 to support deeper emissions reductions in the power, industry and fuel transformation sectors, reaching 2.6 Gt in 2060. Around 620 Mt of CO2 are removed via BECCS and DAC with CO2 storage in 2060, 25% of total CO2 capture, entirely offsetting residual emissions in industry and transport.
CCUS deployment by sector and source of emissions in China in the APS
IEA, 2021.
Notes: Other energy transformation includes fuel transformation, extraction of fossil fuels, and mining. DAC = direct air capture; CCUS = carbon capture, utilisation and storage. CCUS capacity excludes internal use of captured CO2 for chemical production.
CCUS focuses initially on reducing emissions from existing assets but plays a growing role in removing carbon from the atmosphere via BECCS and DAC with storage

An Energy Sector Roadmap to Carbon Neutrality in China Chapter 4: Technology needs for the energy transition
PAGE | 163 IEA,
202
1.
CCUS is increasingly deployed to reduce emissions from existing power and industrial assets and in most applications, CO2 capture rates as high as 99% can be achieved at relatively low additional cost. CO2 capture rates at coal and gas-fired power plants increase over time: the average aggregate capture rate in coal-fired power and natural gas fired-power reaches 96% and 95% respectively in 2030 and around 98% in 2060.
Power generation is the main driver of CCUS deployment throughout the projection period. By 2060, the power sector accounts for around 1.3 Gt, or half of all the CO2 captured (see Chapter 3). These high capture volumes are largely a reflection of the scale of emissions at coal power plants with CCUS contributing 7% of all the emissions savings in China’s power sector in 2060 relative to 2020.
CCUS also grows rapidly in industry, especially in cement and chemicals production (see Chapter 3). CCUS is crucial in reducing industrial emissions, as it is one of few available technologies for reducing process emissions in cement, steel and chemicals production. By 2060, heavy industry accounts for over 820 Mt, or almost 32% of all CO2 captured in the APS. In the cement and chemicals sectors, CCUS contributes as much as 33% and 13% respectively to overall CO2 emissions savings in 2060 compared with 2020.
Low-carbon fuel transformation and CO2 removal technologies play an important role in later decades. By 2060, around 505 Mt of CO2 capture is BECCS and 115 Mt is DAC for storage. Of all the CO2 captured in 2060, 2.5 Gt, or 96%, is permanently stored and 120 Mt, or 4%, is used mainly for making aviation fuels.
The deployment of CCUS in China and elsewhere in the world in the APS brings down costs due to learning-by-doing and economies of scale, while establishing a solid knowledge base, a skilled labour force and considerable technical capacity. Chinese deployment of CCUS in fossil power generation, chemicals, cement, and for DAC accounts for around 50-75% of global CCUS capacity across those sectors by 2060, and around 40% in iron and steel3. The domestic deployment of CCUS provides an opportunity for China to export high-value knowledge and capacity.
3 The high share of CCUS deployment in China relative to the rest of the world reflects, in part, that the APS takes into account current net zero emission pledges by countries with limited deployment of CCUS outside of these countries. For example, in 2060, cement production is shared evenly between countries with net zero pledges and those without, with China accounting for 70% of cement production in countries with pledges. For this reason, China accounts for more than two-thirds of cement production with CCUS in 2060 but only 35% of total global production.

An Energy Sector Roadmap to Carbon Neutrality in China Chapter 4: Technology needs for the energy transition
PAGE | 164 IEA,
202
1.
Global CCUS deployment by sector in the APS
IEA, 2021.
Note: DAC = direct air capture.The APS takes into account net zero emissions pledges that have been made around the world (see Chapter 2). Outside of those countries, CCUS is projected to be deployed in only a limited manner. BECCS and DAC are not deployed in China in the APS to offset residual emissions from other countries but only to compensate for the remaining domestic emissions by 2060. CCUS deployment excludes internal use of captured CO2 for chemical production.
China accounts for more than two-thirds of CO2 captured globally in fossil-based power, chemicals and cement in 2060 in the APS
Technology readiness The contribution of CCUS to China’s pathway to carbon neutrality hinges on the rapid development and commercialisation of capture technologies in each sector and the expansion of CO2 transport and storage networks. The maturity of CCUS in China today varies considerably by technology type and application. While most technologies have been demonstrated in a global context, a lack of policy and regulatory support in China is holding back their deployment. Around 45% of the cumulative emissions reductions from CCUS through to 2060 in the APS come from CO2 capture technologies that are currently at the prototype or demonstration

An Energy Sector Roadmap to Carbon Neutrality in China Chapter 4: Technology needs for the energy transition
PAGE | 165 IEA,
202
1.
stage. Demonstration and commercial-scale project development needs to be accelerated to make this pathway possible.
Cumulative CO2 emissions avoided in selected CCUS applications by maturity in China in the APS, 2020-60
IEA, 2021.
Notes: Steel production refers to the innovative smelting reduction route with CCUS. Application maturity corresponds to the maturity of CO2 capture in a sector for the purpose of CO2 storage. Maturity categories are assigned based on detailed assessment of technology readiness levels of individual technology designs and CCUS systems in the IEA Clean Energy Technology Guide (IEA, 2020a).
CO2 capture is still at the demonstration stage in some sectors, including cement, bioenergy power plants and steel, where it is needed to deliver large emissions reductions
CO2 capture CO2 has been captured for decades in certain industrial and fuel transformation processes such as ammonia production and natural gas processing. In other applications, such as cement and coal-fired power plants, CO2 capture is less widely deployed at present. Of the total of 2-3 Mt of CO2 capture capacity currently in operation in China4, at least 450 kt/year is at coal-fired power plants and 900 kt/year at coal-to-chemicals plants, with the rest in natural gas processing, oil refining and other sectors, including one demonstration project in cement (Cai et al., 2020). At least six projects have started operating since 2019, with their capacity ranging from 20 to 150 kt/year.
The most advanced and widely adopted capture technologies today are chemical absorption and physical separation. Other technologies include membrane separation and looping cycles (calcium and chemical looping), which are currently
4 This excludes CO2 captured from process emissions in the chemical sector during normal operations to synthesize ammonia and urea. In 2020, the Chinese chemical sector captured some 40 Mt CO2 for this purpose.

An Energy Sector Roadmap to Carbon Neutrality in China Chapter 4: Technology needs for the energy transition
PAGE | 166 IEA,
202
1.
at the prototype stage. Capture costs in China vary between USD 36-62/t CO2 (CNY 250-430/t CO2) for pre-combustion capture, USD 43-65/t CO2 (CNY 300-450/t CO2) for post-combustion capture and USD 43-58/t CO2 (CNY 300-400/t CO2) for oxyfuel combustion (ACCA21, 2019). The government has set ambitious targets for future cost reductions of 30-40% by 2030 and 60-70% by 2050 (ACCA21, 2019).
China is making a significant contribution to global CO2 capture R&D efforts. One example of international cooperation is CHEERS, a five year project funded by the European Union’s Horizon 2020 research and innovation programme and the Chinese Ministry of Science and Technology. The project aims to demonstrate a chemical-looping combustion system with integrated capture in refineries. A prototype, using petroleum coke as a fuel, is planned in China, producing CO2 for use in EOR. Another example is the CTSCo project involving China’s Huaneng and Glencore, a multinational resources company, which will use the former’s CO2 capture technology to capture emissions at the Millmerran coal-fired power plant in Australia. International projects like these demonstrate the potential to export Chinese technologies and can support future roll-out of CO2 capture technology in coal-fired power plants in China and elsewhere.
CO2 transport The availability of infrastructure to transport CO2 safely and reliably from where it is captured to storage sites or plants that make use of the gas is essential to the deployment of CCUS technology. Tank trucks have been used as the primary mode of transportation for at least two-thirds of CCUS projects in China to date. Costs range between USD 0.13-0.20/t-km (CNY 0.9-1.4/t-km) (Cai et al., 2020). Inland transport of CO2 by barge has also been demonstrated at a cost of approximately USD 0.04/t-km (CNY 0.30/t-km) (ACCA21, 2019). While transport by tank truck, rail and barges can be viable for short distances and small volumes, pipelines and ships are usually cheaper for longer distances and larger volumes.
The CNPC CO2-EOR project at the Jilin Oilfield is one of the few Chinese CCUS projects that transports CO2 by pipeline, over 53 km at a cost of USD 0.04/t-km (CNY 0.30/t-km) (Cai et al., 2020). Once operational, a pipeline will also be used to transport CO2 captured at Sinopec’s Qilu refinery to the Shengli oilfield for EOR. The cost of pipeline transport depends heavily on the flow rate; for example, the levelised cost for a 35 Mt/year pipeline is more than ten times lower than that of a 1 Mt/year pipeline over the same distance (Wei et al. 2016). Costs also vary across

An Energy Sector Roadmap to Carbon Neutrality in China Chapter 4: Technology needs for the energy transition
PAGE | 167 IEA,
202
1.
regions according to the terrain. In China, costs are lowest in central China, followed by the east, northeast, north, northwest and south areas of China (Wei et al., 2016).
The ACCA21 China CCUS roadmap targets the construction of two 1 Mt/year of onshore pipelines by 2025, expanding to a total transport capacity of 1 Gt/year CO2 and more than 20 000 km of pipeline by 2050 (ACCA21, 2019). As pipeline infrastructure expands and industrial clusters develop, the cost of CO2 transportation is expected to fall due to economies of scale and the construction of shared infrastructure. Business models that involve the separation of the capture, transport and storage components of the CCUS value chain could also help to mitigate risk and reduce the cost of capital.
Several commercial CCUS projects with CO2 transportation by ship are at advanced stages of development around the world. One example is the Northern Lights project in Norway, which will be the first large-scale CO2 shipping operation, collecting CO2 from European ports and shipping it to the coast of Norway, where it will be piped to an offshore storage site. There are no concrete plans to ship CO2 for CCUS in China at present. However, shipping is included in the ACCA21 China CCUS roadmap, with a planned transport capacity of 5 Mt/year by 2040.
CO2 utilisation CO2 can be used as a feedstock for making a range of products either directly, where CO2 is not chemically altered, or through its transformation into fuels, chemicals or building materials. Today, captured CO2 is used mainly for CO2-EOR and making chemicals, while smaller volumes are used in the electronics and food and beverage industries. Most RD&D has focused on new conversion pathways. The use of CO2 to make chemical feedstock and transport fuels plays an important role in the APS, but the technology to do so is currently still at the prototype stage. Innovation and policy support needs to be stepped-up now to ensure these applications are commercially available within the next decade. Other uses of CO2 are being applied or demonstrated at scale, including for curing concrete and creating mineralised building materials. In both cases, the CO2 is effectively stored long-term.
Today, approximately 100 kt/year of CO2 is used in China to synthesize high-value chemicals with an output value of approximately USD 58 (CNY 400) million/year, while 50 kt/year is used in synthesising materials, generating USD 29 (CNY 200) million/year in revenues (ACCA21, 2019). China hosts the world’s first commercial waste-gas ethanol plant, which commenced operation in 2018 at the Jingtang steel mill in Hebei province. The plant, which can produce 46 kt/year

An Energy Sector Roadmap to Carbon Neutrality in China Chapter 4: Technology needs for the energy transition
PAGE | 168 IEA,
202
1.
(160 kilolitres a day) of ethanol, uses bioreactors instead of traditional CO2 capture technologies (LanzaTech, 2018). Waste gas from the steel mill is mixed with anaerobic bacteria that ferment the carbon monoxide and CO2 present in the gas stream to produce ethanol. Some biologically derived CO2 is converted to food and feed, transformed into chemicals or used to make fertilisers, though volumes are small.
CO2-EOR has been used for more than five decades in some parts of the world, with the revenue from the sale of the oil underpinning the development of over three-quarters of currently operating large-scale CCUS projects. Over the lifetime of a CO2-EOR project, the vast majority of injected CO2 is permanently stored underground and CO2-EOR practices can be modified to provide assurance of long-term CO2 storage (IEA, 2015). In China, CO2-EOR can be economic when oil prices rise above USD 70 per barrel (Cai et al., 2020). The Chinese government sees CO2-EOR as a way of stimulating the rollout of CCUS and the development of a CO2 management industry (ACCA21, 2019). Several new CO2-EOR projects are being developed by large energy companies in China. However, while CO2-EOR can be a driving force for CCUS in the near term it should be regarded as a transition step towards the wide roll-out of dedicated storage. In the longer term, it plays much less of a role as production of oil falls with lower demand and prices and the need for dedicated CO2 storage increases.
CO2 storage CO2 can be permanently stored both onshore and offshore in deep saline or depleted oil and gas reservoirs. There is no dedicated commercial storage yet in China. The largest demonstration project, in the Ordos Basin, was run by the Shenhua Group over 2011-2014, injecting approximately 300 kt of CO2 into a saline aquifer (Cai et al., 2020). Although injection has stopped, CO2 is still being actively monitored. Other demonstration projects injected much smaller volumes of CO2. Elsewhere in the world, five large-scale facilities injecting around 8 Mt/year of CO2 into saline formations are in operation today. CO2 storage in depleted oil and gas reservoirs has been limited to pilot demonstrations, but there are plans to develop commercial facilities, for example in the Netherlands and United Kingdom.
There is considerable potential for CO2 storage in China and theoretical capacity has been estimated at more than 325 Gt in onshore basins and 77 Gt in offshore

An Energy Sector Roadmap to Carbon Neutrality in China Chapter 4: Technology needs for the energy transition
PAGE | 169 IEA,
202
1.
basins (Guo et al., 2015; Kearns et al., 2017).5 There are extensive onshore saline storage resources in the northern, western, and central-eastern parts of China, including the Autonomous Regions of Inner Mongolia, Ningxia and Xinjiang and the Shaanxi province, while offshore basins, which are generally less well-explored but may be suitable for storage, are found along most of China’s coastline. Oil and gas fields, including in the Ordos, Bohai Bay and Songliao Basins, may also be suitable for CO2 storage once they have been depleted. Those regions are also the main areas where CO2-EOR is used today. Characterisation of the saline aquifers in regions with existing CO2-EOR activity could stimulate development of dedicated storage while oil and gas production continues. This could allow for shared CO2 transportation infrastructure and encourage the transition from CO2-EOR to dedicated storage.
Using data gathered during offshore oil and gas exploration and production to characterise offshore storage resources could help accelerate its development. However, the widespread development of offshore resources in China is likely to lag behind that of onshore resources by several years, given the additional cost and complexity and the fact that offshore transportation in China is still in the concept phase (ACCA21, 2019).
Storage costs in China, including monitoring for 20 years after site closure, are estimated at USD 8.70/t (CNY 60/t) for onshore saline aquifers, USD 43.48/t (CNY 300/t) for offshore saline aquifers and CNY 50/t (USD 7.25/t) for depleted oil and gas fields (ACCA21, 2019). China’s CCUS roadmap sets a goal of reducing saline storage costs by around one-fifth by 2030 to around USD 5.80-7.25/t (CNY 40-50/t) and half by 2050 to USD 3.62-4.35/t (CNY 25-30/t).
Carbon dioxide removal Carbon dioxide removal technologies involve extracting CO2 from the atmosphere, directly or indirectly (via the absorption of CO2 in biomass) and permanently storing it. Technology-based approaches to carbon dioxide removal based on CCUS will play an important role in meeting China’s climate neutrality objectives. BECCS is closer to large-scale commercialisation than DAC and makes a larger contribution to emission reductions in China in the APS, mostly after 2040.
The only operating large BECCS plant in the world is the Illinois Industrial CCS facility in the United States. It has been in operation since 2017, capturing
5 As with other regions, the theoretical storage potential in China varies according to the methodology used to assess it. Wei et al., 2013 estimates that 18% or 746 Gt of saline aquifer capacity onshore could be highly suitable for CO2 storage based on technical, geographic and social criteria. Kearns et al., 2017 provides a lower and upper estimation of 325-2 287 Gt and 77-544 Gt for onshore and offshore resources respectively.

An Energy Sector Roadmap to Carbon Neutrality in China Chapter 4: Technology needs for the energy transition
PAGE | 170 IEA,
202
1.
1 Mt/year of CO2 generated from ethanol production and storing it in a saline aquifer. BECCS can also be applied in the power sector, with CO2 capture attached to biomass-fired boilers (a process being trialled at the Drax power station in the United Kingdom) or attached to waste-to-energy plants (such as what is being developed at Fortum Oslo Varme in Norway). Waste-to-energy generates a combination of fossil and biological CO2 depending on the feedstock of a plant, which limits the amount of negative emissions.6 Given the widespread use of waste for electricity and heat generation in China, those plants could offer a first opportunity for BECCS, on condition their feedstock contains a large proportion of biomass.
DAC plants, which capture CO2 directly from ambient air as opposed to a point source, require significant amounts of low-carbon energy. Several small pilot-scale plants are currently operating around the world, with the captured CO2 being used in commercial facilities. A large-scale DAC facility is in development in the United States. The optimal siting of DAC for carbon removal is in regions where there is access to low-cost renewable sources of energy or nuclear power and CO2 storage resources. Based on the colocation of hydropower and CO2 storage resources in the Sichuan Basin, the Sichuan Province has been identified as a region with good potential for DAC (Pilorgé et al., 2021). The Songliao Basin in northeastern China has also been identified as a potential region for DAC based on the colocation of CO2 storage resources with wind or solar power (Pilorgé et al., 2021).
Infrastructure needs For CCUS to reduce China’s emissions to the extent projected in the APS, an extensive CO2 transport and storage network is needed. The deployment of this infrastructure will require government co-ordination and support at regional and national levels. Centralised project tracking and reporting could aid co-ordination.
Initially, CCUS activities are expected to be centred on developing CO2 storage resources in proximity to large industrial ports and major industrial clusters such as those in eastern China. Five regions could act as onshore storage hubs. They are home to many existing coal-to-chemicals installations, natural gas processing facilities and CO2-EOR projects. Hydrogen production will most likely be concentrated in these regions since they also have vast wind and solar, as well as fossil fuel, resources. As oil production and CO2-EOR decline, part of the regional
6 The Intergovernmental Panel on Climate Change considers that between 30-50% of the total CO2 from incinerated municipal solid waste is generally of fossil origin (IPCC, 2006).

An Energy Sector Roadmap to Carbon Neutrality in China Chapter 4: Technology needs for the energy transition
PAGE | 171 IEA,
202
1.
work force could be retrained to work in the CO2 management industry since it requires many of the same skills (see Chapter 5).
Potential CO2 storage hubs in China
Storage Resources Provinces CO2 sources Existing CCUS activities
Bohai Bay Basin Beijing, Tianjin, Hebei (North China)
Power, chemicals, refining, iron and steel, cement
CO2-EOR in the Shengli and Zhongyuan oil fields
Junggar and Turpan-Hami basins
Xinjiang (northwest China)
Power, refining, chemicals, cement, iron and steel
CO2-EOR in Xinjiang oil field (Xinjiang CCUS Hub)
Ordos basin Shanxi, Shaanxi (north China)
Power, refining, chemicals, cement, iron and steel
Permanent storage pilot under post-closure monitoring;CO2-EOR in the Jingbian, Ansai, Wuqi, and Jiyuan oil fields
Songliao Basin Heilongjiang, Jilin (northeast China)
Power, refining, chemicals, cement, iron and steel
CO2-EOR in the Jilin oil field
Sichuan Basin Sichuan (central China) Power, refining, cement, iron and steel Unknown
Notes: All CO2 sources are within 50 km. The Xinjiang CCUS Hub is part of the Oil and Gas Climate Initiative (OGCI) Kickstarter programme. The potential storage capacity of the Sichuan Basin is considered more limited than that of the others shown here. Sources: IEA analysis based on IEA’s research and ACCA21 (2019).
Onshore and offshore CO2 storage sites can receive CO2 from a single source or several of them. Storage sites accessible to multiple capture facilities can benefit from economies of scale and reduced commercial risk, and can help to stimulate the development of a CO2 management industry. Porthos in the Netherlands and Northern Lights in Norway are examples of projects that have adopted the multi-source model.
Although more expensive than onshore CO2 storage, the development of offshore storage resources located near existing industrial ports (with high emissions) could be a preferred alternative to transporting CO2 long distances for onshore storage. Establishing new pipeline routes directed inland from ports may require routing through densely populated areas and as a result may be more challenging than routing pipelines through existing industrial zones to offshore. The government intends to develop offshore storage projects in a phased manner to demonstrate their feasibility (ACCA21, 2019). In August 2021, China National

An Energy Sector Roadmap to Carbon Neutrality in China Chapter 4: Technology needs for the energy transition
PAGE | 172 IEA,
202
1.
Offshore Oil Corporation announced plans for China’s first offshore storage facility linked to the Enping 15-1 oilfield in the South China Sea, with capacity to store as much as 300 kt/year of CO2.
The bulk of existing emissions-intensive activities in China are located in the eastern and central regions, notably along the coast and in the Yangtze and Yellow River valleys. Based on the current location of emissions sources, an estimated 45% of existing power and industrial facilities, emitting 3.3 Gt/year, have at least one potential storage resource within 50 km and 64% of them, emitting 4.7 Gt/year, are located within 100 km. This suggests that a large proportion of CO2 captured in the APS could come from plants that are within proximity to a storage resource, unless the location of emissions changes in the coming decades.
Map of CO2 sources and potential geological storage in China
IEA, 2021.
Notes: The pipeline routes presented here are a selection of existing or planned natural gas trunk lines in China that cross through or connect to saline basins, large ports and industrial clusters. These routes can serve as an illustration of potential routes for CO2 trunk lines, but may not be indicative of the full size, extent, or routing of such a network. This map included herein, is without prejudice to the status of or sovereignty over any territory, to the delimitation of international frontiers and boundaries and to the name of any territory, city or area. Source: IEA analysis based on IEA’s research, storage data provided by the Chinese Academy of Sciences, and natural gas trunk lines from Berman (2017).
In China, a national network of more than 15 000 km of CO2 trunk lines could connect emissions sources, sinks, and ports.

An Energy Sector Roadmap to Carbon Neutrality in China Chapter 4: Technology needs for the energy transition
PAGE | 173 IEA,
202
1.
CO2 pipelines are widely considered to be the most cost-effective and scalable way to transport emissions from source to sink. High-capacity trunk lines operating across and between regions may be more economically efficient than multiple smaller capacity pipelines serving the same geographic region. Clusters of large-scale emissions sources across the country could be connected to their nearest CO2 storage resources using trunk lines in the same way as natural gas distribution. The routes of existing pipelines – for natural gas, crude oil and refined products – are likely to be similar to those that will be required to transport CO2. Over time, some of these existing pipelines could be converted to transport CO2, or large CO2 trunk lines could be built alongside existing pipelines to benefit from existing right of way access and engineering studies.
The development of CO2 trunk lines could be optimised by using a transmission service operator model where an entity operates a regulated regional or national transmission system that can be accessed by multiple users. Many natural gas pipelines are operated this way. This approach could encourage the construction of oversized trunk lines to minimise the risk of needing to expand transport capacity soon after its commissioning as demand increases. The Alberta Carbon Trunk Line in Canada is an example of this. State-owned enterprises or other businesses with expertise in pipeline operations could take the lead in planning and developing shared CO2 pipeline infrastructure.
We have identified three potential deployment strategies for trunk lines in China. These strategies are defined by the total length of trunk lines in 2060 and are determined by the scale of investment in offshore storage; the extent to which the location and capacity of sources and sinks are well matched; and regional and national strategies to relocate emission sources close to or on top of storage resources. Source-sink matching is used to optimise transportation and to ensure that storage sites are matched with capture facilities. Its importance diminishes with increasing trunk line length because of the additional redundancies built into such a system, however, shorter transportation distances are generally less expensive. The local and regional deployment strategies rely more heavily on the deployment of offshore storage.

An Energy Sector Roadmap to Carbon Neutrality in China Chapter 4: Technology needs for the energy transition
PAGE | 174 IEA,
202
1.
CO2 trunk line deployment strategies towards 2060
●High ● Moderate ● Low Notes: In all cases, it is assumed that trunk lines are operated following a common carrier or transmission service operator model - thereby accepting CO2 from any source with a fixed transport fee. IEA analysis on routing relies on the routes of natural gas pipelines in China. It assumes that co-locating CO2 pipelines alongside natural gas pipelines or converting natural gas pipelines to CO2 pipelines would be more cost effective than creating entirely new routes. Sources: IEA analysis based on IEA’s research storage data provided by the Chinese Academy of Sciences, and natural gas trunk lines from Berman (2017).
A cross-country CO2 trunk line network in excess of 15 000 km of CO2 pipeline could be required to connect industrial clusters to storage resources by 2060 in the APS. That is about twice the length of the existing CO2 pipeline network in the United States and Canada. The national deployment strategy could allow China to capitalise on economies of scale by deploying large trunk lines that support high mass flows. It could also introduce redundancies into the system to ensure that captured CO2 can always be transported to a storage site even when sites reach capacity, have to be closed for maintenance or experience other operational delays.
The development of CO2 management infrastructure will need take into account national and regional strategies aimed at relocating or decommissioning large carbon-intensive industrial and power plants. Deployment plans for hydrogen and renewable energy should also be considered. Western China has significant storage resources and lower population density than eastern or central China. However, it also has fewer large-scale sources of emissions as it has less heavy industry. Co-locating emissions-intensive, carbon removal, or hydrogen installations with storage resources in western China could have economic and social benefits for the region.
Optimised
source-sink
matching
Offshore storage capacity
Reuse of pipeline routes
Economies of scale
System redundancies
Potential for
capacity constraints
Local strategy Intra-basin ~5000 km ● ● ● ● ● ●
Regional strategy Intra-basin lines and
limited inter-basin connection
10 000 to 15 000 km ● ● ● ● ● ●
National strategy Cross-country
network >15 000 km
● ● ● ● ● ●

An Energy Sector Roadmap to Carbon Neutrality in China Chapter 4: Technology needs for the energy transition
PAGE | 175 IEA,
202
1.
Hydrogen
Role in the energy transition Hydrogen – an energy carrier like electricity – can be an option to decarbonise energy end-use sectors where few alternatives exist, notably long-distance transport, chemicals and iron and steel production (see Chapter 3). With increasing shares of variable renewables in the electricity generation mix, it is also one of the very few technology options for storing large amounts of electricity over days, weeks or even months. Hydrogen can be produced from a variety of energy resources, including natural gas, coal, oil, renewables and nuclear energy, and can be converted into feedstocks for the chemical industry or, in combination with CO2, into synthetic hydrocarbon fuels for the transport sector.
CO2 emissions from hydrogen production drop sharply by 2060 in the APS. CCUS is also retrofitted to reduce emissions from some existing fossil-based hydrogen plants. Direct emissions (i.e. excluding downstream emissions from the use of hydrogen-derived products such as urea and methanol) drop from around 360 Mt in 2020 to 300 Mt in 2040 and 60 Mt in 2060, with some residual emissions from plants equipped with capture facilities. The use of hydrogen and hydrogen-based fuels from low-carbon sources avoids the emission of close to 16 Gt CO2 cumulatively to 2060 in China. The biggest CO2 reductions from these fuels comes from industry, especially the chemical and steel sectors, accounting for more than 50% of those emissions avoided in the APS, with the use of hydrogen and ammonia in shipping and synthetic kerosene in aviation together contributing 20%, and hydrogen in road transport 13%.
CO2 emissions avoided from hydrogen in China by sector in the APS
IEA, 2021.
Heavy industry and long-distance transport contribute to 80% of emissions reductions from the use of low-carbon hydrogen and hydrogen-rich fuels.
-1000
-750
-500
-250
02020 2025 2030 2035 2040 2045 2050 2055 2060
Mt C
O2 Buildings
Transport - trucks andbuses
Transport - cars andtwo/three wheelers
Transport - aviationand shipping
Heavy industry
Other industry
Other energy supply

An Energy Sector Roadmap to Carbon Neutrality in China Chapter 4: Technology needs for the energy transition
PAGE | 176 IEA,
202
1.
The contribution of hydrogen and related fuels to China’s energy transition grows progressively over 2021-2060, especially after 2030, in the APS. Total hydrogen demand increases 20% to 31 Mt by 2030 and more than threefold to 90 Mt by 2060 (see Chapter 3). The fuel accounts for 6%7 of China’s final energy demand in 2060, of which close to 20% is in the form of ammonia (used mainly in shipping) and synthetic hydrocarbon fuels (used mainly in aviation). The share of hydrogen in final energy use is biggest in the transport sector. Although EVs dominate road transport due to their higher efficiency, hydrogen and hydrogen-derived fuels are used heavily in road freight, shipping and aviation. Overall, they meet close to one-quarter of total transport energy needs in 2060. In industry, it accounts for 10% of total energy use (including on-site hydrogen production); in chemicals and steel production, its contribution is significantly larger, at 15% and more than 20% respectively. In the buildings sector, the share of hydrogen is limited to less than 3% (practically all in the form of pure hydrogen in new dedicated pipelines or converted natural gas ones).
Hydrogen production by route and hydrogen demand by sector in China in the APS
IEA, 2021.
Notes: CNR = catalytic naphtha reforming; CCUS = carbon capture and utilisation or storage.
Hydrogen demand more than triples by 2060, with low-carbon hydrogen – mainly electrolytic – accounting for practically all production
For hydrogen to contribute to reducing CO2 emissions, it must be produced from low-carbon energy sources. For synthetic fuels, which are produced using
7 This excludes onsite hydrogen production and use in the industry sector, which consumes around 8% of energy demand in industry today. Including on-site hydrogen production in industry, hydrogen and hydrogen-based fuels meet 10% by 2060 in the APS.

An Energy Sector Roadmap to Carbon Neutrality in China Chapter 4: Technology needs for the energy transition
PAGE | 177 IEA,
202
1.
hydrogen and carbon monoxide, to be carbon neutral, the carbon monoxide must be generated from biogenic CO2 or captured from the atmosphere, using DAC technologies. In the short term, most of the growth in low-carbon hydrogen production comes from electrolytic hydrogen despite it being more costly than fossil-based routes with CCUS over that period (see Chapter 3). The time required to develop the infrastructure to transport and store the CO2 and the fact that there are only two projects under development for hydrogen production with CCUS in China today (equivalent to an overall 1.1 Mt CO2 captured per year) means that production via those routes is unlikely to come online before 2030. In contrast, electrolysis has strong momentum in China with a significant number of projects currently under development. These projects, while small in capacity terms, have much shorter development times given electrolysers can be mass manufactured and are less dependent on enabling infrastructure. In the APS, electrolytic hydrogen meets around 7% of total hydrogen demand already in 2030, almost 90% of which comes from the chemical industry (production of electrolytic ammonia and methanol) and the steel sector (hydrogen-based direct reduced iron). After 2030, fossil-based hydrogen production in industrial facilities is either retrofitted with CCUS or replaced (especially in the case of coal-based production) by the rapid expansion of electrolytic hydrogen. By 2060, nearly all hydrogen demand is met by low-carbon technologies, almost 80% of which being electrolytic hydrogen, which emerges as a competitive production route.
The role of hydrogen in China’s energy transition to carbon neutrality reflects the country’s resource endowments and industrial heritage. Existing plants that require hydrogen (e.g. ammonia and methanol production, refineries) must consider the trade-offs between decarbonising their hydrogen supply using electrolytic hydrogen from renewables, or retrofitting fossil fuel production with CCUS. Factors such as proximity to good wind and solar resources and CO2 storage sites, and the potential to create hubs with neighbouring plants will determine the most economic production route in each region. In the APS, hydrogen provides a means of storing and transporting renewable energy from regions with abundant renewable resources such as Inner Mongolia and Xinjiang (onshore wind and solar PV) or the coastal regions of Fujian and Guangdong (offshore wind) over thousands of kilometres to inland regions with less renewables potential and large demand for hydrogen in industrial clusters (Shaanxi, Chongqing). However, clusters in Hebei and Shandong provinces, which have a very young fleet of plants currently using coal to produce ammonia and methanol, might consider retrofitting existing plants with CCUS due to their

An Energy Sector Roadmap to Carbon Neutrality in China Chapter 4: Technology needs for the energy transition
PAGE | 178 IEA,
202
1.
proximity to depleted oil and gas reservoirs. Regions like Jiangsu have both a large potential for renewables (offshore wind) and good access to potential CO2 storage capacity.
Existing oil refineries, ammonia and methanol plants, cost of renewables-based hydrogen production and potential CO2 storage sites in China
IEA, 2021.
Notes: LCOH = levelised cost of electrolytic hydrogen produced using dedicated wind and solar energy systems. Assumptions for techno-economic parameters available at IEA (2021e). This map included herein, is without prejudice to the status of or sovereignty over any territory, to the delimitation of international frontiers and boundaries and to the name of any territory, city or area. Sources: IEA analysis based on IEA’s research and hourly wind data from Hersbach et al. (2018) and hourly solar data from renewables.ninja (2021). CO2 storage data provided by the Chinese Academy of Sciences.
Proximity to wind and solar resources, CO2 storage sites and the potential to create industrial hubs will determine the most economic production route for hydrogen in each region
Technology readiness The value chain for low-carbon hydrogen comprises many technologies needed to produce, transport, store and consume low-carbon hydrogen, each of them at a different stage of maturity. Electrolysis with low-carbon electricity to produce hydrogen is a commercial technology, but it needs to be deployed on a larger scale to bring down costs to a level that makes it competitive with conventional

An Energy Sector Roadmap to Carbon Neutrality in China Chapter 4: Technology needs for the energy transition
PAGE | 179 IEA,
202
1.
production routes. Similarly, natural gas reforming or coal gasification with CCUS are proven technologies, but have not yet been widely deployed for cost reasons. There are already three CCUS demonstration plants operating in China, all of them using the captured CO2 in EOR: the Karamay Dunhua Oil Technology CCUS EOR Project, which captures 0.1 Mt CO2/year from the oil-based production of methanol, a small coal-based methanol plant in the Changqing oilfield (capturing 0.05 Mt CO2/year) and a coal-based ammonia plant in the Zhongyuan oilfield (capturing 0.1 Mt CO2/year) (IEA, 2021c). Two other demonstration projects under construction are expected to become operational in 2021: the Yanchang Integrated Carbon Capture and Storage Demonstration Project, which will produce hydrogen from coal while capturing 410 kt/year of CO2, and the Qilu Petrochemical CCS Project in Zibu City, which will capture and store up to 700 kt CO2/year from an ammonia plant.
The use of hydrogen for making ammonia and methanol is already large, reaching 17 Mt in 2020, but the use of low-carbon hydrogen as a feedstock in chemicals production and as a reducing agent in the iron and steel industry remains small for now. The use of electrolytic hydrogen in heavy industrial processes is at the demonstration stage today. In the chemicals industry, the production of ammonia and methanol from electrolytic hydrogen using variable renewable electricity are more mature technologies, with some small-scale pre-commercial methanol already in operation and several large demonstration projects for ammonia production under construction around the world. In China, Ningxia Baofeng Energy Group have installed a 30 MW electrolyser to provide some of the feedstock for making the methanol used in its coal to olefins project in Ningxia Province (BNEF, 2021). The company is expanding this capacity to reach 100 MW by the end of 2021, which will make the plant the largest electrolyser for dedicated hydrogen production in the world. In the steel industry, the use of high blending shares (up to 100%) for the iron ore reduction step is at an early stage of development and is not expected to be demonstrated at scale until the late 2020s. Baosteel, the country’s largest steel producer, has pledged to reach net zero emissions by 2050, in part by developing hydrogen-based direct reduced iron (DRI) production, starting large-scale production by 2035. Hebei Iron and Steel Group (HBIS), the second-largest producer, has already built a small commercial-scale DRI plant, blending 70% hydrogen with coke oven gas.
Beyond the industrial sector, end-use hydrogen technologies are at different stages of development. In the transport sector, FCEVs are available today on the market for passenger cars, light-duty vehicles and buses, whereas further developments are needed before fuel cell trucks can be more widely deployed. Hydrogen boilers and fuel cells for space heating and electricity generation in

An Energy Sector Roadmap to Carbon Neutrality in China Chapter 4: Technology needs for the energy transition
PAGE | 180 IEA,
202
1.
buildings are also commercially available, although they face strong competition with more efficient technologies such as heat pumps. In electricity production, fuel cells are available on the market for distributed generation applications and gas turbines have the capability to run on hydrogen-rich gases. Manufacturers are confident to provide standard gas turbines capable of running on pure hydrogen by 2030. Other uses of hydrogen-based fuels that play a significant role in getting China to carbon neutrality in the APS, such as ammonia as a shipping fuel and synthetic aviation fuels, are still at the pre-demonstration stage and must overcome certain barriers, such as toxicity, nitrous oxide emissions in ammonia use and high production costs, notably for synthetic fuels.
Technologies for transporting and distributing hydrogen, which will be critical to scaling up hydrogen use, are at differing stages of maturity. Hydrogen pipelines are already mature and their wider deployment, especially over long distances, will depend on the wider use of hydrogen and the development of a competitive low-carbon hydrogen market to encourage industrial users to source merchant hydrogen from the market instead of producing it onsite. The transport of liquid hydrogen in tanker trucks for short distance delivery is also a mature technology, although improvements are needed, such as reducing energy needs in liquefaction and minimising boil-off, and costs needed to be lowered. Hydrogen refuelling stations (HRS) are mature as well and their deployment is advancing quickly in China. In 2021, Sinopec announced a plan to deploy 1 000 HRS by 2025. However, other technologies, such as long-distance transport of hydrogen by ships or blending of hydrogen into natural gas grids, are still being tested as prototypes or as commercial demonstration projects. Activity in these areas in China is still very limited.
In the APS, 90% of the CO2 emissions avoided due to the adoption of hydrogen technologies in China between 2020 and 2060 are associated with technologies that are at demonstration or earlier stages of development. Among the end-use technologies that make significant contributions, only FCEV passenger cars are commercially available – though expensive – today (see below). The production of electrolytic ammonia and methanol need to be widely demonstrated in the early 2020s to facilitate their rapid deployment from the late 2020s. The use of hydrogen and ammonia in shipping and synthetic fuels in aviation are at very early stages of development and will require strong support for innovation to reach commercialisation in the 2030s.

An Energy Sector Roadmap to Carbon Neutrality in China Chapter 4: Technology needs for the energy transition
PAGE | 181 IEA,
202
1.
Cumulative CO2 emissions avoided for selected low-carbon hydrogen technologies by maturity in China in the APS
IEA, 2021.
Note: DRI = direct reduced iron; HC = hydrocarbon; VRE-electrolysis = electrolysis using variable renewable energy. Maturity categories are assigned based on a detailed assessment of technology readiness levels of individual technology designs presented in the IEA Clean Energy Technology Guide (IEA, 2020a).
90% of the emissions avoided thanks to hydrogen-based technologies are at the prototype or demonstration stage today, with VRE-electrolysis for chemicals production accounting for 40% of the total
Focus on manufacturing electrolysers for making hydrogen Electrolysis, a technique that uses direct electric current to drive an otherwise non-spontaneous chemical reaction, is a relatively mature technology that has been long-used in certain industrial processes, such as the production of chlorine in the chlor-alkali process (in which hydrogen is produced as a by-product). Electrolysis of water yields pure oxygen and hydrogen. There are several different types of electrolysers. Alkaline and polymer electrolyte membrane (PEM) electrolysers are already commercial, whereas solid oxide electrolyser cells (SOECs) are at pre-commercial stage and anion exchange membranes at much earlier stages of development.
The last couple of years have seen a significant increase in interest in electrolytic hydrogen production in China. Capacity increased fourfold to 18 MW in 2020 (accounting for one-quarter of global additions) and a further ninefold increas is expected in 2021. More than 2 GW of capacity are currently under construction or planned (including Ningxia Baofeng Energy’s 100 MW plant – see above). Unlike some other countries, such as Chile and the European Union, China does not have any target for the deployment of electrolysers. Capacity is nonetheless expected to keep growing in the next few years, although its uptake may be slower than in other regions. It is possible that the demand for electrolysers in China will ramp up faster once the uptake of renewables in the Chinese energy system has reached a certain
0 1 2 3 4 5 6
Hydrogen boilers and fuel cells in buildings
Fuel cell electric buses
Fuel cell electric trucks
Fuel cell electric cars
Ammonia-fuelled ships
Synthetic liquid HC production
Hydrogen-based DRI
Hydrogen-fired cement kilns
VRE-Electrolysis for methanol and ammonia production
Gt CO2
Mature Market uptake Demonstration Prototype

An Energy Sector Roadmap to Carbon Neutrality in China Chapter 4: Technology needs for the energy transition
PAGE | 182 IEA,
202
1.
level. Ultimately, the market development of electrolysers will require a national hydrogen strategy to provide some guidance to investors about the prospects for hydrogen demand. Recent FYPs have stimulated the deployment of renewables in electricity generation but have led to grid congestion, as much of the capacity, notably in Inner Mongolia, is far from demand centres. As a result, policy makers are promoting the local use of these resources, which could include hydrogen for use in heavy-duty transport or industrial applications.
Box 4.4 China’s role in global hydrogen value chains
The use of electrolysis for dedicated hydrogen production has not yet been widely adopted anywhere in the world, though deployment has increased in the last few years, with a more-or-less even split between alkaline and PEM designs (SOEC are still limited to small demonstration projects). Deployment has hit a new record every year since 2018. In 2020, more than 60 MW of electrolysis capacity was brought online worldwide, taking total installed capacity to more than 300 MW. China was slow to start investing in electrolysers for dedicated hydrogen production, but has started to catch up with the rest of the world.
Global manufacturing capacity is around 3 GW today. As with other low-carbon technologies such as batteries or fuel cells, China is a big player in electrolysis manufacturing with one-third of global capacity (Europe has most of the rest). The 718 th research institute of China State Shipbuilding Corporation (PERIC) is the largest electrolyser manufacturer in China, followed by Cockerill-Jingli Hydrogen and TianJin Mainland. All three companies manufacture alkaline electrolysers due to their traditional focus on chlor-alkali processes.
Alkaline designs are likely to remain the leading technology for dedicated hydrogen production for the foreseeable future in China since these companies are expanding rapidly their manufacturing capacity and have a good knowledge base to draw from. Moreover, the lack of PEM manufacturers in China has pushed project developers interested in this technology to look for foreign manufacturers. For example, State Power Investment Corp is currently developing a 1 MW demonstration project with Siemens in Beijing to produce hydrogen for transport, which is expected to come online in the second half of 2021 (Siemens, 2020).
China had a head start over the rest of the world in reducing the cost of alkaline electrolysers, reaching USD 750-1300/kW today (including electric equipment, gas treatment, balance of plant and engineering, procurement and construction [EPC]), though some sources point to costs as low as USD 500/kW compared with around USD 1400/kW in the rest of the world (China EV100, 2020; MOST, 2021). The reliability and durability of electrolysers, which have an important impact on the

An Energy Sector Roadmap to Carbon Neutrality in China Chapter 4: Technology needs for the energy transition
PAGE | 183 IEA,
202
1.
final cost of producing hydrogen across the lifetime of the plant, vary across countries. However, manufacturing is improving fast in China. A few years ago, Chinese manufacturers needed to import several components for manufacturing electrolysers, limiting their ability to bring down costs through economies of scale. More components are now manufactured in China and those that are still imported will be manufactured in China soon, allowing industrial clusters to develop, replicating previous successful experiences to bring manufacturing costs down.
Electrolyser capacity expands quickly in the APS, reaching close to 25 GW, or around 15% of global capacity, by 2030. More than 90% of this capacity is in industrial facilities, mainly in steel manufacturing and for the synthesis of chemical products, while the rest is devoted to the production of merchant hydrogen to meet demand from the transport and oil refining sectors. After 2030, new sources of demand for electrolytic hydrogen emerge, particularly for the production of ammonia to be used as shipping fuel. By 2060, electrolysis capacity in China reaches 750 GW, equal to nearly 40% of the world total. With global additions of electrolysis capacity projected to grow by a factor of 700 by 2060, costs fall substantially. By 2030, the global average capital cost reaches less than USD 600/kW of capacity, compared with around USD 1400/kW at present. Costs are lowered by economies of scale, automation and enhanced manufacturing techniques (learning by doing), better designs, such as alkaline electrolysers, and increased competition between technology providers.
Global electrolyser capacity for dedicated hydrogen production and average unit CAPEX in the APS
IEA, 2021.
Notes: electrolyser costs include electrical equipment, gas treatment, balance of plant and EPC.
China accounts for around 15% of the electrolysis capacity added globally by 2030 and 40% by 2060, helping to drive costs down by 70%

An Energy Sector Roadmap to Carbon Neutrality in China Chapter 4: Technology needs for the energy transition
PAGE | 184 IEA,
202
1.
Focus on fuel cells for vehicles The demand and production of fuel cells for powering road vehicles will need to expand rapidly for the transport sector to decarbonise at the rate projected in the APS. The take-up today remains small and limited to trucks and buses, albeit China leads the world in these fuel cell vehicle segments: at the end of 2020, close to 5 300 fuel cell buses were operating in China, compared with around 360 in the rest of the world, and more than 3 100 fuel cell trucks (less than 100 elsewhere). The focus on buses and trucks is strategic, as these have predictable routes, they require less refuelling infrastructure, and have higher utilisation rates than passenger cars. In 2020, sales of FCEV trucks (including light-commercial vehicles) overtook sales of FCEV buses for the first time (AFC TCP, 2021). Most of these vehicles in the fleet today have relatively small fuel cells (30-50 kW compared with 75-150 kW in conventional fuel cell buses) functioning as range extenders rather than the primary source of energy.
The deployment of heavy-duty vehicles with fuel cell range extenders in China is the result of a number of regional initiatives, at the provincial and city level, as well as a central government scheme introduced some years ago, which required only a 30 kW fuel cell to qualify for the subsidy. A new reward-based scheme was introduced in 2020 to accelerate regional hydrogen demonstration projects in urban clusters. Financial support is provided to city-level governments, as opposed to direct subsidies to companies or individuals that purchase such vehicles. A maximum of around USD 245 million (CNY 1.7 billion) is to be allocated to each cluster by 2023 to fund RD&D in FCEV demonstrations and related technologies. City governments will be rewarded according to their success in stimulating innovation along the entire value chain and achieving various performance targets. Those governments will award subsidies to leading manufacturers specialising in key fuel cell components, such as membrane electrode assemblies and bipolar plates, as well as to buyers of FCEVs for medium- and heavy-duty applications, on condition they meet certain technical and operational thresholds such as minimum driving range and warranty standards. Subsidies will also be made available for companies that produce, transport, and distribute hydrogen to reduce the price of hydrogen at the pump. These subsidies will augment those already in place. The final list of city clusters has yet to be made public.

An Energy Sector Roadmap to Carbon Neutrality in China Chapter 4: Technology needs for the energy transition
PAGE | 185 IEA,
202
1.
Box 4.5 Regional hydrogen FCEV strategies in China
China has not yet prepared a national hydrogen strategy or roadmap with specific targets and implementation measures for FCEVs. However, the provinces of Shandong, Hebei, Jilin, Liaoning, Guizhou, Guangdong, Shaanxi and Gansu, the autonomous regions of Guangxi and Inner Mongolia, and the municipalities of Beijing and Shanghai have announced or are developing their own hydrogen strategies aimed at promoting regional economic development, energy diversification and emissions reductions. These strategies cover various technologies, including power-to-gas, renewable electricity storage, use in transport and blending into the gas grid (Energy Iceberg, 2021). The FCEVs are the focus of most of them, targeting a combined total of at least 63 000 FCEVs by 2025, of which Beijing, Shanghai and Shandong each account for 10 000.
One example of the regional strategies for deploying FCEVs is in the Pearl River Delta Area industrial hub in Guangdong, dubbed China’s Silicon Valley, where many of the companies that are pioneering FCEV development are based. In 2020, Guangdong province had the highest FCEV sales, with Foshan and Guangzhou both in the top 5 cities for FCEV sales, and by year-end there were 30 hydrogen refuelling stations in Guangdong (Chunting 2021). Guangdong’s lead in FCEV industry is supported by local policy and the competitiveness of the region’s manufacturing base. In 2016, Foshan became the first city in China to operate a hydrogen-fuelled FCEV transit bus line. Guangzhou, the largest city in the province, aims to deploy 3 000 FCEVs by 2022 and convert at least 30% of the city’s bus fleet to FCEVs by 2025.
The rapid deployment of FCEVs has facilitated the development of local supply chains. Fuel cell system manufacturers in Guangdong, including CEMT, Refire and Synergy Technology, supplied at least 40% of China’s total demand. Hydrogen is supplied mainly from industrial processes such as coke production, where it is a by-product contained in residual gas streams, but electrolysis demonstration projects, which could reduce CO2 emissions, are planned.
Another example of regional development of low-carbon hydrogen production and use in FCEVs is in Beijing and the neighbouring province of Hebei. Major demonstration projects have been initiated, including for the Winter Olympics and Paralympics in 2022, which will be co-hosted by the municipality and province. By March 2021, the size of the FCEV bus fleet in Zhangjiakou in Hebei province, reached over 300 and is due to reach 2 500 by the start of the event. With its large wind power resources, Hebei is a national leader in renewables-based electrolysis projects. More than ten have already been announced and several large projects will begin operation by the end of 2021 and 2022. Fuel cells are mostly supplied by Sino-Hytec, a Beijing-based producer with its main factory in Zhangjiakou, using technology developed by a joint venture with Toyota, set up in 2020.

An Energy Sector Roadmap to Carbon Neutrality in China Chapter 4: Technology needs for the energy transition
PAGE | 186 IEA,
202
1.
In Shandong Province, the Ministry of Science and Technology and the Shandong Provincial Government recently signed a framework agreement on the "Hydrogen into 10 000 families" project. This project aims to demonstrate the use of hydrogen in industrial parks, community buildings, road transportation and ports, and to develop dedicated hydrogen transportation infrastructure. The initiative will receive a total investment of more than CNY 30 billion Yuan during the 14th FYP period to deploy 100 HRS and 10 000 FCEVs, and to ramp up hydrogen demand by around 50 000 tonnes each year until 2025.
China’s fuel cell manufacturing capacity is currently around 75 000 systems per year. Facilities are mostly located near the centres of FCEV demand in Hubei, Shandong and Shanxi and Guangdong provinces – the biggest markets thanks to local policy support, including procurement, and the competitiveness of the regions’ manufacturing base. The price of Chinese manufactured fuel cell systems has dropped by about one-third over recent years and should continue to fall with lower production costs as output rises to meet demand. Chinese fuel cells and FCEVs currently have no real cost advantage on the international market. In view of regional FCEV deployment targets, however, economies of scale could give Chinese manufactures a cost advantage in the coming years. However, the current regional approach could segregate the market, as local producers are favoured in public procurement, which may lead to inefficient investments and reduce the potential to scale-up production among several small local manufacturing plants as opposed to fewer but larger plants better able to exploit economies of scale. In the APS, average costs in China drop from around USD 175/kW (CNY 1207/kW) today to about USD 80/kW (CNY 552/kW) in 2030 and USD 50/kW (CNY 345/kW) in 2060.
Fuel cell producers have already announced an expansion of their combined capacity to 200 000 units per year by 2022, far exceeding the most optimistic expectation of domestic FCEV sales. China’s Society of Automotive Engineers is targeting 50 000 FCEVs on the road by 2025 (below the combined total of 63 000 targeted by regional programmes) and 1 million by 2030. A growing share of these cells will probably go to light-duty vehicles, requiring additional investment in more widely dispersed refuelling infrastructure. In the APS, the total number of FCEVs on China’s roads reaches 750 000in 2030 and 48 million in 2060.

An Energy Sector Roadmap to Carbon Neutrality in China Chapter 4: Technology needs for the energy transition
PAGE | 187 IEA,
202
1.
Global demand for fuel cells for transport and average unit capital costs in the APS
IEA, 2021.
China accounts for over 10% of fuel cell vehicle demand in 2030, helping to drive down the cost of fuel cells
The growing deployment of FCEVs in China and elsewhere is pushing up global demand for platinum and palladium (known as platinum group metals, or PGMs) and raising concerns about future supply bottlenecks. PGMs provide the catalyst which converts hydrogen and oxygen to heat, water and electricity in a fuel cell. Platinum is also used in catalytic converters in conventional internal combustion engine vehicles (ICEVs). FCEVs currently require more platinum than ICEVs, though the amount needed in the former has fallen in recent years (IEA, 2021a). For example, Toyota was able to reduce platinum loading by about one-third between the first-generation model of the Mirai car in 2014 and the second-generation model that came out in 2020. Reducing fuel cell platinum loading further is a key objective of many public fuel cell RD&D programmes, e.g. in Japan and the United States. If successful, switching to FCEVs in China and the rest of the world could reduce substantially global demand for PGMs. We estimate that the deployment of FCEVs in China leads to a reduction of over 80% in national demand for PGMs in 2060 compared with 2020, assuming innovation to continue reducing platinum loading. Without such innovation, PGM demand would increase by about 140% from 2020 to 2060, despite the almost complete elimination of PGM demand for ICEVs due to their replacement with alternative drivetrains.
Infrastructure needs The widespread adoption of hydrogen and hydrogen-derived fuels as low-emissions energy carriers in China would require both modifications to existing infrastructure and the development of new infrastructure to distribute these fuels to end users. This includes hydrogen pipelines, HRS, large-scale storage facilities
0
35
70
105
140
175
210
0
2
4
6
8
10
12
14
2020 2030 2040 2050 2060
USD
/kW
Fuel
cel
l sta
cks
(milli
on)
Rest of the world China CAPEX

An Energy Sector Roadmap to Carbon Neutrality in China Chapter 4: Technology needs for the energy transition
PAGE | 188 IEA,
202
1.
and terminals at ports. Today, there are only around 100 km of dedicated hydrogen pipelines in China, all of them privately owned in industrial clusters. As shown earlier, the location of major industrial end-users, the proximity to large renewable resources and to adequate CO2 storage sites, and the pace and scope of growth of the distributed demand for hydrogen will determine the most suitable infrastructure in each region. This development will take time and will need to be carefully planned, but there are some short-term opportunities, like short-distance transport of liquid hydrogen using tanker trucks. Blending hydrogen into natural gas in existing networks can be a way to build up low-carbon supply while the hydrogen-specific infrastructure develops. Once it is ready, the low-carbon hydrogen supply infrastructure can deliver pure hydrogen to end users. Only Jilin province has so far considered this option yet, as the focus of hydrogen use up to now has been on the transport sector, which requires pure hydrogen (Energy Iceberg, 2021). If hydrogen blending were to be pursued, it would require the adoption of international harmonised safety standards and national regulations on the maximum blend of hydrogen in natural gas networks.
Repurposing existing high-pressure gas transmission pipelines to carry pure hydrogen, where technically feasible, is another possibility in China. This would help create a national hydrogen network to connect centres of demand. However, the natural gas network in China is relatively young and is still expanding to meet rising demand, so it will be several years before certain sections may become candidates for conversion. For that reason, it is essential to plan the development of new natural gas pipelines to make sure that those built between potential big centres of hydrogen (like existing industrial hubs and refineries in regions like Hebei, Shanxi, Shaanxi or the coastal cities) and regions with potential for producing low-cost hydrogen (like western provinces) are designed to be hydrogen-ready to facilitate their repurposing in the future.
The development of new dedicated hydrogen pipelines will also be required. Building them in industrial clusters, for example in the north-western regions (Inner Mongolia, Shanxi, Shandong and Shaanxi), where demand is concentrated and high rates of utilisation of the pipeline capacity can be guaranteed, can be a low-regret economic option. Around 50% of China’s hydrogen demand for ammonia and methanol production today is concentrated in those regions. This could follow a similar model to that in the transport sector, where HRSs have been initially deployed in industrial hubs. The availability of large quantities of by-product hydrogen from the chemicals sector and intensive use of the fuel in commercial FCEVs have ensured that HRSs are well-utilised.

An Energy Sector Roadmap to Carbon Neutrality in China Chapter 4: Technology needs for the energy transition
PAGE | 189 IEA,
202
1.
HRSs are another important component of hydrogen infrastructure. China has the second-largest HRS networks in the world. Currently, more than 100 stations are in operation (compared with more than 800 000 public EV charging stations) – just behind Japan with more than 130 stations. It will most likely become the world leader very soon given the strong support from several municipal FCEVs pilot programmes and plans for new stations (IEA, 2021a). For example, Sinopec recently announced plans to install 1 000 new HRSs by 2026 (Sinopec, 2021). In the APS, deployment accelerates to 2 700 in 2030 and 27 000 in 2060.
The growth of hydrogen use in China in the APS also calls for a major expansion of low-carbon electricity generation to meet the needs of electrolysers. By 2060, close to 3 300 TWh of electricity is needed for hydrogen production, equal to one-fifth of China’s total electricity output. All this additional electricity comes from low-carbon sources. While the scale of expansion of generating capacity is daunting, it presents an opportunity to tap into low-cost variable renewables as hydrogen effectively provides a means of energy storage. In practice, a significant share of electricity generation from renewables could be dedicated to hydrogen production (see Chapter 3). Nuclear power could also be dedicated to electrolytic hydrogen production; the China National Nuclear Corporation has already started some demonstration projects (Energy Iceberg, 2020). Hydrogen production from fossil fuels with CCUS, including retrofits of some existing plants with CO2 capture equipment, which contributes 15% of total hydrogen production in 2060, is supported by the synergies with other capture applications in industrial hubs and the possibility to make use of joint CO2 transport and storage infrastructure.
Bioenergy
Role in the energy transition Modern bioenergy technologies, in the form of gaseous and liquid biofuels derived from renewable biomass feedstock or direct burning of biomass in power and heat generation, have the potential to make an important contribution to decarbonising China’s energy system. An important advantage of bioenergy is that it can be converted into energy forms that are compatible with existing energy technologies that rely on the combustion of fossil fuels: it can be co-fired with existing coal power plants, used as feedstock in the chemicals industry and used in existing vehicle fuelling networks and gas pipelines. Although there are hurdles in accessing

An Energy Sector Roadmap to Carbon Neutrality in China Chapter 4: Technology needs for the energy transition
PAGE | 190 IEA,
202
1.
sustainable bioenergy8, supply could be increased by exploiting more of the country’s abundant resources of biomass waste and residues, and cultivating non-food energy crops on marginal lands. The collection of agricultural wastes, such as manure and crop residues, and forestry residues does not involve any change in land-use nor any water consumption, though impacts on soil water retention should be evaluated.
The country already makes considerable use of waste and residues. Since 2017, China has been the world leader in building bioenergy power plants, contributing 60% of global capacity additions in 2019. Roughly half of these are waste-to-energy (WTE) plants mainly fuelled by municipal solid waste (MSW), a proportion of which is biomass material, e.g. food waste, wood, paper and cardboard, and which are concentrated around large population centres. The remaining capacity is fuelled by agriculture and forestry residues, and, to a lesser extent, by biogas. China also uses significant volumes of solid biomass and biogas for heating (see Chapter 3). China accounts for roughly one-third of global wood pellet production, using it domestically for large-scale heating systems. Biogas, on the other hand, is mostly produced and consumed by households, mainly for cooking. China is also the world’s third-largest producer of liquid biofuels after the United States and Brazil, with ethanol derived mainly from corn in the northeastern provinces and renewable diesel from used cooking oils (UCO) (IEA, 2020c).
The availability of land for growing crops that can be used as energy sources will undoubtedly limit the role that bioenergy is able to play in China’s energy transition to net zero emissions. In 2007, the government set out guiding principles on developing bioenergy: energy crops must not be grown on arable land so as not to undermine food supplies and must not compete with other land-uses. In addition, boosting biofuels production should focus on using more farm and forestry residues. Limited development of non-grain energy crops grown on marginal lands is permitted, on condition that it does not put undue strain on water and other resources (Ministry of Agriculture, 2007).
8 Sustainable bioenergy is bioenergy developed so that negative impacts on biodiversity, fresh water systems, food prices and land availability are avoided (IEA 2021c).

An Energy Sector Roadmap to Carbon Neutrality in China Chapter 4: Technology needs for the energy transition
PAGE | 191 IEA,
202
1.
Box 4.6 Bioenergy deployment targets and policies
The 13th FYP for 2016-2020 set bioenergy targets across three main areas: power, heat and transport (targets under the 14th FYP (2021-2025) have not yet been announced). In the power sector, the target was to install 15 GW of bioenergy by 2020; it was exceeded by 50%, with capacity rising to over 25 GW. About half of these plants use MSW and the rest a combination of forestry residues, crop residues and livestock manure. In January 2020, the government introduced a new subsidy scheme for biomass power plants based on size and estimated lifetime utilisation rates. In addition, the National Development and Reform Commission, the Ministry of Finance, and the National Energy Administration (NEA) jointly issued a plan to accelerate the construction of such plants, again focussing on utilising agricultural and forestry residues, and the organic fraction of MSW to address waste management and environmental pollution as well as promote renewable energy generation (NDRC, 2020).
The Energy Administration of Shandong province, which fosts the fourth largest fleet of coal-fired power stations less than 20 years old among the country’s administrative regions, enacted a policy in March 2021 to encourage the co-firing of biomass with existing coal plants. From now on, for every 10 000 tonnes of biomass co-fired with coal over the course of the year, power plants that co-fire will be prioritised to operate for a certain numbers of hours, up to a limit. The scheme is due to run until 2025.
For heating, China almost tripled its use of pellets between 2016 and 2020 to an estimated 22 million tonnes coal equivalent (Mtce), but still fell short of the 30 Mtce target it had set in the 13th FYP. In January 2021, the NEA published a strategy for the next phase of biomass heating, focussing on upgrading biomass power plants to co-generation and prioritising subsidies for combined heat and power. It also favours the development of other forms of bioenergy, such as biogas, for heating, but recommends not using co-firing biomass with coal, non-biogenic MSW and other non-biogenic wastes because they would increase CO2 emissions. In the case of biomethane, China met less than 1% of its initial FYP target for 2020 (see Chapter 3).
For transport, China initially set a national 10% blending mandate for ethanol usage (E10) to go into effect in 2020, which was fully implemented in seven provinces while other provinces and cities had the mandate partially implemented (see Chapter 3) (NDRC, 2017). Due to a variety of difficulties, including dwindling corn stockpiles and a lack of production capacity, this mandate has been relaxed (NEA, 2020). Some advances in cellulosic ethanol production technology have been achieved, but no targets have been set for their use (IEA, 2021d).

An Energy Sector Roadmap to Carbon Neutrality in China Chapter 4: Technology needs for the energy transition
PAGE | 192 IEA,
202
1.
Overall, the increased use of sustainable bioenergy – with and without CCUS –contributes almost 7% of the cumulative CO2 emissions reductions in the APS in the period to 2060. Bioenergy ties with wind to become the third largest primary energy sources in China after solar and nuclear in 2060. The share of bioenergy in total energy demand more than doubling to just over 13%. In absolute terms, primary bioenergy demand increases by 9 EJ, peaking at almost 20 EJ9 in 2045 before reducing slightly to 16 EJ in 2060. Meeting this growth sustainably to avoid adverse social, environmental or economic impacts will be critical. China currently has an estimated 10-18 EJ/year of collectable10 biomass resources in the form of wastes and residues (corn stover, rice straw, wheat straw, forest residues and animal manure) that could be made available for bioenergy – equal to 6-12% of China’s total primary energy demand in 2020 (see in Chapter 3 for implications of limited sustainable biomass supply for biofuels).
Cumulative CO2 emissions reductions from bioenergy use by sector in China in the APS
IEA, 2021.
Power generation and heavy industries contribute to almost three-quarters of the 32 Gt CO2 avoided from bioenergy cumulatively to 2060
Most biomass feedstock potential is in the eastern half of China, ranging from Heilongjiang in the northeast to Yunnan in the south. Shandong and Henan are home to the greatest potential (3 EJ/year) and highest density (>75 GJ/year/hectare), due to ample crop residues and manure. The latter can be used to produce biogas, which can be upgraded and injected into the existing
9 Utilising 20 EJ of biomass resources for bioenergy is in line with recent literature on sustainable biomass resource potential in China. Nie et al., 2018 estimated a current sustainable biomass potential of 25 EJ, while Kang et al., 2020 estimated 24 EJ in 2050.Both numbers take into account biomass use outside of the energy sector. 10 The utilisation of wastes and residues is influenced by both technical feasibility of collection and by the need to use residues for other non-energy purposes, such as maintaining soil organic carbon content.

An Energy Sector Roadmap to Carbon Neutrality in China Chapter 4: Technology needs for the energy transition
PAGE | 193 IEA,
202
1.
natural gas grids in the region. Sichuan and Yunnan provinces in the southwest have 2.4 EJ/year of biomass potential, mainly agricultural and forestry residues. Southern China holds the greatest potential for energy crops grown on marginal land, followed by the northern regions. Sichuan is particularly well-suited to lead the deployment of BECCS in China, given its large CO2 storage potential on its eastern side and 1.4 EJ/year of biomass resources. Existing natural gas trunk lines near potential storage sites could be repurposed for CO2 (Kang et al., 2020; Nie et al., 2018).
Primary bioenergy demand and share in total energy demand by sector in China in the APS
IEA, 2021.
The share of bioenergy in China’s total primary energy demand increases more than 2 times to 13% by 2060, with almost half of biomass consumption combusted in power plants, almost half of them in turn equipped with CCUS
The way in which bioenergy is consumed also changes markedly in the APS. Around 70% of final bioenergy use and 42% of primary bioenergy use today is in the form of traditional solid biomass, which has harmful impacts on human health and well-being, notably due to indoor air pollution. Such use of biomass is completely phased out by 2030 in China, thanks in part to an increase in the efficiency of its use in solid, liquid or gaseous forms, e.g. with modern cooking stoves or boilers. The bulk of bioenergy use in 2060 is for power and heat generation, including in industry, a sizeable part of it with CCUS. Bioenergy in power generation makes significant contributions to decarbonising electricity in the earlier years, accounting for over 65% of total bioenergy-related CO2 reductions in 2030. The share of bioenergy in the national power mix almost triples, from 3% in 2020 to 9% in 2060, with biomass playing a vital role as a dispatchable source of electricity generation to support the integration of more variable renewables into

An Energy Sector Roadmap to Carbon Neutrality in China Chapter 4: Technology needs for the energy transition
PAGE | 194 IEA,
202
1.
the power system and, in combination with BECCS, to produce negative emissions (see CCUS section above).
The use of biomass as a clean fuel and feedstock in industry increases from just 1% in 2020 to 8% in 2060 in the APS. One-fifth of total bioenergy supply in China is consumed in industry in 2060. Bioenergy is used as a fossil-fuel replacement for high-temperature processes, particularly in the cement industry, where bioenergy supplies one-quarter of final energy. Bioenergy also plays an important role in the steel industry as a replacement for coal, meeting 8% of its energy needs in 2060 while providing 11% of the sector’s cumulative emissions reductions to 2060. In 2060, about 37% of CO2 reductions from bioenergy originate from heavy industry.
Liquid biofuels use in transport also grows significantly in the APS, but still accounts for only 8% of total primary bioenergy use in 2060, with biofuels progressively diverted to aviation as the road vehicle fleet is converted to battery EVs and FCEVs (see Chapter 3). Biofuels use for aviation contribute 55 Mt CO2, or 6%, of all bioenergy-related CO2 emissions reductions in 2060.
Technology readiness The degree of technology maturity varies considerably along the bioenergy value chain, from biomass resource collection, transformation and end use, in China and in the rest of the world. Many heating and power technologies, such as small-scale heating and cooking and WTE plants, are already at the market uptake or commercialisation phase. They provide almost 90% of the cumulative reductions in CO2 emissions from bioenergy in 2021-2060 the APS. Some technologies related to road transport and to industrial heating are similarly at market uptake phase or early commercialisation. For example, corn ethanol, fatty acid methyl esters biodiesel and hydrotreated vegetable oil (HVO) diesel are produced commercially in China, in the first two cases for decades. China is a global leader in the collection of UCO for use as a feedstock for liquid biofuels. Expanded use of bioenergy in these sectors could bring rapid emissions savings, allowing more time for other technology pathways, such as hydrogen and electrification, to advance.
Other bioenergy technologies remain at the demonstration or even prototype phase. These include advanced renewable diesel and biokerosene technologies using woody feedstocks, notably cellulosic ethanol, biomass gasification using Fischer-Tropsch (bio-FT) and alcohol-to-jet (ATJ) kerosene. Among these technologies, renewable diesel plays the most important role in decarbonising

An Energy Sector Roadmap to Carbon Neutrality in China Chapter 4: Technology needs for the energy transition
PAGE | 195 IEA,
202
1.
long-distance transport, specifically heavy-duty trucks and shipping, in the APS: heavy-duty trucks alone account for more than half of renewable diesel demand from 2055 onwards. Although there are no bio-FT plants operating yet in China, there are a several biomass gasification projects in the pipeline, two of which are in the northeast and focused on power and heat generation. One of them, in Heilongjiang province, uses a variety of wastes and residues to power a 40 MW CHP plant. The other, in Jilin province, uses a 20 MW biomass gasifier is co-fired with coal at an existing 660 MW pulverised coal power plant. In addition, there are two cellulosic ethanol plants currently operating in the same two provinces, both of which use crop residues from corn as feedstock to produce a combined total of 120 million litres per year of cellulosic ethanol.
The production of biomethane and its injection into the national gas grid remains at a nascent stage in China compared with Europe. In the APS, biomethane blending shares reach 15% in 2060 (see Chapter 3). Biomethane blending faces technical know-how and administrative barriers, including difficulty securing fair market access to the gas grid (IEA, 2021d). Two biomethane plants currently operating in China illustrate different production pathways. A commercial plant in Shanxi province upgrades biogas that is produced from anaerobic digestion of agricultural waste by removing CO2 and other contaminants, yielding just over 7 million cubic metres (mcm) per year of biomethane. Another pilot plant in Jiangsu uses biomass gasification and methanation to produce biomethane (also known as bio-synthetic natural gas, or bioSNG) at a daily rate of 10 000 cubic meters (just over 3 mcm per year).
In the long term, the use of biokerosene to decarbonise the aviation sector arguably plays an even more crucial role in achieving carbon neutrality in China, as elsewhere, in the APS, due to the lack of potential alternative fuels. Hydrotreated esters and fatty acids (HEFA) is the most promising technology route in the near-term and bio-FT and ATJ in the long term. Biokerosene alone accounts for 40% of aviation fuel consumption by 2060 and contributes 1.6 Gt CO2 of cumulative CO2 reductions over 2021-2060. This underscores the importance of innovation in biokerosene production technologies in China. At least one HVO plant in China has the capability of producing HEFA biokerosene today, but there are no other projects on the horizon for biokerosene or other sustainable aviation fuels.
Another key bioenergy sector at the demonstration stage today is biomass feedstock for making chemicals such as methanol and ethylene. Combined, that pathway contributes nearly 570 Mt CO2 of cumulative emissions reductions to 2060. There are no known biomass-based ammonia plants and only a handful of

An Energy Sector Roadmap to Carbon Neutrality in China Chapter 4: Technology needs for the energy transition
PAGE | 196 IEA,
202
1.
biomass-based methanol projects operating worldwide today. The largest plant, based on MSW, is run by Enerkem in Canada. Biomass gasification is, once again, the key technology component in this process.
Cumulative CO2 emissions avoided from selected bioenergy technologies by technology readiness in China in the APS, 2020-2060
IEA, 2021.
Note: Maturity category assigned based on detailed assessment of technology readiness levels of individual technology designs presented in the IEA Clean Energy Technology Guide (IEA, 2020a).
Almost 90% of cumulative CO2 reductions from bioenergy to 2060 stem from already commercially available technologies
Infrastructure needs One of the main advantages of bioenergy is its ability to be used as a drop-in fuel, making use of existing infrastructure, including natural grid pipelines, vehicles, power plants and process heating equipment, with few if any modifications. The expansion of bioenergy in various forms would nonetheless require substantial amounts of additional infrastructure, ranging from small-scale to large-scale.
In the case of biofuels, many storage facilities for biomass feedstocks, especially for widely dispersed, low-density crop and forestry residues, would be needed to facilitate their collection and distribution to large plants on a “spoke and hub” basis. Storage of biomass feedstock is vital as biofuels production requires a continuous supply of feedstock, while collection schedules from crops or forestry may only occur at certain points in a year. In China, there have been issues with supply chain reliability at demonstration cellulosic ethanol feedstock plants. Large-scale facilities for sorting and cleaning of waste and residue feedstocks would also be required. For example, biogenic MSW used for biogas must be separated from non-biogenic material, while crop and forestry residues need to be cleaned of dirt, stone and other contaminants before being sent to biofuel plants.
0 1 2 3 4 5 6 7 8
Modern biomass stoves
Biokerosene in aviation
Bioenergy use in blast furnaces
Bioenergy co-firing in cement kilns
Bioenergy use for chemicals production
Biomass-fired power plants
GtCO2
Mature Market uptake Demonstration Prototype

An Energy Sector Roadmap to Carbon Neutrality in China Chapter 4: Technology needs for the energy transition
PAGE | 197 IEA,
202
1.
For biomethane, new distribution lines and injection points would need to be built for blending into natural gas. As waste and residue feedstocks such as manure and crop residues are widely dispersed and expensive to transport, biomethane plants are likely to be located near feedstock sources, increasing the need for grid connections. For small biomethane plants, as is the case for most biogas digesters in China today, it can make financial sense to enter into a co-operative agreement with other local producers to aggregate biomethane production before feeding into a shared injection point. Additionally, organic fertilizer (produced as a co-product of biogas in anaerobic digestion) can be collected and distributed to local farms.
In the case of CCUS, infrastructure would need to be built to support the deployment of BECCS in biofuels production and power generation. For instance, where BECCS is added to biomethane production (biogas upgrading or biomass gasification), it may make sense to build CO2 pipelines in tandem with biomethane distribution lines, especially in those provinces with large biomethane feedstock potential, existing natural gas pipelines and potential CO2 storage sites, such as Sichuan and Henan in central China, and Heilongjiang and Jilin provinces in the northeast.

An Energy Sector Roadmap to Carbon Neutrality in China Chapter 4: Technology needs for the energy transition
PAGE | 198 IEA,
202
1.
References ACCA21 (2019), Roadmap for Carbon Capture, Utilization and Storage Technology in China,
provided to the IEA by Energy Foundation China.
AFC TCP (Advanced Fuel Cells Technology Collaboration Partnership) (2021), AFC TCP 2021 Survey on the Number of Fuel Cell Electric Vehicles, Hydrogen Refuelling Stations and Targets, provided to the IEA by AFC TCP.
Benchmark mineral intelligence (2021), Lithium ion battery mega factory assessment, June 2021, https://www.benchmarkminerals.com/.
Berman, L. (2017), China Natural Gas Pipelines (2013), Harvard Dataverse, V1, https://doi.org/10.7910/DVN/J5U79Z, accessed 18 May 2021.
BNEF (2021), Baofeng's hydrogen electrolysis project sets new records, https://www.bnef.com/insights/26313
Cai, B et al., (2020)China Status of CO2 Capture, Utilization and Storage (CCUS) 2019. Center for Climate Change and Environmental Policy, Chinese Academy of Environmental Planning, DOI: 10.13140/RG.2.2.19465.88168.
Chunting, L. (2021), Guangdong Leads China in Embracing Green Hydrogen With Most Refueling Stations, Report Says, 8 January, https://www.yicaiglobal.com/news/guangdong-leads-china-in-embracing-green-hydrogen-with-most-refueling-stations-report-says#:~:text=The%20country%20now%20has%20118,Carbon%20Energy%2C%20told%20Yicai%20Global, accessed 14 September 2021.
China EV100 (2020), China Hydrogen Industry Development Report 2020, http://www.ev100plus.com/content/details1041_4302.html?v=0.7970640183607711.
ChinaIOL (2021), hppt://data.chinaiol.com/ecdata/index, accessed 15 June 2021.
Energy Iceberg (2021), China’s Hydrogen Market in 14th Five-Year Plan: Provincial Strategy Breakdown, https://energyiceberg.com/hydrogen-14th-fyp-provincial-strategy/.
Energy Iceberg (2020), Ten Chinese Green Hydrogen Companies Poised to Lead, https://energyiceberg.com/ten-chinese-green-hydrogen-companies/#CNNC_Nuclear_Giants_Power-to-Gas.
Government of China (2016), Eight departments jointly issued the "Guiding Opinions on Promoting Electricity Substitution" (website): http://www.gov.cn/xinwen/2016-05/25/content_5076579.htm.
Government of China (2017), Clean heating plan in winter in northern area (2017-2021): http://www.gov.cn/xinwen/2017-12/20/5248855/files/7ed7d7cda8984ae39a4e9620a4660c7f.pdf.
Guo J. et al. (2015), Geological Survey of China Volume 2, No 4 April 2015 pp.36-26
Hersbach, H. et al. (2018): ERA5 hourly data on single levels from 1979 to present. Copernicus Climate Change Service (C3S) Climate Data Store (CDS), accessed on 15 June 2021, 10.24381/cds.adbb2d47, https://cds.climate.copernicus.eu/cdsapp#!/dataset/reanalysis-era5-single-levels?tab=overview.

An Energy Sector Roadmap to Carbon Neutrality in China Chapter 4: Technology needs for the energy transition
PAGE | 199 IEA,
202
1.
Intergovernmental panel on climate change (IPCC) 2006. WASTE–IPCC Good Practice Guidance and Uncertainty Management in National Greenhouse Gas Inventories.
IEA (International Energy Agency) (2021a), Global EV Outlook 2021, https://www.iea.org/reports/global-ev-outlook-2021
IEA (2021b), The Role of Critical Minerals in Clean Energy Transitions, IEA, Paris https://www.iea.org/reports/the-role-of-critical-minerals-in-clean-energy-transitions
IEA (2021c), IEA Hydrogen Projects Database, https://www.iea.org/reports/hydrogen-projects-database (forthcoming).
IEA (2021d), China 14th Five-Year Plan on Renewable Energy Development: IEA perspective and suggestions. Chapter 1.
IEA (2021e), Global Hydrogen Review (forthcoming).
IEA (2020a), ETP Clean Energy Technology Guide, IEA, Paris https://www.iea.org/articles/etp-clean-energy-technology-guide
IEA (2020b), Is cooling the future of heating?, https://www.iea.org/commentaries/is-cooling-the-future-of-heating
IEA (2020c), Renewables 2020, IEA, Paris, https://www.iea.org/reports/renewables-2020 https://www.iea.org/reports/renewables-2020
IEA (2019), The Future of Cooling in China, https://www.iea.org/reports/the-future-of-cooling-in-china
IEA (2015), Storing CO2 through Enhanced Oil Recovery, https://www.iea.org/reports/storing-CO2-through-enhanced-oil-recovery
Jiang, K. et al. (2020), China's carbon capture, utilization and storage (CCUS) policy: A critical review. Renewable and Sustainable Energy Reviews, 119, pp.109601.
LanzaTech, 2018. World’s First Commercial Waste Gas to Ethanol Plant Starts Up, https://www.lanzatech.com/2018/06/08/worlds-first-commercial-waste-gas-ethanol-plant-starts/, accessed 7 June 2021.
Lawrence Berkeley National Laboratory (LBNL) (2020). Improving the energy efficiency of room air conditioners in China°: Costs and benefits. Applied Energy, Volume 258, 114023, https://doi.org/10.1016/j.apenergy.2019.114023.
Kang et al. (2020), Bioenergy in China: Evaluation of domestic biomass resources and the associated greenhouse gas mitigation potentials. Renewable and Sustainable Energy Reviews, V. 127, pp. 109842.
Kearns, J. et al. (2017), Developing a consistent database for regional geologic CO2 storage capacity worldwide, Energy Procedia, V.114, pp. 4697-4709.
Ministry of Agriculture (2007). Development plan for agricultural biomass energy industry (2007-2015). http://www.gov.cn/gzdt/2007-07/05/content_674114.htm
MOST (Ministry of Science and Technology) (2021), Hydrogen Energy Technology Key Special Project 2021 Project Application Guidelines, https://service.most.gov.cn/sbzn/20210511/4287.html
NDRC (National Development and Reform Commission) (2021), Ten Highlights of the National "14th Five-Year Plan (website): https://www.ndrc.gov.cn/xxgk/jd/wsdwhfz/202104/t20210406_1271759.html

An Energy Sector Roadmap to Carbon Neutrality in China Chapter 4: Technology needs for the energy transition
PAGE | 200 IEA,
202
1.
NDRC (2020), Notice on Issuing the "Implementation Plan for Improving the Construction and Operation of Biomass Power Generation Projects" (website): http://www.nea.gov.cn/2020-09/16/c_139372803.htm
NDRC (2017), Implementation plan on expanding biofuel ethanol production and promoting the use of ethanol gasoline for vehicles (2017)" (website): http://www.gov.cn/xinwen/2017-09/13/content_5224735.htm
NEA (National Energy Administration) (2020), Summary of Reply to Recommendation No. 6074 of the Third Session of the Thirteenth National People's Congress (website): http://zfxxgk.nea.gov.cn/2020-09/17/c_139975338.htm
Nie et al (2018). Spatial distribution of usable biomass feedstock and technical bioenergy potential in China. GCB Bioenergy, 12, pp. 54-70.
Pilorgé, H. et al. (2021), Global mapping of CDR opportunities, CDR Primer, https://cdrprimer.org.
Randall, C. (2020), China to push forward with electrification targets, Electrive.com, 3 November, https://www.electrive.com/2020/11/03/china-pushes-forward-with-their-electrification-targets-for-2025/, accessed 17 June 2021.
Renewables.ninja (2021), PV dataset, https://www.renewables.ninja/downloadsState Council Information Office of the People’s Republic of China (2020), The potential of electric energy substitution during the "14th Five-Year Plan" period is expected to exceed 600 billion kWh (website): http://www.scio.gov.cn/ztk/dtzt/42313/44537/44544/Document/1695090/1695090.htm.
State Grid (2021), State Grid Corporation of China released its "carbon peak and carbon neutral" action plan, 1 March, http://www.sgcc.com.cn/html/sgcc_main/col2017021449/2021-03/01/20210301152244682318653_1.shtml.
Siemens (2020), Siemens Energy launches its first megawatt green hydrogen production project in China, https://press.siemens.com/global/en/pressrelease/siemens-energy-launches-its-first-megawatt-green-hydrogen-production-project-china.
Sinopec (2021), Sinopec accelerates hydrogen energy development to build world-leading clean energy chemical company, http://www.sinopecgroup.com/group/en/Sinopecnews/20210312/news_20210312_391474893325.shtml
Wei, N. et al. (2013), A preliminary sub-basin scale evaluation framework of site suitability for onshore aquifer-based CO2 storage in China. International Journal of Greenhouse Gas Control, V.12, pp.231-246.
Wei, N., et al. (2016), Budget-type techno-economic model for onshore CO2 pipeline transportation in China. International Journal of Greenhouse Gas Control, V.51, pp.176-192.
Xian, Z. (2021), CCUS Development in China, (presentation at CEM CCUS Initiative, 26 April 2021).

An Energy Sector Roadmap to Carbon Neutrality in China Chapter 5: Near-term opportunities for a faster energy transition
PAGE | 201 IEA,
202
1.
Chapter 5: Near-term opportunities for a faster energy transition
Highlights The timing and level of the peak in emissions, as well as the pace of emissions
reductions once the peak has been reached, are of crucial importance to the achievement of The People’s Republic of China’s (hereafter, “China”) longer-term goal of carbon neutrality. China has the technical capabilities, economic means and policy experience to accomplish a faster clean energy transition to 2030 than in the Announced Pledges Scenario (APS).
The Accelerated Transition Scenario (ATS) assumes enhanced policy efforts to 2030 compared with the APS in three key areas: a faster decline in coal use in the power and industry sectors; higher deployment of low-carbon technologies like renewables, EVs and heat pumps; and increased energy and material efficiency in end-use sectors.
Energy sector CO2 emissions follow roughly the same path to 2025 in the ATS as in the APS as many of the additional measures take time to take effect, but then fall by 4% per year between 2025 and 2030. In 2030, emissions reach around 9.5 Gt – 19% below the APS. Power generation accounts for about 60% of the overall reduction in emissions in 2030 compared with the APS, and industry and transport combined for 30%.
Coal demand in 2030 in the ATS is nearly 20% lower than in the APS, thanks mainly to savings in power generation as a result of accelerated power market reforms and a strengthening of the emissions trading system. The share of coal in generation falls to 38% in 2030 (around 3 900 TWh), about ten percentage points below the APS.
The ATS brings many socioeconomic benefits, including for China’s central role in global clean energy technology value chains and for clean energy innovation. The number of jobs related to clean energy supply also grows by 3.6 million by 2030, compared with the 2.3 million jobs lost in fossil fuel supply and fossil fuel power plants. In the APS, the net gain is only around 0.4 million. Quicker decarbonisation also further reduces pollution, bringing public health benefits.
Anticipating bottlenecks and emerging economic and societal issues is a key near-term challenge in the ATS. The long-term benefit is that carbon neutrality is reached in a more orderly fashion, leaving more time for markets to adjust and businesses and consumers to adapt. The average annual pace of emissions reductions over 2030-2060 is almost 20% lower than in the APS. More than 20 Gt of locked-in emissions to 2060 from new long-lived assets in the power and industry sectors built in the period to 2030 in the APS are avoided, opening the possibility for reaching carbon neutrality earlier.

An Energy Sector Roadmap to Carbon Neutrality in China Chapter 5: Near-term opportunities for a faster energy transition
PAGE | 202 IEA,
202
1.
Opportunities for a faster transition to 2030 The announcement by China’s president in September 2020 – that China “aims to have CO2 emissions peak before 2030 and to achieve carbon neutrality before 2060” – represents a significant strengthening of the country’s climate ambitions (see Chapter 1). The APS, the results of which are set out in detail in Chapter 2-4, describes an energy pathway for meeting China’s long-term goal and is designed to follow the enhanced targets declared in 2020 related to its nationally determined contribution (NDC) under the Paris Agreement (see Chapter 1). Yet, as discussed in Chapter 2, the APS is a path to achieving China’s own stated goals, not necessarily the path. Other pathways are possible, depending, for example, on long-term technological advances and domestic technology preferences and priorities.
Another key uncertainty is near-term policy action. China has committed to achieve a peak in CO2 emissions before 2030, but the timing and level of that peak, as well as the speed of decline once that peak has been reached, are uncertain, as they depend critically on policy decisions and their impact on investment and spending decisions by businesses and consumers over the next few years. China has the technical capabilities, economic means and policy experience to achieve a faster clean energy transition to 2030 than in the APS. Indeed, the fast progress already achieved in meeting its target for reaching a share of non-fossil fuels in energy demand of 20% by 2030 in its NDC recently led China to raise that target to 25%. China has a great interest in repeating such a success during the 2020s: the earlier the CO2 peak, the lower it will be and the more time there will be to reach carbon neutrality, allowing for a smoother and more cost-effective energy transition.
There are clear signs that the government is giving priority to carbon neutrality, acknowledging the urgency of the need to slow emissions growth and bring about a peak in emissions as early as possible. The recent establishment of the “Leadership Group” is one example (see Chapter 1). This chapter explores the opportunities for China to undertake a faster energy transition to 2030 beyond that required by the current official target, involving a faster decline in emissions over the second half of the 2020s, and the broad long-term implications for China and the rest of the world.
The Accelerated Transition Scenario Recent trends in some key indicators suggest that there is considerable scope for a faster energy transition in China, notably by improving the overall efficiency of

An Energy Sector Roadmap to Carbon Neutrality in China Chapter 5: Near-term opportunities for a faster energy transition
PAGE | 203 IEA,
202
1.
the energy system and accelerating the deployment of available and cost-effective clean energy technologies, including solar PV, wind, electric vehicles (EVs) and heat pumps. Some aspects of the energy transition to 2030 in the APS represent a continuation or even a slowdown in the pace of decarbonisation progress compared with the recent past. For example, at 2.9% per year, the average annual drop in the primary energy intensity of GDP is lower than the lever achieved during 2011-2020. For solar PV and wind, annual capacity installations grew by more than 20% on average each year over the past decade; in the APS, they increase by only another 10% by 2030 to meet the official target of a 25% share of non-fossil fuels in primary energy demand. Similarly, the coal intensity of steel production fell by 3% per year over the last decade and 5% per year over the last five years; in the APS, it falls by less than 1% per year to 2030. To some extent, a slowdown in some of these indicators is inevitable as opportunities for efficiency gains or easy emissions reductions are exhausted, but the near-term potential for further improvements nonetheless remains very large.
To explore the implications for China’s energy system and emissions over the current decade of an increase in China’s near-term climate policy ambitions, we have prepared an Accelerated Transition Scenario (ATS). The ATS does not involve a radical change in current policy priorities. Policies are already in place for most of the ten core areas for action set out in the “1+N” framework that is currently being formulated by the new climate ‘leaders group’, including reducing coal use, improving the efficiency of resource use, promoting energy efficiency, building a low-carbon transport system, promoting clean energy technological innovation, developing green finance, introducing supporting economic policies, improving carbon pricing mechanisms and implementing nature-based solutions (see Chapter 1).
The ATS assumes that the government quickly reinforces and strengthen policies in these key areas relative to the APS, in particular:
Accelerating the decline in coal use in the power and industry sectors.
Boosting the deployment of available low-carbon technologies, especially renewables for power generation, new energy vehicles (mainly EVs) and heat pumps.
Increasing energy and material efficiency in the industry, buildings and transport sectors.
As recognised by China’s president in his recent announcement, controlling coal use is critical to curbing China’s CO2 emissions. There remains huge scope for accelerating the decline in coal use in the power and industry sectors, which are responsible for just under 95% of China’s total coal consumption today. China

An Energy Sector Roadmap to Carbon Neutrality in China Chapter 5: Near-term opportunities for a faster energy transition
PAGE | 204 IEA,
202
1.
has been retiring small and inefficient coal mines; old, inefficient coal-fired power plants and industrial facilities; and coal boilers in the residential sector since the 12th Five-Year Plan (FYP) (2011-2015). In the ATS, all remaining inefficient capacity is assumed to be retired, while operational efficiency in the power and industry sectors is assumed to increase by 2-4% per year compared with 1-3% in the APS over 2021-2030. The emissions trading system (ETS) is also strengthened, including through tighter allowance allocation and a faster introduction of auctioning and expansion of the system to cover more energy-intensive industries, incentivising efficiency improvements, and fuel switching (see Chapter 7).
The growth of renewables and other clean energy technologies such as EVs is also boosted by stronger policies. Recent solar PV and wind projects are able to generate power at a cost below average provincial coal electricity prices, suggesting that there is further scope for rapid competitive deployment of solar PV and wind. Accelerated electricity market reforms in the ATS enable market-based operation of electricity dispatch, long-term power purchase agreements and cost-reflective retail electricity prices, boosting investment in solar PV and wind. Electricity network infrastructure is also expanded more rapidly to connect more solar PV and wind projects located far from demand centres and promote interprovincial electricity trade. EV sales are boosted through the combined effects of more stringent fuel economy targets and clear target dates for the phase-out of internal combustion engine (ICE) vehicles at national and provincial levels.
Increasing energy efficiency has been a focus of Chinese policy making and has contributed significantly to moderating energy demand and CO2 emissions growth for more than a decade. Together, enhancing energy and material efficiency is central to containing energy demand growth in the APS, accounting for around one-quarter of the emissions reductions in 2030 (see Chapter 2). Nonetheless, considerable economic potential for greater energy and material efficiency gains still remains in 2030. The ATS assumes more stringent policies to improve energy and material efficiency in the industry, buildings and transport sectors are introduced immediately. They include tightening existing minimum energy performance standards and introducing new ones, effectively banning the sale of the least-efficient technologies. Further opportunities range from retrofitting buildings to optimising energy use in industrial production processes, particularly in energy-intensive ones, and more efficient transport, including through promoting modal shift in cities and in freight.

An Energy Sector Roadmap to Carbon Neutrality in China Chapter 5: Near-term opportunities for a faster energy transition
PAGE | 205 IEA,
202
1.
Energy and emissions trends The impact of these policy-driven measures on the medium-term outlook for CO2 emissions is substantial. At 9.3 Gt, emissions are 19% lower in the ATS than in the APS in 2030. Emissions broadly follow the same path to 2025 in the ATS as in the APS as many of the additional measures take time to take effect, but then fall by 4% per year between 2025 and 2030. Historically, emissions have declined in only three years: 2014-2016 (due to a slowdown in energy demand and the commissioning of large amounts of nuclear and renewables, which curtailed the need to burn coal to generate power).
Annual change in energy-related CO2 emissions in China, APS and ATS
IEA, 2021.
Note: APS = Announced Pledges Scenario, ATS = Accelerated Transition Scenario.
Emissions follow broadly the same path as in the APS in the period to 2025, before declining at an average rate of 4% per year in the second half of the decade
The CO2 intensity of GDP falls by 67% per year on average between 2020 and 2030 in the ATS, compared with 4% in the APS. The faster decline in the ATS is underpinned by a faster decline in the energy intensity of the economy and the CO2 intensity of the energy that supplies it. The energy intensity of GDP falls by 4% per year between 2020 and 2030 in the ATS, compared with 3% in the APS. The share of non-fossil fuels in the primary energy mix increases from 15% in 2020 to 26% by 2030 in the ATS (compared with 23% in the APS).1 Power generation contributes about 60% of the overall reduction in energy sector CO2
1 29% in the ATS and 26% in the APS in 2030 using China’s partial substitution method of energy accounting.
- 200
0
200
400
600
800
1 000
2005 2010 2015 2020
Mt C
O2
Historic APS ATS
- 200
0
200
400
600
800
1 000
Average2020-2030

An Energy Sector Roadmap to Carbon Neutrality in China Chapter 5: Near-term opportunities for a faster energy transition
PAGE | 206 IEA,
202
1.
emissions in 2030 in the ATS compared with the APS; industry and transport together 30%, and buildings, fuels transformation and agriculture combined the remaining 10%.
Change in energy sector CO2 emissions by sector and primary energy use in China in 2030 in the ATS relative to the APS
IEA, 2021.
Note: APS = Announced Pledges Scenario, ATS = Accelerated Transition Scenario.
About 60% of the emissions reductions between the APS and the ATS in 2030 come from the power generation sector, with industry and transport contributing another 30%
Lower coal use accounts for the majority of the difference in emissions between the ATS and the APS. Coal consumption increases in the short-term but then falls back to 70 EJ in 2030 in the ATS, nearly 20% lower than in the APS. Nearly 70% of the lower coal use in 2030 in the ATS relative to the APS is from power generation, where the combined effects of accelerated power market reform and a strengthened ETS push down total coal-fired power generation by over 20% relative to the APS to around 3 900 TWh in 2030. The share of coal in total electricity generation falls from 63% in 2020 to 38% in 2030 in the ATS, nine percentage points lower than in the APS. Another 25% of the lower coal demand in 2030 relative to the APS is from the industry sector. Coal use in iron and steel production is responsible for about 40 of the decline in industrial coal use, relative to APS, followed by cement production. The drop in industrial coal use in the ATS is facilitated by enhanced changes in the structure of the Chinese economy towards higher value-added industries and services, combined with efforts to enhance energy and material efficiency through tighter regulations and the assumed successful expansion of the ETS to cover energy-intensive industries.
9
10
11
12
APS ATS2030
Gt C
O2
Other
Transport
Industry
Powergeneration
CO2 emissions Primary energy
140
150
160
170
180
APS ATS2030
EJ
Other
Natural gas
Oil
Coal

An Energy Sector Roadmap to Carbon Neutrality in China Chapter 5: Near-term opportunities for a faster energy transition
PAGE | 207 IEA,
202
1.
Total coal consumption in 2030 by scenario/case and coal-fired power generation in China in the APS and ATS
IEA, 2021.
Note: APS = Announced Pledges Scenario, ATS = Accelerated Transition Scenario.
Coal-fired power generation declines by over 20% in absolute terms between 2020 and 2030 in the ATS, compared with a 1% increase in the APS
Box 5.1 The impact of a faster energy transition on fossil methane emissions
Accelerating the decline in coal use in the power and industry sectors as in the ATS brings an important benefit for fossil methane emissions but also major efforts are undertaken to reduce the emissions intensity of fossil fuel production. Overall fossil methane emissions is almost 60% lower in the ATS in 2030 compared to the APS. The reductions in methane emissions from fossil fuel operations in the ATS from 2020 to 2030 is equivalent to about 70% of the total decline in methane from these sources seen globally in the APS over the same period. China can play a key role in limiting the near-term impact of methane on global warming.
More than 85% of the reduction in fossil methane emissions in the ATS by 2030 is related to coal extraction, with coal-related methane emissions decreasing by almost 60% in the ATS by 2030 relative to 2020 compared with just 1% in the APS. Methane emissions from oil and gas extraction and processing decline around four times more in ATS than in APS by 2030 given a faster implementation of methane abatement measures in oil and gas operations. These reductions require reinforced policies to ensure that most available abatement measures are fully deployed by 2030.
0
30
60
90
APS Change bysector
ATS
EJ
Other
Industry
Powergeneration
Coal use in 2030 Coal-fired generation
0%
25%
50%
75%
100%
0
1 500
3 000
4 500
6 000
APS ATS2020 2030
Shar
e of
tota
l
TWh
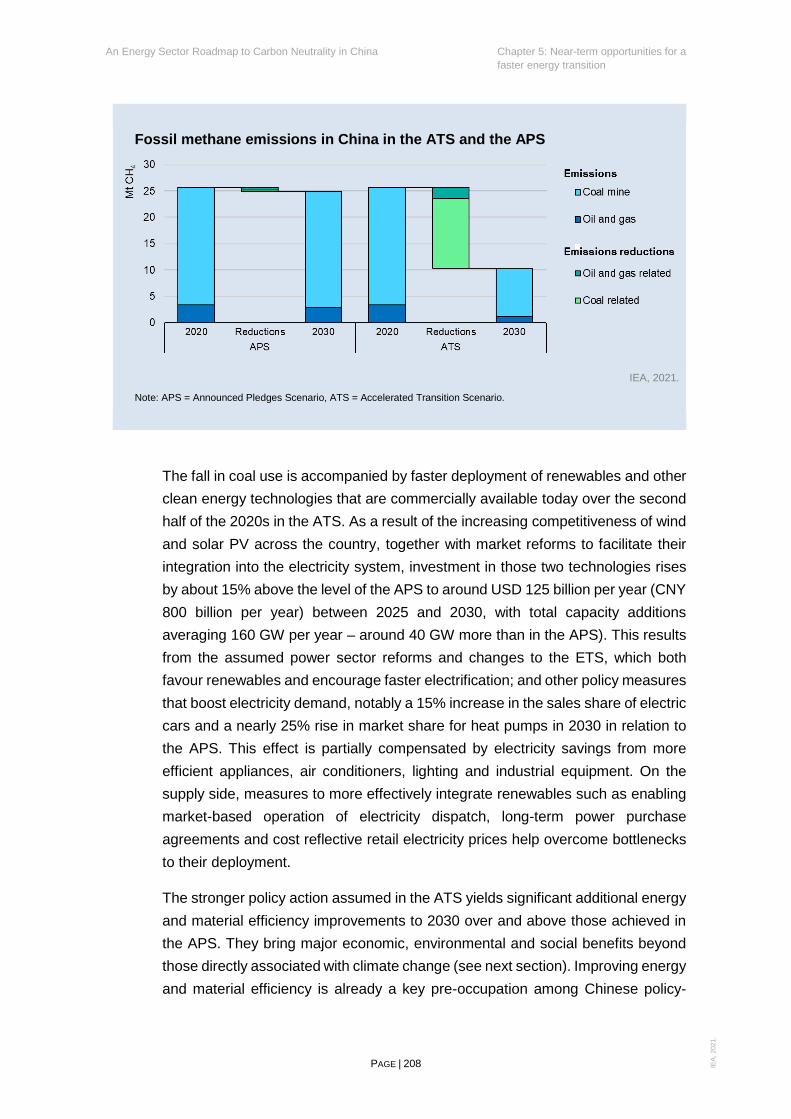
An Energy Sector Roadmap to Carbon Neutrality in China Chapter 5: Near-term opportunities for a faster energy transition
PAGE | 208 IEA,
202
1.
Fossil methane emissions in China in the ATS and the APS
IEA, 2021.
Note: APS = Announced Pledges Scenario, ATS = Accelerated Transition Scenario.
The fall in coal use is accompanied by faster deployment of renewables and other clean energy technologies that are commercially available today over the second half of the 2020s in the ATS. As a result of the increasing competitiveness of wind and solar PV across the country, together with market reforms to facilitate their integration into the electricity system, investment in those two technologies rises by about 15% above the level of the APS to around USD 125 billion per year (CNY 800 billion per year) between 2025 and 2030, with total capacity additions averaging 160 GW per year – around 40 GW more than in the APS). This results from the assumed power sector reforms and changes to the ETS, which both favour renewables and encourage faster electrification; and other policy measures that boost electricity demand, notably a 15% increase in the sales share of electric cars and a nearly 25% rise in market share for heat pumps in 2030 in relation to the APS. This effect is partially compensated by electricity savings from more efficient appliances, air conditioners, lighting and industrial equipment. On the supply side, measures to more effectively integrate renewables such as enabling market-based operation of electricity dispatch, long-term power purchase agreements and cost reflective retail electricity prices help overcome bottlenecks to their deployment.
The stronger policy action assumed in the ATS yields significant additional energy and material efficiency improvements to 2030 over and above those achieved in the APS. They bring major economic, environmental and social benefits beyond those directly associated with climate change (see next section). Improving energy and material efficiency is already a key pre-occupation among Chinese policy-

An Energy Sector Roadmap to Carbon Neutrality in China Chapter 5: Near-term opportunities for a faster energy transition
PAGE | 209 IEA,
202
1.
makers and has reaped substantial gains in the past. For example, after the 2008 financial crisis, China allocated 5% of its CNY 4‐trillion (USD 585‐billion) stimulus package to energy conservation, pollutant emissions reductions and environmental projects. More than CNY 40 billion was spent on energy efficiency, mainly through the Top Ten Energy Saving Projects. As a result, coal consumption fell in 2010, and the domestic market for energy efficiency services and technologies such as efficient boilers, electric motors and lighting expanded. China is also actively pursuing the adoption of MEPS; almost two-thirds of final energy use today is covered by such standards, nearly twice the global average and up from only around one-third in 2010.
Indicators of the deployment of selected clean energy technologies in China in 2030
IEA, 2021.
Note: APS = Announced Pledges Scenario, ATS = Accelerated Transition Scenario.
The deployment of available clean energy technologies accelerates in the ATS
Industry In the ATS, energy efficiency gains contribute to a faster decline in emissions in all end-use sectors. In the industry sector, increases in the shares of scrap used in steel and aluminium production together with decreases in the clinker-to-cement ratio contribute to a 32% decline in the overall energy intensity of value added during 2020-2030. This rate of decline is slightly faster than the 25% decline in the APS, but significantly slower than the fastest rates realised over any of the FYP periods during 2005-2020, reflecting the fact that a lot of progress has already been made in this area (much of it targeted in previous FYPs).

An Energy Sector Roadmap to Carbon Neutrality in China Chapter 5: Near-term opportunities for a faster energy transition
PAGE | 210 IEA,
202
1.
Average performance of selected end-use indicators in China
Indicator 2020 2030 - APS 2030 - ATS
Energy efficiency of new heating equipment in buildings 122% 233% 245%
Energy efficiency of new cooling equipment in buildings 412% 464% 602%
Energy intensity of new refrigerator units (kWh/year) 205 174 159
Efficacy of new LEDs (lumen/watt) 103 117 123
Fuel economy of new light commercial vehicles (MJ/tonne-100km) 336 249 187
Fuel economy of new medium-duty trucks (MJ/tonne-100km) 111 72 66
Coal intensity of steel production (GJ/tonne) 15.6 14.3 13.7
Avoided cement production (Mt/year) - - 125 (-5%)
Avoided steel production (Mt/year) - - 67 (-6%)
Notes: APS = Announced Pledges Scenario; ATS = Accelerated Transition Scenario. Avoided cement and steel production is in the ATS in 2030 relative to the APS in 2030.
Industrial energy intensity falls slightly faster in the ATS than in the APS. Additional reductions in emissions in those sectors are obtained from modifications to the most emissions-intensive processes in the ATS. Energy efficiency plays an important role with the adoption of the best available technologies and increased process integration, e.g. in blast furnaces and cement kilns. Resulting energy savings are offset to some degree by the adoption of carbon capture and low-carbon alternative fuels, which are less emissions-intensive but more energy-intensive.
Material efficiency gains also play a key role, reducing the amount of bulk materials required to deliver the same services in the various end-use sectors that consume them. China’s production of both cement and steel is about 2% lower in 2030 than in 2020 in the ATS; by contrast, production of these materials is 4% higher in the APS. Overall output peaks in the mid-2020s in both cases. Material efficiency strategies such as lightweighting, yield improvements, increased recycling and re-use of these materials in the domestic market all contribute to lowering materials production in the ATS, with reinforced measures building on the experience from the Industry Green Development Plan set out in the 13th FYP (2016-2020). Life-extensions of buildings with an increased rate of retrofits, which reduces the need for more materials-intensive new construction, is a major contributor. For example, cement and steel demand for construction is cut by more than 10% in 2030 in the ATS relative to the APS due to a greater emphasis on

An Energy Sector Roadmap to Carbon Neutrality in China Chapter 5: Near-term opportunities for a faster energy transition
PAGE | 211 IEA,
202
1.
structural optimisation, prefabrication, pre-casting and low-carbon material selection, as well as building lifetime extensions through renovations and repurposing.
Annual average change in energy intensity in industry and bulk materials production in China
IEA, 2021.
Note: APS = Announced Pledges Scenario, ATS = Accelerated Transition Scenario. Energy intensity is measured as industrial energy consumption per unit of industry value added.
Material and energy efficiency improvements lead to additional reductions in industrial energy intensity in the ATS, despite the wider deployment of more energy-intensive innovative technologies
Transport In the transport sector, the ATS assumes that measures to accelerate emissions reductions are reinforced over the next decade in two main climate policy areas:
• Reducing the number and length of trips, both within and between cities, or switching them to lower carbon-intensity modes.
• Accelerating the shift to low-carbon alternative fuels, especially to electricity in road and rail freight.
Opportunities to avoid or reduce discretionary or low-value travel and to switch to low-carbon modes are greatest in cities that are currently being designed and built. Measures to encourage the use of public transit as well as walking and cycling are expanded beyond what is already in place. Urban and transport planning are also better integrated, reducing the need for motorised transport, e.g. smaller housing blocks and improved local provision of commercial and other services that reduce the need to travel by car or bus. This requires changing current incentive

An Energy Sector Roadmap to Carbon Neutrality in China Chapter 5: Near-term opportunities for a faster energy transition
PAGE | 212 IEA,
202
1.
structures, such as those that reward fast construction, the typical practice of selling large land tracts to a single developer and laws that stipulate how new “megablock” developments are integrated into city street grids. The same opportunities exist, albeit to a lesser extent, in existing cities. District-level revitalisation projects can take inspiration from projects elsewhere in the world, e.g. the successful conversion of a highway to a walkable corridor and multi-modal public transit hub along the Cheonggyecheon stream in Seoul, Korea (Development Asia, 2016).
Fuel use by transport mode in China in the APS and ATS in 2030
IEA, 2021.
Note: APS = Announced Pledges Scenario, ATS = Accelerated Transition Scenario.
Designing cities and transport systems to reduce vehicular travel and make low-carbon modes more attractive reduce fossil fuel use by nearly 20% in 2030 compared with the APS
The main driver of near-term reductions in long-distance travel in the ATS comes from modernising the train fleet and intercity and high-speed rail networks. Faster and expanded train services discourage road and air transport, which are more carbon-intensive. There is a big opportunity for renewing railcars and locomotives; resurfacing, repairing and improving tracks; and increasing the maximum cruising speed of intercity passenger trains. Heavily used conventional routes are upgraded and supplemented by high-speed rail to a greater degree than in the APS.
To encourage faster improvements in vehicle efficiency and a switching to EVs, the policies that have proved to be successful for light-duty vehicles and urban transit buses are extended to other transport segments in the ATS. They include
0
2
4
6
8
10
12
APS ATS APS ATS APS ATS APS ATS
Rail Light-duty vehicles Heavy-duty vehicles Aviation
EJ
Fossil fuels
Biofuels
Electricity
Hydrogen

An Energy Sector Roadmap to Carbon Neutrality in China Chapter 5: Near-term opportunities for a faster energy transition
PAGE | 213 IEA,
202
1.
stronger vehicle efficiency standards, new energy vehicle (NEV) mandates for trucks and intercity coaches, and clear targets to phase out the use of ICEs for two- and three-wheelers. Policies to speed up electrification of the remaining railway operations that rely on diesel and the deployment of fuel-cell electric buses, trucks and locomotives are also accelerated, setting the stage for faster decarbonisation in the 2030s.
Buildings Tougher policy measures drive down energy needs in buildings by 5% and direct emissions by 16% in 2030 in the ATS relative to the APS. Coal use in particular falls by more than 75%. The period to 2030 is critical for China to adopt sustainable construction and renovation practices to minimise the environmental impact of buildings in view of their long lifetimes.
In the APS, few of the buildings put up over 2021-2030 are zero-carbon-ready, though they are generally more efficient than recent ones thanks to a tightening of energy performance standards under the 14th FYP (2021-2025). In the ATS, there is a much greater emphasis on zero-carbon-ready buildings, driven by the tightening of standards already in place, such as the Assessment Standard for Green Buildings (GB/T 50378-2019) covering the use of materials, energy and water as well as indoor air quality and buildings operation management (China Legislation Standard, 2019). Their share of the total building stock reaches 16% by 2030 – over four times higher than in the APS and over six times higher than in 2020. Such buildings, which are much more efficient, can be easily adapted to run on low-carbon energy and do not need any upgrade to achieve zero emissions (see Chapter 3). Deep energy retrofitting of existing buildings is critical as two-thirds of China’s building stock were built after 2000. The rate of renovation to zero-carbon-ready standards ramps up to 1% of the residential buildings stock per year, or 500 million m2, in 2030, more than twice as much as in the APS.

An Energy Sector Roadmap to Carbon Neutrality in China Chapter 5: Near-term opportunities for a faster energy transition
PAGE | 214 IEA,
202
1.
Zero-carbon-ready residential building retrofits and new construction in China
IEA, 2021.
Note: APS = Announced Pledges Scenario, ATS = Accelerated Transition Scenario, ZCR = zero-carbon-ready.
The share of zero-carbon-ready buildings in the total building stock reaches 16% by 2030 in the ATS – over four times higher than in the APS
A faster shift to lower-carbon heating technologies also drives down buildings’ emissions in the ATS. Coal and oil boiler sales are cut by 95% and 50% respectively by 2030, while the share of natural gas boilers in heating system sales reaches 15%, and continues to decline. Heat pumps, district energy systems and other direct renewables-based technologies (mainly biomass boilers, solar thermal and geothermal) account for 75% - most of the remainder - of heating system installations in 2030 (60% in the APS). Final energy demand is reduced alongside emissions as the average energy efficiency of the new heating equipment jumps from about 120% in 2020 to 245% (230% in the APS) by 2030, driven by the faster take-up of highly efficient heat pumps, their efficiency reaching 450% in 2030.
Benefits of a faster transition Achieving a faster transition to clean energy over the period to 2030, as depicted in the ATS, brings a raft of socio-economic benefits to China beyond those associated with alleviating the impact of climate change. This section describes some of the main ones.
0%
5%
10%
15%
20%
0
500
1000
1500
2000
2020 APS ATS
2030
milli
on m
2 ZCR construction
ZCR retrofit
Other construction
Share of ZCRbuildings in stock(right axis)

An Energy Sector Roadmap to Carbon Neutrality in China Chapter 5: Near-term opportunities for a faster energy transition
PAGE | 215 IEA,
202
1.
A manufacturing hub for clean energy technology If all countries heed the call to raise climate ambitions to 2030 under updated NDCs at the 26th Conference of the Parties (COP-26) in Glasgow in late 2021, the global market for clean energy technologies will expand. China is well placed to compete. Over the last decade, it has become a global leader in the manufacturing of many clean energy technologies that are sold around the world, as well as in its domestic market. It is the leading producer and consumer of solar panels, batteries and EV. For instance, more than 70% of global battery manufacturing capacity in 2020, or 480 GWh per year, was manufactured domestically by Chinese companies (Benchmark Mineral Intelligence, 2021). Their international outreach is also set to grow as they are building new gigafactories in Europe and elsewhere. Chinese companies also made about 65% of all solar PV modules (with a capacity exceeding 100 GW), nearly 80% of PV cells and more than 95% of silicon wafers in 2020 (IEA PVPS, 2020; CPIA, 2021). China holds large reserves of some critical materials and much of the world’s minerals processing and refining capacity. It is also home to the production of several key raw minerals needed for many clean technologies, including lithium (57% global processing capacity), rare earth metals (60% global mining capacity) and cobalt (65% global processing capacity) (see Chapter 4).
China’s central role in global clean energy technology value chains, as both a technology developer and producer, as well as user, would be strengthened by a faster energy transition. The global reach of China’s clean energy sector is an important driver of the development and deployment of those technologies both in the domestic market and globally. Technology learning, leading to progressive reductions in cost and improvements in performance and manufacturing, is particularly rapid for technologies that are compact and can be standardised and mass- -produced, thus allowing them to be traded more easily. Batteries, solar PV cells, fuel cells, electrolysers and heat pumps fall in this category; together, they enable about 35% of the cumulative emissions avoided in the APS through to 2060 (or 170 Gt CO2) and even more in the ATS. By exporting these technologies, production is expanded more rapidly, boosting technological progress and lowering costs through economies of scale.
China’s aim to become a global leader in all the main technologies needed to achieve its target of carbon neutrality should reinforce these trends. China already dominates the global market for EV batteries, solar PV and heat pumps. The country is also well-placed to expand its involvement in the value chains of emerging technologies such as fuel cells and electrolysers. For instance, if China were to supply the same share of global EV battery demand by 2060 as it does today, the domestic battery manufacturing industry would be worth USD 260 billion – roughly

An Energy Sector Roadmap to Carbon Neutrality in China Chapter 5: Near-term opportunities for a faster energy transition
PAGE | 216 IEA,
202
1.
25 times its current size. China’s vast resources of critical minerals, from which metals required for the manufacturing of these technologies can be extracted, gives it a large competitive advantage over other countries. For instance, 60% and 35% of the global refining capacity for lithium and nickel respectively – the main metals used in batteries – is in China.
Global manufacturing capacity of selected clean energy technologies
IEA, 2021.
Note: PV = photovoltaics. Sources: Derived from Benchmark Mineral Intelligence (batteries), IEA PVPS and CPIA (PV modules) and ChinaIOL (heat pumps).
In 2020, China accounted for about 70% of global manufacturing capacity for solar PV modules and batteries, as well as over 40% of that for heat pumps
The accelerated installation of manufacturing capacity of low-carbon technologies in the ATS increases opportunities to exploit economies of scale in China and the rest of the world. Accelerating the expansion of China’s manufacturing capacity for clean energy technologies to 2030 supports its goal to restructure its domestic industry from heavy industrial sectors towards less energy-intensive higher value-added industries and reinforce its position as global leader in that sector, as well as boosting clean energy and related jobs (see below). This creates opportunities for China to acquire a strategic advantage in critical technology areas. For instance, a higher share of variable renewables in the electricity generating mix requires the development of new electricity management systems, more storage capacity and upgrades to the grid to facilitate load balancing.
Accelerating clean energy innovation The accelerated clean energy transition in the ATS bolsters clean energy innovation in China in areas such as hydrogen and synthetic fuel production for heavy industry and long-distance transportation or CCUS. The increasing role for
0%
20%
40%
60%
80%
100%
2015 2020
Heat pumps
China Rest of the world
0%
20%
40%
60%
80%
100%
2015 2020
Solar PV modules
0%
20%
40%
60%
80%
100%
2015 2020
Batteries

An Energy Sector Roadmap to Carbon Neutrality in China Chapter 5: Near-term opportunities for a faster energy transition
PAGE | 217 IEA,
202
1.
CCUS and hydrogen in the ATS starts in the next decade. CO2 capture reaches 360 Mt in 2030, compared with only 20 Mt in the APS, while low-carbon hydrogen production grows to nearly 8 Mt in compared with 3 Mt in the APS.
A faster transition to clean energy attracts more foreign and domestic investment in demonstration projects for emerging low-carbon technologies in China, as the demand for these technologies takes off sooner. This offers the opportunity of technology leadership to China and opens the possibility to expand exports.
China has a clearly stated aim to become a global leader in innovation as part of its strategy to transform its economy away from low-value manufacturing and towards high-value innovative technologies. Clean energy and critical minerals are among its innovation priorities. The global clean energy transition offers China an opportunity to push the technology frontier and maintain its share of the market for energy-related appliances and equipment. The global market for these goods is set to grow rapidly, but competition will be fierce: other countries are ramping up their R&D spending and developing value chains for emerging technologies in areas such as hydrogen. Enhanced international collaboration on developing and deploying clean energy technologies is required to facilitate the transition to carbon neutrality in China and the rest of the world (see Chapter 7).
Indicators of the deployment of selected innovative clean energy technologies in China in the APS and the ATS, 2030
IEA, 2021.
Note: APS = Announced Pledges Scenario, ATS = Accelerated Transition Scenario.
Clean energy technologies under development or that reached the market recently make much greater inroads by 2030 in the ATS than in the APS
China’s large domestic market will remain the basis for the development and deployment of clean energy technologies. As a huge, unified market with largely uniform regulations and technical requirements, it offers domestic innovators an
0 20 40 60 80
Carbon capture in cement
Mt CO2
APS
Additionalin ATS
0 20 40 60 80 100
Electrolyser capacity
GW
0 0.05 0.1 0.15 0.2 0.25 0.3
Fuel cell trucks
million vehicles

An Energy Sector Roadmap to Carbon Neutrality in China Chapter 5: Near-term opportunities for a faster energy transition
PAGE | 218 IEA,
202
1.
attractive target for product development, fundraising and rapid large-scale commercialisation of best international solutions, giving researchers and manufacturers a strong competitive advantage over those in most other countries (see Chapter 6). China can continue to lead the way as a test bed for new technologies that can be subsequently exported. This is especially true for heavy industrial technologies, where China is expected to remain dominant (given the size of its domestic market), but also for those associated with energy-related infrastructure, including electricity grids, vehicle recharging networks, long-duration energy storage, and low-emissions ships and trains, as well as those to produce low-carbon fuels and consumer goods, such as road vehicles and digital appliances.
Innovative technologies that are not commercially available today are deployed in the current decade in China thanks to stronger policies. For example, in the ATS, the share of CCUS-equipped cement plants in total production reaches 4% in 2030, whereas this technology is not deployed commercially in China in the APS. Hydrogen-based primary steel production reaches 1% of domestic production in the ATS, while it is not deployed commercially until the early 2030s in the APS. In the transport sector, aircraft running on sustainable aviation fuels (biokerosene or synthetic hydrogen-based fuel) account for 15% of the country’s aviation energy demand in 2030 in the ATS, compared with just 2% in the APS.
More and better energy jobs As in other parts of the world, the transition to carbon neutrality in China increases the number of employees working in energy and energy-related sectors. Many of these jobs are well-paid and offer better and safer working conditions compared with traditional energy sector work, especially coal mining. These changes, if co-ordinated with other larger shifts in labour, support China’s broader objectives for industrial restructuring and socioeconomic development in those regions with low GDP per capita.
Accelerating the energy transition hastens job creation. We estimate that roughly 11 million people in China were working directly in the oil, gas, coal, renewables and bioenergy supply and energy network industries in 2020. In the APS, jobs in clean energy supply and related sectors, such as battery manufacturing and energy efficiency retrofits, increase by 2.2 million by 2030, while employment in oil, gas and coal fuel supply and fossil fuel power plants declines by 1.8 million, leading to a net increase of around 0.4 million energy jobs. The change is much more significant in the ATS: jobs in clean energy supply increase by 3.6 million and fall by 2.3 million in the fossil fuel industries, resulting in a net increase of 1.3 million jobs over the same period.

An Energy Sector Roadmap to Carbon Neutrality in China Chapter 5: Near-term opportunities for a faster energy transition
PAGE | 219 IEA,
202
1.
Employment in China’s coal sector is set to continue to shrink, regardless of whether policies to speed up the energy transition are strengthened. Jobs in coal mining and washing have already been in decline over the past decade, falling by 2 million since 2013 and reaching around 3 million today.2 This was primarily due to declining numbers of mines under development and operation and a near 80% improvement in coal productivity, driven by mechanisation. Another 1.6 million jobs in all coal mining (including upstream mining equipment suppliers), or 45%, are lost by 2030 in the APS, and 1.9 million, or 55%, in the ATS. These declines are driven in large part by productivity gains (near 45% of job losses in APS and 35% in ATS), and continuing decline in new mine development and closing existing small mines. Chinese coal production declines only by around 2% to 2030 in the APS and 20% in the ATS. This accelerated decline in coal demand only results in 15% of the coal job losses in the ATS. Productivity gains are made through the closure of inefficient mines producing less than 300 000 tonnes per year, which today account for around 40% of mines in China.
Energy-related employment in China
IEA, 2021.
Notes: Employment estimates for 2019 include energy supply sectors only as there is insufficient information on jobs directly attributable to energy-related activities (e.g. efficiency). APS = Announced Pledges Scenario; ATS = Accelerated Transition Scenario; CCUS = carbon capture, utilisation and storage. 2019 was chosen as the base year for modelling because of the large impact of the Covid-19 pandemic on employment. Changes in employment do not include jobs filled by transferring workers from one business unit to another (e.g. conventional car manufacturing to EVs). This is likely to underestimate the total number of new jobs created in both the APS and the ATS.
In the ATS, clean energy jobs increase by 3.6 million, while 2.3 million are lost in fossil fuels. This creates 1.3 million jobs on net, almost 1 million more jobs than in the APS.
2 Official employment estimates in China for coal mining and washing include only those working in legal entities registered with industrial and commercial departments. This misses informal employment in the sector.
Change in employment 2019-2030
-4
-2
0
2
4
APS ATS
milli
on jo
bs
Oil and gas Coal Coal productivityLow-emissions buildings retrofits Battery manufacturing Hydrogen and CCUSElectricity Bioenergy Net change
0
3
6
9
12
2019
milli
on jo
bs
Total energy sector employment

An Energy Sector Roadmap to Carbon Neutrality in China Chapter 5: Near-term opportunities for a faster energy transition
PAGE | 220 IEA,
202
1.
China’s different coal producing regions have markedly varied levels of modernisation. Job losses will be more pronounced in provinces with many small mines and low levels of coal mining mechanisation, such as Shanxi, Henan, Shandong, Anhui, Heilongjiang, and Hebei. Whereas provinces like Inner Mongolia, Sha’anxi, and Xinjiang deploy more modern mining practices or have a higher share of surface mining, which allows greater labour productivity. New job opportunities in mining could arise in different parts of the country, as demand for critical minerals, such as lithium and rare earth metals, grows rapidly with the global clean energy transition, though they will probably not be sufficient to compensate for all the lost coal mining jobs as all mining industries are meant to improve productivity and reduce overcapacity.3
Some of these provinces have diversified economies, and will have more opportunities for unemployed miners to find work in new sectors. Many low-skilled coal miners, as well as highly-skilled workers displaced in the oil and gas industry, may move to cities and work in other industries or the services sector. Skilled employees may find new opportunities in similar roles within wholesale trading, financial, accounting and legal services, including carbon management. Training programmes could support transitioning these workers while cultivating a highly-skilled workforce for China’s new energy economy that increases international competitiveness of Chinese firms. China piloted a transition support programme to retrain and compensate workers that lose their jobs in the coal and steel industries, which has run since 2016, with a budget of USD 14 billion (CNY 100 billion), and is set to end in the coming years. This programme could be further refined to ensure targeted training that reaches workers directly, instead of being directed through companies. Such efforts could position China’s workforce wider objectives of restructuring the economy away from heavy industry and towards higher-value technologies and services sector, and fostering a more vibrant private sector. In the APS, more than 20 million workers leave heavy industries for jobs elsewhere in the economy; in the ATS, the figure is closer to 30 million. These workforce transitions happen while total employment continues to grow in China to 2030 with greater job growth in services and tertiary industry. Policy makers should remember that energy is just one small part of a larger
3 This push to improve productivity and reduce industrial capacity is mirrored in heavy industries as well, although occurring much later than the decline of coal. However, these are all part of a larger shift in China away from primary and heavy industry, driven by China’s economic reforms and efforts to streamline state-owned enterprise operation. From 2015-2019, employment in primary and heavy industry fell by around 25 million and in secondary industry by around 15 million, while employment in the services sector increased by nearly 40 million (China National Bureau of Statistics, 2020). This trend is expected to continue over the current FYP period (2021-2025).

An Energy Sector Roadmap to Carbon Neutrality in China Chapter 5: Near-term opportunities for a faster energy transition
PAGE | 221 IEA,
202
1.
labour force in flux — job losses in primary industry are 10-15 times larger than those in fossil energy — and design training programmes and economic transition policies accordingly.
A faster transition to clean energy boosts the creation of jobs in related industries as well, including manufacturing NEVs and more energy-efficient appliances and equipment, and construction. In the ATS, clean energy and related jobs in total rise by 5 million, compared with 3.3 million in the APS. Over half of the additional positions in the ATS and APS are highly skilled, underscoring again the need for training and retraining programmes. As China is already a manufacturing hub for a large portion of the clean energy supply chain; a faster transition elsewhere in the world also boosts job creation in that sector. China is set to gain additional market share and employment gains from any near-term increase global in solar and battery demands, as China holds 60-80% of global manufacturing capacity across each step of the production process. In the longer term, however, it is likely that other countries also ramp up domestic manufacturing capacity.
Additional workers needing clean energy skills or training in the APS and ATS, 2019-2030
IEA, 2021.
Note: APS = Announced Pledges Scenario; ATS = Accelerated Transition Scenario; EV = electric vehicle; CCUS= carbon capture utilisation and storage.
By 2030, 5 million workers will need additional skills to hold positions in clean energy sectors in the ATS. Over half of the additional positions being highly skilled
The employment benefits of a faster energy transition in China are not automatically evenly distributed across the country. Its populous coastal regions today are home to many manufacturing jobs, which are less at risk in the transition. In the less developed interior, more jobs in fossil fuel extraction are lost in the ATS, but are outweighed by additional jobs in renewable energy, emerging technologies
Skill level
Occupation
20% 40% 60% 80% 100%
Professional33%
Construction26%
High 54% Medium 32%
By type in the ATS
Manufacturing27%
Other19%
Low8%
1 2 3 4 5 6
APS
ATS
millions
Grids Power generation EVs Bioenergy production Efficiency End-use renewables CCUS and Hydrogen Battery manufacturing
By sub-sector and scenario/case

An Energy Sector Roadmap to Carbon Neutrality in China Chapter 5: Near-term opportunities for a faster energy transition
PAGE | 222 IEA,
202
1.
such as CCUS, and minerals extraction and processing. Even if these new industries demand less unskilled labour, environmental rehabilitation and forestry (not considered in our projections) could create additional demand for low-skilled labour for fixed periods during the transition. The government would be well advised to actively develop retraining and community transition plans, which could locate new clean energy facilities in areas heavily affected by job losses. Together with urbanisation and the ageing of the population, this could alleviate the pain points of immediate job losses in these acutely effected regions.
A more orderly transition that reduces emissions lock-in A faster transition also increases the chances of reaching carbon neutrality in an orderly fashion, leaving more time for markets to adjust and businesses and consumers to adapt to new conditions. In the APS, there is a steady average annual reduction in CO2 emissions of about 385 Mt/year from 2030 to 2060. In the ATS, the required average annual pace of emissions reductions between 2030 and 2060 is almost 20% lower.
An important benefit of the ATS is that there is less need to lower future emissions from long-lived carbon-intensive assets, emissions from which risk being locked in (see Chapter 1). In the APS, such assets in the power and industry sectors emit almost 100 Gt cumulatively over the period 2021-2030, of which assets commissioned within that period are responsible for around 13 Gt, or 13%. The new assets include 88 GW of new coal-fired power capacity (around 45% of all global additions in the APS), more than 60% of which is already under construction today. Given their long operating lifetimes, those plants would continue to emit large amounts of CO2 – around 0.4 Gt/year on average to 2060 – unless decommissioned or retrofitted with CCUS or other low-carbon technologies. Large-scale retrofits and closures are required to ensure the target of carbon neutrality in 2060 is achieved in the APS.
Cumulative additions of selected carbon-intensive energy assets in China in the APS and ATS, 2021-2030
Capacity additions/sales 2021-2030 APS ATS
Unabated coal-fired power generation capacity additions (GW) 88 75
Unabated primary steel production capacity additions (Mt) 275 258
Residential fossil-fuel boiler installations (million) 135 105
ICE truck sales (million) 34 26
Note: APS = Announced Pledges Scenario; ATS = Accelerated Transition Scenario."

An Energy Sector Roadmap to Carbon Neutrality in China Chapter 5: Near-term opportunities for a faster energy transition
PAGE | 223 IEA,
202
1.
Because less long-lived fossil-fuelled capacity in the power and industry sectors is commissioned to 2030 in the ATS, the need to cut future emissions from them is reduced by 3 Gt, or one-quarter, cumulatively to 2030, and around 20 Gt (more than half) to 2060, compared with the APS. Limiting coal-fired power plants capacity additions alone accounts for nearly 25% of the emissions savings to 2030, with the heavy industry sectors accounting for most of the rest. Beyond the power and industry sectors, the extent to which shorter-lived assets contribute to additional locked-in emissions is also reduced. Residential fossil-fuel boiler installations are more than 20% lower in the ATS in 2030, leading to 30 million fewer installations cumulatively over the period 2021-2030. Cumulative sales of ICE trucks over the decade are also 8 million, or over 20%, lower in the ATS, compared with the APS.
A bigger energy sector contribution to carbon neutrality A faster clean energy transition makes it easier for China to achieve its goal of carbon neutrality in 2060. Indeed, reaching net zero CO2 emissions from the energy sector well before 2060 may prove necessary. The Chinese government has recently indicated that the target for peak emissions before 2030 concerns energy-related CO2 emissions, while the 2060 carbon neutrality target may cover economy-wide GHG emissions (see Chapter 1). There is some uncertainty around the exact level of total GHG emissions in China. Emissions of non-CO2 GHGs, including non-CO2 emissions from the energy sector and GHG emissions from non-energy-related activities such as agriculture, have recently been estimated at 2.4 Gt CO2eq in 2020, while forestry and other land-use changes were estimated at 0.7 Gt CO2eq of net-negative emissions (He, J. et al., 2021). This compares with energy sector CO2 emissions of more than 11 Gt in 2020.
In the scenarios from integrated assessment models compiled by the Intergovernmental Panel on Climate Change (IPCC) that limit global warming to below 1.5°C at the end of the century with limited overshoot, energy sector CO2 emissions generally reach net zero earlier than other non-CO2 GHGs, with carbon removal used to offset residual non-CO2 and non-energy sector GHG emissions, either through energy sector technologies (bioenergy with CCUS or direct air capture) or through natural-based solutions (IPCC, 2018)4. This is because eliminating some non-CO2 emissions, such as nitrous oxide emissions in agriculture, is particularly difficult. It follows that reaching net zero energy sector CO2 emissions in China earlier than 2060 may be needed to allow more time to reduce
4 Projected non-CO2 GHG emissions in China in climate mitigation scenarios range between 1.27 and 1.76 Gt CO2-eq by 2050 – between an almost 30% and 50% reduction relative to 2020. This is in contrast with between a 75% and around 90% emissions reductions for energy sector CO2 emissions over the same period (He, J. et al., 2021).

An Energy Sector Roadmap to Carbon Neutrality in China Chapter 5: Near-term opportunities for a faster energy transition
PAGE | 224 IEA,
202
1.
its non-CO2 emissions and facilitate the achievement of overall carbon neutrality by 2060. In practice this may require accelerating the date of net zero CO2 emissions from the energy sector and minimise its emissions already towards 2050. A faster energy transition to 2030, as in the ATS, makes that much easier to achieve as it reduces the pace of that transition needed after 2030.
The faster transition to 2030 in the ATS reduces considerably the emissions from long-lived carbon-intensive assets coming online or being refurbished over that period (see above). Relative to APS, this tempers the pace of deployment of clean energy technologies needed after 2030 if China was to aim at reaching net zero CO2 emissions by 2050. Based on an ATS trajectory to 2030, 12 GW of new solar PV and wind capacity is avoided annually (or 5% of yearly additions) relative to following the APS until 2030. In addition, around 1 million (10%) fewer residential heat pumps need to be deployed on an annual basis, and 1 Mt (4%) of steel production capacity addition using low-carbon routes are avoided.
Average annual growth rate of primary energy intensity and share of non-fossil fuels in primary energy demand for the energy sector to achieve net zero CO2 emissions by 2050 in China
IEA, 2021.
Note: APS = Announced Pledges Scenario. ATS = Accelerated Transition Scenario.
A faster energy transition to 2030 makes it easier to achieve net zero energy sector CO2 emissions earlier than 2060 and net zero GHG emissions by 2060
The benefits of a faster transition in China span beyond the country’s domestic goals. China’s weight in global CO2 emissions makes its decarbonisation pathway a key driver of the world’s CO2 emissions trajectory and, hence, the consequences for global temperature. Depending on when China’s emissions peak or reach net zero, its total cumulative emissions from 2021 to the year of net zero may be cut by around 45%.
-8%
-6%
-4%
-2%
0%2020-2030 2030-2040 2040-2050
APS until 2030 to net zero emissions by 2050 ATS until 2030 to net zero emissions by 2050
Primary energy intensity of GDP
0.0%
2.5%
5.0%
7.5%
10.0%
2020-2030 2030-2040 2040-2050
Non-fossil fuels in primary energy

An Energy Sector Roadmap to Carbon Neutrality in China Chapter 5: Near-term opportunities for a faster energy transition
PAGE | 225 IEA,
202
1.
References Benchmark Mineral Intelligence (2021), Lithium ion battery megafactories assessment,
www.benchmarkminerals.com/megafactories/.
ChinaIOL (2021), Datacentre of Beijing Zhixindao Sci-Tech Corp., Ltd., http://data.chinaiol.com/ecdata/index.
China Legislation Standard (2019), Assessment Standard for Green Buildings (GB/T 50378-2019), www.cnstandards.net/index.php/gb-t-50378-2019-assessment-standard-for-green-building/.
CPIA (Chinese Photovoltaic Industry Association)CPIA (2021), China PV Industry Development Roadmap 2020.
Development Asia (2016), Revitalizing a City by Reviving a Stream, https://development.asia/case-study/revitalizing-city-reviving-stream, accessed 9 August 2021.
He, J. et al. (2021), Comprehensive report on China's Long-Term Low-Carbon Development Strategies and Pathways, Chinese Journal of Population, Resources and Environment, https://doi.org/10.1016/j.cjpre.2021.04.004.
IEA PVPS (Photovoltaic Power Systems Programme) (2020), National Survey Report of PV Power Applications in China, https://iea-pvps.org/wp-content/uploads/2020/09/NSR_China_2019.pdf.
IPCC (Intergovernmental Panel on Climate Change) (2018), Summary for policymakers, in: Global Warming of 1.5°C, Masson-Delmotte, V., P. et al. (eds.), www.ipcc.ch/site/assets/uploads/sites/2/2019/05/SR15_SPM_version_report_LR.pdf.

An Energy Sector Roadmap to Carbon Neutrality in China Chapter 6: Innovation for carbon neutrality
PAGE | 226 IEA,
202
1.
Chapter 6: Innovation for carbon neutrality
Highlights
The People’s Republic of China (hereafter, “China”) has joined the top table of energy-innovating countries. Public spending on low-carbon energy research and development (R&D) has risen by 70% between 2015 and 2019 and now represents 15% of the global total. China accounts for nearly 15% of patent activity in renewables and 10% in electric vehicles (EVs). In the last three years its start-ups have attracted 35% of global early-stage energy venture capital, compared with 5% in 2010-2014. China’s contributions to solar photovoltaics (PV) cost reductions, in particular, have changed the way the world thinks about energy innovation.
A major push for clean energy innovation will be required for China to achieve its carbon neutrality targets. About 40% of the CO2 emissions reductions in 2060 in the Announced Pledges Scenario (APS) come from technologies that are at prototype or demonstration stage today. This share is highest in heavy industry and long‐distance transport. To ensure that critical emerging technologies are available by the 2030s, major innovation efforts are needed in the 2020s.
The 14th Five-Year Plan (FYP) aims to shift the focus of technology development to carbon neutrality and pursue new policy approaches, building on a unique foundation. China’s energy innovation system exhibits five key policy features that are rarely found together elsewhere: the ability to mobilise funding towards strategic national missions; devolved responsibility to state-owned enterprises (SOEs); empowering provincial and municipal governments to experiment and compete; reaping the benefits of a vast domestic market that spreads risks and sustains competition; and learning from international co-operation, especially between firms. Together, they form a framework that is highly centralised in goal setting and relatively decentralised in goal attainment.
Low-carbon energy technologies, including carbon capture, utilisation and storage (CCUS), hydrogen, biofuels and electrification value chains, are highly diverse. The various features of China’s innovation system will need to be harnessed appropriately for each technology. Large-scale technologies like CCUS and biorefining are suited to the main Chinese policy incentives, as are some elements of network infrastructure, while for low-carbon consumer products, China’s manufacturing strengths provide a strong foundation. Building trust through strong intellectual property governance, fair access to markets and depoliticised supply chains would reduce the risk of undermining international collaboration and co-operation on clean energy innovation.

An Energy Sector Roadmap to Carbon Neutrality in China Chapter 6: Innovation for carbon neutrality
PAGE | 227 IEA,
202
1.
Clean energy innovation in China This chapter summarises the case for China to intensify clean energy innovation, drawing on various examples and policy statements to indicate a way forward. It reviews the status of energy innovation policy making in China at the inception of the 14th FYP (2021-2025) and explores five unique features of the Chinese energy innovation landscape that the government could harness to accelerate the development of the key technologies needed for carbon neutrality.
Innovation is needed to meet climate goals The Chinese government recognises that reaching carbon neutrality by 2060 will not be achievable without a major acceleration in clean energy innovation. Such innovation, which is expected to be a major driver of economic growth in the coming decades, stands at the confluence of three major strategic national objectives:
Technological leadership: to become “the top innovation-oriented country by 2035” and “the world's major science centre and a highland of innovation” (Xi, 2021a; Xi, 2021b).
Innovation-driven growth: to build a "new momentum" for high quality economic development, with scientific and technological achievements as the “main battlefield of the economy and society” (Wang, 2021).
Tackle environmental challenges: to achieve the vision of an “ecological civilisation”, including a peak in CO2 emissions before 2030, carbon neutrality before 2060, and tackling air, water and land pollution.
Reaching net zero emissions will require the widespread use after 2030 of technologies that are still at the prototype or demonstration stage today. In the APS technologies that are available on the market today provide the bulk of the CO2 emissions reductions required in 2030 relative to 2020 but, in 2060, 40% of the reductions come from technologies that are under development today. The share of emissions reductions in 2060 that come from technologies currently at demonstration or prototype stage is the highest in heavy industry and long‐distance transport, whose decarbonisation rely on electrification, hydrogen, CCUS and advanced biofuels.

An Energy Sector Roadmap to Carbon Neutrality in China Chapter 6: Innovation for carbon neutrality
PAGE | 228 IEA,
202
1.
Figure 6.1 CO2 emissions reductions by current technology maturity category in China in the APS
IEA, 2021.
Note: APS = Announced Pledges Scenario.
More than 90% of the CO2 emissions reductions by 2030 are from technologies readily available today whereas about half of the reductions in 2060 relative to 2030 come from technologies that are currently only at the prototype or demonstration phase
To ensure that critical technologies for carbon neutrality are available in China and the rest of the world by the 2030s, major innovation efforts are needed in the current decade. As one of the world’s largest energy markets and an emerging leader in clean energy innovation, China will be central to the global challenge. It is expected to be home to many first-of-a-kind energy projects and products, especially in heavy industry. China has become a major exporter of clean energy technology in recent decades. With its R&D resources and world-scale companies, China has the potential to innovate advanced low-carbon technologies for adoption and adaptation in other countries, especially in emerging market and developing economies. Announcements in support of the 14th FYP (2021-2025) recognise the importance of international co-operation alongside other policy mechanisms as highlighted in this chapter.
Clean energy innovation in the five-year plans China’s overarching ambitions for energy and climate technology innovation are encapsulated in its FYPs and supported by high level strategies including “Made in China 2025” and “China Standards 2035”, which seek to ensure that Chinese companies participate throughout strategic value chains and have a voice in international rulemaking (Chipman Koty, 2020). The 14th FYP emphasises energy technology innovation to support decarbonisation efforts more than in previous plans (Li, 2021; Xinhua News, 2021a). It also continues the shift towards technology areas compatible with carbon neutrality started in the 11th FYP
0
3
6
9
12
15
18
2020 Servicedemand
Mitigationmeasures
2030 Servicedemand
Mitigationmeasures
2060
Gt C
O2 Behaviour
Mature
Market uptake
Demonstration
Prototype
Service demand

An Energy Sector Roadmap to Carbon Neutrality in China Chapter 6: Innovation for carbon neutrality
PAGE | 229 IEA,
202
1.
(2006-2010). Together, these plans shape how China promotes clean energy innovation and innovation in related areas such as critical minerals, in which China has already demonstrated strategic interests (IEA, 2021a).
Table 6.1 Technology development and key energy innovation priorities outlined in China’s recent five-year plans
11th FYP (2006-2010)
12th FYP (2011-2015)
13th FYP (2016-2020)
14th FYP (2021-2025)
General innovation approach
Ramp up technology manufacturing to boost exports.
Prime domestic markets and manufacturing innovations.
Seek novel innovations in priority technology areas.
Keep edge in manufacturing and prime breakthrough innovations.
Key focus areas for energy innovation
Nuclear, coal, automobiles and new materials.
Solar, wind, electric vehicles and charging.
Next-generation renewables, energy storage, new energy vehicles and batteries, smart power grids and buildings energy efficiency.
Next-generation batteries and new energy vehicles, hydrogen and fuel cells, advanced biofuels, CCUS and smart digital systems.
Notes: CCUS = carbon capture, utilisation and storage. Key focus areas for innovation correspond to those technologies for which innovation is mentioned in high level policy documents and guidelines. As priorities typically roll over in five-year plans (FYPs), the table focuses on additions relative to previous FYPs. Sources: NDRC (2016); NDRC and NEA (2016a and 2016b); NEA (2016); State Council (2016a and 2016b).
Documents in support of the 14th FYP (2021-2025) published since it was released in 2020 set out expectations for energy innovation. The Energy Development in the New Era White Paper establishes high level guidelines for strengthening the “driving force of technology innovation” and developing emerging strategic industries in light of China’s new carbon neutrality targets (State Council, 2020). The paper calls for major science and technology (S&T) projects in oil and gas, third- and fourth-generation nuclear power, new energy vehicles, smart grids, coal mining and use, renewables, hydrogen and fuel cells, and energy storage. It targets building over 80 national energy R&D centres and laboratories in collaboration with scientific research institutes, universities and enterprises. While the plan aims to prioritise the development of non-fossil energy, it still foresees a major role for technology for more efficient use of fossil fuels.
The Ministry of Science and Technology is developing a “carbon peak and carbon neutral technological innovation action plan”, which will be complemented in 2021 with a detailed carbon-neutral technology development roadmap and a list of new R&D and demonstration programmes (ACCA21, 2021 and 2020; MOST, 2021a).

An Energy Sector Roadmap to Carbon Neutrality in China Chapter 6: Innovation for carbon neutrality
PAGE | 230 IEA,
202
1.
There are signs that they will align much more closely with the technology needs of the APS than the initiatives associated with previous FYPs. However, there are also indications that fossil fuels, including coal, will continue in parallel in 2021-2025 but will be scaled back.
China’s economy-wide push to be in the vanguard of technology innovation involves the introduction of new policy approaches, including efforts to stimulate competition among technology developers and strengthen innovation cultures in research institutions and the corporate sector. Under the 14th FYP (2021-2025), China is expected to:
Increase R&D spending by over 7% every year (more than the gross domestic product (GDP) growth target for 2021) to surpass the US and European R&D budgets, and raise the share of basic research in total public R&D to 8% (up from about 6% in 2019).
Concentrate resources on strategic emerging energy areas, including CCUS, hydrogen, industrial decarbonisation, digital and smart energy, and advanced biofuels for transport.
Grant more autonomy to researchers and increase competition among them by broadening access to publicly funded programmes for young scientists and using performance-based open competition mechanisms, such as the new “bounty system” and “disruptive technology innovation competitions” (MOST, 2021b).
Set up climate neutrality innovation centres to foster collaboration between research institutes, enterprises and universities, including China’s first carbon neutral innovation centre in Sichuan, announced in April 2021 (Li and Chen, 2021), and a CCUS innovation centre.
Encourage enterprises to increase R&D spending and capture a larger share of global supply chains for clean energy technologies, including through tax incentives or other non-traditional fiscal policy tools such as “innovation points” systems that reward innovative firms located in official National High-Tech Zones with financing (MOST, 2021c).
Enhance governance by aligning intellectual property protection with international best practice, modernising S&T institutions, improving evaluation and monitoring mechanisms for R&D, and promoting international collaboration in energy R&D and demonstration.

An Energy Sector Roadmap to Carbon Neutrality in China Chapter 6: Innovation for carbon neutrality
PAGE | 231 IEA,
202
1.
Box 6.1 Bounty system
In support of its renewed focus on innovation in the 14th FYP (2021-2025), China’s State Council announced in May 2021 the adoption of a new bounty system to “give young and capable scientists more opportunities, facilitate the commercialisation of their research results and help them clear technological obstacles to meet the country's socio-economic needs” (State Council, 2021; Xinhua, 2021b). The system has been pilot tested locally since 2016, mostly for non-energy technologies and will now be rolled out nationwide (Zhihao, 2021a and 2021b). Several fields relevant to clean energy have been identified. For example, special projects under this scheme have been put forward in critical and rare earth minerals (with funding of USD 3 million [CNY 20 million]), new energy vehicles (USD 8 million [CNY 60 million]), energy storage and smart grids (USD 5 million [CNY 33 million]) and hydrogen technologies (USD 8 million [CNY 55 million]) (Yezi, 2021).
The details have not yet been published, but the expected for applying and receiving a bounty is:
• The government publishes a list of specific research obstacles (submitted by public institutions or private companies).
• Any capable research teams can apply to clear those obstacles irrespective of their educational qualifications or the job positions of their leading scientists, with priority given to younger applicants.
• Selected research teams will receive government funding and policy support.
• Recipients will be evaluated rigorously for quality and timeliness.
The bounty system represents a break with previous funding programmes, which were often limited to SOEs or government research intuitions and followed the same direction as their existing research.
China’s role in global energy technology development China has made major contributions to energy technology development since 2000. As a hub for manufacturing innovations, innovation in China has had an impressive impact on the clean energy sector, notably in helping to reduce the costs of solar PV by over 90% since 2005 and automotive lithium batteries by 90% since 2010. The experience with solar PV, batteries and light-emitting diodes (LEDs), has arguably changed energy technology expectations more generally, raising confidence that innovation will lower the economic and political barriers to tackling climate change. More recently, China’s contributions to product and equipment improvements have grown as its foundational science capabilities have improved,

An Energy Sector Roadmap to Carbon Neutrality in China Chapter 6: Innovation for carbon neutrality
PAGE | 232 IEA,
202
1.
particularly in ultra-supercritical coal (UCS) combustion, coal conversion, ultra-high voltage transmission and nuclear power. China is now at the forefront of further advances in solar PV, battery, electric vehicle (EV), hydrogen and digital technologies as researchers and technology developers worldwide seek energy solutions that can follow similarly steep learning curves based on modularity and large-scale manufacturing.
China accounted for one-quarter of global public spending on energy R&D and 15% of spending on low-carbon energy R&D in 2020.1 Public energy R&D spending increased under the 13th FYP (2016-2020) from about USD 6.8 billion (CNY 47.2 billion) in 2015 to USD 8.3 billion (CNY 57.3 billion) in 2019, making China the world’s largest energy R&D spender in absolute terms ahead of the United States in that year and the third-largest per unit of GDP after Norway and Finland. Following pledges made in 2015 under Mission Innovation, China’s low-carbon energy R&D spending increased 70% from USD 2.4 billion (CNY 16.8 billion) to USD 4.1 billion (CNY 28.1 billion) over the same period, compared with a rise in GDP of about 30%, raising the low-carbon share of total energy R&D from 35% to nearly 50%.
Figure 6.2 China’s share of global public spending on low-carbon energy R&D, venture capital and patenting
IEA, 2021.
Notes: Left graph: R&D = research and development. Spending includes government and "state-owned enterprises budget estimates. Middle graph: venture capital represents seed, series A and B, grants, growth equity, private investment in public equity, buyout and late-stage private equity, and coin/token offering venture capital deals in clean energy start-ups. Right graph: EVs = electric vehicles; HVAC = heating, ventilation and air conditioning; PV = photovoltaics. Patent counts in climate-change mitigation technologies relating to energy filed in at least two geographical offices. Three-year moving averages are used. Sources: IEA analysis (2021) based on data from: IEA (2021b); Cleantech Group (2021); OECD (2020).
China accounts for about 15% of global public spending on low-carbon energy R&D and a rising share of start-up and patenting activity
1 While data on inputs to innovation, such as R&D spending and finance for entrepreneurs, and outputs from innovation, such as patents, are imperfect proxies for innovation quality and long-term outcomes, they illustrate the rising level of effort and importance given to clean energy innovation in China.
0%
5%
10%
15%
20%
25%
30%
2000 2005 2010 2015
Patenting
Batteries EVs HVAC Hydrogen and fuel cells Lighting Smart grids Solar PV Wind
0%
5%
10%
15%
20%
2015 2020
Shar
e of
wor
ld
R&D spending
0%
10%
20%
30%
40%
2010 2015 2020
Venture capital

An Energy Sector Roadmap to Carbon Neutrality in China Chapter 6: Innovation for carbon neutrality
PAGE | 233 IEA,
202
1.
The increase in China’s clean energy funding has been accompanied by a shift in the focus of energy innovation from publicly led R&D and demonstration projects to addressing other elements of its innovation system (IEA, 2020a). This includes more decentralised responsibility for both R&D and deployment of new technologies, as well as more attention to flows of knowledge between researchers and industry.
China’s share of international patenting activity for clean energy technologies has grown markedly over the last two decades. In 2018, Chinese inventors accounted for 32% of global patenting for lighting, 23% for heating and cooling, 25% for solar PV, 10% for wind, 12% for other renewables, 13% for batteries and 8% for EV and charging technologies. In addition, venture capital activity started to skyrocket in China around 2015, with a focus on electric mobility and a number of very big early-stage deals (above USD 150 million [around CNY 1 billion]); there were few Chinese start-ups in the energy sector just ten years ago. In 2019, energy in total attracted about as much venture capital investment as semiconductors or medicine and health (MOST, 2021d). Over 2018-2020, China accounted for about 35% of global early-stage financing for clean energy start-ups.
China’s approach to energy innovation Choices about technology development in China are often characterised as the result of decisions taken and applied in a top-down manner, but this oversimplifies the unique systems in place that encourage rapid innovation. These systems have several features that are largely unmatched in their nature or scale worldwide. This section focuses on five features, assessing their impact on innovation and contrasting them with approaches in other countries:
Mobilising funding for strategic national missions.
Devolving responsibility for innovation to SOEs.
Empowering provincial and municipal governments to experiment and compete.
Reaping the benefits of the country’s vast domestic market to spread risks and sustain competition.
Facilitating international co-operation to accelerate learning, especially between firms.
The energy technologies that China has prioritised in the past decade, including nuclear power, high voltage transmission, coal conversion, batteries, EVs and hydrogen, have all benefitted from these five factors to some extent.

An Energy Sector Roadmap to Carbon Neutrality in China Chapter 6: Innovation for carbon neutrality
PAGE | 234 IEA,
202
1.
The combination of these features creates a framework that is highly centralised in goal setting and relatively decentralised in goal attainment, providing considerable flexibility for policy makers and companies to experiment quickly and on a large scale (Xu, 2020). While working within the boundaries of the objectives established by the national government, SOEs, private companies, universities and provincial and municipal governments are given considerable scope to define targets, take risks and follow technological paths that would be unfamiliar to most other countries. This is facilitated in particular by the sheer size of the national and provincial economies, which can accommodate several projects at the same time. It is also driven by a history of needing to deliver projects with lower budgets than in other countries, such as the United States.
The innovation system that has emerged benefits from the rapid learning from multiple efforts at different levels of government oversight with a higher tolerance of failure than elsewhere in the world. In digital technologies in particular, China’s market size and speed of adoption of new products are bringing high expectations of disruptive change, but have not yet brought the country to the international frontier of certain complex energy technologies. That is the official goal for the next five years.
Mobilising funding for strategic national missions China’s FYPs provide a common vision of technology priorities over the medium term and can ensure stable funding for R&D projects that result from the high-level guidance. Certain energy technology objectives have been elevated to the status of national missions with strategic socio-economic importance. They include USC coal and nuclear power generation, as well as oilfield drilling and coal conversion, all of which have received high-level support and large-scale funding in recent FYPs, driven by concerns about energy security and, to a lesser extent, environmental protection.
The development of USC coal power plants, initiated under the 11th FYP (2006-2010), is a good example of China’s ability to co-ordinate researchers, developers and investors in meeting a technology goal. The 11th FYP targeted a 20% reduction in energy consumption per unit of GDP and 10% lower sulphur dioxide emissions (Chang et al., 2016). Alongside the closure of small, inefficient coal plants, R&D in advanced combustion was stepped up rapidly, involving tests on older plants. This accelerated during the 12th FYP (2011-2015), leading to the world’s largest supercritical circulating fluidised bed boiler and the first 1 GW USC air-cooling unit. By 2016, a combined 66 GW of these USC units were operational in China, with one of them holding the world energy-conversion efficiency record

An Energy Sector Roadmap to Carbon Neutrality in China Chapter 6: Innovation for carbon neutrality
PAGE | 235 IEA,
202
1.
at 48% (Wiatros-Motyka, 2016). In the case of coal conversion technology, particularly for chemicals production given the sector’s dependence on oil and gas imports, resources were similarly mobilised quickly to develop scientific expertise and invest in demonstration plants followed by commercial facilities.
Box 6.2 Coal conversion: example of large-scale, centrally co-ordinated technology innovation
The Chinese government has sought to develop technologies to convert coal to chemicals and other products since the 1970s, accelerating support in the early 2000s (Xu, Liu and Li, 2020; Wei, Wang and Ding, 2019; Zhao and Gallagher, 2007). The National Medium and Long-term Science and Technology Development Plan (2006-2020) promoted coal-to-chemicals, coal-to-liquids and coal-to-gas as means to reduce reliance on imported energy to produce the goods driving China’s economic growth (State Council, 2006). By the end of the 13th FYP in 2020, China was home to most of the world’s large-scale coal-to-chemicals plants (about 35 out of 40 in 2016) and some of the world’s most advanced-coal conversion technologies, including gasification, indirect coal-to-liquids and methanol-to-olefins. Coal-to-methanol-to-olefins, in particular, is a technology development specific to China, achieved by aligning the funding and incentives of stakeholders across the innovation value chain.
Key actions in developing coal conversion technologies include:
• The Ministry of Science and Technology and other key actors such as the National Energy Administration and the Institute of Coal Chemistry at the Chinese Academy of Sciences included coal conversion among the major S&T projects in 2001 (the 863 programme at the time, a national programme started in 1982) and allocated dedicated annual R&D funding.
• The government set long-term funding horizons and targets to signal that they would sustain efforts over more than a decade. The 2006-2020 plan was followed by the Action Plan for Clean and Efficient Utilization of Coal (2015-2020), the 13th FYP for Demonstration of Coal Deep Processing Industry and the Energy Technology Revolution Innovative Action Plan (2016-2030).
• SOEs, including Shenhua Group, were elevated to become national coal technology champions. Shenhua established a demonstration site in 2004 and now operates the world’s largest coal-to-chemicals plant. In 2008, China Development Bank issued a ten-year loan of USD 350 million (CNY 2.4 billion at the time) to set up the 0.6 million tonne capacity Baotou coal-to-olefins demonstration project in Inner Mongolia.

An Energy Sector Roadmap to Carbon Neutrality in China Chapter 6: Innovation for carbon neutrality
PAGE | 236 IEA,
202
1.
• The government co-ordinated new R&D and test facilities for researchers to focus on specific technology challenges, some of which brought together university and private sector experts. For example, Synfuels China, a 2006 spin-off from the Chinese Academy of Sciences, set up three large innovation centres specialising in Fischer-Tropsch synthesis.
• Provincial governments in coal mining regions were encouraged to co-invest in and extend low cost finance to new facilities and R&D centres, leading to a proliferation of new projects.
• Equipment purchases, licence agreements and joint ventures were all used to test and learn from the products of European and US institutes and companies. Shenhua’s first coal-to-liquids plant used imported technology, but by 2016 it had developed its own, as well as a modified methanol-to-olefins technology.
R&D spending on coal mining and chemicals production in China
IEA, 2021.
Notes: Main enterprises, refer to companies with revenue from principal activities over CNY 20 million (equivalent to USD 2.9 million in 2019). In official documents they are referred to as “industrial enterprises above the designated size”.
Sources: IEA analysis based on data drawn from China’s Statistical Yearbooks (NBS, 2020a), China’s Statistical Yearbooks on Science and Technology (NBS, 2020b) and annual reports of Shenhua Group (Shenhua Group, 2020).
Despite the technical progress made with coal conversion under this multifaceted and co-ordinated approach, the programme ran into challenges (Minchener, 2011). Notably, the incentives for provincial governments to invest in infrastructure were stronger than expected, especially when coal prices were low. This led to a wave of large-scale projects despite a request for caution in 2006 from the National Development and Reform Commission (Jia, 2008). The central government eventually intervened to suspend new projects as international oil prices fell from their 2008 peak. By 2010, it was also apparent that water extraction from the Yellow River risked exacerbating water scarcity in Inner Mongolia, and several coal-to-chemicals plants were found to be in breach of environmental regulations.

An Energy Sector Roadmap to Carbon Neutrality in China Chapter 6: Innovation for carbon neutrality
PAGE | 237 IEA,
202
1.
In 2012, Shenhua indefinitely delayed its flagship integrated CCUS project intended to show that lignite conversion could have low emissions.
The government has found it much harder to limit coal conversion investments in recent years than it did to initiate the innovation programme. In April 2021, following China’s carbon neutrality pledge, the president announced that the government would strictly control coal-fired power generation projects and strictly limit the increase in coal consumption over the 14th FYP period (2021-2025), phasing it down in the 15th FYP period (2026-2030). In July 2021, China suspended the construction of the Yulin coal chemical project by state-owned Shaanxi Coal and Chemical Industry Group Co. over energy consumption concerns, which was expected to start operations in 2025 and become the world’s largest of its kind with a total investment of USD 20 billion (more than CNY 120 billion). Since 2010, coal-to-liquids and coal-to-olefins operations in China have added around 750 Mt of CO2 emissions compared with those that would have arisen had production been based on oil.
In the case of both USC and coal conversion, the government used incentives such as national R&D project funding, tax breaks, rewards for patents and preferential access to capital. In addition, coal-producing provinces were encouraged to invest in these new technologies to help them reach their GDP targets. Under the 14th FYP (2021-2025), this policy approach, involving selecting priority energy technologies and steering research and investment towards them will continue, as will R&D into coal. However, the early signals are that the range of technologies is likely to be broader and that the government will strengthen formal mid-term reviews and monitoring mechanisms for R&D programmes. Without these changes, the risk of over-investment and new vested interests that make it hard to change course, which troubled the coal conversion programme, will persist. Some other countries and regions also have multi-year planning horizons for energy research, but few prioritise strategic technology areas so strongly. The European Union, for example has a longer planning period, with each multi-annual budget spanning seven years. Many governments keep energy and climate technology priorities broader than China’s major S&T projects, with more scope for adjustment and technology-neutral competitive processes. Japan is an example of a country that takes a narrower approach to prioritisation, with eight specific technology areas identified for the 2016-2030 period in its National Energy and Environment Strategy for Technological Innovation towards 2050 (IEA, 2016). It also has a dedicated institution – the New Energy and Industrial Technology Development

An Energy Sector Roadmap to Carbon Neutrality in China Chapter 6: Innovation for carbon neutrality
PAGE | 238 IEA,
202
1.
Organization – for co-ordinating public-private consortia for large-scale demonstration projects. As China’s expansion of industrial capacity slows in the coming years, it may be less able to depend on provincial investment incentives for demonstrating new priority technologies, and may need to make use of such co-ordination mechanisms as well as performance-based project selection.
Devolving responsibility to SOEs SOEs dominate the Chinese energy sector and play a major role in energy investment and innovation, both nationally and globally. The five largest state-owned power generation companies own nearly half of the country’s power plant assets, while the State Grid Corporation of China (SGCC) and the smaller state-owned China Southern Power Grid Company have monopolies on grid operations. SOEs have a higher share of ownership of power generation capacity in China than in most other major economies. SOEs are given explicit responsibility for developing certain technologies and almost single-handedly provide the initial market as buyers of new technologies in some sectors, including heavy industry, fossil fuel supply and power generation, where they have spearheaded huge investments in renewables.
Figure 6.3 SOE ownership share of power generation capacity in G20 countries
IEA, 2021.
Note: The definition of SOE used here includes any minority ownership of a company by a central or sub-national government as a well as 100% SOEs. Source: OECD (2018).
SOEs have a higher share of ownership of power generation capacity in China than in most major economies
National R&D and major S&T projects are the primary instrument used by the central government since the 13th FYP (2016-2020) to advance energy innovation via SOEs. The government funds the national R&D projects according to the

An Energy Sector Roadmap to Carbon Neutrality in China Chapter 6: Innovation for carbon neutrality
PAGE | 239 IEA,
202
1.
technology priorities of the FYP with most funding going to SOEs, who also contribute their own resources to the projects. Major S&T projects are large-scale, multi-year R&D or demonstration projects in priority sectors run by a list of selected SOEs. Nuclear fission power generation has been a focus of major S&T projects and their predecessors under the so-called 863 Programme – a state technology programme that ran from 1986 to 2016. To test and validate different approaches, three SOEs have been given mandates to develop different technologies in parallel.
The national and provincial governments also direct the SOEs to take on other leadership roles in energy innovation. For example, they are required to develop internal technology roadmaps and talent development plans to hire skilled individuals and train staff, and set up R&D projects and laboratories in line with the FYPs. In the 14th FYP (2021-2025), they are required to actively promote the application of new energy saving, low-carbon and environmentally friendly technologies (SASAC, 2021). In 2021, companies including SGCC – a global leader in ultra-high voltage transmission technology and smart grid deployment – and some of the world’s largest steel producers began formulating technology development plans compatible with carbon neutrality.
Box 6.3 Nuclear technology development by SOEs
Nuclear power has been an energy technology priority in China for many decades. Since 2000, there has been a stronger focus on homegrown concepts for large-scale advanced pressurised water reactors, including through major S&T projects proposed by the National Medium- and Long-Term Science and Technology Development and Planning Guidelines (2006-2020) and the Medium- and Long-Term Nuclear Energy Development Plan (2005-2020) (State Council, 2006).
China has three SOEs active in nuclear power generation. Historically, each has adopted a different approach to technology development and innovation, with the government encouraging competition to develop new designs for national adoption and export (Yi-chong, 2010). China National Nuclear Corporation (CNNC) has a mandate to design and operate its own reactor design, building on its military technology expertise. China General Nuclear Power Group (CGN) operates power plants licensed from France’s Framatome and has a mandate to adapt and learn from these to produce a new design. State Power Investment Corporation (SPIC) has a similar approach to CGN but focuses on designs from US suppliers.
The government has struggled to combine the resources and knowledge of the three SOEs in an efficient manner in recent years amid divisive views within the

An Energy Sector Roadmap to Carbon Neutrality in China Chapter 6: Innovation for carbon neutrality
PAGE | 240 IEA,
202
1.
nuclear community about how best to serve China’s nuclear technology ambitions. In 2013, China adopted a more hybrid approach to accelerate the development of current (generation III) technologies, bringing CNNC and CGN closer (Hui, 2014). A formal merger has been resisted, but the two SOEs set up a joint venture SOE – Hualong Nuclear Power Technology Company – to develop the Hualong One reactor design based on a combination of CNNC’s ACP1000 and CGN’s ACPR1000+ designs, which have been developed separately.
Chinese regulators granted the Hualong One design a license in 2014. They were satisfied that its developers owned the intellectual property rights and that core parts were designed and produced domestically. However, full standardisation was not achieved and two slightly different Hualong One versions coexist. The first plant began operating at Fuqing in January 2021 and the first overseas unit in Pakistan in May 2021, with eight others under construction. CNNC stated that it would start construction of Hualong Two by 2024, a potentially cheaper, improved version of Hualong One (Xu, 2021). In July 2021, CNNC started construction of the world’s first commercial small modular reactor project, a 125 MW unit based on the domestic Linglong One ACP100 design, and is building the world’s first prototype (2 MW) of a commercial thorium reactor (Stanway, 2021). In parallel, SPIC has developed another homegrown third-generation design, CAP1400, drawing on experience with imported Westinghouse AP1000 designs.
It is not yet clear how China’s hybrid approach involving indigenous innovation and the incorporation of foreign concepts might be applied to Generation IV technology, reprocessing or other large-scale energy technologies. While it is a successful example of achieving national energy technology goals, lessons could be learned for managing the competing interests of SOEs that each have different sponsors within government. Tensions have arisen in 2021 over co-operation agreements between China and European countries for operating or building nuclear plants with CGN, underscoring the vital importance of good relations with customer countries in the field of nuclear technology exports.
Despite the recent increased involvement of private Chinese companies in energy innovation, especially in solar PV and wind power, SOEs will probably continue to play a central role. SOEs have extensive links to decision makers and research communities, their large balance sheets enable them to finance large-scale demonstration projects and they benefit from preferential access to capital (Zhang, 2020). However, their role will vary by technology. In some resource-intensive areas like nuclear power, chemicals, iron and steel, cement and oil refining, they have the expertise and large-scale industrial laboratories to develop and demonstrate new technologies, often in co-operation with universities. In power generation and supply, governments can direct them to provide commercial test

An Energy Sector Roadmap to Carbon Neutrality in China Chapter 6: Innovation for carbon neutrality
PAGE | 241 IEA,
202
1.
beds for emerging renewables, hydrogen, storage and CO2 capture technologies. For end-user goods like vehicles, SOEs do not always dominate markets but can have preferential access to knowledge via international joint ventures (two leading SOEs, FAW Group and SAIC, are manufacturing partners of Volkswagen, China’s leading car seller). SOEs also have the resources to invest heavily in start-ups: they accounted for 15% of all venture capital investments in 2019, about as much as government-led funds (MOST, 2021d). For example, SAIC Motor led a USD 1.5 billion (CNY 9.7 billion) funding round in 2020 among other state-backed actors to back WM Motor – one of several China-based competitors of the EV manufacturer Tesla.
Relying heavily on SOEs for clean energy innovation, which is unusual among the major economies, carries risks. Their market dominance and internal technology preferences, based on prior experiences or know-how, can create high barriers to entry for other companies or innovators with promising technologies. These barriers can be reinforced by economic incentives that encourage SOEs to meet government targets in ways that preserve the value of existing assets. Additionally, while Chinese SOEs are unusually quick to adjust to changes in governmental policy priorities, there are always risks associated with the inertia and influence of large, dominant companies with close ties to policy makers (Genin, Tan and Song, 2020; Tõnurist and Karo, 2016; Luo et al., 2016, Zhou, Gao and Zhao, 2016). Moreover, energy SOEs typically have an incremental engineering-oriented approach to technology and are less likely to pursue completely new innovative technologies.
Other governments have found various ways to engage large corporate energy players in the development of cutting-edge technologies. In the case of regulated network operators, several countries have followed the lead of the Netherlands (2015) and the United Kingdom (2016) in instituting so-called regulatory sandboxes to allow innovators to trial new products and services without needing to comply with all existing regulation (ISGAN, 2019). In the United States, the National Renewable Energy Laboratory (NREL) runs two programmes – IN2 and GCxN – involving a private entity funding government laboratory staff to identify entrepreneurs with relevant, high impact technologies and support their testing, validation and incubation. The funders get to learn quickly about new technologies that were not on their radar, but do not have exclusive access to them. In 2014, NREL helped establish a network of energy start-up incubators and accelerators, which are now operated by electric utilities who have equal access to the ideas that emerge and can co-operate to create demand for those closest to commercialisation (NREL, 2015).

An Energy Sector Roadmap to Carbon Neutrality in China Chapter 6: Innovation for carbon neutrality
PAGE | 242 IEA,
202
1.
Ensuring that SOEs have incentives to continually improve technological performance and compete fairly with each other and newcomers will help achieve clean energy goals. Staff promotion is increasingly linked to environmental and innovation performance at Chinese SOEs, some of which are actively introducing cultures that foster innovation, such as through the National Institute of Clean and Low-Carbon Energy (NICE) at China Energy Investment Corporation.
Empowering provincial and municipal governments Provincial and municipal governments have been key players in the development of certain energy technologies in recent years. There are 17 Chinese provinces with economies that are each larger than that of the Philippines. Provinces and municipalities have strong incentives to attract investment in and become manufacturing hubs for new technologies. Large solar PV and battery manufacturers such as CATL, LDK, Suntec, Trina and Yingli have set up R&D centres in cities (Ningde, Xinyu, Wuxi, Changzhou and Baoding) that supported the establishment of their manufacturing bases. The central government encourages sub-national governments to experiment with market creation and different approaches to creating local champions, for example in EVs.
In 2009, the “Ten Cities, Thousand Vehicles” programme, which ran until 2012, established a group of municipalities that were encouraged to support EV production and purchases. Ten pilot cities were selected to deploy 1 000 vehicles in each location, with each city being free to decide on how to achieve that. The Ten Cities became home to the pioneers of EV deployment in China, such as BYD in Shenzhen, using different combinations of purchase incentives, loans, tax rebates, access to land, permits, export credits and direct government procurement. The cities also set up specialised innovation clusters and demonstration zones and spurred related investments and improvements in battery manufacturing. By 2012, seven cities reached the target and another 15 had been added to the programme. Subsidies of up to 60% of vehicle costs were common. Shenzhen mandated electrification of its 16 000 strong bus fleet by 2018, subsidising up to half the bus purchase price, installing charging facilities at 180 bus depots and working with manufacturers to reduce risks for customers, for example by providing battery warranties and leases.
Since 2015, local government autonomy to provide subsidies has been gradually curtailed and the central government released new policy support schemes with stricter technology standards. As subsidy conditions have become more stringent, national, provincial and municipal support schemes have shifted to having tighter thresholds for subsidies that encourage performance improvement, including for

An Energy Sector Roadmap to Carbon Neutrality in China Chapter 6: Innovation for carbon neutrality
PAGE | 243 IEA,
202
1.
vehicle range, energy consumption, battery standards and safety requirements (Muniz, Belzowski and Zhu, 2019).
Building on the country’s experience with EVs, the devolution of policy experimentation to sub-national governments to stimulate new markets for nascent clean energy technologies is likely to continue. One advantage is that local policy makers are closer to the needs, preferences and resources of local businesses and consumers, and can create support for public spending that promotes tangible jobs and environmental benefits. The most suitable technologies may be those for which an individual region can use public procurement and infrastructure investment to gain a competitive edge, and look to sell a superior technology to consumers across China and overseas. The rapid growth of hydrogen R&D and demonstration programmes since 2017 has so far largely followed this model, building in particular on the “Ten Cities, Thousand Vehicles” programme.
Box 6.4 Hydrogen technology development at the sub-national level
Hydrogen technologies have long been a focus of China’s energy innovation. They were included in the Medium- to Long-Term Science and Technology Development Plan (2006-2020) and the government has been providing subsidies to hydrogen fuel cell electric vehicles (FCEVs) since 2009 (Ministry of Finance, 2020; State Council, 2006). Between 2006 and 2010, Shanghai and Beijing funded FCEV demonstration programmes and SAIC Motor, an SOE, developed its own fuel cell systems with Tongji University. However, while these early programmes helped build some expertise in hydrogen-based mobility, overall activity has remained limited to date.
In 2020, the Chinese government amended its fiscal support measures for “new energy vehicles” to include FCEV demonstrations, R&D in key core technologies and support for building a complete FCEV industry chain over the 14th FYP period (2021-2025). It has also launched a programme to nurture FCEVs modelled after the “Ten Cities, Thousand Vehicles” EV initiative. It encourages provinces to set up demonstration zones in cities, provide funding for the establishment of fuel cell industries and co-ordinate efforts in agglomerations that cross provincial borders, such as Jingjinji Metropolitan Region, Yangtze River Delta and Greater Bay Area. By the end of 2020, 22 provinces and cities had issued a total of 105 policy documents to support hydrogen development, up from almost none before 2017 (OGRI, 2020). Guangdong, Jiangsu and Shandong have been most active to date.

An Energy Sector Roadmap to Carbon Neutrality in China Chapter 6: Innovation for carbon neutrality
PAGE | 244 IEA,
202
1.
Several of the provincial strategies cover the entire value chain, including hydrogen production and storage, refuelling and vehicles, as well as fuel cells.
The central government has recently changed its policy of encouraging sub-national governments to subsidise FCEV purchases to rewarding technology innovation and deployment. Bonuses will be provided to producers that achieve performance goals for specific technologies, including electrolyser membrane, electrode assemblies, proton-exchange membranes, carbon paper, catalysis, bipolar plates and compressors. To obtain a bonus, the technology must be used in over 500 vehicles, each driven for more than 20 000 kilometres and performance must be verified by a third-party.
The focus of the hydrogen plans being developed by regions and cities varies. For example, Shandong already had some hydrogen-related technology capacity before 2020, with Weichai, an SOE that makes engines, becoming a 20% shareholder in Ballard fuel cells in 2018, and the private sector Dongyue Group producing fuel cell membranes. The province now aims to set up an industrial cluster for fuel cells in Weifeng and one for related materials in Zibo, plus others for FCEVs in Liaocheng and hydrogen supply in Jining. It plans to transform Qingdao into the “Eastern Hydrogen Island” and Jinan into the “Chinese Hydrogen Valley”. In contrast, Ningxia and Shanxi provinces, which are major coal producers, are focused on developing new value streams for hydrogen, especially from coal.
While the central government is seeking more co-ordination of provincial subsidies and limits on their use to avoid boom-and-bust cycles, funding from sub-national governments remains larger than that from the central government in many cases. These governments often own important local businesses have strong connections to industry. These factors, combined with inter-provincial competition, could drive rapid scale up of the hydrogen sector and innovation to produce better and cheaper components and hydrogen supplies. However, it remains unclear whether performance-based rewards will guide researchers towards the same narrow set of technical solutions or whether competition for export market share will prioritise costs over longer term technology leadership and knowledge sharing between provinces. As policies are currently directed mostly towards manufacturers, some provinces might need additional R&D funding and skills to be able to develop cutting-edge technologies.
Hydrogen and other clean energy technologies supported by provincial and municipal governments can also benefit from the National High-Tech Zones – a programme launched in 1988 and significantly expanded since 2010. The State Council approves these zones, which benefit from infrastructure investment, access to a broad pool of skilled workers and financial incentives such as tax breaks. The 169 existing zones have established networks of researchers,

An Energy Sector Roadmap to Carbon Neutrality in China Chapter 6: Innovation for carbon neutrality
PAGE | 245 IEA,
202
1.
laboratories, companies, incubators and technology transfer institutions (MOST, 2021e). The Ministry of Science and Technology has stated that the programme will be modified to support the new carbon neutrality targets, including the introduction of evaluation metrics relating to low-carbon energy (MOST, 2021f).
Reliance on sub-national led innovation is not without risks. The development of EVs saw some cities or provinces strongly back local champions that ultimately went bankrupt. At the other extreme, this approach can incentivise sub-national governments to do the minimum to attract political recognition and investment approvals, leading to superficial pilot projects that foster minimal innovative activity and distract from the efforts of technology leaders. In addition, the ex-ante selection of regions to host demonstrations and innovation clusters might exclude some potential innovators in other parts of the country and lead to an over concentration of resources for innovation in certain areas, such as corporate R&D funds currently concentrated in eastern regions (MOST, 2021g).
The European Union has a different approach to co-ordinating test beds in different regions. In 2008 it established a unique legal entity – the Fuel Cells and Hydrogen Joint Undertaking – to accelerate the market introduction of hydrogen energy technologies and develop an industrial base. It has a multi-year budget, which was EUR 1.3 billion (USD 1.6 billion) for 2014-2020, to which the European Commission contributes half, and manages calls for projects in co-ordination with the Commission, an industry grouping and a research institute. It has supported over 250 projects and shares the technology learnings among participating EU countries and municipalities.
Reaping the benefits of a vast domestic market The sheer scale of China’s domestic population and the large market that has resulted from decades of rapid economic growth benefits energy innovation in several ways:
Multiple competitors can each attract substantial amounts of capital in the early stages of market expansion for a particular technology.
A company only needs to capture a small market share to justify building a world-scale factory.
There is scope for market differentiation, including a large market for low-cost products and services.
The market is large enough to have its own standards and regulations that allow local firms to focus on a single set of requirements and raise barriers to entry for overseas competitors.

An Energy Sector Roadmap to Carbon Neutrality in China Chapter 6: Innovation for carbon neutrality
PAGE | 246 IEA,
202
1.
Risks can be spread widely and under-performing technologies are quickly superseded by newer generations. In a market for many millions of units per year, a company can launch an upgraded generation of products frequently, advancing the innovation frontier.
The benefits of having a large domestic market are substantial for energy technologies sold to other companies, such as wind turbines and ultra-high voltage transmission, and even greater for end-use consumer technologies. China has been one of the most dynamic markets for production and innovation in a range of energy-related consumer products, including heat pumps, energy efficient appliances, air conditioning, smart meters, digital connected devices, EVs and other devices containing lithium-ion batteries. EVs are a notable example of how policy in China can create a huge new market almost from scratch and create some of the world’s most valuable companies that are able to outcompete established multinationals. China is keen to apply this market creation approach to hydrogen and FCEVs too, though these technologies differ from batteries and EVs in two critical ways: they require a co-ordinated approach to pipeline and refuelling infrastructure, and, as fuel cells are still a relatively immature technology, more focus on fundamental innovation R&D compared with that required, for example, by batteries and PV at the times when China adopted them.
Box 6.5 Turbo-charging China’s EV technologies by boosting demand
China’s EV industry emerged in response to strong government support related to concerns about import dependency and urban air pollution in the face of booming demand for personal mobility. The sale of new cars increased more than fivefold between 2005 and 2015 as the population grew and people became wealthier. The 11th FYP (2006-2010) aimed to “accelerate the development of automobile engines… and components with independent intellectual property” (NPC, 2006). The “Ten Cities, Thousand Vehicles” programme was launched in 2009. The Energy Saving and New Energy Vehicle Industry Development Plan (2012-2020) elevated “pure electric drive as the main strategic orientation for the development of new energy vehicles” and set performance targets for technology development in EV technologies (NPC, 2006; NEA, 2012). As a result, China overtook Europe in 2015 as the world’s largest market for electric cars. Today, it is home to 98% of the world’s electric buses (IEA, 2021c and 2020b). Chinese companies now account for significant parts of the global EV value chain from lithium extraction and processing, battery and EV manufacturing and charging to recycling. Many of

An Energy Sector Roadmap to Carbon Neutrality in China Chapter 6: Innovation for carbon neutrality
PAGE | 247 IEA,
202
1.
these companies did not exist in 2015, or were focused on other sectors, but now possess world-class technologies.
China’s success in developing its EV industry was driven by its large internal market and a broad consensus on the strategic importance of supporting this new industry. Yet the creation of a large domestic EV market did not on its own spark innovation. In the early days, several protectionist measures designed to nurture Chinese companies – such as high purchase subsidies with local sourcing requirements and favouring smaller EVs with limited range – held back technological progress and resulted in a gold rush for EVs, with over 200 companies producing on average less than 3 000 cars per year in 2015, which created a bubble, fragmented the market and triggered subsidy fraud in many cases. Based on the experience of the regional pilots, the central government subsequently linked incentives to continual performance improvements and established quotas and fuel economy standards for all automakers (Muniz, Belzowski and Zhu, 2019).
Over the past five years, Chinese car companies have collaborated with research institutions and established large R&D facilities that have led to major technological advances in the field of EVs. With sales of 1.2 million electric cars in 2020, the domestic market is large enough to support hundreds of manufacturers of cars and batteries, catering for different levels of performance and luxury. BYD, a Shenzhen-based battery company, received over USD 400 million (over CNY 2.5 billion) in public subsidies for manufacturing EVs between 2010 and 2015 (Heller, 2017), despite having no automotive experience prior to the 2000s. It is now one of the world’s largest EV and battery companies, second only to Tesla in cumulative global EV sales. Its innovative Blade Battery, which is set to go on sale in Europe in 2021, offers world-leading safety performance. Since 2015, Chinese investors, including digital companies such as Alibaba, have mobilised the world’s biggest venture capital investments for EV start-ups including WM Motor, Xpeng and NIO.
A large and growing domestic market for consumer products is not a sufficient condition for innovation. China has benefitted from a corporate culture that prioritises speed to market and market share above meeting the highest quality standards. The result is a high level of comfort with risk and commercialising new products in advance of full regulatory clarity. Product managers within companies also have considerable freedom to establish new production lines (Yip and McKern, 2017). In contrast with some popularly held impressions of Chinese manufacturing, it has many similarities with a ”permission-free” innovation or a “move fast and break things” model, i.e. the scope of activity is only limited by what is explicitly outlawed, rather than one that waits for the consent of regulators and

An Energy Sector Roadmap to Carbon Neutrality in China Chapter 6: Innovation for carbon neutrality
PAGE | 248 IEA,
202
1.
society before investing. However, in coming years innovating firms may need to adapt to evolving market trends, including higher levels of disposable income and a rapidly ageing society. Higher expectations of product quality and environmental protection could result and pose a risk to China’s dynamism.
The governments of some other countries that do not have such large and growing markets use public procurement to facilitate investment in demonstration projects or manufacturing plants for new clean energy equipment. For example, the Netherlands uses a system for public building works that discounts bids based on the CO2 performance of the tenderer, giving suppliers of low-carbon cement a financial advantage (Hasanbeigi, Becqué and Springer, 2019). As in China, many countries use grants and concessional loans. However, it can take a high degree of international co-operation to bring several countries together to create a large enough early market for new technologies. Within the European Union, state-aid rules affect how much financial assistance that countries or the European Investment Bank can provide to companies, with larger shares of co-financing allowed for smaller companies and innovations that benefit the environment. In North America, British Columbia, California, Oregon and Washington have formed the Pacific Coast Collaborative to create one regional market for low-carbon fuels, notably by unifying their low-carbon fuel standards that can support bioenergy, hydrogen and CCUS.
Facilitating international co-operation International co-operation is an important means by which China seeks to achieve global leadership in energy technology and a crucial pillar of accelerating global energy innovation. The sharing of knowledge via formal agreements, trade and informal personnel exchanges is vital if the quality of research and its ability to reach markets and drive down costs are to be maximised. China’s large internal market helps secure domestic manufacturing and knowledge sharing with overseas companies that want to invest in China, especially given much slower economic growth in the advanced economies. For example, from 2007 until 2017 when sales of new passenger cars in China peaked, the market grew by 15% per year on average, compared with less than 2% in the rest of the world. By 2017, China represented more than one-quarter of the global market, compared with 10% in 2007.
Solar PV exemplifies how China managed to enter a new technology area via joint ventures and licensing. Initially, this was not part of the central government’s solar PV strategy. Rather, local governments helped Chinese companies set up manufacturing facilities based on licenced intellectual property or, in the case of

An Energy Sector Roadmap to Carbon Neutrality in China Chapter 6: Innovation for carbon neutrality
PAGE | 249 IEA,
202
1.
Suntech, on that developed abroad and part-owned by a Chinese citizen. This provided an entry point for several firms to scale up to become world-scale manufacturers and then undertake manufacturing innovation and, more recently, fundamental innovation in PV technology. Nuclear power and transport vehicle technologies are other examples of how the Chinese government and companies have used joint ventures with overseas companies to learn quickly about new technology areas and facilitate technology transfers.
In the case of EVs and batteries, the process was inspired by the experience with solar PV, as well as other technologies such as smartphones. Chinese authorities targeted manufacturing as the entry point from which to build the capacity to innovate, creating such strong local networks of component and sub-system suppliers that they attracted companies and orders from around the world. The firms generally are not the original designers of the products, but by working with the best components, interacting regularly and competing to meet the needs of international innovators they have innovated new approaches, functionalities and even new products that integrate locally available components, especially digital systems.
China’s central government has also encouraged companies to tap into state-of-the-art of energy technology by investing abroad, particularly since the 10th FYP (2001-2005) with the “Go Global” strategy. This has included the acquisition by SOEs and private companies of high-tech companies abroad, including specialists such as Alta Devices (acquired by Hanergy in 2013) and large engineering conglomerates such as Volvo cars (acquired in 2010 by Geely, which had only started making cars eight years earlier). As is normal in these cases, the purchasing company integrated the R&D activities of the new subsidiary into its own operations, often with government support (Osborne, 2015). Chinese SOEs have also invested in infrastructure, companies and R&D centres abroad to tap into a broader pool of skilled labour.
Another type of international co-operation adopted by China is bilateral and multilateral agreements with other governments. China funds joint energy R&D activities on common challenges with several countries around the world. The US-China Clean Energy Research Center, which has been operational since 2016, is a notable example. It brings together researchers from both countries to work on five main technology areas: advanced coal, energy efficiency in buildings, clean vehicles, medium-duty and heavy-duty truck efficiency, and energy and water. One product of the centre is a sprayable sealant technology for energy efficiency in buildings (US DOE, 2017). Other bilateral partnerships include the UK-China (Guangdong) CCUS Centre and a China-France Agreement to co-

An Energy Sector Roadmap to Carbon Neutrality in China Chapter 6: Innovation for carbon neutrality
PAGE | 250 IEA,
202
1.
operate on nuclear power technology (GDCCUS, 2021; WNN, 2018).2 In addition to such bilateral mechanisms, China is a member of Mission Innovation – a global initiative of 22 countries and the European Commission to catalyse action and investment in R&D and demonstration in clean energy and a co-lead of its smart grids, biofuels and power sector programmes. China also participates in 27 of the 38 IEA Technology Collaboration Programmes – the fourth largest.
There is no doubt that China has the resources to continue each of these types of co-operation and to help other emerging economies move up the technology ladder. China’s Belt and Road Initiative – a global infrastructure development strategy adopted by the government in 2013 to enhance physical ties to overseas markets – is just one opportunity to work with international partners to help other countries access the best international technology in the future, just as China benefitted from such access in the past. Experiences from HydroChina’s involvement in wind power development in Ethiopia indicate how such programmes can incorporate local innovation capacity building (Chen, 2018). There are also examples of support by multilateral development banks to local innovation ecosystems, such as World Bank funding for entrepreneurs in Morocco and the International Finance Corporation’s Catalyst Fund and Startup Catalyst programmes (World Bank, 2017).
In contrast to the continuing expansion of China’s international co-operation on energy technology generally, patent activity suggests that its international collaboration on R&D has recently been in decline. The number of clean energy inventions co-patented by a Chinese inventor and someone from outside China has declined in absolute terms since 2013. The United States remains China’s main patenting partner in clean energy, but China has a lower share of international co-patents among all its clean energy patents than the United States. Building trust through strong intellectual property governance, fair access to markets and depoliticised supply chains would reduce the risk of undermining international collaboration and co-operation on clean energy innovation.
2 Other examples of formal bilateral agreements, in addition to those in which China participates, include the research component of the US-India Partnership to Advance Clean Energy (PACE-R), which has operated a joint R&D centre since 2010, and the Joint UK-India Clean Energy Centre launched in 2017. In a more targeted approach, Japan has engaged partners in Australia, Brunei, Saudi Arabia and Norway for the development of hydrogen projects.

An Energy Sector Roadmap to Carbon Neutrality in China Chapter 6: Innovation for carbon neutrality
PAGE | 251 IEA,
202
1.
Figure 6.4 China’s role in international clean energy technology co-patenting
IEA, 2021.
Notes: An international patent family represents a single invention for which patent applications have been filed at a regional patent office or in at least two jurisdictions worldwide. Source: IEA and EPO (2021).
Over the last two decades, inventors in China have been involved in a declining number of clean energy patents with international partners, which represents a lesser role than in some other major economies
Box 6.6 China’s transformation from a solar PV technology importer to innovator
China has funded solar PV R&D since the 1950s, but it was not until the early 2000s that innovation efforts took off. In 2002, PV cells co-developed by a Chinese researcher at an Australian university began production in a factory owned by the researcher’s company, Suntech, in China. A combination of low manufacturing costs, ambitious scale and cheap capital – Suntech was backed by a municipal government in Jiangsu province – gave the factory an edge in export markets just as public support for PV deployment was starting to expand in Europe.
Over the following decade, other Chinese firms built on this model of attracting world-leading companies to manufacture in China, gaining access to technology and global value chains (Zhang and Gallagher, 2016). In 2008, Shandong Solar Technology licensed technology from Johanna Solar Technology, a German company. In 2012, Tianjin Zhonghuan Semiconductor formed a joint venture with Sunpower, a US company that went on to form other joint ventures with Dongfang Electric Company and two other Chinese companies. Some Chinese companies also acquired foreign competitors and progressively absorbed their R&D activities (Urban, Geall and Wang, 2016). For example, Hanergy Group acquired Alta
0%
5%
10%
15%
20%
25%
30%
0
50
100
150
200
250
300
2001 2004 2007 2010 2013 2016 2019
Inte
rnat
iona
l pat
ents
fam
ilies
International co-patents
Share of Chinese total (right)
0%
10%
20%
30%
40%
50%
60%
Japan Europe China UnitedStates
India
Co-patenting share of total (2010-2019)

An Energy Sector Roadmap to Carbon Neutrality in China Chapter 6: Innovation for carbon neutrality
PAGE | 252 IEA,
202
1.
Devices, a US company, in 2013. Given the commanding position of Chinese manufacturing in global markets, raising capital for such purchases was not difficult. In addition, several Chinese companies established partnerships with universities overseas, such as Trina Solar’s tie-up with the Australian National University in 2011, and put in place special programmes to hire skilled labour and executives with academic and professional experience abroad, with a focus on Chinese nationals working abroad (de la Tour, Glachant and Ménière, 2011).
As competition with manufacturers in the rest of the world diminished over the 2010s, it intensified within China with the introduction of policies to support the domestic deployment of solar PV in the 12th FYP (2011-2015). Competition for market share, often between companies backed by different municipalities, helped to drive impressive manufacturing innovations in China. Without innovations in silicon processing and cell assembly, the large cost reductions achieved for solar PV would not have been possible despite economies of scale. Progress in this area has been attributed to the fact that Chinese solar companies are organised around industrial clusters with relatively open exchange of knowledge and expertise (Ball et al., 2017).
Chinese policy makers have indicated an ambition to remain the leading manufacturer of solar PV and the leading developer of new PV technologies. Chinese government laboratories and universities have already shifted their focus to next-generation PV designs, with corporate labs increasingly moving in the same direction. In 2016, Trina Solar set the world efficiency record of 19.9% for a laboratory version of a multi-crystalline solar module, though it has since been beaten (NREL, 2021). Microquanta Semiconductor earned the record of 17.3% for a perovskite submodule in 2018 and MiaSolé Hi-Tech, purchased in 2013 by Hanergy, holds a record of 17.4% for a copper-indium-gallium-selenide (CIGS) thin film module and claimed further records of 18.6% for a flexible module in 2019 and 27% for a hybrid perovskite-CIGS cell in 2021. Jinko Solar and Longi reported record efficiencies above 25% for variants of n-type and p-type monocrystalline cells in mid-2021. The gap between the performance of Chinese firms and overseas competitors has shrunk rapidly. However, most of the PV efficiency records set in the last three years have been by German, Japanese, Korean and US firms.
Opportunities to accelerate innovation The main features of China’s energy innovation system give it unparalleled capacity to adopt, improve and bring new technologies to market quickly. Government policy is central to all these factors. The policy tools currently used vary according to the type of technology and sector. They include funding for

An Energy Sector Roadmap to Carbon Neutrality in China Chapter 6: Innovation for carbon neutrality
PAGE | 253 IEA,
202
1.
large first-of-a-kind projects, strategic guidance of SOEs, establishing deployment targets for selected regions, regulating equipment performance, banning certain technology options and international co-operation. They provide a good foundation for Chinese policy to foster the technologies needed to meet its energy and climate goals, taking account of the specific attributes of each technology.
Mass manufacturing of key technologies in the energy system is a relatively recent phenomenon and one in which China has been a leader for solar PV, batteries and LEDs. It has led to a wider range of innovation dynamics for energy equipment than existed in the 20th century, when most technologies were based on larger scale engineering solutions with unit sizes in the MW to GW range. By mapping low-carbon energy technology types according to their general attributes of size and modularity versus the likely barriers to entry in their markets – including the number of new purchases per year, access to regulated infrastructure, monopoly ownership and network effects – we identify four archetypal technology groupings that respond differently to various policy options. These groupings provide insights into how the component technologies of CCUS, hydrogen, bioenergy and electrification – four of the central pillars of the energy transition in China and the rest of the world – can be supported by governments.
Technologies characterised by small unit sizes, replacement cycles of under 20 years and high levels of standardisation, modularity and mass production play a major role in achieving carbon neutrality in China in the APS. These technologies are generally well suited to China’s manufacturing strengths. Some of them, including smart controls, appliances and low-carbon vehicles, are characterised by high levels of product differentiation (i.e. they can be branded according to their distant characteristics) and are generally unsuited to vertical value chain integration and horizontal monopoly ownership (IEA and EPO, 2021). They also generally have low barriers to market entry. They can be disruptive in the sectors in which they are deployed, especially if policies incentivise innovation through competition between companies.

An Energy Sector Roadmap to Carbon Neutrality in China Chapter 6: Innovation for carbon neutrality
PAGE | 254 IEA,
202
1.
Figure 6.5 Low-carbon energy technology types mapped according to their general attributes of size and modularity versus barriers to market entry
IEA, 2021.
Sources: Adapted from IEA (2020c); Malhotra and Schmidt (2020); Schmidt and Huenteler (2016).
Large-scale technologies like CCUS and biorefining are suited to different policy incentives than network infrastructure or end-use consumer products
The second group of low-carbon technologies deployed in the Announced Pledges Scenario in China, including low-carbon industrial processes, modular nuclear reactors, low-carbon fuels production and CCUS, are more similar to traditional energy sector technologies. They are characterised by large upfront investment, chemical engineering approaches and economies of scale at the plant level, with only a small number of projects commissioned each year. They are not amenable to product differentiation and are often owned by vertically or horizontally integrated monopolies. Innovation in these areas tends to be slower

An Energy Sector Roadmap to Carbon Neutrality in China Chapter 6: Innovation for carbon neutrality
PAGE | 255 IEA,
202
1.
and does not benefit as much from the accumulation of knowledge and experience that is typical of smaller modular technologies, such as solar PV, wind power and batteries. Nonetheless, China has shown that it can mobilise SOEs and large Chinese companies to reorient their R&D plans and take responsibility for large-scale demonstrations of these technology types. A concerted innovation effort, including rapid dissemination of the knowledge and experience that arises from such demonstrations, will be key to their widespread deployment in China, as in the rest of the world.
Between these two extremes lie two other groups of technologies. The first includes enabling technologies, i.e. intermediate or upstream supply-side technologies that are needed to pave the way for the deployment of end-use technologies. Electrolysers, long-duration batteries and certain types of direct air capture are in this category. They are generally modular, mass-produced and designed for industrial customers, so are less amenable to product differentiation. They have the potential for rapid cost declines through manufacturing competition, but could become dominated by a small number of large companies. To achieve rapid improvements in these types of technology, stronger policy incentives to invest in R&D and manufacturing are likely to be required.
Another group of enabling technologies that are targeted to industrial users are those that are generally not modular and are embedded in physical networks. These include thermal and mechanical energy storage technologies (such as pumped storage), district heating and cooling equipment, and smart grid hardware. Network infrastructure is often the responsibility of highly regulated monopolies, creating barriers to entry and limiting the number of potential customers. Public R&D and access to commercial test beds to demonstrate new ideas can be crucial for accelerating improvements in these technologies.
Ease of access to capital differs markedly among the four technology groups. In recent years, China’s financial system has proven capable of allocating large sums of risk capital to early-stage technologies with high market growth potential, mostly new consumer-facing products and services such as EVs. For technologies that displace existing industrial processes, the central government has steered public and SOE funds to incumbent technology owners. These technologies usually have longer development times, higher development costs and higher barriers to market entry than venture capitalists will tolerate.
It is possible to identify the features of China’s energy innovation system that can be mobilised for the development of the four technology groups and the types of capital they require. While this gives some overall guidance to policy approaches,

An Energy Sector Roadmap to Carbon Neutrality in China Chapter 6: Innovation for carbon neutrality
PAGE | 256 IEA,
202
1.
each technology area has its own technical and market specificities. As discussed, China possesses considerable experience in tailoring policy incentives and innovation support to specific technologies. It can also draw on the wealth of international experience in this field.
Not all emerging technologies will fall within the four stylised groups presented here. For instance, digital technologies have specific innovation dynamics and can readily penetrate new sectors by delivering productivity gains and commercial data. They are poised to transform energy supply and use in unexpected ways in the coming decades, yet are not expected to yield significant CO2 emissions reductions unless combined with the types of technologies in the four groupings described, as well as energy efficiency measures. The energy intensity of data centres is a particular concern in China, which prompted the introduction of national minimum energy performance standards in 2020.
Table 6.2 Low-carbon energy technology groups relative to possible innovation policy approaches that build on China’s innovation strengths
Low-carbon technology group
Capital required to accelerate innovation
Relevant features of China’s energy innovation system
Possible policy approaches in 2021-2025
New products and services for consumers
• Grants and tax breaks for early-stage experimentation.
• Venture capital and growth equity.
• Debt for manufacturing plants.
• Corporate and lab partnerships for market testing.
• Spreading risk and sustaining competition within a vast internal market.
• Competing provincial and municipal pilot projects.
• Sub-national level deployment targets.
• Performance-linked purchase incentives.
• Entrepreneurship prizes. • Access to public and SOE
laboratories for product testing and validation.
• Encourage partnerships between companies and universities.
Modular enabling technologies
• Stable public R&D funding.
• Venture capital and growth equity.
• Debt or grants for manufacturing plants.
• Corporate and lab partnerships for market testing.
• Spreading risk and sustaining competition within a vast internal market.
• Competing provincial and municipal pilot projects.
• International co-operation.
• Industry roadmaps and performance targets.
• Provincial and municipal pilots and test beds.
• Public procurement to create demand for final products.
• Innovation prizes. • International R&D projects on
fundamental technology. • Access to public and SOE
laboratories for product testing and validation.

An Energy Sector Roadmap to Carbon Neutrality in China Chapter 6: Innovation for carbon neutrality
PAGE | 257 IEA,
202
1.
Low-carbon technology group
Capital required to accelerate innovation
Relevant features of China’s energy innovation system
Possible policy approaches in 2021-2025
Enabling network infrastructure
• Stable public R&D funding.
• Corporate venture capital.
• Funds for field trials and commercial-scale projects.
• Funding of strategic national priorities.
• Devolved responsibility to SOEs.
• International co-operation.
• Industry-wide roadmaps and performance targets.
• Public investment in infrastructure with third-party access conditions.
• Incentives for inter-firm collaboration on technology.
• Open access knowledge sharing from network pilots and trials.
• Investment incentives for infrastructure upgrades, linked to performance targets.
• Reciprocal engagement in international technology trials.
Industrial engineering processes
• Public co-funding and tax breaks for long-term R&D and demonstrations.
• Corporate venture capital.
• Funding strategic national priorities.
• Devolved responsibility to SOEs.
• International co-operation.
• Industry-wide roadmaps and performance targets.
• Co-ordinated and differentiated SOE technology strategies and targets.
• National major S&T projects and open access demonstrators.
• Public procurement to create demand for final products.
• Certification to promote international trade in low-carbon products.

An Energy Sector Roadmap to Carbon Neutrality in China Chapter 6: Innovation for carbon neutrality
PAGE | 258 IEA,
202
1.
References ACCA21 (Administrative Centre for China’s Agenda 21) (2021), The 21st Century Center held
a carbon neutral technology roadmap research meeting [translated], http://www.acca21.org.cn/trs/000100040016/15980.html, accessed 31 May 2021.
ACCA21 (2020), The 21st Century Center organized an expert seminar on Technological Path to China's Carbon Neutrality Target by 2060 [translated], http://www.acca21.org.cn/trs/000100040014/15875.html.
Ball et al. (2017), The new solar system. China’s evolving solar industry and its implications for competitive solar power in the United States and the world, Stanford, https://www-cdn.law.stanford.edu/wp-content/uploads/2017/03/2017-03-20-Stanford-China-Report.pdf, accessed 22 June 2021.
Chang, S. et al. (2016), Clean coal technologies in China: Current status and future perspectives, Engineering, Vol.2, No. 4, pp. 447-459, https://doi.org/10.1016/J.ENG.2016.04.015.
Chen, Y. (2018), Comparing north-south technology transfer and south-south technology transfer: The technology transfer impact of Ethiopian wind farms, Energy Policy, Vol 116, pp. 1-9, https://doi.org/10.1016/j.enpol.2017.12.051.
Chipman Koty, A. (2020), What is the China Standards 2035 Plan and how will it impact emerging industries?, https://www.china-briefing.com/news/what-is-china-standards-2035-plan-how-will-it-impact-emerging-technologies-what-is-link-made-in-china-2025-goals/, accessed 23 June 2021.
Cleantech Group (2021), i3 database, https://i3connect.com/ accessed June 2021
de la Tour, A, M. Glachant and Y. Meniere (2011), Innovation and international technology transfer: The case of the Chinese photovoltaic industry, Energy Policy, Vol. 39, No. 2, pp. 761-770, https://doi.org/10.1016/j.enpol.2010.10.050.
Genin, A.L., J. Tan and J. Song (2020), State governance and technological innovation in emerging economies: State-owned enterprise restructuration and institutional logic dissonance in China’s high-speed train sector, https://doi.org/10.1057/s41267-020-00342-w.
GDCCUS (UK-China (Guangdong) CCUS Centre) (2021), About the centre, http://www.gdccus.org/en/about.jsp, accessed 22 June 2021.
Hasanbeigi, A, R. Becqué and C. Springer (2019), Curbing carbon from consumption: The role of green public procurement, Global Efficiency Intelligence, https://www.climateworks.org/wp-content/uploads/2019/09/Green-Public-Procurement-Final-28Aug2019.pdf, accessed 28 June 2021.
Heller, M. (2017), Chinese Government Support for New Energy Vehicles as a Trade Battleground, https://www.nbr.org/publication/chinese-government-support-for-new-energy-vehicles-as-a-trade-battleground/, accessed 29 June 2021.
Hui, Z. (2014), Deciphering the third-generation nuclear power technology route: a compromise plan after the infighting between China National Nuclear and China General Nuclear Power [translated], http://finance.sina.com.cn/chanjing/sdbd/20140409/155518747742.shtml, accessed 29 June 2021.
https://www.climateworks.org/wp-content/uploads/2019/09/Green-Public-Procurement-Final-28Aug2019.pdf

An Energy Sector Roadmap to Carbon Neutrality in China Chapter 6: Innovation for carbon neutrality
PAGE | 259 IEA,
202
1.
IEA (International Energy Agency) (2021a), The Role of Critical Minerals in Clean Energy Transitions, https://www.iea.org/reports/the-role-of-critical-minerals-in-clean-energy-transitions.
IEA (2021b), Energy Technology RD&D Budgets: Overview, https://www.iea.org/reports/energy-technology-rdd-budgets-overview.
IEA (2021c), Global EV Outlook 2021, Trends and developments in electric vehicle markets, https://www.iea.org/reports/global-ev-outlook-2021/trends-and-developments-in-electric-vehicle-markets.
IEA (2020a), Tracking Clean Energy Innovation: A framework for using indicators to inform policy, https://www.iea.org/reports/tracking-clean-energy-innovation.
IEA (2020b), Global EV Outlook 2020, https://www.iea.org/reports/global-ev-outlook-2020
IEA (2020c), Energy Technology Perspectives: Special report on clean energy innovation, https://www.iea.org/reports/clean-energy-innovation.
IEA (2016), Energy Policies of IEA Countries: Japan, 2016 Review, https://www.iea.org/reports/energy-policies-of-iea-countries-japan-2016-review
IEA and EPO (European Patent Office) (2021), Patents and the Energy Transition, https://www.iea.org/reports/patents-and-the-energy-transition.
ISGAN (International Smart Grid Action Network) (2019). Innovative regulatory approaches with focus on experimental sandboxes, https://www.iea-isgan.org/wp-content/uploads/2019/05/ISGAN_Casebook-on-Regulatory-Sandbox-A2-1.pdf.
Jia, H. (2008), China suspends coal-to-oil projects, Chemistry World, https://www.chemistryworld.com/news/china-suspends-coal-to-oil-projects/3000966.article, accessed 22 June 2021.
Li, K. (2021), Premier Li Keqiang of the State Council at the fourth session of the Thirteenth National People's Congress ( 5 March 2021) [translated], http://www.gov.cn/premier/2021-03/12/content_5592671.htm, accessed 23 June 2021.
Li, D. and K. Chen (2021), The country's first carbon neutral technology innovation centre was established in Sichuan [translated], Science and Technology Daily, http://www.stdaily.com/index/kejixinwen/2021-04/11/content_1110870.shtml, accessed 23 June 2021.
Luo, L. et al. (2016), Export, subsidy and innovation: China’s state-owned enterprises versus privately-owned enterprises, https://doi.org/10.1080/20954816.2016.1180766
Malhotra, A. and T.S. Schmidt (2020), Accelerating Low-Carbon Innovation, https://doi.org/10.1016/j.joule.2020.09.004.
Minchener, A. (2011), Coal-to-oil, gas and chemicals in China, IEA Clean Coal Centre CCC/181, https://www.sustainable-carbon.org/report/coal-to-oil-gas-and-chemicals-in-china-ccc-181/.
Ministry of Finance (2020), Notice of the National Energy Administration of the Development and Reform Commission of the Ministry of Industry and Information Technology, Ministry of Industry and Information Technology, on the Development of Fuel Cell Vehicle Demonstration Applications" [translated], http://www.gov.cn/zhengce/2020-09/21/content_5545223.htm, accessed 23 June 2021.

An Energy Sector Roadmap to Carbon Neutrality in China Chapter 6: Innovation for carbon neutrality
PAGE | 260 IEA,
202
1.
MOST (Ministry of Science and Technology) (2021a), Ministry of Science and Technology Department of Social Development and Science and Technology organized the second meeting on the research and formulation of the Science and Technology Support Carbon Peak Carbon Neutral Action Plan [translated], http://www.most.gov.cn/kjbgz/202104/t20210407_173885.html, http://www.most.gov.cn/kjbgz/202103/t20210329_173575.html, http://www.most.gov.cn/kjbgz/202103/t20210310_173254.html, accessed 23 June 2021.
MOST (2021b), Notice of the Ministry of Science and Technology on holding the National Disruptive Technology Innovation Competition [translated], http://www.most.gov.cn/xxgk/xinxifenlei/fdzdgknr/qtwj/qtwj2021/202107/t20210714_175842.html, accessed 23 July 2021.
MOST (2021c), Changzhou National high-tech Zone launches enterprise innovation points system to guide innovation elements to the enterprise [translated], http://www.most.gov.cn/kjbgz/202105/t20210513_174583.html, accessed 23 June 2021.
MOST (2021d), Statistical analysis of China’s venture capital in 2019 [translated], http://www.most.gov.cn/xxgk/xinxifenlei/fdzdgknr/kjtjbg/kjtj2021/202107/P020210701389251530427.pdf, accessed 23 July 2021.
MOST (2021e), Statistical Analysis on the Innovation and Development of National High-tech Zones in 2019 [translated], http://www.most.gov.cn/xxgk/xinxifenlei/fdzdgknr/kjtjbg/kjtj2021/202106/P020210630532438708381.pdf.
MOST (2021f), The new version of the comprehensive evaluation index system for national high-tech zones is released [translated], http://www.most.gov.cn/xxgk/xinxifenlei/fdzdgknr/fgzc/zcjd/202106/t20210604_175062.html, accessed 23 July 2021.
MOST (2021g), Statistical analysis of R&D activities of industrial enterprises above designated size in China in 2019 [translated], http://www.most.gov.cn/xxgk/xinxifenlei/fdzdgknr/kjtjbg/kjtj2021/202106/P020210611729817042545.pdf.
Muniz, S.T.G., B.M. Belzowski and J. Zhu (2019), The trajectory of China's new energy vehicles policy, http://www.inderscience.com/offer.php?id=100913.
NDRC (National Development and Reform Commission) (2016), The 13th Five-Year Plan for Economic and Social Development of the People’s Republic of China (2016-2020), https://en.ndrc.gov.cn/newsrelease_8232/201612/P020191101481868235378.pdf
NDRC and NEA (National Energy Administration) (2016a), The 13th Five-Year Plan for Energy Development, https://www.greengrowthknowledge.org/sites/default/files/downloads/policy-database/China%29%2013th%20Five-year%20Energy%20Development%20Plan.pdf.
NDRC and NEA (2016b), Energy Technology Revolution and Innovation Action Plan (2016-2030), https://www.iea.org/policies/6272-china-energy-technology-innovation-action-plan-2016-2030.
NBS (National Bureau of Statistics) (2020a), China Statistical Yearbook 2020, http://www.stats.gov.cn/tjsj/ndsj/2020/indexeh.htm (2020) and http://www.stats.gov.cn/tjsj/ndsj/ (1999-2020).

An Energy Sector Roadmap to Carbon Neutrality in China Chapter 6: Innovation for carbon neutrality
PAGE | 261 IEA,
202
1.
NBS (2020b), China Statistical Yearbook on Science and Technology 2020, http://www.stats.gov.cn/tjsj/tjcbw/202103/t20210329_1815746.html (also see annual reports from previous years).
NEA (National Energy Administration) (2016), The 13th Five-Year Plan for Energy Technology Innovation (2016-2020), https://www.iea.org/policies/6267-china-13th-energy-technology-innovation-five-year-plan-2016-2020.
NEA (2012), The State Council issued the energy-saving and new energy automobile industry development plan (2012-2020) [translated], http://www.nea.gov.cn/2012-07/10/c_131705726.htm.
NPC (China’s National People’s Congress) (2006), Guidelines of the 11th Five-Year Plan for National Economic and Social Development, https://policy.asiapacificenergy.org/sites/default/files/11th%20Five-Year%20Plan%20%282006-2010%29%20for%20National%20Economic%20and%20Social%20Development%20%28EN%29.pdf, accessed 29 June 2021.
NREL (National Renewable Energy Laboratory) (2021), Champion photovoltaic module efficiency chart, https://www.nrel.gov/pv/module-efficiency.html, accessed 22 June 2021.
NREL (2015), New incubator network to help clean-energy entrepreneurs (news release), https://www.nrel.gov/news/press/2015/16455.html, accessed 28 June 2021.
OECD (Organisation for Economic Co-operation and Development) (2020), Innovation in environment-related technologies (database), https://stats.oecd.org/Index.aspx?DataSetCode=PAT_DEV#, accessed December 2020.
OECD (2018), State-owned enterprises and the low-carbon transition, https://dx.doi.org/10.1787/06ff826b-en.
OGRI (Orange Group Research Institute) (2020), 22 provinces and cities issued 105 policy documents, revealing what information about China's hydrogen fuel cell industry? [translated], https://www.163.com/dy/article/FV4F8IIG0519EFR3.html, accessed 29 June 2021.
Osborne, M. (2015), Hanergy TF building 10MW R&D and pilot line for Alta Devices GaAs solar cells, https://www.pv-tech.org/hanergy_tf_building_10mw_rd_and_pilot_line_for_alta_devices_gaas_solar_cell/, accessed 23 July 2021.
Schmidt, T.S. and J. Huenteler (2016), Anticipating industry localization effects of clean technology deployment policies in developing countries, https://doi.org/10.1016/j.gloenvcha.2016.02.005.
Shenhua Group (2020), [translated] China Shenhua Annual Report 2020, http://www.shenhuachina.com/zgshww/dqbg/tzzgxList.shtml (also see annual reports from previous years).
Stanway, D. (2021), China launches first commercial onshore small reactor project, https://www.reuters.com/world/china/china-launches-first-commercial-onshore-small-reactor-project-2021-07-13/.
https://www.pv-tech.org/hanergy_tf_building_10mw_rd_and_pilot_line_for_alta_devices_gaas_solar_cell/
https://www.pv-tech.org/hanergy_tf_building_10mw_rd_and_pilot_line_for_alta_devices_gaas_solar_cell/

An Energy Sector Roadmap to Carbon Neutrality in China Chapter 6: Innovation for carbon neutrality
PAGE | 262 IEA,
202
1.
SASAC (State-owned Assets Supervision and Administration Commission of the State Council) (2021), About the central business energy conservation and ecological environmental protection supervision and management notice (draft) for public comment [translated], http://www.sasac.gov.cn/n2588030/n2588934/c16575255/content.html.
State Council (2021), “Bounty system” to boost tech innovations, http://english.www.gov.cn/news/topnews/202105/26/content_WS60ada27cc6d0df57f98da31f.html, accessed 26 May 2021.
State Council (2020), China's Energy Development in the New Era [translated] (White paper), http://www.gov.cn/zhengce/2020-12/21/content_5571916.htm.
State Council (2016a), The Central Committee of the Communist Party of China and the State Council issued the National Innovation-driven Development Strategy Outline [translated], http://www.gov.cn/zhengce/2016-05/19/content_5074812.htm.
State Council (2016b), State Council Notice on the Publication of the National 13th Five-Year Plan for S&T Innovation [translated], http://www.gov.cn/zhengce/content/2016-08/08/content_5098072.htm and https://cset.georgetown.edu/publication/state-council-notice-on-the-publication-of-the-national-13th-five-year-plan-for-st-innovation/.
State Council (2006), Outline of the National Medium and Long-term Science and Technology Development Plan (2006-2020) [translated], http://www.gov.cn/gongbao/content/2006/content_240244.htm.
Tönurist, P. and E. Karo (2016), State-owned enterprises as instruments of innovation policy, https://doi.org/10.1111/apce.12126.
US DOE (US Department of Energy) (2017), U.S.-China Energy Collaboration, https://www.energy.gov/ia/initiatives/us-china-clean-energy-research-center-cerc.
Urban, F, S. Geall and Y. Wang (2016), Solar PV and solar water heaters in China: Different pathways to low carbon energy, Renewable and Sustainable Energy Reviews, Vol 64, pp. 531-542, https://doi.org/10.1016/j.rser.2016.06.023.
Wiatros-Motyka, M. (2016), An overview of HELE technology deployment in the coal power plant fleets of China, EU, Japan and USA, IEA Clean Coal Centre CCC/273, https://www.sustainable-carbon.org/report/an-overview-of-hele-technology-deployment-in-the-coal-power-plant-fleets-of-china-eu-japan-and-usa-ccc-273/.
Wang (2021), Accelerate the construction of an innovative country to fully support the new development pattern [translated], http://www.scio.gov.cn/xwfbh/xwbfbh/wqfbh/44687/44975/wz44977/Document/1699260/1699260.htm, accessed 23 June 2021.
Wei, X., J. Wang and Y. Ding (2019), Progress and development trend of coal clean and high-efficiency conversion technology, Bulletin of the Chinese Academy of Sciences, Vol 34 No. 4, pp. 409-416, http://www.bulletin.cas.cn/publish_article/2019/4/20190406.htm.
World Bank (2017), Project appraisal document on a proposed loan in the amount of US$50 million to the Kingdom of Morocco for financing innovative start-ups and small and medium enterprises project, https://documents1.worldbank.org/curated/en/805641489370466662/pdf/Morocco-Financing-Innovative-Startups-PAD1362-02222017.pdf, accessed 28 June 2021.

An Energy Sector Roadmap to Carbon Neutrality in China Chapter 6: Innovation for carbon neutrality
PAGE | 263 IEA,
202
1.
WNN (World Nuclear News) (2018), France and China to enhance nuclear energy co-operation, https://www.world-nuclear-news.org/Articles/France-and-China-to-enhance-nuclear-energy-coopera, accessed 22 June 2021.
Xi, J. (2021a), Xi Jinping: Strive to become the world's major science centre and innovation highland [translated], http://www.gov.cn/xinwen/2021-03/15/content_5593022.htm, accessed 23 June 2021.
Xi, J. (2021b), Xi Jinping: Speeches at the 20th Academician Conference of the Chinese Academy of Sciences, the 15th Academician Conference of the Chinese Academy of Engineering, and the 10th National Congress of the Chinese Association for Science and Technology [translated], http://www.xinhuanet.com/politics/leaders/2021-05/28/c_1127505377.htm, accessed 23 June 2021.
Xinhua News (2021a), The 14th Five-Year Plan for National Economic and Social Development of the People’s Republic of China and the Outline of Long-Term Goals for 2035 [translated], http://www.xinhuanet.com/2021-03/13/c_1127205564.htm, accessed 23 June 2021.
Xinhua News (2021b), National Key R&D Program specially sets up the project of Revealing the List and Putting the Lead [translated], http://www.xinhuanet.com/politics/2021-05/11/c_1127429950.htm, accessed 30 May 2021.
Xu, M. (2021), China to start building Hualong Two nuclear reactor in 2024, https://www.nasdaq.com/articles/china-to-start-building-hualong-two-nuclear-reactor-in-2024-2021-04-14.
Xu, J., Z. Liu, Y. and W. Li (2020), Progress in coal chemical technologies of China, Reviews in Chemical Engineering, Vol 36, No. 1, pp. 21-66, https://doi.org/10.1515/revce-2017-0026.
Xu, Y. (2020), Environmental policy and air pollution in China: Governance and strategy. Routlege, Abingdon, https://doi.org/10.4324/9780429452154.
Yezi, J. (2021), The national key research and development plan announced 51 special projects with funds of 2.67 billion for opening the list and taking command projects [translated], https://www.yicai.com/news/101115968.html.
Yi-chong, X. (2010), The Politics of Nuclear Energy in China, Chapter 6: Technology Adoption or Technology Innovation, https://link.springer.com/chapter/10.1057/9780230290532_6.
Yip, G. and B. McKern (2017), China's Next Strategic Advantage: From imitation to innovation, MIT Press, Cambridge, https://mitpress.mit.edu/books/chinas-next-strategic-advantage
Zhang, F. (2020), Leaders and followers in finance mobilization for renewable energy in Germany and China, https://doi.org/10.1016/j.eist.2020.08.005.
Zhang, F. and K.S. Gallagher (2016), Innovation and technology transfer through global value chains: Evidence from China's PV industry, https://doi.org/10.1016/j.enpol.2016.04.014.
Zhao, L. and K.S. Gallagher (2007), Research, development, demonstration, and early deployment policies for advanced-coal technology in China, https://doi.org/10.1016/j.enpol.2007.08.017.
Zhihao, Z. (2021a), New bounty system offers incentives for innovation, https://www.chinadaily.com.cn/a/202103/10/WS60481deca31024ad0baae1d8.html.

An Energy Sector Roadmap to Carbon Neutrality in China Chapter 6: Innovation for carbon neutrality
PAGE | 264 IEA,
202
1.
Zhihao, Z. (2021b), Bounty system to boost tech innovations, http://www.chinadaily.com.cn/a/202105/26/WS60ada091a31024ad0bac171b.html.
Zhou, K.Z., G.Y. Gao and H. Zhao (2016), State ownership and firm innovation in China: An integrated view of institutional and efficiency logics, https://journals.sagepub.com/doi/10.1177/0001839216674457.

An Energy Sector Roadmap to Carbon Neutrality in China Chapter 7: Policy considerations
PAGE | 265 IEA,
202
1.
Chapter 7: Policy considerations
Highlights
The overriding challenge for policy makers in the People’s Republic of China (hereafter, “China”), as in other countries with net zero emissions goals, is to devise a comprehensive policy framework to steer investment towards clean energy technologies, transform business models and accelerate innovation while maintaining energy security and affordability. The transition to carbon neutrality presents an opportunity for China to move up technology value chains, create sustainable new sources of economic growth and enhance its contribution to the global clean energy transition.
The transformation of China’s energy system requires a clearly formulated long-term government strategy, integrated into plans at national, provincial and local levels. That strategy, involving long-term roadmaps for key sectors and technologies, needs to incorporate near-term priorities and to track progress towards medium-term milestones. China has recently made a notable move in this direction by establishing “a Leadership Group” to co-ordinate national efforts to reach its climate goals.
The Chinese government will need to draw on a wide range of policy levers, ranging from China’s new emissions trading system to a continuation of energy market reforms including fuel pricing mechanisms and the phase-out of fossil fuel subsidies that can help enable the development of new business models. Regulatory instruments such as mandates and standards, and increased public support for technology research and development (R&D) and demonstration will also be important to steer investment towards low-carbon technologies.
A key focus of policy action should be on reducing emissions from existing assets by operating them more efficiently, shifting to low-carbon fuels, retrofitting them with carbon capture equipment, and, where economically feasible and socially acceptable, retiring them early. Government intervention is also needed to accelerate the uptake of clean energy technologies at the early stages of commercialisation.
The energy transition to carbon neutrality will require substantial investment in new network infrastructure and upgrades. The central and provincial governments will need to co-ordinate planning processes, provide funding for infrastructure construction, establish clear regulatory frameworks and ensure equal and affordable access to infrastructure.
Innovation of emerging technologies will be critical to achieve carbon neutrality. Beyond direct R&D funding, policy can incentivise innovators through competitive niche markets, infrastructure investment and other market-pull regulatory measures. More international collaboration on developing and deploying clean energy technologies is critical to facilitate the transition to carbon neutrality in China and elsewhere.

An Energy Sector Roadmap to Carbon Neutrality in China Chapter 7: Policy considerations
PAGE | 266 IEA,
202
1.
Towards a comprehensive policy framework China’s 2060 carbon neutrality pledge establishes a framework for its sustainable social and economic development in the long term. The transition to a clean energy system is central to that vision. Given the country’s importance in the global energy market and energy-related technologies, the pathway China takes will have far-reaching implications for the pace and success of decarbonisation efforts in the rest of the world. Government policies will be central to determining that pathway. The overriding challenge for policy makers in China, as in other countries with net zero emissions goals, is to devise a comprehensive policy framework to steer investment and energy use towards clean energy technologies, and to accelerate innovation in emerging technologies. This chapter outlines the main elements of an integrated policy approach to the clean energy transition in China.
The transformation of China’s energy system will not happen at the scale or speed required to get to carbon neutrality without a clearly formulated long-term government strategy, integrated into energy policies and plans at national, provincial and local levels, to guide investment decisions. That strategy needs to foster the development and deployment of a broad portfolio of technologies, incorporating near-term priorities and tracking progress towards medium-term milestones to make them credible and to gain support from businesses and investors. There is also a need to take account of other energy policy objectives, including energy security and affordability, and universal access to modern energy services.
Despite the important role that behavioural change has to play, a technological transformation of the way we go about producing, supplying and using energy will be essential for the clean energy transition. It clearly makes sense to maximise the use of technologies that are already commercially available. But, as this report makes clear, a large share of the emissions reductions needed for China to reach carbon neutrality by 2060 are not yet available on the market. In our roadmap, most of those emerging technologies are commercialised by 2030. The current decade therefore is crucial to their development, demonstration and initial deployment.
The current focus of government climate policy is on devising plans, strategies and measures to turn the vision of a carbon neutral energy sector into reality. Since the president’s announcement in September 2020 that China aims to have CO2 emissions peak before 2030 and to achieve carbon neutrality before 2060, the central government has announced several supplementary climate targets and measures to accelerate the energy transition in support of those aims. They

An Energy Sector Roadmap to Carbon Neutrality in China Chapter 7: Policy considerations
PAGE | 267 IEA,
202
1.
include medium-term targets for energy and carbon intensity, the share of non-fossil fuels in primary energy use, renewable energy capacity and limits on coal use. National, provincial and sectoral plans to achieve a peak in emissions before 2030, as well as detailed sectoral targets for 2025 are currently under development, including caps on energy consumption, industry efficiency improvements, the deployment of renewables and the electrification of energy end-uses. The central government has recently established a “Leadership Group”, overseen by the executive vice-premier and comprising of heads of key national level ministries and agencies. This all-of-government effort is in line with IEA recommendations to accelerate clean energy transitions to net zero emissions (IEA, 2021a).
China’s experience and track record in setting and implementing energy-related targets inspire confidence that its carbon neutrality targets can be achieved. Through its five-year planning, China has a well-established process for setting multi-year policy priorities, tracking progress and reviewing the need for policy modifications, all of which are important components for successful implementation of climate policies. Additionaly, China has a proven record of meeting ambitious energy and climate targets. The carbon and energy intensity reduction targets in the most recent five-year plans (FYPs) were surpassed, except for the energy intensity target for 2020 (due to the Covid-19 crisis). Similarly, the targets for the share of non-fossil fuels in primary energy demand were also exceeded in the last two FYPs. On the back of such progress, the Chinese government declared that it would enhance its nationally determined contribution (NDC) targets for 2030, including reducing its CO2 emissions per unit of GDP by more than 65% from the 2005 level (compared with a target of 60-65% previously) and increasing the share of non-fossil fuels in primary energy consumption to around 25% (up from around 20% in the current NDC).1 China also has a strong record of large-scale infrastructure developments, such as high-speed rail networks, ultra-high voltage transmission lines and electric vehicle (EV) recharging facilities.
Policy approach and priorities China’s new official targets set out a clear timeline for its path to carbon neutrality, shifting the key policy question from “whether and when” to “how”. The next step should be to establish a clear vision of the energy pathway required for a peak in CO2 emissions before 2030 and carbon neutrality before 2060 through road
1 China’s targets are based on the partial substitution method used by China’s National Bureau of Statistics, while IEA statistics and energy balance use the physical energy content method.

An Energy Sector Roadmap to Carbon Neutrality in China Chapter 7: Policy considerations
PAGE | 268 IEA,
202
1.
mapping processes for key sectors and technologies in co-operation with technology experts, civil society and market analysts. The aim should be to identify realistic medium- and long-term targets for the deployment and development of specific technologies based on an assessment of technology and infrastructure needs and innovation gaps, as well as priority technology areas and strategies for net zero emissions taking full advantage of cross-sectoral spillover (knowledge transferred across technology areas or obtained by implementing a technology across different applications [IEA, 2020a]). This IEA Roadmap is intended as an initial input to those processes.
To be effective, some policy measures will need to be tailored to the characteristics of the technologies they are targeting, as clean energy technologies are at different stages of maturity. We have identified five core target areas for policy action in China that differ by technology maturity: reducing emissions from existing energy-related infrastructure; cultivating markets for new clean energy technologies; building clean energy infrastructure; fostering clean energy innovation; and collaborating with other countries on clean energy technology. Each of these target areas are discussed in turn.
Figure 7.1 Policy priorities for China’s net zero emissions strategy by technology maturity level
IEA, 2021.
China’s energy policies in support for carbon neutrality should focus on five core measures, which differ according to their technology maturity

An Energy Sector Roadmap to Carbon Neutrality in China Chapter 7: Policy considerations
PAGE | 269 IEA,
202
1.
Tracking progress, evaluating the impact of policies and adjusting them and technology priorities accordingly are important elements of the overall approach to climate policy making. It helps to ensure that action is effective and that results are delivered, and it enables everyone to see what progress is being made. It also helps to identify technology areas that are struggling to keep up with requirements and enable timely adjustments to policies as and when needed (IEA, 2020a). This hinges on collecting reliable data. The success of China’s priority setting approach, embodied in its FYPs, could be leveraged to establish complementary processes to evaluate outcomes against policy objectives.
The technological transformation to achieve carbon neutrality will be guided by China’s overall climate and energy policies. The government will need to strengthen and draw on the wide range of policy levers at its disposal, including carbon pricing, the phase-out of fossil fuel subsidies and other market reforms such as competitive auctions for low-carbon generating capacity to ensure price signals steer consumer spending and private investment towards low-carbon technologies, as well as regulatory instruments and frameworks such as mandates and standards, and increased public support for technology R&D and demonstration activities. All these policy measures will need to be strengthened to speed up the deployment of clean and efficient energy technologies and to phase out the carbon-intensive ones such as unabated coal‐fired power stations, oil and gas boilers, and conventional internal combustion engine vehicles.
Carbon pricing, which can take the form of a carbon tax or an emissions trading system (ETS), is a valuable instrument in the policy toolkit to help accelerate clean energy transitions. By providing a clear and stable price signal that internalises societal costs of greenhouse gas emissions, it can incentivise cost-effective emissions reductions and guide technological innovation. Well-designed carbon pricing instruments can influence a wide range of decisions about energy use over different timeframes, such as the competition between fuels and technologies (e.g. the dispatch of clean power plants) and consumer behaviour in the short term, decommissioning of carbon-intensive assets in the medium term and infrastructure investment for the long term. Carbon pricing could be a source of public revenues that should be used to fund emissions mitigation or support measures to alleviate cost burden or address other socio-economic impacts (IEA, 2020b). China’s new ETS will need to play a central role in driving the energy transition to carbon neutrality over the coming decades.

An Energy Sector Roadmap to Carbon Neutrality in China Chapter 7: Policy considerations
PAGE | 270 IEA,
202
1.
China’s emissions trading system China’s national ETS, which began trading in July 2021, is the largest CO2 emissions trading scheme in the world, accounting for almost half of all emissions regulated by an ETS. (Worldwide, emissions trading systems cover around 16% of global GHG emissions [World Bank, 2021a].) It initially covers the power sector (including electricity and heat generation2), involving more than 2 000 enterprises and accounting for around 4.5 Gt CO2 or around 40% of China’s energy sector CO2 emissions in 2020. It is expected to be expanded to cover other energy-intensive sectors, including petrochemicals, chemicals, building materials, iron and steel, non-ferrous metals, paper and domestic aviation. Those sectors accounted for 35% of CO2 emissions in 2020.
The design of China’s ETS draws on the experience gained from eight regional pilot schemes, which cover different sectors according to their regional energy patterns. Even with moderate carbon prices, ranging between USD 1.5 and 14.5 per tonne of CO2 (CNY 10 and 100 per tonne) in 2020, the ETS pilots, which continue to run in parallel with the national system, have been successful in encouraging emissions mitigation measures and developing carbon management expertise. For example, the Guangdong ETS, the largest regional pilot, helped to reduce emissions from the enterprises it covered by over 12% in 2019 compared with 2013, when the scheme started (Xuelan et al., 2021).
Emissions allowances in the national ETS are currently allocated to coal- and gas-fired power plants (including combined heat and power) according to their output during 2019‐20 and pre-determined emissions intensity benchmarks (in tonnes of CO2/ t CO2/MWh for electricity and t CO2/GJ for heat generation) for each fuel and type of plant. This encourages plants to reduce their emissions intensity below the benchmark level while providing flexibility in how to do that. However, the output and intensity-based approach does not set a cap on total emissions, as in the European Union’s ETS and some other cap-and-trade systems, which could rise. Allowances are currently allocated for free, but may be auctioned in the future (MEE, 2021). By the end of August 2021, allowances generally traded at around CNY 45-60/t CO2 (around USD 8/t CO2), slightly above market expectations, although the market has displayed relatively low liquidity so far with limited trading volume. In comparison, prices in Korea’s ETS rose from around USD 10 in 2015 to around USD 35 in 2020, before falling to just above USD 10/t in mid-2021; in California’s cap-and-trade scheme, prices have generally fluctuated around
2 Only heat generation from combined heat and power units is covered; heating-only plants are not covered by China’s national ETS.

An Energy Sector Roadmap to Carbon Neutrality in China Chapter 7: Policy considerations
PAGE | 271 IEA,
202
1.
USD 10-20/t, while prices in the EU ETS have risen steadily since 2018 to around USD 70/t in 2021.
In the near term, the main impact of China’s national ETS is likely to be on improving the efficiency of coal-fired power generation, which would limit the increase in total emissions from power generation as electricity demand continues to grow. It could lead to a peak in electricity-related emissions well before 2030, were the benchmarks to be lowered, by stimulating more investment in efficiency improvements, encouraging generation from efficient plants over less efficient ones and incentivising the deployment of carbon capture, utilisation and storage (CCUS). However, the ETS will probably not lead to much switching away from coal, as the effective cost to coal- and gas-fired plants is expected to remain small under the current technology specific benchmarking approach and free allocation of allowances (IEA, 2021b). The role of the ETS in contributing to the peak in China’s total CO2 emissions before 2030 and reaching carbon neutrality by 2060 by guiding cost-effective mitigation measures and leveraging investment in clean energy technologies will depend on market confidence in the CO2 price signal and changes in its design.
International experience has shown that long-term policy predictability is important to encourage active emissions trading and to guide investment decisions in a cost-effective manner, as market participants need to have confidence that the scheme will continue to exist and be able to integrate the price expectations into business plans. This is particularly relevant for capital-intensive sectors with long-term assets, such as energy supply and manufacturing. For instance, policy uncertainty was identified as a key factor for low trading activity in Korea’s ETS at the end of the first commitment period (2015-2017). In response, Korea established a ten-year Master Plan and a five-year Allocation Plan outlining the emissions cap and allocation method while providing market participants with technical details at least six months before the start of a compliance period. In the case of the EU ETS, the scheme has clearly positioned as a cornerstone of its climate policy, providing visibility on long-term emissions reductions pathways and annual linear reduction factors for the overall cap, and releasing details for each compliance period well in advance (IEA, 2020b). Price or supply adjustment mechanisms, such as an allowance price floor or ceiling, auction reserve price or mechanism to adjust the number of allowances in circulation, e.g. EU’s Market Stability Reserve, can also generate confidence in an ETS by helping to increase price certainty and improve the system’s resilience to events such as an economic crisis. Such mechanisms have become a standard component of many emission trading systems (World Bank, 2021b). China has clearly communicated its intention to use the national ETS as a key policy instrument to drive cost-effective decarbonisation. Aligning

An Energy Sector Roadmap to Carbon Neutrality in China Chapter 7: Policy considerations
PAGE | 272 IEA,
202
1.
the trajectory of total allowances with the overall emissions peak and longer term targets would contribute significantly to providing certainty for businesses in drawing up their corporate plans.
China will need to adapt the way in which the ETS works for it to play a stronger role in supporting its climate ambitions. This can be achieved, for instance, by introducing allowance auctioning, setting an absolute cap on emissions, and furthering the links between carbon and financial markets. A gradual introduction of auctioning can help to enhance liquidity and price discovery, and to strengthen incentives for fuel switching and other decarbonisation measures. Auctioning can also raise revenues for investments in low-carbon technologies and for addressing social concerns such as energy affordability and employment. For instance, the California Climate Investments initiative, which is solely funded by auction revenue from the state’s cap-and-trade programme, invested USD 8.3 billion between 2013 and 2020 in public transport projects, EV incentives and efficiency in the buildings sector, of which half benefitted disadvantaged communities and low-income households. Introducing an overall cap on emissions with a decreasing cap trajectory would provide a clear policy signal and ensure emissions in the sectors covered by the scheme are in line with long-term climate goals; it would also increase policy design simplicity and help encourage the most cost-effective mitigation measures across products and sectors that may be subject to different benchmarks. Gradually opening trading to more actors such as financial institutions, could help with strengthening liquidity on the market and enhance the financial function of the ETS. The regional pilots could be used to explore policy designs, with a view to their later inclusion in the national ETS.
Future changes in the design of the ETS will need to be co-ordinated with the evolution of the overall climate policy framework, including regulatory reforms in the power sector and other policies that affect the energy and technology mix in sectors covered by the scheme, such as energy consumption standards for coal-fired power plants or constraints on new coal-fired power plant investment, renewable portfolio standard and green certificate schemes, and energy innovation policies. The aim should be to create effective price signals, reduce non-price barriers and encourage investment in critical emerging technologies that may not be competitive in the near term under prevailing carbon prices.
Reducing emissions from existing assets Reducing emissions from existing energy sector assets is a key priority for China. The emissions projected from these assets alone, if they continue to operate normally and are not retired before the end of their economic lifetime, would

An Energy Sector Roadmap to Carbon Neutrality in China Chapter 7: Policy considerations
PAGE | 273 IEA,
202
1.
exhaust most of the total emissions in the Announced Pledges Scenario (APS) (see Chapter 2). Infrastructure under construction today will add to these “locked in” emissions. For China’s total energy sector emissions to peak before 2030 and to fall to zero on a net basis by 2060, emissions from those assets will need to be curbed. Given the short timeframe and the large stock of China’s fossil fuel-based power, cement and steel plants, and other emissions-intensive assets, policy action needs to target these assets without delay. There are four main ways to reduce these emissions: operating those assets more efficiently; changing fuel and material inputs; retrofitting with carbon capture equipment; and retiring the assets early. Policies need to address each of these levers.
Figure 7.2 Energy sector CO2 emissions from existing infrastructure by sector assuming typical lifetimes in China in the APS
IEA, 2021.
Note: APS = Announced Pledges Scenario.
For China’s total energy emissions to peak before 2030 and fall to zero before 2060, emissions from existing energy assets, especially in power generation and heavy industry, need to be curbed urgently
Box 7.1 Unlocking emissions in China’s heavy industry sectors
China’s heavy industries produce nearly 60% of the world’s steel and cement, along with 30% of the primary chemicals used to make plastics and nitrogen fertilisers. The fleet of plants that makes up its production capacity for these products is not only vast, but young: 85-90% of China’s steel and cement plants
0
2
4
6
8
10
12
2020 2030 2040 2050 2060
Gt C
O2 Other
Buildings
Transport
Industry
Power
APS

An Energy Sector Roadmap to Carbon Neutrality in China Chapter 7: Policy considerations
PAGE | 274 IEA,
202
1.
are less than 20 years old. More than half the cement plants are ten years old or less.
Herein lies both a challenge and an opportunity. The main challenge is that without alterations to their existing modes of operation, or early retirements of large swathes of capacity, these heavy industry plants could emit around 40 Gt CO2
cumulatively, assuming typical plant lifetimes of 25 years. If the equipment in these heavy industry sectors is renewed with emissions-intensive capacity at the end of their current lifetimes, adding a further 25 years of emissions from these assets, the cumulative emissions burden could rise to nearly 120 Gt CO2.
The opportunity lies in making sure that innovative technologies are ready in time for these plants to be renewed, which will involve the interim replacement, upgrade or retirement of a substantial portion of the capital assets employed at each site, such as the relining of a blast furnace. The age profile of China’s existing heavy industrial assets aligns well with the expected availability of near-zero emissions technologies when major industrial assets need to be replaced: much of its capacity is 10-15 years old on average, while several near-zero emissions technologies are 10-15 years away from commercialisation.
Aligning the availability of innovative technologies to be deployed at scale with the phase-out of existing capacity, thus avoiding the need for a further cycle of emissions-intensive capacity renewal, could avoid more than 75 Gt CO2 in cumulative emissions from these sectors in China. Those emissions savings would be equivalent to about 15% of the estimated global carbon budget of 500 Gt CO2 to have a 50% chance of limiting the average temperature increase to 1.5 °C by the Intergovernmental Panel on Climate Change (IPCC, 2021). As well as “unlocking” these emissions, this could open up a vast new market for technology development and capacity replacement through the creation of industrial hubs for the deployment of new near-zero technologies.
Industrial hubs can facilitate a more efficient use of shared infrastructure that is critical for near-zero emissions industrial production, including hydrogen production, distribution and storage, CO2 transport and storage and renewable power generation capacity. Hubs can also help focus the initial planning and co-ordination phases of infrastructure development, creating synergies for the actors involved. Industrial hubs cannot be created overnight and if they and the near-zero emissions technologies that they will host are not ready in time, China risks missing an opportunity to avoid locking in waves of new carbon-intensive capacity, requiring more early retirements later.

An Energy Sector Roadmap to Carbon Neutrality in China Chapter 7: Policy considerations
PAGE | 275 IEA,
202
1.
Potential emissions from heavy industry assets under typical lifetime and renewed cycle with current operating conditions in China, 2020-2070
IEA, 2021.
Notes: Typical lifetimes for steel, cement and chemicals assets are around 25 years in China, compared with 30-40 years globally. The renewal cycle explored here assumes another 25 years of operation of these plants at the end of their current operational period, taking into account the current age of the existing capacity.
More efficient operation of existing equipment Despite the laudable efforts in recent years to shut down the most inefficient capacity and incentivise upgrades to raise energy performance, China still has vast potential to improve the efficiency of fossil fuel use, especially in the power, cement and steel sectors. Energy efficiency gains would allow the same energy service to be provided using the same fuel, but in smaller amounts, thereby lowering emissions. In some cases, the investment required is substantial, e.g., heat recovery and boiler upgrades in industrial plants. Others, such as improving operational and maintenance practices, require little or no investment and involve minimal or no increase in operating costs. Tapping into the efficiency potential across the energy system delivers 6 Gt of cumulative CO2 emissions reductions by 2030 in the APS (around 25% of the total savings). Increasing the efficiency of coal power plants to that of current best available technology performance levels would reduce emissions by 770 Mt CO2, equivalent to 15% of the current emissions from those assets.
China has already established a robust policy framework for encouraging investment in energy efficiency retrofits, as well as the development and sale of new energy-efficient equipment. Even stronger measures can help incentivise
An Energy Sector Roadmap to Carbon Neutrality in China Chapter 7: Policy considerations
PAGE | 276 IEA,
202
1.
incremental energy efficiency gains in existing assets, including strengthening the Top 100/1 000/10 000 programme, an energy conservation initiative which started in 2006 and was expanded under the 13th FYP. The programme places the top 100 energy-consuming enterprises under national regulations on energy use, the top 1 000 such enterprises under the regulation of their respective provincial governments and the other enterprises among the 10 000 biggest energy consumers under the regulation of lower level governments. The regulations include measures aimed at encouraging enterprises to take voluntary measures to reduce energy consumption, as well as facilitating the development of energy management systems. Tradeable energy performance standards, whereby companies are allowed to trade credits for complying with a specific programme setting limits on energy consumption, are another way of achieving this goal.
Changes to energy and material inputs In many cases, an energy service can be provided with a different energy carrier using the same equipment. Drop-in fuels in transport, such as sustainable biofuels and synthetic hydrocarbon fuels, often do not require modifications to existing equipment and, where they are necessary, usually straightforward and inexpensive. The co-firing of sustainably grown biomass and renewable wastes in various industrial processes and power plants, and blending in shares of low emissions fuels that do not require modifications to existing equipment (e.g. hydrogen blended into natural gas in direct reduced iron production and blast furnaces, and in gas networks) can also be economically attractive options for cutting emissions from existing assets. Changes in the material inputs to industrial processes can also help reduce energy consumption, and therefore emissions, from existing assets. Examples include increasing the use of scrap in steel and aluminium production, and lowering the clinker-to-cement ratio in cement production (see Chapter 3).
China has an opportunity to strengthen policies that encourage switching to less carbon-intensive fuels and production processes, especially to reduce the use of coal where possible, particularly in coal-fired power, steel and cement plants. The ETS could play an important role, on condition that the prices for CO2 are high enough to encourage fuel switching and other changes in operating practices. For secondary industrial materials, particularly steel, aluminium and plastics, the government can also help co-ordinate improved recycling networks and mandate recycling collection, testing and quality standards. This could build on efforts outlined in the most recent 14th FYP (2021-2025) for the circular economy, which includes targets to increase the utilisation rate of agricultural straw, bulk solid waste and construction waste to 86%, 60% and 60% respectively, together with

An Energy Sector Roadmap to Carbon Neutrality in China Chapter 7: Policy considerations
PAGE | 277 IEA,
202
1.
tonnage targets for the use of waste paper (60 Mt), steel scrap (320 Mt) and recycled non-ferrous metal (20 Mt). There is also scope to modify emissions and design regulations to optimise life cycle emissions performance. Other measures are needed to improve steel recycling and sorting systems, including better quality control, and operations to reduce in-house scrap generation, as well as to encourage the development of new business models based on value rather than the quantity of material supplied.
Low-carbon technology retrofits Retrofitting coal power plants, cement plants and some types of steel and primary chemical production facilities with carbon capture equipment is likely to be the only viable option to almost entirely eliminate emissions from existing plants. The viability of retrofitting with CCUS will depend on several factors, including the age and efficiency of the plant, adequate space for capture equipment, access to CO2 transport and storage infrastructure, and the availability, maturity and cost of alternative technologies or approaches to reduce emissions. A retrofit is easier and less costly if the plant is built with a view to installing such equipment at a later stage, i.e. CCUS-ready.
Policy support will be critical to exploiting opportunities for CCUS retrofits. Direct funding of first-move projects will likely be required for some power and industrial applications, where technologies are at an early stage of commercialisation. The government will also have an important role to play in supporting investment in CO2 transport and storage infrastructure, including co-ordinating and planning investment across different actors, such as landowners, emitters and storage developers, and across provinces.
There is also considerable potential for retrofitting buildings to reduce their carbon footprint. A zero carbon-ready building is both highly energy efficient and capable of either using renewable energy directly or an external source of energy such as electricity or district heat that is fully decarbonised or capable of being so later. Zero carbon-ready building retrofits are a no-regret measure to jumpstart progress towards a zero emissions buildings sector. Foregoing the opportunity to make energy use in buildings more efficient would drive up electricity demand linked to electrification of energy use in the buildings sector and make decarbonising the energy system significantly more difficult and costly.
Establishing zero carbon-ready building energy codes and standards and introducing financial incentives could encourage investment in building retrofits. Deep retrofits have proven to be more cost-effective compared to a series of

An Energy Sector Roadmap to Carbon Neutrality in China Chapter 7: Policy considerations
PAGE | 278 IEA,
202
1.
several light retrofits, as the former yield bigger immediate energy savings and improvements to thermal comforts. Identifying scalable retrofit packages to reflect the combination of environmental and economic objectives of the various stakeholders – building owners and occupants, and public authorities – is critical to avoid unnecessary investment in new buildings. This includes establishing accreditation systems to support the growth of the retrofit market, assessing how different measures interact with each other and identifying barriers to investment along the full supply chain. Expanding public knowledge of the benefits of retrofits with targeted information campaigns can also foster their adoption.
Decommissioning The early retirement of a significant amount of existing capacity in coal-fired power generation and steel and cement production will be inevitable as China’s economy restructures over the coming years, reducing its reliance on energy-intensive industries to drive economic growth. Early retirements can be minimised by exploiting the maximum potential from each of the measures outlined above. Economic, social and energy security considerations will determine decisions about which plants to close and when. There are already efforts underway to reduce over capacity, particularly in coal power and steel, to improve competitiveness and reduce air pollution. In any case, a move from primary to secondary steelmaking as more scrap becomes available as the economy matures will reduce the need for steel capacity and strengthen the case for closing some plants.
Sunset clauses and mandating of retrofit-ready, or at least retrofit-capable, designs for industrial plants can also be used to make deep emissions reductions from existing assets easier later. In line with guidance in the 14th FYP (2021-2025) to strictly limit expansion of energy- and emissions-intensive capacity and to systematise mechanisms for reducing over capacity, policies should be tightened to constrain additions of such capacity and phase out the least efficient existing capacity and any remaining illegal plants. Pursuing these measures in tandem could help raise utilisation rates at the most efficient plants, with the added benefit of making the more viable existing plants more profitable.
Boosting markets for clean technologies Government intervention is needed to accelerate the uptake of clean energy technologies at the early adoption stage in China, as in the rest of the world. The key is to reduce their cost and performance gap relative to existing technologies by incentivising deployment (see Chapter 4). The objective should be to maximise

An Energy Sector Roadmap to Carbon Neutrality in China Chapter 7: Policy considerations
PAGE | 279 IEA,
202
1.
the contribution from private capital through appropriate policies and measures along clean energy technology value chains. Small, modular, mass-manufactured technology designs with large potential for spillover and rapid learning could be a particularly important focus of policy action. Solar photovoltaics (PV) and Li-ion batteries are examples of how technology improvement, including manufacturing techniques, have led to rapid commercialisation in the past. Electrolysers and fuel cells have similar potential.
The two main types of policy instruments that can be employed to create and nurture markets for clean energy technologies that are at the market uptake stage are:
• Market-pull instruments: These are policy instruments which work to achieve a policy objective by increasing demand for products or services with particular characteristics. Examples include labelling, public procurement and sales tax rebates. Stimulating demand for clean technologies, products and services facilitates their uptake. Market deployment boosts economies of scale and learning-by-doing, which helps to improve the performance and reduce the cost of technologies, creating a virtuous cycle. Different technologies and sectors will need various incentive measures depending on value chain complexity and value for customers, among other factors.
• Continued R&D support after market introduction: Supporting an evolving portfolio of competing designs at different stages of maturity for each priority area improves the chances of success. Favouring options with rapid innovation potential can also help. Historical evidence suggests that ongoing R&D is vital to stimulate the development of new designs and components, and to bring down costs and improve performance, even after commercialisation. Diversity and competition help to spur progress and leave space for unexpected fruitful developments (IEA, 2020c).
Industry sector New near-zero emission technologies in industry are likely to be significantly more expensive than existing conventional technologies as they start to be deployed at commercial-scale and probably for many years thereafter. This means there will be a need to establish stable demand as soon as they appear on the market to give more certainty to investors during the earlier stages of development (piloting and demonstration) and in the first commercial projects. This will pave the way for continued development of those technologies and cost reductions.
Early market-pull instruments for industrial technologies include public or private procurement, where government or intermediate industrial users of materials like

An Energy Sector Roadmap to Carbon Neutrality in China Chapter 7: Policy considerations
PAGE | 280 IEA,
202
1.
car manufacturers or construction companies would agree to pay a premium, for example for low emissions steel, cement, plastics and fertilisers. Upfront capital support, as well as operational support, for example via tax incentives or grants, could also help make low-carbon industrial projects financially viable. Such measures, which could complement the ETS, could be tailored according to specific development goals and technology pathways.
Clearly differentiated standards for low emissions products with certification would benefit individual material producers and purchasers by improving their corporate sustainability image and providing opportunities to market “green” products to domestic consumers. They would also allow those products to be sold into markets in other regions of the world with trade rules that mandate a certain environmental footprint for products. A carbon border adjustment mechanism, under which importers are obliged to buy carbon certificates corresponding to the carbon price that would have been paid had the goods been produced under the importing jurisdiction’s carbon pricing rules, could protect Chinese producers from unfair competition from other countries with less stringent environmental standards, though it would need to be carefully designed to ensure compliance with international law, notably World Trade Organization requirements. Carbon contracts for difference is another mechanism that could work well in China. Rather than purchasing industrial materials directly, central and provincial governments could tender for low emissions materials and fund the difference in the cost of production relative to conventional higher emitting production (including differences in operating costs) for a guaranteed volume of production, in a similar way to a feed-in tariff for renewable energy. The policy would act like a guaranteed carbon price, complementing the ETS.
Once first-of-a-kind low emissions industrial technologies have been successfully deployed, the government could apply content regulations to support investment in additional plants. Regulations could take the form of a tradeable quota or certificate system requiring minimum shares of cement, steel, aluminium, plastics and fertilisers to be near-zero emissions with the shares rising over time. The government could also assist in helping industrial investors tap into sustainable debt and transition finance markets to raise funds for low-carbon technologies. For instance, China updated its green bond standards to include CCUS in 2020, which could aid fundraising for developing commercial projects. The first projects to access such funding could provide lessons on how to optimise future project financing structures.

An Energy Sector Roadmap to Carbon Neutrality in China Chapter 7: Policy considerations
PAGE | 281 IEA,
202
1.
Transport sector China is well positioned to double down on its investments in world-leading public transportation, as well as in digital technologies such as apps that make planning road trips and freight movements simpler, cheaper, more convenient, more energy efficient and less carbon-intensive (see Chapter 3). A recent directive from the Ministry of Transport and the National Development and Reform Commission instructs policy makers at the city, provincial, and central government levels to prioritise investment in green transport infrastructure (MoT and NDRC, 2020). It seeks to leverage China’s success in developing electric buses and other alternatives to private cars, and mobility apps that combine several modes. It sets differentiated minimum targets for the shares of public non-motorised transport modes and other sustainable modes in cities of different sizes, as well as a process for tracking progress and evaluating the effectiveness of meeting those targets. It also notes the potential for integrated urban and transport planning, especially in greenfield developments and outlines the direction that new guidance from the Ministry of Transport should take in 2022 when the impact of the measures in the directive are due to be assessed.
China’s 2016 voluntary plan to review and reform its fossil fuels subsidies under the auspices of the G20 marked an important step in creating a market and regulatory environment to stimulate the adoption of low-carbon alternative transport fuel and vehicle technologies. The plan recognises that the rapid phase- out of implicit and explicit subsidies for oil consumption and national crude oil production and refining is crucial to China’s broader economic, natural resource, and environmental and climate goals. The plan acknowledges that transport fuels should be taxed according to their resource scarcity and societal impacts, including air pollution and climate change, with consideration for equity, e.g. tax exemptions, or the redistribution of tax revenues to vulnerable or severely impacted segments of the population. It also recognises the need to increase gasoline and diesel taxes to levels commensurate with the monetary costs of their environmental and health effects. Doing so, and similarly for shipping and aviation fuels, would not only stimulate adoption of alternative technologies such as EVs and alternative transport modes such as high-speed rail, but also as a consequence reduce China’s increasing dependence on oil imports.
China can build on the rapid progress it has made in adopting vehicle emissions standards and fuel quality standards. China adopted the Euro VI emissions standard in July 2021 to align itself with international best practice. It could go even further, setting standards that are more stringent than those in Europe or the United States. In the meantime, China should consider further strengthening its

An Energy Sector Roadmap to Carbon Neutrality in China Chapter 7: Policy considerations
PAGE | 282 IEA,
202
1.
capacity to verify and enforce compliance with those standards in practice, including by stepping up inspection and maintenance testing requirements.
China could also set clear schedules for reducing the carbon intensity of transport fuels. Low-carbon fuel standards have already been implemented in California and other states in the United States, as well as in Canada. China has experience in setting carbon-intensity targets at the national level and increasing their stringency over time to curb emissions through the FYPs. Sector-specific targets for incorporating low-carbon fuels may be appropriate, particularly in shipping and aviation. Domestic aviation has been identified by the Chinese government as an energy-intensive sector to be covered later by the national ETS, which could play a key role in reducing CO2 emissions in the sector.
The government could also consider setting a clear target date to phase out sales of internal combustion engine (ICE) cars, as many developed countries have already done. There are no new ICE car sales as of around 2045 in the APS in China although an earlier phase out is generally possible given the rapid progress in EV deployment and falling battery costs; such an earlier phase out would enable a smoother transition to carbon neutrality by 2060 or the earlier achievement of that target, depending on measures taken in other sectors. The new energy vehicle (NEV) targets set out by China’s Society of Automotive Engineers and endorsed by the State Council, in providing market certainty, are steering private investment towards new powertrains, supply chains and refuelling infrastructure for light-duty vehicles. This is particularly important for the supply of battery metals, which requires long-term planning (see Chapter 4). By setting a date for the phase-out of ICE cars, China could further boost the transition to EVs. China could also consider extending its NEV mandate to electric and fuel cell trucks, drawing lessons in policy design from its own NEV policy schemes, such as the “dual credit” policy and performance-based subsidies, as well as from California’s Advanced Clean Truck Rule, which sets sales mandates for zero-emissions trucks (see the transport section of Chapter 3).
The new “city-cluster” policy, which aims to stimulate R&D and the demonstration of hydrogen production, supply, delivery and use in fuel cell electric vehicles draws on the successes and failures of the “Ten Cities, Thousand Vehicles” programme launched in 2009 to promote EVs. The new policy has been adapted to the characteristics of hydrogen use in transport, notably the stronger near-term market prospects for commercial and heavy-duty vehicles. This policy could anticipate the need to accelerate the development of low-carbon hydrogen supply chains by setting a carbon-intensity ceiling on hydrogen and establishing an ambitious schedule to award points for low-carbon hydrogen.

An Energy Sector Roadmap to Carbon Neutrality in China Chapter 7: Policy considerations
PAGE | 283 IEA,
202
1.
Buildings sector Near-term government decisions on measures to stimulate the deployment of new clean technologies in buildings will be most effective if they focus on decarbonising the entire value chain, taking into account not only buildings but also the energy and infrastructure networks that supply them, as well as wider considerations including the role of the construction sector and urban planning. Such decisions are also likely to bring wider benefits, notably in reducing fuel poverty and improving urban air quality. The phase-out of fossil fuel subsidies will contribute to boosting the uptake of such technologies. Other measures the government could consider include building energy codes and standards, and regulations and incentives for the use of low-carbon gases and building retrofits.
Zero carbon-ready buildings could become the norm before 2030 for both new construction and retrofits. This would require introducing as soon as possible zero carbon-ready building energy codes. Financial incentives that address split incentive barriers (whereby property owners are discouraged from improving the energy efficiency of a rented property as they do not pay the energy bills) and minimise disruption caused by building works can help make such buildings affordable and attractive to owners and occupants. Building energy performance certificates, green lease agreements, green bond financing and pay-as-you-save models could also play a part. The government could also make public buildings zero carbon-ready in the current decade.
Minimum energy performance standards for all major appliances and equipment used in buildings could also be strengthened over the next decade to fully exploit efficiency opportunities and phase out the least efficient products. That would need to take account of the ability of local manufacturers to meet more stringent standards.
Building clean energy infrastructure The energy transition to carbon neutrality will call for substantial investment in new energy infrastructure and upgrades to existing networks, including smart electricity grids, alternative fuel distribution and CO2 transport and storage. The bulk of the investment will be needed for electricity grids, which will need to be modernised and expanded to facilitate the integration of increasing amounts of variable renewables in power generation and to handle increased electricity demand (see Chapter 3). The impending surge in EVs will also create additional needs for recharging infrastructure (including fast-charging facilities) and catenary (overhead) lines on highways for electric trucks or ground-based feed rails for

An Energy Sector Roadmap to Carbon Neutrality in China Chapter 7: Policy considerations
PAGE | 284 IEA,
202
1.
trucks, buses and cars. The current low cost of capital presents a window of opportunity for exploiting opportunities to invest in clean energy infrastructure projects.
Box 7.2 China’s electricity market reforms
China continues to reform its electricity sector, focusing on increasing the role of market forces to reduce operating costs, achieve more cost-reflective prices and enhance environmental performance. More transparent market structures and regulations are an important foundation for increased flexibility, integration of variable renewables and demand-side participation, which will be vital to meeting the country’s carbon neutrality goals.
In 2015, China launched a round of reforms, introducing competitive markets for medium- to long-term energy contracts, spot and ancillary service markets, and electricity retailers. The coverage of these reforms and progress in implementing them varies, with many still at the pilot phase. The share of electricity traded in markets reached 33% in 2020, with trade growing at an annual rate of 2.8%. About four-fifths of trade takes place under medium- and long-term contracts, which are available in all provinces except Tibet (China Electricity Council, 2021).
The universal establishment of spot markets (in day ahead and real time) and trade between provinces are two of the main elements of the strategy to improve the operational efficiency of the electricity system and support the transition to carbon neutrality. In the APS, full economic dispatch through spot trading alone yields around 24% of cost savings and 31% of CO2 emissions savings, by limiting curtailment of variable renewables to 16% by 2035, when wind and solar PV combined provide 33% of total generation. Continuing the current approach to dispatching power would lead to curtailment levels for wind and solar PV of up to 30% by then. The expansion of inter-provincial connections and trade reduce operational costs and emissions further, by 37% and 45% respectively, and bring curtailment down to 3% by 2035, by exploiting flexibility from existing generation and grids, and demand-side response, particularly the short-term storage capacity of the growing fleet of EVs. The combined share of wind and solar PV in electricity reaches then 38%.
These reforms are well underway. Pilot spot markets have been set up and brought into operation in eight provinces – Guangdong, Inner Mongolia, Shanxi, Gansu, Zhejiang, Sichuan, Shandong and Fujian – covering 30% of the population. Pilots in six more provinces are planned for 2021 (Energy Monitor, 2021). All these pilot programmes comply with overall conditions set at the national level by the National Energy Administration, but each has its own unique design decided at the provincial level. In addition, medium- to long-term contracts between regions and

An Energy Sector Roadmap to Carbon Neutrality in China Chapter 7: Policy considerations
PAGE | 285 IEA,
202
1.
an inter-regional spot market for surplus renewable generation were established in 2017. An expansion of inter-regional markets is planned. Creating a complete national or inter-provincial power market will require China to co-ordinate and harmonise the various provincial market designs to ensure that all generators are subject to the same rules on market pricing and dispatch.
Retail market and grid tariff reforms await full implementation. In many provinces, new retail companies can be formed, but the services they can offer are still limited. Clearer rules on grid tariffs, including for distributed energy resources to participate in wholesale or distribution system trading, are needed to encourage the deployment of distributed solar, batteries and demand response. Regulatory reforms for grid operators that rationalise grid use tariffs, which are still under consideration, will have a major impact on the competitiveness of new renewables. New models for grid regulation that redirect incentives from traditional asset ownership to investment in more innovative alternatives and compensate investors that meet results-based and innovation-based targets are currently under trial. These reforms have already helped boost energy efficiency and investment in distributed energy, micro grids and digital technologies that help improve system security and resiliency.
The adoption of alternative fuels, including advanced biofuels, hydrogen, ammonia and hydrogen-based synthetic fuels, in sectors where emissions are otherwise hard to abate will require modifications to existing supply infrastructure and the development of new facilities for their production and distribution. International trade in these fuels would create a need for new ships and terminals. Dedicated refuelling stations will also be needed (see Chapter 4). China’s most recent infrastructure plan, “Outline of the National Comprehensive Three-Dimensional Transportation Network Planning”, was released in February 2021 and focusses on developing an “integrated, innovative, smart, high quality and efficiency-centred” mobility system, involving extensive integration of the transport, information and energy sectors (Central Committee of the Communist Party of China and The State Council, 2021). Extending this plan to the provision of low-carbon fuels to seaports and airports would bolster China’s ability to lead innovation in these sectors.
The large-scale deployment of CCUS depends on the construction of infrastructure to either permanently store CO2 or use it as feedstock for producing fuel or chemicals. This infrastructure needs to be planned across provinces and regions to match sources of emissions with storage sites. The development of infrastructure in industrial clusters, by boosting economies of scale and permitting

An Energy Sector Roadmap to Carbon Neutrality in China Chapter 7: Policy considerations
PAGE | 286 IEA,
202
1.
sharing of transport and storage infrastructure, could help accelerate the uptake of CCUS (see Chapter 4). A national strategy for building and operating CO2 transportation infrastructure, taking account of regional considerations, could provide the basis for future investments, which could be made by public-private partnerships, as proposed by China’s Guidelines on Establishing a Green Financial System (covering all types of clean energy investment). A transmission service operator model for pipelines may be the best approach.
Major investments in district heating networks will also be needed. They include modifications to convert operations to more efficient low-temperature heat and integrate low-carbon energy sources into the supply mix. More energy storage capacity will also be needed for intermittent energy supplies, such as excess heat from certain applications, to ensure continuous heat supply and help power systems meet peak load. Exploiting decarbonised waste heat from industrial facilities, data centers and heat co-generated from thermal and nuclear power plants requires co-ordinated long-term planning at national, provincial and municipal levels. For instance, it is estimated that nuclear reactors located in northern China could generate electricity while providing heat to about 8% of buildings area (about 5 billion square metres [m2]) (Jiang and Hu, 2021). Industrial waste heat recovery could supply space and water heating to another 4 billion m2 (Lin et al., 2021). Nuclear co-generation could enhance energy efficiency by substituting coal in both power plants and household boilers. While such solutions could be deployed in many coastal cities close to existing and planned nuclear and industrial facilities, technical improvements are crucial to reducing distribution losses for the eight provinces that would rely on long distance heat distribution, up to over more than 200 kilometres – the maximum distance that heat can be transported economically today.
Given the large scale of energy networks and the large investment involved, the central and provincial governments are best placed to take the lead in co-ordinating planning processes, providing funding for infrastructure construction, establishing clear regulatory frameworks and ensuring equal and affordable access to infrastructure regardless of regional constraints. Once clean energy infrastructure is in place, it can be a platform for innovation, encouraging new ideas for how to make best use of it, especially if third-party access is guaranteed. The need for new infrastructure however can be a major barrier to adoption if project promoters bear the risks of putting it in place while also bearing the risks of developing other elements of the value chain. The timelines involved in developing new infrastructure as well as the difficulties that often come with large-scale infrastructure projects mean that strategic and early development planning

An Energy Sector Roadmap to Carbon Neutrality in China Chapter 7: Policy considerations
PAGE | 287 IEA,
202
1.
will be essential to ensure economies of scale and to maximise utilisation. The main considerations for policy makers are to:
• Incentivise network owners and operators to adapt and enhance existing enabling infrastructure, i.e. which facilitates the deployment and use of low-carbon technologies by integrating clean energy technologies into existing networks, pipelines and communication systems. China’s carbon neutrality targets could stimulate private investment in this area, supplemented by direct public finance. Existing infrastructure can also be used to test new clean energy technologies and help accelerate their development. Regulated network operators are usually obliged to minimise risk, which reduces their capacity to incorporate new technologies into existing infrastructure, but new regulatory models that encourage experimentation are emerging.
• Mitigate investment risk in new projects by providing some or all of the initial investment. Infrastructure projects are, by nature, highly capital-intensive and large scale. In the APS, they require more than USD 6 trillion (around CNY 40 trillion) of cumulative investment over 2020-2060, more than 80% of which relates to electricity. A total of USD 1.1 trillion (CNY 7.6 trillion) is needed over the current decade alone (see Chapter 2).
• Adopt a holistic approach to infrastructure planning. For example, an infrastructure project to transport hydrogen from western and north-eastern regions to major urban centres could be considered alongside plans to deploy CCUS in order to exploit synergies.
• Identify opportunities to reuse existing infrastructure in the future, including for hydrogen and other low-carbon fuels and CO2 pipelines.

An Energy Sector Roadmap to Carbon Neutrality in China Chapter 7: Policy considerations
PAGE | 288 IEA,
202
1.
Figure 7.3 Cumulative investment in selected energy infrastructure in China in the APS, 2020-2060
IEA, 2021.
Notes: APS = Announced Pledges Scenario; EV = electric vehicles; T&D = transmission and distribution. Investments are undiscounted. Hydrogen transport and distribution includes investment in import, export and liquefaction terminals, as well as pipeline systems.
Electricity-related infrastructure dominates the cumulative capital expenditure on energy infrastructure needed
Fostering clean energy innovation Innovation will be critical to the success of China’s efforts to achieve the carbon neutrality targets. It has demonstrated excellence in improving technologies that were developed elsewhere and taking them to new heights, but, in some key areas of the energy transition, off-the-shelf solutions that can be imported, deployed and
0 100 200 300
2020 -2030
2031 -2060
Transport and distribution
Storage
Refuelling stations
CO2
Billion USD (2019)
Hydrogen
Electricity
0 50 100 150
2020 -2030
2031 -2060
Transport and storage
0 1,200 2,400 3,600 4,800
2020 -2030
2031 -2060
T&D
EV charging stations

An Energy Sector Roadmap to Carbon Neutrality in China Chapter 7: Policy considerations
PAGE | 289 IEA,
202
1.
improved do not yet exist anywhere in the world. Chinese innovation now needs to focus on emerging technologies.
A successful innovation system goes far beyond R&D and incentivises innovators and disruptors through competitive niche markets, infrastructure investment and other regulatory measures. These will require extensive inter-ministerial and inter-provincial co-ordination. Action plans and R&D budgets are being developed under the current FYP. New policy tools, including so-called “bounty systems” and innovation centres, as well as institutionalised evaluation of R&D programme performance against stated objectives, are being introduced (see Chapter 6). These plans and tools should leverage some of the unique features of China’s innovation system.
Given the urgency of the technology challenge for carbon neutrality, the world cannot afford bottlenecks or blind spots in the transfer of ideas and results across sectors, technologies, regions and countries. One task for all governments is to seek to exploit synergies between various technology areas, so that knowledge flows quickly to where it can be used. The Chinese government has successfully supported the establishment of industrial clusters for solar PV R&D and manufacturing, where information and personnel move relatively freely. The same approach could be used for other technologies, for example, to ensure that advances in electrolysis, such as membrane materials, simultaneously inspire developers of batteries, fuel cells, chemical reactors or hydrogen electrolysers. The resulting spillovers are often viewed as a hidden force behind technology innovation, leading to serendipitous leaps in progress.
CCUS CCUS technology is one important area of innovation policy focus. The commercialisation of CCUS requires the combination of several different technologies, all of which operate at large scale. China has more than one major state-owned enterprise (SOE) in all the key industries with expertise relevant to CCUS, namely oil and gas, chemicals, iron and steel production and power generation. CCUS is well suited to the main national science and technology projects – a major innovation tool in China. The central government can help co-ordinate demonstration projects involving multiple entities from various sectors with different incentives. It can also use such projects to test various approaches to help inform a widespread roll out. These are advantages from which most other countries are unable to benefit. But demonstration projects alone are not sufficient to accelerate the pace of innovation for CCUS. The government will also need to:

An Energy Sector Roadmap to Carbon Neutrality in China Chapter 7: Policy considerations
PAGE | 290 IEA,
202
1.
• Further explore potential CO2 storage resources and make the detailed results widely available to potential developers and researchers.
• Look beyond demonstration projects and start to consolidate the large potential markets for rapid scale up by bringing together companies across sectors to explore common challenges and policy mechanisms to support investment.
• Establish the proposed CCUS innovation centre to devise and rapidly validate novel technologies and techniques, especially for CO2 capture, while introducing more competition for R&D funding and access to facilities.
In the case of direct air capture and other carbon dioxide removal technologies, a technology roadmap could help establish common expectations for their deployment in China, as well as technology export opportunities, and identify the best locations and partners for the first major projects. To encourage innovation, universities and research institutes could be given stable funding to pursue research on the fundamental science, while also being offered high profile (and potentially international) annual prizes for the best performers among competing designs.
Low-carbon hydrogen Improving the technology portfolio for hydrogen supply, distribution and use is central to ensuring that investment flows to hydrogen. Like CCUS, hydrogen opportunities cut across multiple sectors and potentially interact with many parts of the energy system, while some of the innovation needs, like large-scale demonstrations and commercial integration with industrial processes, are shared with CCUS. China’s major SOEs in the chemical and steel sub-sectors could be encouraged to play a significant role in steering efforts and creating momentum for the hydrogen research community, as well as channelling efforts to R&D challenges that arise. Commercial-scale projects for industries like steel, ammonia and methanol will help in scaling up low-carbon hydrogen production in the industrial hubs where a significant share of hydrogen demand will be located. This, in turn, can help the development and demonstration of technologies and business models for hydrogen in heavy-duty transport, taking inspiration from the cluster-based model for China’s rapid deployment of light commercial vehicles. To spur innovation in hydrogen technologies, the Chinese government should also consider:
• Establishing demand for the use of low-carbon hydrogen in industrial processes that can “pull” the most competitive solutions into the market, e.g. via mandatory low-carbon hydrogen quotas for refining, steel and ammonia.

An Energy Sector Roadmap to Carbon Neutrality in China Chapter 7: Policy considerations
PAGE | 291 IEA,
202
1.
• Taking a leading role in international and multilateral initiatives and projects to ensure that technological advances and lessons learned are shared to the benefit of all countries.
• Giving higher priority to areas of fundamental research that can improve performance and lower manufacturing costs (including by reducing the reliance on critical materials) for technologies such as electrolysers, fuel cells and hydrogen storage.
• Supporting international efforts to develop harmonised standards and carbon accounting methodologies for hydrogen production, transport and distribution, including through research projects and technology testing.
Heavy industry There is considerable scope for encouraging experimentation through competition among hydrogen, CCUS and electrification – the main technology options for reducing emissions – in heavy industry. Strengths in these technologies vary across provinces, SOEs and private companies. A nationally co-ordinated programme could potentially devolve a significant amount of responsibility to provinces and SOEs to fund the testing of various options as quickly as possible and share the results. This could then inform national standards and regulations, in line with international experience and co-operation. Mechanisms could potentially be found to share some of the future revenues (from taxes, technology licensing and equipment exports) that ultimately result from these R&D efforts with all participants. In addition to supporting R&D projects, the Chinese government could:
• Incentivise manufacturers and their suppliers to set ambitious technology goals and encourage an innovation culture.
• Support fundamental research into potential breakthrough technologies, such as iron ore electrolysis and electrified cement kilns, which are currently at the prototype stage.
• Create an innovation incubator for industrial innovators to protect intellectual property rights and connect them with potential industrial customers and investors. It could also help establish new companies if the new technologies are not a good fit with existing ones.
• Participate in international projects and consortiums on heavy industry decarbonisation, especially in countries where industrial capacity is expanding rapidly, and share the resulting knowledge widely.
An Energy Sector Roadmap to Carbon Neutrality in China Chapter 7: Policy considerations
PAGE | 292 IEA,
202
1.
End-use energy efficiency There is a vast potential market for new energy efficiency technologies – including smart load management, digital verification of savings, heat pumps and standardised retrofit solutions – in China. The primary role of the government in accelerating innovation in these areas is likely to be in ensuring access to capital and business skills for entrepreneurs, setting up regulated markets in which they can compete and flourish, and providing funding for R&D. The co-ordination of municipal or provincial pilot zones for EVs and hydrogen should provide very valuable lessons.
International collaboration Enhanced international collaboration on developing and deploying clean energy technologies will be required to facilitate the transition to carbon neutrality in China and the rest of the world. All countries will benefit from the faster innovation cycles that would result from sharing experiences in bringing new technologies to market and the economies of scale that an acceleration in trade in clean energy technologies would bring. Reaching net zero emissions globally calls for an unprecedented level of international collaboration between governments – for each country, it is a race against time and not a race against each other – as achieving net zero emissions globally will need every country to cross the finish line. Therefore it is not only a matter of all countries participating in efforts to meet the global net zero goal, but also of all countries working together in an effective and mutually beneficial manner. Without collaboration, China will struggle to reach its 2060 carbon neutrality target, just as other countries will struggle to meet their own goals.
International co-operation and collaboration have been critical to the cost reductions seen in the past for many key energy technologies. As well as accelerating knowledge transfer and boosting economies of scale, they can also help align the emergence of demand for new clean energy technologies and fuels in one region with the development of supply in other regions. Additional benefits can come from the potential for creating domestic jobs and industrial capacities, and for strengthening the resilience of supply chains.
Technology standards and innovation programmes are two important areas of international governmental collaboration.
• Standards: The development of international standards could accelerate energy technology development and deployment. Industries that operate in several countries need standardisation to ensure inter-operability and to minimise costs.

An Energy Sector Roadmap to Carbon Neutrality in China Chapter 7: Policy considerations
PAGE | 293 IEA,
202
1.
Progress on innovation and clean energy technology deployment in sectors such as heavy industry has been inhibited in the past by uncoordinated national policies and a lack of internationally agreed standards.
• Innovation and diffusion: Clean energy R&D and patenting is currently concentrated in the United States, Europe, Japan, Korea and China, which together accounted for about 90% of all clean energy patents in the 2014-2018 period. China alone accounted for slightly less than 10%. Progress towards net zero emissions would be boosted by moving swiftly to extend experience and knowledge of clean energy technologies in countries that are not involved in their initial development, and by funding first-of-a-kind demonstration projects in different countries. International programmes to fund demonstration projects, especially in sectors where technologies are large and complex, would accelerate the innovation process.
China’s gigantic steel, cement and chemicals companies have the potential to both learn from and contribute to the efforts of their foreign counterparts. Industrial technology transfer between countries and companies is a concrete example of this type of collaboration. China has demonstrated its adeptness in this area in the past. Similar opportunities will emerge in low emissions industrial technology and infrastructure development, with China likely to be a key centre of expertise, given its huge industry sector. The creation of specific zones across the country for the development and deployment of certain technologies, including EVs and hydrogen production, is facilitating knowledge exchange. The benefits of knowledge and application spill overs can be maximised by exploiting synergies internationally, while international networks for knowledge exchange, including public-private partnerships and cross-sector coalitions, can help avoid duplication of efforts and identify gaps not yet addressed.
The Chinese government should continue to encourage international co-operation and collaboration on clean energy innovation. It has achieved notable success in collaborations with the EU Horizon 2020 research and innovation programme, the UK-China CCUS Centre and the export of technology developed in China to CCUS projects abroad, e.g., the CTSCo project in Australia. International partnerships to advance technologies at early stages of development could be particularly beneficial. Existing multilateral platforms for co-operation provide a sound basis for deepening collaboration. The IEA Technology Collaboration Programme (TCP), which supports the work of independent, international groups of experts in 38 technology areas, is the world’s foremost collaborative programme. In 2020, China joined three additional IEA TCPs to reach overall participation of 27 out of 38 possible TCPs, including eight out of nine in the renewable energy and hydrogen categories. This corresponds to the fifth-highest

An Energy Sector Roadmap to Carbon Neutrality in China Chapter 7: Policy considerations
PAGE | 294 IEA,
202
1.
participation in the TCPs, behind the United States (36), Japan (30), Korea (29) and Canada (27), and ahead of the European Commission (24). Other platforms include the Clean Energy Ministerial, a community of the world’s largest countries, companies and international experts, and Mission Innovation, a global initiative to catalyse action and investment in clean energy R&D and demonstration.

An Energy Sector Roadmap to Carbon Neutrality in China Chapter 7: Policy considerations
PAGE | 295 IEA,
202
1.
References Central Committee of the Communist Party of China and The State Council (2021), Outline of
the National Comprehensive Three-Dimensional Transportation Network Planning, https://mp.weixin.qq.com/s/OX7uQ6KrrCkuNlTonh9OWw?scene=1&clicktime=1614491908&enterid=1614491908&from=groupmessage&isappinstalled=0.
China Electricity Council (2021), Analysis and Forecast of China Power Demand-Supply Situation 2020-2021, https://english.cec.org.cn/detail/index.html?3-1128, accessed July 2021.
Energy Monitor (2021), China: Energy market reforms offer no quick fix for renewables, https://energymonitor.ai/policy/market-design/china-energy-market-reforms-offer-no-quick-fix-for-renewables, accessed July 2021.
IEA (International Energy Agency) (2021a), Net Zero by 2050: A Roadmap for the Global Energy Sector, https://www.iea.org/reports/net-zero-by-2050.
IEA (2021b), The Role of China’s ETS in Power Sector Decarbonisation, https://www.iea.org/reports/the-role-of-chinas-ets-in-power-sector-decarbonisation.
IEA (2020a), Energy Technology Perspectives, https://www.iea.org/reports/energy-technology-perspectives-2020.
IEA (2020b), Implementing Effective Emissions Trading Systems, https://www.iea.org/reports/implementing-effective-emissions-trading-systems.
IEA (2020c), Energy Technology Perspectives: Special Report on Clean Energy Innovation, https://www.iea.org/reports/clean-energyinnovation.
IEA (2017), District Energy Systems in China, https://iea.blob.core.windows.net/assets/590cc681-349a-4a55-9d3f-609eff6cde0b/DistrictEnergySystemsinChina.pdf.
IPCC (Intergovernmental Panel on Climate Change) (2021), Climate Change 2021: The Physical Science Basis. Contribution of Working Group I to the Sixth Assessment Report of the Intergovernmental Panel on Climate Change, Masson-Delmotte, V. et al. (eds.), Cambridge University Press.
Jian, Y. and S. Hu (2021), Paths to carbon neutrality in China's building sector, Heating Ventilating & Air Conditioning, Vol. 51, pp. 1-13, https://kns.cnki.net/kcms/detail/detail.aspx?dbcode=CJFD&dbname=CJFDLAST2021&filename=NTKT202105001&uniplatform=NZKPT&v=y%25mmd2FuRqjaG8P1LosJ5eUF1LqrjS81shlS0%25mmd2BC%25mmd2BqiM7DPtQMzDnBx2es%25mmd2FU9wjtjaXVQU.
Lin, F. et al. (2021), Low carbon district heating in China in 2025- a district heating mode with low grade waste heat as heat source, Energy, Vol 230, https://doi.org/10.1016/j.energy.2021.120765.
MEE (Ministry of Ecology and Environment) (2021), 碳排放权交易管理办法(试行)[Interim Rules for Carbon Emissions Trading Management], http://www.mee.gov.cn/xxgk2018/xxgk/xxgk02/202101/t20210105_816131.html, accessed 10 January 2021.

An Energy Sector Roadmap to Carbon Neutrality in China Chapter 7: Policy considerations
PAGE | 296 IEA,
202
1.
MoT and NDRC (Ministry of Transport and National Development and Reform Commission) (2020), 《绿色出行创建行动方案》的通知 [Notice of Green Travel Creation Action Plan], http://www.gov.cn/zhengce/zhengceku/2020-07/26/content_5530095.htm, accessed 29 July 2021.
World Bank (2021a), Carbon Pricing Dashboard, https://carbonpricingdashboard.worldbank.org/, accessed 30 August 2021.
World Bank (2021b), State and Trends of Carbon Pricing 2021, https://openknowledge.worldbank.org/handle/10986/35620 License: CC BY 3.0 IGO.
Xuelan Z., L. Weichi and G. Xingyue (2021), The Guangdong carbon emissions trading scheme: Progress, challenges and trends, Discussion Paper, Harvard Project on Climate Agreements, https://www.belfercenter.org/publication/guangdong-carbon-emissions-trading-scheme-progress-challenges-and-trends.

An Energy Sector Roadmap to Carbon Neutrality in China Annexes
PAGE | 297 IEA,
202
1.
General annex
Abbreviations and acronyms ACCA21 Administrative Centre for China’s Agenda 21 AEM anion exchange membrane APS Announced Pledges Scenario AQI air quality index ATS Accelerated Transition Scenario ATJ alcohol-to-jet BECCS bioenergy with carbon capture and storage BTHS Beijing-Tianjin-Hebei and surrounding areas BEV battery electric vehicle BF-BOF blast furnace basic oxygen furnace BIO-FT biomass gasification using the Fischer-Tropsch process BOF basic oxygen furnace BTX benzene, toluene and mixed xylenes CAPEX capital expenditure CCUS carbon capture, utilisation and storage CCS carbon capture and storage CCU carbon capture and utilisation CGN China General Nuclear Power Group CH4 Methane CHP combined heat and power CNNC China National Nuclear Corporation CNPC China National Petroleum Corporation CNR catalytic naphtha reforming CNY Chinese Yuan CO carbon monoxide CO2 carbon dioxide COMAC Commercial Aircraft Corporation of China COP Conference of Parties CORSIA Carbon Offsetting and Reduction Scheme for International Aviation DAC direct air capture DC direct current DRI direct reduced iron DWT deadweight-tonne EAF electric arc furnace

An Energy Sector Roadmap to Carbon Neutrality in China Annexes
PAGE | 298 IEA,
202
1.
EOR enhanced oil recovery ESP electrostatic precipitator ETP Energy Technology Perspectives ETS Emissions Trading System EV electric vehicle FAME fatty acid methyl esters FCEV fuel cell electric vehicle FYP Five-Year Plan GDP gross domestic product GHG greenhouse gas H2 hydrogen HC hydrocarbon HEFA hydroprocessed esters and fatty acids HEV hybrid electric vehicle HFC hydrofluorocarbon HRS hydrogen refuelling station HSR high-speed rail HVAC heating, ventilation and air conditioning HVC high-value chemical HVO hydrotreated vegetable oil IATA International Air Transport Association ICAO International Civil Aviation Organisation ICE internal combustion engine ICEV internal combustion engine vehicle IEA International Energy Agency IPCC Intergovernmental Panel on Climate Change ISGAN International Smart Grid Action Network LCOH levelised cost of hydrogen LED light-emitting diode LFP lithium ferro-phosphate LPG liquefied petroleum gas Li lithium Li-ion lithium-ion MEE Ministry of Ecology and Environment MEPS Minimum Energy Performance Standards MFA Ministry of Foreign Affairs MIIT Ministry of Industry and Information Technology MNR Ministry of Natural Resources MOF Ministry of Finance MOST Ministry of Science and Technology

An Energy Sector Roadmap to Carbon Neutrality in China Annexes
PAGE | 299 IEA,
202
1.
MoT Ministry of Transport MSW municipal solid waste MTO methanol to olefins N2O nitrous oxide NDC nationally determined contribution NDRC National Development and Reform Commission NEA National Energy Administration NEV new energy vehicle NH3 ammonia NICE National Institute of Clean and Low-Carbon Energy NOx nitrogen oxide NREL National Renewable Energy Laboratory OEM original equipment manufacturer OPEX operating expenditure PERIC China State Shipbuilding Corporation PEM polymer electrolyte membrane PGM platinum group metal PHEV plug-in hybrid electric vehicle PPP purchasing power parity PM particulate matter PM2.5 particulate matter with a diameter less than 2.5 micrometres PV photovoltaic R&D research and development RD&D research, development and demonstration SAF sustainable aviation fuel S&T science and technology SASAC State-owned Assets Supervision and Adminstration Commission of the
State Council SEER seasonal energy efficiency ratio SGCC State Grid Corporation of China SO2 sulphur dioxide SOE state-owned enterprise SOEC solid oxide electrolyser cell SPIC State Power Investment Corporation STEPS Stated Policies Scenario SUV sport utility vehicle T&D transmission and distribution TCP Technology Collaboration Programme TFC total final consumption UCO used cooking oil

An Energy Sector Roadmap to Carbon Neutrality in China Annexes
PAGE | 300 IEA,
202
1.
UN United Nations USC ultra-supercritical USD United States dollar V1G vehicle from grid V2G vehicle to grid VC venture capital VRE variable renewables VSD variable speed drive WEM IEA World Energy Model WHO World Health Organisation WTE waste-to-energy ZCR zero-carbon-ready ZCRB zero-carbon-ready building
Units of measure °C degree Celsius bcm billion cubic metre EJ exajoule g CO2/kWh gramme CO2 per kilowatt hour GJ gigajoule GJ/t gigajoule per tonne Gt gigatonne Gtce gigatonne of coal equivalent Gt CO2 gigatonne of carbon dioxide Gt CO2eq gigatonne of carbon dioxide equivalent GW gigawatt GWh gigawatt hour kb/d thousand barrels per day kg kilogramme km kilometre kt kilotonne kt/yr kilotonne per year kt CO2/yr kilotonne of carbon dioxide per year kW kilowatt kWe kilowatt electric kWH2 kilowatt hydrogen kWh kilowatt hour kWh/yr kilowatt hour per year m2 square metre

An Energy Sector Roadmap to Carbon Neutrality in China Annexes
PAGE | 301 IEA,
202
1.
mb/d million barrels per day MJ megajoule mg/m3 milligram per cubic metre Mt million tonne Mt/yr million tonnes per year Mtce million tonnes of coal equivalent Mt CO2 million tonnes of carbon dioxide Mt CH4 million tonnes of methane MW megawatt MWh megawatt-hour PJ petajoules pkm passenger kilometre ppm parts per million tce tonne of coal equivalent t CO2 tonne of carbon dioxide t CO2/cap tonne of carbon dioxide per capita t CO2/MWh tonne of carbon dioxide per megawatt-hour t CO2/t tonne of carbon dioxide per tonne tonne-km tonne-kilometre TWh terawatt-hour μg/m3 micrometres per cubic metre USD/t United States dollar per tonne

Copyright © 2021: International Energy Agency (IEA)
This work reflects the views of the IEA Secretariat but does not necessarily reflect those of the IEA’s individual Member countries or of any particular funder or collaborator. The work does not constitute professional advice on any specific issue or situation. The IEA makes no representation or warranty, express or implied, in respect of the work’s contents (including its completeness or accuracy) and shall not be responsible for any use of, or reliance on, the work.
For further information, please contact: [email protected]
Rights and Permissions
This work is available under the Creative Commons Attribution-NonCommercial- 3.0 IGO licence (CC BY-NC 3.0 IGO) https://creativecommons.org/licenses/by-nc/3.0/igo/. You are free to copy and redistribute the material and to adapt, remix, transform, and build upon the material provided the use is for non-commercial purposes, under the following conditions:
Attribution: Please cite the work as follows: International Energy Agency (IEA), 2021. All rights reserved. An Energy Sector Roadmap to Carbon Neutrality in China. CC BY-NC 3.0 IGO
Third-party content: The OECD/IEA does not necessarily own each component of the content contained within the work. Therefore, neither the OECD nor the IEA warrant that the use of any third-party owned individual component or part contained in the work will not infringe on the rights of those third parties. The risk of claims resulting from such infringement rests solely with you. If you wish to re-use a component of the work, it is your responsibility to determine whether permission is needed for that re-use and to obtain permission from the copyright owner. Examples of components can include, but are not limited to, tables, figures, or images.
Translations—If you create a translation of this work, please add the following disclaimer along with the attribution: This is an unofficial translation of the work from the English language. The translation was not created by the IEA, which takes no responsibility for the accuracy or completeness of this translation.
Adaptations—If you create an adaptation of this work, please add the following disclaimer along with the attribution: This is an adaptation of an original work by the IEA. Views and opinions expressed in the adaptation are the sole responsibility of the author or authors of the adaptation and do not necessarily reflect the views or policy of the IEA Secretariat, IEA Member countries.
Any queries on rights and licenses, including subsidiary rights, except as indicated below, should be addressed to: [email protected].

This document and any map included herein are without prejudice to the status of or sovereignty over any territory, to the delimitation of international frontiers and boundaries and to the name of any territory, city or area.IEA Publications
International Energy Agency
Website: www.iea.org
Contact information: www.iea.org/about/contact
Typeset in France by IEA – September 2021
Cover design: IEA
Photo credits: © Getty Images