A roadmap to sustainability - Charleston-SC.gov
187
A roadmap to sustainability
-
Upload
khangminh22 -
Category
Documents
-
view
1 -
download
0
Transcript of A roadmap to sustainability - Charleston-SC.gov

A roadmap to sustainability

What is a Sustainability Plan? Sustainability is understood to mean the ability of current generations to meet its needs while not diminishing the ability of future generations to meet their own needs. The goal of the Charleston Green Plan is to continue Charleston’s shift to a more sustainable and profitable future for both current and future generations. A sustainability plan is a comprehensive roadmap, with many options, for the City to embrace sustainable practices: through its internal operations, its leadership by example and its education and inspiration of its citizens. It lays a foundation for the City’s efforts. The Green Committee presents this plan for the purpose of offering advice, information and strategies to achieve the City’s and its citizen’s goals of more jobs and less pollution. A team of dedicated City staff served on each subcommittee and offered technical and practical advice on the impact and value of the plan’s recommendations. An inventory of the municipal and community-wide operations and emissions accompanies the plan, as well as a proposed metrics for measuring the City’s efforts. The Charleston Green Plan is not an ordinance, nor will the plan ever be an ordinance or law.

A Message from the Chair Dear Mayor Riley, City Council Members and the Charleston Community, This message is written to clearly state to current readers as well as future council members, staff and citizens the background and the goals of the Charleston Green Plan. City Council’s vision to create a comprehensive plan for climate protection and sustainability resulted in their formation of the Green Committee. The Charleston Green Plan could have been produced by City staff or a hired consultant over a few months like many other City plans. However, that approach would have missed important opportunities to engage and educate the community, including educating City staff. Also, it would have missed out on important input, information and debate that evolved over the two year process. The Charleston Green Committee in collaboration with the City chose an open, participative process that required more time and energy, but the final product hopes to be more useful and comprehensive. It is not only about the plan itself; it is about the conversation that created it.
Creation
In April 2007, City Council authorized the Green Committee’s creation to do the following*:
“Provide leadership and practical solutions to ensure a prosperous community that will sustain healthy lives for our citizens and a healthy earth;”
“Work with City government, business groups, nonprofit organizations and other
partners to protect and enhance Charleston’s distinctive environmental quality and livability;” and
“To inspire individuals and organizations - both within and outside City government -
to take actions that help make Charleston a model of healthy and ecologically sustainable living.”
The Green Committee was tasked with the following responsibilities: • “creating a local action plan on climate change;” • “advising the City in the continued implementation of the City’s local action plan on
climate change;” • “monitoring progress;” • “identifying grant opportunities and other funding
streams;” • “collaborating with established City initiatives …
to promote an integrated community-wide approach to sustainability;”
• “sponsoring and promote sustainability education and … events;” and
• “promoting regional cooperation.” The Green Committee was charged with developing civic policy recommendations in the following four general categories of sustainability: 1. Energy Conservation and Efficiency / Renewable
Energy 2. Greenhouse Gas Reductions / Alternative Fuels
and Technologies 3. Green Building and Development Programs 4. Sustainability Leadership and Education Programs
Evolution
The Charleston Green Committee has met 26 times as a committee, advertising each meeting to the public. Our subcommittees have met an additional 120 times, also advertising each meeting to the public and welcoming new ideas and a growing membership. The Committee has enthusiastically studied what other sustainable cities are doing. At these open meetings, the subcommittees debated and drafted their recommendations. We diligently studied other cities’ sustainability plans, which helped us to craft our recommendations using the best practices of other cities and using the subcommittee members’ knowledge and experiences of Charleston. New ideas continue to emerge. City Council members have carefully studied the plan and have proposed suggestions and amendments*. These suggestions and many others have been carefully evaluated by the
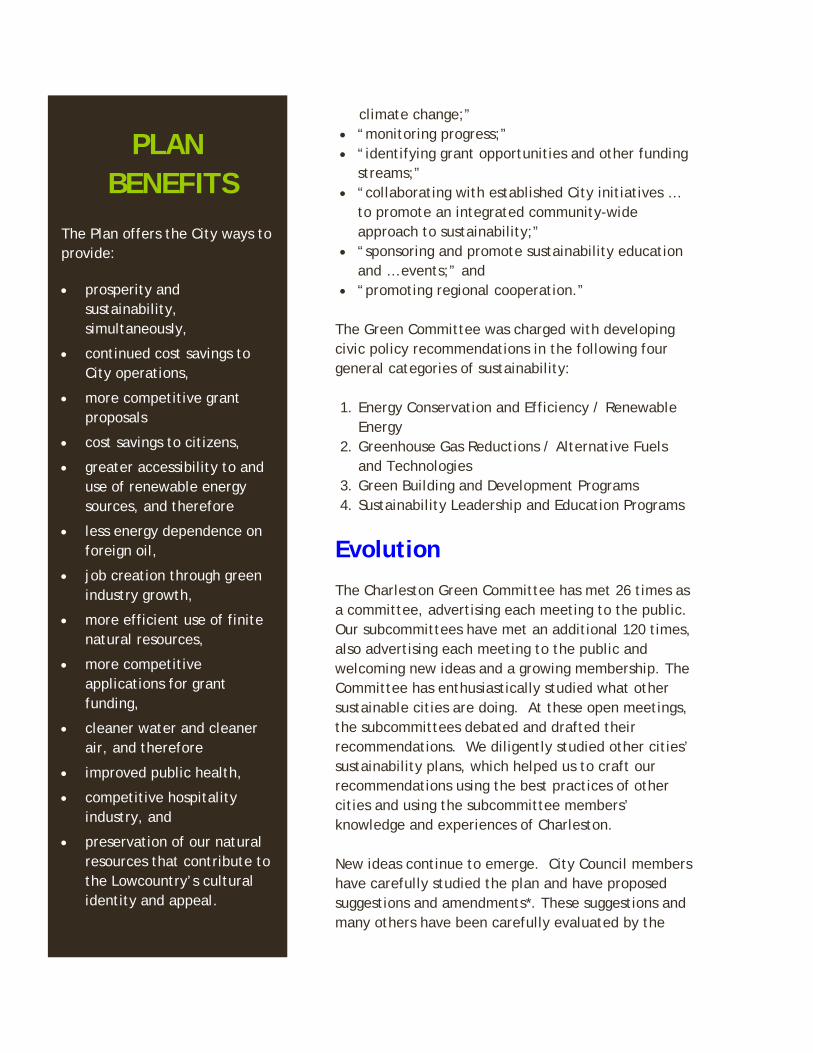
PLAN BENEFITS
The Plan offers the City ways to provide:
• prosperity and sustainability, simultaneously,
• continued cost savings to City operations,
• more competitive grant proposals
• cost savings to citizens,
• greater accessibility to and use of renewable energy sources, and therefore
• less energy dependence on foreign oil,
• job creation through green industry growth,
• more efficient use of finite natural resources,
• more competitive applications for grant funding,
• cleaner water and cleaner air, and therefore
• improved public health,
• competitive hospitality industry, and
• preservation of our natural resources that contribute to the Lowcountry’s cultural identity and appeal.
Green Committee, and several clarifications and amendments have been made based on these on new insights*. This plan uses the best available research and analysis of 2009. A strategy option identified in 2009 may become obsolete in ten years. As new information and technology emerges, the best actions may change. The goals, however, will remain the same. In the future, specific actions from the plan can be presented to City Council in the form of ordinances or other City initiatives. For each initiative, cost-benefit analyses will need to be balanced against issues of public health, safety and our quality of life. With this evaluation, initiatives can be adopted and the plan can come to life steadily and responsibly.
Guide
The Charleston Green Plan is a guide for Charleston to use to work toward their goal: to continue Charleston’s shift to a more sustainable and profitable future. The Charleston Green Committee, a group of about a thousand citizens representing small businesses, nonprofits, academia, technology, tourism and citizens of many ages and backgrounds, stand ready to support the City in the lifelong learning process and responsible implementation of the Charleston Green Plan. We plan to share our progress with the entire community and with other cities worldwide. As the first city in South Carolina to create a sustainability plan, Charleston can lead the way to a more sustainable tomorrow. Thank you for the opportunity to help in the creation of the Charleston Green Plan. Sincerely, James Meadors Chairman, Charleston Green Committee President, Meadors Construction, Inc.
* The 2007 City Council letter on the creation of the Green Committee which includes the City of Charleston Green Committee Initiative defining the Green Committee's tasks and charge and a letter from two Council Members about proposed changes to the Green Plan are included in the Appendix.
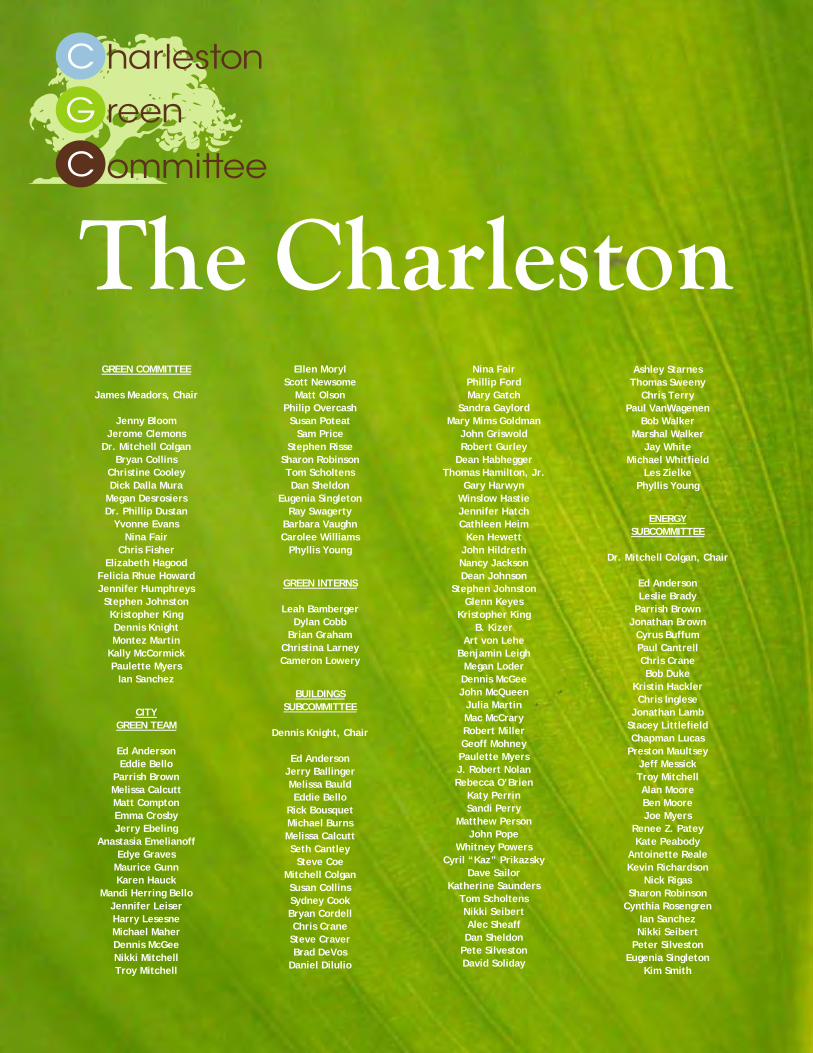
The Charleston GREEN COMMITTEE
James Meadors, Chair
Jenny Bloom
Jerome Clemons Dr. Mitchell Colgan
Bryan Collins Christine Cooley Dick Dalla Mura
Megan Desrosiers Dr. Phillip Dustan
Yvonne Evans Nina Fair
Chris Fisher Elizabeth Hagood
Felicia Rhue Howard Jennifer Humphreys Stephen Johnston Kristopher King Dennis Knight Montez Martin
Kally McCormick Paulette Myers
Ian Sanchez
CITY
GREEN TEAM
Ed Anderson Eddie Bello
Parrish Brown Melissa Calcutt Matt Compton Emma Crosby Jerry Ebeling
Anastasia Emelianoff Edye Graves
Maurice Gunn Karen Hauck
Mandi Herring Bello Jennifer Leiser Harry Lesesne Michael Maher Dennis McGee Nikki Mitchell Troy Mitchell
Ellen Moryl Scott Newsome
Matt Olson Philip Overcash
Susan Poteat Sam Price
Stephen Risse Sharon Robinson Tom Scholtens Dan Sheldon
Eugenia Singleton Ray Swagerty
Barbara Vaughn Carolee Williams
Phyllis Young
GREEN INTERNS
Leah Bamberger
Dylan Cobb Brian Graham
Christina Larney Cameron Lowery
BUILDINGS
SUBCOMMITTEE
Dennis Knight, Chair
Ed Anderson Jerry Ballinger Melissa Bauld Eddie Bello
Rick Bousquet Michael Burns Melissa Calcutt Seth Cantley
Steve Coe Mitchell Colgan Susan Collins Sydney Cook Bryan Cordell Chris Crane Steve Craver Brad DeVos
Daniel Dilulio
Nina Fair Phillip Ford Mary Gatch
Sandra Gaylord Mary Mims Goldman
John Griswold Robert Gurley
Dean Habhegger Thomas Hamilton, Jr.
Gary Harwyn Winslow Hastie Jennifer Hatch Cathleen Heim
Ken Hewett John Hildreth Nancy Jackson Dean Johnson
Stephen Johnston Glenn Keyes
Kristopher King B. Kizer
Art von Lehe Benjamin Leigh
Megan Loder Dennis McGee John McQueen
Julia Martin Mac McCrary Robert Miller Geoff Mohney Paulette Myers J. Robert Nolan Rebecca O’Brien
Katy Perrin Sandi Perry
Matthew Person John Pope
Whitney Powers Cyril “Kaz” Prikazsky
Dave Sailor Katherine Saunders
Tom Scholtens Nikki Seibert Alec Sheaff Dan Sheldon
Pete Silveston David Soliday
Ashley Starnes Thomas Sweeny
Chris Terry Paul VanWagenen
Bob Walker Marshal Walker
Jay White Michael Whitfield
Les Zielke Phyllis Young
ENERGY
SUBCOMMITTEE
Dr. Mitchell Colgan, Chair
Ed Anderson Leslie Brady
Parrish Brown Jonathan Brown
Cyrus Buffum Paul Cantrell Chris Crane Bob Duke
Kristin Hackler Chris Inglese
Jonathan Lamb Stacey Littlefield Chapman Lucas
Preston Maultsey Jeff Messick Troy Mitchell Alan Moore Ben Moore Joe Myers
Renee Z. Patey Kate Peabody
Antoinette Reale Kevin Richardson
Nick Rigas Sharon Robinson
Cynthia Rosengren Ian Sanchez Nikki Seibert
Peter Silveston Eugenia Singleton
Kim Smith

Green Committee J.C. Sutton
Thomas Sweeny Art von Lehe
LAND USE & PLANNING
SUBCOMMITTEE
Elizabeth Hagood, Chair
Rick Bickerstaff Eve Blossom
Rick Bousquet Maurice Brown Brandon Call
Alys Campaign Bryan Collins Emma Crosby Dena Davis Phil Dustan Rich Estes
Steve Gavel Fran Green-Henty
Mandi Herring Bello Beth Huntley
Paige King Cameron Lowery Nina Marshtein
Josh Martin Joel McKellar
James Meadors Atom Miller
Robert Miller Nikki Mitchell Alan Moore
Paulette Myers Philip Overcash
Renee Patey Legare Porcher
Mayo Read Jack Richardson Michelle Sinkler
Pat Sullivan John Tarkany
Peter Tecklenburg Wynne Thomas
TRANSPORATION SUBCOMMITTEE
Jennifer Humphreys, Chair
Jeannie Adame
Mary Akers Jerry Ballinger
Ledlie Bell Billy Blackburn Ryan Bollinger
Jim Brown Parrish Brown George Buell Cyrus Buffum
Bethany Burgee Jeff Burns
Burton Callicott Andy Cohen Charles Cole Randy Cook Frank Curti
Dick Dalla Mura Pat Davis Rick Day
Megan Desrosiers Katherina Diemar
Anastasia Emelianoff Yvonne Evans Joe Fersner Charles Fox
Vonie Gilreath Jennifer Hatch Lesley Jones Martin Jones
Don Keep Jonathan Lamb Art von Lehe
Kally McCormick James Meadors
David Moyer Frank Newham Scott Newsome
Jason Oakes Nelson Ohl
Philip Overcash Renee Z. Patey
Sandi Perry James Poch
Robert Prioleau Anna Richardson
Matt Silveston Fritz Stine
Justin Sutton Peter Tecklenburg
Rob Turkewitz Katie Zimmerman
RECYCLING & WASTE
MANAGEMENT SUBCOMMITTEE
Christine Cooley, Chair
Alec Cooley Benjamin Blanks Jerome Clemons Laura Coolidge Hamilton Davis Dan Dickison Chris Fisher Drew Franyo
Elton Gonzales Jennifer Hatch
Tim Hoover Neil Hudelson
Jerry Hunt Megan Kanski Art von Lehe Shawn McKay Eric Melaro
Mike Metzler Rebecca O'Brien
Renee Patey Liz Pectol
Michael Pectol Susan Poteat
Sam Price Helen Rose Susie Shafel
Maureen Sheridan Kieran Whelan Justin Whitney
Peter Zalka Katie Zimmerman
EDUCATION SUBCOMMITTEE
Jenny Bloom, Chair
Yve Assad Ledlie Bell
Terry Bell-Aby Susan Collins Brad Devos
Dick Dalla Mura Dan Dickison Joe Dukes
Yvonne Evans Nina Fair
Dominick Giordano Beth Huntley
Stacy Littlefield Doug Mackenzie
Shawn McKay Renee Patey
Cynthia Rosengren Ian Sanchez Libby Smith Pat Sullivan
Barbara Vaughn Bob Walker Liza Ward
Suzan Whelan Peter Zalka
PROJECT MANAGERS
Terry Bell-Aby
Meadors Construction
Renee Patey Sustainability Institute
Carolee Williams
City of Charleston
CONTENTS Introduction..................................................... 1 Measuring Emissions.......................................... 15 Better Buildings............................................. .. 23 Cleaner Energy................................................. 41 Sustainable Communities.................................... 59 Improved Transportation..................................... 85 Zero Waste.....................................................109 Green Education..............................................133 Moving Forward...............................................135 Special Thanks................................................ 141 Green Glossary................................................ 145 Endnotes....................................................... 153 Appendix.......................................................163
• Resource: Historic Structures and Sustainability • Earth Day Resolution: The First Measures • 2007 Letter: Mayor Riley to City Council on Charleston Green Committee Creation • 2010 Letter: Two Council members to Green Committee on Charleston Green Plan
"Never doubt that a small group of thoughtful, committed citizens can change the world. Indeed, it's the only thing that ever has."
-Margaret Mead

“In the global effort to protect our environment, the first step starts at home.”
Mayor Joseph P. Riley, Jr.

he lush lands of the Lowcountry with its complex network of estuaries and wetlands and rich
biodiversity has long drawn people to the Charleston area. For centuries, the native inhabitants of the Charleston area found abundant natural resources, and their communities prospered in relative harmony with nature. Before the Civil War, wealth from rice, lumber, and trade transformed Charleston into a prosperous community. Today, the abandoned rice fields attract wildlife, and Charleston’s wealth is preserved in its historic buildings and landscape. Charleston’s history is intertwined with the lushness of the Lowcountry environment, and this historical reliance on the environment has lead to a culture of preservation and a respect for nature. As a consequence, we live in a beautiful environment where wild places abound. Charleston is the home to ancient trees, dolphins, endangered birds, bald eagles, rich wetlands, coastal forests, sea turtles nesting on the beaches, and lush gardens. Historic preservation and environmental conservation
draw people to the Lowcountry, swelling Charleston’s population. Population pressure for more land and resources and global changes have compelled Charleston’s citizens to develop a sustainability plan to meet these challenges.
Ordinary Heroes
This document is the work of 800 local people who want Charleston to have cleaner, greener and more sustainable choices for all who work, live and play in the Holy City. For the past two years, citizens and City staffers have worked together to assess the needs, priorities and opportunities for Charleston to pursue a greener path. Here, they offer their consensus about practical, achievable ways for the City to grow and develop sustainably, minimizing negative impacts on natural resources, quality of life, and Charleston’s unique character. Changes recommended at the City level will, in turn, make it easier for residents to drive less, recycle more, save money, and conserve energy at home and at work. It’s not about convincing average citizens to do more than they can reasonably do. It’s about 800 people committed to living sustainably becoming 8,000 people, and then
Insulating our homes is a simple act that can have a big impact
...actions that seem heroic
today will seem routine
tomorrow.
Walking children to school can be a quality of life and health benefit
2

80,000. When municipal systems provide enough support, actions that seem heroic today will seem routine tomorrow. Sustainable development is illustrated every day in cities across the country. Residents of Grand Rapids, Michigan now get 20% of their electricity from renewable sources.1 San Francisco residents toss 400 tons of food scraps and yard clippings into a separate “green waste” pickup each day, to become compost and enter back into the natural environment.2 And Charlotte residents were so eager to use a new light rail line that within a few months daily ridership was nearly double what officials expected.3 Sustainability is a Charleston tradition. We may not have been using the word “sustainable” for long, but Charleston has been at the forefront of this movement since 1931, when the City passed the nation’s first historic preservation ordinance. There is no difference, really, between Charleston’s longstanding preservation ethic and the “reduce, reuse, recycle” mantra of today’s sustainability movement.
The City of Charleston, founded more than three
“If they have a choice, most people do the right thing.”
Ian Sanchez, Director, Lowcountry Environmental
Education Program & Green Committee member
“Prosperity and sustainability go hand in hand.”
Mayor Joseph P. Riley, Jr. City of Charleston
centuries ago, has withstood fire, hurricanes, wars, and earthquakes. We’ve overcome our harshest challenges through the creativity and determination of thousands of ordinary heroes. With the leadership and support of City government, it will become simple and practical – indeed, second nature – for Charleston residents to help their City meet the greatest challenge of the 21st century -- becoming a sustainable community.
3
Message from the Mayor
As a member of the Climate Protection Task Force of the U.S. Conference of Mayors, it is my privilege to be connected to national and international efforts in which top scientists, engineers, economists, physicians, policy makers, and other experts pool their skills to address global climate protection and sustainability issues. In 2007, City Council decided that Charleston needed its own think tank to address these issues at the local level. Though Council originally appointed 22 citizens and business leaders to create this plan, imagine our surprise and satisfaction when hundreds more people joined this group, bringing many new skills to the table. This is the beginning of a much larger movement. Just as 20th century Charlestonians are remembered for preserving our magnificent buildings, 21st century Charlestonians will be remembered for protecting this region’s landscape and natural systems. Charleston’s 21st century residents will also make their mark on history by creating and fueling a vibrant “green economy.” Multiple studies show that tens of thousands of new jobs can be created in South Carolina by investing in energy conservation and renewable energy. I challenge my fellow citizens to make Charleston a national leader in the effort to create green jobs. Here as elsewhere, prosperity and sustainability go hand in hand. For myself and for City Council, I want to thank the hundreds of passionate and tireless volunteers who created this plan. Truly, in the global effort to protect the natural systems that sustain us, the first step starts at home. Sincerely, Mayor Joseph P. Riley, Jr.
4

The Big Picture
Human induced global changes touch every aspect of our world and alter the earth’s chemical and physical cycles. These changes to the earth’s biogeochemistry are causing global temperatures to rise and altering nutrient cycles that we depend on for our food and water. To prevent continued damage to the earth’s ecosystems and to preserve the Lowcountry environment, climate protection and sustainable development require our urgent attention. Because of the global nature of the problems facing Charleston, our citizens must act with others throughout the world to effectively protect our community and other communities undergoing unwanted environmental changes. In 2007, the Intergovernmental Panel on Climate Change (IPCC) issued its latest report on the state of the world’s climate that concluded, with better than 90% confidence, that human activity has caused most of the observed climate change within the last fifty years.4 The overwhelming scientific evidence shows that
temperatures are rising; that permafrost is thawing; that glaciers, icecaps, snow pack, and sea ice are melting; that sea level is rising; and that storm events, including hurricanes are becoming more severe.5 The significance of these scientific findings, presented by 1,250 authors and 2,500 reviewers from 130 countries, forced nations to face up to the need to put policies into place to reduce the projected rise in greenhouse gases and the concurrent increase in global temperatures. The rate and the degree of climate change will depend on the extent to which we decrease global emissions of carbon dioxide and other heat-trapping gases.6 No reputable scientific society has disputed the IPCC’s conclusions,7 and the Committee won the Nobel Peace Prize for the quality of its work on these issues. Global climate change will alter rain patterns causing both an increase in flooding and drought events, which would make potable water increasingly scarce in many parts of the world and decrease the productivity of croplands. Increasing temperature and changing precipitation patterns will dramatically alter terrestrial
21st CENTURY TRENDS &
PHENOMENA
Intergovernmental Panel on Climate Change (IPCC) calculates:
>99% -virtual certainty that
overall temperature will continue to rise and hot days and nights will be warmer and more frequent over most land areas globally.
>90% -strong likelihood that
there will be more warm spells, heat waves, and heavier and more frequent precipitation events over most areas globally
>66% -likelihood that there
will be an increase in area affected by droughts, more intense hurricane activity, and an increased incidence of extreme high sea level
5

WHAT ARE GREENHOUSE
GASES?
Greenhouse gases enable short-wave radiation from the sun to enter the earth’s atmosphere, but these same gases absorb long-wave energy that reradiates from the earth’s surface, warming the earth’s atmosphere. This process is analogous to the warming of the car’s interior when the windows are closed on a warm day. Throughout earth’s 4.5 billion year history, greenhouse gases, such as carbon
dioxide and methane, have warmed our planet, enabling liquid water to form and life to flourish. Before the widespread burning of fossils fuels carbon dioxide levels were about 284 parts per million. Afterward, carbon dioxide concentration rose to its present value of 358 parts per million. Since 1850, this 35% increase in greenhouse gases has caused global atmospheric temperatures to rise 2 to 3 degrees Farenheit. Future temperature increases depend on how much we reduce global emissions of these gases. If greenhouse emissions are not curtailed average global temperatures could increase 2 to 11.5 degrees Farenheit by 2100.
80% burning of fossil fuels
20%
GHG SOURCES
rapid deforestation & unsustainable agricultural practices
include everything from a new generation of super-efficient household appliances,10 to the possibility of capturing and using waste heat from industries,11 to the burgeoning market for wind energy, which is particularly appropriate for use in South Carolina.12 At the same time, millions of new jobs are projected worldwide as a consequence of climate change13 -- including three million new jobs related to clean energy technology in the US alone.14 As with any great challenge, climate change raises serious concerns, and also creates new opportunities. Both globally and locally, our response to this situation is limited only by our imaginations.
Closer to Home Climate change is expected to have a significant impact in Charleston as well. Average annual temperatures in the region have risen about 2 degrees Fahrenheit since the 1970s. They are projected to rise 4.5 to 9 degrees more by 2080, depending on how much we reduce the global greenhouse gas emissions that are causing temperatures to rise. Moreover, with about 8% less rain each year since the 1970s, droughts in the region
and aquatic ecosystems. Changes to ecosystems will provide opportunities for a new cohort of pests to invade agricultural lands and forests. Rising sea level will adversely impact energy and transportation infrastructure and make many coastal communities uninhabitable. Water scarcity, heat stress, and invasion of new vectors of disease will increase illnesses and have a negative impact on human health. “The projected rapid rate and large amount of climate change over this century will challenge the ability of society and natural systems to adapt.”8 In some cases, plants and animals will not be able to adapt fast enough to the projected climate changes - one million species may become extinct by 2050.9 As serious as climate change is, however, it cannot help but have some positive consequences. Already we are seeing unprecedented levels of international cooperation, effective government, youth leadership, and individual involvement. Further, the threat of climate change is driving exciting advances in technology, and also opening up economic opportunities that were previously unthinkable. These
GHG SOURCES
6
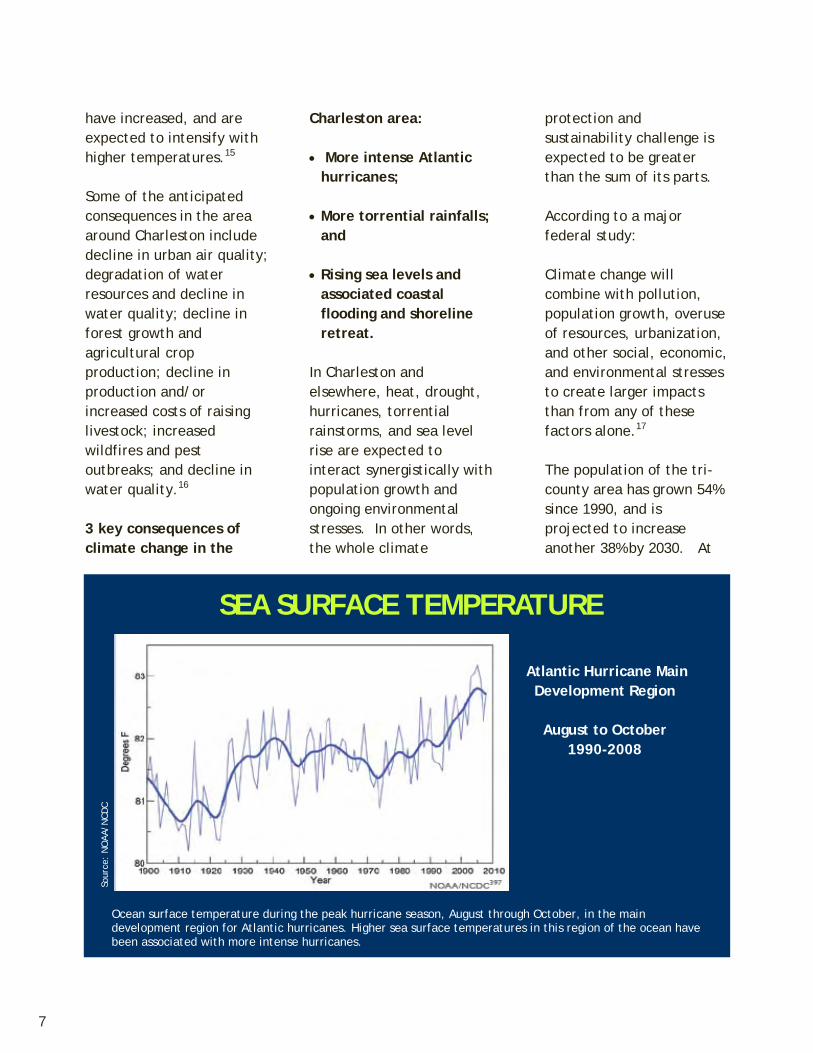
have increased, and are expected to intensify with higher temperatures.15 Some of the anticipated consequences in the area around Charleston include decline in urban air quality; degradation of water resources and decline in water quality; decline in forest growth and agricultural crop production; decline in production and/or increased costs of raising livestock; increased wildfires and pest outbreaks; and decline in water quality.16 3 key consequences of climate change in the
Charleston area: • More intense Atlantic
hurricanes; • More torrential rainfalls;
and • Rising sea levels and
associated coastal flooding and shoreline retreat.
In Charleston and elsewhere, heat, drought, hurricanes, torrential rainstorms, and sea level rise are expected to interact synergistically with population growth and ongoing environmental stresses. In other words, the whole climate
protection and sustainability challenge is expected to be greater than the sum of its parts. According to a major federal study: Climate change will combine with pollution, population growth, overuse of resources, urbanization, and other social, economic, and environmental stresses to create larger impacts than from any of these factors alone.17 The population of the tri-county area has grown 54% since 1990, and is projected to increase another 38% by 2030. At
SEA SURFACE TEMPERATURE
Ocean surface temperature during the peak hurricane season, August through October, in the main development region for Atlantic hurricanes. Higher sea surface temperatures in this region of the ocean have been associated with more intense hurricanes.
Atlantic Hurricane Main Development Region
August to October
1990-2008
Sour
ce:
NO
AA/N
CDC
7

SEA LEVEL RISING
In the past, sea level has risen in Charleston at the rate of 1.03 feet per century18 which is greater than the global rate reported by the IPCC of 0.55 feet per century.19 Between now and the year 2100, global sea level is expected to rise between 1.6 feet and three 3 to 4 feet.20 No predictions for the future are available specifically for Charleston. If current trends continue, local sea level rise will continue to be greater than global sea level rise.
Clearly the City’s low-lying areas are fairly close to sea level. Sea level rise is considered “one of the most certain and most costly consequences of a warming climate.”21 High costs are expected from increased erosion, storm surge damage, and flooding.22 If present trends continue, the annual cost of hurricane damage in the Southeast is expected to rise from $10 billion in 2025 to $422 billion in 2100. The annual cost of real estate losses in the
Southeast is expected to rise from $34 billion in 2025 to $360 billion in 2100.23
Credit: NOAA
Credit: Steve Kirk
A flooded road on the Charleston peninsula
Morris Island (originally established on dry land)
Credit: Yve Assad
Map of the projected effects of sea level rise on the Charleston peninsula.
8

the same time, the Charleston area is experiencing the following environmental stresses: Wetlands Loss: Significant areas of wetlands, which once buffered the coast from storm surges and erosion, have been destroyed. By 1990, South Carolina had lost nearly 30% of its wetlands to development.24 Clean Water: Water quality is also suffering. Roughly one-third of the state’s shellfish beds are consistently closed – due in large part to urbanization and local development standards.25
Clean Air: The American Lung Association (ALA) has raised concerns about air pollution in Charleston County. Particle pollution, which comes mostly from diesel exhaust, is “the most dangerous, and deadly, of the widespread outdoor air pollutants,” according to the ALA. These small toxic particles cause asthma, stroke, cancers, heart disease, and premature death.26 In 2008, physicians with the South Carolina Medical Association and Charleston County Medical Society passed resolutions expressing their concern.27 Heat Island Effect: The
urban heat island effect can make the Charleston peninsula 3 to 6 degrees warmer than surrounding areas on a summer day, with a higher differential at night.28 This occurs because of increased pavement, reduced green space, buildings that absorb heat and block wind, and waste heat from cars and air conditioners. Climate change, then, presents challenges for Charleston and its residents. Fortunately, Charleston has a long tradition of leadership and care for the environment that will help us meet these challenges. Also,
$0
$50
$100
$150
$200
$250
$300
$350
$400
$450
2025 2050 2075 2100Year
HurricaneDamages
RealEstateLosses
Energy-SectorCosts
Source: http://www.nrdc.org/globalWarming/cost/contents.asp
CLIMATE CHANGE PRICE TAG
The graph above illustrates the estimated costs of climate change in terms of damages, real estate losses and energy sector costs. The cost of doing nothing about climate change cannot be measured.
9

Charleston has the opportunity to enjoy the job creation and economic benefits from climate change that are expected in the US and internationally, particularly from development of clean energy resources. Some of these possibilities are discussed below in the chapter on Cleaner Energy.
Charleston Green
In 2005, Mayor Joseph P. Riley Jr. became one of the first in the nation to sign the U.S. Conference of Mayors Climate Protection Agreement. This historic document, signed by 971 mayors nationwide as of September 2009, committed the City to reduce its greenhouse gas emissions by 7% or more below 1990 levels by 2012.29 Even before Riley signed the Climate Protection Agreement, the City began taking significant steps to address climate protection and sustainability. It is a part of the City’s ethic to plant street trees, protect natural buffers, and encourage biking and walking. Charleston has also : • Increased energy
efficiency in City facilities, reducing greenhouse gas emissions and other
pollutants while saving the City $579,000 per year;
• Reduced the police fleet’s consumption of gasoline by more than 10%;
• Synchronized traffic signals to improve flow and reduce idling, which saves more than 340,000 gallons of gasoline per year;
• Replaced 80% of traffic signals with light emitting diodes (LEDs) reducing energy consumption by 66%;
• Guaranteed that future construction on City-owned properties will meet national sustainability standards; and
• Required that all departments recycle and use recycled paper.
While these efforts were underway, City Council decided to integrate its work on climate protection and sustainability into a single, comprehensive plan. City Council asked 22 business, academic, nonprofit, and government leaders to create this plan and advise the City on implementation.30 On October 4, 2007, the Mayor introduced this new “Green Committee” to a standing-room-only audience. The mayor also pledged support
CGC MISSION & CHARGE
Mission: Provide leadership and practical solutions to ensure a prosperous community that will sustain healthy lives for our citizens and a healthy earth. Work to inspire individuals and organizations – both within and outside City government – to take actions and implement polices that help make Charleston a model of health and ecologically sustainable living. Work with City government, business groups, nonprofit organizations, and other partners to protect and enhance Charleston’s distinctive environmental quality and livability. Review and utilize Charleston’s greenhouse gas inventory to provide policy recommendations to exceed the City’s target goal of reducing the City’s greenhouse gas emissions by 7% from its 1990 levels by the year 2012 with a goal based upon specific emission targets in this plan. Charge: Present ongoing recommendations to City Council that will ultimately be incorporated into the comprehensive Plan for Climate Protection and Sustainability for Charleston. Create the Plan for Climate Protection and Sustainability for Charleston with final recommendations to City Council in 2009. Oversee the implementation of the plan. Evaluate Charleston’s Progress for the year 2010 in 2011.
Green Committee Retreat in 2008
10
from numerous City staffers – experts in municipal policy and operations who share a passion for making Charleston more sustainable. Over the next two years, the standing-room-only crowd continued to grow, dividing into separate subcommittees to address Buildings, Communities, Transportation, Energy and Waste. From the beginning education was seen as an aspect that touched all subcommittees and was included in all the subcommittees’ recommendations. As the Green Committee’s
prominence and reach grew, an education subcommittee was formed to engage the community on important information related to each of the other five subcommittees and to serve as the educational and public outreach arm of the Green Committee as a whole. This committee is developing outreach campaigns for the general public, area businesses, and City employees about best practices recommended by the Green Committee. For nearly two years, the Green Committee continued to meet on a monthly basis,
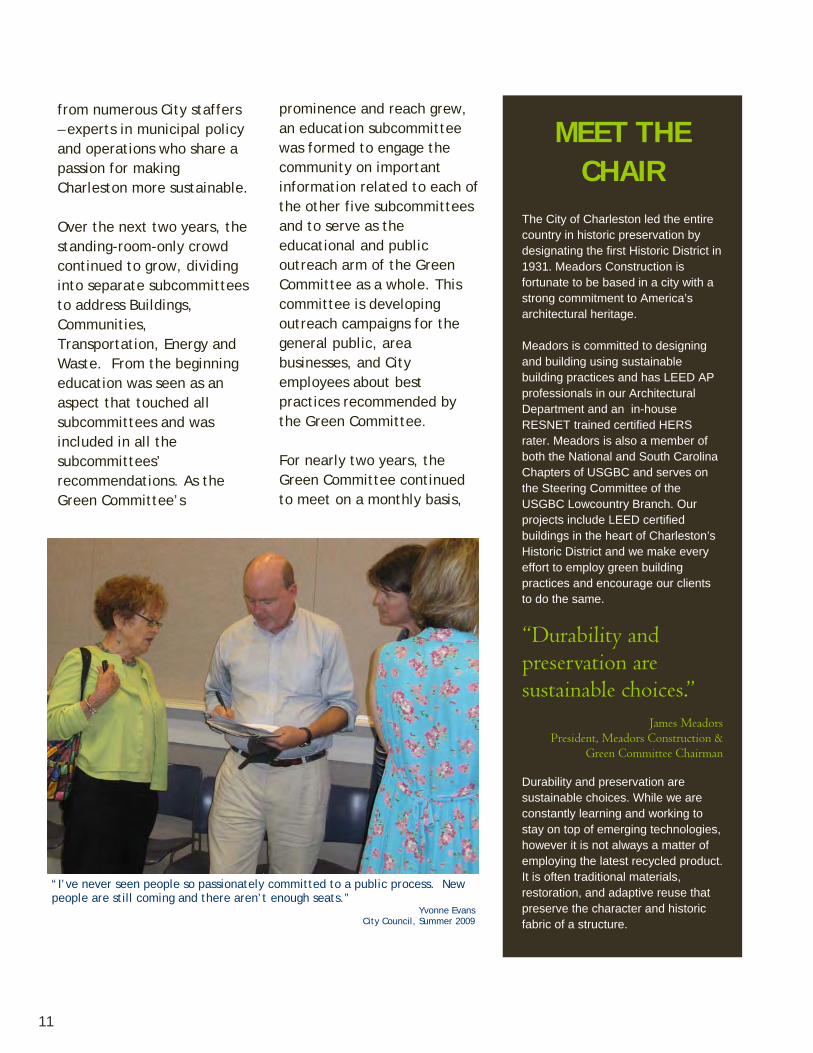
“I’ve never seen people so passionately committed to a public process. New people are still coming and there aren’t enough seats.”
Yvonne Evans City Council, Summer 2009
MEET THE CHAIR
The City of Charleston led the entire country in historic preservation by designating the first Historic District in 1931. Meadors Construction is fortunate to be based in a city with a strong commitment to America’s architectural heritage. Meadors is committed to designing and building using sustainable building practices and has LEED AP professionals in our Architectural Department and an in-house RESNET trained certified HERS rater. Meadors is also a member of both the National and South Carolina Chapters of USGBC and serves on the Steering Committee of the USGBC Lowcountry Branch. Our projects include LEED certified buildings in the heart of Charleston’s Historic District and we make every effort to employ green building practices and encourage our clients to do the same.
“Durability and preservation are sustainable choices.”
James Meadors President, Meadors Construction &
Green Committee Chairman Durability and preservation are sustainable choices. While we are constantly learning and working to stay on top of emerging technologies, however it is not always a matter of employing the latest recycled product. It is often traditional materials, restoration, and adaptive reuse that preserve the character and historic fabric of a structure.
11

MEETING OF MANY MINDS
hosting a variety of experts and industry leaders. These speakers contributed essential information, helping to localize the issues of climate protection and sustainability. Additional expertise was provided by the Rocky Mountain Institute, which facilitated a daylong workshop; and by International Council for Local Environmental Initiatives’ (ICLEI), which provided a framework for the planning process and software for inventorying greenhouse gases.
The Green Committee synthesized local success stories with national best practices in a way that uniquely reflects the strengths of our community. Green Committee members studied other cities’ climate protection and sustainability plans. They also studied Charleston’s existing planning
and management tools such as the City’s energy efficiency contract with Johnson Controls and Charleston’s Preservation Plan.
All told, more than 6,000 person-hours have been dedicated to this plan by more than 800 representatives of local and regional businesses, agencies, and organizations. More than two dozen City staff members contributed their expertise. Participants were professionally and politically diverse. The process was inclusive, with newcomers continuing to join the group until the plan’s completion. The result is a plan that makes every effort to be both forward-thinking and feasible, and that has already engaged many local stakeholders who will be critical to its implementation.
SCE&G Demand Side Manager talks with fellow Energy Subcommittee member.
Citizens reaching new understandings at a Fall 2009 Green Committee meeting
Green Committee members and City of Charleston staff discuss stormwater management at a 2009 meeting.
“This plan represents an unprecedented meeting of the minds among local scientists, engineers, business leaders, and experienced City staff.”
Dr. Mitchell Colgan College of Charleston, Dept. of Geology & Environmental Sciences &
Green Committee member
12

Charleston 2000 —Comprehensive plan includes planning for sea level rise
1989
City increased energy efficiency saving $579,000 per year
Mayor Riley signs US Conference of Mayors’ Climate Protection Agreement
City of Charleston Inventory— 2002 emissions report
Century V—Comprehensive plan includes maintaining an urban growth boundary
2003 City of Charleston Inventory— 2006 emissions report
2000 2005 2006
CHARLESTON
13

OVER THE YEARS
Charleston Green Committee & Staff Green Team formed
City begins purchasing hybrid & bio-diesel compatible vehicles
City Police Department reduces consumption of gasoline by more than 10%
City synchronizes traffic signals, saving more than 340,000 gallons of gas per year
Earth Day—City Council passes Green Resolution
Green Fair debuts —5,000 people attended a near-zero-waste celebration of sustainable products & services
City Sustainability Director hired
City replaces 80% of traffic signals with LEDs, which reduce energy consumption by 83%
City requires departments to recycle and use recycled paper
2008 2009
City guarantees future construction on City-owned properties will meet “LEED” standards 2007
14
Transportation
40% Buildings & Energy Use
58%
Waste
1.6%
Other
0.3%
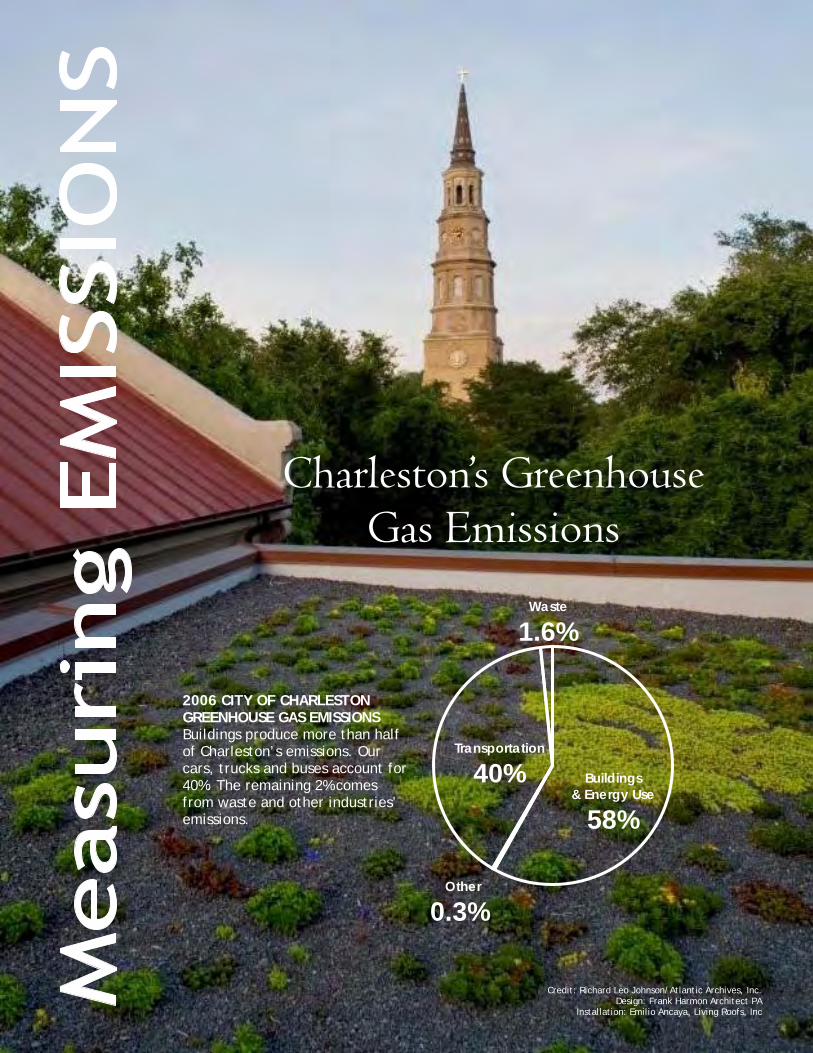
2006 CITY OF CHARLESTON GREENHOUSE GAS EMISSIONS Buildings produce more than half of Charleston’s emissions. Our cars, trucks and buses account for 40%. The remaining 2% comes from waste and other industries’ emissions.
Charleston’s Greenhouse Gas Emissions
Credit: Richard Leo Johnson/Atlantic Archives, Inc. Design: Frank Harmon Architect PA
Installation: Emilio Ancaya, Living Roofs, Inc 15
CONVERTING APPLES TO ORANGES
The analysis of our inventories was developed using the International Council for Local Environmental Initiatives’ (ICLEI) Clean Air and Climate Protection Software. For simplicity, all emissions were converted to the same units:
mtCO2e metric tons of CO2
equivalents Using CO2 equivalents (mtCO2e) for all measurements allows us to easily measure the impact of unrelated activities, such as a comparison of greenhouse gas reductions achieved from increasing fuel efficiency versus composting.
MAKING SENSE OF EMISSIONS
n developing a climate protection and sustainability plan, one of the first tasks for the Green Committee was to
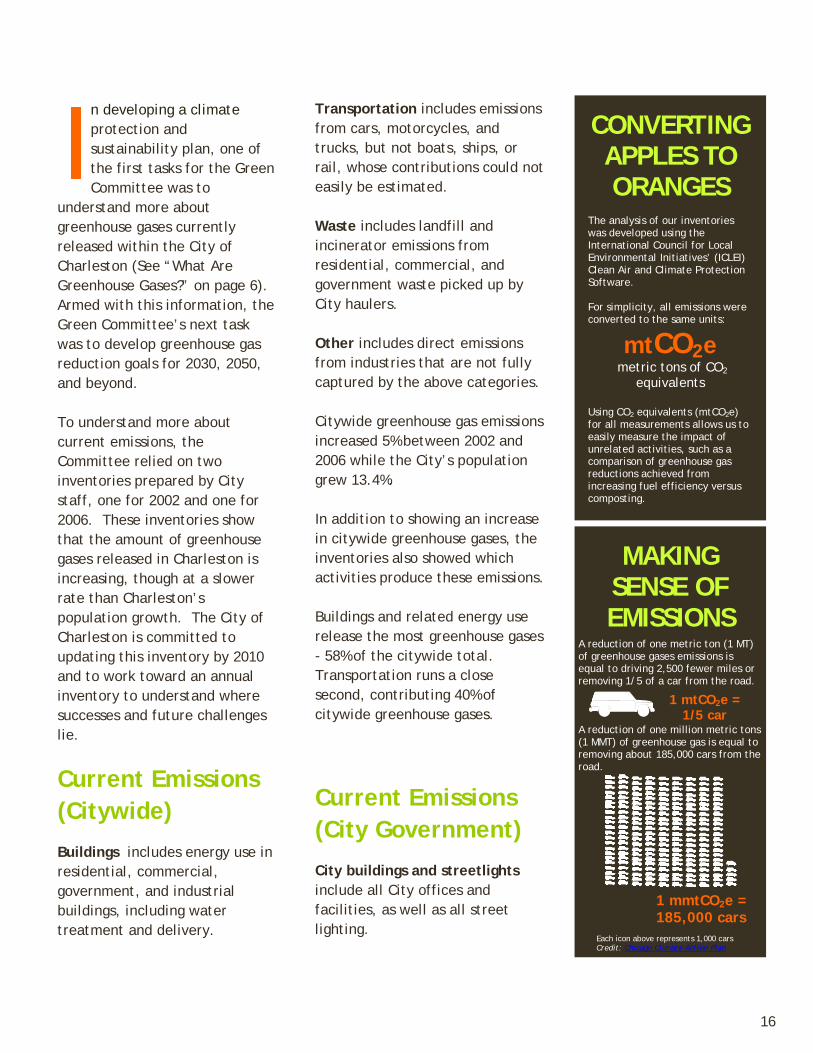
understand more about greenhouse gases currently released within the City of Charleston (See “What Are Greenhouse Gases?” on page 6). Armed with this information, the Green Committee’s next task was to develop greenhouse gas reduction goals for 2030, 2050, and beyond. To understand more about current emissions, the Committee relied on two inventories prepared by City staff, one for 2002 and one for 2006. These inventories show that the amount of greenhouse gases released in Charleston is increasing, though at a slower rate than Charleston’s population growth. The City of Charleston is committed to updating this inventory by 2010 and to work toward an annual inventory to understand where successes and future challenges lie.
Current Emissions (Citywide) Buildings includes energy use in residential, commercial, government, and industrial buildings, including water treatment and delivery.
Transportation includes emissions from cars, motorcycles, and trucks, but not boats, ships, or rail, whose contributions could not easily be estimated. Waste includes landfill and incinerator emissions from residential, commercial, and government waste picked up by City haulers. Other includes direct emissions from industries that are not fully captured by the above categories. Citywide greenhouse gas emissions increased 5% between 2002 and 2006 while the City’s population grew 13.4%. In addition to showing an increase in citywide greenhouse gases, the inventories also showed which activities produce these emissions. Buildings and related energy use release the most greenhouse gases - 58% of the citywide total. Transportation runs a close second, contributing 40% of citywide greenhouse gases.
Current Emissions (City Government)
City buildings and streetlights include all City offices and facilities, as well as all street lighting.
1 mmtCO2e = 185,000 cars
A reduction of one metric ton (1 MT) of greenhouse gases emissions is equal to driving 2,500 fewer miles or removing 1/5 of a car from the road.
A reduction of one million metric tons (1 MMT) of greenhouse gas is equal to removing about 185,000 cars from the road.
1 mtCO2e = 1/5 car
Each icon above represents 1,000 cars Credit: Chicago Climate Action Plan
16

0
1
2
3
1 9 9 0 2 0 0 6 2 0 1 0 2 0 1 4 2 0 1 8 2 0 2 2 2 0Emiss
ions
(Mill
ion
Met
ric To
ns o
f CO
2 e)
2.35 mmtCO2e
2002 2006
2.17 mmtCO2e
2.28 mmtCO2e
2010
City vehicle fleet includes all City cars, trucks, cars, police vehicles and construction equipment. City employee commute includes all employee transportation to and from work. In addition to looking at emissions across the whole community, the inventories also looked specifically at Charleston municipal government emissions. Similar to emissions for the whole city, municipal
government emissions are primarily from buildings and related energy use, with the rest of the emissions mostly related to transportation.
Emissions Goals
The Green Committee’s next task was to determine appropriate goals for reduction of Charleston’s greenhouse gas emissions. The Committee took its cues from goals currently being discussed in the international arena.
In July 2009, the leaders of the G-8 nations reached a historic consensus on ambitious goals to reduce carbon dioxide emissions. For the first time, G-8 leaders explicitly acknowledged the need to limit global warming to no more than two degrees Celsius. All agreed that developed nations should reduce emissions to 80% or more below their 1990 levels or more recent years by 2050. The City’s inventories confirm that Charleston
Char
lest
on E
mis
sion
s Sc
enar
ios
Bu
sine
ss a
s us
ual v
s. E
mis
sion
s Re
duct
ion
Line
s
17

0 2 6 2 0 3 0 2 0 3 4 2 0 3 8 2 0 4 2 2 0 4 6 2 0 5 0
1.52 mmtCO2e 30% below 2002 level
2.64 mmtCO2e
0.38 mmtCO2e 83% below 2002 level
2.94 mmtCO2e
Business-as-usual Projection
2002 Reference
Baseline
Emissions Reduction Goal Line
needs to take decisive action as well. If citywide emissions continue along their current path, Charleston can expect a 25% increase in its greenhouse gas emissions by 2050. The Green Committee recommends that Charleston do its part in lowering emissions by following the global consensus and setting a long term goal to reduce Charleston’s overall emissions by 83% from its 2002 levels by 2050. To achieve this reduction,
the Green Committee recommends a midterm target of 30% reduction below 2002 levels by 2030. Setting a midterm target will allow the City to reevaluate in 2030 to see whether it is on track to reach the 2050 goal. This plan’s key recommendations will produce roughly 99% of the reduction needed to meet the City’s 2030 target. As technology improves and the plan’s recommendations are implemented, 100% of the 2030 goal will be achieved.
CHARLESTON INVENTORY
AND METRICS ONLINE
For more information on the City of Charleston’s emissions inventories and metric calculations please visit:
www.Charleston GreenCommittee.com
or www.CharlestonCity.info
/inventoryandmetrics
18

30% reduction by 2030
AND
83% reduction by 2050
REDUCE EMISSIONS City of Charleston plans to achieve or exceed the following emissions reduction goals, relative to the 2002 baseline measures. This plan identifies quantifiable measures to reach over 99% of the 2030 midterm goal.
19

CHARLESTON GREEN INITIATIVES
Better BUILDINGS Buildings and energy use account for 58% of Charleston’s greenhouse gas emissions. This chapter focuses on making the City’s buildings more energy efficient and more sustainable overall, without sacrificing the historical character of our older structures. Cleaner ENERGY The focus of this chapter is energy efficiency and expanding renewable energy sources. Both are outstanding opportunities for job creation, as well as essential steps toward climate protection and sustainability. Sustainable COMMUNITIES This chapter focuses on designing new development so that it lessens our dependence on cars, allowing us to choose walking, biking, and public transit more often. It also focuses on ways that development can happen with reduced impact on land. Improved TRANSPORTATION Transportation accounts for 40% of the City’s greenhouse gas emissions. This chapter goes beyond community design to discuss Charleston residents’ dependence on cars and strategies for reducing transportation-related emissions. Topics include street design, public transit improvements, and promotion of fuel efficiency and cleaner fuels. Zero WASTE Waste management has an enormous impact on natural resources and climate protection. This chapter shows how Charleston can join cities across the nation in recycling more, composting more, and sending less waste to polluting incinerators and landfills. Green EDUCATION Education is the one element that is integral to every initiative. The Education Subcommittee develops public outreach and educational efforts for other subcommittees as well as new initiatives that serve the greater purpose of the Green Committee.
5.91 7.1 9.6 11.1 11.2
24.519.7
28.2
05
1015202530
London
New York
Toronto
San D
iego
San Fr
ancisco
Charlesto
n
Durham
U.S. A
vg.
Met
ric to
ns o
f CO
2e P
er C
ap
ita
COMPARING CITIES AROUND THE WORLD PER CAPITA EMISSIONS COMPARISONS
Sour
ce: 2
006
City
of C
harle
ston
Inve
ntor
y
20

Measuring Success
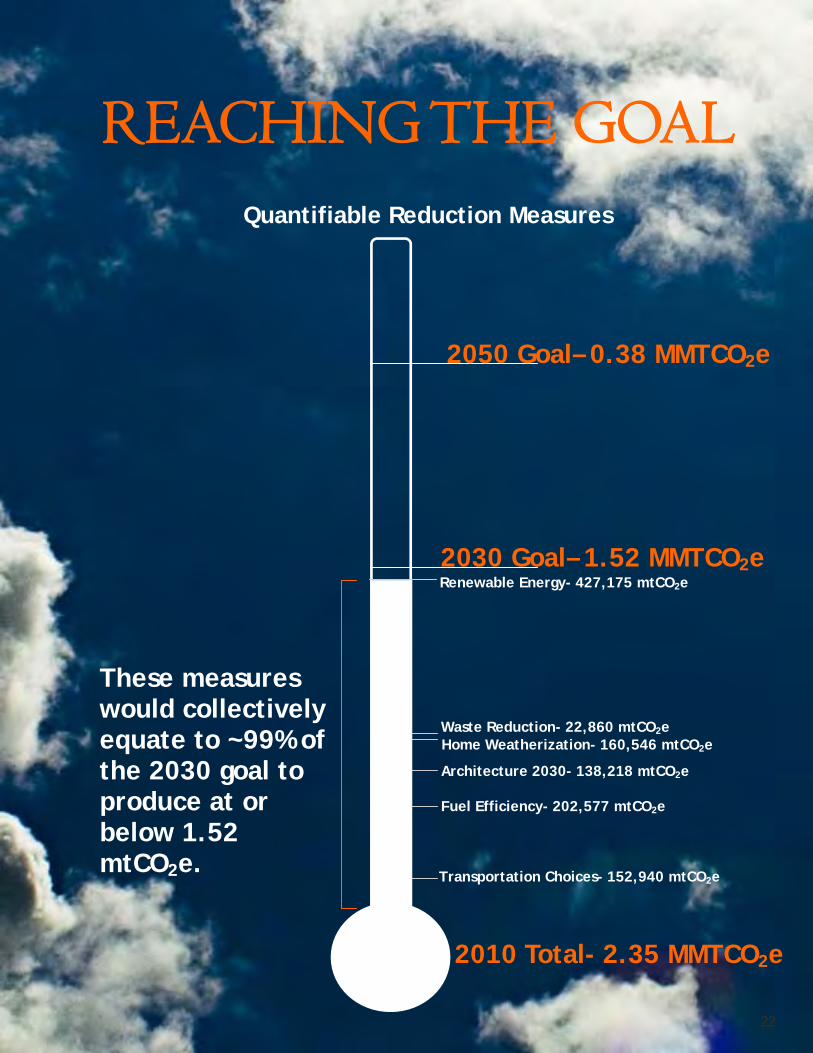
Within the recommendations outlined in the following sections of this plan are several quantifiable strategies that, if achieved, could result in an emissions reduction of 1,104,316 tons of CO2e – 99% of our benchmark goal for 2030. The key strategies listed below form a quantifiable set of actions that include initiatives to change our transportation choices, building practices, the energy efficiency for our homes and vehicles, and waste management practices. These strategies represent several of the overarching goals within the plan, which will impact both quantifiable reductions in emissions as well as quality of life improvements. Many of these implementation strategies are multi-faceted and have an interconnected influence among all of the Green Plan initiatives. Particularly, energy and building initiatives and their impacts are linked. Finally, no recommendations will amount to any carbon reductions without education, understanding, and necessary implementation.
Many important initiatives are not covered because their impacts are less quantifiable. Their unknown potential reductions will take Charleston closer to its climate protection goals.
TRANSPORTATION CHOICES Improved Transportation If Charleston maintains projected 2010 vehicle miles traveled (VMT) level by increasing use of public transportation (CARTA) and/or substitutes walking or biking for driving, it could result in a reduction of 152,940 tons of CO2e in 2030 from projected “business as usual” 2030 level. FUEL EFFICIENCY Improved Transportation If Charleston increases the fuel efficiency of all vehicles by 30% by 2030 (through encouragement of more efficient driving techniques and incentives for purchasing of more efficient vehicles), it could result in a reduction of 202,577 tons of CO2e in 2030 from projected “business as usual” 2030 level. ARCHITECTURE 2030 Better Buildings If Charleston requires that all new City construction and historic renovations adhere to the guidelines of Architecture 2030 Challenge, it could result in a reduction of 10,770 tons of CO2e from projected “business as usual” 2030 level. If Charleston encourages 25% of residential and commercial new construction to adhere to the guidelines of Architecture 2030 Challenge each year, it could result in a reduction of
127,448 tons of CO2e in 2030 from projected “business as usual” 2030 level. HOME WEATHERIZATION Better Buildings If Charleston develops a home weatherization program for homeowners that achieves a 50% reduction in energy usage, it could result in a reduction of 160,546 tons of CO2e in 2030 from projected “business as usual” 2030 level. WASTE REDUCTION Zero Waste If Charleston reduces the waste stream by 50% from the projected 2030 amount, it could result in a reduction of 22,860 tons of CO2e in 2030 from projected “business as usual” 2030 level. RENEWABLE ENERGY Cleaner Energy If Charleston replaces 30% of the total community energy usage with renewable energy, it could result in a reduction of 427,175 tons of CO2e in 2030 from projected “business as usual” 2030 level.
Reaching the Goal
These 6 key strategies could result in a reduction of 1,104,316 tons of CO2e in 2030. This is 99% of the overall goal for an 1,120,000 tons of CO2e reduction in 2030. See page 18 for a web link with more information.
21
2050 Goal– 0.38 MMTCO2e
2030 Goal– 1.52 MMTCO2e Renewable Energy- 427,175 mtCO2e
REACHING THE GOAL
Waste Reduction- 22,860 mtCO2e Home Weatherization- 160,546 mtCO2e
Architecture 2030- 138,218 mtCO2e
Fuel Efficiency- 202,577 mtCO2e
Transportation Choices- 152,940 mtCO2e
Quantifiable Reduction Measures
These measures would collectively equate to ~99% of the 2030 goal to produce at or below 1.52 mtCO2e.
2010 Total- 2.35 MMTCO2e
22

“In my field, green means energy efficient, healthy and safe places to work and live; and, it means jobs, economic stability, clean energy and energy independence.”
Dennis Knight, PE, LEED® AP
Liollio Architecture Subcommittee Chair
Charles Towne Landing Visitor Center with passive solar and many other sustainable features. Credit: Jay White
Design: Liollio Architecture
23
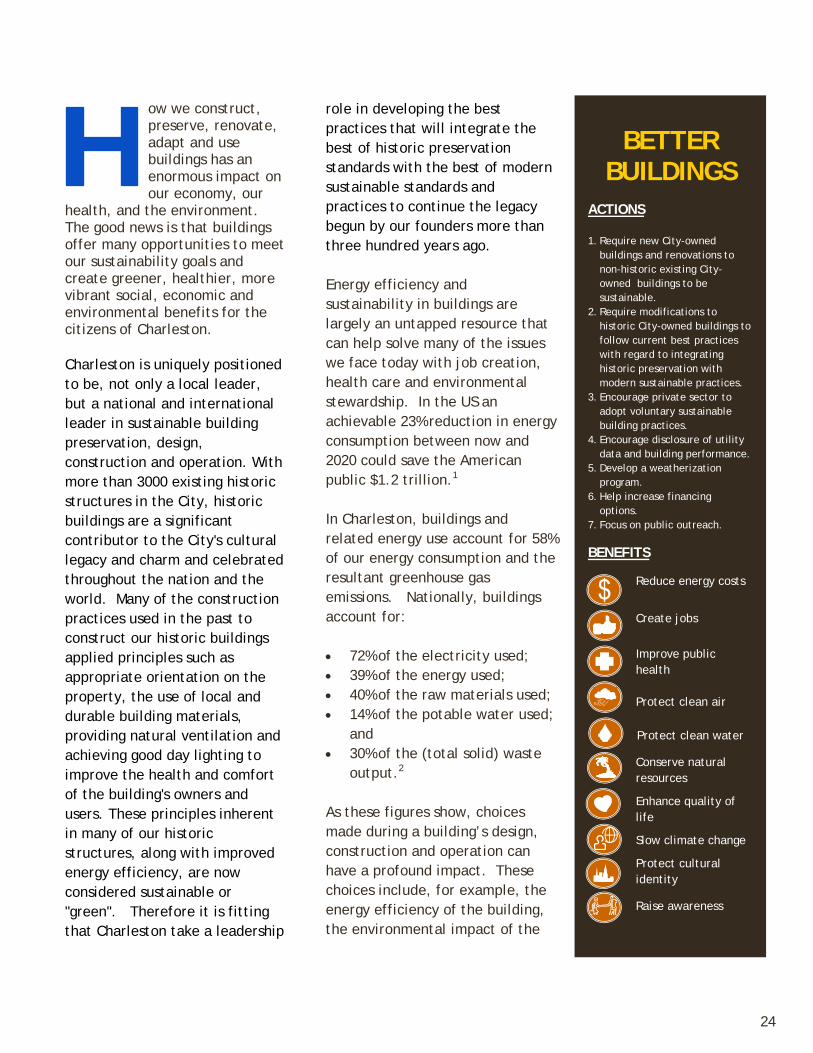
ow we construct, preserve, renovate, adapt and use buildings has an enormous impact on our economy, our
health, and the environment. The good news is that buildings offer many opportunities to meet our sustainability goals and create greener, healthier, more vibrant social, economic and environmental benefits for the citizens of Charleston. Charleston is uniquely positioned to be, not only a local leader, but a national and international leader in sustainable building preservation, design, construction and operation. With more than 3000 existing historic structures in the City, historic buildings are a significant contributor to the City's cultural legacy and charm and celebrated throughout the nation and the world. Many of the construction practices used in the past to construct our historic buildings applied principles such as appropriate orientation on the property, the use of local and durable building materials, providing natural ventilation and achieving good day lighting to improve the health and comfort of the building's owners and users. These principles inherent in many of our historic structures, along with improved energy efficiency, are now considered sustainable or "green". Therefore it is fitting that Charleston take a leadership
role in developing the best practices that will integrate the best of historic preservation standards with the best of modern sustainable standards and practices to continue the legacy begun by our founders more than three hundred years ago. Energy efficiency and sustainability in buildings are largely an untapped resource that can help solve many of the issues we face today with job creation, health care and environmental stewardship. In the US an achievable 23% reduction in energy consumption between now and 2020 could save the American public $1.2 trillion.1 In Charleston, buildings and related energy use account for 58% of our energy consumption and the resultant greenhouse gas emissions. Nationally, buildings account for: • 72% of the electricity used; • 39% of the energy used; • 40% of the raw materials used; • 14% of the potable water used;
and • 30% of the (total solid) waste
output.2
As these figures show, choices made during a building’s design, construction and operation can have a profound impact. These choices include, for example, the energy efficiency of the building, the environmental impact of the
BETTER BUILDINGS
ACTIONS 1. Require new City-owned
buildings and renovations to non-historic existing City-owned buildings to be sustainable.
2. Require modifications to historic City-owned buildings to follow current best practices with regard to integrating historic preservation with modern sustainable practices.
3. Encourage private sector to adopt voluntary sustainable building practices.
4. Encourage disclosure of utility data and building performance.
5. Develop a weatherization program.
6. Help increase financing options.
7. Focus on public outreach. BENEFITS
Reduce energy costs
Create jobs
Improve public health Protect clean air Protect clean water
Conserve natural resources
Enhance quality of life
Slow climate change
Protect cultural identity
Raise awareness
24
materials used, and the amount of water consumed. Buildings, then, have a broad range of impacts as well as the greatest potential for reducing greenhouse gas emissions.
City Commitments The City of Charleston has already made significant commitments in this area. The City owns, or operates long term, nearly 200 facilities totaling roughly 2.5 million square feet. In 2001, City officials decided to spend $3.9 million improving the efficiency of lighting, plumbing, and HVAC systems in many of these buildings. Energy and water efficiency now saves the City nearly $600,000 per year, and has reduced municipal energy and natural gas use by an impressive 17%.
Recently, the City made two more major commitments in this area: LEED Certification: On Earth Day 2008, City Council approved a resolution saying that all new construction on municipal buildings would achieve LEED™ (Leadership in Energy and Environmental Design) certification from the U.S. Green Building Council, beginning with construction planned in 2009. LEED certification is an international building performance rating system that covers every aspect of building design, construction, operation and maintenance. The 2030 Challenge: Also, as a member of the U.S. Conference of Mayors, Mayor Riley adopted the principle of the “2030 Challenge.” The 2030 Challenge encourages that all new buildings, as well as matching amounts of our existing building stock, be constructed and renovated each year to gradually increasing energy performances standards. By 2030, all new buildings and renovated existing buildings should be carbon neutral. In other words, these facilities will use energy that is derived from renewable sources and results in zero emissions of
CARROTS AND STICKS
Nationally, communities are experimenting with various ways to make privately owned buildings more sustainable. Density bonuses and expedited permitting are the most popular. Charlotte, North Carolina goes further, offering permit fee rebates of up to $100,000 for sustainable buildings. Portland, Oregon is getting ready to offer similar incentives to developers who build sustainably. Portland’s program is ingeniously self-sustaining in that it will cover the cost of these incentives by collecting extra fees from developers who just meet minimum building code
requirements.4 Closer to home, Columbia intends to offer permit fee rebates for sustainable building using Energy Efficiency Block Grant funds.
Sustainability Institute Service Day weatherizing low income home
25

One Cool Blow—environmentally friendly, mixed-use development on Charleston’s peninsula
26
greenhouse gases. The potential for nationwide energy savings through the 2030 Challenge is tremendous, since by 2035 three-quarters of U.S. buildings will either have been built or undergone major renovation since 2005.3
Next Steps
Recognizing that Charleston has taken many positive steps in this area, the plan lays out further steps necessary to meet the City’s goals and commitments. City Buildings: The City should commit to continuing to meet higher sustainability standards as they are developed with all municipal buildings. This includes development of separate sustainability guidelines for historic structures. All City facilities should become visible, accessible sources of inspiration and leadership on how to implement sustainable building practices for Charleston
residents, visitors, and other government entities. Private Property Owners: The City should actively encourage private property owners to meet the same high standards of sustainability. Expanding sustainable building in the private sector will require offering meaningful incentives, such as fast-track permit review and waivers of density and other requirements. It will also require effective public relations and community outreach. Energy Efficiency Partnership: The City is currently helping to create a “one stop shop” public-private partnership that will help home and business owners increase energy efficiency through weatherization and conservation measures. Beginning in 2010, this partnership should raise the capital for a revolving loan fund, educate home and business owners, install and insure the improvements, and offer practical financing. This plan calls for the City to remain a key leader, partner, and facilitator in this undertaking. Funding for Sustainable Projects: Financial institutions are often not familiar with sustainable building practices. Nor do they know how to value sustainability over a building’s life cycle. The City should work with lenders, appraisers, investors, and state
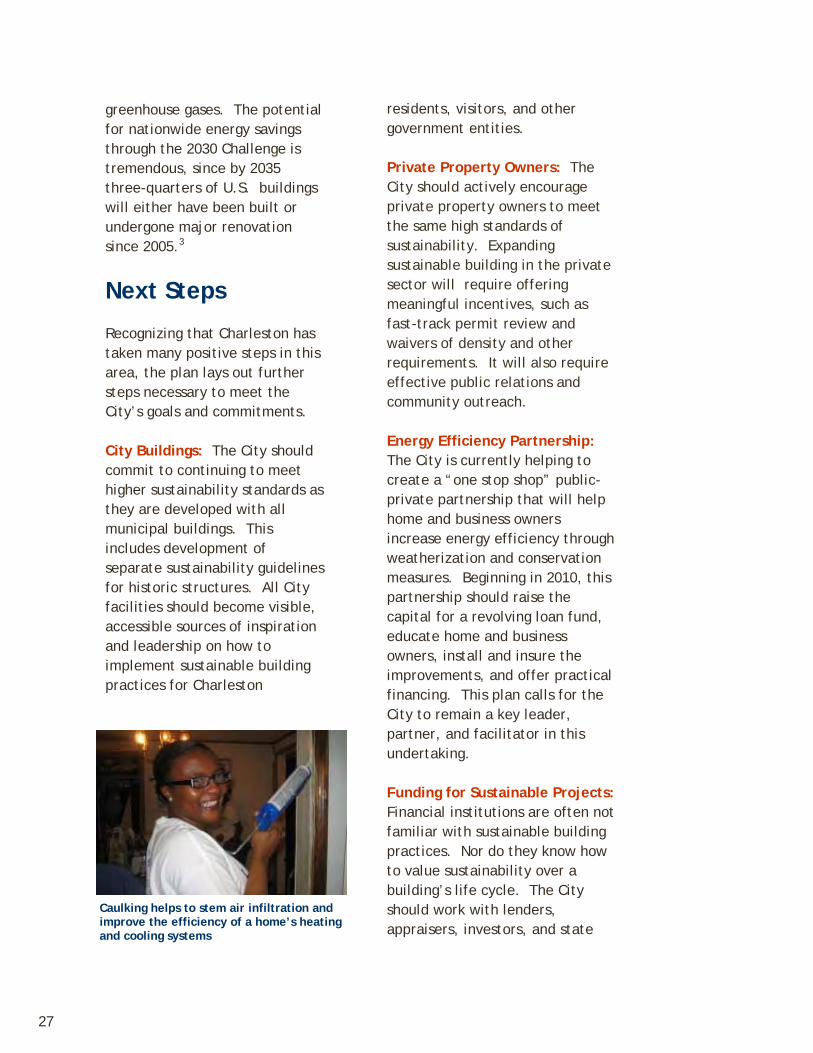
Caulking helps to stem air infiltration and improve the efficiency of a home’s heating and cooling systems
27

and federal agencies to identify and increase financing opportunities, and advertise these opportunities on its website. Historic Preservation and Sustainability: Recognizing the need to address green building practices in historic structures, the Historic Preservation work group of the Buildings Subcommittee developed guidelines for homeowners and businesses to help them make the most energy saving choices. See Appendix.
HALF MOON OUTFITTERS
“Green buildings are one of the most worthwhile investments a business can make.” Beezer Molten is founder and CEO of Half-Moon Outfitters. Molten has integrated green building practices into all Half-Moon facilities, including two Charleston retail stores. The South Windermere store, in particular, is a great example of sustainable reuse and renovation. When an old movie theater was converted into modern retail space, Molten worked with the owner to integrate sustainable features, including advanced insulation and larger windows to capture more natural light. Also, the store’s racks and shelving are made from reused, recycled, and rapidly renewable materials, as well as sustainably harvested woods. “At Half-Moon,” says Molten, “we aspire to be good stewards of the environment as well as good retailers. It’s nice to be recognized for these efforts, but really it’s just what we want to do.”
Native planting helps to reduce irrigation needs and use of chemical fertilizers.
28

WHAT IS GREEN
Solar panels are an increasingly common installation to provide an alternate source of a building’s energy, using a natural and renewable form of energy.
ENERGY Green buildings use energy efficiently and often rely on renewable energy resources. They maximize the sun’s warmth in winter and maximize shade in summer. They are airtight and well-insulated. They also use energy-efficient systems and appliances, and plenty of natural light. When buildings are designed in this way, energy consumption can be reduced by 50% or more at little or no extra cost.5
ENVIRONMENTAL IMPACT Green buildings are made of materials that require less energy to harvest, manufacture, and transport. They often include permeable paving that lets stormwater drain naturally through the soil, rather than pouring it unfiltered into surrounding waterways. They also use landscaping that needs little extra water or maintenance, including native plants. Note: well-designed landscaping can help reduce air conditioning energy consumption by 75%, and can increase property value by as much as 15%.6
RESOURCE CONSERVATION Green buildings often use recycled, reused, or rapidly renewable materials. They also minimize construction waste. Another important feature is efficient plumbing -- which, along with appropriate landscaping, can reduce water use by 30%.7 Sometimes these structures include a “green roof,” which is covered with soil and plants. This reduces energy consumption and stormwater runoff, and can protect
These before and after images of Charles Towne Landing depict the value of siting buildings to achieve their needed purpose and using natural drain-age, lessening site disturbance and protecting natural habitat.
Credit: Liollio Architecture
Credit: Liollio Architecture
Credit: Meadors Construction
29
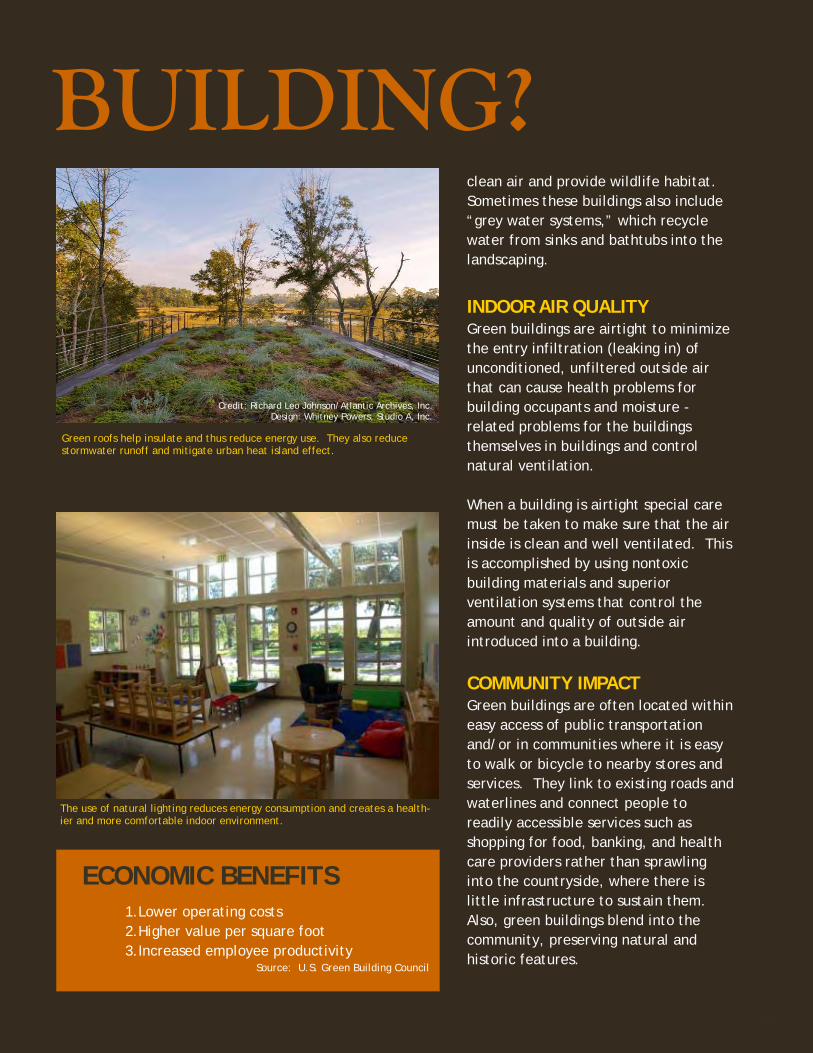
clean air and provide wildlife habitat. Sometimes these buildings also include “grey water systems,” which recycle water from sinks and bathtubs into the landscaping.
INDOOR AIR QUALITY Green buildings are airtight to minimize the entry infiltration (leaking in) of unconditioned, unfiltered outside air that can cause health problems for building occupants and moisture -related problems for the buildings themselves in buildings and control natural ventilation. When a building is airtight special care must be taken to make sure that the air inside is clean and well ventilated. This is accomplished by using nontoxic building materials and superior ventilation systems that control the amount and quality of outside air introduced into a building.
COMMUNITY IMPACT Green buildings are often located within easy access of public transportation and/or in communities where it is easy to walk or bicycle to nearby stores and services. They link to existing roads and waterlines and connect people to readily accessible services such as shopping for food, banking, and health care providers rather than sprawling into the countryside, where there is little infrastructure to sustain them. Also, green buildings blend into the community, preserving natural and historic features.
Green roofs help insulate and thus reduce energy use. They also reduce stormwater runoff and mitigate urban heat island effect.
The use of natural lighting reduces energy consumption and creates a health-ier and more comfortable indoor environment.
ECONOMIC BENEFITS
1.Lower operating costs 2.Higher value per square foot 3.Increased employee productivity
Source: U.S. Green Building Council
BUILDING?
Credit: Richard Leo Johnson/Atlantic Archives, Inc. Design: Whitney Powers, Studio A, Inc.
30

Better Buildings Goals, Actions & Recommendations ACTIONS 1. Require new City-owned
buildings and renovations to non-historic existing City-owned buildings to be sustainable. A. Set specific performance
targets for site selection, water conservation, energy and atmosphere, materials and resources, indoor environmental quality, and operations and maintenance.
B. Meet the energy reduction targets of Architecture 2030.
2. Historic buildings are inherently
sustainable. Require modifications to historic City-owned buildings to follow current best practices with regard to integrating historic preservation with modern sustainable practices.
3. Encourage private sector to adopt
voluntary sustainable building practices.
4. Encourage disclosure of utility data and building performance.
A. Disclose utility data for each City building annually, with comparisons to the previous year and to regional or national benchmarks.
B. Encourage sellers of private property to provide utility data for the previous twelve months.
5. Develop a weatherization program.
6. Help increase financing options. 7. Focus on public outreach.
A. Develop an aggressive, comprehensive, and multi-faceted communications and public education campaign.
B. Implement the campaign in collaboration with local partners, developing Sustainable Design Workshops and Green Building Seminars.
B1. REQUIRE NEW CITY-OWNED BUILDINGS AND RENOVATIONS TO NON-HISTORIC EXISTING CITY-OWNED BUILDINGS TO BE SUSTAINABLE Summary of Specific Issues: On April 22, 2008, Mayor Riley signed into law Resolution 2008-05 supporting a variety of sustainability policies. These included the requirement that all new construction and major renovation of City-owned buildings achieve LEED certification beginning in 2009. By expanding this requirement to include
Quantifiable measures could achieve 27% of 2030 reduction goal (equal to 289,861 mtCO2e). See page 21 for details.
27%
31

all non-historic City buildings, and by requiring additional third party certifications, this system can be used to greater effect. Recommendation/Strategy/Action Plan: A. Expanded Standards: The City should
expand Resolution 2008-05 so that all new City buildings and renovations to non-historic existing City buildings are required to meet a new standard for sustainable building, to be called the “Charleston Sustainable Building Standard.” To minimize administrative effort and expense, the City should not attempt to create and audit a new standard. Instead, the City should use existing third-party certifications such as LEED, Green Globes, EarthCraft, or other suitable standards for all non-historic building construction, operations, and maintenance.
B. The 2030 Challenge: The City should develop the Charleston Sustainable Building Standards so that it can meet “The 2030 Challenge,” issued by an independent nonprofit group called Architecture 2030. Architecture 2030 has asked the global architecture and building community to adopt the following targets: • All new buildings, developments and
major renovations shall be designed to meet a fossil fuel, greenhouse gas, energy consumption performance standard of 50% of the regional (or national) average for that building type.
• An equal amount of existing building
area, at a minimum, shall be renovated annually to meet a fossil fuel, greenhouse gas, energy consumption performance standard of 50% of the regional (or country) average for that building type.
• The fossil fuel reduction standard for all new buildings shall be increased to: 60% in 2010, 70% in 2015, 80% in 2020, 90% in 2025. Carbon-neutral in 2030 (using no fossil-fuel, greenhouse-gas-emitting energy to operate).
• The 2030 challenge targets may be
accomplished by implementing innovative sustainable design strategies, generating on-site renewable power and/or purchasing renewable energy and/or certified renewable energy credits (20% maximum). 1
Inspired by the 2030 Challenge, and based on the currently existing LEED standard for New Construction, we recommend as an example that the following be adopted as the Charleston Sustainable Building Standard: • LEED Gold certification. • Earn 50% of the available points under
the Sustainable Sites credit, including mandatory achievement of both stormwater quality and quantity control points. The Sustainability Director shall have discretion to relax this requirement where the project is developed in an existing dense urban area using high-density urban design criteria established by the City and building footprint occupies 80% of the total property acreage.
• Earn a minimum of 3 out of the 5
available points under the Water Efficiency Credits, including mandatory achievement of the 30% Water Use Reduction point.
• Earn the minimum number of Optimize
Energy Performance points under the
32

Energy and Atmosphere Credit Category necessary to meet the 2030 Challenge target energy use reductions and fossil fuel use reductions.
• Earn an additional 3 points under the
Energy and Atmosphere Credit Category, including mandatory achievement of the Measurement & Verification point.
• Earn 50% of the available points under
the Materials and Resources Credit Category, including mandatory achievement of the 50% Diversion of Construction Waste from Disposal, 10% Recycled Content and 10% Regional Materials points.
• Earn 50% of the available points under
the Indoor Environmental Quality Credit Category, including mandatory achievement of Construction IAQ Management Plan (During Construction and Before Occupancy) points and Low Emitting Materials points for adhesives, sealants, paints, coatings and carpets.
• Earn a minimum of 2 points under the
Innovation and Design Credit Category.
• Noting the many sustainable and life
safety benefits of automatic fire protection systems, require that all City owned new buildings and major renovations (commercial and residential) include them as part of their design and construction.
• Provide Owner’s operations manual
for City record. (Eighty-five percent of the cost of owning a building occurs after the building is constructed or renovated. Having a complete record
of each building’s as-built drawings, operations and maintenance, and care instructions for all equipment, materials, and assemblies can help the City optimize energy efficiency. Maintaining these records permanently, in an electronic format, would benefit the City and any future owners, as well as city planners, building officials, and emergency responders.)
Similar criteria should be established for each LEED rating system and other comparable rating systems being considered or applied. Implementation Responsibilities/Assignments The City Sustainability Director, in conjunction with the Capitol Projects Division Sustainability Project Manager, will develop, update, and maintain the Charleston Sustainable Building Standard, including the establishment of minimum target performance goals under the sustainable sites, development density, public transportation, water efficiency, energy and atmosphere, materials and resources, renewable power, indoor environmental quality, operations, maintenance and procurement categories of those standards. The Charleston Green Committee can assist. All City departments responsible for initiating, developing, permitting, approving and managing existing buildings, new construction and major renovation projects shall meet the Charleston Sustainable Building Standard. Recognizing that the building performance rating systems proposed above can help achieve many recommendations proposed by other subcommittees, the Sustainability Director will coordinate and track these
33
complementary effects when evaluating and reporting on the status and success of this entire plan. Cost to Implement/Net Savings from Implementation: Initial costs to the City should be minimal, including only City staff time. Later costs will depend on the specifics of each project. Additional Benefits: Reduced environmental impact in construction, operation and maintenance of buildings; better indoor air quality; reduced construction waste; higher water efficiency; better use of new and existing materials and resources; economic stability through increased jobs in design, construction, manufacturing, demolition, recycling, waste management and renewable energy industries. Timeline for Implementation: The Sustainability Director should begin developing and implementing the Charleston Sustainable Building Standard upon adoption of this recommendation by the City Council. References: City of Charleston 2002 CO2e inventory.
B2. HISTORIC BUILDINGS ARE INHERENTLY SUSTAINABLE. REQUIRE MODIFICATIONS TO HISTORIC CITY-OWNED BUILDINGS TO FOLLOW CURRENT BEST PRACTICES WITH REGARD TO INTEGRATING HISTORIC PRESERVATION WITH MODERN SUSTAINABLE PRACTICES. Summary of Specific Issues: Founded in 1670 and home to well over 3,000 historic structures, Charleston is one of the oldest and
best preserved and sustained cities in the country. The community’s long-standing practice of historic preservation—not only of individual buildings, but including entire neighborhoods--has made it a national leader in preservation practices. The beauty, quality and character of the existing historic fabric has enabled the city to become one of the most desirable places to live and visit in the world. Historic structures are inherently sustainable; it has often been said that “the greenest building is the one that is already built.” What this refers to is the concept of embodied energy - that is, the total energy used in the building’s lifecycle. The preservation of historic buildings (or any existing buildings) recognizes the value of the existing embodied energy and the resources that have already been expended versus the new consumption of energy and resources, and the waste generated, required to construct an entirely new structure. In addition, because most were built prior to the advent of mechanical systems, many historic structures are excellent examples of sustainable design. They employ passive design features that reduce energy use, promote operator adaptability to changing environmental conditions, and employ quality materials that are provide long life cycles. For these reasons, the continued protection and preservation of Charleston’s historic structures is a high priority. Fortunately, historic buildings can be both preserved and made more environmentally responsible and energy efficient. Recommendation/Strategy/Action Plan: The Charleston Sustainable Building Standard discussed in Recommendations B1 and B3 will not be appropriate for many of Charleston’s historic structures. For historic
34

structures, the City should adopt a “preservation first” approach. At the same time, the City should develop guidelines that suggest how to integrate modern sustainable design and construction practices into the preservation, restoration, and adaptation of historic buildings. The City should commit to following these guidelines, while for other property owners they will be voluntary. The Historic Structures Subcommittee of the Charleston Green Committee has developed specific guidance on this subject. This information may be found in the appendix. Implementation Responsibilities/Assignments: Developing sustainability guidelines for historic structures should be a collaborative effort among: • The City Department of Planning,
Preservation and Sustainability; • Preservation Society of Charleston; • Historic Charleston Foundation; • The National Trust for Historic
Preservation; • Charleston Heritage Foundation; and • Any other local groups with essential
expertise on this subject. The Charleston Green Committee can assist as well. For City-owned properties and facilities, responsibility for following the guidelines will lie with City departments responsible for initiating, developing, permitting, approving and managing existing buildings, new construction and major renovation. For privately owned properties and facilities, please see Recommendation B3. Cost to Implement/Net Savings from Implementation: Initial costs to the City should be minimal, including only City staff time. Later costs will depend on the specifics of each project.
Additional Benefits: Reduced environmental impact in construction, operation and maintenance of buildings; better indoor air quality; reduced construction waste; higher water efficiency; better use of new and existing materials and resources; economic stability through increased jobs in design, construction, manufacturing, demolition, recycling, waste management and renewable energy industries. Timeline for Implementation: The Sustainability Director should begin developing and implementing the guidelines upon adoption of this recommendation by the City Council. References: 113 Calhoun St. Center for Sustainable Living
B3. ENCOURAGE PRIVATE SECTOR TO ADOPT VOLUNTARY SUSTAINABLE BUILDING PRACTICES Summary of Specific Issues: Through Recommendations B1 and B2, the City will take a leadership role in sustainable design and construction. However, approximately 95% of all buildings in Charleston are privately owned. Therefore, the City must encourage owners of private buildings to participate as well. Nationwide, cities are offering such incentives as expedited permit review; density and other bonuses; financial incentives including tax credits and permit fee reductions; and technical and marketing assistance. Recommendation/Strategy/Action Plan: The City should develop
35

incentives to encourage private developers and owners to build, renovate, operate and maintain to the Charleston Sustainable Building Standard (or, for historic structures, the guidelines described in Recommendation B2). Applicants for these incentives will be required to submit evidence of application for, or receipt of, the independent, third-party certifications that underlie the Charleston Sustainable Building Standard. Developers will need to apply for these incentives prior to applying for the underlying third-party certification, during the design phase. Some incentives, then, may be awarded by the City conditional upon receipt of the underlying certification. Owners that satisfy the Charleston Sustainable Building Standard should receive the following incentives: • Recognition: Owners should receive an
emblem which may be affixed to the exterior of the building and will be displayed on the City’s Sustainability webpage in a list of recognized buildings, ideally with a link to the building’s sales listings. Such recognition will not only assist consumers of commercial or residential real estate by providing a unified list of buildings that have satisfied stringent requirements, but will provide a unique marketing opportunity for the owner. The application shall simply be submission of proof that the building has achieved third party certification in accordance with the recommendations set forth in items B1 and/or B2.
• Waivers: The City should offer waivers of
general density, minimum square footage, and parking requirements for such buildings. Such waivers will increase the profitability of such projects, while satisfying other City goals such as increased infill development, reduced
traffic, and increased reliance on public transportation.
• Fast Track Review: Developers of
buildings seeking to satisfy the Charleston Sustainable Building Standard should have special access to a designated City liaison to respond to questions and streamline the City regulatory process. Details can be worked out by the Sustainability Director and City staff.
• Public Transit Bonus: Occupants of
recognized private buildings should receive discounted or free passes for public transportation for 3 years. Such passes will have a minimal cost to the City, but will be a significant marketing advantage to developers. Also, the City should partner with CARTA to encourage “transit-oriented development” by coordinating this incentive with recommendations of the Communities and Transportation sections of this plan. Note that this incentive will help developers meet public transportation access requirements of many of the underlying third party certifications. Encouraging occupants of the recognized buildings to use public transportation will also minimize the effect of increased density and reduced parking.
Estimated Greenhouse Gas Reductions to be Achieved – In Metric Tons/Year: Will vary according to certification levels and other prerequisites required by the City. Implementation Responsibilities/Assignments: The Green Committee will work with the City and the Sustainability Director to develop and implement incentives for private parties and ways to advertise them on the City’s Sustainability webpage.
36
Cost to Implement/Net Savings from Implementation: The costs to the City should be minimal, as follows: City staff time to develop and advertise incentives program; discounted public transit passes; and plaques for sustainable buildings. Additional Benefits: Benefits for individual buildings include better indoor air quality; better return on investment; reduced operating costs; increased building value and occupancy rate; and increased rent ratios. Benefits for the City include reduced environmental impact in construction, operation and maintenance of buildings; reduced construction waste; higher water efficiency; better use of new and existing materials and resources; economic stability through increased jobs in design, construction, manufacturing, demolition, recycling, waste management and renewable energy industries; decreased traffic through improved location and use of public transit; and enhanced marketing of Charleston buildings. Timeline for Implementation The Sustainability Director should commence to develop and implement the Charleston Sustainable Building Standard and system of incentives upon adoption of this recommendation by the City Council.
B4. ENCOURAGE DISCLOSURE OF UTILITY DATA AND BUILDING PERFORMANCE Summary of Specific Issues: Electricity and natural gas produce most of the carbon dioxide emissions for a building. To reduce these emissions, building owners need to use less electricity and natural gas. It is also important to conserve water. Disclosing utility data
allows citizens, building users, and potential buyers to see and compare energy usage, which increases consumer demand for higher performance buildings. This will encourage property owners to improve efficiency and operate buildings conscientiously. Recommendation/Strategy/Action Plan: A. City Disclosure: The City should
commit to annual disclosure of utility data for all its properties. This information should be compared to the previous year’s usage and regional or national databases of buildings with comparable use and occupancy. The format of the report should include the building’s square footage, number of stories, use or occupancy (commercial, residential, mixed use, assembly, storage, etc.), number of occupants, total energy use by utility type (electricity, natural gas, water, and sewer, in the same units used by the utility company), energy use per square foot, total cost by utility type, and percent increase or decrease from the previous year.
B. Disclosure by Sellers: The City
should encourage all sellers of residential and commercial property to provide potential buyers with utility bills or reports for electricity, natural gas, water, and sewer. Seller should disclose this information for at least the previous twelve months before a sales contract becomes binding.
Implementation Responsibilities/Assignments: For City-owned buildings, the Sustainability Director shall develop or purchase an online database for
37

collecting and reporting this data. For privately-owned buildings, it will be the responsibility of the owner to disclose this information. Also, the Sustainability Director should work with state officials to investigate disclosure of utility data by sellers of real property. If this is impossible, the Director will explore other options such as cooperative efforts with sales agents or public education. Cost to Implement/Net Savings from Implementation: There will be minimal cost to the City. Building improvements inspired by it will be up to the owner and funded by the owner. Additional Benefits: Reduces energy use; reduces demand requirements for local power companies; and helps create market forces that encourage sustainable building construction, renovation, operation, and maintenance. Timeline for Implementation: The program should begin for City buildings upon adoption of this recommendation by the City Council. The Sustainability Director should also immediately begin investigating implementation of the private portion, which may take one or two years to implement. References: This recommendation complements Recommendation B3.
B5. DEVELOP A WEATHERIZATION PROGRAM Summary of Specific Issues: More home and business owners would weatherize their buildings if it were easier to calculate the cost savings, access capital, and get the work done. Some qualify for federally-funded weatherization programs, but most do not. Recommendation/Strategy/Action Plan: The City should develop a Home/Business Weatherization Program for those who do not
qualify for federal programs, identifying appropriate lenders, financing options, and service providers. Successful models of these programs exist in many cities, including Milwaukee, Wisconsin and Babylon, New York. Approached as a four-phase program, Phase 1 addresses the fundamentals, such as sealing air leaks, replacing high-energy lighting, and wrapping or upgrading the water heater. Phases 2 to 4 address system upgrades in appliances, HVAC, and windows, doors, and anything else necessary to weatherize the building envelope. Phase 1 of this strategy can be modeled on a similar federal initiative currently in development. Funding can be provided through partnerships with local lenders willing to offer low-cost loans. (See also Recommendation E-2E.) Implementation Responsibilities/Assignments: Once the recommendation is adopted by City Council, it will be the responsibility of the Sustainability Director to develop and implement the program. Heirs’ property circumstances require a partnership with the Center for Heirs’ Property Preservation and similar organizations to overcome the hurdle of unclear title. Energy and Gas Saved Phase 1 saves approximately 10% on energy costs, up to Phase 4 that saves approximately 50%. Cost to Implement/Net Savings from Implementation: The cost to weatherize a building will vary depending on the age, condition and number of weatherization-related energy-conservation measures undertaken by the building owner. The City Staff and/or an energy alliance would work with the owner to help evaluate and analyze energy conservation measures and recommend those that have the potential to provide enough savings over time to offset the monthly cost of installing and
38
maintaining the energy-conservation measure throughout its expected useful life. These costs are borne by the property owner, with access to financing options from conventional lenders and/or an energy efficiency revolving fund. The City of Charleston or an energy-efficiency partnership would bear the cost of staff time. Timeline for Implementation: Phase 1 should begin within first year of the Sustainability Director’s tenure. Phases 2 to 4, including development of funding partnerships to provide larger loans, should be developed and implemented sequentially beginning in the second year of the Director’s tenure.
B6. HELP INCREASE FINANCING OPTIONS Summary of Specific Issues: Due to current economic difficulties and a lack of familiarity among lenders with sustainable building, there are very limited financing options for these projects. There are even fewer options that appropriately value the improvements included in these projects. The City could be uniquely influential in helping to increase financing options for sustainable building projects. Recommendation/Strategy/Action Plan: The Sustainability Director and the Green Committee should work with lenders, investors, and state and federal agencies to increase and publicize financing and funding opportunities for sustainable building projects. Successful models of this program exist elsewhere, including New York City, Kansas City, Cambridge, Massachusetts, and Austin, Texas. Implementation Responsibilities/Assignments: The Sustainability Director
and the Green Committee should contact local lenders to explore available financing options. Available options could be publicized on the City’s Sustainability webpage. The Sustainability Director should also explore and coordinate financing and funding options available at the state and federal levels. Cost to Implement/Net Savings from Implementation: Beyond staff time, there should be no additional cost for this program. Additional Benefits: In addition to the environmental benefits, helping local builders, developers, and owners find financing will have positive economic benefits for Charleston. Timeline for Implementation: Noting the great increase in federal funds available for efficiency projects, the Sustainability Director should begin the process immediately upon adoption of this recommendation by the City Council. The goal should be to have a framework and initial database of available funding organizations and resources published within 6 months of adoption of this plan.
B7. FOCUS ON PUBLIC OUTREACH Summary of Specific Issues: The success of this plan depends on whether a critical mass of City staff and Charleston residents understand and implement its recommendations. It is in everyone’s best interest to increase our collective understanding of climate protection, sustainable living practices, and what each person can do to make a difference.
39
Recommendation/Strategy/Action Plan: The Sustainability Director and the Green Committee should develop and implement a professional public relations campaign and a community-wide public education initiative concerning climate protection, sustainability, energy efficiency, and renewable energy. This initiative should include the following: A. Communications Plan: Develop a
comprehensive, multi-faceted communications and public engagement plan. This plan should target business, faith communities, schools, and the general public.
B. Public Relations Campaign: Undertake an
aggressive public relations and community education campaign in partnership with Chamber of Commerce, the Home Builders Association, the Charleston Green Builders Council, the Charleston AIA, historic preservation leaders, other trade and professional associations, foundations, non-profits, neighborhood organizations, home owners associations, and others that support sustainable building practices. • Design Workshops: As part of this
campaign, develop Sustainable Design Workshops that provide information for both professionals and home owners preparing to build, buy, or remodel a home with the intention of improving energy and water efficiency.
• Green Building Seminar: In addition,
develop a monthly, lunch-time Green Building Seminar Series open to all building design and construction professionals and City personnel. Learning Unit and Continuing Education credits should be available for American Institute of Architects (AIA) and licensed professional engineers.
Implementation Responsibilities/Assignments: The Sustainability Coordinator and the Green Committee should partner with local school districts, institutions of higher education and other local, regional and national organizations listed above to develop curricula for comprehensive lifelong learning opportunities in climate protection and sustainable living practices for all sectors of the local population. Timeline for Implementation: The first phase of education will begin with the adoption of the plan and its publication for use by City staff and the public at large. Ongoing development of programs and curricula will be continuous from that date forward.
40
“Energy conservation saves dollars and makes sense. ” Dr. Mitchell Colgan
College of Charleston, Department of Geology
& Environmental Sciences Subcommittee Chair
41

n the previous chapter, energy usage within buildings was discussed, and in this chapter, the production, transmission,
and conservation of energy are examined. The burning of fossil fuels generates much of the energy that powers our daily activities. Charleston’s reliance on fossil fuels raises three questions concerning the sustainability of our community and the possibility of reducing our dependence upon these sources: • How can we reduce our
dependence on costly fossil fuels that generate global warming greenhouse gases?
• How can we protect public
health and ensure clean air and water while providing needed energy?
• How can we promote the
creation of a local “clean energy” economy, which would reduce the flow of energy dollars out of our community and nation?
Charleston citizens can draw on the successes of other communities that have wrestled with these questions and have established practical solutions.
The Current System
Currently, South Carolina depends heavily on fossil fuels for its energy needs, consuming 61% of its electricity from coal-fired power plants.1 Charleston, in particular, receives at least 66% of its power from this source.2 When coal is used to generate electricity it releases more heat-trapping carbon dioxide than other fossil fuels. Along with carbon dioxide, coal releases oxides of sulfur that produce acid precipitation and trace metals like mercury. As a consequence, coal burning reduces the region’s air quality, contaminates waterways, and compromises public health (Visit http://www.scdhec.gov/environment/water/fish/docs/map.pdf to view map of SC’s contaminated waterways) . Coal is often seen as an inexpensive generator of electricity, but hidden costs associated with the human health problem and environmental pollution can be costly to a community- three times greater, in fact, than the cost of energy production.3
Win-Win Choices
This plan recommends that Charleston place a high priority on energy efficiency and renewable energy, which would decrease greenhouse gases, reduce toxic
CLEANER ENERGY
ACTIONS 1. Establish an “Efficiency-
First” principle. 2. Use energy efficiently. 3. Generate and support
renewable energy. 4. Transmit and deliver
electricity efficiently. 5. Encourage the public to
participate.
BENEFITS
Reduce energy costs Create jobs
Improve public health
Protect clean air
Protect clean water
Conserve natural resources Enhance quality of life Slow climate change
Raise awareness
42

emissions, conserve natural resources, and protect public health. Fortunately, the implementation of these recommendations will also provide important economic benefits. According to four recent studies, 20,000 to 28,000 new jobs could be created in South Carolina by expanding our commitment to energy efficiency and renewable energy.4 Further, national comparisons show that these clean-energy investments create 16.7 jobs for every $1 million spent, whereas
spending on fossil fuels creates only 5.3 jobs for the that same $1 million investment.5 Instead of creating new clean-energy jobs in South Carolina, we currently send more than $1.5 billion out of state each year to import coal, natural gas, petroleum, and nuclear fuels used to generate electricity.6 As fossil fuel supplies diminish and it becomes more likely that coal-fired power plants will need to purchase federal emissions allowances, out-of-state expenditures can only
increase.7 Energy efficiency and renewable energy, therefore, are win-win choices for Charleston. They can provide a rich new source of employment and allow more money to circulate through the local economy, as well as helping us reach climate protection and sustainability goals.
Energy Efficiency
Energy efficiency provides the cheapest, cleanest, quickest way for South Carolina to obtain more energy. If one views efficiency as an energy
The graph above vividly shows the benefits of investing in energy efficiency as compared to all other energy resources. This remains true even taking into consideration the costs of administering and marketing an energy efficiency program, and providing incentives for participation. Improved air quality resulting from each unburned pound of coal benefits human health and provides an additional compelling reason for energy efficiency.
Source: “Levelized Cost of Energy Analysis” Lazard, Alternative Energy Conference Report, Version 2.0, June 2008
Cost Range of Energy Consumption by Energy Source$2
21 -
$334
$0 -
$50
$3 -
$37
$90
- $14
5
$96
- $15
4
$115
- $1
25
$50
- $94
$50
- $81
$44
- $91
$42
- $69
$104
- $1
34
$98
- $12
6
$74
- $13
5
$73
- $10
0
$0
$50
$100
$150
$200
$250
$300
$350
$400
Alternative Energy Conventional Energy
Cost
in D
olla
rs
43
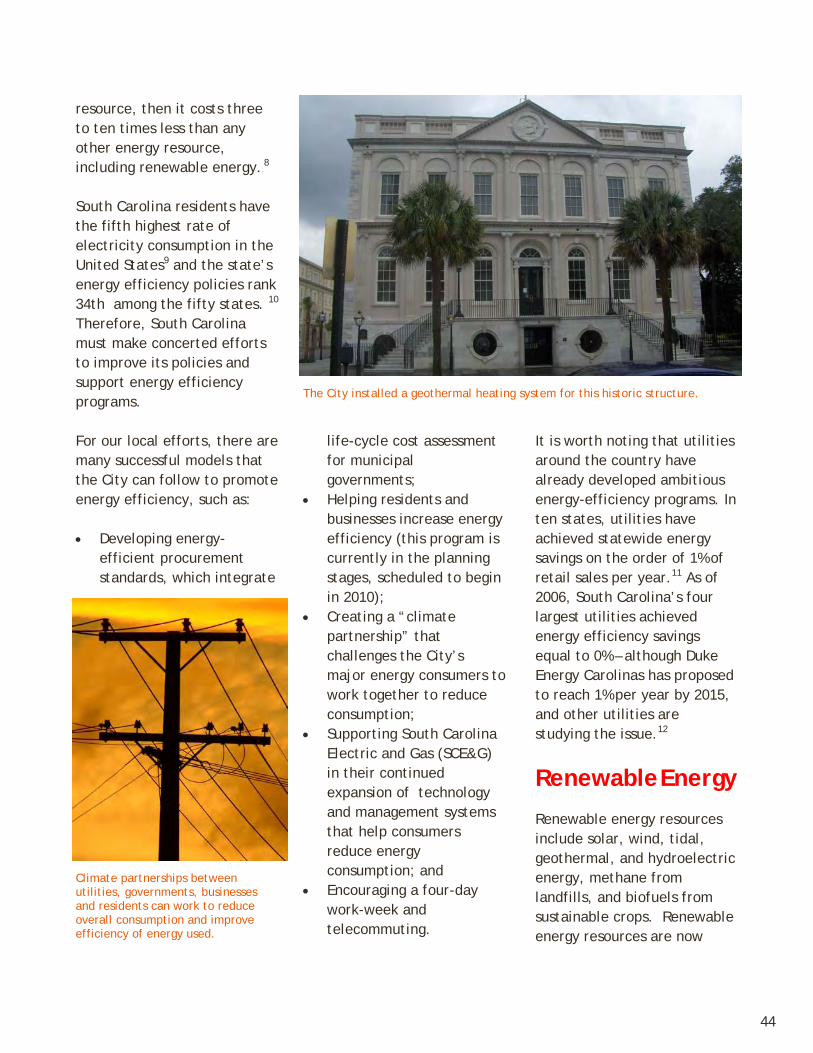
resource, then it costs three to ten times less than any other energy resource, including renewable energy..
8 South Carolina residents have the fifth highest rate of electricity consumption in the United States9 and the state’s energy efficiency policies rank 34th among the fifty states. 10 Therefore, South Carolina must make concerted efforts to improve its policies and support energy efficiency programs. For our local efforts, there are many successful models that the City can follow to promote energy efficiency, such as: • Developing energy-
efficient procurement standards, which integrate
life-cycle cost assessment for municipal governments;
• Helping residents and businesses increase energy efficiency (this program is currently in the planning stages, scheduled to begin in 2010);
• Creating a “climate partnership” that challenges the City’s major energy consumers to work together to reduce consumption;
• Supporting South Carolina Electric and Gas (SCE&G) in their continued expansion of technology and management systems that help consumers reduce energy consumption; and
• Encouraging a four-day work-week and telecommuting.
It is worth noting that utilities around the country have already developed ambitious energy-efficiency programs. In ten states, utilities have achieved statewide energy savings on the order of 1% of retail sales per year.11 As of 2006, South Carolina’s four largest utilities achieved energy efficiency savings equal to 0% – although Duke Energy Carolinas has proposed to reach 1% per year by 2015, and other utilities are studying the issue.12
Renewable Energy
Renewable energy resources include solar, wind, tidal, geothermal, and hydroelectric energy, methane from landfills, and biofuels from sustainable crops. Renewable energy resources are now
Climate partnerships between utilities, governments, businesses and residents can work to reduce overall consumption and improve efficiency of energy used.
The City installed a geothermal heating system for this historic structure.
44

SCE&G IN PROGRESS
Since March 2009, SCE&G has actively solicited input from customers and key stakeholder groups throughout South Carolina regarding the types of programs they would like to see implemented to help them save energy. The majority of the feedback the company has received falls into three general categories of interest for program consideration: rebates/incentives, consumer education and in-home services. In June 2009, SCE&G filed a portfolio of nine proposed Energy Efficiency programs with the South Carolina Office of Regulatory Staff and the Public Service Commission of South Carolina. Seven of the programs are geared toward residential customers, with the remaining two focused on commercial/industrial customers. The company expects a decision regarding these proposed programs by spring 2010. For further information on the proposed programs or for detail on existing tools and resources, visit www.sceg.com/energywise. SCE&G also offers net metering for customers interested in generating their own renewable electricity to power their homes or businesses and even sell the excess energy back to SCE&G. For additional information and resources, including a comprehensive list of FAQ’s, visit www.sceg.com/netmetering. Additionally, in conjunction with other investor owned utilities in South Carolina, the Office of Regulatory Staff and the South Carolina Energy Office, SCE&G is a founding member and serves on the board of directors of Palmetto Clean Energy (PaCE), a non-profit organization dedicated to supporting renewable energy generation in South Carolina. Through incentives paid by PaCE to renewable energy generators, the organization encourages the development and addition of renewable energy resources, such as solar, hydro, biomass and wind energy to South Carolina’s power supply. For more information and enrollment options, visit www.palmettocleanenergy.org.
Felicia Rhue Howard Director, SCANA Demand Side Management
Green Committee Member
economically competitive with traditional energy sources, and they are likely to become more competitive over time. Generating electricity from renewable sources produces far fewer greenhouse gases, little air or water pollution, and comparatively few human health risks compared to the burning of fossil fuels. Currently, South Carolina gets less than 3% of its energy from renewable sources (hydroelectric power about 2%; other renewables less than 1%).13 This plan recommends that the City, working closely with SCE&G and other utilities, encourages the development of renewable energy resources and to work with state officials to establish a statewide renewable energy portfolio standard equal to or greater than the national average. The City should lead the way by: Establishing a renewable energy goal of 15% by 2020. This goal for the City to derive of 15% of its electrical energy from renewable sources is modest compared to other municipalities. Other Cities are setting goals higher than 15% by 2020. Future innovations in renewable technologies might enable the City to easily exceed this goal. Consequently, City officials should be encouraged to increase this goal to keep pace with
45
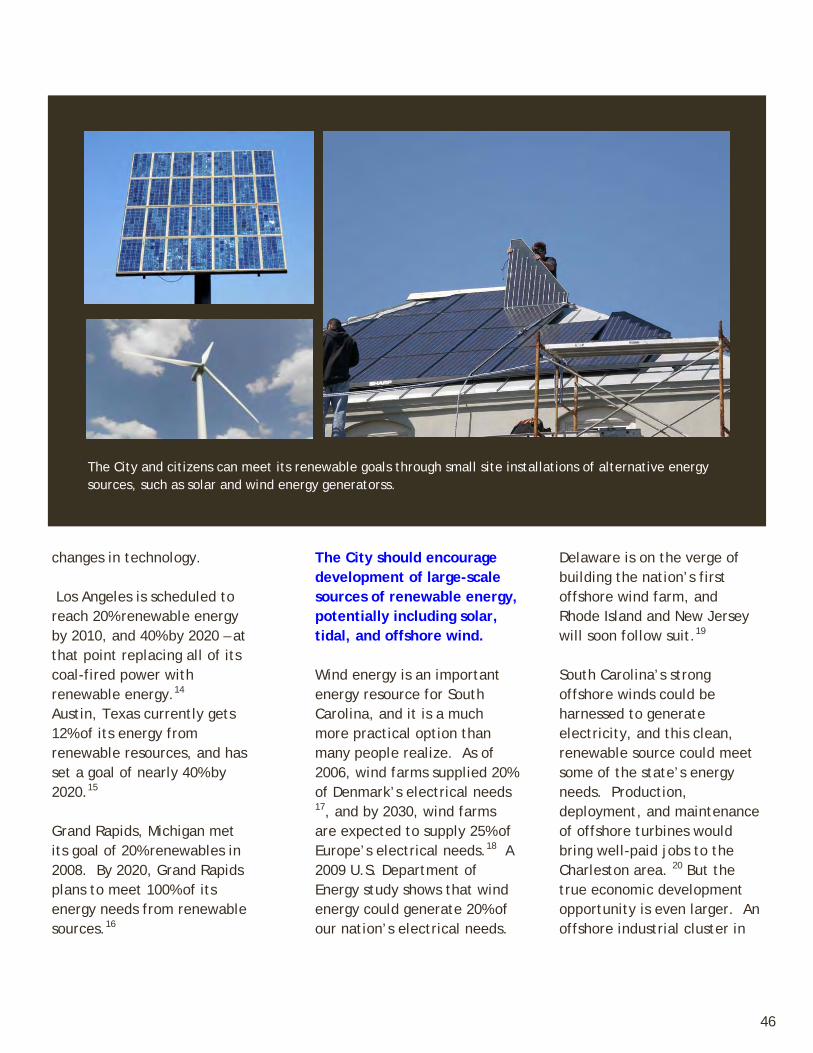
changes in technology. Los Angeles is scheduled to reach 20% renewable energy by 2010, and 40% by 2020 – at that point replacing all of its coal-fired power with renewable energy.14 Austin, Texas currently gets 12% of its energy from renewable resources, and has set a goal of nearly 40% by 2020.15
Grand Rapids, Michigan met its goal of 20% renewables in 2008. By 2020, Grand Rapids plans to meet 100% of its energy needs from renewable sources.16
The City should encourage development of large-scale sources of renewable energy, potentially including solar, tidal, and offshore wind. Wind energy is an important energy resource for South Carolina, and it is a much more practical option than many people realize. As of 2006, wind farms supplied 20% of Denmark’s electrical needs 17, and by 2030, wind farms are expected to supply 25% of Europe’s electrical needs.18 A 2009 U.S. Department of Energy study shows that wind energy could generate 20% of our nation’s electrical needs.
Delaware is on the verge of building the nation’s first offshore wind farm, and Rhode Island and New Jersey will soon follow suit.19 South Carolina’s strong offshore winds could be harnessed to generate electricity, and this clean, renewable source could meet some of the state’s energy needs. Production, deployment, and maintenance of offshore turbines would bring well-paid jobs to the Charleston area. 20 But the true economic development opportunity is even larger. An offshore industrial cluster in
The City and citizens can meet its renewable goals through small site installations of alternative energy sources, such as solar and wind energy generatorss.
46

South Carolina could potentially capture locally up to 50% of the costs associated with building offshore wind farms, representing an estimated market greater than $80 billion over the next twenty years.21 Finally, the City should encourage on-site generation of renewable energy. Strategies include working with local partners to apply for renewable energy grants for public housing, working with SCE&G, amending ordinances as needed, and investigating financing mechanisms to facilitate installation of energy-generating devices at private homes.
Collaboration is Essential
The City of Charleston and its citizens relies primarily on SCE&G to provide its electrical and natural gas needs. The City will need to work closely with SCE&G, Berkeley Electric Cooperative and Santee Cooper to achieve the desired energy efficiencies and reliance on renewable energy to protect our climate, enhance our overall sustainability and promote health.
SCHOOLS CASH IN ON ENERGY SAVINGS
Charleston County schools saved a total of $253,563 in energy usage in 2008. In return, each school will receive 20 cents for every dollar saved, totaling to about $47,000 to spend any way they like. This refund is part of the districts three-year voluntary energy conservation program that was started in 2008. The program is strictly voluntary, but rebate incentives, a monthly newsletter that provides energy saving tips, and a public good will are all that was needed for our county schools to save a lot of energy (and money). Charleston Progressive Elementary School was among the top five energy savers in Charleston County schools by turning off lights and computers and doing without microwaves and refrigerators in the classroom.
Credit: CCSD
47

“While our electric rates are among the lowest nationwide, our bills are among the highest. This means that there are enormous gains to be realized through investing in energy efficiency -- improving insulation, replacing heating and air conditioner systems, fixing leaky windows, and many other simple, cost-effective measures.”
Tony Bakker Charleston Resident
Post & Courier, Letter to the Editor 48

Cleaner Energy Goals, Actions & Recommendations ACTIONS 1. Establish an “Efficiency-First”
principle.
2. Use energy efficiently. A. Increase the conservation of
electricity, B. Develop energy-efficient
procurement standards for the City.
C. Continue to use energy service companies.
D. Create a Charleston Climate Partnership with major energy consumers.
E. Establish an alternative financing program to facilitate energy efficiency.
F. Study the implementation of a four-day workweek.
3. Generate and support renewable energy.
A. Set a goal for renewable energy.
B. Help develop large-scale sources of renewable energy.
C. Encourage on-site generation of renewable energy on City and private property.
4. Transmit and deliver electricity
efficiently.
5. Encourage the public to participate. E1. ESTABLISH AN “EFFICIENCY-FIRST” PRINCIPLE Summary of Specific Issues: Population growth and new technologies have increased energy demands, and consequently greenhouse gas emissions. Energy efficiency is the most cost effective, cleanest, and quickest way to reduce energy consumption and decrease greenhouse gas emissions. Recommendation/Strategy/Action Plan: The City should establish an "Efficiency First" principle to guide all of its energy-use decisions. This principle should influence energy contracts (Recommendation E-2A) and purchases of equipment and supplies (Recommendation E–2B). The Efficiency First principle should guide decisions about buildings and land use. (See Buildings Section and Recommendation B1.) The success of an “Efficiency First” principle depends on City employees’ general understanding of the costs and benefits of selecting energy-efficient items. Estimated Greenhouse Gas Reductions to be Achieved – In Metric Tons/Year: Probably substantial. Implementation Responsibilities/Assignments: The Sustainability Director should create a program to educate City employees about the "Efficiency First" principle.
38% Quantifiable measures could achieve 38% of 2030 reduction goal (equal to 427,175 mtCO2e). See page 21 for details.
49

Cost to Implement/Net Savings from Implementation: Probably quite small. Additional Benefits: Cost savings and leading by example. Timeline for Implementation: Immediate. References: Programs instituted in both Los Angeles and Kansas City.
E2. USE ENERGY EFFICIENTLY E-2A: Increase the conservation of
electricity. Summary of Specific Issues: In other cities, “demand-side management” (DSM) programs have reduced the growth in the demand for electrical power. There are two types of DSM programs: • Energy conservation programs that reduce
total quantity of electricity used (measured in kilowatt-hours).
• Demand response programs that reduce peak demand for electricity (measured in kilowatts).
Since these conservation programs reduce electrical usage, utility companies can forgo the construction of expensive new generating facilities. With reduced usage, peak electrical demands are lessened and the strains on the existing power infrastructure are diminished, minimizing the probability of future power outages. Also, utility companies providing consumers with low-cost, real-time energy usage monitoring devices will help households with the means to make wise energy conservation choices. Finally, a community’s energy needs are met with less electricity, reducing greenhouse gas emissions. DSM programs, then, can make the delivery of electricity more reliable, less expensive, and less polluting.
Recommendation/Strategy/Action Plan: • SCE&G: Since the City of Charleston does
not operate a municipal utility, it must rely on SCE&G to meet its electricity needs. The City should therefore encourage SCE&G to employ robust DSM programs. Charleston should also review its contracts with SCE&G to insure that DSM programs and other energy conservation measures are encouraged. Further, the City should work with the state Public Service Commission to require that all of the state’s utilities have DSM practices and other conservation measures to increase efficiency and reduce greenhouse gases.
• INTERNAL PROGRAM: Internally, the City
should use energy management systems in its buildings to monitor energy uses at the department level. City departments should design and implement energy conservation and demand response programs. In the process, the City should take advantage of any additional opportunities for efficiency, including but not limited to:
• Installing thermostats with timer-
activated set points that control air conditioning/space heating to provide higher or lower temperatures for nights and holidays; and
• Switching to work-space lighting and
reduced room lighting with timer-actuated room lighting to turn off lights after working hours (subject to safety regulations for passageways and stairwells.)
Implementation Responsibilities/Assignments: The Sustainability Director should oversee energy use. The Mayor’s office should work with SCE&G to help design its DSM programs. The City should participate in South Carolina Public Service Commission dockets as necessary to promote its interests in DSM and conservation.
50

Cost to Implement/Net Savings from Implementation: Primarily staff time. Additional Benefits: Cost savings and community leadership. Timeline for Implementation: Review of the contract and DSM program development with SCE&G should start immediately.
E-2B: Develop energy-efficient procurement standards for the City. Summary of Specific Issues: Purchasing decisions affect the amount of energy used. Purchasing rules that promote the use of environmentally preferable products and consider life-cycle costs are an effective means of saving money and energy. Recommendation/Strategy/Action Plan: A green life-cycle purchasing policy should be established for all City departments. In purchasing decisions, departments should be directed to consider life-cycle costs; energy consumption to make, ship, operate, and decommission the product; waste generation; recycled material content; and longevity of items purchased. (See also Recommendation W-1E.) Implementation Responsibilities/Assignments: The Sustainability Director should review and suggest modifications to the City’s existing procurement policy. Department heads and purchasing officers are tasked with overseeing implementation of the policy. Cost to Implement/Net Savings from Implementation: Staff time for both the Sustainability Director and City purchasing officers. Additional Benefits: This policy will reinforce Charleston’s commitment to energy conservation and environmental
stewardship. The City will provide leadership and inspiration for regional municipalities and local businesses.
Timeline for Implementation: Immediate because of low initial cost. E-2C: Continue to use energy service companies. Summary of Specific Issues: Energy service companies, often called ESCOs, provide comprehensive energy solutions that save money and energy. Additionally, these companies provide a means to finance the up-front costs of energy purchases. For instance, the City of Charleston has a successful relationship with Johnson Controls, ESCO, that currently allows it to save more than a half-million dollars per year on energy costs. Recommendation/Strategy/Action Plan: Charleston should maintain and expand its present relationship with energy service companies. Estimated Greenhouse Gas Reductions to be Achieved – In Metric Tons/Year: See Johnson Controls Reports. Implementation Responsibilities/Assignments: Sustainability Director should be involved in overseeing the Johnson Controls contract and performance. Cost to Implement/Net Savings from Implementation: See Johnson Controls Reports. Timeline for Implementation: Continuation of current practices. E-2D: Create a Charleston Climate Partnership with major energy consumers. Summary of Specific Issues: The City of
51

Charleston’s plans to reduce greenhouse gases can only be realized with the cooperation of the City’s major energy consumers. Recommendation/Strategy/Action Plan: Create a Charleston Climate Partnership that challenges large energy users and near-by communities to work together to reduce energy consumption. Develop major business and residential outreach campaigns supporting the adoption of best practices related to energy conservation and the purchase of renewable energy. Implementation Responsibilities/Assignments: The Sustainability Director and the Charleston Chamber of Commerce should work together to develop the Charleston Climate Partnership. Cost to Implement/Net Savings from Implementation: Little cost to the City beyond staff time. Additional Benefits: Sharing of information about energy conservation and renewable energy, and the City assuming a leadership role in working with other communities and business leaders.
Timeline for Implementation: Immediate as there are no initial costs involved. References: New York City E-2E: Establish an alternative financing program to facilitate energy efficiency. Summary of Specific Issues: Charleston’s aging building stock offers immense opportunities for energy efficiency in commercial, industrial, municipal, and residential sectors. Often it is lack of knowledge, financing opportunities, and skilled labor that prevent residents, business owners, and government entities from taking advantage of potential energy reductions and cost savings. Recommendation/Strategy/Action Plan: The
City is already working with a consultant and various local partners to create a self-sustaining entity that will offer comprehensive services to support energy efficiency improvements in residential, commercial, industrial, and government facilities. Services will include energy audits, tailored retrofit programs, financing options, and skilled labor. The City should continue to play a leading role in this effort through and beyond the program’s projected launch date in 2010. (See also Recommendation B5.)
Implementation Responsibilities/Assignments: The Sustainability Director should coordinate this effort for the City. Cost to Implement/Net Savings from Implementation: Proportional to program and services provided. Estimates have made up to $500,000. Additional Benefits: Local job creation, revenue generation, improved health and quality of life, and demonstration of leadership by the City for the State of South Carolina. Timeline for Implementation: The program could be operational by spring 2010. It should provide services to 1,000 housing units, small businesses, or other institutions by 2011; and provide services to all housing units, small businesses and institutions requesting help by 2015. References: Many cities have established similar programs, including the Cambridge Energy Alliance in Massachusetts and programs in Milwaukee, Wisconsin; Charlottesville, Virginia; Portland, Oregon; Babylon, New York; and New York City. E-2F: Study the implementation of a four-day workweek. Summary of Specific Issues: Electricity used in buildings operated by the City of Charleston accounts for 63% of City government’s carbon
52
footprint. Several cities and businesses have instituted a four-day workweek to save energy and reduce operating costs. A four-day workweek can reduce automobile travel, as well as reduce electricity use in City buildings, and can therefore reduce carbon dioxide emissions. Recommendation/Strategy/Action Plan: The City of Charleston should study the possibility of a four-day workweek with departments and the community. Estimated Greenhouse Gas Reductions to be Achieved – In Metric Tons/Year: There will be a small decrease in electricity demand because the reduced work week will be partly compensated for by extending working hours on the remaining four days. We estimate at most a 15% reduction in energy use for City departments. The major energy saving and greenhouse gas reduction will accrue from a 20% reduction in commuting mileage. Implementation Responsibilities/Assignments: The Sustainability Director working together with City department heads should study possible implementation of the four-day workweek. Additional Benefits: Improvement in worker morale, increased work productivity, improved employee retention, reduced employee absenteeism, reduced highway usage. Timeline for Implementation: Implementation will be complex because services to the public may be affected. We recommend initiation of a study during the next 5 years. References: The state of Utah. http://www.heraldextra.com/news/local/article_e5e96c0c-7ee6-5787-b46f-c8ac9990c440.html http://www.usatoday.com/news/
nation/2008-06-30-four-day_N.htm http://www.theoildrum.com/node/2996 College of Charleston MES Green Committee (Case Studies Fall 2008); Recommendations to the Charleston Green Committee for a Sustainable Charleston, SC.
E3. GENERATE AND SUPPORT RENEWABLE ENERGY E-3A: Set a goal for renewable energy. Summary of Specific Issues: To meet long-term goals for reducing greenhouse gas emissions, the city needs to access low-cost, reliable, renewable energy. Our goal is to have 15% of Charleston’s energy needs met by new renewable energy sources, developed after passage of this plan, by 2020 and 30% by 2030. This is a modest goal. Thirty-three states have set renewable energy goals. Ten percent is the lowest goal set by any state, and states that chose that goal plan to reach it no later than 2015. More ambitious states include California, which will require its utilities to generate 20% of their power from renewables by 2010, and 33% by 2020. Los Angeles is scheduled to reach 20% renewable energy by 2010, and 40% by 2020. Ahead of Los Angeles, interestingly, is Grand Rapids, Michigan, which met its goal of 20% in 2008. By 2020, Grand Rapids plans to rely 100% on renewable energy.
Recommendation/Strategy/Action Plan: The City should develop a strategy that will result in at least 15% of its electrical energy needs being met from renewable energy sources by 2020. The City should also pursue opportunities to procure, support, or generate renewable energy.
53
Estimated Greenhouse Gas Reductions to be Achieved – In Metric Tons/Year: If the goal of 15% is met by 2020, there would be a reduction of approximately 40,500 tons CO2/yr. Implementation Responsibilities/Assignments: • The Sustainability Director should identify
possible renewable energy sources to replace fossil fuels. The Sustainability Director will collaborate with utilities and pursue other funding sources.
• City lawyers should review the SCE&G
contract to determine the feasibility of producing renewable energy or procuring renewable energy from SCE&G and/or other providers.
• The Sustainability Director should review
opportunities to purchase renewable energy (e.g. green tags) from green power purchase programs (e.g. Palmetto Clean Energy) or other sources.
• The City with SCE&G, South Carolina Public
Service Commission, and the South Carolina General Assembly should explore the possibilities of setting reasonable statewide standards for renewable energy generation.
Additional Benefits: Embracing renewable energy could foster economic development around sustainability and renewable energy. Timeline for Implementation: Implementation can begin immediately. E-3B: Help develop large-scale sources of renewable energy. Summary of Specific Issues: Development of local, large-scale facilities that generate renewable energy is an important step toward fulfilling long-term goals for reducing carbon dioxide emissions. The wind energy potential
offshore near Charleston is sufficient to meet much of the City’s electricity demand. Off-shore wind farms are successful in Europe and plans are underway for major installations in the Northeastern US. There is also the potential for Charleston to attract a national/ international offshore wind manufacture and distribution hub. The city already meets important infrastructure requirements, such as port facilities and steel manufacturing facilities. In addition, tidal and wave energy, as well as large-scale solar farms, may be potential energy resources for the Charleston area. Recommendation/Strategy/Action Plan: The City should support and/or undertake feasibility studies of potential renewable energy sources, including wind, solar, tidal, and wave energy. The City should then develop a strategy for supporting appropriate renewable energy projects. Estimated Greenhouse Gas Reductions to be Achieved – In Metric Tons/Year: European experience indicates a large possible displacement of fossil fuels.
Implementation Responsibilities/Assignments: Because of the long-term nature of this recommendation, the Sustainability Director and the Charleston Green Committee should take on this responsibility with the possible support of the City Business Innovation Director. Cost to Implement/Net Savings from Implementation: Cost will be mainly Sustainability Director’s time. Additional Benefits: Embracing renewable energy could foster significant economic development. Timeline for Implementation: Next 5 years.
54
References: MES (College of Charleston) case studies report on Off-shore winds.
E-3C(i): Encourage on-site generation of renewable energy (City property). Summary of Specific Issues: To make dramatic reductions in power use and associated climate impacts, it may be necessary to change the City’s policy for acquiring power for its own facilities. Recommendation/Strategy/Action Plan: A City-financed study should address the technical and legal feasibility of on-site renewable energy facilities for City buildings, as well as off-grid retrofits for specific building functions such as solar lighting, space heating, and hot water heating. A further target is conversion from air-source heat pumps to ground- or water-sourced systems, which operate more efficiently.
Estimated Greenhouse Gas Reductions to be Achieved – In Metric Tons/Year: None until the study’s recommendations are implemented. Implementation Responsibilities/Assignments: The Sustainability Director should manage the survey of City-owned facilities. Cost to Implement/Net Savings from Implementation: The cost of this feasibility study would be modest, whether undertaken by a consultant or City employees. Much of the information needed is readily available.
Additional Benefits: Public education regarding viability of alternative energy technology. Timeline for Implementation: This is an important “first step” and should be
implemented immediately because of its low cost. An RFP could be developed within 60 days, a study could be completed in 6 months, and implementation could take place over two to five years depending on study results and budget constraints.
References: Kansas City E-3C(ii): Encourage on-site generation of renewable energy (private property). Summary of Specific Issues: The actions of private property owners have a large impact on energy use. Photovoltaic solar power generation for home or commercial consumption or grid feed-in, solar space heating, and solar hot water heating can substantially reduce greenhouse gas emissions.
Recommendation/Strategy/Action Plan: City staff should: • Examine city ordinances and work with
SCE&G to reduce obstacles to, and create incentives for, the installation of energy-generating devices on private property (e.g. net metering, interconnection standards);
• Work with Charleston County Housing
Authority and the Department of Housing and Community Development to apply for renewable energy grants for low-cost public housing;
• Investigate financing mechanisms that
allow homeowners to amortize the upfront costs of renewable energy generation by utilizing the municipal bond market (e.g. a renewable energy finance district);
• Provide via the City website timely
information about state and federal
55

incentives for solar and other renewable energy installations.
Implementation Responsibilities/Assignments: Sustainability Director working together with the Housing Authority and City Department of Housing and Community Development. Cost to Implement/Net Savings from Implementation: Minimal cost for City staff time. Additional Benefits: Public education regarding viability of alternative energy technology. Timeline for Implementation: Can begin immediately. References: Kansas City
E4. TRANSMIT AND DELIVER ELECTRICITY EFFICIENTLY Summary of Specific Issues: A “Smart Grid” uses available technologies to make the nation’s electrical grid work more efficiently and increase reliability. Increased efficiency of energy delivery reduces consumer’s electrical bills and decreases greenhouse gas emissions associated with energy generation. Household energy monitoring devices linked to a smart grid will help household to make better energy usage decisions, because the consumer can postpone energy-intensive activities until off-peak hours when energy costs less. The “Smart Grid” technology is fully compatible with on-site renewable energy generation. A Smart Grid is used with DSM (Recommendation E-2A) to reduce energy consumption and save money in many cities, including Miami, Florida and Austin, Texas. Recommendation/Strategy/Action Plan: The City should work with SCE&G to bring Smart Grid technology to Charleston. The City can encourage SCE&G to follow the lead of Duke Energy, which is trying to bring Smart Grid
technology to all its customers. The City should ask the South Carolina Public Service Commission to help introduce Smart Grid technology to South Carolina. Implementation Responsibilities/Assignments: The Sustainability Director and Charleston business leaders should work with the state and SCE&G to bring Smart Grid technology to Charleston. Cost to Implement/Net Savings from Implementation: Costs would accrue mainly to SCE&G, but are offset by a reduction of the number of standby generation facilities that will be needed. Additional Benefits: A Smart Grid will encourage the use of on-site renewable energy devices; encourage conservation; and enhance Charleston’s “green” reputation.
E5. ENCOURAGE THE PUBLIC TO PARTICIPATE Summary of Specific Issues: Ultimately, the effectiveness of an energy-efficiency campaign depends on how many individuals and businesses participate. It is therefore essential to include an education and public relations campaign that can address a broad range of stakeholders. Recommendation/Strategy/Action Plan: The City should build or enhance partnerships with a range of interested parties, including utilities, local and regional government entities, and nonprofit groups to establish and implement an education and training program on energy and the environment. Implementation Responsibilities/Assignments: The Sustainability Director should manage this process and work with the Charleston Chamber of Commerce, the County School Board, local colleges, and neighborhood committees, among others.
56
Cost to Implement/Net Savings from Implementation: The only cost to the City would be the Sustainability Director’s time and the preparation of public relations materials. Additional Benefits: Enhanced City leadership. Timeline for Implementation: Planning of the program could begin immediately. References: Educational activities are common to all City energy and greenhouse gas reduction plans examined by the Energy Subcommittee.
57

58
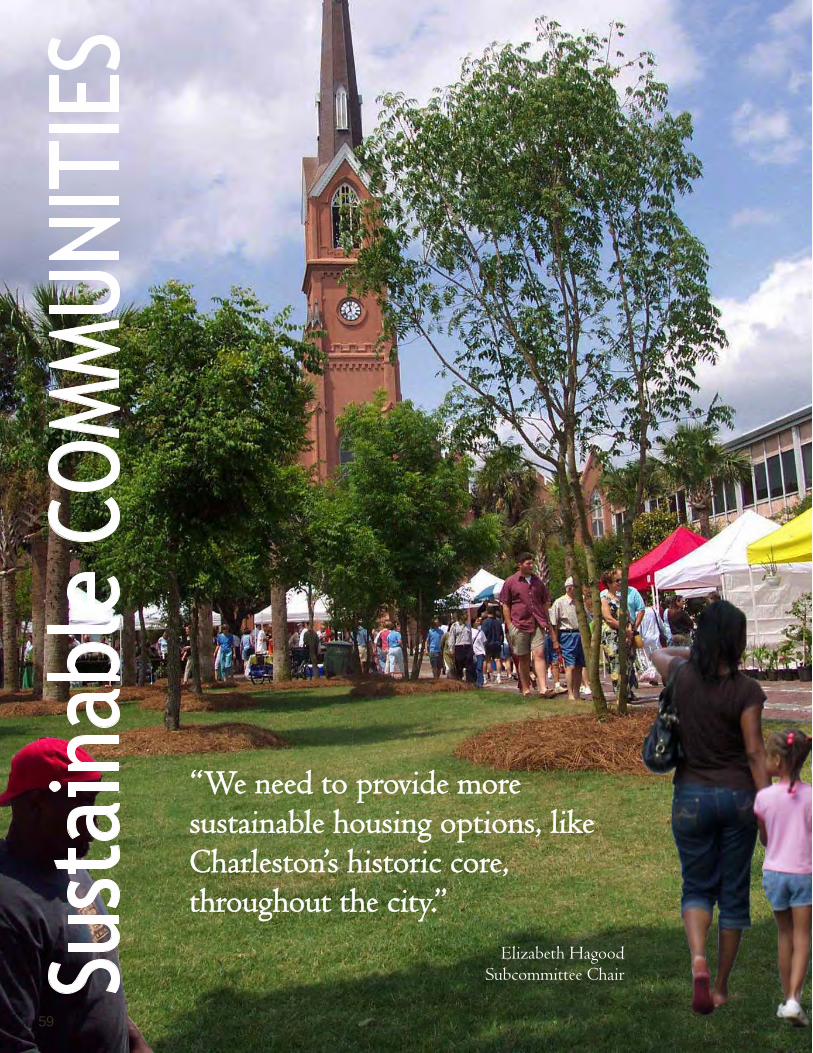
“We need to provide more sustainable housing options, like Charleston’s historic core, throughout the city.”
Elizabeth Hagood Subcommittee Chair
59
ommunity design has a powerful impact on clean air, clean
water, and the rural areas and natural habitats areas that surround the city. More spread-out communities require more driving, which means more smog. And when communities expand outward they displace rural and natural areas. Community design also determines how much pollution is washed off of paved surfaces into surrounding water ways during rainstorms.1 Automobile use is a direct result of how our communities are designed: how neighborhoods are laid out, and how they relate to one another. Community design can allow residents to use their cars sparingly, allowing them to choose walking, biking, and public transit more often. Community design can also promote more appropriate stormwater management practices. Roughly 40% of Charleston’s greenhouse gas emissions are related to transportation. To reduce these emissions and to protect the environment and
human health in other ways, it is necessary to reduce the use of automobiles over the next few decades. Fortunately, this is not as daunting a task as it may seem. Ingenious solutions are close at hand, right here in our own city. Like all healthy cities, Charleston continues to grow and evolve. If the decision is made to grow responsibly - and to use the city’s uniquely intact historic neighborhoods as a guide - we can dramatically reduce our dependence on the automobile for future generations. There will also be a special bonus for our children and grandchildren: Charleston will be cleaner, greener, healthier, safer, and generally more livable for our children and grandchildren.
Better Choices
Charleston is a national leader in not only the preservation of our historic structures, but in the preservation of our historic neighborhoods and communities. On the peninsula everything is close together. Homes casually mix with businesses, and residents enjoy the option of walking, biking, or hopping on a bus. Also, the public open spaces are some of the most beautiful in the world –
SUSTAINABLE COMMUNITIES
ACTIONS 1. Plan future growth to reduce
vehicle emissions. 2. Decide first where growth
should occur, then plan transportation accordingly.
3. Encourage sustainable site design.
4. Create a sea level rise adaptation plan.
5. Raise public awareness.
BENEFITS Reduce energy costs Create jobs Improve public health
Protect clean air
Protect clean water Conserve natural
resources
Enhance quality of life
Slow climate change Protect cultural identity
Raise awareness
60
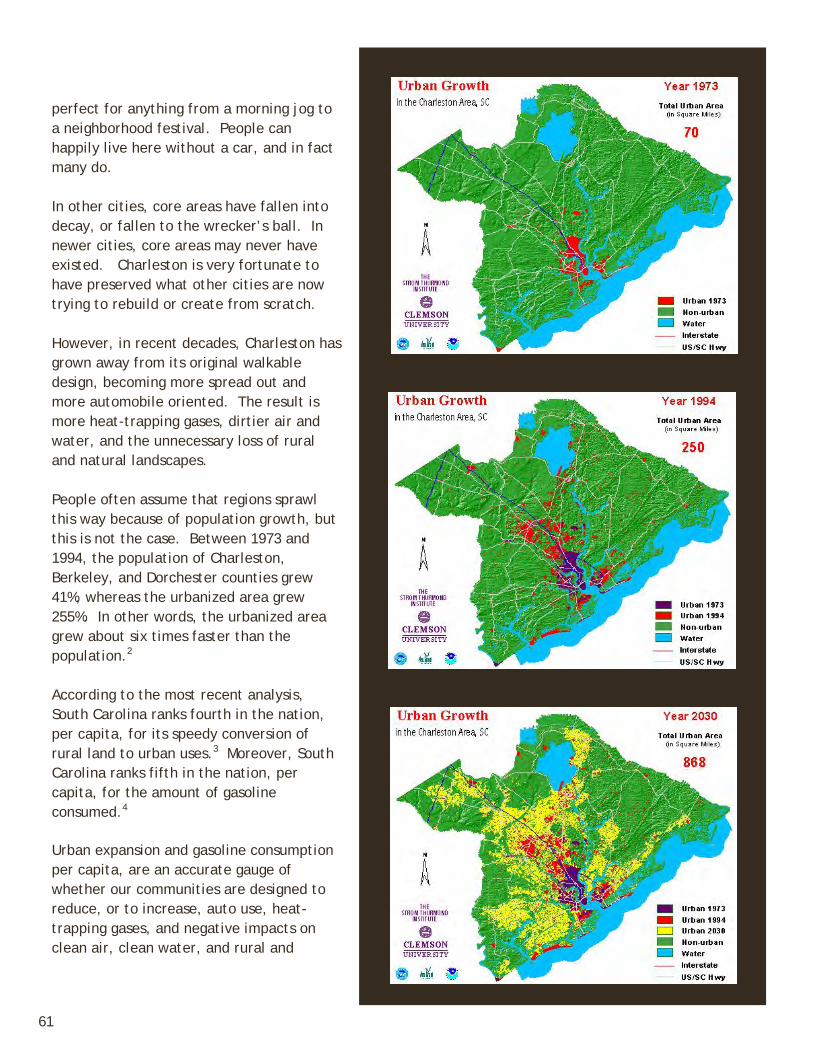
perfect for anything from a morning jog to a neighborhood festival. People can happily live here without a car, and in fact many do. In other cities, core areas have fallen into decay, or fallen to the wrecker’s ball. In newer cities, core areas may never have existed. Charleston is very fortunate to have preserved what other cities are now trying to rebuild or create from scratch. However, in recent decades, Charleston has grown away from its original walkable design, becoming more spread out and more automobile oriented. The result is more heat-trapping gases, dirtier air and water, and the unnecessary loss of rural and natural landscapes. People often assume that regions sprawl this way because of population growth, but this is not the case. Between 1973 and 1994, the population of Charleston, Berkeley, and Dorchester counties grew 41%, whereas the urbanized area grew 255%. In other words, the urbanized area grew about six times faster than the population.2 According to the most recent analysis, South Carolina ranks fourth in the nation, per capita, for its speedy conversion of rural land to urban uses.3 Moreover, South Carolina ranks fifth in the nation, per capita, for the amount of gasoline consumed.4
Urban expansion and gasoline consumption per capita, are an accurate gauge of whether our communities are designed to reduce, or to increase, auto use, heat-trapping gases, and negative impacts on clean air, clean water, and rural and
61
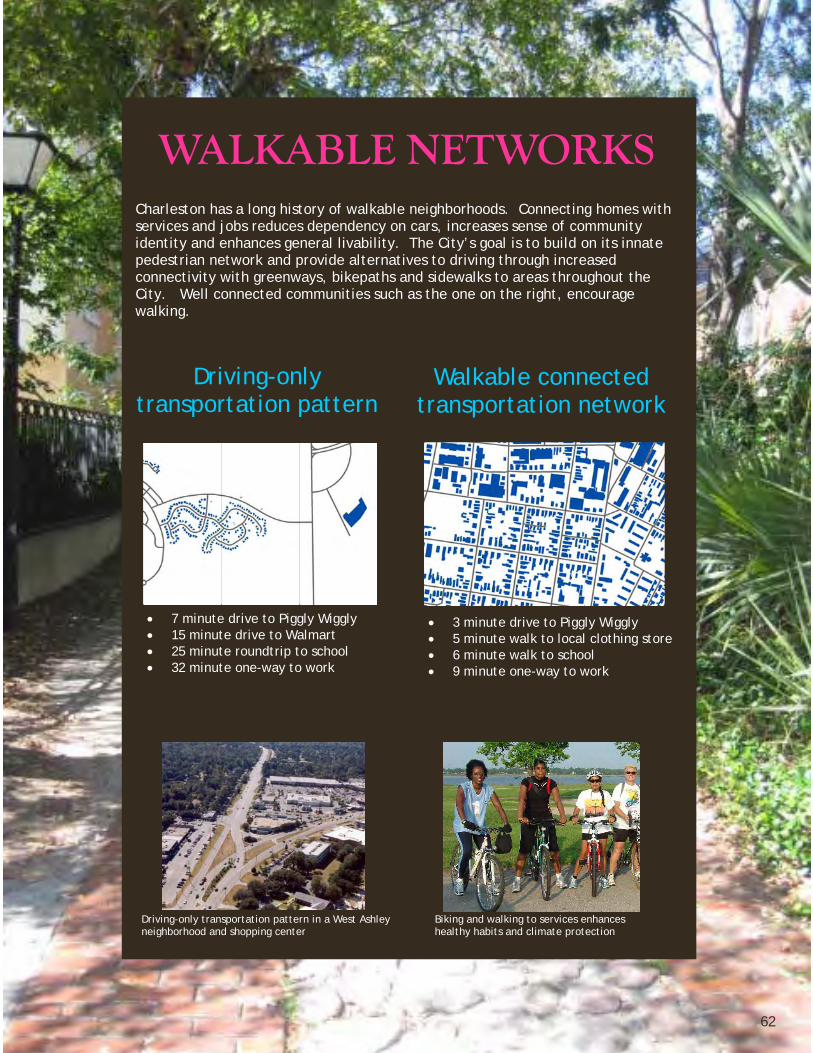
Charleston has a long history of walkable neighborhoods. Connecting homes with services and jobs reduces dependency on cars, increases sense of community identity and enhances general livability. The City’s goal is to build on its innate pedestrian network and provide alternatives to driving through increased connectivity with greenways, bikepaths and sidewalks to areas throughout the City. Well connected communities such as the one on the right, encourage walking.
Driving-only transportation pattern
WALKABLE NETWORKS
• 7 minute drive to Piggly Wiggly • 15 minute drive to Walmart • 25 minute roundtrip to school • 32 minute one-way to work
• 3 minute drive to Piggly Wiggly • 5 minute walk to local clothing store • 6 minute walk to school • 9 minute one-way to work
Walkable connected transportation network
Driving-only transportation pattern in a West Ashley neighborhood and shopping center
Biking and walking to services enhances healthy habits and climate protection
62

natural lands. In the future, Charleston residents can make better choices about development, following the example of the historic peninsula that the city is so fortunate to have preserved.
Outgrowing Sprawl
Sprawl is not inevitable. In Europe, people not only walk and bike to nearby services; extensive public transit minimizes traffic and smog, and miles of productive farmland stretch just beyond the urban core. In the United States, communities are now choosing to redevelop in a way that mimics these compact, sustainable patterns. The City and Charleston County have already agreed on an urban growth boundary to help contain sprawl. For the boundary to be fully effective there must be broader, regional agreement, and expansions of the boundary must be discouraged. This plan recommends the following steps that the City can take to further align itself with the national movement to redevelop cities sustainably: Encourage infill development in underused areas near the city core. These new communities should mix residential and
commercial uses with plenty of parks and public open space; they should be compact enough to support public transit; and they should be conducive to biking, walking, working, shopping, and playing near home; Encourage the “retrofit” of suburban areas, connecting networks of smaller streets to reduce traffic jams on major roads and highways; adding nearby shops, parks, and employment opportunities so that people can choose to stay closer to home; and creating compact, transit-oriented communities along public transit lines; Decide first where growth should occur, then plan transportation accordingly, rather than allowing big road projects to push urban sprawl into rural areas; Create a regional public transit plan that supports the recommendations listed above; and Encourage local food production and distribution, as well as the preservation of rural areas. Once this plan is adopted, the next task will be to support the development of compact, sustainable communities, resulting in much greater choice for the housing consumer. Research by the National
63
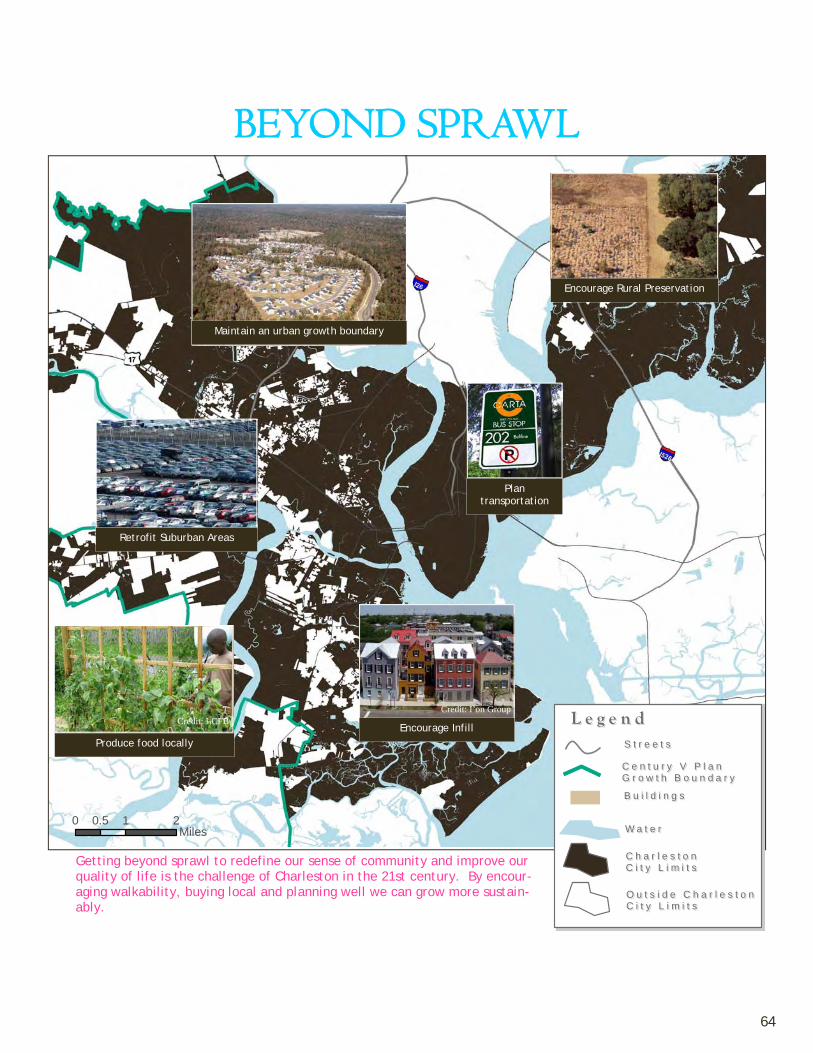
B u i l d i n g sB u i l d i n g s
C h a r l e s t o n C h a r l e s t o n C i t y L i m i t sC i t y L i m i t s
O u t s i d e C h a r l e s t o nO u t s i d e C h a r l e s t o nC i t y L i m i t sC i t y L i m i t s
S t r e e t sS t r e e t s
W a t e rW a t e r
L e g e n dL e g e n d
C e n t u r y V P l a n C e n t u r y V P l a n G r o w t h B o u n d a r yG r o w t h B o u n d a r y
0 1 20.5Miles
Encourage Rural Preservation
Plan transportation
Encourage Infill
Retrofit Suburban Areas
Produce food locally
Maintain an urban growth boundary
BEYOND SPRAWL
Getting beyond sprawl to redefine our sense of community and improve our quality of life is the challenge of Charleston in the 21st century. By encour-aging walkability, buying local and planning well we can grow more sustain-ably.
Credit: LCFB Credit: I’on Group
64

Association of Homebuilders, the National Association of Realtors, and others indicates that there is considerable demand for housing in compact, sustainable communities. One-third of people surveyed say that they would rather live in a compact, sustainable community than in a typical subdivision. Also, if the location would shorten their commute, nearly 60% of people surveyed would prefer that choice.5 Currently, the demand for compact communities is much greater than the supply. As a
result, these communities are now 40% to 100% more expensive per square foot than houses in nearby subdivisions.6 Research indicates that if developers simply met this market demand, by 2050 this would reduce transportation-related carbon dioxide emissions by 7% to 10% from current trends.7 Among climate protection strategies, facilitating sustainable development is a remarkably inexpensive option. All it involves is shifting investments from the unsustainable to the
sustainable.
Sustainable Site Design
In addition to encouraging better design for entire communities, the City should also influence development decisions on a smaller scale. Here are two key examples: Stormwater Management: In urban areas, stormwater runoff contains oil, gasoline, pesticides, petrochemical fertilizers, and other chemicals that are toxic to aquatic life. Conventional
Photo: Schimpf
Bennett’s Point’s outdoor classroom, in the ACE Basin, uses pervious surfaces to improve water quality and manage stormwater drainage.
Credit: Michael Schimpf Photography
65

DESIGN WITH NATURE
“Charleston can continue to prosper
and grow, without taking such a toll on
our wildlife and waterways.”
Capt. Bryan Collins
Owner, Sandlapper Water Tours & Green Committee Member
stormwater management pours this runoff into street drains, then directly into surrounding bodies of water. Also, conventional stormwater systems often do not drain water efficiently, causing frequent floods. This plan recommends, instead, stormwater systems that filter polluted runoff through pervious pavements, healthy soils, and natural plantings. This protects clean water and also minimizes flooding . Heat Island Effect: Cities become “urban heat islands,” consistently warmer than surrounding areas because of increased pavement, reduced vegetation, buildings that absorb heat and block wind, and waste heat from automobiles, air conditioners, etc. This increases demand for electricity, and consequently increases greenhouse gas emissions. This plan recommends investment in a multi-generation urban tree canopy, the use of pervious surfaces, and green roofs for new City buildings. These strategies, as well as the use of light-colored, reflective roofing, can help reduce the urban heat island effect.
Using a European pattern, our ancestors created a sustainable city where residents could easily work, shop, socialize, and relax near their homes. We still enjoy many acres of farmland and native ecosystems that once provided essential support for their community. Now, cities around the country are discovering that the best way to meet the needs of future generations is to revive and reuse the old urban pattern that has been carefully preserved in downtown Charleston. Our city, then, finds itself in a privileged position – we are the new American role model for other cities that wish to develop more sustainably.
Credit: Liollio Architecture
Buildings can be designed to work with natural infrastructure. A building’s site design can capitalize on existing natural systems and enhance the beauty and livability for its occupants. In the design above, a multi-generational oak canopy is the framework for the design of the site and is preserved for future generations’ benefit.
66

NATURE AS INFRASTRUCTURE Advances in the science of Ecology have given us insights into the role that natural processes play in supporting human life on Earth. We have come to realize that the air we breathe, the water we drink, and even sewage treatment are the products of natural ecological processes. Collectively, the value of these “ecological goods and services” is greater than the economy of all the world’s nations combined: a staggering $33 trillion (in 1997 dollars).8 Curiously though, we lost sight of this value as we developed our own cities and neighborhoods. As we built roadways, power grids, and all the underlying infrastructure of our built environment, waterways were polluted and cities became hotter as asphalt and buildings trapped the sun’s warmth. At the same time, pavement forced rainfall into the streets instead of recharging our groundwater, leading to increased flooding. Now, as we begin to look for solutions, we are turning back to the role that nature plays in keeping our world livable. We can plant trees, for example, whose canopies shade the pavement, and whose roots break up the soil, allowing rain to recharge groundwater more easily. At the same time, tree trunks sequester the greenhouse gas, carbon dioxide, while leaves
Buildings can live with nature and need not displace it. At the same time buildings benefit from Kiawah Island’s natural air conditioning and stormwater management.
Waterfront Park’s canopy shades visitors and residents while reducing City temperatures resulting from the urban heat island effect.
Credit: Rick Rhodes Photography
67

absorb pollutants and release life-giving oxygen. No man-made machines can accomplish these feats so efficiently at any price. Today, many of our human activities, pollution, deforestation, and urbanization, have diminished the ecological activity of natural communities. Yet this process can be reversed as we begin to take greater advantage of nature. Swales and wastewater gardens trap and cleanse stormwater runoff. Green roofs cool buildings, trap rainfall, and even become a local source of food. As we enhance the beauty of our environment through trees and natural plantings, we can also create safer, healthier, and more peaceful homes, more livable communities, and a deeper sense of place. All we need to do is open our hearts and minds to real values to realize that nature really and truly does provide the infrastructure for humanity and our built environment.
Dr. Phillip Dustan, Professor of Biology, College of Charleston,
and Green Committee member
OF OUR BUILT ENVIRONMENT
The use of native plantings reduces the need for more irrigation, saves money and absorbs stormwater while reducing runoff.
Spartina marshes have always been nature’s own filtration system that cannot be duplicated by any known human technology while providing us with birds to watch, shrimp, fish and oysters to eat and beautiful vistas.
Credit: Wertimer & Associates
Credit: Phillip Dustan
68

Sustainable Communities Goals, Actions & Recommendations ACTIONS 1. Plan future growth to use land
efficiently and reduce vehicle emissions.
A. Encourage compact, complete and mixed use communities.
B. Encourage infill development and the retrofit of suburban areas.
C. Encourage sustainable “Traditional Neighborhood Design.”
D. Encourage affordable housing. E. Encourage local, sustainable food
production. F. Coordinate infrastructure
decisions with other government entities to support sustainable development by way of the actions listed previously (C-1A through C-1E).
2. Plan where growth occurs, then plan transportation accordingly.
A. Plan sustainable neighborhoods, then plan transportation to support them, rather than allowing poorly-planned roads to create sprawl.
B. Create a regional public transit plan and a citywide “multimodal” transportation plan, then encourage “transit-oriented development.”
3. Encourage sustainable engineering standards.
A. Revise engineering standards to minimize water pollution, reflect “nature as infrastructure” principles, and use less energy.
B. Reduce the “urban heat island effect.”
C. Develop sustainable parking strategies.
D. Remove roadblocks to sustainable development.
4. Create a sea level rise adaptation plan.
5. Create public education
programs.
C1. PLAN FUTURE GROWTH TO USE LAND EFFICIENTLY AND REDUCE VEHICLE EMISSIONS C-1A: Encourage compact, complete and mixed use communities. Automobile use is a major contributor to greenhouse gas emissions. Yet sprawl development separates our homes from workplaces, schools, and shopping, forcing us into our cars. At the same time, sprawl isolates people, promotes sedentary behavior, erodes a sense of community, and turns unique local landscapes into “Anywhere, U.S.A.”
Given the interrelated nature of the Sustainable Communities recommendations, several overlapping quantifiable measures could be attributed to this chapter. See page 21 for measurable effects of related strategies.
69

Fortunately, there is no need to remain prisoners of sprawl. Development is based on local planning codes, along with public investment and market forces. We can change planning codes and direct public investment to create more diverse choices for city residents. We can also offer incentives for developers to create communities that integrate work, school, play, and home life. Added benefits include protection for clean water, agricultural land, and native habitat throughout the region.
Specific Recommendations • Context-Sensitive Planning: The City
should adopt a settlement code that encourages compact, complete and mixed use communities in urban, sub-urban and rural contexts. This code would reflect the special qualities of each area of the city (i.e. Peninsula, West Ashley, James Island, Johns Island, Daniel Island and Cainhoy). Currently, one type of planning tool for this purpose is “transect-based.”1 Transect-based planning divides a metropolitan area into precise zones, ranging from the urban core to natural areas. Design standards vary logically according to the zone. In the future, other, better models may be developed. At that time, the City can consider these alternatives. (See Glossary for more on “context-sensitive” and “transect-based” planning.)
• Sustainable Development Standards: Settlement codes should promote complete, compact, and sustainable neighborhoods and communities, drawing from such models as the historic districts on the Charleston peninsula, as well as from such publications as the City of Charleston’s 2008 Preservation Plan, SmartCode, LEED-ND, Canons of Sustainable Architecture & Urbanism, and the Awahnee Principles. These standards should yield a range of
densities, including establishing minimum densities where appropriate; provide a variety of housing opportunities/choices (including workforce housing); use “form-based codes” that encourage mixed uses; facilitate community-scaled civic and institutional uses (i.e. neighborhood schools); create connected, multi-modal street networks; provide appropriate recreational and open space; and protect significant natural areas; including native habitat and wildlife corridors throughout the city. (See Glossary for more on “form-based codes.”)
• Incentives: Incentives should be
offered to developers willing to build complete, compact, and sustainable communities. These could include waived impact fees, streamlined permitting, and, if possible, assistance in obtaining public financing. Also, impact fees should be based on actual impact. (See Glossary for more on “impact fees.”)
• Urban Growth Boundary: Context-
sensitive (urban to rural transect) planning is mapped from city centers and gathering places outward to an Urban Growth Boundary (UGB), beyond which development codes reflect the increasing rural nature of the area. As part of the next comprehensive plan update, the City should review its UGB for consistency and completeness. Particularly in Berkeley County, the City should map important natural and agricultural resources and evaluate growth projections, then determine how much new land is needed to accommodate future development. Throughout the city, a high priority should be given to directing new development toward infill and retrofitting suburban areas. In future
70

plan updates, the entire UGB should be reevaluated using the process described above. (See Glossary for more on “Urban Growth Boundary.”)
• Thoroughfare Standards: Consistent
with context-sensitive settlement codes, the City should adopt different street design standards for different communities. Current standards tend to mandate wider streets, and are the same whether the street is in historic downtown Charleston or suburban West Ashley. Instead, the new standards should encourage walking, biking, and neighborhood activity. Future investment in maintenance and waste collection vehicles should be consistent with the new thoroughfare standards.
• Community Planning and Outreach:
Context-sensitive settlement codes should be created with significant community involvement so that communities have the opportunity to become comfortable and familiar with the principles of sustainable design. Focusing on one community at a time, as department budgets permit, planning staff should conduct “charrettes,” or detailed design workshops, in West Ashley, James Island, Cainhoy, the Peninsula, etc. After each charrette, planning staff should recommend changes to the comprehensive plan. These recommendations would be referred to the Planning Commission and City Council for approval and addition to the area plan. (See Glossary for more on “charrettes.”)
• Planned Unit Developments: As the
City moves toward context-sensitive settlement codes, it should require that all Planned Unit Developments (PUDs) be designed to be context sensitive. Also, PUD standards should be revised to
include sustainable development requirements. Once new codes are adopted, PUD’s would no longer be needed and should be eliminated to avoid confusion and inconsistent requirements. (See Glossary for more on “Planned Unit Development.”)
C-1B: Encourage infill development and the retrofit of suburban areas. The Charleston Post & Courier recently reported that approximately 135,000 homes were planned for the Charleston metropolitan area. Of these homes, 114,000, or about 85%, will be built beyond I-526, creating more sprawl and increasing auto emissions. Sustainable cities are built on an entirely different model. Growth is directed toward underutilized “infill” sites closer to the urban core. In these areas, existing buildings can often be adapted, and natural landscapes protected or restored. Infill development reduces auto emissions, provides easy commutes, creates vibrant neighborhoods, and also saves taxpayers significant infrastructure costs. Sustainable cities also “retrofit” their suburbs, making these areas less auto-dependent and more appealing to homeowners. At the simplest level, a suburban retrofit can involve inserting mixed-use residential pockets and town centers – some with significant public amenities – among existing office parks, malls, and subdivisions. The most sustainable suburban retrofits emphasize the creation of “transit-worthy” communities. Such communities are dense enough to support public transit (at least 4 – 15 dwelling units per acre depending on the type of transit), and can conveniently be
71

linked with one another for that purpose. (See Glossary for more on “transit-worthy” communities.”) Such projects not only reduce auto emissions by making alternative transportation feasible and strengthening street networks. They also mitigate traffic congestion, meet affordable housing needs, and create vibrant communities that provide residents with services and activities closer to home.
Specific Recommendations • Inventory: The City should conduct a
"room-to-grow" inventory of the City, i.e. an analysis of underutilized or poorly designed properties, to determine how much growth can be accommodated. Areas surrounding current and future public transit stops should receive especially careful attention.
• New Infill Standards: The City should
modify its comprehensive plan and zoning codes to encourage infill development, permitting mixed uses and traditional neighborhood design in these areas.
• New Suburban Retrofit Standards: The
City should modify its comprehensive plan and zoning codes to encourage the retrofit of suburban areas, permitting mixed uses and traditional neighborhood design in these areas. Specifically, the City should adopt a Century V Comprehensive Plan Amendment dealing with suburban retrofits and simultaneously adopt codes and regulations that encourage the use of sustainable design standards such as LEED-ND. Suburban retrofits should include a strengthened street network.
• Incentives: The City should provide incentives for infill development and suburban retrofits, possibly including waived impact fees, streamlined permitting, and/or assistance in obtaining public financing. The City is encouraged to establish a Redevelopment Authority to evaluate financial incentives such as Tax Increment Financing (TIF), Municipal Improvement Districts (MID), property tax abatement, impact fee abatement, public-private partnership, affordable housing funds, Local Development Corporation (LDC) funding, transportation funding for transit housing, and other funding sources relevant to infill development and suburban retrofitting. The Redevelopment Authority or the City could also take the lead in coordinating with financial institutions, including local community banks, likely to respond positively to redevelopment projects, in addition to educating these institutions about successful ventures elsewhere in order to increase their comfort level and the likelihood of successful investment.
C-1C: Encourage Sustainable “Traditional Neighborhood Design.” “Traditional Neighborhood Design,” or TND, refers to neighborhoods that look and function like traditional towns, with minor updates to meet modern standards. TND is sustainable because it is walkable, contains mixed uses, reduces auto-depencency, provides jobs in neighborhoods, and preserves quality open space. TND makes it easy to walk or bike to essential services, and provides neighborhood amenities that encourage people to play and socialize near their homes. These include everything from street furniture under shade trees to urban
72

squares and village greens appropriate for festivals and community events. Also, TND developments provide density that is sufficient to support public transit (i.e. 4 – 15 dwelling units per acre depending on the type of transit). The primary obstacle in building a TND development is outmoded zoning codes that actually outlaw traditional neighborhood features and separate residential from commercial uses.
Specific Recommendations • Design Standards: Zoning codes should
be amended to permit traditional neighborhood features that support biking, walking, and neighborhood gatherings. These could include, for example, mixed uses, nearby parks and civic buildings, reduced lane widths, reduced right-of-way (ROW) widths, bundling of ROW utilities, smaller lots, and even smaller homes. Such flexibility not only allows developers to create bicycle- and pedestrian-friendly neighborhoods; it also frees more land for public green space.
• Retail and Services: Zoning codes
should also be amended to ensure that neighborhood retail and essential services can be included in plans for all new development and redevelopment, including infill, suburban retrofit, and “greenfield” development that converts rural land to urban uses. Concepts such as the five-minute walk, the pedestrian shed, and mixed use centers should be included in this planning. Further, planning should go beyond small corner stores to include convenience stores (10,000-30,000 sq. ft.) and typical neighborhood centers (60,000-80,000 sq. ft.) (See Glossary for more on “pedestrian shed.”)
• Research & Collaboration: To the
extent that City budgets permit, the process of amending zoning codes to permit TND development should include retail expertise and examination of successful case studies, including financing scenarios and public-private partnerships. It should also include, to the extent possible, coordination with financial institutions and the Local Development Corporation (LDC), which could potentially help developers access Community Development Block Grants.
• Priority Investment Act: In its efforts
to promote TND, the City should evaluate the S.C. Priority Investment Act, signed into law in 2007 to amend the Local Government Comprehensive Planning Enabling Act of 1994. This law allows local governments to identify “priority investment zones” in which they can eliminate nonessential regulations and use market-based incentives to encourage TND. Incentives may include, but are not limited to, density bonuses, streamlined permitting, design flexibility, reduced or waived fees, and relaxed zoning regulations such as lot area requirements or setbacks. Note: local governments must incorporate this law into their existing comprehensive plans during their next five-year review or update, which for Charleston occurs in 2009-10.
C-1D: Encourage affordable and workforce housing. The recommendations listed previously (C-1A through C-1C) – which encourage compact development, infill development, suburban retrofits, and Traditional Neighborhood Design – can all help increase the City’s supply of affordable housing. Additional measures should also be taken to promote affordable and workforce housing because it is vitally important that people
73
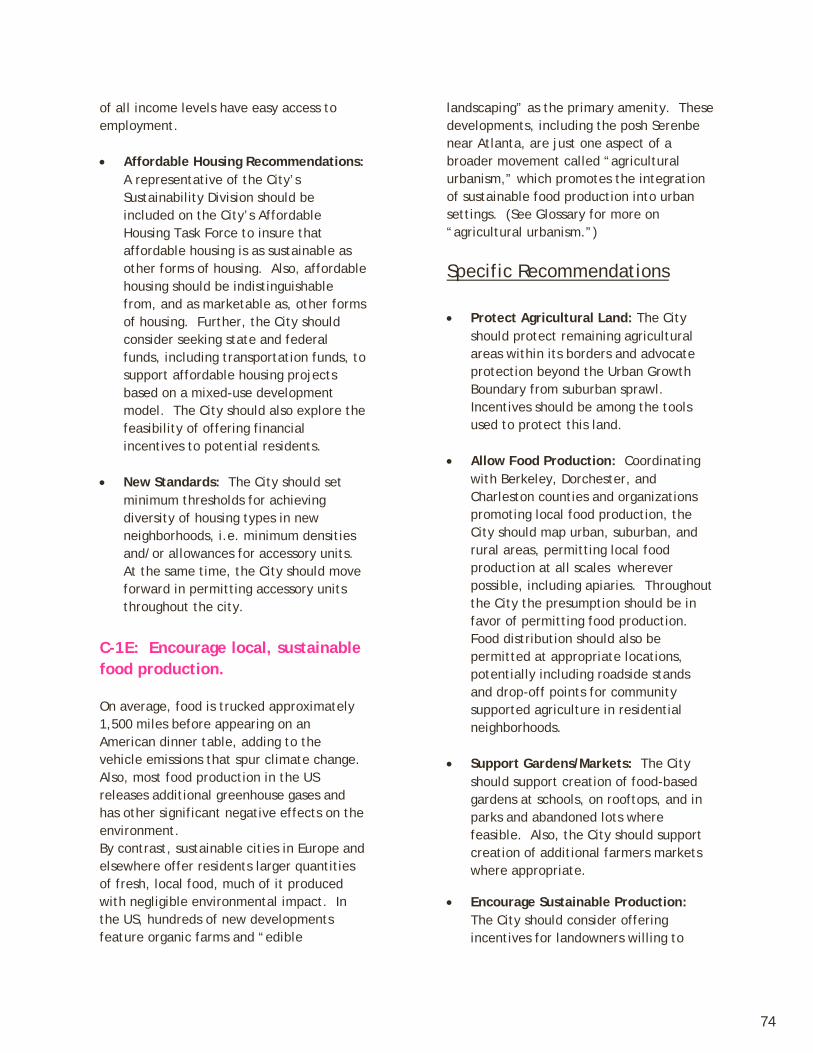
of all income levels have easy access to employment. • Affordable Housing Recommendations:
A representative of the City’s Sustainability Division should be included on the City’s Affordable Housing Task Force to insure that affordable housing is as sustainable as other forms of housing. Also, affordable housing should be indistinguishable from, and as marketable as, other forms of housing. Further, the City should consider seeking state and federal funds, including transportation funds, to support affordable housing projects based on a mixed-use development model. The City should also explore the feasibility of offering financial incentives to potential residents.
• New Standards: The City should set
minimum thresholds for achieving diversity of housing types in new neighborhoods, i.e. minimum densities and/or allowances for accessory units. At the same time, the City should move forward in permitting accessory units throughout the city.
C-1E: Encourage local, sustainable food production. On average, food is trucked approximately 1,500 miles before appearing on an American dinner table, adding to the vehicle emissions that spur climate change. Also, most food production in the US releases additional greenhouse gases and has other significant negative effects on the environment. By contrast, sustainable cities in Europe and elsewhere offer residents larger quantities of fresh, local food, much of it produced with negligible environmental impact. In the US, hundreds of new developments feature organic farms and “edible
landscaping” as the primary amenity. These developments, including the posh Serenbe near Atlanta, are just one aspect of a broader movement called “agricultural urbanism,” which promotes the integration of sustainable food production into urban settings. (See Glossary for more on “agricultural urbanism.”)
Specific Recommendations • Protect Agricultural Land: The City
should protect remaining agricultural areas within its borders and advocate protection beyond the Urban Growth Boundary from suburban sprawl. Incentives should be among the tools used to protect this land.
• Allow Food Production: Coordinating
with Berkeley, Dorchester, and Charleston counties and organizations promoting local food production, the City should map urban, suburban, and rural areas, permitting local food production at all scales wherever possible, including apiaries. Throughout the City the presumption should be in favor of permitting food production. Food distribution should also be permitted at appropriate locations, potentially including roadside stands and drop-off points for community supported agriculture in residential neighborhoods.
• Support Gardens/Markets: The City
should support creation of food-based gardens at schools, on rooftops, and in parks and abandoned lots where feasible. Also, the City should support creation of additional farmers markets where appropriate.
• Encourage Sustainable Production: The City should consider offering incentives for landowners willing to
74

farm in a way that does not threaten human health, clean water and biodiversity, or exacerbate climate change.
C-1F: Coordinate infrastructure decisions with other government entities to support sustainable development by way of the actions listed previously, C-1A through C-1E.
The SC Priority Investment Act is a 2007 amendment to the Local Government Comprehensive Planning Enabling Act of 1994 which requires a basic level of coordination among local governments, school districts, utilities, etc. as they plan roads, schools, sewer lines, and other public infrastructure. Public infrastructure is often poorly planned and can encourage unnecessary sprawl development in rural areas if not properly coordinated. The motto “plan where you grow, and grow where you planned,” should be cooperatively applied by local government. Note: local governments must incorporate this law into their existing comprehensive plans during their next five-year review or update, which for Charleston occurs in 2009-10.
Specific Recommendations • The City should fulfill the requirements
of the Priority Investment Act during the Comprehensive Plan Update in 2009.
• The City should be a leader and
advocate of regional planning and intergovernmental/interagency coordination. Concerning public infrastructure planning and spending, the City should consider requiring current analysis of impacts, costs, and
benefits of all proposed public infrastructure projects that are not adjacent to existing thoroughfares and/or human settlement of a certain density. The City should use that data to construct an impact fee scale based on actual impact. If legally permissible, the City could use these collected impact fees to establish a revolving fund to assist with City expenses related to infill projects and suburban retrofits.
C2. PLAN WHERE GROWTH OCCURS, THEN PLAN TRANSPORTATION ACCORDINGLY.
C-2A: Plan sustainable neighborhoods, then plan transportation to support them, rather than allowing poorly-planned roads to create sprawl. Often, decisions to build roads are made in isolation from decisions about community development. The result has been broad highways – which in turn spawn commercial strips, attract sprawling residential development, displace working farms, and destroy both native habitat and a local “sense of place.” By contrast, sustainable cities seek first to create vibrant, active neighborhoods, then link them using a “connected” transportation network. Where roads are not well connected, larger streets and freeways promote auto-only travel and traffic congestion. They also increase vehicle miles traveled and consequently increase auto emissions. By contrast, a connected street network offers travelers multiple options. This improves traffic flow, shortens trip lengths,
75
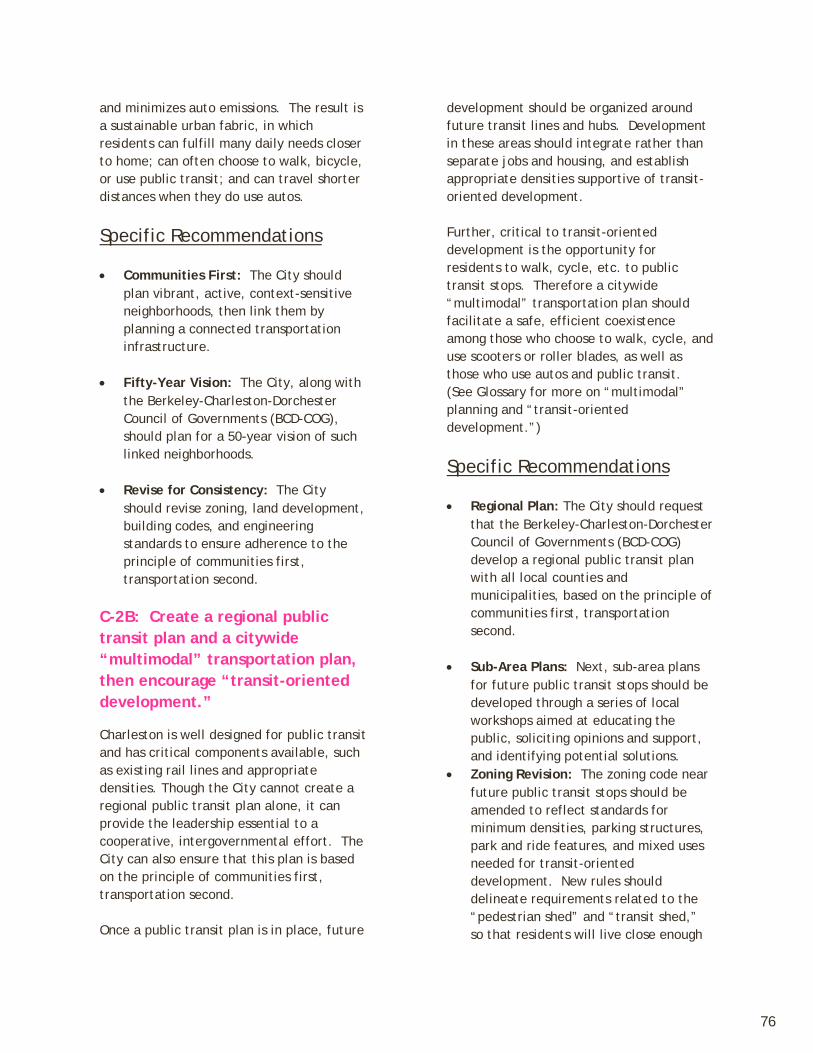
and minimizes auto emissions. The result is a sustainable urban fabric, in which residents can fulfill many daily needs closer to home; can often choose to walk, bicycle, or use public transit; and can travel shorter distances when they do use autos.
Specific Recommendations • Communities First: The City should
plan vibrant, active, context-sensitive neighborhoods, then link them by planning a connected transportation infrastructure.
• Fifty-Year Vision: The City, along with
the Berkeley-Charleston-Dorchester Council of Governments (BCD-COG), should plan for a 50-year vision of such linked neighborhoods.
• Revise for Consistency: The City
should revise zoning, land development, building codes, and engineering standards to ensure adherence to the principle of communities first, transportation second.
C-2B: Create a regional public transit plan and a citywide “multimodal” transportation plan, then encourage “transit-oriented development.”
Charleston is well designed for public transit and has critical components available, such as existing rail lines and appropriate densities. Though the City cannot create a regional public transit plan alone, it can provide the leadership essential to a cooperative, intergovernmental effort. The City can also ensure that this plan is based on the principle of communities first, transportation second. Once a public transit plan is in place, future
development should be organized around future transit lines and hubs. Development in these areas should integrate rather than separate jobs and housing, and establish appropriate densities supportive of transit-oriented development. Further, critical to transit-oriented development is the opportunity for residents to walk, cycle, etc. to public transit stops. Therefore a citywide “multimodal” transportation plan should facilitate a safe, efficient coexistence among those who choose to walk, cycle, and use scooters or roller blades, as well as those who use autos and public transit. (See Glossary for more on “multimodal” planning and “transit-oriented development.”)
Specific Recommendations • Regional Plan: The City should request
that the Berkeley-Charleston-Dorchester Council of Governments (BCD-COG) develop a regional public transit plan with all local counties and municipalities, based on the principle of communities first, transportation second.
• Sub-Area Plans: Next, sub-area plans
for future public transit stops should be developed through a series of local workshops aimed at educating the public, soliciting opinions and support, and identifying potential solutions.
• Zoning Revision: The zoning code near future public transit stops should be amended to reflect standards for minimum densities, parking structures, park and ride features, and mixed uses needed for transit-oriented development. New rules should delineate requirements related to the “pedestrian shed” and “transit shed,” so that residents will live close enough
76

to services and transportation that they can choose not to use automobiles. (See Glossary for more on “pedestrian shed” and “transit shed.”)
• Multi-Modal Plan: The City should
develop a citywide multimodal transportation plan, complete with capital improvement recommendations and funding strategies. Collaboration with Charleston County, BCDCOG, and CHATS is essential. In order to focus on this priority, the City should revise the Comprehensive Plan to do away with mutually exclusive traffic study requirements.
C3. ENCOURAGE SUSTAINABLE ENGINEERING STANDARDS C-3A: Revise engineering standards to minimize water pollution, reflect “nature as infrastructure” principles, and use less energy.
There are many ways the City’s engineering standards can be revised to enhance sustainability. Perhaps the most important revisions are needed to protect our diminishing wetlands and water quality. While the State has jurisdiction over filling wetlands, the City can still do a great deal to protect wetlands and other water resources by how it chooses to manage its stormwater runoff. In populated areas, stormwater runoff contains oil, gasoline, fertilizers, herbicides, and other chemicals that are toxic to aquatic life. Conventional stormwater management systems allow this runoff to spill off pavement and manicured lawns into stormwater drains, then directly into surrounding bodies of water. In addition, frequent flooding results when conventional stormwater systems fail to
drain water as efficiently as natural drainage systems. Alternatively, stormwater systems based on the principle of “nature as infrastructure” capture and filter polluted runoff by mimicking natural drainage systems. These systems also reduce stress on stormwater drains, minimizing flooding. Further, the best “nature as infrastructure” designs can significantly reduce engineering and construction costs. They are also compact and attractive, potentially increasing property values. (See chapter introduction for more on “nature as infrastructure.”)
Specific Recommendations
• Higher Standards for Stormwater: The City should require the use of stormwater systems based on “nature as infrastructure” principles. Techniques include pervious pavements, bioswales and rain gardens, and the combined use of trees and structural soils. The best of these natural stormwater management techniques have been compiled into the “light imprint” standards.2 Light imprint standards are designed to be used with context-sensitive planning, and specify which techniques are most appropriate in which parts of the city. The City’s Storm Water Management Plan and Drainage Manual should be brought into alignment with Light Imprint standards, and the City should expeditiously approve and adopt them. (See Glossary for more on “Light Imprint.”)
• Higher Standards for Buffers: The City
should establish higher standards for protection of water resources, including fresh and saltwater wetlands, going beyond the minimal protection provided by state and federal laws. New standards should include wider natural
77

buffers, with specific requirements for supplemental plantings, native vegetation, and buffer preservation. Further, the City should devise and fund a monitoring and enforcement plan, including meaningful fines.
• Stormwater Fees: The City should
develop a tiered schedule for stormwater fees for all development, commercial and residential, existing and proposed. These fees should be based on actual impact.
• City Properties: New construction on City properties should use exemplary sustainable design for paved areas, landscaping, buffers, and pervious surfaces wherever possible.
• Shoreline Enhancement: The City should create a “Living Shorelines” enhancement program that promotes the use of natural structures instead of conventional engineering to protect and restore damaged shorelines. Programs should encourage planting oyster beds, reducing wake-zones, planting vegetative buffers, etc. This should be undertaken in collaboration with the state’s Office of Ocean and Coastal Resource Management (OCRM) and other local governments. (See Glossary for more on “Living Shorelines.”)
• Wetlands/Water Quality Expertise:
The City should have an ecologist on staff with expertise in natural resource protection, with particular expertise in stormwater management, soils, topography, water quality, and wetlands and critical area protection (including delineation, buffering, habitat protection, and federal, state, and local policies governing these areas.) Further, the City should establish an advisory committee to review standards and enforcement mechanisms and
provide supplementary expertise on wetlands and water quality.
• Essential Data: City planners have
access to a wealth of Geographic Information Systems (“GIS”) data on natural resources, water resources, and drainage information in and around City boundaries. The City’s GIS inventory should be updated with the most current information available from USGS, SCDNR, NOAA, and Coast Guard professional land surveys, plats, site plans, etc. GIS information should include wetlands data, existing topography, critical line data, receiving water bodies, existing outfalls, existing drainage systems, etc. Information should be integrated on a regional basis.
• Collaboration: The City should
continue to collaborate with other local governments on watershed management and public education.
• Additional Standards: The City should
also revise other engineering standards based on national LEED standards – for example, the use of reclaimed materials to increase pavement strength. Further, the City should adopt the 2030 targets for public lighting, reducing energy use and minimizing light pollution by requiring light-emitting diodes, down-lighting, and pathway lighting. Finally, the City should consider eliminating all but the most essential lighting (joining the Dark Skies Initiative), as well as increasing enforcement to address noise pollution.
C-3B: Reduce the “urban heat island effect.”
The “urban heat island effect” occurs when metropolitan areas are warmer than the surrounding countryside. Cities become
78
heat islands because of increased pavement, reduced vegetation, buildings that absorb heat and block wind, and “waste heat” from automobiles, air conditioning, and industry. The Charleston peninsula is often 3-6 degrees warmer than surrounding areas on a summer day, with a much higher differential at night. Warmer urban temperatures increase air conditioning costs, as well as peak energy demand and greenhouse gas emissions. They also diminish quality of life for city residents; facilitate the formation of ozone and other air pollutants; and stress vegetation and aquatic ecosystems. One of the most effective ways to reduce the urban heat island effect is to plant shade trees. Another is to create “green roofs” -- that is, soil installed on the top of buildings and planted with a variety of vegetation. Both strategies have important additional benefits. Trees reduce stormwater runoff by intercepting and diminishing the impact of rainfall and by making the soil more porous. This causes the water to drain into the soil or onto paved surfaces at a much slower rate, decreasing the possibility of overwhelming stormwater systems or other drainage patterns. As a result, groundwater is recharged, flooding is reduced, and pollutants are filtered naturally rather than poured directly into creeks and rivers. Both trees and green roofs capture carbon dioxide (a potent greenhouse gas); provide wildlife habitat; and create a more beautiful and more peaceful urban atmosphere. Other strategies to reduce heat include the use of light-colored, reflective roofing and pavements.
Specific Recommendations • Multigenerational Tree Canopy: The
Plan should promote a diversity of long-lived tree species chosen for their environmental benefits, including heat reduction, carbon sequestration, and runoff retention. (See Glossary for more on “Multigenerational Tree Canopy.)
◊ Master Plan and Coverage Goal: The City should develop an Urban Forestry Master Plan, beginning with an Urban Forest Effects Model of the City’s existing urban forest. Further, the Master Plan should set a citywide tree canopy coverage goal to meet or exceed 40%, with specific goals set for different areas and for new and existing development.
◊ Public Land: The City should
invest in a multigenerational tree canopy on public land. This requires not only protecting the existing canopy of mature trees, but also planting on a regular schedule to replace these trees. It is important to select a diversity of tree species, focusing on native species and those that conserve water. Further, the City should give as high a priority to urban planting as it does to planting in suburban and rural areas.
◊ Private Land: Through its land
development standards and through the use of incentives, the City should promote the planting of shade trees and the use of native vegetation and natural backyard buffers on private land. Further, existing shade trees on private land should be replaced if removal is necessary.
◊ Stewardship Fee: The City should
advocate a state-level fee for the purchase and planting of new
79

trees by local governments.
• Cool Roofs & Pavements: For new construction on City property, the City should set a high standard by using green roofs and rooftop gardens, as well as light-colored, reflective roofing and pavements. Again, plant species should be diverse, with a focus on native species and those that conserve water. On privately-owned property, the City should use incentives to promote the use of these heat-reduction strategies.
C-3C: Develop sustainable parking strategies.
Large parking lots encourage the exclusive use of single-occupancy automobiles, and also contribute to the heat island effect. By developing new parking strategies, the City can support public transit, bicycling, walking, etc.; minimize environmental impacts; and maximize efficiency.
Specific Recommendations • Diverse Strategies: The City should
implement a variety of parking strategies. These should include shared parking, which allows multiple users to share a single space on a predetermined schedule; and “park once” districts, which allow motorists to park in a central location then access multiple stores and services on foot. Also, the City should consider reduced parking requirements. Further, the City should explore “shared vehicle systems,” now popular in many urban areas, which provide easy access to vehicles from a shared fleet for short periods of time. Shared vehicle systems allow families to reduce their need for multiple cars and reduce the pressure to maximize parking capacity. (See Glossary for
more on shared parking, “park once districts,” and “shared vehicle systems.”)
• Visitor and College Parking: The City
should investigate parking management strategies that relate to out-of-town visitors, as well as college campuses. In both cases the goal should be to discourage the use of single-occupancy vehicles and encourage the use of bicycling, walking, and public transit.
• Multiple Levels: The City should
discourage the creation of single-level parking lots and instead encourage multi-level parking structures with green roofs and sustainable stormwater systems.
• City Parking: All City public parking
lots and garages should use exemplary sustainable design, including pervious surfaces, native landscaping, tree canopies, and sustainable stormwater systems.
C-3D: Remove roadblocks to sustainable development.
Application of many of the sustainable development principles discussed in this plan currently requires variances, rezoning, or an extensive review as part of a Planned Unit Development process – or they are prohibited altogether. Once City codes are amended to permit and promote sustainable development, these barriers and delays should be eliminated. In the meantime, the City should identify and eliminate any barriers to sustainable design and construction in the development review process. The City should offer incentives to developers of sustainable communities. Sustainable development projects should be encouraged and
80

systematically facilitated through practices such as waived impact fees, streamlined permitting, and assistance in obtaining public financing.
Specific Recommendations • Training/Liaison: The City should
invest in training on sustainable design and construction for staff members who review development plans. During a transitional period, the City should establish a special liaison to help guide sustainable development projects through the review process. An objective third-party standard should be used to determine which developers the liaison can assist – for example, LEED-ND.
• Regional Coordination: The liaison and
other relevant staff should also be trained to help developers of sustainable communities coordinate intergovernmental and interagency review (involving, for example, counties or state agencies).
• Process Improvement: The City should
investigate development review processes used in cities friendly to sustainable design and construction, and revise its own process to facilitate sustainable projects.
• Incentives: The City should waive
impact fees, assist with public financing, and guarantee expedited permitting for those developers whose practices meet a certain objective, third-party standard – for example, LEED-ND. Impact fees should be based on actual impact, rewarding developers of infill communities and requiring higher fees for developments far from the urban core.
C4. CREATE A SEA LEVEL RISE ADAPTATION PLAN.
Sea level is conservatively projected to rise at least one foot over the next century. While many nations and communities are taking steps to reduce greenhouse gases, there is already a buildup in the atmosphere, and Charleston will experience some effects of climate change for years to come. Thus, it is essential that the city plan to adapt to projected impacts.
Specific Recommendations
C-4A: Establish a commission to create the plan.
The City should empanel a “Blue Ribbon” commission, representing local stakeholder groups. The commission should be established as soon as possible, and should be charged with developing this plan within one year.
• Impacts: The plan should identify
potential short-term, mid-term, and long-term impacts of climate change scenarios likely to affect the City. Issues to be addressed include accelerated sea level rise; increased flooding; intensification of tropical storms; drought; saltwater intrusion into coastal rivers and aquifers; increases in pollen and mold spores; increases in heat-related illness; increases in ground-level ozone; impacts on the insurance and tourism industries; loss of homes and communities; displacement of residents; wildlife and fishing impacts; and insect vectors.
• Options: The plan should identify
policy options for addressing the impacts of climate change on residents (particularly temperature-sensitive
81
populations); vital infrastructure and public facilities; economic systems; energy systems; transportation systems; communications systems; natural systems (including farmland, forests, and wetlands); and all other areas of concern throughout the city.
• Process: The commission should: (1)
review available reports and state and national adaptation plans; (2) create an inventory of adaptation policy options, relying on examples from flood-prone communities like New Orleans and Holland; (3) analyze the cost-effectiveness of these options, as well as the potential risks and costs associated with inaction; (4) prioritize selected policy options based on the certainty and severity of adverse impacts to citizens, ecosystems, and local economies; (5) include suggested policies to be used in considering major capital investments; (6) include a plan and suggested sources of funding for developing accurate assessments of sea level rise; (7) include a plan and suggested sources of funding for public education and outreach; (8) provide specific goals, as well as a time line, for recommended actions; and (9) call for periodic update of the plan (at least every five to ten years.)
C-4B: Involve all affected agencies
and sectors.
The commission should involve and coordinate with all appropriate federal, state, and local agencies (e.g. NOAA, DHEC), organizations (e.g., Save The Lowcountry Coalition), and institutions (e.g., universities) to ensure that all potential impacts and solutions are identified. Further, the plan should complement and be coordinated with related efforts, including:
• Emergency Response: State and local emergency management response plans address short-term responses to natural disasters, including violent storms.
• CECAC: The Governor’s Climate,
Energy, and Commerce Advisory Committee (CECAC) developed a state Climate Action Plan which specifically addresses adaptation.
• OCRM: The Office of Ocean and Coastal
Resource Management (OCRM), a division of the state Department of Health and Environmental Control (DHEC), has formed a Shoreline Change Advisory Committee. The Committee’s charge is to identify research needs and policy options to address storms, coastal erosion, and sea level rise.
C-4C: The plan should be implemented with reasonable speed.
Public education and outreach efforts about the need for adaptation should begin immediately. “Low-hanging fruit” opportunities should be addressed as rapidly as possible, and proactive adaptation initiatives should begin within the next two to three years.
C5. CREATE PUBLIC EDUCATION PROGRAMS
The City has access to a wide range of resources related to public education, both within its various departments and among the public agencies and non-profit groups whose missions include educating Charleston residents about sustainable community planning and development. In educating the public about the Climate Change and Sustainability Plan, opportunities for collaboration abound.
82

Specific Recommendations • City Departments: Both internally and
with the public, City departments should continue to build awareness about the benefits of sustainable development models, including compact communities, urban infill, and suburban revitalization.
• Collaboration: City departments should
collaborate with public agencies and non-profit groups to accomplish this goal, thereby making the most of limited resources.
83

84
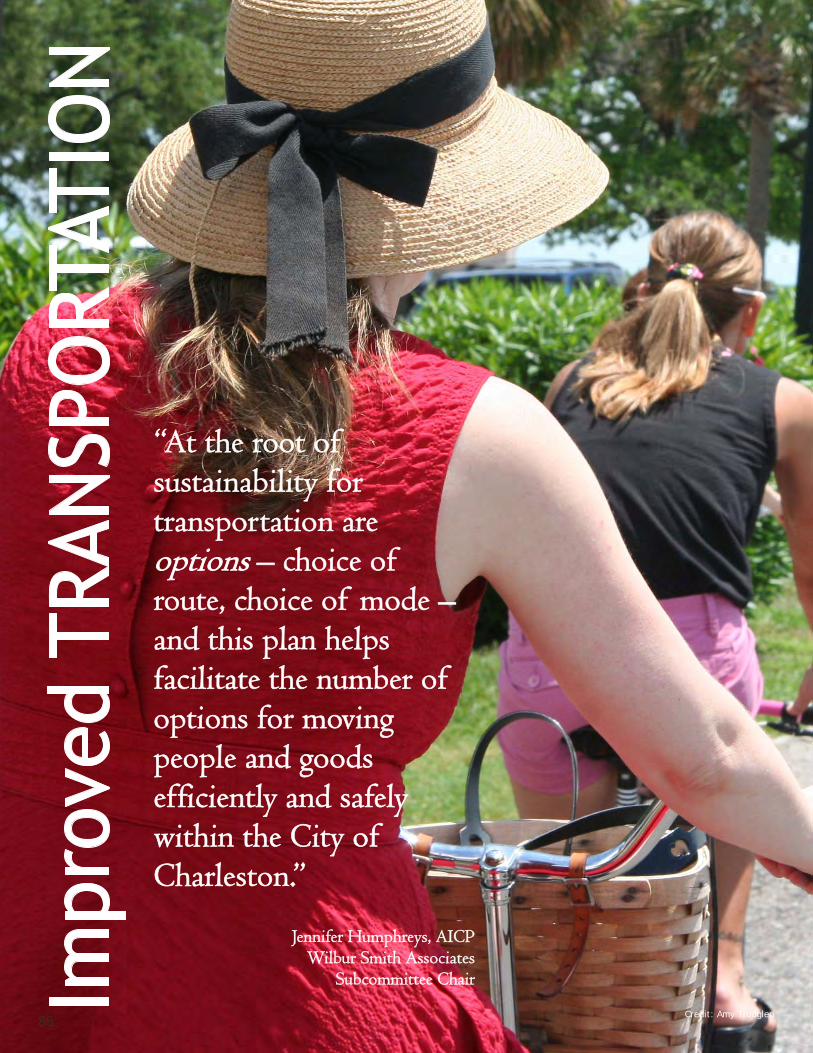
“At the root of sustainability for transportation are options – choice of route, choice of mode – and this plan helps facilitate the number of options for moving people and goods efficiently and safely within the City of Charleston.”
Jennifer Humphreys, AICP Wilbur Smith Associates
Subcommittee Chair
Credit: Amy Trodglen 85

he previous chapter mentioned that 40% of Charleston’s greenhouse gas emissions are
transportation related. This chapter continues the discussion about how to minimize transportation-related emissions. It seems that an obvious way to reduce these emissions would be to improve vehicle and fuel technologies. But it turns out that, by itself, this cannot succeed. Even though vehicle and fuel technologies are advancing quickly, the total number of miles traveled in vehicles is expected to rise.1 As the graph shows, between 1980 and 2005, the number of miles Americans drove grew three times faster than the population. This trend is expected to continue into the near future. Between 2005 and 2030 the number of miles driven is expected to grow 48% -- more than twice the population growth of 23%.2 In the Charleston region, the rate of population growth and increase in Vehicle Miles Traveled (VMT) is expected to align more closely than this
national trend. According to the Berkeley-Charleston-Dorchester Council of Governments (BCDCOG) Long Range Transportation Plan (2003), the region’s population is expected to grow by 34.6% from 2003 to 2030, with VMT growing approximately 39% in that same time period. According to the Urban Land Institute, “the United States cannot achieve…large reductions in transportation related emissions without sharply reducing the growth in the number of miles driven.”3 This conclusion is echoed by many groups, including the American Association of State Highway and Transportation Officials (AASHTO), which is now urging that the national growth rate of vehicle miles traveled be cut in half.4
Reducing Vehicle Miles Traveled So why is Vehicle Miles Traveled soaring in the US? Because most newer communities, including Charleston’s suburbs, separate workplaces and schools from residential areas and make residents dependent on automobiles for basic needs. One way to reduce VMT is to rethink community design so that it is easier and safer to bike, walk, or use public transit. Borrowing principles from older areas like the Charleston peninsula, the nation’s new, sustainable communities site homes closer to schools and workplaces, leaving green space to be enjoyed by the whole
IMPROVED TRANSPORTATION ACTIONS 1. Reduce dependence on
single-occupancy vehicles. 2. Increase convenient, reliable
public transportation. 3. Expand bicycle and
pedestrian options. 4. Increase fuel efficiency and
use of biofuels. 5. Improve air quality.
BENEFITS
Protect clean air Improve public health Reduce traffic
congestion Reduce traffic noise
Enhance quality of life
Slow Climate Change Raise Awareness
Source: Federal Highway Administration. “Vehicle Registrations, Fuel Consumption, & Vehicle Miles of Travel as Indices,” Highway Statistics 2005.
86

population. This provides expanded transportation options that past development patterns did not support. On average, residents of new, sustainable communities drive 20% to 40% less than in traditional suburban communities. Even better, residents of Atlantic Station in mid-town Atlanta average 8 VMT per day, compared to the regional average of 32 VMT per day.5 Instead of using cars, Atlantic Station residents are walking, biking in dedicated lanes, or using a free trolley that carries 60,000 people per month to and from a nearby transit site. Also, the complex features a “commuter café” where people can find out about mass transit, car- and bike-sharing, and other sustainable commuting options.6
More Ways to Reduce VMT
Beyond recommending that the City encourage sustainable community design, this plan also recommends that the City take additional steps to reduce Vehicle Miles Traveled. Before discussing these recommendations, it should be noted that the City is already making important progress in this area: Commuter Rail: State funds have been requested to create a commuter rail line between Summerville and Charleston. The estimated cost of $75 million to initiate commuter rail service is a modest investment
CHARLOTTE LIGHT RAIL A BIG SUCCESS
In November 2007, the City of Charlotte opened a light rail line between its downtown area and the suburban South End. Within months the line was carrying nearly twice the number of weekday riders anticipated. Weekday ridership was expected to be 9,100 in the first
year. Instead, ridership averaged about 16,500 in June 2008.8 Interestingly, 72% of Charlotte’s light rail riders are new to public transit, with large majorities better educated and more affluent than the City’s bus passengers.9 Also, public transit ridership increased across the board by 16% after the light rail opened, easing fears that light rail would simply steal ridership from bus lines.10 Another success attributed to the new light rail is that it was designed to become a magnet for “transit-oriented development” – higher-density, mixed use communities deliberately created along the rail line. This transit planning was thoroughly integrated to foster economic development goals. In 2005, one report said that “the momentum of economic development in this corridor in anticipation of light rail has been outstanding,” with property values along the corridor increasing 89% between 2001 and 2004.11 City officials encouraged this trend by creating special transit-oriented zoning near the rail line. Thousands of new dwelling units have been built or are planned in these areas.12 As the City continues to encourage and approve new projects,13 Charlotte’s transit authority estimates that development along the rail line could total $1.5 billion by 2011.14
87

compared to the cost of design, rights–of-way acquisition, and construction for adding more lanes to Interstate 26. Charleston’s Mayor Riley strongly supports the commuter rail idea, saying, “I think the reasonable human expectation should be that people will use it like crazy.”7 Bicycle & Pedestrian Network: Charleston is also expanding biking and walking routes, as well as installing new bike racks throughout the downtown commercial district. Recent successes include a bike lane on the new Ravenel Bridge that continues on East Bay Street; a bike and walking path along the Ashley River; and extensions of the West Ashley Bikeway and Greenway among others especially regional connections. Another potential project is a bike lane on the Ashley River Bridge that connects the West Ashley Greenway to the Peninsula. Moreover, in May 2009, the City made a commitment to seek “Bicycle Friendly Community” status from the League of American Bicyclists. This will require creating a more complete network of bike routes and expanding efforts to promote bicycling. This plan also recommends that the City work with state and regional partners to: Promote more alternatives to single occupancy vehicles. Strategies include considering support for programs that reward employees for carpooling, walking, biking, or using public transit; designing new “complete streets”
The growing pedestrian and biking greenways serve as alternatives to vehicular travel.
Sidewalks, crosswalks and trees make neighborhoods more walkable and safer.
88
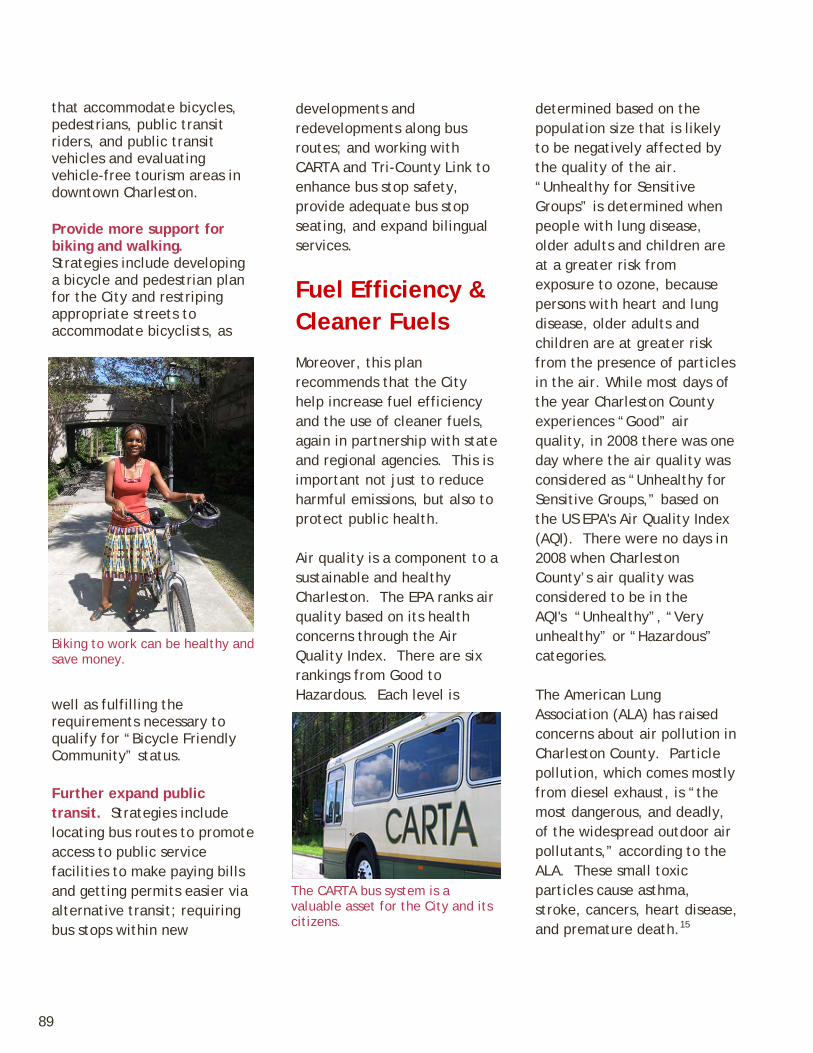
that accommodate bicycles, pedestrians, public transit riders, and public transit vehicles and evaluating vehicle-free tourism areas in downtown Charleston. Provide more support for biking and walking. Strategies include developing a bicycle and pedestrian plan for the City and restriping appropriate streets to accommodate bicyclists, as
well as fulfilling the requirements necessary to qualify for “Bicycle Friendly Community” status. Further expand public transit. Strategies include locating bus routes to promote access to public service facilities to make paying bills and getting permits easier via alternative transit; requiring bus stops within new
developments and redevelopments along bus routes; and working with CARTA and Tri-County Link to enhance bus stop safety, provide adequate bus stop seating, and expand bilingual services.
Fuel Efficiency & Cleaner Fuels
Moreover, this plan recommends that the City help increase fuel efficiency and the use of cleaner fuels, again in partnership with state and regional agencies. This is important not just to reduce harmful emissions, but also to protect public health. Air quality is a component to a sustainable and healthy Charleston. The EPA ranks air quality based on its health concerns through the Air Quality Index. There are six rankings from Good to Hazardous. Each level is
determined based on the population size that is likely to be negatively affected by the quality of the air. “Unhealthy for Sensitive Groups” is determined when people with lung disease, older adults and children are at a greater risk from exposure to ozone, because persons with heart and lung disease, older adults and children are at greater risk from the presence of particles in the air. While most days of the year Charleston County experiences “Good” air quality, in 2008 there was one day where the air quality was considered as “Unhealthy for Sensitive Groups,” based on the US EPA's Air Quality Index (AQI). There were no days in 2008 when Charleston County’s air quality was considered to be in the AQI's “Unhealthy”, “Very unhealthy” or “Hazardous” categories. The American Lung Association (ALA) has raised concerns about air pollution in Charleston County. Particle pollution, which comes mostly from diesel exhaust, is “the most dangerous, and deadly, of the widespread outdoor air pollutants,” according to the ALA. These small toxic particles cause asthma, stroke, cancers, heart disease, and premature death.15
Biking to work can be healthy and save money.
The CARTA bus system is a valuable asset for the City and its citizens.
89

Strategies for reducing fine particle pollution and other harmful emissions include: • Setting high standards for
the purchase, use, and maintenance of fuel-efficient City vehicles;
• Supporting similarly high standards for the CARTA fleet;
• Continuously improving traffic flow;
• Enforcing anti-idling policies and anti-idling programs and technologies; and
• Supporting strict enforcement of speed limits, which reduces fuel consumption.
In addition, this plan recommends that the City support a significant reduction in emissions from truck, train, and ship traffic. Specifically: • Decreasing congestion of
freight corridors by road
The City has a growing fleet of hybrid vehicles with high mileage and low emissions
Proposed street network on Johns Island supporting connectivity between existing and new neighborhoods
and rail to decrease freight travel times; and
• Using cleaner fuels and reducing unnecessary idling by ships, trains, buses, and trucks.
Specifically, this plan urges the City to identify opportunities to participate in the decision making process for policy and actions related to the Port of Charleston and local industries that have a significant impact on fuel efficiency, cleaner fuel, and air quality. In 2008, the Charleston County Medical Society and the South Carolina Medical Association called for a reduction in fine particle pollution, expressing
particular concern about port facilities in and around Charleston.16 The City should play a more prominent role in encouraging emissions reductions from port facilities, industries, and vehicles.
90
Improved Transportation Goals, Actions & Recommendations ACTIONS
1. Reduce dependence on single-occupancy vehicles. A. Keep “vehicle miles traveled”
within the City at the 2010 level. B. Move the City towards a fully multi-
modal transportation system. C. Adopt and implement a Complete
Streets Ordinance. D. Support employer-based programs
that encourage alternative transportation.
E. Encourage vehicle-free tourism.
2. Increase convenient, reliable public transportation. A. Support collaborative programs that
encourage the use of public transit. B. Show visible support for public
transit through the location of city events and public service facilities.
3. Expand bicycle and pedestrian options. A. Adopt and implement a city bicycle
and pedestrian plan. B. Restripe corridors for bicycle use. C. Acquire “Bicycle-Friendly
Community” status. D. Provide incentives for City
employees to commute or conduct business using bicycles.
4. Increase fuel efficiency and use of biofuels. A. Set high standards for the purchase,
use, and maintenance of City vehicles.
B. Support reduction of emissions from freight-related diesel trucks, trains, and ships.
C. Support strict enforcement of speed limits.
D. Study the benefits of providing free or preferred parking for high-efficiency vehicles on City and County lots and decks.
E. Improve vehicle flow by using transportation system management.
F. Support anti-idling programs and technologies.
G. Research a property tax assessment on vehicles that is based on emissions rather than value.
H. Support purchase, use, and appropriate maintenance of high-efficiency vehicles for the CARTA fleet.
5. Improve air quality A. Reduce emissions from small-motor
equipment. B. Raise public awareness of the need
to reduce air pollution outdoor burning and emissions from inefficient, outdoor wood-burning stoves. Educate the public on the existing laws and available cleaner-burning technologies and materials.
T1. REDUCE DEPENDENCE ON SINGLE OCCUPANCY VEHICLES T-1A: Keep “vehicle miles traveled” within the City at the
Quantifiable measures could achieve 32% of 2030 reduction goal (equal to 355,517 mtCO2e). See page 21 for details.
32%
91

2010 level. Summary of specific issues: Vehicles occupied by one person (“single-occupancy vehicles” or SOVs) generate much greater greenhouse gas emissions per passenger-mile than carpools or public transit. SOVs also increase traffic congestion, which itself increases emissions due to traffic idling. In order to reduce dependence on SOVs, the City’s primary goal should be to stabilize, or eventually reduce, the total annual “vehicle miles traveled” (VMT) within the City. This would provide the largest possible reduction in greenhouse gases by the largest group of people. Strategy/Action Plan: City staff should establish a method for quantifying VMTs within City limits, one that can be documented and monitored annually. The inventory should be GIS-based and cover all streets maintained by the City. Ideally, traffic counts for these streets will be regularly updated so that changes can be monitored. In addition, reducing VMT should become a cornerstone of future comprehensive land use and transportation planning goals for the City. (See Recommendation C1.) Implementation responsibilities/assignments: The departments of Planning, Preservation, and Sustainability, Economic Innovation, and Traffic and Transportation should be responsible for creating this inventory, combining GIS skills with the skills needed to measure traffic counts. Regional partners for funding and implementation: To minimize cost, assistance should be sought from regional partners. Many data may already be collected and on a collection schedule. Potential partners include: the Berkeley-Charleston-Dorchester Council
of Governments (BCDCOG);
South Carolina Department of Transportation (SCDOT); and
Charleston County RoadWise Program. Benefits anticipated, aside from greenhouse gas reductions: Improved air quality and improved public health, both from cleaner air and more walking, cycling, etc. Also, a reduction in VMT means less traffic congestion, enhancing quality of life. Timeline for implementation: The initial inventory of City streets and traffic counts can begin immediately, in 2009. GIS based street data and a robust traffic count database are readily available and free of charge. By setting the goal of sustaining VMTs for the year 2010, it is intended that the database be complete and ready for annual updates beginning in 2010.
T-1B: Move the city toward a fully multi-modal transportation system. Summary of specific issues: The City should continue to identify, enact, and enforce policies that support multi-modal transportation of people and goods. This will require significant changes in policies governing community development and redevelopment. Communities should be located and designed to support all transportation modes, including public transit, bicycling, and walking. (See Recommendation C1.) Strategy/Action Plan: The City should enact a citywide multi-modal transportation plan as part of the City Comprehensive Plan. The plan will identify transportation solutions to support land use decisions on a corridor level, preserving system connectivity and thoroughfares. The following should be considered: • Multiple modes of transportation • Corridors with significant congestion • Regional connectivity
92

• Network connectivity • Identification of transit nodes, and
encouragement of “transit-oriented” development
Further, the City should include policies that will reduce dependence on SOVs, such as: • Partnering in Travel Demand
Management Programs that sponsor, coordinate, and encourage carpools, vanpools, and group-based transportation,
• Creating a permitting system that offers incentives for developments that support alternatives to SOVs,
• Participating in regional transit planning initiatives (bus and rail planning activities).
Because transit service is both costly and regional in nature, the City should strengthen and create necessary partnerships, continuing to play a significant role in regional transit planning through BCDCOG. This planning should include bus, rapid bus, commuter rail, light rail, and/or any other modes deemed reasonable. Implementation responsibilities/assignments: Most of the responsibility for implementation lies with the Department of Planning, Preservation, and Sustainability in coordination with the Department of Traffic and Transportation and regional partners. Regional partners for funding and implementation: Many agencies, including Charleston County, the SCDOT, and BCDCOG, are involved in transportation planning. Specifically, BCDCOG has initiated a travel demand management program, making that agency an ideal partner for introducing such programs to businesses within the City of Charleston. Also, the City will eventually share experience and successes with neighboring communities.
Benefits anticipated, aside from greenhouse gas reductions: Health benefits from cleaner air and additional physical activity, as well as an increased sense of community as services and activities become more localized and “community based.” Timeline for implementation: The City’s update of its comprehensive plan in 2009 affords a good opportunity to plan for a multi-modal transportation system. Implementation and enforcement will be gradual over the plan years. T-1C: Adopt and implement a Complete Streets Ordinance. Summary of specific issues: The City should adopt and implement a citywide Complete Streets ordinance. This ensures that all plans for street construction and reconstruction consider the needs of pedestrians of all ages and abilities, bicyclists, transit users, transit vehicles, and other non-automobile users.1 Strategy/Action Plan: The policy should be reviewed by City planning staff, Traffic and Transportation staff, and regional stakeholders including Charleston County and the SCDOT before adoption and implementation by the City. Further, the City should encourage regional stakeholders to incorporate Complete Streets into regional plans. Implementation responsibilities/assignments: City staff should establish a liaison to work with regional stakeholders. Regional partners for funding and implementation: Many regional partners are needed for funding as well as implementation. An initial list includes: • BCDCOG – The regional Metropolitan
Planning Organization has included
93
Complete Streets in the regional long range transportation plan, and has a Complete Streets budget to assist in funding eligible projects in the region.
• SCDOT – The state conducts restriping studies for municipalities within the traffic engineering division of the SCDOT. These studies are done at the request of policy makers on the municipal level.
• Charleston County RoadWise – The Charleston County Sales Tax program.
Benefits anticipated, aside from greenhouse gas reductions: Complete streets increases air quality, physical activity, and overall health; better serves the transportation needs of the elderly, handicapped, and children; reduces traffic congestion; reduces the cost of maintaining roads due to less use by heavy vehicles; and requires no additional funds for planning and engineering evaluation, since existing transportation funds can be used. Timeline for implementation: City liaison with regional partners should establish initial meetings as soon as possible. Implementation will be visible to the public as soon as road improvements are complete. On-going implementation will require vigilance on the part of the City’s liaison with regional stakeholders, as transportation projects are constantly in progress. Through the County RoadWise program, the Charleston Area Transportation Study (CHATS) long range transportation plan, and County resurfacing projects, there are many projects where this policy can be implemented. T-1D: Support employer-based programs that encourage alternative transportation. Summary of specific issues: The City
should offer incentives to employees who use public transit and other SOV alternatives. The City should also support other employers willing to do the same. Strategy/Action Plan: The City should first implement some or all of the following policies, then offer reduced taxes to other employers willing to do the same: • Provide CARTA passes for employees at
discounted rates • Provide preferred or free parking for
carpoolers/vanpoolers • Offer bonuses to employees who use
alternatives to SOVs • Guarantee a ride home in case of
emergency • Eliminate free employee parking Further, the City should educate employers about federal pre-tax benefits associated with transit use, and support mortgage rate incentives for homes purchased near public transit through permitting and public education. Implementation responsibilities/assignments: The City’s Sustainability Director should work with other City staff and employer contacts in the region to implement this plan. Regional partners for funding and implementation: State of South Carolina, SC DOT, CARTA, Tri-County Link, BCDCOG, Charleston Metropolitan Chamber of Commerce. Cost to implement/net savings from implementation: Reduced City tax revenues and, potentially, reduced state fuel tax revenues if gasoline purchases decline. However, reduced use of SOVs reduces roadway maintenance costs. Further, increased SOV use could cause Charleston to exceed federal air quality standards, which would put federal transportation funding at
94
risk. Benefits anticipated, aside from greenhouse gas reductions: Reduced traffic congestion; increased quality of life; and stronger community relationships as more residents commute together. Also, the region may experience an economic multiplier effect as gasoline savings shift toward purchases that provide higher profits for local residents. Timeline for implementation: A community-wide template for implementation can be made available to all regional employers. Later, the success of City-based initiatives can spread to other municipalities in the region. Recommendation T-1E: Encourage vehicle-free tourism. Summary of specific issues: Since tourism is a central to Charleston’s economy, the City should address the transportation demand created by visitors who use their own vehicles to enjoy the City’s attractions. The City should create a plan to limit vehicle use by visitors. Strategy/Action Plan: Strategies could include enhanced public transit, restriction of vehicle travel on certain streets, increased availability of bike rentals, expansion of green taxis and pedi-cabs, and affordable city-perimeter parking with frequent shuttle service. Also, the City should aggressively market these alternatives to visitors. Implementation responsibilities/assignments: Implementation should be coordinated by the City’s Sustainability Director, in partnership with the CVB and the Hotel/Motel Association, who can help with the marketing campaign. Materials can
be distributed to hotel/motel concierges and on travel websites. Regional partners for funding and implementation: BCDCOG’s regional travel demand management program, SCDOT, the Governor’s Council on Tourism and Travel, CARTA, Charleston Metro Chamber of Commerce, Tri-County Link. Also North Charleston Convention Center, Tanger Factory Outlets, Kiawah Island Resort, Wild Dunes Resort and Conference Center, and Charleston Visitors Bureau. Cost to implement/net savings from implementation: The cost of marketing can be spread across stakeholders, including the tourist attractions themselves, the hotel/motel industry, and others in the tourism community. Benefits anticipated, aside from greenhouse gas reductions: Charleston has many strengths: historic setting, access to the waterfront, excellent dining, and her beauty as a walking city. Reducing vehicles on our congested streets would make the city even more walkable than it already is. Marketing the City as a “Green” destination should be pursued as part of a cost-benefit analysis of this program. Consistent with bicycle, pedestrian, running, and other specialty tourism marketing campaigns, “eco-friendly” tourism has emerged as a strong selling point for environmentally-conscious travelers looking to reduce their carbon footprint. Timeline for implementation: Implementation can reasonably be expected by summer 2010.
T2. INCREASE CONVENIENT, RELIABLE PUBLIC TRANSPORTATION
95

T-2A: Support collaborative programs that encourage the use of public transit. Summary of specific issues: The City should strengthen already strong partnerships with CARTA and Tri-County Link, working together to encourage the use of public transit. Strategy/Action Plan: Strategies should include the following: • Require CARTA bus stops and sheds
within new developments and redevelopments along current and proposed CARTA routes: Staff should create an inventory of current CARTA stops, distance between stops and frequency of bus lines to overlay with new/redeveloped residential neighborhoods. Determination of route adjustments and additions should be based on an equidistant measurement between bus stops. The inventory should be GIS-based and should cover all streets presently serviced by CARTA. Provision of “park and ride” lots may be a viable alternative should neither CARTA nor Tri-County Link provide service in close proximity to these development projects.
• Establish public and private
partnerships to increase transit ridership: CARTA and Tri-County Link already have ridership programs involving large regional employers such as MUSC and College of Charleston. Employers of all sizes should also be asked to participate. The Sustainability Director should designate a liaison to help CARTA market this program to Charleston business owners.
• Make public transport more visible and inviting, including additional lighting
to enhance safety: Relatively few people use public transit in Charleston, perhaps because the system has a poor public image – particularly bus service. Many bus stops have no seating, substandard seating, lack rain cover, lack litter control and/or have poor landscaping. Modest investment in waiting area upgrades will put a professional “face” on Charleston’s primary public transit system. While the provision of these facilities is the responsibility of CARTA, the City of Charleston should help improve transit service in the City. The City should create a plan to improve the stops, including solar-powered lighting, benches, rain covers, and trash and recycling receptacles. The City should consider an “adopt-a-stop” program for volunteers, similar to Adopt-a-Highway programs. The City may also wish to consider special “transit teams”, made up of police, trash removal and Parks and Recreation staff to monitor waiting areas on a scheduled basis.
• Support the creation of bilingual CARTA route programs over the next 15 years: All CARTA information should be available in both English and Spanish. This should include CARTA’s website, route maps, on-board signage, and bus stop signage, and should also include bilingual drivers and help-line associates. Further, the Charleston Visitors Bureau may identify other languages of significance for this program, depending on what percent of visitors speak foreign languages.
Implementation responsibilities/assignments: The Sustainability Director should create an action plan to implement these recommendations, including identification and pursuit of funding sources. In most cases, identifying a City liaison to regional transit agencies will
96
suffice, but higher-level City involvement may be necessary to ensure that the City effectively influences regional transit planning efforts. Regional partners for funding and implementation: See above. Benefits anticipated, aside from greenhouse gas reductions: Improved air quality; improved public health from walking to public transit stops; reduced traffic congestion; and a stronger sense of community from sharing transportation, and improved quality of life. Timeline for implementation: This action can begin upon approval from City Council. Recommendation T-2B: Show visible support for public transit through the location of city events and public service facilities. Summary of specific issues: The City should locate meetings, events, and public service facilities where people can easily access them using public transit. Public service facilities include, for example, hospitals, libraries, post offices, homeless shelters, and community centers, Strategy/Action Plan: Strategies include the following: • Continue to advertise CARTA routes
for City meetings and events: Establish a City policy stating that meeting and event sites should be within a five minute walk of CARTA or Tri-County Link route stops. Also, the City Office of Public Information should continue to include public transit information in advertisements for all public events.
• As public service facilities are planned, relocated, or scheduled for retrofit, proximity to public transit should be a priority as decisions are made about location.
Implementation responsibilities/assignments: The Sustainability Director should create an action plan to implement these recommendations. Regional partners for funding and implementation: CARTA and Tri-County Link should both be included in efforts to provide public transit to public services facilities. Benefits anticipated, aside from greenhouse gas reductions: Equal access to city functions and facilities for those who do not use an SOV is a significant public benefit. Timeline for implementation: These recommendations can be implemented immediately at no additional cost to current operations.
T3. EXPAND BICYCLE AND PEDESTRIAN OPTIONS Recommendation T-3A: Adopt and implement a City bicycle and pedestrian plan. Summary of specific issues: Bicycle and pedestrian mobility are key elements of a sustainable transportation network. Bicycle and pedestrian travel already account for more than 6% of all trips to work in the City of Charleston.2 Many areas of the City, such as the downtown area, provide safe travel for cyclists and pedestrians. However, many suburban areas have inadequate facilities. Strategy/Action Plan: The City should
97
develop a plan to promote bicycle and pedestrian transportation and recreation throughout the City and beyond. The plan, which should be developed with community involvement and input from appropriate local and state agencies, should specify how to develop convenient access and ensure safety within an integrated, connected network of streets, trails and other transit corridors. Further, the plan should complement the Charleston Area Transportation Study (CHATS) long range plan and the BCDCOG Regional Transportation Plan. City Council should adopt this plan, including specific, actionable items. A key element of this plan should be a funding and implementation strategy. Funding for construction and maintenance of new transportation facilities is one of the biggest challenges municipalities face. Our goal is to have a dedicated account funded annually through City revenue for bicycle- and pedestrian-related improvements, with reasonable limitations placed on eligible users and the amount and types of expenditures. Ideally, the fund would support multiple smaller projects rather than partially funding just a few larger projects. Implementation responsibilities/assignments: Development of the plan is the responsibility of the City’s Planning, Preservation & Sustainability (PPS) Department. Implementation should involve all departments on some level but especially the following departments: Traffic and Transportation, Parks Department, Public Service Department and Recreation Department.
One of the main goals of the plan will be to integrate the process of planning for bicycles and pedestrians into every planning decision or project construction. The plan should also be integrated into the City’s
overall comprehensive plan with an emphasis on the strong connection between land use and transportation. The Mayor and City Council will be involved in adopting the plan and approving policies and funding. Regional partners for funding and implementation: The City should work closely with SCDOT, Charleston County and CHATS to ensure that projects are appropriately funded and major projects are included in their respective plans. Cost to implement/net savings from implementation: The costs of a comprehensive bicycle and pedestrian plan include both the up-front costs of developing the plan and the costs of implementation over time. The plan may cost between $50,000 and $100,000 while recommendations such as zoning or City code changes cost virtually nothing. The highest costs should be those associated with facility improvements such as path construction or bike lane striping. If combined with road improvements or new construction, these elements should become a modest component of those projects. Much of the savings associated with implementing a bicycle and pedestrian plan will occur much later when congestion and road wear are reduced by increased walking and bicycling. Also, road construction costs may decrease as a result of building pedestrian-scale streets with less width and less associated drainage infrastructure. Benefits anticipated, aside from greenhouse gas reductions: Increased air quality, better public health through increased physical activity, reduced traffic congestion, enhanced recreational opportunities, better quality of life. Timeline for implementation: Funding for a bicycle and pedestrian plan may be included in the budgeting process for the fiscal year following adoption of this recommendation.
98
The development of the plan may then take 6 months and adoption may occur soon thereafter. By the end of 2010, a local plan should be adopted and implementation underway.
T-3B: Restripe corridors for bicycle use. Summary of specific issues: Once outside the Charleston peninsula, most streets connecting neighborhoods are multi-lane, high-speed corridors that provide no accommodations for bicycling. The City has the option of restriping certain roads to create on-street bicycle lanes. Hundreds of cities in the U.S. have used this strategy to create a network of safe, convenient bicycle routes. SCDOT, the Charleston Area Transportation Study (CHATS) Committee, and Charleston County all employ a process for road resurfacing that could easily include such restriping for a minimal increase in costs. Restriping may also include “sharrows,” or shared lane markings, which reinforce correct bicycle direction and indicate exactly where bicycles should travel inside a lane. Strategy/Action Plan: The City should first study its roads to determine those appropriate for restriping. This may be done by either staff or a consultant. To streamline costs and provide consistency, the study may also be done as part of an overall City Bicycle/Pedestrian Plan. The City should then prioritize projects and obtain funding through federal enhancement grant funding, State C-funds (transportation-related funds distributed at the county level), City revenue, or other private or public grant sources. Implementation responsibilities/assignments: The City may initiate a partnership with Charleston County or CHATS because the most likely roads for restriping are major corridors that impact
multiple jurisdictions. The Traffic and Transportation Department, Public Service Department (Engineering Division and Streets & Sidewalks Division) and the Planning Division should be involved. It may be helpful to designate a staff member as a liaison to SCDOT and Charleston County resurfacing programs. The City may also need to apply for funding. Regional partners for funding and implementation:
• CHATS Committee – this regional transportation planning entity prioritizes projects that receive federal funding. It also distributes federal enhancement grant funding and a regional ‘Complete Streets’ fund. • Charleston County – the County maintains a county-wide road resurfacing schedule through in which all jurisdictions participate. The City should work closely with the County to ensure that restriping happens when a road is resurfaced. The County also may approve funding for some projects from the ½ cent transportation sales tax. SCDOT – The State maintains most of the major corridors in Charleston and must approve all restriping plans. In cities around the state, the SCDOT has conducted traffic engineering and design needed to restripe highways.
Cost to implement/net savings from implementation: In the overall cost of road construction or road resurfacing, striping is negligible. It is an option to request that SCDOT do the necessary engineering in-house at little to no cost to the City. The per-mile cost estimates widely reported range between $5,000 and $14,000 including engineering, labor, paint, signage and signals. Benefits anticipated, aside from
99
greenhouse gas reductions: Increased air quality, better public health through increased physical activity, reduced traffic congestion, enhanced recreational opportunities, better quality of life. Timeline for implementation: The recommendation for a restriping plan may be implemented concurrently with other efforts to increase bicycling by creating a comprehensive network. The City is working on an action plan to become a Bicycle Friendly Community and restriping for bike lanes is one of the many items to be implemented. The City may be able to identify some funding and formalize a process for working with the partnering agencies immediately, resulting in a coordinated schedule with Charleston County for resurfacing within the City. T-3C: Acquire “Bicycle Friendly Community” status. Summary of specific issues: A Bicycle Friendly Community, as defined by the League of American Bicyclists, is one where cycling is prevalent and supported by the community. Charleston can achieve this designation by meeting certain criteria – for example, a network of bicycle facilities and a certain level of educational and promotional programs. Charleston already has the climate, terrain and physical attractions to provide a great cycling environment and has been gradually improving its bicycle accessibility. Efforts are underway to achieve this prestigious designation. Strategy/Action Plan: The first thing a Bicycle Friendly Community (BFC) needs is an action plan. A BFC task force has been formed by the Mayor to formulate an action plan. This plan includes: • Adopting a target • Creating a network of bicycle routes,
paths and lanes throughout the entire
community • Establishing information programs to
promote cycling and its benefits • Encouraging employees to commute or
conduct work using a bicycle • Ensuring plans, policies and codes meet
the needs and goals of creating a bicycle friendly community
• Educating bicycle users on the rules of the road and safe interaction with other vehicles and pedestrians
• Enforcing traffic laws to increase safety for all users of the roads
• Promoting intermodal travel by allowing bikes on buses or trains and establishing bike parking at transit stops
• Ensuring City staff have the training available to implement bicycle plans/projects
Once a plan is underway, the task force should complete the application process to the League of American Bicyclists. Implementation responsibilities/assignments: Achieving BFC status will be a community-wide effort led by City elected officials and staff. The newly formed BFC task force includes stakeholders from various areas of the City, bicycle-related organizations, and all relevant City departments. The task force is responsible for creating a BFC action plan and submitting an application. Five task force sub-groups are responsible for completing section of application related to Engineering, Encouragement, Education, Enforcement and Evaluation. Regional partners for funding and implementation: Many of the educational and promotional programs can be accomplished on a regional basis through BCDCOG, while infrastructure improvements rely heavily on projects approved through the SCDOT, CHATS or Charleston County programs. Cost to implement/net savings from
100
implementation: Costs associated with policy and zoning codes will be minimal. Community stakeholders will get involved in educational and promotional programs for very little cost. Costs also include those related to bicycle facilities, which will be incurred on a project by project basis. Cost savings include reduced costs for auto infrastructure; for example, fewer parking facilities or replacing some city motor vehicles with bicycles. Financial benefits include more tourism dollars, increased property values and increased bicycle sales. Benefits anticipated, aside from greenhouse gas reductions: Stronger marketing for tourism, increased air quality, better public health through increased physical activity, reduced traffic noise and congestion, enhanced recreational opportunities, better quality of life. Timeline for implementation: This recommendation is already underway with a goal of receiving “bronze level” designation in the next 18 months. After Charleston receives the BFC designation, the City should continue to implement and evaluate our goals. The process will move from focused efforts to sustained processes through community groups and City departmental planning and decision-making. T-3D: Provide incentives for City employees to commute or conduct business using bicycles.
Summary of specific issues: Bicycles provide efficient, cost-effective transportation. The City should provide incentives for employees to commute or conduct business via bicycle. Strategy/Action Plan: The City already gives employees subsidized CARTA bus passes. This program could expand to include a similar benefit for bicycle
commuters. Business employee bicycle subsidies of up to $20 per month are tax exempt.3 Another way to promote bicycle commuting is to provide shower or changing facilities. City staff can work to identify potential locations in City offices or recreation buildings, or contract with off-site health clubs for showers and locker rooms. The City may also provide bicycles as an option for some work-related vehicle trips. Incentives may be needed to encourage the purchase and use of bicycles by appropriate Departments. Note: when police recover bicycles and their owners cannot be found, the City now makes them available for conducting City business.
Implementation responsibilities/assignments: The purchase of City bicycles should be the responsibility of individual departments. The City’s Department of Human Resources and Organizational Development can implement the bicycle subsidy. The City’s Property Manager should be instrumental in identifying shower/locker facility locations. Regional partners for funding and implementation: Partners may include community groups that sponsor programs or provide grants for purchasing bicycles or maintenance equipment. CARTA could be involved with an effort to combine transit passes with a bicycle subsidy, since most CARTA buses have bike racks for longer-distance commuters. Cost to implement/net savings from implementation: Costs include purchase and maintenance of bicycles and facility upgrades for showers. Potential cost reductions include City-subsidized employee parking, motor vehicle purchase and maintenance, and costs associated with employee health as employees become
101

more active. Benefits anticipated, aside from greenhouse gas reductions: The City could inspire other employers/employees to increase the use of bicycles, reducing traffic congestion and noise pollution. Timeline for implementation: Incentive and employee benefit programs may be studied within the next 8 months and policies in place within the next 12 months.
T4. INCREASE FUEL EFFICIENCY AND USE OF BIOFUELS T-4A: Set high standards for the purchase, use, and maintenance of City vehicles. Summary of specific issues: Despite price fluctuations up to $4 per gallon in August 2008, and despite alternatives entering the marketplace, the United States still relies on petroleum for 97% of the fuel for cars, buses, trucks, trains, planes, and ships.4 At the very least, the City’s own fleet should be moving toward greater fuel efficiency and the use of cleaner fuels. Strategy/Action Plan: Short-term action items should include the following: • Quantify fuel economy for different
classes of City vehicles, which could include passenger, light-truck, truck, bus, and off-road.
• Implement DHEC anti-idling education for City staff and partner organizations.
• Consider the total lifecycle costs, including maintenance, insurance, and resale value, of hybrid, plug-in hybrid, battery electric, and biofuel vehicles.
• Analyze cost/benefit for “plug-in” facilities at City garages.
• Consider delaying procurement when a cost-effective, more fuel-efficient vehicle will be available within two years.
• Add fuel inefficiency as a priority consideration when retiring fleet vehicles.
• Where funding and return-on-investment permits, retrofit City vehicles and equipment with alternative fuels or emissions filters.
• Encourage the use of bicycles, mopeds, motorcycles, and electric vehicles where appropriate.
• Meet the LEED standard for City garages by implementing one of the following LEED options:
◊ Provide low-emitting and fuel-
efficient vehicles for 3% of Full-Time Equivalent (FTE) occupants and provide preferred parking for these vehicles.
◊ Provide preferred parking for low-emitting and fuel-efficient vehicles for 5% of the total vehicle parking capacity of the site.
◊ Install alternative-fuel refueling stations for 3% of the parking capacity of the site (liquid or gaseous fueling facilities must be separately ventilated or located outdoors.)
Low-emitting and fuel-efficient vehicles are defined as vehicles that are either classified as Zero Emission Vehicles (ZEV) by the California Air Resources Board or have achieved a minimum green score of 40 on the American Council for an Energy Efficient Economy (ACEEE) annual vehicle rating guide.
Long-term action items are as follows:
102

• After a majority of short-term action
items have been implemented, set a fuel reduction goal (a certain percent over a certain amount of time) for the City.
• Engage the City’s electric utility provider and encourage grid improvements and other infrastructure improvements needed to reap the benefits of plug-in vehicles.
• Coordinate with City Fleet Management to develop a schedule for vehicle retirement and a strategy for funding this process.
Implementation responsibilities/assignments: Most of the action items listed above should be carried out by City Fleet Management, Planning, Preservation and Economic Innovation, and Traffic and Transportation. Regional partners for funding and implementation: State and regional partners include: • BCDCOG • SCDOT • South Carolina Department of Health
and Environmental Control (SCDHEC) Benefits anticipated, aside from greenhouse gas reductions: Improved air quality, reduced dependence on foreign oil, and an injection of capital into local economies. Timeline for implementation: The initial inventory of vehicle fuel efficiency along with implementation of short-term action items can begin immediately, in 2009, and be measured annually thereafter. Long-term action items can be implemented as technology, funding, and best practices permit.
T-4B: Support reduction of
emissions from freight-related trucks, trains, and ships. Summary of Specific Issues: The Charleston area is home to a thriving ocean port, as well as local industry. Transportation of freight generates significant truck, train, and ship traffic. The City should support significant reductions in emissions from this traffic. Recommendation/Strategy/Action Plan: While most vehicle use and maintenance is outside the City jurisdiction, the City should identify opportunities to influence key decisions. The following strategies should be included: • Decrease congestion of freight corridors
to improve freight travel times; • Move freight more fuel efficiently, or
using cleaner fuels; and • Reduce unnecessary idling by ships,
trains and trucks; Implementation Responsibilities/Assignments: The City’s Sustainability Director should identify opportunities for City involvement in this issue. Regional Partners in Implementation: The City should form partnerships with the following to have a constant presence on technical working groups, steering committees, and other groups with policy making and implementation: • South Carolina State Ports Authority • BCDCOG (Neck Area Transportation
Master Plan, CHATS Long Range Transportation Plan)
• SCDOT (Corridor Planning) • SC Trucking Association • DHEC (Air Quality initiatives) Cost to Implement/Net Savings from Implementation: The cost to implement may be limited to the time spent working as meeting participants.
103

T-4C: Support strict enforcement of speed limits. Summary of specific issues: According to the federal EPA, speeding, rapid acceleration, and rapid braking can lower gas mileage by 33% at highway speeds. Simply observing the speed limit can result in up to a 23% increase in fuel economy.5 For these reasons, CECAC recommended stricter speed enforcement, targeting vehicles traveling 5 mph or more over the speed limit on highways with speed limits of 55 mph or more. This will reduce emissions through improved fuel efficiency in both light- and heavy-duty vehicles. Strategy/Action Plan: The City should participate in any statewide public information campaigns that support this CECAC recommendation. Implementation responsibilities/assignments: Sustainability staff should keep abreast of state plans for a public information campaign. The Sustainability Director should coordinate staff from the office of Planning, Preservation and Economic Innovation, the department of Traffic and Transportation and the Public Information Office. Regional partners for funding and implementation: Partners may include SCDOT and BCDCOG. Benefits anticipated, aside from greenhouse gas reductions: Improved fuel economy and increased safety. Timeline for implementation: Staff from the Sustainability Division can immediately begin to monitor the status of CECAC policy recommendation TLU-8. The City’s actual participation will depend on the timeline of a statewide program.
T-4D: Study the benefits of providing free or preferred parking for high efficiency vehicles on City and County lots and decks. Summary of specific issues: Hybrid and alternative-fuel autos, which reduce greenhouse gases and other emissions, are gaining traction in the marketplace. Cities across the nation are helping to promote this trend by providing free or preferred parking to these vehicles. Such programs help offset increased costs to consumers purchasing such vehicles; promote awareness about hybrid and biofuel technology; and offer an incentive to prospective buyers of hybrid, biofuel, and other high-fuel efficiency autos. Strategy/Action Plan: The City should explore ways to help promote purchase of high-efficiency vehicles, including the provision of free or preferred parking on lots or decks owned by the City and County. The City should evaluate what aspects of these programs are appropriate for Charleston and recommend any innovations appropriate for Charleston. Implementation responsibilities/assignments: The Sustainability Director should coordinate with Traffic and Transportation staff to conduct the study and, if advisable, create an implementation plan. Regional partners for funding and implementation: Charleston County may have useful information to contribute, and coordination with the County will be essential if implementation includes County-owned facilities. Benefits anticipated, aside from greenhouse gas reductions: Increased air quality and enhanced public health.
104
Timeline for implementation: The initial study can begin immediately, followed by an implementation plan and implementation. T-4E: Improve vehicle flow by using transportation system management. Summary of specific issues: The efficient flow of traffic through the City of Charleston is vital in increasing fuel efficiency and reducing emissions. The idling of cars on congested roadways results in the unnecessary release of tons of hydrocarbons, nitrous oxide, and carbon monoxide. Strategy/Action Plan: The City of Charleston completed a traffic signal sequencing plan in 2008 which reduced travel times on 15 of Charleston’s major travel routes during peak commuting hours by approximately 9%. This reduction should prevent consumption of more than 240,000 gallons of gasoline annually, as well as emission of associated greenhouse gases. To maintain the effectiveness of traffic signal coordination, sequencing and retiming should be reevaluated every 5-10 years. Vehicle flow could be improved further by using high occupancy vehicle (HOV) lanes; roundabouts instead of stop signs and traffic signals; and variable message signs to direct traffic around congestion. Another strategy would be to encourage local businesses and agencies to adopt alternate working hours. (Note: improved public transit is ultimately the most effective way to reduce traffic and harmful emissions.) Implementation responsibilities/assignments: Most primary commuter routes are under state jurisdiction. Therefore, it will be necessary for SCDOT to fund and
implement HOV lanes, intersection redesigns, and variable message signs. SCDOT will also need to grant permission for these modifications. Also, funding to reevaluate traffic signal sequencing is the responsibility of SCDOT. The City should do what it can to encourage and assist. Regional partners for funding and implementation: In addition to SCDOT, such changes can be incorporated into BCDCOG’s long range transportation plan, thereby qualifying to receive BCDCOG funds. Benefits anticipated, aside from greenhouse gas reductions: Increased fuel efficiency; increased air quality; small changes in commute time with significant aggregate effect. Timeline for implementation: HOV lanes and intersection redesigns can be costly, and will probably be considered primarily when highways are being widened or otherwise improved. On the other hand, identification of locations which would benefit from variable message signs could begin immediately. Obtaining agreement and funding from SCDOT for such signs will likely require persistent and frequent communication. Retiming and optimal sequencing of traffic signals was completed in 2008, and should be reevaluated between 2013 and 2018.
T-4F: Support anti-idling programs and technologies. Summary of specific issues: Extended idling can be a significant contributor to air pollution. Near a school, idling vehicles can have an even stronger negative impact because of the proximity to children and pedestrians. School children engage in a high level of outdoor activity (athletics, bands, etc.) which makes them particularly vulnerable to pollution.
105

Strategy/Action Plan: Reduce idling near all city schools by using DHEC’s existing B2, Breathe Better education program. Educational programs can be conducted within schools, and appropriate signage added to other problem areas such as loading zones and bus stops. The City should enforce its existing idling ordinance. Implementation responsibilities/assignments: Partnering with the City Information Office, the Traffic and Transportation Department, and the police force, the Sustainability Director should identify opportunities for anti-idling policies and education. Regional partners for funding and implementation: Primarily DHEC. Cost to implement/net savings from implementation: This program can cost the City next to nothing. DHEC manages state-funded education and compliance programs. Benefits anticipated, aside from greenhouse gas reductions: Improved air quality and enhanced public health. Cleaner air near schools will benefit children, teachers, and staff. Timeline for implementation: Partnerships with DHEC and other agencies can be established in 2009. Development of additional programs and educational outreach will be on-going.
T-4G: Research a property tax assessment on vehicles that is based on emissions rather than value. Summary of specific issues: Vehicles emitting more carbon dioxide have a greater impact on the air that citizens breathe. Communities that are in non-
attainment of federal air quality standards will be required to initiate programs that reduce emissions from vehicles. The Charleston metropolitan area is very close to this non-attainment level. Research should be conducted of the rationale and the feasibility of the state of South Carolina taxing a vehicle based on its emissions. The tax could be based on the miles-per-gallon ranking for each type of vehicle. If implemented, this strategy could be phased in over time with advance notice to allow more efficient vehicles to be on the market and to allow more informed purchasing of vehicles. This will help promote the popularity of high-efficiency vehicles, thereby lowering greenhouse gas emissions. Strategy/Action Plan: State legislation would be required to enable such a tax. Once this legislation is in place, the City can work with the County to develop the tax. Coordination and public support should be maintained throughout the process, and should continue after implementation in case any changes need to be made. Implementation responsibilities/assignments: The Sustainability Director should spearhead this effort. Regional partners for funding and implementation: Charleston County and the General Assembly, as well as civic organizations and non-profits. Benefits anticipated, aside from greenhouse gas reductions: Increased air quality; enhanced public health; increased energy independence; increased community resilience to fluctuations in the price of oil. Timeline for implementation: Initial research and outreach can begin immediately, engaging County and local community to obtain necessary support. Before the beginning of the next legislative session, General Assembly members should
106
be engaged as well. T-4H: Support purchase, use, and appropriate maintenance of high-efficiency vehicles for the CARTA fleet. Summary of specific issues: Buses present many fuel efficiency and emission challenges. Solutions enter the market with every new bus design. However, as buses last ten to twenty years, the most immediate improvements would result from retrofits to the existing fleet. Strategy/Action Plan: City staff should appoint a liaison to help CARTA and Tri-County Link pursue federal and state grant opportunities. Tasks should include the following: • Regularly research advances in the
technology of alternative fuels, such as biodiesel, compressed natural gas, propane injection, etc.
• Regularly research advances in the technology of pollution control devices such as diesel filtration, oxidation converters, etc.
• Regularly compare the lifecycle costs and benefits of retrofitting buses in the existing fleet.
Implementation responsibilities/assignments: The Sustainability Director or City Fleet Management should designate an appropriate liaison. Regional partners for funding and implementation: CARTA, Tri-County Link, and BCDCOG, which facilitates of federal funding for local transit providers. Benefits anticipated, aside from greenhouse gas reductions: Improved air quality, reduced dependence on foreign oil, and an injection of capital into local economies.
Timeline for implementation: The partnership and grant assistance should begin immediately.
T5. IMPROVE AIR QUALITY T-5A: Reduce emissions from small-motor equipment. Summary of specific issues: Small gasoline-powered motors account for a disproportionate amount of air pollution compared with other petroleum-fueled motors. Reductions in pollution from lawn equipment should not only improve overall air quality, but should also improve air quality in localized residential areas. Strategy/Action Plan: The City should continue working with DHEC and other local governments and private entities to promote voluntary lawnmower exchange programs. This recommendation overlaps with the recommended procurement program, supporting the purchase and use of lower emissions equipment by the City of Charleston. Implementation responsibilities/assignments: The City of Charleston should participate through the Sustainability Office in the Lowcountry Lawnmower Exchange programs. Regional partners for funding and implementation: DHEC, Sustainability Office, Charleston County Recycling. Cost to implement/net savings from implementation: Lawnmower exchange programs can occur with little or no monetary support from the City. Benefits anticipated, aside from greenhouse gas reductions: Noise pollution
107

will be reduced by the increased use of the quieter, electric mowers. Timeline for implementation: The first lawnmower exchange program took place in March 2009.
T-5B: Raise public awareness of the need to reduce air pollution outdoor burning and emissions from inefficient, outdoor wood-burning stoves. Educate the public on the existing laws and available cleaner-burning technologies and materials. Summary of specific issues: Existing state and local laws already limit outdoor burning. Pollution from burning yard debris burning and from wood stoves degrades air quality in residential areas and can lead to respiratory problems for sensitive people, such as those with asthma. Strategy/Action Plan: Burning yard debris is prohibited, but enforcement needs to be improved. Also, outreach campaigns could spread the word about the adverse affects of open burning, alternative methods for disposing yard debris, and the benefits of using clean-burning wood stoves. Effective forms of outreach include press releases and direct contact with neighborhood associations. Implementation responsibilities/assignments: City staff, including the Fire Department. Regional partners for funding and implementation: DHEC could assist by participating in neighborhood association meetings or contributing air quality data. Benefits anticipated, aside from greenhouse gas reductions: Improved air
quality, especially in localized areas, and improved fire safety. Timeline for implementation: Programs can be identified by summer 2010, and initiated by the end of 2010.
108

“Governing efficiently and effectively means giving citizens sustainable options.”
Christine Cooley,
MUSC Sustainability Manager Subcommittee Chair
109

his plan was developed during a time of great opportunity for the City to directly influence positive changes to
waste management. During 2008 and 2009, issues coalesced to motivate and influence the waste management practices of the City, its citizens, and its businesses. Beginning July 2008, the Bees Ferry Landfill no longer accepted construction and demolition waste from private haulers. In 2009, Charleston County Council committed to end its waste incineration program by January 2010. Also in 2009, Charleston County set a goal of a 40% recycling rate1 -- four times the current rate. The County has also created a "Green Ribbon Committee” to evaluate existing waste management practices and gather public input. Working in the context of these changes, the City of Charleston can capitalize on new opportunities to support progress on the County level and further the goals of climate protection and sustainability.
Where We Begin
Currently, Charleston participates in the County’s successful but limited recycling and waste reduction program. For years, the County has been
burning 70% of its garbage in the incinerator, and putting 20% in the Bees Ferry Landfill.2 Therefore, only 10% of waste is diverted from the incinerator and the landfill through recycling or composting. As Charleston seeks to increase this “diversion rate,” other cities and states can provide inspiring models. Six major cities nationwide, including Los Angeles, have diversion rates of 60% or better.3 California diverts 58% of its waste, and Maryland diverts nearly 50%.4 Major corporations are leaders in diversion as well. Safeway stores divert 85% of their waste, and Hewlett-Packard diverts more than 90%.5 The following recommendations roughly follow the EPA’s solid waste hierarchy of reduce, reuse, recycle, and provide specific suggestions about how to proceed, focusing on the City and its potential to influence County decisions:
Zero Waste The City should pass a resolution to have Zero Waste as its goal. Much as an employer sets “zero accidents” as a workplace goal, the resolution would frame the issue so that garbage is no longer accepted as inevitable. In 2008, Zero Waste topped Newsweek’s list of “10 Fixes for the Planet.”6 Atlanta recently
ZERO WASTE
ACTIONS 1. Commit to a goal of Zero
Waste. 2. Expand recycling and
composting. 3. Explore energy recovery
technologies. 4. Educate the public.
BENEFITS
Reduce energy costs
Conserve natural resources Protect clean air Protect clean water
Improve public health
Create jobs
Enhance quality of life
Slow climate change Raise awareness
110
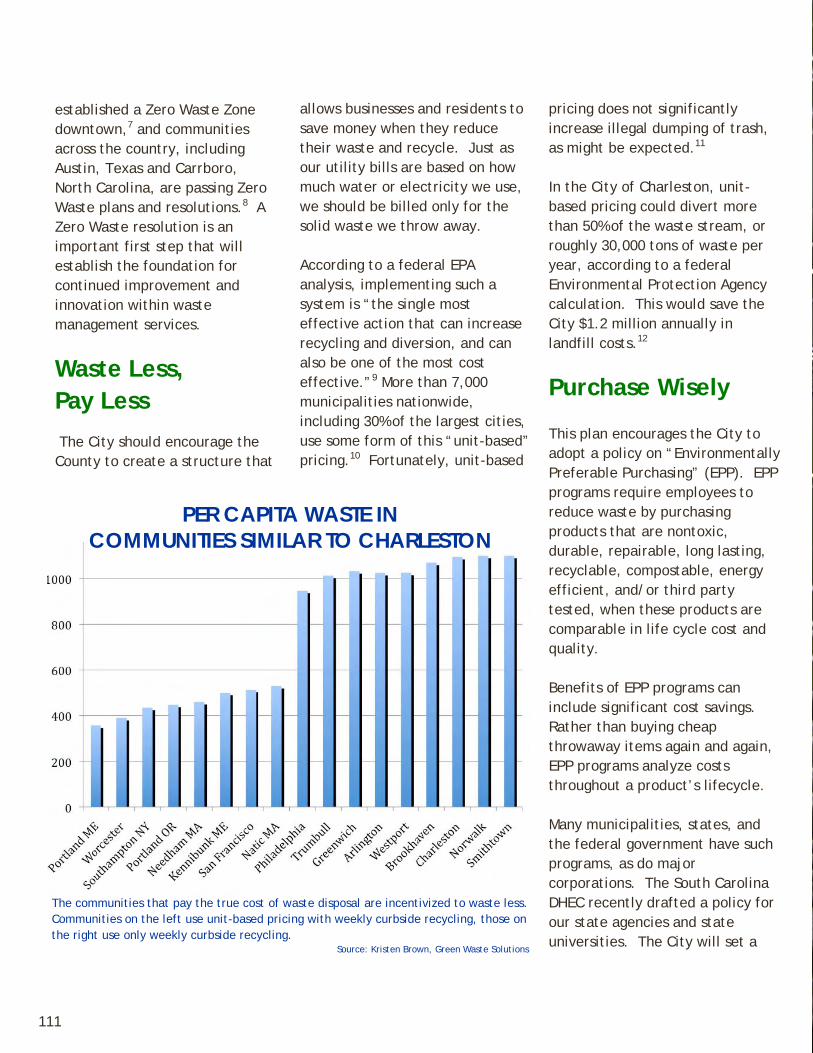
established a Zero Waste Zone downtown,7 and communities across the country, including Austin, Texas and Carrboro, North Carolina, are passing Zero Waste plans and resolutions.8 A Zero Waste resolution is an important first step that will establish the foundation for continued improvement and innovation within waste management services.
Waste Less, Pay Less
The City should encourage the County to create a structure that
allows businesses and residents to save money when they reduce their waste and recycle. Just as our utility bills are based on how much water or electricity we use, we should be billed only for the solid waste we throw away. According to a federal EPA analysis, implementing such a system is “the single most effective action that can increase recycling and diversion, and can also be one of the most cost effective.”9 More than 7,000 municipalities nationwide, including 30% of the largest cities, use some form of this “unit-based” pricing.10 Fortunately, unit-based
pricing does not significantly increase illegal dumping of trash, as might be expected.11 In the City of Charleston, unit-based pricing could divert more than 50% of the waste stream, or roughly 30,000 tons of waste per year, according to a federal Environmental Protection Agency calculation. This would save the City $1.2 million annually in landfill costs.12
Purchase Wisely This plan encourages the City to adopt a policy on “Environmentally Preferable Purchasing” (EPP). EPP programs require employees to reduce waste by purchasing products that are nontoxic, durable, repairable, long lasting, recyclable, compostable, energy efficient, and/or third party tested, when these products are comparable in life cycle cost and quality. Benefits of EPP programs can include significant cost savings. Rather than buying cheap throwaway items again and again, EPP programs analyze costs throughout a product’s lifecycle. Many municipalities, states, and the federal government have such programs, as do major corporations. The South Carolina DHEC recently drafted a policy for our state agencies and state universities. The City will set a
PER CAPITA WASTE IN COMMUNITIES SIMILAR TO CHARLESTON
The communities that pay the true cost of waste disposal are incentivized to waste less. Communities on the left use unit-based pricing with weekly curbside recycling, those on the right use only weekly curbside recycling.
Source: Kristen Brown, Green Waste Solutions
111
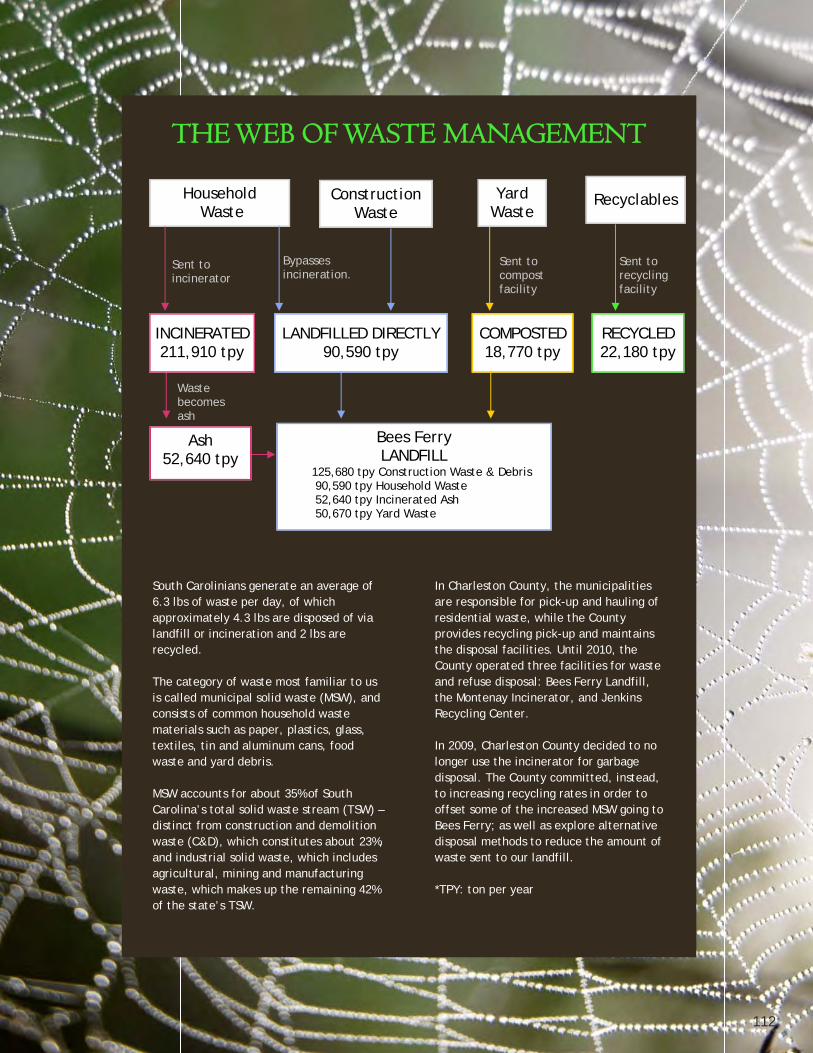
Household Waste
Construction Waste
Yard Waste
Recyclables
INCINERATED 211,910 tpy
LANDFILLED DIRECTLY 90,590 tpy
COMPOSTED 18,770 tpy
Ash 52,640 tpy
Bees Ferry LANDFILL
125,680 tpy Construction Waste & Debris 90,590 tpy Household Waste 52,640 tpy Incinerated Ash 50,670 tpy Yard Waste
RECYCLED 22,180 tpy
Sent to incinerator
Bypasses incineration.
Sent to compost facility
Sent to recycling facility
Waste becomes ash
THE WEB OF WASTE MANAGEMENT
South Carolinians generate an average of 6.3 lbs of waste per day, of which approximately 4.3 lbs are disposed of via landfill or incineration and 2 lbs are recycled. The category of waste most familiar to us is called municipal solid waste (MSW), and consists of common household waste materials such as paper, plastics, glass, textiles, tin and aluminum cans, food waste and yard debris. MSW accounts for about 35% of South Carolina’s total solid waste stream (TSW) – distinct from construction and demolition waste (C&D), which constitutes about 23%, and industrial solid waste, which includes agricultural, mining and manufacturing waste, which makes up the remaining 42% of the state’s TSW.
In Charleston County, the municipalities are responsible for pick-up and hauling of residential waste, while the County provides recycling pick-up and maintains the disposal facilities. Until 2010, the County operated three facilities for waste and refuse disposal: Bees Ferry Landfill, the Montenay Incinerator, and Jenkins Recycling Center. In 2009, Charleston County decided to no longer use the incinerator for garbage disposal. The County committed, instead, to increasing recycling rates in order to offset some of the increased MSW going to Bees Ferry; as well as explore alternative disposal methods to reduce the amount of waste sent to our landfill. *TPY: ton per year
112
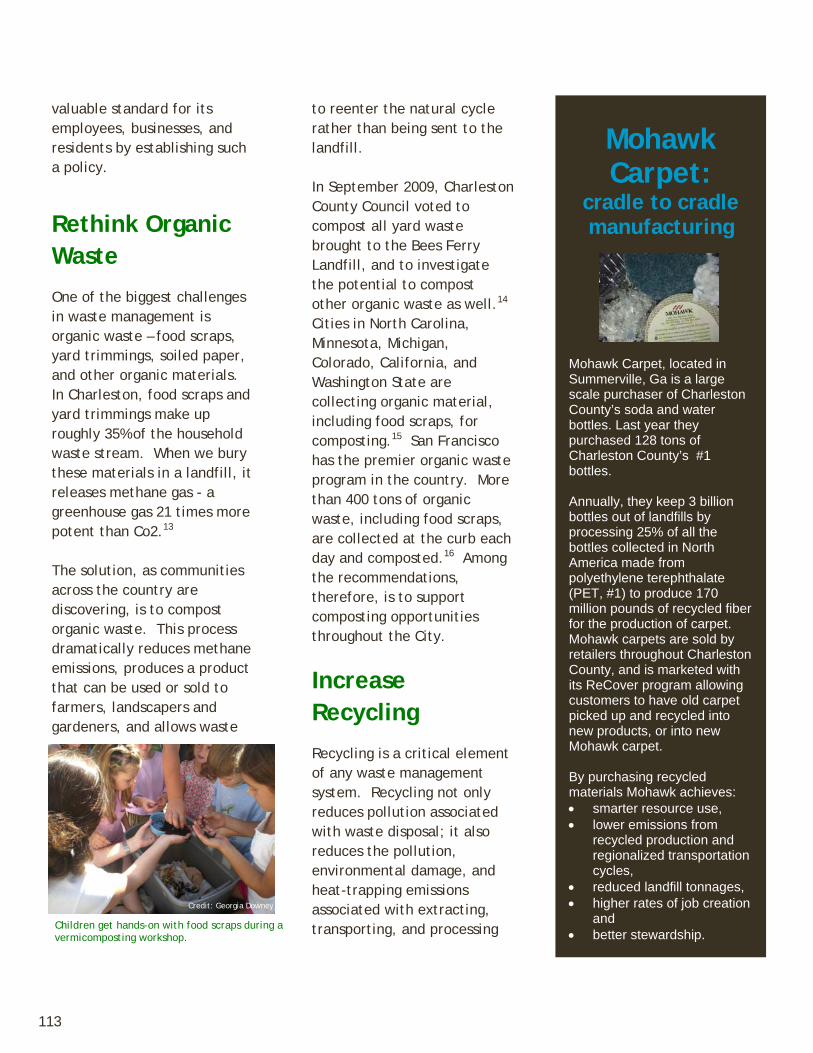
valuable standard for its employees, businesses, and residents by establishing such a policy.
Rethink Organic Waste
One of the biggest challenges in waste management is organic waste – food scraps, yard trimmings, soiled paper, and other organic materials. In Charleston, food scraps and yard trimmings make up roughly 35% of the household waste stream. When we bury these materials in a landfill, it releases methane gas - a greenhouse gas 21 times more potent than Co2.13 The solution, as communities across the country are discovering, is to compost organic waste. This process dramatically reduces methane emissions, produces a product that can be used or sold to farmers, landscapers and gardeners, and allows waste
to reenter the natural cycle rather than being sent to the landfill. In September 2009, Charleston County Council voted to compost all yard waste brought to the Bees Ferry Landfill, and to investigate the potential to compost other organic waste as well.14 Cities in North Carolina, Minnesota, Michigan, Colorado, California, and Washington State are collecting organic material, including food scraps, for composting.15 San Francisco has the premier organic waste program in the country. More than 400 tons of organic waste, including food scraps, are collected at the curb each day and composted.16 Among the recommendations, therefore, is to support composting opportunities throughout the City.
Increase Recycling
Recycling is a critical element of any waste management system. Recycling not only reduces pollution associated with waste disposal; it also reduces the pollution, environmental damage, and heat-trapping emissions associated with extracting, transporting, and processing
Mohawk Carpet:
cradle to cradle manufacturing
Mohawk Carpet, located in Summerville, Ga is a large scale purchaser of Charleston County’s soda and water bottles. Last year they purchased 128 tons of Charleston County’s #1 bottles. Annually, they keep 3 billion bottles out of landfills by processing 25% of all the bottles collected in North America made from polyethylene terephthalate (PET, #1) to produce 170 million pounds of recycled fiber for the production of carpet. Mohawk carpets are sold by retailers throughout Charleston County, and is marketed with its ReCover program allowing customers to have old carpet picked up and recycled into new products, or into new Mohawk carpet. By purchasing recycled materials Mohawk achieves: • smarter resource use, • lower emissions from
recycled production and regionalized transportation cycles,
• reduced landfill tonnages, • higher rates of job creation
and • better stewardship.
Children get hands-on with food scraps during a vermicomposting workshop.
Credit: Georgia Downey
113

virgin materials. Moreover, recycling saves energy: producing an aluminum can from virgin materials, for example, requires 20 times more energy than when recycled metal is used. The City should therefore adopt, or encourage the County to adopt, the following policies (some of which are already in the planning stages): Increase construction and demolition waste diversion (recycling and salvage/reuse): In South Carolina, construction and demolition (C&D) waste represents roughly one-quarter of our total solid waste stream,18 yet only about one-third of it is typically recycled.19 It is possible, however, to divert 90% of construction job site waste and 80% of demolition waste from the landfill.20 Some cities require 50% - 90% diversion, depending on the type of construction waste.21 The City, therefore, should commit to diverting a high percentage of its own construction waste. The City should also encourage private builders, with incentives, to recycle, ultimately moving toward specific recycling requirements tied to building permits and building inspections.
Make recycling easy, and
mandatory: According to the County’s solid waste consultant, we could more than double our current residential recycling rate of 22,000 tons per year, recycling 45,000 tons instead. To accomplish this goal, we should make recycling as easy as throwing out garbage. For example, recycling collection should be as frequent as garbage collection, and larger, rolling recycling containers should be available. Also, recycling should be required for both homes and businesses. Recycling is mandatory in many cities across the country, including Pittsburgh, Seattle, San Diego, Wilmington, North Carolina, and Cambridge, Massachusetts.22 Expand Materials Collected: Residential curbside recycling pickup should be expanded to include cardboard and all plastics #1 through #7, not just the plastics bottles, jugs and jars #1 and #2 that are currently accepted. • Cardboard is roughly one-
quarter of all municipal recyclables collected in South Carolina.23 Charleston County does recycle cardboard, yet does not provide curbside pickup due to the limited
capability of the current recycling truck fleet to hold large sheets of cardboard. The solution is to use a compactor truck, typical for garbage collection, to haul cardboard for recycling.
• Plastics #3 through #7 and
#1 and #2 other than bottles, jugs, and jars are not currently accepted by the County for recycling. The recommendation encourages the County to explore commodities markets for these plastics, and expand curbside recycling pickup to include them. While plastics account for a small percentage of total recyclables collected in South Carolina (2%), they
Charleston County recycles 10% of the mu-nicipal waste stream. In 2009 it established a goal of increasing recycling to 40%.
114

AIRPORT RECYCLES
The Charleston County Aviation Authority successfully launched their Recycling Program in July of 2009. Significant in that commercial recycling is entirely voluntary and they worked closely with the Charleston County Government and DHEC to train their employees and obtain the proper receptacles. They successfully diverted 90 tons of trash from the landfill over the first nine months and helped lead the way for other commercial operations to reduce their waste streams and demonstrate there are cost savings to be realized at the same time. The education of their tenants and staffs will undoubtedly extend beyond the daily operations and into their personal lives as well. Prominent recycling messages also set an important tone for the many visitors coming through the airport letting them know Charlestonians are proud of their natural environment and are working to retain the beauty and character of Charleston.
are a rapidly growing segment of our municipal solid waste stream.24 Therefore, capitalizing on recycling opportunities to keep plastics out of the landfills will have a great impact on overall waste reduction.
Provide public recycling bins, and require recycling at events. Public and event recycling are visible statements of the City’s commitment to zero waste. We should not underestimate how important this can be for visitors from places where recycling is the norm.
Energy Recovery Technologies and Landfill
Efforts such as unit-based pricing, environmentally preferable purchasing, composting, and recycling should reduce our waste stream by 40% or better. While we are working to reduce our waste stream to as close to zero as possible, the residual solid waste could be converted to an energy source. Creating energy from our residual solid waste would be preferable to landfilling. All such energy recovery technologies should meet or exceed federal and state air quality standards and should recycle materials like metal and glass not converted to energy. Energy recovery technologies should not undercut the economics or take the place of source reduction, composting, and recycling.
Credit: Charleston County Aviation Authority
Credit: MUSC
MUSC has an aggressive recycling pro-gram which significantly reduces the waste stream from all campus sources.
115

The second annual Green Fair re-corded a 93% waste diversion rate. Vendors were required to use com-postable and recycleable materials and participants were encouraged to use reusable containers.
116
Zero Waste Goals, Actions & Recommendations ACTIONS 1. Commit to Zero Waste
A. Pass a Zero Waste resolution. B. Encourage inter-jurisdictional
cooperation. C. Implement per-unit system for waste
collection and disposal fees. D. Improve bulky trash collection. E. Require the City to purchase
environmentally preferable products when price and quality are comparable.
F. Improve data collection on solid waste, recycling, and composting.
2. Expand Recycling and
Composting A. Facilitate composting and mulching
of all organic waste. i. Residential and commercial ii. City-owned facilities
B. Improve recycling of hazardous and electronic waste.
C. Increase recycling of construction waste. i. Created by private projects ii. Created by City projects
D. Redesign residential recycling program for ergonomics and increased recycling.
E. Encourage the County to add cardboard and all plastics #1 through #7 to residential recycling.
F. Require residential recycling. G. Require commercial recycling, and
make it easy and beneficial for
business owners. H. Provide a recycling bin next to each
public trash bin I. Require recycling at local events. 3. Explore Energy Recovery
Technologies A. Create energy from residual solid
waste, using the landfill as a last resort.
4. Encourage the Public to Support
These Efforts A. Create a Zero Waste education plan.
B. Educate builders about construction debris.
C. Create and advertise a guide to help businesses reduce waste.
W1. COMMIT TO ZERO WASTE
W-1A: Pass a Zero Waste Resolution Summary of Issue(s) and Benefits: Zero Waste is a philosophy and a design principle for the 21st century. By taking a “whole system” approach to the vast flow of resources and waste, Zero Waste maximizes recycling, minimizes waste, reduces consumption, and ensures that products are made to be nontoxic, durable, repairable, reusable, recyclable, or compostable. Charleston County currently sends 90% of its waste to landfills: a “diversion rate” of only 10%. Various states and municipalities report diversion rates of 50%, 60%, and even 70%, while businesses nationwide, including Hewlett-Packard, report diversion rates of 90% or more. Recommendation/Strategy/Action Plan: With support from the Charleston Green Committee, the City should pass a Zero Waste Resolution that sets a goal to reduce the volume and weight of the City’s waste to zero or near zero by using the following actions: • Revise local ordinances to support zero
waste; • Hold industry liable for creating less
Quantifiable measures related to W.1 could achieve 2% of 2030 reduction goal (equal to 22,860 mtCO2e). See page 21 for details.
2%
117

toxic and more efficient products. This is called Extended Producer Responsibility(EPR). Work through the Conference of Mayors, Chamber of Commerce, State and Federal Government agencies and private industries;
• Use the City’s buying power to support EPP principles (See Recommendation W-1E);
• Work with the County and surrounding municipalities to build and continuously improve processing and recovery systems that will move us toward Zero Waste (See Recommendation W-1B);
• Require waste to be separated at the source into three streams: compostables, recyclables and residuals (See Recommendations W-2A through W-2I);
• Compost and mulch organic waste to avoid potent methane emissions (See Recommendation W-2A);
• Improve solid waste and recycling data collection (See Recommendation W-1F);
• Educate citizens so that Zero Waste becomes part of our culture. (See Recommendation W-3A)
Implementation Responsibilities/Assignments • The Sustainability Director should identify
which local ordinances should be changed to support zero waste;
• The Public Services Department should conduct a waste composition study;
• City to provide incentives to businesses that support EPR;
• City should Invest in recovery infrastructure, not landfills ◊ No more tax funds for landfills or
incinerators ◊ Use tax funds to build “Resource
Recovery Parks” ◊ Example CHARM Boulder, Colorado;
• Maximize Employment Opportunities -- Sorting and processing recyclables alone sustains ten times more jobs than landfilling or incineration.1
Timeline for Implementation/Performance Goals • 2010 or before City Council to Pass a Zero
Waste Resolution • Implement all other Waste Subcommittee
recommendations as soon as possible • 2010 Work with County to pass ordinance to
ban certain items from the landfill
• 2010 Pass ordinance to prohibit sale of unnecessarily toxic or polluting products ex. plastic bags (San Francisco, etc)
• 2010 and beyond work with County to educate citizens
• 2010 Work with Chamber of Commerce to educate commercial sector and manufacturers
References (standards, other cities etc.): Eco Cycle: http://www.ecocycle.org/zero/index.cfm Cool 2012 Campaign: http://www.cool2012.com/ Stop Trashing the Climate Report: http://www.stoptrashingtheclimate.org/ Grass Roots Recycling Network: http://www.grrn.org/zerowaste/index.html Reaching for Zero: A Citizens Plan for Zero Waste in New York City: http://www.consumersunion.org/other/zero-waste/overview.html Zero Waste California: http://www.zerowaste.ca.gov/ Gary Liss and Associates, Zero Waste: http://www.garyliss.com/id18.html
These cities have achieved approximately 50% diversion: Seattle; San Jose; Twin Cities, MN; and smaller cities like Poway in northern San Diego County and Tacoma Park, MD.
• The State of New Jersey has reported a 56%
statewide diversion rate and the Australian Capital Territory of Canberra has adopted a Zero Waste goal by 2010.
• Halifax, Nova Scotia has adopted a resource management strategy to achieve Zero Waste.
• 97% diversion - Mad River Brewing in Northern California
• 95% diversion - Zanker Construction & Demolition Landfill in San Jose, CA
• 97% diversion - Hewlett-Packard in Roseville, CA
• 95% recycling rates at office buildings in the EPA Green Buildings program
• 80-90% diversion rates at many businesses with some progressive businesses now adopting Factor 10 goals to achieve a ten-fold increase in efficiency
W-1B: Encourage inter-jurisdictional cooperation.
118

Summary of Issue(s) and Benefits: Responsibility for solid waste in Charleston County is shared among the County, the municipalities, and various private businesses. Waste hauling is provided by municipalities and private entities. Disposal is provided by the County and private entities. Recycling services are provided by the County and by private business. Recommendation/Strategy/Action Plan: Given this complex web, the City of Charleston must work with Charleston County, other municipalities, and private businesses to create and maintain a solid waste system that places the highest value on waste reduction, recycling, and composting. Estimated Green House Gas Reduction Achieved and Other Performance Measures/Metrics: To be calculated using EPA’s Waste Reduction Model (WARM).2 Implementation Responsibilities/Assignments: Inter-jurisdictional coordination is already well underway as the City of Charleston is represented on the Charleston County Green Ribbon Committee and Charleston County is represented on the City of Charleston’s Green Committee. The City Green Committee and City staff are responsible for finalizing the City Green Plan, which will need to be revised once the County writes its own Green Plan. Cooperation on solid waste issues among City and County elected officials and staff should increase. W-1C: Implement per-unit system for waste collection and disposal fees. Summary of Issue(s) and Benefits: Across the nation, more than 7,000 cities and towns are using Unit-Based Pricing (UBP) to save tax dollars and generate revenue. Under our current system, residents pay flat fees to the City and the County regardless of how much waste they generate. These flat fees obscure the actual cost of waste disposal, and require customers who create little waste to subsidize customers who
generate large volumes. The fee structure should be changed to provide a strong incentive to recycle and compost more and discard less. Recommendation/Strategy/Action Plan: The City should collaborate with the County to plan and implement a UBP system. Several approaches can be taken. The simplest would be to have the County charge the City for all actual waste disposal costs. The city would in turn develop a rate structure based on the size of trash container provided and frequency of collection. Extensive outreach will need to be developed for residential customers to familiarize them with the new system. Estimated Green House Gas Reduction Achieved and Other Performance Measures/Metrics: To be calculated using EPA’s Waste Reduction Model (WARM).3 Performance measures, to be quantified by City and County staff, should include the percent reduction in garbage disposed at energy recovery facilities and landfills , and the financial savings for residents. Implementation Responsibilities/Assignments: A UBP system will require both inter-jurisdictional coordination with Charleston County and guidance from an expert in solid waste management. Both the City and the County already have access to such expertise. Cost to Implement/Net Savings from Implementation: Costs may include additional consulting fees. Net savings will likely be substantial based on the experience of other municipalities. Dover, New Hampshire, for example, saves $322,000 annually while reaching a recycling rate of 50%.4 References (standards, other cities etc.): EPA Waste Conservation Tools Website
with Unit Based Pricing standards and communities http://www.epa.gov/epawaste/conserve/tools/payt/index.htm
W-1D: Improve bulky trash
119

collection. Summary of Issue(s) and Benefits: The City currently provides weekly collection of loose trash, using a claw truck to grab items ranging from old sofas to bagged household garbage. Yard waste is supposed to be separated, but often is not. In addition to routinely sending yard waste to the landfill, this service also discourages residents from repairing or donating reusable items. Further, it will undercut attempts to implement Unit-Based Pricing for roll-cart collection. Recommendation/Strategy/Action Plan: The City should analyze the following options and implement the best choices: • Reduce the frequency of this service to no
more than once a month; • Replace the service with a special call-in
service; • Implement unit based pricing for this
service.
At the same time, the service should be restricted to bulky items too large to fit into roll carts. It should clearly prohibit yard waste, electronic waste, and bags of household garbage. It should insure recycling of “white goods,” i.e. large appliances. Further, where yard waste and bulky trash collection coincide on the same day, residents should be required to keep piles sufficiently separated to avoid cross-contamination. The City should separately look to implement a GPS-based tracking system to increase collection efficiency. As bulky trash service is improved in these ways, outreach materials will be needed for residents. Estimated Green House Gas Reduction Achieved and Other Performance Measures/Metrics: Percent reduction in bulky waste requiring
curbside pickup. Implementation Responsibilities/Assignments: The City’s Public Services Department should coordinate with the County to ensure proper disposal of bulky trash, consistent with recommendations on Unit-Based Pricing (W-1C) and composting (W-2I). Cost to Implement/Net Savings from Implementation: Cost savings from elimination of service could be rebated to residential
customers. W-1E: Require the City to purchase environmentally preferable products when price and quality are comparable. Summary of Issue(s) and Benefits: Currently, City departments independently purchase supplies and services pursuant to policies set forth by the City’s procurement office. Whether to purchase environmentally preferable products is left to the discretion of multiple City employees. Many municipalities, states, and the federal government have committed to EPP. Such programs restrict purchasing to products that are nontoxic, durable, repairable, reusable, recyclable and or compostable where price and quality are comparable. Factors that can be considered in making purchasing decisions include raw materials acquisition, production, manufacturing, packaging, distribution, reuse, operation, maintenance, and disposal of the product. Benefits of EPP programs include potential cost savings; reduction of waste sent to landfills and incinerators; reduced pollution; conservation of natural resources; and support of locally produced goods and services. Recommendation/Strategy/Action Plan: • Establish an EPP Policy; • Develop EPP goals and track EPP purchases; • Purchase only EPP products where quality
and price are equal to or better than non-EPP products;
• Develop standards - for example, minimum quantity of recycled content - using guidelines set forth by the EPA, other governments, and non-profit organizations, such as Green Seal;
• Create a cross-functional team (including City staff from key purchasing areas, a procurement representative, a local sustainability expert, and the Sustainability Director) that will conduct research, target product categories and attributes, and develop an implementation plan;
• Develop a charter for the team and timelines for the project;
120

• Evaluate other jurisdictions’ programs and get feedback on successes and challenges;
• Obtain department feedback on what is currently purchased and what could be purchased through an EPP program;
• Train City employees. Estimated Green House Gas Reduction Achieved and Other Performance Measures/Metrics: Performance measures could include the dollar value of EPP purchases. In the long run, the City might develop measures to determine how much money is being saved and/or make annual comparisons of materials costs, energy costs, water consumption, insurance costs, recycling rates, and chemical consumption, to the extent that these quantities can be determined. Implementation Responsibilities/Assignments: The Sustainability Director will facilitate meetings with the cross-functional team and City departments and divisions. The team will make its recommendations to the Mayor’s Office and City’s Department Heads. Once the policy is approved, the Sustainability Director will coordinate implementation of the program with assistance from the cross-functional team. City departments will then be required to set internal goals and track EPP purchases. References (standards, other cities etc.): In addition to the federal government, the states of North Carolina, Indiana, Minnesota, Oregon, and California, have adopted EPP policies. Local governments with such policies include:
◊ Austin, Texas ◊ Boulder, Colorado ◊ Phoenix, Arizona ◊ King County, Washington ◊ Portland, Oregon ◊ Seattle, Washington ◊ San Jose, California
• The federal EPA EPP Program helps
federal agencies comply with green purchasing requirements, using the federal government's enormous buying power to stimulate market demand for
green products and services. http://www.epa.gov/opptintr/epp/
• Green Seal is an independent, nonprofit
organization dedicated to safeguarding the environment by promoting the manufacturing, purchasing, and use of environmentally responsible products and services. http://www.greenseal.org/resources/reports/CGR_officesupplies.pdf
• A model EPP policy is available from
Alameda County, California: http://www.ecocycle.org/tools/atwork/documents/sample_epp.pdf
W-1F: Improve data collection on waste, recycling, and composting. Summary of Issue(s) and Benefits: In order to improve Charleston’s waste management system in the most cost-effective way, we need data, including the current amounts of solid waste, yard waste, construction and demolition (C&D) waste, and recyclables produced within City limits. Recommendation/Strategy/Action Plan: The City should gather key waste management data, including but not limited to the following: amount of trash collected in tons and volume, amount of garbage collected in tons and volume, amount of yard waste collected in tons and volume, amount of C&D waste disposed of in a landfill versus recycling, amount of trash going to landfill versus incinerator, amount of garbage going to landfill, amount of white goods (i.e. large appliances) recycled in tons and volume, amount of yard waste being composted vs. landfilled, amount of recycling from all city facilities including commingled plastic, glass, aluminum and steel cans, paper, cardboard, scrap metal, phone books, books, magazines, newspaper, rechargeable batteries, fluorescent tubes, mercury, pallets, oil, oil filters, tires, and antifreeze. The EPA and DHEC currently use Re-Trac data management system to keep track of the amounts of materials recycled,
121
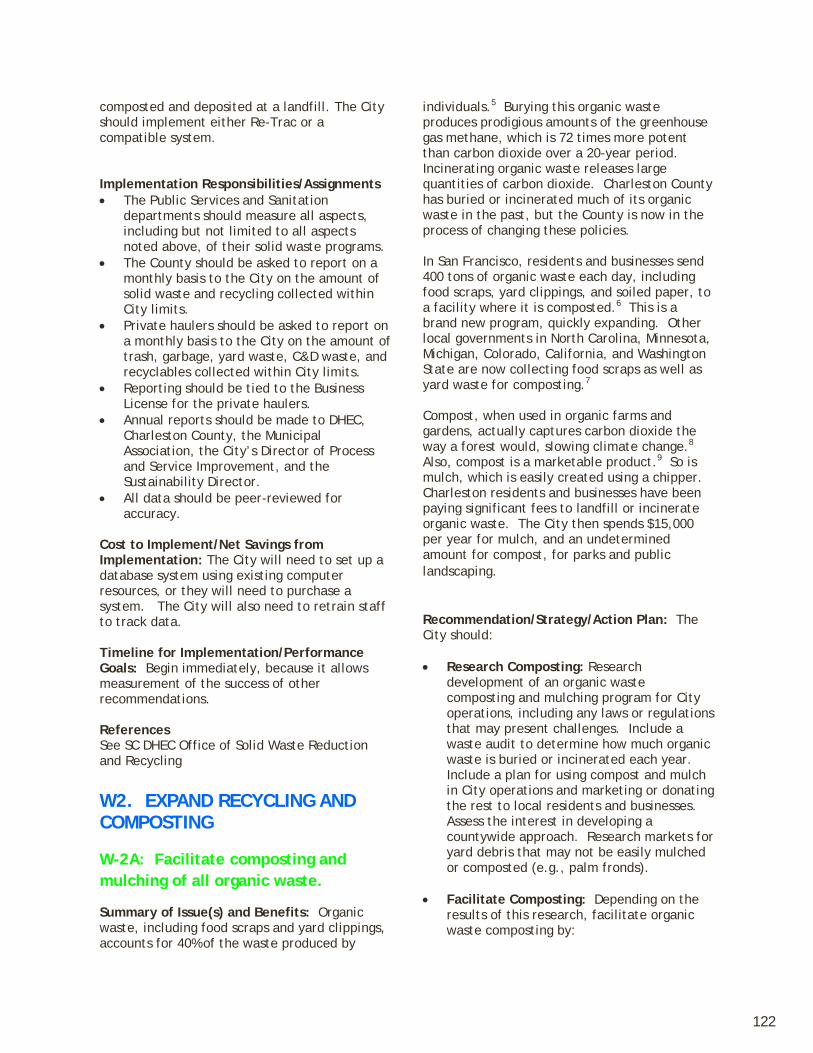
composted and deposited at a landfill. The City should implement either Re-Trac or a compatible system. Implementation Responsibilities/Assignments • The Public Services and Sanitation
departments should measure all aspects, including but not limited to all aspects noted above, of their solid waste programs.
• The County should be asked to report on a monthly basis to the City on the amount of solid waste and recycling collected within City limits.
• Private haulers should be asked to report on a monthly basis to the City on the amount of trash, garbage, yard waste, C&D waste, and recyclables collected within City limits.
• Reporting should be tied to the Business License for the private haulers.
• Annual reports should be made to DHEC, Charleston County, the Municipal Association, the City’s Director of Process and Service Improvement, and the Sustainability Director.
• All data should be peer-reviewed for accuracy.
Cost to Implement/Net Savings from Implementation: The City will need to set up a database system using existing computer resources, or they will need to purchase a system. The City will also need to retrain staff to track data. Timeline for Implementation/Performance Goals: Begin immediately, because it allows measurement of the success of other recommendations. References See SC DHEC Office of Solid Waste Reduction and Recycling W2. EXPAND RECYCLING AND COMPOSTING W-2A: Facilitate composting and mulching of all organic waste.
Summary of Issue(s) and Benefits: Organic waste, including food scraps and yard clippings, accounts for 40% of the waste produced by
individuals.5 Burying this organic waste produces prodigious amounts of the greenhouse gas methane, which is 72 times more potent than carbon dioxide over a 20-year period. Incinerating organic waste releases large quantities of carbon dioxide. Charleston County has buried or incinerated much of its organic waste in the past, but the County is now in the process of changing these policies. In San Francisco, residents and businesses send 400 tons of organic waste each day, including food scraps, yard clippings, and soiled paper, to a facility where it is composted.6 This is a brand new program, quickly expanding. Other local governments in North Carolina, Minnesota, Michigan, Colorado, California, and Washington State are now collecting food scraps as well as yard waste for composting.7 Compost, when used in organic farms and gardens, actually captures carbon dioxide the way a forest would, slowing climate change.8 Also, compost is a marketable product.9 So is mulch, which is easily created using a chipper. Charleston residents and businesses have been paying significant fees to landfill or incinerate organic waste. The City then spends $15,000 per year for mulch, and an undetermined amount for compost, for parks and public landscaping.
Recommendation/Strategy/Action Plan: The City should: • Research Composting: Research
development of an organic waste composting and mulching program for City operations, including any laws or regulations that may present challenges. Include a waste audit to determine how much organic waste is buried or incinerated each year. Include a plan for using compost and mulch in City operations and marketing or donating the rest to local residents and businesses. Assess the interest in developing a countywide approach. Research markets for yard debris that may not be easily mulched or composted (e.g., palm fronds).
• Facilitate Composting: Depending on the
results of this research, facilitate organic waste composting by:
122
◊ Developing a pilot curbside organic waste collection program;
◊ Identifying drop sites for organic waste;
◊ Assisting and encouraging groups and individuals interested in developing a composting co-op;
◊ Identifying locations at City parks where it would be practical to compost on-site;
◊ Encouraging the use of biodegradable and compostable packaging and garbage bags; and
◊ Encouraging, through education and possible subsidies, the use of backyard composting vessels, which could capture up to 25% of the municipal solid waste stream.
• Create Partnerships: Foster a dialogue
between local agriculture and landscaping enterprises, City and County waste handlers, and restaurants and other copious producers of organic waste to explore the creation of an organics market. Restaurants in Chicago and elsewhere are forming just such compost co-ops.
• Use Compost: Require the use of
finished compost as an alternative to petrochemical fertilizers in city activities such as City parks, facilities and public rights-of-way.
• Mitigate greenhouse gases: Mitigate
methane from existing sources where organics have already been buried by flaring or using it for an energy source.
Estimated Green House Gas Reduction Achieved and Other Performance Measures/Metrics • Percent reduction of compostable waste
diverted from landfill/incineration, and resulting reduction in greenhouse gas emissions (need baseline).
• Number of people receiving composting guidance.
• Amount of compost sold or used by the City, and resulting greenhouse gas sequestration.10
• Reduction in use of petroleum-based fertilizers (need baseline).
• Amount of money saved by businesses involved in cooperative composting, or receiving free or reduced-rate compost from the City.
References (standards, other cities etc.)
Dominic, Ernest, Favoino, and Hogg. The Potential Role of Compost in Reducing Greenhouse Gases. 2008. Waste Management & Research, Vol. 26, No. 1, 61-69 Kashmanian, Richard. Markets for Compost. EPA. 1993.
In encouraging biodegradable plastics, governments such as Malta have used a carrot-and-stick approach, increasing taxes on eco-unfriendly plastics, while keeping biodegradable products tax exempt. Other cities, like Chicago, have introduced legislation to encourage “buyers co-ops” to reduce the price of such plastics. San Francisco is one of the leading city for plastic waste reduction and biodegradable plastic use.
W-2B: Improve recycling of hazardous and electronic waste.
A loophole in the current law allows households to mix hazardous waste with regular trash. Hazardous household waste includes, for example, bleach, batteries, pool chemicals, insecticides, paints and construction chemicals, and items containing mercury such as thermometers. Toxins associated with these items are dangerous and have both human health and environmental implications. Electronic Waste (E-waste), including cell phones, computers, televisions, and DVD players, is one of the fastest rising waste streams in the nation. At the same time, E-waste is one of the largest sources of heavy metals and organic pollutants in the waste stream. Further, many electronics contain valuable recyclable materials including gold, silver, aluminum, and plastics. Nationwide, over 100 million pounds of materials are recovered from electronics each year. Here in South Carolina, we generated an estimated 56,025 tons of E-waste in 2005, but only 728 tons were
123
recycled.11 Currently, residents can properly dispose of hazardous and E-wastes only by driving to the Bees Ferry Landfill or the Charleston County Recycling Center on Romney Street. Multiplying these locations would help reduce the amount of hazardous waste being disposed of improperly. Recommendation/Strategy/Action Plan: Work with the County, DHEC, and private entrepreneurs to establish more drop-off sites and provide public education about hazardous and E-wastes. Estimated Green House Gas Reduction Achieved and Other Performance Measures/Metrics: Monitor the amount and types of hazardous and E-wastes properly disposed of as reported by Charleston County. Count the number of new waste sites approved annually. Cost to Implement/Net Savings from Implementation: As a cooperative effort, the cost will be spread among stakeholders including Charleston County, the City of Charleston, businesses and residents. References (standards, other cities etc.):
Charleston County Solid Waste and Recycling Department DHEC Bureau of Land and Waste Management EPA eCylcing Website: http://www.epa.gov/epawaste/conserve/materials/ecycling/index.htm EPA Universal Waste Website http://www.epa.gov/epawaste/hazard/wastetypes/universal/index.htm
W-2C(i): Increase recycling of construction waste (created by private projects ). Summary of Issue(s) and Benefits: In South Carolina, the amount of construction and demolition (C&D) debris has risen consistently. According to the state Department of Health and Environmental Control (DHEC), 1.1 million tons of this waste in 1999 increased to 3.6 million tons in 2007. At the same time, C&D debris went from being 13% of the state’s solid waste stream to 21%.
Here in Charleston County, more than 45% of the waste taken to the Bees Ferry Landfill in 2006 was C&D waste. By 2007, the total C&D waste taken to Bees Ferry was 189,000 tons – almost 10% of the state C&D total. In 2008, Bees Ferry stopped accepting this waste from private haulers to prolong the life of its C&D “cells.” Better management of C&D waste would reduce environmental impact and greenhouse gas emissions associated with putting this debris into landfills. The good news is that 80% of a home builder’s waste is recyclable. Unfortunately, of the 3.6 million tons of C&D debris generated statewide in 2007, only one-third was recycled or salvaged. The rest went to landfills or incinerators.
Recommendation/Strategy/Action Plan: The City should significantly reduce the amount of C&D debris taken to the landfill from private commercial and residential projects by increasing recycling, reuse and/or salvage. Materials diverted should include all masonry, aggregate, untreated lumber, metals, cardboard, glass, and other reusable building materials. The City should build a strong C&D waste diversion program by first incentivizing proper waste management planning and compliance with a minimum diversion rate established by the City; in time, requiring use of a materials recovery and recycling plan and achievement of a minimum waste diversion rate established through City mandate. Specific strategies are as follows:
• Use Incentives: The City should develop an
incentive scheme encouraging builders to achieve a minimum diversion rate, preferably through the use of a comprehensive materials recovery and recycling plan prepared by the builder. The general contractor could show compliance by submitting receipts showing waste tonnage and destination. The City should employ phased implementation first incentivizing and then requiring proper planning and waste diversion to allow time for outreach, builder education, and development of markets for recycled/reused materials. Initially, the City should reward the achievement of a minimum diversion rate established by the City and
124
the use of a materials recovery and recycling plan. Possible incentives include reduced impact fees.
• Require Planning: First through
incentive and then by mandate, require all builders seeking a City permit for a C&D project to have a comprehensive materials recovery and recycling plan showing the ability to achieve the minimum diversion rate established by the City. The waste management plan should include specific methods for refuse recycling, salvage, reuse, or reclamation and on-site source separation. The City should develop guidelines for materials recovery and recycling plans and minimum diversion rates, which should depend on the project size and whether the project is residential or commercial.
Estimated Green House Gas Reduction Achieved and Other Performance Measures/Metrics: • Number and percent of developers/
construction firms awarded the incentive and projects which achieve minimum diversion rate.
• Amount of C&D debris that has been diverted from the landfill. A baseline value is needed. Then measurements can determine change over time.
Cost to Implement/Net Savings from Implementation: Initially, builders (and their clients) will bear increased cost of on-site waste separation and non-landfill disposal as the construction salvage and recyclables market develops the capacity/scale to provide the services required at costs comparable to conventional comingled C&D debris dumpster service. Timeline for Implementation/Performance Goals: Create program by 2011; incentivize the use of a comprehensive materials recovery and recycling plan with a 50% diversion by 2012; and require a plan and a 75% diversion by 2017. References (standards, other cities etc.):
Standards: LEED, ECH, NAHB MUSC guidelines: http://academicdepartments.musc.edu/vpfa/
eandf/sustainability/c_d Other cities: Austin, TX
W-2C(ii): Increase recycling of construction waste (created by City projects) Summary of Issue(s) and Benefits: In April 2008, the City passed a resolution to ensure that all City construction projects meet LEED basic certification level standards whose planning began in 2009. Construction waste management is an aspect of LEED certification. By following this recommendation, the City will be in a position to help the County achieve its recent mandate to increase recycling and waste diversion rates to 40%. Recommendation/Strategy/Action Plan: The City should commit to: • Significantly reduce the amount of
landfilled C&D debris generated by City construction projects;
• Develop guidelines for, and establish the use of, a comprehensive site waste management plan for each project. The plans should detail methods of recycling, reuse, salvage and separation on-site;
• Commit to achieve a minimum diversion rate through steps to recycle, salvage and/or reuse, at a minimum, all masonry, aggregate, untreated lumber, metals, cardboard, glass and other reusable building materials from all City-owned C&D sites;
• Commit to a diversion rate of 50% per project by 2012 and 75% by 2017, in order to achieve basic LEED certification standards for Materials and Resources credits 2.1 and 2.2 respectively;
• Establish specific, predetermined disposal sites to facilitate the recycling or salvage of C&D materials. Also, establish disposal protocols and identify appropriate receptacles;
• Develop outreach to inform City staff and contractors of new procedures.
Estimated Green House Gas Reduction Achieved and Other Performance Measures/Metrics:
125
• Amount and percent of C&D debris diverted from landfills (need to establish a baseline figure before the program begins). From this figure it is possible to calculate a reduction in greenhouse gases.
• Number of projects that achieve waste diversion rates. (success rate)
Cost to Implement/Net Savings from Implementation • Short term: possible increased cost to City
and/or contractor of on-site separation and hauling, may be offset by decreased disposal fees at landfill.
• Long term benefits will accrue due to rising cost of landfill tipping fees and development of markets for recycled/reused materials.
References (standards, other cities etc.):
Standards: LEED-NC, LEED-ND MUSC guidelines http://academicdepartments.musc.edu/vpfa/eandf/sustainability/c_d Other cities: Austin
W-2D: Redesign residential recycling program for ergonomics and increased recycling. Summary of Issue(s) and Benefits: The County currently provides biweekly recycling collection to residential customers using small 20-gallon bins. By contrast, the City provides weekly garbage collection using 96 gallon roll carts. Residents, therefore, have 10 gallons of recycling capacity for every 96 gallons of trash capacity: a ratio of about 1 to 10. Recycling bins can quickly fill up before the next collection, making it harder for residents to recycle. Also, full recycling bins can be very heavy. Because they lack wheels and require bending and lifting, they can be a challenge even for healthy adults to handle safely. Recommendation/Strategy/Action Plan: The Public Services department should coordinate with the County to replace all recycling bins with larger roll carts, or offer the option of larger roll carts to interested customers, as part of replacement plan to modernize collection equipment vehicles over time. If recycling roll
carts are optional, outreach materials will be needed to inform residents. Over time as recycling increases and garbage collection decreases, Public Services can coordinate with the County to adjust the frequency of both garbage and recycling collection. Implementation of this recommendation should be consistent with implementation of Unit-Based Pricing. (See Recommendation W-1C.) Estimated Green House Gas Reduction Achieved and Other Performance Measures/Metrics: • Number of residents using a roll cart versus
bin versus nothing. • Percent increase in recycled materials from
residences (need baseline data). • Percent decrease of recyclable waste in
trash containers (need baseline data). • Number of requests for roll carts if optional. Cost to Implement/Net Savings from Implementation: The primary cost are new roll carts and a different type of collection vehicle. W-2E: Encourage the County to add cardboard and all plastics #1 through #7 to residential recycling.
Summary of Issue(s) and Benefits: More than one-quarter of South Carolina’s municipal solid waste is cardboard. Yet cardboard, which is accepted at the County’s recycling center, is not included in the residential curbside collection service, due to limitations of current recycling truck fleet to hold large sheets of cardboard. The County does accept plastics #1 and #2 bottles, jugs and jars for recycling, but it does not accept other plastic #1 and 2 containers or any plastics #3 through #7. Some markets exist for this material. Recommendation/Strategy/Action Plan: The Public Service department should encourage the County to add cardboard to their curbside collection, perhaps by using a compactor truck, typical of garbage collection, to pickup and haul cardboard for recycling. The department should also encourage the County to begin recycling all plastic types #1 through #7, accepting them as part of curbside collection. The City should
126
assist the County by researching costs and market values and developing a full proposal, then assist with outreach to residents. Estimated Green House Gas Reduction Achieved and Other Performance Measures/Metrics: • Amount of new material collected. • Decrease in tonnage of trash collected
from City residences (need baseline). • Decrease in waste sent to the landfill
(need baseline.) References (standards, other cities etc.): SC Recycling Market Development Advisory Council http://www.sccommerce.com/resources/conferencesevents/recyclingmarketdevelopmentadvisorycouncil.aspx W-2F: Require residential recycling. Summary of Issue(s) and Benefits: The South Carolina Solid Waste Policy and Management Act of 1991, set a 35% recycling goal for the State of South Carolina by 1995. Charleston County currently only recycles 10% of its solid waste, far below the stated goal for the State. Kessler Consulting, solid waste consultant for the County, has estimated that residential recycling in Charleston County could more than double. Local households currently recycle only 22,000 tons per year, whereas we could be recycling 45,000. Recycling has numerous benefits, beyond what most people are aware of: • Recycling reduces the pollution,
environmental damage, and greenhouse gas emissions caused by the extraction, transport, and processing of virgin materials;
• Recycling saves energy. Producing an aluminum can from recycled metal uses 95% less energy. Producing products from recycled steel uses 60% less energy, recycled glass 40% less energy, and recycled plastics 70% less energy;12
• Recycling avoids costs associated with
incineration and landfilling ; • Recycling stimulates development of
“green” technologies and products. Recommendation/Strategy/Action Plan: The City should pass an ordinance that: • Requires residential recycling consistent
with the County’s collection capacity; • Ban disposal of paper, aluminum and tin
cans, plastic bottles #1 & #2, cardboard, and glass jars in curbside trash collection bins and carts; and
• Institute policies necessary to enforce this requirement.
Further, the City should provide information to residents about proper curb-side recycling, including an outline of materials collected, acceptable condition of materials, and separation guidelines. Estimated Green House Gas Reduction Achieved and Other Performance Measures/Metrics: • Need baseline data on the amount of
material recycled and annual percent increase of household recyclables collected;
• Need number of households in compliance.
Implementation Responsibilities/Assignments: • The Public Services Department should
arrange with the County to coordinate weekly residential recycling and trash collection so that collection can fall on the same day in as many areas of the City as possible. Public Services and the County should coordinate initial education for residents.
• City should determine unacceptable amount of recyclables in trash (e.g. more than 1-2 items), at which point Solid Waste and/or Environmental Services will be notified and the resident issued a first-time warning then a non-compliance fee.
References (standards, other cities etc.): State of South Carolina http://www.scstatehouse.gov/sess109_1991-1992/bills/388.htm
127

State of Virginia http://www.deq.state.va.us/recycle/mandatory.html Cambridge, Mass: http://www.cambridgema.gov/TheWorks/departments/recycle/ordinance.html# In March 1991, Cambridge City Council passed the Mandatory Recycling Ordinance, which requires each owner or occupant of all residential and commercial buildings to implement recycling programs. The Ordinance set a goal of recycling 15% of our refuse within two years after the start of the curbside program and 25% after five years. Cheltenham Township, PA: http://www.cheltenhamtownship.org/publicworks/recycreg.htm#Mandatory%20Recycling%20Guidelines. San Diego County: http://www.borderwastewise.org/databank/mandat.htm Seattle: http://www.seattle.gov/util/Services/Recycling/Recycle_at_Your_House/index.asp San Francisco: http://www.sfenvironment.org/our_programs/interests.html?ssi=3&ti=6&ii=236#what_the_ordinance_does Westford, Ma: http://www.westfordrecycles.org/index.htm W-2G: Require commercial recycling, and make it easy and beneficial for business owners.
Summary of Issue(s) and Benefits: Currently, businesses and other commercial waste generators have three voluntary options for recycling. If they are on a County recycling collection route, they can use the same small 20-gallon bins offered to residents, if they are on King Street or Market Street they can call Fisher Recycling for cardboard, oyster shells, cooking oil and wine cork collection, or they can pay a fee for private recycling collection. These limited options create obstacles to broad participation in commercial recycling. City staff has proposed a pilot recycling collection project for downtown merchants that would be bundled with existing solid waste collection service. Based on the success of the pilot, the City would consider expansion beyond
the downtown business district. For the service to be economically efficient, broad participation will be necessary. Recommendation/Strategy/Action Plan: Based on the City’s experience with the pilot program, the Public Service Department should write an ordinance requiring mandatory commercial recycling in all service zones as the service becomes available. Recycling service should be convenient; it should include all recyclables consistent with the County collection service including cardboard and it should be available in a cost-neutral or beneficial format to all business and commercial waste generators. The City should consider contracting for service with the County or private haulers. Enforcement should be handled as with residential customers. Waste haulers will periodically report on cardboard put out for trash collection. Solid Waste and/or Environmental Services will issue notices and assess appropriate fees for non-compliance. Further, the City should study the suggestion that a waste reduction and recycling plan be included with business license applications and renewals, and should provide information about proper recycling practices. (See Recommendation W-3C.)
Estimated Green House Gas Reduction Achieved and Other Performance Measures/Metrics: • Amount of material collected (need
baseline). • Decrease in waste tonnage collected from
City businesses (need baseline). • Number of businesses in compliance. W-2H: Provide a recycling bin next to each public trash bin. Summary of Issue(s) and Benefits: There are currently limited recycling bins for public use on City streets and in City facilities, including garages and parks. As with event recycling, recycling in public areas is a high profile, low-cost service demonstrating the City’s commitment to zero waste. Recommendation/Strategy/Action Plan: All public area waste stations throughout the City
128

should include both waste and recycling receptacles. The Parks and Public Service departments should coordinate and standardize their activities, including: • Selecting recycling bins based on
function and aesthetics; • Obtaining BAR/Design Review
Committee approval as needed; • Developing a collection plan; • Placing the bins; • Exploring a public/private partnership
where businesses purchase bins for streets and the City services the bins;
• Educating citizens using various media; • Surveying use of the bins annually to
determine the need to move them or add more.
Estimated Green House Gas Reduction Achieved and Other Performance Measures/Metrics • Number of recycling receptacles placed. • Amount of recycled material collected
from public receptacles. • Percent reduction in City public area
waste sent to landfill and incinerator (need baseline).
• Cross-contamination rate (recyclables mixed with trash).
Cost to Implement/Net Savings from Implementation: Cost of bins and labor. References (standards, other cities etc.): City of San Jose, www.sjrecycles.org Cambridge, MA www.cambridgema.gov
W-2I: Require recycling at local events.
Summary of Issue(s) and Benefits: Charleston is a popular destination where events take place year round. From small functions like weddings to large gatherings like the Cooper River Bridge Run, events generate waste and often contribute to problems with litter and air and water pollution. No official sustainability guidelines currently exist for events, and few local vendors and event organizers use sustainable practices. Recommendation/Strategy/Action Plan:
The City should include a sustainability component in its process for permitting events, including recycling and on-site separation measures. Permanent recycling receptacles should be provided at all City event locations. Additional temporary recycling receptacles should be available, just as additional trash receptacles are available. Recyclables collected would, of course, be consistent with Charleston County Recycling collection . The City should create a sustainable event rating system whereby events will be rated by waste haulers based on the amount of material properly separated and other key criteria. Preference in scheduling for future events should be given to events with high ratings for waste reduction. The City Special Events Committee can create an on-line guide to the new procedures based on models from other municipalities and organizations. It may be helpful to get input from a focus group of regular event applicants as the guide is being written. A simple printed sheet or card can alert events applicants to changed procedures and direct them to the website for details. The Special Events Committee should remain available to answer questions; update the guide and permit applications; approve permitting requests; track event waste and recycling volume; and monitor compliance with permit requirements. The City should coordinate with the Chamber of Commerce Sustainable Business Awards to develop an award for the “greenest” event related to recycling and waste diversion. Finally, the City should attempt to develop a reputation as a sustainable event center for the southeast based on objective, quantifiable accomplishments over the next few years. Estimated Green House Gas Reduction Achieved and Other Performance Measures/Metrics: • Establish baseline data using the
number of individuals who participate in events, and the number of events that transpire annually. Compare this with
129

data from other event-active municipalities regarding CO2 generation.
• Compare county waste data from weeks with very large events to weeks with no large events (need baseline data).
Cost to Implement/Net Savings from Implementation: These changes will cost the City staff time, and there will be an initial cost to event organizers while they learn the new rules. Timeline for Implementation/Performance Goals: This is such an important and visible statement that the work should be undertaken as soon as possible, in late 2009 and early 2010. References (standards, other cities etc.): www.portlandonline.com Sustainable Event and Sport Toolkit (online) www.recyclingadvocates.org New York City Marathon
W3. EXPLORE ENERGY RECOVERY TECHNOLOGIES
W- 3A: Create energy from residual solid waste, using the landfill as a last resort.
Summary of Issue(s) and Benefits: Waste reduction efforts such as unit based pricing, environmentally preferable purchasing, composting, and recycling should reduce our waste stream by 40% or better. It will take some time for these waste reduction efforts to take effect. While we are working to reduce our waste stream as close to zero as possible, the residual solid waste could be converted to an energy source. The city should work with the County to research energy recovery technologies. Landfilling solid waste should be the last resort. If solid waste must be landfilled, the landfill should meet or exceed all EPA and state regulations. Landfill gas contains dioxin, carbon dioxide, mercury, and hundreds of other contaminants.13 Recommendation/Strategy/Action Plan: Create energy from our residual solid waste. All such energy recovery technologies should meet
or exceed EPA and state air quality standards and should recycle materials such as metal and glass not converted to energy. Energy recovery technologies should not undercut the economics or take the place of source reduction, composting, and recycling. Energy created should be used locally if possible.
Estimated Green House Gas Reduction Achieved and Other Performance Measures/Metrics: To be calculated using EPA’s Waste Reduction Model (WARM).14 Performance measures, to be quantified by City staff, should include the percent reduction in garbage disposed at energy recovery facilities and landfills , and the financial savings for residents. Timeline for Implementation/Performance Goals: The County is currently working on its future solid waste plans. The City should continue to work with the County through avenues such as the Green Ribbon Committee.
W4. ENCOURAGE THE PUBLIC TO SUPPORT THESE EFFORTS W-4A: Create a Zero Waste Education Plan Summary of Issue(s) and Benefits: As explained in Recommendation W-1A, Zero Waste maximizes recycling, minimizes waste, reduces consumption and ensures that products are made to be non-toxic, durable, repairable, reusable, recyclable or compostable. Charleston County currently has a limited amount of permitted landfill space. Also, waste improperly disposed in the landfill, or incinerated, unnecessarily increases our exposure to toxins and increases greenhouse gas emissions. Recently, a consultant for the County estimated that the county’s current recycling rate, 10%, could increase to 40%. To allow this to occur, what is needed is a cultural shift toward reducing waste.
Recommendation/Strategy/Action Plan: The City Public Services Department should do the following, perhaps in collaboration with Charleston County Solid Waste Division:
130
• Provide every customer with easy access to Zero Waste information, guidelines and resources, using a variety of formats and outreach methods;
• Update City and County websites with a focus on being user-friendly to all customers.
• Partner with other government departments that communicate monthly with customers (i.e. info printed on monthly utility bills.)
• Collaborate with existing community, government, and business recycling initiatives (i.e. businesses where batteries or oil are recycled.)
• Partner with businesses that already reach our customers. For example realtors, home delivery advertising companies such as VAL-PAK, businesses that send welcome info to new residences, telephone directories, and more.
• Post information on appropriate public information boards (i.e. library bulletin board).
• Conduct community outreach events regularly to support the Zero Waste program.
• Use Charleston’s 101 Neighborhood Associations to communicate with and raise awareness among residents.
• Explore potential for labeling roll carts used for residential trash collection to notify residents of what should not be thrown in the trash.
Estimated Green House Gas Reduction Achieved and Other Performance Measures/Metrics • Collaborate with the County to track
solid waste and recycling data. • Use citizen survey to track/monitor Zero
Waste awareness and participation. Timeline for Implementation/Performance Goals • 2010 or before City Council to Pass a
Zero Waste Resolution. • Implement all other Waste
Subcommittee recommendations as soon as possible.
• 2010 and beyond work with County to educate citizens.
• 2010 and beyond work with Chamber of
Commerce to educate commercial sector and manufacturers.
W-4B: Educate builders about construction debris.
Summary of Issue(s) and Benefits: As private builders are encouraged/incentivized and City contractors are required to increase diversion rates for construction and demolition (C&D) debris, industry professionals will need to be educated about how to achieve these benchmarks. Looking forward to that time, the Charleston Green Committee supported the development of a C&D Waste Diversion Guide (on-line searchable database for the state and printed brochure for the tri-county area.)15 Recommendation/Strategy/Action Plan: The City should: • Advertise this guide on the City website
and with appropriate businesses and nonprofits.
• Distribute the guide with all City issued construction and demolition permits.
• Assign a dedicated Public Services Department staff member to maintain and update the guide.
Estimated Green House Gas Reduction Achieved and Other Performance Measures/Metrics Number of website hits Number of brochures printed/requested Timeline for Implementation/Performance Goals: Ongoing updates and development of guide. References (standards, other cities etc.) DHEC Solid Waste and Recycling Boulder, CO
W-4C: Create and advertise a guide to help businesses reduce waste.
Summary of Issue(s) and Benefits: In 2008, commercial solid waste constituted an estimated 13% (4,721 tons) of the solid waste collected in the City. By minimizing
131

waste and increasing recycling, businesses can offset the cost of waste disposal. Also, recycling is increasingly becoming the signature of a “green” business. Recommendation/Strategy/Action Plan: The Department of Public Services should create a guide to help businesses minimize waste and maximize recycling. The guide should include information on incentives like the Chamber of Commerce Sustainability Awards. Public Services and other departments should advertise the guide on the City website, make hard copies available, and use PSA’s, the telephone book, the water bill, etc. Also, approval or renewal of business licenses should be linked to the creation of a waste recycling plan. Estimated Greenhouse Gas Reduction Achieved and Other Performance Measures/Metrics: • Volume of materials/tonnage recycled by
City businesses (need baseline). • Percent of businesses implementing
recycling (need baseline). • Number of web hits and hard copies
requested. Timeline for Implementation/Performance Goals: Create the guide with the launch of the downtown commercial recycling pilot program. References (standards, other cities etc.) Carolina Waste DHEC Charleston County
132

Green Fair 2009 KidZone
“Outreach and education are the tools of the sustainability trade; with this plan we have broken ground. Now its time to roll up our shirtsleeves and get to work."
Jenny Bloom,
Recycling Education Coordinator, Charleston County Education Subcommittee Chair
133
he Education Subcommittee supports the recommendations developed by the
subcommittees of the Green Committee, as well as the best practices associated with these recommendations. This subcommittee also develops public outreach and educational efforts that go beyond the issues covered by the subcommittees, but serve the greater purpose of the Green Committee. In the future, our efforts will become more varied as we develop programs to reach out to inform the public, Charleston businesses, and City employees about the recommendations. From training volunteers to collect recyclables at City events in support of the Zero Waste Subcommittee; to creating resource guides on the web to help residents interested in weatherization per Building and Energy subcommittee goals; to advocating for more sustainable practices in City offices and schools, the Education Subcommittee helps the Sustainability Director and Charleston residents implement the programs that will move this plan’s recommendations into everyday practice. Since early 2009, some forty subcommittee members have
met monthly and worked more frequently in committee to develop educational programs to facilitate the big picture outlined within these pages. Unlike the other subcommittees, we are not asking the City to adopt additional recommendations. We exist to support the recommendations of other subcommittees with action and advice. Some subcommittees will use the Education Subcommittee as a research and resource base, and some will rely on our combined skills to address larger marketing and outreach goals to “message” our community’s directional shifts. Community outreach and education efforts will focus on introducing new opportunities and technologies, as well as age-old, simple behaviors and practices that impact environmental preservation and energy conservation, and support healthier, more sustainable lifestyles. Our campaigns and actions are based on what will be most helpful to the City in becoming a leader in sustainable operations.
GREEN EDUCATION
ACTIONS 1. Provide volunteer training
and support 2. Research and resource
development 3. Develop curriculum and
outreach
BENEFITS
Reduce energy costs
Create jobs
Improve public health
Protect clean air Protect clean water
Conserve natural resources Enhance quality of life
Slow climate change
Protect cultural identity Raise awareness
Green Committee in action
134

“I’m excited about taking the Green Plan to the street -- in my neighborhood just a little education would make a big difference.”
Nina Fair, Principal, Fair Consulting, LLC
Green Committee Member
135

rom its inception the Green Committee has benefitted from the enthusiastic
participation by a diverse cross section of the community. Over two years, attendance at monthly meetings was consistently strong – 75-147 people came out to learn and study best practices and innovative ideas from around the country and around the world. Perhaps the strongest aspect of the recommendations in this document is that they are the culmination of hundreds of people working in subcommittees focusing on the details in order to determine what will work here in the Lowcountry. The City of Charleston’s unique set of jurisdictional challenges and opportunities combined with its climate, geography, and existing infrastructure were all considered as the committee planned not only what should be adopted but also how to ensure implementation. Initially tasked with the development of this plan by Mayor Riley in October 2007, in many ways the work of the Charleston Green Committee has only just
begun with its submission to City Council for adoption. The Committee is dedicated to engaging the community of Charleston, including its schools, businesses, and community organizations, in the implementation of this plan, as well as the implementation of other long-term goals that will make Charleston a healthier, more sustainable, and more environmentally-friendly city. Some of the recommendations detailed in this plan are the “low-hanging fruit” – short-term tactics proposed because of their low cost and ease of implementation while other recommendations are for the long term, intended to be a guide for future policies, programs, and objectives. Other recommendations consist of education ,study, testing and/or implementation. The Green Committee will continue to take a leadership role in advocating for more sustainable practices and educating and supporting the City and its staff and the public on the goals of its work particularly through the Green Committee’s Education Subcommittee, and assisting with implementing its recommendations.
Bringing the plan into being will be a cooperative, all-inclusive effort of both private and public enterprise. The work will include: • Community outreach,
education and public awareness campaigns on the concepts, goals and recommendations presented in the plan; and
• Regional leadership and cooperation and public-private collaboration.
Community Outreach, Education and Public Awareness
Over the past two years of the plan’s development, the Green Committee has been involved in many public events and activities, and has developed a presence in the community as a source of information and advocacy on sustainable development and green living. The Green Committee has also created tools to engage the citizens and businesses of Charleston to help them understand and support the various initiatives of the Committee.
136
These resources are listed in the box to the right. Continued reliance on these and development of new resources will be important to community outreach and education, as well as the implementation of the Green Committee’s recommendations and a focus of its ongoing work. Moving forward, the Education Subcommittee will be working hand in hand with the other subcommittees to continue efforts to engage the public, Charleston’s business community, and City staff with tools and resources to increase awareness, understanding, and support for more environmentally responsible and sustainability-driven
practices. Education and outreach efforts are critical to the success and utility of the plan, as well as the acceptance and support of the overall sustainability movement. As enthusiasm and participation continue to grow, with new people joining the ranks each month, the Committee welcomes everyone to the table. With these ideas in mind, perhaps the most critical piece is to acknowledge the great impact small changes can make to collectively achieve long term sustainability and environmentally responsible lifestyles. The common theme to ensure success in all areas is to educate and raise awareness by continually being in front of people with the message until this new way of life becomes routine.
Collaboration and Leadership
Some of the plan’s recommendations go beyond the boundaries of the City of Charleston, transcending our jurisdiction, and ultimately will need regional cooperation to succeed. Several transportation
ALONG THE WAY
• Earth Day Resolutions
adopted by City Council April 23rd, 2008. See appendix for details.
• A guide for construction and demolition waste diversion;
• Event volunteers to support recycling, which led to an event recycling training program;
• Financial support and advice in the initial development of a “one-stop shop” energy efficiency and financing program for improvements for all buildings within the City;
• Support for events such as the first Charleston Green Fair and the region’s first Lawn Mower Exchange;
• Educational tools to share the work and success of the Green Committee with others as well as;
• An independent website hosting information and resources related to Green Committee activity.
Practicality and feasibility of the recommendations were major priorities for James Meadors of Meadors Construction, Green Committee Chairman.
137
GREEN WORKS
Katie Wells runs KEW Solutions, Inc., a Charleston-based service training company that works with hotels and convention centers nationwide. Earlier this year, her “green” credentials landed her a contract to train service staff for the G-20 summit at the Pittsburgh convention center -- the first convention center in the U.S. to be certified “LEED Gold” for its sustainable features, including rigorous recycling.
“Being green has given my business a competitive edge.” Here in Charleston, Wells helped start the local Green Fair, and used sustainable practices in a recent office renovation. What’s more, every time she lands a new client she gives a generous donation to support environmental education in local schools. “Hey,” says Wells, “I need to practice what I preach!”
recommendations depend on coordination with CARTA and the BCDCOG. Likewise, many waste management and recycling recommendations relate to the County’s plans for improved efficiency, waste diversion, and alternative disposal options. The City is in a position to support, and in some instances spearhead, regional efforts to foster sustainable growth and development. The plan also encourages the City to use its authority and influence to remove barriers and enable opportunities for businesses and citizens to engage in a more sustainable community and have more environmentally conscious lifestyle choices. Implementation will also require the cooperation of both private and public sectors. Neither the burden nor the benefit of this plan’s recommendations will fall completely on the City, its citizens, or its business community. The City must seek to lead and influence private enterprise and civic leaders to engage in more sustainable practices, and, in turn, private enterprise and the citizenry must support the City with their own initiative and innovation. The City is in a
strong position to lead and to use its authority to create a positive arena in which to grow and develop sustainably, and businesses and citizens will benefit by taking the initiative and assuming responsibility for their own future and the future of the City.
Plan for the Future
The plan has been designed, in part, so that successful implementation will lead to further initiatives and practices that support a more sustainable City. Tracking and benchmarking progress is essential. A first step of the Green Committee was to take stock of current conditions. The City inventoried greenhouse gas emissions by sector, analyzed them over time (2002 and 2006), and compared them to emissions in other cities. With this inventory in mind, the subcommittees made recommendations to facilitate better environmental management, combat climate change, and encourage sustainable growth and development. The continued tracking of greenhouse gases and other metrics is an important
138

component of the plan’s implementation and is suggested throughout many recommendations. Tracking and benchmarking should continue with a 2010 greenhouse gas inventory, if not sooner. Tracking and benchmarking data related to the recommendations will enable the City to evaluate progress over time as well as to help prioritize and refocus efforts if needed, and inform further initiatives and improvement. As initiatives are implemented and successes achieved, the process starts over. New goals are set, new practices are developed, and new successes achieved – the process is cyclical, constantly evolving for a better City, better services, and better investment in a more sustainable future. The City of Charleston has an expressed motivation and commitment to sustainability as a principle of growth and development – social, cultural, economic, and environmental. This is evident in the City’s 2008 Preservation Plan, all of its recent and ongoing comprehensive planning and numerous projects and programs intended to conserve energy, reduce environmental impacts of urbanization, and retain a high quality of life in Charleston. In addition, much of the work
SUSTAINABILITY DIRECTOR
Starting in October 2009, this commitment expanded to include a City Sustainability Director – a new position and a new division in the Department of Planning, Preservation, and Sustainability. The Sustainability Director will take the lead on many of the issues outlined in the plan, and serve as counsel for the Mayor and City staff on issues of climate protection and sustainability.
“It is an exciting time to come to Charleston where there are already so many resources and successes. We certainly need and expect to create more and I am happy to be a conduit and a liaison for you.”
Brian P. Sheehan Charleston’s 1st Sustainability Director
Within City operations, sustainability cannot stay confined to a single department. It must transcend all departments and all operational initiatives. Therefore, the Sustainability Director’s duties will include helping to establish an environmental ethic throughout City government and among the public at large. At a minimum, each department should develop its own sustainable operations plan using the City of Charleston’s Green Plan as a guide and resource. By integrating the principle of sustainability into all levels of government and operations, it can serve as a foundation for all new policies, programs, and objectives.
139

that is outlined in this plan will and must ultimately be performed in the community, beyond the reach of government. It is therefore imperative that the Green Committee continue to function as the go-to resource, not only for all levels of government and its operations, but also for every citizen and business that has come to rely on it through the development of this plan. The Green Committee’s make-up and representation is a strategic advantage, not
only for the City of Charleston but also for the region. It can and should continue to be a primary resource for this and other communities. Its ability to shift resources and refocus efforts quickly will help capture new opportunities beyond those ever envisioned in this plan. Although the structure of and representation on the Green Committee can and will change over time, again, this fluidity will allow for rapid response as well as permanence over the generations, both of which
are necessary ingredients to success. The Green Committee’s network of professionals, students, citizens, businesses, non-profits and community stakeholders is quite simply the most dynamic force for positive change in the region and a tremendous asset in sustaining these efforts moving forward.
Mayor Riley works with Buist Academy students to plant a tree that will have a benefit to future generations.
140

“Unless someone like you cares a whole awful lot, nothing is going to get better. It's not. ” Dr. Seuss
141

he contributions to the creation of this plan cannot begin to be listed. The volunteer hours can not be
counted and their value can not be measured. The financial and in-kind gifts we received were vital in producing the recommendations – some provided interns at no cost; our banner used at events was underwritten; local companies allowed their employees to work on CGC projects and encouraged their participation; and in addition to their contributions of time and talent, many members gave money to underscore their commitments. We were also gratified to have the contributions of those who, while they did not participate in our process still felt the need to demonstrate support for the initiatives to make Charleston more sustainable.
Thank you to the following contributors*
A Plus Staffing
All Green Committee Speakers
Anastasia Emelianoff
Argand Energy Solutions
Anonymous
Becky Fenno
Berkeley Electric Cooperative
Cal McRae
Carolee Williams
CARTA
Charles Foster Staffing
Charleston County
Environmental Management
and Recycling
Charleston County Housing
and Redevelopment Authority
Circular Congregational
Church
Charleston Classic Homes
College of Charleston
Dan Dickison
Dennis Knight
Dick Dalla Mura
Dominick Giordano
Doug Mackenzie
Dwellsmart
Elizabeth Hagood
Fair Consulting, LLC
Felicia Rhue Howard
Fisher Commercial Recycling
Service
Frank Genello
Gary Thornhill
George Buell
Green Room of Charleston
Harbor National Bank
I’On Group
Ian Sanchez
James and Anne Meadors
James Island Recreation
Center
Jennifer Mathis
Jenny Bloom
Jody Stebben
Joel McKellar
John Wesley United Methodist
Church
Johnson Controls
Katherine Fishburne
Kitty Robinson
Kris King
Lowcountry Environmental
Education Programs
Linda Ketner
Liollio Architecture
Lowcountry Foodbank
Marshall Meadors
Meadors Construction
Medical University of South
Carolina
Megan Desrosiers
Michael Nixon
Mitch Colgan
Nick Rigas
Nicole Kansas
Nina deCordova
Nina Fair
O'Connor Monogramming
and Gifts
Pat Sullivan
Paul VanWagenen
Peter Zalka
Phil Dustan
Phyllis Young
Rebecca O’Brien
Richard Leo Johnson,
photographer Atlantic
Archives
Rosen and Associates
Sandlapper Tours
SCANA Corporation
Sierra Club
142
Thank you to the following Charleston Green Committee Speakers Sea Level Rise in Charleston, Clemson Architectural Studio, Rob Miller Sustainability Committee College of Charleston, Burton Callicott Sustainability Institute, Brian Cordell South Carolina Coastal Conservation League, Megan Desrosiers Green Building Council, Dennis Knight League of Women Voters, Jenny Wiedower Lowcountry Earth Force, Anna Richardson American Institute of Architects, Joel McKellar ICLEI Local Governments for Sustainability (International Council for Local Environmental Initiatives), Wesley Look
Seth Cantly
Shawn McKay
South Carolina Aquarium
South Carolina Coastal
Conservation League
South Carolina Electric & Gas
Southern Lumber and Millwork
Stephen Johnston
Stubbs Muldrow Herrin
Architects
Susan Collins
Sustainable Warehouse
Suzie Webster and Drew
Frayno
Sydney Cook
Terry Bell-Aby
The Sustainability Institute
Thomas and Denzinger
Architects
Tidewater Environmental
Services
Tom Hamilton
Tony and Linda Bakker
Wertimer and Associates
Landscape Architects
Westminster Presbyterian
Church
Whitney Powers
Wilbur Smith Associates
Yve Assad
*Includes contributions as of
November 16. 2009.
Charleston Green Maps, Barry Patterson Rising Seas: Challenges and Opportunities for the Lowcountry, Southern Alliance for Clean Energy, Toni Reale Santee Cooper Wind Study, Mollie Gore Super Goals and Principles Workshop, Rocky Mountain Institute (RMI), Michael Kinsley Commuter Rail for Charleston, City of Charleston, Mayor Joseph P. Riley, Jr. SC Climate, Energy and Commerce Committee Report, Representative Ben Hagood South Carolina Offshore Wind Project, Eco Energy, Nick Rigas Net Metering and Palmetto Clean Energy (PaCE), SCE&G, Bob Long What’s Green about the Economic Stimulus Package for Charleston?, City of Charleston, Harry Lesesne Engaging SCE&G Customers on Energy Efficiency and Demand Response, SCE&G, Felicia Rhue Howard
143
Offshore Wind Power Development in South Carolina, College of Charleston, Dr. Scott Harris Charleston Energy Partnership, Serrafix, Doug Foy, Mike Jesanis and Andrew Gottlieb Wind Energy Presentation, Green Committee, James Meadors Phase II – The Stormwater Green Initiative, City of Charleston, Fowler Del Porto
144
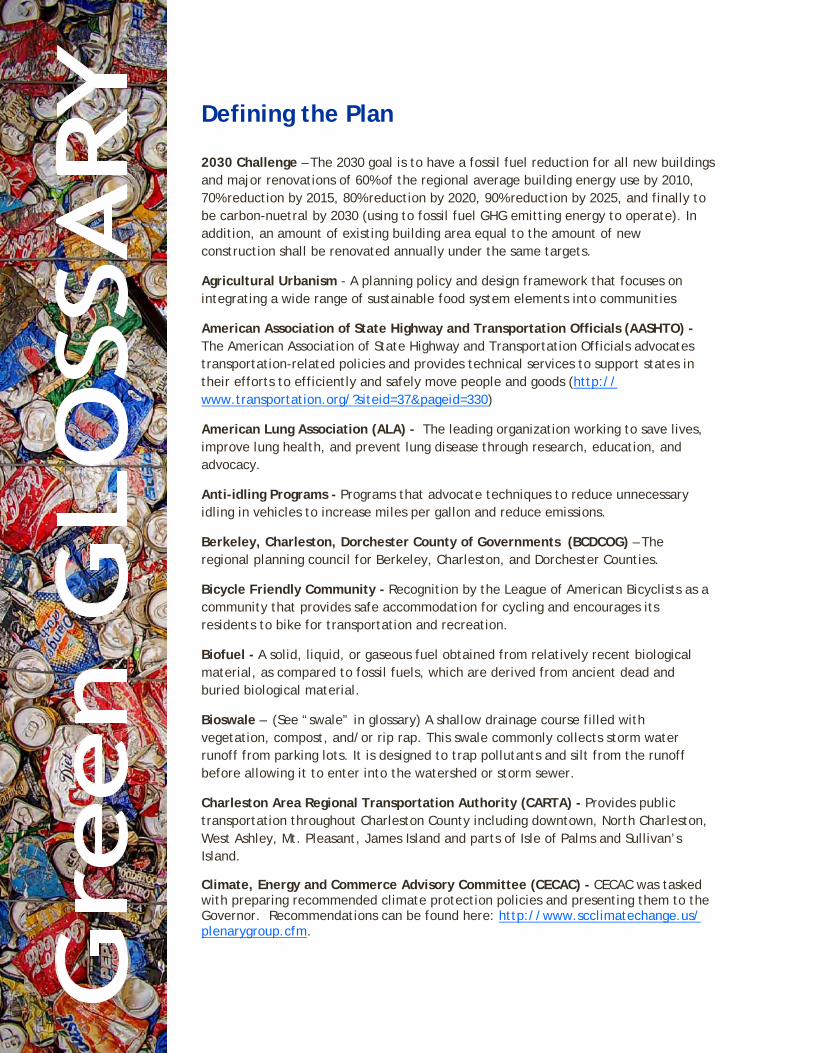
2
Defining the Plan
2030 Challenge – The 2030 goal is to have a fossil fuel reduction for all new buildings and major renovations of 60% of the regional average building energy use by 2010, 70% reduction by 2015, 80% reduction by 2020, 90% reduction by 2025, and finally to be carbon-nuetral by 2030 (using to fossil fuel GHG emitting energy to operate). In addition, an amount of existing building area equal to the amount of new construction shall be renovated annually under the same targets.
Agricultural Urbanism - A planning policy and design framework that focuses on integrating a wide range of sustainable food system elements into communities
American Association of State Highway and Transportation Officials (AASHTO) - The American Association of State Highway and Transportation Officials advocates transportation-related policies and provides technical services to support states in their efforts to efficiently and safely move people and goods (http://www.transportation.org/?siteid=37&pageid=330)
American Lung Association (ALA) - The leading organization working to save lives, improve lung health, and prevent lung disease through research, education, and advocacy.
Anti-idling Programs - Programs that advocate techniques to reduce unnecessary idling in vehicles to increase miles per gallon and reduce emissions.
Berkeley, Charleston, Dorchester County of Governments (BCDCOG) – The regional planning council for Berkeley, Charleston, and Dorchester Counties.
Bicycle Friendly Community - Recognition by the League of American Bicyclists as a community that provides safe accommodation for cycling and encourages its residents to bike for transportation and recreation.
Biofuel - A solid, liquid, or gaseous fuel obtained from relatively recent biological material, as compared to fossil fuels, which are derived from ancient dead and buried biological material.
Bioswale – (See “swale” in glossary) A shallow drainage course filled with vegetation, compost, and/or rip rap. This swale commonly collects storm water runoff from parking lots. It is designed to trap pollutants and silt from the runoff before allowing it to enter into the watershed or storm sewer.
Charleston Area Regional Transportation Authority (CARTA) - Provides public transportation throughout Charleston County including downtown, North Charleston, West Ashley, Mt. Pleasant, James Island and parts of Isle of Palms and Sullivan’s Island.
Climate, Energy and Commerce Advisory Committee (CECAC) - CECAC was tasked with preparing recommended climate protection policies and presenting them to the Governor. Recommendations can be found here: http://www.scclimatechange.us/plenarygroup.cfm.
145

3
Commuter Rail - A passenger rail for commuters that provides public transportation between a center city and an outer suburb or other commuter town
Complete Streets - Complete streets are designed to enable safe access for all users, including pedestrians, bicyclists, motorists and transit riders of all ages and abilities.
Construction and Demolition Waste (C & D) – Materials that consist of debris generated during the construction, renovation, and demolition of buildings, roads, and bridges. This often includes bulky, heavy materials such as concrete, wood, metals, and glass. (http://www.epa.gov/waste/conserve/rrr/imr/cdm/index.htm)
Council of Governments (COG or BCDCOG) – As one of South Carolina's 10 Regional Planning Councils, the Berkeley-Charleston-Dorchester Council of Governments' primary objectives are to assist local governments develop local and regional plans within the tri-county region, as well as providing local governments with planning and technical support to improve the quality of life in the region.
The BCDCOG accomplishes this by providing its member governments with technical assistance is a variety of fields, including economic and community development, comprehensive planning, statistical information gathering and analysis, and water resource management.
In addition, the COG's board of directors provides a forum for local leaders to find common goals and determine a course for the entire region.
Local governments in Berkeley and Charleston counties first created a Regional Planning Commission in 1968 to encourage a regional approach to local dilemmas. Dorchester County governments elected to join the group three years later. The organization changed in 1976 to the Berkeley-Charleston-Dorchester Council of Governments (BCDCOG). (www.bcdcog.com)
Dark Skies Initiative – The Dark Skies Initiative is a non-profit effort to help solve the problem of light pollution. City lights left on at night block out the stars and the Milky Way and waste energy.
Density Bonuses - Density bonuses are granted for projects in which the developer agrees to include a certain number of affordable housing units. Essentially, for every one unit of affordable housing a developer agrees to build, a jurisdiction allows the construction of a greater number of market rate units than would otherwise be allowed. (http://www.wahpdc.org/densitybonus.html)
Energy Crops – A low cost plant, (such as corn, grasses, soybeans, etc.), grown for harvesting and processing into biofuels, or directly exploited as solid biomass for its energy content.
Energy Service Company (ESCO) - A consultancy group engages in a performance based contract with a client firm to implement measures which reduce energy consumption and costs in a technically and financially viable manner.
146
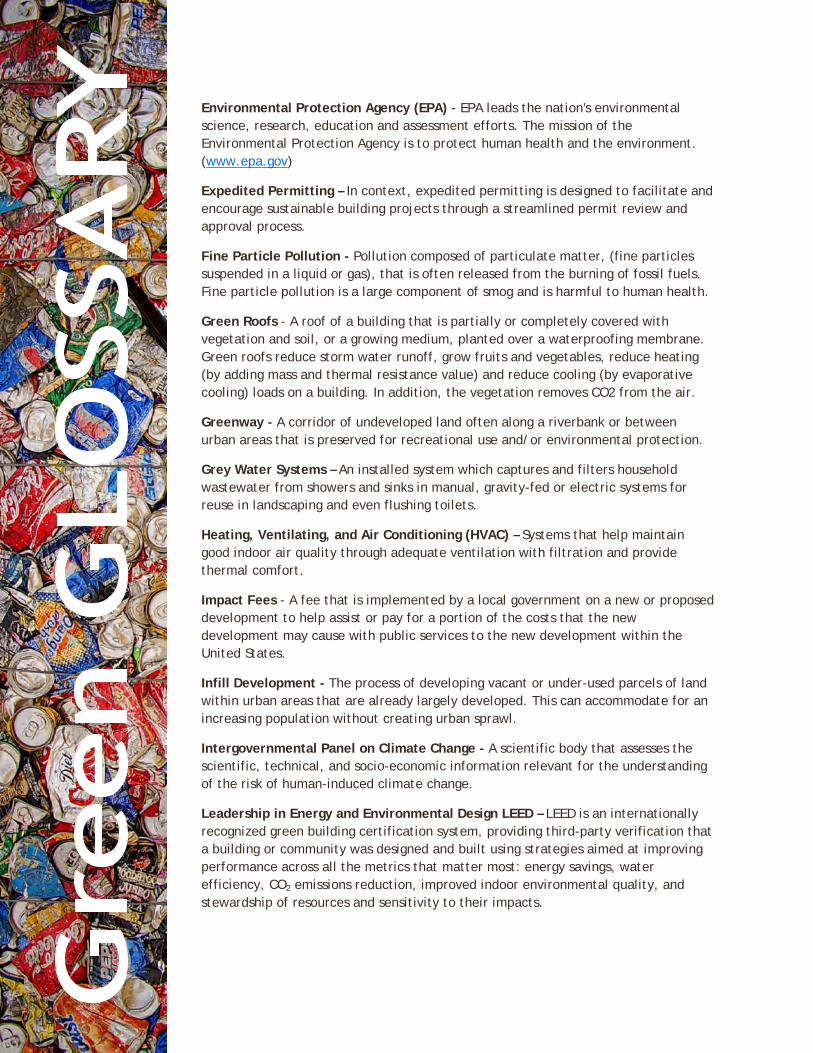
4
Environmental Protection Agency (EPA) - EPA leads the nation's environmental science, research, education and assessment efforts. The mission of the Environmental Protection Agency is to protect human health and the environment. (www.epa.gov)
Expedited Permitting – In context, expedited permitting is designed to facilitate and encourage sustainable building projects through a streamlined permit review and approval process.
Fine Particle Pollution - Pollution composed of particulate matter, (fine particles suspended in a liquid or gas), that is often released from the burning of fossil fuels. Fine particle pollution is a large component of smog and is harmful to human health.
Green Roofs - A roof of a building that is partially or completely covered with vegetation and soil, or a growing medium, planted over a waterproofing membrane. Green roofs reduce storm water runoff, grow fruits and vegetables, reduce heating (by adding mass and thermal resistance value) and reduce cooling (by evaporative cooling) loads on a building. In addition, the vegetation removes CO2 from the air.
Greenway - A corridor of undeveloped land often along a riverbank or between urban areas that is preserved for recreational use and/or environmental protection.
Grey Water Systems – An installed system which captures and filters household wastewater from showers and sinks in manual, gravity-fed or electric systems for reuse in landscaping and even flushing toilets.
Heating, Ventilating, and Air Conditioning (HVAC) – Systems that help maintain good indoor air quality through adequate ventilation with filtration and provide thermal comfort.
Impact Fees - A fee that is implemented by a local government on a new or proposed development to help assist or pay for a portion of the costs that the new development may cause with public services to the new development within the United States.
Infill Development - The process of developing vacant or under-used parcels of land within urban areas that are already largely developed. This can accommodate for an increasing population without creating urban sprawl.
Intergovernmental Panel on Climate Change - A scientific body that assesses the scientific, technical, and socio-economic information relevant for the understanding of the risk of human-induced climate change.
Leadership in Energy and Environmental Design LEED – LEED is an internationally recognized green building certification system, providing third-party verification that a building or community was designed and built using strategies aimed at improving performance across all the metrics that matter most: energy savings, water efficiency, CO2 emissions reduction, improved indoor environmental quality, and stewardship of resources and sensitivity to their impacts.
147

5
Developed by the U.S. Green Building Council (USGBC), LEED provides building owners and operators a concise framework for identifying and implementing practical and measurable green building design, construction, operations and maintenance solutions. LEED is flexible enough to apply to all building types – commercial as well as residential. It works throughout the building lifecycle – design and construction, operations and maintenance, tenant fitout, and significant retrofit. And LEED for Neighborhood Development extends the benefits of LEED beyond the building footprint into the neighborhood it serves. (http://www.usgbc.org/DisplayPage.aspx?CMSPageID=1988)
League of American Bicyclists - A league founded in 1880 to promote bicycling for fun, fitness and transportation through their work in advocacy and education for a bicycle-friendly America.
Life Cycle Cost – The total cost of ownership, maintenance, upgrading, and disposing of a fixed asset over time.
Light Imprint— A philosophy that encourages practices with the lowest amount of environmental impact.
Light Rail – Lightweight passenger rail cars used for public transportation. Light rails generally have a lower capacity and a lower speed than heavy rail systems. The rail cars are driven electronically from overhead lines like a trolley. In addition, light rails are run in rights of way, but are not always separated from traffic.
Living Shoreline - shoreline management options that provide erosion control benefits, while also enhancing the natural shoreline habitat. Living shorelines often allow for natural coastal processes to remain through the strategic placement o f plants, stone, sandfill and other structural and organic materials.
Local Development Corporation (LDC) - An organization, usually made up of local citizens, designed to improve the economy of the area by encouraging business and industry to locate there.
Multi-generational Tree Canopy - The limbs, branches and leaves (biomass) of trees of significantly varying ages. An ideal urban forest is comprised of 1/3 young trees, 1/3 maturing trees and 1/3 mature trees. Multi-modal planning—refers to decision making that considers various modes (walking, cycling, automobile, public transit, etc.) and connections among modes so each can fill its optimal role in the overall transport system.
Municipal Improvement District (MID) – Districts created by cities and towns to account for special improvements benefiting specific properties and financed by special assessments and/or fees. (http://www.sao.state.ut.us/UAM/special%20district/vf06.htm)
Municipal Solid Waste (MSW) – Common garbage or trash generated by industries, businesses, institutions, and homes.
148

6
Park Once Districts - In a "park once" district, people are encouraged to park in one place and then make stops on foot rather than driving from one destination to another within the district, as you would with a car-oriented strip mall area. Creating the type of environment where it’s easy for people to walk between destinations has to do both with urban design and with parking policies. For example, if each destination is required to provide its own off-street parking, and if a building has parking on all sides, dead zones of surface parking lots are created between destinations, making walking distances longer and walking experiences less pleasant, which in turn causes people to get back in the car to go a few stores down rather than to walk. (http://transtoolkit.mapc.org/resources/parking-toolkit/parking-issues-questions/create-park-once-district)
Pedestrian shed - The basic building block of walkable neighborhoods. An area encompassed by the walking distance from a center point and often defined as the area covered by a 5-minute walk (about 0.25 miles, 1,320 feet, or 400 meters.) They may be drawn as perfect circles, but in practice pedestrian sheds have irregular shapes because they cover the actual distance walked, not the linear (crow flies) distance. (http://pedshed.net/?page_id=5)
Permeable Paving - A range of materials and techniques for paving roads, parking lots and walkways that allow the movement of water and air through the paving material, thus ensuring that stormwater can drain into the soil. Otherwise, this stormwater could wash into storm drains as runoff, which is often polluted and emptied unfiltered into nearby creeks and streams.
Permit Fee Rebates - In context, expedited permitting is designed to facilitate and encourage sustainable building projects through rebates given after payment of the permitting fee.
Petrochemical Fertilizers - Fertilizers derived from raw materials of petroleum.
Planned Unit Development (PUD) – Designed grouping of varied and compatible land uses, such as housing, recreation, commercial centers, and industrial parks, all within one contained development or subdivision. PUD zones generally set an overall density limit for the entire subdivision, allowing the dwelling units to be clustered to provide for common open space. An example is Harbor Park, Kenosha, Wisconsin.
Rain Garden - A slightly depressed garden, used to capture stormwater runoff. The runoff is then taken up by the plants and filtered through the ground, as opposed to running off into storm drains or watersheds while possibly carrying pollutants and silt.
Rapidly Renewable Materials - Materials that can be grown and harvested for production in a short period of time. These materials reduce resource depletion because they can be harvested and renewed quickly and sustainably. To be considered a rapidly renewable material, the practice of exploiting the resource must be fully renewable in 10 years or less.
Revolving Loan Fund - In context, a fund that can be used to make energy saving renovations to a building, and is structured so that repayments can be used to make more loans.
149

7
Renewable Energy - Energy generated from perpetual and/or rapidly renewable resources, such as wind, water, solar, geothermal heat, tides, and biomass (if rapidly renewable).
Ridership: The number of passengers who ride a public transport system over a specific amount of time (day, month, year, etc.).
Sequester – In context, to capture CO2 and/or other greenhouse gases within environmental sinks, such as ocean water and plants.
Shared Vehicle Systems - This system allows a group of people to share a fleet of vehicles and spread the responsibility and rights of ownership. The system can support more efficient use of vehicles and can choose to purchase more environmentally friendly vehicles.
Single Occupancy Vehicles (SOV) - Motor vehicles used for transportation of the driver as a single occupant.
SmartCode - The SmartCode is a model form-based unified land development ordinance designed to create walkable neighborhoods across the full spectrum of human settlement, from the most rural to the most urban, incorporating a transect of character and intensity within each. The SmartCode is a unified land development ordinance template for planning and urban design. It folds zoning, subdivision regulations, urban design, and basic architectural standards into one compact document. The SmartCode enables community vision by coding specific outcomes that are desired in particular places.
The SmartCode is not a building code. Building codes address life/safety issues such as fire and storm protection. Examples of building codes include the International Building Code (IBC), International Residential Code IRC), and International Code Council (ICC) documents.
Form-Based – The SmartCode is a form-based code. Conventional Euclidean zoning regulates land development with the most emphasis on controlling land use. Form-based zoning has been developed over the last twenty years to overcome the problems of sprawl created by use-based codes. Form-based zoning regulates land development with the most emphasis on controlling urban form and less emphasis on controlling land uses (although uses with negative impacts, such as heavy industry, adult businesses, etc. are still regulated). Urban form features regulated under the SmartCode include the width of lots, size of blocks, building setbacks, building heights, placement of buildings on the lot, location of parking, etc.
Model Code – The SmartCode is a model code, with metrics designed to create a generic medium-sized American city structured into walkable neighborhoods. The model code is freeware, a template meant to be locally customized by professional planners, architects, and attorneys.
Rural-Urban Transect – The zones within the SmartCode are designed to create complete human habitats ranging from the very rural to the very urban. Where conventional zoning categories are based on different land uses, SmartCode
150

8
zoning categories are based on their rural-urban character. All categories within the SmartCode allow some mix of uses. SmartCode zoning categories ensure that a community offers a full diversity of building types, thoroughfare types, and civic space types, and that each has appropriate characteristics for its location.
Unified Land Development Regulation – The SmartCode is a unified land development code that can include zoning, subdivision regulations, urban design, signage, landscaping, and basic architectural standards.
Walkable Neighborhoods – One of the basic principles in the SmartCode is that towns and cities should be structured as a series of walkable neighborhoods. Walkable neighborhoods require a mix of land uses (residential, office, and retail), public spaces with a sense of enclosure to create “outdoor rooms”, and pedestrian-oriented transportation design.
Sustainable Community - A community that is designed to persist over generations with minimal impact to the environment.
Swale - A swale is a slight depression that runs along the contour of the land. This depression catches rainfall, allowing it to soak in and collect as groundwater. This groundwater can then move down slope, keeping your grass watered through rainfall alone.
Traditional Neighborhood Development (TND) – A comprehensive planning system that permits educational facilities, civic buildings, and commercial establishments to be within walking distance of private homes. These buildings are served by complete streets, which allow walking, biking, or driving.
Transect - New Urbanist town planners use the term transect to refer to the varieties of land use from an urban core to a rural boundary. General New Urban transect classifications (from highest to lowest density) are: urban core, urban center, general urban, suburban, rural, and natural. Among the goals of this type of development is the creation of compact, walkable communities centered around mass transit systems. This makes it possible to live without complete dependence on a car for mobility.
Transect Based Codes - A type of code which reflects the natural evolution of development from a denser city core outward toward suburban, rural and agricultural uses.
Transit Oriented Development - The creation of compact, walkable communities centered around mass transit systems. This makes it possible to live without complete dependence on a car for mobility.
Transit Shed - An area encompassed by the walking distance that people will walk from a starting point to a transit stop and generally defined as the area covered by a 5-minute walk (about 0.25 mile) for a bus stop and a 10-minute walk (about 0.50 mile) for a rail transit stop. By developing housing, job and service centers within this distance, fewer vehicle trips are needed.
151

9
Tri-County Link – A rural bus system serving Berkeley, Charleston, and Dorchester Counties of South Carolina. (http://www.ridetricountylink.com/index.html)
Unit Based Pricing – A system in which residents pay for municipal solid waste collection services per unit of waste collected, rather than through a fixed fee or property tax.
Urban Forests Effects - A computer model that calculates the structure, environmental effects, and values of urban forests.
Urban Growth Boundary (UGB)- A regional boundary set in an attempt to control urban sprawl. The area inside the boundary must be used for higher density urban development, and the area outside the boundary must be used for lower density development.
Urban Land Institute - A multidisciplinary real estate forum that provides leadership in the responsible use of land and in creating and sustaining thriving communities worldwide.
Vehicle Miles Traveled (VMT) - The number of miles traveled by all or certain vehicles within a specified time and area.
Zero Waste: A philosophy that strives to recycle, reuse, and compost all resources that would normally be discarded as waste, so that very minimal to zero waste is sent to a landfill or incinerator.
152
Introduction 1. See “Renewable Energy,” www.grcity.us, http://www.grand-rapids.mi.us/index.pl?
page_id=10562 accessed August 2009.
2. See “Composting,” www.sfenvironmental.org, http://www.sfenvironment.org/our_programs/topics.html?ti=6 accessed August 2009.
3. See “Charlotte Light Rail Exceeds First Year Ridership Goals,” Smart Growth News (2009), http://www.smartgrowth.org/news/article.asp?art=7208&res=1280 accessed August 2009.
4. See “Fourth Assessment Report: Climate Change 2007,” IPCC, at 23, 86, http://www.ipcc.ch/pdf/assessment-report/ar4/wg1/ar4-wg1-ts.pdf.
5. See “Summary for Policymakers” at 5-7 in Climate Change 2007: The Physical Science Basis, Contribution of Working Group 1 to the Fourth Assessment Report of the Intergovernmental Panel on Climate Change, http://www.ipcc.ch/pdf/assessment-report/ar4/wg1/ar4-wg1-spm.pdf.
6. Id. at 69.
7. See “Global Climate Change Impacts in the United States,” U.S. Global Change Research Program (2009) at 9, http://downloads.globalchange.gov/usimpacts/pdfs/climate-impacts-report.pdf.
8. Id. at 10.
9. See “Climate Risk ‘to Million Species,’” BBC On-Line News (7 Jan 2004), http://news.bbc.co.uk/2/hi/science/nature/3375447.stm.
10. See “Energy Efficiency Can Deliver Big Rewards,” Christian Science Monitor (1 May 2009), http://features.csmonitor.com/environment/topics/?topic=40&offset=3.
11. See “Why Aren’t We Harnessing Waste Heat?” Christian Science Monitor (8 Oct 2009), http://features.csmonitor.com/environment/2009/10/08/why-arent-we-harnessing-waste-heat/.
12. See “An Offshore Wind Power Industrial Cluster for South Carolina,” Clemson University Restoration Institute (2009), http://www.scribd.com/doc/14832620/Charleston-SC-Offshore-Wind-Ins-Trust-Rial-Hub-White-Paper.
13. See “Silver Lining to Climate Change: Green Jobs,” United Nations Environment Programme (2007), http://www.unep.org/Documents.Multilingual/Default.asp?DocumentID=523&ArticleID=5717&l=en.
14. See “Clean Energy Economy,” We Can Solve It (2009), http://www.wecansolveit.org/content/solution/clean_energy_economy/.
15. Global Climate Change Impacts in the United States, U.S. Global Change Research Program (2009) at 111-12, http://downloads.globalchange.gov/usimpacts/pdfs/climate-impacts-report.pdf.
16. Id. at 113, 115-16.
153
17. See Global Climate Change Impacts in the United States, U.S. Global Change Research Program (2009) at 12, 99, 102, www.globalchange.gov/usimpacts.
18. See “Mean Sea Level Trend, Charleston, South Carolina,” NOAA Tides & Currents, http://tidesandcurrents.noaa.gov/sltrends/sltrends_station.shtml?stnid=8665530.
19. See “Summary for Policymakers” at 7 in Climate Change 2007: The Physical Science Basis, Contribution of Working Group 1 to the Fourth Assessment Report of the Intergovernmental Panel on Climate Change, http://www.ipcc.ch/pdf/assessment-report/ar4/wg1/ar4-wg1-spm.pdf.
20. See “Rising Sea Levels Set to Have Major Impacts Around the World,” University of Copenhagen Press Release (10 March 2009), http://climatecongress.ku.dk/newsroom/rising_sealevels/. In 2007, the Intergovernmental Panel on Climate Change predicted a sea level rise by the end of this century of 18 to 59 centimeters (roughly 0.6 to 1.9 feet). This estimate included the effects of melting glaciers and expanding ocean water, which are relatively predictable. However, it did not include the effect of melting ice sheets, a process which is not as well understood. In March 2009, scientists updated this estimate to 50 to 100 or more centimeters (roughly 1.6 to 3.3 or more feet) because ice sheets in Greenland and Antarctica are now melting much faster than expected. Id; see also prediction of 3 to 4 feet for the higher emissions scenario and explanation of IPCC prediction, Global Climate Change Impacts in the United States, U.S. Global Change Research Program (2009) at 25, http://downloads.globalchange.gov/usimpacts/pdfs/climate-impacts-report.pdf.
21. Id.at 112.
22. Id. at 12. About half of the nation’s coastal wetlands have been lost – most during the past 50 years to overzealous development – weakening their capacity to absorb storm surges. Id. at 149.
23. In 2006 dollars. See “The Cost of Climate Change: What We’ll Pay if Global Warming Continues Unchecked,” Stockholm Environment Institute-US Center, Tufts University (2008).
24. Note: the rate of wetlands loss has subsequently slowed. See “Threats to Wetlands,” U.S. Environmental Protection Agency (2001), http://www.epa.gov/owow/wetlands/pdf/threats.pdf.
25. For the past ten to 15 years, 25% to 35% of the state’s shellfish beds have consistently been closed to harvesting because fecal coliform exceeds the federal standard. The primary cause is the way we manage stormwater in urban and suburban areas: sending water down street drains and directly into creeks and rivers, rather than letting it filter naturally through the soil. A secondary cause is boat wakes, which prevent the fecal coliform from settling permanently at the bottom. Telephone interview with Mike Pearson, Shellfish Sanitation Section Manager, South Carolina Department of Health and Environmental Control, 25 August 2009.
26. See “State of the Air 2007,” American Lung Association, at 6, http://www.lbamspray.com/00_Health/American%20Lung%20Association.pdf.
27. See “Physicians are Concerned about Dangers of Air Pollution, Post & Courier (2 July 2008), http://www.postandcourier.com/news/2008/jul/02/physicians_are_concerned_about_dangers_air_polluti/. Charleston County Medical Society resolution confirmed by e-mail with staff Kaye Wallen on 28 Sept 2009.
154

28. The three to six degree difference is based on tabulation of local data by Green Committee members. The federal Environmental Protection Agency states that annual mean air temperature of a city with one million people or more can be 1.8 to 5.4 degrees Farenheit warmer than surrounding areas, with a much greater differential of 22 degrees Farenheit on clear calm nights. See “Heat Island Effect,” U.S. Environmental Protection Agency (2009), http://www.epa.gov/heatisland/.
29. Under the agreement, participating cities agree to (1) meet or beat the Kyoto Protocol target of reducing greenhouse gas emissions by 7% from 1990 levels by 2012; (2) urge federal and state governments to do the same; and (3) urge the federal government to pass bipartisan greenhouse gas reduction legislation establishing a national emission trading system. See “U.S. Conference of Mayors Climate Protection Agreement,” http://www.usmayors.org/climateprotection/agreement.htm.
30. Specifically, the Green Committee was charged with (1) Providing solutions to ensure a prosperous community that will sustain a healthy citizenry and a healthy planet; (2) Inspiring individuals and organizations to make Charleston a model of health and ecologically sustainability; and (3) Working with City government, businesses, nonprofits, and others to protect and enhance Charleston’s environment and quality of life. See City of Charleston Earth Day Resolution, April 2008, http://www.charlestoncity.info/shared/docs/0/42208greenresolution.pdf; see also Charleston Green Committee website, http://charlestongreencommittee.com/missionstatement.html.
Better Buildings 1. See “Unlocking Energy Efficiency in the U.S. Economy,” McKinsey & Company (2009),
http://www.mckinsey.com/clientservice/electricpowernaturalgas/us_energy_efficiency/.
2. See “Green Building Research,” U.S. Green Building Council, http://www.usgbc.org/DisplayPage.aspx?CMSPageID=1718.
3. See summary of “Nation Under Siege: Sea Level Rise at our Doorstep,” Architecture 2030 at 4 (2007), (http://www.architecture2030.org/pdfs/coastal_impact_summary.pdf.
4. See “Promotion of Green Building: Local Government Land Use and Building Code Incentives and Mandates,” Institute of Green Professionals (3 August 2009), http://www.consilienceblog.org/consilience-the-blog/2009/8/3/future-of-green-building-where-is-it-going.html.
5. See “Case Studies,” Architecture 2030, http://www.architecture2030.org/current_situation/case_studies.php.
6. See “Green Building Principles – Environmental Impact,” Smart Communities Network (2004), http://www.smartcommunities.ncat.org/buildings/envirimp.shtml.
7. See “Green Building Principles – Resource Conservation, Smart Communities Network (2004), http://www.smartcommunities.ncat.org/buildings/rescon.shtml.
Better Buildings Recommendations 1. Guidance on achieving these goals along with a blueprint for implementation and
numerous resources may be found at www.architecture2030.org.
155
Cleaner Energy 1. [i] With 61% of the state’s electrical power coming from coal, nuclear energy contributes
31%, natural gas/oil 5%, hydropower 2%, and non-hydropower renewable less than 1%. See “Energy Policy Report,” South Carolina Regulation of Public Utilities Review Committee (2009) at 6, http://www.scstatehouse.gov/citizensinterestpage/EnergyIssuesAndPolicies/FinalPURCEnergyReport.pdf.
2. [ii] Charleston is primarily served by South Carolina Electric and Gas, which generates electricity using 66%coal, 19% nuclear, 11% natural gas, and 4% hydroelectric. See “SCE&G Quick Facts” retrieved August 2009, http://www.sceg.com/NR/rdonlyres/26ADE7BE-0699-41C8-84C7 32C488E5292A/0/SCEGQuickFacts.pdf.
3. [iii] See “Cost Benefit Analysis: Replacing Ontario’s Coal-Fired Electricity Generation,” Ontario Ministry of Energy (2005), www.mei.gov.cn.ca/English/pdf/electricity/coal_cost_benefit_analysis_april2005.pdf.
4. [iv] See “Clean-Energy Investments Create Jobs in South Carolina” Political Economy Research Institute
5. (2009), http://images2.americanprogress.org/CAP/2009/06/factsheets/peri_sc.pdf; “Green Economic Recovery Program: Impacts on South Carolina,” Political Economy Research Institute (2008), http://images2.americanprogress.org/CAP/2008/09/peri_sc.pdf; “South Carolina’s Road to Energy Independence,” Blue-Green Alliance (2007), http://www.bluegreenalliance.org/assets/pdf/SC-Report.pdf; “Clean Energy: Jobs for America’s Future,” World Wildlife Fund (2001), http://www.worldwildlife.org/climate/Publications/WWFBinaryitem4931.pdf .Relative to spending on fossil fuels, clean-energy investments create 2.6 times more jobs for people with college degrees or above; 3 times more jobs for people with some college; and 3.6 times more jobs for people with high school degrees or less. See “Clean-Energy Investments Create Jobs in South Carolina” Political Economy Research Institute (2009), http://images2.americanprogress.org/CAP/2009/06/factsheets/peri_sc.pdf.
6. [v] See “Clean-Energy Investments Create Jobs in South Carolina” Political Economy Research Institute (2009), http://images2.americanprogress.org/CAP/2009/06/factsheets/peri_sc.pdf.
7. [vi] See “State Energy Data System,” U.S. Energy Information Administration (2005), http://www.eia.doe.gov/emeu/states/hf.jsp?incfile=sep_sum/plain_html/sum_ex_tot.html
8. [vii] See “Don’t Get Burned: The Risks of Investing in New Coal-Fired Generating Facilities,” Interfaith Center on Corporate Economics (2008) at 20, http://www.iccr.org/news/press_releases/pdf%20files/DontGetBurned08.pdf.
9. [viii] See “Levelized Cost of Energy Analysis: Version 2.0,” Lazard (2008), http://www.narucmeetings.org/
10. Presentations/2008%20EMP%20Levelized%20Cost%20of%20Energy%20-%20Master%20June%202008%20(2).pdf. Beyond its modest price tag, energy efficiency has other benefits. A recent study showed that investment in energy efficiency, as opposed to fossil fuel power plants, would give consumers in Virginia a net savings of $2.2 billion annually. It would also create nearly 10,000 new jobs, growing the state’s economy by $882 million per year. See “Energizing Virginia: Efficiency First,” American Council for an Energy Efficient Economy (2008), https://salsa.democracyinaction.org/o/423/images/
156

energyefficiency_va.pdf.
11. [ix] See “Energy Policy Report,” State Regulation of Public Utilities Review Committee (2009) at 5, http://www.scstatehouse.gov/citizensinterestpage/EnergyIssuesAndPolicies/FinalPURCEnergyReport.pdf.
12. [x] See “2008 State Energy Efficiency Scorecard,” American Council for an Energy-Efficient Economy, http://www.aceee.org/pubs/e086_es.pdf.
13. [xi] A utility in Colorado has committed to reducing consumption by an impressive 1.4% in 2013. Also, Vermont utilities reduced energy consumption by approximately 5%, and peak demand by approximately 6%, between 1991 and 1997. See “Comments on Energy and Energy Policies in South Carolina,” SC Coastal Conservation League (2008) at 12-13 and cites therein, http://www.scstatehouse.gov/citizensinterestpage/EnergyIssuesAndPolicies/CommentsReceived/Coastal%20Conservation%20League%20Comments.pdf; see also “Powering Down in Juneau,” Berkeley Lab News Center (2009), http://www.lbl.gov/publicinfo/newscenter/features/2008/EETD-alaska.html. (Juneau, Alaska residents voluntarily reduce peak power usage by 40% during an eight-week crisis in electrical power delivery).
14. [xii] Duke Energy’s goal is consistent with a unanimous recommendation by the state’s Climate, Energy, and Commerce Advisory Committee (CECAC). See id. at 14 and cites therein.
15. [xiii] See “Energy Policy Report,” South Carolina Regulation of Public Utilities Review Committee (2009) at 6,
16. http://www.scstatehouse.gov/citizensinterestpage/EnergyIssuesAndPolicies/FinalPURCEnergyReport.pdf.
17. [xiv] See “Los Angeles Will End Use of Coal Fired Power,” Reuters (2 July 2009), http://www.reuters.com/article/GCA-GreenBusiness/idUSTRE56165X20090702.
18. [xv] See “Austin Energy Raises Green Energy Goal,” News 8 Austin (4 Sept 2009), http://news8austin.com/content/your_news/default.asp?ArID=251247.
19. [xvi] See “Renewable Energy,” Grand Rapids, Michigan official site, retrieved August 2009, mhttp://www.ci.grand-rapids.mi.us/index.pl?page_id=9143.
20. [xvii] See “Offshore Wind Farms and the Environment,” Danish Energy Authority (2006) at 3, http://www.bluewaterwind.com/pdfs/havvindm_korr_16nov_UK.pdf.
21. [xviii] See “An Offshore Wind Power Industrial Cluster for South Carolina,” Clemson University Restoration Institute (2009) at 3, http://www.scribd.com/doc/14832620/Charleston-SC-Offshore-Wind-Ins-Trust-Rial-Hub-White-Paper.
22. [xix] Id.
23. [xx] The U.S. Department of Energy predicts that South Carolina could generate 1,000 to 5,000 megawatts of energy from offshore wind. See “Energy Efficiency and Renewable Energy,” U.S. Department of Energy (2009) at 10, http://www.windpoweringamerica.gov/pdfs/20_percent_wind_2.pdf. This represents 4% to more than 20% of the state’s current peak summer electrical capacity, according to an e-mail exchange with Dr. Nicholas Rigas of the Clemson University Restoration Institute on 15 Sept 2009. Peak summer capacity is the maximum amount of electricity that can be put on the state’s grid during peak hours.
157

24. [xxi] See “An Offshore Wind Power Industrial Cluster for South Carolina,” Clemson University Restoration Institute (2009) at 4, http://www.scribd.com/doc/14832620/Charleston-SC-Offshore-Wind-Ins-Trust-Rial-Hub-White-Paper.
Cleaner Energy Recommendations 1. See http://apps1.eere.energy.gov/states/maps/renewable_portfolio_states.cfm.
2. See http://www.energy.ca.gov/renewables/index.html.
3. See http://www.reuters.com/article/GCA-GreenBusiness/idUSTRE56165X20090702.
4. See http://www.ci.grand-rapids.mi.us/index.pl?page_id=9143.
Sustainable Communities
1. Studying a 600-acre property in Mt. Pleasant, scientists from Clemson University and elsewhere looked at the impact on clean water from two possible development scenarios: conventional sprawl, and a more clustered design that minimized pavement and kept buildings away from the water’s edge. The sprawl design produced 43% more stormwater runoff than the clustered design. Also, in the sprawl design, the runoff contained three times as many pollutants. See “The Belle Hall Study,” Dover, Kohl & Partners (1996), http://www.doverkohl.com/files/pdf/Belle%20Hall_low%20res.pdf.
2. See “Modeling and Predicting Future Urban Growth in the Charleston Area,” Strom Thurmond Institute of Government & Public Affairs, Clemson University (2003), http://www.strom.clemson.edu/teams/dctech/urban.html.
3. See “Land Conversion in South Carolina: State Makes Top Ten List,” Jim Self Center on the Future, Clemson University (2000) at 2-3, http://www.strom.clemson.edu/publications/london/conversion.pdf.
4. See “Gasoline Consumption Per Capita,” Statemaster.Com (2001 source, retrieved August 2009) http://www.statemaster.com/graph/ene_gas_con_percap-energy-gasoline-consumption-per-capita.
5. See “Growing Cooler: The Evidence on Urban Development and Climate Change,” Urban Land Institute (2007), at 8-9, http://www.smartgrowthamerica.org/documents/growingcoolerCH1.pdf.
6. Id.
7. Id.
8. See “The Valuation of the World’s Ecosystem Services and Natural Capital,” Nature, v. 387 (15 May 1997) at 253-260.
Sustainable Communities Recommendations 1. See, e.g., http://www.transect.org/.
2. See http://www.lightimprint.org/.
158

Improved Transportation 1. See “Growing Cooler: The Evidence on Urban Development and Climate Change,” Urban
Land Institute 2007), at 4, http://www.smartgrowthamerica.org/documents/growingcoolerCH1.pdf.
2. Id. at 2, 4. Id
3. Id. at 4.
4. See “A New Vision for the 21st Century,” AASHTO (2007), summarized at http://www.transportation.org/news/121.aspx. Id
5. See “Growing Cooler: The Evidence on Urban Development and Climate Change,” Urban Land Institute (2007), at 4, 7, http://www.smartgrowthamerica.org/documents/growingcoolerCH1.pdf.
6. See “Outer Limits: Sprawling Atlanta Seeks New Routes to the Future,” Grist (14 May 2008), http://www.atlanticstation.com/press/Sprawling%20Atlanta%20seeks%20new%20routes%20to%20the%20future%20|%20By%20Robert%20DiGiacomo%20|%20Grist%20|%20Grist%20Feature%20|%2014%20May%202008.pdf.
7. See “Fast Track for Commuter Rail, Post & Courier (14 March 2008), http://www.postandcourier.com/news/2008/mar/14/fast_track_commuter_rail33776/.
8. See “Ridership Ahead of Schedule,” Charlotte Observer (12 July 2008), http://www.charlotteobserver.com/local/story/76813.html?q=light%20rail%2016,479. See “Charlotte Light Rail Line Exceeds First-Year Ridership Goals,” Smart Growth News (2009) http://www.smartgrowth.org/news/article.asp?art=7208&res=1280.
9. See “Charlotte Light Rail Line Exceeds First-Year Ridership Goals,” Smart Growth News (2009) http://www.smartgrowth.org/news/article.asp?art=7208&res=1280.
10. See “Charlotte’s New Lynx Light Rail,” Light Rail Now (2008), http://www.lightrailnow.org/news/n_cha_2008-08a.htm.
11. Id.
12. See “Light Rail in Charlotte,” www.Joe Urban.com (2009), http://joe-urban.com/wp-content/uploads/2009/08/light-rail-in-charlotte-july-20091.pdf.
13. See, e.g., “South End Development Fits Transit-Oriented Plan,” Charlotte Observer (20 July 2008), http://www.charlotteobserver.com/opinion/story/85469.html?q=light%20rail%20%22transit%20oriented%22; “Rezoning Requests to be Considered,” Charlotte Observer (14 Sept 2008), http://www.charlotteobserver.com/277/story/175039.html?q=light%20rail%20%22transit%20oriented%22.
14. See “Light Rail in Charlotte,” www.Joe Urban.com (2009), http://joe-urban.com/wp-content/uploads/2009/08/light-rail-in-charlotte-july-20091.pdf.
15. See “State of the Air 2007,” American Lung Association, at 6, http://www.lbamspray.com/00_Health/American%20Lung%20Association.pdf.
16. See “Physicians are Concerned about Dangers of Air Pollution,” Post & Courier (2 July 2008), http://www.postandcourier.com/news/2008/jul/02/
159

physicians_are_concerned_about_dangers_air_polluti/; Charleston County Medical Society resolution confirmed by e-mail with staff Kaye Wallen on 28 Sept 2009.
Improved Transportation Recommendations 1. See www.completestreets.org.
2. Census 2007 American Community Survey.
3. http://www.irs.gov/publications/p15b/ar02.html#en_US_publink1000101852
4. www.hybridcars.com/oil-dependence
5. http://www.fueleconomy.gov/feg/driveHabits.shtml
6. LEED Category – Sustainable Sites – 4.3
Zero Waste 1. See “Trash Strategies Approved,” Post & Courier (2 Sept 2009), http://
www.postandcourier.com/news/2009/sep/02/trash-strategies-approved/.
2. Id.
3. See “Waste Management 2008 Rankings,” www.SustainLane.com, http://www.sustainlane.com/us-city-rankings/categories/waste-management.
4. “California Reports 58 Percent Waste Diversion,” Recycling Today (8 Jan 2009); http://www.recyclingtoday.com/news/news.asp?ID=14485; “Maryland’s 47.5 Percent Diversion Rate,” Maryland Department of the Environment (2007), http://www.mde.maryland.gov/Programs/LandPrograms/Recycling/Local/recylingrates.asp.
5. See “Safeway’s Waste Diversion Rate: 85 Percent,” www.GreenBiz.com (14 May 2009), http://www.greenbiz.com/news/2009/05/14/safeways-waste-diversion-rate-85-percent; “Waste and Recycling,” Global Citizenship at HP (2009), http://www.hp.com/hpinfo/globalcitizenship/gcreport/operations/waste.html. .
6. See “10 Fixes for the Planet,” Newsweek (14 April 2008), http://www.newsweek.com/id/130625/page/1.
7. “Atlanta to Launch Southeast’s First Zero Waste Zone,” U.S. Environmental Protection Agency (12 Feb 2009), http://yosemite.epa.gov/opa/admpress.nsf/2ac652c59703a4738525735900400c2c/ 4f7604c1b53aa8cd8525755b00781318!OpenDocument.
8. See “What’s Your Take on Zero Waste?” Austin City Connection, http://www.ci.austin.tx.us/sws/0waste.htm; “A Resolution Supporting the Creation of a Zero Waste Plan,” Grassroots Recycling Network (1998), http://www.grrn.org/zerowaste/CZWRes.html.
9. See “Pay as You Throw (PAYT) in the U.S.: 2006 Update and Analyses,” U.S. Environmental Protection Agency Office of Solid Waste (2006) at 1 http://www.epa.gov/waste/conserve/tools/payt/pdf/sera06.pdf.
10. See “Pay as You Throw (PAYT) in the U.S.: 2006 Update and Analyses,” U.S. Environmental Protection Agency Office of Solid Waste (2006) at 1 http://www.epa.gov/waste/
160

conserve/tools/payt/pdf/sera06.pdf.
11. This was the finding of a Duke University study involving 212 communities. In fact, in 6% of communities using this system litter actually decreased. See “New Study Documents Pay-As-You-Throw-Results,” U.S. Environmental Protection Agency Office of Solid Waste (1997), http://www.epa.gov/waste/conserve/tools/payt/tools/bulletin/bullet.htm. Also, communities have developed ways to make sure that unit-based pricing does not have an unfair impact on low-income residents – for example distributing free or reduced-cost stickers or bags to families who qualify for other assistance programs. See “Variable-Rate or ‘Pay-as-you-throw’ Waste Management: Answers to Frequently Asked Questions,” Reason Public Policy Institute (2002) at 17, http://reason.org/files/a4e176b96ff713f3dec9a3336cafd71c.pdf.
12. See “The City of Charleston South Carolina SMART Waste Management,” US Environmental Protection Agency, Green Waste Solutions, ICF International (2009), at 12-13, available from Kirsten Brown, Green Waste Solutions. Rockville Center, NY, [email protected].
13. See “Methane as a Greenhouse Gas,” U.S. Climate Change Science Program (2006), http://www.climatescience.gov/infosheets/highlight1/default.htm.
14. See “Trash Strategies Approved,” Post & Courier (2 Sept 2009), http://www.postandcourier.com/news/2009/sep/02/trash-strategies-approved/.
15. See “Composting Practices for Organics,” COOL2012.com (2009), http://www.cool2012.com/community/collection/.
16. See “Composting,” www.sfenvironment.org (2009), http://www.sfenvironment.org/our_programs/topics.html?ti=6.
17. See “Common Waste and Materials: Aluminum,” U.S. Environmental Protection Agency (2008), http://www.epa.gov/osw/conserve/materials/alum.htm.
18. See “Construction and Demolition,” SC Solid Waste Management Annual Report (2008) at 71, http://www.scdhec.gov/environment/lwm/recycle/pubs/section7.pdf.
19. Id.
20. See “Construction Waste Management,” National Institute of Building Sciences Whole Building Design Guide (2008), http://www.wbdg.org/resources/cwmgmt.php.
21. See “Local Government Sample Documents,” California Integrated Waste Management Board (2009), http://www.ciwmb.ca.gov/ConDemo/SampleDocs/.
22. See articles at http://mandatoryrecycling.org/; see also “New Recycling Regulations Go into Effect,” WWAY Channel 3 (21 Sept 2009), http://www.wwaytv3.com/new_recycling_regulations_set_go_effect/09/2009; “Mandatory Recycling,” Cambridge Department of Public Works, http://www.cambridgema.gov/TheWorks/departments/recycle/ordinance.html.
23. See “MSW Recycling: Markets and Commodities,” SC Solid Waste Management Annual Report (2008) at 13, 20, http://www.scdhec.gov/environment/lwm/recycle/pubs/section3.pdf.
24. Id.
25. See “Coca-Cola, URRC Open World’s Largest Plastic Bottle-to-Bottle Recycling Plant.”
161

www.thecoca-colacompany.com (14 Jan 2009), http://www.thecoca-colacompany.com/presscenter/nr_20090114_bottle-to-bottle_recycling.html.
26. “Coke Opening World’s Largest Bottle-to-Bottle Recycling Plant,” Huffington Post (15 Jan 2009), http://www.huffingtonpost.com/2009/01/15/coke-opening-worlds-large_n_158280.html.
Zero Waste Recommendations 1. Wasting and Recycling in the United States 2000: http://www.grrn.org/order/
w2kinfo.html
2. The EPA created WARM to help solid waste planners and organizations track and report greenhouse gas emissions reductions and energy savings from several different waste management practices. The calculator is available at: http://www.epa.gov/climatechange/wycd/waste/calculators/Warm_home.html.
3. Available at: http://www.epa.gov/climatechange/wycd/waste/calculators/Warm_home.html.
4. See American City and County (Oct 2003) http://americancityandcounty.com/mag/government_payasyouthrow_payoff/
5. The city of Boulder, CO tested two curbside compost pilot programs, leading to a 60% waste diversion. Post-pilot, current diversion is 40%
6. See http://www.sfenvironment.org/our_programs/topics.html?ti=6.
7. See http://www.cool2012.com/community/collection/.
8. Four European countries have actually changed their emission-reduction targets for the Kyoto Protocol to include contributions from organic agriculture. See http://www.rodaleinstitute.org/files/Rodale_Research_Paper-5-28-08.pdf at 5.
9. Whole Foods now composts the organic waste from its Southeastern stores, then resells it in tiny, expensive packages. See http://www.farmerd.com/product/farmer_d_compost_16qt/composting
10. The EPA estimates that .05 metric tons of carbon equivalent per wet ton of finished compost is sequestered after 10 years. http://www.epa.gov/climatechange/wycd/waste/downloads/chapter4.pdf
11. See http://www.scdhec.net/environment/lwm/recycle/pubs/e-waste.pdf).
12. EPA , Common Waste and Materials: http://www.epa.gov/osw/conserve/materials/index.htm
13. Energy Justice Network: http://www.energyjustice.net/lfg/
14. Available at: http://www.epa.gov/climatechange/wycd/waste/calculators/Warm_home.html.
15. http://www.scgreenbuildingdirectory.org/
162

Historic Structures and Sustainability
1.0 DEFINITION Historic Structures are those which are fifty-years or older and eligible for the National Register of Historic Places.
Within the rubric of sustainability, Historic Structures should be defined just as they are elsewhere by the City of Charleston.
Because of their unique cultural value, Historic Structures need a different level and kind of consideration than Existing Buildings, (which have been considered under the Buildings category of the Charleston Green Committee).
2.0 PRINCIPLES
The following principles should be adopted regarding sustainability in Historic Structures. They should find application at community as well as building scales.
2.1 Historic structures are inherently sustainable.
Due to their longevity and their ingrained values, Historic Structures are inherently sustainable. Most structures built prior to 1950 are sensitively tuned to the natural environment, employ higher quality and longer-lasting materials than currently available, utilize passive environmental systems, conserve open space, foster sustainable practices, and create a sense of place. Moreover, the “embodied energy” in historic structures represents a significant sustainable resource. Consequently, Historic Structures should be valued, not just culturally, but as highly sustainable.
Beyond the buildings themselves, historic settlements tend to embody sustainable practices through their density (conserving land and infrastructure while minimizing vehicular transport); support of mixed uses (minimizing vehicular transport while supporting community engagement); sponsoring pedestrian connections; orientation to natural topography and climate; and so on.
2.2 Rediscover and recover the ritual of sustainable habitation.
Historically, there was a ritual that developed with the sustainable occupation of buildings and sites, such as the seasonal closing of shutters or the daily opening of windows. The meaning, poetics, and value of such practices, at the scale of the community and the building, have been lost.
163
2.2.1 Awnings
New technologies can be added to old ones in supporting ritual habitation. For example, mechanically operated awnings, controlled by timers or sensors, can direct a building to responding to changing sun conditions.
2.2.2 Incentives
The City and preservation organizations should sponsor educational programs to encourage the rediscovery of sustainable features of historic structures; they should also raise awareness and popularize modified standards for interior conditioning that are more compatible with historic structures and take advantage of the natural climate. Directories of companies that provide passive and active systems should be made available.
2.3 Repair and Reuse (Instead of Replace)
Except in the case of mechanical and electrical systems, most of which are not original, historic building fabric should be repaired and reused (at all scales). Even when not visible, saving historic fabric preserves building culture for future generations; it also prevents materials from ending up in a landfill and precludes the need for new building materials that have to be processed and transported. Every material that is already in place represents a significant investment in embodied energy; historic structures add to this a cultural value. As a renovation culture is developed that repairs rather than replaces fabric, renovation practices that follow this ethic will be reduced in cost.
2.4 Make Alterations to Historic Structures Reversible
The overriding criterion in renovating Historic Structures for sustainability is to make alterations reversible. That is, sustainable renovations should have minimal impacts to existing historic fabric upon implementation and could, in the future, be removed so that the building could be restored to its historic configuration.
3.0 BEST PRACTICES
The following strategies should direct the sustainable treatment of Historic Structures.
3.1 Encourage the use and development of sustainable standards for Historic Structures.
The Leadership in Energy and Environmental Design (LEED) Green Building Rating System, a program of the US Green Building Council (USGBC), encourages sustainable green building and development practices through standards and performance criteria. LEED is the emerging sustainability standard governing the built
164

environment in the United States.
The City should participate in the development of a LEED standard for historic buildings.
3.1.1 Applicable Standards
There is not currently a LEED standard specifically attuned to historic buildings. The most applicable existing standards are:
LEED-NC: LEED for New Construction and Major Renovations/Additions (for commercial and institutional buildings, released in 2000) LEED-EB: LEED for Existing Buildings (released 2004) LEED-ND: LEED for Neighborhood Development (in pilot) Within the existing ratings, historic building projects are hampered by their historic fabric because, where sustainable efficiencies can be gained according to standards for new construction, historic integrity is often lost. USGBC is aware of this problem and discussions are in progress to give Historic Structures adequate credits. Just the embodied energy in Historic Structures is generally recognized as worth 30-50 years of energy use.
3.1.2 Information For more information: http://www.usgbc.org/DisplayPage.aspx?CategoryID=19 http://209.85.165.104/search?q=cache:zaZGsyYwRxoJ:www.eere.energy.gov/femp/pdfs/ee_historicbldgs_leed.pdf+LEED+for+Historic+Structures&hl=en&ct=clnk&cd=4&gl=us&client=firefox-a 3.2 HAZARDOUS MATERIALS Create safe, not necessarily non-hazardous, environments.
The treatment or removal of hazardous materials is a significant aspect of sustainable renovation. Lead paint, asbestos, fuel oil tanks, and other materials present issues during and after removal. It is often more sustainable, as well as better for historic fabric, to abate by encapsulation rather than to remove hazardous materials. Abatement should not be cause for demolition.
The City should develop an information center for sustainable renovation with links to National Park Service guidelines and other credible sources. Regarding sources such as the Occupational Safety and Health Administration (OSHA), the City should provide simplified, user-friendly interpretations that will be followed by homeowners and small contractors.
Regulate the removal and disposal of lead paint.
165

The removal of lead paint, and its disposal, is a serious problem in historic areas and should be regulated by the City such as by requiring proof of training as mandated by EPA’s Renovation, Repair and Painting (RRP) ruling.
3.3 WATER MANAGEMENT Utilize on-site water storage when gray water systems are installed.
Sustainable practices encourage the conservation and delayed release of precipitation. Although Historic Structures frequently had such systems, cisterns in the Charleston climate may fill up in a few months unless on-site uses for retained water (such as site watering and toilet flushing) are utilized. Consequently, cisterns should only be used when gray water uses are also employed.
3.4 PASSIVE SYSTEMS Always retain or provide passive systems.
The City should require workable passive systems in all historic buildings, even when they are redundant to mechanical ones. Daylighting and natural ventilation, with automated controls that reduce use of and dependence on mechanical systems, should become standard. Historic windows should be maintained in good operating condition (i.e., not painted shut and with counterweights in good operable condition); permanent storm windows should be discouraged.
3.5 BUILDING SYSTEMS Improve energy efficiency through high-performance technology.
Electrical and mechanical systems are the exception to the Repair and Reuse principle: new is often better than old. Recent technological developments in lighting, daylighting, HVAC systems, electrical controls, hot water heaters, automated and motion-sensitive control systems, and other new technologies can drastically improve energy efficiency with little or no impact to historic fabric. New technologies should be aesthetically and technically employed with sensitivity to the historic fabric.
Specific recommended practices:
3.5.1 Design Standards
Conditioning standards in historic structures should not be designed to maintain heating and cooling temperatures that have become standard in modern structures (typically year-round interior temperatures between 70-72 Degrees F). Designed to respond to local climate and not designed for extreme indoor-outdoor temperature differentials, historic structures bring with them the need for inhabitants to live in a less-artificial environment.
Consequently, more moderate design temperatures should become standard, such as: • heating: 68 Degrees F
166

• cooling: 78-80 Degrees F In the cooling mode especially, this minimizes the number of hours where the dew point is reached within the building envelope, thus reducing conducive environments for mold and moisture damage and greatly reducing energy consumption.
3.5.2 Pressurization
When mechanical conditioning is used, maintaining a positive interior air pressure insures that humid air is not drawn into the building through leaks in the building envelope. Warm moist air, coupled with low temperatures, results in condensation and subsequent mold and deterioration of historic fabric.
3.5.3 Exterior Systems
Exterior components should be carefully chosen and located, not only to be reversible, but to be concealed from the public view. New developments in solar panels, for example, allow panels to sit flush within the profile of historic roofs. Such technologies, which are less obtrusive than traditional HVAC systems, should be encouraged.
3.6 ENVELOPE Improve, but don’t alter, the historic building envelope.
Historic buildings generally have tried-and-true profiles, sections, and material palettes attuned to the local climate. It is unwise to tamper with these systems to avoid unforeseen consequences.
According to this strategy, some specific practices:
3.6.1 Insulation
In most cases, Historic Structures that were not designed for wall insulation should not have insulation added. Properly designed walls require internal ventilation; it is difficult to add insulation to a completed wall while retaining space for internal air movement; moreover, its installation typically requires the removal of historic fabric.
At the same time, insulation changes the dew point within a wall. In humid coastal environments where air conditioning has been added to Historic Structures, altering the dew point can create condensation problems within the wall. Furthermore, historic plaster & lath are capable of accommodating and facilitating changes in humidity and are naturally resistant to mildew; contemporary drywall systems are not.
It is often best to install insulation in the floors and attic, rather than in the walls. This can be quite effective because significant thermal transfer occurs through the floors and attic.
167

3.6.2 Air infiltration
Air infiltration of the building envelope has been found to have a much greater impact on energy usage than insulation. Consequently, air barriers are now widely recognized as a primary sustainable strategy in new construction and air infiltration should be the primary strategy for upgrading historic structures.
SIDING: It is not advisable to remove historic siding in order to install building-wrap air barriers; rather, it is better to caulk, paint, or otherwise try to stop specific leakage. If, however, siding is removed in order to repair structure behind it or if a significant amount of siding is being replaced, building-wrap should be installed.
3.6.3 Windows
WEATHERSTRIPPING: The best way to minimize air infiltration in Historic Structures is to weatherstrip or otherwise improve the infiltration performance of historic doors and windows. Interior storm-doors and windows are not encouraged for, although they do not change the characteristics of the historic exterior, they alter the humidity and temperature properties of the exterior wall.
GLAZING: Most Historic Structures have single-pane glazing. New technologies, such as solar films and Low-E glass, can reduce energy use by reducing heat flow through glass. Historic Structures should make use of such technologies where the original glass is no longer extant and if the aesthetic properties of the new glazing is compatible with historic color and transparency.
ENVELOPE PERFORMANCE: Relative to new construction, historic structures tend to have a lower ratio of glazing to solid-wall than do modern structures. When historic doors and windows have been sealed against air infiltration, they perform perfectly adequately from a sustainability perspective. This means that, contrary to popular belief, historic structures are not inherently weak in terms of sustainability; in fact, the opposite is true.
3.7 EXTERIOR LIGHTING Reduce the nighttime level of artificial light.
Prior to the twentieth century, Charleston and its buildings would have had a much lower level of light at night than exists today. Both for sustainability as well as historical reasons, the City should reduce the nighttime level of exterior light.
Street light and building light levels should be lowered; light sources (bulbs) should be shielded to direct light where needed; night light should not be projected into the sky (with rare exceptions for places of civic importance).
3.8 SHUTTERS Develop shuttering systems that comply with historic profiles and contemporary standards.
New building-code and insurance requirements require shuttering standards that
168
exceed the capability of historic shutters. At the same time, shutters are one component of historic structures that require regular refinishing, rebuilding, or replacement. Consequently, shuttering is an area where significant strides need to be made in order to protect historic structures and make them more cost-effective.
Rather than rely on temporary emergency storm protection, such as pre-fabricated storm panels, the City should work with the private sector to develop innovation in shuttering systems that match historic profiles while meeting contemporary performance standards and offering improved material and finish longevity. It should also develop more sympathetic and cost-effective strategies that work with historic shutters, when original equipment is extant.
4.0 ACTION PLAN
In summary, the following actions are called for elsewhere in this report.
4.1 CITY OF CHARLESTON AND OTHERS As recommended at various places in this report, the City of Charleston in cooperation with non-profits, private sector, state and federal governments should provide education, incentives and regulations that will foster a sustainable preservation culture. These include:
4.1.1 INFORMATION
INCENTIVES: Provide a central information source (a physical office, published information, and/or a website) for local information on sustainable preservation (2.2, 3.2, 5.2).
4.1.2 STANDARDS
REGULATION: Set and popularize modified standards for interior conditioning and building performance (3.1.1, 3.4, 3.5.1).
4.1.3 EXTERIOR LIGHT
REGULATION: Work with SCE&G and building owners to reduce the nighttime level of exterior light. (3.7).
4.1.4 INNOVATION AND RESEARCH
REGULATION + INCENTIVES: Support the harmonious use of sustainable technologies (3.3, 3.5.3, 3.6.3) and nurture the development of improved building components in historic structures (3.8).
RESEARCH: Become a demonstration site for research programs such as the National Trust’s Preservation Green Lab program.
169
5.0 RESOURCES
5.1 GENERAL INFORMATION
5.1.1 PRESERVATION MAGAZINE
The January/February 2008 edition of Preservation magazine addresses the merging cultures of preservation and sustainability: http://www.preservationnation.org/magazine/2008/january-february/ 5.1.2 DARK SKY MOVEMENT
Organizations which support the sensible and sustainable control of outdoor lighting: http://www.darksky.org/mc/page.do http://www.darkskysociety.org/ 5.2 CITY OF CHARLESTON The City should update its current information for historic preservation guidelines to include information encouraging sustainability practices, tailored specifically to different interests and levels of expertise: property owners, contractors, architects, developers, home inspectors, and real estate brokers. By tailoring the technical content and subject matter to specific user groups, this information is more likely to be useful. (Although something like The National Trust’s “10 Tips to Green Your Historic House” would be helpful, a concise guide that walked users through all the required approvals, issues (including design, safety, sustainability), and local preservation resources would be better.
5.3 CASE STUDIES The following Case Studies are relevant to the Charleston climate or context:
5.3.1 LINCOLN COTTAGE
Robert H. Smith Visitor Education Center (to the Lincoln Cottage), Washington, DC: a 1905 Beaux Arts style building, the first National Trust Historic site structure to qualify for LEED (Leadership in Environmental and Energy Design) certification. Links:http://www.lincolncottage.org/visit/vecinfo.htm http://www.preservationnation.org/magazine/2008/january-february/lincoln-cottage.html 5.4 TECHNICAL INFORMATION The following sources have design and technical information relevant to the Charleston climate or context:
5.4.1 NATIONAL TRUST
The National Trust for Historic Preservation has tips for historic preservation and sustainability: http://www.preservationnation.org/issues/sustainability/ http://www.preservationnation.org/magazine/2008/january-february/green-home-tips.html
170

Earth Day Resolution: The First Measures
WHEREAS, the City of Charleston recognizes the scientific evidence that global warming is strengthening; and,
WHEREAS, human activity, such as the burning of fossil fuels, has increased the levels of car-bon dioxide (CO2) in our atmosphere from 280 parts per million (pre-industrialization) to the current level of 380 PPM; and,
WHEREAS, the scientific data shows the rise in C02 is directly related to higher global average temperatures, melting ice caps, glaciers and permafrost and rising sea levels, as well as the in-crease of extreme weather events such as hurricanes; and,
WHEREAS, the City of Charleston has created a bilateral effort in the form of the Staff Green Team and the Charleston Green Committee. The Staff Green Team is comprised of interested City employees from all City departments, and the Green Committee consists of 22 business and academic, nonprofit and government leaders from the local community; and,
WHEREAS, City Council, in April of 2007, charged the Green Committee with providing lead-ership and practical solutions to ensure a prosperous community that will sustain healthy lives for our citizens and a healthy earth; -working to inspire individuals and organizations, both within and outside City government, to take actions that help make Charleston a model of healthy and ecologically sustainable living; and working with City government, business groups, nonprofit organizations and other partners to protect and enhance Charleston’s distinc-tive environmental quality and livability; and,
WHEREAS, the Green Committee is working to create a Climate Protection and Sustainability Plan for Charleston over the next year; and,
WHEREAS, the Green Committee and Staff Green Team recommends that the City of Charles-ton continue to empower staff and citizens to lessen Charleston’s contributions to global warm-ing;
NOW, THEREFORE, BE IT RESOLVED THAT I, Joseph P. Riley, Jr., Mayor, City of
Charleston and Charleston City Council do hereby support the following policies and actions:
1. Require that all City staff recycle paper, plastic (plastics #1 and #2), aluminum and tin via Charleston County Curb Side Pick-up or the City Parks Department;
RESOLUTION
171
2. Require that all City staff recycle printer cartridges; 3. Require that all City staff use recycled copier paper for routine use; 4. Request that the Department of Public Service study the ability to pick up recyclable materials such as aluminum, tin, plastics, cardboard, and newspaper from the downtown business merchants as a pilot program that may be used to design an effective City-wide program including mandatory recycling where the program is offered; 5. Create a partnership with local stores to develop a plan to responsibly decrease the amount of plastic bag waste; 6. Identify and clearly advertise the CARTA route on which all City events are located; 7. Promote the City’s policy of providing CARTA passes to employees who choose a CARTA pass in lieu of a parking garage pass to new and current employees; 8. In partnership with individual businesses and institutions and groups such as the Charleston Metro Chamber of Commerce initiate a “lights out in buildings at night” campaign; 9. Ensure that all City owned construction, beginning with those buildings whose planning begins in 2009, meets LEED certification; 10. Work with City Council to develop and pass a resolution supporting the Federal Energy Block Grant Program; 11. Enforce the City’s current idling ordinance, which prohibits idling for more than 5 minutes; and 12. Create an eco hospitality program that welcomes visitors to help Charleston be a sustainable city by helping with some small acts such as indicating when new towels are needed or turning lights out when leaving a hotel room.
172
2007 Letter - Mayor Riley to City Council
M E M O R A N D U M To: City of Charleston Council Members From: Mayor Joseph P. Riley, Jr. Re: Charleston Green Committee Date: April 24, 2007
As you know, the issue of global climate change is a pressing issue in our society. In June of 2005, I signed the U. S. Mayors Climate Protection Agreement to help address climate change. In signing this agreement, we set goals for the City of Charleston to reduce our CO2 emissions by seven percent below the 1990 levels by the year 2012. Fortunately, the City of Charleston has begun making progress on lowering its carbon dioxide emissions. In 2006 alone, we lowered our carbon dioxide levels by 19,000 tons by installing more energy efficient lighting, enhancing the efficiency of our heating and air conditioning systems and installing low flow water devices. These reductions are equivalent of the removal of 2,800 vehicles from the streets of Charleston. These same retrofits also benefited the city and its taxpayers with over $550,000 in annual energy savings.
However, because we now understand the threat of climate more clearly than ever,
we know that we must be continuously looking for more ways to: • conserve energy, especially by using renewable energy, • reduce our greenhouse gas emissions especially by utilizing alternative fuels and
technologies, • develop green buildings and green communities and encourage choices that lead to more sustainable living.
This is a wonderful opportunity to engage the community in the City’s planning for a
“greener” Charleston and I request your support in the formation of the Charleston Green Committee, which recognizes our historic past but looks forward to a future where our community’s long term health is assured. The composition of the proposed committee is diverse, reflecting both a knowledge base of the challenges and of the solutions, and will include: biologists, environmental and civil engineers, designers who are LEED certified, environmental advocates, developers of a variety of housing and commercial types, tourism leaders who focus on our region’s natural wonders, environmental advocates, alternative energy specialists, and interested, motivated citizens.
Attached is the mission of the Charleston Green Committee’s and the proposed
173

initial committee members. I look forward to your ideas on how to initiate the Charleston Green committee.
City of Charleston’s “Charleston Green” Initiative
The Charleston Green Committee will provide leadership and practical solutions to ensure a prosperous community that will sustain healthy lives for our citizens and a healthy earth. The committee will work with City government, business groups, nonprofit organizations and other partners to protect and enhance Charleston’s distinctive environmental quality and livability. The Charleston Green Committee will work to inspire individuals and organizations –both within and outside City government – to take actions that help make Charleston a model of healthy and ecologically sustainable living. The specific work of the Charleston Green Committee will include but is not limited to:
• creating a Local Action Plan on Climate Change that helps the City to implement policies to achieve the goals set forth in the U. S. Mayors Climate Protection Agreement as signed by Mayor Joseph P. Riley, Jr. in June 2005. This will include reducing global warming pollutants through programs that provide economic and quality of life benefits such as reduced energy bills, green space preservation, air quality improvements, reduced traffic congestion, improved transportation choices and economic development and job creation through energy conservation and new energy technologies.
• advising the City in the continued implementation of the City’s Local Action Plan on Climate Change, including but not limited to:
• suggesting further measures and goals to encourage the City’s energy independence and greenhouse gas reduction
• preparing recommendations regarding the adoption green building standards and certification programs
• monitoring progress on benchmarks in the City’s Local Action Plan • identifying grant opportunities and other possible funding streams to start
and sustain programs • collaborating with established City initiatives, such as the Bike/Pedestrian
Committee and established advocacy organizations to promote an integrated community-wide approach to sustainability
• sponsoring and promote sustainability education and outreach programs and events, and develop linkages to schools, institutions and universities
• promoting regional cooperation in sustainability, energy conservation and environmental stewardship.
The Charleston Green Committee will be charged with developing civic policy recommendations related to four general categories of sustainability, as follows:
1.Energy Conservation and Efficiency / Renewable Energy 2.Greenhouse Gas Reductions / Alternative Fuels and Technologies 3.Green Building and Development Programs 4.Sustainability Leadership and Education Programs
174

2010 Letter - Council Members White and Alexander to Green Committee
1/8/2010 Brian P. Sheehan, Sustainability Director City of Charleston James Meadors, Chairman The Charleston Green Committee Dear Sirs, We thank you both for the time, effort and diligence you have dedicated to the Charleston green initiative. Per your request and after thoughtful consideration, analysis and citizen in-put, the below items are being put forward for your thoughtful consideration. • Edit all context of the plan so that the document is focused on “volunteerism”, not
“mandates” • Throughout the plan remove the word “require” and replace it with “recommend but not
mandate” • As climate conditions, sea level rise and GHG affects are based on incomplete and/or
suspect data any reference to those items should be preceded by a conditional word such as “potential” or “possible”.
• The City’s legal staff should completely review the Green Plan and remove any aspects which would be deemed illegal or outside the purview of Council.
• Remove any references to lobbying activities by City staff. • Remove all references to fines, fees and taxes. • Remove reference to any lifestyle activities which may be deemed illegal or fineable in
the future. It should be noted that the above comments are meant to be global in nature and should not be misconstrued as being all encompassing. These recommendations are being put forward to
175
represent a starting point in which we can begin the process of collectively working together to come up with a plan that is amenable to all interested parties and reflects the desires of Charleston’s overall constituency. We recognize that in its current state the Green Plan is not flushed out enough to provide an appropriate financial cost benefit analysis. And with that it is our expectation that any ordi-nances that are originated subsequent to the potential passage of a Green Plan should be ac-companied with a financial cost benefit analysis. Lastly, it is our recommendation that the Resolution document read that the plan is being accepted by Council as information for con-sideration. Any language associated with adopt, believe and/or similar words must be re-moved from the resolution. As we feel strongly that these issues must not resolved in order to gain support, we are rec-ommending that a small group (8-10 maximum) be formed to craft the final version of the plan. Again, we thank you both for all your time and commitment to this project and look forward to working with both of you in the future.
176

Cover Aerial Photo: NOAA Morris Island Photo: Yve Assad Design: Anastasia Emelianoff
Green Plan Online
In an effort to preserve trees and reduce greenhouse gas emissions, this document is available online at www.CharlestonGreenCommittee.com and www.CharlestonCity.info. When printing, please print on recycled paper. We also
hope that you will help us continue to be sustainable by sharing printed plans with friends and recycling it when needed.
Green Plan Creative Direction, Editing & Design
Anastasia Emelianoff | Freelance [email protected] | Charleston, South Carolina

“Don’t blow it — good planets are hard to find.” Time Magazine