
An Energy Action Plan for - City of Fridley
77
An Energy Action Plan for Fridley Approved by City Council on November 26, 2018
-
Upload
khangminh22 -
Category
Documents
-
view
0 -
download
0
Transcript of An Energy Action Plan for - City of Fridley

An Energy Action Plan for
Fridley
Approved by City Council on November 26, 2018


Acknowledgements Thanks to the following organizations and individuals for participating in developing this
Energy Action Plan.
Fridley’s Energy Action Planning Team The planning team was formed from a varied group of City staff and commissioners, local businesses, and committed community members. City of Fridley
Scott Lund, Mayor
Wally Wysopal, City Manager
Rachel Workin, Environmental Planner
Jeannie Benson, Facilities Operations
Annie Leibel , Intern, Housing and Redevelopment Authority
Environmental Quality and Energy Commission
Mark Hanson, Chair
Nick Olberding, Vice Chair
Fridley Residents
Amy Dritz
Natividad Seefeld, Manager, Park Plaza Cooperative
Business Representatives
Lance Voigt, Owner, Voigt Bus Service
Mike Wardwell, Associate, Hyde Development
Institution Representatives
Tim Pastoors, Director of Facilities and Technology, Totino-Grace High School
Russ Couwenhoven, Facilities Manager, Redeemer Lutheran
Energy Utility Representatives
Elena Foshay, Partners in Energy Facilitator
Marisa Bayer, Partners in Energy Facilitator
Brady Steigauf, Partners in Energy Facilitator
Tami Gunderzik, Partners in Energy Program Manager, Xcel Energy
Yvonne Pfeifer, Community Energy Efficiency Manager, Xcel Energy
Colette Jurek, Community Relations Manager, Xcel Energy
Jennifer Abbott, Account Manager, Xcel Energy
Emma Schoppe, CenterPoint Energy
Nick Mark, CenterPoint Energy

Table of Contents
Executive Summary ...................................................................................................... i
Our Vision ................................................................................................................. i
Our Energy Mission ................................................................................................... i
How Will We Get There? ........................................................................................... i
Focus Area Goals .....................................................................................................ii
Introduction .................................................................................................................. 1
Fridley’s Commitment to Sustainability ........................................................................ 1
The Case for a Community Energy Action Plan ....................................................... 4
Xcel Energy’s Partners in Energy ............................................................................. 4
Plan Development Process ...................................................................................... 5
Where Are We Now? – Baseline Energy Analysis ....................................................... 7
Energy Data Overview ............................................................................................. 7
Baseline Energy Analysis ......................................................................................... 7
Premises .................................................................................................................. 7
Energy Consumption ................................................................................................ 8
Current Energy Conservation ................................................................................... 9
Renewable Energy ................................................................................................. 12
Where Do We Want To Go? – Community Energy Vision, Focus Areas, and Goals 13
Our Energy Vision & Mission ................................................................................. 13
Focus Areas ........................................................................................................... 13
Goals ...................................................................................................................... 15
How Are We Going To Get There? – Actionable Strategies ...................................... 16
Focus Area 1: Residential Energy .......................................................................... 17
Focus Area 2: Businesses and Multifamily Buildings ............................................. 25
Focus Area 3: Institutions ....................................................................................... 33
Focus Area 4: Transportation and Electric Vehicles ............................................... 40
Impact of Energy Action Plan .................................................................................... 44
Plan Implementation .................................................................................................. 46
Roles and Responsibilities ..................................................................................... 47
Implementation Launch .......................................................................................... 48
How We Will Stay On Course ................................................................................ 48

Appendix 1: Implementation Memorandum of Understanding ................................... 50
Appendix 2: Who Are We? – Community Background .............................................. 51
Appendix 3: Methodology for Measuring Success ..................................................... 54
Appendix 4: Glossary of Terms ................................................................................. 56
Appendix 5: Work Plan and Timeline ......................................................................... 57

FRIDLEY ENERGY ACTION PLAN
i
Executive Summary Fridley has set a goal to reduce community energy use 5 percent by the year 2020, and
20 percent by 2030. This goal will set Fridley on a path toward long-term resilience
against the impacts of climate change, while generating immediate benefits such as
energy cost savings; ensuring Fridley achieves its energy vision and mission.
The purpose of this plan is to identify specific goals and strategies for increasing energy
efficiency and renewable energy use among residents, businesses, and institutions in
the community. Community support will be critical to the success of this plan, and the
strategies outlined emphasize broad engagement in energy action.
Our Vision
Fridley will continue leading by example and engaging residents, businesses, and
institutions to save money and reduce greenhouse gas emissions for the benefit of
everyone in the community.
Our Energy Mission
Fridley will continue improving upon its values of being a safe, vibrant, friendly, and
stable home for families and businesses by:
1. Increasing sustainable, reliable energy in the grid;
2. Strengthening energy efficient practices and participation; and
3. Supporting innovative strategies and technologies to achieve Fridley's energy
vision.
How Will We Get There? To achieve our goal, Fridley will prioritize four short-term focus areas:
Focus Area 1: Residential Energy, inclusive of homeowners, renters, and
under-resourced residents.
Focus Area 2: Businesses and Multifamily Buildings, inclusive of all
businesses in the community, as well as multifamily buildings with more than five
units.
Focus Area 3: Institutions, including municipal premises, worship facilities,
schools, and hospitals and medical facilities.
Focus Area 4: Transportation and Electric Vehicles, noting that this area is
important for long-term greenhouse gas emission reductions.
Renewable energy was also noted as an important component and will be included in
all focus areas as a goal or strategy.

FRIDLEY ENERGY ACTION PLAN
ii
Focus Area Goals1
1 The business as usual scenario represents a presumed slight increase in energy demand based on
residential and commercial energy demand of about 0.5 percent per year. It is assumed institutions demand will increase in 2019 when the new civic campus opens, but stay relatively flat in future years.
•By 2020, Fridley residents will take 1,200 additional actions toward energy conservation and renewable energy.
•By 2030, residents will reduce total energy use 10 percent, as compared to business as usual.
Residential Energy
•By 2020, business and multifamily buildings will achieve 5 percent energy savings.
•By 2030, business and multifamily buildings will reduce total energy use 20 percent, as compared to business as usual.
Businesses and Multifamily Buildings
•By 2020, institutions will achieve 5 percent energy savings.
•By 2030, institutions will reduce total energy use 15 percent, as compared to business as usual.
Institutions
•By 2020, conduct an outreach campaign to raise awareness about electric vehicles, with the goal of reaching 500 residents and individuals who work in Fridley.
•By 2020, reach 10 businesses and multifamily buildings through a targeted outreach campaign to encourage installation of charging infrastructure.
•By 2020, install one electric vehicle charging station at a City-owned building or location.
Transportation and Electric Vehicles

1
Introduction Fridley prides itself on being a safe, vibrant,
friendly, and stable home for families and
businesses. Sustainability is a core value, as
demonstrated by the history and variety of
actions taken by the community. Through the
guidance of the Environmental Quality and
Energy Commission, the City of Fridley has a
solid framework to position itself as a local
leader. This plan represents an exciting first
step in energy action planning, and will
launch the community toward a more
sustainable and resilient future.
Fridley is a community in transition: its population is changing, growing more diverse
and younger; and redevelopment of industrial and commercial areas will add new,
denser multifamily housing and mixed-use buildings.2 Redevelopment opportunities give
Fridley the chance to ensure development is sustainable long term. Initial progress has
been made through City policy and community initiatives that promote on-site solar
generation, and in the 2040 Comprehensive Plan.
In the 2040 Comprehensive Plan, the City of Fridley identifies food security, native
landscaping, and solar resources important to planning for the impacts of climate
change and reducing the City’s contribution to greenhouse gas emissions. The Energy
Action Plan identifies strategies that will reduce Fridley’s energy-related greenhouse
gas emissions through energy efficiency, renewable energy subscriptions, and
encouraging on-site renewable energy generation. These strategies will increase
energy resiliency for residents, businesses, and institutions — ensuring everyone in the
community benefits.
Fridley’s Commitment to Energy Efficiency Fridley has demonstrated a strong commitment to sustainability and energy efficiency
over the past few years. To date, the City has achieved Step 2 in GreenStep Cities, a
statewide voluntary challenge, assistance, and recognition program to help cities
achieve their sustainability and quality-of-life goals. Fridley is on track to become a Step
3 city by 2020.
The City has invested in efficiency in many of its own facilities. Some of the upgrades
completed include replacing old equipment with energy efficient units, upgrading to LED
lighting in public buildings, installing variable frequency drives throughout the City’s
water treatment system, and replacing city street lights with LED bulbs. The City of
2 See Appendix 2 for community demographic data.
Photo Credit: City of Fridley
FRIDLEY ENERGY ACTION PLAN
2
Fridley updated their zoning ordinance to make it easier to permit photovoltaic solar
installations. The City is also completing a fleet analysis with Xcel Energy and
FleetCarma,3 and is participating in the Cities Charging Ahead!4 initiative to understand
ways to integrate electric vehicles (EVs) into the City fleet and become EV ready at the
new civic campus.
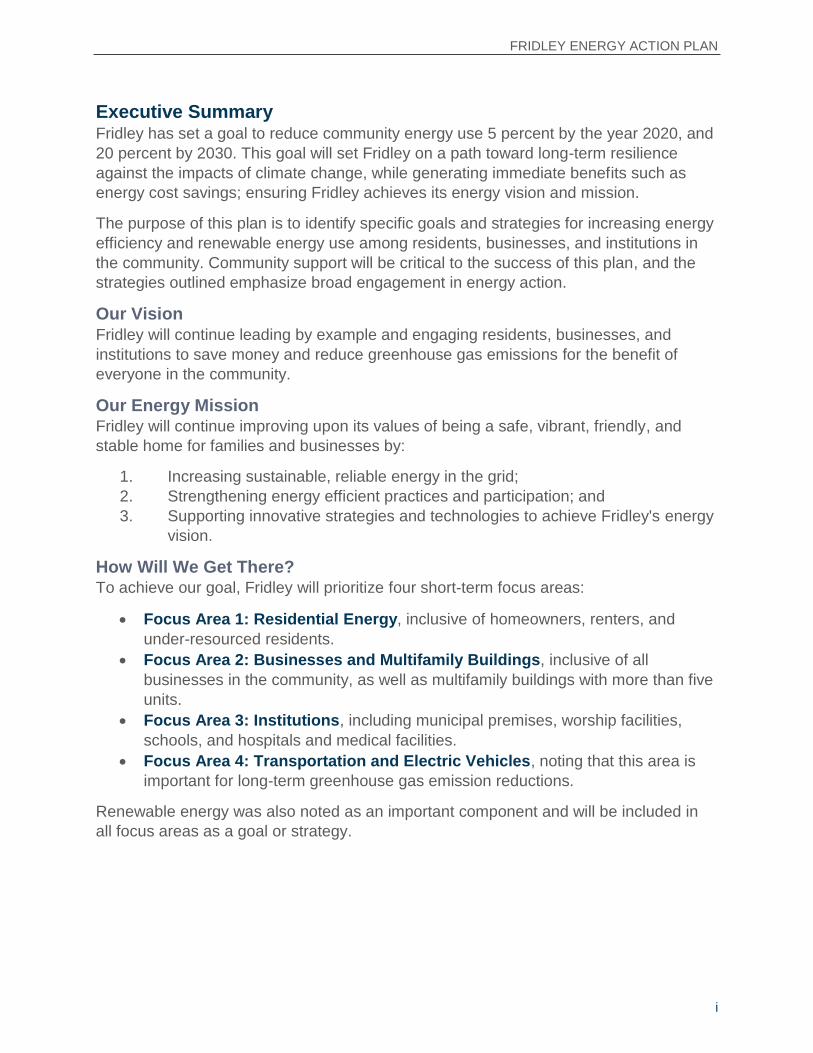
The most exciting effort to reduce energy use in City facilities is tied to construction of
the new civic campus. This campus will consolidate City Hall, Public Safety, and Fire
Station 1 into the same facility, and relocate Public Works and vehicle storage. The City
participated in Xcel Energy’s Energy Design Assistance program to include energy
savings in the planning and design phase of the new civic campus project. Fridley’s new
Public Safety and City Hall building are anticipated to save 32 percent compared to
baseline, and the new Public Works facility is anticipated to save 43 percent compared
to baseline.5 The City is committed to exploring additional opportunities in these
buildings and other City-owned facilities to increase efficiency and reduce costs.
Figure 1: City of Fridley New Civic Campus Site Plan6
3 Fleet analysis assesses electric vehicle suitability in City-owned fleet and charging infrastructure needed
based on the deployment of electric vehicles. 4 Cities Charging Ahead! is sponsored by CERTs and Great Plains Institute. Participating cities receive
technical assistance focused on actions and best practices local governments can implement to accelerate adoption of electric vehicles. 5 Energy Design Assistance CD Review Report, 2017.
6 City of Fridley, Town Hall Meeting, 2016.

3
The City of Fridley also prioritizes energy efficiency for its residents by offering
discounted Home Energy Squad® Enhanced7 visits through the Housing and
Redevelopment Authority. In 2014, the first year of the partnership, participation rates
were the highest, but participation has decreased over the last two years. An important
target of this plan is to increase participation in Home Energy Squad. Fridley also offers
low-interest home improvement loans, administered by the Center for Energy and
Environment. However, while energy efficiency upgrades are allowable in the loan
scope, past applicants have not generally incorporated efficiency into their project. This
plan will also address increasing the use of loans for efficiency projects.
The 2040 Comprehensive Plan update has been an important opportunity for the City to
establish long-term energy and sustainability initiatives. In the 2040 Comprehensive
Plan, the City’s goals are to establish policies and implement programs that support
Fridley’s commitment to environmental sustainability in the community and region, and
to increase resiliency. Specific components of the 2040 Comprehensive Plan include
supporting the Next Generation Energy Act goal;8 encouraging the use of solar devices,
especially in under-utilized spaces; and ensuring equitable access to alternative energy
and energy efficiency programming. Action steps detailed in this plan, such as
participating in programs to promote and incentivize energy efficiency and renewable
energy, and integrating green building best practices into the permit process, will help
the City of Fridley meet its Comprehensive Plan goals.
7 Home Energy Squad
® is a joint program offered by Xcel Energy and CenterPoint Energy to help
customers reduce energy use. Energy experts deliver customized energy solutions, including installation of energy-saving measures. Enhanced visits include blower door test, thermal image testing, combustion safety check, and carbon monoxide check. 8 Next Generation Energy Act passed in 2007 established statewide goals for reducing greenhouse gas
(GHG) emissions 30 percent by 2025 and 80 percent by 2050 below 2005 levels.

FRIDLEY ENERGY ACTION PLAN
4
Table 1: Fridley’s Sustainability Initiatives
Fridley’s Sustainability Initiatives
Recognition Programs
GreenStep Cities
Tree City USA Community through the Arbor Day Foundation
Pollinator-friendly city with Pollinate Minnesota
Policies & Plans
Zoning districts allow roof-mount solar as permitted use and ground-mount solar installations as a special use
2040 Comprehensive Plan
Solid Waste Management Plan
Active Transportation Plan
Community Initiatives
Home Energy Squad buy-down through Housing & Redevelopment Authority
Curb-cut raingarden grants
City-owned Buildings & Fleet
Completed Xcel Energy and CenterPoint Energy’s Energy Design Assistance program to improve efficiency in new civic campus buildings in 2017
Upgraded to LED fixtures in City-owned buildings, parking lots, and street lights
Replacing old equipment with energy efficient models
Updating building operations to include energy efficiency practices
Completing a fleet analysis through Xcel Energy and FleetCarma
Participating in Cities Charging Ahead!
The Case for a Community Energy Action Plan
The City of Fridley has successfully integrated energy efficient policies and practices
into many of their own operations. Looking to approach energy efficiency more
holistically, the City identified Partners in Energy as an opportunity to “involve and
motivate different sectors of the community in [energy action planning]”, to ensure that
Fridley “is developing sustainably and equitably.”9 This process allows inclusive
engagement across all sectors and helps the community reduce energy use and
greenhouse gas emissions. City staff saw Partners in Energy as a great opportunity to
participate in a community-driven, data-led approach to energy action planning.
Xcel Energy’s Partners in Energy
Xcel Energy is the main electric utility serving the City of Fridley. In the summer of 2014,
Xcel Energy launched Partners in Energy to support communities like Fridley in
developing and implementing energy action plans that supplement existing
9 Fridley’s Partners in Energy Application.

5
sustainability plans, strategies, and tools. The content of this plan is derived from a
series of planning workshops held in the community with a planning team committed to
representing local energy priorities and implementing plan strategies.
The Partners in Energy planning process consisted of a series of five workshops where
the Energy Action Team learned about community energy use to develop goals and
strategies to achieve Fridley’s energy vision.
Partners in Energy will work with the City of Fridley to coordinate support for
implementing the plan and will develop a Memorandum of Understanding that outlines
specific support Xcel Energy will provide, including resources diagrammed in Figure 3,
to help Fridley deploy its strategies and achieve its goals.
Figure 2: Partners in Energy Process for Success
Figure 3: Resources from Xcel Energy for Implementation
Plan Development Process
To develop Fridley’s Energy Action Plan, the City of Fridley recruited a diverse group of
business and institution representatives, residents, City staff, Environmental Quality and
Energy Commission members, and utility representatives serving Fridley. See the
Acknowledgements section at the beginning of this document for a complete list of
participants.
The Energy Action Team met over the course of five months to review community
energy use data, set priorities and goals, and develop strategies to meet those goals. A
summary of the workshops can be found in
Table 2.
Between workshops, Energy Action Team members completed surveys to provide
additional input on goals and strategies; and a sub-group met outside of the regular
Project Management
Communication Assistance and
Resources
Tracking and Measurement
Celebration and Recognition of
Successes
FRIDLEY ENERGY ACTION PLAN
6
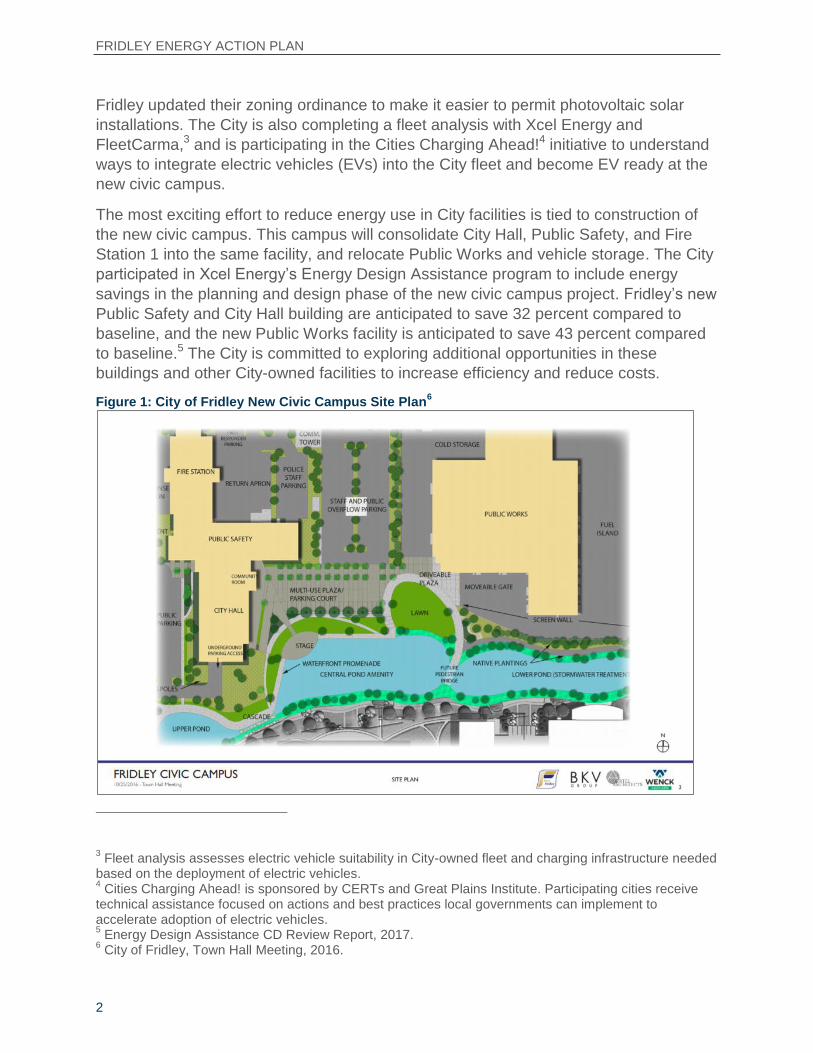
workshop schedule via conference call to establish goals and strategies for the Electric
Vehicles Focus Area.
Photo: Fridley Energy Action Team at Workshop 5
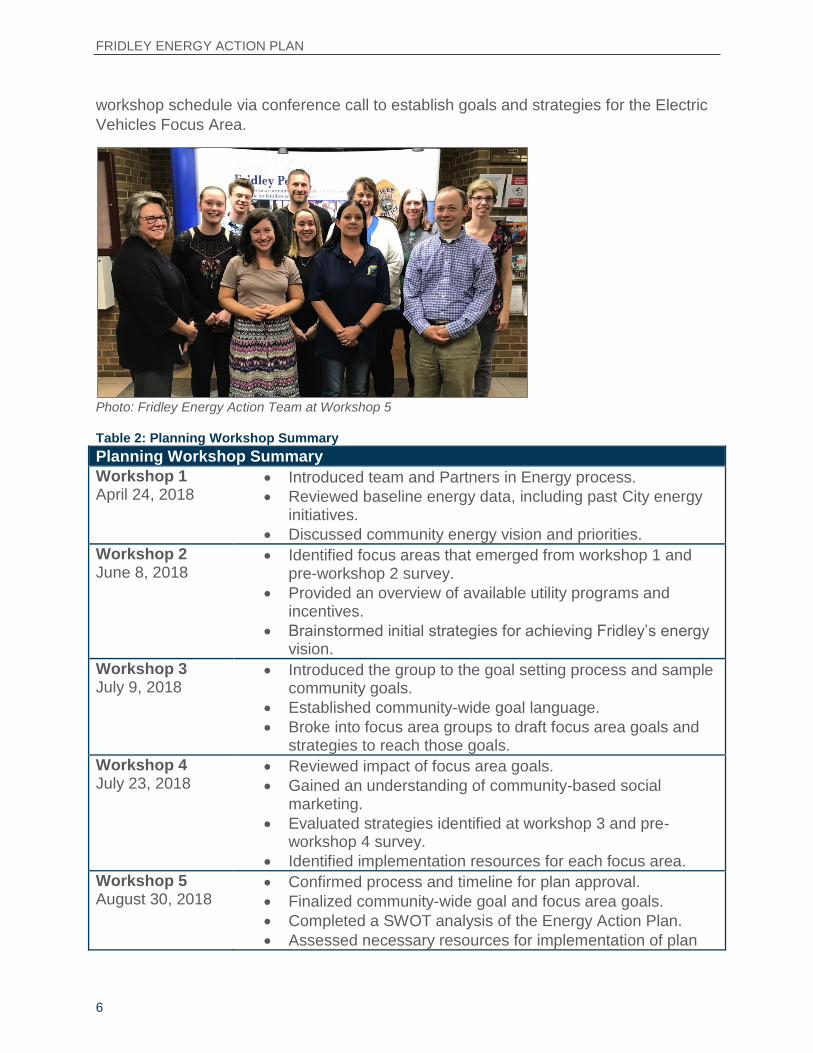
Table 2: Planning Workshop Summary
Planning Workshop Summary
Workshop 1 April 24, 2018
Introduced team and Partners in Energy process.
Reviewed baseline energy data, including past City energy initiatives.
Discussed community energy vision and priorities.
Workshop 2 June 8, 2018
Identified focus areas that emerged from workshop 1 and pre-workshop 2 survey.
Provided an overview of available utility programs and incentives.
Brainstormed initial strategies for achieving Fridley’s energy vision.
Workshop 3 July 9, 2018
Introduced the group to the goal setting process and sample community goals.
Established community-wide goal language.
Broke into focus area groups to draft focus area goals and strategies to reach those goals.
Workshop 4 July 23, 2018
Reviewed impact of focus area goals.
Gained an understanding of community-based social marketing.
Evaluated strategies identified at workshop 3 and pre-workshop 4 survey.
Identified implementation resources for each focus area.
Workshop 5 August 30, 2018
Confirmed process and timeline for plan approval.
Finalized community-wide goal and focus area goals.
Completed a SWOT analysis of the Energy Action Plan.
Assessed necessary resources for implementation of plan

7
strategies.
Where Are We Now? – Baseline Energy Analysis
Energy Data Overview
An integral part of the Partners in Energy planning process is reviewing historic energy
data for Fridley. This included data on energy use and participation in utility energy
conservation programs, as well as savings associated with participation in those
programs. Data was provided by both Xcel Energy and CenterPoint Energy for all
Fridley premises for 2015-2017. The data helped the Energy Action Team decide where
to focus efforts and allowed the group to forecast the impact of Fridley’s energy goals.
Baseline Energy Analysis
This section summarizes community-wide energy use, conservation program
participation, and historic energy savings.10 Data included in this section establish a
baseline against which progress toward goals will be compared to in the future.
Premises
A premise is a unique identifier for the location of electricity or natural gas service. In
most cases, it is a facility or building location. In Fridley, there are 13,433 electricity
premises served by Xcel Energy and 9,768 natural gas premises served by CenterPoint
Energy. The distribution of electric and natural gas premises among residential,
commercial and industrial, and municipal premises is shown in Figure 4.
10 The electricity and natural gas data in this plan complies with Xcel Energy’s 15 x15 privacy rules, which
require all data summary statistics to contain at least 15 entities, with no single entity responsible for more than 15 percent of the total. Following these rules, if an entity is responsible for more than 15 percent of the total for that data set, they are removed from the summary. No premises were removed from the summary.

FRIDLEY ENERGY ACTION PLAN
8
Figure 4: Distribution of Premises, 2017
Energy Consumption
Fridley consumed a total of 397,416,249 kilowatt-hours (kWh) of electricity and
23,280,262 therms of natural gas in 2017. Combined, all sectors spent an estimated
$52.8 million on energy in 2017.11 Although the majority of premises are residential,
most electricity and natural gas are consumed by commercial and industrial premises
(Figure 5). Commercial and industrial premises consumed 80 percent of electricity and
69 percent of natural gas in 2017, spending an average of $20,583 on electricity and
$6,583 on natural gas per premise per year.12 Residential premises consumed 19
percent of electricity and 31 percent of natural gas, spending an average of $776 on
electricity and $677 on natural gas per premise in 2017. Fridley homes spent an
average of $120 per month on energy. The remaining energy was consumed by
municipal premises, representing 1 percent of electricity and less than 1 percent of
natural gas.
11 This excludes any taxes and fees.
12 The commercial and industrial customer usage and spend can be highly variable, which can have an
impact on customer averages.
88%
11%
1%
Electric Premises Xcel Energy
Residential
Commercial and Industrial
Municipal
88%
11%
.3%
Natural Gas Premises CenterPoint Energy
Residential
Commercial and Industrial
Municipal

9
Figure 5: Energy Consumption, 2017
Current Energy Conservation
Both Xcel Energy and CenterPoint Energy offer programs and rebates to help residents
and businesses save energy. Over the past three years, Fridley residents and
businesses have taken important steps toward reducing energy use, saving an average
of 1.6 percent of electricity consumed, and 1.4 percent of natural gas consumed per
year through participation in conservation improvement programs.13
13 Conservation improvement programs include the portfolio of approved utility energy efficiency and
demand management programs. Minnesota electric utilities have a goal of saving 1.5 percent of their total energy sales each year via customer conservation efforts. Minnesota natural gas utilities have a goal of saving .5 percent of their total energy sales each year via customer conservation efforts.
19%
80%
1%
Electricity Consumption Xcel Energy
Residential
Commercial and Industrial
Municipal
31%
69%
0.3%
Natural Gas Consumption CenterPoint Energy
Residential
Commercial and Industrial
Municipal

FRIDLEY ENERGY ACTION PLAN
10
Figure 6: Electricity Savings from Xcel Energy Conservation Improvement Program Participation
Figure 7: Therm Savings from CenterPoint Energy Conservation Improvement Program Participation
-
1,000,000
2,000,000
3,000,000
4,000,000
5,000,000
6,000,000
7,000,000
8,000,000
9,000,000
10,000,000
2015 2016 2017
kW
h
Residential Commercial/Industrial
0
50,000
100,000
150,000
200,000
250,000
300,000
350,000
400,000
450,000
2015 2016 2017
Th
erm
s
Residential Commercial/Industrial

11
Figure 8 summarizes residential conservation program participation for the past three
years. Total participation in residential conservation programs has declined slightly
since 2015, with 9 in 100 premises participating in an Xcel Energy conservation
program in 2017. In 2017, Fridley residents saved 209,351 kWh and 79,647 therms,
representing 0.9 percent of total residential energy use. Residential program
participation has been highest in home efficiency rebates, primarily tied to replacement
of heating and cooling equipment.
Figure 8: Residential Conservation Improvement Program Participation14
Figure 9 shows that commercial and industrial program participation rates have been
slightly higher than residential sector participation over the past three years – 7 in 50
commercial premises participated in an Xcel Energy conservation improvement
program in 2017. Lighting and natural gas equipment rebates have been most popular
among commercial and industrial customers. In 2017, commercial and industrial
premises saved 9,094,217 kWh and 78,420 therms, representing 1.4 percent of total
sector energy use.
14 Xcel Energy and CenterPoint Energy Conservation Program Participation Counts, 2015-2017.
Programs grouped based on common themes defined by Partners in Energy.
698
259
79
45
26
-
814
140
37
23
15
1
633
114
58
32
10
5
- 100 200 300 400 500 600 700 800 900
Home Efficiency Rebates
Home Energy Squad/Energy Audit
Low-income Programs
Refrigerator Recycling
Insulation Rebates
New Construction Rebates
2017 2016 2015

FRIDLEY ENERGY ACTION PLAN
12
Figure 9: Commercial and Industrial Conservation Improvement Program Participation15
Renewable Energy
Fridley has taken initial strides to support on-site renewable energy installations and
renewable energy subscription programs. The City of Fridley removed a barrier to
ground-mount solar by updating their zoning ordinance to allow ground-mount
installations with a special use permit. Five residential and eight commercial and
industrial premises have installed on-site solar installations in Fridley between 2014 and
2018, according to City permit records. Renewable energy subscriptions have also been
popular among Fridley residents. In 2017, 490 households subscribed to Windsource®,
a voluntary subscription program that allows customers to source some or all of their
electricity from wind energy. Of these, 68 households elected to cover 100 percent of
their annual electricity use with wind energy, representing 0.6 percent of total residential
electricity use in 2017. There are two commercial Windsource subscribers; both
subscribe 100 percent of their annual electricity use. Fridley residents and businesses
also subscribe to Renewable*Connect®, a voluntary subscription program from Xcel
Energy that allows customers to subscribe up to a 100 percent of their annual electricity
15 Xcel Energy and CenterPoint Energy Conservation Program Participation Counts, 2015-2017.
Programs grouped based on common themes defined by Partners in Energy.
88
53
13
18
7
3
0
0
94
99
20
29
11
3
3
0
115
43
12
17
3
1
3
0
0 20 40 60 80 100 120 140
Lighting
CenterPoint Commercial Programs
Heating & Cooling Efficiency
Other Efficiency Programs & Rebates
Process Efficiency
Energy Audits & Assessments
New Construction
Multi-family Programs
2017 2016 2015

13
use from a blend of wind and solar energy. In 2018, 17 residents, and 4 commercial and
industrial customers subscribed to Renewable*Connect.16
Where Do We Want To Go? – Community Energy Vision, Focus Areas,
and Goals
Our Energy Vision & Mission
During the first and second planning workshops, the Energy Action Team worked
together to develop a shared vision and mission for Fridley’s energy future. The vision
and mission represent the priorities of the team and the community throughout the
energy planning process.
Focus Areas
After analyzing baseline energy use and historical program participation, four priority
focus areas were chosen:
Focus Area 1: Residential Energy, inclusive of homeowners, renters, and
under-resourced residents.
Focus Area 2: Businesses and Multifamily Buildings, inclusive of all
businesses in the community, as well as multifamily buildings with more than five
units.
Focus Area 3: Institutions, including municipal premises, worship facilities,
schools, and hospitals and medical facilities.
Focus Area 4: Transportation and Electric Vehicles, noting that this area is
important for long-term greenhouse gas emission reductions.
16 Renewable*Connect was fully subscribed at time of plan adoption and was not accepting new
subscriptions.
Vision
Fridley will continue leading by example and engaging residents, businesses, and
institutions to save money and reduce greenhouse gas emissions for the benefit of
everyone in the community.
Mission
Ensure Fridley will continue improving upon its values of being a safe, vibrant,
friendly, and stable home for families and businesses by:
1. Increasing sustainable, reliable energy in the grid;
2. Strengthening energy efficient practices and participation; and
3. Supporting innovative strategies and technologies to achieve Fridley's
energy vision.

FRIDLEY ENERGY ACTION PLAN
14
Focus areas 1-3 are sectors in the community that the Energy Action Team believes
can realize short-term measurable results through the strategies outlined in this plan.
Focus area 4 is a long-term priority – the Energy Action Team acknowledged
transportation and electric vehicles are important for long-term greenhouse gas
emission reductions, public health, and cost-savings for electric vehicle owners over the
lifetime of the vehicle. A small sub-group met outside of the regular workshop schedule
to identify strategies for this focus area.
Through the planning process, renewable energy was also noted as an important
component for reducing greenhouse gas emissions and improving energy resilience.
Rather than defining renewable energy as a separate focus area, the group determined
that renewable energy was an important component of all focus areas and should be
integrated throughout the plan for a more comprehensive approach.
Figure 10: Energy Consumption by Focus Area, 201717
17 Xcel Energy and CenterPoint Energy, estimates based on modeling and projections by Partners in
Energy. Total energy consumption based on actual 2017 electricity consumption for classified premises and a natural gas consumption estimate. The natural gas consumption estimate was completed using actual 2017 therm consumption for all commercial and industrial premises and applying a ratio to institution consumption based on actual kWh consumption for classified premises.
26%
70%
4%
Residential Business & Multifamily Institutions

15
Goals18
During workshops 3-5, the Energy Action Team worked together to develop a
community-wide goal, and in small groups to develop goals and strategies for each
focus area. The group wanted to make sure that goals were data-driven and would
include both short-term and long-term time horizons. The Energy Action Team believes
shorter time frames will provide immediate, tangible results that can garner support for
the Energy Action Plan, while also building toward more ambitious outcomes in the
future. Appendix 3 explains methodology of how goals will be measured and success
reported.
18 Goals measured against the business as usual scenario, where noted. The business as usual scenario
represents a presumed slight increase in energy demand based on residential and commercial energy demand of about 0.5 percent per year. It is assumed institutions demand will increase in 2019 when the new civic campus opens, but stay relatively flat in future years.

FRIDLEY ENERGY ACTION PLAN
16
How Are We Going To Get There? – Actionable Strategies The following sections detail actionable strategies to achieve the goals outlined in this
plan. The Energy Action Team worked in teams to create strategies they believed would
have high impact and measurable results.
In addition to strategies listed within each focus area, there are general strategies that
fall within the scope of all four focus areas to broadly address energy efficiency and
renewable energy throughout the community. These include:
Providing general informational materials through City communication channels,
including website, newsletter, social media, and events;
Leveraging existing City relationships and programs to promote targeted energy-
saving and renewable energy opportunities; and
•Reduce energy use 5 percent by 2020, and 20 percent by 2030, as compared to business as usual.
Community-wide Goal
•By 2020, Fridley residents will take 1,200 additional actions toward energy conservation and renewable energy.
•By 2030, residents will reduce total energy use 10 percent, as compared to business as usual.
Residential Energy
•By 2020, business and multifamily buildings will achieve 5 percent energy savings.
•By 2030, business and multifamily buildings will reduce total energy use 20 percent, as compared to business as usual.
Businesses and Multifamily Buildings
•By 2020, institutions will achieve 5 percent energy savings.
•By 2030, institutions will reduce total energy use 15 percent, as compared to business as usual.
Institutions
•By 2020, conduct an outreach campaign to raise awareness about electric vehicles, with the goal of reaching 500 residents and individuals who work in Fridley.
•By 2020, reach 10 businesses and multifamily buildings through a targeted outreach campaign to encourage installation of charging infrastructure.
•By 2020, install one electric vehicle charging station at a City-owned building or location.
Transportation and Electric Vehicles

17
Coordinating with the City’s building department and Development Review
Committee to integrate information about energy efficiency and renewable
energy into the development process.
Specific actions to support these strategies are further detailed in each focus area
section.
Focus Area 1: Residential Energy
Residents are an important component for the success of the Energy Action Plan. The
residential sector represents 23 percent of total community energy use. In addition to
conserving energy, this sector creates an opportunity for broad community engagement
and support for energy goals.
Homeowners are the primary target for this
focus area. A majority of Fridley residents own
their home (62.5 percent19) and most owner-
occupied homes are single-family units (65
percent20). The housing stock in Fridley is
aging – 8 9 percent of housing units are more
than 30 years old.21 These homes likely have
many opportunities to improve efficiency,
particularly as part of planned kitchen, bath,
and other remodeling projects.
Under-resourced Households
The residential sector also includes under-resourced households. Data show that
under-resourced residents are energy burdened – meaning the household spends a
high percentage of their income on home energy bills (see Figure 11). Fridley has a
high rate of people living in poverty (12.3 percent22), as compared to Anoka County (7.4
percent). The number of Fridley households earning less than 50 percent of state
median income (SMI), the threshold for utility low-income program eligibility, is
estimated to be 2,750. 23 This represents 24.9 percent of all households in Fridley. The
highest concentration of households below the 50 percent SMI threshold is in the
census tract located north of Interstate 694, west of University Avenue, and south of
Mississippi Street (see Figure 12). Understanding the geographic distribution of under-
resourced households will help the Energy Action Team target their efforts. There are a
19 U.S. Census Bureau, American Community Survey 2012-2016 5-year Estimates.
20 City of Fridley, 2018.
21 U.S. Census Bureau, American Community Survey 2012-2016 5-year Estimates.
22 U.S. Census Bureau, American Community Survey 2012-2016 5-year Estimates.
23 Estimate based on American Community Survey 2016 Household Income in the Past 12 Months (2016
Inflation-Adjusted Dollars).
Source: City of Fridley

FRIDLEY ENERGY ACTION PLAN
18
variety of programs and strategies for these households that help reduce energy bills
and offer grants and low-interest financing to make repairs.
Figure 11: Energy Burden for City of Fridley24
24 U.S. Department of Energy, Better Buildings Initiative, Clean Energy for Low Income Communities
Accelerator. Average annual expenditure based on U.S. Energy Information Administration reported electric utility revenue per residential customer, and statewide natural gas expenditures per residential customer.
0
500
1,000
1,500
2,000
2,500
3,000
0%
5%
10%
15%
20%
25%
30%
0-3
0%
30
-50%
50
-80%
80
-100%
10
0%
+
0-3
0%
30
-50%
50
-80%
80
-100%
10
0%
+
Owner-occupied Renter-occupied
Area median income
Av
era
ge a
nn
ual e
nerg
y e
xp
en
ditu
res ($
/year)
Av
era
ge p
erc
en
t o
f h
ou
seh
old
in
co
me s
pen
t o
n e
nerg
y
Fraction of income Average annual expenditure

19
Figure 12: Percent of Households Below 50 percent of SMI by Census Tract25
Renters
There is also large percentage of renters in the community – 37.5 percent of
households are renters.26 Ensuring cost of living remains affordable for renters was
important to the Energy Action Team, so strategies include those that target renters in
single family, multifamily, and other housing types.
Table 3: Household Tenure by Housing Type27
Owner-Occupied Renter-Occupied
Single family 6,293 1,046
Multifamily, 2-4 units 103 278
Multifamily, 5+ units 128 2,759
Other 363 55
Total 6,887 4,138
25 Estimate based on American Community Survey 2016 Household Income in the Past 12 Months (2016
Inflation-Adjusted Dollars). 26
U.S. Census Bureau, American Community Survey 2012-2016 5-year Estimates. 27
Ibid.

FRIDLEY ENERGY ACTION PLAN
20
Since renters do not own their housing unit, most are limited in the types of energy
improvements they can make. Some ways that renters likely can save energy include
managing indoor temperature using thermostats, replacing lightbulbs with LEDs,
unplugging electronics when not in use, and using ENERGY STAR-rated products.
Strategies identified to target renters include energy conservation and energy efficiency
to ensure renters are able to achieve energy savings. In addition, income-qualified
renters can utilize a free energy efficiency program that also replaces appliances.
Residential Energy Goal and Strategies
Fridley’s goals in the residential sector are to increase program participation in
conservation programs and renewable energy subscriptions:
By 2020, Fridley residents will take 1,200 additional actions toward energy
conservation and renewable energy.
By 2030, residents will reduce total energy use 10 percent, as compared to
business as usual.
To achieve this goal, the Energy Action Team identified specific programs to promote
during outreach – see Table 4. In addition to increasing participation in utility
conservation programs, behavior changes inspired through education and awareness
are a critical component to successfully reducing residential energy use.
Table 4: Residential Program Participation Targets
Program Baseline
(2017) Participation Target
by 2020
Home Energy Squad 55 340
Refrigerator Recycling 32 150
Income Qualified Programs 58 190
Windsource® 490 200 additional
These programs were chosen because of the opportunity to have a big impact on
residential energy savings. The City of Fridley Housing and Redevelopment Authority
(HRA) offers discounted Home Energy Squad visits to all Fridley residents. Home
Energy Squad is a key first step to identifying cost-effective opportunities to reduce
energy use. However, participation has been decreasing since 2014, when the discount
program launched.
During planning, Energy Action Team members spent time considering perceived
benefits among residents of taking energy action, and barriers that might get in the way
(Table 5). Energy Action Team members noted that lack of awareness and distrust in
the message and/or messenger were barriers to taking action; so strategies were
crafted to overcome those barriers.

21
Table 5: Residential Energy Barriers and Benefits
Barriers Benefits
Cost to take action Cost savings
Language barrier Sense of community & pride in Fridley
Lack of trust in the message and/or messenger
Helping the environment
Lack of knowledge Comfort and safety in the home
Effort needed to take action Awareness of impact
Cost to take action was also identified as a barrier to taking an energy efficiency or
renewable energy action. Refrigerator recycling was targeted because there is no cost
to participate and a rebate is given to the customer after pick up. Xcel Energy’s
Windsource® was chosen as an easy, low cost way for residents to access renewable
energy. The planning team also prioritized income-based programs from both Xcel
Energy and CenterPoint Energy since they are available at no cost for income-eligible
households. These programs include low-income Home Energy Squad, Home Energy
Savings Program, Stay Safe Stay Warm, and weatherization services.
Table 6: Residential Energy Strategies
Focus Area: Residential Energy
Strategy 1: Engage residents in taking action through a community-wide marketing campaign.
Actions:
Analyze resident survey to understand what messaging resonates with residents and who the trusted messengers are.
Create “first-step actions” checklist to guide residents on easy actions to take at home.
Create a checklist for installing solar panels on residential structures.
Create informational materials focusing on program participation and rebates as a way to conserve energy and use renewable energy.
o Include behavior change information as part of campaign materials. o Use testimonials, success stories, and case studies to encourage
participation. o Target programs: Enhanced Home Energy Squad, Refrigerator Recycling,
renewable energy programs (e.g. Windsource®, community solar garden subscriptions), and the Fridley Home Loan Program.
Create and distribute informational materials with targeted messaging for key populations.
o Target neighborhoods with older homes with home rehabilitation information.
o Target new residents using new resident packet with energy audit and rehab information.
o Door-knock at manufactured home parks with program and rebates information.

FRIDLEY ENERGY ACTION PLAN
22
Focus Area: Residential Energy
Translate materials into other languages, such as Somali and Spanish. o Identify nonprofit and service organizations to share and support
translated materials and program offerings. o Partner with leaders in language communities to help ensure messaging
will resonate with community.
Partner with local businesses where home improvement or construction materials are purchased to display informational materials.
Use existing communication channels and community events to share materials and information.
Strategy 2: Integrate energy efficiency language into existing points of City communications; and train staff to share message with residents.
Actions:
Update Home Loan Program application, website, and program marketing to emphasize energy efficient improvements.
Include energy efficient information in Building Permit display and application materials.
Create energy efficiency inserts for water utility bills.
Strategy 3: Partner with schools and community groups to reduce energy use by promoting behavior change.
Actions:
Partner with school district to reach senior citizens and senior center on actions they can take at home.
Partner with local Boy Scout and Girl Scout troops to do energy badge activity.
Create materials and messaging scouts can share with their family.
Design energy efficiency course with Community Education and offer course during one session.
Strategy 4: Conduct marketing and outreach specifically targeting under-resourced households.
Actions:
Create materials summarizing income-qualified program options from all utilities and local service providers.
Collaborate with local food shelves and other service providers to reach under-resourced populations.
o Distribute marketing campaign materials at their locations and events. o Co-brand materials with service providers.
Establish partnerships with property managers at income-eligible multifamily buildings to share informational materials.
Leverage existing contacts, networks, and events to reach under-resourced residents.
Implementation Partners
The following partners were identified as needed to help with implementation of
residential energy strategies:

23
City of Fridley staff, including City Lead, Communications Division, and Building
Inspections
Fridley Housing and Redevelopment Authority and Business Retention and
Expansion Team
Environmental Quality and Energy Commission
Home Energy Squad implementers
Xcel Energy’s Partners in Energy
Impact
Achieving goals outlined here will generate important impacts on both community
engagement and energy use. Increasing energy conservation and renewable energy
program participation by 1,200 additional actions will result in almost 3,000 homes
taking action by 2020, representing 25 percent of all households in Fridley. If the goals
of this focus area are achieved, residential energy use will decrease by 1.5 percent by
2020, saving an estimated 700,922 kWh and 94,694 therms between 2019 and 2020.
Residential energy-related greenhouse gas emissions will be reduced 955 MTCO2e by
2020, which is approximately equivalent to the carbon emitted from 204 passenger
vehicles in one year.28 These actions will also improve the quality of life for Fridley
residents by improving the health and comfort of their homes, and lowering their energy
bills. On average, Fridley residents who participate in an energy conservation program
are expected to save $52 per year.
28 U.S. Environmental Protection Agency (March 13, 2018). Greenhouse gas equivalencies calculator.
Retrieved from https://www.epa.gov/energy/greenhouse-gas-equivalencies-calculator.

FRIDLEY ENERGY ACTION PLAN
24
Figure 13: Projected Residential Energy Use and Savings
Long-term Residential Energy Strategies
Strategies outlined in this plan will help Fridley achieve its goal of residents taking 1,200
additional actions toward energy conservation and renewable energy. To achieve
Fridley’s goal of reducing total energy use 10 percent by 2030, additional strategies and
resources will need to be identified. Initial ideas from the Energy Action Team include
continuing promotion of rebates and programs using City communication channels and
trusted messengers, and identifying additional funding sources or incentives to help
residents make energy-related improvements or install on-site renewable energy. The
Energy Action Team also noted that evolving technology and new utility programs and
rebates will have an impact and should be utilized as they become available.
860,000
880,000
900,000
920,000
940,000
960,000
980,000
1,000,000
1,020,000
1,040,000
1,060,000
2015 2020 2025 2030
MM
Btu
BAU Growth Historic Participation Energy Action Plan Impact

25
Focus Area 2: Businesses and Multifamily Buildings
Businesses are typically among the
largest energy users in a community
and can therefore make a significant
impact on reducing overall energy
use.
Manufacturing is the primary
employment sector in the community;
representing 37 percent of all jobs in
Fridley (see Figure 14).
Manufacturing businesses are
primarily concentrated along the
railroad corridor on the western side
of the City, and near the intersection of University Avenue and 73rd Avenue.
Health care, retail, and wholesale trade also employ a large number of people. Job
growth is steady – Fridley is home to several large industrial and manufacturing
companies, and its proximity to Minneapolis will help the community continue to attract
and sustain business growth. Fridley businesses source most of their employees from
outside of Fridley (see Table 7).
Figure 14: Employment by Industry29
29 Minnesota Department of Employment and Economic Development, Quarterly Census of Employment
and Wages, 2nd
quarter data, 2017.
8,407
3,277
2,932
2,076
1,770
1,247
1,196
777
424
271
245
115
0 1,000 2,000 3,000 4,000 5,000 6,000 7,000 8,000 9,000
Manufacturing
Health Care and Social Assistance
All Other Industries
Retail Trade
Wholesale Trade
Administrative and Waste Services
Transportation and Warehousing
Educational Services
Real Estate and Rental and Leasing
Professional and Technical Services
Public Administration
Finance and Insurance
Number of Employees
Source: City of Fridley

FRIDLEY ENERGY ACTION PLAN
26
Table 7: Top 10 Cities of Residence for People Who Work in Fridley30
Residences Workers
Minneapolis 1,661
Blaine 1,535
Coon Rapids 1,442
Fridley 1,286
St. Paul 924
Brooklyn Park 776
Andover 687
Maple Grove 575
Plymouth 449
Ramsey 425
Other 8,952
Industrial Premises
For the purposes of this plan, industrial premises are businesses that are heavy
manufacturers and industrial processors. Industrial premises account for approximately
55 percent of total energy consumption (see Figure 15). Industrial premises typically
include larger energy users, such as manufacturing, machining, and metal and coating
facilities.
30 Census Bureau Local Employment-Household Dynamics.

27
Figure 15: Total Energy Consumption, 201731
Historically, industrial customers have been the most active energy efficiency
participants among commercial energy users, with particular emphasis on four areas:
lighting, fluid system optimization, process efficiency, and motors efficiency. Opportunity
exists for additional energy efficiency services, in particular walk-through energy
audits32 and recommissioning,33 which historically have had low participation.
Multifamily Buildings
Multifamily buildings with more than five units were grouped into this focus area
because they are typically operated like a business and it is up to building owners to
make energy efficient improvements, not tenants. Additionally, utility conservation
programs that serve buildings with more than five units are typically part of the
commercial program portfolio.
There are 149 multifamily buildings with more than five units in Fridley34. Nine buildings
are classified as low-income by Minnesota Housing’s Low-Income Rental Classification
31 Xcel Energy and CenterPoint Energy, Estimates based on modeling and projections by Partners in
Energy. Partners in Energy classified electrical commercial and industrial premises based on Xcel Energy’s rate classification and NAICS code. 32
Turn Key Services is a full-service program designed to provide our customers with on-site energy efficiency assessments and/or free implementation services they need to make energy-saving improvements. 33
Recommissioning is a study that looks to improve the efficiency of existing building operations by identifying and tuning up less-than-optimal equipment within the facility. 34
City of Fridley, 2017.
26%
15%
55%
4%
Residential Commercial Industrial Institutions

FRIDLEY ENERGY ACTION PLAN
28
(LIRC) certification. According to the American Community Survey, of the households
living in multifamily properties, 65 percent live in multifamily buildings built before
1980.35 These older buildings are likely in need of energy efficiency improvements,
which can benefit residents through increased comfort, and building owners through
cost savings.
Multifamily building energy use may show up as part of the residential or commercial
sector, or both, depending on how they are metered. Most commonly, individual units
pay electricity bills but there is a single natural gas account for the whole building. As a
result, multifamily engagement strategies must reach both building owners and tenants,
to ensure benefits are shared among all. Historically, there has been no participation in
conservation programs aimed at multifamily buildings with more than five units,
presenting an important program opportunity. Two barriers to engaging this sector are
identifying the owners and operators of these multifamily buildings and identifying the
message that resonates with them. Strategies were crafted to engage trusted
messengers to help reach the multifamily sector.
Table 8: Multifamily Buildings by Unit Count36
Housing Unit Type Unit Count Building Count
Multifamily Building, 2-4 units 244 64
Multifamily Building, 5+ units 3,263 149
Total 3,507 213
Table 9: Age of Multifamily Structure by Units in Structure37
Multifamily Building, 2-4 units
Multifamily Building, 5+ units
Built 1939 or earlier: - 13
Built 1940 to 1959: 51 286
Built 1960 to 1979: 189 1,469
Built 1980 to 1999: 38 894
Built 2000 to 2009: - 68
Built 2010 or later: - 29
Total 278 2,759
Business and Multifamily Buildings Energy Goals and Strategies
Below are Fridley’s goals for businesses and multifamily buildings:
By 2020, Business and Multifamily Buildings will achieve 5 percent energy
savings;
35 Multifamily buildings defined as buildings with five or more units.
36 City of Fridley, 2017.
37 U.S. Census Bureau, American Community Survey 2012-2016 5-year Estimates.
29
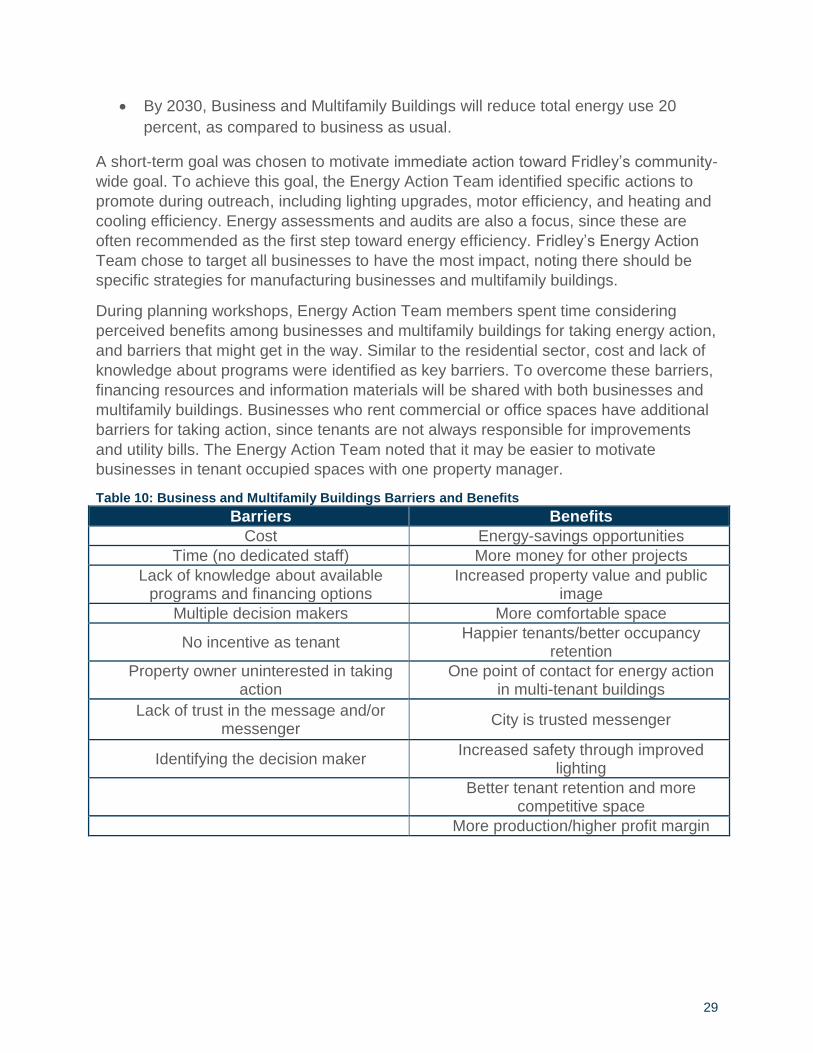
By 2030, Business and Multifamily Buildings will reduce total energy use 20
percent, as compared to business as usual.
A short-term goal was chosen to motivate immediate action toward Fridley’s community-
wide goal. To achieve this goal, the Energy Action Team identified specific actions to
promote during outreach, including lighting upgrades, motor efficiency, and heating and
cooling efficiency. Energy assessments and audits are also a focus, since these are
often recommended as the first step toward energy efficiency. Fridley’s Energy Action
Team chose to target all businesses to have the most impact, noting there should be
specific strategies for manufacturing businesses and multifamily buildings.
During planning workshops, Energy Action Team members spent time considering
perceived benefits among businesses and multifamily buildings for taking energy action,
and barriers that might get in the way. Similar to the residential sector, cost and lack of
knowledge about programs were identified as key barriers. To overcome these barriers,
financing resources and information materials will be shared with both businesses and
multifamily buildings. Businesses who rent commercial or office spaces have additional
barriers for taking action, since tenants are not always responsible for improvements
and utility bills. The Energy Action Team noted that it may be easier to motivate
businesses in tenant occupied spaces with one property manager.
Table 10: Business and Multifamily Buildings Barriers and Benefits
Barriers Benefits
Cost Energy-savings opportunities
Time (no dedicated staff) More money for other projects
Lack of knowledge about available programs and financing options
Increased property value and public image
Multiple decision makers More comfortable space
No incentive as tenant Happier tenants/better occupancy
retention
Property owner uninterested in taking action
One point of contact for energy action in multi-tenant buildings
Lack of trust in the message and/or messenger
City is trusted messenger
Identifying the decision maker Increased safety through improved
lighting
Better tenant retention and more
competitive space
More production/higher profit margin

FRIDLEY ENERGY ACTION PLAN
30
Table 11: Business and Multifamily Buildings Strategies
Focus Area: Business and Multifamily Buildings
Strategy 1: Create and distribute informational and marketing materials educating businesses and multifamily building owners about actions and programs.
Actions:
Distribute informational materials at building permit counter and City communication channels, with a particular focus on utility programs and renewable energy opportunities that are free and/or provide follow-up support.
Create checklist for on-site solar installation and include on City website.
Distribute informational materials at City business retention and expansion program visits.
Publish case studies of local businesses who have taken action on City communication channels.
Include energy efficiency messaging in the City business e-newsletter with concrete, simple ways to save energy; highlight case studies.
Promote Property Assessed Clean Energy (PACE), Trillion BTU, and other financing opportunities to inspire businesses to take action.
Develop informational materials for the Minnesota Technical Assistance Project (MNTAP) engineering intern program and conduct outreach to businesses that would be likely candidates.
Establish partnerships with business green teams to share informational materials.
Strategy 2: Leverage existing events and trusted communication channels to educate and raise awareness.
Actions:
Recognize businesses who have taken action. o Promote businesses that have taken energy efficiency action on Small
Business Saturday (November). o Ask an independent retailer who has shown interest in making energy
saving advancements to accept the Proclamation for Independent Retailer Month (July).
o Leverage City communication channels to recognize businesses who take action.
Encourage manufacturers who have made advancements in energy savings to host a community tour of their business highlighting those projects for Manufacturing Week. (October).
Utilize the City’s ongoing relationships and communication channels to inform businesses about energy-saving opportunities.

31
Focus Area: Business and Multifamily Buildings
Strategy 3: Conduct door-to-door outreach to businesses to encourage energy action.
Actions:
Target outreach to high energy users with efficiency programs and energy audits.
Enlist partners to assist with door-to-door outreach, such as CERTs.
Sign up businesses on the spot for energy audits or free assessments/walk-throughs.
Include Windsource® and other renewable energy options as part of informational materials.
Strategy 4: Host a lunch and learn event for businesses about energy actions the City has taken to share experience and encourage best practices.
Actions:
Partner with both local Chambers of Commerce and local business green teams to co-host and promote event.
Strategy 5: Conduct outreach specifically targeting multifamily buildings to engage them in energy action.
Actions:
Create information materials targeting for multifamily building owners and operators.
Identify and prioritize engagement to under-resourced areas and multifamily buildings in the City that are eligible to participate in income-qualified programs.
Utilize trusted communication channels and networks of building owners to share energy-saving actions.
o Multifamily housing associations. o “Crime Free Housing” meetings hosted by Fridley’s Police Department.
Collaborate with rental inspectors on multifamily energy efficiency information. o Add a question on the rental license application that asks whether the
property owner or manager is interested in learning more about energy efficiency.
Implementation Partners
Partners identified to help during implementation include:
City of Fridley staff, including City Lead, Communications Division, Building
Inspections, Rental Inspection, and Police Department
Fridley Housing and Redevelopment Authority and Business Retention and
Expansion Team
Environmental Quality and Energy Commission
Minnesota Technical Assistance Program (MnTAP)
Multifamily housing associations and property managers
Clean Energy Resource Teams (CERTs)
Xcel Energy’s Partners in Energy

FRIDLEY ENERGY ACTION PLAN
32
Impact
Achieving the goals outlined here will generate important benefits for business
engagement and retention, as well as lower energy use. Achieving 5 percent energy
savings by 2020 will result in an estimated 16,836,281 kWh and 717,088 therms saved,
which would be equivalent to 12,010 MTCO2e in avoided emissions. Through increased
efficiencies, businesses are anticipated to save an estimated $1.8 million between 2019
and 2020.
Figure 16: Projected Business and Multifamily Building Energy Use and Savings
Long-term Business and Multifamily Energy Strategies
Achieving the goals outlined in this section and continued engagement of businesses
and multifamily buildings will result in businesses and multifamily buildings reducing
their energy use an estimated 17 percent by 2030, as compared to business as usual;
which is 3 percent below their goal of a 20 percent reduction in energy use by 2030.
The Energy Action Team identified opportunities to achieve their goal of a 20 percent
reduction in energy use – capitalizing on advancing technology and processes for
increased efficiency in manufacturing; expanded funding resources and incentives to
inspire businesses and multifamily buildings to take action; and new multifamily and
mixed-use redevelopment being more efficient than the older industrial or commercial
properties they replaced. Resources, partners, and specific actionable strategies will
need to be identified by the Energy Action Team, the City of Fridley, and the
Environmental Quality and Energy Commission to address these opportunities.
2,000,000
2,100,000
2,200,000
2,300,000
2,400,000
2,500,000
2,600,000
2,700,000
2,800,000
2015 2020 2025 2030
MM
Btu
BAU Growth Historic Participation Energy Action Plan Impact

33
Focus Area 3: Institutions
While Institutions38 represent approximately 4 percent of total energy use, they
constitute the Energy Action Plan’s important “leadership wedge.” These organizations
demonstrate leadership through action. Institutions are viewed as responsible public
stewards and are often in a position to influence others to take action. The City in
particular is an important leader in reducing energy use and achieving the Energy
Action Plan’s mission
The institutions focus area includes schools, worship facilities, hospitals and medical
service centers, government buildings, day care centers, and nonprofit organizations.
There are a total of 211 electric premises39 in this category, including 104 that belong to
the City of Fridley.
Figure 17: Institution Energy Consumption, 201740
Municipal Energy
The City of Fridley consumed 4,674,909 kWh of electricity and 73,357 therms of natural
gas in 2017. The water treatment plants consume the most energy among municipal
facilities – three treatment plants represented 45 percent of total municipal energy
consumption in 2017 (see Figure 18). In the past, the City of Fridley received treated
38 To classify institutions, Partners in Energy reviewed NAICS codes and premise names on the
commercial and industrial electric premise list. 39
Four premises were removed for 15x15 violations and their energy use is included in the Business and Multifamily focus area. 40
Xcel Energy and CenterPoint Energy, Estimates based on modeling and projections by Partners in Energy.
27%
73%
City of Fridley Other Institutions

FRIDLEY ENERGY ACTION PLAN
34
water from the City of New Brighton at virtually no cost. In the last three years, the City
of Fridley no longer receives the treated water from New Brighton, resulting in the City
needing to increase capacity at their wells and pumps about 27 percent. To reduce
energy use of its water infrastructure, the City installed more efficient variable frequency
drives in the last five years. The City’s water treatment plants also made some
operational changes to help offset increased energy use.
The City of Fridley is currently constructing a new civic campus to consolidate four
departments: City Hall, Public Safety, Public Works, and Fire Station 1. The new civic
campus, which will open in the fall of 2018, is estimated to increase municipal electricity
consumption by 350,000 kWh and 20,000 therms. As part of the design process, the
City participated in Xcel Energy’s Energy Design Assistance program to learn how to
increase energy efficiency and identify cost-savings opportunities. Additional
opportunities may exist at these buildings, but municipal strategies in this sector will be
primarily focused at other City-owned buildings and properties.
Figure 18: Total Municipal Buildings Energy Consumption, 201741
Other efficiency opportunities include upgrading to energy efficient lighting at parks,
including field lighting, tennis court lighting, park shelters, and parking lots; upgrading
41 Xcel Energy, CenterPoint Energy.
New Municipal Center
Historical Society
Water - Storm Water
Police Department
Parks - No Shelter
Fire Department
Springbrook Nature Center
Water - Well/Pump
Parks - Shelter
Signals
Public Works
Liquor Store
Municipal Center
Water - Water Department
0 2,000 4,000 6,000 8,000 10,000 12,000
MMBtu

35
lighting at water treatment plants and facilities; and completing a commercial
refrigeration efficiency assessment at a municipal-owned liquor store.
Worship Facilities
Worship facilities can be important energy leaders and trusted resources that value
responsible environmental stewardship. In addition to addressing efficiency in their own
buildings, congregations can play an important role in engaging members in energy
action at home.
Worship facilities are unique because there are variable times of heavy use, which can
change depending on the day of the week or season. Opportunities for energy efficiency
include upgrading lighting to LEDs, installing occupancy sensors to control lighting in
rooms when they are not in use, and using programmable thermostats to control room
temperatures. Strategies to engage worship facilities include one-on-one outreach with
information about actions the facility can take related to energy efficiency and
renewable energy. Strategies also include engaging congregants to take action at their
home, which can contribute toward the greater good and benefit the worship facility.
Schools
There are six public schools and five private schools in Fridley. The public schools are
spread between three different school districts – Fridley ISD 14 has five elementary,
middle, and high schools in the community, plus two elementary schools from Spring
Lake Park ISD 16 and Columbia Heights ISD 13. The private schools include Totino-
Grace, a large high school with some on-site residents, as well as three charter and
religious schools.
Schools tend to be high-energy users, and are often housed in older buildings. Similar
to worship facilities, schools can demonstrate leadership through energy action at their
buildings. Schools can also integrate learning into efficiency projects, building in
engagement with students. Through increased energy efficiency, cost savings can be
used toward other student programming.
Since Fridley ISD 14 and other schools in Fridley have their own facility managers and
capital improvement plans, strategies in this plan focus on technical assistance to help
schools develop energy plans and sharing information about resources. As schools
develop energy plans, there is an opportunity for the City of Fridley to further engage
schools in taking additional energy action.
Institution Energy Goals and Strategies
Fridley’s goals for institutions are to increase energy savings and reduce total energy
use:
By 2020, institutions will achieve 5 percent energy savings;
By 2030, institutions will reduce total energy use 15 percent, as compared to
business as usual.
FRIDLEY ENERGY ACTION PLAN
36
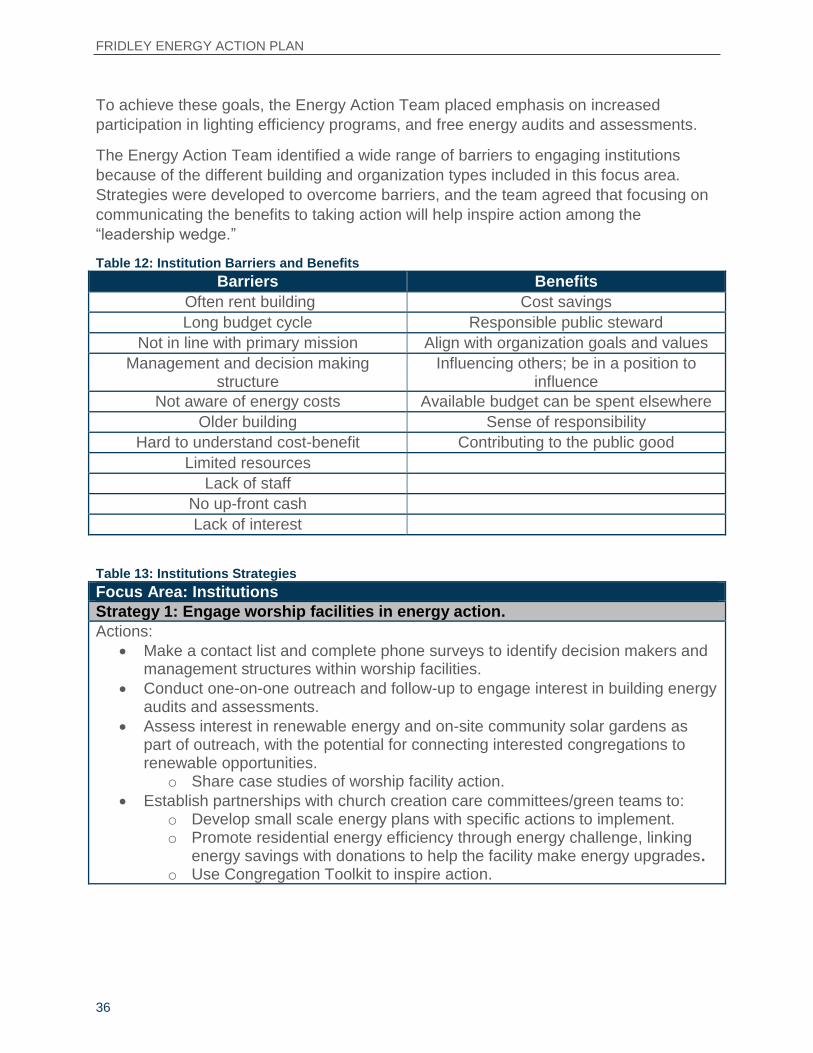
To achieve these goals, the Energy Action Team placed emphasis on increased
participation in lighting efficiency programs, and free energy audits and assessments.
The Energy Action Team identified a wide range of barriers to engaging institutions
because of the different building and organization types included in this focus area.
Strategies were developed to overcome barriers, and the team agreed that focusing on
communicating the benefits to taking action will help inspire action among the
“leadership wedge.”
Table 12: Institution Barriers and Benefits
Barriers Benefits
Often rent building Cost savings
Long budget cycle Responsible public steward
Not in line with primary mission Align with organization goals and values
Management and decision making structure
Influencing others; be in a position to influence
Not aware of energy costs Available budget can be spent elsewhere
Older building Sense of responsibility
Hard to understand cost-benefit Contributing to the public good
Limited resources
Lack of staff
No up-front cash
Lack of interest
Table 13: Institutions Strategies
Focus Area: Institutions
Strategy 1: Engage worship facilities in energy action.
Actions:
Make a contact list and complete phone surveys to identify decision makers and management structures within worship facilities.
Conduct one-on-one outreach and follow-up to engage interest in building energy audits and assessments.
Assess interest in renewable energy and on-site community solar gardens as part of outreach, with the potential for connecting interested congregations to renewable opportunities.
o Share case studies of worship facility action.
Establish partnerships with church creation care committees/green teams to: o Develop small scale energy plans with specific actions to implement. o Promote residential energy efficiency through energy challenge, linking
energy savings with donations to help the facility make energy upgrades. o Use Congregation Toolkit to inspire action.

37
Focus Area: Institutions
Strategy 2: Demonstrate City leadership in reducing energy use in City facilities.
Actions:
Educate City staff on municipal efforts to reduce energy use and efficient building operations, and share information on office behavior changes.
Evaluate and pursue opportunities to reduce energy use, including: o Liquor store participation in refrigeration efficiency program; o Variable Frequency Drives (VFDs) for irrigation and fountains; o Updating outdoor and parks lighting with LEDs.
Highlight efficient features at new Civic Center and other city facilities using City communication channels.
Publish case studies about efficient and renewable features at new Civic Center, Springbrook Nature Center, and municipal-owned liquor stores.
Track City facility energy use in benchmarking software.
Strategy 3: Identify ways to reduce energy use in water treatment plants located in Fridley.
Actions:
Identify actions already taken by water treatment facilities located in Fridley to reduce energy use.
Partner with Xcel Energy to reach out to representatives from water utilities with plants located in Fridley to discuss additional opportunities to reduce energy use.
Partner with MnTAP to support Fridley’s water utility in implementing energy management best practices.
Strategy 4: Partner with schools, hospitals, and other medical or education centers located in Fridley to reduce energy use in their facilities.
Actions:
Provide technical assistance to school and hospital facility managers interested in benchmarking or developing energy-savings plans, and share financing opportunities.
o Work with utility account managers to support implementing efficiency projects and accessing rebates.
Identify schools or medical facilities that have taken action toward energy conservation or renewable energy to feature in case studies.
Work with students to create a video about energy efficient behavior changes that can help save on energy costs.

FRIDLEY ENERGY ACTION PLAN
38
Focus Area: Institutions
Strategy 5: Integrate energy efficiency and renewable energy into City development review process.
Actions:
Collaborate with Development Review Committee to identify areas of opportunity to encourage energy efficiency or renewable energy use during review process.
Create packet to provide developers at Development Review Committee with information on how to integrate efficiency and renewable energy into new construction and building rehabilitation/additions.
Research available policy and program options for sustainable building policy, with examples of similar initiatives in other cities.
Develop policy proposals with assistance of the Environmental Quality and Energy Commission and present to the Planning Commission and City Council for consideration.
Implementation Partners
Partners identified to help during implementation include:
City of Fridley staff, including City Lead, City Facilities Manager, Communications
Division, Development Review Committee, and Police Department
Environmental Quality and Energy Commission
Nonprofit organizations, including Interfaith Power and Light, Alliance for
Sustainability, and EnerChange
Congregation and faith leaders
Creation Care teams at congregations
Student-led green teams at schools
MnTAP
Xcel Energy’s Partners in Energy
Utility Account Managers
Relationships have not been established with all partners identified. City Lead and
EQEC will be responsible for establishing initial partnerships.
Impact
Institutions are projected to achieve their goals of 5 percent energy savings by 2020 and
15 percent reduction in energy use by 2030 (Figure 19). By 2020, Institutions are
estimated to save 1,963,473 kWh and 2,104 therms, which would be equivalent to 854
MTCO2e in avoided emissions. Impact will also be seen through increased engagement
in the “leadership wedge” – where institutions acting as public energy stewards will
inspire action among others. These actions will likely be seen in the residential sector
through inspiration from worship facilities; and in businesses through leadership from
the City of Fridley, medical facilities, and other government buildings.

39
Figure 19: Projected Institutions Energy Use and Savings
100,000
105,000
110,000
115,000
120,000
125,000
130,000
135,000
140,000
2015 2020 2025 2030
MM
Btu
BAU Growth Historic Participation Energy Action Plan Impact

FRIDLEY ENERGY ACTION PLAN
40
Focus Area 4: Transportation and Electric Vehicles
Transportation and electric vehicles were identified as important focus areas with short-
term actions that will generate long-term benefit. Electric vehicles help reduce
greenhouse gas emissions, benefit public health by improving air quality, and increase
cost-savings for owners over the lifetime of the vehicle. A small working group met
outside the five planning workshops to identify strategies that will help push Fridley
forward in adoption of electric vehicles. The group noted that it is important to help raise
awareness and provide education about alternative transportation opportunities and
electric vehicles. Lack of knowledge, negative perception, and upfront costs to owning
an electric vehicle were identified as barriers to taking action; strategies focus on
educating and increasing awareness for Fridley residents, workers, and businesses.
Existing Policy and Practice
The City of Fridley is participating in Cities Charging Ahead!, a municipal cohort
organized by Great Plains Institute and Clean Energy Resource Teams. The cohort
receives technical assistance on actions and best practices that local governments can
implement to accelerate the adoption of electric vehicles. Cities Charging Ahead!
participants identify a GreenSteps Cities best practice they will work toward. The City of
Fridley chose best practice action 6.5 – Adopt climate mitigation and/or energy
independence goals and objectives in the comprehensive plan or in a separate policy
document.
City of Fridley is also completing a fleet analysis with FleetCarma through an Xcel
Energy pilot. This analysis looks at the City’s existing fleet operations in all departments
and identifies where opportunities may exist to electrify fleet vehicles.
Existing Infrastructure
There is limited public charging infrastructure in the City of Fridley. There is one public
charging station located near two major thoroughfares, University Avenue and Interstate
694. To increase access to public charging stations, strategies in this plan include
educating businesses about the different options available for adding on-site charging
stations and installing at least one station at a City-owned building or property. The City
is also installing electric vehicle charging infrastructure at their new civic campus, so
that it is electric vehicle ready.
Transportation and Electric Vehicles Goals and Strategies
Success in this focus area is measured through participation counts and points of
contact; and is dependent on establishing partnerships with electric vehicle
organizations and advocates.
By 2020, conduct an outreach campaign to raise awareness about electric
vehicles, with the goal of reaching 500 residents and individuals who work in
Fridley;
By 2020, reach 10 businesses and multifamily buildings through a targeted
outreach campaign to encourage installation of charging infrastructure;

41
By 2020, install one electric vehicle charging station at a City-owned building or
location.
Since this focus area’s goals are centered on education and awareness, the Energy
Action Team identified messaging that overcomes barriers such as lack of knowledge,
mindset/perception, and lack of awareness as important components of all strategies in
this focus area.
Table 14: Electric Vehicles Barriers and Benefits
Barriers Benefits
Variety of vehicles available Emissions reduction/environmental impact
Lack of knowledge or expertise at dealerships
Lower maintenance costs over lifetime of vehicle
Lack of charging infrastructure Tax credits/rebates
Mindset/perception Growing public infrastructure (free
charging)
Lack of awareness Better mileage
Upfront cost to purchase Health
Upfront cost to install charging station at home
Ability to charge at home
Driving range (miles per charge) Ability to source fuel renewably
Table 15: Transportation and Electric Vehicles Strategies
Focus Area: Transportation and Electric Vehicles
Strategy 1: Raise awareness about electric vehicle ownership to residents and individuals who work in Fridley.
Actions:
Table at five events to educate attendees about electric vehicle ownership. o Leverage existing community events for tabling: 49er Days, Springbrook
Environmental Fair, Farmers Market. o Identify channels to bring electric vehicles to tabling events (e.g. existing
owners, car dealerships, electric vehicle organizations).
Design informational materials to help educate and normalize electric vehicle ownership.
o Craft message using barriers and benefits list, focusing on benefits most don’t know about (e.g. no oil changes, less maintenance, etc.).
o Use City social media to distribute materials and promote tabling events. o Work with City videographer to create short PSA about ownership.
Establish partnerships with electric vehicle organizations to co-host tables
Write articles for City newsletters (Community Connection and Business e-Newsletter).
o Interview electric vehicle owners for testimonials to include in newsletter articles.
o Interview Fridley business with electric vehicle charging stations. o Feature new civic center’s charging stations.

FRIDLEY ENERGY ACTION PLAN
42
Focus Area: Transportation and Electric Vehicles o Include industry updates (“did you know”) about electric vehicles and
charging infrastructure.
Partner with Fridley Community Education to have a class on electric vehicles and plug-in hybrids.
Strategy 2: Conduct one-on-one outreach to business and multifamily buildings to encourage installation of charging infrastructure.
Actions:
Create information materials to distribute during outreach. o Materials should focus on types of charging infrastructure and benefits to
customers.
Partner with electric vehicle organizations to assist with outreach.
Identify destinations, large employers, hotels, and major attractions where charging infrastructure makes sense.
Partner with businesses applying to MPCA Volkswagen settlement grant to spread awareness and get testimonials.
Partner with Xcel Energy to deliver presentations about electric vehicle charging stations and special rate programs.
Strategy 3: Integrate electric vehicle charging infrastructure into development review process to encourage action.
Actions:
Work with City planning staff to add language to development review process encouraging charging infrastructure.
Strategy 4: Educate City staff about electrifying fleet vehicles and installing charging stations.
Actions:
Partner with local auto dealerships and other electric vehicle organizations to host one ride and drive event for City staff.
o Coordinate event near Earth Day or other “green” event date.
Partner with Xcel Energy to present to City staff about electrifying fleet vehicles. o Coordinate presentation to align with 2020 budget cycle kick-off.
Use findings from FleetCarma study and Cities Charging Ahead! to craft message.
Identify City-owned opportunity sites for a charging station.
Implementation Partners
Partnerships with electric vehicle organizations and volunteers are important to realizing
success in this focus area. During the planning process, the Energy Action Team
identified the following organizations as potential partners for implementation of this
focus area’s strategies:
PlugInConnect
Minnesota Electric Vehicles Owners group
Cities Charging Ahead!

43
American Lung Association
Drive Electric Minnesota
Midwest EVOLVE
Xcel Energy’s Partners in Energy

FRIDLEY ENERGY ACTION PLAN
44
Impact of Energy Action Plan The combined goals and strategies outlined in this plan will have a significant impact on
decreasing energy use and reducing Fridley’s carbon footprint. Overall, achieving the
short-term goals laid out in this plan will result in an estimated 5 percent reduction in
energy use below business as usual by 2020, and 14 percent by 2030 (Figure 20). This
represents an incremental increase in kWh savings of 4.6 percent and therm savings of
2.1 percent over projected historic participation savings by 2030.
Figure 20: Projected Energy Consumption and Savings42
42 Projected energy consumption and savings includes both electricity and natural gas. BAU Growth
scenario represents a presumed slight increase in energy demand based on residential and commercial energy demand of about 0.5 percent per year. It is assumed institutions demand will increase in 2019 when the new civic campus opens, but stay relatively flat in future years.
0
500,000
1,000,000
1,500,000
2,000,000
2,500,000
3,000,000
3,500,000
4,000,000
4,500,000
2015 2020 2025 2030
MM
Btu
BAU Growth Historic Participation Energy Action Plan Impact
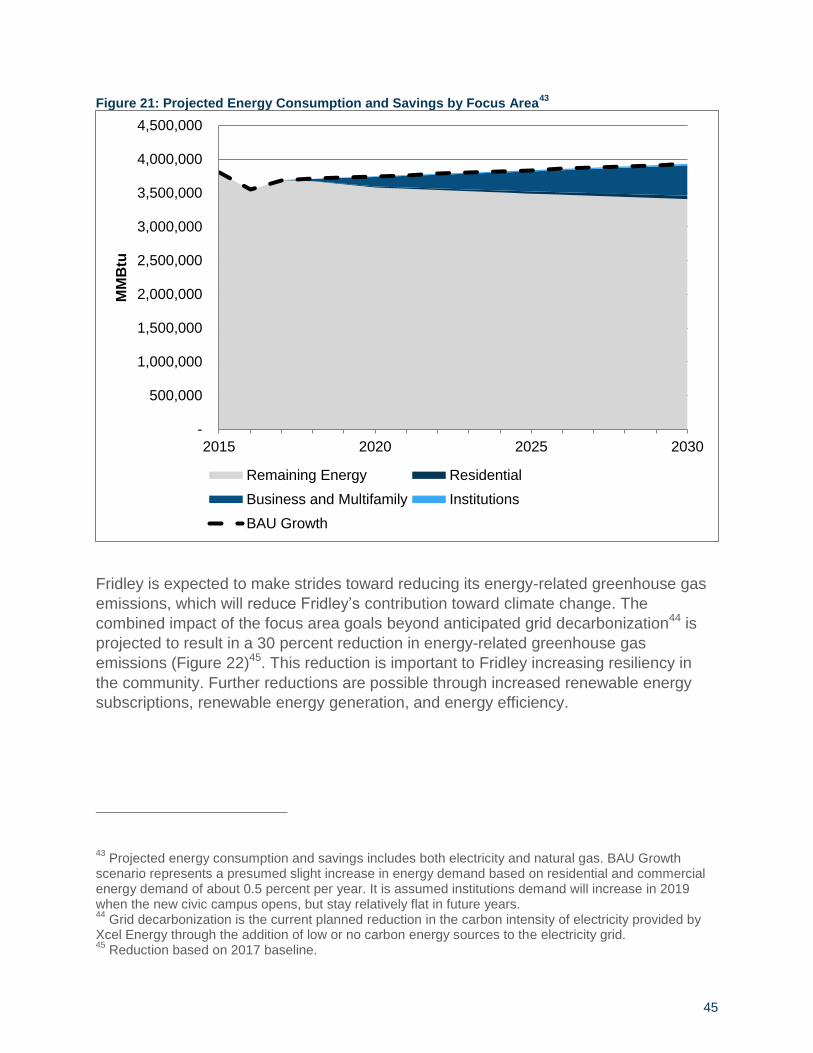
45
Figure 21: Projected Energy Consumption and Savings by Focus Area43
Fridley is expected to make strides toward reducing its energy-related greenhouse gas
emissions, which will reduce Fridley’s contribution toward climate change. The
combined impact of the focus area goals beyond anticipated grid decarbonization44 is
projected to result in a 30 percent reduction in energy-related greenhouse gas
emissions (Figure 22)45. This reduction is important to Fridley increasing resiliency in
the community. Further reductions are possible through increased renewable energy
subscriptions, renewable energy generation, and energy efficiency.
43 Projected energy consumption and savings includes both electricity and natural gas. BAU Growth
scenario represents a presumed slight increase in energy demand based on residential and commercial energy demand of about 0.5 percent per year. It is assumed institutions demand will increase in 2019 when the new civic campus opens, but stay relatively flat in future years. 44
Grid decarbonization is the current planned reduction in the carbon intensity of electricity provided by Xcel Energy through the addition of low or no carbon energy sources to the electricity grid. 45
Reduction based on 2017 baseline.
-
500,000
1,000,000
1,500,000
2,000,000
2,500,000
3,000,000
3,500,000
4,000,000
4,500,000
2015 2020 2025 2030
MM
Btu
Remaining Energy Residential
Business and Multifamily Institutions
BAU Growth

FRIDLEY ENERGY ACTION PLAN
46
Figure 22: Projected Energy-related Greenhouse Gas Emission Reductions
Long-term Strategies
The Energy Action Team will need to identify additional strategies, resources, and
partners in all focus areas to achieve its community-wide goal of 20 percent reduction in
energy use by 2030 – current strategies result in a 14 percent reduction in energy use.
The Energy Action Team identified businesses and multifamily buildings, which includes
large energy users, as an opportunity to achieve additional energy savings. Continued
engagement in this focus area will be important to ensuring energy action and increased
efficiency. With the help of grid decarbonization, achieving a 20 percent reduction in
energy use by 2030 will result in a 37 percent reduction in energy-related greenhouse
gas emissions.
Plan Implementation The goals and strategies outlined in this plan represent priorities for action over the next
two years, with the intention that the momentum generated will continue into the future.
A detailed work plan that outlines tasks, roles, and timeline is included in Appendix 4.
-
50,000
100,000
150,000
200,000
250,000
300,000
350,000
2015 2020 2025 2030
MtC
O2e
Remaining Emissions Residential
Business and Multifamily Institutions
Grid Decarbonization BAU Growth (No Change in EF)
2017 Baseline

47
City staff, and the Environmental Planner in particular, will serve as project lead on plan
implementation, and the Environmental Quality and Energy Commission will provide
boots-on-the-ground support. However, engagement of additional community volunteers
and business representatives will be critical in successfully achieving plan goals. A core
team will be designated by the Energy Action Team to work closely with Partners in
Energy on strategy implementation during the first 18 months. Partners in Energy will
provide support in four main areas: project management, technical expertise, data
tracking to measure progress toward goals, and marketing and communications. An
implementation Memorandum of Understanding will be signed as a first step, outlining
specific actions and energy conservation goals to be achieved during this time period.
Roles and Responsibilities
Implementing the strategies laid out in this plan will require leadership and collaboration
from a team of partners, including City staff, Environmental Quality and Energy
Commission members, and the Energy Action Team. To ensure plan success, this
section outlines the following roles and responsibilities for the first 18 months of
implementation. Specific responsibilities are further detailed in Appendix 5.
City of Fridley
Invest staff resources in supporting plan implementation.
Dedicate one or more pages on the City website for providing information and
resources to help residents and businesses access utility programs and rebates,
and support renewable energy.
Leverage existing City events and communication channels to promote energy
efficiency and renewable energy.
Integrate energy efficiency into Home Loan Program application, Development
Review Committee, and City permitting process.
Establish partnerships with local service providers, institutions, and creation care
teams.
Assist with door-knocking efforts in multifamily buildings, manufactured home
parks, and business blitz.
Lead by example through investments in energy efficiency and renewable energy
in City facilities.
Benchmark City energy use.
Engage City staff from all departments in supporting energy conservation and
energy efficient operations.
Provide information about residential and commercial energy efficiency programs
and rebates at the City permit desk and Development Review Committee.
Recognize businesses using existing events and website.
Encourage manufacturers to host energy tours.
Environmental Quality and Energy Commission
Assist with door-knocking efforts in manufactured home parks and business blitz.

FRIDLEY ENERGY ACTION PLAN
48
Table at existing events and leverage existing communication channels to
promote energy efficiency and renewable energy.
Establish partnerships with local service providers, property owners, institutions,
creation care teams, and electric vehicle organizations.
Research policy and program options for sustainable development, and present
to City Council.
Energy Action Team
Become advocates for achieving Energy Action Plan goals.
Promote engagement of residents in energy action.
Identify strategies and resources to support energy use reductions to achieve
long-term goals.
Partners in Energy
Assist with designing informational materials for residents, businesses,
multifamily buildings, and institutions.
Write and publish case studies, newsletter articles, and press releases.
Identify ways to reduce energy use in water treatment plants located in Fridley.
Provide technical assistance in energy benchmarking or development energy
saving plans.
Leverage existing relationships to connect the City of Fridley and EQEC with
local service providers.
Support door-knocking and tabling efforts with marketing materials, talking
points, and tabling kits.
Provide biannual reports for tracking progress toward goals.
Provide overall project management support and coordination during the first 18
months of plan implementation.
Implementation Launch
The Energy Action Team and City staff will work together to promote the Energy Action
Plan with press and social media coverage announcing the adoption of the plan, and an
engagement page will be added to the City website with additional information for
residents, businesses, multifamily buildings, and institutions.
How We Will Stay On Course
As part of implementation support, Partners in Energy will provide biannual progress
reports that include metrics of success and overall progress toward goals. These
reports will be made available to the public through the City of Fridley website. Results
of these reports will be analyzed to assess whether a change in course is needed. An
in-person meeting will take place at the mid-point of implementation to evaluate overall
progress in each of the focus areas and set priorities for the remaining time period. The
Energy Action Team and Environmental Quality and Energy Commission will be invited
to reconvene at the halfway point of implementation to evaluate whether Fridley is on

49
track to meet its goals, and whether goals should be revised to be more ambitious or
expanded to include additional priorities.

FRIDLEY ENERGY ACTION PLAN
50
Appendix 1: Implementation Memorandum of Understanding


51
Appendix 2: Who Are We? – Community Background The City of Fridley is a fully developed community just north of the City of Minneapolis.
Its area is approximately 10 square miles, and it is located in Anoka County.
Geography, Population, and Demographics
Fridley is a first-ring suburb located just 15 minutes north of downtown Minneapolis with
major transit corridors, including Interstate 694, Central Avenue (TH-65) and University
Avenue (TH-47), and access to the Mississippi River along its western border.
Although population has remained steady, with 27,447 residents in 2016, Fridley has
become increasingly diverse and younger:
Median age has decreased 2.5 years from 38.3 in 2010 to 35.8 in 2016;
18.2 percent of families speak a language other than English at home; and
14 percent of the population is foreign-born.46
Fridley is home to six public schools in three school districts and five private schools,
totaling over 3,500 students47. Ninety percent of the population has graduated from high
school and 27.2 percent have a bachelor’s degree or higher.
Median household income in Fridley is $55,006 and 12.3 percent of residents live in
poverty (compared to 11.3 percent statewide). An estimated 2,750 households earn
less than 50 percent of state median income (SMI), the eligibility threshold for utility low-
income programs. The highest concentration of households below 50 percent SMI is in
the census tract located north of Interstate 694, west of University Avenue, and south of
Mississippi Street.
Housing
Fridley’s housing stock contains a mix of owner-occupied and renter-occupied units,
and most of Fridley’s housing stock is aging. Eighty-nine percent of units are more than
30 years old.
Tenure breakdown is 62.5 percent owner-occupied and 37.5 percent renter-occupied
units. One third of housing units are in multifamily buildings, creating a unique
opportunity for multifamily and renter engagement.
Business and Economy
Fridley has a strong economic base – the City is home to the largest number of
employees in Anoka County with 22,737 jobs. Fridley employment is forecasted to grow
to 26,100 jobs by 204048. Manufacturing is the largest industry, representing 37 percent
46 U.S. Census Bureau, American Community Survey 2012-2016 5-year Estimates.
47 U.S. Census Bureau, American Community Survey 2012-2016 5-year Estimates, Fridley Public
Schools, and Totino-Grace High School enrollment. 48
Minnesota Department of Employment and Economic Development, Quarterly Census of Employment and Wages, 2
nd quarter data, 2017.

FRIDLEY ENERGY ACTION PLAN
52
of all jobs in the City.49 The City’s unemployment rate is slightly above state average at
3.8 percent in 2017 but is below the national unemployment rate. 50
Major employers include Medtronic, Cummins Power Generation, and Unity Medical
Center.
Table 16: Major Employers in Fridley51
Major Employer Sector Number of Employees
Medtronic, Inc. Medical/Technology 3,464
Cummins Power Generation Energy Generators 1,210
Unity Medical Center Medical 1,138
Target Retail 696
BAE Systems Security 600
ISD 14 (Fridley Schools) Education 580
Minco Products, Inc. Manufacturing 515
Walmart Retail 312
Kurt Manufacturing Manufacturing 295
Treehouse Foods Food Manufacturing 206
Local Outreach and Communication Channels
Engaging the community is critical to reaching Fridley’s Energy Action Plan goals. Table
17 lists some of the ways that residents and businesses currently receive information.
These communication channels will be helpful during implementation efforts.
49 Minnesota Department of Employment and Economic Development, Quarterly Census of Employment
and Wages, 2nd
quarter data, 2017. 50
Minnesota Department of Employment and Economic Development, Local Area Unemployment Statistics, 2017. 51
City of Fridley, 2016.

53
Table 17: Local Outreach Channels
Local Outreach Channels
Source: City of Fridley, Community Connection, May/June 2018 Issue
City Communications
Website
Social media (Facebook, Twitter,
NextDoor)
CityTV
Email updates (Fridley4U)
Community Connection, bi-monthly
newsletter
Quarterly business newsletter
Business retention visits
Cops & Clergy group
Electronic billboard on University Ave.
New Resident Packet
Other Communication Channels
Local newspapers
o Sun Focus
o Northeaster
Fridley Patch
Civic Organizations
Homeowners Associations
Neighborhood Associations
Mississippi Library bulletin board
Events
Farmers Market
49er Days
Springbrook Environmental Fun Fair
Night to Unite
Municipal Open House
Manufacturing Week
Small Business Saturday
Independent Retailer Month
Summer Concert Series
Springbrook Nature Center Camps

FRIDLEY ENERGY ACTION PLAN
54
Appendix 3: Methodology for Measuring Success
As part of implementation support, Partners in Energy will provide biannual progress
reports that include metrics of success and overall progress toward goals. The following
section defines how progress toward goals will be measured. All 2020 goals will be
measured through the implementation closeout date, as agreed to in the
Implementation Memorandum of Understanding. All 2030 goals will be measured
through the end of the year 2030.
For purposes of this plan, the business as usual scenario represents a presumed slight
increase in energy demand based on residential and commercial energy demand of
about 0.5 percent per year. It is assumed institutions demand will increase in 2019
when the new civic campus opens, but stay relatively flat in future years.
Community-wide Goal:
1. Reduce energy use 5 percent by 2020, and 20 percent by 2030, as compared to
business as usual.
The community-wide goal will be measured by comparing actual kWh and therm
consumption, measured in MMBtu, against projected community-wide MMBtu
consumption based on the business as usual scenario. Projected community-wide
MMBtu consumption in 2020 is 3,747,985 MMBtu, and in 2030 is 3,932,786 MMBtu.
Residential Energy Goals:
1. By 2020, Fridley residents will take 1,200 additional actions toward energy
conservation and renewable energy.
2. By 2030, residents will reduce total energy use 10 percent, as compared to
business as usual.
Goal one assumes the three-year participation average of 964 actions will continue in
2018, 2019, and 2020. The baseline that goal one will be measured against is the three-
year participation average of 964 actions. Goal one will be measured by counting all
actions taken in 2019 and 2020 above the 964 actions baseline.
Goal two will be measured by comparing actual kWh and therm consumption, measured
in MMBtu, against projected residential MMBtu consumption based on the business as
usual scenario. Projected residential business as usual MMBtu consumption for 2030 is
1,037,362 MMBtu.
Businesses and Multifamily Buildings Goals:
1. By 2020, business and multifamily buildings will achieve 5 percent energy
savings.
2. By 2030, business and multifamily buildings will reduce total energy use 20
percent, as compared to business as usual.

55
Goal one will be measured by combining actual kWh and therm savings, measured in
MMBtu, in 2019 and 2020 (MMBtusaved). MMBtusaved will be measured against 2017
MMBtu consumption.
Goal two will be measured by comparing actual kWh and therm consumption, measured
in MMBtu, against projected business and multifamily buildings MMBtu consumption
based on the business as usual scenario. Projected business and multifamily buildings
business as usual MMBtu consumption for 2030 is 2,761,076 MMBtu.
Institutions Goals:
1. By 2020, institutions will achieve 5 percent energy savings.
2. By 2030, institutions will reduce total energy use 15 percent, as compared to
business as usual.
Goal one will be measured by combining actual kWh and therm savings, measured in
MMBtu, in 2019 and 2020 (MMBtusaved). MMBtusaved will be measured against 2017
MMBtu consumption.
Goal two will be measured by comparing actual kWh and therm consumption, measured
in MMBtu, against projected institutions MMBtu consumption based on the business as
usual scenario. Projected institutions business as usual MMBtu consumption for 2030 is
134,349 MMBtu.
Transportation and Electric Vehicles Goals:
1. By 2020, conduct an outreach campaign to raise awareness about electric
vehicles, with the goal of reaching 500 residents and individuals who work in
Fridley.
2. By 2020, reach 10 businesses and multifamily buildings through a targeted
outreach campaign to encourage installation of charging infrastructure.
3. By 2020, install one electric vehicle charging station at a City-owned building or
location.
Goals one and two will be measured through points of contact. Points of contact will be
quantified by sign-in sheets at presentations and lunch and learns, count of collateral
pieces distributed at tabling events, count of individuals spoken to at tabling events,
count of businesses and multifamily buildings contacted through door-knocking, and
count of one-on-one outreach calls completed.
Goal three will be measured by the count of charging stations installed at City-owned
buildings and properties. The baseline is zero.
FRIDLEY ENERGY ACTION PLAN
56
Appendix 4: Glossary of Terms
Energy Action Plan: A written plan that includes an integrated approach to all aspects
of energy management and efficiency. This includes both short- and long-term goals,
strategies, and metrics to track performance.
Goals: The results toward which efforts and actions are directed. There can be a
number of objectives and goals outlined in order to successfully implement a plan.
Greenhouse Gas Emissions: Gases in the atmosphere that absorb and emit radiation
and significantly contribute to climate change. The primary greenhouse gases in the
earth's atmosphere are water vapor, carbon dioxide, methane, nitrous oxide, and ozone.
GreenStep Cities: Minnesota GreenStep Cities is a voluntary challenge, assistance
and recognition program managed by a public-private partnership to help cities achieve
their sustainability and quality-of-life goals. More information is available at:
greenstep.pca.state.mn.us/.
kWh (kilowatt-hour): A unit of electricity consumption.
MMBtu (million British thermal units): A unit of energy consumption that allows both
electricity and natural gas consumption to be combined.
MTCO2e (metric tons of carbon dioxide equivalent): A unit of measure for
greenhouse gas emissions. The unit "CO2e" represents an amount of a GHG whose
atmospheric impact has been standardized to that of one unit mass of carbon dioxide
(CO2), based on the global warming potential (GWP) of the gas.
Premise: A unique identifier for the location of electricity or natural gas service. In most
cases it is a facility location. There can be multiple premises per building, and multiple
premises per individual debtor.
Therm: A unit of natural gas consumption.
Trade Ally: Trade Allies, or Business Trade Partners, are vendors and contractors
who work with business and residential customers servicing, installing, and providing
consulting services regarding the equipment associated with utility rebate programs.
Their support for utility programs can range from providing equipment, assisting with
rebate paperwork, to receiving rebates for equipment sold.

57
Appendix 5: Work Plan and Timeline
Residential Energy
Actions Q4
2018 Q1
2019 Q2
2019 Q3
2019 Q4
2019 Q1
2020 Responsible Support Other Resources Required
Analyze resident survey to inform marketing campaign
City Lead
Partners in Energy, City Communications
Polco results
Create materials to promote energy efficiency at home, including materials in other languages and materials targeted at under-resourced households
Partners in Energy
City Lead, City Communications
Money for printing materials, Translation services
Create solar panel installation checklist and include on City website
City Lead, Partners in Energy
City Communications
Website page
Target neighborhoods with older homes with informational mailer
Partners in Energy
City Assessing data, Postage for mailing
Target new residents using new resident packet
Partners in Energy
City Informational materials
Door-knock at manufactured home parks
City Lead, EQEC
Partners in Enregy
Informational materials, Talking points
Use existing events and communicaion channels to promote energy efficiency and residential campaign materials
City Lead, EQEC
Partners in Energy
Tabling kits, Informational materials, Volunteers, Social media content and press releases
Update Home Loan Program application, website, and marketing materials to emphasize energy efficiency
City Lead, HRA
City Communications, Partners in Energy
Content, Talking points
Include energy efficiency at City's building permit desk and on website
City Lead
City Communications, Building Department, Partners in Energy
Informational materials
Create energy efficiency insert for City's water utility bills
Partners in Energy
City Communications
Insert
Partner with senior center on actions senior citizens can take home
City Lead Partners in Energy
Behavior change information

FRIDLEY ENERGY ACTION PLAN
58
Residential Energy
Actions Q4
2018 Q1
2019 Q2
2019 Q3
2019 Q4
2019 Q1
2020 Responsible Support Other Resources Required
Collaborate with local food shelves and service providers to reach under-resourced populations
City Lead EQEC Informational materials
Leverage existing partnerships with property managers at multifamily buildings to share information
City Lead, City Rental Department, EQEC
Property managers, Home Energy Squad, Local service organizations
Informational materials, Talking points
Leverage existing contacts, networks, events to reach under-resourced residents
City EQEC Informational materials
Businesses and Multifamily Buildings
Actions Q4
2018 Q1
2019 Q2
2019 Q3
2019 Q4
2019 Q1
2020 Responsible Support Other Resources Required
Create informational materials about actions and programs for business and multifamily, including case studies and funding information
Partners in Energy
City Communications, Business Retention and Expansion Team
Case study examples, Information on ROI
Distribute informational materials at building permit counter and city communication channels
City Lead
Building Department City Communications
Money for printing materials, Talking points, Website
Include energy efficiency messaging in City business e-newsletter and business rentention visits
City Lead
City Communications Business Retention and Expansion Team
Newsletter content, Informational materials
Conduct outreach on MNTAP intern program
City Lead
City Communications, Business Retention and Expansion Team, MNTAP
Informational materials
Launch door-knocking campaign(s) to promote energy audits, energy efficiency, and
City Lead, EQEC
Business Retention and Expansion Team, CERTs
Informational materials, Talking points, Volunteer training

59
Businesses and Multifamily Buildings
Actions Q4
2018 Q1
2019 Q2
2019 Q3
2019 Q4
2019 Q1
2020 Responsible Support Other Resources Required
renewable energy to local businesses
Host lunch and learn for businesses about City actions/experiences
City Lead, Business Retention and Expansion Team
Partners in Energy, Utility Program Reps, EQEC
Meeting location, Meeting refreshments and lunch Presentation content
Identify and target engagement in under-resourced areas and buildings
City Lead, HRA
EQEC
List of under-resourced areas and buildings Targeted informational materials
Use existing communication channels and relationships to share information with multifamily buildings
City Communications
Multifamily housing associations, Police Department, City HRA, Buildings Department
Information materials for different platforms
Collaborate with rental inspections to promote energy efficiency in multifamily buildings
City Lead
Partners in Energy, Rental Inspectors
Information materials, Talking points
Institutions
Actions Q4
2018 Q1
2019 Q2
2019 Q3
2019 Q4
2019 Q1
2020 Responsible Support Other Resources Required
Engage worship facilities in energy action and renewable energy
City Lead
EQEC, Interfaith Power and Light, Alliance for Sustainability, Cops and Clergy, EnerChange
List of worship facilities, Mailing funds, Scripts and talking points, Informational materials, Case studies
Establish partnerships with creation care teams to promote residential energy efficiency and create small scale energy plans
City Lead EQEC, Partners in Energy
Congregation toolkit, Scripts and talking points, Informational materials
Educate city staff about efficient building operations, utility rebates and programs, and behavior changes
City Lead
Partners in Energy, Xcel Energy Account Manager
Presentation materials, Behavior change materials

FRIDLEY ENERGY ACTION PLAN
60
Institutions
Actions Q4
2018 Q1
2019 Q2
2019 Q3
2019 Q4
2019 Q1
2020 Responsible Support Other Resources Required
Pursue opportunities to reduce energy use in city buildings and properties
City Facilities Manager
City Lead, Xcel Energy Account Manager
List of future projects/improvements, Rebate information, ROI information
Publish case studies for new civic campus and Springbrook Nature Center
Partners in Energy
City Lead, Facilities Manager
Information on improvements, Photos of improvements, ROI and rebate information, Communication channels to share highlights
Highlight efficient features at Civic Center open house using City communication channels and informational materials
City Lead Partners in Energy
Informational materials and posters, Social media content and press releases
Complete energy benchmarking for City Facilities
City Lead Xcel Energy Benchmarking tool
B3 support
Identify ways to reduce energy use in water treatment plants located in Fridley in partnership with Xcel Energy and MnTAP
Partners in Energy
Xcel Energy Account Managers, MnTAP, City Lead
Talking points
Provide technical assistance to school and hospital facility managers interested in benchmarking or developing energy saving plans
City Lead, Partners in Energy
Xcel Energy and CenterPoint Energy Account Managers
Informational materials, ROI information, Communication channels to share information
One-on-one outreach to school and hospitals to identify existing actions and potential resources
City Lead
Xcel Energy and CenterPoint Energy Account Managers
Work with students to create behavior change video
Identify school partner to take lead
City Communications, Partners in Energy, School green teams/students
Funding to film and edit video, Content for video, Volunteers to participate
Collaborate with DRC to identify areas of opportunity for energy efficiency in review process
City Lead Development Review Committee

61
Institutions
Actions Q4
2018 Q1
2019 Q2
2019 Q3
2019 Q4
2019 Q1
2020 Responsible Support Other Resources Required
Create energy efficiency and renewable energy packet for developers at DRC
Partners in Energy
City Lead Development Review Committee
Informational materials
Transportation and Electric Vehicles
Actions Q4
2018 Q1
2019 Q2
2019 Q3
2019 Q4
2019 Q1
2020 Responsible Support Other Resources Required
Table 5 events to educate attendees about electric vehicle ownership
EQEC City Lead, Partners in Energy
Tabling kits, Informational materials, Volunteers, Social media content and press releases
Design electric vehicle information materials for residential, business, and multifamily building outreach
x Partners in Energy
City Lead
Case study examples, Printing funds, EV-oriented information
Establish partnerships with electric vehicle organizations and dealerships to co-host tabling events and ride & drive, and assist with door knocking
EQEC City Lead, Partners in Energy
Informational materials, Talking points, Contact information
Write newsletter articles
Partners in Energy
City Lead, City Communications
Newsletter topics
Identify community destinations and large businesses to help target outreach
EQEC
Add language to DRC process encouraging charging infrastructure
City Lead Development Review Committee
Draft language
Present to city staff about electrifying fleet vehicles and FleetCarma study
City Lead
Partners in Energy, Xcel Energy, FleetCarma
FleetCarma study results, Space for presentations, Presentation materials
Identify city-owned opportunity sites for charging station
City Lead
List of city-owned property, Criteria for charging station