CAENTI Coordination Action of the European Network of Territorial Intelligence
Upload
khangminh22Category
view
0download
0
European Vaccine Action Plan
2015-2020Midterm reportMIDTERM REPORT
2015 2016 2017 2018 2019 2020

European Vaccine Action Plan
2015-2020Midterm reportMIDTERM REPORT
2015 2016 2017 2018 2019 2020

Abstract KeywordsA midterm review was undertaken to assess progress made by
the WHO European Region (the Region) in implementing the Eu-
ropean Vac cine Action Plan 2015-2020 (EVAP) as of its mid-point
at the end of 2017. This report documents progress made by the
Region with a focus on the EVAP goals and reflects upon the key
challenges in achieving the outlined targets in the EVAP. Overall,
the Region is on track for maintaining its polio-free status (Goal
1), off track for verification of measles and rubella elimination in
all 53 Member States by 2020 (Goal 2), pending validation to as-
certain the control of hepatitis B (Goal 3), at risk of not reaching
vaccination targets (Goal 4), on track for making evidence-based
decisions about introduction of new and underutilized vaccines
(Goal 5) and on track for securing the financial sustainability of
national immunization programmes (Goal 6).
HEPATITIS B VACCINE
IMMUNIZATION PROGRAMS
MEASLES VACCINE
POLIOVIRUS VACCINES
PUBLIC HEALTH
RUBELLA VACCINE
© World Health Organization 2018All rights reserved. The Regional Office for Europe of the World
Health Organization welcomes requests for permission to repro-
duce or translate its publications, in part or in full.
The designations employed and the presentation of the mate-
rial in this publication do not imply the expression of any opinion
whatsoever on the part of the World Health Organization concern-
ing the legal status of any country, territory, city or area or of
its authorities, or concerning the delimitation of its frontiers or
boundaries. Dotted lines on maps represent approximate border
lines for which there may not yet be full agreement.
The mention of specific companies or of certain manufacturers’
products does not imply that they are endorsed or recommended
by the World Health Organization in preference to others of a
similar nature that are not mentioned. Errors and omissions
excepted, the names of proprietary products are distinguished by
initial capital letters.
All reasonable precautions have been taken by the World Health
Organization to verify the information contained in this publica-
tion. However, the published material is being distributed without
warranty of any kind, either expressed or implied. The responsi-
bility for the interpretation and use of the material lies with the
reader. In no event shall the World Health Organization be liable
for damages arising from its use. The views expressed by au-
thors, editors, or expert groups do not necessarily represent the
decisions or the stated policy of the World Health Organization.
Address requests about publications of the
WHO Regional Office for Europe to:
PublicationsWHO Regional Office for EuropeUN City, Marmorvej 51DK-2100 Copenhagen Ø, Denmark
Alternatively, complete an online request form for documentation,
health information, or for permission to quote or translate, on the
Regional Office website (http://www.euro.who.int/pubrequest).
Photo credits: V: WHO/M. Bring / IX: WHO/G. Lazdane / X: WHO /
3: WHO / 8: WHO/M.Bring / 29: WHO/M. Bring / 36: WHO/L.Shea-
hen / 40: WHO/A.Shpigunov / 46: Russian Nurses Association /
51: A. Sokolovic- Rasmussen / 61: WHO / 66:WHO/M.Bring
Layout: Morten Noer Visuel Kommunikation

ContentsAbbreviations
Acknowledgements
Executive summary
Introduction
Progress towards EVAP goals
Goal 1: Sustain polio-free status
Goal 2: Elimination of measles and rubella
Goal 3: Control hepatitis B infection
Goal 4: Meet regional vaccination coverage targets at all administrative levels
Goal 5:Make evidence-based decisions about introduction of new vaccines
Goal 6: Achieve financial sustainability of national immunization programmes
Middle-income countries falling behind: a landscape analysis
References
IV
IV
VI
01
04
06
14
22
28
44
50
56
67

IV EVAP midterm report
AcknowledgementsThis EVAP midterm report was informed and produced by the
Vaccine-preventable Diseases and Immunization team (VPI) of
the WHO Regional Office for Europe. Expert oversight was pro-
vided by the European Technical Advisory Group of Experts on
Immunization (ETAGE). The WHO Regional Office extends special
thanks to the ETAGE working group members for reviewing the
report and providing valuable suggestions:
Professor Adam Finn,
University of Bristol,
United Kingdom
Dr Antonietta Filia,
Infectious Diseases Epidemiology Unit
of the National Health Institute,
Italy
Professor Alenka Kraigher,
University of Ljubljana,
Slovenia
Dr Ole Wichmann,
Robert Koch Institute,
Germany
Thomas Cherian, Carsten Mantel and Stefano Malvolti of MM
Global Health Consulting are also gratefully acknowledged for
their help during the consultations and drafting of the report.
WHO is indebted to its Member States for routinely sharing their
national and subnational immunization data, without which
completion of this report would not have been possible.
AbbreviationsAFP acute flaccid paralysis
BCG Bacille Calmette-Guerin vaccine for tuberculosis
CRS congenital rubella syndrome
DTP1 diphtheria-tetanus-pertussis-containing vaccine, first dose
DTP2 diphtheria-tetanus-pertussis-containing vaccine,
second dose
DTP3 diphtheria-tetanus-pertussis-containing vaccine,
third dose
ETAGE European Technical Advisory Group of Experts on
Immunization
EVAP European Vaccine Action Plan 2015-2020
GVAP Global Vaccine Action Plan
HepB3 hepatitis B vaccine, third dose
Hib Haemophilus influenzae type b
HIC high-income country
HPV human papillomavirus
IB-VPD invasive bacterial vaccine-preventable diseases
IPV inactivated polio vaccine
LMIC lower-middle-income country
MIC middle-income country
MCV1 measles-containing vaccine, first dose
MCV2 measles-containing vaccine, second dose
MMR measles-mumps-rubella vaccine
NITAG National Immunization Technical Advisory Group
OPV oral polio vaccine
PCV pneumococcal conjugate vaccine
PEF poliovirus essential facility
Pol3 polio-containing vaccine, third dose
RCC Regional Commission for the Certification of
Poliomyelitis Eradication
RV rotavirus vaccine
RVC Regional Verification Commission for Measles and
Rubella Elimination
SAGE Strategic Advisory Group of Experts on Immunization
SDGs Sustainable Development Goals
TIP Tailoring Immunization Programmes
UMIC upper-middle-income country
VDPV vaccine-derived poliovirus
WPV wild poliovirus

V

VI EVAP midterm report
Executive summary
A midterm review was undertaken to assess progress made by the WHO European Region (the Region) in implementing the European Vac-cine Action Plan 2015-2020 (EVAP) as of its mid-point, which was the end of 2017. This report documents progress with a focus on the EVAP goals and reflects upon the key challenges to further progress in the implementation of the EVAP.
Though the Region has main-tained polio-free status, all of its Member States remain at risk for importation or in some cases re-emergence of poliovirus, with three
Member States at high risk for its subsequent spread. To maintain the Region’s polio-free status and in preparation for certification of global eradication, all Member States need to: enhance and/or sustain high vaccination cover-age to maintain high population immunity; achieve and/or sustain high-quality surveillance; and be prepared to respond promptly in case of an importation or re-emer-gence of the virus. Member States with certified poliovirus essential facilities (PEFs) will also need to maintain a high level of vigilance to avoid breaches in containment and to mitigate the risk of spread, should a breach occur.
While the Region has made steady progress towards measles and rubella elimination in the last few years, the available evidence suggests that the Region is not on
track to be verified as having elimi-nated measles by 2020. Periodic outbreaks continue to occur in the
THE EUROPEAN REGION HAS SUSTAINED POLIO-FREE STATUS SINCE
2002Region. Failure in some Member States to achieve and sustain high immunization coverage sug-gests that they may be at risk of re-establishing transmission or remaining endemic. The quality of surveillance remains suboptimal in several Member States and may prove to be an impediment to veri-fication of elimination.
MIDTERM REPORT
2015 2016 2017 2018 2019 2020
39 MEMBER STATES HAVE ELIMINATED MEASLES AND/OR RUBELLA

VIIExecutive summary
eradication, elimination and control goals. There has been a decline since 2015 in the number of Member States whose coverage with the third dose of diphtheria-tetanus-pertussis-containing vaccine (DTP3) is ≥95%. Conse-quently, there is concern about achieving the EVAP target of 48 Member States having reached this level by 2020. Data to moni-tor equity is only being reported to WHO by about half of Member States (26/53 in 2017) and achieve-ment of the target of ≥90% DTP3 coverage in ≥90% districts could only be documented in 14 Mem-ber States in 2017. Analysis of disaggregated data, and periodic surveys and special studies will be required to monitor inequity and take measures to address it. The WHO Regional Office for Europe (Regional Office) is in the process of developing a guidance docu-ment to assist Member States with monitoring and addressing ineq-uity. Available data show that vac-cine hesitancy (as defined by the Strategic Advisory Group of Experts on Immunization1) has contributed
A goal for the control of hepatitis B infection through vaccination was established in the EVAP, but the indicators and targets for monitor-ing these goals have only recently been established (as part of the Action plan for the health sector response to viral hepatitis in the WHO European Region). A Working Group of the European Techni-cal Advisory Group of Experts on Immunization (ETAGE) will assess progress and validate achievement of the targets. Considering the already low regional prevalence of HBsAg carriage and the high coverage with vaccination and/or screening and prevalence, this goal could represent an early win for the Region.
Achieving and maintaining high and equitable coverage under-pins vaccine-preventable disease
to declining coverage of some vac-cines at the national level in some Member States and can exacer-bate inequitable coverage. Further in-depth analyses of data at the country level may provide insights into the root causes. Application of the Tailoring Immunization Pro-grammes (TIP) approach helps in achieving a better understanding of the reasons for low uptake and in designing a tailored approach to correcting the problem. Evi-dence also indicates that vaccine stockouts have contributed to a low or declining coverage in some Member States. The reasons for stockouts vary between countries but all require remedial actions.
REGIONAL AVERAGE DTP3 COVERAGE IN 2017
49 MEMBER STATES PROVIDE UNIVERSAL HEPATITIS B IMMUNIZATION
94%
1 Report of the SAGE working group on vaccine hesitancy http://www.who.int/immunization/sage/meetings/2014/october/1_Report_WORKING_GROUP_vaccine_hesitancy_final.pdf

VIII EVAP midterm report
erated data to support decisions on rotavirus vaccine introduction. However, surveillance capac-ity would need to be enhanced to document the impact of vaccines. These data may become important for sustained financing in the face of other competing priorities.
The Member States of the Eu-ropean Region are on track to achieve financial self-sufficiency for procuring routine vaccines by 2020. However, concerns remain about current funding mechanisms in some of the MICs to adequately finance their immunization pro-grammes to achieve the vision and goals of the EVAP, including but not limited to the introduction of new vaccines. On average, these countries spend a lower proportion of their gross domestic product (GDP) and total government expen-ditures on health as compared to high-income countries and a few allocate a relatively low percentage of their current health expendi-tures to procuring vaccines despite the high return on investment in immunization.
The available data shows that MICs without donor support are lag-ging behind and unless corrective measures are taken the decline or stagnation in their perfor-mance could pose a threat to the achievement of the EVAP goals and targets.
NITAGS IN 80% OF MEMBER STATES MADE RECOMMENDATIONS ON VACCINE INTRODUCTION
There has been substantial progress in establishing national immunization technical advisory groups (NITAGs) in the Region and in enhancing their capacities to provide credible, well-informed recommendations to the national governments based on a thorough review of the available evidence. However, further support from WHO or other partner agencies would be required to further en-hance these capacities.
WHO supports a network of senti-nel sites that conduct surveillance for invasive bacterial vaccine-preventable-diseases (IB-VPD) and rotavirus diarrhoea that have gen-
50MEMBER STATES ARE FINANCIALLY SELF-SUFFICIENT FOR VACCINE PROCUREMENT
80%

Midterm report IX
X EVAP midterm report

1Introduction
Introduction
The European Vaccine Action Plan 2015–2020 (EVAP) was adopted unanimously at the 64th session of the WHO Regional Committee for Europe [1] and envisions a Region free from vaccine-preventable dis-eases, where all countries provide equitable access to high-quality, safe, affordable vaccines and im-munization services throughout the life-course. It was developed through a consultative process with the Member States of the WHO Eu-ropean Region (the Region). It sets a course to reach its vision and goals for immunization and control of vaccine-preventable diseases, by defining objectives, priority action areas and indicators, considering the specific needs and challenges of the Region’s Member States. The EVAP complements the Global Vaccine Action Plan (GVAP), the Sustainable Development Goals (SDGs) and is in line with Health 2020 and other key regional health strategies and polices.
It is widely recognized that im-munization has brought about a remarkable reduction in child
2 Armenia, Azerbaijan, Georgia, Kyrgyzstan, Republic of Moldova, Tajikistan, Turkmenistan, Ukraine, and Uzbekistan. MICs as per 2013 World Bank country classifications by income level
mortality in the WHO European Region over the past few decades and is one of the best buys not only in health but for sustainable development. Through adoption of the EVAP, the Member States of the Region made an unprece-dented pledge to ensure long-term domestic funding of and commit-ment to immunization. If the vision and goals outlined in the EVAP are achieved, a recent analysis sug-gests the economic benefits for the period 2011-2020 in the 9 middle-income countries in the Region2 would amount to US$ 5 billion, with a return on investment of US$ 5 for every US$ 1 invested [2].
Member States agreed on a set of targets as part of the monitor-ing and evaluation framework to periodically evaluate and monitor progress towards the EVAP goals and objectives [3]. The robust mon-itoring and evaluation framework also ensured that all stakeholders in the Region adopt a shared ap-proach to optimize their efforts in protecting the health of individuals in the Member States.
EVAP FRAMEWORK:
1 VISION 6 GOALS
5 OBJECTIVES AND
19 TARGETS

2 EVAP midterm report
This midterm report presents progress against the goals, objec-tives and targets of the EVAP up to December 2017, using 2014 as the baseline year, to objectively reflect key challenges in the Region. The assessment is based on a desk re-view and analysis of data reported to WHO through the WHO/UNICEF Joint Reporting Form (JRF) as well as other publicly available docu-ments and reports, including the reports of the Regional Commis-sion for the Certification of Polio-myelitis Eradication (RCC) and the Regional Verification Commission for Measles and Rubella Elimina-tion (RVC). Based on this report, the European Technical Advisory Group of Experts on Immunization (ETAGE) will propose interventions to address the identified priorities and challenges and ensure that all of the ambitious targets of EVAP are met by 2020. This report pro-vides an opportunity for all stake-holders in the Region to reflect on the immunization achievements thus far and provides the basis to renew their commitment to the goals of the EVAP to ensure that
the benefits of immunization do indeed reach all, thereby contrib-uting to achievement of the EVAP vision of a Region free of vaccine-preventable diseases. 3 OF 6 GOALS:
ON TRACKFOR 2020

3Introduction

Progress towards EVAP goals This report focuses on the EVAP goals and targets, but the narrative section under each goal provides information on the relevant EVAP objectives as well.

5Progress towards EVAP goals
FIG. 1REGIONAL PROGRESS TOWARDS EVAP GOALS, 2017
GOAL TARGET STATUS ON PROGESS
Sustain polio-free status
No wild poliovirus transmission re-established in the Region
On track
Eliminate measles and rubella
By 2015, all Member States have interrupted endemic transmission of measles and rubella for >12 months and by 2018 regional elimination is verified
Not achieved
Control hepatitis B infection
By 2020 all Member States reach hepatitis B control targets and this achievement is validated by ETAGE
Validation pending
Meet regional vaccination coverage targets at all administrative levels
By 2020, 90% of Member States with ≥95% DTP3 at national level
At risk
Make evidence-based decisions about introduction of new vaccines
By 2020, 90% of Member States with a NITAG have made an informed decision on introduction of a new vaccine following review of the relevant evidence by the NITAG
On track
Achieve financial sustainability of national immunization programmes
By 2020, 96% of Member States are financially self-sufficient for procuring routine vaccines
On track
12
3
4
5
6

6 EVAP midterm report
Sustain polio-free status
At its 32nd meeting held in May 2018, the RCC concluded that based on avail-able evidence there was no wild poliovirus transmission in the Region in 2017. Though the Region has maintained its polio-free status since 2002, it continues to be at risk for the introduction of wild poliovirus and emergence of vaccine-derived polioviruses. Following the successful switch from tri-valent to bivalent oral polio vaccine (OPV) in the OPV-using countries in the Region in 2016, the risk of emergence of vaccine-derived poliovirus (VDPV) type 2 has been reduced. This report summarizes the key findings of the RCC 2018 meeting [4].
Risk assessmentEach WHO region conducts qualitative assessments of the risk of sustained poliovirus transmission following an importation. The WHO regions differ with respect to the methods, process and cut-off values used [5], though level of population immunity, surveillance quality, and preparedness for outbreak response are common to all [6]. In 2018, the RCC included the containment risk ranking as a variable in the overall risk assessment matrix and requested the national certification committees in the Region to provide the national perspective on the specific risks and the corrective actions to be taken to mitigate the risks [7]. The risk categorization of Member States in the Region for 2017 is shown in Fig. 2.
In 2017, three Member States, namely Bosnia and Herzegovina, Romania and Ukraine were categorized by the RCC as being at high risk for sustained
GOAL 1
THE EUROPEAN REGION
HAS SUSTAINED POLIO-
FREE STATUS SINCE
2002
Target: No wild poliovirus transmission re-established in the Region

7Goal 1
FIG. 2 RISK CATEGORIZATION FOR SPREAD OF POLIOVIRUSES, WHO EUROPEAN REGION, 2014-2017
2017
2016
2015
2014
0 10 20 30 40 50
Number of Member States (n=53)
Low
Intermediate
High
Not assessed
transmission following importation, primarily because of low population immunity. These countries were also classified as high risk in 2016. In addi-tion, Bulgaria and Serbia were provisionally classified as high risk pending submission of action plans for a polio outbreak response. Lack of prepared-ness plans in these countries is an important part of the risk assessment, in addition to the presence of suboptimal population immunity and average surveillance quality.
A further review of the individual risks of the Member States in the Region conducted as a part of the polio-risk assessment for the RCC, presented below, provides better perspective of the specific risks and the corrective actions to be taken to mitigate those risks, based on the following charac-
Data source: WHO/Europe RCC ReportNote: Risk status for two Member States, Bulgaria and Serbia, is pending for 2017

8 EVAP midterm report
FIG. 3COVERAGE WITH THIRD DOSE OF POLIO VACCINE, WHO EUROPEAN REGION, 2014-2017
2017
2016
2015
2014
0 10 20 30 40 50
Number of Member States (n=53)
Data source: WHO/UNICEF coverage estimates as of 11 July 2018
≥95%
90-94%
<90%

9Goal 1
teristics: (1) population immunity gaps; (2) surveillance quality; (3) prepar-edness for response to importation; and (4) containment of polioviruses.
Population immunity gapsFor 2017, 52 Member States reported coverage rates with three doses of po-lio vaccine through their annual WHO/UNICEF Joint Reporting Form (JRF); Monaco did not report Pol3 coverage in the JRF. The number of Member States with coverage ≥95% has declined over the past 3-4 years; from 35 in both 2014 and 2015, to 30 in 2016 and 29 in 2017. In 2017, 7 Member States had Pol3 coverage <90% (Fig. 3), of which Bosnia and Herzegovina and Ukraine had coverage of 75% and 48%, respectively, raising concerns about increasing immunity gaps in these Member States. Even in Member States with sustained coverage ≥95%, concerns remain about the quality of the coverage data and the presence of pockets with immunity gaps, especially among vulnerable and underserved populations.
All 53 Member States in the Region have included inactivated polio vaccine (IPV) in their national immunization schedules, of which 7 provide a single dose of IPV to supplement immunity provided by the bivalent OPV. Detailed in-formation on individual country schedules is available on the WHO website [8].
High-quality surveillance As the world progresses towards certification of polio eradication, maintain-ing high-quality polio surveillance is crucial not just for certification, but also to mitigate the risks of importation and spread of polioviruses. As-sessing poliovirus surveillance quality in the Region is challenging because of the varying surveillance strategies used by the Member States. As per reports available with WHO, in 2017, 44 Member States were conduct-ing acute flaccid paralysis (AFP) surveillance, of which 30 also conducted supplementary surveillance (13 enterovirus surveillance, 4 environmental surveillance and 13 both enterovirus and environmental); 10 conducted only
29MEMBER STATES ACHIEVED
≥95% POL3 COVERAGE IN 2017
ALL 53
MEMBER STATES INCLUDE
IPV IN THEIR NATIONAL
IMMUNIZATION SCHEDULES

10 EVAP midterm report
supplementary surveillance (7 enterovirus surveillance, 1 environmental surveillance, 2 enterovirus and environmental). In 2017, only one country (Belgium) in the Region was assessed to have low-quality surveillance and 153 to have average quality. This represents an improvement from 2016 when 5 Member States were assessed to have low-quality surveillance and 17 as having average quality.
Preparedness and response to importationsA polio outbreak simulation exercise (POSE) is a two-day desktop exercise designed to help Member States critically review and update their national plans for responding to the detection of imported wild polioviruses (WPVs) and VDPVs, including use of the International Health Regulations mecha-nism. The exercise addresses communication, coordination and collabora-tion at an international and national level and exposes any weaknesses in polio preparedness and response arrangements [9].
In 2017, 18 Member States4 still did not provide a national plan of action for response to importations. As of July 2018, 20 Member States5 in the Region had conducted national simulation exercises or participated in the regional events to strengthen polio outbreak response preparedness. These exercises have shown that the level of preparedness needs to be further strengthened, particularly by periodically reviewing and updating the national plans, when available, improving the strategies for vaccine procurement, timely shipment of patient specimens, and risk communication. These simulation exercises have also highlighted programmatic deficiencies that need to be addressed to mitigate the risks of an outbreak following importation and to mount a ro-bust response, including the need for improved quality of coverage, surveil-lance data, and better information on the high-risk populations along with targeted strategies to reach them as part of the outbreak response.
3 Andorra, Bulgaria, Croatia, Czech Republic, Greece, Hungary, Italy, Latvia, Monaco, Montenegro, Poland, San Marino, Serbia, Slovenia and Switzerland 4 Albania, Armenia, Belarus, Bosnia and Herzegovina, Bulgaria, Denmark, Estonia, France, Hungary, Israel, Kyrgyzstan, Latvia, Malta, Monaco, Poland, Serbia, the former Yugoslav Republic of Macedonia and Turkey5 Armenia, Azerbaijan, Bosnia and Herzegovina, Czech Republic, Georgia, Hungary, Kazakhstan, Kyrgyzstan, Latvia, Montenegro, Republic of Moldova, Romania, Russian Federation, Serbia, Slovakia, Tajikistan, Turkmenistan, Ukraine, United Kingdom of Great Britain and Northern Ireland and Uzbekistan
3MEMBER STATES
ARE AT HIGH RISK OF
POLIO TRANSMISSION
FOLLOWING IMPORTATION
OR RE-EMERGENCE

BOX 1RISK OF A POLIOVIRUS CONTAINMENT BREACH AND MEASURES TO MITIGATE THE RISK
In April 2017, a wild poliovirus type 2
(WPV2) leak occurred during down-
stream IPV production at Bilthoven
Biologicals (BBio) in the Netherlands
[10]. A containment breach was also
reported at GSK Biologicals in Belgium
in 2014. While these breaches were
rapidly contained, the IHR Emergency
Committee on international spread of
poliovirus noted that any transmission
from such containment breaches could
have serious public health conse-
quences and recommended revisions
of the WHO and national containment
protocols and preparedness plans.
The WHO Regional Office jointly with the
European Centre for Disease Prevention
and Control (ECDC) will support Mem-
ber States that propose to establish
PEFs to conduct POSE with the specific
aim of critically reviewing and updat-
ing their respective national plans for
responding to containment breaches in
the PEFs.
ContainmentAs highlighted by the RCC in its 2016 meeting report, as the number of cir-culating wild polioviruses decreases globally, the main risk for the European Region could come from a containment breach at a vaccine manufacturer or research laboratory. Containment of polioviruses will therefore become an important issue that will require close monitoring in preparation for global certification and to mitigate risks in the post-certification period. Vac-cine production facilities as well as laboratories that store polioviruses or materials likely to contain polioviruses, which are to be designated as PEFs, will need to implement measures to mitigate the risks of infection of their workers and further spread of the virus or accidental release of virus into the environment. To date, two containment breaches in vaccine manufactur-ing facilities in the Region have been reported (see Box 1).
Thirteen Member States in the Region have declared their intent to estab-lish one or more PEFs that will have stock of poliovirus, as laid out in the WHO global action plan to minimize poliovirus facility-associated risk after type-specific eradication of wild polioviruses and sequential cessation of routine OPV use (GAP III). Each Member State with one or more PEFs is required to establish a National Authority for Containment (NAC) to monitor the implementation of containment measures. To date, 9 of the 13 Member States have established NACs; the remainder will need to complete the process of formally establishing a NAC.
11Goal 1


GOAL 1 CONCLUSION
The Region has so far maintained its polio-free status. However, all Member States in the Region remain at risk for importation or re-emergence of poliovirus, with 3 Member States assessed to be at high risk in 2017 for its subsequent spread. All Mem-ber States will need to enhance and/or sustain high vaccination coverage to maintain high population immunity, achieve and/or sustain high-quality surveillance and be prepared to respond promptly in case of an importation or re-emergence of the virus. Member States with PEFs will also need to maintain a high level of surveillance and vigilance to avoid breaches in containment and mitigate the risk of spread, should a breach occur. Member States in the Region will continue to strengthen their outbreak preparedness, including by testing their response plans through POSE.
Goal 1 13

14 EVAP midterm report
Elimination of measles and rubella
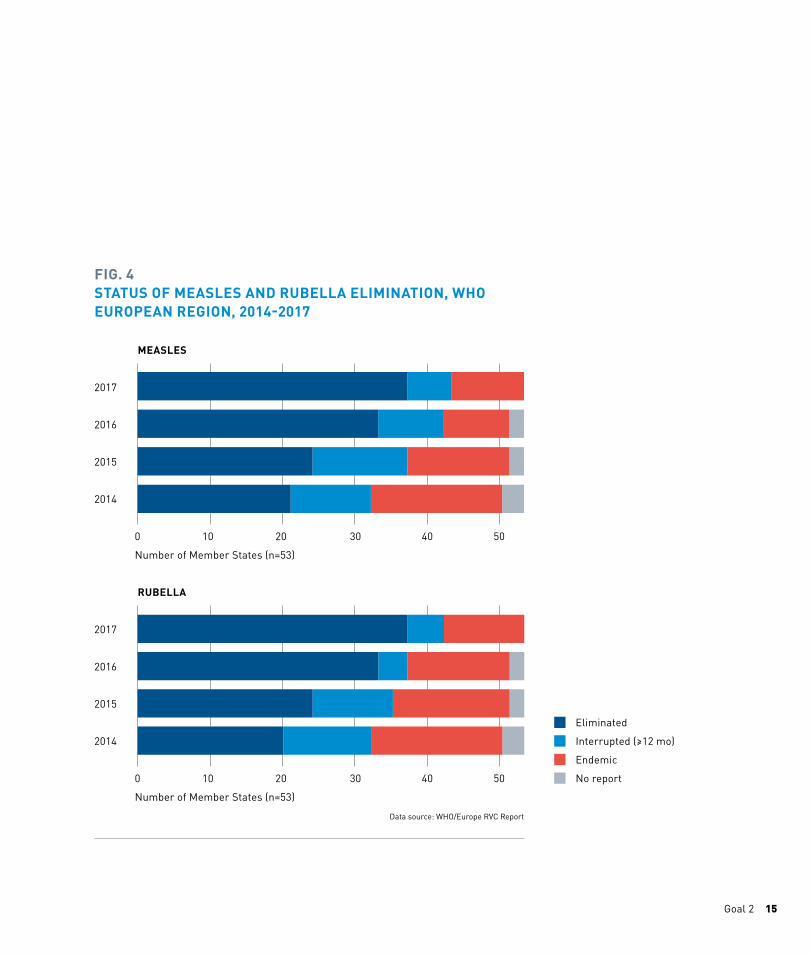
Elimination of measles and rubella is defined as the absence of endemic transmission in a defined geographic area (such as a region or country) for ≥12 months in the presence of a well-performing surveillance system. Veri-fication takes place after 36 months of interrupted transmission [11].The details of the status of measles and rubella/CRS elimination are avail-able in the RVC 2018 meeting report. This section summarizes the key findings.
Status of eliminationThe target for interruption of endemic measles and rubella transmission for ≥12 months in all Member States in the Region by 2015 was not met and thus, the 2018 target for the verification of elimination of measles and rubella in the Region will not be met. Based on the status of measles control in the endemic countries as well as the persistent immunity gaps and consequent risk of re-establishment of endemic transmission, it will be challenging to verify interruption of transmission for at least 12 months in all Member States in the Region by the end of 2020.
The status of elimination of measles and rubella in the Region, as deter-mined by the RVC is summarized in Fig. 4. In late 2014, the RVC modified the verification procedures to verify the measles and rubella elimination status at the national level as opposed to only at the regional level. The number of Member States in the Region that have been verified as having eliminated
GOAL 2
Target: By 2015, all Member States have interrupted endemic transmission of measles and rubella for ≥12 months and by 2018 regional elimination is verified
2020MEASLES AND RUBELLA ELIMINATION TARGET WILL NOT BE MET
15Goal 2
FIG. 4STATUS OF MEASLES AND RUBELLA ELIMINATION, WHO EUROPEAN REGION, 2014-2017
Eliminated
Interrupted (≥12 mo)
Endemic
No report
RUBELLA
Data source: WHO/Europe RVC Report
2017
2017
2016
2016
2015
2015
2014
2014
MEASLES
0 10 20 30 40 50
Number of Member States (n=53)
0 10 20 30 40 50
Number of Member States (n=53)

16 EVAP midterm report
endemic measles and/or rubella transmission has steadily increased from 21 in 2014 to 37 in 2017 for measles and from 20 to 37 for rubella.
Despite the steady progress with measles and rubella elimination in the Re-gion, the RVC expressed concern about the quality and completeness of the annual status reports from the Member States, making it difficult to assess the interruption of endemic transmission in some Member States.
Cases and incidence of measles and rubella 2010-2017Fig. 5 shows the reported number of measles and rubella cases in the Region from 2010 to 2017. The lowest number of reported cases for both measles and rubella was in 2016, though the number of measles cases increased in 2017 to levels higher than in 2014 (the baseline year for EVAP). It may be noted that 496 of the 723 reported rubella cases in 2017 were in Poland and none was laboratory confirmed.
In 2017, a total of 22 447 (range 1 to 5689) cases of measles were reported by 44 Member States in the Region for a regional incidence of 24.06/million population (country incidence range 0 to 294.6/million) and resulting in 36 deaths (data reported as of 6 July 2018) [12]. Twenty-one Member States reported an incidence <1/million population in 2017, whereas 12 reported an incidence >10/million. Large outbreaks with over 1000 cases were reported from 4 Member States: Romania (incidence 294.6/m), Ukraine (incidence 107.7/m), Greece (incidence 97.6/m) and Italy (incidence 89.7/m). The total number of rubella cases reported in 2017 was 723 for a regional incidence of 0.78/ million population [11]. Detailed epidemiological information is published monthly in the WHO EpiBrief published by the Regional Office [13].
The following subsections of this report briefly summarize the main chal-lenges to achieving the measles and rubella elimination target for the Region, namely (1) coverage and immunity gaps; and (2) suboptimal surveil-
NUMBER OF MEMBER STATES
THAT ELIMINATED MEASLES
INCREASED FROM
21
IN 2014 TO
37 IN 2017
NUMBER OF MEMBER STATES
THAT ELIMINATED RUBELLA
INCREASED FROM
20
IN 2014 TO
37 IN 2017

17Goal 2
2010 2012 2014 20162011 2013 2015 2017
NUMBER OF CASES
% COVERAGE
40 000
35 000
30 000
25 000
20 000
15 000
10 000
5000
0
FIG. 5 MEASLES AND RUBELLA CASES AND COVERAGE WITH MEASLES-AND-RUBELLA-CONTAINING VACCINES (MCV1 AND MCV2), WHO EUROPEAN REGION, 2010-2017
80
93
89
95
83
94
89
94
88
93
83
95
89
94
90
95
Measles cases
Rubella cases
Data sources: Centralized Information System for Infectious Diseases (CISID), data as of 6 July 2018; WHO/UNICEF Joint Reporting Form and WHO/UNICEF coverage estimates, as of 11 July 2018
MCV1 COVERAGE
MCV2COVERAGE

18 EVAP midterm report
lance, which could potentially become an impediment to achieving and sus-taining interruption of endemic transmission of the diseases and ultimately for the verification of regional elimination.
Coverage and immunity gaps Sustained immunization coverage of ≥95% with two appropriately spaced doses of measles-containing vaccines is needed to achieve and sustain measles elimination. The regional coverage with the first and second doses of measles-containing vaccines (MCV1 and MCV2) in 2017 was 95% and 90%, respectively (Fig. 5). In 2017, of the 53 Members States that reported coverage, 23 had MCV1 coverage <95%, of which the coverage was 90-94% in 14 and below 90% in 9; 2 Member States had coverage <70%. Of the 52 Member States for which MCV2 coverage is available, 34 Member States had MCV2 coverage <95%, with 19 of these having coverage <90%. Of note, the MCV2 coverage in Montenegro in 2017 among children 6 years of age was 83% compared to 58% for MCV1 in children < 23 months in the same year. There may not always be a direct relationship between current cover-age in infants and the number of measles cases in a given year in individual Member States. For this, one would need to consider population immunity across a much wider age range and consider natural immunity induced by recent disease outbreaks. Nevertheless, low routine immunization coverage in infants indicates risks to achieving and/or sustaining elimination status in the future, unless steps are taken to fill the gaps through supplementary immunization activities.
Measles vaccination schedules Based on evidence presented on population mixing rates and the risk of measles transmission [14], the WHO Strategic Advisory Group of Experts on Immunization (SAGE) noted that because of the high contact rates after school entry, immunity gaps in school-age children can be a strong driver of disease transmission. SAGE recommended that countries where the sched-
9 OUT OF 10 CHILDREN
RECEIVED THEIR
SCHEDULED SECOND
DOSE OF MEASLES
VACCINE IN 2017
36MEASLES DEATHS WERE
REPORTED IN 2017

19Goal 2
uled age for administration of MCV2 is after school entry should consider lowering the age of MCV2, provided this does not have a negative impact on coverage levels. SAGE also recommended that countries should institution-alize school entry checks to determine immunization status and consider approaches to fill immunity gaps [15].
Currently, in the Region, 13 Member States schedule MCV2 after the age of 6 years and many more provide this dose at 6 years, highlighting the need for Member States to review their schedule, together with epidemiological and coverage data to optimize the age of immunization to maximize disease control.
Suboptimal surveillanceIn its 2017 meeting report, the RVC noted that the extent and quality of surveillance remains suboptimal in many Member States, including some Member States that have achieved elimination, especially for rubella and congenital rubella syndrome (CRS).
The implementation of standardized case-based measles and rubella sur-veillance and the assessment of surveillance quality remains a challenge in the Region because of the divergent surveillance systems in the Member States. Though most Member States in the Region conduct case-based sur-veillance for measles, as of 2017, 9 still did not report monthly case-based data to WHO. Evaluation of the recommended laboratory indicators in 2017 reveal that in 4 Member States, laboratory investigations were done for <80% of suspected measles cases. Twenty-three Member States did not achieve the 80% target for timeliness of investigation [16]. All Member States in the Region have access to WHO-accredited reference laboratories [17]. Similarly, for rubella, of the 24 Member States reporting cases, 4 performed labora-tory investigations for <80% of suspected rubella cases. Fourteen of the 24 Member States did not meet the 80% target for timeliness of investigation.
30MEMBER STATES
REACHED MCV1 COVERAGE
≥95% IN 2017

20 EVAP midterm report
ECDC collects, analyses and shares with WHO monthly measles and rubella surveillance data from all 28 European Union (EU) Member States and two of the three remaining European Economic Area (EEA) countries (Iceland and Norway). ECDC ensures standardized measles and rubella surveillance reporting across the EU including diagnostic and typing methods and case definitions6, which differ from the surveillance definitions used by WHO7. The remaining countries submit their data to WHO.
At this stage of measles and rubella elimination in the Region, Member States should have the ability to distinguish between endemic and import-related transmission, which supports the verification process. Measles and rubella genotyping data, together with epidemiological information, are important elements that enable Member States to make this distinction. Analysis of the measles case-based data submitted to WHO in 2017 reveals that 94% of the adequate samples collected from suspected measles cases were investigated in a proficient laboratory and that the origin of infec-tion was known in 64% of positive cases. While the reporting of genomic sequence data for measles has improved in recent years in the Region, the reporting of genomic data for rubella remains low.
6 https://eur-lex.europa.eu/LexUriServ/LexUriServ.do?uri=OJ:L:2012:262:0001:0057:EN:PDF7 http://www.euro.who.int/__data/assets/pdf_file/0018/79020/e93035-2013.pdf?ua=1
44 OUT OF 53 MEMBER
STATES REPORT MONTHLY
CASE-BASED MEASLES
AND RUBELLA DATA

GOAL 2 CONCLUSION
While the Region has made steady progress towards measles and rubella elimination in the last few years, it is not on track to be verified as having eliminated measles by 2020. However, interrupted transmission in all 53 Member States by 2020 is pos-sible if the remaining endemic Member States make a greater, concerted effort to interrupt transmission.
At the same time, it is imperative that the Region not lose mo-mentum nor any gains in pursuit of this goal. Periodic measles outbreaks continue to occur in the Region. Failure to achieve and/or sustain the high level of immunization coverage required to prevent a build-up of immunity gaps suggests that a few Mem-ber States that have already interrupted transmission for ≥12 months could be at risk of outbreaks and re-establishment of the disease.
While all Member States in the Region have demonstrated high-level political commitment through the re-endorsement of the elimination goal in 2014, there is complacency in transla-tion of this commitment into action in a few Member States, as evidenced by insufficient allocation of resources, stagnant or declining vaccination coverage, suboptimal surveillance quality, and inadequate preparedness for or response to outbreaks.
Goal 2 21
22 EVAP midterm report
Control hepatitis B infection
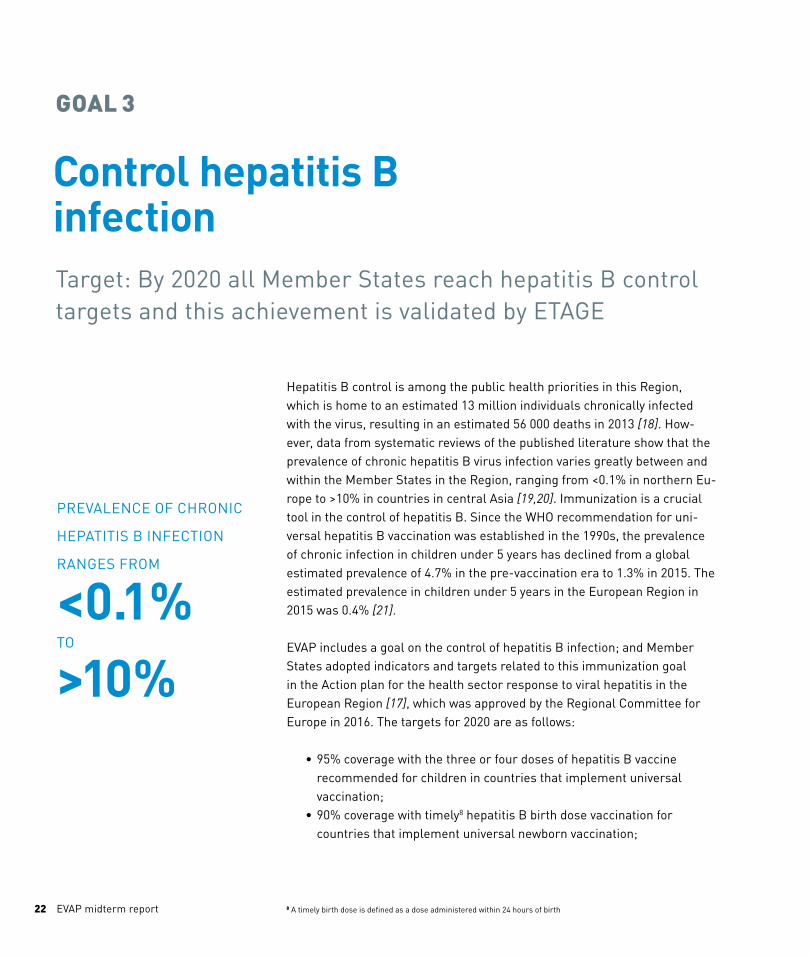
Hepatitis B control is among the public health priorities in this Region, which is home to an estimated 13 million individuals chronically infected with the virus, resulting in an estimated 56 000 deaths in 2013 [18]. How-ever, data from systematic reviews of the published literature show that the prevalence of chronic hepatitis B virus infection varies greatly between and within the Member States in the Region, ranging from <0.1% in northern Eu-rope to >10% in countries in central Asia [19,20]. Immunization is a crucial tool in the control of hepatitis B. Since the WHO recommendation for uni-versal hepatitis B vaccination was established in the 1990s, the prevalence of chronic infection in children under 5 years has declined from a global estimated prevalence of 4.7% in the pre-vaccination era to 1.3% in 2015. The estimated prevalence in children under 5 years in the European Region in 2015 was 0.4% [21].
EVAP includes a goal on the control of hepatitis B infection; and Member States adopted indicators and targets related to this immunization goal in the Action plan for the health sector response to viral hepatitis in the European Region [17], which was approved by the Regional Committee for Europe in 2016. The targets for 2020 are as follows:
• 95% coverage with the three or four doses of hepatitis B vaccine recommended for children in countries that implement universal vaccination;
• 90% coverage with timely8 hepatitis B birth dose vaccination for countries that implement universal newborn vaccination;
GOAL 3
PREVALENCE OF CHRONIC
HEPATITIS B INFECTION
RANGES FROM
<0.1% TO >10%
Target: By 2020 all Member States reach hepatitis B control targets and this achievement is validated by ETAGE
8 A timely birth dose is defined as a dose administered within 24 hours of birth

23Goal 3
• 90% coverage with screening in pregnant women and 95% coverage with post-exposure prophylaxis in infants born to infected mothers for countries that implement screening of pregnant women and post-exposure prophylaxis of newborns; and
• ≤0.5% of hepatitis B surface antigen (HBsAg) prevalence in vaccinated cohorts.
The Regional Office has developed guidelines for validating the achieve-ment of the regional control targets. These guidelines were developed with the guidance of an ETAGE working group, which will also be responsible for reviewing the country reports to assess progress and validate the achieve-ment of targets. However, due to the time required for Member States to conduct sero-surveys, test the sera, analyse and report the data and sub-sequently for the ETAGE working group to complete the formal validation of achievement of the targets in 53 Member States and at regional level, this process will likely not be completed by the target year of 2020.
This report summarizes available data from 2014 to 2017 on the indicators related to status of hepatitis B vaccination; prevention of mother-to-child transmission; and prevalence of hepatitis B surface antigen. Status of hepatitis B vaccinationHepatitis B vaccination policies vary among the Member States of the Re-gion. Universal hepatitis B immunization is provided by 49 of 53 (92%) Mem-ber States, of which 25 provide universal immunization starting at birth, 21 provide immunization to infants (<12 months of age), but without universal immunization at birth, and three provide vaccination later in childhood or adolescence. Four northern European Member States, where endemicity is very low (Denmark, Finland, Iceland and Sweden), do not provide universal childhood or adolescent vaccination, but rely on selective immunization of newborns of hepatitis B carrier mothers and of “high risk” groups. In Swe-den, hepatitis B vaccine is available free of charge for all infants.
49MEMBER STATES PROVIDE
UNIVERSAL HEPATITIS B
IMMUNIZATION
25MEMBER STATES PROVIDE
HEPATITIS B VACCINE FOR
NEWBORNS
24 EVAP midterm report
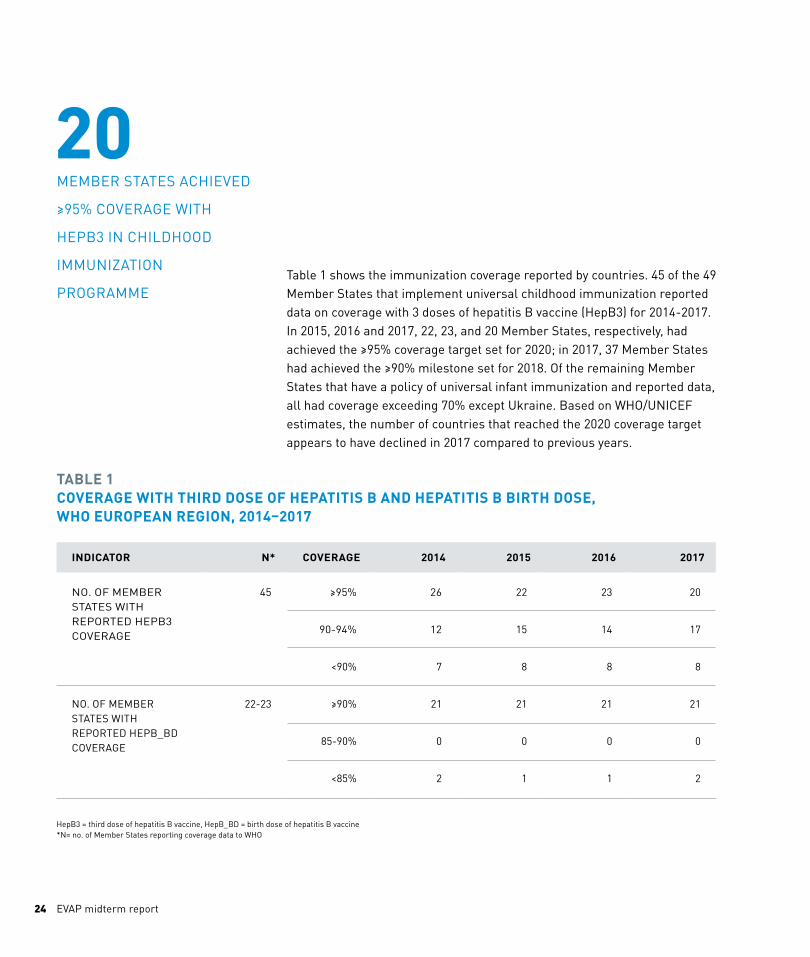
Table 1 shows the immunization coverage reported by countries. 45 of the 49 Member States that implement universal childhood immunization reported data on coverage with 3 doses of hepatitis B vaccine (HepB3) for 2014-2017. In 2015, 2016 and 2017, 22, 23, and 20 Member States, respectively, had achieved the ≥95% coverage target set for 2020; in 2017, 37 Member States had achieved the ≥90% milestone set for 2018. Of the remaining Member States that have a policy of universal infant immunization and reported data, all had coverage exceeding 70% except Ukraine. Based on WHO/UNICEF estimates, the number of countries that reached the 2020 coverage target appears to have declined in 2017 compared to previous years.
INDICATOR N* COVERAGE 2014 2015 2016 2017
NO. OF MEMBER STATES WITH REPORTED HEPB3 COVERAGE
45 ≥95% 26 22 23 20
90-94% 12 15 14 17
<90% 7 8 8 8
NO. OF MEMBER STATES WITH REPORTED HEPB_BD COVERAGE
22-23 ≥90% 21 21 21 21
85-90% 0 0 0 0
<85% 2 1 1 2
TABLE 1 COVERAGE WITH THIRD DOSE OF HEPATITIS B AND HEPATITIS B BIRTH DOSE, WHO EUROPEAN REGION, 2014–2017
HepB3 = third dose of hepatitis B vaccine, HepB_BD = birth dose of hepatitis B vaccine*N= no. of Member States reporting coverage data to WHO
20MEMBER STATES ACHIEVED
≥95% COVERAGE WITH
HEPB3 IN CHILDHOOD
IMMUNIZATION
PROGRAMME

In the period 2014–2017, up to 23 Member States have reported coverage for the hepatitis birth dose (HepB_BD). In 2017, 21 (of 23 Member States with coverage estimates) had coverage reaching the target of ≥90%. Avail-ability of data on the proportion of infants who received a timely birth dose is suboptimal and will require closer monitoring in future.
Prevention of mother-to-child transmissionOf the 25 Member States in the Region that provide universal newborn vaccination, 14 also screen pregnant women and provide post-exposure prophylaxis to infants born to mothers who are positive for HBsAg. The remaining 28 Member States do not provide universal newborn vaccina-tion, but screen pregnant women and provide post-exposure prophylaxis to infants born to HBsAg positive women. Currently data on the coverage of screening of pregnant women and prophylaxis to exposed infants are not routinely reported to WHO. Member States will be requested to present data from routine reports or special studies as part of the validation process by the ETAGE working group. Data from recent studies reported in the pub-lished literature indicate that high coverage can be achieved, though close monitoring is also required to ensure completion of the vaccination sched-ule and follow up testing [22-25].
HBsAg prevalenceThe prevalence of HBsAg in cohorts born after the implementation of uni-versal immunization or of universal screening and post-exposure prophy-laxis will be a critical measure for validating the achievement of the hepa-titis B control goal. Member States will be requested to collect and report seroprevalence data as part of the validation process. Systematic reviews of available data from the Region indicate that nationally representative good-quality seroprevalence data are limited. A systematic review conducted by ECDC was only able to identify studies from 13 countries with low probability of bias [26]. Another review of data from non-EU countries in the Region
BOX 2 TAJIKISTAN – COUNTRY EXPERIENCE
Tajikistan was considered to be a highly
endemic area for hepatitis B virus (HBV)
in the pre-vaccine era. The country
introduced universal hepatitis B vac-
cination in 2002 and has reported ≥80%
coverage with three doses of hepatitis B
vaccine (HepB3) since 2004. To measure
the impact of vaccination introduction,
residual serum specimens from a 2010
national serosurvey using a stratified
multi-stage cluster sampling of all
residents of the country were tested for
the prevalence of HBsAg. A total of 2188
samples were tested. Prevalence of HB-
sAg among cohorts with HepB3 cover-
age ≥80% was 0.4% (0.1-1.3%) whereas
prevalence among cohorts born before
the implementation of universal vac-
cination and unvaccinated adults was
3.5% and 6.8%, respectively.
Through the systematic collection and
analysis of serological data the country
was able to document the substantial
impact of hepatitis B vaccination [28].
Goal 3 25

26 EVAP midterm report
could only identify 21 studies from 7 countries, of which only 4 had national or multi-site data from the general population [27].
Going forward, data from well-designed serosurveys will be requested to document the impact of vaccination and achievement of the hepatitis B control goal and targets. WHO has published guidelines for designing and conducting serosurveys to measure the impact of hepatitis B vaccination [26,27].

GOAL 3 CONCLUSION
While a goal for the control of hepatitis B infection through vacci-nation was established in the EVAP, the indicators and targets for monitoring this goal were only recently established. Validation of achievement of the targets will be conducted by an ETAGE work-ing group. Member States in the Region use different strategies for hepatitis B control, as appropriate to their situation. Vaccina-tion coverage in Member States implementing universal immu-nization of infants is generally high, with a few exceptions. Data on coverage with universal screening of pregnant women and provision of post-exposure prophylaxis to infants is not available from all Member States implementing this strategy, but will be requested as part of the validation process as will data on sero-prevalence of HBsAg in cohorts born after the implementation of universal vaccination and/or universal screening of pregnant women and post-exposure prophylaxis to infants born to HBsAg positive women. Considering the already low regional prevalence of HBsAg carriage and the high coverage with vaccination and/or screening, this goal could be well within reach in the Region.
Goal 3 27

28 EVAP midterm report
Meet regional vaccination coverage targets at all administrative levels
High and equitable coverage with vaccination is critical for achieving and sustaining vaccine-preventable disease eradication, elimination and control goals and embodies the principles of equity and empowerment underlying the SDGs. While high and equitable coverage with all vaccines in the nation-al programme and across the life-course is important, coverage with three doses of DTP-containing vaccines (DTP3) is used here as a proxy measure for immunization coverage in general.
Availability and limitations of coverage dataNational immunization coverage data for 2017 were reported by 53 Member States in the Region. These included coverage from their administrative data systems, their official estimate of national coverage9, or both.
The WHO/UNICEF estimates of national immunization coverage (WUENIC) are based on data reported by Member States and adjusted for potential biases, taking expert opinion into consideration [29]. For the years when Member States do not report data, estimates are derived by extrapolating from available reported data.
Since 2011, the WUENIC for each country is accompanied by a “grade of confidence” (GoC), which reflects the degree of empirical support for the WUENIC and is not a judgment of the quality of data reported by national authorities [29]. Each estimate is given a score of 1 to 3, with 3 representing the highest degree of confidence. The 2016 WUENIC estimates for 13 Mem-ber States received a GoC of 1,10 39 received a score of 2, and 1 (Kazakhstan)
GOAL 4
Target: By 2020, 48 of 53 (90%) of Member States with ≥95% DTP3 at national level
9 The official estimate may represent an estimate of coverage from sources other than the administrative data systems (e.g. coverage surveys or estimates derived from coverage at school entry) or when adjustments are made to administrative coverage based on other sources of data or to accommodate doses not captured in the administrative systems, e.g. doses delivered outside the government system. 10 Albania, Azerbaijan, Germany, Hungary, Italy, Latvia, Monaco, Malta, Poland, Portugal, Serbia, Sweden and Switzerland.
29Goal 4
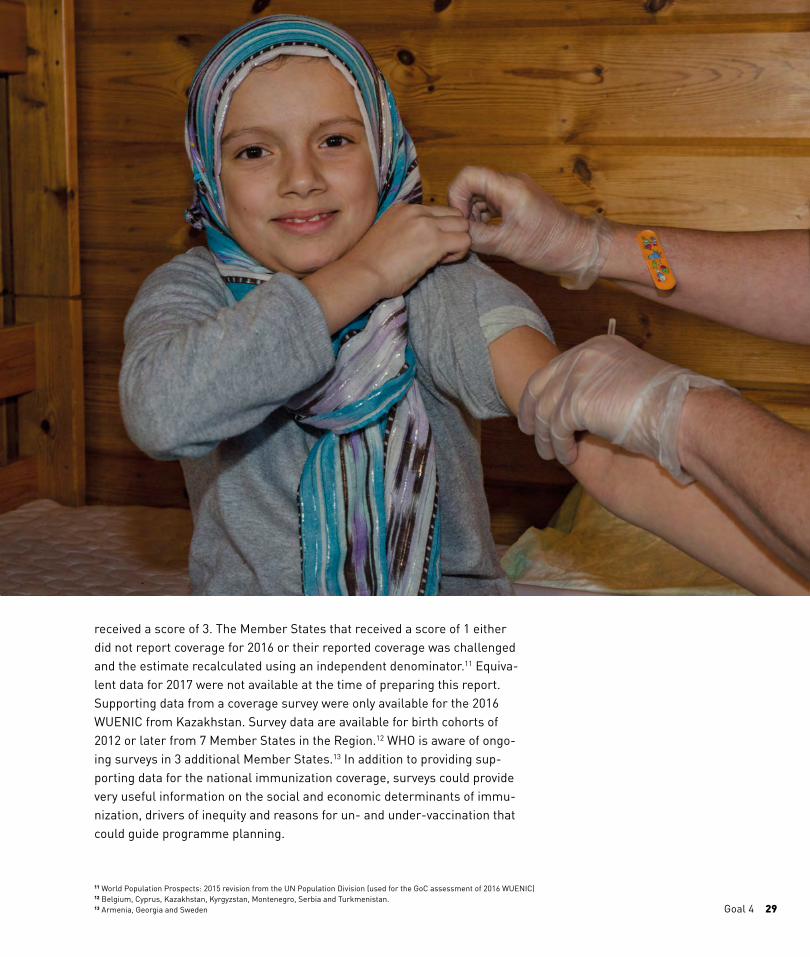
received a score of 3. The Member States that received a score of 1 either did not report coverage for 2016 or their reported coverage was challenged and the estimate recalculated using an independent denominator.11 Equiva-lent data for 2017 were not available at the time of preparing this report. Supporting data from a coverage survey were only available for the 2016 WUENIC from Kazakhstan. Survey data are available for birth cohorts of 2012 or later from 7 Member States in the Region.12 WHO is aware of ongo-ing surveys in 3 additional Member States.13 In addition to providing sup-porting data for the national immunization coverage, surveys could provide very useful information on the social and economic determinants of immu-nization, drivers of inequity and reasons for un- and under-vaccination that could guide programme planning.
11 World Population Prospects: 2015 revision from the UN Population Division (used for the GoC assessment of 2016 WUENIC)12 Belgium, Cyprus, Kazakhstan, Kyrgyzstan, Montenegro, Serbia and Turkmenistan.13 Armenia, Georgia and Sweden

30 EVAP midterm report
All Member States in the Region are required to submit data through the JRF on the number of districts (or equivalent administrative units, but here-after referred to as districts) with DTP3 coverage within specified ranges. Seventeen Member States which submitted the JRF did not provide data for districts with coverage within a specific range (Andorra, Malta, Monaco and San Marino are excluded because there is only one administrative level in the country); 32 Member States provided the number of districts with cover-age within a specific range.
Progress towards the targetFor 2017, 32 Member States show DTP3 coverage ≥95% (Fig. 6) at national level; this represents a decline from 2014 when 36 Member States had achieved this coverage. This change is also reflected in an increase in the number of Member States where coverage is <90%, including two that had coverage <80%. Similar trends are also noted for other vaccine doses, namely the 3rd dose of polio vaccine and the first dose of measles-contain-ing vaccine.
Nine Member States had drop-out rates ≥5% (range 6% to 23%) between DTP1 and DTP3; 3 of which could achieve DTP3 coverage >90% by taking measures to reduce drop-out.14
Vaccination trendsFive Member States showed considerable decline in DTP3 coverage in one or more years from 2014 to 2016 (Fig. 7). Of the Member States which showed decline in previous years, Kazakhstan and Ukraine reported a sub-stantial increase in coverage in 2017 compared to 2016. (Fig. 7). In addition, Bulgaria, Denmark, Latvia, Israel and Norway registered an increase in cov-erage of around 4-6% in 2017 from the 2014 base level. In 2017, the regional DTP3 coverage was 94%, which is 2% more than in 2016 and 1% higher than the 2014 base level.
NUMBER OF MEMBER STATES
WITH ≥95% DTP3 COVERAGE
DECREASED FROM
36
IN 2017 TO
32 IN 2014
221 000MORE CHILDREN RECEIVED
DTP3 IN 2017 THAN IN 2016
14 Croatia, Georgia and the former Yugoslav Republic of Macedonia

31Goal 4
FIG. 6 DTP3 COVERAGE IN THE WHO EUROPEAN REGION, 2014-2017
2017
2016
2015
2014
0 10 20 30 40 50
Number of Member States (n=53)
Regional average (%)
≥95%
90-94%
<90%
Regional coverage
Data source: WHO/UNICEF coverage estimates as of 11 July 2018
94
93
93
92

32
FIG. 7MEMBER STATES SHOWING DECLINE IN COVERAGE BETWEEN 2014 AND 2016, AND THE STATUS IN 2017, WHO EUROPEAN REGION
AUSTRIA
DTP3 coverage (%)
2014 2015 2016 2017
100
80
60
40
20
0
BOSNIA AND HERZEGOVINA
DTP3 coverage (%)
2014 2015 2016 2017
100
80
60
40
20
0
EVAP midterm report

Source: WHO/UNICEF coverage estimates as of 11 July 2018
UKRAINE
DTP3 coverage (%)
2014 2015 2016 2017
100
80
60
40
20
0
FINLAND
DTP3 coverage (%)
2014 2015 2016 2017
100
80
60
40
20
0
KAZAKHSTAN
DTP3 coverage (%)
2014 2015 2016 2017
100
80
60
40
20
0
Goal 4 33

34 EVAP midterm report
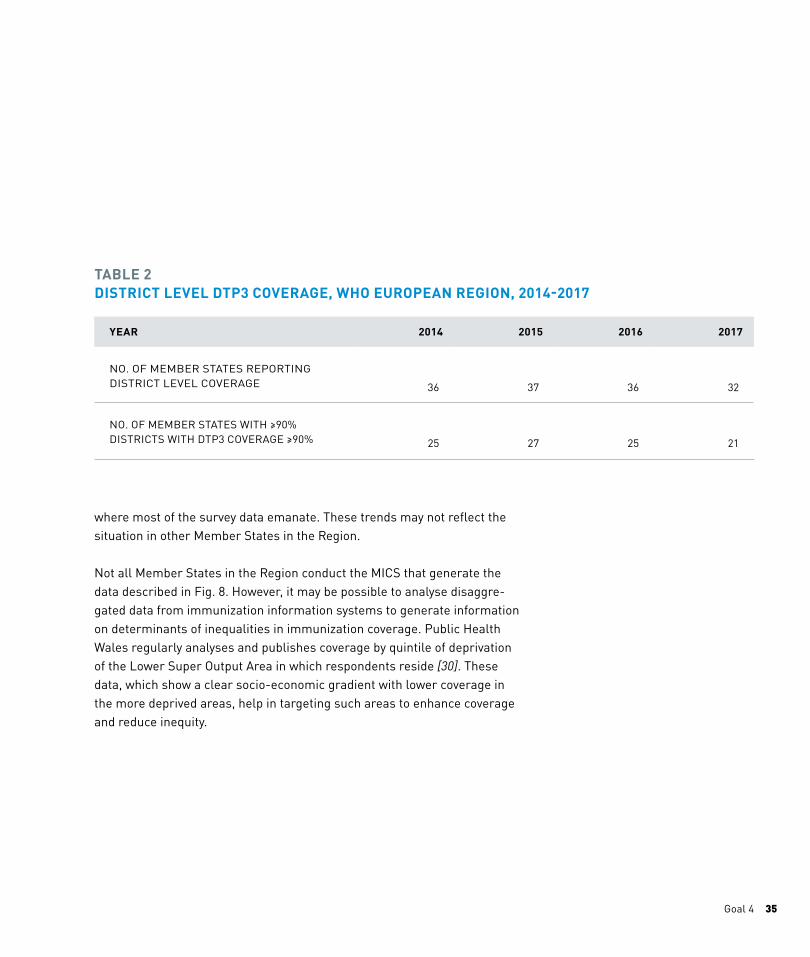
Geographic and socioeconomic inequitiesObjective 3 of the EVAP calls for the benefits of vaccination to be equitably extended to all people through tailored, innovative strategies. The target for this objective is that ≥90% of districts (or equivalent administrative units) achieve ≥90% DTP3 coverage. Not all Member States in the Region report coverage at the district level. The number of Member States that report such coverage and the number that report ≥90% of districts achieving ≥90% DTP3 coverage is shown in Table 2. In 2017, of the 32 Member States that reported district coverage, 53 districts in 10 countries had coverage <80%, including one district with coverage <50%.
Data on health and vaccination inequities between wealth quintiles are col-lected through standardized surveys such as demographic and health sur-veys (DHS) supported by the United States Agency for International Develop-ment (USAID)15 and the multiple indicator cluster surveys (MICS) supported by United Nations Children’s Fund (UNICEF).16 These surveys are generally conducted in low- and middle-income countries. The difference in cover-age between the richest and poorest quintile is often used as an indicator of socio-economic inequity. The DTP3 coverage by wealth quintile from 12 Member States in the Region that have data from surveys conducted in 2010 or later are shown in Fig. 8.
The available survey data showed no consistent pattern of coverage by wealth quintile across all countries. Where patterns in individual countries were apparent (Republic of Moldova and Serbia), they show higher coverage in the lower wealth quintiles compared to the higher wealth quintiles. The reasons for lower coverage in socially advantaged groups in a few countries merits further investigation. The patterns also indicate that the socio-economic gradients that determine access to health care in general may not apply to immunization service access and utilization in some Member States in the Region, especially those in Eastern Europe and Central Asia from
15 The DHS Progam: Demographic and Health Surveys. https://dhsprogram.com/Who-We-Are/About-Us.cfm16 UNICEF multiple indicator cluster surveys (MICS) - http://mics.unicef.org/
Goal 4 35
where most of the survey data emanate. These trends may not reflect the situation in other Member States in the Region.
Not all Member States in the Region conduct the MICS that generate the data described in Fig. 8. However, it may be possible to analyse disaggre-gated data from immunization information systems to generate information on determinants of inequalities in immunization coverage. Public Health Wales regularly analyses and publishes coverage by quintile of deprivation of the Lower Super Output Area in which respondents reside [30]. These data, which show a clear socio-economic gradient with lower coverage in the more deprived areas, help in targeting such areas to enhance coverage and reduce inequity.
YEAR 2014 2015 2016 2017
NO. OF MEMBER STATES REPORTING DISTRICT LEVEL COVERAGE 36 37 36 32
NO. OF MEMBER STATES WITH ≥90% DISTRICTS WITH DTP3 COVERAGE ≥90% 25 27 25 21
TABLE 2 DISTRICT LEVEL DTP3 COVERAGE, WHO EUROPEAN REGION, 2014-2017

36

Quintile 1 = poorest
Quintile 2
Quintile 3
Quintile 4
Quintile 5 = richest
Data source: WHO/UNICEF coverage estimates as of 11 July 2018 and World Bank Income level as of June 2017
Goal 4 37
FIG. 8DTP3 COVERAGE BY WEALTH QUINTILE IN MEMBER STATES WITH DHS/MICS SURVEYS CONDUCTED IN OR AFTER 2010, WHO EUROPEAN REGION
ARMEN
IA
THE FORM
ER YUGOSLAV
REPUB
LIC OF MACED
ONIA
REPUB
LIC OF MOLD
OVA
MON
TENEGRO
SERBIA
UKRAIN
E
BOSNIA AN
DH
ERZEGOVINA
KYRGYZSTAN
TAJIKISTAN
TURKM
ENISTAN
KAZAKHSTAN
100
80
60
40
20
0
COVERAGE %

38 EVAP midterm report
Understanding the root causes of low coverageThe root causes for persistent low or declining coverage at the national level in some Member States and for inequities in coverage are contextual and vary between and within Member States and over time. A comprehen-sive understanding of the root causes requires an in-depth assessment of health system shortfalls as well as community demand for vaccination. The available information consulted for this report does not allow for a detailed country-by-country analysis, but it does provide some insights into two of the causes.
Vaccine demandThe decline in vaccination coverage seen in several countries and conse-quently in the Region as a whole has been attributed, in part, to vaccine hesitancy or concerns related to a specific vaccine. For example, Member States in the southeastern parts of the Region have seen declines especially for the measles-mumps-rubella vaccine (MMR), while Denmark and Ireland experienced a sharp decline in coverage for human papilomavirus (HPV) vaccine. The latter was the result of increased reports of diffuse unex-plained symptoms reported by vaccinated girls, their relatives and health professionals that caught media attention and raised concerns about the safety of the vaccines. In January 2016, the Global Advisory Committee for Vaccine Safety concluded based on a thorough review of evidence that there was no evidence to support any serious safety concerns related to the use of HPV vaccines.
Even in countries with sustained high vaccination coverage at national level, pockets of low coverage exist, sometimes resulting in outbreaks of vaccine-preventable diseases. The reasons behind low uptake in certain communi-ties are often not sufficiently explored. The evaluation report of the Tailoring Immunization Program (TIP) approach provides examples from Bulgaria, Lithuania, Sweden and the United Kingdom of Great Britain and Northern

BOX 3 IMPROVING IMMUNIZA-TION COVERAGE AMONG THE CHAREDI JEWISH COMMUNITY IN NORTH LONDON
In an attempt to better understand
reasons for suboptimal coverage of
children’s immunizations within an
ultra-orthodox Jewish community in
North London, Public Health England
(PHE) in partnership with the communi-
ty, immunization service commissioners
and health providers conducted a WHO
Tailoring Immunization Programmes
(TIP) project during 2014–2016. The
project aimed to provide evidence-in-
formed recommendations to immuniza-
tion commissioners and providers to
enable services to be better tailored to
the needs of the community. Engage-
ment with the community and the quali-
tative research showed that, contrary
to the preconceived assumption, there
was no religious or other resistance
to vaccination in the community. Most
issues leading to low vaccination uptake
were related to the large family sizes in
this community. Competing pressures
on these families made it challenging
to prioritize immunization, especially
when it was difficult to secure an ap-
pointment and waiting times were long
in facilities that were not child-friendly.
(continues page 41)
Goal 4 39
Ireland that illustrate the many reasons that lead to low uptake of vaccines, including those that relate to convenience of vaccination services, legisla-tion, education of and support to family doctors and community and peer support.
Achieving and sustaining the high and more equitable vaccination coverage needed for disease eradication, elimination and control depend on commu-nities maintaining high demand for vaccination and trust even in the face of reports or rumours about adverse events.
The complex and wide-ranging issues that lead to vaccine hesitancy and decreasing demand require a multi-dimensional response, based on a good understanding of both the community and health provider perspectives. The TIP guide provides a framework to identify and prioritize the underserved populations, diagnose the demand and supply-side barriers to immunization and to design, implement and evaluate a tailored response [31]. Experience with implementing this approach has shown that the findings of formative research may challenge preconceived notions about the reasons for low vaccination uptake (see Box 3), make services more responsive to com-munity needs and enhance the engagement of community representatives, making them strong advocates for immunization with the community [32]. The reasons for low uptake may also vary between different communities in the same country, as was the case in Sweden [33].
The Regional Office works with Member States to sustain demand and con-fidence in vaccination through the provision of guidance documents, sup-port for the conduct of formative research, training on responding to vocal vaccine deniers, preparing for and responding to crisis in confidence, and identifying and tailoring immunization programme interventions to address identified challenges. The guidance documents are available on the WHO website [34-36].


Vaccine supply shortages and stock outIn 2017, 20 Member States reported 49 events of vaccine stockouts either at the national or subnational level. Thirty-two of the 49 events resulted in stockouts at the subnational level. In all except two events where the dura-tion of the stockout was reported, it was ≥1 month (range 1 to >12 months) and vaccination was interrupted in 27 such events. In 12 Member States, the stockout affected more than one vaccine (range 2 to 5 vaccines), including combination vaccines17. The vaccines most commonly affected were DTP-containing combinations and hepatitis B vaccine (stockouts were reported in 10 Member States for each of these vaccines). Of the 5 Member States18 where the stockout of DTP-containing combination vaccines led to interrup-tion in delivery of the vaccines, 2 Member States (Bosnia and Herzegovina, and Romania) also experienced a drop in DTP3 coverage ≥5% in 2017 com-pared to 2014 levels. In Romania, which experienced a vaccine stockout last-ing 5 to 6 months as a result of procurement delays, DTP3 coverage in 2017 was 82% compared to 89% in 2015 and 2016 and 94% in 2014. In contrast, Kazakhstan and Ukraine, which experienced stockouts of DTP-containing vaccines and interruption of services in 2016 but not in 2017, DTP3 coverage increased from 82% and 19%, respectively in 2016 to 99% and 50%, respec-tively, in 2017.
The reasons reported for the 49 stockout events were vaccine supply short-age (in 26 cases), procurement delays (in 14 cases) and other or unknown reasons (in 9 cases). In 2016, the Bacille Calmette-Guerin vaccine against tuberculosis (BCG) was among the most commonly affected vaccines. Recent analyses performed by WHO identified some root causes for those sup-ply shortages. Several BCG manufacturers with product licensed in Europe experienced production issues and left the market19. While the global supply remained higher than demand, local registration constraints – countries with only one product registered – resulted in shortages and need for emergency issuance of import licenses to procure products not registered in the country.
BOX 3 CONTINUED
The findings from this assessment led
to a series of recommendations to en-
sure that the service providers are able
to meet the needs of the community.
However, it is well recognized that
implementing the recommendations
will be a long-term process to ensure
sustainable health behaviour change
through understanding the needs of the
intended beneficiaries.
17 Shortages were reported for BCG, PCV, Hepatitis B containing vaccines, Hib containing vaccines, DTP combinations, OPV, Tetanus Toxoid, measles containing vaccines, IPV, HPV, and rotavirus18 Austria, Estonia, Iceland, Kazakhstan, Romania and Ukraine19 Sanofi interrupted production in 2012, Staten Serum Institute interrupted production in 2015, was sold to AJ Biologics in 2017 and has not yet re-started production Goal 4 41

42 EVAP midterm report
For DTP-containing vaccines, recent restructuring of the manufacturing base resulting from acquisitions20 and the corporate decisions21 to concen-trate paediatric vaccine production on selected acellular-pertussis combi-nations led to a reduction in capacity for hepatitis B vaccine that affected specific countries irrespective of the unconstrained global supply situation. As was the case with BCG, reliance on a very limited number of registered products resulted in shortages when some of those products encountered production issues or reduction in available supply.
20 GSK acquired Novartis Vaccines & Diagnostics in 2015, the latter being a major source of supply for DTP-containing vaccines21 Both GSK and Sanofi-Pasteur have recently announced their rationalisation of the product portfolio
20 MEMBER STATES
REPORTED
49
STOCKOUT EVENTS IN 2017
DTP3 COVERAGE IN
UKRAINE INCREASED FROM
19%
IN 2016 TO
50%
IN 2017
GOAL 4 CONCLUSION
Achieving and maintaining high and equitable coverage underlies the achievement and maintenance of all the vaccine-preventable disease eradication, elimination and control goals. There has been a decline in the number of Member States with DTP3 coverage ≥95% since 2015. Consequently, there is concern about achieving the 2020 target. Data to monitor equity is only being reported to WHO by a fraction of Member States (26/53 in 2017) and the achievement of the target of ≥90% coverage in ≥90% districts could only be documented in 14 in 2017. Analysis of dis-aggregated data and periodic surveys and special studies will be required to monitor inequity and take measures to address them. The Regional Office is in the process of developing a guidance document to assist Member States with monitoring and address-ing inequity. Available data show that vaccine hesitancy has led to declining coverage of some vaccines at the national level in a few Member States and contributes to inequitable coverage. Further in-depth research and analyses of data at the country level would provide further insights into the root causes. Application of the TIP approach facilitates a better understanding of the reasons for low uptake and the design of tailored approaches to address bar-riers to vaccination. Evidence also indicates that vaccine stock-outs contribute to a low or declining coverage in some Member States. The reasons for stockouts vary between countries but all require remedial actions.
Goal 4 43

44 EVAP midterm report
Make evidence-based decisions about introduction of new vaccines
Evidence-informed decision-making through the advice of a competent and credible national immunization technical advisory group (NITAG) is a key factor for the introduction of new vaccines and for their sustained and optimal use. WHO recommends that NITAGs take the following issues into consideration when making recommendations on the introduction of a vac-cine: (1) the disease, including its burden, public health or political prior-ity, and the availability of other prevention and control measures; (2) the vaccine, including its efficacy and safety, economic and financial issues and supply availability; and (3) the strength of the immunization programme and health system to accommodate the vaccine.
The Region has made substantial progress in establishing NITAGs and in strengthening their capacities. As of December 2017, 47 of the 53 Member States in the Region had established NITAGs including 17 of the 21 middle-income countries (MICs). At the time of writing this report, the Russian Fed-eration is in the process of establishing a NITAG. In 2017, based on available data, 35 of the 47 NITAGs met all six process indicators for functionality of their NITAGs.
Member States report annually on whether their NITAGs made a recom-mendation for or against introduction of three vaccines, namely pneumo-coccal conjugate vaccine (PCV), rotavirus vaccine (RV) or HPV, as per the
GOAL 5
Target: By 2020 at least 48 of 53 (90%) of Member States with a NITAG have made an informed decision on introduction of a new vaccine following review of the relevant evidence by the NITAG
42NITAGS MADE
RECOMMENDATIONS
ON NEW VACCINE
INTRODUCTIONS

Goal 5 45
indicator for this goal. NITAGs in 42 of the 53 Member States in the Region made evidence-informed recommendations related to either PCV, RV and/or HPV (by close of 2017) (Table 3). In some Member States that do not have a NITAG established or in place at the time of a decision, the decisions were made through equivalent technical expert groups.
Not all NITAG recommendations in favour of a vaccine have led to its intro-duction. As of the close of 2017, RV was used only in 19 Member States and HPV in 35 Member States. Where reasons are known, the decision of the immunization programme not to introduce the vaccine despite a positive recommendation was related to affordability of the vaccines and financial sustainability challenges.
PCV RV HPV
NITAG MADE A RECOMMENDATION 41 33 42
NITAG DID NOT MAKE A RECOMMENDATION 4 12 5
NOT APPLICABLE (NO NITAG) 6 6 6
NOT KNOWN 2 1 0
DECISION MADE BEFORE NITAG WAS ESTABLISHED 4 3 2
NO. OF MEMBER STATES THAT INTRODUCED THE VACCINE 41 17 35
TABLE 3 NUMBER OF MEMBER STATES WHOSE NITAGS (OR EQUIVALENT BODIES) MADE EVIDENCE-INFORMED RECOMMENDATIONS RELATED TO PCV, RV OR HPV VACCINES (BY CLOSE OF 2017)


The Regional Office has supported MICs in establishing and strengthening NITAGs. The Regional Office has conducted meetings, mainly targeting MICs with recently established NITAGs, to review their status, discuss challenges and share experiences; facilitated study tours to observe the functioning of well-established NITAGs; and supported participation of the NITAG chairs and secretaries at the meetings of ETAGE and SAGE. The Regional Office conducted evaluations of the NITAGs in Kazakhstan and Kyrgyzstan using a standardized evaluation tool and arranged a visit of representatives of the Joint Committee on Vaccines and Immunization of the United Kingdom to Georgia to evaluate the Georgian NITAG and provide recommendations for its improvement. The evaluations revealed challenges that many of the new NITAGs continue to face, including the process for development of NITAG recommendations, the need to improve the quality of NITAG recommenda-tions and reports, and lack of formalization of communication with national government authorities.
As exemplified by the experience in Kazakhstan (see Box 4), the devel-opment/revision of NITAG charters and standard operating procedures, continuing capacity building of NITAG members and the secretariats as well as improved collaboration among NITAGs through the NITAG Resource Centre and Global NITAG Network will enable full functionality of the newly established NITAGs and enhance their capacity to provide informed and independent advice to the national immunization programmes.
Generating evidence for decision-makingHigh-quality surveillance is required to generate local evidence on the bur-den of disease and to document the impact of vaccines once they are intro-duced. According to the reports submitted in the JRF, 48 Member States in the Region conduct surveillance for invasive vaccine-preventable bacterial diseases (IB-VPD) and 38 conduct surveillance for rotavirus (RV). Of these, 4 Member States participate in the WHO coordinated IB-VPD surveillance net-
BOX 4 EVALUATION OF THE KAZAKHSTAN NITAG
The Kazakhstan NITAG was established
in February 2012. A formal evaluation of
the NITAG was conducted in 2017 using
the standardized WHO/SIVAC tool [37].
The evaluation concluded that Kazakh-
stan NITAG meets the WHO process
indicators for a well-functioning NITAG.
It has a legislative basis and written
Terms of Reference, meets annually,
and the members are informed about a
meeting agenda in advance. Its mem-
bers represent at least five disciplines
and declare potential conflicts of inter-
ests prior to each meeting.
The evaluation recommended revision
of the NITAG’s composition (reassign-
ment of MoH representatives as ex-
officio members and inclusion of rep-
resentatives of medical associations),
formalization of communication with
the MoH, development of annual work
plans, revision of the NITAG Charter
and development of Standard Operating
Procedures for the development of rec-
ommendations, and improved quality of
NITAG reports and recommendations.
The evaluation provided very useful
insights about the limitations of the
NITAG and the measures that could
be taken to enhance its capacity and
functionality. It also helped WHO and
partner agencies in planning support
for NITAG strengthening.
Goal 5 47

48 EVAP midterm report
work and seven in the RV surveillance network and provide case-based data to WHO. These data are regularly summarized and published in the WHO surveillance bulletins [38]. Beginning in January 2017, the RV surveillance network has expanded in 5 Member States to now test specimens for over 20 enteric pathogens, to inform decisions on newer vaccines in the pipeline.Five of the seven MICs in the RV network have introduced the vaccine; two of them have used their sentinel sites to monitor the impact of vaccination and published the results; while two others are in the process of estimating vaccine effectiveness using their surveillance data. These data will be useful for decision-making on sustaining vaccination.
GOAL 5 CONCLUSION
There has been substantial progress in establishing NITAGs in the Region and in enhancing their capacities to provide credible, well-informed recommendations to the national governments based on a thorough review of the available evidence. However, further support from WHO or other partner agencies would be required to further enhance these capacities. WHO supports a network of sentinel sites that conduct surveillance for IB-VPD and RV. While these sites have generated data to support deci-sions on vaccine introduction, surveillance capacity will need to be enhanced to document the impact of vaccines. These data will become important for sustained financing in the face of other competing priorities.
Goal 5 49

50 EVAP midterm report
Achieve financial sustainability of national immunization programmes
The availability of adequate financial resources is critical to achieve and sustain the EVAP goals and vision.
By 2016, 47 Member States had achieved financial self-sufficiency in pro-curing vaccines in their national immunization schedules using domestic funding. Armenia, Azerbaijan and Georgia followed in 2017, as they transi-tioned from donor support. Uzbekistan will be the next country to achieve fi-nancial self-sufficiency by 2020. Only Kyrgyzstan and Tajikistan will continue to receive donor support for procurement of vaccines beyond 2020.
Being self-sufficient to procure the routine vaccines does not necessarily imply that all national programmes receive sufficient financial resources to achieve the EVAP vision and its ambitious targets and sustain these achieve-ments thereafter. The evidence presented in Chapter 7 indicate that sev-eral MICs in the Region that do not benefit from donor support are lagging behind and are at risk of not achieving the EVAP targets. There are also concerns about the sustainability of immunization programmes in Member States that have recently lost or will soon lose donor support.
Availability and limitations of dataFinancial sustainability includes secured long-term domestic funding to meet programme objectives and efficient use of available resources. Mem-ber States report annual expenditures on vaccines in the JRF. To help un-derstand long-term financial sustainability and assess efficiency in the use of available resources, these data were triangulated with data from other
GOAL 6
Target: By 2020, at least 51 of 53 (96%) of Member States are financially self-sufficient for procuring routine vaccines
MEMBER STATES
ARE FINANCIALLY
SELF-SUFFICIENT IN
PROCURING VACCINES
50

Goal 6 51
sources, including data from national procurement websites, financial re-ports of pharmaceutical companies and data obtained through direct com-munications with the Member States to generate best estimates on vaccine expenditures on vaccines included in the national immunization schedules for the years 2014 to 2016. The prices were converted to US dollars, applying the mid-year exchange rate for each year.
Since vaccine prices and delivery costs differ from one country to another, especially between those in different income brackets, it is difficult to make relevant comparisons across countries. As shown in Table 4, the average vaccine expenditure per live birth varies considerably between countries in the three income brackets, with the lowest costs in the low-middle income countries that have benefited from donor support since 2017. Vaccine expenditures are expected to fluctuate between years as vaccine prices change over time and new vaccines are added to the programme.

52 EVAP midterm report
Expenditures on vaccinesThe average vaccine expenditures per live birth in the Member States in the Region, stratified by income level and access to donor support, are pre-sented in Table 4. As expected, the highest expenditures are in high-income countries (HICs), and the lowest in MICs that benefit from vaccines at subsi-dized prices through Gavi support.
Data on vaccine expenditures were available from 12 of the 32 HICs for 2014 and 2015, and from 11 HICs for 2016. Data were available from 8, 10 and 13 of 14 MICs without access to donor support for 2014, 2015 and 2016, respec-tively. Data were available from all 7 MICs with donor support for each of the 3 years.
Available data from the WHO Global Health Expenditure Database for 2014 and 2015 [39] were also analysed to assess government expenditures on health as a proportion of the national per capita GDP and the total national government expenditures. The results stratified by country income catego-ries are shown in Table 5.
INCOME CATEGORY
AVERAGE VACCINE EXPENDITURES PER LIVE BIRTH (CURRENT US $)
2014 2015 2016
HIC 348.51 299.36 386.03
MIC (no donor support) 132.08 101.26 137.45
MIC (donor support) 38.62 37.62 38.53
TABLE 4 AVERAGE VACCINE EXPENDITURES PER LIVE BIRTH, 2014-2016

Goal 6 53
INCOME CATEGORY
AVERAGE DOMESTIC GOVT. HEALTH EXPENDITURE AS % OF PER CAPITA GDP
AVERAGE DOMESTIC GOVT. HEALTH EXPENDITURES AS % OF TOTAL GOVT.
EXPENDITURES
2014 2015 2014 2015
HIC 6 6 14 14
MIC (no donor support) 4 4 11 10
MIC (donor support) 3 3 8 8
INCOMECATEGORY
HIC(N=12)
MIC WITHOUT DONOR SUPPORT (N=10)
MIC WITHOUT DONOR SUPPORT (N=7)
AVERAGE 0.22% 0.72% 1.10%
RANGE 0.01 to 0.71% 0.12 to 2.48% 0.47 to 2.17%
TABLE 5 AVERAGE DOMESTIC GOVERNMENT HEALTH EXPENDITURES AS A PERCENTAGE OF PER CAPITA GDP AND OF TOTAL GOVERNMENT EXPENDITURES, 2014 AND 2015
TABLE 6 NE EXPENDITURES AS A PROPORTION OF CURRENT HEALTH EXPENDITURES THROUGH GOVERNMENT SCHEMES AND COMPULSORY CONTRIBUTIONS TO HEALTH CARE, 2015

54 EVAP midterm report
On average the lower-income countries spend a lower proportion of their GDP and their total government expenditures on their national health pro-grammes.
Vaccine expenditures as proportion of current health expenditures through government schemes and compulsory contributions to health care (hereaf-ter referred to as current health expenditures)22 were calculated for the year 2015 for 29 Member States in the Region for whom data were available. The results are presented in Table 6.
Though vaccine expenditures form a larger proportion of current health expenditures in MIC compared to HIC, the range is quite wide with vaccine expenditures forming less than 0.25% of the current health expenditures in 5 MICs without donor support, compared to 2.48% in Turkey in the same income category but where immunization is accorded high priority. Of the 5 Member States that have not introduced either PCV, RV or HPV (see Table 5), in three23 vaccine expenditures constitute <0.25% of current health expen-ditures. Data to calculate this figure were not available from the remaining two.
22 Current health expenditures through government schemes and compulsory contributions to health care is an indicator in the Global Health Expenditure Database23 Belarus, Bosnia and Herzegovina and Romania

GOAL 6 CONCLUSION
The Member States of the Region are on track to achieve fi-nancial self-sufficiency for procuring routine vaccines by 2020. However, concerns remain about the current funding mecha-nisms in some of the MICs to adequately finance their immuniza-tion programmes to achieve the EVAP vision and goals, including but not limited to the introduction of new vaccines. On average these countries spend a lower proportion of their GDP and total government expenditures on health as compared to high-income countries. In addition, some MICs that are lagging behind (see Chapter 7) spend a relatively low proportion of their current health expenditures on procuring vaccines, indicating that there may be fiscal space to increase their spending on immunization and accelerate progress towards achieving EVAP goals. In addi-tion, these countries could access vaccines at optimum prices by improving their procurement systems.
Goal 6 55

56 EVAP midterm report
Middle-income countries falling behind: a landscape analysis
BackgroundThere is increasing concern that MICs that do not benefit from external support may face difficulties in achieving and sustaining the ambitious EVAP goals and targets for vaccine-preventable disease control and may be missing out on opportunities to benefit from new life-saving vaccines. The concern is partly fuelled by the realization that the majority of vaccine-preventable deaths globally are now in MICs [40].
The Region has 21 MICs24 that together account for 46% of its population and 54% of the birth cohort. These include 7 lower-middle-income countries (LMIC)25 that account for 11% of the regional population and 15% of the birth cohort; and 14 upper-middle-income countries (UMIC)26 that account for 35% of the regional population and 39% of the regional birth cohort. All the LMIC were eligible for support from Gavi, the Vaccine Alliance (hereafter referred to as Gavi) though Ukraine has not received direct support from Gavi since 2008. The Region does not have any low-income countries at the time of writing this report.
In this section we examine the progress that Member States, stratified by income categories and Gavi-eligibility, have made with the implementation of the EVAP. Eligibility for Gavi support since 2015 is used as a proxy stratification index for ease of securing external support for immunization in the Region.
Disease elimination and eradicationThe European Region has sustained its polio-free status since 2002. How-ever, over half its Member States were assessed to be at intermediate or high risk for the spread of polio following importation or emergence of a po-liovirus (see Fig. 2). The risk status for Member States stratified by income levels and Gavi-eligibility is shown in Fig. 9. All three Member States that were assessed to be at high risk for spread of poliovirus are MIC that did not benefit from Gavi support.
24 Based on World Bank country classification by income levels: 2017-18; https://blogs.worldbank.org/opendata/new-country-classifications-income-level-2017-201825 Armenia, Georgia, Kyrgyzstan, Republic of Moldova, Tajikistan, Ukraine and Uzbekistan26 Albania, Azerbaijan, Belarus, Bosnia and Herzegovina, Bulgaria, Croatia, Kazakhstan, Montenegro, Romania, Russian Federation, Serbia, the former Yugoslav Republic of Macedonia, Turkey and Turkmenistan
21MICS ACCOUNT FOR 46% OF
THE REGION’S POPULATION
AND 54% OF ITS BIRTH
COHORT
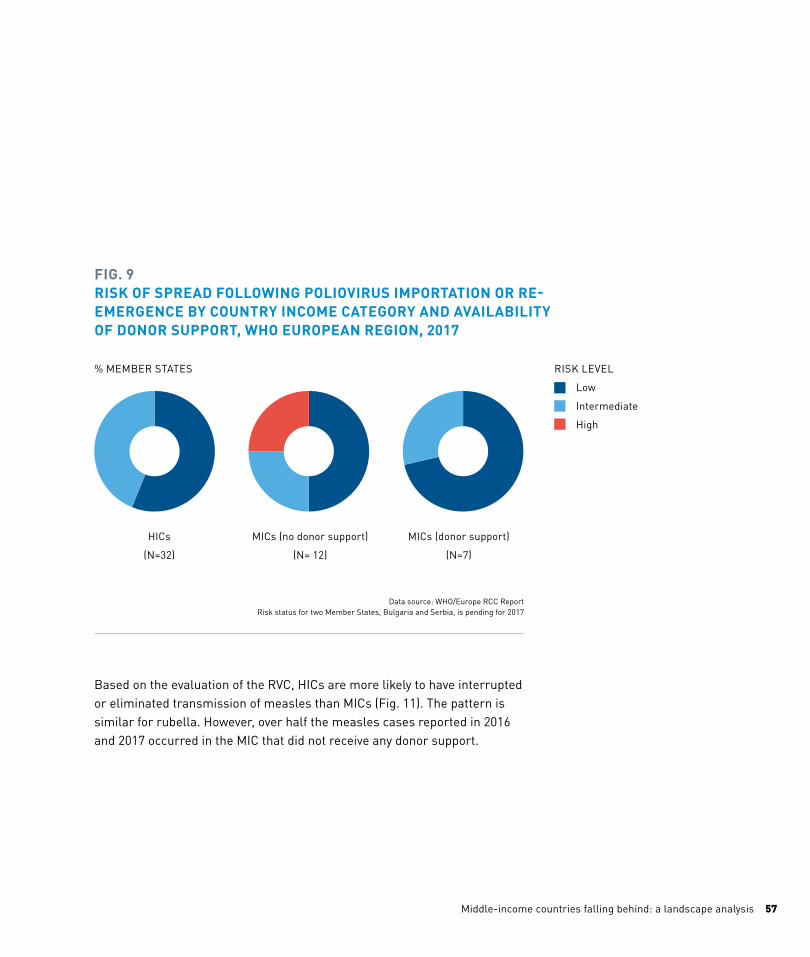
57Middle-income countries falling behind: a landscape analysis
Based on the evaluation of the RVC, HICs are more likely to have interrupted or eliminated transmission of measles than MICs (Fig. 11). The pattern is similar for rubella. However, over half the measles cases reported in 2016 and 2017 occurred in the MIC that did not receive any donor support.
FIG. 9RISK OF SPREAD FOLLOWING POLIOVIRUS IMPORTATION OR RE-EMERGENCE BY COUNTRY INCOME CATEGORY AND AVAILABILITY OF DONOR SUPPORT, WHO EUROPEAN REGION, 2017
Low
Intermediate
High
HICs
(N=32)
MICs (no donor support)
(N= 12)
MICs (donor support)
(N=7)
RISK LEVEL% MEMBER STATES
Data source: WHO/Europe RCC ReportRisk status for two Member States, Bulgaria and Serbia, is pending for 2017

58 EVAP midterm report
FIG. 10 STATUS OF MEASLES AND RUBELLA ELIMINATION, BY COUNTRY INCOME STATUS AND AVAILABILITY OF DONOR SUPPORT, WHO EUROPEAN REGION, 2017
Eliminated
Interrupted
Endemic
Eliminated
Interrupted
Endemic
HICs
(N=32)
MICs (no donor support)
(N= 14)
MICs (donor support)
(N=7)
HICs
(N=32)
MICs (no donor support)
(N= 14)
MICs (donor support)
(N=7)
COUNTRY CATEGORY
MEASLES % COUNTRIES
RUBELLA% COUNTRIES
Source: WHO/Europe RVC Report and World Bank Income level as of June 2017
COUNTRY CATEGORY

59Middle-income countries falling behind: a landscape analysis
FIG. 11 DTP3 AND MCV1 COVERAGE IN MEMBER STATES BY INCOME LEVELS AND AVAILABILITY OF DONOR SUPPORT, WHO EUROPEAN REGION, 2017
≥95%
90-94%
<90%
≥95%
90-94%
<90%
HICs
(N=32)
MICs (no donor support)
(N= 14)
MICs (donor support)
(N=7)
HICs
(N=32)
MICs (no donor support)
(N= 14)
MICs (donor support)
(N=7)
DTP3 COVERAGE% COUNTRIES
MCV1 COVERAGE% COUNTRIES
Data source: WHO/UNICEF coverage estimates and World Bank Income level as of June 2017
CATEGORY
CATEGORY
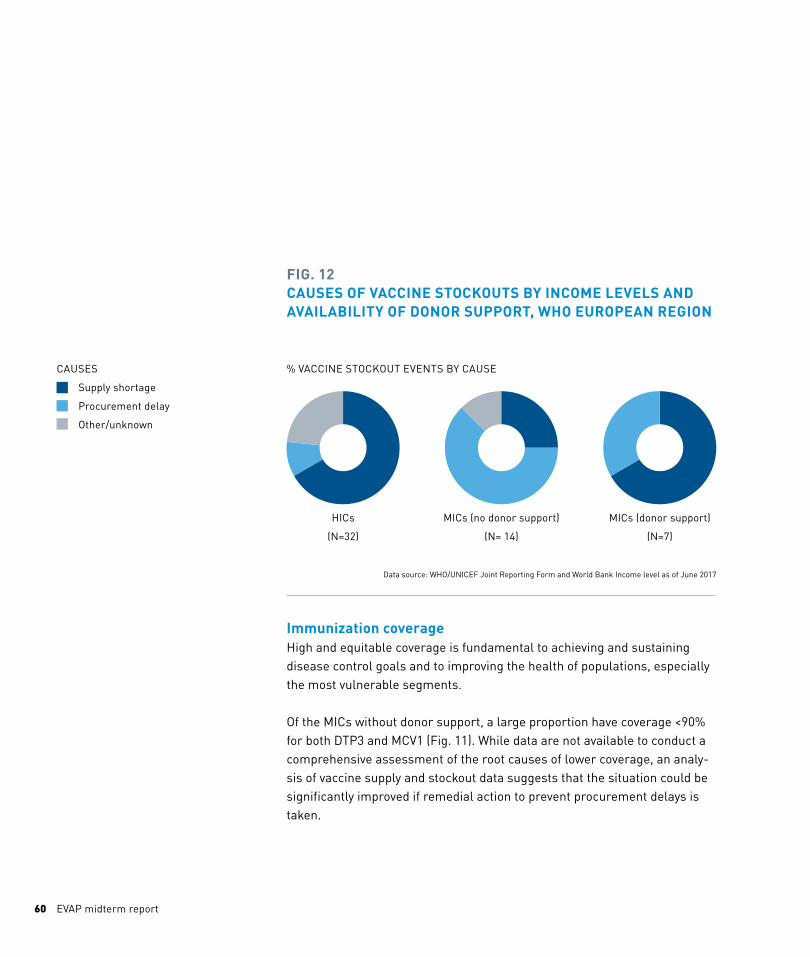
60 EVAP midterm report
Immunization coverageHigh and equitable coverage is fundamental to achieving and sustaining disease control goals and to improving the health of populations, especially the most vulnerable segments.
Of the MICs without donor support, a large proportion have coverage <90% for both DTP3 and MCV1 (Fig. 11). While data are not available to conduct a comprehensive assessment of the root causes of lower coverage, an analy-sis of vaccine supply and stockout data suggests that the situation could be significantly improved if remedial action to prevent procurement delays is taken.
FIG. 12 CAUSES OF VACCINE STOCKOUTS BY INCOME LEVELS AND AVAILABILITY OF DONOR SUPPORT, WHO EUROPEAN REGION
Supply shortage
Procurement delay
Other/unknown
HICs
(N=32)
MICs (no donor support)
(N= 14)
MICs (donor support)
(N=7)
% VACCINE STOCKOUT EVENTS BY CAUSE
Data source: WHO/UNICEF Joint Reporting Form and World Bank Income level as of June 2017
CAUSES


62 EVAP midterm report
INCOME CATEGORY
NUMBER OF VACCINES INTRODUCED BY MEMBER STATES (OF PCV, RV AND HPV)
0 1 2 3
No. of HICs 0 4 15 13
No. of MICs (no Gavi support)
5 9 0 0
No. of MICs (with Gavi support)
0 3 1 3
TABLE 7INTRODUCTION OF NEW VACCINES BY INCOME CATEGORY AND ELIGIBILITY FOR DONOR SUPPORT
The 14 MICs without donor support reported 16 stockout events, 10 of which led to interruption in vaccination. While HICs also experienced vaccine stockouts that led to interruption in services, the causes of stockouts ap-peared to be different in the different income categories (Fig. 12). Procure-ment delays, which could be remedied by improving the efficiency of the procurement process, were more often the cause of vaccine stockouts in MICs without donor support as compared to the other two categories. Introduction of new vaccinesMICs without donor support also lag behind HICs and MICs with donor support in introducing new and underutilized vaccines into their national programmes. Five of the 14 Member States in the first category have not in-troduced either PCV, RV or HPV into their national programmes, whereas all the 32 HICs and the 7 MICs that benefit from donor support have introduced either one or more of these vaccines.

63Middle-income countries falling behind: a landscape analysis
AVERAGE PUCHASE VOLUMES
European Region
Other WHO regions
Vaccines were selected based on sufficient data for analyses – data for single-dose presentations from at least three countries in both European and non-European regions
Data source: V3P Region Fact Sheet. European Region - http://www.who.int/immunization/programmes_systems/procurement/v3p/platform/module2/V3P_Region_Fact_Sheet_EUR.pdf?ua=1
FIG. 13 WEIGHTED AVERAGE PRICES FOR SIX VACCINES (IN SINGLE-DOSE PRESENTATION) IN SELF-PROCURING NON-GAVI MICS IN THE EUROPEAN REGION AND IN OTHER WHO REGIONS, 2016
PCV DTaP-Hib-IPV HPV HepA (ped) MMR Influenza (adult)
DOSES Price (US$)
2 500 000
2 000 000
1 500 000
1 000 000
500 000
0
$20.00
$16.00
$12.00
$8.00
$4.00
$0.00
$19.47
$14.21
$18.05
$11.07
$15.68
$11.54
$9.47
$4.88
$2.56
$4.89
$8.01
$5.63

64 EVAP midterm report
Price is one of the reasons for the slow introduction of new vaccines in MICs. Fig. 13 shows the weighted average price (WAP) of selected vaccines in self-procuring MICs without donor support in the European Region com-pared to similar countries in other regions. The WAP for both PCV and HPV are higher in this Region than in other regions.
There is also a wide range in prices for the same vaccine in the Region, likely influenced by several factors, including the procurement process and the terms and conditions for procuring the vaccine, the choice of product and presentation, and the volumes purchased.
Allocation of domestic resources for procurement of vaccines could be another factor that may be contributing to the slower uptake of new vac-cines in these MICs without donor support. The data presented in Chapter 6 indicates that there is fiscal space available for those Member States lag-ging behind to enhance the financing of immunization programmes to get back on track.
CONCLUSION
The available data shows that MICs without donor support are lagging behind and unless corrective measures are taken the decline or stagnation in their performance could pose a threat to their national progress and the regional achievement of EVAP goals and targets. MICs in the Region seem to be paying a higher price for procuring vaccines, though the causes for the higher prices need further investigation. Several MICs are allocating a smaller percentage of their health expenditures for immuniza-tion than their peers even though the return on investments in immunization is higher than in many other health programmes.
Middle-income countries falling behind: a landscape analysis 65


67References
References
1. European Vaccine Action Plan (2015-2020). http://www.euro.who.int/__data/assets/pdf_file/
0007/255679/WHO_EVAP_UK_v30_WEBx.pdf?ua=1
2. Ozawa S, Clark S, Portnoy A, Grewal S, Brenzel L, Walker DG. Return On Investment From Childhood Immunization In Low- And Middle-Income Countries, 2011-20. Health Aff (Millwood).
2016;35(2):199-207
3. European Vaccine Action Plan 2015-2020, Annex 2 monitoring and evaluation framework.
http://www.euro.who.int/__data/assets/pdf_file/ 0007/255679/WHO_EVAP_UK_v30_WEBx.pdf?ua=1
4. Report of the 32nd meeting of the European Regional Commission for the Certification of Poliomyelitis Eradication (URL pending)
5. Lowther SA, Roesel S, O'Connor P, Landaverde M, Oblapenko G, Deshevoi S, et al. World Health Organization regional assessments of the risks of poliovirus outbreaks. Risk Anal.
2013;33(4):664-79
6. Report of the 17th meeting of the Global Commission for the Certification of Poliomyelitis Eradication, Geneva 2018
http://polioeradication.org/wp-content/uploads/2018/04/polio-eradication-certification-17th-meeting-global-commission-for-certification-of-poliomyelitis-eradication-20180412.pdf
7. 15th meeting of the SAGE polio working group: conclusions and recommendations. World Health Organization, Geneva, February 2018.
http://www.who.int/immunization/sage/meetings/ 2018/april/2_WHO_Polio_SAGE_Apr2018.pdf?ua=1
8. WHO vaccine-preventable diseases: monitoring system. 2018 global summary: immunization schedule selection centre
http://apps.who.int/immunization_monitoring/globalsummary/schedules
9. Polio Outbreak Simulation Exercise (POSE) http://www.euro.who.int/en/health-topics/communicable-diseases/poliomyelitis/activities/polio-outbreak-simulation-exercises-pose
10. Duizer E, Ruijs WL, van der Weijden CP, Timen A. Response to a wild poliovirus type 2 (WPV2)-shedding event following accidental exposure to WPV2, the Netherlands, April 2017. Euro Surveill. 2017;22(21)
11. World Health Oragnization, Framework for verifying elimination of measles and rubella. Weekly Epidemiological Record 2013; 88 (9): 89-100
http://www.who.int/wer/2013/wer8809.pdf?ua=1
12. WHO EpiData, No 4/2018 http://www.euro.who.int/__data/assets/pdf_
file/0018/371430/2018-04-epi-data-apr2017-mar2018-eng.pdf?ua=1
13. WHO Epi Brief No 1/2018 http://www.euro.who.int/__data/assets/pdf_
file/0009/370656/epibrief-1-2018-eng.pdf?ua=1

68 EVAP midterm report
14. World Health Organization, Conclusions of the SAGE Working Group on measles and rubella: WHO policy recommendation on target Immunity levels for elimination - considerations for defining age-specific target levels Geneva; 2017
http://www.who.int/immunization/sage/meetings/ 2017/october/Yellow_book_SAGE_October_2017.pdf
15. Meeting of the Strategic Advisory Group of Experts on immunization, October 2017 - conclusions and recommendations. Weekly Epidemiological Record. 2017;92(48):729-48.
http://apps.who.int/iris/bitstream/handle/10665/ 259533/WER9248.pdf?sequence=1&isAllowed=y
16. WHO Regional Office for Europe. EpiData 1/2018 http://www.euro.who.int/en/health-topics/disease-prevention/vaccines-and-immunization/publications/surveillance-and-data/who-epidata/who-epidata,-no.-12018
17. Datta SS, O'Connor PM, Jankovic D, Muscat M, Ben Mamou MC, Singh S, et al. Progress and challenges in measles and rubella elimination in the WHO European Region. Vaccine. 2017
18. Action plan for the health sector response to viral hepatitis in the WHO European Region. Copenhagen; 2017
http://www.euro.who.int/__data/assets/pdf_file/ 0008/357236/Hepatitis-9789289052870-eng.pdf
19. Hope VD, Eramova I, Capurro D, Donoghoe MC. Prevalence and estimation of hepatitis B and C infections in the WHO European Region: a review of data focusing on the countries outside the European Union and the European Free Trade Association. Epidemiol Infect. 2014;142(2):270-86
20. European Centre for Disease Prevention and Control Scientific Advice. Systematic review of hepatitis B and C prevalence in EU/EAA. Stockholm; ECDC; 2016
https://ecdc.europa.eu/sites/portal/files/media/en/publications/Publications/systematic-review-hepatitis-B-C-prevalence.pdf
21. Global Hepatitis Report 2017. Geneva; 2017 http://apps.who.int/iris/bitstream/handle/10665/
255016/9789241565455-eng.pdf?sequence=1
22. Keeble S, Quested J, Barker D, Varadarajan A, Shankar AG. Immunization of babies born to HBsAg positive mothers: An audit on the delivery and completeness of follow up in Norfolk and Suffolk, United Kingdom. Hum Vaccin Immunother. 2015;11(5):1153-6.
23. Harder KM, Cowan S, Eriksen MB, Krarup HB, Christensen PB. Universal screening for hepatitis B among pregnant women led to 96% vaccination coverage among newborns of HBsAg positive mothers in Denmark. Vaccine.
2011;29(50):9303-7
24. Kunoee A, Nielsen J, Cowan S. Hepatitis B vaccination coverage and risk factors associated with incomplete vaccination of children born to hepatitis B surface antigen-positive mothers, Denmark, 2006 to 2010. Euro Surveill. 2016;21(7):pii=30136
25. Weis N, Cowan S, Hallager S, Drose S, Kristensen LH, Gronbaek K, et al. Vertical transmission of hepatitis B virus during pregnancy and delivery in Denmark. Scand J Gastroenterol.
2017;52(2):178-84

69References
26. World Health Oragnization, Documenting the impact of hepatitis B immunization: Best practices for conducting a serosurvey (WHO/IVB/11.08) http://www.who.int/immunization/documents/who_ivb_11.08/en/
27. World Health Organization, Sample design and procedures for hepatitis B immunization surveys: A companion to the WHO cluster survey reference manual (WHO/IVB/11.12)
http://www.who.int/immunization/documents/monitoring/WHO_IVB_11.12/en/
28. Khetsuriani N, Tishkova F, Jabirov S, Wannemuehler K, Kamili S, Pirova Z, et al. Substantial decline in hepatitis B virus infections following vaccine introduction in Tajikistan. Vaccine. 2015;33(32):4019-24
29. WHO/UNICEF estimates of national infant immunization coverage: methods and processes.
http://www.who.int/bulletin/volumes / 87/7/08- -053819/en/
30. Vaccine Uptake in Children in Wales, Cover Annual Report 2017, Cardiff: Public Health Wales; May 2017
31. Tailoring immunization programmes to reach underserved groups – the TIP approach
http://www.euro.who.int/__data/assets/pdf_file/0003/187347/The-Guide-to-Tailoring-Immunization-Programmes-TIP.pdf?ua=1
32. Dube E, Leask J, Wolff B, Hickler B, Balaban V, Hosein E, et al. The WHO Tailoring Immunization Programmes (TIP) approach: Review of implementation to date. Vaccine.
2018;36(11):1509-15
33. Barriers and motivating factors to MMR vaccination in communities with low coverage in Sweden: implementation of the WHO's Tailoring Immunization Programmes (TIP) method. Stockholm, Sweden; 2015
https://www.folkhalsomyndigheten.se/contentassets/5db4b41a40f94e98b0e1d0d4a596bae8/barriers-motivating-factors-mmr-vaccination-communities-low-coverage-sweden-15027.pdf
34. WHO Regional Office for Europe, Vaccine and trust library
http://www.euro.who.int/en/health-topics/disease-prevention/vaccines-and-immunization/publications/vaccination-and-trust
35. WHO Regional Office for Europe, Communications and advocacy
http://www.euro.who.int/en/health-topics/disease-prevention/vaccines-and-immunization/activities/communication-and-advocacy
36. Immunization Demand team Division of Health Emergencies and Communicable Diseases (DEC) Vaccine-preventable Diseases programme (VPI) WHO Regional Office for Europe, 2016 progress report
http://www.who.int/immunization/sage/meetings/2017/april/8_VPI_Demand_team_2016_report.pdf?ua=1
37. NITAG Performance Evaluation: The SIVAC tool for evaluating NITAGs Paris: AMP: Agence de Médecine Préventive; 2016
http://www.nitag-resource.org/media-center/document/3473

70 EVAP midterm report
38. WHO Global Invasive Bacterial Vaccine-Preventable Disease and Rotavirus and Pediatric Diarrhea Surveillance Networks Bulletin.
https://mailchi.mp/fbbaac19c519/who-ib-vpd-and- rotavirus-surveillance-bulletin-june-1402653?e= ca32895e54
39. World Health Organization, Global Health Expenditure Database
http://apps.who.int/nha/database/Select/Indicators/en
40. Sustainable Access to Vaccines in Middle-Income Countries (MICs): A Shared Partner Strategy Report of the WHO-Convened MIC Task Force, March 2015
http://www.who.int/immunization/sage/meetings/ 2015/april/Cernuschi_MIC_Strategy_SAGE_Apr 2015.pdf?ua=1&ua=1

The WHO RegionalOffice for Europe
The World Health Organization (WHO) is a specialized agency of the United Nations created in 1948 with the primary responsibility for international health matters and public health. The WHO Regional Office for Europe is one of six regional offices throughout the world, each with its own programme geared to the particular health conditions of the countries it serves.
Member States
AlbaniaAndorraArmeniaAustriaAzerbaijanBelarusBelgiumBosnia and HerzegovinaBulgariaCroatiaCyprusCzechiaDenmarkEstoniaFinlandFranceGeorgiaGermanyGreeceHungaryIcelandIrelandIsraelItalyKazakhstanKyrgyzstanLatviaLithuaniaLuxembourgMaltaMonacoMontenegroNetherlandsNorwayPolandPortugalRepublic of MoldovaRomaniaRussian FederationSan MarinoSerbiaSlovakiaSloveniaSpainSwedenSwitzerlandTajikistanThe former Yugoslav Republic of MacedoniaTurkeyTurkmenistanUkraineUnited KingdomUzbekistan
WHO Regional Office for Europe
UN City, Marmorvej 51, DK-2100 Copenhagen Ø, DenmarkTel: +45 45 33 70 00 Fax: +45 45 33 70 01Email: [email protected]: www.euro.who.int
Copyright © 2022 FDOKUMEN