Capital asset pricing model with fuzzy returns and hypothesis ...
Upload
khangminh22Category
view
0download
0
Noname manuscript No.(will be inserted by the editor)
An empirical comparison of asset-pricing models in
the Shanghai A-share exchange market
Received: date / Accepted: date
Abstract This paper evaluates and compares the performance of three-assetpricing models- the capital asset pricing model of Sharpe (1964), the three-factor model of Fama and French (1993), and the five-factor model (Fama andFrench 2015)- in the Shanghai A-share exchange market. Our results do notsupport the superiority of the five-factor model and show that the three-factormodel outperforms the other models. We also verify the redundancy of thebook-to-market factor and confirm the findings of Fama and French (2015).
JEL classification G1 · C5
Keywords Fama-French models · Capital asset pricing model · Shanghaiexchange market
1 Introduction
Estimating the expected return on portfolios or the cost of equity for indi-vidual stocks has constantly been a central question in financial economics. Forthis purpose, three major asset-pricing models were created; the capital assetpricing model of Sharpe (1964), Lintner (1965) and Mossin (1966) (henceforthCAPM), the three-factor model (henceforth FF3FM) and the five-factor model(henceforth FF5FM) both developed by Fama and French in 1996 and 2015respectively. For over thirty years, the CAPM has dominated the finance the-ory since it provides a simple and intuitive relation between systematic riskand return. However, the model has been subject to a lot of criticism reportingthat the market beta coefficient alone cannot fully describe the cross-sectionof expected stock returns. For example, Banz (1981), Basu (1983), and Lakon-ishok, Shleifer, and Vishny (1994) found the existence of a relationship betweenaverage stock returns and firm size, book-to-market equity, earnings to priceratio, cash flow to price ratio and past sales growth. Following these studies
Manuscript (author information must not appear in the manuscript) Click here to view linked References
1 2 3 4 5 6 7 8 9 10 11 12 13 14 15 16 17 18 19 20 21 22 23 24 25 26 27 28 29 30 31 32 33 34 35 36 37 38 39 40 41 42 43 44 45 46 47 48 49 50 51 52 53 54 55 56 57 58 59 60 61 62 63 64 65
2
among others, Fama and French (1993, 1996) constructed a three-factor modeladding two factors to the market beta of the CAPM: the market capitalizationand the book-to-market ratio.
On one hand, much empirical research demonstrates that the FF3FMoutperforms the CAPM and describes well the cross-section of asset returns((Griffin and Lemmon 2002); (Liew and Vassalou 2000)). On the other hand,many studies have shown anomalies left unexplained by the FF3FM and havediscovered factors that seem to better explain average returns. For instance,Novy-Marx (2013) shows that profitable firms generate better returns thanfirms with low profitability. In the same way, Aharoni, Grundy, and Zeng(2013) find that there is a strong relationship between the investment factorand average returns. Based on these findings, Fama and French presentedthe five-factor model. In 2015, Fama and French expanded the FF3FM withtwo factors; profitability and investment. Compared to the CAPM and theFF3FM, the FF5FM achieve better results in describing the cross-section ofstock returns using U.S data and international data from developed markets.Examples include Fama and French (2015, 2017). Although several studieshave focused on the empirical testing of multifactor models in the developedmarkets, little attention has been given to Asian emerging markets. Chui andWei (1998) were the first to examine the relationship between average stockreturns and the market factor in the Asian region and validated the work ofFama and French (1996). They demonstrated that the market factor alone isnot sufficient to describe the cross-section of expected returns and reportedthat average returns are closely related to book-to-market equity ratio andfirm size. Additionally, Drew and Veeraraghavan (2001, 2002) found that theFF3FM performed better than the CAPM in the Shanghai Stock Exchangeover the 1990s.
This paper has the following three objectives. First, we evaluate the per-formance of the FF5FM in the Shanghai stock market. Most studies have onlyfocused on the empirical testing of this model in the developed and Europeanemerging markets. For instance, Nichol and Dowling (2014) tested the FF5FMand confirmed its superiority over the FF3FM in the UK context. Particularly,they reported a strong profitability pattern and a weak investment effect inaverage returns. In Japan, Kubota and Takehara (2017) investigated the per-formance of the FF5FM and concluded that the addition of the profitabilityand investment factors did not significantly improve the description of aver-age returns. In another major study, Zaremba and Czapkiewicz (2017) testedand compared the performance of four factor pricing models (the CAPM, theFF3FM, the FF5FM and the four-factor model of Carhart (1997)) in the Eu-ropean emerging stock markets and showed that the FF5FM is the least-badmodel. Furthermore, Fama and French (2017) evaluated the explanatory powerof size, value, profitability and investment in 23 developed countries and docu-mented a positive relationship between average returns and profitability and anegative relation between average returns and investment. The only exceptionin their empirical research is Japan; they reported that the average returnsof Japanese stocks have little relation with profitability and investment. This
1 2 3 4 5 6 7 8 9 10 11 12 13 14 15 16 17 18 19 20 21 22 23 24 25 26 27 28 29 30 31 32 33 34 35 36 37 38 39 40 41 42 43 44 45 46 47 48 49 50 51 52 53 54 55 56 57 58 59 60 61 62 63 64 65

Title Suppressed Due to Excessive Length 3
means that every region has its own anomalies and thus each market shouldbe investigated specifically. Although these studies covered more than 30 dif-ferent countries, very few studies focused on the evaluation of the performanceof FF5FM in the Chinese market.Contrary to the developed markets, China isstill emerging and thus represents an attractive context in which to study theasset pricing. In recent years, China has been making efforts to be one of theglobal markets by opening more segments to foreign investors. In 2015, China'sforeign direct investment reached $118 billion and is expected to increase by15% in 2017 due to reducing restrictive measures on foreign investment. Yet,market imperfections such as the lack of transparency and weak market disci-pline still exist in the Chinese market. This makes the empirical investigationinto the Chinese stock market important. The central question that arises inthis paper is whether the superiority of the FF5FM is a phenomenon onlyrelated to the developed markets. In view of market inefficiencies that hasbeen mentioned so far, one would anticipate higher returns on Chinese stockmarket anomalies. In an analysis of the explanatory power of profitability andinvestment in the Chinese market, Lin (2017) verified the superiority of theFF5FM over the FF3FM, documented a strong profitability pattern and founda weak investment effect in average stock returns. In another similar study,Guo et al (2017) provided an out-of-sample test of the FF5FM in the Chinesestock market and found results consistent with Fama and French (2015) andLin (2017). In addition, they showed that the investment factor shows littlerelation with average stock returns. Both studies use the ratio of operatingprofits as a proxy for profitability in the FF5FM. In this paper, we adopta slightly different approach; we replace the profitability proxy of Fama andFrench by the net profit before tax over the total shareholders equity. Accord-ing to Hou et al (2015), this proxy generates higher returns than that used inFama and French (2015). To our knowledge, no study to date has ever assessedthe performance of the FF5FM with a modified profitability proxy. By doingso, our research contributes to extending the literature on asset pricing in theChinese equity market. Second, to search for a better asset-pricing model, wecompare factor-pricing models (CAPM, FF3FM and FF5FM) in explainingaverage returns. We use standard asset-pricing tests (adjusted R2, average ab-solute of the intercepts and the GRS statistic) and include the GMM J-basedstatistic following MacKinlay and Richardson (1991) and Cochrane (2005).Commenting on the theoretical background of their multifactor model, Famaand French (2017) argued that “given their flimsy theoretical underpinnings,empirical asset pricing models can be judged only on empirical robustness”.We follow the same rationale in our study. Third, Fama and French (2015) findthat the book-to-market factor becomes redundant when profitability and in-vestment are included. Our final goal is to investigate the redundancy of thevalue factor in the Shanghai equity market.
The findings of this study can be summarized as follows. The FF3FMoutperforms the CAPM and the FF5FM in explaining average stock returns.In addition, we find that the book-to-market factor is redundant when theprofitability and investment factors are present, which is line with the findings
1 2 3 4 5 6 7 8 9 10 11 12 13 14 15 16 17 18 19 20 21 22 23 24 25 26 27 28 29 30 31 32 33 34 35 36 37 38 39 40 41 42 43 44 45 46 47 48 49 50 51 52 53 54 55 56 57 58 59 60 61 62 63 64 65

4
of Fama and French (2015). Moreover, we find that the FF5FM without thebook-to-market factor performs better than the FF5FM in the Shanghai stockmarket.
The organization of the remainder of the paper is as follows. Section 2presents a literature review. Section 3 outlines the data and portfolio con-struction method. Empirical findings are discussed in section 4 with section 5presenting concluding comments.
2 Literature review
A considerable amount of literature has confirmed the relationship betweenaverage returns, firm size and book-to-market ratio (Banz, 1981; Basu, 1983,Fama and French, 1992). Following these studies, Fama and French (1993)constructed a three-factor model by augmenting the CAPM with two addi-tional factors; size and book-to-market ratio. Later in 1996, Fama and Frenchconducted an empirical testing using data from developed markets and showedthat the FF3FM outperforms the CAPM in explaining the cross-section of av-erage stock returns. In China, numerous studies have followed the previousapproach and considered the FF3FM as a benchmark model. For instance,Chui and Wei (1998), and Xie and Qu (2016) report that size and value pre-miums are significant. However, these studies provide mixed results and showthat many anomalies are still left unexplained by the FF3FM. Attemptingto uncover those anomalies, Novy-Marx (2013) and Haugen and Baker (1996)find a positive relationship between average stock returns and profitability andTitman et al. (2004) report that average stock returns are negatively associ-ated with investment. Motivated by the recent findings on the effects of theprofitability and investment factors on stock returns, Fama and French (2015)constructed a five-factor model adding two new factors associated to prof-itability and investment. In 2017, they conducted a comprehensive empiricaltesting of this model and showed that the FF5FM outperforms the FF3FM inexplaining average stock returns. Similarly, Nichol and Dowling (2017) evalu-ate the performance of the FF5FM in the UK and find results consistent withthe findings of Fama and French (2017).
In China, only two studies are relevant to our research. Lin (2017) inves-tigates the explanatory power of the profitability and investment ratios overthe period 1997-2015 and supports the superiority of the FF5FM. In the sameway, Guo et al (2017) test the FF5FM and report a strong effect of size andprofitability and a weak investment pattern. They also find that the invest-ment factor is redundant which contradicts the results of Fama and French(2015, 2017). Both studies follow the methodology of Fama and French inconstructing factors related to size, value, profitability, and investment.
Our study has several contributions. First, we test the FF5FM in theShanghai stock market and follow Fama and French approach in constructingfactors associated with size, value, and investment. However, regarding theprofitability factor, we use the net profit before tax over the total shareholders
1 2 3 4 5 6 7 8 9 10 11 12 13 14 15 16 17 18 19 20 21 22 23 24 25 26 27 28 29 30 31 32 33 34 35 36 37 38 39 40 41 42 43 44 45 46 47 48 49 50 51 52 53 54 55 56 57 58 59 60 61 62 63 64 65
Title Suppressed Due to Excessive Length 5
equity. This proxy is recommended by Hou et al (2015) and is shown to gener-ate higher returns than that of Fama and French. As far as we know, there areno studies that investigate the performance of the FF5FM using a differentprofitability proxy. Therefore, our study adds to the asset-pricing literature.Our second goal is to compare the factor pricing models (CAPM, FF3FM,FF5FM) and look for the best model for pricing Chinese equities. Last butnot least, we examine the redundancy of the value factor in the FF5FM. Themain findings of this study can be summarized as follows: the FF3FM per-forms better than both the CAPM and the FF5FM. This result contradictsthe previous research (Fama and French (2015, 2017), Lin (2017), Guo et al(2017)), which supports the superiority of the FF5FM. A significant profitabil-ity effect and a weak investment pattern are observed in our sample, whichis in line with the findings of the precedent studies. However, we find thatthe value factor is redundant in the FF5FM in the Shanghai equity market,which contradicts the results of Lin (2017) and Guo et (2017) who report aredundancy of the investment factor in the Chinese stock market.
3 Data and methodology
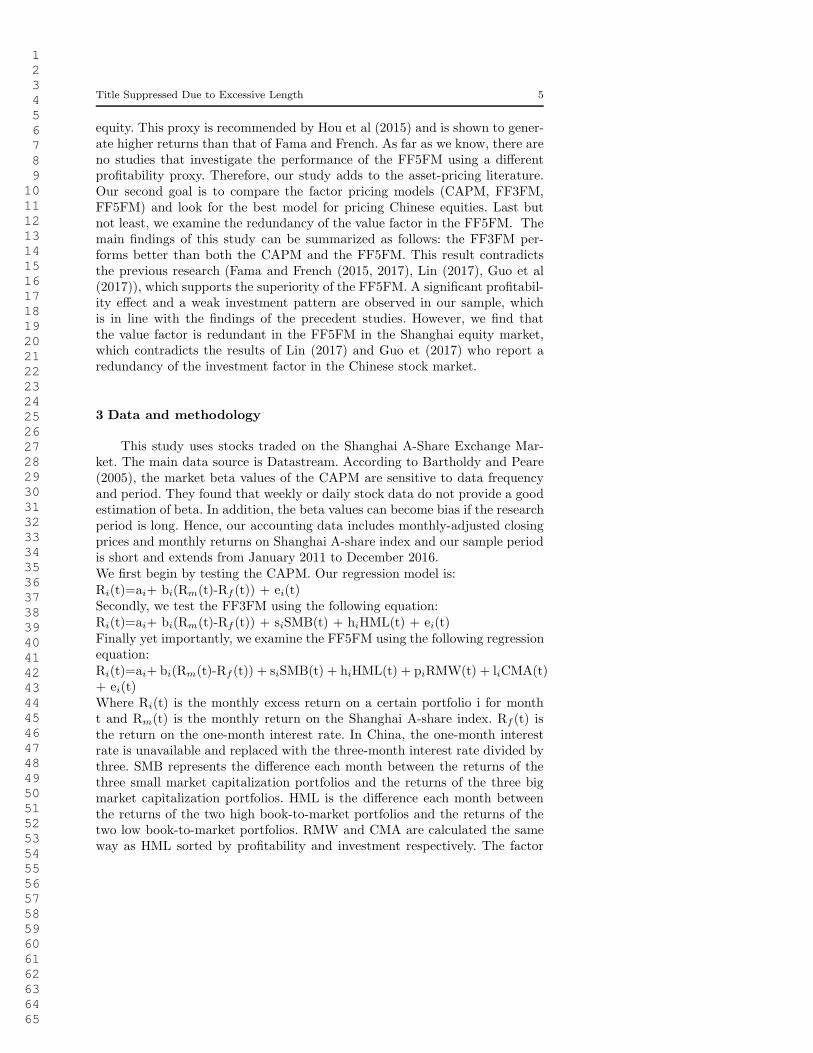
This study uses stocks traded on the Shanghai A-Share Exchange Mar-ket. The main data source is Datastream. According to Bartholdy and Peare(2005), the market beta values of the CAPM are sensitive to data frequencyand period. They found that weekly or daily stock data do not provide a goodestimation of beta. In addition, the beta values can become bias if the researchperiod is long. Hence, our accounting data includes monthly-adjusted closingprices and monthly returns on Shanghai A-share index and our sample periodis short and extends from January 2011 to December 2016.We first begin by testing the CAPM. Our regression model is:Ri(t)=ai+ bi(Rm(t)-Rf (t)) + ei(t)Secondly, we test the FF3FM using the following equation:Ri(t)=ai+ bi(Rm(t)-Rf (t)) + siSMB(t) + hiHML(t) + ei(t)Finally yet importantly, we examine the FF5FM using the following regressionequation:Ri(t)=ai+ bi(Rm(t)-Rf (t)) + siSMB(t) + hiHML(t) + piRMW(t) + liCMA(t)+ ei(t)Where Ri(t) is the monthly excess return on a certain portfolio i for montht and Rm(t) is the monthly return on the Shanghai A-share index. Rf (t) isthe return on the one-month interest rate. In China, the one-month interestrate is unavailable and replaced with the three-month interest rate divided bythree. SMB represents the difference each month between the returns of thethree small market capitalization portfolios and the returns of the three bigmarket capitalization portfolios. HML is the difference each month betweenthe returns of the two high book-to-market portfolios and the returns of thetwo low book-to-market portfolios. RMW and CMA are calculated the sameway as HML sorted by profitability and investment respectively. The factor
1 2 3 4 5 6 7 8 9 10 11 12 13 14 15 16 17 18 19 20 21 22 23 24 25 26 27 28 29 30 31 32 33 34 35 36 37 38 39 40 41 42 43 44 45 46 47 48 49 50 51 52 53 54 55 56 57 58 59 60 61 62 63 64 65
6
loadings for each variable are bi,si, hi, pi and li. ei(t) represents the errorterm.
In order to construct the factors used in the three models cited above, weneed measures of book-to-equity, profitability and investment ratios. Accordingto Fama and French (1993), we exclude companies with negative book-to-market ratios. Following Fama and French (2008, 2015), we use asset growthas a proxy for investment, which is calculated as Total Assetst−1 minus TotalAssetst−2, dividing the result by Total Assetst−2.
To measure profitability, we use return on equity defined as the net profitbefore tax in year t by the total shareholder’s equity in the same year. This isstrongly recommended by Hou et al (2015, 2017). They show that this proxygenerates higher returns than the proxy used by Fama and French (2015).
We start by forming portfolios at the end of December at year t. Thesorting process begins by defining yearly breakpoints for size, book-to-market,profitability and investment ratios. The yearly market capitalization medianis used as the breakpoint for size. This is strongly advocated by Fama andFrench (2015). For all other factors, the yearly sample 30th and 70th per-centiles are used as breakpoints in the sorting method. Having obtained thebreakpoints, we form six portfolios from the intersection of two size and threebook-to-market portfolios. Monthly value-weighted returns on each of thesesix portfolios are calculated from January to December of year t+1. SMB andHML that capture the returns associated with size and book-to-market arethen calculated. RMW and CMA are calculated in the same way by form-ing two size groups and three groups of profitability and investment factorsrespectively.
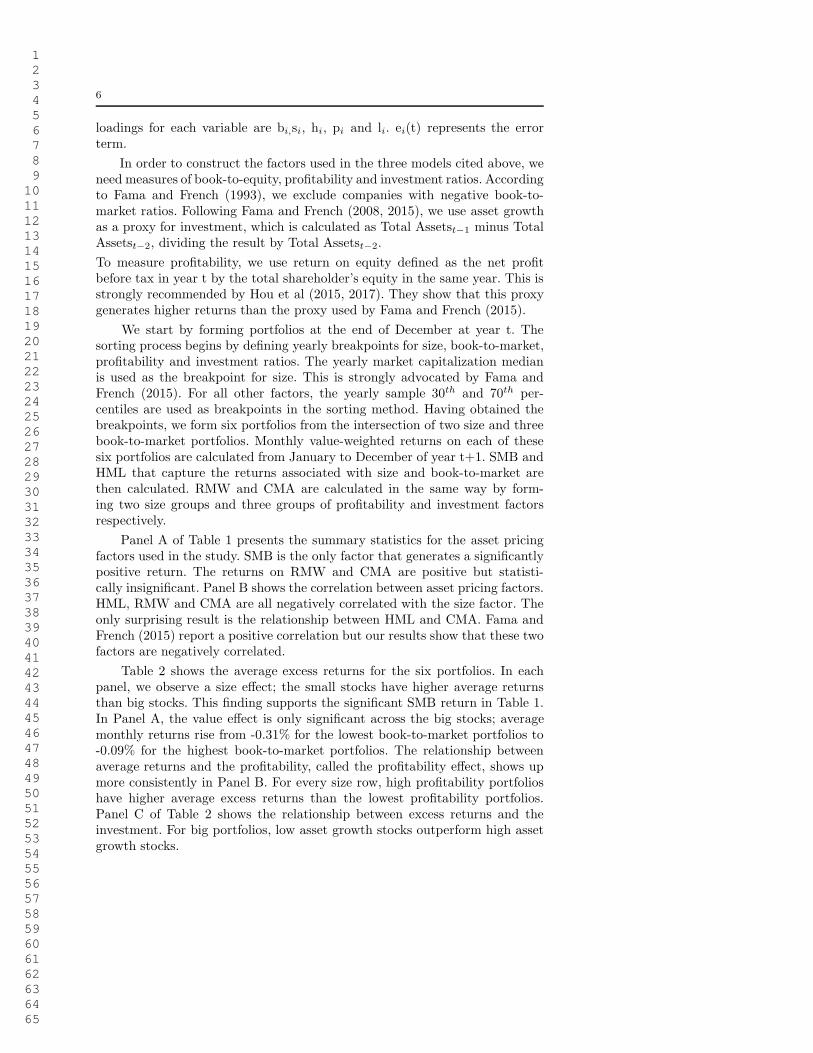
Panel A of Table 1 presents the summary statistics for the asset pricingfactors used in the study. SMB is the only factor that generates a significantlypositive return. The returns on RMW and CMA are positive but statisti-cally insignificant. Panel B shows the correlation between asset pricing factors.HML, RMW and CMA are all negatively correlated with the size factor. Theonly surprising result is the relationship between HML and CMA. Fama andFrench (2015) report a positive correlation but our results show that these twofactors are negatively correlated.
Table 2 shows the average excess returns for the six portfolios. In eachpanel, we observe a size effect; the small stocks have higher average returnsthan big stocks. This finding supports the significant SMB return in Table 1.In Panel A, the value effect is only significant across the big stocks; averagemonthly returns rise from -0.31% for the lowest book-to-market portfolios to-0.09% for the highest book-to-market portfolios. The relationship betweenaverage returns and the profitability, called the profitability effect, shows upmore consistently in Panel B. For every size row, high profitability portfolioshave higher average excess returns than the lowest profitability portfolios.Panel C of Table 2 shows the relationship between excess returns and theinvestment. For big portfolios, low asset growth stocks outperform high assetgrowth stocks.
1 2 3 4 5 6 7 8 9 10 11 12 13 14 15 16 17 18 19 20 21 22 23 24 25 26 27 28 29 30 31 32 33 34 35 36 37 38 39 40 41 42 43 44 45 46 47 48 49 50 51 52 53 54 55 56 57 58 59 60 61 62 63 64 65

Title Suppressed Due to Excessive Length 7
Table 1: Summary statistics for factor returns; January 2011 to December 2016
Rm-Rf SMB HML RMW CMA
Panel A: Summary statisticsMean -0.66 1.11 -0.10 0.18 0.05Std dev 7.23 3.40 3.36 2.21 1.42t-Mean -0.78 2.75 -0.25 0.70 0.32Panel B: Correlation coefficientsRm-Rf 1SMB -0.02 1HML -0.01 -0.49 1RMW -0.16 -0.51 0.08 1CMA 0.03 -0.15 -0.34 0.46 1
Table 2: Average monthly excess returns for portfolios formed on size and book-to-market,size and profitability, and size and asset growth
Low Medium High
Panel A: size/book-to market portfoliosSmall 1.02 0.87 0.60Big -0.31 -0.24 -0.09Panel B: size/profitability portfoliosSmall 0.97 0.75 1.08Big -0.42 -0.13 -0.17Panel C: size/investment portfoliosSmall 1.00 0.80 0.88Big -0.29 -0.27 -0.06
4 Results
The aim of this research is to evaluate and compare the performance ofthree asset-pricing models: the CAPM, the FF3FM, and the FF5FM. First,we examine the regression coefficients of each model to assess the explana-tory power of the market, size, profitability, and investment factors. Second,to compare our models, we use the F statistic of Gibbons, Ross and Shanken(GRS, 1989) to test the zero intercept hypothesis. The GRS test assumes thatstock returns are identically, independently, and normally distributed. How-ever, since this assumption is not always true, we add to our tests the GMMJ-statistic on the regression intercepts following MacKinlay and Richardson(1991) and Cochrane (2005). In addition, we report the average absolute in-tercept (ABS(a)), the average adjusted R2 and the average standard error ofthe intercepts (SE(a)).
4.1 Portfolios formed on size and book-to-market
Table 3 reports the regression coefficients for the six size and book-to-market portfolios. For every asset-pricing model, we report the intercepts,
1 2 3 4 5 6 7 8 9 10 11 12 13 14 15 16 17 18 19 20 21 22 23 24 25 26 27 28 29 30 31 32 33 34 35 36 37 38 39 40 41 42 43 44 45 46 47 48 49 50 51 52 53 54 55 56 57 58 59 60 61 62 63 64 65

8
the factor loadings on each factor, and the adjusted R2. Panel A shows theregression results for the CAPM. The market factor loadings are all significantat the 1% level and four out of six intercepts are distinguishable from zero. InPanel B, the results for the FF3FM are presented. The regression interceptsare all indistinguishable from zero showing that the FF3FM outperforms theCAPM in explaining average returns. In addition, the loadings (s) on theSMB factor are all dramatically significant at the 1% level indicating that ourresults are consistent with the findings of Fama and French (1996). The smallcapitalization portfolios have positive slopes on SMB while big portfolios havediminishing positive slopes. Regarding the HML factor loadings, five out of sixare significant at the 10% confidence level. Panel C shows the results for theFF5FM. RMW is significant for all six portfolios at the 10% level. However,for the CMA factor, only one out of six is significant. Overall, Table 3 showsthat the average adjusted R2for the CAPM is only 0.74 while it is around 0.93for both the FF3FM and the FF5FM. This result supports the superiority ofthe FF3FM and the FF5FM over the CAPM in explaining average returns.However, the FF3FM and the FF5FM perform similarly in explaining returnsfor the six size and book-to-market portfolios.
4.2 Portfolios formed on size and investment
We now report the regressions for the six portfolios formed on size andinvestment. Panel A of Table 4 shows that the intercepts are not close to zerowhich is sufficient to conclude that the CAPM does not explain well averagestock returns. As we can see in Table 4, all of the six size and investmentportfolios load positively and significantly on the market factor. In Panel B,we observe that the FF3FM intercepts are all close to zero and factors aremostly significant. Panel C provides regression details for the FF5FM. Weobserve that there is no clear pattern in the HML slopes. However, there is aclear relationship between investment and expected returns; average returnsare positive for high investment portfolios and negative for low investmentportfolios. This result contradicts the findings of Fama and French (2015).The average adjusted R2 is 0.76 for the CAPM, 0.93 for the FF3FM, and 0.94for the FF5FM. This result confirms that both the FF3FM and the FF5FMexplain average stock returns better than the CAPM. Nonetheless, based onlyon the adjusted R2, we cannot confirm which of the FF3FM or the FF5FM isthe preferred model.
4.3 Portfolios formed on size and profitability
In Table 5, we show the regression details for the portfolios formed on sizeand profitability. As shown in Panel A, the CAPM intercepts are mostly closeto zero indicating that the CAPM cannot capture all the variations in averagereturns for size and profitability portfolios. Panel B reports the results for the
1 2 3 4 5 6 7 8 9 10 11 12 13 14 15 16 17 18 19 20 21 22 23 24 25 26 27 28 29 30 31 32 33 34 35 36 37 38 39 40 41 42 43 44 45 46 47 48 49 50 51 52 53 54 55 56 57 58 59 60 61 62 63 64 65

Title Suppressed Due to Excessive Length 9
Table 3: Regressions for six size/book-to-market portfolios
Size/Book-To-Market
Low Medium High Low Medium High
Panel A: the CAPMa t(a)
Small 1.75 1.61 1.33 2.34* 2.31* 2.20*Big 0.41 0.52 0.63 0.68 1.20 2.47*
b t(b)Small 1.11 1.12 1.11 10.69*** 11.60*** 13.26***Big 1.10 1.16 1.09 13.09*** 19.18*** 30.83***
Adjusted R2
Small 0.61 0.65 0.71Big 0.71 0.84 0.93
Panel B: the FF3FMa t(a)
Small 0.25 0.23 -0.03 0.96 0.69 -0.08Big 0.11 0.15 0.40 0.34 0.47 1.54
b t(b)Small 1.12 1.13 1.13 32.52*** 26.06*** 25.66***Big 1.10 1.16 1.09 24.97*** 28.12*** 32.41***
s t(s)Small 1.30 1.21 1.23 15.45*** 11.42*** 11.48***Big 0.16 0.29 0.23 1.50 2.83** 2.80**
h t(h)Small -0.70 -0.53 -0.10 -8.18*** -4.99*** -0.92Big -1.21 -0.62 0.19 -11.14*** -6.12*** 2.30*
Adjusted R2
Small 0.96 0.93 0.92Big 0.92 0.92 0.94
Panel C: the FF5FMa t(a)
Small 0.49 0.44 0.23 1.85* 1.33 0.72Big 0.31 0.33 0.57 0.94 1.03 2.15
b t(b)Small 1.10 1.10 1.09 32.52*** 25.60*** 25.89***Big 1.06 1.13 1.07 24.81*** 27.50*** 31.64***
s t(s)Small 1.14 1.06 1.05 11.71*** 8.62*** 8.73***Big 0.03 0.16 0.11 0.24 1.38 1.15
h t(h)Small -0.76 -0.53 -0.08 -8.21*** -4.52*** -0.73Big -1.17 -0.61 0.16 -9.98*** -5.45*** 1.70*
r t(r)Small -0.40 -0.50 -0.64 -2.77** -2.76** -3.56***Big -0.56 -0.44 -0.32 -3.05** -2.53* -2.20*
c t(c)Small 0.00 0.35 0.49 -0.01 1.31 1.84*Big 0.55 0.34 0.06 2.03* 1.31 0.29
Adjusted R2
Small 0.96 0.94 0.93Big 0.93 0.93 0.94
This table shows the regression details for the six size/book-to-market portfolios for De-cember 2011 January 2016. The regressions use the CAPM, the FF3FM, and the FF5FMto explain average returns. The table reports the intercepts, the coefficients for each factor,and the adjusted R2. The results are expressed in percentages. ***, **, * denote significanceat the 1%, 5%, and 10% levels, respectively.
1 2 3 4 5 6 7 8 9 10 11 12 13 14 15 16 17 18 19 20 21 22 23 24 25 26 27 28 29 30 31 32 33 34 35 36 37 38 39 40 41 42 43 44 45 46 47 48 49 50 51 52 53 54 55 56 57 58 59 60 61 62 63 64 65

10
Table 4: Regressions for six size/investment portfolios
Size/Investment
Low Medium High Low Medium High
Panel A: the CAPMa t(a)
Small 1.74 1.53 1.63 2.39* 2.29* 2.38*Big 0.46 0.47 0.68 1.31 1.34 1.69*
b t(b)Small 1.11 1.10 1.14 10.95*** 11.91*** 11.99***Big 1.14 1.11 1.12 23.31*** 23.08*** 19.90***
Adjusted R2
Small 0.63 0.66 0.67Big 0.88 0.88 0.85
Panel B: the FF3FMa t(a)
Small 0.16 0.21 0.22 0.53 0.68 0.71Big 0.05 0.19 0.44 0.17 0.65 1.49
b t(b)Small 1.12 1.11 1.15 27.88*** 27.01*** 27.57***Big 1.14 1.11 1.12 28.03*** 29.73*** 28.68***
s t(s)Small 1.39 1.15 1.24 14.21*** 11.45*** 12.15***Big 0.35 0.21 0.16 3.55*** 2.35* 1.65
h t(h)Small -0.45 -0.53 -0.47 -4.47*** -5.20*** -4.59***Big -0.22 -0.42 -0.65 -2.17* -4.53*** -6.73***
Adjusted R2
Small 0.94 0.93 0.94Big 0.92 0.93 0.93
Panel C: the FF5FMa t(a)
Small 0.50 0.44 0.35 1.70* 1.42 1.21Big 0.38 0.38 0.53 1.27 1.31 1.76*
b t(b)Small 1.10 1.08 1.11 29.08*** 26.91*** 29.97***Big 1.11 1.09 1.10 28.67*** 29.14*** 28.23***
s t(s)Small 1.15 1.00 1.17 10.64*** 8.65*** 10.98***Big 0.12 0.08 0.11 1.10 0.75 0.96
h t(h)Small -0.60 -0.52 -0.32 -5.8*** -4.76*** -3.21**Big -0.30 -0.44 -0.58 -2.88** -4.30*** -5.43***
r t(r)Small -0.42 -0.54 -0.62 -2.62* -3.17** -3.93***Big -0.56 -0.41 -0.36 -3.41** -2.54* -2.19*
c t(c)Small -0.39 0.39 1.05 -1.65 1.54 4.53***Big -0.04 0.18 0.55 -0.015 0.76 2.28*
Adjusted R2
Small 0.95 0.94 0.95Big 0.93 0.93 0.93
This table shows the regression details for the six size/investment portfolios for December2011 January 2016. The regressions use the CAPM, the FF3FM, and the FF5FM to explainaverage returns. The table reports the intercepts, the coefficients for each factor, and theadjusted R2. The results are expressed in percentages. ***, **, * denote significance at the1%, 5%, and 10% levels, respectively.
1 2 3 4 5 6 7 8 9 10 11 12 13 14 15 16 17 18 19 20 21 22 23 24 25 26 27 28 29 30 31 32 33 34 35 36 37 38 39 40 41 42 43 44 45 46 47 48 49 50 51 52 53 54 55 56 57 58 59 60 61 62 63 64 65

Title Suppressed Due to Excessive Length 11
FF3FM. We notice that there is a considerable improvement compared withthe CAPM, as only two out of six regression intercepts are significant. Thisfinding suggests that the market factor along with HML and SMB capturevariations in average returns better than the CAPM. We also observe a sizepattern; the SMB slopes increase from strongly positive for small stocks toslightly positive for big stocks. However, there is no clear pattern for HMLslopes. In Panel C, RMW slopes increase from strongly negative for low prof-itability portfolios to weakly negative or slightly positive for high profitabilityportfolios. Looking at CMA slopes, only two out of six are significant at the10% level. Hence, the investment factor has little impact on portfolios formedon profitability. The average adjusted R2 is 0.75 for the CAPM, 0.93 for theFF3FM, and 0.94 for the FF5FM suggesting that the latter two models out-perform the CAPM.
As shown in this section, our results were quite expected. We observe strongsize, value and profitability effects. However, the investment pattern is weak.This result is consistent with the findings of Fama and French (2015, 2017),Lin (2017) and Guo et al (2017).
4.4 Comparison of the asset-pricing models
In this section, we provide additional tests to compare the asset-pricingmodels. We report the GRS tests statistics, the GMM J statistics, the averageadjusted R2, the average absolute value of the intercepts ABS(a), and theaverage standard error of the intercepts SE(a). Panel A of Table 6 reports thetest statistics for the CAPM. As can be seen, the CAPM performs poorly and isrejected at the 10% level in our tests. The GRS statistics are between 4.44 and4.68 and the J statistics are between 3.73 and 3.93. Switching to the FF3FM,we observe a significant improvement in our statistics suggesting that addingthe size and value factors improve the description of average returns. The GRSstatistics decrease and range between 0.52 and 0.63. Clearly, the FF3FM hasno difficulty in explaining the portfolios formed on size and value, investmentand profitability factors respectively. Interestingly, the FF3FM performs betterthan the FF5FM suggesting that one of the five factors might be redundant.This finding contradicts the results of Fama and French (2015) who report thesuperiority of the five-factor model. Moreover, Fama and French (2015) findthat the value factor is redundant in the US; while Lin (2017) and Guo et al(2017) show that the CMA factor is redundant in the Chinese market. In thenext section, we empirically test whether HML is redundant in the Shanghaiequity market and compare the FF5FM without the HML factor with theprevious models (CAPM, FF3FM and FF5FM).
1 2 3 4 5 6 7 8 9 10 11 12 13 14 15 16 17 18 19 20 21 22 23 24 25 26 27 28 29 30 31 32 33 34 35 36 37 38 39 40 41 42 43 44 45 46 47 48 49 50 51 52 53 54 55 56 57 58 59 60 61 62 63 64 65

12
Table 5: Regressions for six size/profitability portfolios
Size/Profitability
Low Medium High Low Medium High
Panel A: the CAPMa t(a)
Small 1.71 1.48 1.80 2.33* 2.16* 2.80**Big 0.34 0.63 0.55 0.74 1.55 1.68*
b t(b)Small 1.12 1.10 1.10 10.97*** 11.63*** 12.32***Big 1.16 1.15 1.08 18.13*** 20.41*** 23.82***
Adjusted R2
Small 0.63 0.65 0.68Big 0.82 0.85 0.89
Panel B: the FF3FMa t(a)
Small 0.12 0.12 0.52 0.36 0.40 1.69*Big -0.28 0.27 0.49 -0.73 0.87 1.74*
b t(b)Small 1.13 1.11 1.11 25.65*** 28.22*** 27.87***Big 1.16 1.15 1.07 22.99*** 29.03*** 29.33***
s t(s)Small 1.41 1.18 1.13 13.10*** 12.26*** 11.59***Big 0.54 0.28 0.01 4.38*** 2.92** 0.09
h t(h)Small -0.40 -0.57 -0.49 -3.66*** -5.86*** -4.94***Big -0.27 -0.55 -0.49 -2.16* -5.58*** -5.37***
Adjusted R2
Small 0.93 0.94 0.94Big 0.89 0.93 0.93
Panel C: the FF5FMa t(a)
Small 0.58 0.29 0.43 1.96* 0.96 1.33Big 0.32 0.45 0.48 0.99 1.48 1.61
b t(b)Small 1.09 1.09 1.12 28.19*** 28.01*** 27.01***Big 1.10 1.13 1.07 26.73*** 28.80*** 28.03***
s t(s)Small 1.09 1.07 1.19 9.82*** 9.63*** 10.00***Big 0.12 0.16 0.02 1.02 1.44 0.17
h t(h)Small -0.51 -0.53 -0.47 -4.84*** -5.04*** -4.11***Big -0.41 -0.52 -0.45 -3.61*** -4.89*** -4.32***
r t(r)Small -0.82 -0.48 0.16 -5.00*** -2.70** 0.89Big -1.08 -0.49 -0.06 -6.13*** -2.93** -0.35
c t(c)Small 0.06 0.48 -0.01 0.27 1.99* -0.05Big 0.11 0.44 0.19 0.44 1.79* 0.80
Adjusted R2
Small 0.95 0.95 0.94Big 0.93 0.93 0.93
This table reports the GRS and the GMM J statistics that test whether the intercepts areequal to zero. We also report the average absolute for the intercepts (ABS(a)), the averagestandard error for the intercepts (SE(a)), and the average adjusted R2. ***, **, * denotesignificance at the 1%, 5%, and 10% levels, respectively.
1 2 3 4 5 6 7 8 9 10 11 12 13 14 15 16 17 18 19 20 21 22 23 24 25 26 27 28 29 30 31 32 33 34 35 36 37 38 39 40 41 42 43 44 45 46 47 48 49 50 51 52 53 54 55 56 57 58 59 60 61 62 63 64 65

Title Suppressed Due to Excessive Length 13
Table 6: Summary statistics for the CAPM, the FF3FM, and the FF5FM
Size and book-to-market Size and investment Size and profitability
Panel A: the CAPMGRS 4.44** (pval=0.04) 4.68** (pval=0.03) 4.67** (pval=0.03)J-Stat 3.73* (pval=0.05) 3.93* (pval=0.05) 3.92* (pval=0.05)ABS(a) 1.04 1.08 1.09SE(a) 0.56 0.53 0.54Average R2 0.74 0.76 0.75Panel B: the FF3FMGRS 0.52 (pval=0.47) 0.63 (pval=0.43) 0.62 (pval=0.43)J-Stat 0.25 (pval=0.61) 0.30 (pval=0.58) 0.30 (pval=0.58)ABS(a) 0.19 0.21 0.30SE(a) 0.31 0.31 0.32Average R2 0.93 0.93 0.93Panel B: the FF5FMGRS 2.09 (pval=0.15) 2.36 (pval=0.13) 2.35 (pval=0.13)J-Stat 0.89 (pval=0.34) 1.00 (pval=0.32) 0.99 (pval=0.32)ABS(a) 0.40 0.43 0.43SE(a) 0.31 0.30 0.31R2 0.94 0.94 0.94
This table reports the GRS and the GMM J statistics that test whether the intercepts areequal to zero. We also report the average absolute for the intercepts (ABS(a)), the averagestandard error for the intercepts (SE(a)), and the average adjusted R2. ***, **, * denotesignificance at the 1%, 5%, and 10% levels, respectively.
4.5 Investigating the HML redundancy
This section investigates whether the HML factor is redundant in theFF5FM in the Shanghai exchange market. We test the performance of a four-factor model defined as follows:
Ri(t)=ai+ bi(Rm(t)-Rf (t)) + siSMB(t) + piRMW(t) + liCMA(t) + ei(t)
Where Ri(t), Rm(t), Rf (t), SMB, RMW, and CMA are defined in the method-ology and data section.
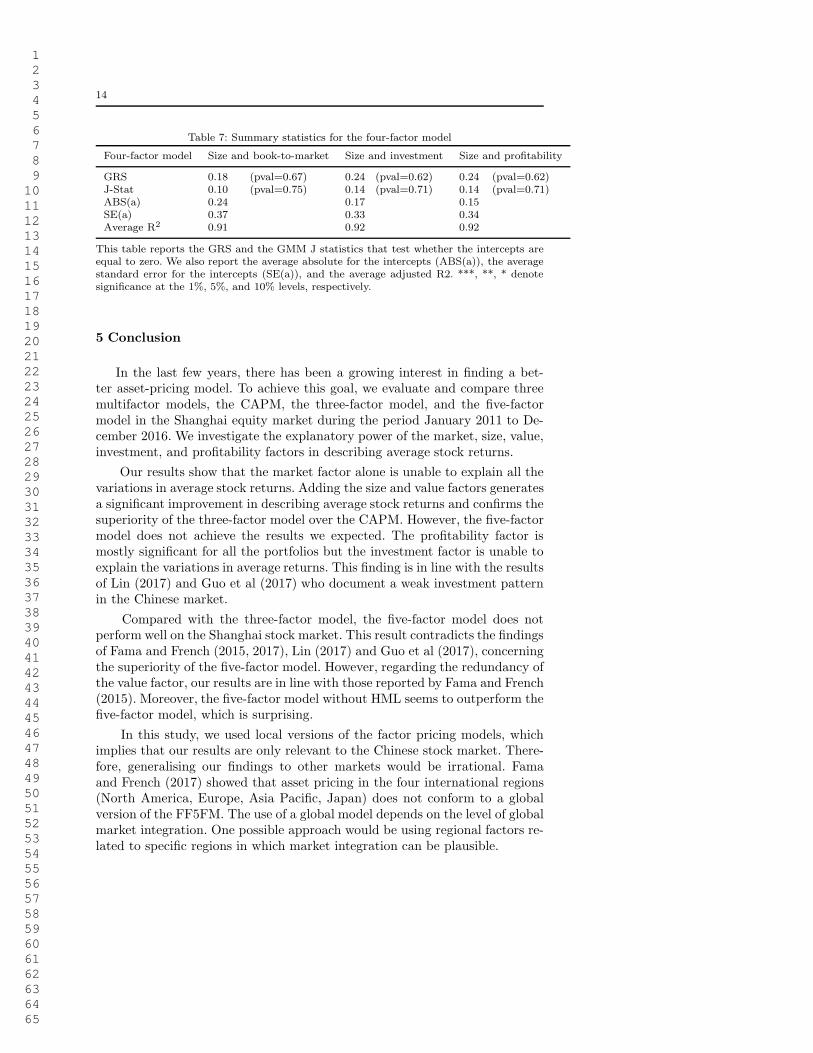
Similar to the previous section, we report the GRS and the GMM J statistics,along with the average adjusted R2, the average absolute of the intercepts, andthe average standard error of the intercepts. Table 7 presents the details. Boththe GRS and the GMM statistics show that the four-factor model outperformsthe five-factor model. This result confirms the findings of Fama and French(2015) and suggests that replacing HML with RMW and CMA improves thedescription of average returns in the Shanghai equity market. Moreover, com-pared to the FF3FM, the average absolute values of the intercepts for the fourfactor model are lower than those of the FF3FM (except for the size/book-to-market portfolios), which means that the four factor is better in explainingthe cross section of average stock returns.
1 2 3 4 5 6 7 8 9 10 11 12 13 14 15 16 17 18 19 20 21 22 23 24 25 26 27 28 29 30 31 32 33 34 35 36 37 38 39 40 41 42 43 44 45 46 47 48 49 50 51 52 53 54 55 56 57 58 59 60 61 62 63 64 65
14
Table 7: Summary statistics for the four-factor model
Four-factor model Size and book-to-market Size and investment Size and profitability
GRS 0.18 (pval=0.67) 0.24 (pval=0.62) 0.24 (pval=0.62)J-Stat 0.10 (pval=0.75) 0.14 (pval=0.71) 0.14 (pval=0.71)ABS(a) 0.24 0.17 0.15SE(a) 0.37 0.33 0.34Average R2 0.91 0.92 0.92
This table reports the GRS and the GMM J statistics that test whether the intercepts areequal to zero. We also report the average absolute for the intercepts (ABS(a)), the averagestandard error for the intercepts (SE(a)), and the average adjusted R2. ***, **, * denotesignificance at the 1%, 5%, and 10% levels, respectively.
5 Conclusion
In the last few years, there has been a growing interest in finding a bet-ter asset-pricing model. To achieve this goal, we evaluate and compare threemultifactor models, the CAPM, the three-factor model, and the five-factormodel in the Shanghai equity market during the period January 2011 to De-cember 2016. We investigate the explanatory power of the market, size, value,investment, and profitability factors in describing average stock returns.
Our results show that the market factor alone is unable to explain all thevariations in average stock returns. Adding the size and value factors generatesa significant improvement in describing average stock returns and confirms thesuperiority of the three-factor model over the CAPM. However, the five-factormodel does not achieve the results we expected. The profitability factor ismostly significant for all the portfolios but the investment factor is unable toexplain the variations in average returns. This finding is in line with the resultsof Lin (2017) and Guo et al (2017) who document a weak investment patternin the Chinese market.
Compared with the three-factor model, the five-factor model does notperform well on the Shanghai stock market. This result contradicts the findingsof Fama and French (2015, 2017), Lin (2017) and Guo et al (2017), concerningthe superiority of the five-factor model. However, regarding the redundancy ofthe value factor, our results are in line with those reported by Fama and French(2015). Moreover, the five-factor model without HML seems to outperform thefive-factor model, which is surprising.
In this study, we used local versions of the factor pricing models, whichimplies that our results are only relevant to the Chinese stock market. There-fore, generalising our findings to other markets would be irrational. Famaand French (2017) showed that asset pricing in the four international regions(North America, Europe, Asia Pacific, Japan) does not conform to a globalversion of the FF5FM. The use of a global model depends on the level of globalmarket integration. One possible approach would be using regional factors re-lated to specific regions in which market integration can be plausible.
1 2 3 4 5 6 7 8 9 10 11 12 13 14 15 16 17 18 19 20 21 22 23 24 25 26 27 28 29 30 31 32 33 34 35 36 37 38 39 40 41 42 43 44 45 46 47 48 49 50 51 52 53 54 55 56 57 58 59 60 61 62 63 64 65

Title Suppressed Due to Excessive Length 15
Summing up the results, it can be concluded that the best asset-pricingmodel for the Shanghai equity market is the five-factor model without HML.However, this model is still unable to capture all the time-variations in aver-age returns. A possible avenue for future work is to consider macroeconomicvariables or country specific parameters related to China in explaining the av-erage stock returns. Clearly, more research is still necessary before obtainingan efficient model for pricing Chinese equities.
References
1. Aharoni, G., Grundy, B., & Zeng, Q. (2013). Stock returns and the Miller Modiglianivaluation formula: Revisiting the Fama French analysis. Journal of Financial Economics,110, 347-357.
2. Banz, R. W. (1981). The relationship between return and market value of common stocks.Journal of Financial Economics, 9, 3-18.
3. Bartholdy, J., & Peare, P. (2005). Estimation of expected return: CAPM vs. Fama andFrench. International Review of Financial Analysis, 14, 407-427.
4. Basu, S. (1983). The relationship between earnings’ yield, market value and return forNYSE common stocks: Further evidence. Journal of Financial Economics, 12, 129-156.
5. Chui, A. C., & Wei, K. J. (1998). Book-to-market, firm size, and the turn-of-the-yeareffect: Evidence from Pacific-Basin emerging markets. Pacific-Basin Finance Journal, 6(3-4), 275-293.
6. Cochrane, J. H. (2005). Asset Pricing. vol. 1. New Jersey: Princeton University Press.7. Drew, M., & Veeraraghavan, M. (2001). Explaining the cross-section of stock returns inthe Asian region. International Quarterly Journal of Finance, 205-222.
8. Drew, M., & Veeraraghavan, M. (2002). Idiosyncratic volatility and security returns:evidence from the Asian region. International Quarterly Journal of Finance, 2(1-4), 1-14.
9. Fama, E. F., &French, K. R. (1992). The crosssection of expected stock returns. TheJournal of Finance, 47(2), 427-465.
10. Fama, E. F., & French, K. R. (1993). Common risk factors in the returns on stocks andbonds. Journal of Financial Economics, 33, 3-56.
11. Fama, E. F., & French, K. R. (1996). Multifactor explanations of asset pricing anomalies.The Journal of Finance, 51, 55-84.
12. Fama, E. F., & French, K. R. (2008). Dissecting anomalies. The Journal of Finance, 63,1653-1678.
13. Fama, E. F., & French, K. R. (2015). A five-factor asset pricing model. Journal ofFinancial Economics, 1-22.
14. Fama, E. F., & French, K. R. (2017). International tests of a five-factor asset pricingmodel. Journal of Financial Economics, 123, 441-463.
15. Gibbons, M. R., Ross, S. A., & Shanken, J. (1989). A test of the efficiency of a givenportfolio. Econometrica: Journal of the Econometric Society, 1121-1152.
16. Gray, P., & Johnson, J. (2011). The relationship between asset growth and the cross-section of stock returns. Journal of Banking & Finance, 35, 670-680.
17. Griffin, J. M., & Lemmon, M. L. (2002). Book-to-market equity, distress risk, and stockreturns. The Journal of Finance, 57, 2317-2336.
18. Guo, B., Zhang, W., Zhang, Y., & Zhang, H. (2017). The five-factor asset pricing modeltests for the Chinese stock market. Pacific-Basin Finance Journal, 43, 84-106.
19. Haugen, R. A., & Baker, N. L. (1996). Commonality in the determinants of expectedstock returns. Journal of Financial Economics, 41, 401-439.
20. Hou, K., Xue, C., & Zhang, L. (2015). Digesting anomalies: An investment approach.The Review of Financial Studies, 28, 650-705.
21. Kubota, K., & Takehara, H. (2017). Does the Fama and French Five-Factor Model WorkWell in Japan? International Review of Finance,137-146.
22. Lakonishok, J., Shleifer, A., & Vishny, R. W. (1994). Contrarian investment, extrapo-lation, and risk. The Journal of Finance, 49, 1541-1578.
1 2 3 4 5 6 7 8 9 10 11 12 13 14 15 16 17 18 19 20 21 22 23 24 25 26 27 28 29 30 31 32 33 34 35 36 37 38 39 40 41 42 43 44 45 46 47 48 49 50 51 52 53 54 55 56 57 58 59 60 61 62 63 64 65
16
23. Liew, J., & Vassalou, M. (2000). Can book-to-market, size and momentum be riskfactors that predict economic growth?. Journal of Financial Economics, 57, 221-245.
24. Lin, Q. (2017). Noisy prices and the Fama–French five-factor asset pricing model inChina. Emerging Markets Review, 31, 141-163.
25. Lintner, J. (1965). Security prices, risk, and maximal gains from diversification. TheJournal of Finance, 20, 587-615.
26. MacKinlay, A. C., & Richardson, M. P. (1991). Using generalized method of momentsto test mean-variance efficiency. The Journal of Finance, 46, 511-527.
27. Mossin, J. (1966). Equilibrium in a capital asset market. Econometrica: Journal of theeconometric society, 768-783.
28. Nichol, E., & Dowling, M. (2014). Profitability and investment factors for UK assetpricing models. Economics Letters, 125, 364-366.
29. Novy-Marx, R. (2013). The other side of value: The gross profitability premium. Journalof Financial Economics, 108, 1-28.
30. Sharpe, W. F. (1964). Capital asset prices: A theory of market equilibrium under con-ditions of risk. The Journal of Finance, 19, 425-442.
31. Titman, S., Wei, K. J., & Xie, F. (2004). Capital investments and stock returns. Journalof financial and Quantitative Analysis, 39, 677-700.
32. Xie, S., & Qu, Q. (2016). The three-factor model and size and value premiums in china’sstock market. Emerging Markets Finance and Trade, 52, 1092-1105.
33. Zaremba, A., & Czapkiewicz, A. (2017). Digesting anomalies in emerging Europeanmarkets: a comparison of factor pricing models. Emerging Markets Review, 31, 1-15.
1 2 3 4 5 6 7 8 9 10 11 12 13 14 15 16 17 18 19 20 21 22 23 24 25 26 27 28 29 30 31 32 33 34 35 36 37 38 39 40 41 42 43 44 45 46 47 48 49 50 51 52 53 54 55 56 57 58 59 60 61 62 63 64 65
Copyright © 2022 FDOKUMEN