An efficient method to find poentially universal population genetic markers, applied to metazoans
17
METHODOLOGY ARTICLE Open Access An efficient method to find potentially universal population genetic markers, applied to metazoans Anne Chenuil 11* , Thierry B Hoareau 1 , Emilie Egea 11 , Gwilherm Penant 11 , Caroline Rocher 11 , Didier Aurelle 11 , Kenza Mokhtar-Jamai 11 , John DD Bishop 2 , Emilie Boissin 3 , Angie Diaz 4 , Manuela Krakau 5 , Pieternella C Luttikhuizen 6 , Francesco P Patti 7 , Nicolas Blavet 8 , Sylvain Mousset 9,10 Abstract Background: Despite the impressive growth of sequence databases, the limited availability of nuclear markers that are sufficiently polymorphic for population genetics and phylogeography and applicable across various phyla restricts many potential studies, particularly in non-model organisms. Numerous introns have invariant positions among kingdoms, providing a potential source for such markers. Unfortunately, most of the few known EPIC (Exon Primed Intron Crossing) loci are restricted to vertebrates or belong to multigenic families. Results: In order to develop markers with broad applicability, we designed a bioinformatic approach aimed at avoiding multigenic families while identifying intron positions conserved across metazoan phyla. We developed a program facilitating the identification of EPIC loci which allowed slight variation in intron position. From the Homolens databases we selected 29 gene families which contained 52 promising introns for which we designed 93 primer pairs. PCR tests were performed on several ascidians, echinoderms, bivalves and cnidarians. On average, 24 different introns per genus were amplified in bilaterians. Remarkably, five of the introns successfully amplified in all of the metazoan genera tested (a dozen genera, including cnidarians). The influence of several factors on amplification success was investigated. Success rate was not related to the phylogenetic relatedness of a taxon to the groups that most influenced primer design, showing that these EPIC markers are extremely conserved in animals. Conclusions: Our new method now makes it possible to (i) rapidly isolate a set of EPIC markers for any phylum, even outside the animal kingdom, and thus, (ii) compare genetic diversity at potentially homologous polymorphic loci between divergent taxa. Background Despite the crucial need for genetic markers indepen- dent from the non recombining mitochondrial genome, nuclear markers remain much less used than mitochon- drial ones in metazoans (in the Entrez-Nucleotide data- base, there are about ten times fewer entries containing “population” and “nuclear marker” or “population” and “nuclear”, when used as key-words, than entries contain- ing “ mitochondrial ” instead of “ nuclear ” ). When choosing molecular genetic markers for a given biodi- versity study, two properties, codominance and the pos- sibility of reconstructing evolutionary relationships among alleles, are generally desirable but are often diffi- cult to obtain [1]. During the last decade, microsatellites became the most popular codominant markers. How- ever, introns are well known for providing potential markers variable within species, using EPIC-PCR. EPIC loci have several advantages compared to microsatellites. Owing to the position of the primers in conserved exons, EPICs are potentially applicable across species and much less prone to null alleles. After sequencing the variants, evolutionary relationships among alleles can be inferred much more accurately than for * Correspondence: [email protected] 11 Aix-Marseille Université, Laboratoire DIMAR (diversité, évolution et écologie fonctionnelle marine), CNRS UMR6540, rue de la batterie des Lions, 13007 Marseille, France Full list of author information is available at the end of the article Chenuil et al. BMC Evolutionary Biology 2010, 10:276 http://www.biomedcentral.com/1471-2148/10/276 © 2010 Chenuil et al; licensee BioMed Central Ltd. This is an Open Access article distributed under the terms of the Creative Commons Attribution License (http://creativecommons.org/licenses/by/2.0), which permits unrestricted use, distribution, and reproduction in any medium, provided the original work is properly cited.
Transcript of An efficient method to find poentially universal population genetic markers, applied to metazoans
METHODOLOGY ARTICLE Open Access
An efficient method to find potentially universalpopulation genetic markers, applied tometazoansAnne Chenuil11*, Thierry B Hoareau1, Emilie Egea11, Gwilherm Penant11, Caroline Rocher11, Didier Aurelle11,Kenza Mokhtar-Jamai11, John DD Bishop2, Emilie Boissin3, Angie Diaz4, Manuela Krakau5,Pieternella C Luttikhuizen6, Francesco P Patti7, Nicolas Blavet8, Sylvain Mousset9,10
Abstract
Background: Despite the impressive growth of sequence databases, the limited availability of nuclear markers thatare sufficiently polymorphic for population genetics and phylogeography and applicable across various phylarestricts many potential studies, particularly in non-model organisms. Numerous introns have invariant positionsamong kingdoms, providing a potential source for such markers. Unfortunately, most of the few known EPIC (ExonPrimed Intron Crossing) loci are restricted to vertebrates or belong to multigenic families.
Results: In order to develop markers with broad applicability, we designed a bioinformatic approach aimed atavoiding multigenic families while identifying intron positions conserved across metazoan phyla. We developed aprogram facilitating the identification of EPIC loci which allowed slight variation in intron position. From theHomolens databases we selected 29 gene families which contained 52 promising introns for which we designed 93primer pairs. PCR tests were performed on several ascidians, echinoderms, bivalves and cnidarians. On average, 24different introns per genus were amplified in bilaterians. Remarkably, five of the introns successfully amplified in allof the metazoan genera tested (a dozen genera, including cnidarians). The influence of several factors onamplification success was investigated. Success rate was not related to the phylogenetic relatedness of a taxon tothe groups that most influenced primer design, showing that these EPIC markers are extremely conserved inanimals.
Conclusions: Our new method now makes it possible to (i) rapidly isolate a set of EPIC markers for any phylum,even outside the animal kingdom, and thus, (ii) compare genetic diversity at potentially homologous polymorphicloci between divergent taxa.
BackgroundDespite the crucial need for genetic markers indepen-dent from the non recombining mitochondrial genome,nuclear markers remain much less used than mitochon-drial ones in metazoans (in the Entrez-Nucleotide data-base, there are about ten times fewer entries containing“population” and “nuclear marker” or “population” and“nuclear”, when used as key-words, than entries contain-ing “mitochondrial” instead of “nuclear”). When
choosing molecular genetic markers for a given biodi-versity study, two properties, codominance and the pos-sibility of reconstructing evolutionary relationshipsamong alleles, are generally desirable but are often diffi-cult to obtain [1]. During the last decade, microsatellitesbecame the most popular codominant markers. How-ever, introns are well known for providing potentialmarkers variable within species, using EPIC-PCR. EPICloci have several advantages compared to microsatellites.Owing to the position of the primers in conservedexons, EPICs are potentially applicable across speciesand much less prone to null alleles. After sequencingthe variants, evolutionary relationships among allelescan be inferred much more accurately than for
* Correspondence: [email protected] Université, Laboratoire DIMAR (diversité, évolution et écologiefonctionnelle marine), CNRS UMR6540, rue de la batterie des Lions, 13007Marseille, FranceFull list of author information is available at the end of the article
Chenuil et al. BMC Evolutionary Biology 2010, 10:276http://www.biomedcentral.com/1471-2148/10/276
© 2010 Chenuil et al; licensee BioMed Central Ltd. This is an Open Access article distributed under the terms of the Creative CommonsAttribution License (http://creativecommons.org/licenses/by/2.0), which permits unrestricted use, distribution, and reproduction inany medium, provided the original work is properly cited.
microsatellites, which are very susceptible to homoplasy[2]. There is also a less well known but important pro-blem with microsatellites: in some species, most micro-satellites appear to belong to the same family (or a smallnumber of families) of repeated elements; in such casescodominant genotyping is difficult since the primersoften anneal to multiple paralogous regions ([3,4] andChenuil, unpublished).A recent computer program [5] allows the identifica-
tion of introns at conserved positions in a species forwhich EST sequences are available by comparison witha related model species for which extensive sequenceinformation is available (see also [6]). Another studydeveloped a bioinformatic pipeline to identify EPICloci by comparison of two or more whole-genomesequence datasets, and tested a dozen of these loci byPCR-sequencing in distantly related teleost fishes [7].By contrast, our approach is designed to find intronpositions and define primers able to amplify a widervariety of species from which we may have absolutelyno sequence data.The positions of introns are extremely conserved dur-
ing evolution; for instance, 14% of animal introns matchplant intron positions [8,9]. Although this should havefavoured the development of EPIC markers conserved indifferent phyla, only half a dozen EPIC loci were pro-posed by [10] and by [11]. These loci have rarely beenused outside vertebrates (e.g. [12-14]) and in numerousspecies none of the tested EPIC loci appeared usable(e.g. [15]). EPIC loci can be developed specifically for agiven taxon, often using genomic and cDNA sequencedata (e.g. [16,17]; Aurelle et al., submitted). Only verte-brates benefit from a relatively consistent set of EPICloci [18,19]. Several reasons for such biases can beinvoked. (1) These “universal” EPIC loci were chosen inextremely conserved genes, and, not surprisingly, oftenappeared to belong to multigenic families, which limitedtheir use as codominant markers due to simultaneousamplification of paralogs. (2) Few sequences were avail-able (often none outside vertebrates) to properly definePCR primers, thus PCR amplifications often failed. (3)Primers were generally designed considering the nucleo-tide variation observed in the data set available (oftenphylogenetically limited), but ignoring amino-acid con-servation and code degeneracy.Our study was designed to avoid these shortcomings.
We identified putative universal EPIC loci and designedprimers to amplify them in metazoans, taking advantageof the increased availability of properly annotated, phy-logenetically diverse whole-genome sequences. Weactively avoided multigenic families, and used a primerdesign strategy aimed at preserving amino-acidsequences while allowing synonymous codon changes.For this purpose, we developed dedicated bioinformatic
tools, and then tested all the primer pairs designed indivergent animal phyla for PCR amplification underrelatively standardized conditions.
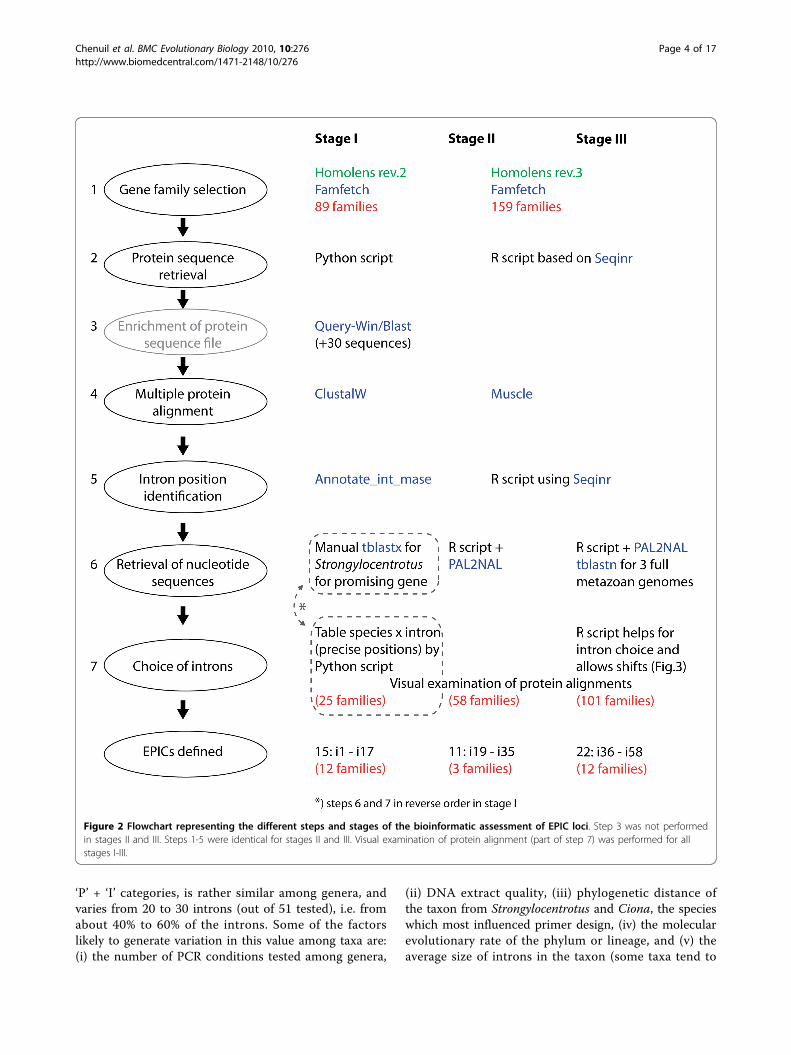
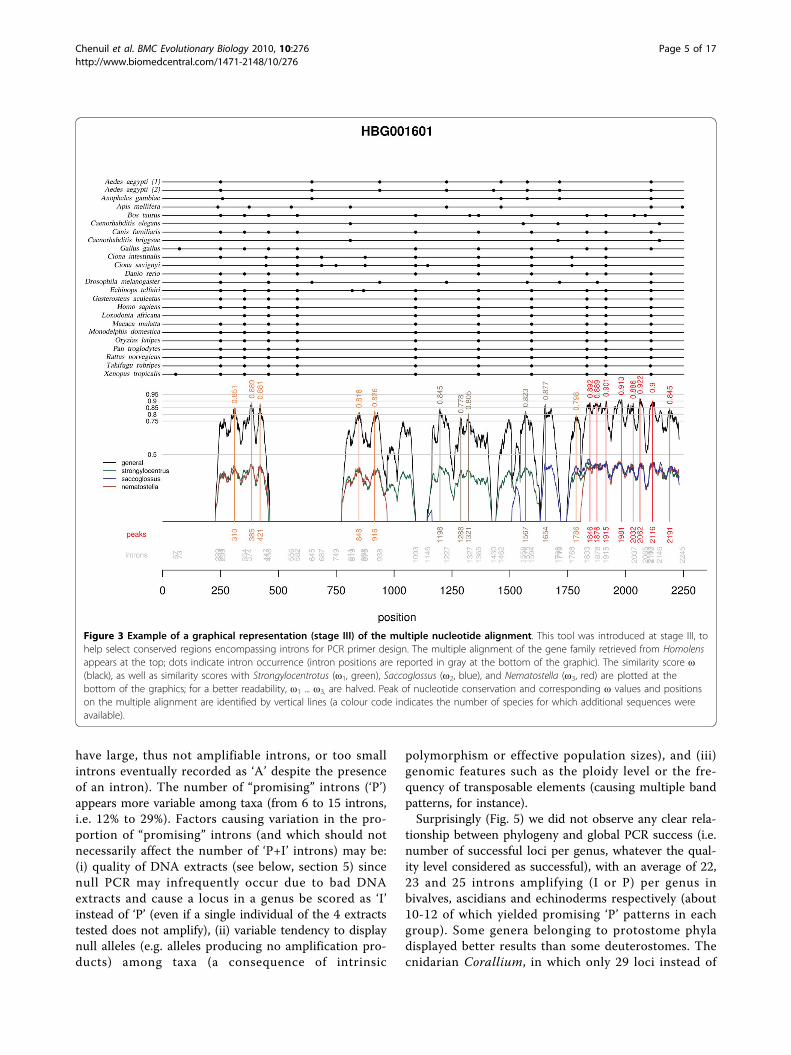
Results-DiscussionPotential EPIC loci found in data basesThe number of introns for which we designed andtested primer pairs was respectively 15 (named betweeni1 to i17), 11 (i19 to i35) and 22 (i36 to i58) for stages I,II and III described in the Methods section (Fig. 1, Fig.2). Intron numbers are not consecutive because wecould not design satisfactory primer pairs for someintrons that appeared good at the preceding step. Inaddition, we designed primers for two genes containingalready known “universal” EPICs: in ATPS-a, one introncorresponds to the one in Jarman et al (2002) [11] withslightly different primer sequences, and primers weredesigned for an additional intron; in EF1-a, two primerpairs were designed for each of two introns. The 52introns came from 29 different gene families and corre-sponded to 93 primer pairs tested in all species. Surpris-ingly, a single family was retained from both stages Iand II (so that intron 2 is the same as intron 22). Fromthe 89 families containing no duplication nodes (i.e. anode containing the same clusters of taxa several times,due to gene duplication) isolated during stage I, only sixintrons appeared to be present at exactly the samenucleotide position in 100% of the species, and for only3 of these, corresponding to EPIC 1, 4 and 5, could wedesign satisfactory primer pairs (Fig. 1). Thus, we alsodesigned primers for some introns that were present in100% of the deuterostome species in the amino-acidalignments (i.e. vertebrates and Ciona, no echinodermspecies being available in the Homolens database). Forsubsequent stages, intron position was not necessarilyperfectly invariant (see Methods). Fig. 3 displays anexample of the output of the graphical script designedfor stage III. For 36 introns (56 primer pairs out of 93)we could define a forward and a reverse primer whosedegeneracy did not exceed 8-fold. For 12 of them (22primer pairs), degeneracy was lower than or equal to 6.In particular, the primers designed for introns 21, 25,26, 45, 50 and 54 displayed no more than a 2- or 4-folddegeneracy (Fig. 1).
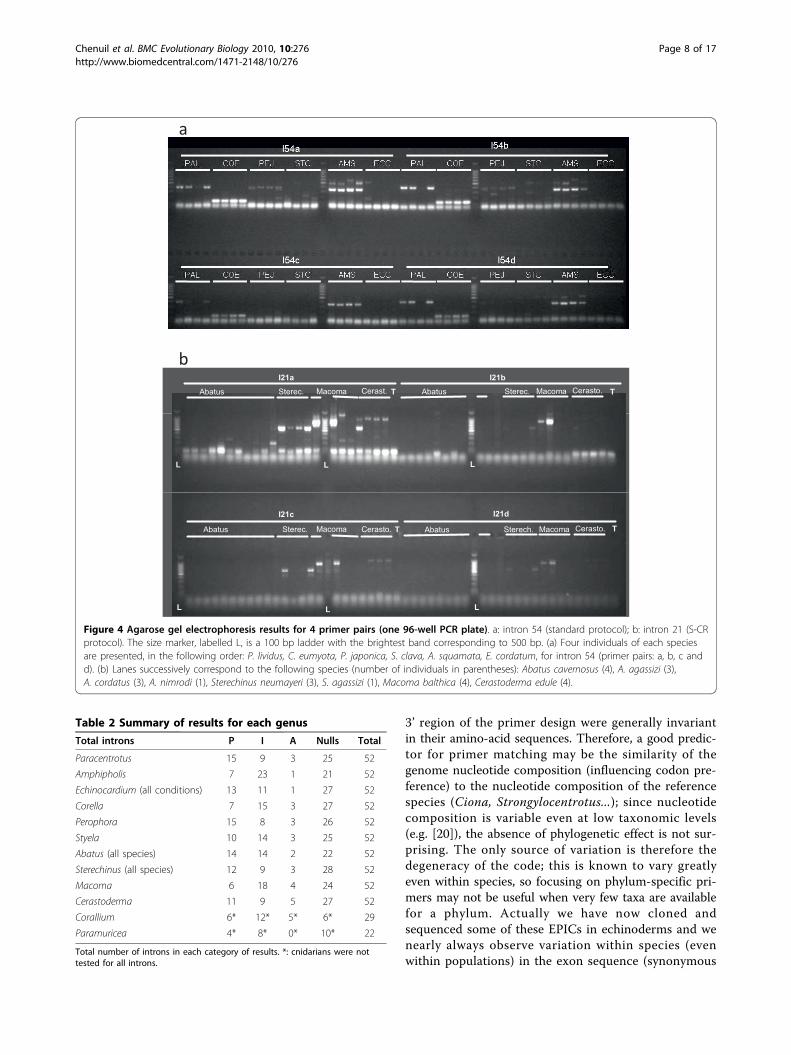
Effect of taxonomy on PCR resultsFor each stage, protein family, and intron, Table 1 andTable 2 report the results of the PCR for each genus asobserved on agarose gels (Fig. 4) (and the total numberof genera), distinguishing the three quality levels ‘P′(Pro-mising), ‘I’ (Intron-size amplicon) and ‘A’ (Amplifica-tion) defined in the Methods section V. The number ofintrons producing an amplification product large enoughto contain an intron of at least 70 bp, i.e. pooling the
Chenuil et al. BMC Evolutionary Biology 2010, 10:276http://www.biomedcentral.com/1471-2148/10/276
Page 2 of 17
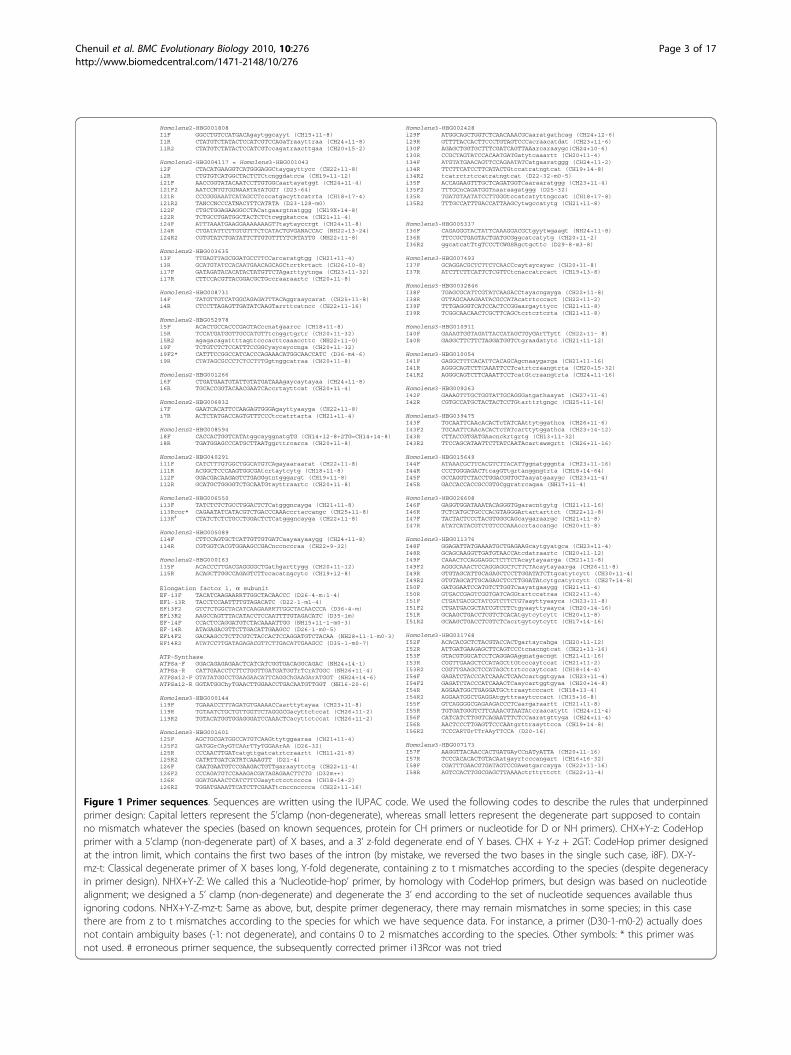
Figure 1 Primer sequences. Sequences are written using the IUPAC code. We used the following codes to describe the rules that underpinnedprimer design: Capital letters represent the 5’clamp (non-degenerate), whereas small letters represent the degenerate part supposed to containno mismatch whatever the species (based on known sequences, protein for CH primers or nucleotide for D or NH primers). CHX+Y-z: CodeHopprimer with a 5’clamp (non-degenerate part) of X bases, and a 3’ z-fold degenerate end of Y bases. CHX + Y-z + 2GT: CodeHop primer designedat the intron limit, which contains the first two bases of the intron (by mistake, we reversed the two bases in the single such case, i8F). DX-Y-mz-t: Classical degenerate primer of X bases long, Y-fold degenerate, containing z to t mismatches according to the species (despite degeneracyin primer design). NHX+Y-Z: We called this a ‘Nucleotide-hop’ primer, by homology with CodeHop primers, but design was based on nucleotidealignment; we designed a 5’ clamp (non-degenerate) and degenerate the 3’ end according to the set of nucleotide sequences available thusignoring codons. NHX+Y-Z-mz-t: Same as above, but, despite primer degeneracy, there may remain mismatches in some species; in this casethere are from z to t mismatches according to the species for which we have sequence data. For instance, a primer (D30-1-m0-2) actually doesnot contain ambiguity bases (-1: not degenerate), and contains 0 to 2 mismatches according to the species. Other symbols: * this primer wasnot used. # erroneous primer sequence, the subsequently corrected primer i13Rcor was not tried
Chenuil et al. BMC Evolutionary Biology 2010, 10:276http://www.biomedcentral.com/1471-2148/10/276
Page 3 of 17
‘P’ + ‘I’ categories, is rather similar among genera, andvaries from 20 to 30 introns (out of 51 tested), i.e. fromabout 40% to 60% of the introns. Some of the factorslikely to generate variation in this value among taxa are:(i) the number of PCR conditions tested among genera,
(ii) DNA extract quality, (iii) phylogenetic distance ofthe taxon from Strongylocentrotus and Ciona, the specieswhich most influenced primer design, (iv) the molecularevolutionary rate of the phylum or lineage, and (v) theaverage size of introns in the taxon (some taxa tend to
Figure 2 Flowchart representing the different steps and stages of the bioinformatic assessment of EPIC loci. Step 3 was not performedin stages II and III. Steps 1-5 were identical for stages II and III. Visual examination of protein alignment (part of step 7) was performed for allstages I-III.
Chenuil et al. BMC Evolutionary Biology 2010, 10:276http://www.biomedcentral.com/1471-2148/10/276
Page 4 of 17
have large, thus not amplifiable introns, or too smallintrons eventually recorded as ‘A’ despite the presenceof an intron). The number of “promising” introns (‘P’)appears more variable among taxa (from 6 to 15 introns,i.e. 12% to 29%). Factors causing variation in the pro-portion of “promising” introns (and which should notnecessarily affect the number of ‘P+I’ introns) may be:(i) quality of DNA extracts (see below, section 5) sincenull PCR may infrequently occur due to bad DNAextracts and cause a locus in a genus be scored as ‘I’instead of ‘P’ (even if a single individual of the 4 extractstested does not amplify), (ii) variable tendency to displaynull alleles (e.g. alleles producing no amplification pro-ducts) among taxa (a consequence of intrinsic
polymorphism or effective population sizes), and (iii)genomic features such as the ploidy level or the fre-quency of transposable elements (causing multiple bandpatterns, for instance).Surprisingly (Fig. 5) we did not observe any clear rela-
tionship between phylogeny and global PCR success (i.e.number of successful loci per genus, whatever the qual-ity level considered as successful), with an average of 22,23 and 25 introns amplifying (I or P) per genus inbivalves, ascidians and echinoderms respectively (about10-12 of which yielded promising ‘P’ patterns in eachgroup). Some genera belonging to protostome phyladisplayed better results than some deuterostomes. Thecnidarian Corallium, in which only 29 loci instead of
Figure 3 Example of a graphical representation (stage III) of the multiple nucleotide alignment. This tool was introduced at stage III, tohelp select conserved regions encompassing introns for PCR primer design. The multiple alignment of the gene family retrieved from Homolensappears at the top; dots indicate intron occurrence (intron positions are reported in gray at the bottom of the graphic). The similarity score ω(black), as well as similarity scores with Strongylocentrotus (ω1, green), Saccoglossus (ω2, blue), and Nematostella (ω3, red) are plotted at thebottom of the graphics; for a better readability, ω1 ... ω3, are halved. Peak of nucleotide conservation and corresponding ω values and positionson the multiple alignment are identified by vertical lines (a colour code indicates the number of species for which additional sequences wereavailable).
Chenuil et al. BMC Evolutionary Biology 2010, 10:276http://www.biomedcentral.com/1471-2148/10/276
Page 5 of 17
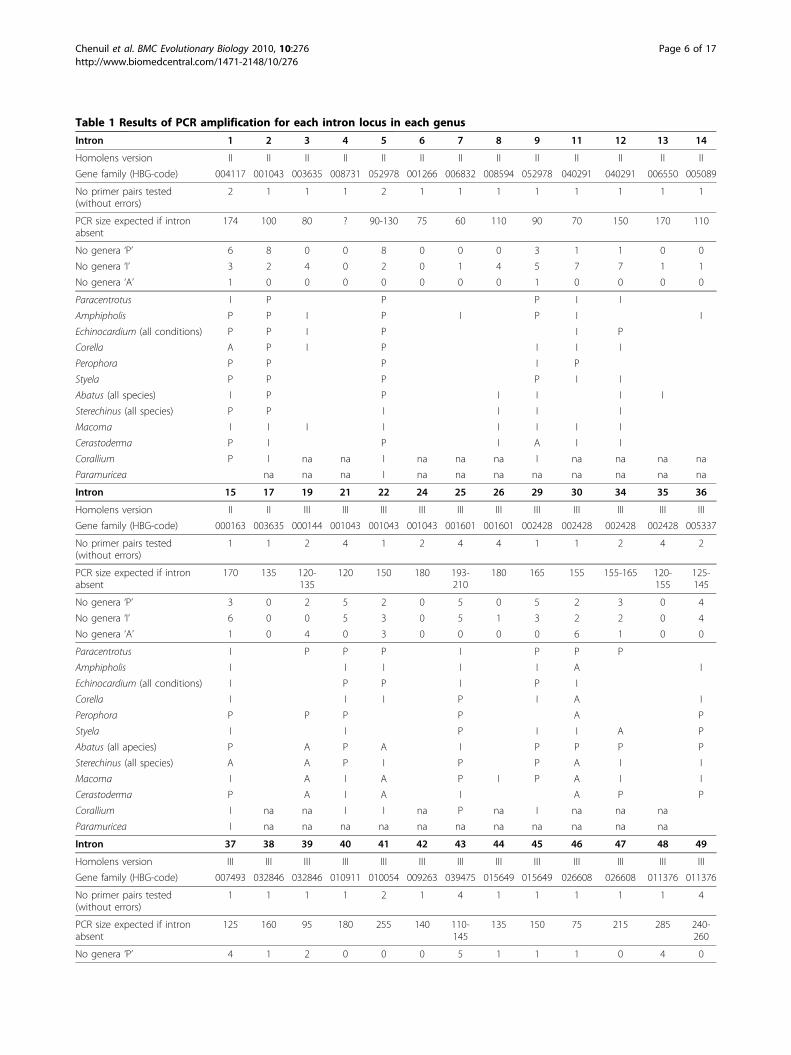
Table 1 Results of PCR amplification for each intron locus in each genus
Intron 1 2 3 4 5 6 7 8 9 11 12 13 14
Homolens version II II II II II II II II II II II II II
Gene family (HBG-code) 004117 001043 003635 008731 052978 001266 006832 008594 052978 040291 040291 006550 005089
No primer pairs tested(without errors)
2 1 1 1 2 1 1 1 1 1 1 1 1
PCR size expected if intronabsent
174 100 80 ? 90-130 75 60 110 90 70 150 170 110
No genera ‘P’ 6 8 0 0 8 0 0 0 3 1 1 0 0
No genera ‘I’ 3 2 4 0 2 0 1 4 5 7 7 1 1
No genera ‘A’ 1 0 0 0 0 0 0 0 1 0 0 0 0
Paracentrotus I P P P I I
Amphipholis P P I P I P I I
Echinocardium (all conditions) P P I P I P
Corella A P I P I I I
Perophora P P P I P
Styela P P P P I I
Abatus (all species) I P P I I I I
Sterechinus (all species) P P I I I I
Macoma I I I I I I I I
Cerastoderma P I P I A I I
Corallium P I na na I na na na I na na na na
Paramuricea na na na I na na na na na na na na
Intron 15 17 19 21 22 24 25 26 29 30 34 35 36
Homolens version II II III III III III III III III III III III III
Gene family (HBG-code) 000163 003635 000144 001043 001043 001043 001601 001601 002428 002428 002428 002428 005337
No primer pairs tested(without errors)
1 1 2 4 1 2 4 4 1 1 2 4 2
PCR size expected if intronabsent
170 135 120-135
120 150 180 193-210
180 165 155 155-165 120-155
125-145
No genera ‘P’ 3 0 2 5 2 0 5 0 5 2 3 0 4
No genera ‘I’ 6 0 0 5 3 0 5 1 3 2 2 0 4
No genera ‘A’ 1 0 4 0 3 0 0 0 0 6 1 0 0
Paracentrotus I P P P I P P P
Amphipholis I I I I I A I
Echinocardium (all conditions) I P P I P I
Corella I I I P I A I
Perophora P P P P A P
Styela I I P I I A P
Abatus (all apecies) P A P A I P P P P
Sterechinus (all species) A A P I P P A I I
Macoma I A I A P I P A I I
Cerastoderma P A I A I A P P
Corallium I na na I I na P na I na na na
Paramuricea I na na na na na na na na na na na
Intron 37 38 39 40 41 42 43 44 45 46 47 48 49
Homolens version III III III III III III III III III III III III III
Gene family (HBG-code) 007493 032846 032846 010911 010054 009263 039475 015649 015649 026608 026608 011376 011376
No primer pairs tested(without errors)
1 1 1 1 2 1 4 1 1 1 1 1 4
PCR size expected if intronabsent
125 160 95 180 255 140 110-145
135 150 75 215 285 240-260
No genera ‘P’ 4 1 2 0 0 0 5 1 1 1 0 4 0
Chenuil et al. BMC Evolutionary Biology 2010, 10:276http://www.biomedcentral.com/1471-2148/10/276
Page 6 of 17
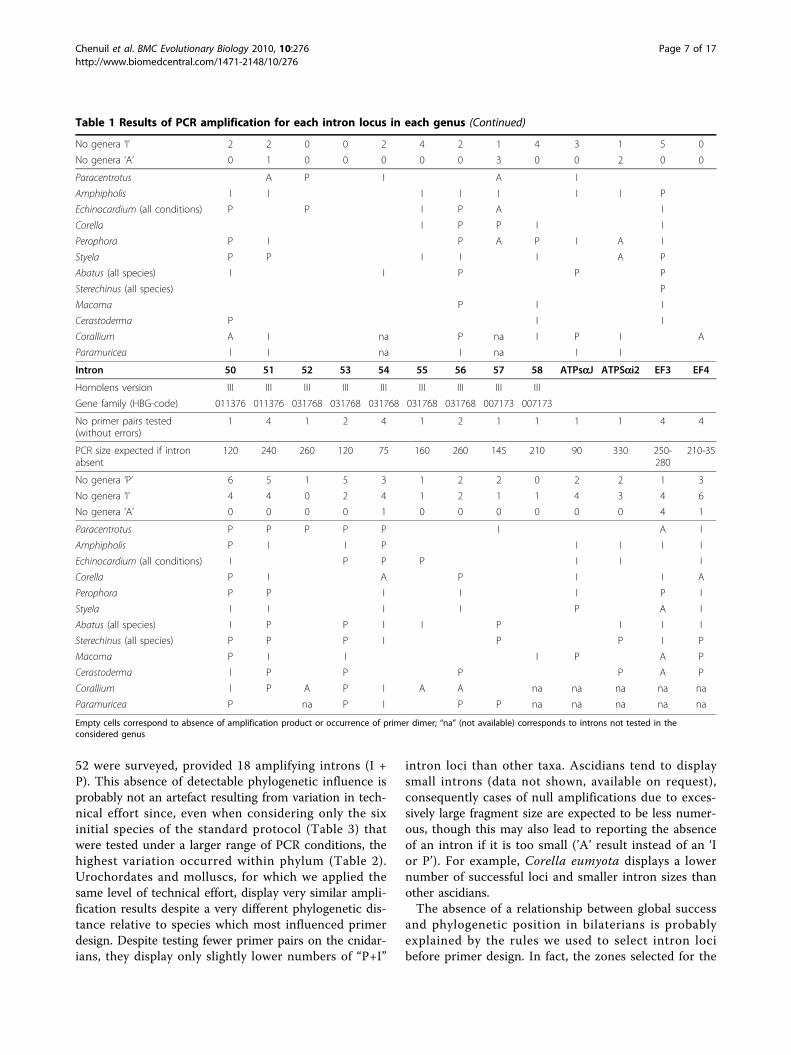
52 were surveyed, provided 18 amplifying introns (I +P). This absence of detectable phylogenetic influence isprobably not an artefact resulting from variation in tech-nical effort since, even when considering only the sixinitial species of the standard protocol (Table 3) thatwere tested under a larger range of PCR conditions, thehighest variation occurred within phylum (Table 2).Urochordates and molluscs, for which we applied thesame level of technical effort, display very similar ampli-fication results despite a very different phylogenetic dis-tance relative to species which most influenced primerdesign. Despite testing fewer primer pairs on the cnidar-ians, they display only slightly lower numbers of “P+I”
intron loci than other taxa. Ascidians tend to displaysmall introns (data not shown, available on request),consequently cases of null amplifications due to exces-sively large fragment size are expected to be less numer-ous, though this may also lead to reporting the absenceof an intron if it is too small (’A’ result instead of an ‘Ior P’). For example, Corella eumyota displays a lowernumber of successful loci and smaller intron sizes thanother ascidians.The absence of a relationship between global success
and phylogenetic position in bilaterians is probablyexplained by the rules we used to select intron locibefore primer design. In fact, the zones selected for the
Table 1 Results of PCR amplification for each intron locus in each genus (Continued)
No genera ‘I’ 2 2 0 0 2 4 2 1 4 3 1 5 0
No genera ‘A’ 0 1 0 0 0 0 0 3 0 0 2 0 0
Paracentrotus A P I A I
Amphipholis I I I I I I I P
Echinocardium (all conditions) P P I P A I
Corella I P P I I
Perophora P I P A P I A I
Styela P P I I I A P
Abatus (all species) I I P P P
Sterechinus (all species) P
Macoma P I I
Cerastoderma P I I
Corallium A I na P na I P I A
Paramuricea I I na I na I I
Intron 50 51 52 53 54 55 56 57 58 ATPsaJ ATPSai2 EF3 EF4
Homolens version III III III III III III III III III
Gene family (HBG-code) 011376 011376 031768 031768 031768 031768 031768 007173 007173
No primer pairs tested(without errors)
1 4 1 2 4 1 2 1 1 1 1 4 4
PCR size expected if intronabsent
120 240 260 120 75 160 260 145 210 90 330 250-280
210-35
No genera ‘P’ 6 5 1 5 3 1 2 2 0 2 2 1 3
No genera ‘I’ 4 4 0 2 4 1 2 1 1 4 3 4 6
No genera ‘A’ 0 0 0 0 1 0 0 0 0 0 0 4 1
Paracentrotus P P P P P I A I
Amphipholis P I I P I I I I
Echinocardium (all conditions) I P P P I I I
Corella P I A P I I A
Perophora P P I I I P I
Styela I I I I P A I
Abatus (all species) I P P I I P I I I
Sterechinus (all species) P P P I P P I P
Macoma P I I I P A P
Cerastoderma I P P P P A P
Corallium I P A P I A A na na na na na
Paramuricea P na P I P P na na na na na
Empty cells correspond to absence of amplification product or occurrence of primer dimer; “na” (not available) corresponds to introns not tested in theconsidered genus
Chenuil et al. BMC Evolutionary Biology 2010, 10:276http://www.biomedcentral.com/1471-2148/10/276
Page 7 of 17
3’ region of the primer design were generally invariantin their amino-acid sequences. Therefore, a good predic-tor for primer matching may be the similarity of thegenome nucleotide composition (influencing codon pre-ference) to the nucleotide composition of the referencespecies (Ciona, Strongylocentrotus...); since nucleotidecomposition is variable even at low taxonomic levels(e.g. [20]), the absence of phylogenetic effect is not sur-prising. The only source of variation is therefore thedegeneracy of the code; this is known to vary greatlyeven within species, so focusing on phylum-specific pri-mers may not be useful when very few taxa are availablefor a phylum. Actually we have now cloned andsequenced some of these EPICs in echinoderms and wenearly always observe variation within species (evenwithin populations) in the exon sequence (synonymous
Table 2 Summary of results for each genus
Total introns P I A Nulls Total
Paracentrotus 15 9 3 25 52
Amphipholis 7 23 1 21 52
Echinocardium (all conditions) 13 11 1 27 52
Corella 7 15 3 27 52
Perophora 15 8 3 26 52
Styela 10 14 3 25 52
Abatus (all species) 14 14 2 22 52
Sterechinus (all species) 12 9 3 28 52
Macoma 6 18 4 24 52
Cerastoderma 11 9 5 27 52
Corallium 6* 12* 5* 6* 29
Paramuricea 4* 8* 0* 10* 22
Total number of introns in each category of results. *: cnidarians were nottested for all introns.
Figure 4 Agarose gel electrophoresis results for 4 primer pairs (one 96-well PCR plate). a: intron 54 (standard protocol); b: intron 21 (S-CRprotocol). The size marker, labelled L, is a 100 bp ladder with the brightest band corresponding to 500 bp. (a) Four individuals of each speciesare presented, in the following order: P. lividus, C. eumyota, P. japonica, S. clava, A. squamata, E. cordatum, for intron 54 (primer pairs: a, b, c andd). (b) Lanes successively correspond to the following species (number of individuals in parentheses): Abatus cavernosus (4), A. agassizi (3),A. cordatus (3), A. nimrodi (1), Sterechinus neumayeri (3), S. agassizi (1), Macoma balthica (4), Cerastoderma edule (4).
Chenuil et al. BMC Evolutionary Biology 2010, 10:276http://www.biomedcentral.com/1471-2148/10/276
Page 8 of 17
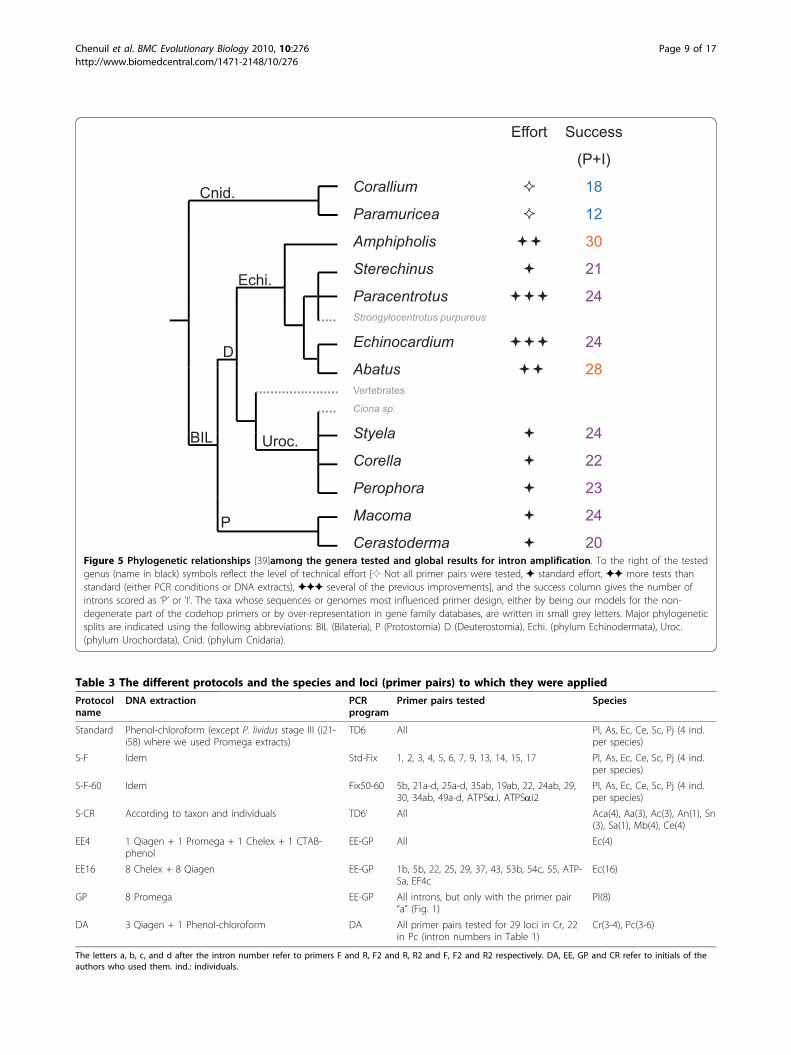
Figure 5 Phylogenetic relationships [39]among the genera tested and global results for intron amplification. To the right of the testedgenus (name in black) symbols reflect the level of technical effort [✧ Not all primer pairs were tested, ✦ standard effort, ✦✦ more tests thanstandard (either PCR conditions or DNA extracts), ✦✦✦ several of the previous improvements], and the success column gives the number ofintrons scored as ‘P’ or ‘I’. The taxa whose sequences or genomes most influenced primer design, either by being our models for the non-degenerate part of the codehop primers or by over-representation in gene family databases, are written in small grey letters. Major phylogeneticsplits are indicated using the following abbreviations: BIL (Bilateria), P (Protostomia) D (Deuterostomia), Echi. (phylum Echinodermata), Uroc.(phylum Urochordata), Cnid. (phylum Cnidaria).
Table 3 The different protocols and the species and loci (primer pairs) to which they were applied
Protocolname
DNA extraction PCRprogram
Primer pairs tested Species
Standard Phenol-chloroform (except P. lividus stage III (i21-i58) where we used Promega extracts)
TD6 All Pl, As, Ec, Ce, Sc, Pj (4 ind.per species)
S-F Idem Std-Fix 1, 2, 3, 4, 5, 6, 7, 9, 13, 14, 15, 17 Pl, As, Ec, Ce, Sc, Pj (4 ind.per species)
S-F-60 Idem Fix50-60 5b, 21a-d, 25a-d, 35ab, 19ab, 22, 24ab, 29,30, 34ab, 49a-d, ATPSaJ, ATPSai2
Pl, As, Ec, Ce, Sc, Pj (4 ind.per species)
S-CR According to taxon and individuals TD6’ All Aca(4), Aa(3), Ac(3), An(1), Sn(3), Sa(1), Mb(4), Ce(4)
EE4 1 Qiagen + 1 Promega + 1 Chelex + 1 CTAB-phenol
EE-GP All Ec(4)
EE16 8 Chelex + 8 Qiagen EE-GP 1b, 5b, 22, 25, 29, 37, 43, 53b, 54c, 55, ATP-Sa, EF4c
Ec(16)
GP 8 Promega EE-GP All introns, but only with the primer pair“a” (Fig. 1)
Pl(8)
DA 3 Qiagen + 1 Phenol-chloroform DA All primer pairs tested for 29 loci in Cr, 22in Pc (intron numbers in Table 1)
Cr(3-4), Pc(3-6)
The letters a, b, c, and d after the intron number refer to primers F and R, F2 and R, R2 and F, F2 and R2 respectively. DA, EE, GP and CR refer to initials of theauthors who used them. ind.: individuals.
Chenuil et al. BMC Evolutionary Biology 2010, 10:276http://www.biomedcentral.com/1471-2148/10/276
Page 9 of 17

changes). However, when the precise pattern at eachintron was considered and the data (from Table 1) wereanalysed through a factorial correspondence analysis,the genera seemed to group according to their phylum(Fig. 6, see legend for details), illustrating the fact thatsome introns are more useful in some phyla than inothers. Within echinoderms, more genera were sur-veyed, but we did not observe any taxonomic trend,either comparing ophiuroids versus echinoids, or regularversus irregular echinoids. Echinoderms appear widelyscattered, by contrast with Urochordates. This mayreflect different genome evolutionary rates of thosephyla though a richer taxonomic sampling is required totest this hypothesis.Some gene families appear to be extremely good pro-
viders of EPIC markers (Table 4). Remarkably, fiveintrons, from four different gene families, amplifyintron-sized products (‘P’ or ‘I’) in all the metazoan gen-era tested (ten to twelve depending on intron) (Table 4).The previously known universal EPICs tested, ATPS andEF1, do not belong to these families.
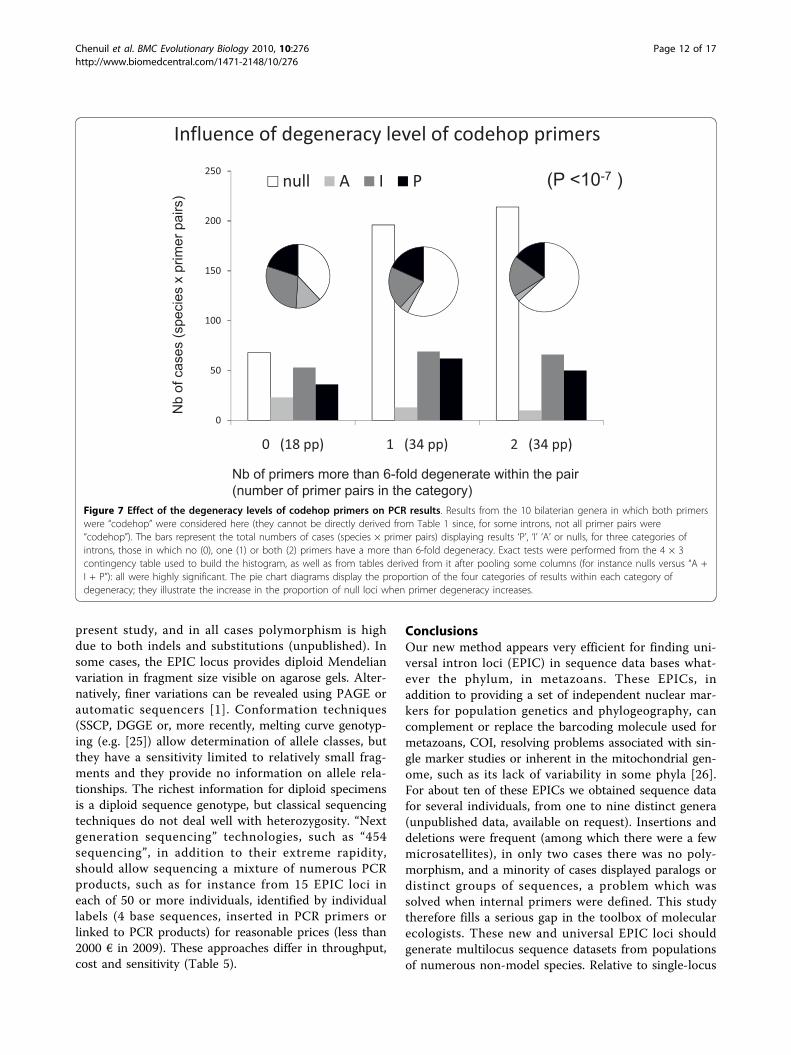
Effect of primer designThe least degenerate primers provided the best results(Fig. 7, highly significant exact tests) for the primerpairs composed of two codehop primers (86 cases). Thisresult was not trivial: if the taxa available in our proteinalignments had not been sufficiently representative of
the diversity of phyla tested–among deuterostomes, forinstance, the Homolens database provided only verte-brates and one urochordate genus–higher amplificationsuccess would have been observed for more degenerateprimers. Despite this significant relationship, some ofthe least degenerate introns at the stage of primerdesign never amplified (e.g. introns 6, 7, 24 and 49).Codehop primers seem slightly more efficient than pri-mers designed from nucleotide alignments only, thoughthis is not statistically significant (additional file 1).
Effects of PCR program and extraction methodComparisons, for 12 primer pairs, of touch-down andfixed annealing temperature programs suggest thattouch-down programs are more stringent (less success)and less prone to produce artefactual additional frag-ments (higher proportion of ‘P’ patterns) (additional file1). The two-phase program (tested on 28 primer pairs)also appears to help (additional file 1). However, weobtained no statistical support for these effects. Since inmost experiments we used program TD6, our globalresults may be improved by using alternative programs.A strong influence of DNA extraction and/or tissue
storage history, depending on the species, was revealed(additional file 1).
Obtaining new EPIC loci for any eukaryote lineageOur method can potentially be applied to obtain newEPIC loci for any phylogenetic group. Three strategiescan be followed. (i) Using the last version of Homolens,the famfetch tool, and the graphical tool developed inthis study, one can isolate numerous new EPIC loci,eventually decreasing the stringency level allowing dupli-cation nodes in some genomes, if numerous loci aredesired. (ii) More simply, one can focus on the genefamilies we isolated, and retrieve from protein, nucleo-tide or EST sequence databases the entries correspond-ing to the desired lineages; primer pairs should then bedesigned following our method. (iii) One can just testthe primer pairs developed in our study (Fig. 1), prefer-ably using several DNA extraction methods, which canbe done in less than 10 working days and for severalspecies simultaneously. Even for kingdoms very distantfrom metazoans (e.g. plants, fungi, or protists) the sec-ond approach may provide successful loci since in someof these gene families the protein alignment filesincluded sequences from plants. We can predict that thesuccess rate will not depend much on the phylogeneticproximity of the taxa to deuterostomes (since those pro-tein sequences are definitely strongly conserved) but willbe influenced more on average by the genomic substitu-tion rate of the taxonomic group. For instance, the ecdy-sozoan phyla (e.g. arthropods and nematodes) may notwork as well as molluscs and annelids, though these
Figure 6 Correspondence analysis representing the bilateriangenera according to their results for each intron. Nulls, A, I andP were respectively scored as 0,1,2 and 3. Methodological changessuch as (i) adding cnidarians (therefore reducing the number ofvariates from 52 to 22 or 29), (ii) considering nulls (scored as 0)versus all amplifying categories (1) or (iii) changing the nature ofthe multivariate analysis did not change the pattern. When includedin analyses, the two cnidarians appeared neither to form a tightgroup, nor to be outliers relative to bilaterian phyla. Empty symbolsrepresent genera of the Echinodermata (stars, circles and ovoidsintuitively represent ophiuroids, regular sea uchins and irregular seaurchins, respectively), black triangles represent ascidians(Urochordata) and black squares represent the two bilvalves(Mollusca).
Chenuil et al. BMC Evolutionary Biology 2010, 10:276http://www.biomedcentral.com/1471-2148/10/276
Page 10 of 17

phyla share a common ancestor relative to deutero-stomes, since their genomes are known to evolve rapidlyat the nucleotide level [21,22]. For the third strategy,based on already defined primers, genome nucleotidecomposition may be an important factor (see above).The facts that (i) low degeneracy codehop primers per-
formed better than high degeneracy primers, and (ii) phy-logenetic distance (to vertebrates and Ciona) has norelationship with global amplification results, are positiveexperimental findings of this study, and suggest that thesimplest strategy (use of the primers we defined) may besufficient in most metazoan species to obtain severalEPIC loci. In the increasing number of phylogeneticgroups where sufficient EST sequence data are availableto enrich nucleotide alignments in a variety of taxa, pri-mer design may not require using the Codehop strategy(personal observation from a new ongoing EPIC project).
From EPIC identification to genotyping of large samplesOnce a promising EPIC locus has been found, it is notalways straightforward to directly characterize
populations with it. Obtaining sequence data prior togenotyping is recommended. In some cases, goodresults are provided by direct sequencing of PCR pro-ducts. There are generally no indels in the exonsequence, so the sequences are readable even withambiguous positions due to heterozygosity in thisregion, allowing the design of specific primers. In some(e.g. inbred) species where homozygous individuals arecommon, direct sequencing is very useful, and even-tually, “heterozygous sequences” may be deduced auto-matically from sequence files containing ambiguities,using dedicated software [23,24]. When direct sequen-cing is not satisfactory, we recommend cloning theEPIC amplicons from a dozen individuals and sequen-cing about 10 clones per individual to assess the natureand the level of the variation, permitting (i) the defini-tion of more specific primers if necessary and (ii) thedecision whether to characterize alleles by sequence, bysize, or by conformation. Some of these introns havebeen cloned and sequenced in large samples of P. livi-dus, E. cordatum and species not included in the
Table 4 Gene families providing best introns and highest numbers of introns
Gene Family Gene name (from Homolens) EPIC n° No. bilaterian genera “P or I” CR PC
HBG0011376 UDP-N-acetylglucosaminyl- 48 9 NA NA
(Homolens 3) transferase 49 0 0 NA
50 10 1 1
51 9 1 NA
HBG0052978 Ubiquitin 5 10 1 1
(Homolens 2) 9 8 1 NA
HBG004117 Calpain 2 = 22 10 1 NA
(Homolens 2) 21 10 1 NA
= HBG001043
(Homolens 3)
HBG0001601 LD39850p; Peptidylprolyl 25 10 1 1
(Homolens 3) isomerase domain and WD
repeat-containing protein 1
HBG0031768 Glutamyl-prolyl-tRNA- 52 1 0 NA
(Homolens 3) synthetase 53 7 1 1
54 8 1 1
55 2 0 NA
56 4 0 1
HBG0002428 AT23778p; Colon RCB-0549 Cle- 29 8 1 NA
(Homolens 3) H3 cDNA; RIKEN full-length 30 4 NA NA
enriched library; clone: G430060P17 product:si 34 5 NA NA
The ten bilaterian genera were tested for all 52 introns, two cnidarian genera were tested for 22 and 29 introns respectively. The number of bilaterian generadisplaying promising or intron amplifying patterns (P or I) out of the ten genera tested is indicated. The five best introns (10/10 success among bilaterian genera)appear in bold. In the right-hand columns, the results of the two cnidarian genera when tested (not all loci): NA (not available), 1 (promising or intronamplifying), 0 (no intron-size amplicon).CR: Corallium rubrum, PC: Paramuricea clavata.
Chenuil et al. BMC Evolutionary Biology 2010, 10:276http://www.biomedcentral.com/1471-2148/10/276
Page 11 of 17
present study, and in all cases polymorphism is highdue to both indels and substitutions (unpublished). Insome cases, the EPIC locus provides diploid Mendelianvariation in fragment size visible on agarose gels. Alter-natively, finer variations can be revealed using PAGE orautomatic sequencers [1]. Conformation techniques(SSCP, DGGE or, more recently, melting curve genotyp-ing (e.g. [25]) allow determination of allele classes, butthey have a sensitivity limited to relatively small frag-ments and they provide no information on allele rela-tionships. The richest information for diploid specimensis a diploid sequence genotype, but classical sequencingtechniques do not deal well with heterozygosity. “Nextgeneration sequencing” technologies, such as “454sequencing”, in addition to their extreme rapidity,should allow sequencing a mixture of numerous PCRproducts, such as for instance from 15 EPIC loci ineach of 50 or more individuals, identified by individuallabels (4 base sequences, inserted in PCR primers orlinked to PCR products) for reasonable prices (less than2000 € in 2009). These approaches differ in throughput,cost and sensitivity (Table 5).
ConclusionsOur new method appears very efficient for finding uni-versal intron loci (EPIC) in sequence data bases what-ever the phylum, in metazoans. These EPICs, inaddition to providing a set of independent nuclear mar-kers for population genetics and phylogeography, cancomplement or replace the barcoding molecule used formetazoans, COI, resolving problems associated with sin-gle marker studies or inherent in the mitochondrial gen-ome, such as its lack of variability in some phyla [26].For about ten of these EPICs we obtained sequence datafor several individuals, from one to nine distinct genera(unpublished data, available on request). Insertions anddeletions were frequent (among which there were a fewmicrosatellites), in only two cases there was no poly-morphism, and a minority of cases displayed paralogs ordistinct groups of sequences, a problem which wassolved when internal primers were defined. This studytherefore fills a serious gap in the toolbox of molecularecologists. These new and universal EPIC loci shouldgenerate multilocus sequence datasets from populationsof numerous non-model species. Relative to single-locus
Figure 7 Effect of the degeneracy levels of codehop primers on PCR results. Results from the 10 bilaterian genera in which both primerswere “codehop” were considered here (they cannot be directly derived from Table 1 since, for some introns, not all primer pairs were“codehop”). The bars represent the total numbers of cases (species × primer pairs) displaying results ‘P’, ‘I’ ‘A’ or nulls, for three categories ofintrons, those in which no (0), one (1) or both (2) primers have a more than 6-fold degeneracy. Exact tests were performed from the 4 × 3contingency table used to build the histogram, as well as from tables derived from it after pooling some columns (for instance nulls versus “A +I + P”): all were highly significant. The pie chart diagrams display the proportion of the four categories of results within each category ofdegeneracy; they illustrate the increase in the proportion of null loci when primer degeneracy increases.
Chenuil et al. BMC Evolutionary Biology 2010, 10:276http://www.biomedcentral.com/1471-2148/10/276
Page 12 of 17

sequence data sets or multilocus microsatellite loci data-sets, the inferences made from such data using the coa-lescent theory will be much more precise.
MethodsBioinformatic assessment of candidate lociWe had previously tried a method based on the Exon-Intron Database [26,27,8] but this was not successfuland thus we developed an original approach. In order tofind universal markers from orthologous genes, we tookadvantage of annotated full-genome sequences to obtaina list of candidate gene families.The search involved three successive stages (I-III),
introducing some methodological changes betweenstages; each stage contained the following steps, exceptthat step 3 was not performed for stages II-III (see Fig.2 for flowchart).Step 1: Gene family selectionThe Famfetch software [28] was used to query revision 2(stage I of our search) or revision 3 (stages II and III) ofthe Homolens database of homologous gene families[29] from Ensembl, and retain families for which ortho-logs were found in Homo, Rodentia, Canis, Gallus,Danio, Xenopus, Percomorpha, Ciona, Insecta, andNematoda, but no duplication event occurred at theroot of any of these taxa in the family tree. This stepeliminated known highly conserved families, includingmost or all of the already known “universal” EPIC loci,
but we estimated that the remaining loci would be lessprone to paralogy and laboratory effort would be saved.Families in which one isolated species within one ofthese taxa appeared duplicated were not eliminated (e.g.family HBG001601 was retained (Fig. 3) although Aedesaegyptii presents a duplication, since the duplication isnot shared by all Insecta). Step 1 provided 89 genefamilies for stage I, and 159 gene families for stages IIand III, which were merged until step 6.Step 2: Protein sequence retrievalFor each retained gene family, protein sequences wereretrieved with a python script, for stage I, or an R scriptbased on the Seqinr package [30], for stages II and III.Step 3: Enrichment of protein sequence fileFor stage I only, we enriched our protein alignment withprotein sequences from other deuterostome speciesusing the Query-Win software to obtain Genbank acces-sion numbers for CDS of deuterostome taxa that werenot already included in Homolens. For each gene family,blast searches using the Homo and nematode sequenceswere performed on this new database; sequences leadingto a lower than 10-100 e-value were considered as homo-logous sequences. Only 30 additional sequences wereidentified by this additional step.Step 4: Multiple-sequence protein alignmentFor each family, a multiple alignment of proteinsequences was obtained with ClustalW [31] (stage I) orMuscle [32] (stages II and III).
Table 5 Benefits and limits of different genotyping techniques for EPICs (for direct sequencing, see Results-Discussion,last section)
Genotypingtechnique
454 sequencing Cloning-sequencing Melting curvegenotyping
SSCP Intron lengthpolymorphism
Information (modelsof allele evolution)
Diploid Seq. (various) Diploid Seq. (various) Genotype (IAM)i Genotype (IAM)i Genotype (IAM)i
Fragment size Seq <400 bp* No limit ** Best <350 bp Best <350 bp No limit
Allele number No limit No limit Very limited. If high,impairs genotyping
Some alleles may notbe distinguished
Some alleles may notbe distinguished
Throughput high low high Medium medium
PCR Classical Classical Real Time Classical Classical
Cloning No Yes No No No
Pooling loci After careful quantification Possible# butproblematical
No Possible Common
Electrophoresis No For sequencing No Yes Yes
Sequencing 1 run = Numerousindividuals × numerousloci
Several reactionsrequired per individual
No No No
Number humanaction steps μ
L + 1 + 1 L + NL + 10NL L L + L/3 μ’ L + L/3 μ’
Seq.: sequence. i: IAM: Infinite Allele Model (evolutionary distance is considered identical between all allele pairs). *: Larger amplicons can be included in the run,but only the first 400 bp will be sequenced; however, to favor equal representation among loci, amplicons of relatively uniform lengths (500-900) are preferred.Sequencing can be oriented if desired (start with one of the PCR primers only). This size threshold may increase in future. **: but cloning efficiency may dependon size (and size must be compatible with PCR). #: not recommended, since loci may be very unequally inserted by cloning vectors (often one missing). μ : Foreach technique, the number of steps requiring human action is expressed as a function of the numbers of loci (L) and of genotyped individuals (N) and deducedfrom the five preceeding rows of the table. We do not consider the possibility of multiplex PCR (i.e. several loci in a single PCR reaction) though this reduces thenumber of steps). μ’: Pooling three loci together for electrophoresis is generally easy (whether or not an automatic sequencer is used); more loci can be pooledwhen allelic distributions do not overlap.
Chenuil et al. BMC Evolutionary Biology 2010, 10:276http://www.biomedcentral.com/1471-2148/10/276
Page 13 of 17
Step 5: Intron position identificationIntron positions and phases were annotated on themultiple alignment using either the Annote_int_maseprogram (kindly provided by L. Duret, stage I) or anR script using Seqinr (stages II and III).Step 6 and 7: Retrieval of nucleotide sequences, and choiceof intronsChoice of introns occurred before retrieval of nucleotidesequences for stage I and after retrieval for stages II andIII. For stage I, we first considered intron positions pre-sent in 100% of all species in all taxonomic groups (asdetermined by a python script). When such positionswere considered promising (embedded within conservedand low-degeneracy amino-acid sequences), we manuallyretrieved corresponding nucleotide sequences usingtblastx, for Strongylocentrotus purpuratus at least (andin some cases a few other species), to determine the 5′part of the codehop PCR primers (see primer designsection).Stage II was initiated before all stage I families were
thoroughly visually screened since we estimated that themethod changes introduced in Stage II would save time.For stages II and III, CDS were retrieved and the corre-sponding nucleotide alignment was obtained usingPAL2NAL, for each family. The first 58 protein align-ments, taken by increasing Homolens (HBGxxxxxx)number, were examined visually, looking for intronsthat were present in all the deuterostome species of thealignment and that lay between regions conservedenough to design PCR primers (see below).In stage III, the remaining 101 families identified from
Homolens revision 3 were examined: for this stage, weretrieved potentially homologous sequences from theunannotated genomes of Saccoglossus, Nematostella andStrongylocentrotus, by performing tblastn searches invol-ving the protein sequences of Homo and Ciona. Weretained sequences leading to a lower than 10-5 e-value,and for which protein sequence similarity with somesequences in the original alignment was higher than 0.5.For this stage we developed a new R script facilitatingthe visual identification of both intron position andexon sequence conservation in a multiple alignment.This tool allowed us to consider introns whose positionvaried only slightly among phyla, which may thereforepotentially provide EPIC markers (Fig.3). Region conser-vation was scored by computing a local similarity scoreω in a sliding window along the multiple alignment.This similarity score is the geometric mean of up tofour components ω0 ... ω3 depending on the numbern of species for which additional sequences were avail-able (1 ≤ n ≤ 3), where ω0 is the mean local nucleotidesimilarity between pairs of sequences retrieved fromHomolens, and ω1, ω2 and ω3 are the highest nucleotideidentities between pairs of sequences involving one
sequence from Homolens and one sequence from Stron-gylocentrus, Saccoglossus or Nematostella (whensequences from these species were available). We used asliding window width of 20 nucleotides to compute ω,and identified local peaks of nucleotide similarity in slid-ing windows of 51 nucleotides width. A plot of nucleo-tide conservation and intron occurrence was used tovisually select promising loci. Contrary to stage I, we didnot eliminate potentially usable EPIC loci whose posi-tion may vary by a few nucleotides.In addition to this original research among Homolens
families, we specifically examined two genes containingalready known “universal” EPIC loci, the Elongation Fac-tor 1 a subunit and the ATP-Synthase a subunit[10,11]. We retrieved the corresponding metazoannucleotide sequences from Genbank and aligned themwith DIALIGN, specifying that the alignment containedboth coding (exon) and non coding regions (introns).Then, we visually examined these alignment files toidentify potential EPIC loci.
Primer designThe great majority of primers were designed using theCodehop method [33,34], which is based on an amino-acid alignment. The 3′ end of the primer (at least 11bases) is degenerate in a way that represents all possiblenucleotide combinations considering that there areusually several codons per amino-acid. The 5′ end,called a clamp, is not degenerate, so that, although itmay not anneal during the first two cycles, it should, inthe following cycles, perfectly anneal to the primersincorporated and replicated during previous cycles. Sucha strategy allows amplification of relatively variableregions, while limiting the problems inherent in highlydegenerate primers. Primers were designed only when itwas possible to limit degeneracy to less than 32× (exceptfor a single primer that has 64× degeneracy) and mostof them have 8× or less degeneracy (Fig. 1). This rule,aimed at reducing the risk of simultaneous amplificationof paralogs, eliminated numerous potential loci. In prac-tice, to visually identify conserved regions containinglow-degeneracy codons, we used the Bioedit softwareand customized the amino-acid background color codeto reflect the level of codon degeneracy. In some caseswhen the nucleotide alignment appeared much less vari-able than predicted from codon degeneracy, conven-tional degenerate primers were designed, based on thenucleotide alignment (i.e. ambiguities were toleratedalong the primer). In these cases, we often decided todesign the primer in two parts, with a 3′ part of at least11 bp degenerate enough to represent all observednucleotide sequences in our alignment and a non-degenerate 5′ part, mimicking the Codehop design strat-egy [35]. Below, we will refer to these primers as
Chenuil et al. BMC Evolutionary Biology 2010, 10:276http://www.biomedcentral.com/1471-2148/10/276
Page 14 of 17
NucHop primers. All details of primer design andsequences are in Fig. 1. The letters a, b, c, and d afterthe intron number refer to primers pairs F and R, F2and R, R2 and F, F2 and R2 respectively. The design ofthe 5′ clamp of the primer was based on the Strongylo-centrotus nucleotide sequence when available, otherwiseon Ciona.
Taxa testedWithin Bilateria, there are two important clades, theProtostomia, which contain the Lophotrochozoa (suchas annelids and molluscs) and the Ecdysozoa (such asarthropods and nematodes), and the Deuterostomia (towhich vertebrates, urochordates, and echinodermsbelong) (Fig. 5). We first had decided to focus on Deu-terostomia in which more sequence data are available,and to survey additional ascidian (Urochordata) species(Corella eumyota, Perophora japonica, and Styela clava)and echinoderm species (regular sea urchins: Paracen-trotus lividus, Sterechinus agassizi, Sterechinus neu-mayeri; spatangoid sea urchins: Echinocardiumcordatum, Abatus agassizi, Abatus cavernosus, Abatuscordatus, Abatus ingens, Abatus nimrodi; brittlestars:Amphipholis squamata). To check whether the EPICloci selected would be exportable to more distant phyla,we also surveyed two mollusc species (Protostomia),Cerastoderma edule and Macoma balthica (bothbivalves), and two extremely divergent, non-bilaterianspecies, the cnidarians Corallium rubrum (the red coral)and Paramuricea clavata. These cnidarians belong tothe Octocorallia and are non-symbiotic. Initially, a firstround of six species was systematically tested with fourindividuals per species and the “standard protocol”: thethree ascidian species, and three echinoderms: P. lividus,E. cordatum, and A. squamata. Then additional testswere made for these echinoderms and additional spe-cies. Table 3 reports the number of individuals, loci andspecies tested per genus, and the corresponding techni-cal conditions.
Molecular methodsDNA was extracted using phenol-chloroform methodsfor Paracentrotus lividus and the three ascidian species,
plus Echinocardium cordatum, Amphipholis squamata,and Abatus spp. [36]; a saline method was used for Ster-echinus spp. [37], and the Nucleon phytopure kit forsome Abatus. In addition, specimens of E. cordatumwere also extracted using Chelex [38], or with theQIAamp® DNA Kit (Qiagen), and specimens of P. lividuswere extracted using the Wizard® SV Genomic DNApurification system (Promega). Paramuricea clavataDNA was extracted using the QIAamp® kit, and we usedstandard phenol-chloroform extractions for Coralliumrubrum. Polymerase Chain Reactions were performed ina 10 μl final volume, using 0.25 u of GoTaq® Flexi-DNAPolymerase and green buffer (Promega), in 5 mMMgCl2, and 0.2 mM dNTP, with 10 pmol of eachprimer, and with 10 ng of template DNA, except forcnidarians for which template DNA probably exceeded10 ng. PCR cycling temperature programs with fixedannealing temperatures (Table 6) were first tried for afew EPIC loci (trials at 48, 50, 55, or 60°C, according tolocus referred as “St-fix” or “fix-50-60” in Table 6), andcompared with two touch-down programs (TD6, TD6′);subsequently, touch-down programs were preferred andwere used for all primer pairs for all EPIC loci exceptcnidarians (referred as the standard protocol, Table 3).For E. cordatum and P. lividus, all loci were additionallyamplified with fixed annealing temperatures (named EE-GP in Table1). For cnidarians, a similar program wasused at 45°C (DA in Table 6). PCR products were visua-lized by electophoresis using 5 μl of product on a 1X-TBE-1.5% agarose gel (260 ml) in a Biorad SubCellModel 192 Cell, gels of 25 × 25 cm and 4 combs of 51wells, during ca 1 h migration at 120 V, using 2.5 to 5μl of 100 bp Benchtop ladder ® (Promega) as sizemarker.
Nomenclature used to characterize the results to allowcomparison of methodsResults of PCR amplification as observed from agarosegels were characterized, at first on a per species basis,using the following rules. ‘Promising’ results (‘P’ inTable 1) refer to the observation in all individuals of thespecies of amplification products that were not too faint,did not display numerous fragments (rare cases with
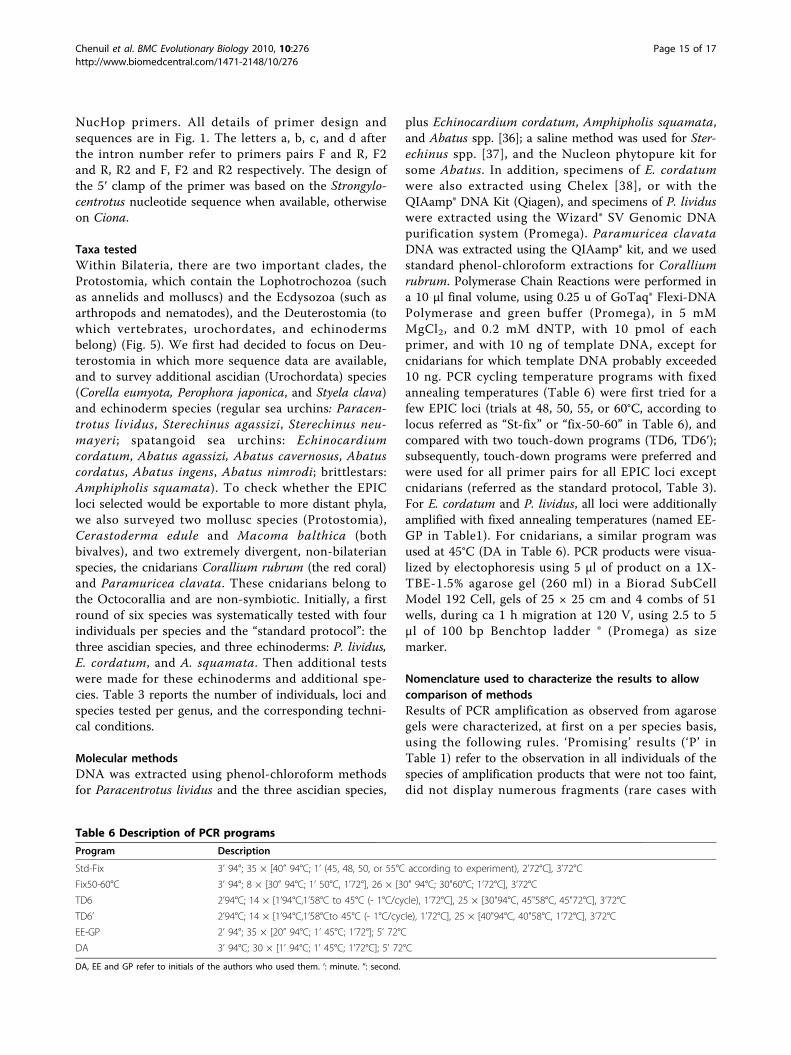
Table 6 Description of PCR programs
Program Description
Std-Fix 3’ 94°; 35 × [40” 94°C; 1’ (45, 48, 50, or 55°C according to experiment), 2’72°C], 3’72°C
Fix50-60°C 3’ 94°; 8 × [30” 94°C; 1’ 50°C, 1’72°], 26 × [30” 94°C; 30"60°C; 1’72°C], 3’72°C
TD6 2’94°C; 14 × [1’94°C,1’58°C to 45°C (- 1°C/cycle), 1’72°C], 25 × [30"94°C, 45"58°C, 45"72°C], 3’72°C
TD6’ 2’94°C; 14 × [1’94°C,1’58°Cto 45°C (- 1°C/cycle), 1’72°C], 25 × [40"94°C, 40"58°C, 1’72°C], 3’72°C
EE-GP 2’ 94°; 35 × [20” 94°C; 1’ 45°C; 1’72°]; 5’ 72°C
DA 3’ 94°C; 30 × [1’ 94°C; 1’ 45°C; 1’72°C]; 5’ 72°C
DA, EE and GP refer to initials of the authors who used them. ‘: minute. “: second.
Chenuil et al. BMC Evolutionary Biology 2010, 10:276http://www.biomedcentral.com/1471-2148/10/276
Page 15 of 17
three bands were admitted, when one was constant) andwere long enough to contain an intron of ca 70-100 bpat least. The second category is designated ‘I’ (intron-size amplicon), and corresponds to amplicons of the sizeof an intron that were very faint or displayed multiplebands or failed to amplify in at least one individual. Thethird category, ‘Amplification’ (designated ‘A’), corre-sponds to amplification products too short to contain auseful intron. Results in the subsequent tables and textare reported by genus after pooling all the protocolsthat were tried. For the species tested with several pro-tocols (P. lividus, E. cordatum), and for the generawhere several species were tested (i.e. Abatus, Sterechi-nus), the best result is reported.
Additional material
Additional file 1: Influence of molecular biology methods on EPICamplification success. It contains three paragraphs: (1) Are the codehopprimers more efficient than primers designed from nucleotidealignments only? (2) Effect of PCR programs, and (3) Effect of DNAextraction and tissue conservation history.
AbbreviationsCDS: Coding DNA Sequence; EPIC: Exon Primed Intron Crossing; PCR:Polymerase Chain Reaction; SSCP: Single Strand ConformationPolymorphism; DGGE: Denaturing Gradient Gel Electrophoresis; PAGE: Poly-Acrylamide Gel Electrophoresis.
AcknowledgementsWe thank Paolo Sordino who accepted this project in the workpackage heco-coordinated with F. P. Patti, within the European network of excellence“Marine Genomics Europe” (GOCE-CT-2004-505403), providing funds forconsumables and TH’s salary. We also thank Laurent Duret for helpfulsuggestions, Jeanine Olsen and Jean-Pierre Féral for stimulating theextension of the study to molluscs. PCL was supported by NWO-Meervoudand ESF Conservation Genetics grants.
Author details1African Coelacanth Ecosystem Programme, Department of Genetics,University of Pretoria, Lynnwood Road 0002, Pretoria, South Africa. 2MarineBiological Association of the UK, The Laboratory, Citadel Hill Plymouth, PL12PB, UK. 3Department of Genetics, Forestry and Agricultural BiotechnologyInstitute (FABI), University of Pretoria, Pretoria, South Africa. 4Instituto deEcología y Biodiversidad, Departamento de Ciencias Ecológicas, Facultad deCiencias, Universidad de Chile, Santiago, Chile. 5Alfred Wegener Institute forPolar and Marine Research, Wadden Sea, Station Sylt, Hafenstr. 43, 25992 List,Germany. 6Royal Netherlands Institute for Sea Research, Department ofMarine Ecology, P.O. Box 59, 1790AB Den Burg, The Netherlands. 7Functionaland Evolutionary Ecology Laboratory, Stazione Zoologica “Anton Dohrn”, VillaDohrn, Punta S. Pietro, Napoli, Italia - 80077 Ischia (Naples), Italy. 8PlantEcological Genetics Group, Institute of Integrative Biology, ETH Zurich,Universitätsstrasse 16, CHN, 8092 Zurich, Switzerland. 9Université de Lyon, F-69000, Lyon, France. 10Université Lyon 1; CNRS, UMR5558, Laboratoire deBiométrie et Biologie Evolutive, F-69622, Villeurbanne, France. 11Aix-MarseilleUniversité, Laboratoire DIMAR (diversité, évolution et écologie fonctionnellemarine), CNRS UMR6540, rue de la batterie des Lions, 13007 Marseille,France.
Authors’ contributionsTH performed the majority of laboratory work, and designed primers. NBand SM developed all the dedicated bioinformatic tools. CR performed thelaboratory work for several species; GP, EE, DA and KMJ tested all/numerous
primer pairs for one species, and EE, in addition, compared DNA extractionmethods. AC conceived and supervised the project, selected loci anddesigned primers, and wrote the article. Other authors provided DNAextracts. Some authors in addition improved the manuscript. All authorsread and approved the final manuscript.
Received: 1 April 2010 Accepted: 13 September 2010Published: 13 September 2010
References1. Chenuil A: Choosing the right molecular genetic markers for studying
biodiversity: from molecular evolution to practical aspects. Genetica 2006,127:101-120.
2. Anmarkrud JA, Kleven O, Bachmann L, Lifjeld JT: Microsatellite evolution:Mutations, sequence variation, and homoplasy in the hypervariableavian microsatellite locus HrU10. BMC Evolutionary Biology 2008, 8:138.
3. Arcot SS, Wang ZY, Weber JL, Deininger PL, Batzer MA: Alu Repeats - asource for the genesis of primate microsatellites. Genomics 1995,29(1):136-144.
4. Grillo V, Jackson F, Gilleard JS: Characterisation of Teladorsagiacircumcincta microsatellites and their development as populationgenetic markers. Molecular and Biochemical Parasitology 2006,148(2):181-189.
5. Jayashree B, Jagadeesh VT, Hoisington D: CISprimerTOOL: software toimplement a comparative genomics strategy for the development ofconserved intron scanning (CIS) markers. Molecular Ecology Notes 2007,8(3):575-577.
6. Bierne N, Lehnert A, Bedier E, Bonhomme F, Moore SS: Screening forintron-length polymorphisms in penaeid shrimps using exon-primedintron-crossing (EPIC)-PCR. Molecular Ecology 2000, 9(2):233-235.
7. Li C, Riethoven J-JM, Ma L: Exon-primed intron-crossing (EPIC) markersfor non-model teleost fishes. BMC Evolutionary Biology 2010, 10:90.
8. Fedorov A, Merican AF, Gilbert W: Large-scale comparison of intronpositions among animal, plant and fungal genes. Proc Natl Acad Sci USA2002, 99(25):16128-16133.
9. Putnam NH, Srivastava M, Hellsten U, Dirks B, Chapman J, Salamov A,Terry A, Shapiro H, Lindquist E, Kapitonov VV, et al: Sea anemone genomereveals ancestral eumetazoan gene repertoire and genomicorganization. Science 2007, 317(5834):86-94.
10. Palumbi SR: Nucleic Acids II. Chapter 7: The polymerase chain reaction.In Molecular systematics. Edited by: Hillis DM, Moritz C, Mable BK.Massachussetts: Sinauer. Sunderland; 1996:205-247.
11. Jarman SN, Ward RD, Elliott NG: Oligonucleotide primers for PCRamplification of coelomate introns. Mar Biotechnol 2002, 4:347-355.
12. Concepcion GT, Crepeau MW, Wagner D, Kahng SE, Toonen RJ: Analternative to ITS, a hypervariable, single-copy nuclear intron in corals,and its use in detecting cryptic species within the octocoral genusCarijoa. Coral Reefs 2008, 27(2):323-336.
13. Cordero D, Pena JB, Saavedra C: Polymorphisms at three introns in theManila clam (Ruditapes philippinarum) and the grooved carpet-shell clam(R-decussatus). Journal of Shellfish Research 2008, 27(2):301-306.
14. Foltz DW: An ancient repeat sequence in the ATP synthase beta-subunitgene of forcipulate sea stars. Journal of Molecular Evolution 2007,65(5):564-573.
15. Boissin E, Feral JP, Chenuil A: Defining reproductively isolated units in acryptic and syntopic species complex using mitochondrial and nuclearmarkers: the brooding brittle star, Amphipholis squamata (Ophiuroidea).Molecular Ecology 2008, 17(7):1732-1744.
16. Daguin C, Bonhomme F, Borsa P: The zone of sympatry and hybridizationof Mytilus edulis and M. galloprovincialis, as described by intron lengthpolymorphism at locus mac-1. Heredity 2001, 86:342-354.
17. Ohresser M, Borsa P, Delsert C: Intron-length polymorphism at the actinlocus Mac-1: a genetic marker for population studies in the marinemussels Mytilus galloprovincialis Lmk. and M. edulis L. Mol Mar BiolBiotechnol 1997, 6(2):123-130.
18. Hassan M, Lemaire C, Fauvelot C, Bonhomme F: Seventeen new exon-primed intron-crossing polymerase chain reaction amplifiable introns infish. Molecular Ecology Notes 2002, 2(3):334-340.
19. Atarhouch T, Rami M, Cattaneo-Berrebi G, Ibanez C, Augros S, Boissin E,Dakkak A, Berrebi P: Primers for EPIC amplification of intron sequences
Chenuil et al. BMC Evolutionary Biology 2010, 10:276http://www.biomedcentral.com/1471-2148/10/276
Page 16 of 17

for fish and other vertebrate population genetic studies. Biotechniques2003, 35(4):676-682.
20. Mitreva M, Wendl MC, Martin J, Wylie T, Yin Y, Larson A, Parkinson J,Waterston RH, McCarter JP: Codon usage patterns in Nematoda: analysisbased on over 25 million codons in thirty-two species. Genome Biology2006, 7(8).
21. Raible F, Tessmar-Raible K, Osoegawa K, Wincker P, Jubin C, Balavoine G,Ferrier D, Benes V, de Jong P, Weissenbach J, et al: Vertebrate-type intron-rich genes in the marine annelid Platynereis dumerilii. Science 2005,310(5752):1325-1326.
22. Zimek A, Weber K: In contrast to the nematode and fruit fly all 9 intronpositions of the sea anemone lamin gene are conserved in humanlamin genes. European Journal of Cell Biology 2008, 87(5):305-309.
23. Stephens M, Scheet P: Accounting for decay of linkage disequilibrium inhaplotype inference and missing-data imputation. American Journal ofHuman Genetics 2005, 76(3):449-462.
24. Dixon CJ: OLFinder:a program which disentangles DNA sequencescontaining heterozygous indels. Molecular Ecology Resources 2010,10(2):335-340.
25. Ye J, Parra EJ, Sosnoski DM, Hiester K, Underhill PA, Shriver MD: Meltingcurve SNP(McSNP) Genotyping: a useful approach for diallelicgenotyping in forensic science. Journal of Forensci Science 2002,47(3):593-600.
26. Van der Ham JL, Brugler MR, France SC: Exploring the utility of an indel-rich, mitochondrial intergenic region as a molecular barcode forbamboo corals (Octocorallia: Isididae). Marine Genomics 2009, 2(3-4):183-192.
27. Saxonov S, Daizadeh I, Fedorov A, Gilbert W: EID: The Exon IntronDatabase-an exhaustive database of protein-coding intron-containinggenes. Nucleic Acids Res 2000, 28(1):185-190.
28. Dufayard JF, Duret L, Penel S, Gouy M, Rechenmann F, Perrière G: Treepattern matching in phylogenetic trees: automatic search for orthologsor paralogs in homologous gene sequence databases. Bioinformatics2005, 21:2596-2603.
29. Penel S, Arigon AM, Dufayard JF, Sertier AS, Daubin V, Duret L, Gouy M,Perrière G: Databases of homologous gene families for comparativegenomics. BMC Bioinformatics 2009, 10(Suppl 6):S3.
30. Charif D, Lobry J, (eds): SeqinR 1.0-2: a contributed package to the Rproject for statistical computing devoted to biological sequencesretrieval and analysis. 2007.
31. Thompson JD, Higgins DG, Gibson TJ: CLUSTAL-W - Improving thesensitivity of progressive multiple sequence alignment throughsequence weighting, position specific gap penalties and weight matrixchoice. Nucleic Acids Research 1994, 22(22):4673-4680.
32. Edgar RC: MUSCLE: a multiple sequence alignment method with reducedtime and space complexity. Bmc Bioinformatics 2004, 5:1-19.
33. Rose TM, Henikoff JG, Henikoff S: CODEHOP (COnsensus-DEgenerateHybrid Oligonucleotide Primer) PCR primer design. Nucleic Acids Res 2003,31(13):3763-3766.
34. Rose TM, Schultz ER, Henikoff JG, Pietrokovski S, McCallum CM, Henikoff S:Consensus-Degenerate hybrid oligonucleotide primers for amplificationof distantly related sequences. Nucleic Acids Res 1998, 26(7):1628-1635.
35. Hoareau TB, Boissin E: Design of phylum-specific hybrid primers for DNAbarcoding: addressing the need for efficient COI amplification in theEchinodermata. Molecular Ecology Resources 2010, 9999(9999).
36. Winnepenninckx B, Backeljau T, De Wachter R: Extraction of highmolecular weight DNA for molluscs. Trends in Genetics 1993, 9(12):407.
37. Aljanabi SM, Martinez I: Universal and rapid salt-extraction of high qualitygenomic DNA for PCR-based techniques. Nucleic Acids Research 1997,25(22):4692-4693.
38. Walsh PS, Metzger DA, Higushi R: Chelex 100 as a medium for simpleextraction of DNA for PCR-based typing from forensic material.Biotechniques 1991, 10(4):506-513.
39. Lecointre G, Le H: Classification phylogénétique du vivant. Paris: Belin2001.
doi:10.1186/1471-2148-10-276Cite this article as: Chenuil et al.: An efficient method to find potentiallyuniversal population genetic markers, applied to metazoans. BMCEvolutionary Biology 2010 10:276.
Submit your next manuscript to BioMed Centraland take full advantage of:
• Convenient online submission
• Thorough peer review
• No space constraints or color figure charges
• Immediate publication on acceptance
• Inclusion in PubMed, CAS, Scopus and Google Scholar
• Research which is freely available for redistribution
Submit your manuscript at www.biomedcentral.com/submit
Chenuil et al. BMC Evolutionary Biology 2010, 10:276http://www.biomedcentral.com/1471-2148/10/276
Page 17 of 17