
An atmospheric oxidation monitor based on in situ thin-film deposition
32
An Atmospheric Oxidation Monitor Based on In-Situ Thin-Film Deposition Author to whom correspondence should addressed: Richard Quinn NASA Ames Research Center Mail Stop 239-12 Moffett Field, CA 94035 Phone: 650-604-6501 email: [email protected] Submitted to: Sensors and Actuators: B Chemical Date: January 19, 2005 Text pages: 19 Figure pages:12
-
Upload
independent -
Category
Documents
-
view
2 -
download
0
Transcript of An atmospheric oxidation monitor based on in situ thin-film deposition
An Atmospheric Oxidation Monitor Based on In-Situ Thin-Film Deposition
Author to whom correspondence should addressed Richard Quinn NASA Ames Research Center Mail Stop 239-12 Moffett Field CA 94035 Phone 650-604-6501 email rquinnmailarcnasagov Submitted to Sensors and Actuators B Chemical Date January 19 2005 Text pages 19 Figure pages12
1
An Atmospheric Oxidation Monitor
Based on In-Situ Thin-Film Deposition
Richard C Quinnac Aaron P Zentb James R C Garryc
Timothy J Ringrosed Martin C Townerd and Frank J Grunthanere
aSETI Institute NASA Ames Research Center MS 239-12 Moffett Field CA 94305 USA
bNASA Ames Research Center Moffett Field CA 94035 USA
cLeiden Institute of Chemistry Astrobiology Group Ledien University 2300 RA Leiden NL
dPlanetary and Space Science Research Institute Open University Milton Keynes UK
eIn Situ Exploration Technology Group NASA Jet Propulsion Laboratory Pasadena CA 91109
2
Abstract
We describe an atmospheric oxidation sensor developed and delivered as part of the
European Space Agency Beagle 2 Mars Lander Environmental Sensor Suite The sensor
monitors atmospheric oxidation rates by measuring resistance changes in a thin-silver film
deposited in-situ onto a sapphire substrate while on the surface of Mars Potential terres-
trial applications of this sensing approach include long-term monitoring of oxidative con-
taminants in low-oxygen systems including process gases and environmental chambers
The sensor response to ppb levels of hydrogen peroxide vapor in carbon dioxide is dem-
onstrated
Key Words Oxidation Sensor Hydrogen Peroxide Chemiresistor Mars
3
1 Introduction
We have developed a novel sensor to characterize very broadly the reactive nature
of the martian atmosphere The sensor monitors atmospheric oxidation rates by measuring
resistance changes in a thin-metal film deposited in-situ onto a sapphire substrate while on
the surface of Mars The novel use of in-situ deposition avoids problems related to pre-
deployment storage and sensor aging without using costly hermetic sealing technologies
Although the sensor is designed to monitor martian atmospheric oxidation potential ter-
restrial applications of this sensing approach include long-term monitoring of oxidative
contaminants in low-oxygen systems including process gases and environmental chambers
The martian atmosphere is composed primarily of carbon dioxide (~95) the ab-
sence of a martian ozone layer allows solar radiation of wavelengths greater than 190 nm
(the CO2 cutoff wavelength) to reach the surface of the planet As a result of this low cut-
off photochemical models of the near-surface atmosphere of Mars predict the presence of
low levels of reactive oxygen and hydrogen species including O3 O H2O2 and OH [1
2] It is thought that reactions of these species particularly H2O2 with the martian surface
may be responsible for creating a chemically reactive surface material on Mars containing
multiple oxidizing species as was discovered by the United States National Aeronautics
and Space Agency (NASA) Viking Landers in 1976 [3] In this paper we describe a sen-
sor designed to investigate this theory
The sensor referred to as the Environmental Sensors Oxidation Sensor (ESOS) was
developed and built for the European Space Agency (ESA) Beagle 2 (B2) Mars Lander
and included on the payload as part of the landerrsquos Environmental Sensor Suite (ESS)
4
The B2 ESS was comprised of several components designed to return detailed chemical
and physical characterizations of the spacecraft and martian environment during the course
of the mission In addition to the oxidation sensor the package included a set of acceler-
ometers for pre-descent descent and post-landing monitoring atmospheric temperature
and pressure measurement capability an atmospheric dust impact sensor an array of UV
photodiodes for solar flux measurement and wind speed and direction sensors [4] Unfor-
tunately a signal from the B2 lander was never received after successful release of the
spacecraft by the ESA Mars Express orbiter in December 2003
The sensor described in this paper is based on a series of chemical sensor array meas-
urement strategies that have been developed for landed Mars missions to investigate the
chemical reactivity of the martian surface material and near-surface atmosphere After the
Viking Mars mission in 1976 the first attempt to directly examine the chemical reactivity
of the martian surface was planned as part of the Russian Mars rsquo96 mission The Mars
Oxidant Experiment (MOx) was contributed to the mission by NASA and was unfortu-
nately lost with the mission shortly after launch [5 6] MOx used a fiber-optic array oper-
ating in a micro-mirror sensing mode to monitor chemical changes in chemical thin-film
reactants MOx was designed as a survey instrument to characterize the chemical nature of
the soil by using a array of chemical-thin films with different reactivities MOx used a
chemometric approach in which the identity of unknowns is elucidated through the reac-
tion pattern of the sample with reference compounds Valuable lessons learned in the de-
velopment of MOx have led to improved designs for both soil and atmospheric oxidant
sensors The Thermo-Acoustic Oxidant Sensor (TAOS) extended the use of thin-film sen-
sors for Mars applications to chemiresistors and surface acoustic wave devices [7] Fol-
5
lowing TAOS the Mars Oxidant Instrument (MOI) was developed to study soil oxidants
using chemiresistor sensing MOI added the capability of sealing the soil sample and heat-
ing and humidifying the sample headspace
More recently the Mars Atmospheric Oxidant Sensor (MAOS) which is based on
MOx TAOS and MOI technologies has been designed MAOS is a chemometric sensor
array that measures the oxidation rate of chemical thin-films that are sensitive to particular
types of oxidants these oxidants represent key elements in the martian soil or emulate
prebiotic materials The thin-film reactants include highly electropositive metals semicon-
ductors and a set of organic functional groups Half of the sensors are permanently sealed
from the environment and serve as references Two kinds of passive filters are used in
combination with the non-reference sensors one to exclude UV and one to exclude dust
These two filters are deployed over the sensors in combination to exclude UV dust both
UV and dust or neither All sensors other than the sealed references are exposed to the
atmosphere By monitoring differences in film reaction among the filter combinations
MAOS quantifies the relative contribution of soil-borne oxidants UV photoxidation and
gaseous oxidants to the chemical reactivity of the Mars surface environment [8]
A major technical challenge associated with the deployment of these sensor arrays on
Mars is the need to deliver unreacted and uncontaminated sensing films to the surface of
the planet Because the sensing films are highly reactive exposure to air water vapor or
other contaminants during instrument delivery integration or transport to Mars would
seriously compromise experimental results To ensure the delivery of pristine MAOS sens-
ing films to Mars they are encapsulated in a hermetically sealed enclosure using a micro-
machined cover that is bonded to the sensor substrate immediately following film deposi-
6
tion Fabricated using bulk Si micro-machining the seal cover consists of a thick silicon
frame with suspended films of silicon nitride Once delivered to the planetrsquos surface on
computer command the silicon nitride seals are ruptured exposing the sensing thin-film to
the martian environment The micro-machined sealing system was fully designed tested
and delivered as part of the MOx fight instrument however there is a high financial cost
associated with the fabrication and integration of the sealing system Additionally there is
a level of risk associated with the system since mechanical failure or leaking of the seals
are potential instrument failure modes Even in the absence of membrane failure or leak-
age a low level of film oxidation is unavoidable during sensor fabrication Since the MOx
flight instrument the combination of high fabrication costs and limited flight opportunities
have prevented a second opportunity to land a chemical sensor array designed to measure
environmental chemical reactivity on Mars
The sensor described in this work was designed to characterize atmospheric oxidation
rates on Mars and diurnal variations in these rates By eliminating the need for hermetic
sealing the sensor also provides a proof-of-concept demonstration of in-situ deposition of
thin-film sensing materials on Mars as risk mitigation strategy and fabrication cost savings
2 Sensor Description and Operating Principle
21 Operating Principle
The sensorrsquos operating principle is based on the in-situ thermal deposition on Mars of
thin silver films onto a sapphire substrate and on monitoring changes in film resistance
7
during both deposition and post-deposition oxidation by atmospheric gases The evapora-
tion source is placed in the center of an open-ended tube to provide a diffusion-controlled
operating mechanism for the chemical sensor Upon the initial flash heating of the source
evaporated metallic silver rapidly reacts with oxidizing gases in the tube Unoxidized silver
then deposits on the substrate subsequent to consumption of oxidizing gases in the vicinity
of the source The kinetics and extent of the chemical reaction between the deposited film
and the reactive gases diffusing into the tube are then measured by monitoring the changes
in resistance of the film as a function of time By depositing fresh films on the substrate at
different times (eg sunrise midday sundown midnight) diurnal variations in chemical
activity can be mapped
It is also possible that information on atmospheric H2O levels can be derived from film
deposition time and power requirements Since the ends of the tube are open atmospheric
gases in the tube will cause a time delay as vapor phase silver reacts with the available
oxygen and water after the consumption of these gases in the tube a silver film closes the
chemiresistor circuit Although not validated during the prototyping stage in principle this
operation mode provides a repeatable measure of the variable H2O abundance since O2
levels are constant in the atmosphere and the low levels of other oxidizing gases in the
tube should not contribute significantly to the time delay However validation of the sen-
sorrsquos ability to measure H2O was not performed since the B2 Lander was equipped with a
Mass Spectrometer (MS) that would provide quantitative abundances of both atmospheric
O2 and H2O Quantification of O2 and H2O levels by the MS provides the ability to deter-
mine the relative contributions of these gases to overall post-film deposition oxidation
rates
8
22 Sensor Description
Prototype specifications and performance of the sensor are described in this paper
There were some minor variations between the prototype specifications and the final flight
unit (figure 1) which was fabricated at the Open University Planetary and Space Science
Research Institute (Milton Keynes UK) these are not addressed in this paper The sensor
shown schematically in figure 2 consists of an open-ended 1 cm long sapphire tube with a
5 mm inner diameter A 50 micron diameter tungsten filament with a centered silver point
source is mounted coaxially in the tube The inner surface of the sapphire tube is coated on
each end with Cermet 8881B gold conductor (Electro-Science Laboratories Inc) to form
6 to 8 micrometer thick electrodes 4 millimeters in length with an electrode gap of 2 mil-
limeters The silver source is centrally positioned in the tube and the electrode gap is cen-
trally positioned on the inner surface of the tube
The selection of the filament diameter tube size and electrode gap was based on per-
formance compatibility and optimization with the B2 spacecraft circuitry The ESOS flight
sensor was packaged on an 8-pin dual-inline package (DIP) (figure 1) and mounted on an
electronics board located on the spacecraft upper surface adjacent to the UV sensors By
placing the ESOS near the UV sensors oxidation rates can be correlated with UV flux
levels The spacecraft battery used by the ESOS to evaporate the silver source was
charged by the landerrsquos solar panels and had an output voltage that was expected to fluc-
tuate during the course of spacecraft operations During the available time windows for
sensor operation on Mars the battery voltage was expected to be in the 20-to-26-volt
9
range This voltage is monitored as part of ESOS operation and a particular voltage range
could be used as a requirement for sensor activation allowing a degree of reproducibility
The ESOS electronics printed circuit board was rated to 15A continuous and it was an-
ticipated that short-duration current pulses of up to 4A could be used to heat the sensor
filament if needed A temperature sensor is also included within ESOS to characterize
temperature dependence in film resistance and deposition rates
3 Experimental
Prior to use the tungsten filament used in all prototypes was thermally annealed in
dry N2 for five minutes and the silver source was then formed in dry N2 by heating a 3 mm
piece of 0127 mm diameter silver wire (Aldrich Chemical 9999) centered on the fila-
ment until a small bead formed (figure 3) Film depositions were carried out in a test
chamber at room temperature with a CO2 atmosphere (9999+) at ambient Mars pres-
sures (10 mbar) Optimization studies with tungsten filaments of different diameters dem-
onstrated that given the battery operating range of 20 to 26 V rapid evaporation of the
silver source could be achieved using a 50 microm diameter and a ~1 Amp current pulse All
current pulses referred to in the Results and Discussion section below are ~1 Amp
Dry hydrogen peroxide vapor for sensor response testing was generated by passing
the test gas over a urea-hydrogen peroxide addition compound (Aldrich Chemical) Hy-
drogen peroxide levels were calibrated using a Draumlger Polytron 2 Because the Polytron
operates only at atmospheric pressure and is temperaturendashsensitive sensor response test-
10
ing was carried out at a total pressure of 1 bar and at room temperature The composition
of the simulated Mars test gas used in this work was 013 O2 27 N2 balance CO2
4 Results and Discussion
41 Primary Film Deposition
The magnitude and duration of a current needed to thermally deposit a film using 50 microm diameter tungsten filament with a silver source and a 242V power supply is shown in
figure 4 It was determined that current pulses 600 msec or longer resulted in the deposi-
tion of unoxidized silver on the electrode Pulses shorter than 500 msec resulted in a visi-
ble flashing of the filamentsource but no visible deposition or measurable resistance
across the 2 mm gap electrodes Pulses longer than 500 msec but shorter that 550 msec
resulted in visible deposition of a film on the substrate but still no measurable resistance
across the electrodes Figure 4 shows the formation of a film with a final resistance of ~10
Kohm after the second of two 550 msec pulses This film resistance indicates the forma-
tion of either a discontinuous or a partially oxidized film visual inspection and further test-
ing (described below) suggest the latter is the case
42 Secondary Depositions
An example of secondary film deposition is shown in figure 5 In this case a 1 Amp
350 msec current pulse was used to deposit additional material on top of a primary film
11
resulting in an increase of film resistance In all cases where current pulses between 250
and 350 msec were used an increase in film resistance occurred suggesting that for short
current pulses (less than 550 msec) oxide formation occurs as the evaporated silver reacts
with oxidizing gases in the electrode region When a pulse of 550 msec or greater was
used deposition of unoxidized silver occurred after an initial period of oxide deposition
during which the oxidizing gases in the region of the source were consumed This effect is
shown in figure 6 A 600 msec 1 Amp current pulse resulted in a rapid film resistance in-
crease followed by a rapid decrease Both the resistance increase and decrease were ap-
proximately one order of magnitude relative to the initial baseline film resistance
43 Sensor Model
In order to better understand the behavior of the sensor explore its utility for H2O
measurement predict its behavior in a natural environment and identify possible failure
modes we developed a numerical model of the laboratory experiment and applied it to
likely Mars conditions The model predicts the behavior of the electrical circuit the cur-
rent flow the voltage drop across each component of the circuit the resistance tempera-
ture dependence for each component and the resultant Joule heating The model
calculates separately the heating in the silver (Ag) bead and the tungsten (W) filament that
supports it Within the W filament-Ag bead system the model balances the Joule heating
against radiation sensible heat loss to ambient CO2 and latent heat loss from sublimating
Ag atoms to calculate the temperature of the bead Based upon the bead temperature the
model partitions the Ag among the solid liquid and vapor phases The latent heat of fusion
12
is accounted for when the Ag bead reaches its melting temperature (1234K) The surface
area of each component is tracked to allow calculation of the radiative and sensible heat
exchange Although the bead is allowed to melt wetting of the W filament is not explicitly
accounted for
The flux of Ag atoms from the Ag bead is tracked continuously In the gas phase the
number density of Ag and H2O is calculated along with their reaction rates on collision
Based on the high temperature of the silver atoms during deposition it is assumed that
there is no activation barrier associated with gas phase reactions and that oxidation of Ag
is complete upon collision The Ag is assumed to be oxidized after a single collision and is
tracked as AgO Subsequent collisions or alteration on the tube walls may result in sub-
stantial occurrence of other oxides but for our purposes all oxidized Ag is considered a
poor conductor The mass of unoxidized Ag as well as Ag-oxide deposited on the walls
of the tube is tracked as a function of time The ambient air temperature and the number
density of H2O and O2 are assumed fixed and invariant and are specified as boundary con-
ditions The tube is modeled as a symmetrical domain with 6 finite elements from the cen-
ter to the end Each element has a length of 0909 mm allowing 11 elements along a 1 cm
tube Abundances of gas phase and surface deposits are tracked in each of the elements
from 0 (center) to 5 (end)
The predicted current is shown in Figure 7 with the laboratory data overlaid The re-
lay opens the connection to the battery at t= 0762 s The subsequent drop in current is
due to the rise in resistance of the circuit components with temperature The current levels
out at 092A because temperature rise in the Ag-W system is truncated when the Ag
reaches its boiling temperature (1804 K at 100 mbar) In the simulation here the mass of
13
the Ag bead decreases to about 1 of itrsquos original value However in the laboratory tests
visual inspection of the Ag bead indicated that it was not fully exhausted before the end of
the laboratory experiments The abundance of Ag and H2O in elements 0-2 (figure 8) sug-
gests that Ag substantially depletes H2O only near the center of the bead In this simula-
tion it was assumed that the H2O is buffered at the vapor pressure of ice at 230K With
substantially more H2O the finite rate of Ag supply to the gas phase means the H2O abun-
dance is less affected Above some background H2O abundance oxidized Ag is deposited
in every element in excess of metallic Ag
The sensitivity of the system to H2O is shown in Figure 9 The model supports the
hypothesis that the onset of high conductivity between the Au electrodes is a function of
the H2O abundance in the ambient gas but only to a limit Because the flux of Ag atoms
to the tube gas phase is limited by the Joule heating available there is an upper limit to the
effective range of H2O sensitivity In the present case when H2O abundances are buffered
at 250K unoxidized Ag never deposits in excess of silver oxide However for Mars con-
ditions unoxidized silver will deposit and the time delay for the deposition increases with
H2O abundance
The potential behavior of the system for predicted Mars-like conditions is shown in
Figure 10 The differences between the laboratory and Mars simulations are 1) lower ini-
tial T (210 K) 2) Somewhat lower pressure (7 mbar) 3) An ambient H2O abundance
buffered at the vapor pressure of water at 210 K In this Mars simulation with a 650 msec
pulse all of the Ag is vaporized allowing the W filament to continue heating The mod-
eled filament temperature prior to the end of the pulse was 3400K Given the results of
our model to prevent melting of the filament on Mars the current pulse would be sequen-
14
tially increased from a value less than 650 msec until unoxidized silver deposits The signa-
ture of complete Ag vaporization is a significant drop in the current prior to cutoff a con-
sequence of the increased resistivity of W at temperatures above 1800K As a
consequence mostly of the lower starting temperature metallic Ag exceeds AgO deposi-
tion somewhat later than in the laboratory case However since the Ag bead has less sen-
sible heat loss to the atmosphere (7 mbar assumed for Mars ndash 10 mbar in the laboratory)
more heat is lost through Ag vaporization
34 Gas Sensing Properties
The sensitivity of freshly deposited films to hydrogen peroxide vapor in carbon diox-
ide is shown in figure 10 The detection limit of the Polytron unit is 100 ppb and the un-
certainty in the measurements is plusmn50 ppb This limitation prevents sensor testing at levels
below 100 ppb Although 100 ppb is significantly higher than the hydrogen peroxide con-
centrations expected in the martian atmosphere the sensor response for this peroxide level
indicates that sensor detection limits should be several orders of magnitude lower Addi-
tionally since the oxidation of the silver film is dosimetric extremely low rates of oxida-
tion can be measured by continual monitoring during long-duration atmospheric
exposures Figure 10 also shows the response of a freshly deposited film to pure CO2 In
the absence of oxidizing gases the resistance of freshly deposited films slowly decreased
over a period of several hours as the film annealed The response of a freshly deposited
film to a simulated peroxide-free martian atmosphere (013 O2 27 N2 balance CO2)
shows a low sensitivity of the film to O2 relative to H2O2
15
5 Conclusions
The use of in-situ deposition techniques can provide an inexpensive and practical means of
overcoming thin-film chemical sensor limitations due to pre-deployment contamination
and aging We have demonstrated the use of this technique using a silver sensing layer
thermally deposited in-situ under Mars-like conditions These films have a high sensitivity
to H2O2 vapor and a comparatively low sensitivity to O2 which is present at a level of ap-
proximately 013 in the martian atmosphere The high sensitivity of the sensor to perox-
ide along with the dosimetric nature of the thin-film oxidation will enable low rates of
atmospheric oxidation to be monitored on the surface of Mars Simultaneous determina-
tion of H2O and O2 levels by the MS will allow the contributions of these gases to the sen-
sor response to be removed during data analysis By removing from the data the
contribution of O2 and H2O to the sensor response oxidation rates due to the presence of
H2O2 and other photochemically produced atmospheric oxidants can be determined The
ability to deposit sensing films in-situ allows the surface of the sensing film to be refreshed
with unoxidized silver By re-depositing fresh film surfaces at different times of the day
diurnal variations in atmospheric oxidation rates can be determined The diffusion-tube
sensor configuration described in this paper has a number of potential terrestrial applica-
tions including long-term monitoring of oxidative contaminants process gases and envi-
ronmental chambers The measurement capabilities of the in-situ deposition technique can
be expanded by though the use of metals with different electrochemical potentials and with
arrays tailored to the chemical environment of interest
16
Acknowledgements
Work performed at NASA Ames (RC Quinn AP Zent) was funded by the NASA Ames
Directorrsquos Discretionary Fund Beagle 2 activities (MC Towner JC Garry TR Rin-
grose) were funded in part by the UK Particle Physics and Astronomy Research Council
The authors would like to thank Cindy Taylor of the SETI Institute for her assistance in
preparing the sensor sources The author (RQ) would like to thank Pascale Ehrenfreund
and Hans Fraaije of the Leiden Institute of Chemistry Christopher Chyba of the SETI In-
stitute Oliver Botta of the International Space Science Institute and Chris McKay of
NASA Ames Research Center for their manuscript reviews
17
References [1] TY Kong MB McElroy Photochemistry of the martian atmosphere Icarus 32
(1977) 168-189 [2] D M Hunten Possible oxidant sources in the atmosphere and surface of Mars J Mol
Evol 14 (1979) 57-64 [3] HP Klein The Viking biological experiments on Mars Icarus 34 (1978) 666-674 [4] MC Towner MR Patel TJ Ringrose JC Zarnecki D Pullen MR Sims S Haa-
panala A-M Harri J Polko CF Wilson AP Zent RC Quinn FJ Grunthaner MH Hecht and JRC Garry The Beagle 2 environmental sensors science goals and instrument description Planetary and Space Sci 52 (2004) 1141-1156
[5] FJ Grunthaner A Ricco M A Butler A L Lane C P McKay A P Zent R C
Quinn B Murray H P Klein G V Levin R W Terhune M L Homer A Ksend-zov and P Niedermann Investigating the surface chemistry of Mars Analytical Chemistry 67 (1995) 605A-610A
[6] CP McKay F J Grunthaner A L Lane M Herring R K Bartmann A J Ricco
M A Butler B C Murray R C Quinn A P Zent H P Klein G V Levin The Mars oxidant experiment (MOx) for Mars 96 Planetary and Space Science 46 (1998) 769-777
[7] AP Zent R C Quinn and M Madou A thermo-acoustic gas sensor array for photo-
chemically critical species in the martian atmosphere Planetary and Space Science 46 (1998) 795-803
[8] AP Zent RC Quinn FJ Grunthaner MH Hecht MG Buehler CP McKay
Mars atmospheric oxidant sensor (MAOS) an in-situ heterogeneous chemistry analy-sis Planetary and Space Science 51 (2003) 167-175
18
Figure Captions 1 A Beagle 2 Environmental Sensors Oxidation Sensor The sensor was developed and
built for the European Space Agency (ESA) B2 Mars Lander and included on the pay-load as part of the landerrsquos Environmental Sensor Suite
2 Schematic of the oxidation sensor The open-ended sapphire tube is 1 cm long with a 5
mm inner diameter The Au electrodes are 4 millimeters in length with an electrode gap of 2 millimeters A 50 micron diameter titanium filament with a centered silver point source is mounted coaxially in the hollow tube
3 Titanium filament and silver source shown in the fixture used for annealing and silver
source preparation 4 Thermal deposition of a film using 50 microm diameter titanium filament with a silver
source in 10 mbar of CO2 Visible film deposition occurred with a 500 msec pulse A film with a measurable resistance deposited after the second 550 msec pulse
5 Secondary film deposition using a ~350 msec pulse For short current pulses (less than
550 msec) oxide formation occurs as the evaporated silver reacts with oxidizing gases in the electrode region
6 Secondary film deposition using a ~600 msec pulse When a pulse 550 msec or greater
was used deposition of unoxidized silver occurred after an initial period of oxide depo-sition (resistance increase) as the oxidizing gases in the region of the source were con-sumed
7 Comparison of the laboratory test data and the modeled sensor behavior The model
correctly predicts the current flow through the circuit Since heating = I2R the heating rate must likewise be accurate
8 The modeled number density (m-3) of metallic Ag (solid lines) and H2O (dashed lines) in
finite elements from 0 (center of tube including Ag bead ndash circles) through 2 ndash (dia-monds) Although the end of the tube is element 5 we plot only to element 2 because elements 0 and 1 bridge the ends of the Au electrodes Metallic Ag exceeds H2O only near the source
9 The modeled accumulation of metallic Ag and oxidized AgO at the Au electrode margin
as a function of the ambient H2O abundance The times indicate the interval when Ag first accumulates in excess of AgO Conductivity changes will occur somewhat later For H2O abundances buffered at 240K Ag is never deposited in excess of AgO at the Au electrode
10 A comparison of the model using the laboratory test conditions with the model using
predicted Mars conditions Both cases we have adjusted the ambient H2O pressure to
19
071Pa the pressure in equilibrium with ice at 210 K In all cases the solid lines repre-sent Mars simulations the dotted lines represent the laboratory simulations The filled circles represent the number density of metallic Ag (m-2) deposited on the walls of the tube in finite element i=1 which corresponds to the inboard edge of the Au electrode The open circles represent the number density of AgO Number densities are labeled on the right hand ordinate and the upper abscissa The arrows labeled ldquoLabrdquo and ldquoMarsrdquo indicate the time at which metallic Ag begins to be deposited in excess of AgO in ele-ment i=1 On the left hand ordinate and the lower abscissa the thermal history of the metal filament is plotted for the laboratory and Mars experiments
11 The predicted current for operations on Mars (solid) in the laboratory (dotted) The
drop in I near the end of the current pulse is due to increased resistivity of the W fila-ment after Ag is exhausted The mass of the Ag bead is shown for comparison in the two simulations
12 The sensitivity of freshly deposited films to hydrogen peroxide vapor in carbon dioxide
and response of a freshly deposited film to a simulated peroxide free martian atmos-phere (013 O2 27 N2 balance CO2)
20
Figure 1
21
Figure 2
22
Figure 3
23
Figure 4
00
02
04
06
08
10
12
0 20 40 60 80 100 120 140 160Seconds
Cu
rren
t (A
)
0E+00
2E+07
4E+07
6E+07
8E+07
1E+08
Res
ista
nce
(O
hm
s)
AmpsOhms
242 Volts
450msec 500
msec
550msec
550msec
24
Figure 5
00
02
04
06
08
10
12
0 1000 2000 3000 4000 5000 6000milliseconds
Cu
rren
t (A
)
10E+04
12E+04
14E+04
16E+04
18E+04
20E+04
Res
ista
nce
(O
hm
s)
AmpsOhms
253 Volts
25
Figure 6
00
02
04
06
08
10
12
0 500 1000 1500 2000 2500milliseconds
Cu
rren
t (A
)
1E+03
1E+05
2E+05
3E+05
4E+05
Res
ista
nce
(O
hm
s)
AmpsOhms
254 Volts
26
Figure 7
0
02
04
06
08
1
12
0 200 400 600 800 1000 1200 1400 1600
Comparison of Model and Lab Data
Current - Dep 8 (A)I
Cu
rren
t (A
)
Time (ms)
Laboratory Data Modeled Data
27
Figure 8
1010
1012
1014
1016
1018
1020
0 100 200 300 400 500 600
Ag 0Ag 1Ag 2H2O 0H2O 1H2O 2
(m-3
)
Time(msec)
28
Figure 9
1016
1017
1018
1019
1020
160 180 200 220 240
Ag1 210KAgO1 210KAg1 225KAgO1 225KAg1 240KAgO1 240K
Su
rfac
e D
ensi
ty (
m-3
)
Time(msec)
Tbuff
210K
t = 168 msec
Tbuff
225K
t = 198 msec
29
Figure 10
500
1000
1500
2000
2500
3000
3500
1010
1012
1014
1016
1018
1020
1022
0 100 200 300 400 500 600
160 180 200 220 240
T Filament - MarsT Filament -Lab
Ag1 Mars
AgO1 Mars
Ag1 Lab
AgO1 Lab
Tem
per
atu
re (
K)
Ag
and
Ag
O S
urface D
ensity (m
-2)
Time (Temperature) (msec)
Time (Ag and AgO) (msec)
Mars
Lab
30
Figure 11
0
02
04
06
08
1
12
0
5 10-8
1 10-7
15 10-7
2 10-7
25 10-7
3 10-7
35 10-7
4 10-7
0 100 200 300 400 500 600
Current - MarsCurrent - Lab
Mass Ag - MarsMass Ag - Lab
Cu
rren
t (
A)
Mass A
g B
ead (kg
)
Time(msec)
31
Figure 12
09
11
13
15
17
0 10 20 30 40 50 60Minutes
RR
o
500 ppb H2O2100 ppb H2O20 ppb H2O2Mars Gas
1
An Atmospheric Oxidation Monitor
Based on In-Situ Thin-Film Deposition
Richard C Quinnac Aaron P Zentb James R C Garryc
Timothy J Ringrosed Martin C Townerd and Frank J Grunthanere
aSETI Institute NASA Ames Research Center MS 239-12 Moffett Field CA 94305 USA
bNASA Ames Research Center Moffett Field CA 94035 USA
cLeiden Institute of Chemistry Astrobiology Group Ledien University 2300 RA Leiden NL
dPlanetary and Space Science Research Institute Open University Milton Keynes UK
eIn Situ Exploration Technology Group NASA Jet Propulsion Laboratory Pasadena CA 91109
2
Abstract
We describe an atmospheric oxidation sensor developed and delivered as part of the
European Space Agency Beagle 2 Mars Lander Environmental Sensor Suite The sensor
monitors atmospheric oxidation rates by measuring resistance changes in a thin-silver film
deposited in-situ onto a sapphire substrate while on the surface of Mars Potential terres-
trial applications of this sensing approach include long-term monitoring of oxidative con-
taminants in low-oxygen systems including process gases and environmental chambers
The sensor response to ppb levels of hydrogen peroxide vapor in carbon dioxide is dem-
onstrated
Key Words Oxidation Sensor Hydrogen Peroxide Chemiresistor Mars
3
1 Introduction
We have developed a novel sensor to characterize very broadly the reactive nature
of the martian atmosphere The sensor monitors atmospheric oxidation rates by measuring
resistance changes in a thin-metal film deposited in-situ onto a sapphire substrate while on
the surface of Mars The novel use of in-situ deposition avoids problems related to pre-
deployment storage and sensor aging without using costly hermetic sealing technologies
Although the sensor is designed to monitor martian atmospheric oxidation potential ter-
restrial applications of this sensing approach include long-term monitoring of oxidative
contaminants in low-oxygen systems including process gases and environmental chambers
The martian atmosphere is composed primarily of carbon dioxide (~95) the ab-
sence of a martian ozone layer allows solar radiation of wavelengths greater than 190 nm
(the CO2 cutoff wavelength) to reach the surface of the planet As a result of this low cut-
off photochemical models of the near-surface atmosphere of Mars predict the presence of
low levels of reactive oxygen and hydrogen species including O3 O H2O2 and OH [1
2] It is thought that reactions of these species particularly H2O2 with the martian surface
may be responsible for creating a chemically reactive surface material on Mars containing
multiple oxidizing species as was discovered by the United States National Aeronautics
and Space Agency (NASA) Viking Landers in 1976 [3] In this paper we describe a sen-
sor designed to investigate this theory
The sensor referred to as the Environmental Sensors Oxidation Sensor (ESOS) was
developed and built for the European Space Agency (ESA) Beagle 2 (B2) Mars Lander
and included on the payload as part of the landerrsquos Environmental Sensor Suite (ESS)
4
The B2 ESS was comprised of several components designed to return detailed chemical
and physical characterizations of the spacecraft and martian environment during the course
of the mission In addition to the oxidation sensor the package included a set of acceler-
ometers for pre-descent descent and post-landing monitoring atmospheric temperature
and pressure measurement capability an atmospheric dust impact sensor an array of UV
photodiodes for solar flux measurement and wind speed and direction sensors [4] Unfor-
tunately a signal from the B2 lander was never received after successful release of the
spacecraft by the ESA Mars Express orbiter in December 2003
The sensor described in this paper is based on a series of chemical sensor array meas-
urement strategies that have been developed for landed Mars missions to investigate the
chemical reactivity of the martian surface material and near-surface atmosphere After the
Viking Mars mission in 1976 the first attempt to directly examine the chemical reactivity
of the martian surface was planned as part of the Russian Mars rsquo96 mission The Mars
Oxidant Experiment (MOx) was contributed to the mission by NASA and was unfortu-
nately lost with the mission shortly after launch [5 6] MOx used a fiber-optic array oper-
ating in a micro-mirror sensing mode to monitor chemical changes in chemical thin-film
reactants MOx was designed as a survey instrument to characterize the chemical nature of
the soil by using a array of chemical-thin films with different reactivities MOx used a
chemometric approach in which the identity of unknowns is elucidated through the reac-
tion pattern of the sample with reference compounds Valuable lessons learned in the de-
velopment of MOx have led to improved designs for both soil and atmospheric oxidant
sensors The Thermo-Acoustic Oxidant Sensor (TAOS) extended the use of thin-film sen-
sors for Mars applications to chemiresistors and surface acoustic wave devices [7] Fol-
5
lowing TAOS the Mars Oxidant Instrument (MOI) was developed to study soil oxidants
using chemiresistor sensing MOI added the capability of sealing the soil sample and heat-
ing and humidifying the sample headspace
More recently the Mars Atmospheric Oxidant Sensor (MAOS) which is based on
MOx TAOS and MOI technologies has been designed MAOS is a chemometric sensor
array that measures the oxidation rate of chemical thin-films that are sensitive to particular
types of oxidants these oxidants represent key elements in the martian soil or emulate
prebiotic materials The thin-film reactants include highly electropositive metals semicon-
ductors and a set of organic functional groups Half of the sensors are permanently sealed
from the environment and serve as references Two kinds of passive filters are used in
combination with the non-reference sensors one to exclude UV and one to exclude dust
These two filters are deployed over the sensors in combination to exclude UV dust both
UV and dust or neither All sensors other than the sealed references are exposed to the
atmosphere By monitoring differences in film reaction among the filter combinations
MAOS quantifies the relative contribution of soil-borne oxidants UV photoxidation and
gaseous oxidants to the chemical reactivity of the Mars surface environment [8]
A major technical challenge associated with the deployment of these sensor arrays on
Mars is the need to deliver unreacted and uncontaminated sensing films to the surface of
the planet Because the sensing films are highly reactive exposure to air water vapor or
other contaminants during instrument delivery integration or transport to Mars would
seriously compromise experimental results To ensure the delivery of pristine MAOS sens-
ing films to Mars they are encapsulated in a hermetically sealed enclosure using a micro-
machined cover that is bonded to the sensor substrate immediately following film deposi-
6
tion Fabricated using bulk Si micro-machining the seal cover consists of a thick silicon
frame with suspended films of silicon nitride Once delivered to the planetrsquos surface on
computer command the silicon nitride seals are ruptured exposing the sensing thin-film to
the martian environment The micro-machined sealing system was fully designed tested
and delivered as part of the MOx fight instrument however there is a high financial cost
associated with the fabrication and integration of the sealing system Additionally there is
a level of risk associated with the system since mechanical failure or leaking of the seals
are potential instrument failure modes Even in the absence of membrane failure or leak-
age a low level of film oxidation is unavoidable during sensor fabrication Since the MOx
flight instrument the combination of high fabrication costs and limited flight opportunities
have prevented a second opportunity to land a chemical sensor array designed to measure
environmental chemical reactivity on Mars
The sensor described in this work was designed to characterize atmospheric oxidation
rates on Mars and diurnal variations in these rates By eliminating the need for hermetic
sealing the sensor also provides a proof-of-concept demonstration of in-situ deposition of
thin-film sensing materials on Mars as risk mitigation strategy and fabrication cost savings
2 Sensor Description and Operating Principle
21 Operating Principle
The sensorrsquos operating principle is based on the in-situ thermal deposition on Mars of
thin silver films onto a sapphire substrate and on monitoring changes in film resistance
7
during both deposition and post-deposition oxidation by atmospheric gases The evapora-
tion source is placed in the center of an open-ended tube to provide a diffusion-controlled
operating mechanism for the chemical sensor Upon the initial flash heating of the source
evaporated metallic silver rapidly reacts with oxidizing gases in the tube Unoxidized silver
then deposits on the substrate subsequent to consumption of oxidizing gases in the vicinity
of the source The kinetics and extent of the chemical reaction between the deposited film
and the reactive gases diffusing into the tube are then measured by monitoring the changes
in resistance of the film as a function of time By depositing fresh films on the substrate at
different times (eg sunrise midday sundown midnight) diurnal variations in chemical
activity can be mapped
It is also possible that information on atmospheric H2O levels can be derived from film
deposition time and power requirements Since the ends of the tube are open atmospheric
gases in the tube will cause a time delay as vapor phase silver reacts with the available
oxygen and water after the consumption of these gases in the tube a silver film closes the
chemiresistor circuit Although not validated during the prototyping stage in principle this
operation mode provides a repeatable measure of the variable H2O abundance since O2
levels are constant in the atmosphere and the low levels of other oxidizing gases in the
tube should not contribute significantly to the time delay However validation of the sen-
sorrsquos ability to measure H2O was not performed since the B2 Lander was equipped with a
Mass Spectrometer (MS) that would provide quantitative abundances of both atmospheric
O2 and H2O Quantification of O2 and H2O levels by the MS provides the ability to deter-
mine the relative contributions of these gases to overall post-film deposition oxidation
rates
8
22 Sensor Description
Prototype specifications and performance of the sensor are described in this paper
There were some minor variations between the prototype specifications and the final flight
unit (figure 1) which was fabricated at the Open University Planetary and Space Science
Research Institute (Milton Keynes UK) these are not addressed in this paper The sensor
shown schematically in figure 2 consists of an open-ended 1 cm long sapphire tube with a
5 mm inner diameter A 50 micron diameter tungsten filament with a centered silver point
source is mounted coaxially in the tube The inner surface of the sapphire tube is coated on
each end with Cermet 8881B gold conductor (Electro-Science Laboratories Inc) to form
6 to 8 micrometer thick electrodes 4 millimeters in length with an electrode gap of 2 mil-
limeters The silver source is centrally positioned in the tube and the electrode gap is cen-
trally positioned on the inner surface of the tube
The selection of the filament diameter tube size and electrode gap was based on per-
formance compatibility and optimization with the B2 spacecraft circuitry The ESOS flight
sensor was packaged on an 8-pin dual-inline package (DIP) (figure 1) and mounted on an
electronics board located on the spacecraft upper surface adjacent to the UV sensors By
placing the ESOS near the UV sensors oxidation rates can be correlated with UV flux
levels The spacecraft battery used by the ESOS to evaporate the silver source was
charged by the landerrsquos solar panels and had an output voltage that was expected to fluc-
tuate during the course of spacecraft operations During the available time windows for
sensor operation on Mars the battery voltage was expected to be in the 20-to-26-volt
9
range This voltage is monitored as part of ESOS operation and a particular voltage range
could be used as a requirement for sensor activation allowing a degree of reproducibility
The ESOS electronics printed circuit board was rated to 15A continuous and it was an-
ticipated that short-duration current pulses of up to 4A could be used to heat the sensor
filament if needed A temperature sensor is also included within ESOS to characterize
temperature dependence in film resistance and deposition rates
3 Experimental
Prior to use the tungsten filament used in all prototypes was thermally annealed in
dry N2 for five minutes and the silver source was then formed in dry N2 by heating a 3 mm
piece of 0127 mm diameter silver wire (Aldrich Chemical 9999) centered on the fila-
ment until a small bead formed (figure 3) Film depositions were carried out in a test
chamber at room temperature with a CO2 atmosphere (9999+) at ambient Mars pres-
sures (10 mbar) Optimization studies with tungsten filaments of different diameters dem-
onstrated that given the battery operating range of 20 to 26 V rapid evaporation of the
silver source could be achieved using a 50 microm diameter and a ~1 Amp current pulse All
current pulses referred to in the Results and Discussion section below are ~1 Amp
Dry hydrogen peroxide vapor for sensor response testing was generated by passing
the test gas over a urea-hydrogen peroxide addition compound (Aldrich Chemical) Hy-
drogen peroxide levels were calibrated using a Draumlger Polytron 2 Because the Polytron
operates only at atmospheric pressure and is temperaturendashsensitive sensor response test-
10
ing was carried out at a total pressure of 1 bar and at room temperature The composition
of the simulated Mars test gas used in this work was 013 O2 27 N2 balance CO2
4 Results and Discussion
41 Primary Film Deposition
The magnitude and duration of a current needed to thermally deposit a film using 50 microm diameter tungsten filament with a silver source and a 242V power supply is shown in
figure 4 It was determined that current pulses 600 msec or longer resulted in the deposi-
tion of unoxidized silver on the electrode Pulses shorter than 500 msec resulted in a visi-
ble flashing of the filamentsource but no visible deposition or measurable resistance
across the 2 mm gap electrodes Pulses longer than 500 msec but shorter that 550 msec
resulted in visible deposition of a film on the substrate but still no measurable resistance
across the electrodes Figure 4 shows the formation of a film with a final resistance of ~10
Kohm after the second of two 550 msec pulses This film resistance indicates the forma-
tion of either a discontinuous or a partially oxidized film visual inspection and further test-
ing (described below) suggest the latter is the case
42 Secondary Depositions
An example of secondary film deposition is shown in figure 5 In this case a 1 Amp
350 msec current pulse was used to deposit additional material on top of a primary film
11
resulting in an increase of film resistance In all cases where current pulses between 250
and 350 msec were used an increase in film resistance occurred suggesting that for short
current pulses (less than 550 msec) oxide formation occurs as the evaporated silver reacts
with oxidizing gases in the electrode region When a pulse of 550 msec or greater was
used deposition of unoxidized silver occurred after an initial period of oxide deposition
during which the oxidizing gases in the region of the source were consumed This effect is
shown in figure 6 A 600 msec 1 Amp current pulse resulted in a rapid film resistance in-
crease followed by a rapid decrease Both the resistance increase and decrease were ap-
proximately one order of magnitude relative to the initial baseline film resistance
43 Sensor Model
In order to better understand the behavior of the sensor explore its utility for H2O
measurement predict its behavior in a natural environment and identify possible failure
modes we developed a numerical model of the laboratory experiment and applied it to
likely Mars conditions The model predicts the behavior of the electrical circuit the cur-
rent flow the voltage drop across each component of the circuit the resistance tempera-
ture dependence for each component and the resultant Joule heating The model
calculates separately the heating in the silver (Ag) bead and the tungsten (W) filament that
supports it Within the W filament-Ag bead system the model balances the Joule heating
against radiation sensible heat loss to ambient CO2 and latent heat loss from sublimating
Ag atoms to calculate the temperature of the bead Based upon the bead temperature the
model partitions the Ag among the solid liquid and vapor phases The latent heat of fusion
12
is accounted for when the Ag bead reaches its melting temperature (1234K) The surface
area of each component is tracked to allow calculation of the radiative and sensible heat
exchange Although the bead is allowed to melt wetting of the W filament is not explicitly
accounted for
The flux of Ag atoms from the Ag bead is tracked continuously In the gas phase the
number density of Ag and H2O is calculated along with their reaction rates on collision
Based on the high temperature of the silver atoms during deposition it is assumed that
there is no activation barrier associated with gas phase reactions and that oxidation of Ag
is complete upon collision The Ag is assumed to be oxidized after a single collision and is
tracked as AgO Subsequent collisions or alteration on the tube walls may result in sub-
stantial occurrence of other oxides but for our purposes all oxidized Ag is considered a
poor conductor The mass of unoxidized Ag as well as Ag-oxide deposited on the walls
of the tube is tracked as a function of time The ambient air temperature and the number
density of H2O and O2 are assumed fixed and invariant and are specified as boundary con-
ditions The tube is modeled as a symmetrical domain with 6 finite elements from the cen-
ter to the end Each element has a length of 0909 mm allowing 11 elements along a 1 cm
tube Abundances of gas phase and surface deposits are tracked in each of the elements
from 0 (center) to 5 (end)
The predicted current is shown in Figure 7 with the laboratory data overlaid The re-
lay opens the connection to the battery at t= 0762 s The subsequent drop in current is
due to the rise in resistance of the circuit components with temperature The current levels
out at 092A because temperature rise in the Ag-W system is truncated when the Ag
reaches its boiling temperature (1804 K at 100 mbar) In the simulation here the mass of
13
the Ag bead decreases to about 1 of itrsquos original value However in the laboratory tests
visual inspection of the Ag bead indicated that it was not fully exhausted before the end of
the laboratory experiments The abundance of Ag and H2O in elements 0-2 (figure 8) sug-
gests that Ag substantially depletes H2O only near the center of the bead In this simula-
tion it was assumed that the H2O is buffered at the vapor pressure of ice at 230K With
substantially more H2O the finite rate of Ag supply to the gas phase means the H2O abun-
dance is less affected Above some background H2O abundance oxidized Ag is deposited
in every element in excess of metallic Ag
The sensitivity of the system to H2O is shown in Figure 9 The model supports the
hypothesis that the onset of high conductivity between the Au electrodes is a function of
the H2O abundance in the ambient gas but only to a limit Because the flux of Ag atoms
to the tube gas phase is limited by the Joule heating available there is an upper limit to the
effective range of H2O sensitivity In the present case when H2O abundances are buffered
at 250K unoxidized Ag never deposits in excess of silver oxide However for Mars con-
ditions unoxidized silver will deposit and the time delay for the deposition increases with
H2O abundance
The potential behavior of the system for predicted Mars-like conditions is shown in
Figure 10 The differences between the laboratory and Mars simulations are 1) lower ini-
tial T (210 K) 2) Somewhat lower pressure (7 mbar) 3) An ambient H2O abundance
buffered at the vapor pressure of water at 210 K In this Mars simulation with a 650 msec
pulse all of the Ag is vaporized allowing the W filament to continue heating The mod-
eled filament temperature prior to the end of the pulse was 3400K Given the results of
our model to prevent melting of the filament on Mars the current pulse would be sequen-
14
tially increased from a value less than 650 msec until unoxidized silver deposits The signa-
ture of complete Ag vaporization is a significant drop in the current prior to cutoff a con-
sequence of the increased resistivity of W at temperatures above 1800K As a
consequence mostly of the lower starting temperature metallic Ag exceeds AgO deposi-
tion somewhat later than in the laboratory case However since the Ag bead has less sen-
sible heat loss to the atmosphere (7 mbar assumed for Mars ndash 10 mbar in the laboratory)
more heat is lost through Ag vaporization
34 Gas Sensing Properties
The sensitivity of freshly deposited films to hydrogen peroxide vapor in carbon diox-
ide is shown in figure 10 The detection limit of the Polytron unit is 100 ppb and the un-
certainty in the measurements is plusmn50 ppb This limitation prevents sensor testing at levels
below 100 ppb Although 100 ppb is significantly higher than the hydrogen peroxide con-
centrations expected in the martian atmosphere the sensor response for this peroxide level
indicates that sensor detection limits should be several orders of magnitude lower Addi-
tionally since the oxidation of the silver film is dosimetric extremely low rates of oxida-
tion can be measured by continual monitoring during long-duration atmospheric
exposures Figure 10 also shows the response of a freshly deposited film to pure CO2 In
the absence of oxidizing gases the resistance of freshly deposited films slowly decreased
over a period of several hours as the film annealed The response of a freshly deposited
film to a simulated peroxide-free martian atmosphere (013 O2 27 N2 balance CO2)
shows a low sensitivity of the film to O2 relative to H2O2
15
5 Conclusions
The use of in-situ deposition techniques can provide an inexpensive and practical means of
overcoming thin-film chemical sensor limitations due to pre-deployment contamination
and aging We have demonstrated the use of this technique using a silver sensing layer
thermally deposited in-situ under Mars-like conditions These films have a high sensitivity
to H2O2 vapor and a comparatively low sensitivity to O2 which is present at a level of ap-
proximately 013 in the martian atmosphere The high sensitivity of the sensor to perox-
ide along with the dosimetric nature of the thin-film oxidation will enable low rates of
atmospheric oxidation to be monitored on the surface of Mars Simultaneous determina-
tion of H2O and O2 levels by the MS will allow the contributions of these gases to the sen-
sor response to be removed during data analysis By removing from the data the
contribution of O2 and H2O to the sensor response oxidation rates due to the presence of
H2O2 and other photochemically produced atmospheric oxidants can be determined The
ability to deposit sensing films in-situ allows the surface of the sensing film to be refreshed
with unoxidized silver By re-depositing fresh film surfaces at different times of the day
diurnal variations in atmospheric oxidation rates can be determined The diffusion-tube
sensor configuration described in this paper has a number of potential terrestrial applica-
tions including long-term monitoring of oxidative contaminants process gases and envi-
ronmental chambers The measurement capabilities of the in-situ deposition technique can
be expanded by though the use of metals with different electrochemical potentials and with
arrays tailored to the chemical environment of interest
16
Acknowledgements
Work performed at NASA Ames (RC Quinn AP Zent) was funded by the NASA Ames
Directorrsquos Discretionary Fund Beagle 2 activities (MC Towner JC Garry TR Rin-
grose) were funded in part by the UK Particle Physics and Astronomy Research Council
The authors would like to thank Cindy Taylor of the SETI Institute for her assistance in
preparing the sensor sources The author (RQ) would like to thank Pascale Ehrenfreund
and Hans Fraaije of the Leiden Institute of Chemistry Christopher Chyba of the SETI In-
stitute Oliver Botta of the International Space Science Institute and Chris McKay of
NASA Ames Research Center for their manuscript reviews
17
References [1] TY Kong MB McElroy Photochemistry of the martian atmosphere Icarus 32
(1977) 168-189 [2] D M Hunten Possible oxidant sources in the atmosphere and surface of Mars J Mol
Evol 14 (1979) 57-64 [3] HP Klein The Viking biological experiments on Mars Icarus 34 (1978) 666-674 [4] MC Towner MR Patel TJ Ringrose JC Zarnecki D Pullen MR Sims S Haa-
panala A-M Harri J Polko CF Wilson AP Zent RC Quinn FJ Grunthaner MH Hecht and JRC Garry The Beagle 2 environmental sensors science goals and instrument description Planetary and Space Sci 52 (2004) 1141-1156
[5] FJ Grunthaner A Ricco M A Butler A L Lane C P McKay A P Zent R C
Quinn B Murray H P Klein G V Levin R W Terhune M L Homer A Ksend-zov and P Niedermann Investigating the surface chemistry of Mars Analytical Chemistry 67 (1995) 605A-610A
[6] CP McKay F J Grunthaner A L Lane M Herring R K Bartmann A J Ricco
M A Butler B C Murray R C Quinn A P Zent H P Klein G V Levin The Mars oxidant experiment (MOx) for Mars 96 Planetary and Space Science 46 (1998) 769-777
[7] AP Zent R C Quinn and M Madou A thermo-acoustic gas sensor array for photo-
chemically critical species in the martian atmosphere Planetary and Space Science 46 (1998) 795-803
[8] AP Zent RC Quinn FJ Grunthaner MH Hecht MG Buehler CP McKay
Mars atmospheric oxidant sensor (MAOS) an in-situ heterogeneous chemistry analy-sis Planetary and Space Science 51 (2003) 167-175
18
Figure Captions 1 A Beagle 2 Environmental Sensors Oxidation Sensor The sensor was developed and
built for the European Space Agency (ESA) B2 Mars Lander and included on the pay-load as part of the landerrsquos Environmental Sensor Suite
2 Schematic of the oxidation sensor The open-ended sapphire tube is 1 cm long with a 5
mm inner diameter The Au electrodes are 4 millimeters in length with an electrode gap of 2 millimeters A 50 micron diameter titanium filament with a centered silver point source is mounted coaxially in the hollow tube
3 Titanium filament and silver source shown in the fixture used for annealing and silver
source preparation 4 Thermal deposition of a film using 50 microm diameter titanium filament with a silver
source in 10 mbar of CO2 Visible film deposition occurred with a 500 msec pulse A film with a measurable resistance deposited after the second 550 msec pulse
5 Secondary film deposition using a ~350 msec pulse For short current pulses (less than
550 msec) oxide formation occurs as the evaporated silver reacts with oxidizing gases in the electrode region
6 Secondary film deposition using a ~600 msec pulse When a pulse 550 msec or greater
was used deposition of unoxidized silver occurred after an initial period of oxide depo-sition (resistance increase) as the oxidizing gases in the region of the source were con-sumed
7 Comparison of the laboratory test data and the modeled sensor behavior The model
correctly predicts the current flow through the circuit Since heating = I2R the heating rate must likewise be accurate
8 The modeled number density (m-3) of metallic Ag (solid lines) and H2O (dashed lines) in
finite elements from 0 (center of tube including Ag bead ndash circles) through 2 ndash (dia-monds) Although the end of the tube is element 5 we plot only to element 2 because elements 0 and 1 bridge the ends of the Au electrodes Metallic Ag exceeds H2O only near the source
9 The modeled accumulation of metallic Ag and oxidized AgO at the Au electrode margin
as a function of the ambient H2O abundance The times indicate the interval when Ag first accumulates in excess of AgO Conductivity changes will occur somewhat later For H2O abundances buffered at 240K Ag is never deposited in excess of AgO at the Au electrode
10 A comparison of the model using the laboratory test conditions with the model using
predicted Mars conditions Both cases we have adjusted the ambient H2O pressure to
19
071Pa the pressure in equilibrium with ice at 210 K In all cases the solid lines repre-sent Mars simulations the dotted lines represent the laboratory simulations The filled circles represent the number density of metallic Ag (m-2) deposited on the walls of the tube in finite element i=1 which corresponds to the inboard edge of the Au electrode The open circles represent the number density of AgO Number densities are labeled on the right hand ordinate and the upper abscissa The arrows labeled ldquoLabrdquo and ldquoMarsrdquo indicate the time at which metallic Ag begins to be deposited in excess of AgO in ele-ment i=1 On the left hand ordinate and the lower abscissa the thermal history of the metal filament is plotted for the laboratory and Mars experiments
11 The predicted current for operations on Mars (solid) in the laboratory (dotted) The
drop in I near the end of the current pulse is due to increased resistivity of the W fila-ment after Ag is exhausted The mass of the Ag bead is shown for comparison in the two simulations
12 The sensitivity of freshly deposited films to hydrogen peroxide vapor in carbon dioxide
and response of a freshly deposited film to a simulated peroxide free martian atmos-phere (013 O2 27 N2 balance CO2)
20
Figure 1
21
Figure 2
22
Figure 3
23
Figure 4
00
02
04
06
08
10
12
0 20 40 60 80 100 120 140 160Seconds
Cu
rren
t (A
)
0E+00
2E+07
4E+07
6E+07
8E+07
1E+08
Res
ista
nce
(O
hm
s)
AmpsOhms
242 Volts
450msec 500
msec
550msec
550msec
24
Figure 5
00
02
04
06
08
10
12
0 1000 2000 3000 4000 5000 6000milliseconds
Cu
rren
t (A
)
10E+04
12E+04
14E+04
16E+04
18E+04
20E+04
Res
ista
nce
(O
hm
s)
AmpsOhms
253 Volts
25
Figure 6
00
02
04
06
08
10
12
0 500 1000 1500 2000 2500milliseconds
Cu
rren
t (A
)
1E+03
1E+05
2E+05
3E+05
4E+05
Res
ista
nce
(O
hm
s)
AmpsOhms
254 Volts
26
Figure 7
0
02
04
06
08
1
12
0 200 400 600 800 1000 1200 1400 1600
Comparison of Model and Lab Data
Current - Dep 8 (A)I
Cu
rren
t (A
)
Time (ms)
Laboratory Data Modeled Data
27
Figure 8
1010
1012
1014
1016
1018
1020
0 100 200 300 400 500 600
Ag 0Ag 1Ag 2H2O 0H2O 1H2O 2
(m-3
)
Time(msec)
28
Figure 9
1016
1017
1018
1019
1020
160 180 200 220 240
Ag1 210KAgO1 210KAg1 225KAgO1 225KAg1 240KAgO1 240K
Su
rfac
e D
ensi
ty (
m-3
)
Time(msec)
Tbuff
210K
t = 168 msec
Tbuff
225K
t = 198 msec
29
Figure 10
500
1000
1500
2000
2500
3000
3500
1010
1012
1014
1016
1018
1020
1022
0 100 200 300 400 500 600
160 180 200 220 240
T Filament - MarsT Filament -Lab
Ag1 Mars
AgO1 Mars
Ag1 Lab
AgO1 Lab
Tem
per
atu
re (
K)
Ag
and
Ag
O S
urface D
ensity (m
-2)
Time (Temperature) (msec)
Time (Ag and AgO) (msec)
Mars
Lab
30
Figure 11
0
02
04
06
08
1
12
0
5 10-8
1 10-7
15 10-7
2 10-7
25 10-7
3 10-7
35 10-7
4 10-7
0 100 200 300 400 500 600
Current - MarsCurrent - Lab
Mass Ag - MarsMass Ag - Lab
Cu
rren
t (
A)
Mass A
g B
ead (kg
)
Time(msec)
31
Figure 12
09
11
13
15
17
0 10 20 30 40 50 60Minutes
RR
o
500 ppb H2O2100 ppb H2O20 ppb H2O2Mars Gas
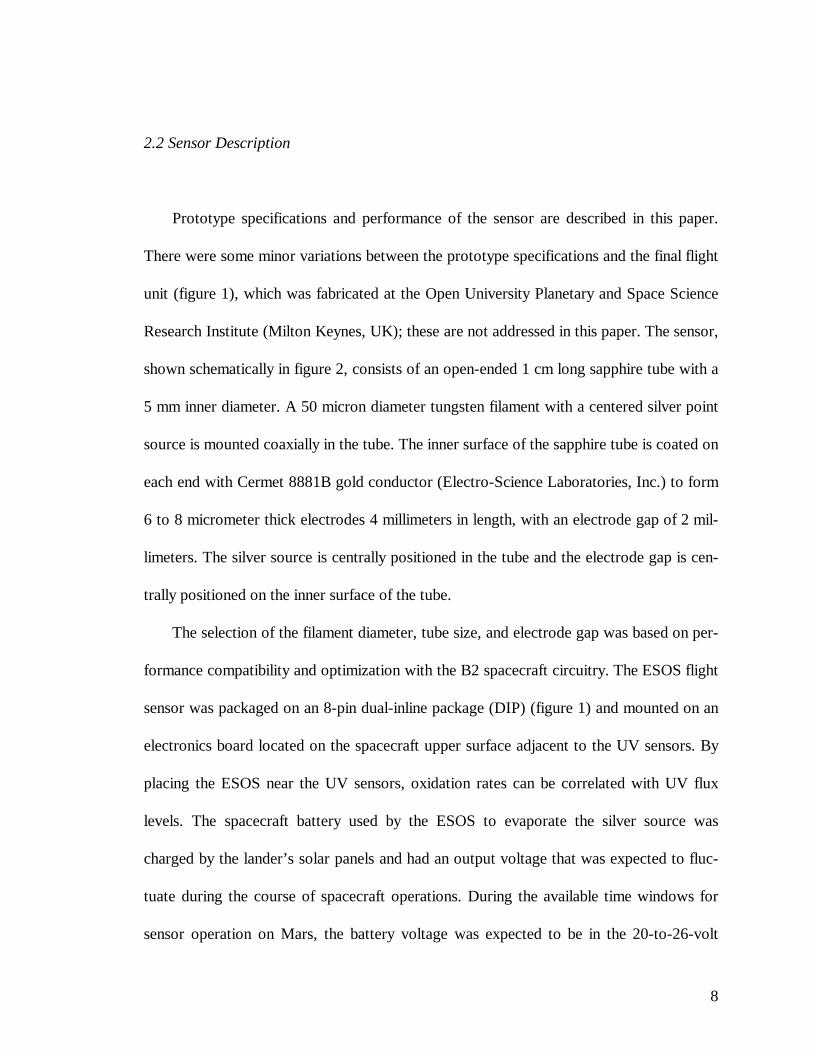
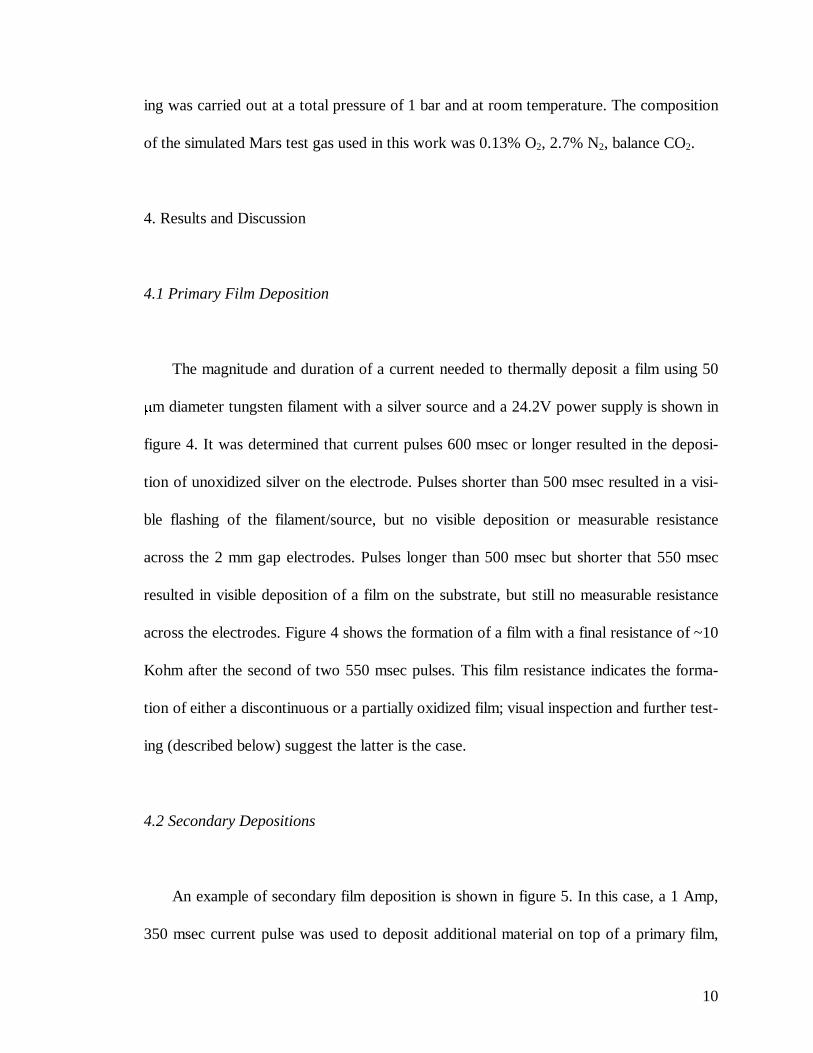
10
ing was carried out at a total pressure of 1 bar and at room temperature The composition
of the simulated Mars test gas used in this work was 013 O2 27 N2 balance CO2
4 Results and Discussion
41 Primary Film Deposition
The magnitude and duration of a current needed to thermally deposit a film using 50 microm diameter tungsten filament with a silver source and a 242V power supply is shown in
figure 4 It was determined that current pulses 600 msec or longer resulted in the deposi-
tion of unoxidized silver on the electrode Pulses shorter than 500 msec resulted in a visi-
ble flashing of the filamentsource but no visible deposition or measurable resistance
across the 2 mm gap electrodes Pulses longer than 500 msec but shorter that 550 msec
resulted in visible deposition of a film on the substrate but still no measurable resistance
across the electrodes Figure 4 shows the formation of a film with a final resistance of ~10
Kohm after the second of two 550 msec pulses This film resistance indicates the forma-
tion of either a discontinuous or a partially oxidized film visual inspection and further test-
ing (described below) suggest the latter is the case
42 Secondary Depositions
An example of secondary film deposition is shown in figure 5 In this case a 1 Amp
350 msec current pulse was used to deposit additional material on top of a primary film
11
resulting in an increase of film resistance In all cases where current pulses between 250
and 350 msec were used an increase in film resistance occurred suggesting that for short
current pulses (less than 550 msec) oxide formation occurs as the evaporated silver reacts
with oxidizing gases in the electrode region When a pulse of 550 msec or greater was
used deposition of unoxidized silver occurred after an initial period of oxide deposition
during which the oxidizing gases in the region of the source were consumed This effect is
shown in figure 6 A 600 msec 1 Amp current pulse resulted in a rapid film resistance in-
crease followed by a rapid decrease Both the resistance increase and decrease were ap-
proximately one order of magnitude relative to the initial baseline film resistance
43 Sensor Model
In order to better understand the behavior of the sensor explore its utility for H2O
measurement predict its behavior in a natural environment and identify possible failure
modes we developed a numerical model of the laboratory experiment and applied it to
likely Mars conditions The model predicts the behavior of the electrical circuit the cur-
rent flow the voltage drop across each component of the circuit the resistance tempera-
ture dependence for each component and the resultant Joule heating The model
calculates separately the heating in the silver (Ag) bead and the tungsten (W) filament that
supports it Within the W filament-Ag bead system the model balances the Joule heating
against radiation sensible heat loss to ambient CO2 and latent heat loss from sublimating
Ag atoms to calculate the temperature of the bead Based upon the bead temperature the
model partitions the Ag among the solid liquid and vapor phases The latent heat of fusion
12
is accounted for when the Ag bead reaches its melting temperature (1234K) The surface
area of each component is tracked to allow calculation of the radiative and sensible heat
exchange Although the bead is allowed to melt wetting of the W filament is not explicitly
accounted for
The flux of Ag atoms from the Ag bead is tracked continuously In the gas phase the
number density of Ag and H2O is calculated along with their reaction rates on collision
Based on the high temperature of the silver atoms during deposition it is assumed that
there is no activation barrier associated with gas phase reactions and that oxidation of Ag
is complete upon collision The Ag is assumed to be oxidized after a single collision and is
tracked as AgO Subsequent collisions or alteration on the tube walls may result in sub-
stantial occurrence of other oxides but for our purposes all oxidized Ag is considered a
poor conductor The mass of unoxidized Ag as well as Ag-oxide deposited on the walls
of the tube is tracked as a function of time The ambient air temperature and the number
density of H2O and O2 are assumed fixed and invariant and are specified as boundary con-
ditions The tube is modeled as a symmetrical domain with 6 finite elements from the cen-
ter to the end Each element has a length of 0909 mm allowing 11 elements along a 1 cm
tube Abundances of gas phase and surface deposits are tracked in each of the elements
from 0 (center) to 5 (end)
The predicted current is shown in Figure 7 with the laboratory data overlaid The re-
lay opens the connection to the battery at t= 0762 s The subsequent drop in current is
due to the rise in resistance of the circuit components with temperature The current levels
out at 092A because temperature rise in the Ag-W system is truncated when the Ag
reaches its boiling temperature (1804 K at 100 mbar) In the simulation here the mass of
13
the Ag bead decreases to about 1 of itrsquos original value However in the laboratory tests
visual inspection of the Ag bead indicated that it was not fully exhausted before the end of
the laboratory experiments The abundance of Ag and H2O in elements 0-2 (figure 8) sug-
gests that Ag substantially depletes H2O only near the center of the bead In this simula-
tion it was assumed that the H2O is buffered at the vapor pressure of ice at 230K With
substantially more H2O the finite rate of Ag supply to the gas phase means the H2O abun-
dance is less affected Above some background H2O abundance oxidized Ag is deposited
in every element in excess of metallic Ag
The sensitivity of the system to H2O is shown in Figure 9 The model supports the
hypothesis that the onset of high conductivity between the Au electrodes is a function of
the H2O abundance in the ambient gas but only to a limit Because the flux of Ag atoms
to the tube gas phase is limited by the Joule heating available there is an upper limit to the
effective range of H2O sensitivity In the present case when H2O abundances are buffered
at 250K unoxidized Ag never deposits in excess of silver oxide However for Mars con-
ditions unoxidized silver will deposit and the time delay for the deposition increases with
H2O abundance
The potential behavior of the system for predicted Mars-like conditions is shown in
Figure 10 The differences between the laboratory and Mars simulations are 1) lower ini-
tial T (210 K) 2) Somewhat lower pressure (7 mbar) 3) An ambient H2O abundance
buffered at the vapor pressure of water at 210 K In this Mars simulation with a 650 msec
pulse all of the Ag is vaporized allowing the W filament to continue heating The mod-
eled filament temperature prior to the end of the pulse was 3400K Given the results of
our model to prevent melting of the filament on Mars the current pulse would be sequen-
14
tially increased from a value less than 650 msec until unoxidized silver deposits The signa-
ture of complete Ag vaporization is a significant drop in the current prior to cutoff a con-
sequence of the increased resistivity of W at temperatures above 1800K As a
consequence mostly of the lower starting temperature metallic Ag exceeds AgO deposi-
tion somewhat later than in the laboratory case However since the Ag bead has less sen-
sible heat loss to the atmosphere (7 mbar assumed for Mars ndash 10 mbar in the laboratory)
more heat is lost through Ag vaporization
34 Gas Sensing Properties
The sensitivity of freshly deposited films to hydrogen peroxide vapor in carbon diox-
ide is shown in figure 10 The detection limit of the Polytron unit is 100 ppb and the un-
certainty in the measurements is plusmn50 ppb This limitation prevents sensor testing at levels
below 100 ppb Although 100 ppb is significantly higher than the hydrogen peroxide con-
centrations expected in the martian atmosphere the sensor response for this peroxide level
indicates that sensor detection limits should be several orders of magnitude lower Addi-
tionally since the oxidation of the silver film is dosimetric extremely low rates of oxida-
tion can be measured by continual monitoring during long-duration atmospheric
exposures Figure 10 also shows the response of a freshly deposited film to pure CO2 In
the absence of oxidizing gases the resistance of freshly deposited films slowly decreased
over a period of several hours as the film annealed The response of a freshly deposited
film to a simulated peroxide-free martian atmosphere (013 O2 27 N2 balance CO2)
shows a low sensitivity of the film to O2 relative to H2O2
15
5 Conclusions
The use of in-situ deposition techniques can provide an inexpensive and practical means of
overcoming thin-film chemical sensor limitations due to pre-deployment contamination
and aging We have demonstrated the use of this technique using a silver sensing layer
thermally deposited in-situ under Mars-like conditions These films have a high sensitivity
to H2O2 vapor and a comparatively low sensitivity to O2 which is present at a level of ap-
proximately 013 in the martian atmosphere The high sensitivity of the sensor to perox-
ide along with the dosimetric nature of the thin-film oxidation will enable low rates of
atmospheric oxidation to be monitored on the surface of Mars Simultaneous determina-
tion of H2O and O2 levels by the MS will allow the contributions of these gases to the sen-
sor response to be removed during data analysis By removing from the data the
contribution of O2 and H2O to the sensor response oxidation rates due to the presence of
H2O2 and other photochemically produced atmospheric oxidants can be determined The
ability to deposit sensing films in-situ allows the surface of the sensing film to be refreshed
with unoxidized silver By re-depositing fresh film surfaces at different times of the day
diurnal variations in atmospheric oxidation rates can be determined The diffusion-tube
sensor configuration described in this paper has a number of potential terrestrial applica-
tions including long-term monitoring of oxidative contaminants process gases and envi-
ronmental chambers The measurement capabilities of the in-situ deposition technique can
be expanded by though the use of metals with different electrochemical potentials and with
arrays tailored to the chemical environment of interest
16
Acknowledgements
Work performed at NASA Ames (RC Quinn AP Zent) was funded by the NASA Ames
Directorrsquos Discretionary Fund Beagle 2 activities (MC Towner JC Garry TR Rin-
grose) were funded in part by the UK Particle Physics and Astronomy Research Council
The authors would like to thank Cindy Taylor of the SETI Institute for her assistance in
preparing the sensor sources The author (RQ) would like to thank Pascale Ehrenfreund
and Hans Fraaije of the Leiden Institute of Chemistry Christopher Chyba of the SETI In-
stitute Oliver Botta of the International Space Science Institute and Chris McKay of
NASA Ames Research Center for their manuscript reviews
17
References [1] TY Kong MB McElroy Photochemistry of the martian atmosphere Icarus 32
(1977) 168-189 [2] D M Hunten Possible oxidant sources in the atmosphere and surface of Mars J Mol
Evol 14 (1979) 57-64 [3] HP Klein The Viking biological experiments on Mars Icarus 34 (1978) 666-674 [4] MC Towner MR Patel TJ Ringrose JC Zarnecki D Pullen MR Sims S Haa-
panala A-M Harri J Polko CF Wilson AP Zent RC Quinn FJ Grunthaner MH Hecht and JRC Garry The Beagle 2 environmental sensors science goals and instrument description Planetary and Space Sci 52 (2004) 1141-1156
[5] FJ Grunthaner A Ricco M A Butler A L Lane C P McKay A P Zent R C
Quinn B Murray H P Klein G V Levin R W Terhune M L Homer A Ksend-zov and P Niedermann Investigating the surface chemistry of Mars Analytical Chemistry 67 (1995) 605A-610A
[6] CP McKay F J Grunthaner A L Lane M Herring R K Bartmann A J Ricco
M A Butler B C Murray R C Quinn A P Zent H P Klein G V Levin The Mars oxidant experiment (MOx) for Mars 96 Planetary and Space Science 46 (1998) 769-777
[7] AP Zent R C Quinn and M Madou A thermo-acoustic gas sensor array for photo-
chemically critical species in the martian atmosphere Planetary and Space Science 46 (1998) 795-803
[8] AP Zent RC Quinn FJ Grunthaner MH Hecht MG Buehler CP McKay
Mars atmospheric oxidant sensor (MAOS) an in-situ heterogeneous chemistry analy-sis Planetary and Space Science 51 (2003) 167-175
18
Figure Captions 1 A Beagle 2 Environmental Sensors Oxidation Sensor The sensor was developed and
built for the European Space Agency (ESA) B2 Mars Lander and included on the pay-load as part of the landerrsquos Environmental Sensor Suite
2 Schematic of the oxidation sensor The open-ended sapphire tube is 1 cm long with a 5
mm inner diameter The Au electrodes are 4 millimeters in length with an electrode gap of 2 millimeters A 50 micron diameter titanium filament with a centered silver point source is mounted coaxially in the hollow tube
3 Titanium filament and silver source shown in the fixture used for annealing and silver
source preparation 4 Thermal deposition of a film using 50 microm diameter titanium filament with a silver
source in 10 mbar of CO2 Visible film deposition occurred with a 500 msec pulse A film with a measurable resistance deposited after the second 550 msec pulse
5 Secondary film deposition using a ~350 msec pulse For short current pulses (less than
550 msec) oxide formation occurs as the evaporated silver reacts with oxidizing gases in the electrode region
6 Secondary film deposition using a ~600 msec pulse When a pulse 550 msec or greater
was used deposition of unoxidized silver occurred after an initial period of oxide depo-sition (resistance increase) as the oxidizing gases in the region of the source were con-sumed
7 Comparison of the laboratory test data and the modeled sensor behavior The model
correctly predicts the current flow through the circuit Since heating = I2R the heating rate must likewise be accurate
8 The modeled number density (m-3) of metallic Ag (solid lines) and H2O (dashed lines) in
finite elements from 0 (center of tube including Ag bead ndash circles) through 2 ndash (dia-monds) Although the end of the tube is element 5 we plot only to element 2 because elements 0 and 1 bridge the ends of the Au electrodes Metallic Ag exceeds H2O only near the source
9 The modeled accumulation of metallic Ag and oxidized AgO at the Au electrode margin
as a function of the ambient H2O abundance The times indicate the interval when Ag first accumulates in excess of AgO Conductivity changes will occur somewhat later For H2O abundances buffered at 240K Ag is never deposited in excess of AgO at the Au electrode
10 A comparison of the model using the laboratory test conditions with the model using
predicted Mars conditions Both cases we have adjusted the ambient H2O pressure to
19
071Pa the pressure in equilibrium with ice at 210 K In all cases the solid lines repre-sent Mars simulations the dotted lines represent the laboratory simulations The filled circles represent the number density of metallic Ag (m-2) deposited on the walls of the tube in finite element i=1 which corresponds to the inboard edge of the Au electrode The open circles represent the number density of AgO Number densities are labeled on the right hand ordinate and the upper abscissa The arrows labeled ldquoLabrdquo and ldquoMarsrdquo indicate the time at which metallic Ag begins to be deposited in excess of AgO in ele-ment i=1 On the left hand ordinate and the lower abscissa the thermal history of the metal filament is plotted for the laboratory and Mars experiments
11 The predicted current for operations on Mars (solid) in the laboratory (dotted) The
drop in I near the end of the current pulse is due to increased resistivity of the W fila-ment after Ag is exhausted The mass of the Ag bead is shown for comparison in the two simulations
12 The sensitivity of freshly deposited films to hydrogen peroxide vapor in carbon dioxide
and response of a freshly deposited film to a simulated peroxide free martian atmos-phere (013 O2 27 N2 balance CO2)
20
Figure 1
21
Figure 2
22
Figure 3
23
Figure 4
00
02
04
06
08
10
12
0 20 40 60 80 100 120 140 160Seconds
Cu
rren
t (A
)
0E+00
2E+07
4E+07
6E+07
8E+07
1E+08
Res
ista
nce
(O
hm
s)
AmpsOhms
242 Volts
450msec 500
msec
550msec
550msec
24
Figure 5
00
02
04
06
08
10
12
0 1000 2000 3000 4000 5000 6000milliseconds
Cu
rren
t (A
)
10E+04
12E+04
14E+04
16E+04
18E+04
20E+04
Res
ista
nce
(O
hm
s)
AmpsOhms
253 Volts
25
Figure 6
00
02
04
06
08
10
12
0 500 1000 1500 2000 2500milliseconds
Cu
rren
t (A
)
1E+03
1E+05
2E+05
3E+05
4E+05
Res
ista
nce
(O
hm
s)
AmpsOhms
254 Volts
26
Figure 7
0
02
04
06
08
1
12
0 200 400 600 800 1000 1200 1400 1600
Comparison of Model and Lab Data
Current - Dep 8 (A)I
Cu
rren
t (A
)
Time (ms)
Laboratory Data Modeled Data
27
Figure 8
1010
1012
1014
1016
1018
1020
0 100 200 300 400 500 600
Ag 0Ag 1Ag 2H2O 0H2O 1H2O 2
(m-3
)
Time(msec)
28
Figure 9
1016
1017
1018
1019
1020
160 180 200 220 240
Ag1 210KAgO1 210KAg1 225KAgO1 225KAg1 240KAgO1 240K
Su
rfac
e D
ensi
ty (
m-3
)
Time(msec)
Tbuff
210K
t = 168 msec
Tbuff
225K
t = 198 msec
29
Figure 10
500
1000
1500
2000
2500
3000
3500
1010
1012
1014
1016
1018
1020
1022
0 100 200 300 400 500 600
160 180 200 220 240
T Filament - MarsT Filament -Lab
Ag1 Mars
AgO1 Mars
Ag1 Lab
AgO1 Lab
Tem
per
atu
re (
K)
Ag
and
Ag
O S
urface D
ensity (m
-2)
Time (Temperature) (msec)
Time (Ag and AgO) (msec)
Mars
Lab
30
Figure 11
0
02
04
06
08
1
12
0
5 10-8
1 10-7
15 10-7
2 10-7
25 10-7
3 10-7
35 10-7
4 10-7
0 100 200 300 400 500 600
Current - MarsCurrent - Lab
Mass Ag - MarsMass Ag - Lab
Cu
rren
t (
A)
Mass A
g B
ead (kg
)
Time(msec)
31
Figure 12
09
11
13
15
17
0 10 20 30 40 50 60Minutes
RR
o
500 ppb H2O2100 ppb H2O20 ppb H2O2Mars Gas
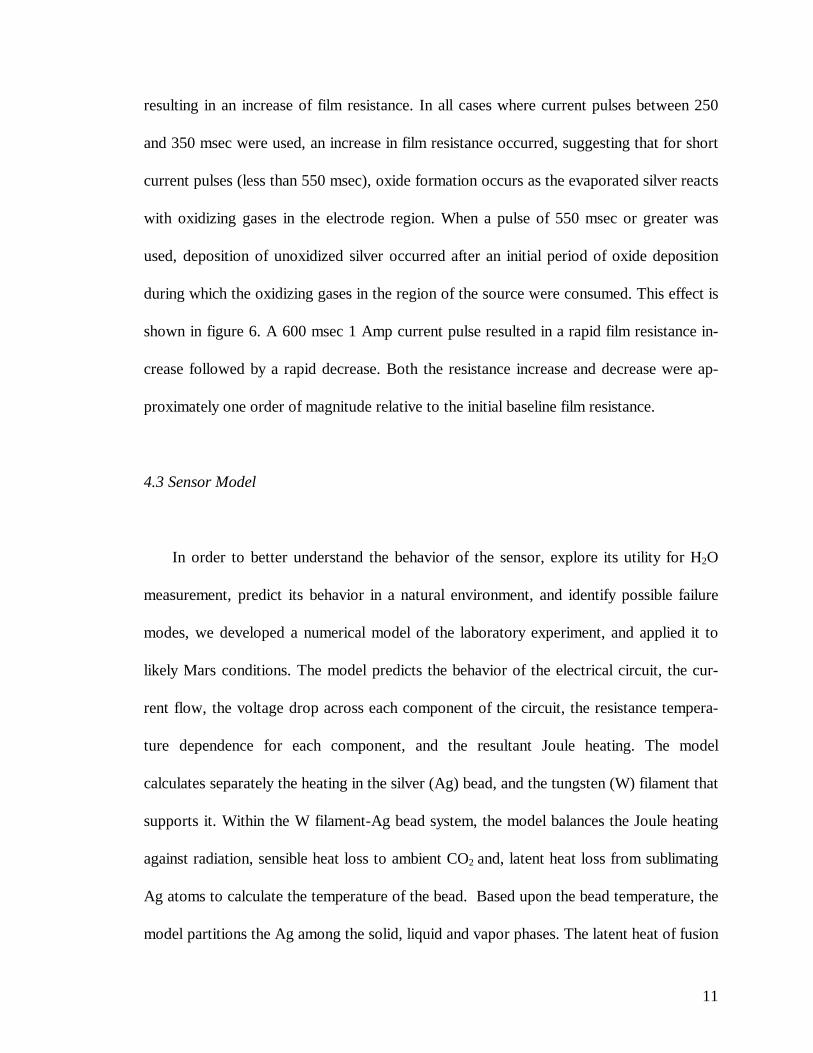
11
resulting in an increase of film resistance In all cases where current pulses between 250
and 350 msec were used an increase in film resistance occurred suggesting that for short
current pulses (less than 550 msec) oxide formation occurs as the evaporated silver reacts
with oxidizing gases in the electrode region When a pulse of 550 msec or greater was
used deposition of unoxidized silver occurred after an initial period of oxide deposition
during which the oxidizing gases in the region of the source were consumed This effect is
shown in figure 6 A 600 msec 1 Amp current pulse resulted in a rapid film resistance in-
crease followed by a rapid decrease Both the resistance increase and decrease were ap-
proximately one order of magnitude relative to the initial baseline film resistance
43 Sensor Model
In order to better understand the behavior of the sensor explore its utility for H2O
measurement predict its behavior in a natural environment and identify possible failure
modes we developed a numerical model of the laboratory experiment and applied it to
likely Mars conditions The model predicts the behavior of the electrical circuit the cur-
rent flow the voltage drop across each component of the circuit the resistance tempera-
ture dependence for each component and the resultant Joule heating The model
calculates separately the heating in the silver (Ag) bead and the tungsten (W) filament that
supports it Within the W filament-Ag bead system the model balances the Joule heating
against radiation sensible heat loss to ambient CO2 and latent heat loss from sublimating
Ag atoms to calculate the temperature of the bead Based upon the bead temperature the
model partitions the Ag among the solid liquid and vapor phases The latent heat of fusion
12
is accounted for when the Ag bead reaches its melting temperature (1234K) The surface
area of each component is tracked to allow calculation of the radiative and sensible heat
exchange Although the bead is allowed to melt wetting of the W filament is not explicitly
accounted for
The flux of Ag atoms from the Ag bead is tracked continuously In the gas phase the
number density of Ag and H2O is calculated along with their reaction rates on collision
Based on the high temperature of the silver atoms during deposition it is assumed that
there is no activation barrier associated with gas phase reactions and that oxidation of Ag
is complete upon collision The Ag is assumed to be oxidized after a single collision and is
tracked as AgO Subsequent collisions or alteration on the tube walls may result in sub-
stantial occurrence of other oxides but for our purposes all oxidized Ag is considered a
poor conductor The mass of unoxidized Ag as well as Ag-oxide deposited on the walls
of the tube is tracked as a function of time The ambient air temperature and the number
density of H2O and O2 are assumed fixed and invariant and are specified as boundary con-
ditions The tube is modeled as a symmetrical domain with 6 finite elements from the cen-
ter to the end Each element has a length of 0909 mm allowing 11 elements along a 1 cm
tube Abundances of gas phase and surface deposits are tracked in each of the elements
from 0 (center) to 5 (end)
The predicted current is shown in Figure 7 with the laboratory data overlaid The re-
lay opens the connection to the battery at t= 0762 s The subsequent drop in current is
due to the rise in resistance of the circuit components with temperature The current levels
out at 092A because temperature rise in the Ag-W system is truncated when the Ag
reaches its boiling temperature (1804 K at 100 mbar) In the simulation here the mass of
13
the Ag bead decreases to about 1 of itrsquos original value However in the laboratory tests
visual inspection of the Ag bead indicated that it was not fully exhausted before the end of
the laboratory experiments The abundance of Ag and H2O in elements 0-2 (figure 8) sug-
gests that Ag substantially depletes H2O only near the center of the bead In this simula-
tion it was assumed that the H2O is buffered at the vapor pressure of ice at 230K With
substantially more H2O the finite rate of Ag supply to the gas phase means the H2O abun-
dance is less affected Above some background H2O abundance oxidized Ag is deposited
in every element in excess of metallic Ag
The sensitivity of the system to H2O is shown in Figure 9 The model supports the
hypothesis that the onset of high conductivity between the Au electrodes is a function of
the H2O abundance in the ambient gas but only to a limit Because the flux of Ag atoms
to the tube gas phase is limited by the Joule heating available there is an upper limit to the
effective range of H2O sensitivity In the present case when H2O abundances are buffered
at 250K unoxidized Ag never deposits in excess of silver oxide However for Mars con-
ditions unoxidized silver will deposit and the time delay for the deposition increases with
H2O abundance
The potential behavior of the system for predicted Mars-like conditions is shown in
Figure 10 The differences between the laboratory and Mars simulations are 1) lower ini-
tial T (210 K) 2) Somewhat lower pressure (7 mbar) 3) An ambient H2O abundance
buffered at the vapor pressure of water at 210 K In this Mars simulation with a 650 msec
pulse all of the Ag is vaporized allowing the W filament to continue heating The mod-
eled filament temperature prior to the end of the pulse was 3400K Given the results of
our model to prevent melting of the filament on Mars the current pulse would be sequen-
14
tially increased from a value less than 650 msec until unoxidized silver deposits The signa-
ture of complete Ag vaporization is a significant drop in the current prior to cutoff a con-
sequence of the increased resistivity of W at temperatures above 1800K As a
consequence mostly of the lower starting temperature metallic Ag exceeds AgO deposi-
tion somewhat later than in the laboratory case However since the Ag bead has less sen-
sible heat loss to the atmosphere (7 mbar assumed for Mars ndash 10 mbar in the laboratory)
more heat is lost through Ag vaporization
34 Gas Sensing Properties
The sensitivity of freshly deposited films to hydrogen peroxide vapor in carbon diox-
ide is shown in figure 10 The detection limit of the Polytron unit is 100 ppb and the un-
certainty in the measurements is plusmn50 ppb This limitation prevents sensor testing at levels
below 100 ppb Although 100 ppb is significantly higher than the hydrogen peroxide con-
centrations expected in the martian atmosphere the sensor response for this peroxide level
indicates that sensor detection limits should be several orders of magnitude lower Addi-
tionally since the oxidation of the silver film is dosimetric extremely low rates of oxida-
tion can be measured by continual monitoring during long-duration atmospheric
exposures Figure 10 also shows the response of a freshly deposited film to pure CO2 In
the absence of oxidizing gases the resistance of freshly deposited films slowly decreased
over a period of several hours as the film annealed The response of a freshly deposited
film to a simulated peroxide-free martian atmosphere (013 O2 27 N2 balance CO2)
shows a low sensitivity of the film to O2 relative to H2O2
15
5 Conclusions
The use of in-situ deposition techniques can provide an inexpensive and practical means of
overcoming thin-film chemical sensor limitations due to pre-deployment contamination
and aging We have demonstrated the use of this technique using a silver sensing layer
thermally deposited in-situ under Mars-like conditions These films have a high sensitivity
to H2O2 vapor and a comparatively low sensitivity to O2 which is present at a level of ap-
proximately 013 in the martian atmosphere The high sensitivity of the sensor to perox-
ide along with the dosimetric nature of the thin-film oxidation will enable low rates of
atmospheric oxidation to be monitored on the surface of Mars Simultaneous determina-
tion of H2O and O2 levels by the MS will allow the contributions of these gases to the sen-
sor response to be removed during data analysis By removing from the data the
contribution of O2 and H2O to the sensor response oxidation rates due to the presence of
H2O2 and other photochemically produced atmospheric oxidants can be determined The
ability to deposit sensing films in-situ allows the surface of the sensing film to be refreshed
with unoxidized silver By re-depositing fresh film surfaces at different times of the day
diurnal variations in atmospheric oxidation rates can be determined The diffusion-tube
sensor configuration described in this paper has a number of potential terrestrial applica-
tions including long-term monitoring of oxidative contaminants process gases and envi-
ronmental chambers The measurement capabilities of the in-situ deposition technique can
be expanded by though the use of metals with different electrochemical potentials and with
arrays tailored to the chemical environment of interest
16
Acknowledgements
Work performed at NASA Ames (RC Quinn AP Zent) was funded by the NASA Ames
Directorrsquos Discretionary Fund Beagle 2 activities (MC Towner JC Garry TR Rin-
grose) were funded in part by the UK Particle Physics and Astronomy Research Council
The authors would like to thank Cindy Taylor of the SETI Institute for her assistance in
preparing the sensor sources The author (RQ) would like to thank Pascale Ehrenfreund
and Hans Fraaije of the Leiden Institute of Chemistry Christopher Chyba of the SETI In-
stitute Oliver Botta of the International Space Science Institute and Chris McKay of
NASA Ames Research Center for their manuscript reviews
17
References [1] TY Kong MB McElroy Photochemistry of the martian atmosphere Icarus 32
(1977) 168-189 [2] D M Hunten Possible oxidant sources in the atmosphere and surface of Mars J Mol
Evol 14 (1979) 57-64 [3] HP Klein The Viking biological experiments on Mars Icarus 34 (1978) 666-674 [4] MC Towner MR Patel TJ Ringrose JC Zarnecki D Pullen MR Sims S Haa-
panala A-M Harri J Polko CF Wilson AP Zent RC Quinn FJ Grunthaner MH Hecht and JRC Garry The Beagle 2 environmental sensors science goals and instrument description Planetary and Space Sci 52 (2004) 1141-1156
[5] FJ Grunthaner A Ricco M A Butler A L Lane C P McKay A P Zent R C
Quinn B Murray H P Klein G V Levin R W Terhune M L Homer A Ksend-zov and P Niedermann Investigating the surface chemistry of Mars Analytical Chemistry 67 (1995) 605A-610A
[6] CP McKay F J Grunthaner A L Lane M Herring R K Bartmann A J Ricco
M A Butler B C Murray R C Quinn A P Zent H P Klein G V Levin The Mars oxidant experiment (MOx) for Mars 96 Planetary and Space Science 46 (1998) 769-777
[7] AP Zent R C Quinn and M Madou A thermo-acoustic gas sensor array for photo-
chemically critical species in the martian atmosphere Planetary and Space Science 46 (1998) 795-803
[8] AP Zent RC Quinn FJ Grunthaner MH Hecht MG Buehler CP McKay
Mars atmospheric oxidant sensor (MAOS) an in-situ heterogeneous chemistry analy-sis Planetary and Space Science 51 (2003) 167-175
18
Figure Captions 1 A Beagle 2 Environmental Sensors Oxidation Sensor The sensor was developed and
built for the European Space Agency (ESA) B2 Mars Lander and included on the pay-load as part of the landerrsquos Environmental Sensor Suite
2 Schematic of the oxidation sensor The open-ended sapphire tube is 1 cm long with a 5
mm inner diameter The Au electrodes are 4 millimeters in length with an electrode gap of 2 millimeters A 50 micron diameter titanium filament with a centered silver point source is mounted coaxially in the hollow tube
3 Titanium filament and silver source shown in the fixture used for annealing and silver
source preparation 4 Thermal deposition of a film using 50 microm diameter titanium filament with a silver
source in 10 mbar of CO2 Visible film deposition occurred with a 500 msec pulse A film with a measurable resistance deposited after the second 550 msec pulse
5 Secondary film deposition using a ~350 msec pulse For short current pulses (less than
550 msec) oxide formation occurs as the evaporated silver reacts with oxidizing gases in the electrode region
6 Secondary film deposition using a ~600 msec pulse When a pulse 550 msec or greater
was used deposition of unoxidized silver occurred after an initial period of oxide depo-sition (resistance increase) as the oxidizing gases in the region of the source were con-sumed
7 Comparison of the laboratory test data and the modeled sensor behavior The model
correctly predicts the current flow through the circuit Since heating = I2R the heating rate must likewise be accurate
8 The modeled number density (m-3) of metallic Ag (solid lines) and H2O (dashed lines) in
finite elements from 0 (center of tube including Ag bead ndash circles) through 2 ndash (dia-monds) Although the end of the tube is element 5 we plot only to element 2 because elements 0 and 1 bridge the ends of the Au electrodes Metallic Ag exceeds H2O only near the source
9 The modeled accumulation of metallic Ag and oxidized AgO at the Au electrode margin
as a function of the ambient H2O abundance The times indicate the interval when Ag first accumulates in excess of AgO Conductivity changes will occur somewhat later For H2O abundances buffered at 240K Ag is never deposited in excess of AgO at the Au electrode
10 A comparison of the model using the laboratory test conditions with the model using
predicted Mars conditions Both cases we have adjusted the ambient H2O pressure to
19
071Pa the pressure in equilibrium with ice at 210 K In all cases the solid lines repre-sent Mars simulations the dotted lines represent the laboratory simulations The filled circles represent the number density of metallic Ag (m-2) deposited on the walls of the tube in finite element i=1 which corresponds to the inboard edge of the Au electrode The open circles represent the number density of AgO Number densities are labeled on the right hand ordinate and the upper abscissa The arrows labeled ldquoLabrdquo and ldquoMarsrdquo indicate the time at which metallic Ag begins to be deposited in excess of AgO in ele-ment i=1 On the left hand ordinate and the lower abscissa the thermal history of the metal filament is plotted for the laboratory and Mars experiments
11 The predicted current for operations on Mars (solid) in the laboratory (dotted) The
drop in I near the end of the current pulse is due to increased resistivity of the W fila-ment after Ag is exhausted The mass of the Ag bead is shown for comparison in the two simulations
12 The sensitivity of freshly deposited films to hydrogen peroxide vapor in carbon dioxide
and response of a freshly deposited film to a simulated peroxide free martian atmos-phere (013 O2 27 N2 balance CO2)
20
Figure 1
21
Figure 2
22
Figure 3
23
Figure 4
00
02
04
06
08
10
12
0 20 40 60 80 100 120 140 160Seconds
Cu
rren
t (A
)
0E+00
2E+07
4E+07
6E+07
8E+07
1E+08
Res
ista
nce
(O
hm
s)
AmpsOhms
242 Volts
450msec 500
msec
550msec
550msec
24
Figure 5
00
02
04
06
08
10
12
0 1000 2000 3000 4000 5000 6000milliseconds
Cu
rren
t (A
)
10E+04
12E+04
14E+04
16E+04
18E+04
20E+04
Res
ista
nce
(O
hm
s)
AmpsOhms
253 Volts
25
Figure 6
00
02
04
06
08
10
12
0 500 1000 1500 2000 2500milliseconds
Cu
rren
t (A
)
1E+03
1E+05
2E+05
3E+05
4E+05
Res
ista
nce
(O
hm
s)
AmpsOhms
254 Volts
26
Figure 7
0
02
04
06
08
1
12
0 200 400 600 800 1000 1200 1400 1600
Comparison of Model and Lab Data
Current - Dep 8 (A)I
Cu
rren
t (A
)
Time (ms)
Laboratory Data Modeled Data
27
Figure 8
1010
1012
1014
1016
1018
1020
0 100 200 300 400 500 600
Ag 0Ag 1Ag 2H2O 0H2O 1H2O 2
(m-3
)
Time(msec)
28
Figure 9
1016
1017
1018
1019
1020
160 180 200 220 240
Ag1 210KAgO1 210KAg1 225KAgO1 225KAg1 240KAgO1 240K
Su
rfac
e D
ensi
ty (
m-3
)
Time(msec)
Tbuff
210K
t = 168 msec
Tbuff
225K
t = 198 msec
29
Figure 10
500
1000
1500
2000
2500
3000
3500
1010
1012
1014
1016
1018
1020
1022
0 100 200 300 400 500 600
160 180 200 220 240
T Filament - MarsT Filament -Lab
Ag1 Mars
AgO1 Mars
Ag1 Lab
AgO1 Lab
Tem
per
atu
re (
K)
Ag
and
Ag
O S
urface D
ensity (m
-2)
Time (Temperature) (msec)
Time (Ag and AgO) (msec)
Mars
Lab
30
Figure 11
0
02
04
06
08
1
12
0
5 10-8
1 10-7
15 10-7
2 10-7
25 10-7
3 10-7
35 10-7
4 10-7
0 100 200 300 400 500 600
Current - MarsCurrent - Lab
Mass Ag - MarsMass Ag - Lab
Cu
rren
t (
A)
Mass A
g B
ead (kg
)
Time(msec)
31
Figure 12
09
11
13
15
17
0 10 20 30 40 50 60Minutes
RR
o
500 ppb H2O2100 ppb H2O20 ppb H2O2Mars Gas

12
is accounted for when the Ag bead reaches its melting temperature (1234K) The surface
area of each component is tracked to allow calculation of the radiative and sensible heat
exchange Although the bead is allowed to melt wetting of the W filament is not explicitly
accounted for
The flux of Ag atoms from the Ag bead is tracked continuously In the gas phase the
number density of Ag and H2O is calculated along with their reaction rates on collision
Based on the high temperature of the silver atoms during deposition it is assumed that
there is no activation barrier associated with gas phase reactions and that oxidation of Ag
is complete upon collision The Ag is assumed to be oxidized after a single collision and is
tracked as AgO Subsequent collisions or alteration on the tube walls may result in sub-
stantial occurrence of other oxides but for our purposes all oxidized Ag is considered a
poor conductor The mass of unoxidized Ag as well as Ag-oxide deposited on the walls
of the tube is tracked as a function of time The ambient air temperature and the number
density of H2O and O2 are assumed fixed and invariant and are specified as boundary con-
ditions The tube is modeled as a symmetrical domain with 6 finite elements from the cen-
ter to the end Each element has a length of 0909 mm allowing 11 elements along a 1 cm
tube Abundances of gas phase and surface deposits are tracked in each of the elements
from 0 (center) to 5 (end)
The predicted current is shown in Figure 7 with the laboratory data overlaid The re-
lay opens the connection to the battery at t= 0762 s The subsequent drop in current is
due to the rise in resistance of the circuit components with temperature The current levels
out at 092A because temperature rise in the Ag-W system is truncated when the Ag
reaches its boiling temperature (1804 K at 100 mbar) In the simulation here the mass of
13
the Ag bead decreases to about 1 of itrsquos original value However in the laboratory tests
visual inspection of the Ag bead indicated that it was not fully exhausted before the end of
the laboratory experiments The abundance of Ag and H2O in elements 0-2 (figure 8) sug-
gests that Ag substantially depletes H2O only near the center of the bead In this simula-
tion it was assumed that the H2O is buffered at the vapor pressure of ice at 230K With
substantially more H2O the finite rate of Ag supply to the gas phase means the H2O abun-
dance is less affected Above some background H2O abundance oxidized Ag is deposited
in every element in excess of metallic Ag
The sensitivity of the system to H2O is shown in Figure 9 The model supports the
hypothesis that the onset of high conductivity between the Au electrodes is a function of
the H2O abundance in the ambient gas but only to a limit Because the flux of Ag atoms
to the tube gas phase is limited by the Joule heating available there is an upper limit to the
effective range of H2O sensitivity In the present case when H2O abundances are buffered
at 250K unoxidized Ag never deposits in excess of silver oxide However for Mars con-
ditions unoxidized silver will deposit and the time delay for the deposition increases with
H2O abundance
The potential behavior of the system for predicted Mars-like conditions is shown in
Figure 10 The differences between the laboratory and Mars simulations are 1) lower ini-
tial T (210 K) 2) Somewhat lower pressure (7 mbar) 3) An ambient H2O abundance
buffered at the vapor pressure of water at 210 K In this Mars simulation with a 650 msec
pulse all of the Ag is vaporized allowing the W filament to continue heating The mod-
eled filament temperature prior to the end of the pulse was 3400K Given the results of
our model to prevent melting of the filament on Mars the current pulse would be sequen-
14
tially increased from a value less than 650 msec until unoxidized silver deposits The signa-
ture of complete Ag vaporization is a significant drop in the current prior to cutoff a con-
sequence of the increased resistivity of W at temperatures above 1800K As a
consequence mostly of the lower starting temperature metallic Ag exceeds AgO deposi-
tion somewhat later than in the laboratory case However since the Ag bead has less sen-
sible heat loss to the atmosphere (7 mbar assumed for Mars ndash 10 mbar in the laboratory)
more heat is lost through Ag vaporization
34 Gas Sensing Properties
The sensitivity of freshly deposited films to hydrogen peroxide vapor in carbon diox-
ide is shown in figure 10 The detection limit of the Polytron unit is 100 ppb and the un-
certainty in the measurements is plusmn50 ppb This limitation prevents sensor testing at levels
below 100 ppb Although 100 ppb is significantly higher than the hydrogen peroxide con-
centrations expected in the martian atmosphere the sensor response for this peroxide level
indicates that sensor detection limits should be several orders of magnitude lower Addi-
tionally since the oxidation of the silver film is dosimetric extremely low rates of oxida-
tion can be measured by continual monitoring during long-duration atmospheric
exposures Figure 10 also shows the response of a freshly deposited film to pure CO2 In
the absence of oxidizing gases the resistance of freshly deposited films slowly decreased
over a period of several hours as the film annealed The response of a freshly deposited
film to a simulated peroxide-free martian atmosphere (013 O2 27 N2 balance CO2)
shows a low sensitivity of the film to O2 relative to H2O2
15
5 Conclusions
The use of in-situ deposition techniques can provide an inexpensive and practical means of
overcoming thin-film chemical sensor limitations due to pre-deployment contamination
and aging We have demonstrated the use of this technique using a silver sensing layer
thermally deposited in-situ under Mars-like conditions These films have a high sensitivity
to H2O2 vapor and a comparatively low sensitivity to O2 which is present at a level of ap-
proximately 013 in the martian atmosphere The high sensitivity of the sensor to perox-
ide along with the dosimetric nature of the thin-film oxidation will enable low rates of
atmospheric oxidation to be monitored on the surface of Mars Simultaneous determina-
tion of H2O and O2 levels by the MS will allow the contributions of these gases to the sen-
sor response to be removed during data analysis By removing from the data the
contribution of O2 and H2O to the sensor response oxidation rates due to the presence of
H2O2 and other photochemically produced atmospheric oxidants can be determined The
ability to deposit sensing films in-situ allows the surface of the sensing film to be refreshed
with unoxidized silver By re-depositing fresh film surfaces at different times of the day
diurnal variations in atmospheric oxidation rates can be determined The diffusion-tube
sensor configuration described in this paper has a number of potential terrestrial applica-
tions including long-term monitoring of oxidative contaminants process gases and envi-
ronmental chambers The measurement capabilities of the in-situ deposition technique can
be expanded by though the use of metals with different electrochemical potentials and with
arrays tailored to the chemical environment of interest
16
Acknowledgements
Work performed at NASA Ames (RC Quinn AP Zent) was funded by the NASA Ames
Directorrsquos Discretionary Fund Beagle 2 activities (MC Towner JC Garry TR Rin-
grose) were funded in part by the UK Particle Physics and Astronomy Research Council
The authors would like to thank Cindy Taylor of the SETI Institute for her assistance in
preparing the sensor sources The author (RQ) would like to thank Pascale Ehrenfreund
and Hans Fraaije of the Leiden Institute of Chemistry Christopher Chyba of the SETI In-
stitute Oliver Botta of the International Space Science Institute and Chris McKay of
NASA Ames Research Center for their manuscript reviews
17
References [1] TY Kong MB McElroy Photochemistry of the martian atmosphere Icarus 32
(1977) 168-189 [2] D M Hunten Possible oxidant sources in the atmosphere and surface of Mars J Mol
Evol 14 (1979) 57-64 [3] HP Klein The Viking biological experiments on Mars Icarus 34 (1978) 666-674 [4] MC Towner MR Patel TJ Ringrose JC Zarnecki D Pullen MR Sims S Haa-
panala A-M Harri J Polko CF Wilson AP Zent RC Quinn FJ Grunthaner MH Hecht and JRC Garry The Beagle 2 environmental sensors science goals and instrument description Planetary and Space Sci 52 (2004) 1141-1156
[5] FJ Grunthaner A Ricco M A Butler A L Lane C P McKay A P Zent R C
Quinn B Murray H P Klein G V Levin R W Terhune M L Homer A Ksend-zov and P Niedermann Investigating the surface chemistry of Mars Analytical Chemistry 67 (1995) 605A-610A
[6] CP McKay F J Grunthaner A L Lane M Herring R K Bartmann A J Ricco
M A Butler B C Murray R C Quinn A P Zent H P Klein G V Levin The Mars oxidant experiment (MOx) for Mars 96 Planetary and Space Science 46 (1998) 769-777
[7] AP Zent R C Quinn and M Madou A thermo-acoustic gas sensor array for photo-
chemically critical species in the martian atmosphere Planetary and Space Science 46 (1998) 795-803
[8] AP Zent RC Quinn FJ Grunthaner MH Hecht MG Buehler CP McKay
Mars atmospheric oxidant sensor (MAOS) an in-situ heterogeneous chemistry analy-sis Planetary and Space Science 51 (2003) 167-175
18
Figure Captions 1 A Beagle 2 Environmental Sensors Oxidation Sensor The sensor was developed and
built for the European Space Agency (ESA) B2 Mars Lander and included on the pay-load as part of the landerrsquos Environmental Sensor Suite
2 Schematic of the oxidation sensor The open-ended sapphire tube is 1 cm long with a 5
mm inner diameter The Au electrodes are 4 millimeters in length with an electrode gap of 2 millimeters A 50 micron diameter titanium filament with a centered silver point source is mounted coaxially in the hollow tube
3 Titanium filament and silver source shown in the fixture used for annealing and silver
source preparation 4 Thermal deposition of a film using 50 microm diameter titanium filament with a silver
source in 10 mbar of CO2 Visible film deposition occurred with a 500 msec pulse A film with a measurable resistance deposited after the second 550 msec pulse
5 Secondary film deposition using a ~350 msec pulse For short current pulses (less than
550 msec) oxide formation occurs as the evaporated silver reacts with oxidizing gases in the electrode region
6 Secondary film deposition using a ~600 msec pulse When a pulse 550 msec or greater
was used deposition of unoxidized silver occurred after an initial period of oxide depo-sition (resistance increase) as the oxidizing gases in the region of the source were con-sumed
7 Comparison of the laboratory test data and the modeled sensor behavior The model
correctly predicts the current flow through the circuit Since heating = I2R the heating rate must likewise be accurate
8 The modeled number density (m-3) of metallic Ag (solid lines) and H2O (dashed lines) in
finite elements from 0 (center of tube including Ag bead ndash circles) through 2 ndash (dia-monds) Although the end of the tube is element 5 we plot only to element 2 because elements 0 and 1 bridge the ends of the Au electrodes Metallic Ag exceeds H2O only near the source
9 The modeled accumulation of metallic Ag and oxidized AgO at the Au electrode margin
as a function of the ambient H2O abundance The times indicate the interval when Ag first accumulates in excess of AgO Conductivity changes will occur somewhat later For H2O abundances buffered at 240K Ag is never deposited in excess of AgO at the Au electrode
10 A comparison of the model using the laboratory test conditions with the model using
predicted Mars conditions Both cases we have adjusted the ambient H2O pressure to
19
071Pa the pressure in equilibrium with ice at 210 K In all cases the solid lines repre-sent Mars simulations the dotted lines represent the laboratory simulations The filled circles represent the number density of metallic Ag (m-2) deposited on the walls of the tube in finite element i=1 which corresponds to the inboard edge of the Au electrode The open circles represent the number density of AgO Number densities are labeled on the right hand ordinate and the upper abscissa The arrows labeled ldquoLabrdquo and ldquoMarsrdquo indicate the time at which metallic Ag begins to be deposited in excess of AgO in ele-ment i=1 On the left hand ordinate and the lower abscissa the thermal history of the metal filament is plotted for the laboratory and Mars experiments
11 The predicted current for operations on Mars (solid) in the laboratory (dotted) The
drop in I near the end of the current pulse is due to increased resistivity of the W fila-ment after Ag is exhausted The mass of the Ag bead is shown for comparison in the two simulations
12 The sensitivity of freshly deposited films to hydrogen peroxide vapor in carbon dioxide
and response of a freshly deposited film to a simulated peroxide free martian atmos-phere (013 O2 27 N2 balance CO2)
20
Figure 1
21
Figure 2
22
Figure 3
23
Figure 4
00
02
04
06
08
10
12
0 20 40 60 80 100 120 140 160Seconds
Cu
rren
t (A
)
0E+00
2E+07
4E+07
6E+07
8E+07
1E+08
Res
ista
nce
(O
hm
s)
AmpsOhms
242 Volts
450msec 500
msec
550msec
550msec
24
Figure 5
00
02
04
06
08
10
12
0 1000 2000 3000 4000 5000 6000milliseconds
Cu
rren
t (A
)
10E+04
12E+04
14E+04
16E+04
18E+04
20E+04
Res
ista
nce
(O
hm
s)
AmpsOhms
253 Volts
25
Figure 6
00
02
04
06
08
10
12
0 500 1000 1500 2000 2500milliseconds
Cu
rren
t (A
)
1E+03
1E+05
2E+05
3E+05
4E+05
Res
ista
nce
(O
hm
s)
AmpsOhms
254 Volts
26
Figure 7
0
02
04
06
08
1
12
0 200 400 600 800 1000 1200 1400 1600
Comparison of Model and Lab Data
Current - Dep 8 (A)I
Cu
rren
t (A
)
Time (ms)
Laboratory Data Modeled Data
27
Figure 8
1010
1012
1014
1016
1018
1020
0 100 200 300 400 500 600
Ag 0Ag 1Ag 2H2O 0H2O 1H2O 2
(m-3
)
Time(msec)
28
Figure 9
1016
1017
1018
1019
1020
160 180 200 220 240
Ag1 210KAgO1 210KAg1 225KAgO1 225KAg1 240KAgO1 240K
Su
rfac
e D
ensi
ty (
m-3
)
Time(msec)
Tbuff
210K
t = 168 msec
Tbuff
225K
t = 198 msec
29
Figure 10
500
1000
1500
2000
2500
3000
3500
1010
1012
1014
1016
1018
1020
1022
0 100 200 300 400 500 600
160 180 200 220 240
T Filament - MarsT Filament -Lab
Ag1 Mars
AgO1 Mars
Ag1 Lab
AgO1 Lab
Tem
per
atu
re (
K)
Ag
and
Ag
O S
urface D
ensity (m
-2)
Time (Temperature) (msec)
Time (Ag and AgO) (msec)
Mars
Lab
30
Figure 11
0
02
04
06
08
1
12
0
5 10-8
1 10-7
15 10-7
2 10-7
25 10-7
3 10-7
35 10-7
4 10-7
0 100 200 300 400 500 600
Current - MarsCurrent - Lab
Mass Ag - MarsMass Ag - Lab
Cu
rren
t (
A)
Mass A
g B
ead (kg
)
Time(msec)
31
Figure 12
09
11
13
15
17
0 10 20 30 40 50 60Minutes
RR
o
500 ppb H2O2100 ppb H2O20 ppb H2O2Mars Gas

13
the Ag bead decreases to about 1 of itrsquos original value However in the laboratory tests
visual inspection of the Ag bead indicated that it was not fully exhausted before the end of
the laboratory experiments The abundance of Ag and H2O in elements 0-2 (figure 8) sug-
gests that Ag substantially depletes H2O only near the center of the bead In this simula-
tion it was assumed that the H2O is buffered at the vapor pressure of ice at 230K With
substantially more H2O the finite rate of Ag supply to the gas phase means the H2O abun-
dance is less affected Above some background H2O abundance oxidized Ag is deposited
in every element in excess of metallic Ag
The sensitivity of the system to H2O is shown in Figure 9 The model supports the
hypothesis that the onset of high conductivity between the Au electrodes is a function of
the H2O abundance in the ambient gas but only to a limit Because the flux of Ag atoms
to the tube gas phase is limited by the Joule heating available there is an upper limit to the
effective range of H2O sensitivity In the present case when H2O abundances are buffered
at 250K unoxidized Ag never deposits in excess of silver oxide However for Mars con-
ditions unoxidized silver will deposit and the time delay for the deposition increases with
H2O abundance
The potential behavior of the system for predicted Mars-like conditions is shown in
Figure 10 The differences between the laboratory and Mars simulations are 1) lower ini-
tial T (210 K) 2) Somewhat lower pressure (7 mbar) 3) An ambient H2O abundance
buffered at the vapor pressure of water at 210 K In this Mars simulation with a 650 msec
pulse all of the Ag is vaporized allowing the W filament to continue heating The mod-
eled filament temperature prior to the end of the pulse was 3400K Given the results of
our model to prevent melting of the filament on Mars the current pulse would be sequen-
14
tially increased from a value less than 650 msec until unoxidized silver deposits The signa-
ture of complete Ag vaporization is a significant drop in the current prior to cutoff a con-
sequence of the increased resistivity of W at temperatures above 1800K As a
consequence mostly of the lower starting temperature metallic Ag exceeds AgO deposi-
tion somewhat later than in the laboratory case However since the Ag bead has less sen-
sible heat loss to the atmosphere (7 mbar assumed for Mars ndash 10 mbar in the laboratory)
more heat is lost through Ag vaporization
34 Gas Sensing Properties
The sensitivity of freshly deposited films to hydrogen peroxide vapor in carbon diox-
ide is shown in figure 10 The detection limit of the Polytron unit is 100 ppb and the un-
certainty in the measurements is plusmn50 ppb This limitation prevents sensor testing at levels
below 100 ppb Although 100 ppb is significantly higher than the hydrogen peroxide con-
centrations expected in the martian atmosphere the sensor response for this peroxide level
indicates that sensor detection limits should be several orders of magnitude lower Addi-
tionally since the oxidation of the silver film is dosimetric extremely low rates of oxida-
tion can be measured by continual monitoring during long-duration atmospheric
exposures Figure 10 also shows the response of a freshly deposited film to pure CO2 In
the absence of oxidizing gases the resistance of freshly deposited films slowly decreased
over a period of several hours as the film annealed The response of a freshly deposited
film to a simulated peroxide-free martian atmosphere (013 O2 27 N2 balance CO2)
shows a low sensitivity of the film to O2 relative to H2O2
15
5 Conclusions
The use of in-situ deposition techniques can provide an inexpensive and practical means of
overcoming thin-film chemical sensor limitations due to pre-deployment contamination
and aging We have demonstrated the use of this technique using a silver sensing layer
thermally deposited in-situ under Mars-like conditions These films have a high sensitivity
to H2O2 vapor and a comparatively low sensitivity to O2 which is present at a level of ap-
proximately 013 in the martian atmosphere The high sensitivity of the sensor to perox-
ide along with the dosimetric nature of the thin-film oxidation will enable low rates of
atmospheric oxidation to be monitored on the surface of Mars Simultaneous determina-
tion of H2O and O2 levels by the MS will allow the contributions of these gases to the sen-
sor response to be removed during data analysis By removing from the data the
contribution of O2 and H2O to the sensor response oxidation rates due to the presence of
H2O2 and other photochemically produced atmospheric oxidants can be determined The
ability to deposit sensing films in-situ allows the surface of the sensing film to be refreshed
with unoxidized silver By re-depositing fresh film surfaces at different times of the day
diurnal variations in atmospheric oxidation rates can be determined The diffusion-tube
sensor configuration described in this paper has a number of potential terrestrial applica-
tions including long-term monitoring of oxidative contaminants process gases and envi-
ronmental chambers The measurement capabilities of the in-situ deposition technique can
be expanded by though the use of metals with different electrochemical potentials and with
arrays tailored to the chemical environment of interest
16
Acknowledgements
Work performed at NASA Ames (RC Quinn AP Zent) was funded by the NASA Ames
Directorrsquos Discretionary Fund Beagle 2 activities (MC Towner JC Garry TR Rin-
grose) were funded in part by the UK Particle Physics and Astronomy Research Council
The authors would like to thank Cindy Taylor of the SETI Institute for her assistance in
preparing the sensor sources The author (RQ) would like to thank Pascale Ehrenfreund
and Hans Fraaije of the Leiden Institute of Chemistry Christopher Chyba of the SETI In-
stitute Oliver Botta of the International Space Science Institute and Chris McKay of
NASA Ames Research Center for their manuscript reviews
17
References [1] TY Kong MB McElroy Photochemistry of the martian atmosphere Icarus 32
(1977) 168-189 [2] D M Hunten Possible oxidant sources in the atmosphere and surface of Mars J Mol
Evol 14 (1979) 57-64 [3] HP Klein The Viking biological experiments on Mars Icarus 34 (1978) 666-674 [4] MC Towner MR Patel TJ Ringrose JC Zarnecki D Pullen MR Sims S Haa-
panala A-M Harri J Polko CF Wilson AP Zent RC Quinn FJ Grunthaner MH Hecht and JRC Garry The Beagle 2 environmental sensors science goals and instrument description Planetary and Space Sci 52 (2004) 1141-1156
[5] FJ Grunthaner A Ricco M A Butler A L Lane C P McKay A P Zent R C
Quinn B Murray H P Klein G V Levin R W Terhune M L Homer A Ksend-zov and P Niedermann Investigating the surface chemistry of Mars Analytical Chemistry 67 (1995) 605A-610A
[6] CP McKay F J Grunthaner A L Lane M Herring R K Bartmann A J Ricco
M A Butler B C Murray R C Quinn A P Zent H P Klein G V Levin The Mars oxidant experiment (MOx) for Mars 96 Planetary and Space Science 46 (1998) 769-777
[7] AP Zent R C Quinn and M Madou A thermo-acoustic gas sensor array for photo-
chemically critical species in the martian atmosphere Planetary and Space Science 46 (1998) 795-803
[8] AP Zent RC Quinn FJ Grunthaner MH Hecht MG Buehler CP McKay
Mars atmospheric oxidant sensor (MAOS) an in-situ heterogeneous chemistry analy-sis Planetary and Space Science 51 (2003) 167-175
18
Figure Captions 1 A Beagle 2 Environmental Sensors Oxidation Sensor The sensor was developed and
built for the European Space Agency (ESA) B2 Mars Lander and included on the pay-load as part of the landerrsquos Environmental Sensor Suite
2 Schematic of the oxidation sensor The open-ended sapphire tube is 1 cm long with a 5
mm inner diameter The Au electrodes are 4 millimeters in length with an electrode gap of 2 millimeters A 50 micron diameter titanium filament with a centered silver point source is mounted coaxially in the hollow tube
3 Titanium filament and silver source shown in the fixture used for annealing and silver
source preparation 4 Thermal deposition of a film using 50 microm diameter titanium filament with a silver
source in 10 mbar of CO2 Visible film deposition occurred with a 500 msec pulse A film with a measurable resistance deposited after the second 550 msec pulse
5 Secondary film deposition using a ~350 msec pulse For short current pulses (less than
550 msec) oxide formation occurs as the evaporated silver reacts with oxidizing gases in the electrode region
6 Secondary film deposition using a ~600 msec pulse When a pulse 550 msec or greater
was used deposition of unoxidized silver occurred after an initial period of oxide depo-sition (resistance increase) as the oxidizing gases in the region of the source were con-sumed
7 Comparison of the laboratory test data and the modeled sensor behavior The model
correctly predicts the current flow through the circuit Since heating = I2R the heating rate must likewise be accurate
8 The modeled number density (m-3) of metallic Ag (solid lines) and H2O (dashed lines) in
finite elements from 0 (center of tube including Ag bead ndash circles) through 2 ndash (dia-monds) Although the end of the tube is element 5 we plot only to element 2 because elements 0 and 1 bridge the ends of the Au electrodes Metallic Ag exceeds H2O only near the source
9 The modeled accumulation of metallic Ag and oxidized AgO at the Au electrode margin
as a function of the ambient H2O abundance The times indicate the interval when Ag first accumulates in excess of AgO Conductivity changes will occur somewhat later For H2O abundances buffered at 240K Ag is never deposited in excess of AgO at the Au electrode
10 A comparison of the model using the laboratory test conditions with the model using
predicted Mars conditions Both cases we have adjusted the ambient H2O pressure to
19
071Pa the pressure in equilibrium with ice at 210 K In all cases the solid lines repre-sent Mars simulations the dotted lines represent the laboratory simulations The filled circles represent the number density of metallic Ag (m-2) deposited on the walls of the tube in finite element i=1 which corresponds to the inboard edge of the Au electrode The open circles represent the number density of AgO Number densities are labeled on the right hand ordinate and the upper abscissa The arrows labeled ldquoLabrdquo and ldquoMarsrdquo indicate the time at which metallic Ag begins to be deposited in excess of AgO in ele-ment i=1 On the left hand ordinate and the lower abscissa the thermal history of the metal filament is plotted for the laboratory and Mars experiments
11 The predicted current for operations on Mars (solid) in the laboratory (dotted) The
drop in I near the end of the current pulse is due to increased resistivity of the W fila-ment after Ag is exhausted The mass of the Ag bead is shown for comparison in the two simulations
12 The sensitivity of freshly deposited films to hydrogen peroxide vapor in carbon dioxide
and response of a freshly deposited film to a simulated peroxide free martian atmos-phere (013 O2 27 N2 balance CO2)
20
Figure 1
21
Figure 2
22
Figure 3
23
Figure 4
00
02
04
06
08
10
12
0 20 40 60 80 100 120 140 160Seconds
Cu
rren
t (A
)
0E+00
2E+07
4E+07
6E+07
8E+07
1E+08
Res
ista
nce
(O
hm
s)
AmpsOhms
242 Volts
450msec 500
msec
550msec
550msec
24
Figure 5
00
02
04
06
08
10
12
0 1000 2000 3000 4000 5000 6000milliseconds
Cu
rren
t (A
)
10E+04
12E+04
14E+04
16E+04
18E+04
20E+04
Res
ista
nce
(O
hm
s)
AmpsOhms
253 Volts
25
Figure 6
00
02
04
06
08
10
12
0 500 1000 1500 2000 2500milliseconds
Cu
rren
t (A
)
1E+03
1E+05
2E+05
3E+05
4E+05
Res
ista
nce
(O
hm
s)
AmpsOhms
254 Volts
26
Figure 7
0
02
04
06
08
1
12
0 200 400 600 800 1000 1200 1400 1600
Comparison of Model and Lab Data
Current - Dep 8 (A)I
Cu
rren
t (A
)
Time (ms)
Laboratory Data Modeled Data
27
Figure 8
1010
1012
1014
1016
1018
1020
0 100 200 300 400 500 600
Ag 0Ag 1Ag 2H2O 0H2O 1H2O 2
(m-3
)
Time(msec)
28
Figure 9
1016
1017
1018
1019
1020
160 180 200 220 240
Ag1 210KAgO1 210KAg1 225KAgO1 225KAg1 240KAgO1 240K
Su
rfac
e D
ensi
ty (
m-3
)
Time(msec)
Tbuff
210K
t = 168 msec
Tbuff
225K
t = 198 msec
29
Figure 10
500
1000
1500
2000
2500
3000
3500
1010
1012
1014
1016
1018
1020
1022
0 100 200 300 400 500 600
160 180 200 220 240
T Filament - MarsT Filament -Lab
Ag1 Mars
AgO1 Mars
Ag1 Lab
AgO1 Lab
Tem
per
atu
re (
K)
Ag
and
Ag
O S
urface D
ensity (m
-2)
Time (Temperature) (msec)
Time (Ag and AgO) (msec)
Mars
Lab
30
Figure 11
0
02
04
06
08
1
12
0
5 10-8
1 10-7
15 10-7
2 10-7
25 10-7
3 10-7
35 10-7
4 10-7
0 100 200 300 400 500 600
Current - MarsCurrent - Lab
Mass Ag - MarsMass Ag - Lab
Cu
rren
t (
A)
Mass A
g B
ead (kg
)
Time(msec)
31
Figure 12
09
11
13
15
17
0 10 20 30 40 50 60Minutes
RR
o
500 ppb H2O2100 ppb H2O20 ppb H2O2Mars Gas
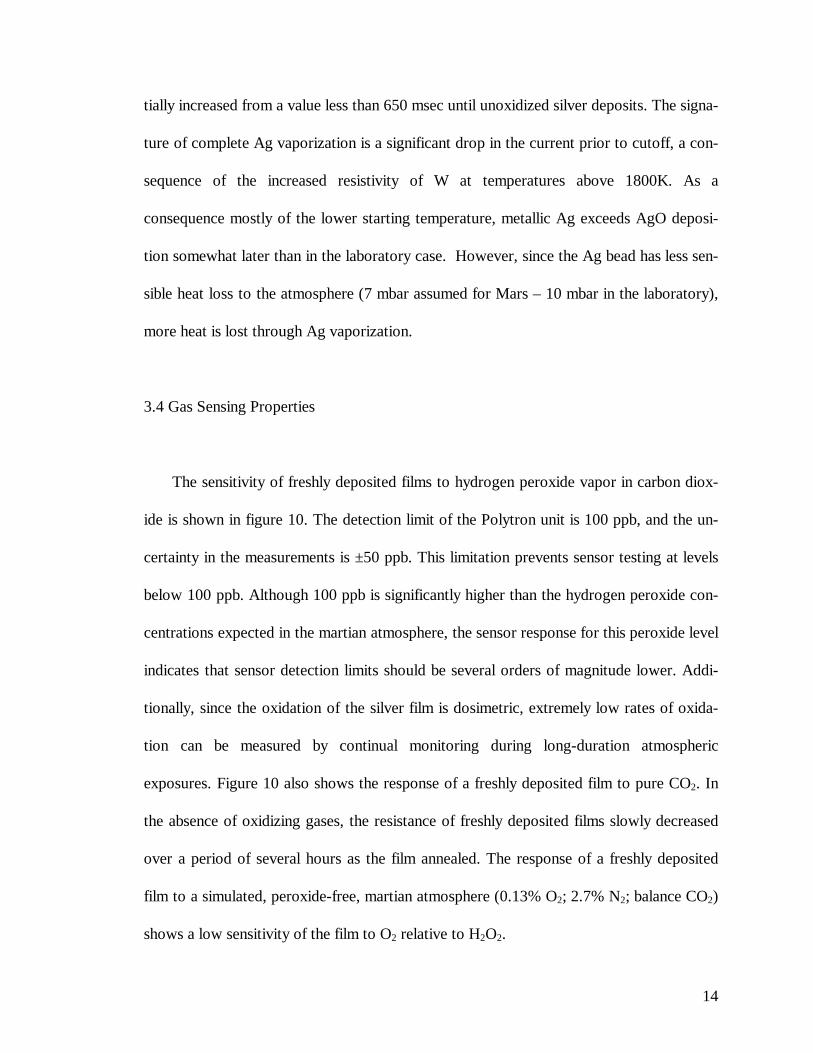
15
5 Conclusions
The use of in-situ deposition techniques can provide an inexpensive and practical means of
overcoming thin-film chemical sensor limitations due to pre-deployment contamination
and aging We have demonstrated the use of this technique using a silver sensing layer
thermally deposited in-situ under Mars-like conditions These films have a high sensitivity
to H2O2 vapor and a comparatively low sensitivity to O2 which is present at a level of ap-
proximately 013 in the martian atmosphere The high sensitivity of the sensor to perox-
ide along with the dosimetric nature of the thin-film oxidation will enable low rates of
atmospheric oxidation to be monitored on the surface of Mars Simultaneous determina-
tion of H2O and O2 levels by the MS will allow the contributions of these gases to the sen-
sor response to be removed during data analysis By removing from the data the
contribution of O2 and H2O to the sensor response oxidation rates due to the presence of
H2O2 and other photochemically produced atmospheric oxidants can be determined The
ability to deposit sensing films in-situ allows the surface of the sensing film to be refreshed
with unoxidized silver By re-depositing fresh film surfaces at different times of the day
diurnal variations in atmospheric oxidation rates can be determined The diffusion-tube
sensor configuration described in this paper has a number of potential terrestrial applica-
tions including long-term monitoring of oxidative contaminants process gases and envi-
ronmental chambers The measurement capabilities of the in-situ deposition technique can
be expanded by though the use of metals with different electrochemical potentials and with
arrays tailored to the chemical environment of interest
16
Acknowledgements
Work performed at NASA Ames (RC Quinn AP Zent) was funded by the NASA Ames
Directorrsquos Discretionary Fund Beagle 2 activities (MC Towner JC Garry TR Rin-
grose) were funded in part by the UK Particle Physics and Astronomy Research Council
The authors would like to thank Cindy Taylor of the SETI Institute for her assistance in
preparing the sensor sources The author (RQ) would like to thank Pascale Ehrenfreund
and Hans Fraaije of the Leiden Institute of Chemistry Christopher Chyba of the SETI In-
stitute Oliver Botta of the International Space Science Institute and Chris McKay of
NASA Ames Research Center for their manuscript reviews
17
References [1] TY Kong MB McElroy Photochemistry of the martian atmosphere Icarus 32
(1977) 168-189 [2] D M Hunten Possible oxidant sources in the atmosphere and surface of Mars J Mol
Evol 14 (1979) 57-64 [3] HP Klein The Viking biological experiments on Mars Icarus 34 (1978) 666-674 [4] MC Towner MR Patel TJ Ringrose JC Zarnecki D Pullen MR Sims S Haa-
panala A-M Harri J Polko CF Wilson AP Zent RC Quinn FJ Grunthaner MH Hecht and JRC Garry The Beagle 2 environmental sensors science goals and instrument description Planetary and Space Sci 52 (2004) 1141-1156
[5] FJ Grunthaner A Ricco M A Butler A L Lane C P McKay A P Zent R C
Quinn B Murray H P Klein G V Levin R W Terhune M L Homer A Ksend-zov and P Niedermann Investigating the surface chemistry of Mars Analytical Chemistry 67 (1995) 605A-610A
[6] CP McKay F J Grunthaner A L Lane M Herring R K Bartmann A J Ricco
M A Butler B C Murray R C Quinn A P Zent H P Klein G V Levin The Mars oxidant experiment (MOx) for Mars 96 Planetary and Space Science 46 (1998) 769-777
[7] AP Zent R C Quinn and M Madou A thermo-acoustic gas sensor array for photo-
chemically critical species in the martian atmosphere Planetary and Space Science 46 (1998) 795-803
[8] AP Zent RC Quinn FJ Grunthaner MH Hecht MG Buehler CP McKay
Mars atmospheric oxidant sensor (MAOS) an in-situ heterogeneous chemistry analy-sis Planetary and Space Science 51 (2003) 167-175
18
Figure Captions 1 A Beagle 2 Environmental Sensors Oxidation Sensor The sensor was developed and
built for the European Space Agency (ESA) B2 Mars Lander and included on the pay-load as part of the landerrsquos Environmental Sensor Suite
2 Schematic of the oxidation sensor The open-ended sapphire tube is 1 cm long with a 5
mm inner diameter The Au electrodes are 4 millimeters in length with an electrode gap of 2 millimeters A 50 micron diameter titanium filament with a centered silver point source is mounted coaxially in the hollow tube
3 Titanium filament and silver source shown in the fixture used for annealing and silver
source preparation 4 Thermal deposition of a film using 50 microm diameter titanium filament with a silver
source in 10 mbar of CO2 Visible film deposition occurred with a 500 msec pulse A film with a measurable resistance deposited after the second 550 msec pulse
5 Secondary film deposition using a ~350 msec pulse For short current pulses (less than
550 msec) oxide formation occurs as the evaporated silver reacts with oxidizing gases in the electrode region
6 Secondary film deposition using a ~600 msec pulse When a pulse 550 msec or greater
was used deposition of unoxidized silver occurred after an initial period of oxide depo-sition (resistance increase) as the oxidizing gases in the region of the source were con-sumed
7 Comparison of the laboratory test data and the modeled sensor behavior The model
correctly predicts the current flow through the circuit Since heating = I2R the heating rate must likewise be accurate
8 The modeled number density (m-3) of metallic Ag (solid lines) and H2O (dashed lines) in
finite elements from 0 (center of tube including Ag bead ndash circles) through 2 ndash (dia-monds) Although the end of the tube is element 5 we plot only to element 2 because elements 0 and 1 bridge the ends of the Au electrodes Metallic Ag exceeds H2O only near the source
9 The modeled accumulation of metallic Ag and oxidized AgO at the Au electrode margin
as a function of the ambient H2O abundance The times indicate the interval when Ag first accumulates in excess of AgO Conductivity changes will occur somewhat later For H2O abundances buffered at 240K Ag is never deposited in excess of AgO at the Au electrode
10 A comparison of the model using the laboratory test conditions with the model using
predicted Mars conditions Both cases we have adjusted the ambient H2O pressure to
19
071Pa the pressure in equilibrium with ice at 210 K In all cases the solid lines repre-sent Mars simulations the dotted lines represent the laboratory simulations The filled circles represent the number density of metallic Ag (m-2) deposited on the walls of the tube in finite element i=1 which corresponds to the inboard edge of the Au electrode The open circles represent the number density of AgO Number densities are labeled on the right hand ordinate and the upper abscissa The arrows labeled ldquoLabrdquo and ldquoMarsrdquo indicate the time at which metallic Ag begins to be deposited in excess of AgO in ele-ment i=1 On the left hand ordinate and the lower abscissa the thermal history of the metal filament is plotted for the laboratory and Mars experiments
11 The predicted current for operations on Mars (solid) in the laboratory (dotted) The
drop in I near the end of the current pulse is due to increased resistivity of the W fila-ment after Ag is exhausted The mass of the Ag bead is shown for comparison in the two simulations
12 The sensitivity of freshly deposited films to hydrogen peroxide vapor in carbon dioxide
and response of a freshly deposited film to a simulated peroxide free martian atmos-phere (013 O2 27 N2 balance CO2)
20
Figure 1
21
Figure 2
22
Figure 3
23
Figure 4
00
02
04
06
08
10
12
0 20 40 60 80 100 120 140 160Seconds
Cu
rren
t (A
)
0E+00
2E+07
4E+07
6E+07
8E+07
1E+08
Res
ista
nce
(O
hm
s)
AmpsOhms
242 Volts
450msec 500
msec
550msec
550msec
24
Figure 5
00
02
04
06
08
10
12
0 1000 2000 3000 4000 5000 6000milliseconds
Cu
rren
t (A
)
10E+04
12E+04
14E+04
16E+04
18E+04
20E+04
Res
ista
nce
(O
hm
s)
AmpsOhms
253 Volts
25
Figure 6
00
02
04
06
08
10
12
0 500 1000 1500 2000 2500milliseconds
Cu
rren
t (A
)
1E+03
1E+05
2E+05
3E+05
4E+05
Res
ista
nce
(O
hm
s)
AmpsOhms
254 Volts
26
Figure 7
0
02
04
06
08
1
12
0 200 400 600 800 1000 1200 1400 1600
Comparison of Model and Lab Data
Current - Dep 8 (A)I
Cu
rren
t (A
)
Time (ms)
Laboratory Data Modeled Data
27
Figure 8
1010
1012
1014
1016
1018
1020
0 100 200 300 400 500 600
Ag 0Ag 1Ag 2H2O 0H2O 1H2O 2
(m-3
)
Time(msec)
28
Figure 9
1016
1017
1018
1019
1020
160 180 200 220 240
Ag1 210KAgO1 210KAg1 225KAgO1 225KAg1 240KAgO1 240K
Su
rfac
e D
ensi
ty (
m-3
)
Time(msec)
Tbuff
210K
t = 168 msec
Tbuff
225K
t = 198 msec
29
Figure 10
500
1000
1500
2000
2500
3000
3500
1010
1012
1014
1016
1018
1020
1022
0 100 200 300 400 500 600
160 180 200 220 240
T Filament - MarsT Filament -Lab
Ag1 Mars
AgO1 Mars
Ag1 Lab
AgO1 Lab
Tem
per
atu
re (
K)
Ag
and
Ag
O S
urface D
ensity (m
-2)
Time (Temperature) (msec)
Time (Ag and AgO) (msec)
Mars
Lab
30
Figure 11
0
02
04
06
08
1
12
0
5 10-8
1 10-7
15 10-7
2 10-7
25 10-7
3 10-7
35 10-7
4 10-7
0 100 200 300 400 500 600
Current - MarsCurrent - Lab
Mass Ag - MarsMass Ag - Lab
Cu
rren
t (
A)
Mass A
g B
ead (kg
)
Time(msec)
31
Figure 12
09
11
13
15
17
0 10 20 30 40 50 60Minutes
RR
o
500 ppb H2O2100 ppb H2O20 ppb H2O2Mars Gas

17
References [1] TY Kong MB McElroy Photochemistry of the martian atmosphere Icarus 32
(1977) 168-189 [2] D M Hunten Possible oxidant sources in the atmosphere and surface of Mars J Mol
Evol 14 (1979) 57-64 [3] HP Klein The Viking biological experiments on Mars Icarus 34 (1978) 666-674 [4] MC Towner MR Patel TJ Ringrose JC Zarnecki D Pullen MR Sims S Haa-
panala A-M Harri J Polko CF Wilson AP Zent RC Quinn FJ Grunthaner MH Hecht and JRC Garry The Beagle 2 environmental sensors science goals and instrument description Planetary and Space Sci 52 (2004) 1141-1156
[5] FJ Grunthaner A Ricco M A Butler A L Lane C P McKay A P Zent R C
Quinn B Murray H P Klein G V Levin R W Terhune M L Homer A Ksend-zov and P Niedermann Investigating the surface chemistry of Mars Analytical Chemistry 67 (1995) 605A-610A
[6] CP McKay F J Grunthaner A L Lane M Herring R K Bartmann A J Ricco
M A Butler B C Murray R C Quinn A P Zent H P Klein G V Levin The Mars oxidant experiment (MOx) for Mars 96 Planetary and Space Science 46 (1998) 769-777
[7] AP Zent R C Quinn and M Madou A thermo-acoustic gas sensor array for photo-
chemically critical species in the martian atmosphere Planetary and Space Science 46 (1998) 795-803
[8] AP Zent RC Quinn FJ Grunthaner MH Hecht MG Buehler CP McKay
Mars atmospheric oxidant sensor (MAOS) an in-situ heterogeneous chemistry analy-sis Planetary and Space Science 51 (2003) 167-175
18
Figure Captions 1 A Beagle 2 Environmental Sensors Oxidation Sensor The sensor was developed and
built for the European Space Agency (ESA) B2 Mars Lander and included on the pay-load as part of the landerrsquos Environmental Sensor Suite
2 Schematic of the oxidation sensor The open-ended sapphire tube is 1 cm long with a 5
mm inner diameter The Au electrodes are 4 millimeters in length with an electrode gap of 2 millimeters A 50 micron diameter titanium filament with a centered silver point source is mounted coaxially in the hollow tube
3 Titanium filament and silver source shown in the fixture used for annealing and silver
source preparation 4 Thermal deposition of a film using 50 microm diameter titanium filament with a silver
source in 10 mbar of CO2 Visible film deposition occurred with a 500 msec pulse A film with a measurable resistance deposited after the second 550 msec pulse
5 Secondary film deposition using a ~350 msec pulse For short current pulses (less than
550 msec) oxide formation occurs as the evaporated silver reacts with oxidizing gases in the electrode region
6 Secondary film deposition using a ~600 msec pulse When a pulse 550 msec or greater
was used deposition of unoxidized silver occurred after an initial period of oxide depo-sition (resistance increase) as the oxidizing gases in the region of the source were con-sumed
7 Comparison of the laboratory test data and the modeled sensor behavior The model
correctly predicts the current flow through the circuit Since heating = I2R the heating rate must likewise be accurate
8 The modeled number density (m-3) of metallic Ag (solid lines) and H2O (dashed lines) in
finite elements from 0 (center of tube including Ag bead ndash circles) through 2 ndash (dia-monds) Although the end of the tube is element 5 we plot only to element 2 because elements 0 and 1 bridge the ends of the Au electrodes Metallic Ag exceeds H2O only near the source
9 The modeled accumulation of metallic Ag and oxidized AgO at the Au electrode margin
as a function of the ambient H2O abundance The times indicate the interval when Ag first accumulates in excess of AgO Conductivity changes will occur somewhat later For H2O abundances buffered at 240K Ag is never deposited in excess of AgO at the Au electrode
10 A comparison of the model using the laboratory test conditions with the model using
predicted Mars conditions Both cases we have adjusted the ambient H2O pressure to
19
071Pa the pressure in equilibrium with ice at 210 K In all cases the solid lines repre-sent Mars simulations the dotted lines represent the laboratory simulations The filled circles represent the number density of metallic Ag (m-2) deposited on the walls of the tube in finite element i=1 which corresponds to the inboard edge of the Au electrode The open circles represent the number density of AgO Number densities are labeled on the right hand ordinate and the upper abscissa The arrows labeled ldquoLabrdquo and ldquoMarsrdquo indicate the time at which metallic Ag begins to be deposited in excess of AgO in ele-ment i=1 On the left hand ordinate and the lower abscissa the thermal history of the metal filament is plotted for the laboratory and Mars experiments
11 The predicted current for operations on Mars (solid) in the laboratory (dotted) The
drop in I near the end of the current pulse is due to increased resistivity of the W fila-ment after Ag is exhausted The mass of the Ag bead is shown for comparison in the two simulations
12 The sensitivity of freshly deposited films to hydrogen peroxide vapor in carbon dioxide
and response of a freshly deposited film to a simulated peroxide free martian atmos-phere (013 O2 27 N2 balance CO2)
20
Figure 1
21
Figure 2
22
Figure 3
23
Figure 4
00
02
04
06
08
10
12
0 20 40 60 80 100 120 140 160Seconds
Cu
rren
t (A
)
0E+00
2E+07
4E+07
6E+07
8E+07
1E+08
Res
ista
nce
(O
hm
s)
AmpsOhms
242 Volts
450msec 500
msec
550msec
550msec
24
Figure 5
00
02
04
06
08
10
12
0 1000 2000 3000 4000 5000 6000milliseconds
Cu
rren
t (A
)
10E+04
12E+04
14E+04
16E+04
18E+04
20E+04
Res
ista
nce
(O
hm
s)
AmpsOhms
253 Volts
25
Figure 6
00
02
04
06
08
10
12
0 500 1000 1500 2000 2500milliseconds
Cu
rren
t (A
)
1E+03
1E+05
2E+05
3E+05
4E+05
Res
ista
nce
(O
hm
s)
AmpsOhms
254 Volts
26
Figure 7
0
02
04
06
08
1
12
0 200 400 600 800 1000 1200 1400 1600
Comparison of Model and Lab Data
Current - Dep 8 (A)I
Cu
rren
t (A
)
Time (ms)
Laboratory Data Modeled Data
27
Figure 8
1010
1012
1014
1016
1018
1020
0 100 200 300 400 500 600
Ag 0Ag 1Ag 2H2O 0H2O 1H2O 2
(m-3
)
Time(msec)
28
Figure 9
1016
1017
1018
1019
1020
160 180 200 220 240
Ag1 210KAgO1 210KAg1 225KAgO1 225KAg1 240KAgO1 240K
Su
rfac
e D
ensi
ty (
m-3
)
Time(msec)
Tbuff
210K
t = 168 msec
Tbuff
225K
t = 198 msec
29
Figure 10
500
1000
1500
2000
2500
3000
3500
1010
1012
1014
1016
1018
1020
1022
0 100 200 300 400 500 600
160 180 200 220 240
T Filament - MarsT Filament -Lab
Ag1 Mars
AgO1 Mars
Ag1 Lab
AgO1 Lab
Tem
per
atu
re (
K)
Ag
and
Ag
O S
urface D
ensity (m
-2)
Time (Temperature) (msec)
Time (Ag and AgO) (msec)
Mars
Lab
30
Figure 11
0
02
04
06
08
1
12
0
5 10-8
1 10-7
15 10-7
2 10-7
25 10-7
3 10-7
35 10-7
4 10-7
0 100 200 300 400 500 600
Current - MarsCurrent - Lab
Mass Ag - MarsMass Ag - Lab
Cu
rren
t (
A)
Mass A
g B
ead (kg
)
Time(msec)
31
Figure 12
09
11
13
15
17
0 10 20 30 40 50 60Minutes
RR
o
500 ppb H2O2100 ppb H2O20 ppb H2O2Mars Gas
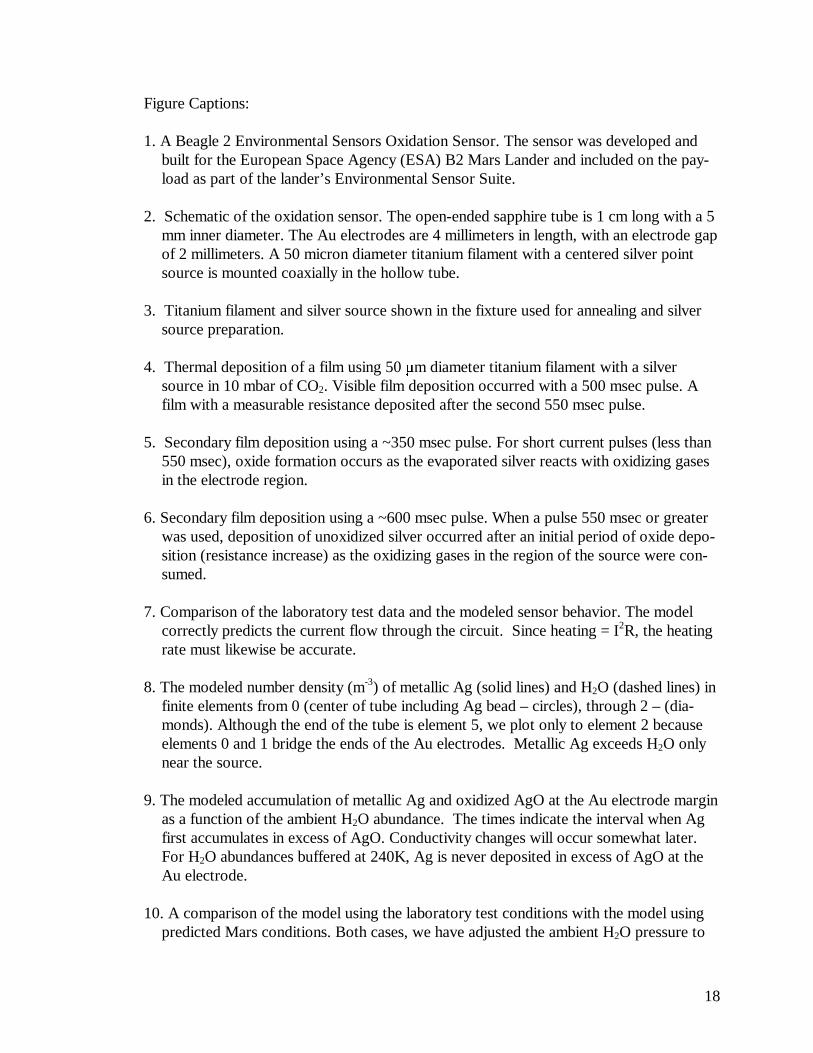
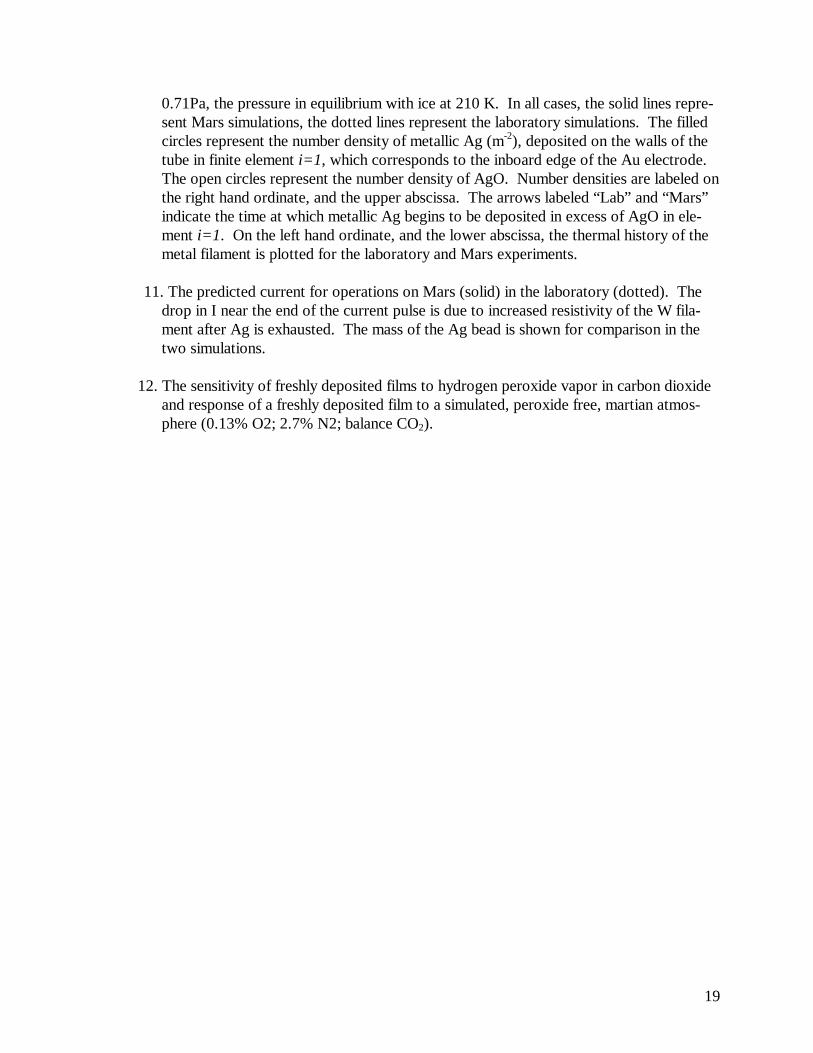
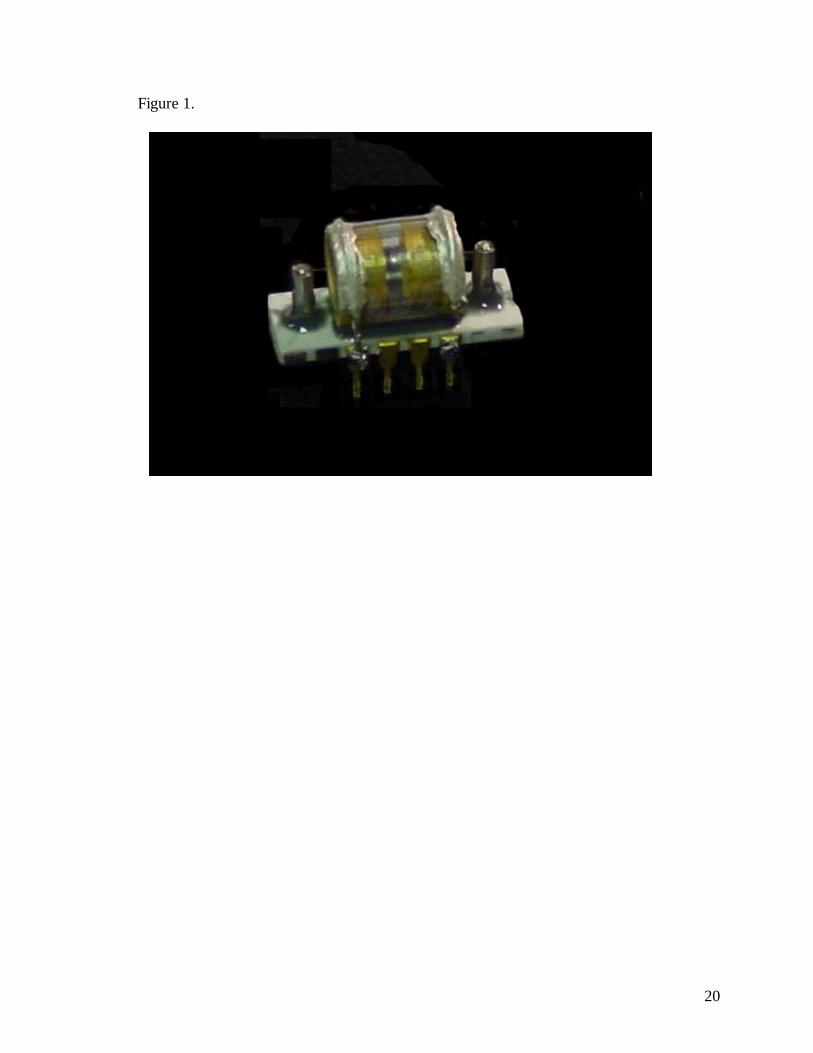
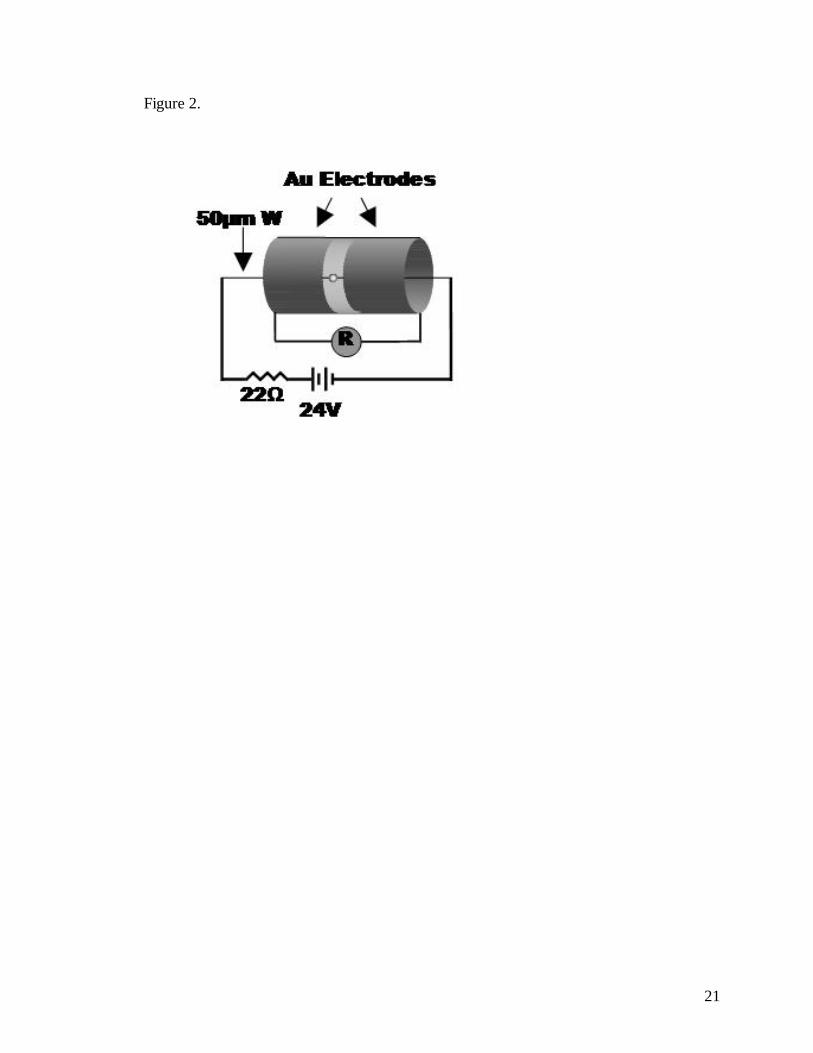
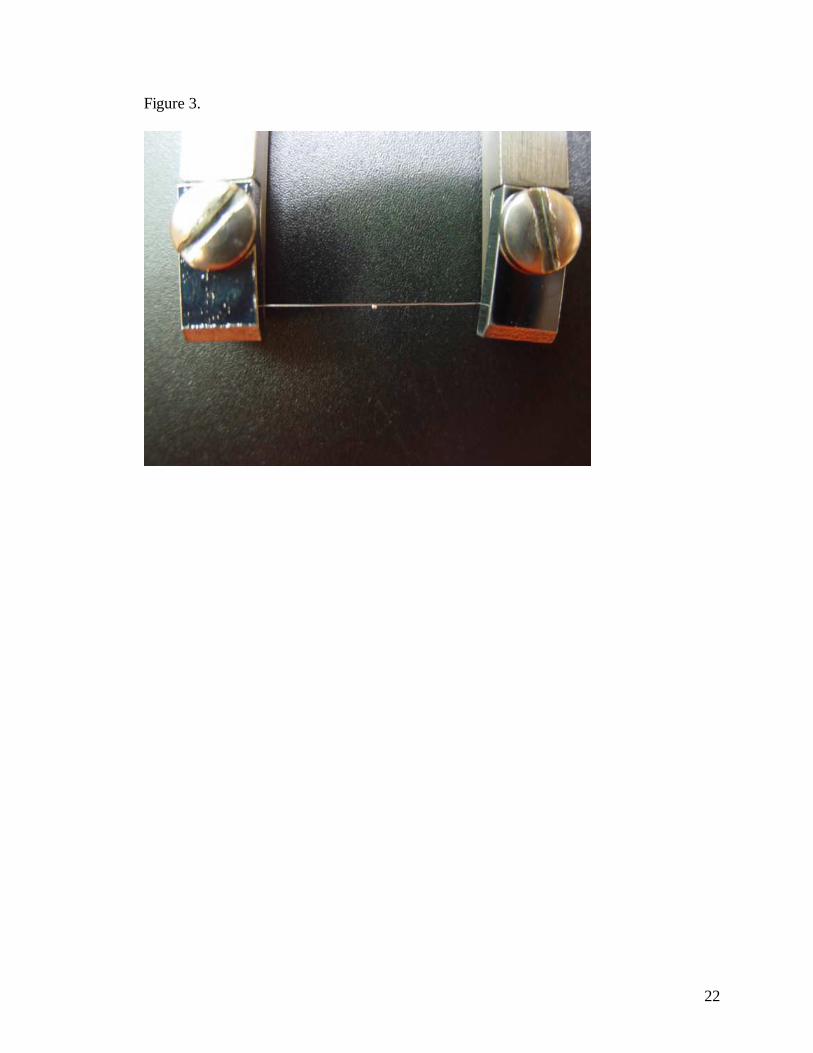
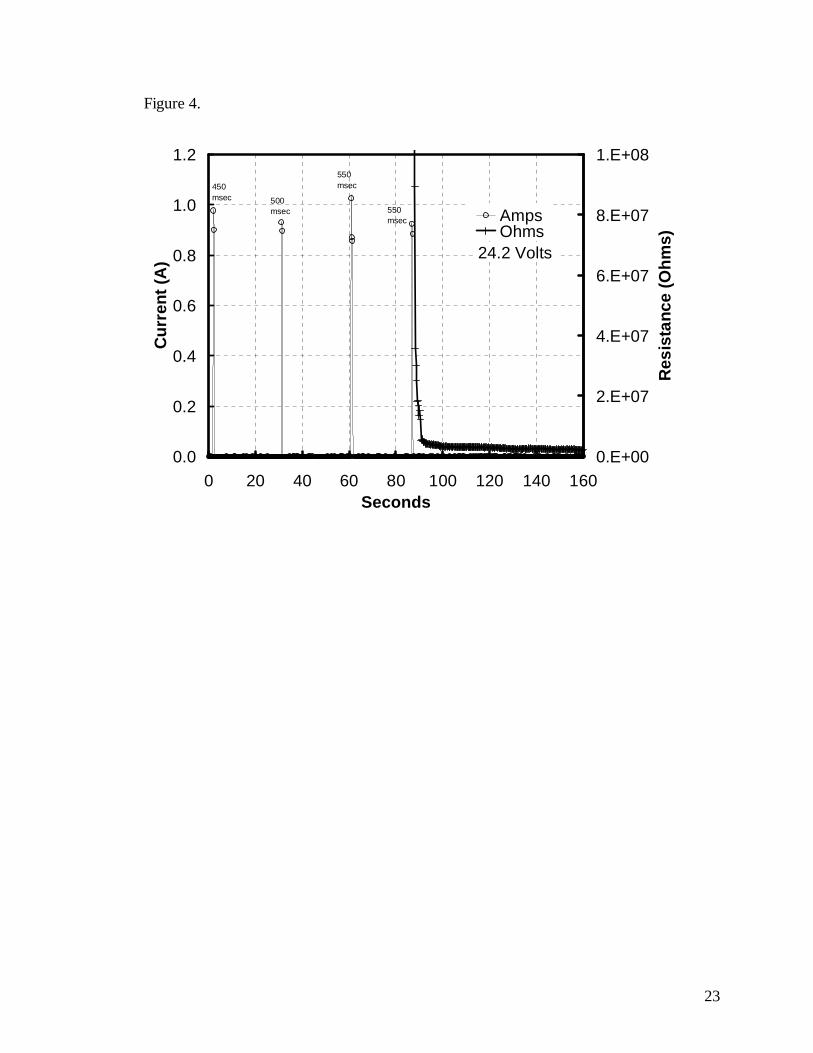
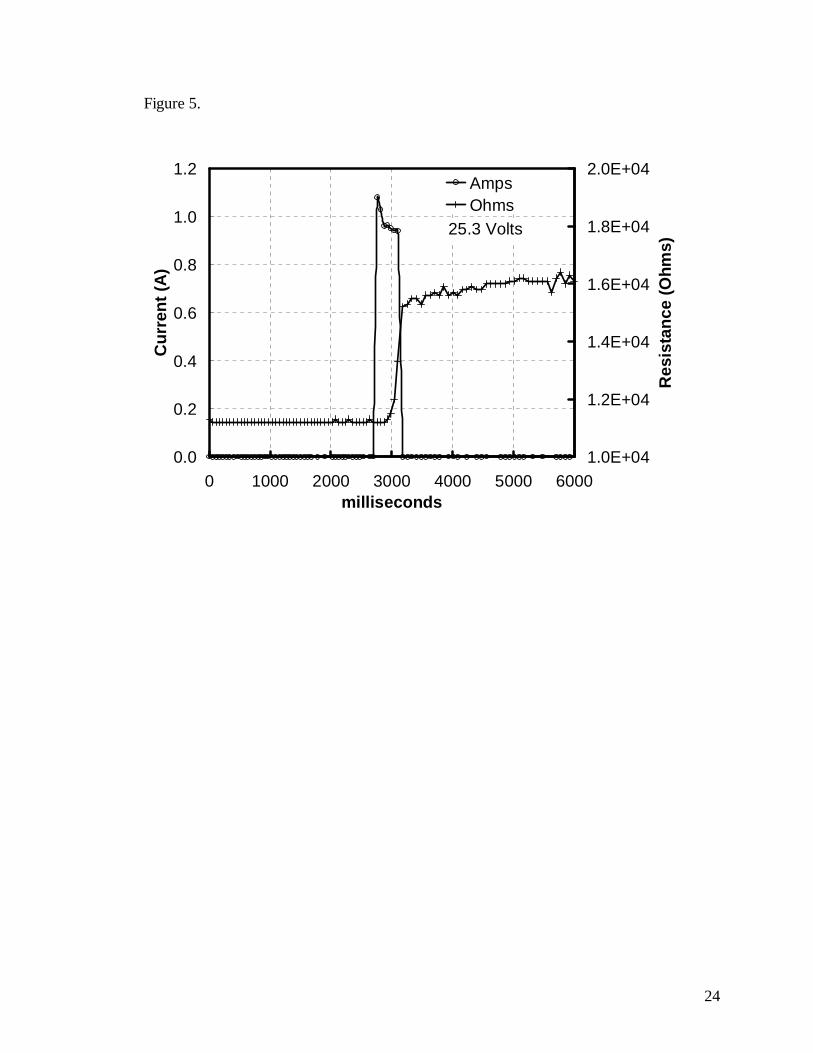
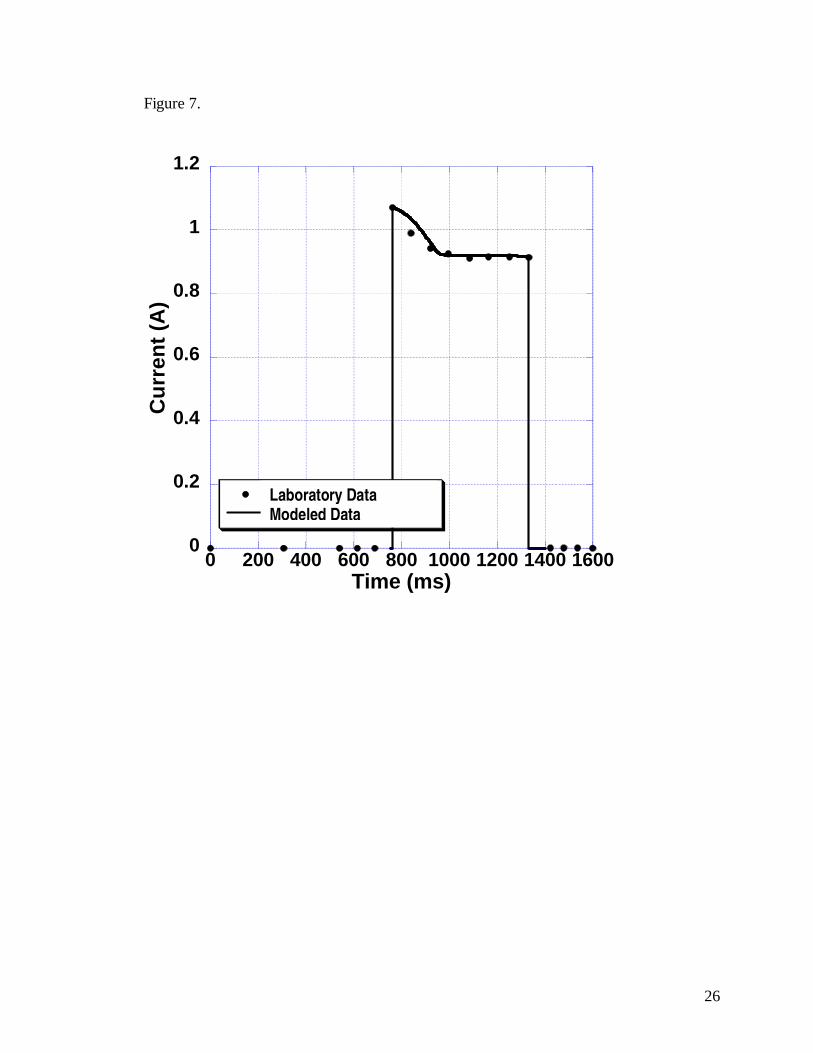
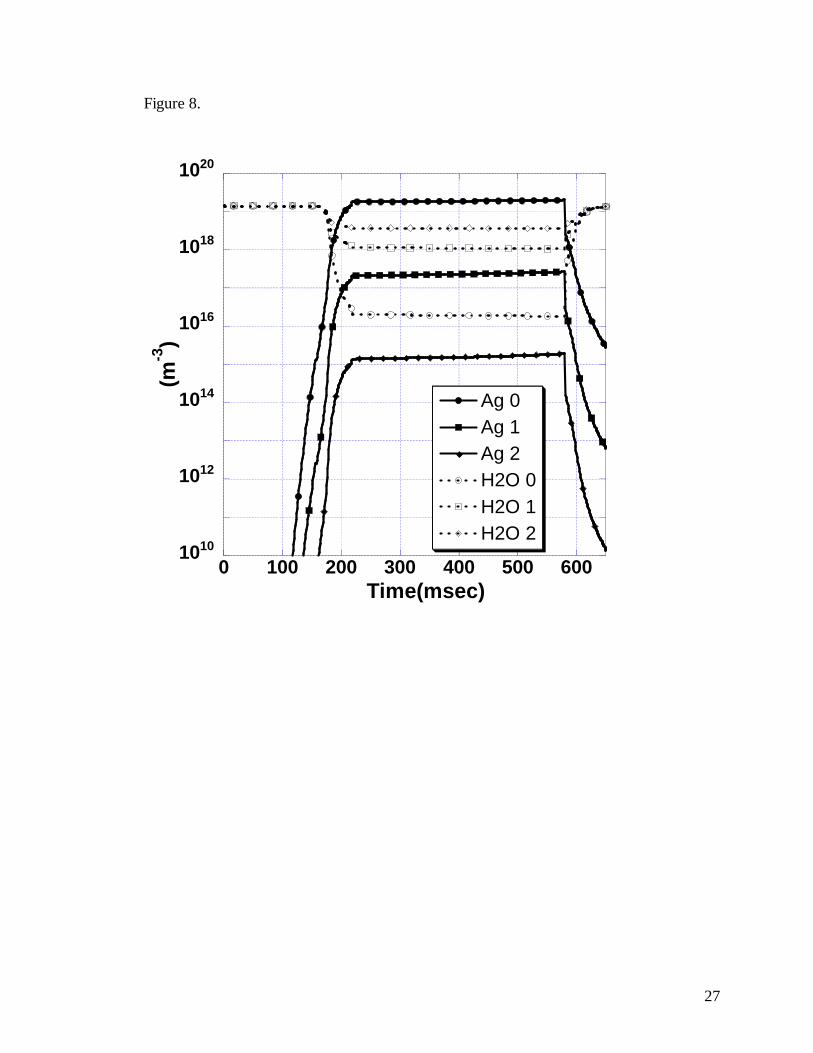
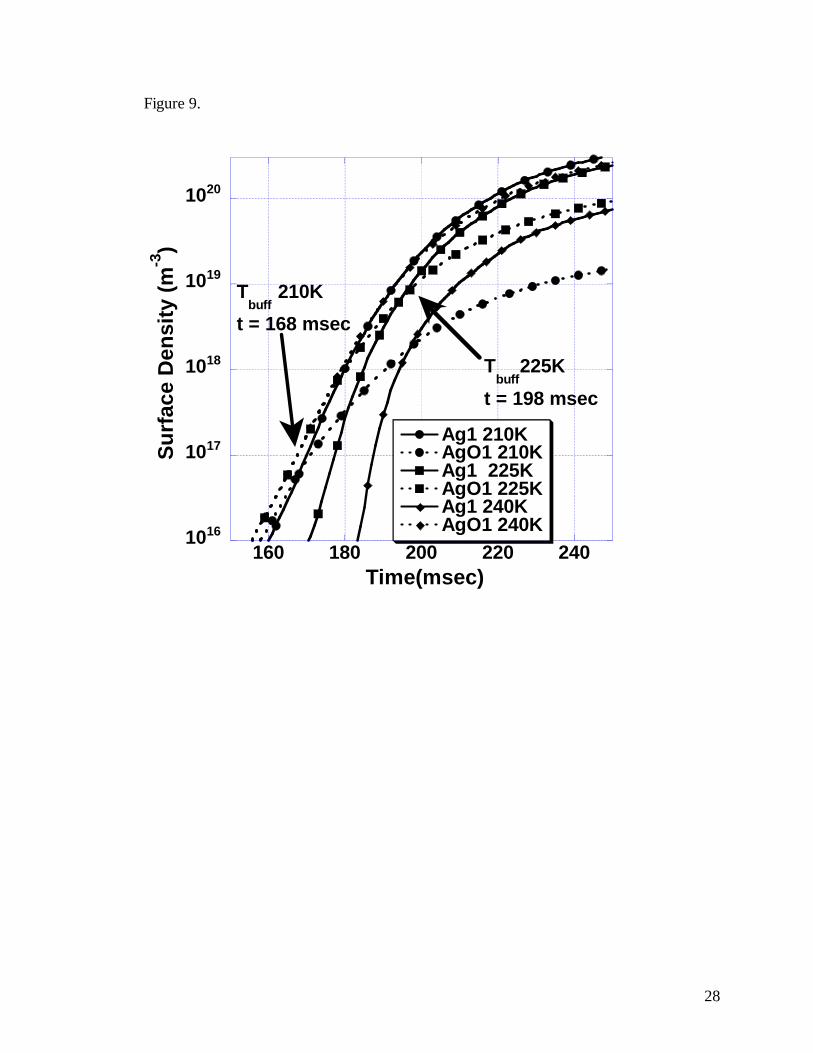
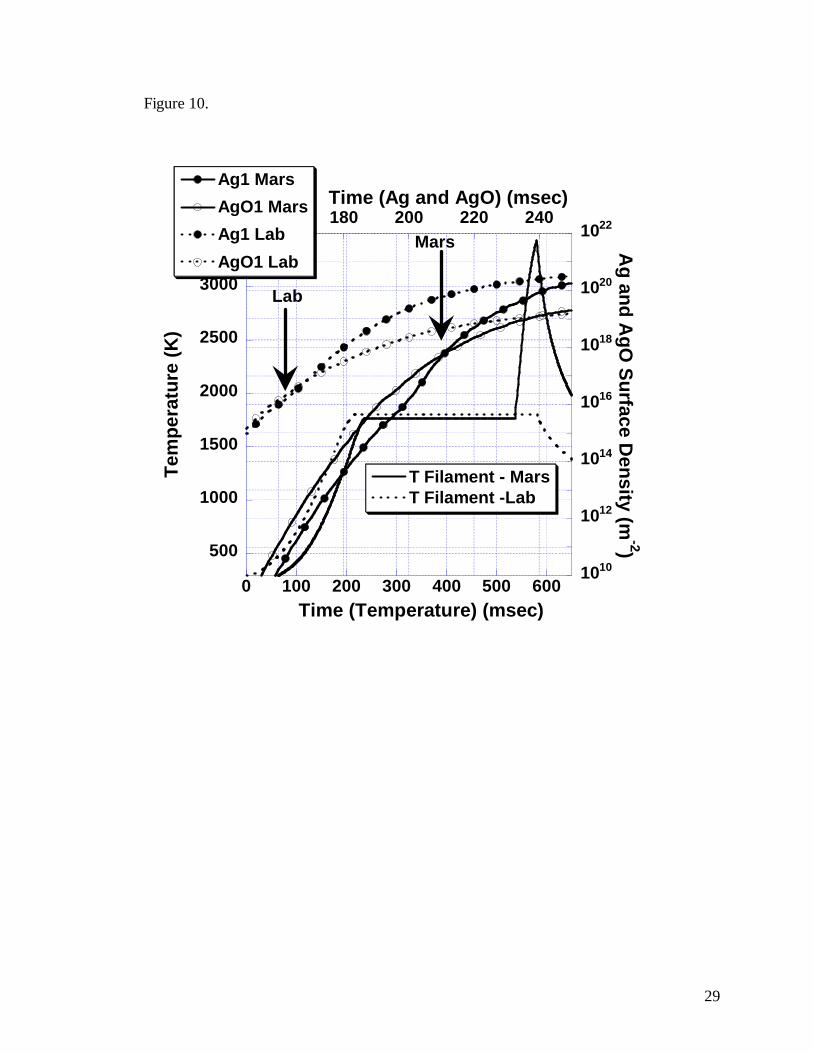
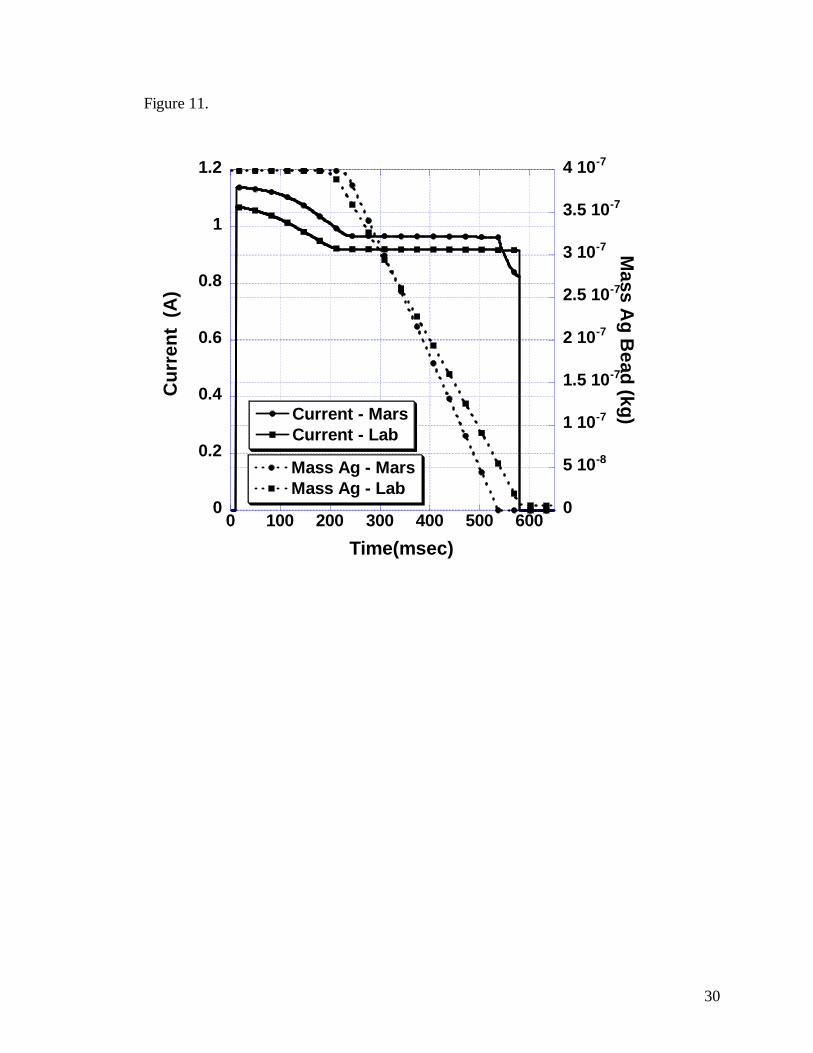
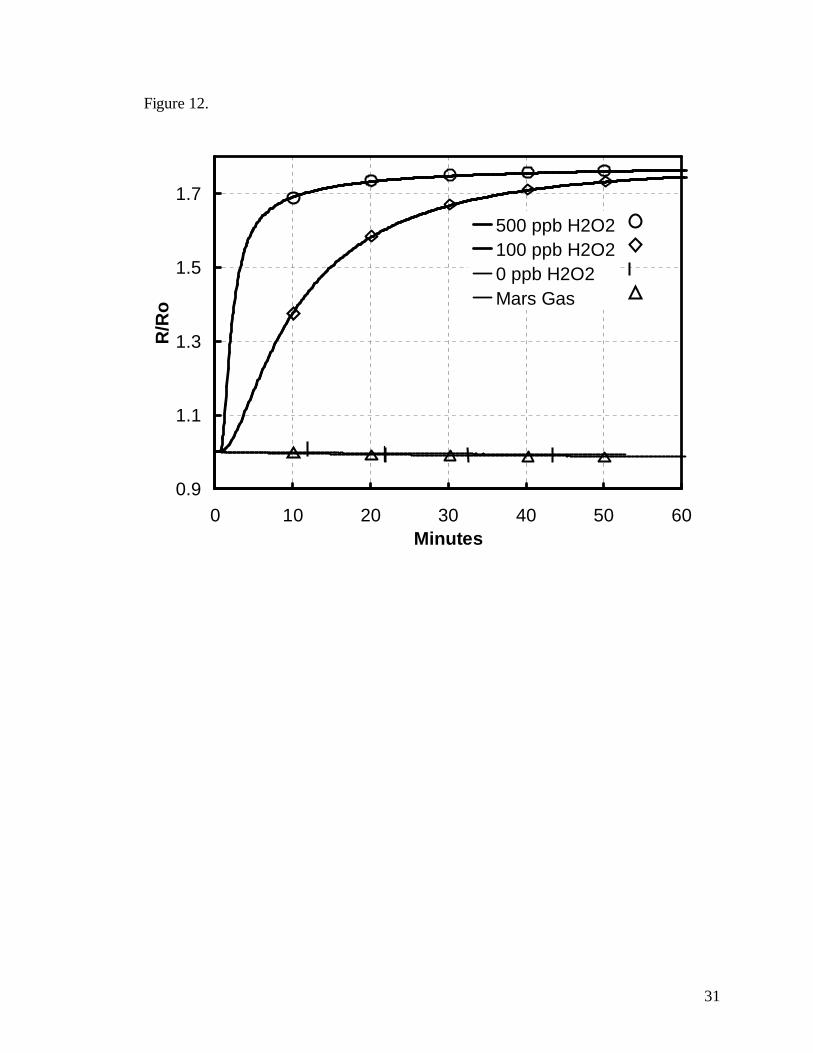
31
Figure 12
09
11
13
15
17
0 10 20 30 40 50 60Minutes
RR
o
500 ppb H2O2100 ppb H2O20 ppb H2O2Mars Gas