Impairments of Social Cognition and Decision Making in Alzheimers Disease
An assessment of the reference watershed approachfor TMDLs with biological impairments
Rachel C. Wagner & Theo A. Dillaha & Gene Yagow
Received: 5 February 2006 /Accepted: 26 October 2006 / Published online: 12 December 2006# Springer Science + Business Media B.V. 2006
Abstract The Reference Watershed Approach(RWA) is used in TMDL development for biologicaland other impairments with narrative water qualitycriteria. The questions addressed in this researchinclude: (1) With the RWA, how do land useclassifications from different data sources (DigitalOrtho-Quarter Quads (DOQQ) and National LandCover Dataset (NLCD)) impact simulated pollutantloadings? (2) With the RWA, what is the impact ofalternative water quality models (GWLF and SWAT)on pollutant loadings? (3) With the RWA, howsensitive are simulated pollutant loadings to the useof different reference watersheds? Various combina-tions of land use, water quality model, and referencewatershed resulted in pollutant reductions that rangedfrom −13 to 88%. In a comparison of the use ofNLCD versus DOQQ-based land use data with theGWLF model, differences in required reductionsranged from 13 to 74% for three different reference
watersheds. Use of alternative water quality modelswith DOQQ land use data resulted in differences inrequired sediment reductions from −43 to 8% for thethree reference watersheds. Differences in load reduc-tion requirements were also seen when differentreference watersheds were used, regardless of thewater quality model or the land use source used. WithDOQQ land use, required sediment reductions rangedfrom 18 to 88% and 37 to 82%, for the SWAT andGWLF models, respectively. These results suggestthat explicit margins of safety used to account formodeling uncertainties during TMDL developmentmay need to be substantially greater than 20% whenusing the reference watershed approach.
Keywords TMDL . water quality . benthicimpairment . modeling . ReferenceWatershedApproach . SWAT. GWLF
1 Introduction
The 1972 Clean Water Act (CWA) required states todevelop water quality standards, lists of impairedwaters that do not meet the developed water qualitystandards, and Total Maximum Daily Loads (TMDLs)for waters on the impaired waters lists (USEPA, U.S.Environmental Protection Agency, 2002a). Thesestandards, lists, and TMDLs must be approved by
Water Air Soil Pollut (2007) 181:341–354DOI 10.1007/s11270-006-9306-8
R. C. WagnerDepartment of Civil and Environmental Engineering,Pennsylvania State University,University Park, PA, USA
T. A. Dillaha (*) :G. YagowBiological Systems Engineering Department,Virginia Tech, 840 University City Blvd., Suite 5,Blacksburg, VA 24061-0378, USAe-mail: [email protected]
the USEPA. The water quality standards are com-posed of the designated uses of a water body, thewater quality criteria, and the allowable frequency ofexceedance that determines compliance with adesignated use. A TMDL is defined as the maximumload of a pollutant that a water body can receive andstill be in compliance with its water quality standard.For impaired waters, the difference between theexisting pollutant load and the TMDL load isassumed to be the required reduction in pollutantloading that will bring the water body into compli-ance with its water quality standard (USEPA, 2002a).The concept behind TMDLs is that the attainment ofwater quality goals is based on measurements ofwater in a stream or lake, rather than on measure-ments of effluent from point sources with technology-based controls.
Along with numeric water quality criteria forspecific parameters (i.e., 10 mg N/l nitrate), states,tribes, and territories may also have narrative orqualitative biological standards. In Virginia for exam-ple, there is a general biological standard for waterquality, which reads in part (9-VAC-25-260-20;Virginia General Assembly, 1998):
All state waters... shall be free from substances...which are inimical or harmful to human, animal,plant, or aquatic life.
In Virginia, the Department of EnvironmentalQuality (DEQ) monitors the benthic macroinverte-brate assemblage to determine if Virginia’s streamsmeet the general biological standard. Benthic macro-invertebrates are the invertebrate subset (mainly insectlarvae, crustaceans, and worms) of the communityliving on a stream bottom. The characteristics (e.g.,number, diversity, and pollution tolerance) of thiscommunity subset (or assemblage) change mea-surably when a stream is impaired by pollutants orenvironmental stressors. Therefore, when the benthicmacroinvertebrate assemblage in a water body isunhealthy, the general standard is not met. As ofMay 2004, a stream in Virginia was designated as“benthically impaired” when the benthic macroinver-tebrate assemblage at any given stream monitoringsite showed a significant difference from a compara-ble non-impaired regional reference site. A “benthi-cally impaired” stream fails to meet the requirementsof the Virginia General Standard and, therefore, thebiological requirements of the CWA.
1.1 Narrative impairment TMDLs
The process of developing a TMDL for narrativewater quality criteria is inherently different from theprocess of developing TMDLs for numeric waterquality criteria. For an impairment based on a specificnumeric water quality criterion, such as fecal coli-form, the pollutant for which the TMDL will bedeveloped is specified by the criterion. In biologicaland other narrative impairment cases, however, anunhealthy biological assemblage is merely an indica-tion of a problem, but the source of the problem (thecausative pollutant(s)) is not specifically identified.
The main components of the TMDL process for anarrative/biological impairment are defined below.
Identification of the pollutant/stressor causing thewater quality impairment An impaired biologicalassemblage is an indicator that a pollutant(s) is“stressing” the stream, but the impairment assessmentdoes not pinpoint the specific stressor(s) (USEPA,2000). A process called Stressor Analysis is used toidentify the likely pollutant or condition causing thebiological impairment, with the TMDL then devel-oped for the identified pollutants(s)/stressor(s). Stress-or Analysis is applied to data from the biologicalmetrics, the chemical ambient water quality measure-ments, and physical habitat evaluations to determinethe most likely stressor(s) that then becomes thetarget stressor for the TMDL determination. Becausemultiple stressors may be contributing in varyingdegrees to a biological impairment, Stressor Analysisis used to sift the available information in order todetermine one or more primary stressor(s) that willbecome the basis for the TMDL (USEPA, 2000).
Estimation of the water body assimilative capacityFor many biological stressors, no numeric waterquality criteria exist. In the absence of numeric criteria,one method to determine the target pollutant loadingsis the Reference Watershed Approach. In this method,a watershed is selected that is not biologicallyimpaired, but is otherwise similar to the impairedwatershed. The calculated pollutant loading from thereference watershed is then used to establish the targetload for the pollutant in the impaired watershed.
Estimation of the pollutant load from all sources tothe water body Pollutant loads are typically deter-
342 Water Air Soil Pollut (2007) 181:341–354
mined using computer models. These models esti-mate nonpoint source loads using parameters basedon land use, soil type, and other watershedcharacteristics and represent the variety of sourcesof the target pollutant that are present in thewatershed. Both point sources and nonpoint sourcesare considered.
Predictive analysis of pollution in the water bodyand determination of total allowable pollutionload Pollutant loads are modeled for the impairedand reference watersheds. The load from the referencewatershed represents the TMDL target load required toachieve the water quality standard, and the differencebetween the two simulated loads represents the re-quired reduction in pollutant load from the impairedwatershed.
Definition of the margin of safety (MOS) A MOS is arequired component of a TMDL that accounts for theuncertainty about the relationship between the pollut-ant loads and the quality of the receiving waters. TheMOS may be accounted for implicitly (MOS=0) usingconservative assumptions in the development ofTMDLs (conservative calculations or estimates ofmodel parameters). If the MOS needs to be larger thanthat which can be accounted for through the conserva-tive assumptions, an explicit MOS can be used.Depending on the quality of available data and themodel used to develop the TMDL, explicit, MOS forsediment TMDLs typically range from 5 to 20%(USEPA, 2006).
Allocation (with a margin of safety) of the allowablepollutant loads Existing pollutant loads must then bereduced to the allowable pollutant load throughreductions from the various point and nonpointpollution sources. A number of alternative reductionscenarios are generally developed to illustrate alter-nate strategies that result in the same targeted TMDLload. These scenarios are created by using differentcombinations of percentage reductions from thevarious pollutant sources (USEPA, 1991).
The final goal of a biological TMDL is therestoration of a healthy benthic assemblage in thewater body, which brings the water body back intocompliance with the Virginia general standard forwater quality (Benham, Walker, & Yagow, 2003).
1.2 Goals and objectives
The goal of this study was to investigate the var-iability in required pollutant reductions when devel-oping TMDLs for biologically-impaired streamsusing the Reference Watershed Approach. The gener-al water quality standard for Virginia, which isassessed using benthic assemblage health, was theapplicable water quality standard. The specific objec-tive was to assess the variability in pollutant reductionrequirements using the Reference Watershed Ap-proach for impaired watersheds as a function of using1) different sources of land use data, 2) alternativewater quality models, and 3) different referencewatersheds.
2 Methodology
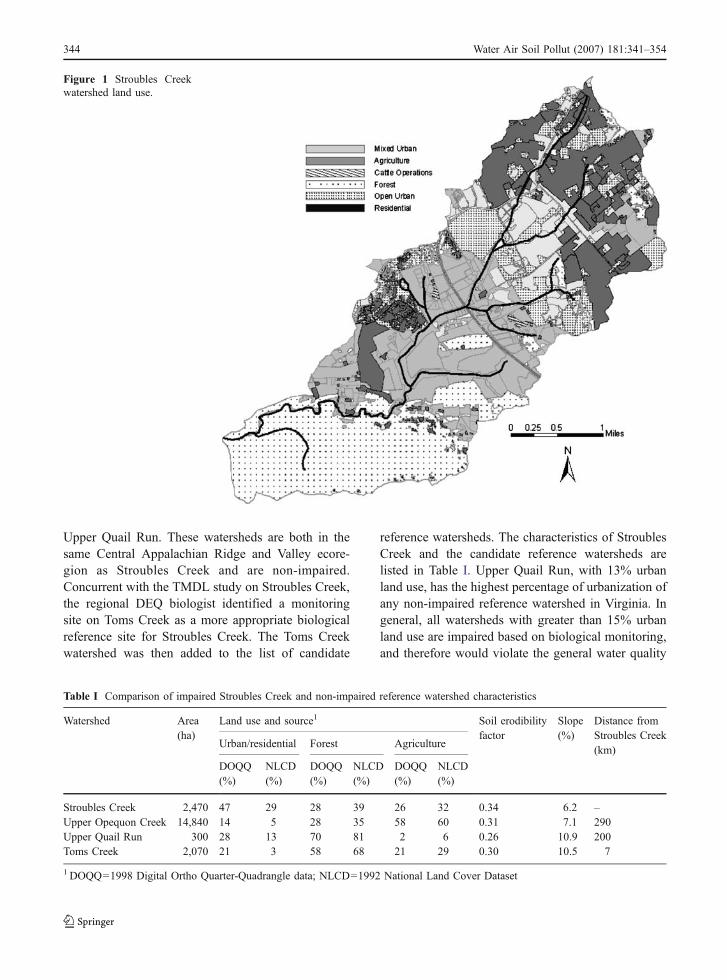
Stroubles Creek, a benthically-impaired water bodyon Virginia’s 1998 303(d) list was selected as thestudy watershed for this research. Stroubles Creek islocated in the town of Blacksburg in MontgomeryCounty, Virginia. Stroubles Creek was selectedbecause the Center for TMDL and Watershed Studiesat Virginia Tech (formerly the Virginia Tech TMDLDevelopment Group) was contracted to develop aTMDL for the benthic impairment on StroublesCreek. In addition, the authors were intimatelyfamiliar with the watershed, which encompasses themajority of the Virginia Tech campus. Figure 1 showsthe land use distribution in the Stroubles Creekwatershed.
2.1 Selection of reference watersheds
To evaluate the variability of required pollutantreductions as a function of alternative referencewatersheds, TMDLs were developed for StroublesCreek using three different reference watersheds.Selection of the reference watersheds for benthicimpairment TMDL development is typically based onsimilarities in ecoregion and watershed characteristicsin the impaired and candidate reference watersheds,including area, land use distribution, soil erodibility,slope, elevation, and proximity to the impairedwatershed. The following watersheds were selectedfrom reference watersheds used in previous TMDLstudies in the region: Upper Opequon Creek and
Water Air Soil Pollut (2007) 181:341–354 343
Upper Quail Run. These watersheds are both in thesame Central Appalachian Ridge and Valley ecore-gion as Stroubles Creek and are non-impaired.Concurrent with the TMDL study on Stroubles Creek,the regional DEQ biologist identified a monitoringsite on Toms Creek as a more appropriate biologicalreference site for Stroubles Creek. The Toms Creekwatershed was then added to the list of candidate
reference watersheds. The characteristics of StroublesCreek and the candidate reference watersheds arelisted in Table I. Upper Quail Run, with 13% urbanland use, has the highest percentage of urbanization ofany non-impaired reference watershed in Virginia. Ingeneral, all watersheds with greater than 15% urbanland use are impaired based on biological monitoring,and therefore would violate the general water quality
Table I Comparison of impaired Stroubles Creek and non-impaired reference watershed characteristics
Watershed Area(ha)
Land use and source1 Soil erodibilityfactor
Slope(%)
Distance fromStroubles Creek(km)
Urban/residential Forest Agriculture
DOQQ(%)
NLCD(%)
DOQQ(%)
NLCD(%)
DOQQ(%)
NLCD(%)
Stroubles Creek 2,470 47 29 28 39 26 32 0.34 6.2 –Upper Opequon Creek 14,840 14 5 28 35 58 60 0.31 7.1 290Upper Quail Run 300 28 13 70 81 2 6 0.26 10.9 200Toms Creek 2,070 21 3 58 68 21 29 0.30 10.5 7
1 DOQQ=1998 Digital Ortho Quarter-Quadrangle data; NLCD=1992 National Land Cover Dataset
Figure 1 Stroubles Creekwatershed land use.
344 Water Air Soil Pollut (2007) 181:341–354
standard if assessed (Boward, Teeter, Lockaby, Hurd,& Prochaska, 1999).
2.2 Alternative land use sources used in TMDLdevelopment
Land use information was derived from two sources:digital ortho quarter-quadrangles (DOQQs) and theNational Land Cover Dataset (NLCD). The DOQQsare infrared aerial photographs of one quarter of aUSGS 7.5-min quadrangle map. Using these images,the outlines of distinct land use areas were manuallydelineated in the ArcMap™ GIS environment (ESRI,2006). A specific land use was then assigned to eachdelineated area through visual assessment of theDOQQs. The land use assignments were verified orreassigned by physically visiting and driving thewatersheds to confirm or correct land use assign-ments. Some of the DOQQ-based land use used inthis study was developed by Virginia Department ofConservation and Recreation (DCR) and some wasdeveloped by the Virginia Tech TMDL DevelopmentGroup. Areas digitized by Virginia Tech werechecked and approved by DCR (Wagner, 2004).
2.3 Alternative models used in TMDL development
The stressor analysis conducted as part of the TMDLstudy identified sediment as the principal stressorresponsible for the impairment and the TMDL wasconsequently developed for sediment (Mostaghimiet al., 2003). Based on a review of the modelscommonly used in the development of sedimentTMDLs for benthically-impaired streams, the Gener-alized Watershed Loading Functions (GWLF) and theSoil and Water Assessment Tool (SWAT) models wereselected for evaluation in this study. The approachused to apply these models is described below.
2.3.1 GWLF: Generalized watershed loadingfunctions
The GWLF model was developed at Cornell Univer-sity (Haith, 1985). The sediment component of thismodel was developed to predict sediment loading tostreams using parameters that do not require calibra-tion and that are obtainable from readily accessibledata sources. GWLF uses sediment delivery ratios andthe Universal Soil Loss Equation parameters. The soil
erosion process in GWLF is simulated using 1) soildetachment by rainfall, and 2) runoff transportrelationships developed by Meyer and Wischmeier(1969). The model accounts for both urban and ruralland uses, uses daily input values, and producesoutput at a monthly time step. In-stream depositionand sediment trapping by impoundments are notsimulated. The model simulates runoff and baseflowwith a tolerable degree of accuracy (USEPA, 1992).
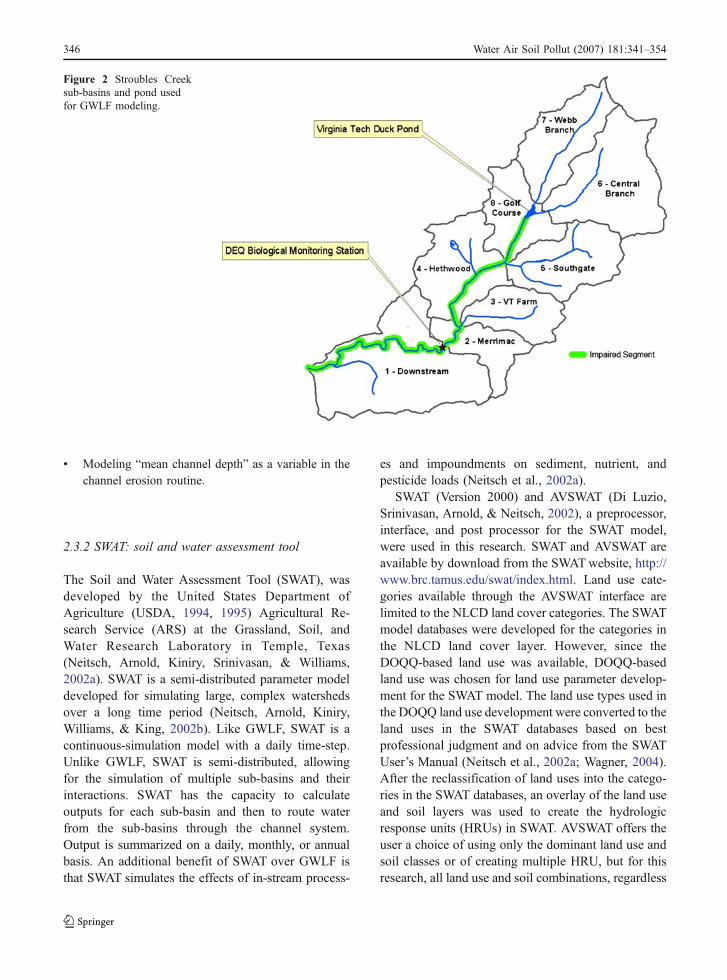
A limitation of GWLF is that the model does notexplicitly model sub-basins. To simulate sub-basinloads, a series of model runs must be made so that ateach intended sub-basin outlet, a watershed is definedthat includes the entire area draining to that point forparameter evaluation. During post-processing ofmodel results, loads from upstream sub-basins aresubtracted from downstream sub-basin loads toestimate loads from within non-headwater sub-basins.This method of combination and subtraction isimportant for accurate evaluation of parameters suchas sediment delivery ratio, in which the parameter isdependent on stream length or watershed area andcannot be calculated accurately without consideringcontributions from upstream sub-basins. Figure 2depicts the Stroubles Creek sub-basins that were usedin this study.
In the official Stroubles Creek Benthic TMDLreport (Mostaghimi et al., 2003), the Virginia TechDuck Pond, shown in Figure 2 was estimated astrapping 50% of the sediment entering the pond fromupstream sub-basins. After modeling with GWLF,the sediment load from the sub-basins upstream ofthe pond was therefore reduced by 50% beforecombining with the sediment loads from the down-stream sub-basins to obtain the overall watershedsediment yield.
The version of the GWLF Model used in thisresearch was modified from the Penn State AVGWLFversion that includes a channel erosion component(Evans, Sheeder, & Lehning, 2003). The modifiedVirginia Tech version (Yagow, 2004) includes thefollowing modifications:
& Calculation of monthly sediment loads by land use.& Use of a “response file” to allow for batch runs of
multiple watersheds.& Inclusion of a variable urban sediment build-up rate.& Inclusion of the urban sediment load in total
sediment loads.
Water Air Soil Pollut (2007) 181:341–354 345
& Modeling “mean channel depth” as a variable in thechannel erosion routine.
2.3.2 SWAT: soil and water assessment tool
The Soil and Water Assessment Tool (SWAT), wasdeveloped by the United States Department ofAgriculture (USDA, 1994, 1995) Agricultural Re-search Service (ARS) at the Grassland, Soil, andWater Research Laboratory in Temple, Texas(Neitsch, Arnold, Kiniry, Srinivasan, & Williams,2002a). SWAT is a semi-distributed parameter modeldeveloped for simulating large, complex watershedsover a long time period (Neitsch, Arnold, Kiniry,Williams, & King, 2002b). Like GWLF, SWAT is acontinuous-simulation model with a daily time-step.Unlike GWLF, SWAT is semi-distributed, allowingfor the simulation of multiple sub-basins and theirinteractions. SWAT has the capacity to calculateoutputs for each sub-basin and then to route waterfrom the sub-basins through the channel system.Output is summarized on a daily, monthly, or annualbasis. An additional benefit of SWAT over GWLF isthat SWAT simulates the effects of in-stream process-
es and impoundments on sediment, nutrient, andpesticide loads (Neitsch et al., 2002a).
SWAT (Version 2000) and AVSWAT (Di Luzio,Srinivasan, Arnold, & Neitsch, 2002), a preprocessor,interface, and post processor for the SWAT model,were used in this research. SWAT and AVSWAT areavailable by download from the SWATwebsite, http://www.brc.tamus.edu/swat/index.html. Land use cate-gories available through the AVSWAT interface arelimited to the NLCD land cover categories. The SWATmodel databases were developed for the categories inthe NLCD land cover layer. However, since theDOQQ-based land use was available, DOQQ-basedland use was chosen for land use parameter develop-ment for the SWAT model. The land use types used inthe DOQQ land use development were converted to theland uses in the SWAT databases based on bestprofessional judgment and on advice from the SWATUser’s Manual (Neitsch et al., 2002a; Wagner, 2004).After the reclassification of land uses into the catego-ries in the SWAT databases, an overlay of the land useand soil layers was used to create the hydrologicresponse units (HRUs) in SWAT. AVSWAT offers theuser a choice of using only the dominant land use andsoil classes or of creating multiple HRU, but for thisresearch, all land use and soil combinations, regardless
Figure 2 Stroubles Creeksub-basins and pond usedfor GWLF modeling.
346 Water Air Soil Pollut (2007) 181:341–354
of how small their contribution to the watershed area,were used to construct HRUs.
2.4 Reference Watershed Approach
The Reference Watershed Approach compares theaverage annual pollutant loads from an impairedwatershed with those from the non-impaired referencewatershed. The loads of the primary pollutant(s) aresimulated for both watersheds. Since the reference andimpaired watersheds typically have different areas,comparisons between the watersheds should either bedone on a unit area basis, or the reference watershedareas may be scaled to produce watersheds with thesame area as Stroubles Creek. This scaling allows directcomparison of resultant pollutant loads. The requiredreduction in pollutant load in the impaired watershed iscalculated as the difference in loads between theimpaired watershed and the area-adjusted referencewatershed. In a TMDL study, the pollutant reductionincludes reductions from nonpoint sources, permittedpoint sources, and a margin of safety. For StroublesCreek and the reference watersheds considered, pointsource sediment sources were insignificant and werenot considered. For the following comparisons, thesame margin of safety (MOS) would have appliedregardless of reference watershed. Since the MOSwould have no effect on these comparisons, therefore,it was not included in the following calculations.
2.5 Comparison of sediment loads
In the development of a TMDL for sediment, thepredicted sediment loads are translated into thepercentage of the load in the impaired watershed thatmust be eliminated to meet the TMDL target load
established by the reference watershed. This isreferred to as the required percentage reduction, andis calculated as:
Reduction ¼ Yimp � YrefY imp
� 100 ð1Þ
Where
Reduction required impaired watershed sedimentreduction, %
Yimp total sediment yield from the impairedwatershed, Mg/year
Yref total sediment yield from the referencewatershed, Mg/year
It is this value, the required sediment reduction inthe impaired watershed, which is evaluated through-out this study for different combinations of land usesource, water quality model, and reference watershed.
3 Results and discussion
3.1 Load reductions as a function of land use sourcebased on GWLF modeled loads
Simulated sediment loads and required sedimentreductions using GWLF based on the two differentland use sources are shown in Table II for StroublesCreek and the three selected reference watersheds.Modeled sediment yields based on NLCD land usewere consistently higher for each watershed thanthose based on DOQQ land use (extremely so forToms Creek), while modeled streambank erosion wasconsistently lower. These loads led to notable differ-ences in the required sediment reductions usingDOQQ and NLCD-based land use. Toms Creek has
Table II Comparison of GWLF simulated sediment loads and reductions based on different land use sources
Parameter Stroubles Creek Reference watershed
Upper Opequon Creek Upper Quail Run Toms Creek
Land use source DOQQ NLCD DOQQ NLCD DOQQ NLCD DOQQ NLCD
Upland sediment yield (Mg/year)1 5,349 5,974 3,406 4,554 938 1,066 2,090 6,796Channel sediment yield (Mg/year) 168 59 42 15 52 25 38 15Total sediment yield (Mg/year) 5,516 6,033 3,449 4,570 990 1,091 2,128 6,811Required sediment reduction 37% 24% 82% 82% 61% −13%DOQQ-NLCD Difference in required reduction 13% 0% 74%
1 Sediment yields can be converted to Mg/ha/year by dividing the above yields by the area of Stroubles Creek (2,470 ha) to which theother watersheds were area normalized.
Water Air Soil Pollut (2007) 181:341–354 347
the largest difference in required sediment reduction:DOQQ-based land use requires a 61% sedimentreduction, while NLCD-based land use required nodecrease in sediment loads as the Toms Creekreference watershed had 13% higher total sedimentloss than Stroubles Creek. In contrast, differences inrequired sediment reductions due to land use sourceusing Upper Opequon Creek and Upper Quail Run asreference watersheds were 13 and 0%, respectively.For Upper Opequon Creek and Toms Creek, requiredreductions were greater using DOQQ land use,whereas for Upper Quail Run, DOQQ reductionswere equal to the NLCD-based reductions. Differ-ences of less than 20% are probably not of majorconcern given the known uncertainty in the accuracyof the GWLF model. Use of an appropriate margin ofsafety, for example 20%, in the development of anactual TMDL could compensate for the 0 to 13%differences due to alternative land use sources forUpper Quail Run and Upper Opequon. However, thelarge differences (61% versus −13%) in requiredsediment reductions for Toms Creek due to alternativeland use sources cannot be compensated for using areasonable margin of safety.
Use of NLCD land use resulted in substantiallyless (52 to 65%) channel erosion than DOQQ-basedland use (Table II). Channel erosion estimated withthe Penn State algorithm is an empirical function ofstream dimensions, average watershed curve number(CN), average slope, average soil erodibility, animaldensity, and percent developed land. As shown inTable I, use of the NLCD resulted in substantiallylower estimates of urban land use and therefore lowerstormwater runoff, which contributed to reducedestimates of channel erosion with NLCD land use.
While DOQQ-based land use produced highersediment yields from channel erosion, use of NLCD
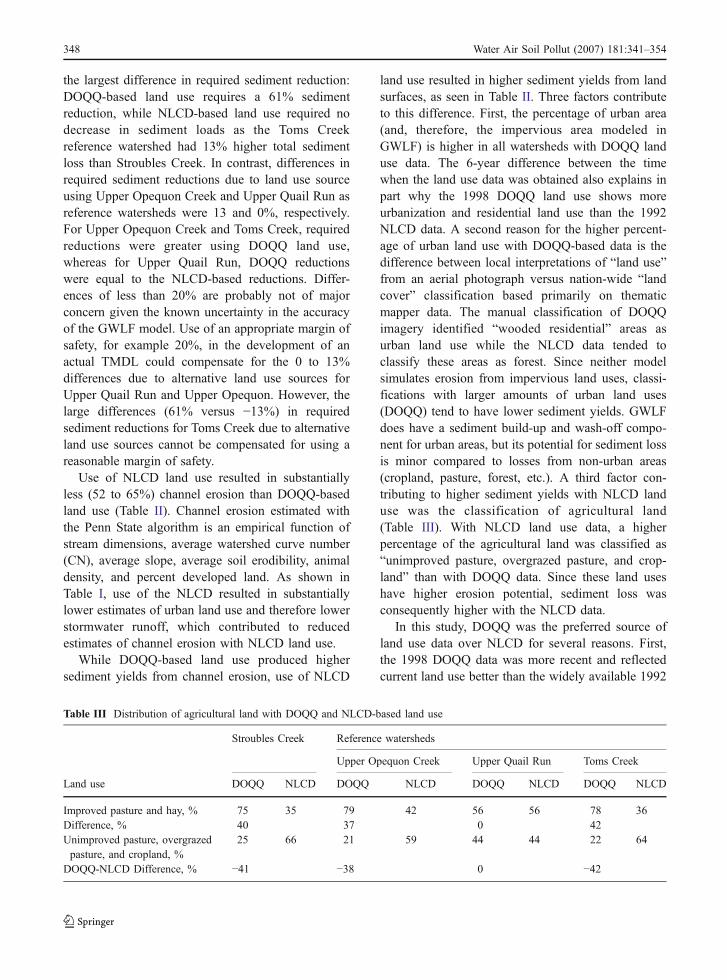
land use resulted in higher sediment yields from landsurfaces, as seen in Table II. Three factors contributeto this difference. First, the percentage of urban area(and, therefore, the impervious area modeled inGWLF) is higher in all watersheds with DOQQ landuse data. The 6-year difference between the timewhen the land use data was obtained also explains inpart why the 1998 DOQQ land use shows moreurbanization and residential land use than the 1992NLCD data. A second reason for the higher percent-age of urban land use with DOQQ-based data is thedifference between local interpretations of “land use”from an aerial photograph versus nation-wide “landcover” classification based primarily on thematicmapper data. The manual classification of DOQQimagery identified “wooded residential” areas asurban land use while the NLCD data tended toclassify these areas as forest. Since neither modelsimulates erosion from impervious land uses, classi-fications with larger amounts of urban land uses(DOQQ) tend to have lower sediment yields. GWLFdoes have a sediment build-up and wash-off compo-nent for urban areas, but its potential for sediment lossis minor compared to losses from non-urban areas(cropland, pasture, forest, etc.). A third factor con-tributing to higher sediment yields with NLCD landuse was the classification of agricultural land(Table III). With NLCD land use data, a higherpercentage of the agricultural land was classified as“unimproved pasture, overgrazed pasture, and crop-land” than with DOQQ data. Since these land useshave higher erosion potential, sediment loss wasconsequently higher with the NLCD data.
In this study, DOQQ was the preferred source ofland use data over NLCD for several reasons. First,the 1998 DOQQ data was more recent and reflectedcurrent land use better than the widely available 1992
Table III Distribution of agricultural land with DOQQ and NLCD-based land use
Stroubles Creek Reference watersheds
Upper Opequon Creek Upper Quail Run Toms Creek
Land use DOQQ NLCD DOQQ NLCD DOQQ NLCD DOQQ NLCD
Improved pasture and hay, % 75 35 79 42 56 56 78 36Difference, % 40 37 0 42Unimproved pasture, overgrazedpasture, and cropland, %
25 66 21 59 44 44 22 64
DOQQ-NLCD Difference, % −41 −38 0 −42
348 Water Air Soil Pollut (2007) 181:341–354
NLCD data. Since TMDLs are developed for current/future conditions, use of the most up-to-date dataavailable is more consistent with the TMDL modelingneeds. Second, the aerial photography-based DOQQdata had greater resolution than the available satelliteimagery-based NLCD data. Consequently, theDOQQ-based land use delineations allowed moreprecise land use categorization and delineation ofsmaller land use parcels. Development of digital landuse data from DOQQs, however, requires additionaltime and expense to perform the manual delineationand classification, and the follow-up ground-truthing.In contrast, the NLCD land use data is available foralmost the entire US from the US Geological Surveyand is ready to use.
3.2 Load reductions as a function of alternative waterquality models
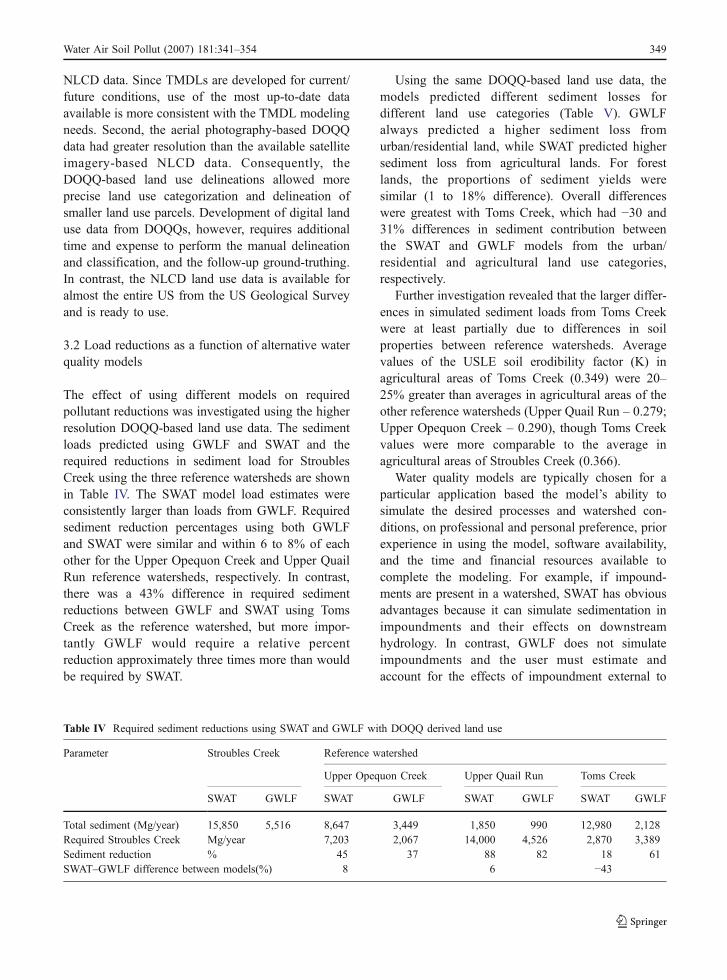
The effect of using different models on requiredpollutant reductions was investigated using the higherresolution DOQQ-based land use data. The sedimentloads predicted using GWLF and SWAT and therequired reductions in sediment load for StroublesCreek using the three reference watersheds are shownin Table IV. The SWAT model load estimates wereconsistently larger than loads from GWLF. Requiredsediment reduction percentages using both GWLFand SWAT were similar and within 6 to 8% of eachother for the Upper Opequon Creek and Upper QuailRun reference watersheds, respectively. In contrast,there was a 43% difference in required sedimentreductions between GWLF and SWAT using TomsCreek as the reference watershed, but more impor-tantly GWLF would require a relative percentreduction approximately three times more than wouldbe required by SWAT.
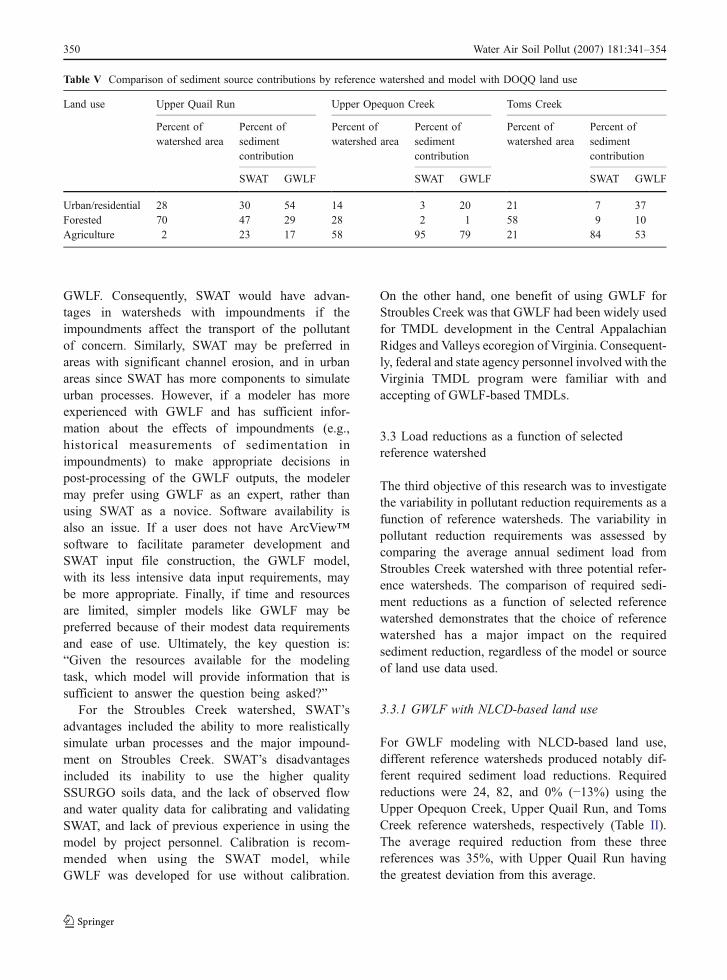
Using the same DOQQ-based land use data, themodels predicted different sediment losses fordifferent land use categories (Table V). GWLFalways predicted a higher sediment loss fromurban/residential land, while SWAT predicted highersediment loss from agricultural lands. For forestlands, the proportions of sediment yields weresimilar (1 to 18% difference). Overall differenceswere greatest with Toms Creek, which had −30 and31% differences in sediment contribution betweenthe SWAT and GWLF models from the urban/residential and agricultural land use categories,respectively.
Further investigation revealed that the larger differ-ences in simulated sediment loads from Toms Creekwere at least partially due to differences in soilproperties between reference watersheds. Averagevalues of the USLE soil erodibility factor (K) inagricultural areas of Toms Creek (0.349) were 20–25% greater than averages in agricultural areas of theother reference watersheds (Upper Quail Run – 0.279;Upper Opequon Creek – 0.290), though Toms Creekvalues were more comparable to the average inagricultural areas of Stroubles Creek (0.366).
Water quality models are typically chosen for aparticular application based the model’s ability tosimulate the desired processes and watershed con-ditions, on professional and personal preference, priorexperience in using the model, software availability,and the time and financial resources available tocomplete the modeling. For example, if impound-ments are present in a watershed, SWAT has obviousadvantages because it can simulate sedimentation inimpoundments and their effects on downstreamhydrology. In contrast, GWLF does not simulateimpoundments and the user must estimate andaccount for the effects of impoundment external to
Table IV Required sediment reductions using SWAT and GWLF with DOQQ derived land use
Parameter Stroubles Creek Reference watershed
Upper Opequon Creek Upper Quail Run Toms Creek
SWAT GWLF SWAT GWLF SWAT GWLF SWAT GWLF
Total sediment (Mg/year) 15,850 5,516 8,647 3,449 1,850 990 12,980 2,128Required Stroubles Creek Mg/year 7,203 2,067 14,000 4,526 2,870 3,389Sediment reduction % 45 37 88 82 18 61SWAT–GWLF difference between models(%) 8 6 −43
Water Air Soil Pollut (2007) 181:341–354 349
GWLF. Consequently, SWAT would have advan-tages in watersheds with impoundments if theimpoundments affect the transport of the pollutantof concern. Similarly, SWAT may be preferred inareas with significant channel erosion, and in urbanareas since SWAT has more components to simulateurban processes. However, if a modeler has moreexperienced with GWLF and has sufficient infor-mation about the effects of impoundments (e.g.,historical measurements of sedimentation inimpoundments) to make appropriate decisions inpost-processing of the GWLF outputs, the modelermay prefer using GWLF as an expert, rather thanusing SWAT as a novice. Software availability isalso an issue. If a user does not have ArcView™software to facilitate parameter development andSWAT input file construction, the GWLF model,with its less intensive data input requirements, maybe more appropriate. Finally, if time and resourcesare limited, simpler models like GWLF may bepreferred because of their modest data requirementsand ease of use. Ultimately, the key question is:“Given the resources available for the modelingtask, which model will provide information that issufficient to answer the question being asked?”
For the Stroubles Creek watershed, SWAT’sadvantages included the ability to more realisticallysimulate urban processes and the major impound-ment on Stroubles Creek. SWAT’s disadvantagesincluded its inability to use the higher qualitySSURGO soils data, and the lack of observed flowand water quality data for calibrating and validatingSWAT, and lack of previous experience in using themodel by project personnel. Calibration is recom-mended when using the SWAT model, whileGWLF was developed for use without calibration.
On the other hand, one benefit of using GWLF forStroubles Creek was that GWLF had been widely usedfor TMDL development in the Central AppalachianRidges and Valleys ecoregion of Virginia. Consequent-ly, federal and state agency personnel involved with theVirginia TMDL program were familiar with andaccepting of GWLF-based TMDLs.
3.3 Load reductions as a function of selectedreference watershed
The third objective of this research was to investigatethe variability in pollutant reduction requirements as afunction of reference watersheds. The variability inpollutant reduction requirements was assessed bycomparing the average annual sediment load fromStroubles Creek watershed with three potential refer-ence watersheds. The comparison of required sedi-ment reductions as a function of selected referencewatershed demonstrates that the choice of referencewatershed has a major impact on the requiredsediment reduction, regardless of the model or sourceof land use data used.
3.3.1 GWLF with NLCD-based land use
For GWLF modeling with NLCD-based land use,different reference watersheds produced notably dif-ferent required sediment load reductions. Requiredreductions were 24, 82, and 0% (−13%) using theUpper Opequon Creek, Upper Quail Run, and TomsCreek reference watersheds, respectively (Table II).The average required reduction from these threereferences was 35%, with Upper Quail Run havingthe greatest deviation from this average.
Table V Comparison of sediment source contributions by reference watershed and model with DOQQ land use
Land use Upper Quail Run Upper Opequon Creek Toms Creek
Percent ofwatershed area
Percent ofsedimentcontribution
Percent ofwatershed area
Percent ofsedimentcontribution
Percent ofwatershed area
Percent ofsedimentcontribution
SWAT GWLF SWAT GWLF SWAT GWLF
Urban/residential 28 30 54 14 3 20 21 7 37Forested 70 47 29 28 2 1 58 9 10Agriculture 2 23 17 58 95 79 21 84 53
350 Water Air Soil Pollut (2007) 181:341–354
3.3.2 GWLF with DOQQ-based land use
For GWLF modeling with DOQQ-based land use, therequired reductions in sediment loading were 37, 82,and 61% using Upper Opequon Creek, Upper QuailRun, and Toms Creek as the reference watersheds,respectively (Table II). The average required reduc-tion using these three references was 60%, withUpper Opequon Creek and Upper Quail Run differingthe most.
3.3.3 SWAT with DOQQ-based land use
Variability in required reductions with differentreference watersheds was also large with SWAT.Required sediment reductions were 45, 88, and 18%using the Upper Opequon Creek, Upper Quail Run,and Toms Creek watersheds, respectively (Table IV),with an average of 51%. Once again, Upper QuailRun had the greatest deviation from the average.
3.3.4 Discussion of reference watershed comparisons
Regardless of model used or the source of land useinformation, the use of different reference watershedshad a profound impact on required sediment reduc-tions. In all cases, Upper Quail Run required thegreatest percentage reduction, followed by UpperOpequon Creek, and Toms Creek. Clearly, the choiceof reference watershed affects the required loadingreductions and thus has a substantial impact on theresulting TMDL. Reductions required using TomsCreek as the reference watershed were generallyminor (0 to 18%) and substantially less than thoserequired with the other reference watersheds (exceptfor the case using GWLF with DOQQ land use data,which required a 61% reduction). In contrast, use ofUpper Quail Run would require sediment reductionsof 82 to 88% for all model and land use combinations,or about four times greater sediment reductions thanthat required using Toms Creek.
The low sediment yield from Upper Quail Run,seen for all land use source/model combinations, canlikely be attributed to the large proportion of forestand the low proportion of agricultural land in theUpper Quail Run watershed (Table I). Forest land usetypically has the lowest runoff volumes and sedimentyields of any land use. Use of Toms Creek as thereference watershed usually required the smallest
percentage reduction in sediment yield for StroublesCreek, with the exception of GWLF used with theDOQQ data. This is probably because the distributionof DOQQ-categorized land uses in the Toms Creekbasin was similar to that in Stroubles Creek, as weresoil types and agricultural practices.
An examination of Table I does not reveal anyobvious first choice for a reference watershed usingthe watershed characteristics comparison. AlthoughUpper Quail Run has a relatively high amount ofurban land use using either NLCD or DOQQ land usefor a reference watershed, its percentage of forestedland is very high compared to Stroubles Creek and itsfraction of agricultural land is exceedingly low. UpperQuail Run’s results were always the most different,possibly indicating that Upper Quail Run is not anappropriate reference watershed and that bettermatches are needed between forested and agriculturalland use distributions. Upper Opequon Creek has acomparable percentage of forested land, but twice thepercentage of agriculture land, which typically hashigher unit area soil losses. Toms Creek has arelatively similar percentage of agriculture land andis similar in size to Stroubles Creek. Similar size isbeneficial because it reduces required area-adjust-ment, which may introduce anomalies in estimation ofGWLF channel erosion parameter values.
Based on the importance of having similar land usedistributions, Toms Creek is probably the bestreference watershed for Stroubles Creek. In additionto the two watersheds being adjacent, they are alsosimilar in size, and the similarity in agricultural landpercentage is beneficial because agricultural land is asignificant contributor to sediment. Upper OpequonCreek is a reasonable choice for a reference watershedsince it has a comparable proportion of forest land toStroubles Creek, and a similar average slope. UpperQuail Run is the least appropriate: it is primarilyforested and is very small compared to StroublesCreek, requiring significant area-adjustment for com-parative load modeling purposes. However, resultsfrom this research indicate that sediment yields aremuch more variable (−43 to 74% difference) withrespect to model and land use source using TomsCreek as the reference watershed compared to theother two reference watersheds (Tables II and IV).Upper Opequon Creek and Upper Quail Run, incontrast, produce similar required sediment reductions(0 to 13% difference) regardless of the water quality
Water Air Soil Pollut (2007) 181:341–354 351
model used, and therefore may be preferred to ensureconsistency of the required pollutant reduction.
3.4 Reference watershed approach alternatives
Because of the difficulty in identifying “good”reference watersheds, the use of regression equationshas been proposed as an alternative to the ReferenceWatershed Approach in the development of TMDLsfor waterbodies with benthic impairments. Frondorf(2001) developed a series of regression equationsrelating stressors to Rapid Bioassessment Protocol II(RBPII) scores and to individual benthic metrics usedin developing the RBPII score. These equations, bothlinear and non-linear, express correlated relationshipsbetween specific combinations of benthic metrics andhabitat measurements with the RBPII score for astream segment, though the correlations were notstrong. Although these equations were limited inscope, further research and experimental applicationof these equations could promote their use as areplacement for the Reference Watershed Approach.A significant benefit to using these equations instead ofthe Reference Watershed Approach is that theseequations incorporate multiple reference watershedsinto the determination of the target load of thepollutants, whereas the Reference Watershed Approachonly considers one reference watershed. This approachhas been used in the development of at least oneexperimental TMDL in Virginia (MapTech, 2004).
An additional alternative to the Reference Wa-tershed Approach is the development of waterquality criteria for pollutants that are associatedwith benthic impairments and for which criteria donot exist. Sediment, nutrients, and organic loadingsare commonly identified as the primary stressorsduring TMDL development for benthic impair-ments. Although development of criteria for these
pollutants is complicated and could require a suiteof criteria for different ecoregions, establishingthese criteria would eliminate the need for theReference Watershed Approach when setting thetarget load for these pollutants in a water body. Thebenefit of using criteria is that they eliminateinconsistency in TMDL development by establish-ing the same target goal for all ecologically similarwaters.
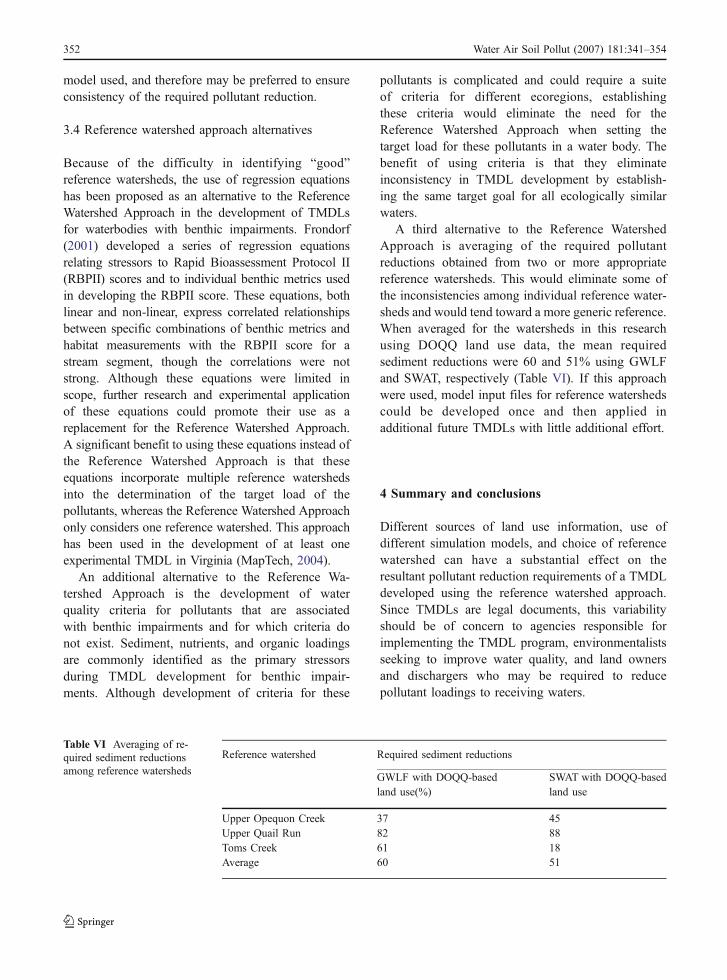
A third alternative to the Reference WatershedApproach is averaging of the required pollutantreductions obtained from two or more appropriatereference watersheds. This would eliminate some ofthe inconsistencies among individual reference water-sheds and would tend toward a more generic reference.When averaged for the watersheds in this researchusing DOQQ land use data, the mean requiredsediment reductions were 60 and 51% using GWLFand SWAT, respectively (Table VI). If this approachwere used, model input files for reference watershedscould be developed once and then applied inadditional future TMDLs with little additional effort.
4 Summary and conclusions
Different sources of land use information, use ofdifferent simulation models, and choice of referencewatershed can have a substantial effect on theresultant pollutant reduction requirements of a TMDLdeveloped using the reference watershed approach.Since TMDLs are legal documents, this variabilityshould be of concern to agencies responsible forimplementing the TMDL program, environmentalistsseeking to improve water quality, and land ownersand dischargers who may be required to reducepollutant loadings to receiving waters.
Reference watershed Required sediment reductions
GWLF with DOQQ-basedland use(%)
SWAT with DOQQ-basedland use
Upper Opequon Creek 37 45Upper Quail Run 82 88Toms Creek 61 18Average 60 51
Table VI Averaging of re-quired sediment reductionsamong reference watersheds
352 Water Air Soil Pollut (2007) 181:341–354
Alternative land use sources, models, and referencewatersheds were shown to introduce considerableuncertainty into required pollutant reductions. Whendata is derived from different sources, such asdifferent land use sources, the input parameters canchange considerably, resulting in substantially differ-ent required reductions. Different land use sourcesresulted in sediment load reductions that differed from0 to 74% with the GWLF model. Some land uses,such as agriculture, appear to be more important thanothers in influencing sediment load, and differences inagricultural land uses therefore may result in substan-tial differences in model results. Division of generalland use classes into more specific land use types(such as general pasture into good, unimproved, andovergrazed pasture classes) can also affect pollutantloads. Models used for estimating required pollutantreductions vary greatly in complexity, the processessimulated, and resulting accuracy. Consequentlydifferent models can produce very different resultsfor the same watershed. When SWAT and GWLF,both commonly used for sediment TMDL develop-ment, were compared on four different watershedsusing DOQQ data, actual loads were two to six timeslarger with SWAT, while the relative percent reduc-tions between the impaired and reference watersheds,between models ranged from 6 to −43%. Finally, it isvery difficult if not impossible to find a non-impairedreference watershed that is a good match for animpaired urbanizing watershed. Reference watershedstend to be non-impaired because they are relativelyundeveloped with a high percentage of forest andother minimally disruptive land uses. Use of alterna-tive reference watersheds was also shown to have asubstantial impact on required pollutant reductions,which ranged from 18 to 88% using SWAT, and from37 to 82% using GWLF.
Our results do not attempt to quantify requiredexplicit margins of safety; however, they suggest thatexplicit margins of safety substantially greater thanthe 5 to 20% used in most TMDLs may be justified tobetter account for uncertainty in TMDLs developedusing the reference watershed approach.
Despite its shortcomings, the Reference WatershedApproach fills an important need in TMDL modelingapproaches for impairments with non-numeric stand-ards, and is useful where relative reductions can guideinitial strategies towards addressing the impairment.In watersheds with impairments dominated by non-
point sources, EPA (USEPA, 1991) and state guidance(Commonwealth of Virginia, 2000) recommend thatreduction strategies be developed with a “phased”approach that recognizes the uncertainty in character-izing precise load targets. This approach is alsoconsistent with “adaptive implementation” as referredto in EPA’s Twenty Needs report (USEPA, 2002b),and defined by the National Research Council (NRC,2001) as “a process of taking actions of limited scopecommensurate with available data and information tocontinuously improve our understanding of a prob-lem and its solutions, while at the same time makingprogress toward attaining a water quality standard.”This type of approach is essential in preventing“paralysis through analysis” and the delay of remedi-ation efforts in many watersheds where impairment isevident even though the exact solution may not be.
The TMDL development process for benthicimpairments is unique to Virginia but the referencewatershed approach is not. While most TMDLs aredeveloped for the pollutant indicated by the waterquality criteria, in the case of a TMDL for a benthicimpairment, determining the stressor/pollutant is alsopart of the process. Most importantly, in a TMDL fora benthic impairment, the pollutant load reduction isnot the final indicator of success. The return of thebenthic macroinvertebrate assemblage to a non-im-paired condition is the ultimate indicator of success.
The biota of a stream serves as an importantsentinel for overall stream health, and biologicalmonitoring should continue to be an integral part ofany water quality assessment scheme. However, webelieve that the TMDL process should be restricted topollutants and environmental stressors that conformto the definition of the TMDL process. Whenbiological monitoring reveals an impaired benthic orother biological assemblage, additional monitoringshould first be conducted to adequately determine thestressor(s) causing the impairment. Only after theidentification and confirmation of a stressor(s) aroundwhich loads can be quantified should the TMDLprocess be initiated.
Acknowledgements The authors wish to thank the Center forTMDL and Watershed Studies at Virginia Tech for technicaland financial support, the Virginia Department of Conservationand Recreation for funding, and the Virginia Department ofEnvironmental Quality for guidance throughout the StroublesCreek TMDL development process.
Water Air Soil Pollut (2007) 181:341–354 353
References
Benham, B. L., Walker, J. L., & Yagow, G. (2003). TMDLs(Total Maximum Daily Loads) for benthic impairments.Virginia cooperative extension publication 442–556, (4 pp).Blacksburg: Virginia Tech. Available online (5/2005) at:http://www.ext.vt.edu/pubs/bse/442-556/442-556.html.
Boward, P., Teeter, L. D., Lockaby, B. G., Hurd, M. K., &Prochaska, T. P. (1999). From the mountains to the sea:The state of Maryland’s freshwater streams. (64 pp, EPA/903/R-99/023). Washington, DC: USEPA. Available online(2/2006) at: http://www.epa.gov/maia/pdf/md-streams.pdf.
Commonwealth of Virginia (2000). Total maximum daily loadprogram, a ten year implementation plan (75 pp.).Richmond, VA: Dept. of Environmental Quality; Dept. ofConservation and Recreation; Dept of Mines, Minerals andEnergy; and Dept. of Health. Available online (5/2005) at:http://www.deq.state.va.us/tmdl/reports/hb30.pdf.
Di Luzio, M., Srinivasan, R., Arnold, J. G., & Neitsch, S. L.(2002). Soil and water assessment tool. ArcView GISinterface manual: Version 2000. (346 pp, GSWRL report02–03, BRC report 02–07) College Station, TX: Publishedby Texas Water Resources Institute TR-193.
ESRI (2006). ArcGIS – The complete geographic informationsystem. Available online (2/2006) at: http://www.esri.com/software/arcgis/index.html.
Evans, B. M., Sheeder, S. A., & Lehning, D. W. (2003). Aspatial technique for estimating streambank erosionbased on watershed characteristics. Journal of SpatialHydrology, 3(1). Available online (2/2006) at: http://www.spatialhydrology.com/journal/paper/erosion/erosion.pdf.
Frondorf, L. (2001). An investigation of the relationships betweenstream benthic macroinvertebrate assemblage conditionsand their stressors. M.S. thesis (179 pp.). Blacksburg:Virginia Tech.
Haith, D. A. (1985). An event-based procedure for estimatingmonthly sediment yields. Transactions of the ASAE, 28(6),1916–1920.
MapTech (2004). General standard TMDL (Total MaximumDaily Load) development for Black Creek Wise County,Virginia. Prepared By MapTech Inc., Blacksburg, VA forVirginia Department of Environmental Quality and Vir-ginia Department of Mines, Minerals, and Energy. 172 p.Available online (2/2006) at: http://www.deq.virginia.gov/tmdl/apptmdls/tenbigrvr/blackbc.pdf.
Meyer, L. D., & Wischmeier, W. H. (1969). Mathematicalsimulation of the process of soil erosion by water.Transactions of the ASAE, 12(6), 754–759, 762.
Mostaghimi, S., Benham, B., Brannan, K., Dillaha, T. A., Wagner,R., Wynn, J., et al. (2003). Benthic TMDL for StroublesCreek in Montgomery County, Virginia. Prepared forVADEQ, Virginia Department of Environmental Quality.Richmond, VA. 89 p. Available online (2/2006) at: http://www.deq.virginia.gov/tmdl/apptmdls/newrvr/stroub.pdf.
Neitsch, S. L., Arnold, J. G., Kiniry, J. R., Srinivasan, R., &Williams, J. R. (2002a). Soil and water assessment tooluser’s manual: Version 2000. (472 pp, TWRI report TR-192). College Station, TX: Texas Water Resources
Institute. Available online (2/2006) at: http://www.brc.tamus.edu/swat/downloads/doc/swatuserman.pdf.
Neitsch, S. L., Arnold, J. G., Kiniry, J. R., Williams, J. R., & King,K. W. (2002b). Soil and water assessment tool theoreticaldocumentation: Version 2000. (506 pp, TWRI report TR-191). College Station, TX: Texas Water Resources Institute.Available online (2/2006) at: http://www.brc.tamus.edu/swat/downloads/doc/swat2000theory.pdf.
NRC (2001). Assessing the TMDL Approach to water qualitymanagement (109 p). Washington, D.C.: National Re-search Council, National Academy. Available online (2/2006) at: http://www.nap.edu/books/0309075793/html/.
USDA (1994). State Soil Geographic (STATSGO) data basedata use information (113 pp, Misc. Pub. No. 1492).Washington, DC: Natural Resources Conservation Service,National Soil Survey Center, United States Department ofAgriculture. Available online (2/2006) at: ftp://ftp-fc.sc.egov.usda.gov/NCGC/products/statsgo/statsgo-user-guide.pdf.
USDA (1995). Soil Survey Geographic (SSURGO) data basedata use information (110 pp, Miscellaneous PublicationNumber 1527). Washington, DC: Natural ResourcesConservation Service, National Soil Survey Center, UnitedStates Department of Agriculture. Available online (2/2006) at: http://tahoe.usgs.gov/files/ssurgo_database.pdf.
USEPA (1991). Guidance for water quality-based decisions:The TMDL process (65 pp, EPA 440/4-91-001). Wash-ington, DC: Office of Water Regulations and Standards, U.S. Environmental Protection Agency. Available online (2/2006) at: http://www.epa.gov/OWOW/tmdl/decisions/.
USEPA (1992). Compendium of watershed-scale models for TMDLdevelopment (EPA 841-R-94-002). Washington, DC: Office ofWetlands, Oceans, and Watersheds, Office of Science andTechnology, U.S. Environmental Protection Agency.
USEPA (2000). Stressor identification guidance document(228 pp, EPA 822-B-00-025). Washington, DC: Office ofWater and Office of Research and Development, U.S.Environmental Protection Agency. Available online (2/2006) at: http://www.epa.gov/ost/biocriteria/stressors/stressorid.pdf.
USEPA, U.S. Environmental Protection Agency (2002a). Cleanwater act. Available online (2/2006) at: http://www.epa.gov/r5water/cwa.htm.
USEPA (2002b). The twenty needs report: How research canimprove the TMDL program (EPA 841-B-02-002). Wash-ington, DC: Office of Water, U.S. Environmental Protec-tion Agency. Available online (2/2006) at: http://www.epa.gov/owow/tmdl/20needsreport_8-02.pdf.
USEPA (2006). WATERS expert query tool. Available online (2/2006) at: http://www.epa.gov/waters/tmdl/expert_query.html.
Virginia General Assembly (1998). Legislative informationsystem. Virginia Administrative Code. Available online(5/2005) at: http://leg1.state.va.us/000/reg/TOC.HTM.
Wagner, R. C. (2004). An examination of the referencewatershed approach for TMDLs with benthic impairments.M.S. thesis (110 p). Blacksburg: Virginia Tech.
Yagow G. (2004). Using GWLF for development of “referencewatershed approach” TMDLs. Paper no. 042262. 2004ASAE/CSAE annual international meeting. July 31–August4, 2004. Ontario, Canada. ASAE: St. Joseph, MI. 10 pp.
354 Water Air Soil Pollut (2007) 181:341–354
Copyright © 2022 FDOKUMEN