Customer Satisfaction With Internet BankingService Quality In The Ghanaian Banking Industry
Upload
khangminh22Category
view
2download
0
AN ASSESSMENT OF INTERNET BANKING SERVICE QUALITY
by
MASOPHA NEHEMIA MOLAPO
Short dissertation
Submitted in partial fulfilment of the requirements of the degree
MASTER COMMERCII
in
Business Management
at
UNIVERSITY OF JOHANNESBURG
STUDY LEADER: Mr C. SCHEEPERS
October 2008
JOHANNESBURG
i
Abstract
Extensive studies have been done in the past on measuring service quality where the
service is delivered on a face-to-face encounter. This study assesses and measures
online service quality where there is no face-to-face encounter. The service quality
measures are particularly on Internet Banking service. The research problem has
been stated as the lack of insight into customer perceptions on Internet Banking
service quality by management in South African banks. The purpose of this study was
to explore customers’ perceptions on key electronic service dimensions or factors of
Internet Banking service quality. The primary objective of the study was to have an
insight into how Internet Banking customers in South Africa perceive their respective
banks’ performance on pre-defined electronic service quality dimensions. The
secondary objective was to determine if there was any difference in Internet Banking
service quality perception based on age, gender, or primary bank offering the service
(service provider).
Even though online shopping and Internet Banking are online services there are
subtle differences between the two services. With online shopping there is a physical
item that gets traded and in Internet Banking only services are traded. It is for this
reason that the original E-S-Q instrument was slightly adjusted. Some of the
dimensions that were excluded from the original E-S-Q instrument include flexibility,
price knowledge and customization
Given the purpose and objectives of the study a quantitative approach was taken as
the major research approach for the study. The sampling design was a non-
probability sampling one because the convenience method of sampling was used.
The survey population was all online banking users, utilizing services from South
African banks. A slightly revised electronic service quality (E-S-Q), a service quality
measurement instrument, was used in this study. Data was collected via a web based
self administered survey. The original E-S-Q instrument measured customer service
quality from an online shopping experience point of view. This study aimed at
gleaning respondents’ perceptions on key Internet Banking service dimensions.
The study involved collecting primary data through a structured survey questioning
which was followed by statistical analysis of the data. The objective was to generalise
about online banking customers’ perceptions on the quality of Internet Banking
ii
service. To collect primary data the Internet survey method was used. In essence, the
combination of the quantitative approach and the survey method was utilised in this
study.
The findings and conclusion of the study is that the overall respondents’ perception on
Internet Banking service quality was a satisfactory one. The Internet Banking service
quality perceptions are not influenced by who the service provider is, age or gender.
Respondents’ perceptions were neutral or indifferent on the responsiveness service
quality dimension. Lastly there were five dimensions that the respondents evaluated
Internet Banking service quality on, that of efficiency, performance, security,
responsiveness and contact.

iii
Declaration of Original Work
AFFIDAVIT: MASTER’S AND DOCTORAL STUDENTS TO WHOM IT MAY CONCERN
This serves to confirm that I Masopha Nehemia Molapo
ID Number 6112025743086
Student number 200610108 enrolled for the
Qualification: M.Com
Faculty: Business Management
Herewith declare that my academic work is in line with the Plagiarism Policy of the
University of Johannesburg which I am familiar with. I further declare that the work
presented in the minor dissertation is authentic and original unless clearly indicated
otherwise and in such instances full reference to the source is acknowledged and I do
not pretend to receive any credit for such acknowledged quotations, and that there is
no copyright infringement in my work. I declare that no unethical research practices
were used or material gained through dishonesty. I understand that plagiarism is a
serious offence and that should I contravene the Plagiarism Policy notwithstanding
signing this affidavit, I may be found guilty of a serious criminal offence (perjury) that
would amongst other consequences compel the UJ to inform all other tertiary
institutions of the offence and to issue a corresponding certificate of reprehensible
academic conduct to whomever requests such a certificate from the institution.
Signed at Johannesburg on this 17 day of March 2009. Signature__________________________________ Name: Masopha Molapo STAMP COMMISSIONER OF OATHS Affidavit certified by a Commissioner of Oaths This affidavit conforms with the requirements of the JUSTICES OF THE PEACE AND COMMISSIONERS OF OATHS ACT 16 OF 1963 and the applicable Regulations published in the GG GNR 1258 of 21 July 1972; GN 903 of 10 July 1998; GN 109 of 2 February 2001 as amended.

iv
Acknowledgements
First and foremost I would like to thank my saviour, the Almighty God, for His love and
guidance, for granting me the strength to persevere and the ability to succeed.
Secondly I would like to express my sincere gratitude to my wife Thuso, my children
Khanyapa, Thato and Refiloe, for their love, understanding and patience they gave
me when I could not spend quality time with them during my studies. I am also
thankful to my brothers and sisters for the encouragement and support they gave me
during these trying times.
Lastly I would also like to express my gratitude to the following persons:
• Mr. Cor Scheepers for his supervision, advice, guidance and support.
• Professor Adele Thomas for her encouragement and continued drive in
assisting me to complete this dissertation.
• My friends, colleagues, business partners and my family for being available as
a sounding board in the process of writing this dissertation.
• My language editor, Mr Patrick Radebe, for his editorial work on this document.
• All those who participated in the survey, without whom this study would not
have been possible.
• University of Johannesburg statistical services (STATKON) for assisting me in
designing, hosting the online survey and completing the statistical analysis.
v
TABLE OF CONTENTS Page
Abstract.......................................................................................................................i
Declaration of Original Work................................................................................... iii
Acknowledgements.................................................................................................. iv
Chapter ONE..............................................................................................................1
INTRODUCTION.........................................................................................................1
1.1 Background of the study ...............................................................................1
1.1.1 Historical background .............................................................................1
1.1.2 Banking and technology..........................................................................2
1.1.3 Internet service quality ............................................................................3
1.1.4 Internet Banking......................................................................................4
1.2 Problem statement: .......................................................................................5
1.3 Objective / purpose .......................................................................................6
1.4 A brief outline of the research methodology..................................................6
1.4.1 The research methodology .....................................................................6
1.4.2 The research population .........................................................................6
1.4.3 The sampling method .............................................................................6
1.4.4 Data Collection........................................................................................6
1.5 An outline of the remainder of the dissertation..............................................7
1.6 Conclusion ....................................................................................................8
Chapter TWO .............................................................................................................9
LITERATURE REVIEW ..............................................................................................9
2.1 Introduction. ..........................................................................................................9
2.2 Traditional Services ....................................................................................10
2.2.1 Definition and characteristics of services ..............................................10
2.2.2 Traditional service quality......................................................................11
2.2.3 SERVQUAL ..........................................................................................16
2.2.4 Traditional banking service quality ........................................................17
2.3 Electronic Services (e- Services) ................................................................18
2.3.1 Definition and characteristics of e-Services ..........................................18
2.3.2 Electronic Service quality ......................................................................20
2.3.3 Understanding and measuring e-Service quality...................................23
2.4 Online systems quality ................................................................................24
2.4.1 Definition of online systems quality .......................................................24
2.4.2 Characteristics of online systems quality ..............................................25
vi
2.4.3 Measuring online systems quality .........................................................26
2.5 Internet Banking..........................................................................................30
2.5.1 Definition of Internet Banking................................................................30
2.5.2 Characteristics of Internet Banking .......................................................30
2.5.3 Internet Banking Service quality............................................................33
2.5.4 Measuring Internet Banking service quality...........................................35
2.6 Conclusion ..................................................................................................35
Chapter THREE .......................................................................................................38
RESEARCH METHODOLOGY.................................................................................38
3.1 Introduction .................................................................................................38
3.2 Research design .........................................................................................38
3.3 Research population ...................................................................................39
3.4 Sampling .....................................................................................................41
3.4.1 Sampling methodology..........................................................................41
3.4.2 Sample size ..........................................................................................42
3.5 Research instrument ...................................................................................43
3.6 Data Collection............................................................................................44
3.7 Data Analysis ..............................................................................................45
3.8 Ethical Considerations ................................................................................46
3.9 Conclusion ..................................................................................................47
Chapter FOUR .........................................................................................................48
PRESENTATION OF RESULTS ..............................................................................48
4.1 Introduction. ................................................................................................48
4.2 Missing data................................................................................................48
4.3 Descriptive Statistics ...................................................................................48
4.4 Principal Component Analysis ....................................................................51
4.5 Reliability and Validity Tests .......................................................................56
4.6 Internet Banking service quality measures .................................................58
Chapter FIVE............................................................................................................69
INTERPRETATION OF RESULTS ...........................................................................69
5.1 Introduction. ................................................................................................69
5.2 Findings ......................................................................................................69
5.3 Findings linked to the literature ...................................................................70
5.3.1 Characteristics of service ......................................................................70
5.3.2 Responsiveness in service recovery.....................................................70

vii
5.3.3 GAPS model .........................................................................................71
5.3.4 Modified theoretical model ....................................................................72
5.4 Limitations to the study ...............................................................................73
5.5 Conclusion ..................................................................................................73
Chapter SIX..............................................................................................................74
CONCLUSION AND RECOMMENDATIONS ...........................................................74
6.1 Summary of research objectives and major findings...................................74
6.2 Recommendations ......................................................................................75
6.3 Suggestions for further study ......................................................................76
REFERENCES..........................................................................................................77
APPENDICES...........................................................................................................81
viii
List of Tables Page
Table 2.1: WebQual 4.0 Instrument ......................................................................... 27
Table 2.2: E-S-Q instrument .................................................................................... 28
Table 2.3:E-RecS-Qual............................................................................................ 29
Table 2.4: Retail banking services and distribution channels................................... 32
Table 2.5: Service dimensions and related categories............................................. 35
Table 4.1: KMO and Bartlett’s Tests ........................................................................ 51
Table 4.2:Communalities of the twenty four variables.............................................. 52
Table 4.3: Total Varience explained......................................................................... 53
Table 4.4: Rotated Factor Matrix.............................................................................. 55
Table 4.5: Cronbach’s Alpha scores ........................................................................ 57
Table 4.6: Potential Maximum Validity Coefficient ................................................... 57
Table 4.7: Normality Test......................................................................................... 58
Table 4.8: ANOVA T-Test for Age............................................................................ 66
Table 4.9: ANOVA T-Test for Gender ...................................................................... 67
Table 4.10:ANOVA T-Test for primary bank ............................................................ 68
ix
List of Figures Page
Figure 2.1: GAPS model of service quality .............................................................. 13
Figure 2.2: Extended GAPS model if service quality................................................ 14
Figure 2.3:Possible levels of customer expectations ............................................... 15
Figure 2.4:Inherent characteristics of systems......................................................... 19
Figure 2.5: Conceptual model for understanding quality.......................................... 20
Figure 2.6: e-Service quality model.......................................................................... 22
Figure 2.7: Conceptual model for e-SQ ................................................................... 24
Figure 2.8: Website Portal Quality ........................................................................... 25
Figure 2.9: Changes in the banking sector .............................................................. 31
Figure 2.10:Internet Banking perceived qulaity model ............................................. 34
Figure 3.1: Consumer households using Internet Banking ...................................... 41
Figure 5.1: Initial and modified theoretical model..................................................... 72
Appendices
Appendix I: Internet Banking Service Quality Frequency Table ................................ 81
Appendix II: Descriptive Statistics ............................................................................. 82
Appendix III:Normality Test results ...........................................................................83
Appendix IV: Reliability Test results.......................................................................... 85
Appendix V:New Service Dimensions Labels ........................................................... 89
Appendix VI:The Kruskal-wallis Test......................................................................... 91
Appendix VII:Survey Covering Letter........................................................................92
Appendix VIII:The Survey Questionnaire..................................................................93
1
Chapter ONE
INTRODUCTION
1.1 Background of the study
The Internet emerged as a key competitive arena for the future of financial services
hence it came as no surprise when banks and brokers flocked to the Web. The use of
the Internet makes it possible for banks to offer a number of home banking services
24 hours a day (Möls, 1998:331). According to Sayar and Wolfe (2007:123) the term
Internet Banking is used to describe the case where banks’ customers conduct
banking transactions on the Internet.
1.1.1 Historical background
According to Singh (2004:187) banking in South Africa has its roots in both the British
and Dutch traditions. The British and the Dutch influence led to the existence of
Standard Bank and Nedbank respectively. The year 1998 saw the consolidation of
United, Volskas and TrustBank into a single brand as Absa adopted a new corporate
identity. As a result, four major banks, Standard Bank, Nedbank, Absa and First
National Bank emerged. These banks dominate the South African retail banking
sector (Singh, 2004:188).
Internet Banking in South Africa started in 1996. The start was fairly slow, but
consumers were attracted to the convenience, safety and low costs of online banking.
Absa was the first to offer online services and was followed by Nedcor with Standard
Bank, First National Bank and Mercantile Bank being the last to follow (Singh,
2004:190). Below are some of the key milestones in the history of Internet Banking:
• May 1995: Wells Fargo (USA), already on the Web, offered online access to
statements
• November1995: NBS became the first South African bank on the Web, offering
only a brochure on its site, with no clickable links.
• October 1996: Absa became the first South African bank to offer personal
banking details online.
• February 1997: Nedbank became the first South African bank to allow online
transactions.
2
• December 1997: Wells Fargo became the first online banking service to sign-
up 400 000 customers.
• July 2001: South Africa’s first standalone bank 20Twenty was launched with
the backing of Saambou and 40 000 customers signed up in the first six
months.
• July 2003: UK based Standard Chartered Bank signed an agreement to
acquire 20Twenty as part of its entry into the retail banking space in South
Africa.
• May 2004: Absa reached the 450 000 online banking customer mark
(Goldstuck, 2004:23).
1.1.2 Banking and technology
The Internet emerged as a key competitive arena for the future of financial services
hence it came as no surprise when banks and brokers flocked to the Web. The use of
the Internet makes it possible for banks to offer a number of home banking services
24 hours a day (Möls, 1998:331). The Internet is not merely a medium of information
delivery in a passive sense. Due to the necessary participation of the consumer in
using the Internet, it also serves as a means of service delivery. The Internet, along
with other means of home banking services, has dramatically changed the distribution
channel of the structure of banks. New partnerships and electronic commerce product
announcements have become a daily routine for financial services industry. The
momentum to move to Web-based business models is increasing and the traditional
distinction amongst the service providers is blurring (Sweeny & Lapp, 2004:276).
Singh (2004:187) supports this notion by stating that in South Africa business is being
revolutionised every day as a result of the influence of the Internet. He further
maintains that organisations have become leaner, meaner, more profitable and more
competitive. Some existing organisations have moved from brick-and-mortar format to
clicks-and-mortar format, whilst others have adopted a more conservative approach
and have both physical and virtual presence.
Bradley and Steward (2003:272) are of the opinion that the banking sector, which has
been characterised by its tried and tested processes of service delivery, is greatly
affected by the environmental change. The authors assert that competition is
escalating for both traditional players and new entrants because of deregulation,
changing consumer behaviour and needs, globalisation and Information Technology.
3
The financial sector is one of the business areas that has been most affected by the
spread of new technologies, particularly the Internet. These technologies have not
only had a bearing on the internal organizational processes, but have also had a
sizeable influence on the way in which financial institutions interrelate with their
customers (Flavian, Guinalίu & Torres, 2006:406). The Internet has been accepted as
a new addition to the traditional way of doing business. Banking organisations have
progressed a long way in the use of the Internet, with most banks offering transaction
services over the Internet (Sohail & Shaikh, 2008:58). O’Neill, Palmer and Wright
(2003:281) reckon that the winners in the online search market space will be those
who consistently provide compelling, user friendly and responsive online service
experiences. They further suggest that specific research on the identification of
attributes that work together to create effective online services experience is lacking.
1.1.3 Internet service quality
Sweeney and Lapp (2004:276) argue that following the proliferation of e-commerce
and the Internet there has been an increasing interest in the evaluation of Websites.
Ibrahim, Joseph, and Ibeh (2006:476), add that the challenging business environment
in the financial services market in the UK and beyond has also resulted in more
pressure on the banks to develop and utilise alternative channels with a view of
attracting more customers and improving customer perceptions. According to Ibrahim
et al. (2006:476) “not enough is known regarding how customers perceive and
evaluate electronically delivered services”. Service quality research has
overwhelmingly focused on customer expectations. The importance-performance
analysis (IPA) approach is built around customer perceived importance of quality
attributes and attributes of performance, the interplay of which suggests strategies for
service improvement and satisfaction management (Ibrahim et al., 2005:479).
Rowley (2006:339) is of the view that service experience associated with electronic
environments is very different from a service experience that is mediated through a
human service agent. Zeithaml (2002:135) defines electronic service quality (E-S-Q)
as an extent to which a Website facilitates efficient and effective shopping, purchasing
and delivery. Zeithaml’s (2002:135) research on electronic service quality indicates
that E-S-Q has seven dimensions that form two scales: a core E-S-Q scale and a
recovery scale. Four dimensions - efficiency, reliability, fulfilment and privacy form the
4
core E-S-Q scale that can be used to measure customer perceptions of service
quality. According to Zeithaml (2002:136) the other three dimensions become salient
when online customers run into problems. These three dimensions are
responsiveness, compensation and contact. These three dimensions were
conceptualised by the research as constituting E-S-Q recovery. Jun and Cai
(2001:276) identified seventeen dimensions under three categories of Internet
Banking service quality. These dimensions included:
• Customer service quality: reliability, responsiveness, competence, courtesy,
credibility, access, communication, understanding, collaboration and continuous
improvements
• Online system quality: content, accuracy, ease of use, timeliness, aesthetics, and
security.
• Banking service product quality: one dimension of product variety.
Broderick and Vachirapornpuk (2002:332) in their study on Internet Banking service
quality agreed that the management implication for their study arises in two areas:
firstly within the service interface and secondly, with the management of increased
customer role. From a service setting point of view they argued that at the outset
customers might use service setting cues more in judging service quality, because of
the lack of tangible cues that are available in Internet formats. Broderick and
Vachirapornuk (2003:333) further purport that one feature of customer interaction is
not confined to Internet transactions, but involves a lot of other interfaces. Customer
scripts also operate between the service setting and the service encounter, as when
customers seek to solve problems with service setting by contacting personnel. This
study will focus on assessing Internet Banking service quality dimensions. From the
set of identified dimensions the study will establish how the South African banks are
performing as perceived by their customers.
1.1.4 Internet Banking
Internet Banking, at a basic level, is defined as the setting up of a Web page by a
bank to give information about its products and services. At a more advanced level it
is defined as provisioning of facilities such as accessing accounts, funds transfer and
buying financial products or services online (Sathye, 1999:524). According to Sayar
5
and Wolfe (2007:123) the term Internet Banking is used to describe the case where
banks’ customers conduct banking transactions on the Internet. In the contemporary
context, this mainly implies the usage of computers, and digital TV’s for accessing
internet branches.
Internet Banking refers to a service offered by banks that allows account holders to
access their account data via the Internet. In order to take advantage of the Internet
Banking, an account holder would need to meet several technological requirements,
such as having a personal computer with Internet access and a web browser. If these
conditions are satisfied Internet Banking can be performed from anywhere in the
world. Thus, Internet Banking facilitates direct access to account details; enables
transfer of funds; allows for multiple bills payments, and performs an array of other
transactions (Sayar & Wolfe, 2007:124).
1.2 Problem statement:
The challenging business environment in the financial services market resulted in
more pressure on banks to develop and utilise alternative delivery channels, with a
view to attracting more customers and improving customer perceptions and
encouraging loyalty. Internet Banking is among the channels that were developed and
implemented. Banks have invested heavily in introducing and making Internet
Banking service functionality rich, with an objective of improving customer satisfaction
and loyalty, ultimately contributing positively to income and profits.
The challenge for teams of software designers, marketers and experts in human-
computer interaction, (amongst others), is to create a business model that not only
increases productivity and enhances bottom line performance, but one that also seeks
to add value for customers, employees and suppliers alike (O’Neill et al., 2003:293).
Research Problem:
Management in South African banks, do not have an insight into how their customers
perceive and evaluate Internet Banking service quality.
6
1.3 Objective / purpose
This study aims to explore customers’ perceptions on Internet Banking service quality
dimensions or factors. This will be done with the following objectives in mind:
• Have an insight into how Internet Banking customers in South Africa perceive and
evaluate their respective banks’ performance on pre-defined Internet Banking
service quality dimensions.
• Determine if there are any differences in perceptions of Internet Banking service
quality based on gender, age or primary bank.
1.4 A brief outline of the research methodology
1.4.1 The research methodology
The survey method was used to collect primary data for this study. Electronic
interactive media was employed, as respondents were contacted via e-mail and
directed via a URL to take a self-administered questionnaire online. Zikmund
(2003:198) defines electronic interactive media as “a communication media that
allows an organization and the audience to interact using digital technology”. This
method was chosen as it was inexpensive and could reach a wide sample of the
survey population with ease.
1.4.2 The research population
The survey population was a sample of customers that do banking online with any of
the South African banks.
1.4.3 The sampling method
Convenience sampling was used to sample the population. This was a non-probability
sampling design
1.4.4 Data Collection
Data was collected using an Internet survey. The survey was a self-administered
questionnaire posted on a web-site. This made it possible to reach a large number of
respondents and secure confidential answers quickly and cost-effectively.
7
Respondents were invited by e-mail to participate in the survey. This ensured that the
respondents’ feedback was captured at the time when the responses were submitted.
1.5 An outline of the remainder of the dissertation
Chapter one: Introduction
This chapter provides a background to the study, in which the environment within
which the research is undertaken is described. Concepts such as Internet Banking
and service quality are introduced. The problem statement, which flows from the
background, is also stated in this chapter. The objective(s) of the research in
addressing the research problem are then identified
Chapter 2: Literature review
The chapter reviews related literature on Internet Banking. The literature offers
guidance to the tentative solutions to the problem. It addresses concepts such as
traditional services, electronic services, online system quality, Internet Banking
services and instruments like SERVQUAL and E-S-Q for quality of service
measurements.
Chapter 3: Research Methodology
This chapter will explain the research design chosen and the rationale behind such a
choice. It will focus on the research population, the sampling techniques to be used
and the sample size. It will further elaborate on the research instruments used and
data collection and analysis including validity and reliability of the research instrument.
Chapter 4: Presentation of research results
The chapter will focus on providing the main findings of the study, the insights gained
in relation to the research objectives.
Chapter 5: Interpretation of research results
The chapter will analyse and interpret research results and link them to the reviewed
literature. The chapter will conclude by giving a statement on limitations of the study.
8
Chapter 6: Conclusions and recommendations
The chapter will give a summary of the research objectives and major findings.
Recommendations and suggestions for further research will also be outlined in this
chapter.
1.6 Conclusion
Chapter one served as an introduction to the study, outlining the problem statement,
the research objectives and the research methodology were discussed. In chapter two
a review of the related literature will be done. The review will include an explanation of
what service quality, service and electronic service are. The chapter will undertake to
offer insights into service quality dimensions. The other concepts to be discussed
include SERVQUAL and E-S-Q as instruments used to measure traditional service
quality and electronic service quality respectively.
9
Chapter TWO
LITERATURE REVIEW
2.1 Introduction.
O’Sullivan, Edmond and ter Hofstede (2002:3) define a service in its simplest form, as
an action which involves transferring value, performed by one entity on behalf of the
other. According to Zeithaml, Bitner and Gremler (2006:6) the broad definition of
service implies intangibility as a key determinant of whether an offering is a service or
not. The International Organization for Standardization (ISO) describes a service as
part of the total production concept. A service is generated by a process and the
customer outcome is created in this process. In the case of a service as compared to
a product the customer is present and affects the results in terms of added value and
quality (Edvardsson, 1998:142).
Service quality can be viewed in a structured and integrated way called the GAPS
model of service quality. Zeithaml, Bitner and Gremler (2006:33) depict the GAPS
model as consisting of the customer and provider gaps. The customer gap is the
difference between the customer expectations and perceptions. To close the all
important gaps, the GAPS model suggests that the other four gaps, referred to as
provider gaps, need to be closed. According to Zeithaml et al., (2006:34) the gaps
occurring within the organization providing the service include:
• Gap1 is about not knowing what customers want.
• Gap2 refers to not selecting the right service designs and standards.
• Gap3 refers to not delivering to service designs and standards.
• Gap4 is about not matching performance to promise
The literature review will look into the definition of traditional service, service quality,
banking service quality and service quality measurements. This will then lead to a
discussion on electronic service, service quality and electronic service measurements.
The majority of definitions for electronic service use the Internet and/ or workflows as
a conduit to new revenue or task completion. Web services have also been described
as an aggregation of functionality with a single façade and published for the purpose
of use (O’Sullivan et al. 2002:3). To conclude the literature review an important
10
discussion on online systems will be undertaken. Internet Banking service will be
defined and its characteristics outlined.
2.2 Traditional Services
2.2.1 Definition and characteristics of services
Zeithaml et al. (2006:4) simply describe services as deeds, processes and
performances, whilst Baron and Harris (2003:4) concur that services are processes
that occur over time. There are three fundamental aspects of service: process,
people, and physical evidence. Compatible to the simple definition is that services
include all economic activities whose output is not a physical product and is
consumed at the time it is rendered. In the broad definition of service, intangibility is
the key determinant of whether an offering is, or is not a service (Baron & Harris,
2003:5). According to Zeithaml and Bitner (1996:5) while the statement on
intangibility being the key determinant of service is true, it is also true that few are
purely intangible or totally tangible. Services tend to be more intangible than
manufactured products. The latter products tend to be more tangible than services.
Bateson and Hoffman (1999:9) agree that it is difficult to define a pure good product
or service. A pure service assumes that there is no “goods” element to the service that
the customer receives. In reality most services contain some “goods” element in them
(Bateson & Hoffman, 1999:9). Zeithaml et al. (2006:21) summarises the
characteristics of services that distinguish it from products as intangibility,
heterogeneity, simultaneous production and consumption as well as perishability.
• Intangibility
The distinguishing characteristic of services is intangibility because services are
performances or actions rather than objects, they cannot be seen, felt, tasted or
touched in the same manner one can touch and feel physical goods (Zeithaml et al.
2006:22). Baron et al. (2003:19) indicate that the intangibility of services often
increases the risk for the purchaser. Some services are perceived to be riskier than
others depending on whether they are high in search, experience, and credence
factors. Baron and Harris (2003:19) describe these factors as:
o A service that is high in search factors is the one about which customers
can get some (prior) information as to what they will receive.
o A service that is high in experience factors is one that customers must try
out (experience) before they can decide whether or not it is a great deal.

11
o A service that is high in credence factors is one that is difficult to evaluate
even after experiencing it.
• Heterogeneity
No two services will precisely be alike because they are performances frequently
rendered by humans (Zeithaml et al., 2006:22). Baron and Harris (2003:20) say
organisations providing services know that no two service provisions are exactly the
same, whatever the attempts to standardise them. The quality of any service will vary
when offered by different employees, probably at different times of the day.
• Simultaneous rendering and consumption
To receive the benefit of the service, the consumer must be part of the system. It thus
becomes impossible to store a service (Bateson & Hoffman, 1999:12). This situation
of simultaneous rendering and consumption means that the consumer is present while
the service is being rendered and thus views and may even take part in the rendering
process. In simultaneously rendering and consumption of service, customers will
interact with one another during the service rendering process and thus may affect
one another’s experiences (Zeithaml et al., 2006:23). Baron and Harris (2003:20) refer
to this characteristic of service as inseparability.
• Perishability
According to Zeithaml et al. (2006:23) perishability refers to the fact that services
cannot be saved, stored resold or returned.
2.2.2 Traditional service quality
Imrie, Cadogan and McNaughton (2002:10) describe service quality as an antecedent
of consumer assessment of value. Examples of behaviours motivated by favourable
service quality assessment are re-purchase intentions, loyalty and word of mouth.
Kang and James (2004:267) point out that the construct of service quality as
conceptualised in the services marketing literature centres on perceived quality,
defined as a consumer’s judgement about an entity’s overall excellence. Kang and
James (2004:268) further suggest that the “perceived service quality model” replaces
the product features of a physical product in the consumption of services. The
technical aspect (what service is provided) and the functional aspect (how the service
is provided) are the two dimensions that Kang and James (2004: 268) identified.

12
Santos (2003:234) argue that there are two main conceptualisations of service quality
that exist – one based on disconfirmation approach, and the other based on the
performance-only approach. Oliver (1980:461) points out that expectations are
thought to create a frame of reference about which one makes a comparative
judgement. This means that outcomes poorer than expected (negative
disconfirmation) are rated below this reference point, whereas those better than
expected (a positive disconfirmation) are rated above the base. Service quality was
therefore understood to be a measure of how well the service level delivered matched
customer expectations.
Bateson and Hoffman (1999:340) argue that the two concepts of customer satisfaction
and service quality are intertwined. One plausible explanation is that satisfaction
assists customers in revising service quality perceptions. Bateson and Hoffman
(1999:340) describe the logic for this position as follows:
• Consumer perception of the service quality of a firm with which no prior
experience exists is based on the consumer’s expectations.
• Subsequent encounters with the service firm lead the consumer through the
disconfirmation process and further revise the perceptions of service quality.
• Each additional encounter with the service firm further revises or reinforces
service quality perceptions.
• Revised service quality perceptions modify future consumer purchase
intentions towards the service firm.
Baron and Harris (2003:136) describe perceived service quality as the degree and
direction of the gap between consumer perceptions and expectations of service. In
the GAPS model as described by Zeithaml et al. (2006:46) this refers to the customer
gap 5 - the gap between the expected service and the perceived service. Baron and
Harris (2003:136) further describe consumer satisfaction as a function of the
similarities between the consumers’ expectations and the perceived performance of
the purchaser.
13
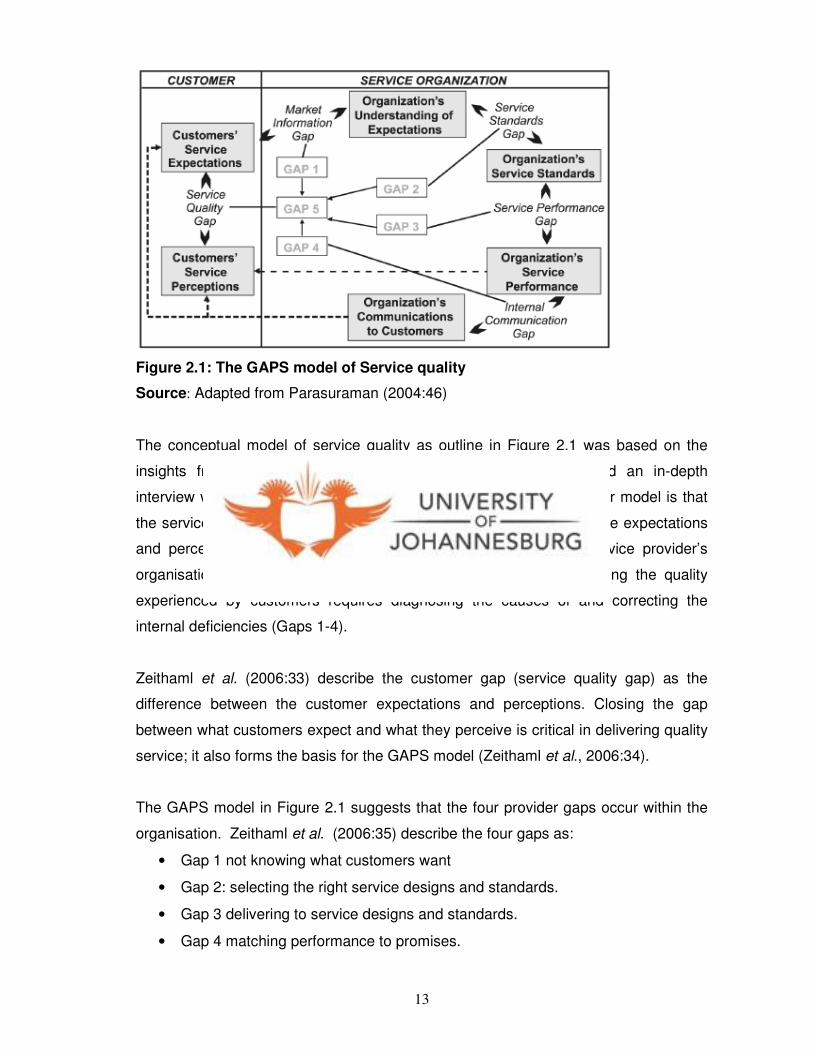
Figure 2.1: The GAPS model of Service quality
Source: Adapted from Parasuraman (2004:46)
The conceptual model of service quality as outline in Figure 2.1 was based on the
insights from extensive focus group research with customers and an in-depth
interview with executives in various sectors. The primary thesis of their model is that
the service quality shortfall Gap 5 (the gap between customers’ service expectations
and perceptions) is a result of a series of shortfalls within the service provider’s
organisation (Parasuraman, 2004:45). This then means that improving the quality
experienced by customers requires diagnosing the causes of and correcting the
internal deficiencies (Gaps 1-4).
Zeithaml et al. (2006:33) describe the customer gap (service quality gap) as the
difference between the customer expectations and perceptions. Closing the gap
between what customers expect and what they perceive is critical in delivering quality
service; it also forms the basis for the GAPS model (Zeithaml et al., 2006:34).
The GAPS model in Figure 2.1 suggests that the four provider gaps occur within the
organisation. Zeithaml et al. (2006:35) describe the four gaps as:
• Gap 1 not knowing what customers want
• Gap 2: selecting the right service designs and standards.
• Gap 3 delivering to service designs and standards.
• Gap 4 matching performance to promises.
14
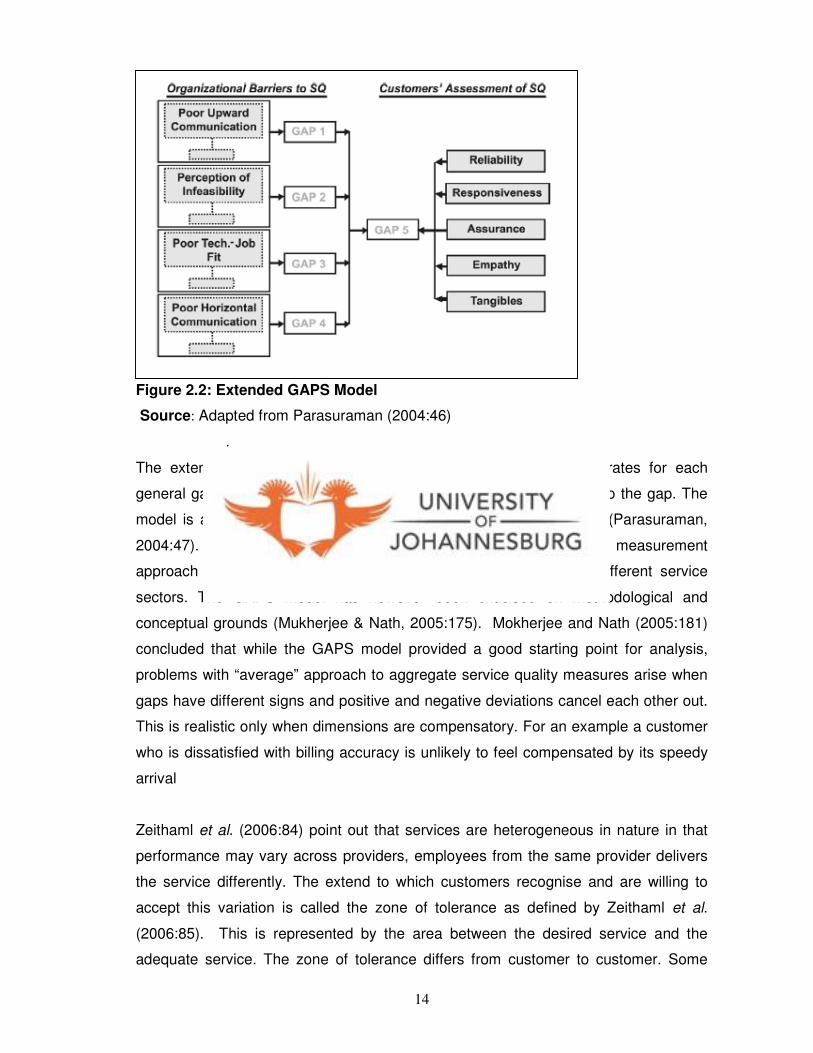
Figure 2.2: Extended GAPS Model
Source: Adapted from Parasuraman (2004:46)
.
The extended Gaps model as shown in Figure 2.2 above enumerates for each
general gap a list of organisational deficiencies that could contribute to the gap. The
model is a useful starting point for diagnosing and closing the gaps (Parasuraman,
2004:47). The GAPS model has emerged as the most popular measurement
approach of service quality and has been extensively applied in different service
sectors. The GAPS model has however been criticised on methodological and
conceptual grounds (Mukherjee & Nath, 2005:175). Mokherjee and Nath (2005:181)
concluded that while the GAPS model provided a good starting point for analysis,
problems with “average” approach to aggregate service quality measures arise when
gaps have different signs and positive and negative deviations cancel each other out.
This is realistic only when dimensions are compensatory. For an example a customer
who is dissatisfied with billing accuracy is unlikely to feel compensated by its speedy
arrival
Zeithaml et al. (2006:84) point out that services are heterogeneous in nature in that
performance may vary across providers, employees from the same provider delivers
the service differently. The extend to which customers recognise and are willing to
accept this variation is called the zone of tolerance as defined by Zeithaml et al.
(2006:85). This is represented by the area between the desired service and the
adequate service. The zone of tolerance differs from customer to customer. Some
15
customers have narrow zones of tolerance, requiring a tighter range of service from
providers and others have a greater range of service (Zeithaml et al., 2006:86).
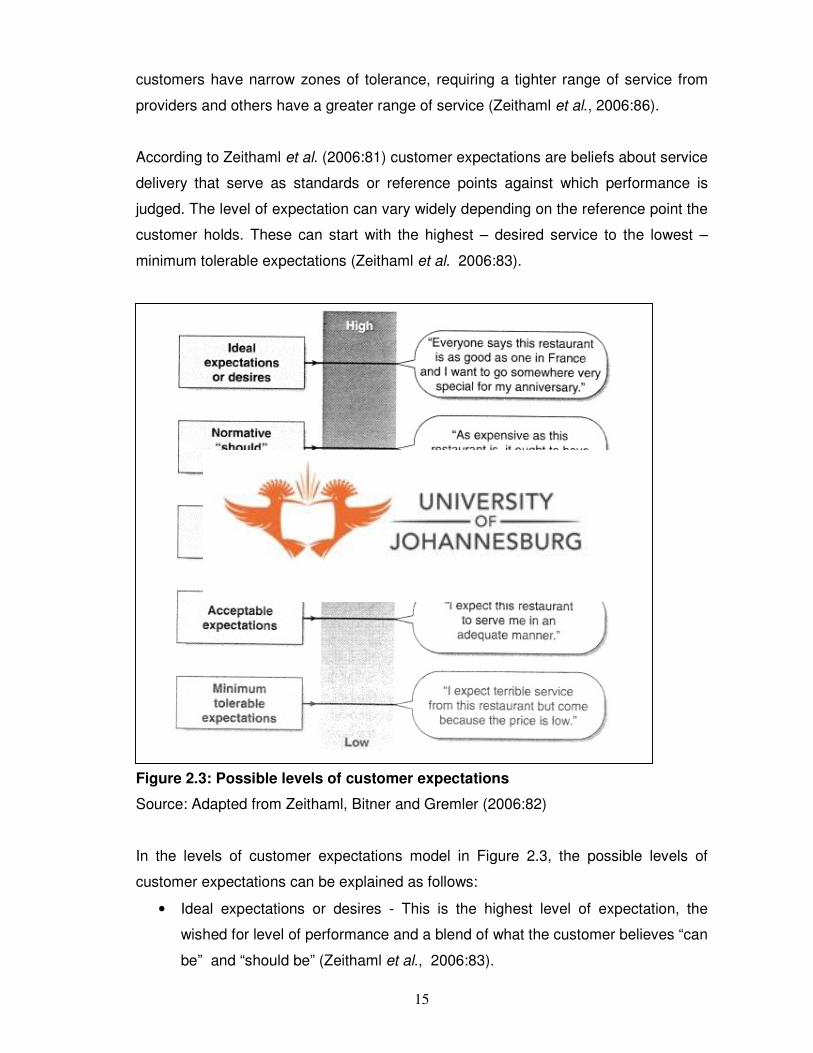
According to Zeithaml et al. (2006:81) customer expectations are beliefs about service
delivery that serve as standards or reference points against which performance is
judged. The level of expectation can vary widely depending on the reference point the
customer holds. These can start with the highest – desired service to the lowest –
minimum tolerable expectations (Zeithaml et al. 2006:83).
Figure 2.3: Possible levels of customer expectations
Source: Adapted from Zeithaml, Bitner and Gremler (2006:82)
In the levels of customer expectations model in Figure 2.3, the possible levels of
customer expectations can be explained as follows:
• Ideal expectations or desires - This is the highest level of expectation, the
wished for level of performance and a blend of what the customer believes “can
be” and “should be” (Zeithaml et al., 2006:83).

16
• Normative (“Should”) expectation: an example of this expectation would be: as
expensive as this restaurant is, it ought to have excellent food for service.
• Experience-based norms: this refers to an expectation based on past
experience. For example, “In most cases this restaurant is very good, but when
it gets busy the service is slow”.
• Acceptable expectation: an example of an acceptable expectation would be: “I
expect this restaurant to serve me in an adequate manner”.
• Minimum tolerable expectation: This is the extreme side of the desired service
as it relates to the bottom level of performance acceptable to the customer
(Zeithaml et al., 2006:83).
2.2.3 SERVQUAL
SERVQUAL is a multidimensional scale used to capture customer perceptions and
expectations of service quality. The SERVQUAL scale was first published in 1988 and
has undergone numerous improvements and revisions since then. The scale currently
contains twenty one perception items that are distributed across five service quality
dimensions (Zeithaml et al., 2006:154). Parasuraman (2004:46) indicates that building
on key insights from qualitative research, the research team launched a series of
empirical studies to develop, test and refine a scale for measuring service quality as
perceived by customers. These qualitative studies gave birth to SERVQUAL, a five
dimensional, two part instrument. The first and the second parts measure customer
expectations and perceptions respectively along a variety of service attributes
grouped into five dimensions of reliability, responsiveness, assurance, empathy and
tangibles. The SERVQUAL instrument, though very valuable, is believed to be just
one approach for assessing service quality (Parasuraman, 2004:48).
One criticism of SERVQUAL has been the point that the instrument mainly focuses on
the service delivery process (Kang & James, 2004:266). The other criticism by
Oppewal and Vriens (2000:154) is that SERVQUAL does not provide good measures
of the importance of service attributes and dimensions. SERVQUAL grounded in the
GAPS model, measures service quality as the calculated difference between
customer expectations and the performance perceptions of a service encounter.
Cronin and Taylor (1992:56) challenged this approach and developed the SERVPERF
scale which directly captures customers’ performance perceptions in comparison to
17
their expectations of service encounter. A qualitative method of measuring service
quality includes techniques such as interviews, focus groups, customer role-play and
observation. These provide insight into the mindset of customers and are highly
subjective. Quantitative surveys can be administered either face-to-face or customers
may be left to do these on their own. The confirmation-disconfirmation paradigm has
been extensively incorporated into surveys (O’Neill et al., 2003:283). O’Neill et al.
(2003:284) further suggest that as consumers evaluate the levels of the service’s
performance, they typically cannot help but compare that performance to what they
expected. In turn, these expectations provide a baseline for the assessment of a
customer level satisfaction.
2.2.4 Traditional banking service quality
Using the critical incident technique Johnston (1995:65) made the following
conclusions in his study on the determinants of service quality satisfiers and
dissatisfiers amongst bank customers:
• Some determinants of quality predominate over others.
• For the personal customer of the bank, the main sources of satisfaction are
attentiveness, responsiveness, care and friendliness. The main sources of
dissatisfaction are integrity, reliability, responsiveness, availability and
functionality.
• The sources of dissatisfaction are not necessarily the obverse of sources of
satisfaction.
• The intangible aspects of the staff-customer interface have significant effects,
both negative and positive, on service quality.
• Responsiveness is the crucial determinant of quality, as it is the key component
in providing satisfaction and the lack of it is a major source of dissatisfaction.
• Reliability is predominantly a source of dissatisfaction not satisfaction.
Johnston (1995:62) in his study used eighteen service quality attributes:
attentiveness, responsiveness, care, availability, integrity, friendliness, courtesy,
communications, competence, functionality, commitment, access, flexibility,
aesthetics, cleanliness, comfort and security.

18
Bahia and Natel (2000:86) used an alternative measure on service quality by
proposing seven dimensions of which some were covered by the SERVQUAL scale.
These included effectiveness and assurance, access, price, tangibles, place, service
portfolio and reliability. Oppewal and Vriens (2004:158) used twenty eight attributes
including four service quality dimensions to evaluate service quality. The four
dimensions included accessibility, competence, accuracy and tangibles.
2.3 Electronic Services (e- Services)
2.3.1 Definition and characteristics of e-Services
Buckley (2003:455) defines e-Service as the electronic provision of a service to
customers whilst Santos (2003:234) describes e-Service as the provision of
consumers with a superior experience with respect to the interactive flow of
information. Rowley (2006:341) on the other hand brings in a different perspective of
e-Service by defining it as deeds, efforts or performances whose delivery is mediated
by information technology (including the Web, information kiosks and mobile devices)
and such includes the service element of e-tailing, customer support , service and
service delivery. In e-Service the customer’s interaction or contact with the
organisation is through the technology, such as Websites. e-Service encounter is the
initial landing on the home page until the requested service has been completed or
the final product has been delivered and is fit for use (Bucley, 2003:456). During an e-
Service encounter, customers have to rely on only two senses, that of sight and
sound, whereas the traditional service experience can use all senses. e-Service is
described as a relative impoverished experience, due to the absence of face to face
interaction, which is seen as central to relationships development (Rowley 2006:341).
From all the definitions of e-Service discussed the following characteristics standout:
• There is an interactive flow of information between the customer and the
service provider.
• This customer interaction is mediated through some kind of information
technology.
• The service is a virtual one and there is no face-to-face interaction.
• Customers have to rely on only two senses that of sight and sound during the
interaction.
19
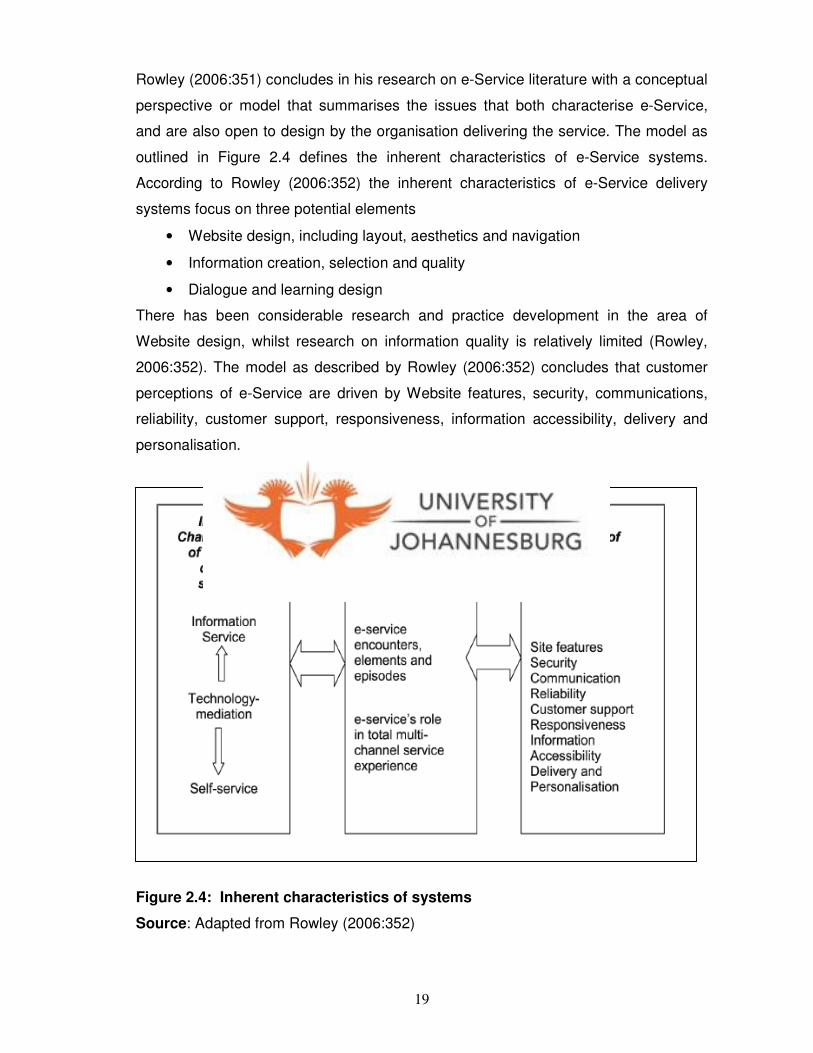
Rowley (2006:351) concludes in his research on e-Service literature with a conceptual
perspective or model that summarises the issues that both characterise e-Service,
and are also open to design by the organisation delivering the service. The model as
outlined in Figure 2.4 defines the inherent characteristics of e-Service systems.
According to Rowley (2006:352) the inherent characteristics of e-Service delivery
systems focus on three potential elements
• Website design, including layout, aesthetics and navigation
• Information creation, selection and quality
• Dialogue and learning design
There has been considerable research and practice development in the area of
Website design, whilst research on information quality is relatively limited (Rowley,
2006:352). The model as described by Rowley (2006:352) concludes that customer
perceptions of e-Service are driven by Website features, security, communications,
reliability, customer support, responsiveness, information accessibility, delivery and
personalisation.
Figure 2.4: Inherent characteristics of systems
Source: Adapted from Rowley (2006:352)
20
The first box in Figure 2.4 summarizes the issues that both characterise e-Service and
are also open to design by the organisation delivering the service. The second box
includes differentiating factors. This means that one service system and experience
are different from the next in terms of scope and nature. The third box is concerned
with the customers’ perceptions of the experience of e-Service and derives from work
on e-Service quality dimensions. It summarizes and identifies some of the dimensions
that customers use in their evaluation of e-Service experiences (Rowley, 2006:352).
2.3.2 Electronic Service quality
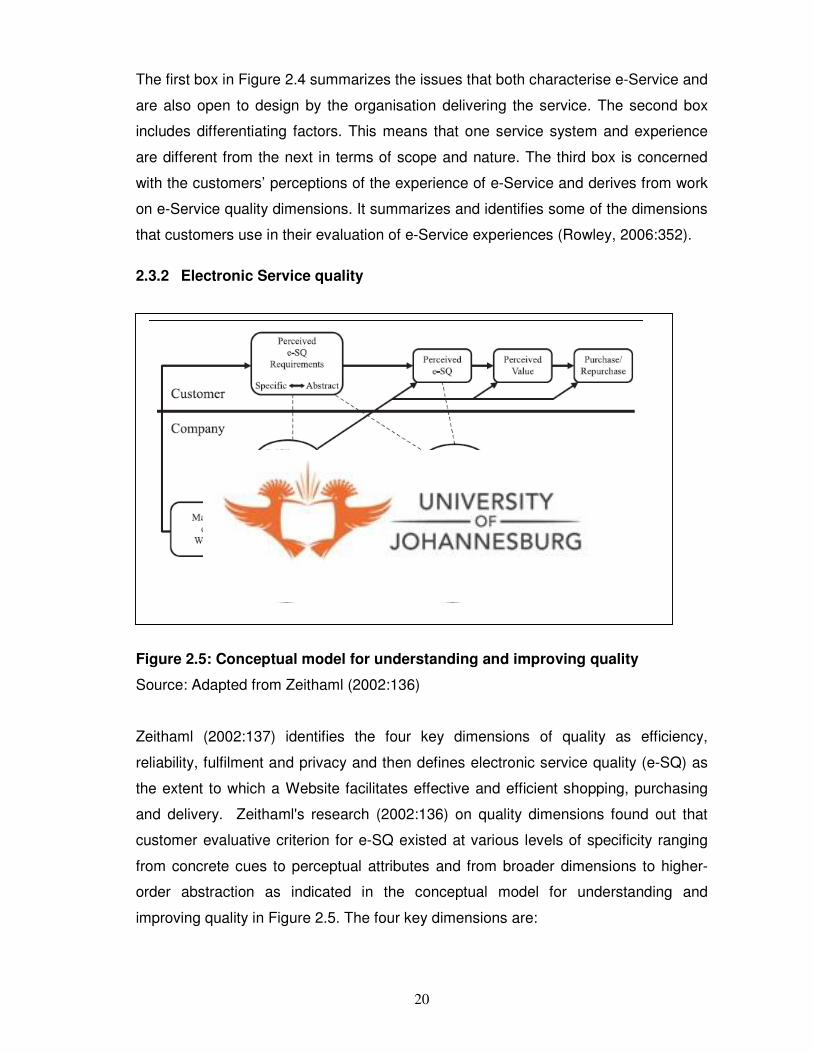
Figure 2.5: Conceptual model for understanding and improving quality
Source: Adapted from Zeithaml (2002:136)
Zeithaml (2002:137) identifies the four key dimensions of quality as efficiency,
reliability, fulfilment and privacy and then defines electronic service quality (e-SQ) as
the extent to which a Website facilitates effective and efficient shopping, purchasing
and delivery. Zeithaml's research (2002:136) on quality dimensions found out that
customer evaluative criterion for e-SQ existed at various levels of specificity ranging
from concrete cues to perceptual attributes and from broader dimensions to higher-
order abstraction as indicated in the conceptual model for understanding and
improving quality in Figure 2.5. The four key dimensions are:
21
1. Efficiency – refers to the ability of customers to get to the Website, find their
desired product and information associated with it and check-out with minimal
effort.
2. Fulfilment incorporates accuracy of service promises, having products in stock
and delivering the products in the promised time.
3. Reliability is associated with the technical functioning of the site, particularly the
extent to which it is available and functioning properly.
4. The privacy dimension includes assurances that shopping behaviour and
information is secured.
The recovery-SQ scale includes the personal service aspects:
1. Responsiveness measures the ability of a company to provide appropriate
information to customers when a problem occurs, have mechanisms for
handling returns and providing online guarantees.
2. Compensation is the dimension that involves receiving money back.
3. Contact points. So that customers should be able to speak to a live service
agent in times of problems.
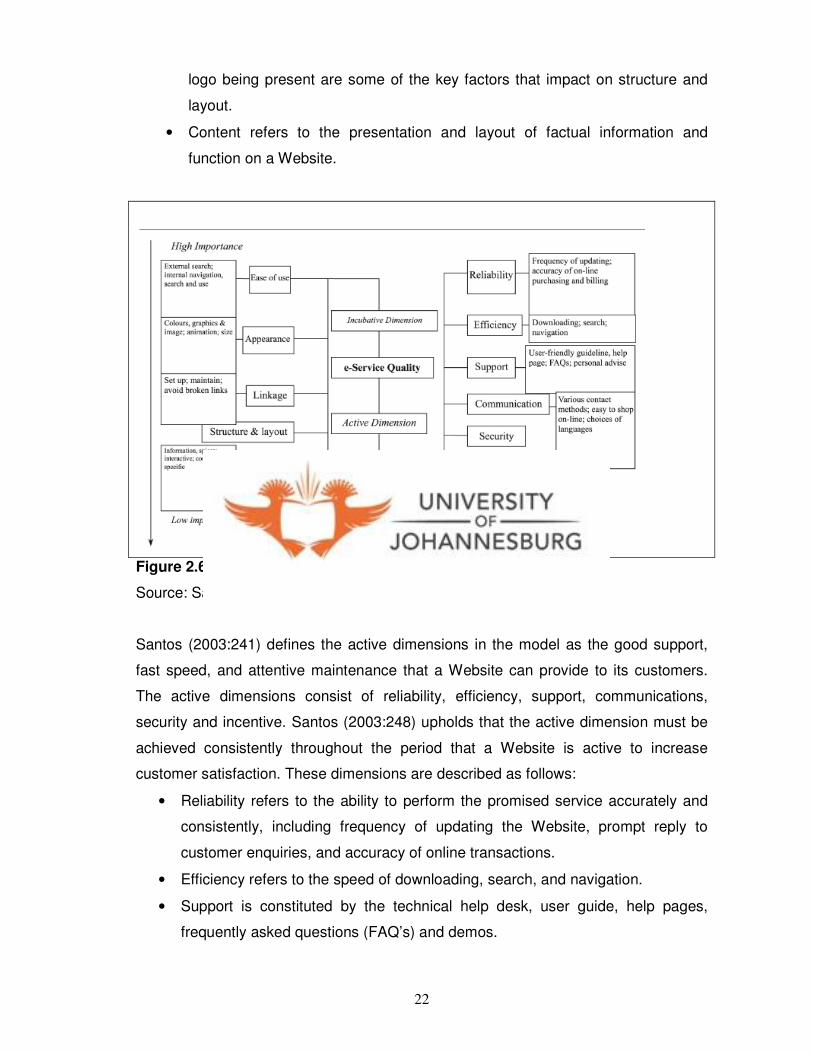
According to Santos (2003:238) there are two dimensions that determine e-Service
quality, the incubative and active dimensions as indicated in the model of e-Service in
Figure 2.6. The incubative dimension lists the determinants of a Website daily hit rate
and the time length any visitor stays on the Website as ease of use, appearance,
linkages, content and layout. Santos (2003:239) defines these determinants as
follows:
• Ease of use is defined as how easy the Website is for customers to conduct
external search in cyberspace and internal navigation and search within the
Website.
• Appearance is defined by Santos (2003:239) as the proper use of colour,
graphics, images and animations, together with the appropriate size of the
Web pages. Appearance is usually the first thing observed by Web users.
• Linkages refer to the number and quality of links that a Website offers.
• Structure and layout refers to the organisation and presentation of a Website’s
content and information. This structure is characterised by simplicity clarity,
consistent layout, good use of frame, provision of a site map that allows users
to skip sections that are of no interest, a clear listed menu, and the company
22
logo being present are some of the key factors that impact on structure and
layout.
• Content refers to the presentation and layout of factual information and
function on a Website.
Figure 2.6: A model of e-Service quality
Source: Santos (2003:239)
Santos (2003:241) defines the active dimensions in the model as the good support,
fast speed, and attentive maintenance that a Website can provide to its customers.
The active dimensions consist of reliability, efficiency, support, communications,
security and incentive. Santos (2003:248) upholds that the active dimension must be
achieved consistently throughout the period that a Website is active to increase
customer satisfaction. These dimensions are described as follows:
• Reliability refers to the ability to perform the promised service accurately and
consistently, including frequency of updating the Website, prompt reply to
customer enquiries, and accuracy of online transactions.
• Efficiency refers to the speed of downloading, search, and navigation.
• Support is constituted by the technical help desk, user guide, help pages,
frequently asked questions (FAQ’s) and demos.

23
• Communications is defined as keeping the customers properly informed and
communicating with them in a language they can understand. Communications
in e-Service consists of online communications (e-mails and chat rooms) and
traditional communications methods (telephone, fax and postal mail.
• Security refers to the freedom from danger, risk, or doubt (including financial
insecurity) during the service process.
• Incentive is the encouragement given by Web providers to consumers to
browse and use the Website.
2.3.3 Understanding and measuring e-Service quality
Parasuraman, Zeithaml and Malhorta (2005:230) on their research on electronic
service quality (E-S-Q) a multiple item scale for assessing electronic service quality
came up with the five managerial implications:
• Efficiency and fulfilment were the most critical and important facets of the
Website service quality. Of the four E-S-Q dimensions, customers’
assessments of a Website on these two dimensions had the strongest
influence not only on the overall quality perceptions but also on perceived value
and loyalty intentions.
• The systems availability facet of the Websites was also critical contributor to
customers’ perceptions of overall quality, value and loyalty intentions.
• Privacy was the least critical of the four E-S-Q dimensions
• The three service recovery dimensions (responsiveness, compensation, and
contact) and the perceptual attributes they contain imply service aspects that
mirror aspects of traditional service quality (ready access to company
personnel, solving customers’ problems)
• The E-S-QUAL and electronic recovery of service quality ( E-RecS-Q) are
generic scales, intended for obtaining a global (as opposed to transaction-
specific) assessment of a Website service quality.
The dimensions on which customers assess electronic service quality (e-SQ) are:
access, ease of navigation, efficiency, customization/personalization, security/
privacy, responsiveness, assurance/ trust, price knowledge, aesthetics, reliability,
flexibility and efficiency. Each of the mentioned general dimensions has a number of
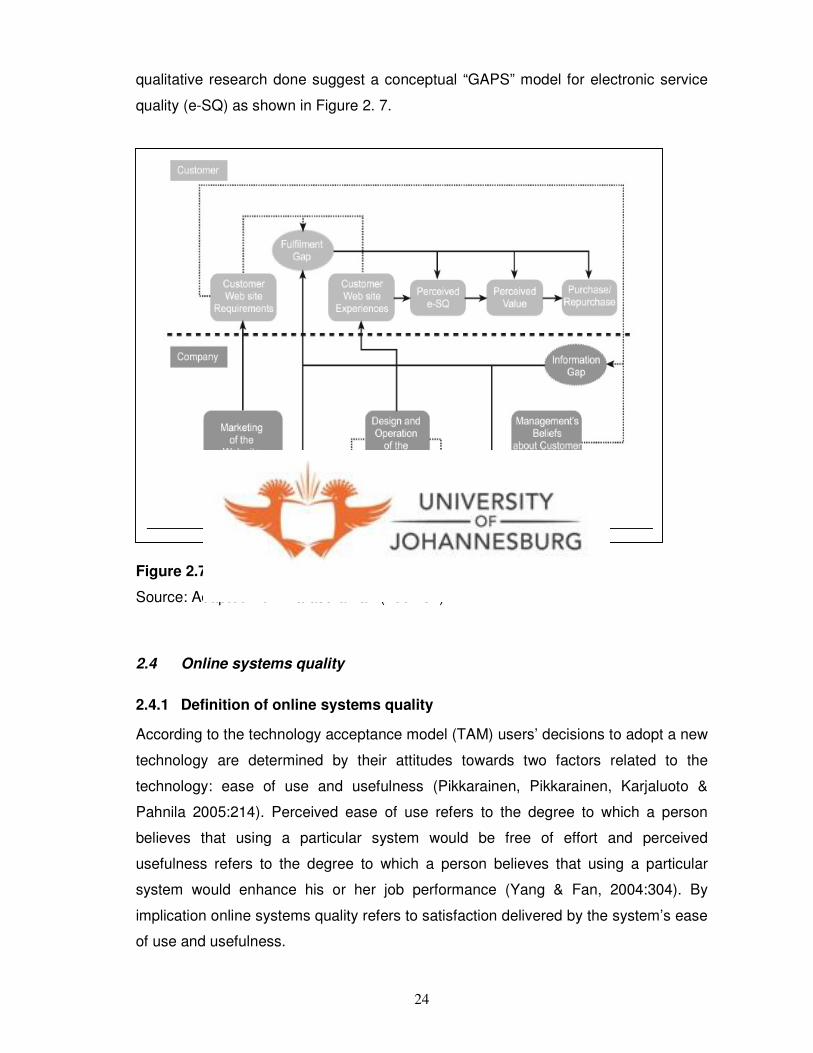
specific attributes (Parasuraman, 2004:50). Parasuraman (2004:50) adds that the
24
qualitative research done suggest a conceptual “GAPS” model for electronic service
quality (e-SQ) as shown in Figure 2. 7.
Figure 2.7: Conceptual GAPS model for E-S-Q
Source: Adapted from Parasuraman (2004:51)
2.4 Online systems quality
2.4.1 Definition of online systems quality
According to the technology acceptance model (TAM) users’ decisions to adopt a new
technology are determined by their attitudes towards two factors related to the
technology: ease of use and usefulness (Pikkarainen, Pikkarainen, Karjaluoto &
Pahnila 2005:214). Perceived ease of use refers to the degree to which a person
believes that using a particular system would be free of effort and perceived
usefulness refers to the degree to which a person believes that using a particular
system would enhance his or her job performance (Yang & Fan, 2004:304). By
implication online systems quality refers to satisfaction delivered by the system’s ease
of use and usefulness.
25
2.4.2 Characteristics of online systems quality
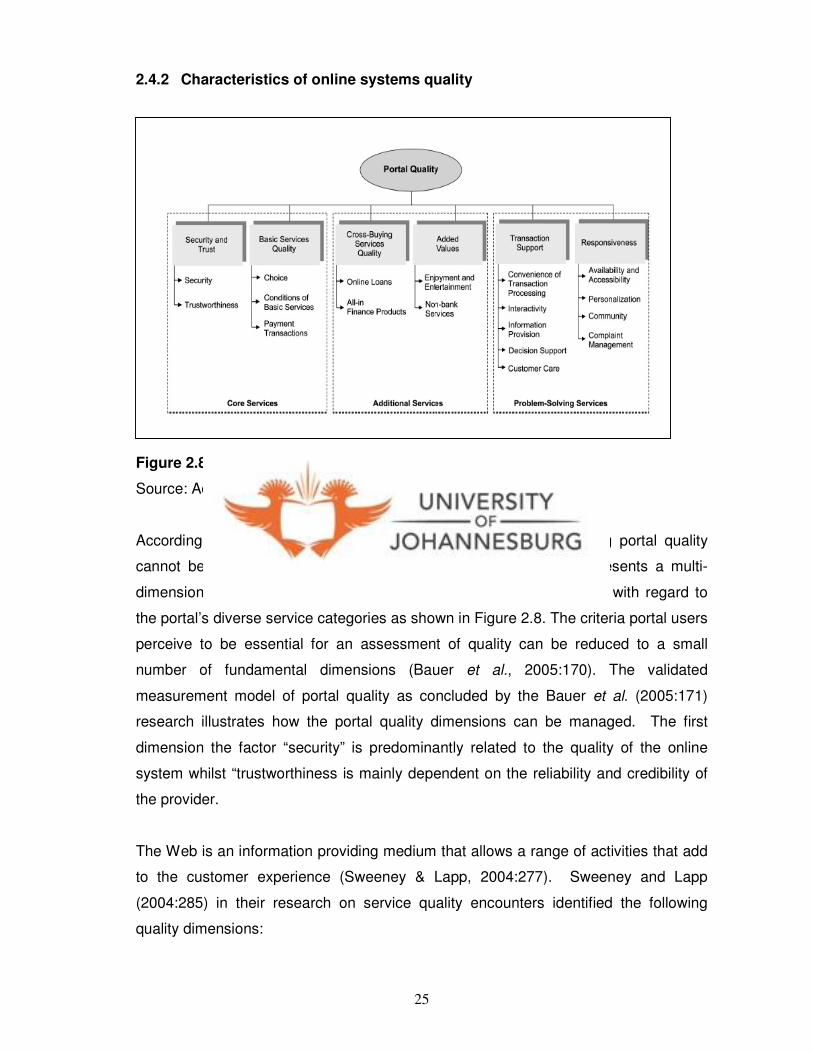
Figure 2.8: Website portal quality
Source: Adapted from Zeithaml et al. (2006:83)
According to Bauer, Hammerschmidt and Falk (2005:172) e-banking portal quality
cannot be described as a one dimensional customer rating. It represents a multi-
dimensional construct that is composed of partial quality judgements with regard to
the portal’s diverse service categories as shown in Figure 2.8. The criteria portal users
perceive to be essential for an assessment of quality can be reduced to a small
number of fundamental dimensions (Bauer et al., 2005:170). The validated
measurement model of portal quality as concluded by the Bauer et al. (2005:171)
research illustrates how the portal quality dimensions can be managed. The first
dimension the factor “security” is predominantly related to the quality of the online
system whilst “trustworthiness is mainly dependent on the reliability and credibility of
the provider.
The Web is an information providing medium that allows a range of activities that add
to the customer experience (Sweeney & Lapp, 2004:277). Sweeney and Lapp
(2004:285) in their research on service quality encounters identified the following
quality dimensions:
26
1. Ease of use which deal with the following factors:
• Instructions and explanations on the web
• Structural design
• Navigational systems
2. Content
• Depth of content
• Correctness and accuracy of the content
• Presentation appropriateness
3. Process
• Control of the process
• Speed
The empirical results from the Bauer et al. research (2005:172) support the
understanding of portals as integral solutions representing a bundle of various
services and functions. Based on this research, aspects such as depth of service
range and possibility of opening accounts online or call back buttons and prompt
responses to questions, are important drivers leveraging overall service quality in an
effective manner.
2.4.3 Measuring online systems quality
Yang and Fang (2004:305) hold that: “since consumers’ use of Internet-based
services can be viewed as similar to the adoption of new technology, ease of use and
usefulness are important factors in evaluating online service quality.” Dimensions of
online service quality such as information content, customization, reliability, and
response also have significant effects on perceived ease of use and perceived
usefulness, which in turn influences the attitude towards using the portal site,
behavioural intention to reuse portal sites and actual portal site use (Yang & Fang,
2004:305).

27
Table 2.1: The WebQual 4.0 Instrument
Source: Adapted from Barnes and Vidgen (2003:299)
According to Barnes and Vidgen (2003:298) WebQual is based on quality function
deployment (QFD) which is a structured process that provides a means to identify and
carry the voice of the customer through each stage of the product or service
development. The standard WebQual 4.0 instrument in Table 2.1 consists of 23
questions with usability, information quality and service interaction as the main
categories.
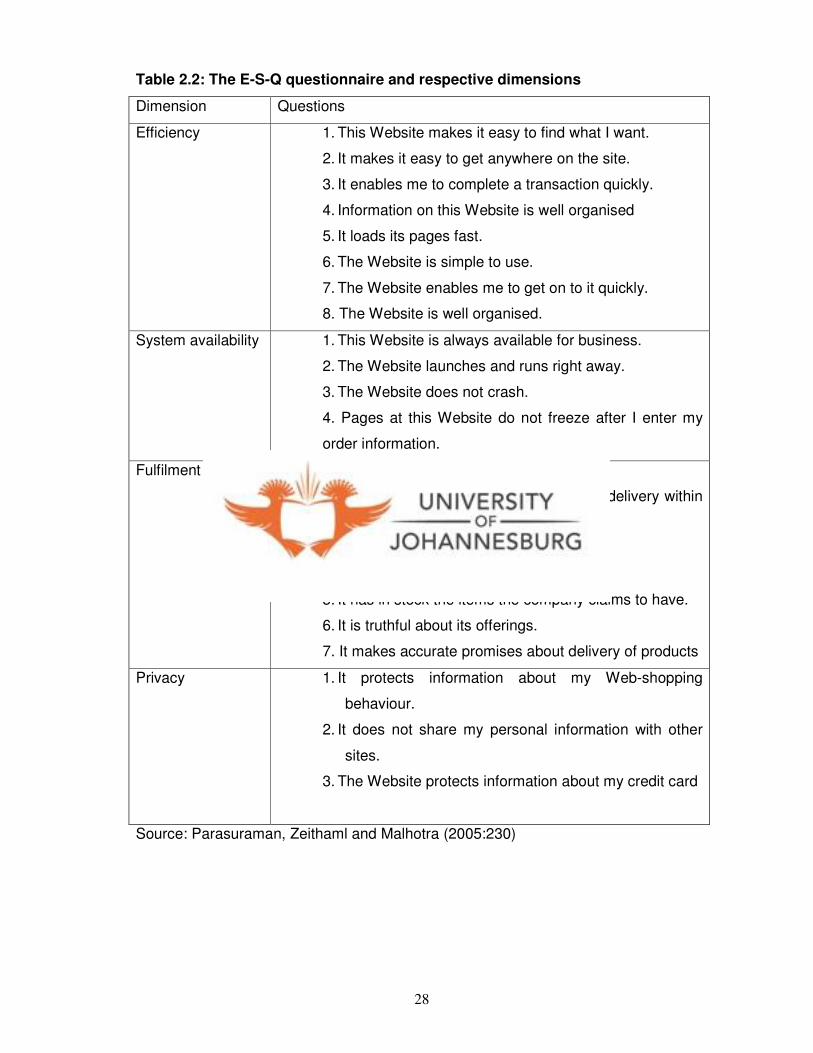
The original electronic service quality (E-S-Q) scale was used to measure Website
service quality. The Table 2.2 below represents the original E-S-Q scale dimensions
with related questions (variables).
28
Table 2.2: The E-S-Q questionnaire and respective dimensions
Dimension Questions
Efficiency 1. This Website makes it easy to find what I want.
2. It makes it easy to get anywhere on the site.
3. It enables me to complete a transaction quickly.
4. Information on this Website is well organised
5. It loads its pages fast.
6. The Website is simple to use.
7. The Website enables me to get on to it quickly.
8. The Website is well organised.
System availability 1. This Website is always available for business.
2. The Website launches and runs right away.
3. The Website does not crash.
4. Pages at this Website do not freeze after I enter my
order information.
Fulfilment 1. It delivers orders when promised.
2. This Website makes items available for delivery within
suitable time frame.
3. It quickly delivers what I order.
4. It sends out the orders I ordered.
5. It has in stock the items the company claims to have.
6. It is truthful about its offerings.
7. It makes accurate promises about delivery of products
Privacy 1. It protects information about my Web-shopping
behaviour.
2. It does not share my personal information with other
sites.
3. The Website protects information about my credit card
Source: Parasuraman, Zeithaml and Malhotra (2005:230)
29
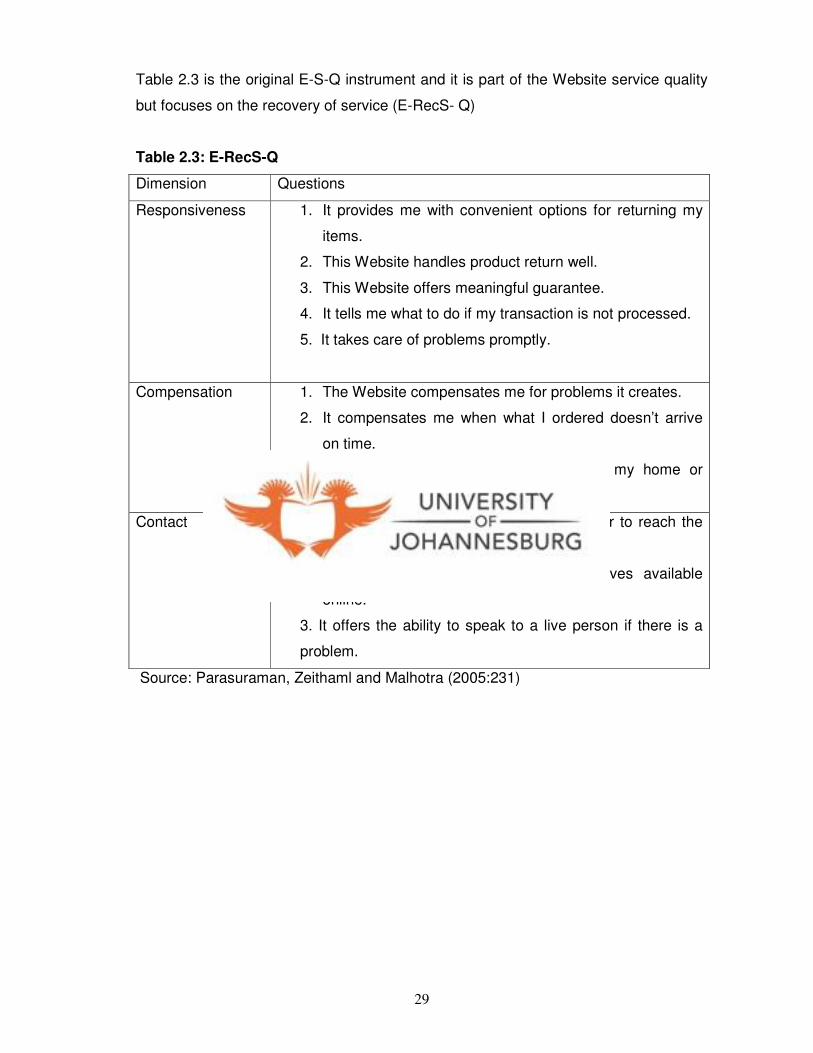
Table 2.3 is the original E-S-Q instrument and it is part of the Website service quality
but focuses on the recovery of service (E-RecS- Q)
Table 2.3: E-RecS-Q
Dimension Questions
Responsiveness 1. It provides me with convenient options for returning my
items.
2. This Website handles product return well.
3. This Website offers meaningful guarantee.
4. It tells me what to do if my transaction is not processed.
5. It takes care of problems promptly.
Compensation 1. The Website compensates me for problems it creates.
2. It compensates me when what I ordered doesn’t arrive
on time.
3. It picks up items I want to return from my home or
business.
Contact 1. The Website provides a telephone number to reach the
company.
2. The Website has customer representatives available
online.
3. It offers the ability to speak to a live person if there is a
problem.
Source: Parasuraman, Zeithaml and Malhotra (2005:231)
30
2.5 Internet Banking
2.5.1 Definition of Internet Banking
According to Sayar and Wolfe (2007:123) the term “Internet Banking” from a
customer’s perspective is used to describe the case where banks’ customers conduct
banking transactions on the Internet. In the contemporary context, this mainly implies
the usage of computers, but also allows for other possible devices like mobile phones
and digital TVs (Sayar & Wolfe, 2007:123). Internet Banking presents the industry
with an electronic and remote distribution channel. It represents an electronic
marketplace whereby consumers may conduct their financial transactions on a virtual
level (Bradley & Steward, 2003:272). Internet Banking refers to a service offered by
banks that allows account holders to access their account data via the Internet. In
order to take advantage of Internet Banking, an account holder would need to meet
several technological requirements, such as having a personal computer with Internet
access and web browser. If these conditions are satisfied, Internet Banking can be
performed from anywhere in the world. Thus, Internet Banking facilitates direct access
to account details, enables transfer of funds, allows for multiple bills payments, and
performs an array of other transactions.
2.5.2 Characteristics of Internet Banking
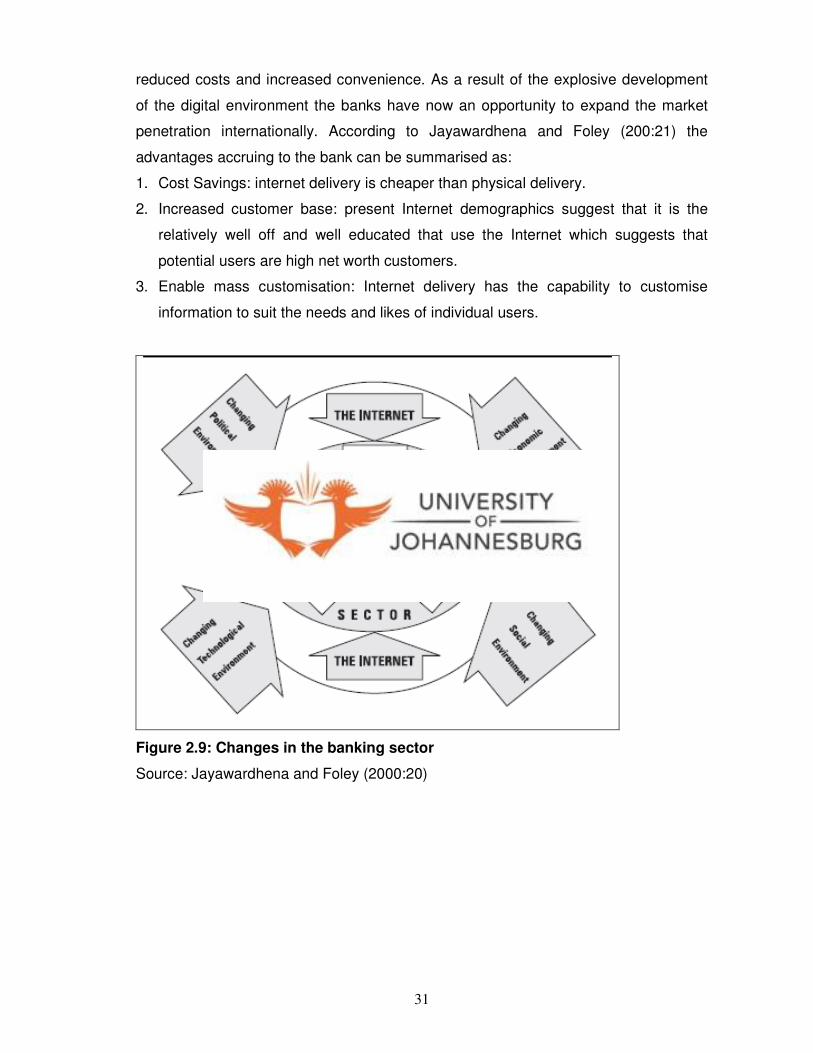
Jayawardhena and Foley (2000:19) in Figure 2.9 explain that the developments in
technology have dominated the revolution in the banking sector. The world-wide
expansion in technologies for connections has supported increased globalisation of
capital flows and financial organisations. The successful implementation and
development of online banking are influenced by the quality and security of Internet
network, the level of Internet knowledge of the population, the government support, as
well as the Internet strategy of the bank and the quality/ reliability of online banking
services (Gurau, 2002:294). Jayawardhena and Foley (2000:20) further state that
traditional banking is characterised by physical decentralisation, with branches
scattered around populated areas providing an ubiquitous presence. The rationale
behind such branch investment is the need to distribute the banking services.
Jayawardhena and Foley (200:21) indicate that the properties of Internet are the key
reasons why it is an ideal medium for delivery of banking products and services.
Gurau (2002:285) concurs that by using the Internet people can access their bank
accounts and conduct transactions twenty four hours a day, seven days a week with
31
reduced costs and increased convenience. As a result of the explosive development
of the digital environment the banks have now an opportunity to expand the market
penetration internationally. According to Jayawardhena and Foley (200:21) the
advantages accruing to the bank can be summarised as:
1. Cost Savings: internet delivery is cheaper than physical delivery.
2. Increased customer base: present Internet demographics suggest that it is the
relatively well off and well educated that use the Internet which suggests that
potential users are high net worth customers.
3. Enable mass customisation: Internet delivery has the capability to customise
information to suit the needs and likes of individual users.
Figure 2.9: Changes in the banking sector
Source: Jayawardhena and Foley (2000:20)
32
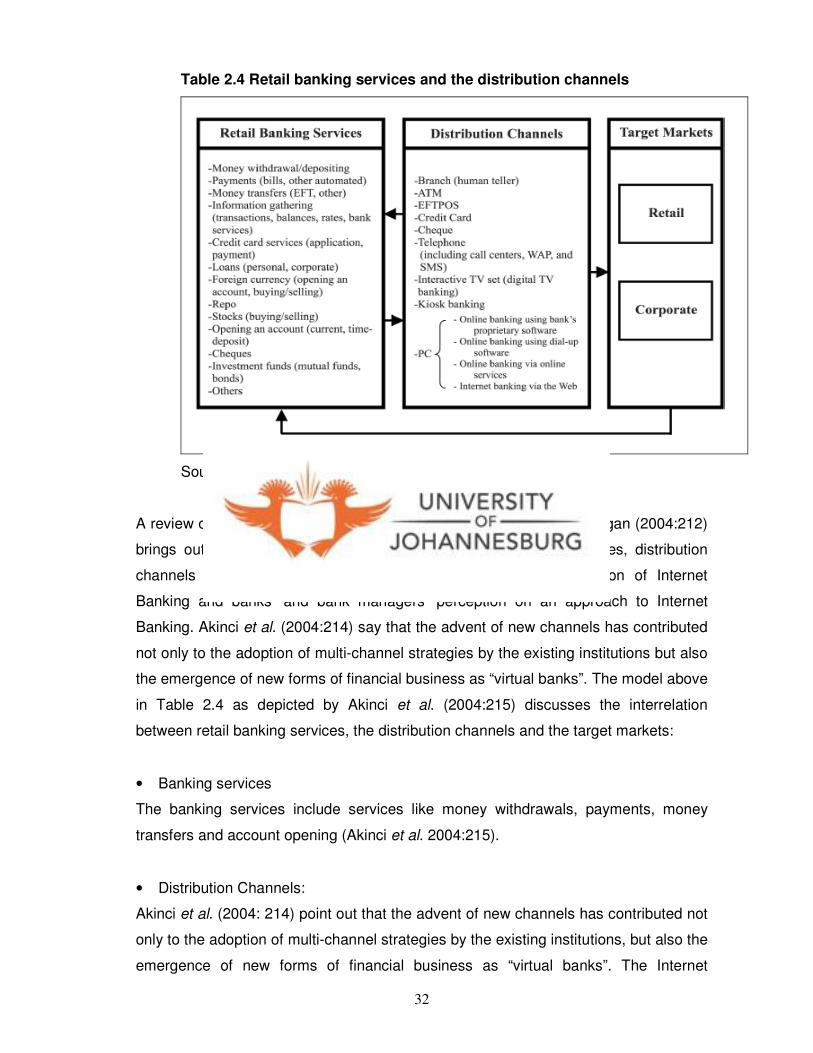
Table 2.4 Retail banking services and the distribution channels
Source: Akinci, Aksoy and Atilgan (2004:215)
A review of the literature on Internet Banking by Akinci, Aksoy and Atilgan (2004:212)
brings out four interrelated areas identified as: retail banking services, distribution
channels for the services, consumer attitudes towards the adoption of Internet
Banking and banks’ and bank managers’ perception on an approach to Internet
Banking. Akinci et al. (2004:214) say that the advent of new channels has contributed
not only to the adoption of multi-channel strategies by the existing institutions but also
the emergence of new forms of financial business as “virtual banks”. The model above
in Table 2.4 as depicted by Akinci et al. (2004:215) discusses the interrelation
between retail banking services, the distribution channels and the target markets:
• Banking services
The banking services include services like money withdrawals, payments, money
transfers and account opening (Akinci et al. 2004:215).
• Distribution Channels:
Akinci et al. (2004: 214) point out that the advent of new channels has contributed not
only to the adoption of multi-channel strategies by the existing institutions, but also the
emergence of new forms of financial business as “virtual banks”. The Internet
33
influences the future distribution channel structure in two ways. Firstly, it is in itself a
new distribution channel for financial service. The costs of using it are different from
those of other available distribution channels. Secondly, the Internet influences
consumers many of whom invest time and money in becoming PC literate and getting
to know the Internet (Möls, 1998:332)
• Target Market
The extent to which customers switch to Internet Banking is mainly determined by
each individual’s expectations regarding security, accuracy, transaction speed, user
friendliness, user involvement and convenience, all of which are components of
“perceived usefulness” (Sayar & Wolfe, 2007: 125).
2.5.3 Internet Banking Service quality
Focussing on the quality perception process, the model in Figure 2.10 below as
described by Broderick and Vachirapornuk (2002:328) identifies five key elements as
central influences on perceived quality:
• customer expectations of service
• the image and reputation of the service organization
• aspects of the service setting
• the actual service encounter
• customer participation
The model permits exploration of the perceived difference between expected service
and the experienced service. Corporate image is regarded as an important
determinant of perceived service quality. Customers build trust based on the image
and reputation of service providers (Broderick & Vachirapornuk, 2002:328). Broderick
and Vachirapornuk (2002:329) further state that the model incorporates concepts of
functional and technical quality by focusing on two elements of service experience,
that of service encounter and that of service setting. In Internet service the service
setting is one of the key elements that will affect perceived quality. In the Internet
environment, the virtual service setting facilitates performance and communicates
evidence to customers about service. User satisfaction was found to be dependent
on Website features such as speed to download, content and design, interactivity,
navigation and security. There is good evidence that service encounter evaluation is
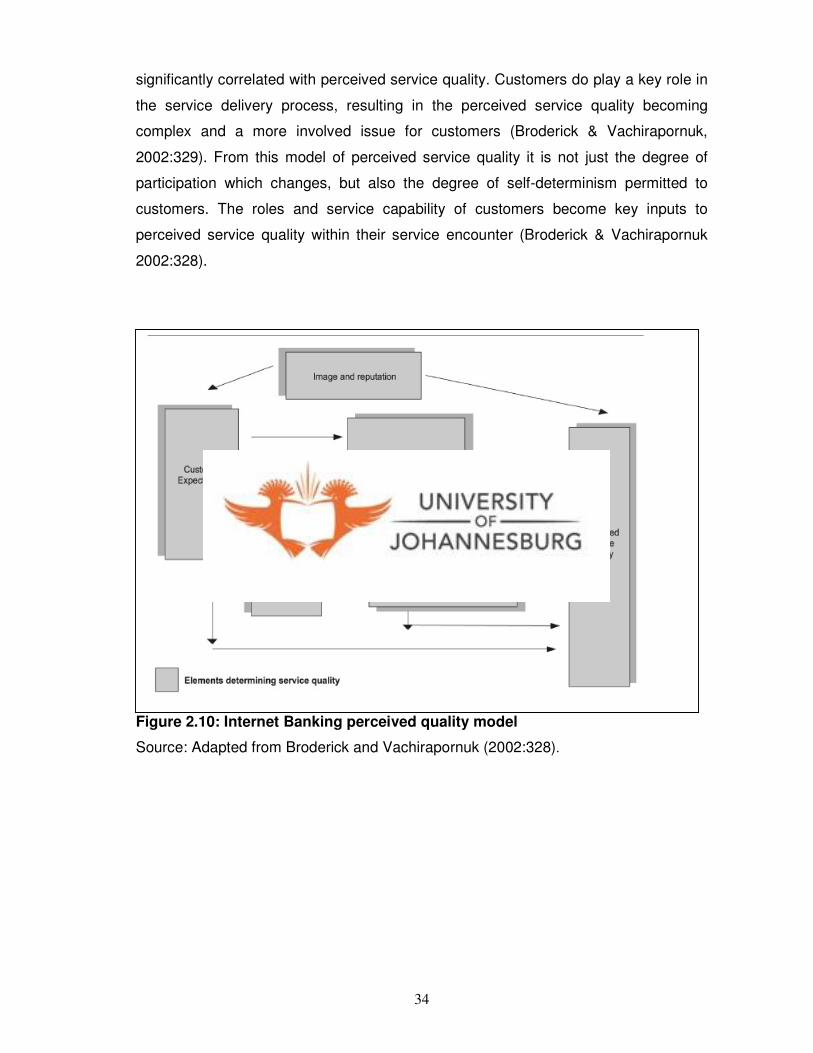
34
significantly correlated with perceived service quality. Customers do play a key role in
the service delivery process, resulting in the perceived service quality becoming
complex and a more involved issue for customers (Broderick & Vachirapornuk,
2002:329). From this model of perceived service quality it is not just the degree of
participation which changes, but also the degree of self-determinism permitted to
customers. The roles and service capability of customers become key inputs to
perceived service quality within their service encounter (Broderick & Vachirapornuk
2002:328).
Figure 2.10: Internet Banking perceived quality model
Source: Adapted from Broderick and Vachirapornuk (2002:328).
35
2.5.4 Measuring Internet Banking service quality
A study undertaken by Jun and Cai (2001:276) on the key determinants of Internet
Banking service quality concludes that a total of seventeen dimensions were identified
under three categories of Internet Banking service quality:
• Customer service quality.
• Online systems quality.
• Banking service product quality.
Table 2.5: Service Dimensions and related Categories
Customer Service Quality Online System Quality Banking Service Product
Quality
Reliability Content Product variety
Responsiveness Accuracy
Competence Ease of use
Courtesy Timeliness
Credibility Aesthetics
Access Security
Communications
Understanding the customer
Collaboration
Continuous improvement
Source: Jun and Cai (2001:282).
2.6 Conclusion
The literature reviewed a number of concepts on service quality. It started with the
review of traditional services, traditional service quality, SERVQUAL as an instrument
used to measure traditional service. It also introduced the concept of electronic
service. In measuring electronic service the basis of the SERVQUAL instrument was
used. This was the basis of a new tool called E-S-Q (Carrillant, Jaramilo & Mulki,
2007:473). Internet service quality was also reviewed and a model adapted from Jun
and Cai (2001:238) brought about the fact that dimensions were identified under three
categories, that of customer service quality, online system quality and banking service
product quality.

36
To move ahead to understanding Internet Banking service quality, one needs to
unpack a number of service concepts. This starts by understanding traditional
services and measurements thereof, through to electronic service such as Internet
Banking service. Concepts and theory on measurements of electronic service have
been presented in order to provide a deeper understanding of Internet Banking
service quality. The intention of presenting the theoretical background of both
traditional service and electronic service is to offer an insight into measuring service
quality, how it developed in time and how it changed because of the impact of
technology, especially Internet service delivery.
The basis of the E-S-Q and E-Rec-Q will be used to develop an instrument for
measuring the quality of Internet Banking service quality. A slightly modified version
of this instrument will be used in this study. This instrument will include amongst
others a question on customers’ perception on how the depth of functionality offered
by their banks’ Internet Banking service addresses their needs. Dimensions which
were in the original E-S-Q instrument like flexibility, price knowledge and
customization will be excluded in this study. These dimensions are more related to an
online purchasing service rather than banking, hence they will be excluded from the
instrument.
Based on the numerous discussions in the literature around measurements of
traditional service quality, electronic service quality, online systems quality and
Internet Banking service quality with their respective determinants of service quality
an adapted E-S-Q instrument was used in this survey. Twenty four questions were
used covering eight key determinants of electronic Banking service quality:
1. Efficiency: covers the ability to access the banking site, the ease of use, the
speed of completing banking transactions and the depth of Internet Banking
functionality.
2. Fulfilment: covers accuracy of information, the convenience factor and
promises being kept.
3. System Availability: is about system quality. Internet Banking system being
available at all times when needed.
4. Privacy: no misuse of personal information that gets exchanged on the online
interaction.
37
5. Assurance and trust: refers to confidence in the online service and how
trustworthy the brand is.
6. Responsiveness: refers to online requests done promptly and issues are
resolved on time.
7. Contact: refers to the bank being easily accessible and support staff available
at all times when needed.
8. Website aesthetics: means how attractive the banking site is.
Chapter Three describes in detail the research methodology used to do the study.
This chapter will capture the research design, sample selection and methods used to
collect primary data. The relevant reliability and validity tests to be employed will also
be discussed in this chapter.
38
Chapter THREE
RESEARCH METHODOLOGY
3.1 Introduction
This chapter discusses the methodology that was employed to conduct the study. The
discussion will include the design of the research, population sample, sampling and
data collection methods that were used. The web survey method was used to collect
primary data for this study. Web survey process concerns transforming paper based
instruments into Web forms and incorporate user interface design (Roynolds, Woods
& Baker, 2007:11). Electronic interactive media was used as respondents were
contacted via e-mail and directed via a URL to take a self-administered questionnaire
online. Zikmund (2003:198) defines electronic interactive media as a communication
media that allows an organization and the audience to interact using digital
technology. This method was chosen as the preferred method because of its wide
reach of respondents, convenience, low cost, speed of data collection and the fit that
it has with the study. An Internet survey is a self administered questionnaire posted
on a Website. Respondents provide answers to questions displayed on the screen by
clicking on an icon, keying in an answer or highlighting a phrase (Zikmund, 2003:221).
3.2 Research design
Zikmund (2003:65) defines research design as a master plan specifying the methods,
approaches and procedures for collecting and analysing the needed information. The
objectives of the research, the available data sources, the urgency of the decision,
and the cost of obtaining the data will determine the choice of the appropriate
research design. The quantitative and qualitative research methodologies are the two
main research approaches useful in the classification of studying primary data (Davis,
2000:265). Zikmund (2003:110) asserts that qualitative research usually provides
greater understanding of a concept or crystallizes a problem, rather than providing
precise measurement or quantification. The focus of qualitative research is not on
numbers but rather on words and observations. According to Schmidt and Hollensen
(2006:89) the purpose of qualitative research is to find out what is going on in a
person’s mind. Davis (2000:265) on the other hand says qualitative research consists
of studies that can be quantified. He maintains that these studies are an in-depth
39
analysis of one or a few observations; they involve less structured questioning and
observations of respondents.
Conversely, quantitative research uses large samples and involves structured survey
questioning that is subsequently numerically and statistically analysed (Davis.
2000:265). Martins et al. (1996:125) highlight that quantitative research objective is to
generalise about a specific population, based on the results of a representative
sample of that population. The method generally involves the collection of primary
data from a large number of individuals, with the intention of projecting the results to a
wider population. Quantitative research approach is based on testable hypothesis
and tends to measure “how often” or “how much”. The choice of the approach to be
taken in a research study is primarily based on the research question or problem.
Taking into consideration the description of the two research approaches discussed
above and the study’s research objectives, it was decided to use the quantitative
research approach. This study aims to explore customer’s perceptions on key
electronic service dimensions of Internet Banking service quality. Since this study
explores perceptions it means the study aims to measure “how much” satisfied online
banking customers are with the quality of Internet Banking service. This approach
allowed for statistical analysis of the data on the basis of a service quality
measurement instrument. The study involved collecting primary data in a structured
survey questioning which was followed by statistical analysis of the data. The
objective was to be in a position to generalise about online banking customers’
perceptions on the quality of Internet Banking service. To collect primary data the
Internet survey method was used. The combination of the quantitative approach and
the survey method was appropriate for the research question in this study as a
representative sample of the population was surveyed.
3.3 Research population
Davis (2000:220) defines population as the complete set of units of analysis that are
under investigation. Zikmund (2003:369) brings in an element of commonality by
defining population or universe as a complete group of entities sharing some common
set of characteristics. On the other hand the survey population is an aggregate of
elements from which the sample is drawn (Martins et al., 1996:252). Martins et al.
(1996:252) state that “In practice we seldom find complete lists of all the elements, so
40
that the sample has to be drawn from lists that do not always contain all the elements.
The differences between the survey population and the population or universe should
therefore be always noticed.” The distinction between a population and the universe
is made on the bases of whether the group is finite (population) or infinite (universe)
(Zikmund, 2003:369). Based on the definitions of universe, population and survey
population by different authors above, these concepts can be summarised as follows:
• Universe is an infinite group of entities sharing some common characteristics.
• Population is a finite complete group of entities sharing some common
characteristics.
• Survey population is the aggregate of elements from which a sample is drawn.
This study investigated the perception of online banking customers on the quality of
service delivered by Internet Banking. The universe comprised of all banking
customers world wide, whilst Internet Banking customers in the world will be the
population and the Internet Banking customers using South African banks will form
the survey population.
The contact list of online banking customers in South Africa was not commercially
available and the four major banks would not divulge their customers contact details
as a result of legal compliance restrictions. An alternative to reach as many online
banking customers as possible was an approach of social networking to create the
survey population list. An invitation was sent to colleagues, friends, business
associates, family and social contacts from social media (Face book) to provide
contact e-mail addresses of their contacts that are online banking users. This ensured
that there was no bias in selecting users from any specific bank.
Figure 3.1 shows the trend of Internet Banking users in the United States compared to
the world wide trends. The trend shows a 3 275% increase of world wide online
banking users in 12 years between 1995 and 2007.
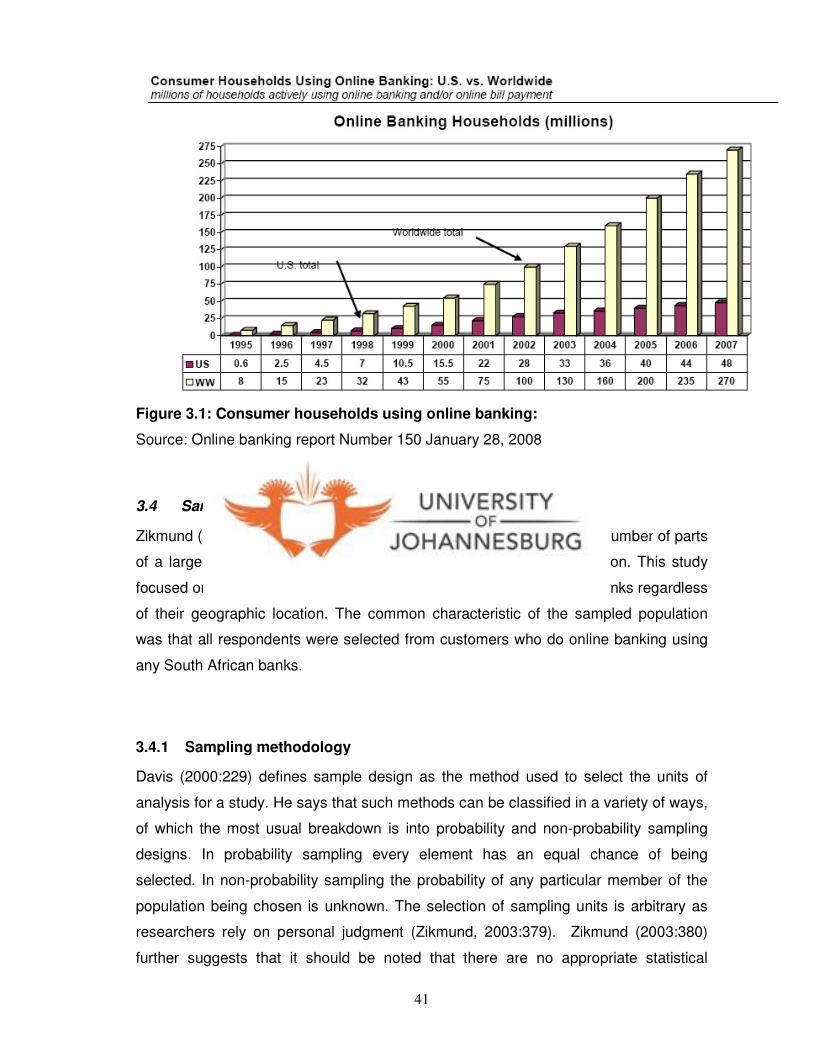
41
Figure 3.1: Consumer households using online banking:
Source: Online banking report Number 150 January 28, 2008
3.4 Sampling
Zikmund (2003:369) defines sampling as the process of using a small number of parts
of a larger population to make a conclusion about the whole population. This study
focused on all Internet Banking customers serviced by South African banks regardless
of their geographic location. The common characteristic of the sampled population
was that all respondents were selected from customers who do online banking using
any South African banks.
3.4.1 Sampling methodology
Davis (2000:229) defines sample design as the method used to select the units of
analysis for a study. He says that such methods can be classified in a variety of ways,
of which the most usual breakdown is into probability and non-probability sampling
designs. In probability sampling every element has an equal chance of being
selected. In non-probability sampling the probability of any particular member of the
population being chosen is unknown. The selection of sampling units is arbitrary as
researchers rely on personal judgment (Zikmund, 2003:379). Zikmund (2003:380)
further suggests that it should be noted that there are no appropriate statistical
42
techniques for measuring random sampling error from a non-probability sample. A
non-probability sample is a one in which chance selection procedures are not used
(Davis, 2003:243)
Given the above discussion on probability and non-probability sampling this study
used the non-probability sampling called convenience sampling. This was because
the respondents that were invited to take part in the survey were conveniently
available. To gather names and e-mail addresses of the respondents, an e-mail and a
face book invitation were sent to colleagues, friends, business associates, and family
asking them to extend the invitation to their respective lists. The only criteria stipulated
were that the respondent should be an online banking customer with one of the
banking institutions in South Africa. This then meant that the survey population was
conveniently obtained from friends, business associates, colleagues and family. One
thousand (1 000) contacts e-mail addresses were gathered through this method. The
reason for using the convenience sample was to obtain a large number of completed
questionnaires quickly and economically. The only other way of getting a sample
would have been to get a list of all online banking customers from the banking
institutions in South Africa. Out of the combined list a random sample would have
been selected as the survey population. One of the limitations of the study was the
fact that the sample used was a non-probability one because it was a convenience
sample. Projecting results beyond a specific sample in a non-probability sample
(convenience) might be inappropriate. Zikmund (2003:382) states that convenience
samples are best used for exploratory research when additional research will
subsequently be conducted with a probability sample.
3.4.2 Sample size
Two hundred and six (206) responses were received. Based on the online survey
responses, the average response rate for online surveys is approximately twenty
percent (20%). The survey population was one thousand (1 000). The two hundred
and six represented a 20.6% response rate. One hundred and sixty five (165) usable
responses were received as out of the two hundred and six, the valid responses were
one hundred and sixty five representing a 16.5% of the survey population.
43
3.5 Research instrument
Zikmund (2003:330) points out that a survey is only as good as the questions it asks,
hence the questionnaire design is a critical stage in the survey research process. The
questionnaire must be relevant and accurate in trying to capture the essence of the
research objective. To achieve these ends, a researcher will be required to make
several decisions:
• What should be asked?
• How should each question be phrased?
• In what sequence should the questions be arranged?
• What questionnaire layout will best serve the research objectives?
• How should the questionnaire be pre-tested?
• Does the questionnaire need to be revised.
The questionnaire that was used in this study was based on an E-S-Q instrument that
has been extensively used to measure the quality of service delivered by Websites
and online services. The questionnaire was slightly adjusted to ensure that it captured
the essence of Internet Banking compared to electronic shopping. The instrument has
been used mostly in electronic shopping service quality measurements. This
instrument included amongst others a question on customers’ perception on how the
depth of functionality offered by their banks’ Internet Banking service addressed their
needs. Dimensions which were in the original E-S-Q instrument like flexibility, price
knowledge and customization were excluded in this study. These dimensions refer to
online purchasing service rather than banking, hence they were excluded from the
instrument. Twenty four questions were used covering eight key determinants of
electronic banking service quality. Five more questions on the customer’s personal
information (biographical questions) were covered. The first question in the survey
asked customers if they banked online or not. This was to allow non-Internet Banking
customers not to take the entire questionnaire but rather to fill in only the biographic
information. Customers that responded with a “Yes” answer to this question were
directed to take the entire questionnaire. A summary of the eight key determinants of
electronic banking service are:
• Efficiency: covers the ability to access the banking site, the ease of use, the
speed of completing banking transactions and the depth of Internet Banking
functionality.

44
• Fulfilment: covers accuracy of information, the convenience factor and
promises being kept.
• System Availability: is about system quality. Internet Banking system being
available at all times when needed.
• Privacy: no misuse of personal information that gets exchanged on the online
interaction.
• Assurance and trust: refers to confidence in the online service and how
trustworthy the brand is.
• Responsiveness: refers to online requests done promptly and issues are
resolved on time.
• Contact: refers to the bank being easily accessible and support staff available
at all times when needed.
• Website aesthetics: means how attractive the banking site is.
The scale that was used in the instrument was the summated ratings method called
the Linkert scale. With the Linkert scale, respondents indicate their attitude or
perception by checking how strongly they agree or disagree with carefully constructed
statements that range from very negative to very positive towards the attitudinal object
(Zikmund. 2003:312). Schmidt and Hollensen (2006:120) define the Linkert scale as a
widely used rating scale that requires the respondents to indicate a degree of
agreement or disagreement with each of a series of statements about the stimulus
objects. Since Internet survey or questionnaire was used, respondents were given
radio buttons to make their choices. In the questions where personal information was
required input fields were provided.
3.6 Data Collection
Zikmund (2003:72) argues that because there are many research techniques it stands
to reason that there will also be different ways of collecting data. Respondents may be
given a questionnaire to fill or they may interact with an interviewer. A self-
administered survey questionnaire is defined as a questionnaire that is filled in by
respondents rather than an interviewer. An internet survey is one such questionnaire
where the respondent takes a self-administered questionnaire posted on a Website.
The speed of response, cost of gathering primary data and the reach of the Internet
survey are some of the advantages of this method of collecting data. One other
45
advantage is that the information collection and capturing can be done in real time
(Zikmund, 2003:227).
The Internet self-administered questionnaire method was used in this study. The
major reason for using this method was that the nature of the topic is around online
banking hence the survey sample was easily reachable through this technique and
was also more willing to take the questionnaire online. This guaranteed some form of
a good response rate. Some of the advantages of using online questionnaire for
primary data collection are:
• Speed of data collection is almost instantaneous.
• High geographic flexibility.
• Respondents’ participation would be higher compared to other methods.
• Versatile questioning.
• No interviewer influence on questions.
• Anonymity of respondents can be guaranteed.
• Low cost for primary data collection.
The questionnaire was open for two weeks. A reminder was sent in the second week
to improve on the response rate. The site was taken down after it has been up for two
weeks.
3.7 Data Analysis
The data was collected online in real time. As respondents submitted their
questionnaire the data was automatically exported into a predefined and coded
database. Each question was coded in the interface (Web form) and matched to field
names in the database. This in turn made analysis to be started much quicker.
STATCON (A statistical services bureau at the University of Johannesburg) was
contracted to host the web side and do the analysis. Some of the services that
STATKON completed included:
• Ensuring that respondents only had one opportunity for taking the
questionnaire. This was done by tracking the embedded system controls.
• Statistical analysis of quantitative data including use of multivariate techniques
to meet the objectives of the research project.
• The reliability and validity tests.
• Providing the interpretation of the statistical results
46
• Providing the graphical displays to enhance the interpretation of the results.
3.8 Ethical Considerations
Ethical questions are philosophical questions. There is no general agreement
amongst philosophers about the answers to such questions. However, the rights
and obligations of individuals are generally dictated by the norms of society. Social
norms are codes of behaviour adopted by a group; they suggest what a member of
a group ought to do under given circumstances (Zikmund, 2003:78). Below are
some of the ethical aspects which were considered during the research project:
• Informed consent - the respondents were informed on the invitation letter
about the intent of the study.
• Deception - the intent and mandate to do the research was made clear from
the onset.
• Anonymity - the self administered questionnaires were completed
anonymously to ensure the privacy of the subject.
• Confidentiality - all information received was handled with confidentiality
• Publication of the findings - a written academic report was compiled as
accurately and objectively as possible.
Roynolds et al. (2007:114) point out that the application of ethical principles in
online surveys implies the following:
• Providing complete and unambiguous information regarding the identity of
the researcher, the purpose of research, and the use of the collected data,
including the diffusion of the research results
• Including a clear statement regarding the protection of participants’ privacy
and to give the participants the opportunity to define the level of
confidentiality they require
• To ensure the security of Internet connection and data transfer, informing
participants about the risk of data interception by third parties.
• Openly present all the advantages or disadvantages related to the
participation in the study
• Providing contact information to allow respondents to obtain additional
clarification about the research project.
47
3.9 Conclusion
The aim of the study was to explore online banking customers’ perceptions on Internet
Banking service quality. The quantitative approach allowed for statistical analysis of
the data. The sample was a non-probability sample and the study followed a
quantitative research approach. The combination of the quantitative approach and the
survey method was appropriate for the research question in this study as a sample
population was surveyed and the general conclusion drawn for the entire sample
population. The survey population was all online banking users utilizing services from
South African banks and the sampling design was a non-probability one as a
convenience sampling method was used. A slightly revised E-S-Q service quality
measurement instrument was used in this study and data was collected via a web
based self-administered survey.
Chapter Four will concentrate mainly on the presentation of the results. The focus will
be on providing the analysis of the results in terms of elaborating on the research
objectives.
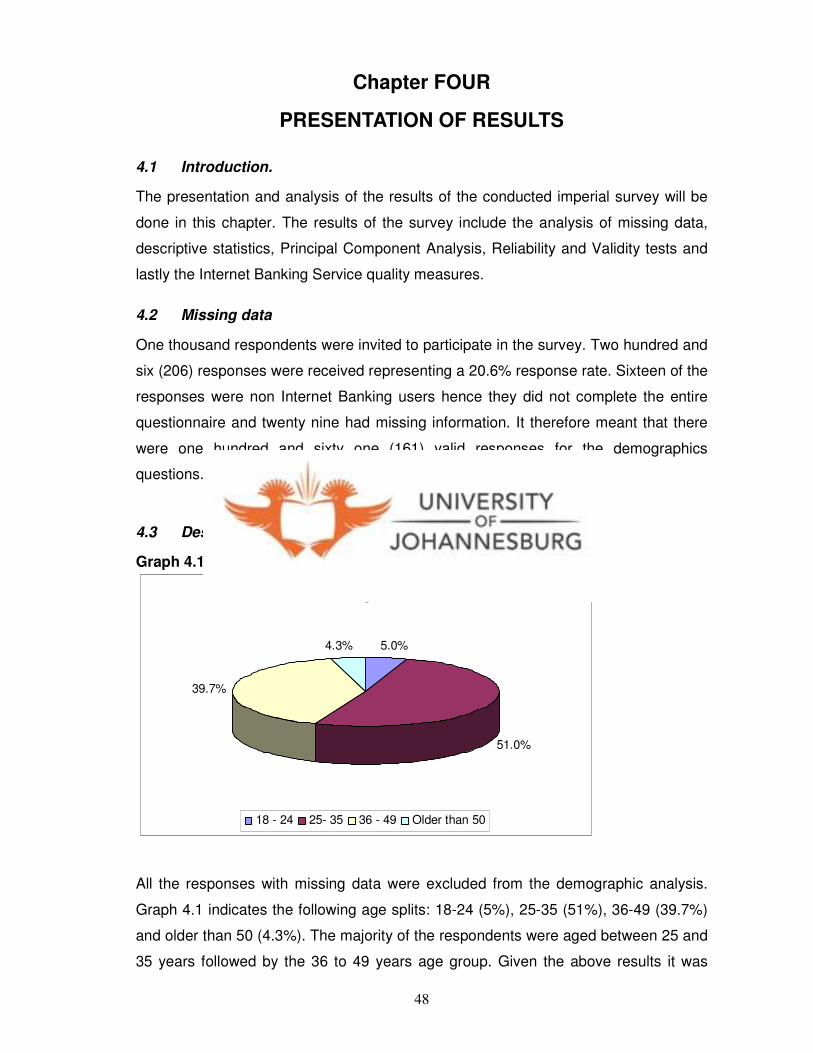
48
Chapter FOUR
PRESENTATION OF RESULTS
4.1 Introduction.
The presentation and analysis of the results of the conducted imperial survey will be
done in this chapter. The results of the survey include the analysis of missing data,
descriptive statistics, Principal Component Analysis, Reliability and Validity tests and
lastly the Internet Banking Service quality measures.
4.2 Missing data
One thousand respondents were invited to participate in the survey. Two hundred and
six (206) responses were received representing a 20.6% response rate. Sixteen of the
responses were non Internet Banking users hence they did not complete the entire
questionnaire and twenty nine had missing information. It therefore meant that there
were one hundred and sixty one (161) valid responses for the demographics
questions.
4.3 Descriptive Statistics
Graph 4.1 Age demographics
Age
5.0%
51.0%
39.7%
4.3%
18 - 24 25- 35 36 - 49 Older than 50
All the responses with missing data were excluded from the demographic analysis.
Graph 4.1 indicates the following age splits: 18-24 (5%), 25-35 (51%), 36-49 (39.7%)
and older than 50 (4.3%). The majority of the respondents were aged between 25 and
35 years followed by the 36 to 49 years age group. Given the above results it was
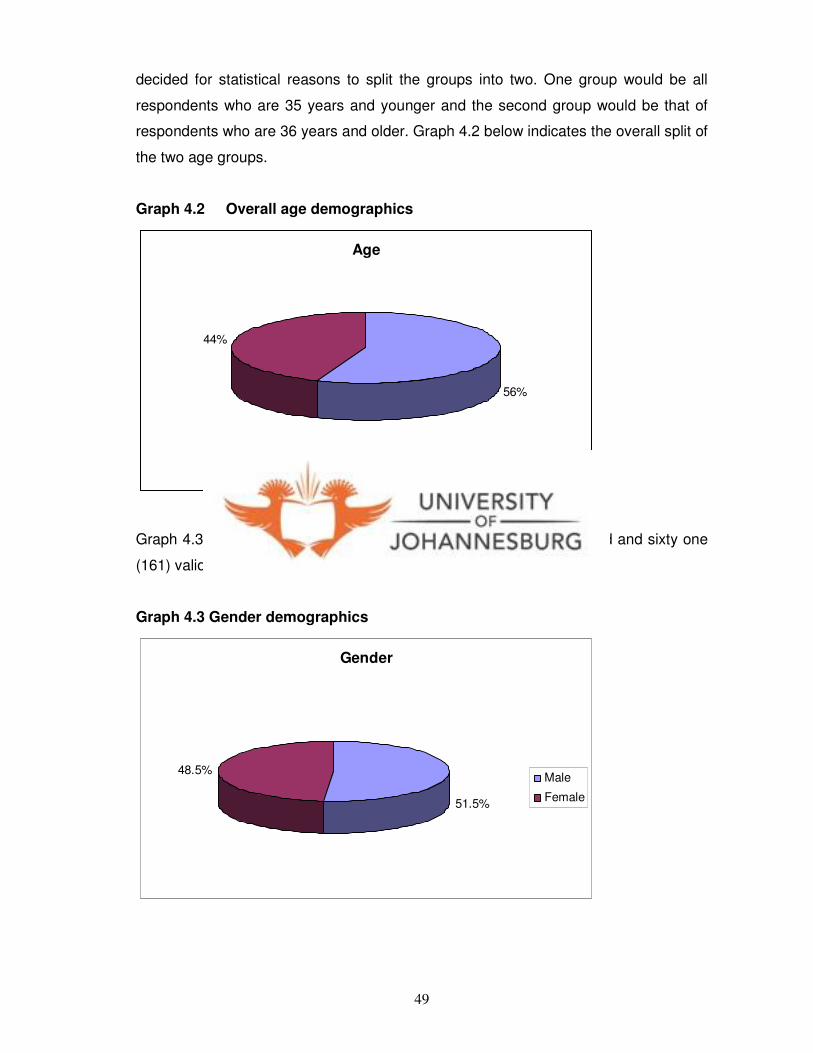
49
decided for statistical reasons to split the groups into two. One group would be all
respondents who are 35 years and younger and the second group would be that of
respondents who are 36 years and older. Graph 4.2 below indicates the overall split of
the two age groups.
Graph 4.2 Overall age demographics
Age
56%
44%
35 years and younger 36 years and older
Graph 4.3 indicates the gender demographics. Out of the one hundred and sixty one
(161) valid responses 51.5% were males compared to 48.5 females.
Graph 4.3 Gender demographics
Gender
51.5%
48.5%Male
Female
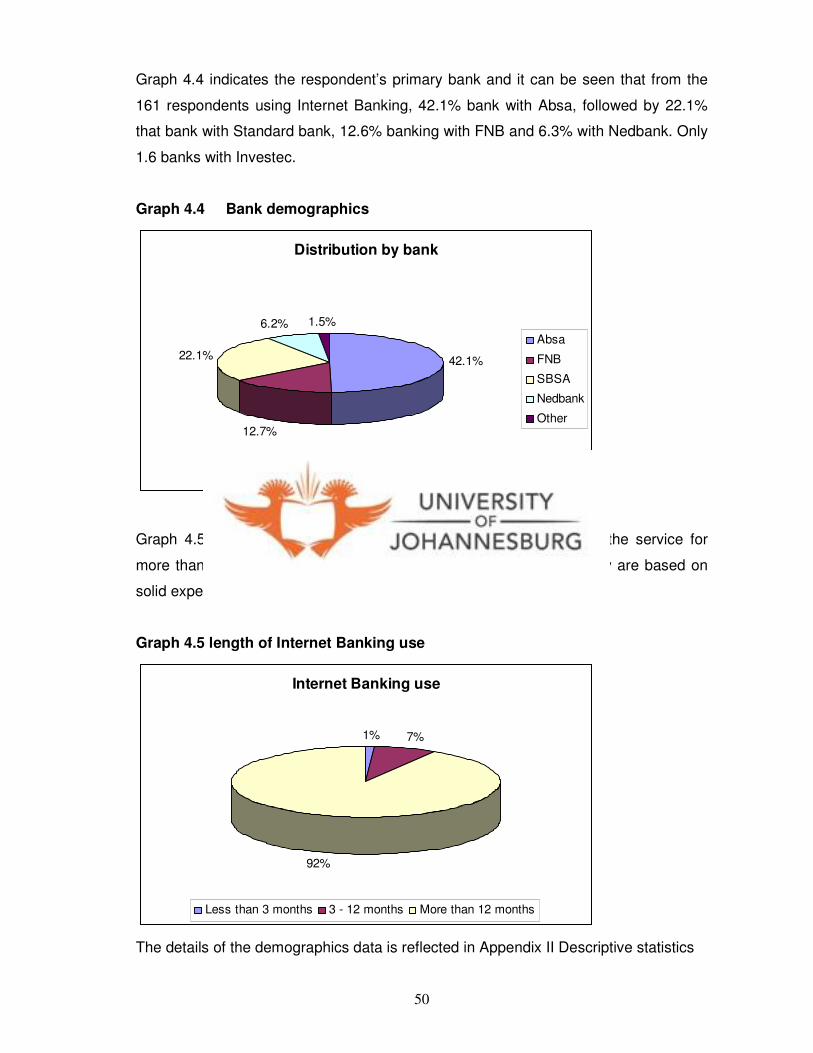
50
Graph 4.4 indicates the respondent’s primary bank and it can be seen that from the
161 respondents using Internet Banking, 42.1% bank with Absa, followed by 22.1%
that bank with Standard bank, 12.6% banking with FNB and 6.3% with Nedbank. Only
1.6 banks with Investec.
Graph 4.4 Bank demographics
Distribution by bank
42.1%
12.7%
22.1%
6.2% 1.5%
Absa
FNB
SBSA
Nedbank
Other
Graph 4.5 indicates that 92% of the respondents have been using the service for
more than a year. This implies that the responses given in the survey are based on
solid experience.
Graph 4.5 length of Internet Banking use
Internet Banking use
1% 7%
92%
Less than 3 months 3 - 12 months More than 12 months
The details of the demographics data is reflected in Appendix II Descriptive statistics
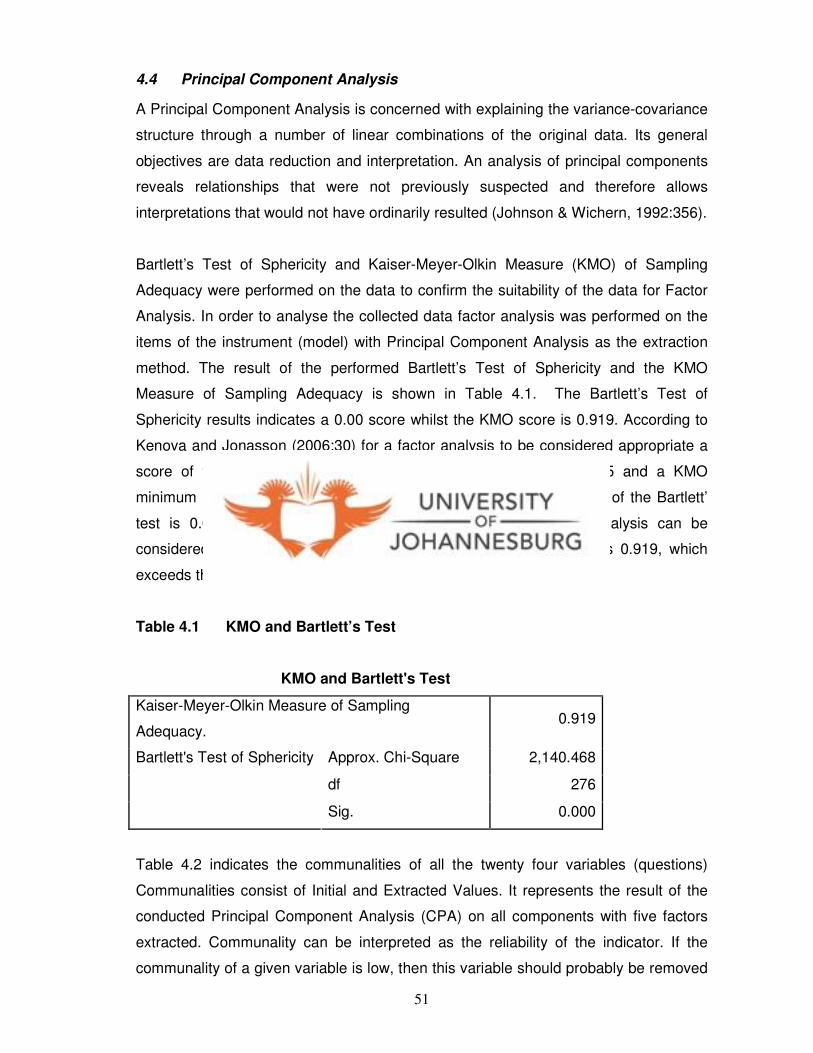
51
4.4 Principal Component Analysis
A Principal Component Analysis is concerned with explaining the variance-covariance
structure through a number of linear combinations of the original data. Its general
objectives are data reduction and interpretation. An analysis of principal components
reveals relationships that were not previously suspected and therefore allows
interpretations that would not have ordinarily resulted (Johnson & Wichern, 1992:356).
Bartlett’s Test of Sphericity and Kaiser-Meyer-Olkin Measure (KMO) of Sampling
Adequacy were performed on the data to confirm the suitability of the data for Factor
Analysis. In order to analyse the collected data factor analysis was performed on the
items of the instrument (model) with Principal Component Analysis as the extraction
method. The result of the performed Bartlett’s Test of Sphericity and the KMO
Measure of Sampling Adequacy is shown in Table 4.1. The Bartlett’s Test of
Sphericity results indicates a 0.00 score whilst the KMO score is 0.919. According to
Kenova and Jonasson (2006:30) for a factor analysis to be considered appropriate a
score of the Bartlett’s Test of Sphericity should be less than 0.05 and a KMO
minimum score of 0.6 is needed for good factor analysis. The result of the Bartlett’
test is 0.00 which is less than 0.05 indicating that the factor analysis can be
considered appropriate and KMO Measure of Sampling Adequacy is 0.919, which
exceeds the minimum value of 0.6 for good factor analysis.
Table 4.1 KMO and Bartlett’s Test
KMO and Bartlett's Test
Kaiser-Meyer-Olkin Measure of Sampling
Adequacy. 0.919
Approx. Chi-Square 2,140.468
df 276
Bartlett's Test of Sphericity
Sig. 0.000
Table 4.2 indicates the communalities of all the twenty four variables (questions)
Communalities consist of Initial and Extracted Values. It represents the result of the
conducted Principal Component Analysis (CPA) on all components with five factors
extracted. Communality can be interpreted as the reliability of the indicator. If the
communality of a given variable is low, then this variable should probably be removed
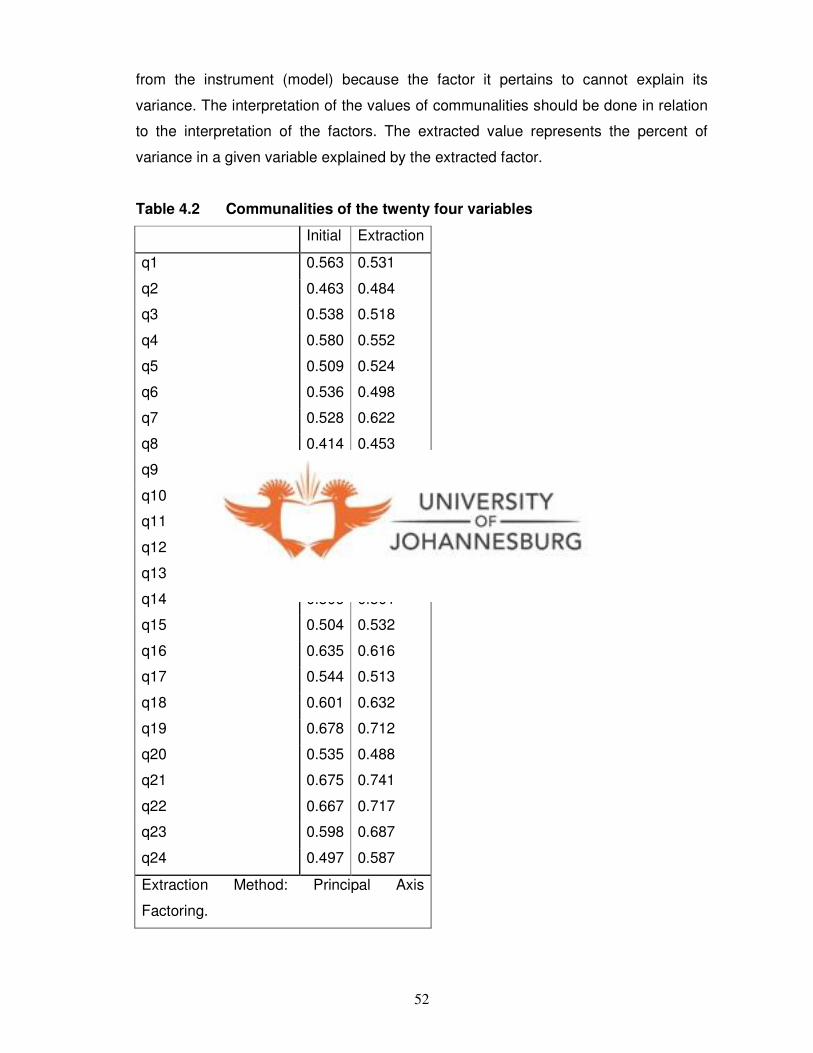
52
from the instrument (model) because the factor it pertains to cannot explain its
variance. The interpretation of the values of communalities should be done in relation
to the interpretation of the factors. The extracted value represents the percent of
variance in a given variable explained by the extracted factor.
Table 4.2 Communalities of the twenty four variables
Initial Extraction
q1 0.563 0.531
q2 0.463 0.484
q3 0.538 0.518
q4 0.580 0.552
q5 0.509 0.524
q6 0.536 0.498
q7 0.528 0.622
q8 0.414 0.453
q9 0.471 0.463
q10 0.510 0.482
q11 0.707 0.747
q12 0.590 0.606
q13 0.439 0.404
q14 0.506 0.501
q15 0.504 0.532
q16 0.635 0.616
q17 0.544 0.513
q18 0.601 0.632
q19 0.678 0.712
q20 0.535 0.488
q21 0.675 0.741
q22 0.667 0.717
q23 0.598 0.687
q24 0.497 0.587
Extraction Method: Principal Axis
Factoring.
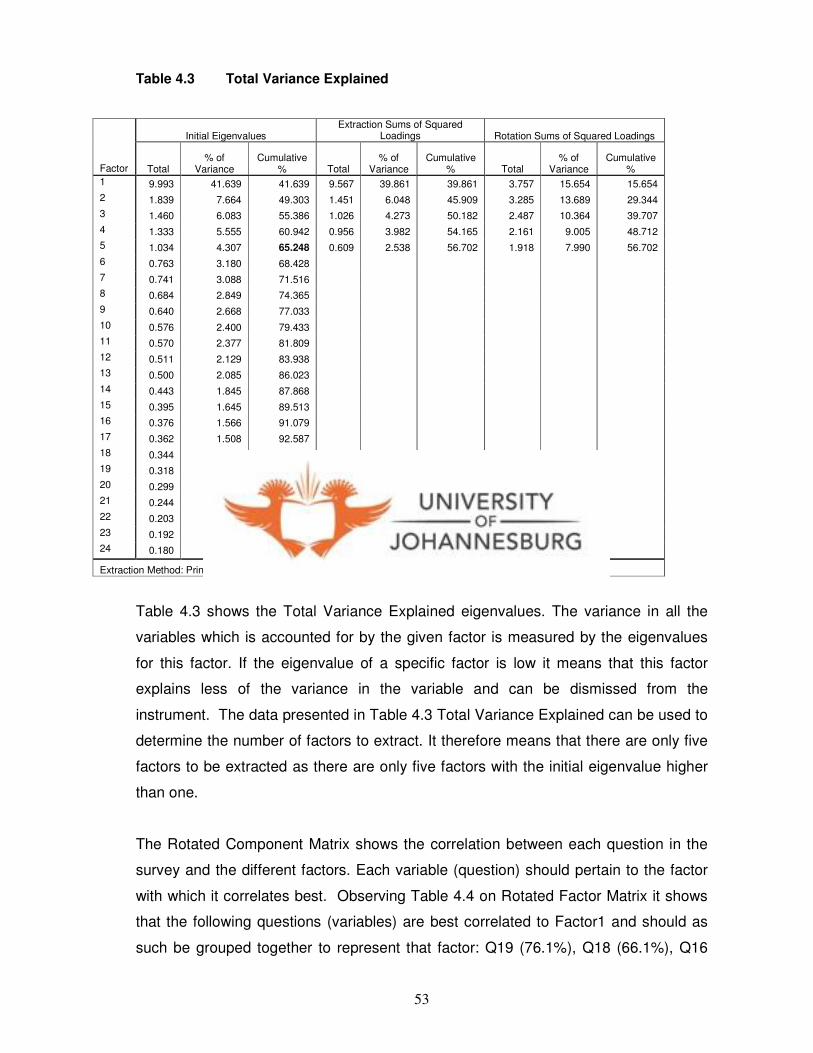
53
Table 4.3 Total Variance Explained
Initial Eigenvalues Extraction Sums of Squared
Loadings Rotation Sums of Squared Loadings
Factor Total % of
Variance Cumulative
% Total % of
Variance Cumulative
% Total % of
Variance Cumulative
%
1 9.993 41.639 41.639 9.567 39.861 39.861 3.757 15.654 15.654
2 1.839 7.664 49.303 1.451 6.048 45.909 3.285 13.689 29.344
3 1.460 6.083 55.386 1.026 4.273 50.182 2.487 10.364 39.707
4 1.333 5.555 60.942 0.956 3.982 54.165 2.161 9.005 48.712
5 1.034 4.307 65.248 0.609 2.538 56.702 1.918 7.990 56.702
6 0.763 3.180 68.428
7 0.741 3.088 71.516
8 0.684 2.849 74.365
9 0.640 2.668 77.033
10 0.576 2.400 79.433
11 0.570 2.377 81.809
12 0.511 2.129 83.938
13 0.500 2.085 86.023
14 0.443 1.845 87.868
15 0.395 1.645 89.513
16 0.376 1.566 91.079
17 0.362 1.508 92.587
18 0.344 1.433 94.020
19 0.318 1.324 95.343
20 0.299 1.246 96.589
21 0.244 1.015 97.604
22 0.203 0.846 98.450
23 0.192 0.800 99.249
24 0.180 0.751 100.000
Extraction Method: Principal Axis Factoring.
Table 4.3 shows the Total Variance Explained eigenvalues. The variance in all the
variables which is accounted for by the given factor is measured by the eigenvalues
for this factor. If the eigenvalue of a specific factor is low it means that this factor
explains less of the variance in the variable and can be dismissed from the
instrument. The data presented in Table 4.3 Total Variance Explained can be used to
determine the number of factors to extract. It therefore means that there are only five
factors to be extracted as there are only five factors with the initial eigenvalue higher
than one.
The Rotated Component Matrix shows the correlation between each question in the
survey and the different factors. Each variable (question) should pertain to the factor
with which it correlates best. Observing Table 4.4 on Rotated Factor Matrix it shows
that the following questions (variables) are best correlated to Factor1 and should as
such be grouped together to represent that factor: Q19 (76.1%), Q18 (66.1%), Q16
54
(61.9%), Q6 (56.7%), Q9 (56.9%) and Q17 (51.3%). Although the communality value
for Q9 is below 50% at (47%) it will be retained in the instrument as a result of the
good correlation at (56%) which is higher than 50%.
Following similar logic the following questions correlates best to Factor2 as observed
from Table 4.4 hence they will be grouped together: Q21 (79%), Q22 (78%), Q11
(73.5%), Q3 (60.2) and Q1 (51.4) All factors will be retained as the communality
scores of all the five questions is above 50. The third factor as observed from Table
4.4 will be grouped as follows: Q12 (65.3%), Q4 (57.2%), Q5 (47.9%), Q10 (44.8)
and Q13 (38.8). Question 10 can be retained as it has a communality value of more
than 50%; however question 13 cannot be retained as it has the less favourable
correlation of 38.8% which is less than the 60% and also the communality value of
less than 50%. Question 13 was about the brand reputation, this question was
included because from the theory it is stated that a well known brand will always
positively influence customer perceptions. This variable will however be excluded
based on the results above. The fourth factor should include the following questions
which best correlates to factor4: Q7 (70.8), Q8 (65.8), Q14 (48.4), Q2 (46.3) and Q20
(41.6). All the other questions can be retained in the exception of question 2 as it has
a communality value of less than 50%. Lastly, the fifth factor as observed from Table
4.4 will be represented by the following questions (variables): Q24 (66.8%), Q23
(65.2%) and Q15 (54%).
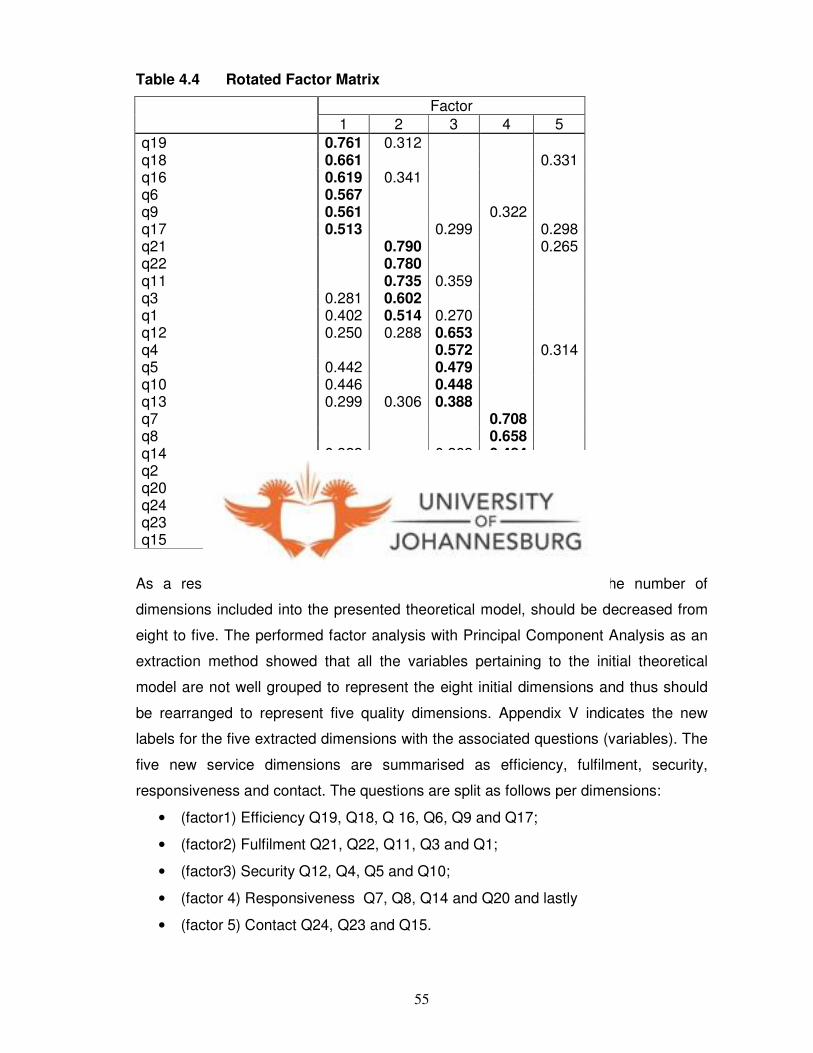
55
Table 4.4 Rotated Factor Matrix
Factor 1 2 3 4 5
q19 0.761 0.312 q18 0.661 0.331 q16 0.619 0.341 q6 0.567 q9 0.561 0.322 q17 0.513 0.299 0.298 q21 0.790 0.265 q22 0.780 q11 0.735 0.359 q3 0.281 0.602 q1 0.402 0.514 0.270 q12 0.250 0.288 0.653 q4 0.572 0.314 q5 0.442 0.479 q10 0.446 0.448 q13 0.299 0.306 0.388 q7 0.708 q8 0.658 q14 0.322 0.262 0.484 q2 0.260 0.419 0.463 q20 0.394 0.289 0.416 q24 0.297 0.668 q23 0.486 0.652 q15 0.357 0.540
As a result of the analysis done above of the collected data, the number of
dimensions included into the presented theoretical model, should be decreased from
eight to five. The performed factor analysis with Principal Component Analysis as an
extraction method showed that all the variables pertaining to the initial theoretical
model are not well grouped to represent the eight initial dimensions and thus should
be rearranged to represent five quality dimensions. Appendix V indicates the new
labels for the five extracted dimensions with the associated questions (variables). The
five new service dimensions are summarised as efficiency, fulfilment, security,
responsiveness and contact. The questions are split as follows per dimensions:
• (factor1) Efficiency Q19, Q18, Q 16, Q6, Q9 and Q17;
• (factor2) Fulfilment Q21, Q22, Q11, Q3 and Q1;
• (factor3) Security Q12, Q4, Q5 and Q10;
• (factor 4) Responsiveness Q7, Q8, Q14 and Q20 and lastly
• (factor 5) Contact Q24, Q23 and Q15.
56
Factor one refers to efficiency and includes variables like adequacy of functionality,
the ease of finding information on the banking site, aesthetics of the site and speed of
transacting amongst others. These variables are more inclined towards the service
efficiency as perceived by customers hence it was labelled “Efficiency”. The second
factor relates to the fulfilment. Variables included cover speed at which the Website
pages load at, the availability of the Website and the speed of accessing the Website
hence the dimension was labelled “Fulfilment”. The third factor relates to the security
of the information exchanged, the protection of information, and the assurance with
the transactions and confidence in the service. As a result this dimension was labelled
“Security”. The fourth factor relates to customer feedback and accessibility of the
bank. The variables contained in this factor address issues like how responsive is the
bank and how it communicates on customers’ requests hence it was labelled
“Responsiveness”. Lastly the fifth factor is around contact. The related variables
(questions) relate to the bank offering contact details on the site and having personnel
available online and telephonically. This factor was labelled “Contact”.
4.5 Reliability and Validity Tests
Reliability is broadly defined as the degree to which measures are free from error and
therefore yield consistent results (Zikmund, 2003:300). Kurpius and Stafford
(2006:121) concur by defining reliability as the trustworthiness or accuracy of
measurement. The terms consistency and stability are also used when discussing
reliability. According Kurpius and Stafford (2006:121) reliability coefficient refers to the
scores obtained on a test. A reliability coefficient of zero indicates that the test scores
are unreliable. On the other hand the higher the reliability coefficient, the more reliable
or accurate the test scores. A reliability coefficient is a numerical value that can range
from zero to one. For research purposes, tests with a reliability score of 0.7 and above
are accepted as reliable, whilst for clinical decision making, test scores of between 0.8
and 0.9 are acceptable (Kurpius & Stafford, 2006:121).
The Cronbach’s Alpha Test of reliability was used to test the reliability of the
instrument (model) used for the survey. The reliability test was done on the five
extracted factors or dimensions and the scores are reflected in Table 4.5. Detailed
scores across all dimensions and variables are obtained in Appendix IV. From Table
4.5 it can be seen that the Alpha scores on all dimensions, efficiency, fulfilment,
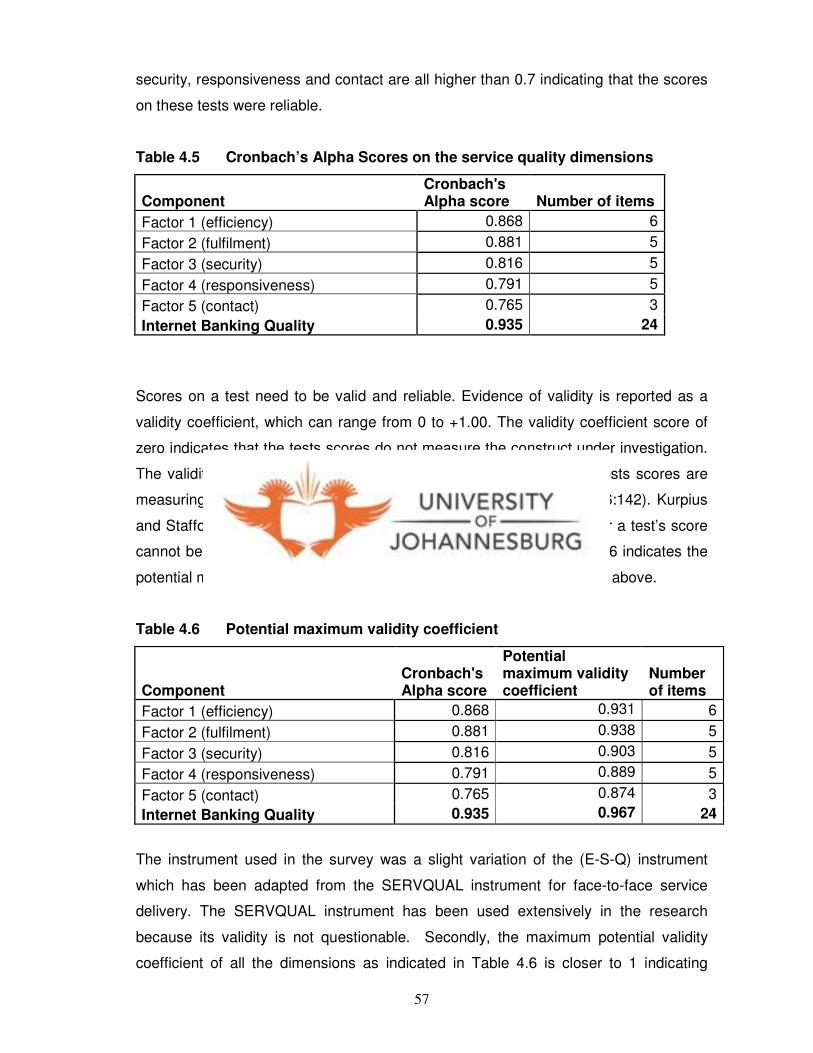
57
security, responsiveness and contact are all higher than 0.7 indicating that the scores
on these tests were reliable.
Table 4.5 Cronbach’s Alpha Scores on the service quality dimensions
Component Cronbach's Alpha score Number of items
Factor 1 (efficiency) 0.868 6
Factor 2 (fulfilment) 0.881 5
Factor 3 (security) 0.816 5
Factor 4 (responsiveness) 0.791 5
Factor 5 (contact) 0.765 3
Internet Banking Quality 0.935 24
Scores on a test need to be valid and reliable. Evidence of validity is reported as a
validity coefficient, which can range from 0 to +1.00. The validity coefficient score of
zero indicates that the tests scores do not measure the construct under investigation.
The validity scores approaching 1 provide strong evidence that the tests scores are
measuring the construct under investigation (Kurpius & Stafford, 2006:142). Kurpius
and Stafford (2006:154) further point out that the validity coefficient for a test’s score
cannot be greater than the square root of the test’s reliability. Table 4.6 indicates the
potential maximum values of the validity coefficient as per the definition above.
Table 4.6 Potential maximum validity coefficient
Component Cronbach's Alpha score
Potential maximum validity coefficient
Number of items
Factor 1 (efficiency) 0.868 0.931 6
Factor 2 (fulfilment) 0.881 0.938 5
Factor 3 (security) 0.816 0.903 5
Factor 4 (responsiveness) 0.791 0.889 5
Factor 5 (contact) 0.765 0.874 3
Internet Banking Quality 0.935 0.967 24
The instrument used in the survey was a slight variation of the (E-S-Q) instrument
which has been adapted from the SERVQUAL instrument for face-to-face service
delivery. The SERVQUAL instrument has been used extensively in the research
because its validity is not questionable. Secondly, the maximum potential validity
coefficient of all the dimensions as indicated in Table 4.6 is closer to 1 indicating
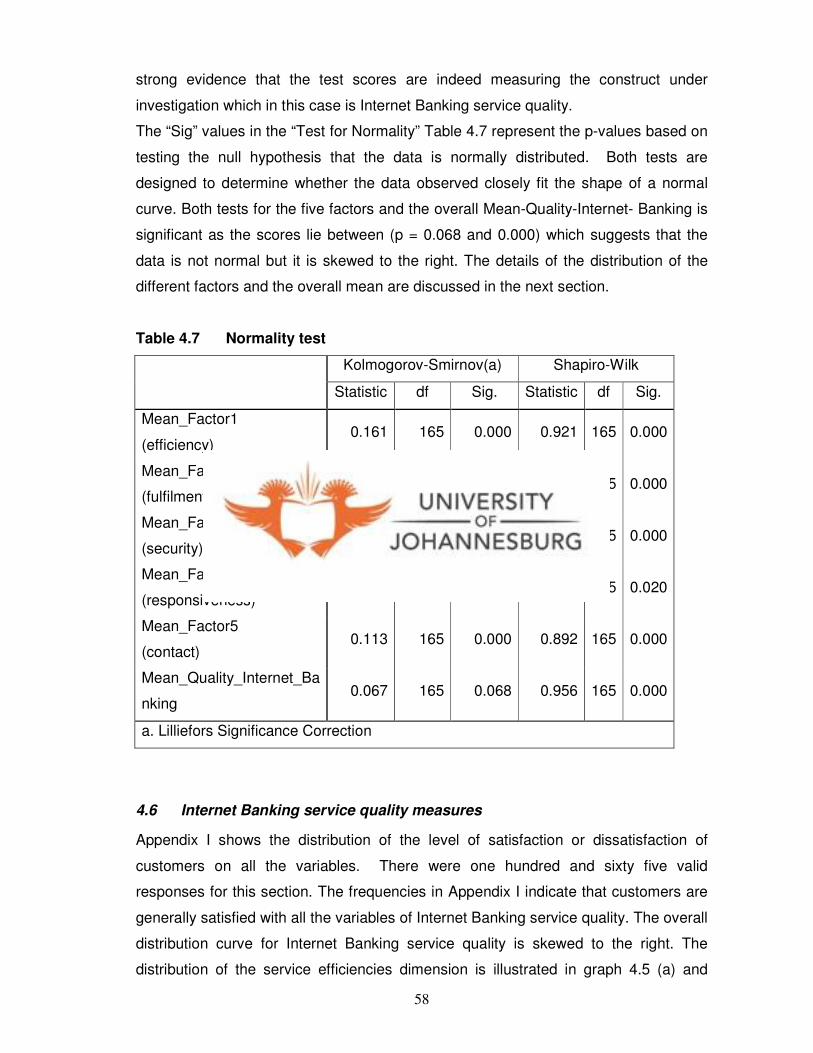
58
strong evidence that the test scores are indeed measuring the construct under
investigation which in this case is Internet Banking service quality.
The “Sig” values in the “Test for Normality” Table 4.7 represent the p-values based on
testing the null hypothesis that the data is normally distributed. Both tests are
designed to determine whether the data observed closely fit the shape of a normal
curve. Both tests for the five factors and the overall Mean-Quality-Internet- Banking is
significant as the scores lie between (p = 0.068 and 0.000) which suggests that the
data is not normal but it is skewed to the right. The details of the distribution of the
different factors and the overall mean are discussed in the next section.
Table 4.7 Normality test
Kolmogorov-Smirnov(a) Shapiro-Wilk
Statistic df Sig. Statistic df Sig.
Mean_Factor1
(efficiency) 0.161 165 0.000 0.921 165 0.000
Mean_Factor2
(fulfilment) 0.108 165 0.000 0.940 165 0.000
Mean_Factor3
(security) 0.115 165 0.000 0.889 165 0.000
Mean_Factor4
(responsiveness) 0.078 165 0.015 0.980 165 0.020
Mean_Factor5
(contact) 0.113 165 0.000 0.892 165 0.000
Mean_Quality_Internet_Ba
nking 0.067 165 0.068 0.956 165 0.000
a. Lilliefors Significance Correction
4.6 Internet Banking service quality measures
Appendix I shows the distribution of the level of satisfaction or dissatisfaction of
customers on all the variables. There were one hundred and sixty five valid
responses for this section. The frequencies in Appendix I indicate that customers are
generally satisfied with all the variables of Internet Banking service quality. The overall
distribution curve for Internet Banking service quality is skewed to the right. The
distribution of the service efficiencies dimension is illustrated in graph 4.5 (a) and
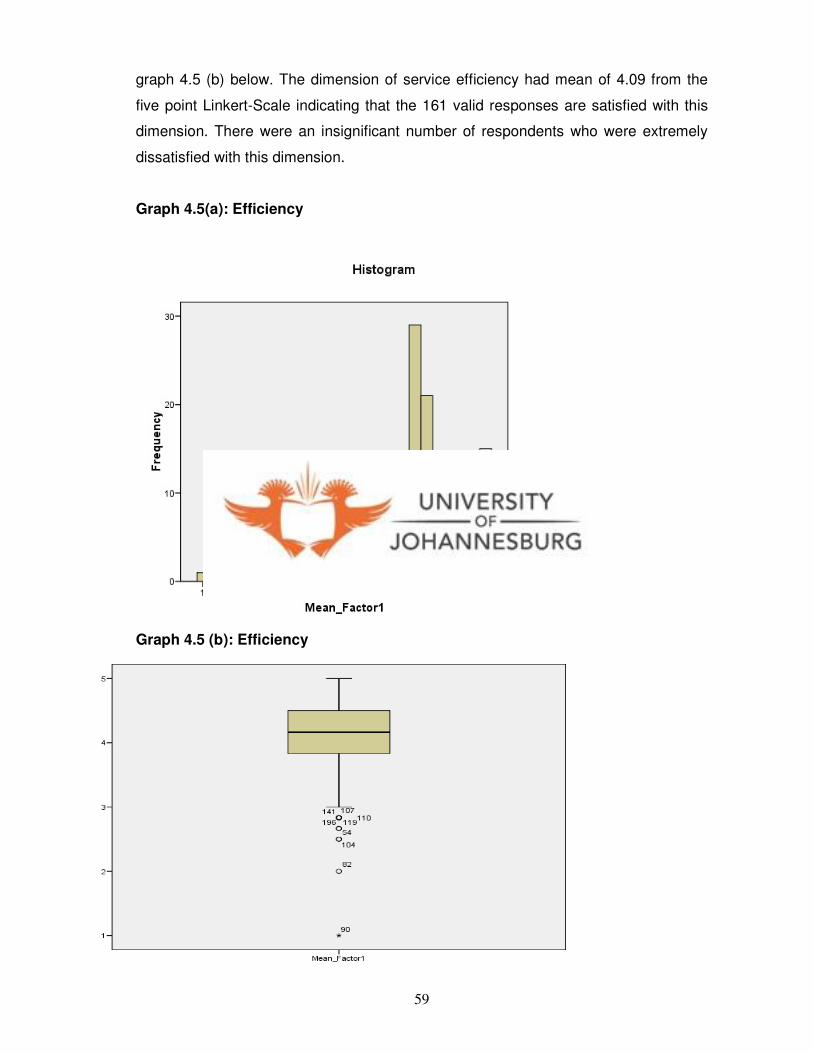
59
graph 4.5 (b) below. The dimension of service efficiency had mean of 4.09 from the
five point Linkert-Scale indicating that the 161 valid responses are satisfied with this
dimension. There were an insignificant number of respondents who were extremely
dissatisfied with this dimension.
Graph 4.5(a): Efficiency
Graph 4.5 (b): Efficiency
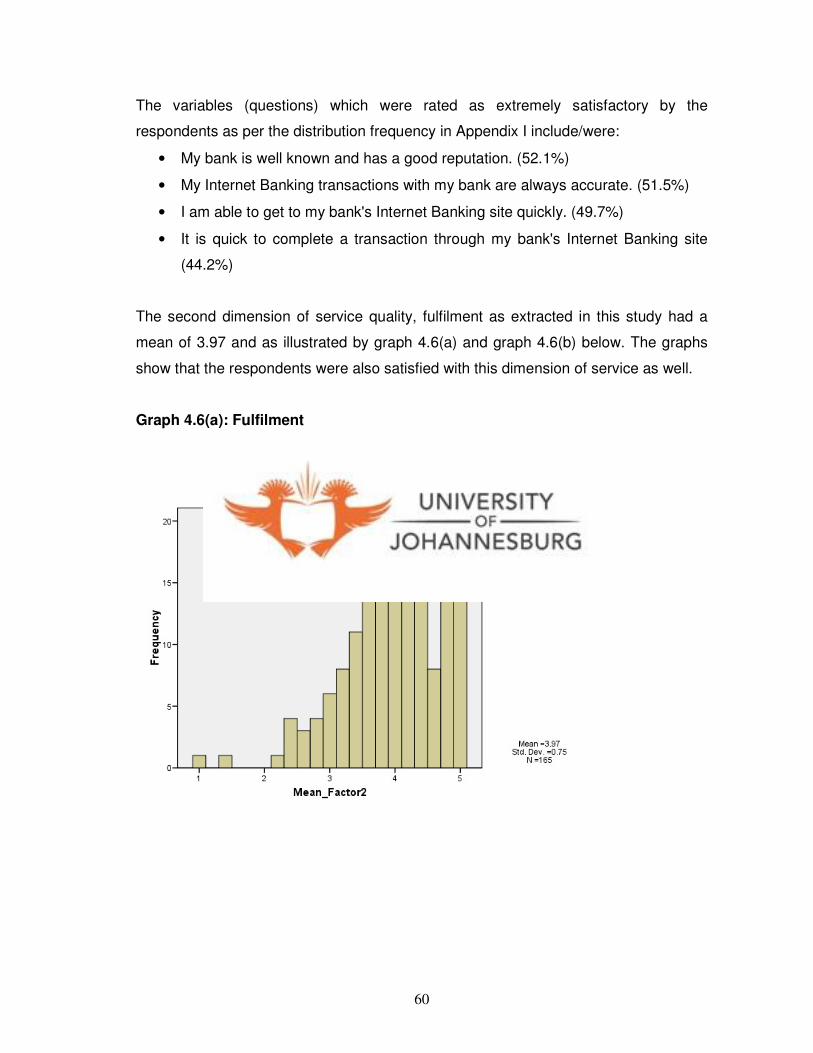
60
The variables (questions) which were rated as extremely satisfactory by the
respondents as per the distribution frequency in Appendix I include/were:
• My bank is well known and has a good reputation. (52.1%)
• My Internet Banking transactions with my bank are always accurate. (51.5%)
• I am able to get to my bank's Internet Banking site quickly. (49.7%)
• It is quick to complete a transaction through my bank's Internet Banking site
(44.2%)
The second dimension of service quality, fulfilment as extracted in this study had a
mean of 3.97 and as illustrated by graph 4.6(a) and graph 4.6(b) below. The graphs
show that the respondents were also satisfied with this dimension of service as well.
Graph 4.6(a): Fulfilment

61
Graph 4.6 (b): Fulfilment
The third dimension of security which encompasses assurance, trust and privacy
indicated a mean north of 4 (4.29) as indicated in graph 4.7(a) and graph 4.7(b)
respectively, showing that the respondents were satisfied with this dimension.
Graph 4.7(a): Security
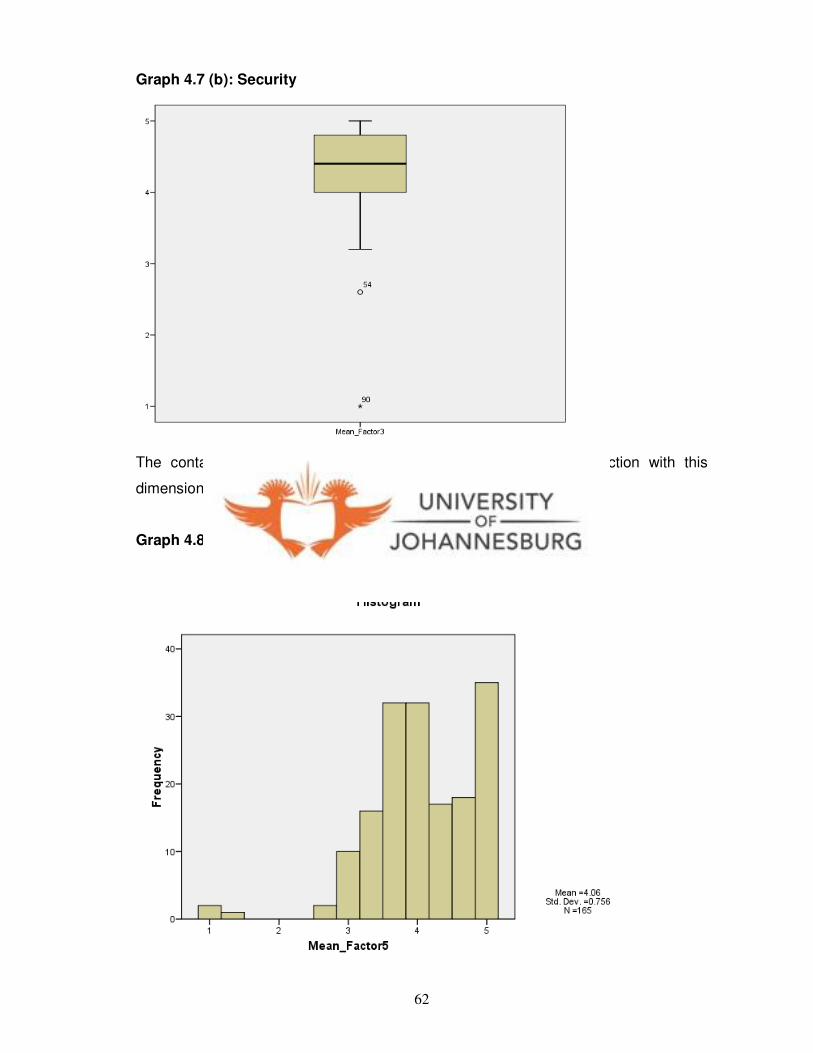
62
Graph 4.7 (b): Security
The contact dimension also had a mean of 4.06 showing satisfaction with this
dimension as indicated in graphs 4.8(a) and 4.8(b).
Graph 4.8(a) : Contact
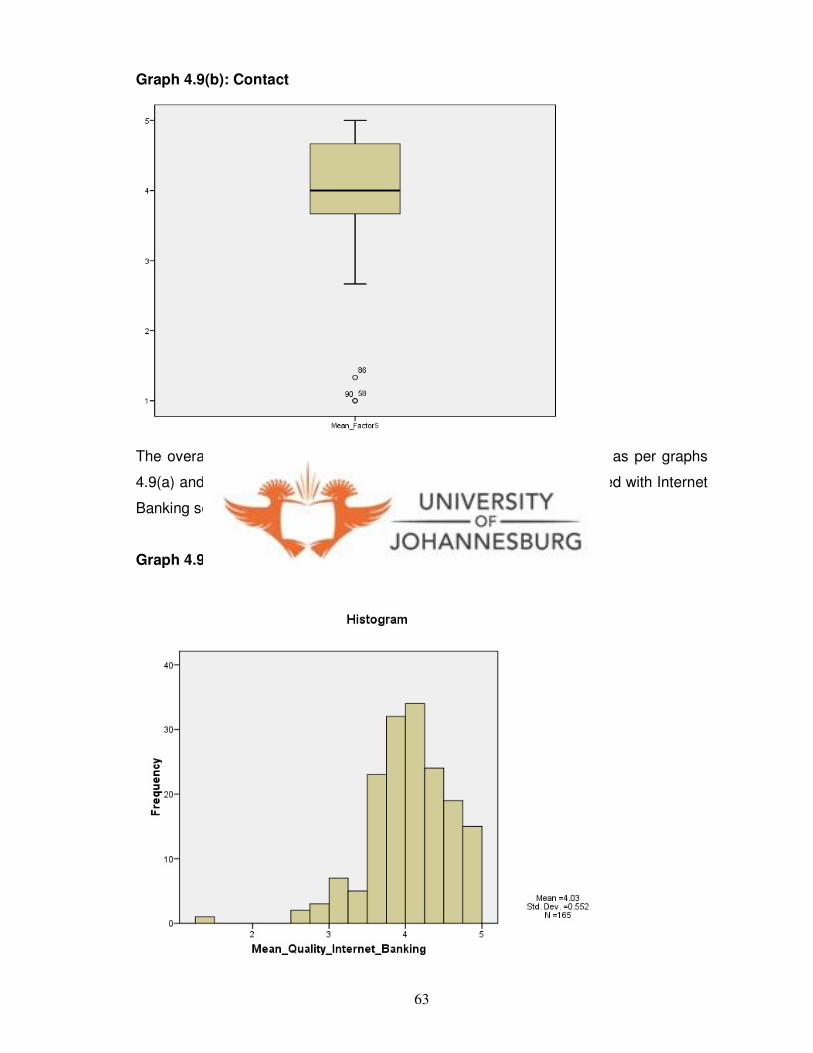
63
Graph 4.9(b): Contact
The overall Internet Banking service quality indicated a mean of 4.03 as per graphs
4.9(a) and 4.9(b) indicating that the respondents were generally satisfied with Internet
Banking service quality.
Graph 4.9(a): Internet Banking Service Quality
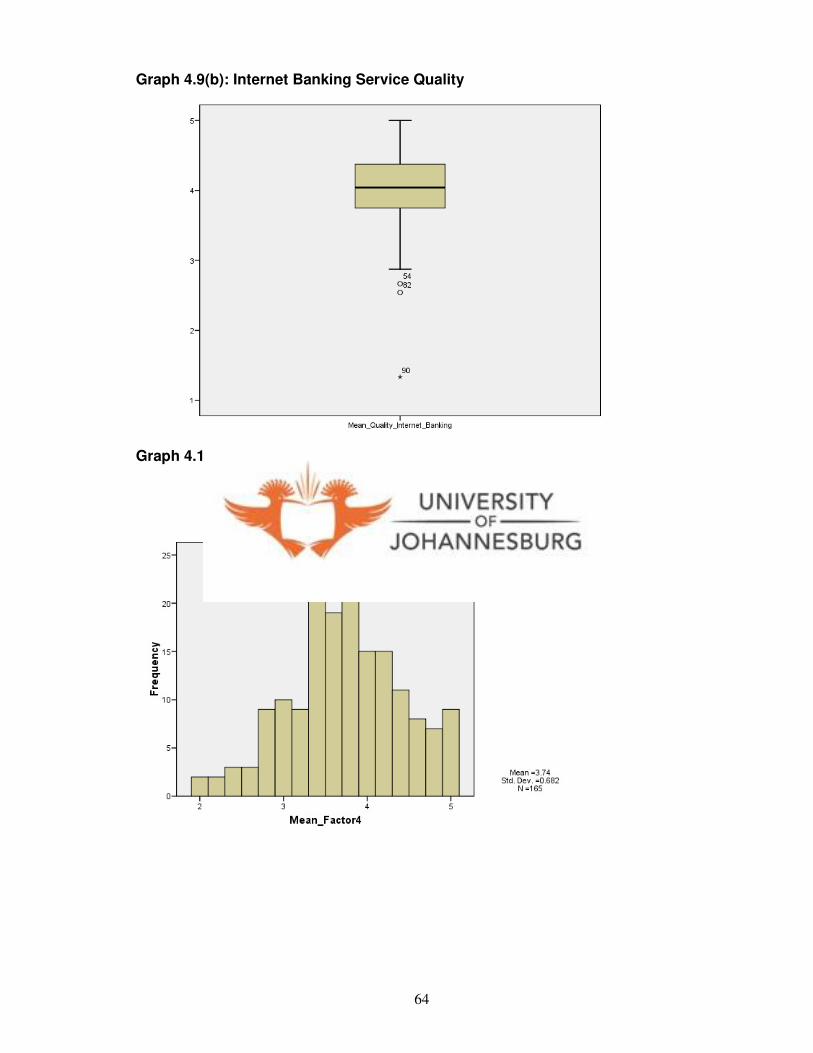
64
Graph 4.9(b): Internet Banking Service Quality
Graph 4.10(a): Responsiveness
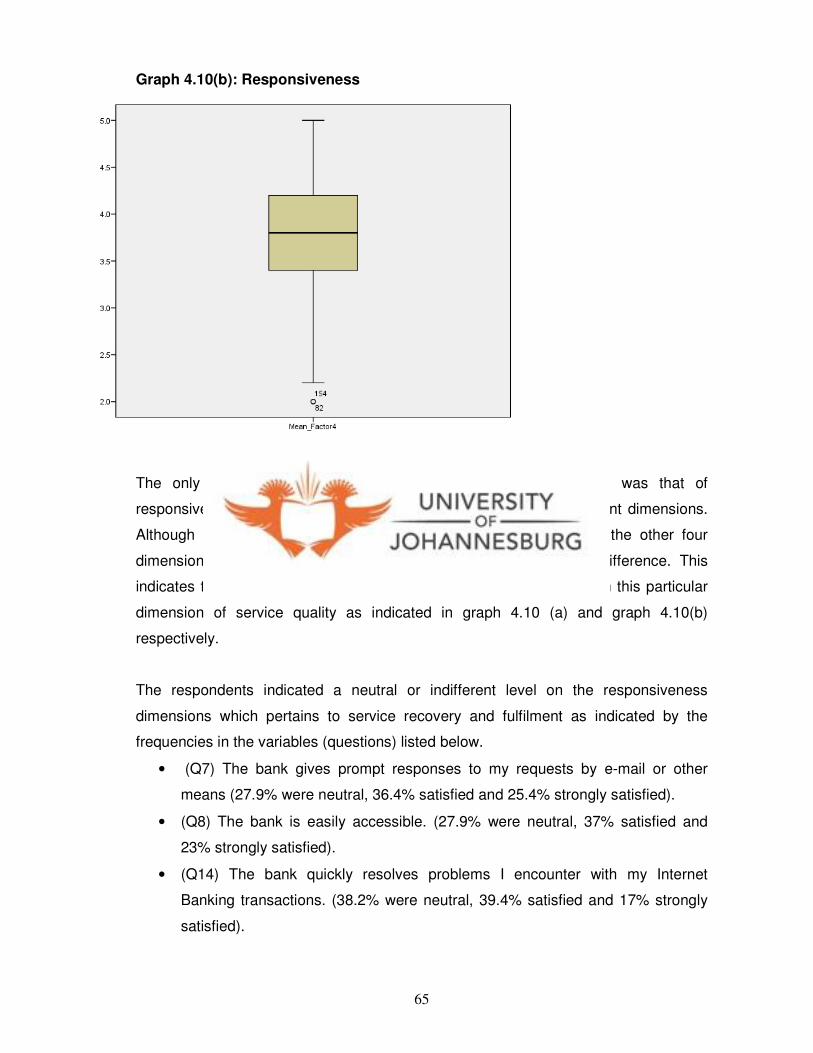
65
Graph 4.10(b): Responsiveness
The only dimension that showed a mean south of 4 at (3.74) was that of
responsiveness which encompasses the communications and fulfilment dimensions.
Although a mean of 3.74 does not look bad, but compared to all the other four
dimensions it is the one where respondents showed the most indifference. This
indicates that most of the respondents were neutral and indifferent on this particular
dimension of service quality as indicated in graph 4.10 (a) and graph 4.10(b)
respectively.
The respondents indicated a neutral or indifferent level on the responsiveness
dimensions which pertains to service recovery and fulfilment as indicated by the
frequencies in the variables (questions) listed below.
• (Q7) The bank gives prompt responses to my requests by e-mail or other
means (27.9% were neutral, 36.4% satisfied and 25.4% strongly satisfied).
• (Q8) The bank is easily accessible. (27.9% were neutral, 37% satisfied and
23% strongly satisfied).
• (Q14) The bank quickly resolves problems I encounter with my Internet
Banking transactions. (38.2% were neutral, 39.4% satisfied and 17% strongly
satisfied).
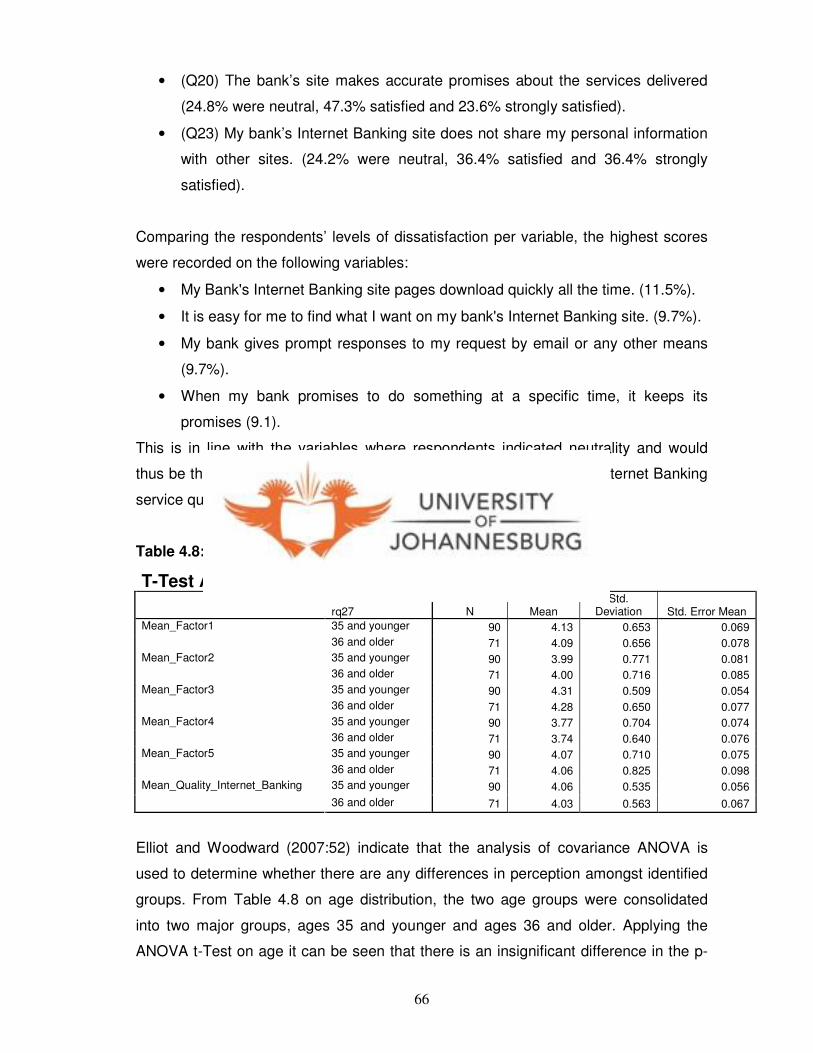
66
• (Q20) The bank’s site makes accurate promises about the services delivered
(24.8% were neutral, 47.3% satisfied and 23.6% strongly satisfied).
• (Q23) My bank’s Internet Banking site does not share my personal information
with other sites. (24.2% were neutral, 36.4% satisfied and 36.4% strongly
satisfied).
Comparing the respondents’ levels of dissatisfaction per variable, the highest scores
were recorded on the following variables:
• My Bank's Internet Banking site pages download quickly all the time. (11.5%).
• It is easy for me to find what I want on my bank's Internet Banking site. (9.7%).
• My bank gives prompt responses to my request by email or any other means
(9.7%).
• When my bank promises to do something at a specific time, it keeps its
promises (9.1).
This is in line with the variables where respondents indicated neutrality and would
thus be the dimension that would need improvement to enhance the Internet Banking
service quality.
Table 4.8: ANOVA T-Test on age
T-Test Age
rq27 N Mean Std.
Deviation Std. Error Mean
35 and younger 90 4.13 0.653 0.069 Mean_Factor1
36 and older 71 4.09 0.656 0.078
35 and younger 90 3.99 0.771 0.081 Mean_Factor2
36 and older 71 4.00 0.716 0.085
35 and younger 90 4.31 0.509 0.054 Mean_Factor3
36 and older 71 4.28 0.650 0.077
35 and younger 90 3.77 0.704 0.074 Mean_Factor4
36 and older 71 3.74 0.640 0.076
35 and younger 90 4.07 0.710 0.075 Mean_Factor5
36 and older 71 4.06 0.825 0.098
35 and younger 90 4.06 0.535 0.056 Mean_Quality_Internet_Banking
36 and older 71 4.03 0.563 0.067
Elliot and Woodward (2007:52) indicate that the analysis of covariance ANOVA is
used to determine whether there are any differences in perception amongst identified
groups. From Table 4.8 on age distribution, the two age groups were consolidated
into two major groups, ages 35 and younger and ages 36 and older. Applying the
ANOVA t-Test on age it can be seen that there is an insignificant difference in the p-
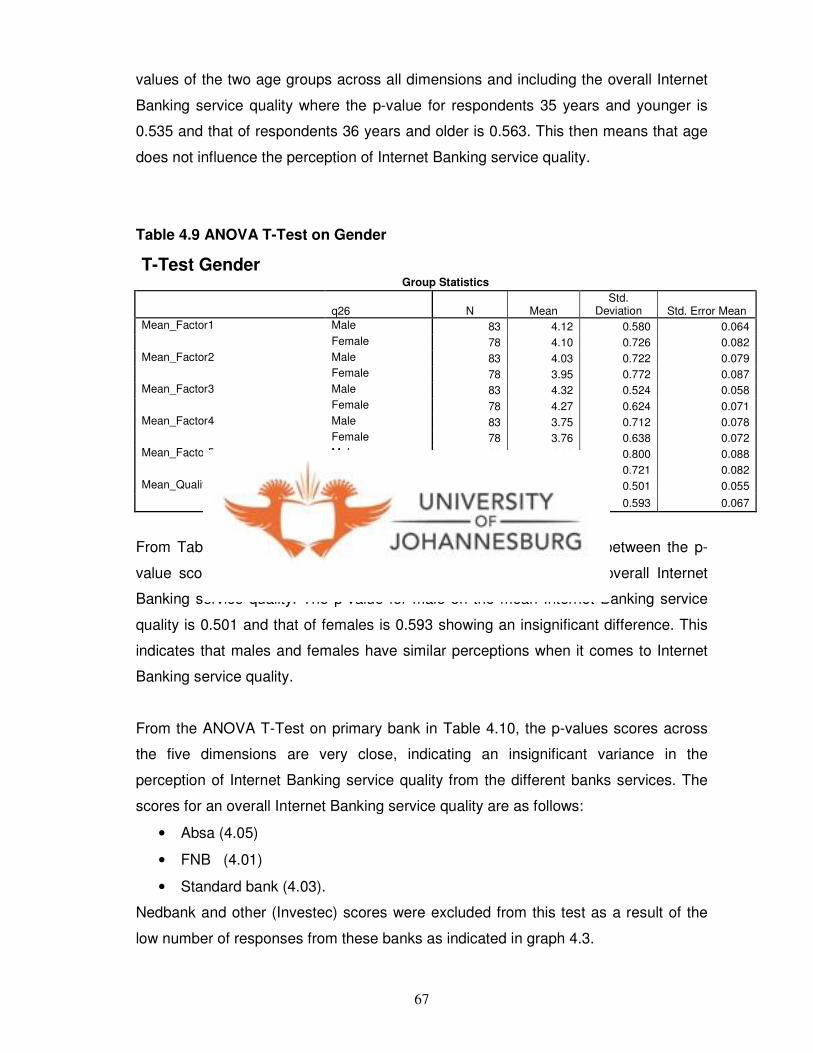
67
values of the two age groups across all dimensions and including the overall Internet
Banking service quality where the p-value for respondents 35 years and younger is
0.535 and that of respondents 36 years and older is 0.563. This then means that age
does not influence the perception of Internet Banking service quality.
Table 4.9 ANOVA T-Test on Gender
T-Test Gender Group Statistics
q26 N Mean Std.
Deviation Std. Error Mean
Male 83 4.12 0.580 0.064 Mean_Factor1
Female 78 4.10 0.726 0.082
Male 83 4.03 0.722 0.079 Mean_Factor2
Female 78 3.95 0.772 0.087
Male 83 4.32 0.524 0.058 Mean_Factor3
Female 78 4.27 0.624 0.071
Male 83 3.75 0.712 0.078 Mean_Factor4
Female 78 3.76 0.638 0.072
Male 83 4.06 0.800 0.088 Mean_Factor5
Female 78 4.08 0.721 0.082
Male 83 4.06 0.501 0.055 Mean_Quality_Internet_Banking
Female 78 4.03 0.593 0.067
From Table 4.9 it is evident that there is an insignificant difference between the p-
value scores on both genders across all dimensions including the overall Internet
Banking service quality. The p-value for male on the mean Internet Banking service
quality is 0.501 and that of females is 0.593 showing an insignificant difference. This
indicates that males and females have similar perceptions when it comes to Internet
Banking service quality.
From the ANOVA T-Test on primary bank in Table 4.10, the p-values scores across
the five dimensions are very close, indicating an insignificant variance in the
perception of Internet Banking service quality from the different banks services. The
scores for an overall Internet Banking service quality are as follows:
• Absa (4.05)
• FNB (4.01)
• Standard bank (4.03).
Nedbank and other (Investec) scores were excluded from this test as a result of the
low number of responses from these banks as indicated in graph 4.3.
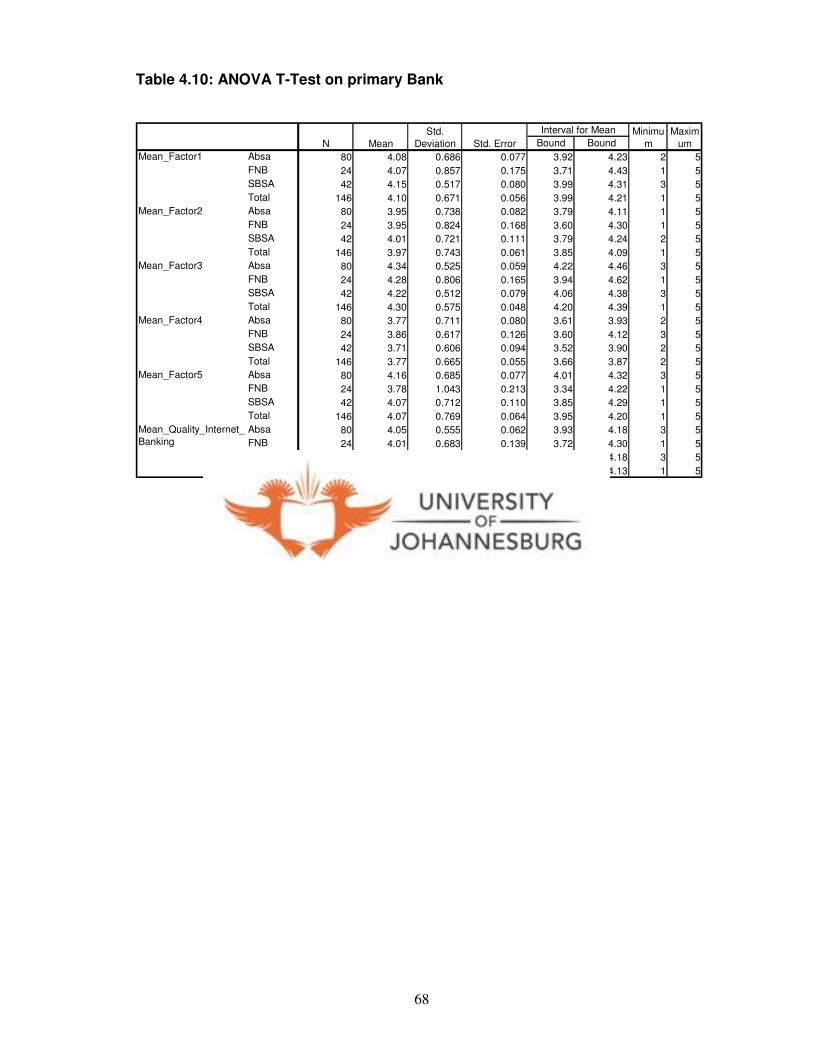
68
Table 4.10: ANOVA T-Test on primary Bank
Bound Bound
Absa 80 4.08 0.686 0.077 3.92 4.23 2 5
FNB 24 4.07 0.857 0.175 3.71 4.43 1 5
SBSA 42 4.15 0.517 0.080 3.99 4.31 3 5
Total 146 4.10 0.671 0.056 3.99 4.21 1 5
Absa 80 3.95 0.738 0.082 3.79 4.11 1 5
FNB 24 3.95 0.824 0.168 3.60 4.30 1 5
SBSA 42 4.01 0.721 0.111 3.79 4.24 2 5
Total 146 3.97 0.743 0.061 3.85 4.09 1 5
Absa 80 4.34 0.525 0.059 4.22 4.46 3 5
FNB 24 4.28 0.806 0.165 3.94 4.62 1 5
SBSA 42 4.22 0.512 0.079 4.06 4.38 3 5
Total 146 4.30 0.575 0.048 4.20 4.39 1 5
Absa 80 3.77 0.711 0.080 3.61 3.93 2 5
FNB 24 3.86 0.617 0.126 3.60 4.12 3 5
SBSA 42 3.71 0.606 0.094 3.52 3.90 2 5
Total 146 3.77 0.665 0.055 3.66 3.87 2 5
Absa 80 4.16 0.685 0.077 4.01 4.32 3 5
FNB 24 3.78 1.043 0.213 3.34 4.22 1 5
SBSA 42 4.07 0.712 0.110 3.85 4.29 1 5
Total 146 4.07 0.769 0.064 3.95 4.20 1 5
Absa 80 4.05 0.555 0.062 3.93 4.18 3 5
FNB 24 4.01 0.683 0.139 3.72 4.30 1 5
SBSA 42 4.03 0.462 0.071 3.89 4.18 3 5
Total 146 4.04 0.550 0.046 3.95 4.13 1 5
N Mean
Std.
Deviation Std. Error
95% Confidence
Interval for Mean Minimu
m
Maxim
um
Mean_Factor1
Mean_Factor2
Mean_Factor3
Mean_Factor4
Mean_Factor5
Mean_Quality_Internet_
Banking

69
Chapter FIVE
INTERPRETATION OF RESULTS
5.1 Introduction.
In this chapter the results presented in Chapter four are interpreted and discussed.
The findings and issues picked up including limitations of the study are also
discussed. The findings are also linked to the literature that was reviewed
5.2 Findings
The findings below were made in respect of the three biographical variables (gender,
age and primary bank) in the survey,
• Gender
It was observed that the p-values between males and females across all five
dimensions were insignificant. This then indicates that there are no differences in
perception or opinion on Internet Banking service quality between males and females.
• Age
The p-values across all variables for the two identified age groups (35 and younger
and older that 36) showed no significant difference. The overall mean on the quality of
Internet Banking was 0.535 for respondents 35 years and younger compared to 0.563
for respondents 36 years and older. This indicates age does not play a major role in
influencing the respondents’ perceptions on Internet banking service quality.
• Primary bank
The Kruskal-Wallis Test in appendix VI indicates that there are no significant
differences in the rankings across all dimensions from the respondents. These
insignificant differences in the rankings imply that the quality of Internet Banking
service delivered by the different banks is perceived in a similar manner by the
respondents.
From the frequency distribution Table in Appendix I, it was observed that the majority
of the respondents gave a perception that they were satisfied with all the five
dimensions of Internet Banking service. The overall p-value for quality of Internet
Banking service was 4.03 as shown in the normality distribution curve in Appendix II,
implying that respondents were satisfied with all the five extracted dimension of
Internet Banking service quality. One particular dimension that showed a neutral

70
perception with a lowest p-value of 3.7 was that of responsiveness. This dimension
comprised of the following variables:
• The bank gives prompt responses to my requests by e-mail or other means
• The bank is easily accessible by phone
• The bank quickly resolves problems I encounter with my Internet Banking
transactions
• The bank’s site makes accurate promises about the services delivered
The neutral or indifferent perception on these variables implies that the banks can
improve overall satisfaction of Internet Banking service quality by:
• Giving prompt response to customers’ requests sent by e-mail or any other
means.
• Ensuring that the banks are easily accessible by phone
• Ensuring that the banks quickly resolves problems customers encounter with
Internet Banking transactions
• Committing to service delivery promises made on their banking sites.
5.3 Findings linked to the literature
5.3.1 Characteristics of service
Zeithaml et al. (2006:21) summarise the characteristics of services that distinguish it
from products as intangibility, heterogeneity, simultaneous production and
consumption and perishability. Heterogeneity as one of the characteristics of service
played a major role in the assessment of the responsiveness dimension of service.
The quality of any service will vary when offered by different employees at different
times. Baron and Harris (2003:20) say organisations providing services know that no
two service provisions are exactly the same, whatever the attempts to standardise
them. It is for this reason that it is not surprising that respondents were indifferent on
the responsiveness dimension of Internet Banking service quality.
5.3.2 Responsiveness in service recovery
Parasuraman et al. (2005:230) on their research on electronic service quality (E-S-
Q), a multiple item scale for assessing electronic service quality, came up with five
managerial implications as described in Chapter Two. From these managerial
71
implications one finding that came up as an area of concern from the analysis of the
survey results was that of the responsiveness dimension. This dimension covers
variables such as communications with customers and solving customers’ problems
which are in line with service recovery. This dimension indeed mirrors aspects of
traditional service such as ready access to company personnel and solving
customers’ problems. The respondents were neutral and indifferent on this dimension.
The critical incident technique as defined by Johnston (1995:65) indicates that
responsiveness is the crucial determinant of quality, as it is the key component in
providing satisfaction and the lack of it is a major source of dissatisfaction
5.3.3 GAPS model
The GAPS model as illustrated in Figures 2.2 depicts non-responsiveness as one of
the major gaps that could contribute to the customer dissatisfaction of service quality.
In this study responsiveness was one of the dimensions where respondents were
most indifferent compared to the other four dimensions. According to Zeithaml et al.,
(2006:34) the gaps occurring within the organization providing the service include:
• Gap1 is about not knowing what customers want.
• Gap2 refers to not selecting the right service designs and standards.
• Gap3 refers to not delivering to service designs and standards.
• Gap4 is about not matching performance to promise.
In this study the responsiveness dimension was the one where respondents were
indifferent.
The overall satisfaction of Internet Banking service quality in this study was skewed to
the right implying that respondents were generally satisfied with the level of service
quality. The two most critical and influential dimensions were that of efficiency and
fulfilment. In the literature Parasuraman et al. (2005:230) describe these two
dimensions as follows: efficiency and fulfilment were the most critical and important
facets of the Website service quality. Of the four E-S-Q dimensions, customers’
assessments of a Website on these two dimensions had the strongest influence not
only on the overall quality perceptions but also on perceived value and loyalty
intentions. The systems availability facet of the Websites was also the critical
contributor to customers’ perceptions of overall quality, value and loyalty intentions.
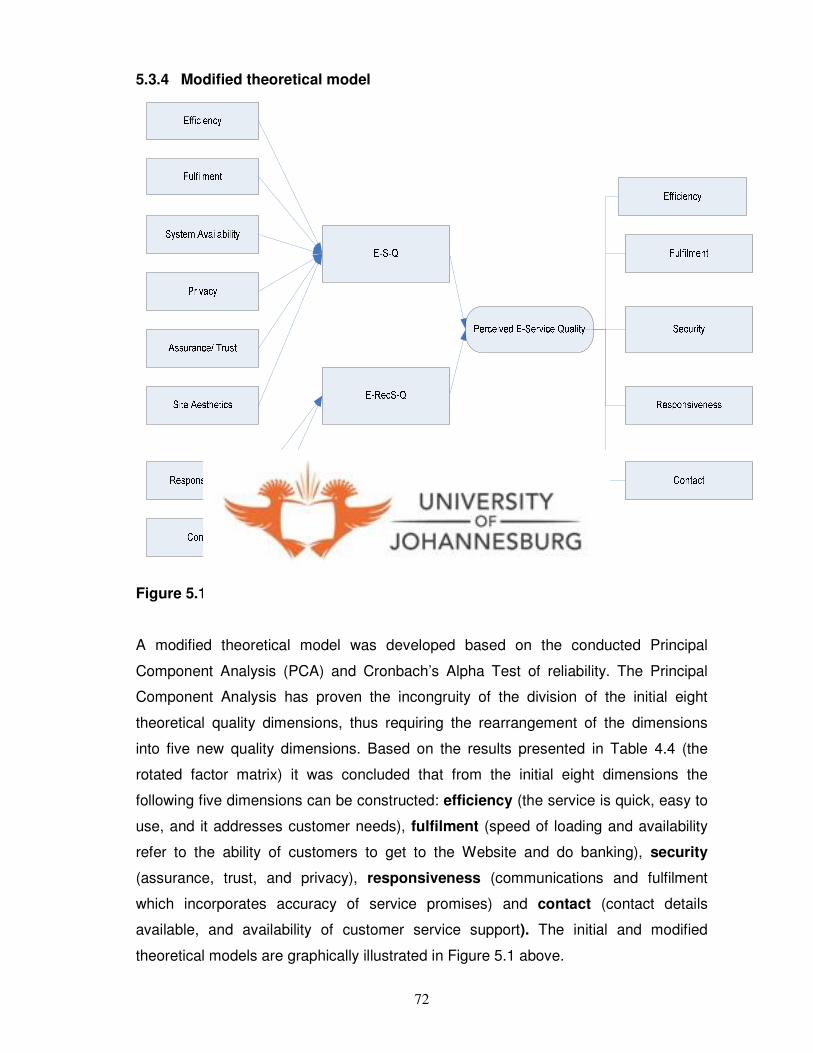
72
5.3.4 Modified theoretical model
Figure 5.1: The initial and modified theoretical model
A modified theoretical model was developed based on the conducted Principal
Component Analysis (PCA) and Cronbach’s Alpha Test of reliability. The Principal
Component Analysis has proven the incongruity of the division of the initial eight
theoretical quality dimensions, thus requiring the rearrangement of the dimensions
into five new quality dimensions. Based on the results presented in Table 4.4 (the
rotated factor matrix) it was concluded that from the initial eight dimensions the
following five dimensions can be constructed: efficiency (the service is quick, easy to
use, and it addresses customer needs), fulfilment (speed of loading and availability
refer to the ability of customers to get to the Website and do banking), security
(assurance, trust, and privacy), responsiveness (communications and fulfilment
which incorporates accuracy of service promises) and contact (contact details
available, and availability of customer service support). The initial and modified
theoretical models are graphically illustrated in Figure 5.1 above.
73
5.4 Limitations to the study
As with any research, there were limitations to this study. Firstly, the respondents’ lists
that would allow for random sampling were not readily available. The sample used
was a non-probability sample because it is was a convenience one. Projecting results
beyond a specific sample in a non-probability sample (convenience) might be
inappropriate. Zikmund (2003:382) points out that convenience samples are best
used for exploratory research when additional research will subsequently be
conducted with a probability sample.
The instrument used, only measured the level of customer satisfaction with different
dimensions characterising Internet Banking services quality, but does not show the
relative importance of each dimension in comparison to the others.
5.5 Conclusion
The following conclusions can be arrived at based on the research results analysis
and interpretation. The overall respondents’ perception of Internet Banking service
quality was skewed to the right, indicating a satisfactory perception. There was no
difference in perception of Internet Banking service quality based on age, gender or
primary bank of the respondents. This implies that Internet Banking service quality
perceptions are not influenced by respondents’ age, gender or bank. The only service
quality dimension where the respondents exhibited a neutral stance was that of
responsiveness. Lastly, the instrument used in the survey was reliable and the results
obtained can be trusted as they have been proven to be valid.
74
Chapter SIX
CONCLUSION AND RECOMMENDATIONS
6.1 Summary of research objectives and major findings
Banks have invested heavily in introducing and making Internet Banking service, with
the objective of improving customer satisfaction and loyalty, ultimately contributing
positively to income and profits. This study’s purpose was to explore customer’s
perceptions on key electronic service dimensions or factors of Internet Banking
service quality. The survey was done with a primary objective of having an insight
into Internet Banking service quality as offered by South African banks. The
secondary objective was to determine if there were any differences in perceptions on
Internet Banking service quality based on gender, age or primary banking institution.
The major findings of the research study were:
• Customers were generally satisfied with Internet Banking service quality.
• Internet Banking customers’ perception on the responsiveness dimension of
service quality was neutral or indifferent. This dimension relates to service
recovery with variables like: the bank giving prompt responses to customer
requests; being easily accessible by phone; speed of resolving problems
encountered with Internet Banking and banks making accurate promises about
the services they deliver on their Websites.
• The variables where the frequency scores were indicating a level of
dissatisfaction were in line with the variables where a level of neutrality was
indicated.
• There were no significant differences in perceptions of Internet Banking service
quality, based on gender, age or primary bank offering Internet Banking
services.
O’Neill, Palmer and Wright (2003:281) concluded that the winners in the online market
space will be those who consistently provide compelling, user-friendly and responsive
online service experiences. Overall Internet Banking customers in South Africa are
satisfied with Internet Banking service quality. However, attention needs to be given to
the service recovery dimension of Internet Banking service which was identified as
responsiveness. These findings mean that Internet Banking service quality is not
75
influenced by gender, age or the bank offering the service. People of different age and
gender have similar Internet Banking service expectations. Lastly the study indicated
that the respondents evaluated Internet Banking service quality on five key
dimensions: efficiency, performance, security, responsiveness and contact
6.2 Recommendations
As outlined in the limitations section of this study it is important to further develop the
instrument in order to better understand Internet Banking service dimensions and their
relative importance as perceived by customers. The analysis of the survey includes
implications to bank mangers as far as satisfaction levels of their customers on
different aspects of Internet Banking are concerned.
The respondents in this study have shown the highest level of indifference or
dissatisfaction with aspects of Internet Banking service quality such as the bank giving
prompt responses to customer requests or complaints, being easily accessible by
phone, speed of resolving problems encountered with Internet Banking and banks
making accurate promises about the services they deliver on their sites. Bank
managers should improve on the following responsiveness or service recovery
aspects of Internet Banking service:
• An improved and closely managed customer complaint management system
and process with tight service levels agreements in place.
• Ensuring that all contact details given on the banks’ information and banking
Websites are manned and relevant responses are given to customers within
reasonable time frames.
• Ensuring that there is proper feedback given to customers on their requests.
Proper feedback might also include an acknowledgement of the request with a
commitment of timelines for resolution.
• Ensuring that the banks meet all obligations and promises that are made on
their Websites.
The results of the analysis indicate that banks perform relatively well on aspects of
Internet Banking such as service efficiency (the service is quick, easy to use, and it
addresses customer needs), fulfilment (speed of loading and availability which refer
to the ability of customers to get to the Website and do banking). It is recommended
that banks keep on innovating in this area as more and many customers are starting
76
to bank online. Banks must always try to exceed the customers’ expectations. This is
one critical area of Internet Banking service that could impact the overall satisfaction
negatively if it were to be allowed to deteriorate or not leave up to customers’
expectations.
Bank managers do not need to segment the market by gender or age to achieve
Internet Banking service quality because the results of this study have revealed that
there is no significant gender-based or age-based difference in so far as Internet
Banking service quality is concerned. .
6.3 Suggestions for further study
The instrument used in this study, only measured the level of customer satisfaction
with different dimensions characterising Internet Banking services quality. The
instrument fell short of showing the relative importance of each dimension in
comparison to the others. It is suggested that a further study on Internet Banking
service quality be undertaken where the relative importance of the dimensions is
tested. The importance-performance analysis (IPA) approach is built around
customer-perceived importance of quality attributes and attributes of performance, the
interplay of which suggests strategies for service improvement and satisfaction
management (Ibrahim et al., 2005:479).
Time permitting and a list of customers using Internet banking available, probability
sampling method could be used to ensure that the survey sample is representative of
the population.
In view of the relative immaturity of online banking, other interesting areas for further
research include:
• A comparison of online banking service quality with traditional service-quality
models.
• An exploration of the difference in customer expectations and perceptions
between online environment and traditional channels.
77
REFERENCES
Akinci A, Aksoy S & Atilgan E. 2004. Adoption of Internet Banking amongst sophisticated consumer segments in an advanced developing country. The International Journal of Bank Marketing, 22(3):212-232. Available from Emerald: http://www.emeraldinsight.com/ [Accessed: 2008-03-03]. Bahia K. & Nantel J. 2000. A reliable and valid measurement scale for the perceived service quality of banks. International Journal of Bank Marketing, 18(2):84-91. Available from Emerald: http://www.emeraldinsight.com/ [Accessed: 2008-08-09]. Barnes SJ & Vidgen R. 2003. Measuring Website quality improvements: A case study of the forum of strategic management, Industrial Management and Data Systems, 103(5):297-309. Available from Emerald: http://www.emeraldinsight.com/ [Accessed: 2008-08-14]. Baron S & Harris K. 2003. Services Marketing. 2nd ed. New York: Palgarve Macmillan. Bateson JEG & Hoffman KD. 1999. Managing Services Marketing. Orlando FL: Dryden. Bauer HH, Hammerschmidt M &Falk T. 2005: Measuring the quality of e-banking portals. International Journal of Bank Marketing, 23(2):153-175. Available from Emerald: http://www.emeraldinsight.com/ [Accessed: 2008-02-16]. Bradley L & Steward K. 2003. A Delphi study of Internet Banking. Marketing Intelligence and Planning, 21(5):272-281. Available from Emerald: http://www.emeraldinsight.com/ [Accessed: 2007-07-24]. Broderick AJ & Vachirapornuk S. 2002. Service quality in Internet Banking: the importance of customer role. Marketing Intelligence and Planning, 20(6):327-335. Available from Emerald: http://www.emeraldinsight.com/ [Accessed: 2008-04-12]. Bucley J. 2003. E-service Quality and the public sector. Managing Service Quality, 13(6):453-462. Available from Emerald: http://www.emeraldinsight.com/ [Accessed: 2008-08-11]. Carrillant FA, Jaramillo F & Mulki PJ. 2007. The validity of the SERVQUAL and SERVPERF scales: A meta-analytic view of 17 years of research across five continents. International Journal of Service Industry Management, 18(5):472-490. Available from Emerald: http://www.emeraldinsight.com/ [Accessed: 2008-02-16]. Cronin J.J & Taylor S.A. 1992. Measuring Service Quality: A re-examination and Extension. Journal of Marketing, 56(3):56-58. Available from Emerald: http://www.emeraldinsight.com/ [Accessed: 2008-08-10]. Davis D. 2000. Business Research for decision making. 5th ed. Pacific Groove: Thomson Learning.
78
Edvardsson B. 1998. Service quality improvements. Managing Service Quality, 8(2):1142-149. Available from Emerald: http://www.emeraldinsight.com/ [Accessed: 2008-01-22]. Elliot AC & Woodward WA. 2007. Statistical Analysis: Quick Reference Guidebook. London:Sage. Flavian C, Guinalίu M & Torres E. 2006. How bricks-and-mortar attributes affect online banking adoption. International Journal of Bank Marketing, 24(6):406-423. Available from Emerald: http://www.emeraldinsight.com/ [Accessed: 2008-04-12]. Goldstuck A. 2004. The Goldstuck Report: Online Banking in South Africa report. Johannesburg. Gurau C. 20002. Online banking in transition economies: the implementation and development of online banking systems in Romania. International Journal of Bank Marketing, 20(6):285-296. Available from Emerald: http://www.emeraldinsight.com/ [Accessed: 2008-07.31]. Ibrahim EE, Joseph M & Ibeh KIN. 2006. Customer perception of electronic service delivery in the UK retail banking sector. International Journal of Bank Marketing, 24(7):475-493. Available from Emerald: http://www.emeraldinsight.com/ [Accessed: 2008-02-17]. Imrie BC, Cadogan JW & McNaughton R. 2002. The service quality construct on a global stage. Managing Service Quality, 12(1):10-18. Available from Emerald: http://www.emeraldinsight.com/ [Accessed: 2008-03-03]. Jayawardhena C. Foley P. 2000. Changes in the banking sector: The case of Internet Banking in the UK. Electronic Networking Applications and Policy, 10(1):19-30. Available from Emerald: http://www.emeraldinsight.com/ [Accessed: 2008-07-17]. Johnson RA & Wichern DW. 1992. Applied Multivariate Statistical Analysis 3rd ed. New Jersey: Prentice-Hall. Johnston R. 1995. The determinants of service quality: satisfiers and dissatisfies. International Journal of Service Industry Management, 6(5):53-71. Available from Emerald: http://www.emeraldinsight.com/ [Accessed: 2008-08-09]. Jun M & Cai S. 2001. The key determinants of Internet banking service quality: a content analysis. International Journal of Bank Marketing, 19(7):276-29. Available from Emerald: http://www.emeraldinsight.com/ [Accessed: 2007-09-24]. Kang G & James J. 2004. Service quality dimensions: an examination of Grönroos's service quality model. Managing Service Quality, 14 (4)266-277. Available from Emerald: http://www.emeraldinsight.com/ [Accessed: 2008-01-22]. Kenova V & Jonnason P. 2006. Quality of Online Banking Services. Bachelor’s Thesis in Business Administration: Jönköping University.
79
Kurpius SER & Stafford ME. 2006. Testing and Measurement: A user friendly guide. London: Sage Martins JH. Lobser M & van Wyk HJ. 1996. Marketing Research: A South African Approach. Parow. CTP. Möls PN. 1998. The Internet and the banks' strategic distribution channel decision. Electronic Networking Applications and Policy, 8(4):331-337. Available from Emerald: http://www.emeraldinsight.com/ [Accessed: 2008-04-22]. Mukherjee A & Nath P. 2005. An empirical assessment of comparative approaches to service quality measurement. Journal of service marketing. 19(3):174-184. Available from Emerald: http://www.emeraldinsight.com/ [Accessed: 2008-05-26]. Oliver RL. 1980. A cognitive model of the antecedents and consequences of satisfaction decisions, Journal of marketing research (17) 4: 460-469. Available from Emerald: http://www.emeraldinsight.com/ [Accessed: 2008-09-04]. O'Neill M, Palmer A & Wright C. 2003. Disconfirming user expectations of the online service experience: Inferred versus direct disconfirmation modelling. Internet Research: Electronic Networking Applications and Policy. 13(4):281-296. Available from Emerald: http://www.emeraldinsight.com/ [Accessed: 2008-01-30]. O’Sullivan J, Edmond D & ter Hofstede. 2002. Service Description: A survey of the general nature of services. Distributed and Parallel Database, 12(2):117-133. Available from Emerald: http://www.emeraldinsight.com/ [Accessed: 2008.01-30]. Oppewal H & Vriens M. 2000. Measuring perceived service quality using integrated conjoint experiments. International Journal of Bank Marketing, 18(4):154-169. Available from Emerald: http://www.emeraldinsight.com/ [Accessed: 2008-02-17]. Parasuraman A. 2004. Assessing and improving service performance for maximum impact: Insight from a two decade-long research journey. Performance Measurement and Metrics, 5(2):45-52. Available from Emerald: http://www.emeraldinsight.com/ [Accessed: 2008-02-05]. Parasuraman A, Zeithamal V.A & Malhotra A. 2005. E-S-QUAL: A Multiple-Item Scale for Assessing Electronic Service Quality. Journal of Service Research, 7(3):213-233. Available from Emerald: http://www.emeraldinsight.com/ [Accessed: 2006-08-08]. Pikkarainen T, Pikkarainen K, Karjaluoto H & Pahnila S. 2004. Consumer acceptance of online banking: An extension of the technology acceptance model. Internet research, 14(3):224-235. Available from Emerald: http://www.emeraldinsight.com/ [Accessed: 2006-05-29]. Roynolds R.A, Woods R & Baker J.D. 2007. Handbook of Research on Electronic Surveys and Measurements. Hershey. Idea Group. Rowley J. 2006. An analysis of the literature: Towards a research agenda. Internet research, 16(3):339-359.Available from Emerald: http://www.emeraldinsight.com/ [Accessed: 2008-01-30].
80
Santos J. 2003. E-service quality: a model of virtual service quality dimensions. Managing Service Quality, 13(3):233-246. Available from Emerald: http://www.emeraldinsight.com/ [Accessed: 2008-07-08]. Sathye M. 1999. Adoption of Internet Banking by Australian consumers: an empirical investigation. International Journal of Bank Marketing, 17(7):324-334. Available from Emerald: http://www.emeraldinsight.com/ [Accessed: 2008-02-05]. Sayar C. & Wolfe S. 2007. Internet Banking market performance: Turkey versus UK. International Journal of Bank Marketing, 25(3):122-141. Available from Emerald: http://www.emeraldinsight.com/ [Accessed: 2008-02-17]. Schmidt MJ & Hollensen S. 2006. Marketing Research: An International Approach. England: Pearson Education Singh A.M. 2004. Trends in South African Internet Banking. Aslib Proceedings: New Information Perspectives, 56(3):187-196. Available from Emerald: http://www.emeraldinsight.com/ [Accessed: 2008-03-03]. Sohail M.S & Shaikh NM. 2008. Internet Banking and quality of service: Perspectives from a developing nation in the Middle East. Online Information Review, 32(1):58-72. Available from Emerald: http://www.emeraldinsight.com/ [Accessed: 2008-04-12]. Sweeney JC & Lapp W. 2004. Critical service quality encounters on the Web: an exploratory study. Journal of Services Marketing, 18(4):276-289. Available from Emerald: http://www.emeraldinsight.com/ [Accessed: 2008-01-30]. Yang Z & Fang X. 2004. Online service dimensions and their relationship with satisfaction: A content analysis of customer reviews of securities brokerage. Managing Service Quality, 15(3):302-325. Available from Emerald: http://www.emeraldinsight.com/ [Accessed: 2008-08.14]. Zeithaml VA & Bitner MJ. 1996. Services Marketing. New York: McGraw-Hill. Zeithaml VA, Bitner MJ & Gremler DD. 2006. Services Marketing: Integrating Customer Focus Across the Firm. New York: McGraw-Hill Zeithaml VA. 2002. Service excellence in electronic channels. Managing Service Quality, 12(3):135-138. Available from Emerald: http://www.emeraldinsight.com/ [Accessed: 2008-02-05]. Zikmund WG. 2003. Business Research Methods, 7th ed. Ohio. Thomson.
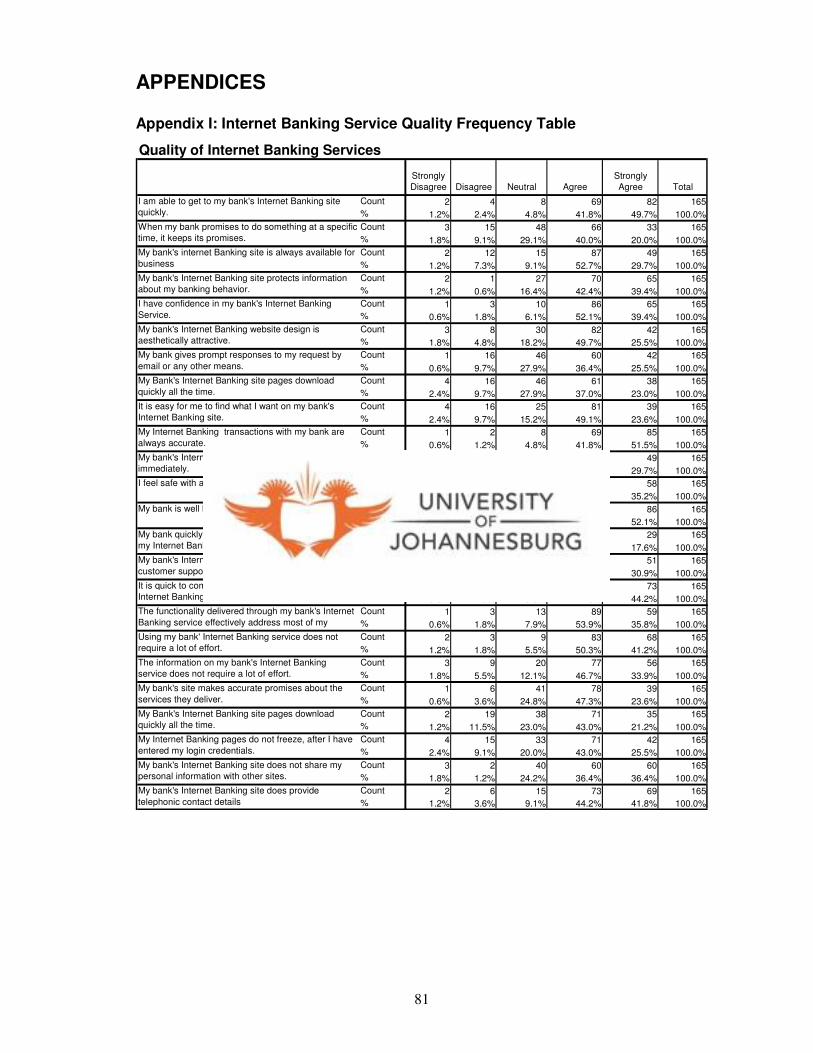
81
APPENDICES Appendix I: Internet Banking Service Quality Frequency Table
Quality of Internet Banking Services
Strongly
Disagree Disagree Neutral Agree
Strongly
Agree Total
Count 2 4 8 69 82 165
% 1.2% 2.4% 4.8% 41.8% 49.7% 100.0%
Count 3 15 48 66 33 165
% 1.8% 9.1% 29.1% 40.0% 20.0% 100.0%
Count 2 12 15 87 49 165
% 1.2% 7.3% 9.1% 52.7% 29.7% 100.0%
Count 2 1 27 70 65 165
% 1.2% 0.6% 16.4% 42.4% 39.4% 100.0%
Count 1 3 10 86 65 165
% 0.6% 1.8% 6.1% 52.1% 39.4% 100.0%
Count 3 8 30 82 42 165
% 1.8% 4.8% 18.2% 49.7% 25.5% 100.0%
Count 1 16 46 60 42 165
% 0.6% 9.7% 27.9% 36.4% 25.5% 100.0%
Count 4 16 46 61 38 165
% 2.4% 9.7% 27.9% 37.0% 23.0% 100.0%
Count 4 16 25 81 39 165
% 2.4% 9.7% 15.2% 49.1% 23.6% 100.0%
Count 1 2 8 69 85 165
% 0.6% 1.2% 4.8% 41.8% 51.5% 100.0%
Count 1 10 32 73 49 165
% 0.6% 6.1% 19.4% 44.2% 29.7% 100.0%
Count 1 5 23 78 58 165
% 0.6% 3.0% 13.9% 47.3% 35.2% 100.0%
Count 1 5 4 69 86 165
% 0.6% 3.0% 2.4% 41.8% 52.1% 100.0%
Count 2 6 63 65 29 165
% 1.2% 3.6% 38.2% 39.4% 17.6% 100.0%
Count 4 11 30 69 51 165
% 2.4% 6.7% 18.2% 41.8% 30.9% 100.0%
Count 1 8 14 69 73 165
% 0.6% 4.8% 8.5% 41.8% 44.2% 100.0%
Count 1 3 13 89 59 165
% 0.6% 1.8% 7.9% 53.9% 35.8% 100.0%
Count 2 3 9 83 68 165
% 1.2% 1.8% 5.5% 50.3% 41.2% 100.0%
Count 3 9 20 77 56 165
% 1.8% 5.5% 12.1% 46.7% 33.9% 100.0%
Count 1 6 41 78 39 165
% 0.6% 3.6% 24.8% 47.3% 23.6% 100.0%
Count 2 19 38 71 35 165
% 1.2% 11.5% 23.0% 43.0% 21.2% 100.0%
Count 4 15 33 71 42 165
% 2.4% 9.1% 20.0% 43.0% 25.5% 100.0%
Count 3 2 40 60 60 165
% 1.8% 1.2% 24.2% 36.4% 36.4% 100.0%
Count 2 6 15 73 69 165
% 1.2% 3.6% 9.1% 44.2% 41.8% 100.0%
My Bank's Internet Banking site pages download
quickly all the time.
My Internet Banking pages do not freeze, after I have
entered my login credentials.
My bank's Internet Banking site does not share my
personal information with other sites.
My bank's Internet Banking site does provide
telephonic contact details
The functionality delivered through my bank's Internet
Banking service effectively address most of my
banking needs.Using my bank' Internet Banking service does not
require a lot of effort.
The information on my bank's Internet Banking
service does not require a lot of effort.
My bank's site makes accurate promises about the
services they deliver.
My bank is well known and has a good reputation.
My bank quickly resolves problems I encounter with
my Internet Banking transactions.
My bank's Internet Banking service does have
customer support staff available on email and/or
telephonically.It is quick to complete a transaction through my bank's
Internet Banking site
It is easy for me to find what I want on my bank's
Internet Banking site.
My Internet Banking transactions with my bank are
always accurate.
My bank's Internet Banking site launches and runs
immediately.
I feel safe with all my internet banking transactions.
I have confidence in my bank's Internet Banking
Service.
My bank's Internet Banking website design is
aesthetically attractive.
My bank gives prompt responses to my request by
email or any other means.
My Bank's Internet Banking site pages download
quickly all the time.
I am able to get to my bank's Internet Banking site
quickly.
When my bank promises to do something at a specific
time, it keeps its promises.
My bank's internet Banking site is always available for
business
My bank's Internet Banking site protects information
about my banking behavior.
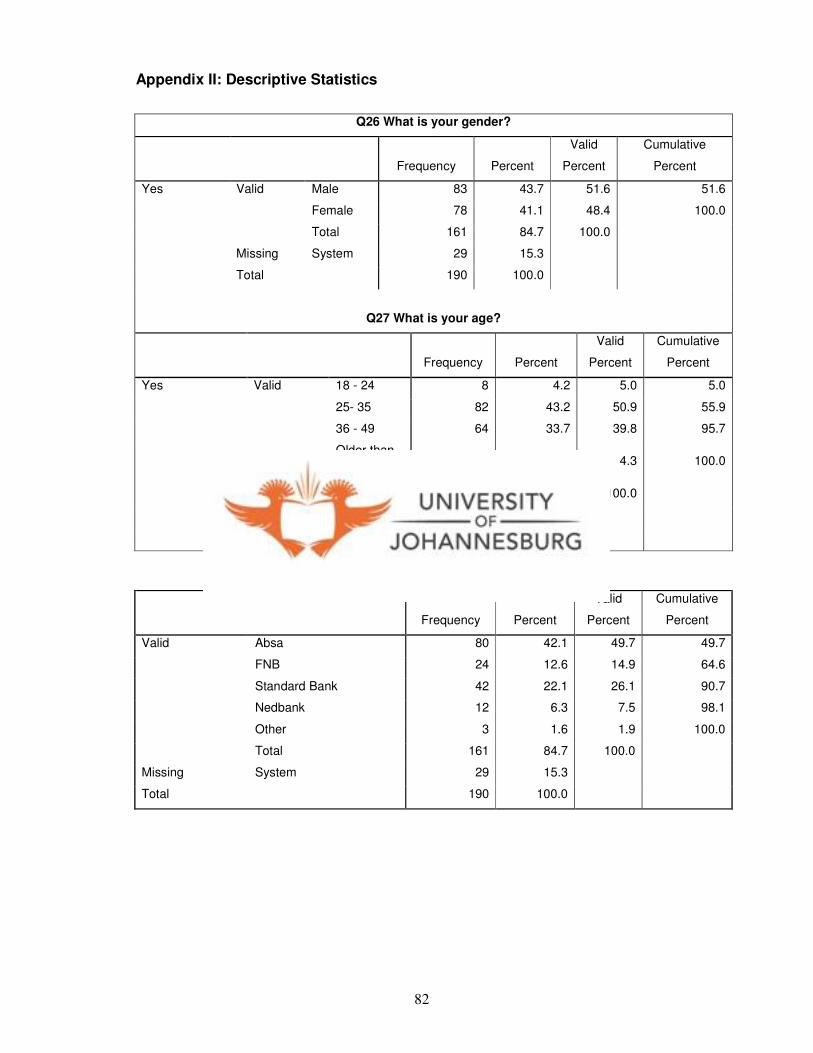
82
Appendix II: Descriptive Statistics
Q26 What is your gender?
Frequency Percent
Valid
Percent
Cumulative
Percent
Male 83 43.7 51.6 51.6
Female 78 41.1 48.4 100.0
Valid
Total 161 84.7 100.0
Missing System 29 15.3
Yes
Total 190 100.0
Q27 What is your age?
Frequency Percent
Valid
Percent
Cumulative
Percent
18 - 24 8 4.2 5.0 5.0
25- 35 82 43.2 50.9 55.9
36 - 49 64 33.7 39.8 95.7
Older than
50 7 3.7 4.3 100.0
Valid
Total 161 84.7 100.0
Missing System 29 15.3
Yes
Total 190 100.0
Q25 Where you do most of your Internet Banking?
Frequency Percent
Valid
Percent
Cumulative
Percent
Absa 80 42.1 49.7 49.7
FNB 24 12.6 14.9 64.6
Standard Bank 42 22.1 26.1 90.7
Nedbank 12 6.3 7.5 98.1
Other 3 1.6 1.9 100.0
Valid
Total 161 84.7 100.0
Missing System 29 15.3
Total 190 100.0
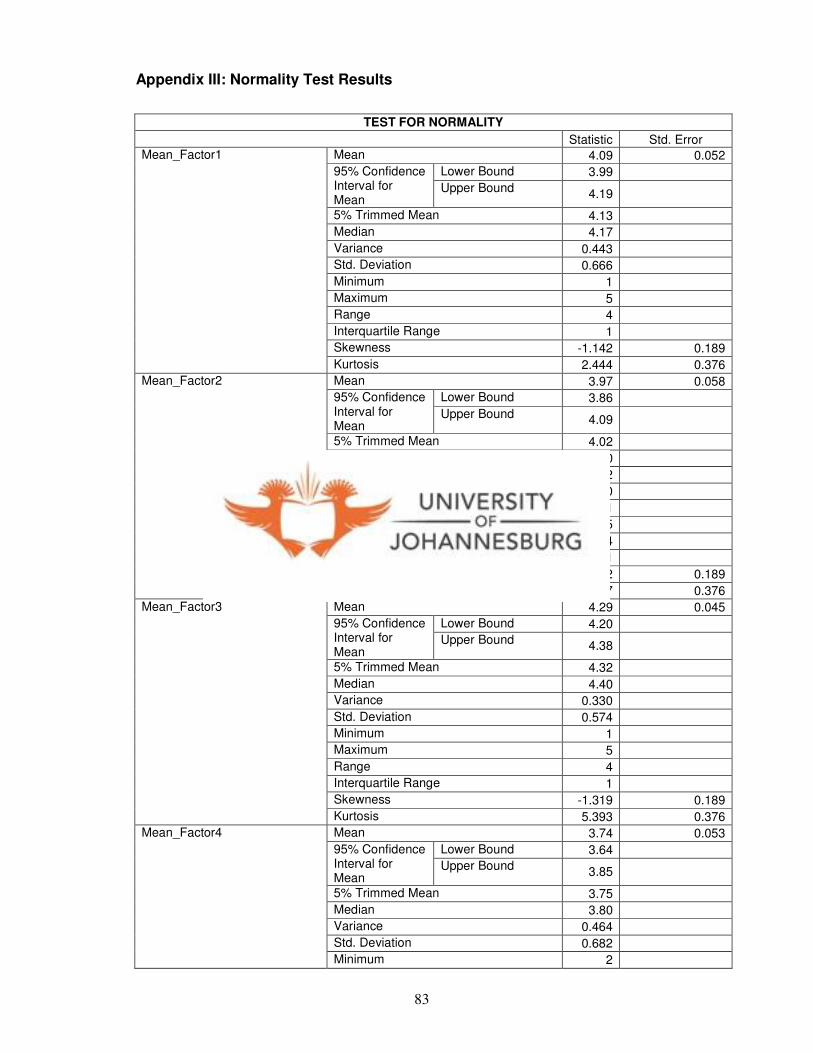
83
Appendix III: Normality Test Results
TEST FOR NORMALITY
Statistic Std. Error
Mean 4.09 0.052
Lower Bound 3.99 95% Confidence Interval for Mean
Upper Bound 4.19
5% Trimmed Mean 4.13
Median 4.17
Variance 0.443
Std. Deviation 0.666
Minimum 1
Maximum 5
Range 4
Interquartile Range 1
Skewness -1.142 0.189
Mean_Factor1
Kurtosis 2.444 0.376
Mean 3.97 0.058
Lower Bound 3.86 95% Confidence Interval for Mean
Upper Bound 4.09
5% Trimmed Mean 4.02
Median 4.00
Variance 0.562
Std. Deviation 0.750
Minimum 1
Maximum 5
Range 4
Interquartile Range 1
Skewness -0.882 0.189
Mean_Factor2
Kurtosis 1.187 0.376
Mean 4.29 0.045
Lower Bound 4.20 95% Confidence Interval for Mean
Upper Bound 4.38
5% Trimmed Mean 4.32
Median 4.40
Variance 0.330
Std. Deviation 0.574
Minimum 1
Maximum 5
Range 4
Interquartile Range 1
Skewness -1.319 0.189
Mean_Factor3
Kurtosis 5.393 0.376
Mean 3.74 0.053
Lower Bound 3.64 95% Confidence Interval for Mean
Upper Bound 3.85
5% Trimmed Mean 3.75
Median 3.80
Variance 0.464
Std. Deviation 0.682
Mean_Factor4
Minimum 2
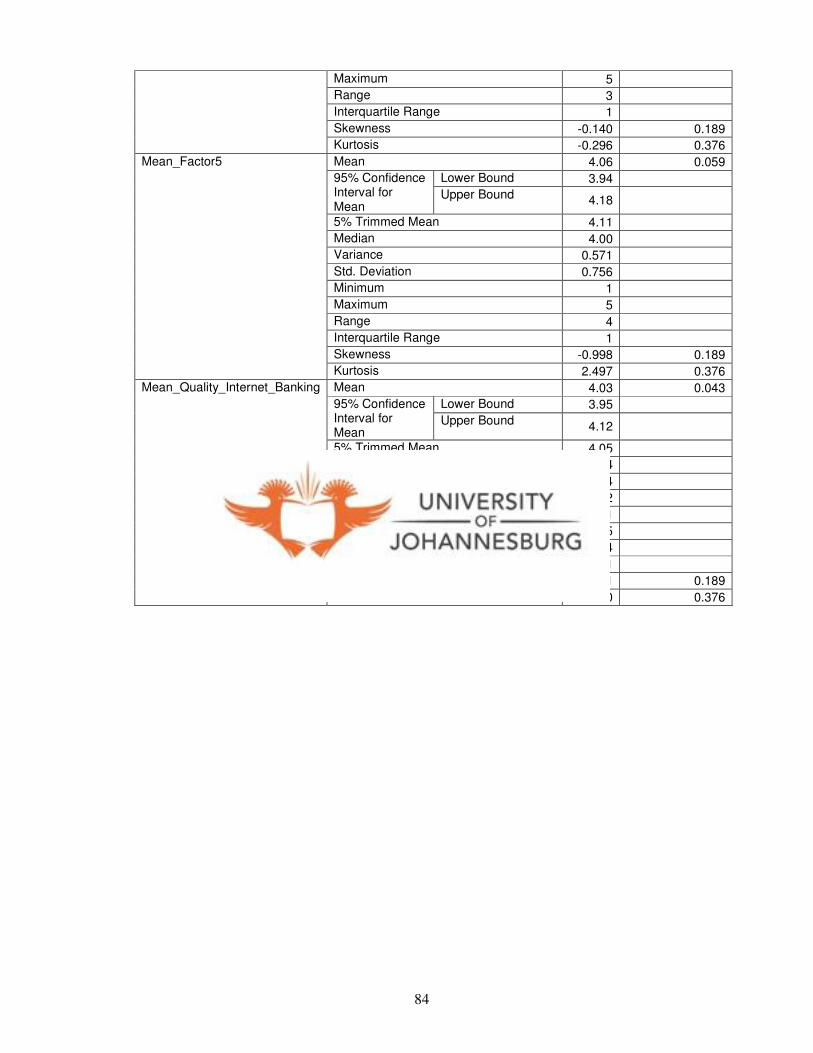
84
Maximum 5
Range 3
Interquartile Range 1
Skewness -0.140 0.189
Kurtosis -0.296 0.376
Mean 4.06 0.059
Lower Bound 3.94 95% Confidence Interval for Mean
Upper Bound 4.18
5% Trimmed Mean 4.11
Median 4.00
Variance 0.571
Std. Deviation 0.756
Minimum 1
Maximum 5
Range 4
Interquartile Range 1
Skewness -0.998 0.189
Mean_Factor5
Kurtosis 2.497 0.376
Mean 4.03 0.043
Lower Bound 3.95 95% Confidence Interval for Mean
Upper Bound 4.12
5% Trimmed Mean 4.05
Median 4.04
Variance 0.304
Std. Deviation 0.552
Minimum 1
Maximum 5
Range 4
Interquartile Range 1
Skewness -0.891 0.189
Mean_Quality_Internet_Banking
Kurtosis 2.790 0.376
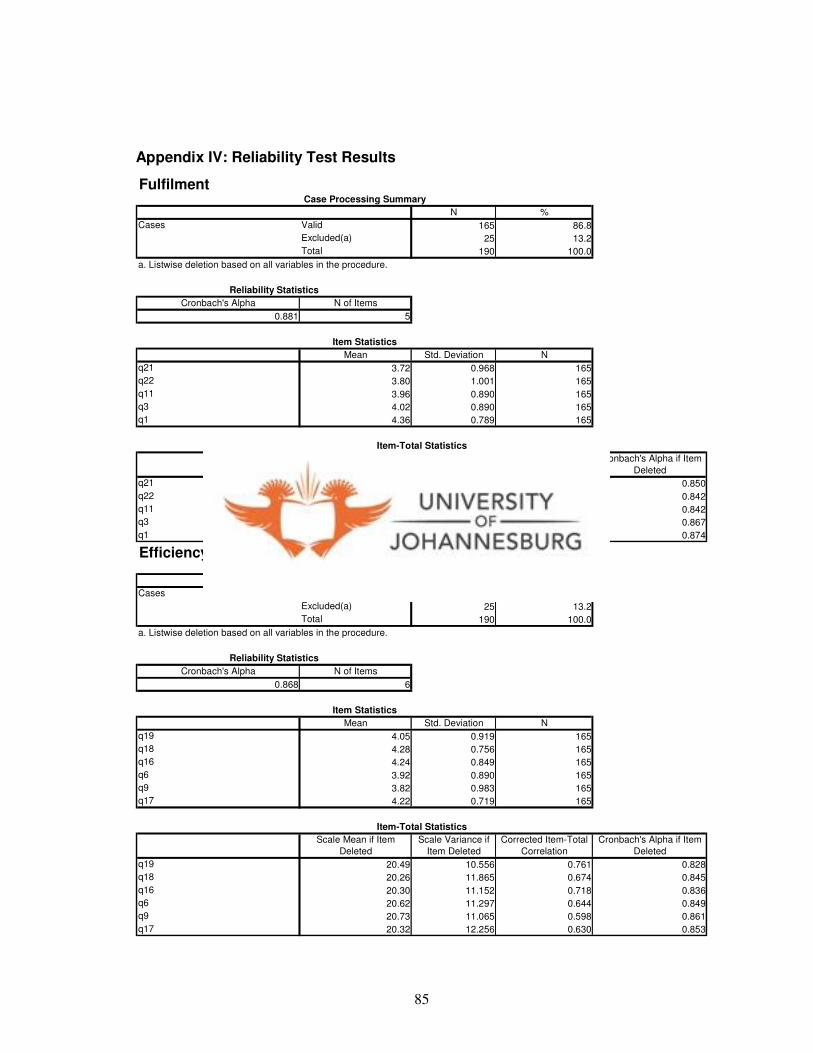
85
Appendix IV: Reliability Test Results
Fulfilment
N %
Valid 165 86.8
Excluded(a) 25 13.2
Total 190 100.0
Cronbach's Alpha N of Items
0.881 5
Mean Std. Deviation N
q21 3.72 0.968 165
q22 3.80 1.001 165
q11 3.96 0.890 165
q3 4.02 0.890 165
q1 4.36 0.789 165
Scale Mean if Item
Deleted
Scale Variance if
Item Deleted
Corrected Item-Total
Correlation
Cronbach's Alpha if Item
Deleted
q21 16.15 8.861 0.739 0.850
q22 16.07 8.538 0.772 0.842
q11 15.90 9.100 0.776 0.842
q3 15.84 9.597 0.665 0.867
q1 15.50 10.215 0.638 0.874
Case Processing Summary
Cases
a. Listwise deletion based on all variables in the procedure.
Reliability Statistics
Item Statistics
Item-Total Statistics
Efficiency
N %
Valid 165 86.8
Excluded(a) 25 13.2
Total 190 100.0
Cronbach's Alpha N of Items
0.868 6
Mean Std. Deviation N
q19 4.05 0.919 165
q18 4.28 0.756 165
q16 4.24 0.849 165
q6 3.92 0.890 165
q9 3.82 0.983 165
q17 4.22 0.719 165
Scale Mean if Item
Deleted
Scale Variance if
Item Deleted
Corrected Item-Total
Correlation
Cronbach's Alpha if Item
Deleted
q19 20.49 10.556 0.761 0.828
q18 20.26 11.865 0.674 0.845
q16 20.30 11.152 0.718 0.836
q6 20.62 11.297 0.644 0.849
q9 20.73 11.065 0.598 0.861
q17 20.32 12.256 0.630 0.853
Case Processing Summary
Cases
a. Listwise deletion based on all variables in the procedure.
Reliability Statistics
Item Statistics
Item-Total Statistics
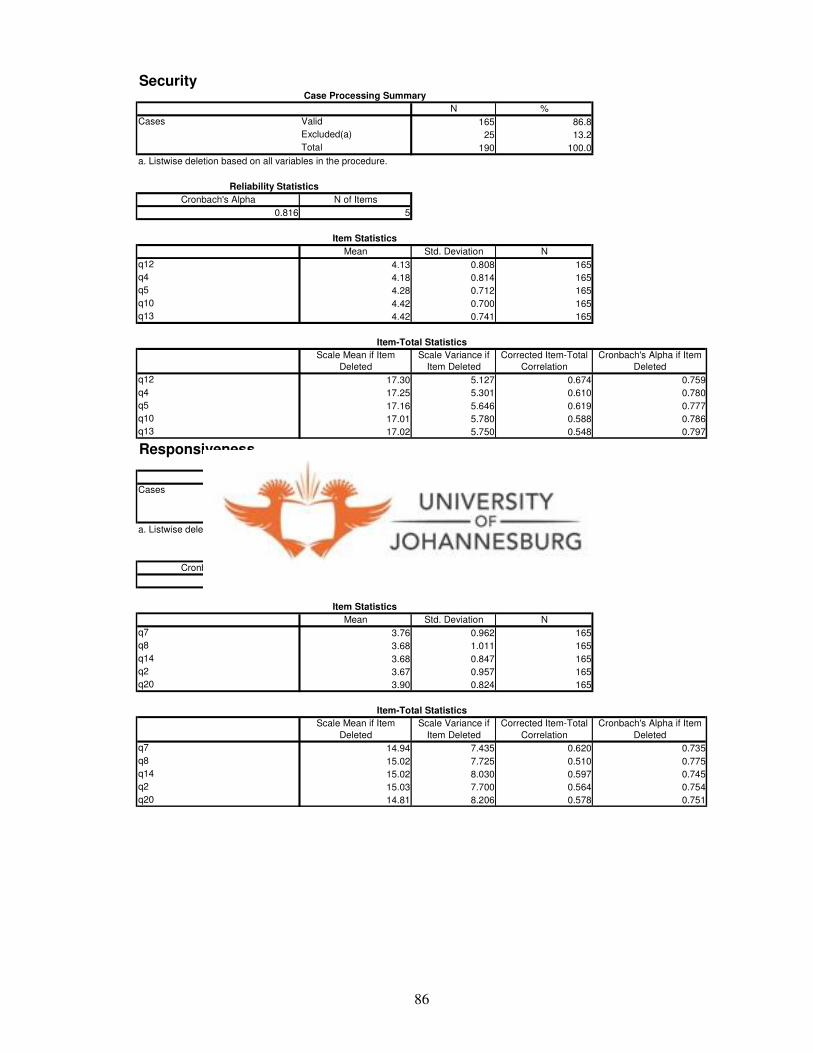
86
Security
N %
Valid 165 86.8
Excluded(a) 25 13.2
Total 190 100.0
Cronbach's Alpha N of Items
0.816 5
Mean Std. Deviation N
q12 4.13 0.808 165
q4 4.18 0.814 165
q5 4.28 0.712 165
q10 4.42 0.700 165
q13 4.42 0.741 165
Scale Mean if Item
Deleted
Scale Variance if
Item Deleted
Corrected Item-Total
Correlation
Cronbach's Alpha if Item
Deleted
q12 17.30 5.127 0.674 0.759
q4 17.25 5.301 0.610 0.780
q5 17.16 5.646 0.619 0.777
q10 17.01 5.780 0.588 0.786
q13 17.02 5.750 0.548 0.797
Case Processing Summary
Cases
a. Listwise deletion based on all variables in the procedure.
Reliability Statistics
Item Statistics
Item-Total Statistics
Responsiveness
N %
Valid 165 86.8
Excluded(a) 25 13.2
Total 190 100.0
Cronbach's Alpha N of Items
0.791 5
Mean Std. Deviation N
q7 3.76 0.962 165
q8 3.68 1.011 165
q14 3.68 0.847 165
q2 3.67 0.957 165
q20 3.90 0.824 165
Scale Mean if Item
Deleted
Scale Variance if
Item Deleted
Corrected Item-Total
Correlation
Cronbach's Alpha if Item
Deleted
q7 14.94 7.435 0.620 0.735
q8 15.02 7.725 0.510 0.775
q14 15.02 8.030 0.597 0.745
q2 15.03 7.700 0.564 0.754
q20 14.81 8.206 0.578 0.751
Case Processing Summary
Cases
a. Listwise deletion based on all variables in the procedure.
Reliability Statistics
Item Statistics
Item-Total Statistics
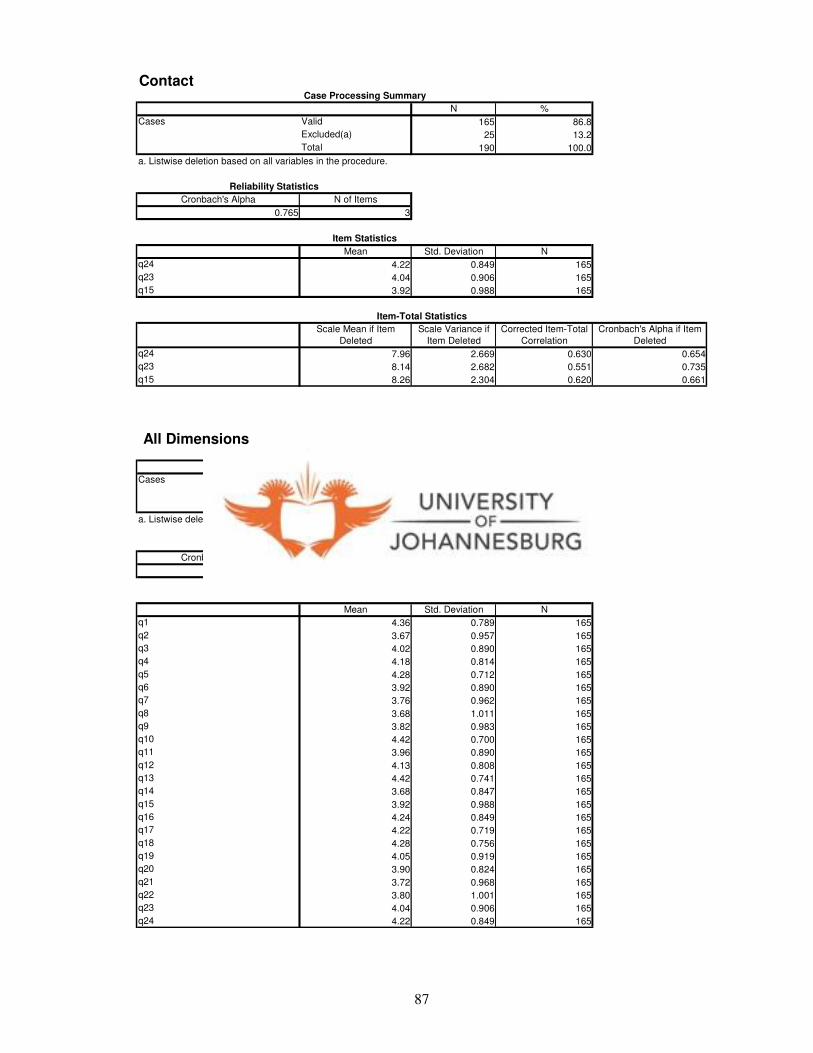
87
Contact
N %
Valid 165 86.8
Excluded(a) 25 13.2
Total 190 100.0
Cronbach's Alpha N of Items
0.765 3
Mean Std. Deviation N
q24 4.22 0.849 165
q23 4.04 0.906 165
q15 3.92 0.988 165
Scale Mean if Item
Deleted
Scale Variance if
Item Deleted
Corrected Item-Total
Correlation
Cronbach's Alpha if Item
Deleted
q24 7.96 2.669 0.630 0.654
q23 8.14 2.682 0.551 0.735
q15 8.26 2.304 0.620 0.661
Case Processing Summary
Cases
a. Listwise deletion based on all variables in the procedure.
Reliability Statistics
Item Statistics
Item-Total Statistics
All Dimensions
N %
Valid 165 86.8
Excluded(a) 25 13.2
Total 190 100.0
Cronbach's Alpha N of Items
0.935 24
Mean Std. Deviation N
q1 4.36 0.789 165
q2 3.67 0.957 165
q3 4.02 0.890 165
q4 4.18 0.814 165
q5 4.28 0.712 165
q6 3.92 0.890 165
q7 3.76 0.962 165
q8 3.68 1.011 165
q9 3.82 0.983 165
q10 4.42 0.700 165
q11 3.96 0.890 165
q12 4.13 0.808 165
q13 4.42 0.741 165
q14 3.68 0.847 165
q15 3.92 0.988 165
q16 4.24 0.849 165
q17 4.22 0.719 165
q18 4.28 0.756 165
q19 4.05 0.919 165
q20 3.90 0.824 165
q21 3.72 0.968 165
q22 3.80 1.001 165
q23 4.04 0.906 165
q24 4.22 0.849 165
Case Processing Summary
Item Statistics
Cases
a. Listwise deletion based on all variables in the procedure.
Reliability Statistics

88
Scale Mean if Item
Deleted
Scale Variance if
Item Deleted
Corrected Item-Total
Correlation
Cronbach's Alpha if Item
Deleted
q1 92.37 162.064 0.631 0.932
q2 93.06 160.362 0.581 0.933
q3 92.71 161.915 0.559 0.933
q4 92.55 161.859 0.621 0.932
q5 92.45 163.079 0.648 0.932
q6 92.81 160.214 0.637 0.932
q7 92.97 161.981 0.509 0.934
q8 93.05 165.498 0.340 0.937
q9 92.92 160.298 0.566 0.933
q10 92.31 163.971 0.609 0.933
q11 92.77 159.312 0.680 0.931
q12 92.60 162.010 0.618 0.932
q13 92.32 163.632 0.590 0.933
q14 93.05 160.839 0.643 0.932
q15 92.81 159.727 0.587 0.933
q16 92.49 159.471 0.707 0.931
q17 92.51 162.751 0.660 0.932
q18 92.45 162.554 0.635 0.932
q19 92.68 159.207 0.660 0.932
q20 92.84 161.260 0.642 0.932
q21 93.02 159.518 0.610 0.932
q22 92.93 158.624 0.624 0.932
q23 92.69 162.947 0.501 0.934
q24 92.52 163.190 0.528 0.933
Item-Total Statistics
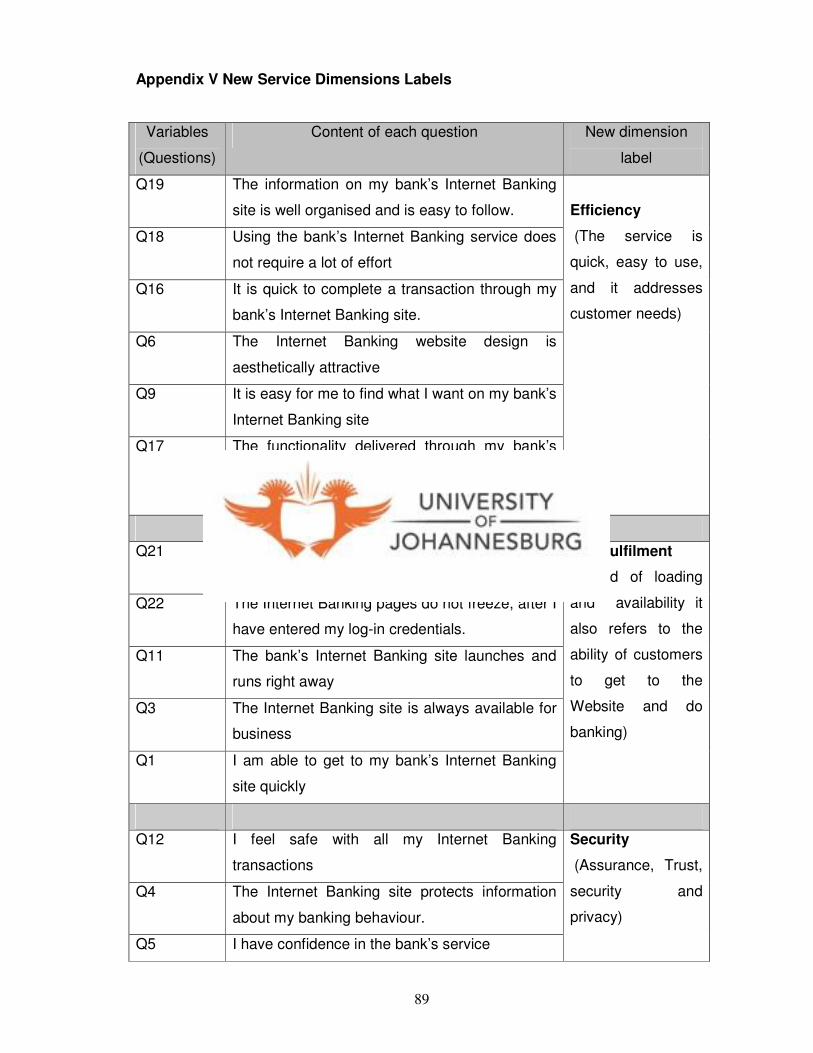
89
Appendix V New Service Dimensions Labels
Variables
(Questions)
Content of each question New dimension
label
Q19 The information on my bank’s Internet Banking
site is well organised and is easy to follow.
Q18 Using the bank’s Internet Banking service does
not require a lot of effort
Q16 It is quick to complete a transaction through my
bank’s Internet Banking site.
Q6 The Internet Banking website design is
aesthetically attractive
Q9 It is easy for me to find what I want on my bank’s
Internet Banking site
Q17 The functionality delivered through my bank’s
Internet Banking site effectively addresses my
banking needs.
Efficiency
(The service is
quick, easy to use,
and it addresses
customer needs)
Q21 My bank’s Internet Banking site pages loads fast
all the time.
Q22 The Internet Banking pages do not freeze, after I
have entered my log-in credentials.
Q11 The bank’s Internet Banking site launches and
runs right away
Q3 The Internet Banking site is always available for
business
Q1 I am able to get to my bank’s Internet Banking
site quickly
Fulfilment
(Speed of loading
and availability it
also refers to the
ability of customers
to get to the
Website and do
banking)
Q12 I feel safe with all my Internet Banking
transactions
Q4 The Internet Banking site protects information
about my banking behaviour.
Q5 I have confidence in the bank’s service
Security
(Assurance, Trust,
security and
privacy)
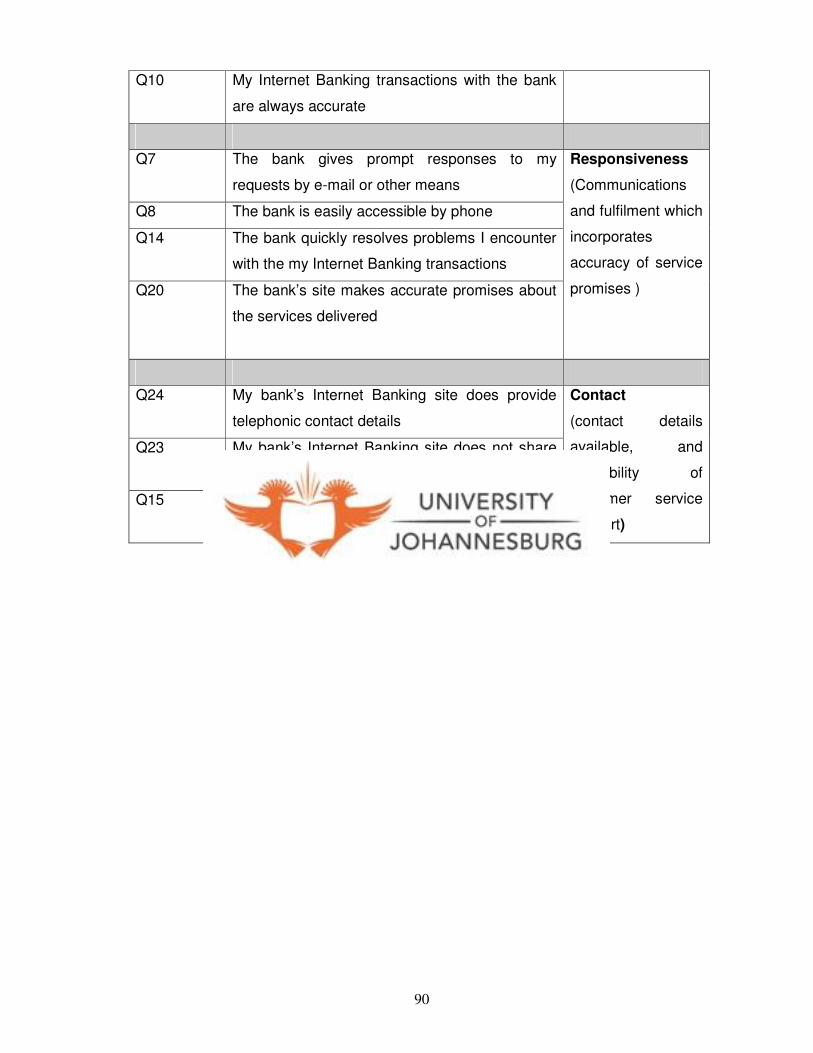
90
Q10 My Internet Banking transactions with the bank
are always accurate
Q7 The bank gives prompt responses to my
requests by e-mail or other means
Q8 The bank is easily accessible by phone
Q14 The bank quickly resolves problems I encounter
with the my Internet Banking transactions
Q20 The bank’s site makes accurate promises about
the services delivered
Responsiveness
(Communications
and fulfilment which
incorporates
accuracy of service
promises )
Q24 My bank’s Internet Banking site does provide
telephonic contact details
Q23 My bank’s Internet Banking site does not share
my personal information with other sites
Q15 The Service does have customer support staff
available online and telephonically.
Contact
(contact details
available, and
availability of
customer service
support)
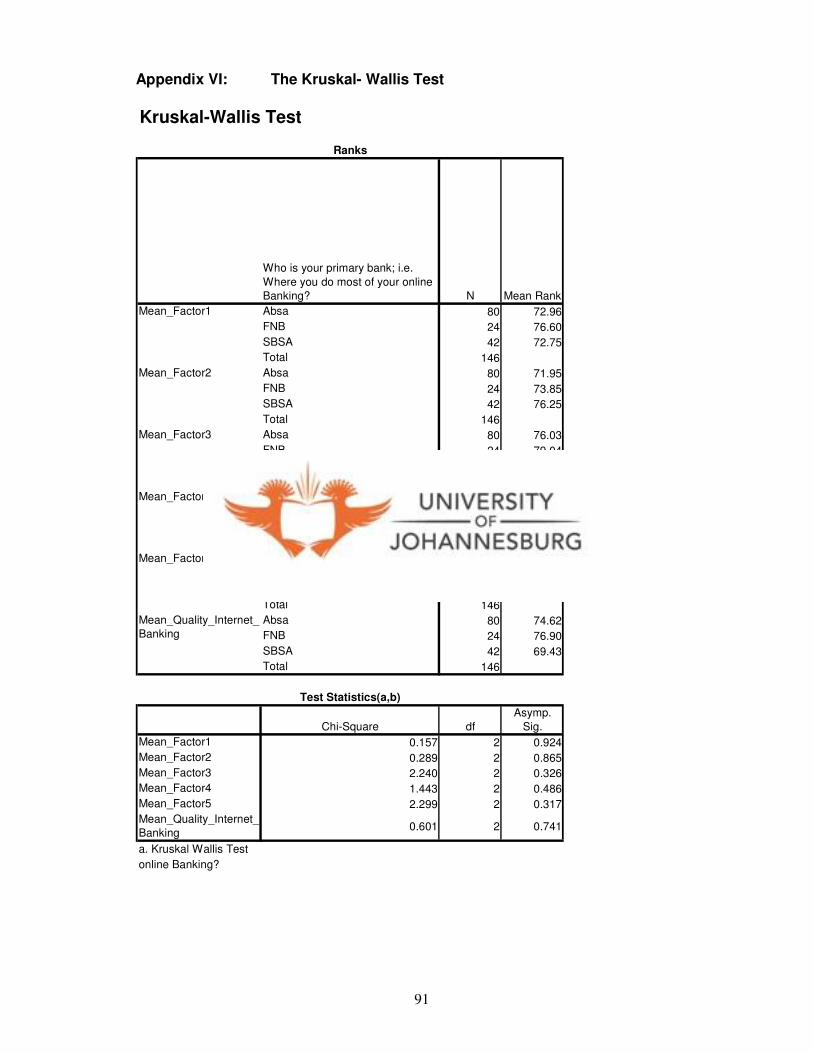
91
Appendix VI: The Kruskal- Wallis Test
Kruskal-Wallis Test
Who is your primary bank; i.e.
Where you do most of your online
Banking? N Mean Rank
Absa 80 72.96
FNB 24 76.60
SBSA 42 72.75
Total 146
Absa 80 71.95
FNB 24 73.85
SBSA 42 76.25
Total 146
Absa 80 76.03
FNB 24 79.04
SBSA 42 65.51
Total 146
Absa 80 74.95
FNB 24 79.35
SBSA 42 67.39
Total 146
Absa 80 76.90
FNB 24 62.19
SBSA 42 73.49
Total 146
Absa 80 74.62
FNB 24 76.90
SBSA 42 69.43
Total 146
Chi-Square df
Asymp.
Sig.
Mean_Factor1 0.157 2 0.924
Mean_Factor2 0.289 2 0.865
Mean_Factor3 2.240 2 0.326
Mean_Factor4 1.443 2 0.486
Mean_Factor5 2.299 2 0.317
Mean_Quality_Internet_
Banking0.601 2 0.741
Mean_Quality_Internet_
Banking
Test Statistics(a,b)
a. Kruskal Wallis Testb. Grouping Variable: Who is your primary bank; i.e. Where you do most of your
online Banking?
Mean_Factor2
Mean_Factor3
Mean_Factor4
Mean_Factor5
Ranks
Mean_Factor1

92
Appendix VII: SURVEY COVERING LETTER
Dear Prospective Respondent
You are hereby invited to complete a survey on Internet Banking service quality in SA as part
of my dissertation that I will be submitting in fulfilment of the requirements for the degree in
Magister Commercii in the faculty of Management at the University of Johannesburg.
Topic: An assessment of Internet Banking Service Quality.
The objective of the study is to get an insight into the perceptions of online banking customers
in South Africa on Internet Banking service quality. The questionnaire will take approximately
only 8 - 12 minutes to complete, confidentiality is guaranteed and your co-operation in this
regard is highly appreciated.
To access the survey please click on the hyperlink below or copy and paste the link into your
web browser
http://take-survey.com/statkon2/Quality_of_Internet_Banking_Services.htm
Thanking you in advance
Masopha Molapo Study Leader: Cor Scheepers
M.Com Business Management Student Faculty of Business Management
University of Johannesburg University of Johannesburg
[email protected] http://www.uj.ac.za/
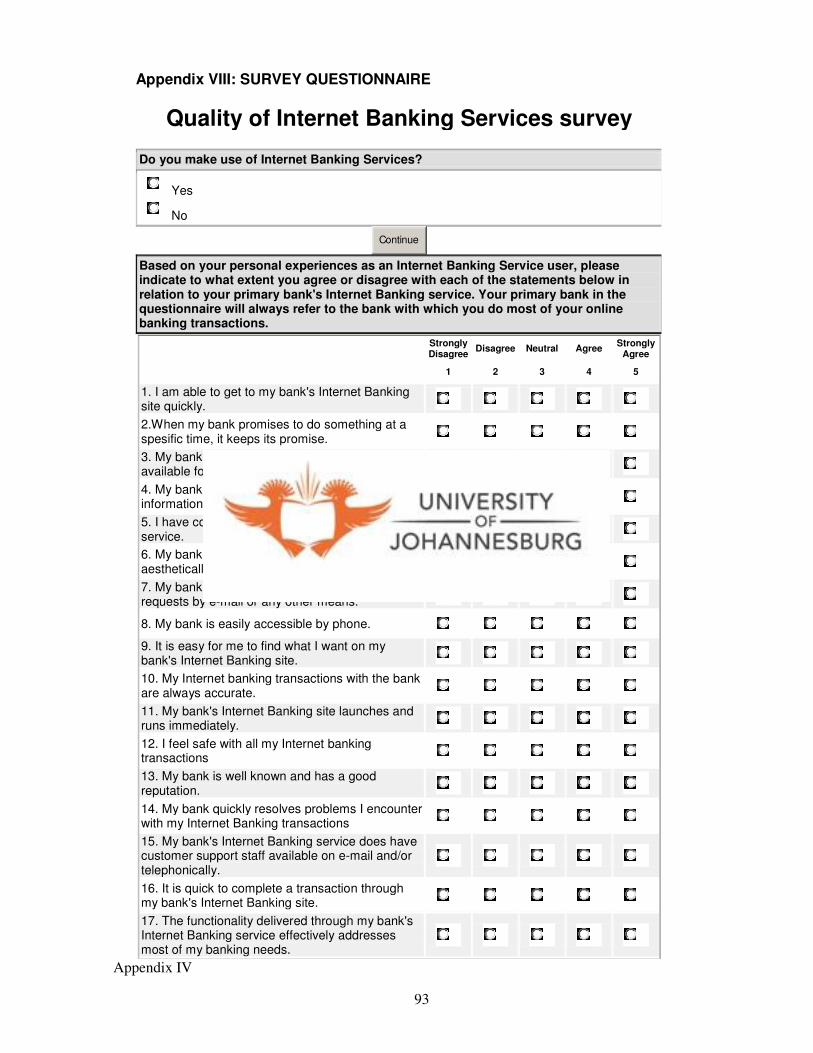
93
Appendix VIII: SURVEY QUESTIONNAIRE
Quality of Internet Banking Services survey
Do you make use of Internet Banking Services?
Yes
No
Continue
Based on your personal experiences as an Internet Banking Service user, please indicate to what extent you agree or disagree with each of the statements below in relation to your primary bank's Internet Banking service. Your primary bank in the questionnaire will always refer to the bank with which you do most of your online banking transactions.
Strongly Disagree Disagree Neutral Agree Strongly
Agree
1 2 3 4 5
1. I am able to get to my bank's Internet Banking site quickly.
2.When my bank promises to do something at a spesific time, it keeps its promise.
3. My bank's Internet Banking site is always available for business.
4. My bank's Internet Banking site protects information about my banking behaviour.
5. I have confidence in my bank's Internet Banking service.
6. My bank's Internet Banking website design is aesthetically attractive.
7. My bank gives prompt responses to my requests by e-mail or any other means.
8. My bank is easily accessible by phone.
9. It is easy for me to find what I want on my bank's Internet Banking site.
10. My Internet banking transactions with the bank are always accurate.
11. My bank's Internet Banking site launches and runs immediately.
12. I feel safe with all my Internet banking transactions
13. My bank is well known and has a good reputation.
14. My bank quickly resolves problems I encounter with my Internet Banking transactions
15. My bank's Internet Banking service does have customer support staff available on e-mail and/or telephonically.
16. It is quick to complete a transaction through my bank's Internet Banking site.
17. The functionality delivered through my bank's Internet Banking service effectively addresses most of my banking needs.
Appendix IV

94
Strongly Disagree Disagree Neutral Agree Strongly
Agree
1 2 3 4 5
1. I am able to get to my bank's Internet Banking site quickly.
2. When my bank promises to do something at a specific time, it keeps its promise.
3. My bank's Internet Banking site is always available for business.
4. My bank's Internet Banking site protects information about my banking behaviour.
5. I have confidence in my bank's Internet Banking service.
6. My bank's Internet Banking website design is aesthetically attractive.
7. My bank gives prompt responses to my requests by e-mail or any other means.
8. My bank is easily accessible by phone.
9. It is easy for me to find what I want on my bank's Internet Banking site.
10. My Internet Banking transactions with the bank are always accurate.
11. My bank's Internet Banking site launches and runs immediately.
12. I feel safe with all my Internet Banking transactions
13. My bank is well known and has a good reputation.
14. My bank quickly resolves problems I encounter with my Internet Banking transactions
15. My bank's Internet Banking service does have customer support staff available on e-mail and/or telephonically.
16. It is quick to complete a transaction through my bank's Internet Banking site.
17. The functionality delivered through my bank's Internet Banking service effectively addresses most of my banking needs.
18. Using my bank's Internet Banking service does not require a lot of effort.
19. The information on my bank's Internet Banking site is well organised and is easy to follow.
20. My bank's site makes accurate promises about the services they deliver.
21. My bank's Internet Banking site pages download quickly all the time.
22. The Internet Banking pages do not freeze, after I have entered my login credentials.
23. My bank's Internet Banking site does not share my personal information with other sites.
24. My bank's Internet Banking site does provide telephonic contact details.
Continue
95
Please provide the following information:
25. Who is your primary bank; i.e. Where you do most of your online Banking? (Please choose one only)
Absa
FNB
SBSA
Nedbank
Other (Please specify)
26. What is your gender?
Male
Female
27. What is your age?
Younger than18
18 - 24
25 - 35
36 - 49
Older than 50
28. How long have you been using Internet Banking?
Less than 3 months
3 - 12 months
More than 12 months
29. How do you access your Internet Banking site? (Most of the time)
Home - Dial-up access
Home - Fixed line or wireless broadband
My employer's network
Other (Please specify)
Copyright © 2022 FDOKUMEN