A framework for implementing Internet Quality of Service in ...
116
A framework for Internet Quality o fService in Kenya p/56/p/S 173/03 UNIVERSITY OF NAIROBI SCHOOL OF COMPUTING AND INFORMATICS \ A framework for implementing Internet Quality of Service in Kenya PRESENTED BY Nicholas Kibaara Riungu P56/P/8173/2003 SUPERVISOR Mr. Erick Ayienga A project report submitted in partial fulfillment for the award of » t ' Master of Science degree in Information Systems of the University of Nairobi July 2010 i University of NAIROBI Library
-
Upload
khangminh22 -
Category
Documents
-
view
1 -
download
0
Transcript of A framework for implementing Internet Quality of Service in ...
A framework fo r Internet Quality o f Service in Kenya p/56/p/S 173/03
UNIVERSITY OF NAIROBISCHOOL OF COMPUTING AND INFORMATICS
\ A framework for implementing Internet Quality of
Service in Kenya
PRESENTED BY
Nicholas Kibaara Riungu
P56/P/8173/2003
SUPERVISOR
Mr. Erick Ayienga
A project report submitted in partial fulfillment for the award of» t '
Master of Science degree in Information Systems of the University
of Nairobi
July 2010i
University of NAIROBI Library

A framework fo r Internet Quality o f Service in Kenya
DECLARATIONThis project, as presented in this report, is my original work and has not been
published or presented for the award of any university degree.
1 4 - 1 & % / U a r o
DateNicholas Kibaara Riungu
P56/p/8173/2003
This research report is submitted for examination with my approval as the
university supervisor
-------- fh p t fZ T -----------
Mr. Erick Ayienga, Lecturer,
School of Computing and Informatics,
University of Nairobi
Date
\
11
I f

A framework fo r Internet Quality o f Service in Kenya p/56/p/8173/03
DEDICATION:
My wife, Cynthia
iii
A framework fo r Internet Quality o f Service in Kenya p/56/p/8!73/03
ABSTRACTThe Internet is built on the datagram model, where each individual packet is
forwarded independently to its destination. This model has the strength of
simplicity and the ability to adapt automatically to changes in network topology.
In this model, all packets are given the same forwarding treatment, and no service
differentiation is provided.
The growth of the Internet has brought with it several new applications which
require some level of resource assurance to operate. These resource assurances
cannot be addresses in the traditional datagram model, which has limited resource
management capabilities inside the network and therefore cannot provide any
resource guarantees to users. The concept of Quality of Service (QoS) was thus
introduced in order to provide service differentiation and assurance for these
services.
According to ITU, Internet quality of service is the collective effect of service
performance which determines the degree of satisfaction on the part of the user of
the service [ITU-T, E.800]. It represents those quantitative and qualitative
characteristics of a network system that are necessary to achieve the required
functionality of an application [Vogel et al, 1995]. These characteristics are
specified though service parameters such as bandwidth, jitter, packet loss, and
delay. /To support the implementation of QoS capabilities on the Internet, the Internet
Community developed two key service models, the differentiated services
(Diffserv) and the integrated services (Intserv) models. Diffserv provides QoS
capabilities by classifying packets, using the differentiated services code point
(DSCP), while Intserv uses RSVP to reserve resources across the network path. In
addition, the Intserv over Diffserv was later proposed to provide the benefits of
both Diffserv and Intserv end-to-end QoS capabilities.
In Kenya, the Internet was introduced in 1992 [Mweu, 2000], and has seen a
tremendous growth, especially in the last ten years. This has seen the introduction
of many applications, some of which require resource assurances and service
differentiation. However, Internet services in Kenya are still based on the best
effort service, to a large extent, with very minimal QoS support provided.iv
A framework fo r Internet Quality o f Service in Kenya p/56/p/8173/03
This report presents an overview of the Internet services in Kenya, and proposes a
framework which can be used to specify and implement QoS capabilities for
Internet Services in Kenya. The framework proposed herein is based on the
Intserv over Diffserv service model, as defined by the Internet Engineering Task
Force (IETF).
The framework focuses on three service components; infrastructure, user
environment and application type. It makes proposals on the minimum
infrastructure requirements, as well as the parameter settings that would be
suitable in implementing QoS for these types of services.
Three service classes are defined with six associated service types. Each of these
service types is targeted towards a specific category of applications, as well as
infrastructure capacity.
The framework provides a means by which Internet QoS can be provided, and
evaluated.
/\ t
V

A fi-amework fo r Internet Quality o f Service in Kenya p/56/p/8173/03
ACKNCWLED j EMENTI wish to acknowledge the support from my supervisor, Mr. Erick Ayienga of the
SCI, and all the SCI staff.
I also wish to thank my employer the Kenya Methodist University and
particularly my colleague in the department of Computer Information Systems,
for their support and encouragement.
Last and not least, I acknowledge the support of my family; my wife, my mum,
my brothers and sisters, and all who assisted in one way or another during this
period of study.
/f
VI

A framework fo r Internet Quality o f Service in Kenya p/56/p/8l 73/03
TABLE :F CONTENTS:
Content
Declaration
Dedication
Abstract
Acknowledgement
List of figures
List of tables
List of Abbreviations
1. Chapter Cne: Introduction
1.1. The Internet
1.2. Quality of service
1.3. Problem statement
1.3.1. Problem definition
1.3.2. Research hypothesis
1.4. Research justification
1.5. Research objectives:
1.5.1. General objective
1.5.2. Specific objectives
1.5.3. Research questions
2. Chapter Two: Review of relevant literature
2.1. Internet Quality of Service
2.2. Quality of Service parameters/ requirements
2.3. Quality of Service implementation techniques
2.4. Quos-Sensitive applications
2.5. End-to-end QoS models
2.5.1. The best-effort service model
2.5.2. The Integrated services model
2.5.3. The differentiated services model
2.5.4. Intserv over Diffserv model
2.5.5. Other models
2.5.5.1. Multi-Protocol Label Switching
2.5.5.2. The Asynchronous Transfer Mode
Page
ii
iii
iv
vi
ix
x
xi
12
4
4
5
5
6
6
6
6
7
8
9
11 12
13
14
16
19
20
22
Vll

A framework fo r Internet Quality o f Service in Kenya p/56/p/8173/03
2.6. Limitations to QoS implementation 22
3. Chapter 3: Internet QoS in Kenya3.1. Introduction 25
3.2. Existing Internet infrastructure in Kenya 29
3.3. Service differentiation and Quality of Service 34
4. Chapter 4: Conceptual Framework4.1. Introduction 36
4.2. The Intserv over Diffserv Service model 37
5. Chapter 5: Research Methodology5.1. Research design 39
5.2. Data collection methods 40
6. Chapter 5: Data analysis and Results6.1. Analysis of corrected data 42
6.2. Preliminary Data 42
6.3. Data from CCK 43
6.4. Data from Internet Users 46
6.5. Data from ISPs 54
7. Chapter 6: Proposed Framework7.1. Introduction 61
7.2. Model implementation components 64
7.3. The KiQoS Model and Services 65
7.4. KiQoS Service implementation 72
7.5. Framework Validation 80
8. Chapter 7: Conclusion and Recommendations8.1. Introduction 82
8.2. Conclusion 82
8.3. Recommendations 83
AppendicesAppendix A: References . 84
Appendix B: Cover Letter 86
Appendix C: Questionnaire 1 87
Appendix D: Questionnaire 2 93
/\ t '9
v iii

A framework fo r Internet Quality o f Service in Kenya
LIST OF FIGURESFigure page
Figure 2.1 19
Figure 3.1 26
Figure 3.2 30
Figure 3.3 32
Figure 3.4 33
Figure 3.5 34
Figure 4.1 37
Figure 6.1 47
Figure 6.2 48
Figure 6.3 51
Figure 6.4 52
Figure 6.5 54
Figure 6.6 56
Figure 6.7 57
Figure 6.8 58
Figure 6.9 59
Figure 7.2 66
Figure 7.3 67
Figure 7.4a 73
Figure 7.4b 73
Figure 7.5 74
Figure 7.6 75
Figure 7.7 75
Figure 7.8 76
Figure 7.9 77
Figure 7.10 78
Figure 7.11 79
Figure 7.12 79
Figure 7.13 80
Figure 7.14 80
p/56/p/8l 73/03
IX
A framework fo r Internet Quality o f Service in Kenya
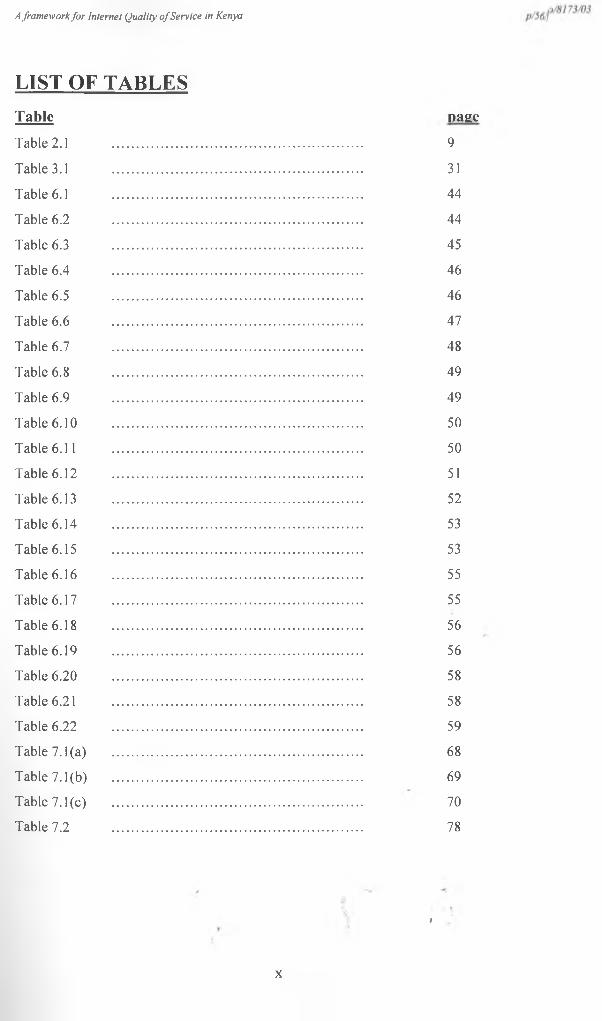
LIST OF TABLESTabic pageTable 2.1 .................................................................... 9
Table 3.1 .................................................................... 31
Table 6.1 .................................................................... 44
Table 6.2 .................................................................... 44
Table 6.3 ................................................................... 45
Table 6.4 .................................................................... 46
Table 6.5 .................................................................... 46
Table 6.6 .................................................................... 47
Table 6.7 .................................................................... 48
Table 6.8 ........ ........................................................... 49
Table 6.9 .................................................................... 49
Table 6.10 .................................................................... 50
Table 6.11 .................................................................... 50
Table 6.12 .................................................................... 51
Table 6.13 .................................................................... 52
Table 6.14 .................................................................... 53
Table 6.15 .................................................................... 53
Table 6.16 .................................................................... 55
Table 6.17 .................................................................... 55
Table 6.18 .................................................................... 56
Table 6.19 .................................................................... 56
Table 6.20 .................................................................... 58
Table 6.21 .................................................................... 58
Table 6.22 .................................................................... 59
Table 7.1(a) .................................................................... 68
Table 7.1(b) .................................................................... 69
Table 7.1(c) .................................................................... 70
Table 7.2 .................................................................... 78
t
X
A framework fo r Internet Quality o f Service in Kenya
LIST OF ABBREVIATIONS1. AF - Assured Forwarding
2. ARCC - Africa Regional Centre for Computing
3. ARPANET - Advanced Research Project Agency Network
4. ATM - Asynchronous Transfer mode
5. CBR - Constant Bit Rate
6. CCK -Communications Commission of Kenya
7. DARPA - Defense Advanced Research project Agency
8. Diffserv - Differentiated Services Architecture
9. DSCP - Differentiated Services Code point
10. EASSy - East Africa Submarine Cable System
11. EF - Expedited Forwarding
12. IETF - Internet Engineering Task Force
13. Intserv - Integrated Services Architecture
14. IP - Internet Protocol
15. ISP - Internet Service provider
16. ITU - International Telecommunication union
17. LSP - Label Switching Protocol
18. MPLS - Multi-Protocol Label Switching
19. NQoS - Network Quality of Service
20. PHB - Per-Hop Behavior
21. QoS - Quality of Service
22. RFC - Request For Comments
23. RSVP - Resource Reservation Protocol
24. SLA - Service Level Agreement
25. SONET - Synchronous Optical Network
26. TEAMS - The East Africa Marine System
27. ToS - Type of Service
28. VBR - Variable Bit Rate
29. VoD - Video on Demand
30. VoIP - Voice Over Internet Protocol
31. VPN - Virtual Private Network
A framework fo r Internet Quality o f Service in Kenya p/56/p/8173/03
Chapter One: Introduction
1.1. The InternetThe current Internet has its roots in the ARPANET, an experimental data network
funded by the United States Defense Advanced Research Projects Agency
(DARPA) in the early 1960s. An important goal was to build a robust network
that could survive active military attacks such as bombing. To achieve this, the
ARPANET was built on the datagram model, where each individual packet is
forwarded independently to its destination. The datagram network has the strength
of simplicity and the ability to adapt automatically to changes in network
topology [Zheng Wang, 2001]. It however, has limited resource management
capabilities inside the network and therefore cannot provide any resource
guarantees to users. In addition, the Internet treats all packets the same way, thus
offering a single level of service for all applications.
For many years, the Internet was primarily used by scientists for networking
research and for exchanging information amongst themselves. Remote access, file
transfer, and e-mail were among the most popular applications, and for these
applications the datagram model works well.
The World Wide Web, however, has fundamentally changed the Internet. New
applications, such as video conferencing, Web searching, electronic media,/
discussion boards, and Internet telephony, have been developed. E-commerce is
revolutionizing the way we do business. The Internet is destined to become the
ubiquitous global communication infrastructure for the twenty first century [Zeng
Wang, 2001],
Since the introduction of the World Wide Web, many new applications have
emerged that require some sort of special treatment. These applications require
some minimal level of resources to operate, as well as predictability in the
performance of the network. These requirements translate into technical
constraints for network bandwidth, latency, packet loss and jitter. The ability of a
network to offer guarantees on these parameters is referred to a Quality of Service
(QoS). Application that need these assurances are said to be QdS sensitive.
l
A framework fo r Internet Quality o f Service in Kenya p/56/p/8173/03
As a result of these challenges in the Internet usage, and it becoming
indispensable in the homes and work places of the twenty-first century, there is a
growing trend for organizations to show willingness to pay a little more, if this
guarantees them of preferential treatment or at the least guaranteed levels of
service.
In Kenya, the Internet was introduced in 1992 [Mweu, 2000]. It has since
expanded to become a core component in business, education, and also in the life
of the individual. However, the level of technology, and cost of services, offered
by the Internet service providers in Kenya tends to limit the extent to which the
Internet can be exploited. The introduction of the undersea fiber optic cables,
between 2009 and 2011, is expected to provide a solution to these constraints. It is
however not clear how this will affect the cost of services.
According to Waema et al (2007), there is increased use of Quality of Service
sensitive applications such as IP-telephony, video conferencing, video on demand,
interactive games, E-commerce, etc. Bandwidth provisioning has been widely
used to ensure service quality and user satisfaction by Internet service providers.
Internet users have also embraced this approach as a solution to poor service
quality.
The regulatory framework for the implementation and quality of service for these
applications is either absent or in development stages. This present an urgent need
for a framework to guide the implementation, so that the quality of service
requirements are addressed sufficiently.
1*2. Quality of serviceThe capability to provide resource assurance and service differentiation in a
network is often referred to as quality of service (QoS) [Zeng wang, 2001],
Generally, Quality of Service (QoS) is defined as the collective effect of service
performances, which determine the degree of satisfaction on the part of the user of
the service [ITU-T recommendation E-800], This implies that the user is the final
arbiter of'good'or'bad'QoS./\ * '\ •.* t
2
A framework fo r Internet Quality o f Service in Kenya p/56/p/8173/03
According to Vogel et al, 1995, QoS represents those quantitative and qualitative
characteristics of a network system, that are necessary to achieve the required
functionality of an application.
Network Quality of Service (NQoS) is thus defined as a measure of the extent to
which a network is capable of providing better service to selected network traffic,
over various technologies, to sustain the user’s requirements. The implementation
of these QoS capabilities in the Internet has been one of the toughest challenges in
its evolution, leading to changes in the technology and basic architecture of the
Internet.
Different applications demand different service qualities. Some need minimal
delay and reliable response time, while others may need a good image quality [X.
Guo, 1997]. The need for QoS capabilities in the Internet stems from the fact that
best-effort service and datagram routing do not meet the needs of many new
applications, which require some degree of resource assurance in order to operate
effectively. Diverse customer requirements also create a need for service
providers to offer different levels of services in the Internet.
A necessary component in a quality of service-enabled network is the service
model. The quality of service model defines the type of services provided, and
their quality of service parameters.
In addition, a number of quality of service (QoS) models have been proposed in
the recent past [Zeng wang, 2001].
The Internet community has developed a number of new technologies to address
these issues. The Integrated Services and Differentiated Services architectures
were developed to provide alternative approaches for resource allocation in the
Internet. Integrated Services use the resource reservation protocol (RSVP) to
provide guaranteed resources for individual flows. The Differentiated Services
architecture takes a different approach. It combines edge policing, provisioning,
and traffic prioritization to provide different levels of services to customers [Zeng
wang, 2001],
Multiprotocol Label Switching (MPLS) [rfc 3812] and traffic.engineering [rfc
3272] address the issues of bandwidth provisioning and performance optimization
in Internet backbones. The explicit route mechanism in MPLS adds an important
3
A framework fo r Internet Quality o f Service in Kenya p/56/p/8173/03
capability to the IP-based network. Combined with constraint-based routing in
traffic engineering, MPLS and traffic engineering can help network providers
make the best use of available resources and reduce costs [Zeng wang, 2001J.
1.3. Problem statement1.3.1 Problem Definition
The growth of the Internet in Kenya has seen the introduction of a range of
multimedia and real-time applications. These applications, including online
banking, E-commerce, E-learning, video conferencing, and Voice over Internet
Protocol (VoIP), require some form of service assurance. This makes it necessary
to provide a way in which the existing network infrastructure can be utilized to
provide support for these applications.
The level of technology and infrastructure, between Internet service providers and
the application users, has not grown in proportion with the application needs. This
is mostly attributed to the ownership and control of the same, since most service
providers don’t own the infrastructure.
The absence of specific policy framework, touching on Quality of Service for
Internet applications, has made it more difficult to determine the acceptable level
of service, particularly for these QoS-sensitive applications.
Several Quality of Service models already exist. However, these offer only partial
solution to the QoS requirements in Kenya. This is partly because:
• These models are so much dependent on investment in hardware technologies.
• The overall bandwidth available, and shared, between service providers and
end users is a limitation. This is expected to improve with the launch of the
fiber optic links.
• These models assume a service level/ parameter levels based on good Internet
infrastructure.
• Most Internet users in Kenya are “once-in-a-while” users of the real-time
applications. This serves as a disincentive to subscribing for QoS capabilities
in the network.
4
A framework fo r Internet Quality o f Service in Kenya p/56/p/8173/03
• The specification of QoS parameters is quite technical, and not readily
understood by most service users in Kenya.
• Cost of Internet services is based on time and fixed bandwidth, thus does not
provide for additional bandwidth resources, nor factor in the cost of delay and
jitter.
1.3.2 Research Hypothesis
It is possible to achieve Internet QoS in Kenya based on the existing technology
and infrastructure.
1.4. Research justificationThe Internet situation in Kenya represents a unique set of requirements and
implementation options which may not be addressed, fully, by the existing
Quality of Service models.
Since it may not be possible to achieve the level of technology and infrastructure
identified in the definition of the existing models, it is important to determine how
best we can utilize the existing technology and infrastructure, to attain quality
internet services. In addition, we need a measure of quality for our Internet
services.
Quality of service is only sustainable when it is supported by the service provider,
and understood by the service user. The technical aspects involved in the
specification and implementation of QoS, makes it difficult to implement
sustainable QoS.
This study seeks to propose a framework, for the implementation of Internet
quality of service in Kenya, that determines the parameters and level of service at
which the service offered is acceptable, especially for the QoS-sensitive
applications. It proposes a means of QoS specification that is easily understood by
both the user and service provider.
The study, however, does not define new parameters or technological
specifications. Instead, it- seeks to provide a framework, based on the existing\ « '\\ t> «
5
A framework fo r Internet Quality o f Service in Kenya p/56/p/8173/03
models and standards that will ease the specification and implementation of
Quality of Service.
1.5. Research objectives1.5.1. General objective
The overall objective of this project is to develop a framework for the
implementation of Internet Quality of Service in Kenya.
1.5.2. Specific objectives
To achieve the overall project objective, the following specific objectives will be
pursued:
(a.) To establish if there is, currently, a quality of service measure in the
provision of Internet services in Kenya.
(b.) To determine the applications that currently need guaranteed services in
the Kenyan market.
(c.) To determine whether the existing quality of service models are applicable
to the Kenyan scenario.
(d.) To determine how Internet users in Kenya access the services.
(e.) To determine the Internet users’ understanding of QoS
(f.) To propose a Quality of Service framework.
1.5.3. Research Questions
The following research questions will guide this study:
(a.) Is there an existing measure of quality in the provision of Internet services
in Kenya?
(b.) Are the existing quality of service models applicable to the Kenyan
situation?
/V
i t
6
A framework fo r Internet Quality o f Service in Kenya p/56/p/8173/03
Chapter Two: Review of relevant literature2.1 Internet Quality of Service
In the traditional Internet, the service differentiation has been in the pricing
structure (individual vs. business rates) or the connectivity type (dial-up access vs.
leased line, etc) [Y. Bemet et al].
With the expansion of Internet traffic and its diversified service request, the
traditional network service model, which provides all the users with the same
performance level (best effort service), can no longer meet the users’ demand that
is essential to a set of differentiated services [S. Voung, et al.]
According to Ruediger Z, et al. [2007], the current model of achieving network
quality in public IP networks, which is based on ‘Over provisioned best Effort’
approach, will not be sufficient to deliver end-to-end premium services to a large
user base in an acceptable quality. Its inability to differentiate service classes can
be considered inefficient as it results in uncontrolled overload times and requires a
network capacity that by far exceeds an optimal capacity, both from an
economical and managerial perspective.
Quality o f Service (QoS) refers to the capability of a network to provide better
service to selected network traffic over various technologies, including Frame
Relay, Asynchronous Transfer Mode (ATM), Ethernet and .802.1 networks,
SONET, and IP-routed networks that may use any or all of these- underlying
technologies [Cisco Systems, 2003].
The primary goal of QoS is to provide priority, including dedicated bandwidth,
controlled jitter and latency, and improved loss characteristics. Fundamentally,
QoS enables you to provide better service to certain flows. This is done by either
raising the priority of a flow, or limiting the priority of another flow. Also
important is making sure that providing priority for one or more flows does not
make other flows fail [Cisco systems, 2003].
QoS comprises a set of techniques to manage network resources in a manner that
enables the network to differentiate and handle traffic based on policy. This
provides consistent and predictable data delivery to users or applications that are> ‘
supported within the network. Achieving the required Quality of Service (QoS) by
7
A framework fo r Internet Quality o f Service in Kenya p/56/p/8l 73/03
managing delay, delay variation (jitter), bandwidth, and packet loss parameters on
a network becomes the secret to a successful end-to-end business solution.
Apart from over-provisioning network resources, providing QoS guarantees
require deployment of appropriate QoS control mechanisms in the operations and
management of a network. A vast variety of QoS control mechanisms have been
proposed and developed, with varying degree of complexity and cost.
Implementing a successful QoS policy will ensure a predictable, measurable, and
guaranteed treatment of the communications on the backbone. This would provide
a better means of handling specialized traffic on the limited and costly backbone
resources. The demand for the use of bandwidth-intensive and delay/jitter-
sensitive applications coupled with the ever-increasing use of backbone for
"‘unsupported'’ traffic provides the need and reasoning for implementing QoS.
2.2 Quality of Service parameters/ requirementsNetwork QoS can be defined in a variety of ways and include a diverse set of
service requirements, such as performance, availability, reliability, security, etc.
All these service requirements are important aspects of a comprehensive network
QoS service offering. Typical performance metrics used in defining network QoS
are bandwidth, delay/delay jitter, and packet loss rate.
Using these performance metrics, network performance guarantees can be
specified in various forms, such as absolute (or deterministic), e.g', a network
connection is guaranteed with 10 Mbps bandwidth all the time; probabilistic (or
stochastic), e.g., network delay is guaranteed to be no more than 100 ms for 95%
of the packets; time average, e.g., packet loss rate is less than 10-5 measured
over a month.
The guarantee feature of network QoS is what differentiates it from the “best-
effort” network services. The exact form of performance guarantee is defined as
part of the service level agreement (SLA) between the network service provider
and its customers.
The key Network Quality of Service (NQoS) parameters are: -/
• Reliability or packet loss rates \ , '
8
A framework fo r Internet Quality o f Service in Kenya p/56/p/8173/03
• Delay
• Delay jitter
• Bandwidth
In addition, network availability and service cost have also been identified as key
parameters in the provision of practical end-to-end Internet Quality of Service.
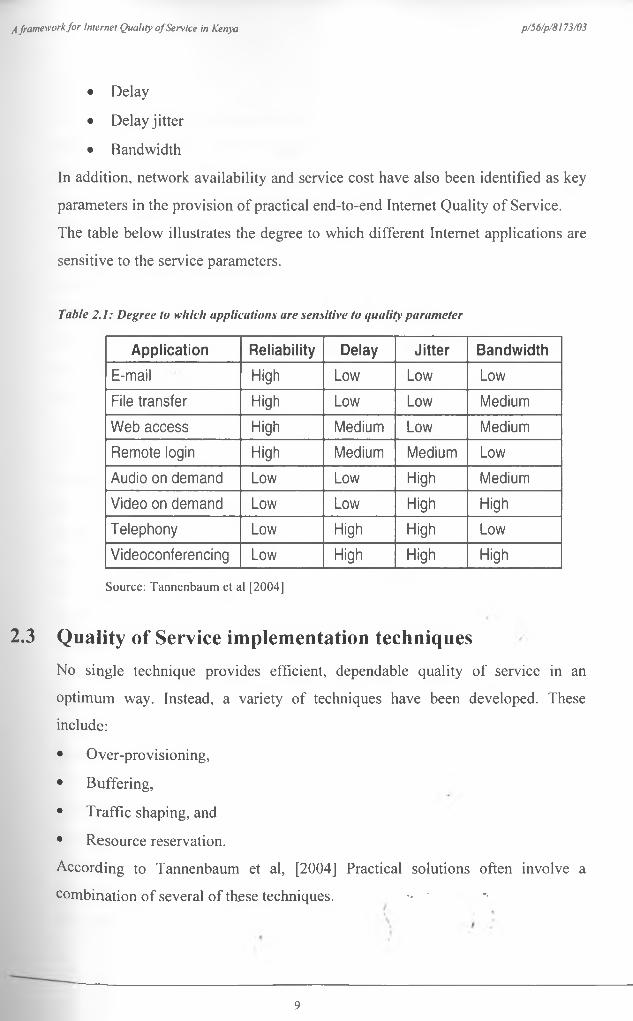
The table below illustrates the degree to which different Internet applications are
sensitive to the service parameters.
Table 2.1: Degree to which applications are sensitive to quality parameter
A pp lica tion R eliab ility Delay J itter B andw idth
E-mail High Low Low Low
File transfer High Low Low Medium
W eb access High Medium Low Medium
Remote login High Medium Medium Low
Audio on demand Low Low High Medium
Video on demand Low Low High High
Telephony Low High High Low
Videoconferencing Low High High High
Source: Tannenbaum et al [2004]
2.3 Quality of Service implementation techniquesNo single technique provides efficient, dependable quality of service in an
optimum way. Instead, a variety of techniques have been developed. These
include:
• Over-provisioning,
• Buffering,
• Traffic shaping, and
• Resource reservation.
According to Tannenbaum et al, [2004] Practical solutions often involve a
combination of several of these techniques. - ' *•
9

A framework fo r Internet Quality o f Service in Kenya p/56/p/8173/03
Over-provisioning
This involves the provision of so much router capacity, buffer space, and
bandwidth, that the packets fly through the network easily. The technique seeks to
provide a constant, high capacity stream service, in response to the bandwidth,
delay, jitter and reliability needs of data streams.
The technique is however expensive to implement, as it requires the investment in
additional equipment.
Buffering
Buffering increases delay, and smoothes jitter, by temporarily storing packets on
intermediate nodes. This allows the implementation of a controlled transmission
rate from one point to the next.
Buffering has no effect on reliability or bandwidth. It is thus a technique suitable
for flows that are tolerant to delay, but sensitive to jitter, such as audio and video
on demand.
Traffic shaping
Buffering does not work for some applications. E.g. Video Conferencing.
Traffic shaping involves the smoothing of the transmission rate, or packet
delivery rate, by providing a uniform traffic flow. It involves the regulation of the
average rate, and burst, of a transmission.
In traffic shaping, the user and the subnet agree on a certain traffic pattern, for
that circuit, during connection set up. This agreement is called a Service Level
Agreement (SLA). Traffic shaping is more important for real-time data, such as
audio and video connections, which have stringent quality of service
requirements.
Resource Reservation
The implementation of traffic shaping on datagram subnets assumes that all the
packets of a flow follow the same route. However, packet switched networks send
packets independently, through different routers, making it hard to guarantee
much through traffic shaping.
Resource reservation sets up a virtual circuit from the source, to destination, and
all packets that belong to the flow must follow thi£ route.
10
A framework fo r Internet Quality o f Service in Kenya p/56/p/8173/03
Once a route for a flow has been specified, it becomes possible to reserve
resources along that route, making sure that the necessary capacity for the flow is
available.
Three different kinds of resources can be reserved. These are:
• Bandwidth
• Buffer space
• CPU cycles ( processing power)
The set of flow parameters need to be specified accurately. These can be
negotiated between the sender, receiver, and the intermediate routers.
Admission Control
Admission control mechanisms are employed to ensure adherence to flow
specifications. A router accepts to handle a flow only if there are sufficient
resources to service the flow, otherwise the request is turned down.
According to O’Neil [2002], admission control combines bandwidth control and
policy control to provide network quality of service (NQoS). In a typical scenario,
applications, such as polycom video communication terminals, request a
particular NQoS for their traffic.
The devices in the network, through which this traffic passes, can either grant or
deny the request, depending on various factors, such as capacity, load, policies,
and so on. If the request is granted, the application has a contract for the service.
The contract is honored as long as there are no disruptive events, such as network
outages.
2.4 QoS-sensitive Internet applicationsThere are likely two major drivers for network services with QoS guarantees:
One comes from applications with stringent QoS requirements. Applications such
as IP telephony and video-on-demand (VoD) provide strict demands on the
service offered over the Internet. In IP telephony two end users send packetized
voice and the quality of rendered sound depends on low delay and small loss rate
of end-end packet transmission. Likewise, streaming videos, over the Internet
l i
A framework fo r Internet Quality o f Service in Kenya p/56/p/8173/03
requires adequate bandwidth and packet loss guarantees from the network to
ensure TV-broadcast quality.
The other major driver for network QoS is the need for service differentiation due
to competitive nature of the marketplace. A network service provider may support
a “virtual private network” (VPN) service over its network with only security
guarantee but no performance guarantee. Whereas, another network service
provider may support a “virtual leased line” service over its network that, in
addition to security guarantee, has bandwidth, delay and loss guarantees
comparable to a physical leased line. The first network service provider may be
forced to enhance its VPN service also with performance guarantees or to lose its
customers who demand performance guarantees to its competitor. Hence
guaranteed QoS performance can serve as a service differentiating feature for
network services.
Real-time applications such as video conferencing are sensitive to the timeliness
of data and so do not work well in the Internet, where the latency is typically
unpredictable. The stringent delay and jitter requirements of these applications
require a new type of service that can provide some level of resource assurance to
the applications.
The following applications have been identified to have strict QoS requirements:
• Videoconferencing
• Distance Education
• Video surveillance
• Multimedia Information Retrieval
• Multimedia Desktop Collaboration
• High-definition TV
• Video-on-demand
2.5 End-to-end Quality of Service modelsThe problem of Internet QoS provisioning has been an active area of research for
many years. From the earlier Integrated Services (Iritserv) architecture to the more* ' '
recent Differentiated Services (Diffserv) architecture, many QoS control
12
A framework fo r Internet Quality o f Service in Kenya p/56/p/8!73/03
mechanisms, especially in the areas of packet scheduling and queue management
algorithms, have been proposed.
Elegant theories such as network calculus and effective bandwidths [Chengzhi et
al, 2003] have also been developed.
A key component in the provision of Network QoS is a service model. This
defines the service levels and parameters involved in the provision of the service
[Diederich J. et al, 2005].
End-to-end service models define the actual end-to-end QoS capabilities for a
network. The services provided differ in their level of QoS strictness, which
describes how tightly the service can be bound by specific bandwidth, delay,
jitter, and loss characteristics.
Three basic end-to-end QoS models have been identified for heterogeneous
networks. These are:
• The best-effort service model
• The differentiated service model
• The integrated service model
Three factors have been identified as influencing the decision on which service
model to deploy in the network. They are:
• The application or problem that a customer wants to solve.
• The rate at which customers can realistically upgrade their infrastructure.
• The cost of implementing and deploying the service.
2.5.1 The best-effort service model
Best-effort service is also referred to as lack of QoS capabilities in a network. It
provides the basic connectivity with no guarantees. The service is characterized
by FIFO queues, which have no differentiation between traffic flows.
Currently the Internet offers a point-to-point delivery service, which is based on
the "best effort" delivery model. In this model, data will be delivered to its
destination as soon as possible, but with no commitment as to bandwidth or
latency. Using protocols such as TCP, the highest guarantee the network provides
is reliable data delivery. This is adequate for traditional /data applications like FTP* *
13
A framework fo r Internet Quality o f Service in Kenya p/56/p/8173/03
and Telnet, but inadequate for applications requiring timeliness. For example,
distributed multimedia applications need to communicate in real-time and are
sensitive to the quality of service they receive from the network.
2.5.2 The Integrated services model
The Integrated Services (Intserv) Architecture was originated by the end-to-end
research group, of the Internet Engineering Task Force (IETF), in 1991 and 1992.
It is a multiple service model that can accommodate multiple QoS requirements.
In this model, an application requests a specific kind of service from the network,
before sending data. The request is made by explicit signaling; the application
informs the network of its traffic profile and requests a particular kind of service
that can encompass its bandwidth and delay requirements. The application is
expected to send data only after it gets a confirmation from the network. It is also
expected to send data that lies within the profile described during the signaling.
To achieve the requested service, the network maintains per-flow state
information, and performs packet classification, policing, and intelligent queuing
based on the state. It also performs admission control, based on the information
provided by the application, and the available network resource. The network
implicitly commits itself to meet the QoS requirements for a given application as
long as the traffic remains within the profile specifications..
The Integrated Services architecture, with RSVP, is based on per-flow resource
reservation. To receive resource assurance, an application must make a
reservation before it can transmit traffic over the network.
Resource reservation involves the following:
• The application characterizes its traffic source and the resource requirements.
• The network then uses a routing protocol to find a path, based on the
requested resources.
• A reservation protocol is used to install the reservation state along that path.
• At each hop admission control checks whether sufficient resources are
available to accept the new reservation.
14

A framework fo r Internet Quality o f Service in Kenya p/56/p/8173/03
• Once the reservation is established, the application can start to send traffic
over the path for which it has exclusive use of the resources.
• Resource reservation is enforced by packet classification and scheduling
mechanisms in the network elements, such as routers.
The Integrated Services working group proposed the Internet Integrated Services
(IIS) with two new services, that a user can select:
• The guaranteed service and
• The controlled load service
The guaranteed service focuses on network delay requirements, and seeks to
provide a deterministic worst-case delay bound service, through strict admission
control and fair queuing scheduling. It allows applications to reserve bandwidth to
meet their requirements. This service was designed for applications that require a
perfectly reliable upper-bound on network delay.
The guaranteed service ensures that packets arrive before the requested maximum
delay time, and they are not dropped due to network congestion.
The controlled load service focuses more on bandwidth. It provides a less firm
guarantee, by providing a service that is close to a lightly loaded best-effort
network. It allows applications to have low delay and high throughput even
during times of congestion. This service is intended for applications that work
well with a non-congested internetwork, providing best-effort service.
Under the controlled load service, there is no delay bound op any other
guarantees. The provided service is minimalistic on purpose.
The Resource Reservation Protocol (RSVP) was also standardized for signaling
an application's requirements to the network and for setting up resource
reservation along the path.
The Integrated Services model was the first attempt to enhance the Internet with
QoS capabilities. The research and development efforts provided valuable insights
into the complex issues of supporting QoS in the Internet. The resource allocation
architecture, new service models, and RSVP protocol were standardized in the
late 1990s./\ i '\
\ f* <
15
A framework fo r Internet Quality o f Service in Kenya p/56/p/8173/03
The Integrated services model suffers from scaling and settlement problems. As a
result, the deployment of the Integrated Services architecture in the service
provider's backbones has been rather slow.
The Integrated Services architecture is however a viable framework for resource
allocation in corporate networks. This is because corporate networks are typically
limited in size and operated by a single administrative domain. Therefore many of
the scaling and settlement issues may not arise. It can support guaranteed
bandwidth for IP telephony, video conferencing over corporate intranets. RSVP
can also be used for resources allocation and admission control for traffic going
out to wide-area networks.
The ideas, concepts, and mechanisms developed in Integrated Services also found
their ways into later work on QoS. For example, controlled load service has
influenced the development of Differentiated Services, and similar resource
reservation capability has been incorporated into MPLS for bandwidth guarantees
over traffic trunks in the backbones.
2.5.3 The differentiated services model
According to Zheng Wang [2001], the Differentiated Services architecture was
developed as an alternative resource allocation scheme for service providers'
networks. By mid-1997 service providers felt that Integrated Services were not
ready for large-scale deployment, and at the same time the need for an enhanced
service model had become more urgent. The Internet community started to look
for a simpler and more scalable approach to offer a better than best-effort service.
After a great deal of discussion, the IETF formed a new working group to develop
a framework and standards for allocating different levels of services in the
Internet. The new approach, called Differentiated Services, is significantly
different from Integrated Services. Instead of making per-flow reservations,
Differentiated Services architecture uses a combination of edge policing,
provisioning, and traffic prioritization to make possible service differentiation.
In the Differentiated Services architecture, users' traffic is divided into a small
number of forwarding classes. For each forwarding class, the •amount of trafficJ t
that users can inject into the network is limited at the edge of the network. By
16
/tfn ii ork for lolernel Qua/jiy 0f Service in Kenyap/S6/p/8173/03
chanr.1 . 1 . . | . r . «- allowed in the network, service providers can’“uangmg the total amount of traffic a** Kadinc* *1 i , « • • and hence control the degree of resourceuJust the level of resource provision!1*6, 6
assurance to the users.The edge of a Differentiated Services <’e,WOrk is reSp°"Sible fw maPPin6 packetsto tiw • , r- j - i c This packet classification is typically doneineir appropriate forwarding classes- rba<j»a - i i nt (SLA) between the user and its serviceu«secj on the service level agreemen1 vProvider. The nodes at the edge of tl>e "*work als0 Perfo™ faffic policing to
Protect the network from misbehavingtraffic sources' Nonconforming traffic may
bo dropped, delayed, or marked with a differeM forwarding class- The forwardingcl®s is directly encoded into the pack* header. After packets are marked withtheir c .• , , „ of the network, the interior nodes of thetorwarding classes at the edgeneturcs i r . . . ,:fferentiate the treatment of the packets. The“ciwork can use this information to di1* K
forwarding classes may indicate drop or resource priorit5'- For example-when a link is congested, the network will drop packets with the highest drop
Priority first.Differentiated Services do not require resource reservation setup. The allocationof f„ , . . . ,, ^geified as part of the SLA between the1 forwarding classes is typically sp4' renstonier and its service provider, ahd ,he forwarding classes apply to traffic
aggregates rather than to individual n°ws' These features work we“ wi,h 'ransaction-orientated Web applications- The Differentiated Sendees architecture
eliminates many of the scalability concems with In,egrattd Sepvices- The fractions that interior nodes have to P * form ,0 suppon DUfaen,iated Servicesare r»i .■ i ■ i tl i -ncess of classification is needed only at thec relatively simple. The complex p r Jedee of the network, where traffic rates are typically much lower.The Tv**- ■ , . . felies on provisioning to provide resourceuc Uifferentiated Services approach 1 r Kassttrance. The quality of the assurant* depends on how Provisioning is carriedout j . . A in the network,and how the resources are manage^The ^ , . /rvi-fcerv) architecture consists of two mainue differentiated services (Difis& '
c°rnponents;
1. Packet marking using2. Per-Hop-Behaviors (P^Bs) \ , •
17

I
Packet marking is achieved through the IPv4 ToS byte. Diffserv has however
completely redefined the ToS byte; It uses six bits to classify packets, and the
field is now called the differentiated services (DS) field, with two of the bits
unused (RFC-2474). The six bits now replace the three IP-precedence bits, and is
referred to as the Differentiated Services Codepoint (DSCP). All classification
and QoS in the Diffserv model revolve around the DSCP. With DSCP in any
given node, up to 64 aggregates or classes can be supported.
Once network traffic has been marked using the DSCP, the packets are grouped
into Behavior Aggregates (BA), at each node. A BA is a collection of packets that
have the same DSCP value in them, and crossing in a particular direction.
Per-Hop-Behavior (PHB) is defined as the externally observable forwarding
behavior of a node on any packet belonging to a BA (RFC-2475). It refers to the
packet scheduling, queuing, policing, or shaping behavior of a node, on any
packet belonging to a BA.
The Diffserv define four standard PHBs for constructing a Diffserv-enabled
network, and achieve coarse-grained, end-to-end CoS and Qos, these are:
1. The Default PHB (RFC-2474)
2. The Class-Selector PHBs (RFC-2474)
3. Expedited Forwarding PHB (RFC-2598)
4. Assured Forwarding PHB (RFC-2597)
The default PHB applies for packets whose DSCP is all zeros, or no DSCP values
are set. These packets receive the traditional best-effort service.
The class-selector PHBs provide for backward compatibility between DSCP and
IP-precedence marked packets. They provide the same service as define in IP-
precedence for packets with DSCP value xxxOOO, where x is either 0 or 1.
The Expedited Forwarding (EF) PHB provides for guaranteed bandwidth. It is a
key ingredient in Diffserv for the provision of low-loss, low-latency, and assured
bandwidth service. EF PHB is especially suitable for applications that require
very low packet loss, guaranteed bandwidth, low delay and low jitter.
The Assured Forwarding (AF) PHB defines a method by which BAs can be given
different forwarding assurances. It defines four AF classes with different amountst
* .
18
A framework fo r Internet Quality o f Service ih Kenya p/56/p/8173/03
of buffer space, and interface bandwidth. In addition, three drop precedence levels
are specified for each AF class.
The Diffserv architecture defines two new services:
1. The premium service
2. The assured service
The premium service uses the Expedited Forwarding (EF) PHB to provide an
absolute service differentiation. It creates a “Virtual Leased Line”. Premium
service provides a service of low latency, low loss and assured bandwidth.
The assured service uses the Assured Forwarding (AF) PHB to provide a relative
service differentiation. It provides different levels of best effort service at the time
of network congestion.
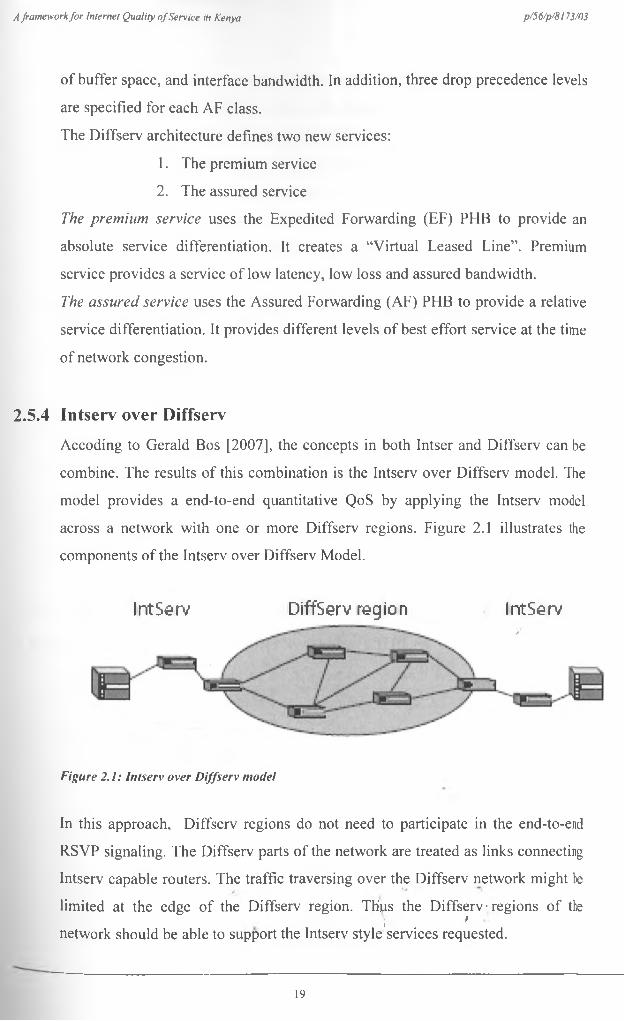
2.5.4 Intserv over Diffserv
Accoding to Gerald Bos [2007], the concepts in both Intser and Diffserv can be
combine. The results of this combination is the Intserv over Diffserv model. The
model provides a end-to-end quantitative QoS by applying the Intserv model
across a network with one or more Diffserv regions. Figure 2.1 illustrates the
components of the Intserv over Diffserv Model.
IntServ DiffServ region IntServ
Figure 2.1: Intserv over Diffserv model
In this approach, Diffserv regions do not need to participate in the end-to-end
RSVP signaling. The Diffserv parts of the network are treated as links connecting
Intserv capable routers. The traffic traversing over the Diffserv network might be
limited at the edge of the Diffserv region. Thus the Diffserv ■ regions of the1 9
network should be able to support the Intserv style services requested.
19
A framework fo r Internet Quality o f Service in Kenya p/56/p/8173/03
To support Intserv, the sender and receiver host must both support an Intserv
signalling protocol (e.g. RSVP). The nodes in the Diffserv regions do not need to
support RSVP signalling messages, but they do need to be able to forward them.
The requests for the Intserv service types must be mapped onto the capabilities of
the Diffserv network. This involves the selection of an appropriate PHB or set of
PHBs, performing policing if needed, exporting the Intserv parameters from the
Diffserv region and performing admission control on the Intserv requests, taking
the available resources in account. When the PHB for the flow is selected, it is
then necessary to communicate the choice of DSCP for the flow to other network
elements. This is done by mapping. There are two mapping methods, the first one
is default mapping, where there is a one to one translation from Intserv service
types to a specific DSCP. The second method is Network driven mapping. In this
method, RSVP aware routers in the Diffserv network may override the default
mapping. If this happens, the modification needs to be communicated upstream to
the marking device.
The KiQoS model, services, and their implementation, specified later in this
report, are based on the Intserv over Diffserv implementation model. Default
mapping is employed for simplicity of implementation.
2.5.5 Other Models
2.5.5.1 Multi-Protocol Label Switching (MPLS)
MPLS was originally seen as an alternative approach for supporting IP over
ATM. Although several approaches for running IP over ATM were standardized,
most of the techniques are complex and have scaling problems. The need for more
seamless IP/ATM integration led to the development of MPLS in 1997. The
MPLS approach allows IP routing protocols to take direct control over ATM
switches, and thus the IP control plane can be tightly integrated with the rest of
the IP network.
The technique that MPLS uses is known as label switching. A short, fixed-length
label is encoded into the packet header and used for packet forwarding. When a
label switch router (LSR) receives a labeled packet, it uses t)ie incoming label in* 1
20
A framework fo r Internet Quality o f Service in Kenya p/56/p/8l73/03
the packet header to find the next hop and the corresponding outgoing label. With
label switching, the path that a packet traverses through, called the label switched
path (LSP), has to be set up before it can be used for label switching.
In addition to improving IP/ATM integration, MPLS may also be used to simplify
packet forwarding.
The driving force behind the wide deployment of MPLS has been the need for
traffic engineering in Internet backbones. Internet traffic engineering is defined as
that aspect of Internet network engineering dealing with the issue of performance
evaluation and performance optimization of operational IP networks. Traffic
Engineering encompasses the application of technology and scientific principles
to the measurement, characterization, modeling, and control of Internet traffic
[RFC-2702, AWD2]. The explicit route mechanism in MPLS provides a critical
capability that is currently lacking in the IP-based networks. MPLS also
incorporates concepts and features from both Integrated Services and
Differentiated Services. For example, MPLS allows bandwidth reservation to be
specified over a LSP, and packets can be marked to indicate their loss priority.
These features make MPLS an ideal mechanism for implementing traffic
engineering capabilities in the Internet.
MPLS seeks to enhance the services provided in IP-based networks by offering
scope for traffic engineering, guaranteed QoS, and virtual private networks
(VPNs). It works alongside the exiting routing technologies and provides IP
networks with a mechanism for explicit control over routing paths. It also allows
two fundamentally different data-networking approaches, datagram and virtual
circuit, to be combined in IP-based networks. The datagram approach, on which
the Internet is based, forwards packets hop by hop based on their destination
addresses. The virtual circuit approach, used in ATM and frame relay, requires
connections to be set up. With MPLS, the two approaches can be tightly
integrated to offer the best combination of scalability and manageability.
MPLS control protocols are based on IP addressing and transport and therefore
can be more easily integrated with other IP control protocols. This creates a
unified IP-based architecture in which MPLS is used in thq core for traffic
21
A framework fo r Internet Quality o f Service in Kenya p/56/p/8173/03
engineering and IP routing for scalable domain routing. MPLS is projected to
become the standard signaling protocol for the Internet.
2.5.5.2 The Asynchronous Transfer Mode (ATM) Service Model
ATM is a connection-oriented technology which uses virtual circuits to establish
connections. The primary purpose of ATM is to provide high-speed, low-delay
transport of multiple traffic types.
The ATM Forum defines five service categories:
• Constant Bit Rate (CBR) for applications such as Internet telephony.
• Real-Time Variable Bit Rate (rt-VBR) for applications such as
videoconferencing.
• Non-Real Time Variable Bit Rate (nrt-VBR), for response time critical
transaction processing, e.g. airline reservation, banking, etc.
• Unspecified Bit Rate (UBR) for non-real-time applications, eg. email, file
transfer, etc.
• Available Bit Rate (ABR), any UBR application for which the end-system
requires a guaranteed quality of service (QoS). E.g. critical data transfer such
as defense information.
In ATM, data transfer is preceded by the establishment of a connection between
two end-systems. For each direction of an ATM connection, a specific QoS is
negotiated among the networks and end-systems. The network agrees to meet or
exceed the negotiated QoS as long as the end-system complies with a negotiated
traffic contract. A traffic contract comprises a QoS class, a list of traffic
parameters and a conformance definition.
2.6 Limitations to QoS implementationThe implementation of NQoS over the Internet has several limitations. One, QoS
as found on any consumer router running on a standard Internet Service Provider
will only work on upstream/outbound data (data going from you to your ISP). It
is practically impossible for a service user to cpntrol the priority of data coming
22

A framework fo r Internet Quality o f Service in Kenya p/56/p/8173/03
from the ISP, since it’s only possible to control the data on your side of the
network.
Two, the deployment of the Integrated Services architecture in the service
provider's backbones has the following several limitations:
• The Integrated Services architecture focused primarily on long-lasting and
delay-sensitive applications. The World Wide Web, however, significantly
changed the Internet landscape. Web-based applications now dominate the
Internet, and much of Web traffic is short-lived transactions.
• Although per-flow reservation makes sense for long-lasting sessions, such as
video conferencing, it is not appropriate for Web traffic.
• The overheads for setting up a reservation for each session are simply too
high.
• Concerns also arose about the scalability of the mechanisms for supporting
Integrated Services. To support per-flow reservation, each node in a network
has to implement per-flow classification and scheduling. These mechanisms
may not be able to cope with a very large number of flows at high speeds.
• Resource reservation requires the support of accounting and settlement
between different service providers. Since those who request reservation have
to pay for the services, any reservations must be authorized, authenticated, and
accounted. Such supporting infrastructures simply do not exist in the Internet.
• When multiple service providers are involved in a reservation, they have to
agree on the charges for carrying traffic from other service providers'
customers and settle these charges among them.
• Most network service providers are normally connected through bilateral
peering agreements. To extend these bilateral agreements to an Internet-wide
settlement agreement is difficult given the large number of players.
The differentiated services model (Diffserv.), though simple and scalable, lacks
mechanisms for admission control. This makes it possible for an application
request for resources that may not be available at that moment. The application, in
this case, is not aware of the actual service that the network device provided. The
application must therefore observe its own end-to-end performance to adapt to the
service it is actually receiving from the network device.
23
A framework fo r Internet Quality o f Service in Kenya p/56/p/8173/03
The provision of QoS over the Internet involves a substantial cost on the part of
the service provider. However, there is no standard framework for determining
the actual increase in cost/byte when QoS is introduced. Service providers have to
balance between maintaining their profit margin, and remaining in business.
QoS provision is based on the service level specifications as laid down, between
the user and service provider, in the SLA. However, majority of network users
either are not aware of their actual service requirements, or do not have the
required expertise to specify the service levels. On the other hand, service
providers provide ready made service packages to users, without option of
modification. The user is then restricted to a predefined service type and level,
that has different service implications on a user by user basis.
Infrastructure ownership on the Internet is a key limitation to QoS
implementation. Due to cost of investment and lease of equipment, most service
providers prefer offering services on the already existing national
telecommunication grade. In addition, there is a strict limitation on how much of
the infrastructure capacity can be assigned to a single provider. To overcome the
cost implications, the service providers end up oversubscribing the service.
Another alternative has been the use of points-of-presence to provide the services.
This provides a bottleneck due to the additional store-and-forward operations at
the PoP.
The resources shared on the Internet are finite. This means that every time an
application reserves a given resource, it affects the performance of other
applications that were sharing the resources. A typical case of bandwidth
reservation will disadvantage the applications that are deemed not to be sensitive
to QoS requirements.
f
\f
24
A framework fo r Internet Quality o f Service in Kenya p/56/p/8173/03
Chapter 3: Internet Quality of Service in Kenya
3.1 Introduction
The Internet was introduced in Kenya in the early 1990s. By 1992, only e-mail
services were available. As with many other African states, Internet development
in Kenya was primarily led by a small group of technical enthusiasts, who included
Kenyans returning from overseas studies, Western ex-patriots, and Inter-
Governmental Organization (IGO) employees, and Non-Governmental
Organization (NGO) personnel. Individuals in these groups had been exposed to
Internet services and so upon their return or arrival in Kenya demanded Internet
access. The only means of accessing the Internet, during this period, was through a
Gopher service which offered access to text based information. The access then
was through either international leased lines or through X.25 connection to ITUs
TIES (Mweu, 2000).
The African Regional Centre for Computing (ARCC), an NGO based in Nairobi,
Kenya, was the first provider of web-based Internet service (Mweu, 2000). This
they did by providing their subscribers with the first-ever web browser software-
Mosaic. The connection to the global Internet backbone was via an analogue
leased line.
NGOs and IGOs who were in need of establishing communication with their
counterparts elsewhere were among the early adopters of Internet. These also
included services offered by HealthNet, email services for the staff of Institute of
Computer Science at the University of Nairobi, as well as ARCC email services
based on dialup connection to FIDOnet [Waema et al, 2007].
In October 1995, ARCC established the first full Internet services connection in
Kenya. Soon after (1995-1996) a number of commercial ISPs led by FormNet
and Africa Online entered the market with an array of dial-up access and leased
circuits offerings. This was followed by the entry of three other ISPs.
The commercial operators leased analogue and/or digital data links to the USA to
access the Internet backbone. Local dedicated lines-were predominantly analogue
lines leased ranging in capacity from 28.8 Kbps to 64Kbps. t
25
•ork fo r Internet Quality o f Service in Kenya p/56/p/8l 73/03
The Kenya Posts & Telecommunication Corporation (KPTC) was the sole
provider of telecommunication infrastructure within the country as well as
international circuits. The corporation also carried out regulatory functions which
included licensing of entrants (ISPs), frequency spectrum management, etc. This
made it difficult for the commercial services providers to operate freely without
some hindrances from the incumbent who did not have capacity to regulate as
well as enter the market as a player. The need for an Internet backbone access
locally became eminent with the increased demand for bandwidth and in
December 1998, KPTC launched the East Africa Internet exchange (EAFIX)
together with it Jambonet (Mweu, 2000). This led to lowering of costs for ISP
operations and an increase in the number of ISPs active in the market.
Competition resulted in slightly better prices for the end users.
The international bandwidth available at EAFIX comprised of 3 routes as follows:
• Teleglobe 2Mbps bi-directional
• BT 512Kbps bi-directional
• USEI 2Mbps upstream and 8Mbps downstream
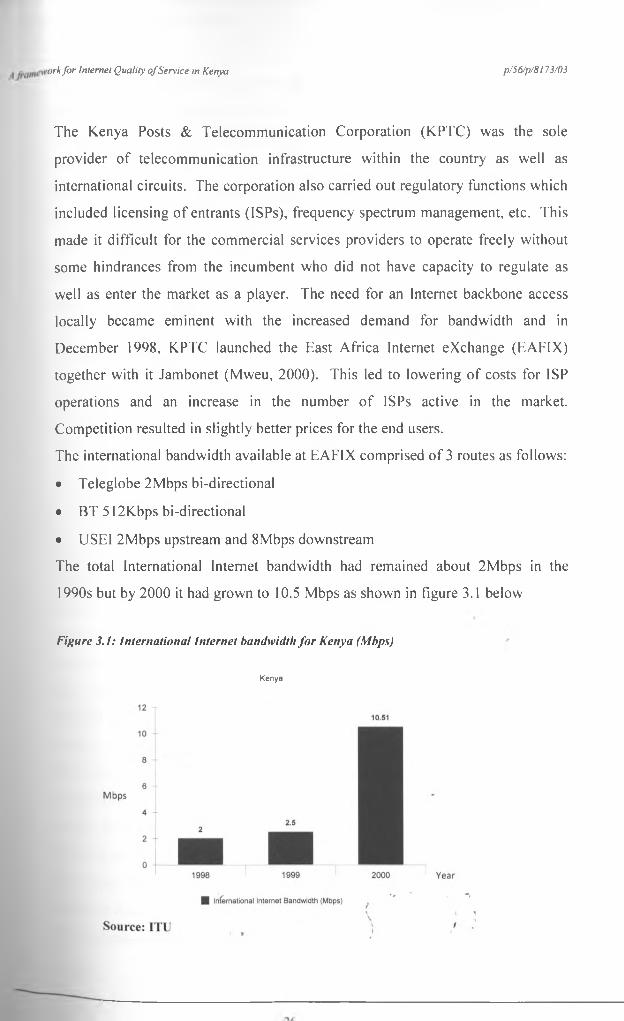
The total International Internet bandwidth had remained about 2Mbps in the
1990s but by 2000 it had grown to 10.5 Mbps as shown in figure 3.1 below
Figure 3.1: International Internet bandwidth for Kenya (Mbps)
Kenya
A framework fo r Internet Quality o f Service in Kenya p/S6/p/8l73/03
Between 1998 and 2000, the monthly cost of leasing a 64 Kbps link decreased
from a high of $12,500 to $4,500. At the same time, many cyber cates
mushroomed all over the main towns and competition among the service
providers was evident.
In July 1999 the government officially liberalized the telecommunicad°ns market
in Kenya. The Communication Commission of Kenya (CCK) WaS f°rrned to
regulate the sector. However, Telkom Kenya, formed Irom the
telecommunications arm of the former KPTC, was allowed a monopoly t0 °Perate
an Internet backbone for five years, until 2004.
During the exclusivity period, Telkom developed and expanded a national
backbone. The coverage area was limited to the main urban centers and l°r a l°nS
time availability, reliability and quality of the services provided was way below
average. During this period, the Internet market in Kenya witnessed rapid
expansions and the user base grew to over 500,000 users.
On average the cost of full unlimited dial up Internet account per w01 1 was
Ksh.5,000 plus VAT per month in the year 2000 plus the telecom usage charge.
This has now reduced to a cost of Kshl,000 plus VAT per month- With the
emergence of cyber cafes, this cost has reduced from Kshs 5.00-10-00 Per minute
in 2000 to the current cost of between Ksh0.50-1.00 per minute. The cost has
further reduced with the introduction of mobile internet services. This reduction in
consumer tariffs has enabled access to Internet service by more, Kenyans,
especially in the low income bracket.
By 2005, Telkom Kenya revised its domestic leased line tariffs, through its Jambo
Telkom subsidiary, which had remained constant since 2000. The Kenstream
charges (dedicated point-to-point domestic links) remained the sarue untd duly
2006 when Telkom reduced them by 50%. This reduction can be associated with
competition in provision of domestic leased lines following the licensing of
several Public Data Network Operators [Waema et al, 2007]. The other PDNOs
followed suit and reduced their domestic leased line tariffs.
In January 2006, ISP licenses were modified to permit VoIP seryices- Before the
modified licenses could be issued, all licensed I&Ps were required to mahe their
outstanding statistical returns to CCK. Those ISPs that did fl°t meet the

A framework fo r Internet Quality o f Service in Kenya p/56/p/8173/03
requirements were deregistered through a gazette notice. According to the Kenya
Gazette Notice dated 6th October, 2006, CCK revoked the licenses of 30 ISPs.
Until 2005, only ISPs could offer Internet services. However, the situation has
changed since CCK issued a new licensing framework in late 2004 after the
TKL’s monopoly came to an end in June 2004. For example, two Internet
Backbone Gateway Operators were licensed in December 2004 and Telkom
Kenya, through its subsidiary Jambo Telkom, moved into the Internet market in
2005/2006. Mobile companies Safaricom and Celtel (now Zain) started offering
mobile Internet services in the form of GPRS and EDGE [Waema et al, 2006].
Acording to Waema et al (2007),, Kenya has lost several opportunities that in all
likelihood would have led to increased growth in the Internet market, since the
end of Telkom’s monopoly in 2004. One of these opportunities was the planned
licensing of a Second National Operator (SNO) to compete with Telkom Kenya,
which failed in 2004 for different reasons. The second opportunity that was lost
was the planned privatization of a majority stake in Telkom. This was postponed
to 2006. The situation has however changed, and the envisaged growth is now
visible. Telkom Kenya was privatized, and a third mobile operator has already
commenced operations.
On the positive side, key successes have been reported, including:
• The lifting of the ban on VoIP;
• Telkom Kenya’s monopoly in the provision of Internet backbone and
international bandwidth services expired, with the entry of new operators
leading to reductions and improved quality of services; and
• Enormous growth in the mobile telephony sector.
• The key challenges in the growth of Internet, in Kenya, include cost of
Internet use, lack of local content, and narrow focus on the part of the ISPs,
inadequate regulatory framework, unfriendly interconnection process,
unpredictable business environment and poor local access network
infrastructure [Waema et al, 2006].
The privatization of majority stake in Telkom, ..and the commencement of/
operation by the country’s third mobile service provide^ ii two other key* 1 <
successes in the recent year. This has led to increased competition, particularly in
28
A framework fo r Internet Quality o f Service in Kenya p/56/p/8173/03
the provision of data services. This is expected to have positive impact on the
growth of Internet use in Kenya.
The landing of the undersea fiber optic cable in Mombasa has also introduced a
strong catalyst in this growth. The East African Marine System (TEAMS) cable
and the SEACOM marine cable system have already landed and are expected to
provide an addition 1.28Tbps (SEACOM) and l,2Tbps (TEAMS). Also the same
may be said for the expected landing of the East Africa submarine System
(EASSy) cable in 2010.
3.2 Existing Internet infrastructure in Kenya
In most countries, Kenya included, fixed telephone lines formed the platform
upon which Internet services were developed. Dial-up connectivity and analog
leased lines were the initial set of Internet access services offered. The fixed line
teledensity influenced the adoption and growth of the Internet users. However,
fixed digital leased lines later became the dominant mode of providing permanent
internet connections to organizations [Waema et al, 2006].
Kenya liberalized its telecommunications sector in 1999 after the Kenya
Communication Act 1998 became operational. This led to the formalization of
market structures and advent of activities geared towards the development of the
telecommunications markets in total. On the Internet front, ISPs were licensed to
operate formally and the incumbent was given the monopoly to operate the
Internet Backbone as well as the provision of access circuits (leased lines, VS AT,
etc) for 5 years until July 2004. Though Telkom Kenya developed and expanded
a national backbone, the coverage area was limited to the main urban centres and
for a long time availability, reliability and quality of the services provided was
way below average.
Two mobile operators, Safaricom and Kencel (currently Zain), were licensed and
continue to operate as a duopoly. Later in 2008, Telkom launched its mobile
service “Telkom Wireless”. This was later converted to Orange Mobile, after the
privatization of Telkom. The Licensed third operator, econet wireless, also
commenced operations in 2009, under the YU brand. This has introduced thef
much desired competition, leading to better services. '
29
A framework fo r Interne I Quality o f Service in Kenya p/56/p/8173/03
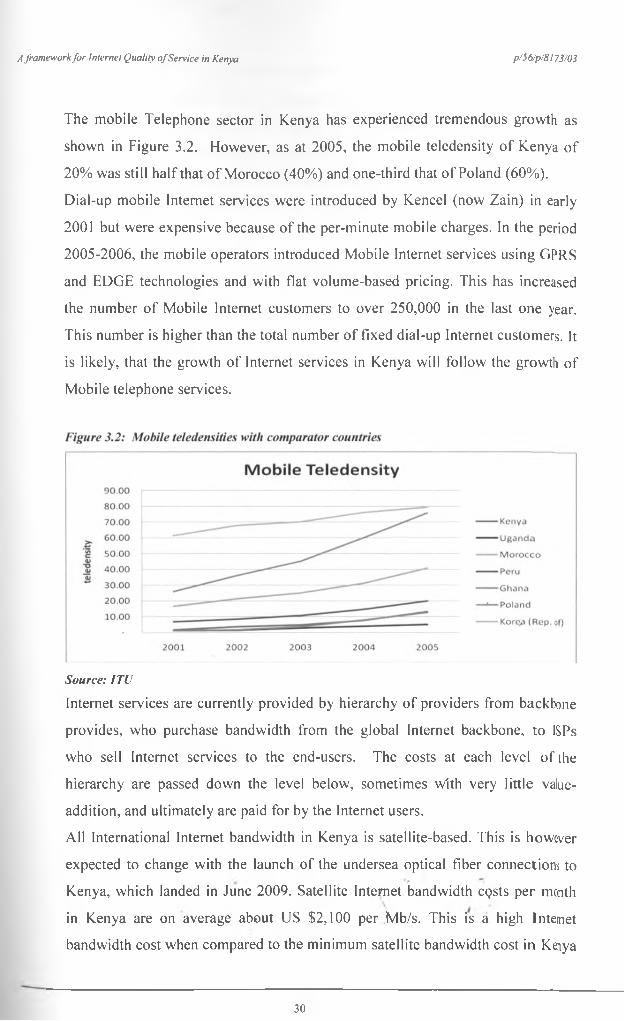
The mobile Telephone sector in Kenya has experienced tremendous growth as
shown in Figure 3.2. However, as at 2005, the mobile teledensity of Kenya of
20% was still half that of Morocco (40%) and one-third that of Poland (60%).
Dial-up mobile Internet services were introduced by Kencel (now Zain) in early
2001 but were expensive because of the per-minute mobile charges. In the period
2005-2006, the mobile operators introduced Mobile Internet services using GPRS
and EDGE technologies and with flat volume-based pricing. This has increased
the number of Mobile Internet customers to over 250,000 in the last one year.
This number is higher than the total number of fixed dial-up Internet customers. It
is likely, that the growth of Internet services in Kenya will follow the growth of
Mobile telephone services.
Source: ITU
Internet services are currently provided by hierarchy of providers from backbone
provides, who purchase bandwidth from the global Internet backbone, to ISPs
who sell Internet services to the end-users. The costs at each level of the
hierarchy are passed down the level below, sometimes with very little value-
addition, and ultimately are paid for by the Internet users.
All International Internet bandwidth in Kenya is satellite-based. This is however
expected to change with the launch of the undersea optical fiber connections to
Kenya, which landed in June 2009. Satellite Internet bandwidth CQSts per month
in Kenya are on average about US $2,100 per Mb/s. This is a high Internet
bandwidth cost when compared to the minimum satellite bandwidth cost in Kenya
30
A framework fo r Internet Quality o f Service in Kenya p/56/p/8l 73/03
of only US $625 per Mb/s and under US$ 500 per Mb/s per month possible with
an undersea optical fiber. Consequently, Internet gateway operators use
asymmetrical configurations to reduce the total cost of international Internet
bandwidth. The costs are thus expected to go down tremendously once the ISPs
are linked via the undersea optical fiber connections to the global Internet. It is
expected to be even cheaper with the landing of the third undersea connection in
2010.
The total gateway bandwidth in Kenya has grown progressively to a total of
758.59 Mbps as at 2005/2006 as shown in table 3.1 below. It is to be noted that
this bandwidth has increased tremendously since the end of TKL’s exclusivity
period, doubling in 2004/2005 and more than doubling in 2005/2006 from the
previous year.
Table 3.1: International gateway bandwidth
2001/02 2002/03 2003/04 2004/05 2005/06International gateway downlink bandwidth (Mbps) 62.24 102.32 84.91 180.75 660.83International gateway downlink bandwidth per inhabitant (bps) 2.06 3.33 2.70 5.64 20.26International gateway uplink bandwidth (Mbps)
20.51 24.61 26.20 42.63 97.77
International gateway total bandwidth (Mbps) 82.75 126.92 111.10 223.38 758.59Ratio o f downlink to uplink bandwidth 3.03 4.16 3.24 .4.24 6.76
Source: Internet Analysis Study
Three major submarine cables are currently being deployed to offer east and
southern African countries with much needed cheap connectivity [Adam L„
2008].
(a.) The SEACOM submarine cable due to become operational during the
third quarter of 2009 is being built by a consortium of private companies
including Herakles, Blackstone, Aga Khan Fund, Venfin, Convergence
Partners, Shanduka and the second national operator of South Africa
Neotel.
(b.) The East African Marine System (TEAMS) owned by the Government of
Kenya, the Kenyan private sector and UAE based mobile Operator Etisalat* •is another cable due to be operational during the second half of 2009.
31
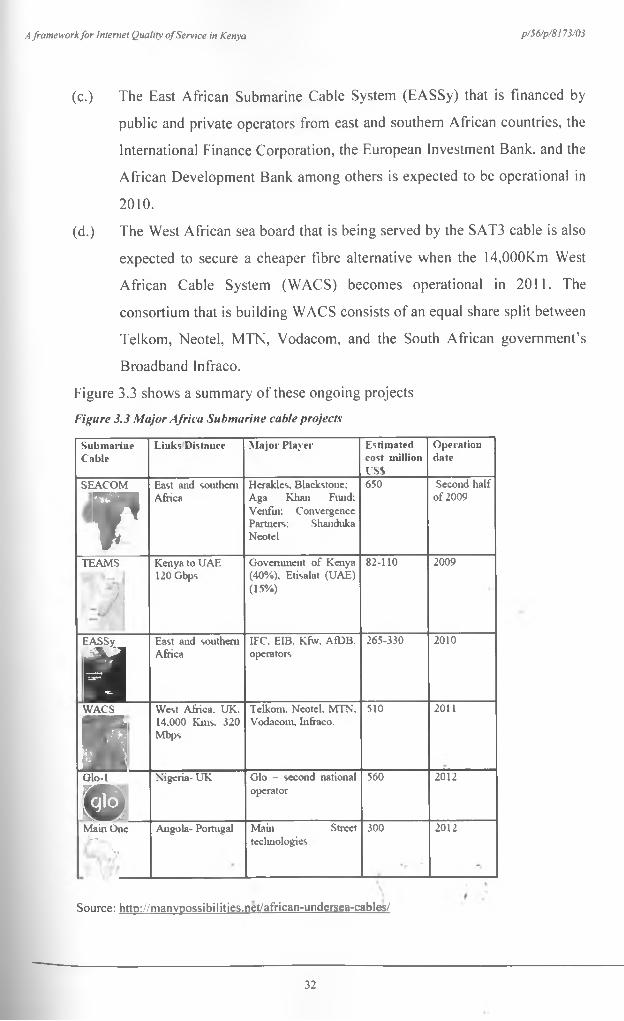
A framework fo r Internet Quality o f Service in Kenya p/56/p/8173/03
(c.) The East African Submarine Cable System (EASSy) that is financed by
public and private operators from east and southern African countries, the
International Finance Corporation, the European Investment Bank, and the
African Development Bank among others is expected to be operational in
2010.
(d.) The West African sea board that is being served by the SAT3 cable is also
expected to secure a cheaper fibre alternative when the 14,000Km West
African Cable System (WACS) becomes operational in 2011. The
consortium that is building WACS consists of an equal share split between
Telkom, Neotel, MTN, Vodacom, and the South African government’s
Broadband Infraco.
Figure 3.3 shows a summary of these ongoing projectsFigure 3.3 Major Africa Submarine cable projects
S u b m a rin eC a b le
L iu k s D istance M a jo r P la y e r E stim a te d cost m illion USS
O p e ra tio nd a te
SEA C O M
VEast and southern Africa
H erakles. B lackstone: Aga K han Fluid; V enfin: C onvergence Partners; Shanduka N eotel
650 Second h a lf o f 2009
TEA M S
A
Kenya to U A E 120 G bps
G overnm ent o f Kenya (40% ), E tisalat (U A E) (15% )
82-110 2009
EA SSy
MEast and southern Africa
IFC. EIB. Kfrv. AfD B. operators
265-330 2010
W ACS
1W est A frica. UK , 14.000 K nis. 320 M bps
T elkom , N eotel. M TN . V odacom , Infraco.
510 2011
O lo -lm N igeria- U K G lo - second national operator
560 2012
M ain O ney -s
V,
A ngola- Portugal M ain Street technologies
300 2012
Source: http://manvpossibilities.net/african-undersea-cables/
32
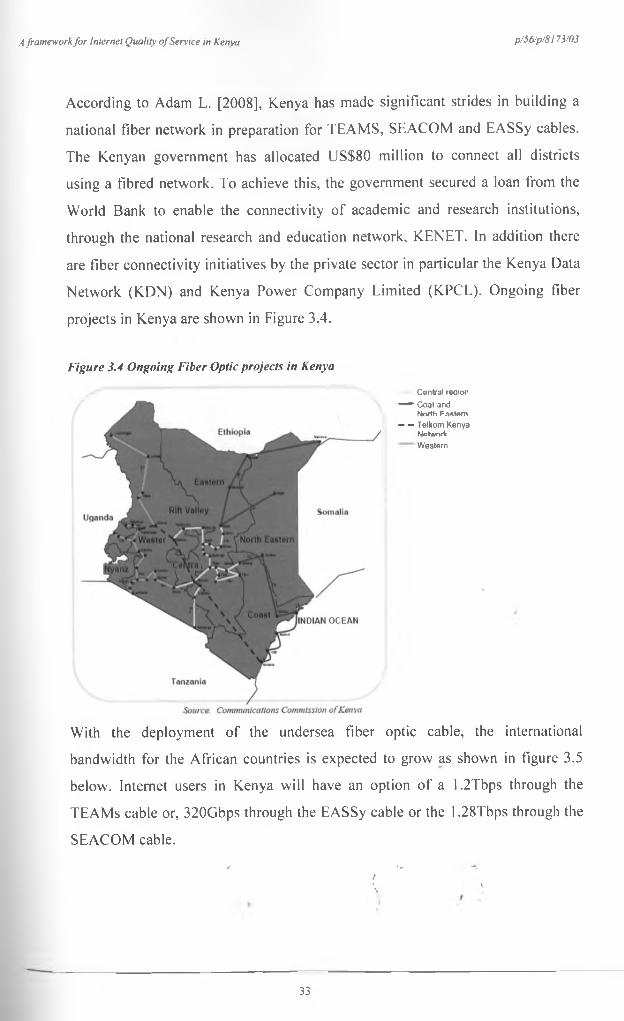
A framework fo r Internet Quality o f Service in Kenya p/56/p/8173/03
According to Adam L. [2008], Kenya has made significant strides in building a
national fiber network in preparation for TEAMS, SEACOM and EASSy cables.
The Kenyan government has allocated US$80 million to connect all districts
using a fibred network. To achieve this, the government secured a loan from the
World Bank to enable the connectivity of academic and research institutions,
through the national research and education network, KENET. In addition there
are fiber connectivity initiatives by the private sector in particular the Kenya Data
Network (KDN) and Kenya Power Company Limited (KPCL). Ongoing fiber
projects in Kenya are shown in Figure 3.4.
Figure 3.4 Ongoing Fiber Optic projects in Kenya
Central reqion
“ Coat andNorth Fa*tom
— — Telkom Kenya Notwork Western
With the deployment of the undersea fiber optic cable, the international
bandwidth for the African countries is expected to grow as shown in figure 3.5
below. Internet users in Kenya will have an option of a 1.2Tbps through the
TEAMs cable or, 320Gbps through the EASSy cable or the 1.28Tbps through the
SEACOM cable.V •#
/\ i '\
33
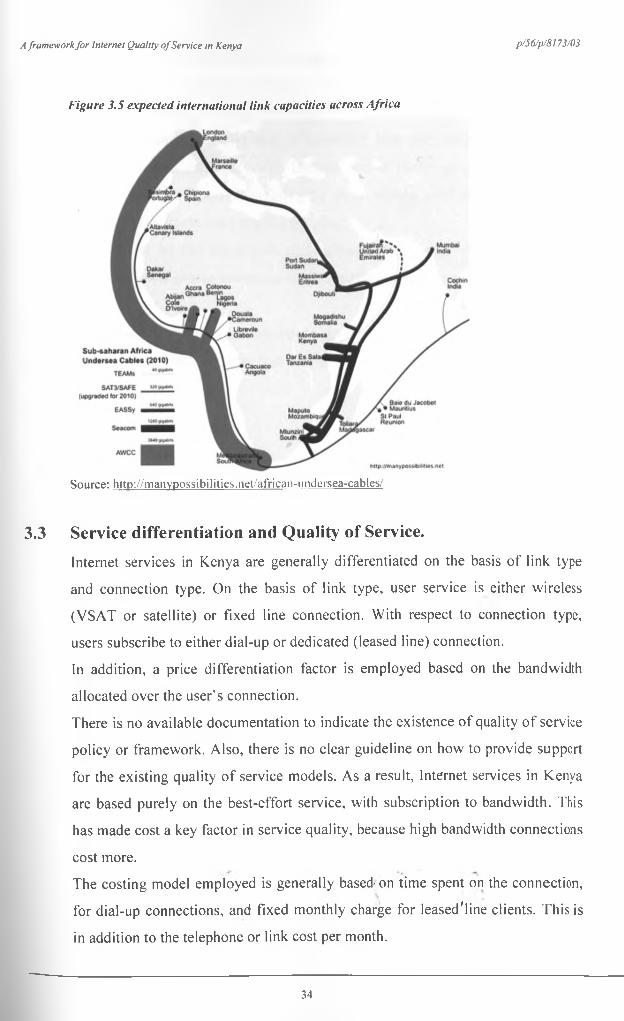
/) framework fo r Internet Quality o f Service in Kenya p/56/p/8173/03
Figure 3.5 expected international link capacities across Africa
Source: http://manvpossibilities.net/african-undersea-cables/
3.3 Service differentiation and Quality of Service.Internet services in Kenya are generally differentiated on the basis of link type
and connection type. On the basis of link type, user service is either wireless
(VSAT or satellite) or fixed line connection. With respect to connection type,
users subscribe to either dial-up or dedicated (leased line) connection.
In addition, a price differentiation factor is employed based on the bandwidth
allocated over the user’s connection.
There is no available documentation to indicate the existence of quality of service
policy or framework. Also, there is no clear guideline on how to provide support
for the existing quality of service models. As a result, Internet services in Kenya
are based purely on the best-effort service, with subscription to bandwidth. This
has made cost a key factor in service quality, because high bandwidth connections
cost more.The costing model employed is generally based; on time spent on the connection,
for dial-up connections, and fixed monthly charge for leased'line clients. This is
in addition to the telephone or link cost per month.
34
A framework fo r Internet Quality o f Service in Kenya p/56/p/8173/03
This study has established a continued desire for quality services by Internet
users, and a corresponding willingness to pay for the services.
Though the degree to which applications such as VoIP, Video conferencing and
video on demand, are in use is generally low, the usage is growing at a
tremendous rate, especially with introduction of exchange programs, e-learning
and distance education. Currently, the most widely used applications are web
browsing, electronic mail and file transfers.
The number of file downloads and uploads is growing, particularly with the
advent of open source resources such as software, learning materials and free e-
books.
This trend calls for urgent measures to ensure the Internet infrastructure is suitable
for the applications, and also that user satisfaction is achieved.
/V
/
A framework fo r Internet Quality o f Service in Kenya p/56/p/8173/03
Chapter 4: Conceptual Framework:4.1 Introduction
QoS is the collective effect of service performances which determine the degree
of satisfaction of a user of the service [ITU-T E.800]. This implies that the user is
the final arbiter of 'good' or 'bad' QoS. Different applications demand different
service qualities. Some need minimal delay and reliable response time, while
others may need a good image quality. The QoS is a difficult issue in that the
relationship between application QoS parameters and network QoS parameters is
very complex; QoS must be end-to-end; and the application QoS might change
during connections [X. Guo, 1997].
QoS, as found on any consumer router running on a standard Internet Service
Provider, will only work on upstream/outbound data (data going from you to your
ISP). It is practically impossible for a service user to control the priority of data
coming from the ISP, since it’s only possible to control the data on your side of
the modem. Thus true QoS is only possible if it’s offered by the Service provider,
and understood by the service user. The service level agreement need to be
specific on the type of service, parameters to measure, parameter levels and the
guaranteed levels.
In Kenya, the most commonly used Internet Services include web browsing,
electronic mail and file transfer. These services are quite tolerant to the
performance of the best-effort service. In addition, the users are generally patient
enough to wait or try another time. QoS sensitive applications, such as VoIP and
Video Conferencing, are growing in use in the Kenyan Internet market. However,
this study established that these services are accessed on a once-off (rarely) bases.
This provides little incentive to the subscription to “full time” quality of service.
The Integrated Services architecture focused primarily on 'long-lasting and delay-
sensitive applications. The World Wide Web, however, the Internet is currently
dominated by web traffic, much of which is short-lived transactions. Intserv
operates optimally with a local area network or a campus area network, where the/ *•* *number of intermediate hops is low. On an internetwork, it suffers the drawback
\ i fof having to store too much flow based information on each intermediate node.
36
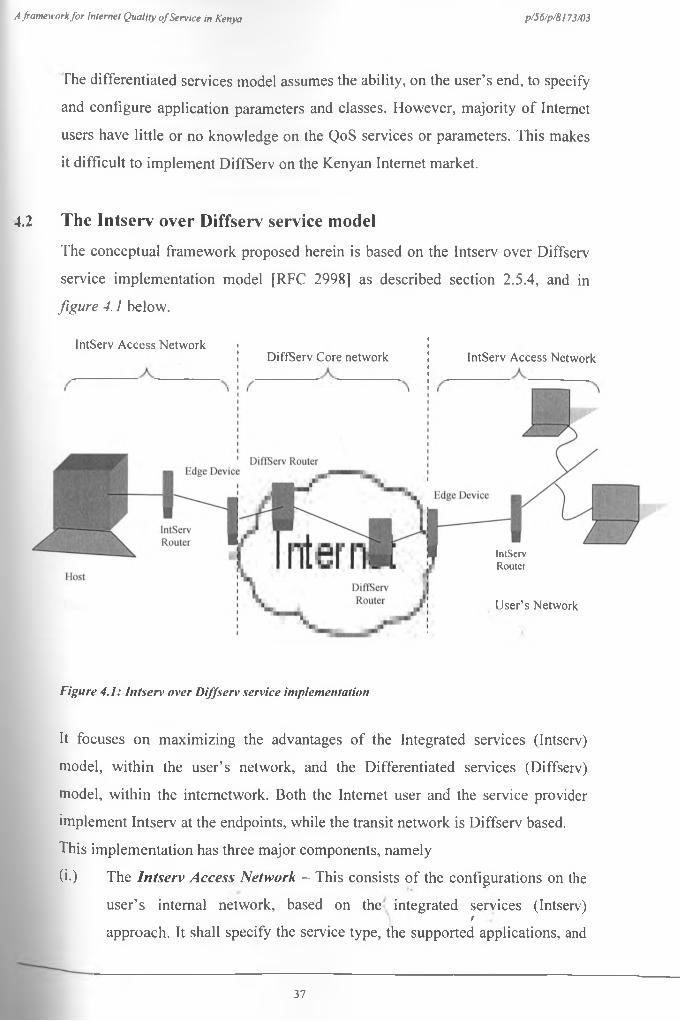
A framework fo r InterneI Quality o f Service in Kenya p/56/p/8173/03
The differentiated services model assumes the ability, on the user’s end, to specify
and configure application parameters and classes. However, majority of Internet
users have little or no knowledge on the QoS services or parameters. This makes
it difficult to implement DiffServ on the Kenyan Internet market.
4.2 The Intserv over Diffserv service model
The conceptual framework proposed herein is based on the Intserv over Diffserv
service implementation model [RFC 2998] as described section 2.5.4, and in
figure 4.1 below.
IntServ Access NetworkDiffServ Core network IntServ Access Network
DniScrvRouter
bdge Device
IntServRouter
DiffServ Router
IntServRouter
User’s Network
bdge Device
Figure 4.1: Intserv over Diffserv service implementation
It focuses on maximizing the advantages of the Integrated services (Intserv)
model, within the user’s network, and the Differentiated services (Diffserv)
model, within the internetwork. Both the Internet user and the service provider
implement Intserv at the endpoints, while the transit network is Diffserv based.
This implementation has three major components, namely
(i.) The Intserv Access Network - This consists of the configurations on the
user’s internal network, based on the integrated services (Intserv)t
approach. It shall specify the service type, the supported applications, and
37
A framework fo r Internet Quality o f Service in Kenya p/56/p/8173/03
QoS parameters for the service. This component is defined on both the
user’s and the service provider’s ends of the communication.
(ii.) The Diffserv Core Network - This comprises of the interconnection
technology from the user’s router (gateway) to the service provider’s
gateway. It defines the resource assurances that the physical infrastructure
will be able to support for the services. It comprises a set of Diffserv
routers that collaborate in the delivery of the requested service.
The service provider specifies the infrastructure requirements for each of
the services supported.
(iii.) The edge device - This consists of the services and configurations on the
service provider’s endpoint. It defines how the requested service is offered
by the service provider. This component contains the specifications of the
service types, service interfaces, supported applications and QoS
parameters for the service offered. It includes an admission control
mechanism to accept or reject a request for service.
(iv.) The service mapping algorithm - This determines how the Diffserv
service classes are mapped to the Intserv service definition, and vice versa.
For simplicity of application, direct/default mapping has been employed in
this implementation.
The Intserv over Diffserv model however has the following limitations:
• It does not specify the minimum infrastructure requirements for services.
• It does not specify the parameter mapping necessary to support the various
services.
• It does not define any service classes for QoS implementation, leaving the
choice to the user. This makes implementation of the service a difficult
decision to make.
• It does not factor service evaluation in the implementation of QoS.
To ensure simplicity in the implementation of QoS, the proposed framework
focuses on three broad components:
• Service specification > •- -
• Service implementation \ t
• Service implementation.
38

A framework fo r Internet Quality o f Service in Kenya p/56/p/8173/03
Chapter 5: Research Methodology5.1 Research design
The primary data for this research was obtained from the Internet service
providers (ISPs). These included:
• The type of service (s) offered to the users, as per the service level agreement
(SLA).
• Any service differentiation approach used, including: dial-up versus
dedicated, high-bandwidth versus low-bandwidth, etc.
• Any application specific provisions and/or guarantees offered/implied in the
SLA. Including: minimum bandwidth, percentage daily service availability,
maximum delay, reliability, etc.
• Parameters considered when offering service to users,
o The available bandwidth.
o The available infrastructure, etc.
• Any measure taken to ensure service promised is actually delivered to the
users. E.g. Infrastructure agreement.
• Service costing model used. E.g.
o Number of hours of connection,
o Number of bytes delivered./
o Fixed monthly rate,
o Bandwidth dependent fixed monthly rate,
o Fixed rate plus variable rate,
o Fixed rate plus variable bandwidth rate, etc.
• Support for implementation of the existing QoS models; the Diffserv and
Intserv models.
Secondary data was obtained from the Communications Commission of Kenya
(CCK) and a random sample of users. This will include:
• From the CCK:
o Current service guidelines for Internet seryice provision. *
39
A framework fo r Internet Quality o f Service in Kenya p/56/p/8l73/(rf
o The acceptable service levels for different internet applications’
particularly VoIP, audio on demand, video conferencing and video of1
demand.
o List of registered ISPs.
o Any existing service/application specific guidelines,
o Internet infrastructure and associated guidelines.
• From the user sample:
o The desirable service, based on availability, reliability, delay, cost, etc.
o Desired service differentiation approach: by service supported, b /
bandwidth levels, by bits/bytes delivered, guarantees/provisions offered,
o Desired costing model/approach.
5.2 Data collection methodsThe following data collection methods were employed in this research:
• Semi-structured questionnaires
• Interviews
• Review of documentation.
In addition, literature survey, preliminary interviews and observation method^
were used in obtaining preliminary data for the research.
To obtain the primary data, a random sample of the Internet Service Provider^
was taken. A questionnaire was used to collect the information from the selectee^
ISPs, and a subsequent interview was organized, where necessary, to gathe:r
additional information, and obtain any necessary clarifications on the collected
data.
Secondary data was obtained from the service regulator, the Communication^
Commission of Kenya (CCK) and a randomly selected user sample.
Necessary documentation on service and infrastructure guidelines was obtained
from the CCK. This was used to obtain information on the existing services
service levels and service providers. In addition, an informal interview wa^s
conducted with one of the tepresentatives of CCI£. '*
40

A framework fo r Internet Quality o f Service in Kenya p/56/p/8173/03
A random sample of fifty (50) users was selected, and a questionnaire was issued
to each. This provided information on the user’s perception of the existing
services, and the desired service levels.
A framework fo r Internet Quality o f Service in Kenya p/56/p/8l 73/03
Chapter 6: Data Analysis and Results6.1 Analysis of collected data
The purpose of the study was to come up with a proposed framework for the
implementation of Internet Quality of Service in Kenya. The data presented herein
was gathered from three main sources; namely the communications commission
of Kenya (CCK), a sample of Internet Service Providers (ISPs) and a sample of
50 Internet users.
In addition, preliminary data was gathered from literature survey, preliminary
interviews and observations.
Before the data was analyzed, all the questionnaires were adequately checked for
accuracy and completeness. The information was then coded and entered into a
relational EPI-data® database and analyzed using Statistical Package for Social
Sciences (SPSS®). Exploratory analysis was first performed to ensure that the
output was free from outliers and the effect of missing responses was at
minimum. Descriptive methods of data analysis were applied. The findings are
presented by use of tables, bar charts and pie charts.
The organization of the results is as follows: section 5.1 presents the findings on
the preliminary data; section 5.2 presents findings on data from CCK; section 5.3
presents findings on data from the user sample; and Section 5.4 presents findings
on data from ISPs.
6.2 Preliminary Data
The preliminary data was obtained by review of documentation, informal
interviews and observation. The following results were obtained:
• There was no evidence of any policy document, either from the service
regulator (CCK), or the government addressing quality in Internet provision.
The CCK however, in the CCK policy guideline on the provision of VoIP
[2005], states that service providers are required to meet the quality of service
requirements as may be'set out by the commission'.'
42
A framework fo r Internet Quality o f Service in Kenya p/56/p/8!73/03
• The operations of Internet services are generally regulated by the
Communication Act (2001), which basically has no specific reference to the
Internet services. With respect to quality of service, the act states that
“interconnection agreements shall provide for adequate capacity, service
levels and reasonable remedies for any failure to meet those service levels”.
• Most of the Internet users are ignorant of their entitlement to quality of
service.
• There was general feeling of dissatisfaction, on the part of Internet users, with
the services they received from their providers. In addition, the users exhibited
little or no knowledge of quality of service concepts.
• Internet service providers basically provide service differentiation on the basis
of either price, or the type of connection. No specific guarantees are attached
to the user contracts.
• There are fifty three (53) licensed Internet Service Providers. Among these,
only 39 were found to be active. In addition, some of the service providers
also double up as infrastructure providers.
• From observation, the Internet services experienced frequent down-times, for
leased-line clients. For dial-up clients, it was observed that the data rates
specified in the service contract was never achieved. For example, most dial
up clients observed had a 64kbps connection, which only provided a/
maximum of 21kbps.
• Most dial-up clients were noted to be connected through points-of-presence.
This partly contributed to the low data rates achieved, and also poor response
time in case of service down-time. This was further attributed to the
oversubscription of the lines, by the providers, in order to maximize on
profits.
6 3 Data from CCK
The communications commission of Kenya (CCK) categorizes Internet traffic
into two categories. v /\ , ■
• Audio and video applications.,
43

A framework fo r Internet Quality o f Service in Kenya p/56/p/8173/03
• Data applications.
Audio applications include conversational voice, voice messaging, and high
quality streaming audio. Tables 6.1 provides a description of audio and video
applications, while table 6.2 illustrate the performance parameters and targets for
audio and video applications.
Video traffic is divided into videophone (conferencing) and one-way video (video
on demand). Data applications fall under thirteen categories, as shown in table 6.3
Table 6.1- Performance targets for audio and video applications
Medium Application Degree of symmetry Typical data rates
Audio Conversational voice Two-way 4-64 kbit/s
Audio Voice messaging Primarilyone-way
4-32 kbit/s
Audio High quality streaming audio Primarily one-way 16-128 kbit/s
Video Videophone Two-way 16-384 kbit/s
Video One-way One-way 16-384 kbit/sSource: CCK
Table 6.2 - Key performance parameters and target values for audio and video applications
Application One-waydelay
Delayvariation
Information loss Other
Conversationalvoice
<150 ms preferred <400 ms limit
< 1 ms < 3 % packet loss ratio (PLR)
/
Voice messaging < 1 s for playback< 2 s for record
< 1 ms < 3% PLR
High quality streaming audio
< 10s « 1 ms < 1% PLR
Videophone < 150 ms preferred <400 ms limit
< 1% PLR Lip-synch: < 8 0 ms
One-way video < 10 s < 1% PLRSource: CCK
The values in tables 6.1 and 6.2 are subject to the following considerations:
• The value of one-way delay for conversational voice is subject to an assumption
of adequate echo control. ( »
44
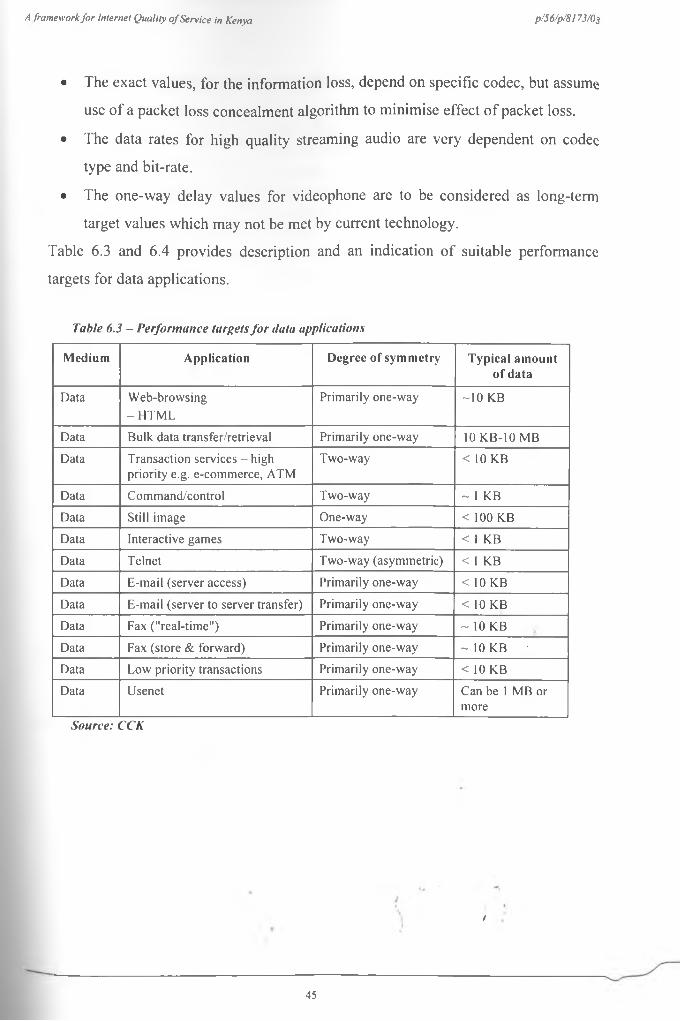
A framework fo r Internet Quality o f Service in Kenya p/56/p/817 3/0 3
• The exact values, for the information loss, depend on specific codec, but assume
use of a packet loss concealment algorithm to minimise effect of packet loss.
• The data rates for high quality streaming audio are very dependent on codec
type and bit-rate.
• The one-way delay values for videophone are to be considered as long-term
target values which may not be met by current technology.
Table 6.3 and 6.4 provides description and an indication of suitable performance
targets for data applications.
Table 6.3 - Performance targets for data applications
Medium Application Degree of symmetry Typical amount of data
Data Web-browsing-H TM L
Primarily one-way ~10 KB
Data Bulk data transfer/retrieval Primarily one-way 10 KB-10 MB
Data Transaction services - high priority e.g. e-commerce, ATM
Two-way < 10 KB
Data Command/control Two-way ~ 1 KB
Data Still image One-way < 100 KB
Data Interactive games Two-way < 1 KB
Data Telnet Two-way (asymmetric) < 1 KB
Data E-mail (server access) Primarily one-way < 10 KB
Data E-mail (server to server transfer) Primarily one-way < 10 KB
Data Fax ("real-time") Primarily one-way - 10 KB
Data Fax (store & forward) Primarily one-way ~ 10 KB
Data Low priority transactions Primarily one-way < 10 KB
Data Usenet Primarily one-way Can be 1 MB or more
Source: CCK
t
45

A framework fo r Internet Quality o f Service in Kenya p/56/p/8173/03
Table 6.4 - Key performance parameters and target values
Application One-way delay (Note)
Delayvariation
Informationloss
Web-browsing-H TM L
Preferred < 2 s /page Acceptable < 4 s /page
N.A. Zero
Bulk data transfer/retrieval Preferred < 15 s Acceptable < 60 s
N.A. Zero
Transaction services - high priority e.g. e-commerce, ATM
Preferred < 2 s Acceptable < 4 s
N.A. Zero
Command/control < 250 ms N.A. Zero
Still image Preferred < 15 s Acceptable < 60 s
N.A. Zero
Interactive games < 200 ms N.A. Zero
Telnet < 200 ms N.A. Zero
E-mail (server access) Preferred < 2 s Acceptable < 4 s
N.A. Zero
E-mail (server to server transfer) Can be several minutes N.A. Zero
Fax ("real-time”) < 3 0 s/page N.A. <10'6 BER
Fax (store & forward) Can be several minutes N.A. <10'6 BER
Low priority transactions < 30 s N.A. Zero
Usenet Can be several minutes N.A. ZeroSource: CCK
6.4 Data from Internet Users
The organization of the results is as follows: section 6.4.1 presents findings on the
respondents; section 6.4.2 presents findings on the status of internet infrastructure;
Section 6.4.3 presents findings on internet services and Section 6.44 presents
findings on the quality of service.
6.4.1 Information on the respondents
The targeted sample comprised of network users and network administrators. The
data presented herein was gathered from 50 respondents who comprised of
network administrators and network users as indicated in Table 6.5.Table 6.5: Status of the internet user interviewed (N=46)
Frequency % of the totalNetwork administrator 26 56.5%Network user 20 43.5%Total 46 100.0%

A framework fo r Internet Quality o f Service in Kenya p/56/p/8173/03
6.4.2 Internet InfrastructureThis part sought to establish the infrastructure available to the Internet users in
Kenya, in accessing the availed Internet services. It focuses on three aspects of
infrastructure, as presented in the following section: section 6.4.2.1 Mode of
Internet access; section 6.4.2.2 Type of connection; and section 6.4.2.3
Connection speeds as per service level agreements.
6.4.2.1 Mode of internet access
The research questionnaire had sought to establish how the respondents access
Internet services. The options available included personal computer, workplace
computer, and from a cyber cafe. Table 6.6 presents a multiple response analysis
on the various points of access of internet services as identified by the
respondents.Table 6.6: Internet services ’points of access
n % of the totalPersonal computer with connection (N=50) 12 24.0%Computer at the work place (N=50) 6 12.0%Computer in a cyber cafe (N=50) 38 76.0%
6.4.2.2 Types of Connection
Figure 6.1 presents a split of responses regarding the types of connections used in accessing internet services.Figure 6.1: Types of Connections Used (N=48)
47
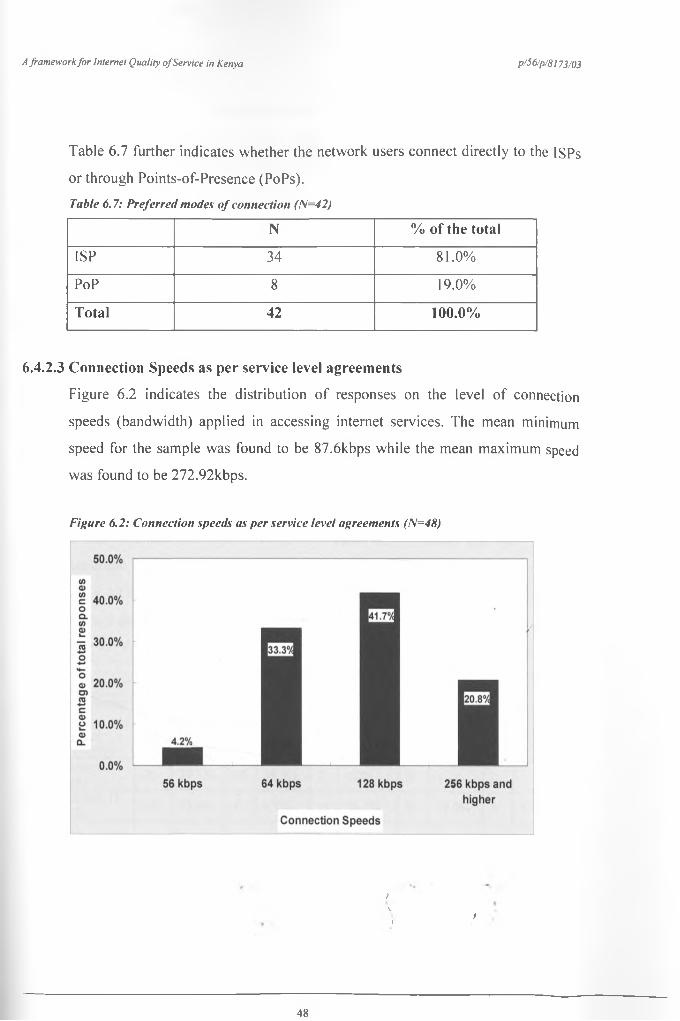
A framework fo r Internet Quality ofService in Kenya p/56/p/8l 73/03
Table 6.7 further indicates whether the network users connect directly to the ISPs
or through Points-of-Presence (PoPs).Table 6.7: Preferred modes of connection (N=42)
N % of the total
ISP 34 81.0%
PoP 8 19.0%
Total 42 100.0%
6.4.2.3 Connection Speeds as per service level agreements
Figure 6.2 indicates the distribution of responses on the level of connection
speeds (bandwidth) applied in accessing internet services. The mean minimum
speed for the sample was found to be 87.6kbps while the mean maximum speed
was found to be 272.92kbps.
Figure 6.2: Connection speeds as per service level agreements (N=48)
t\i t
48
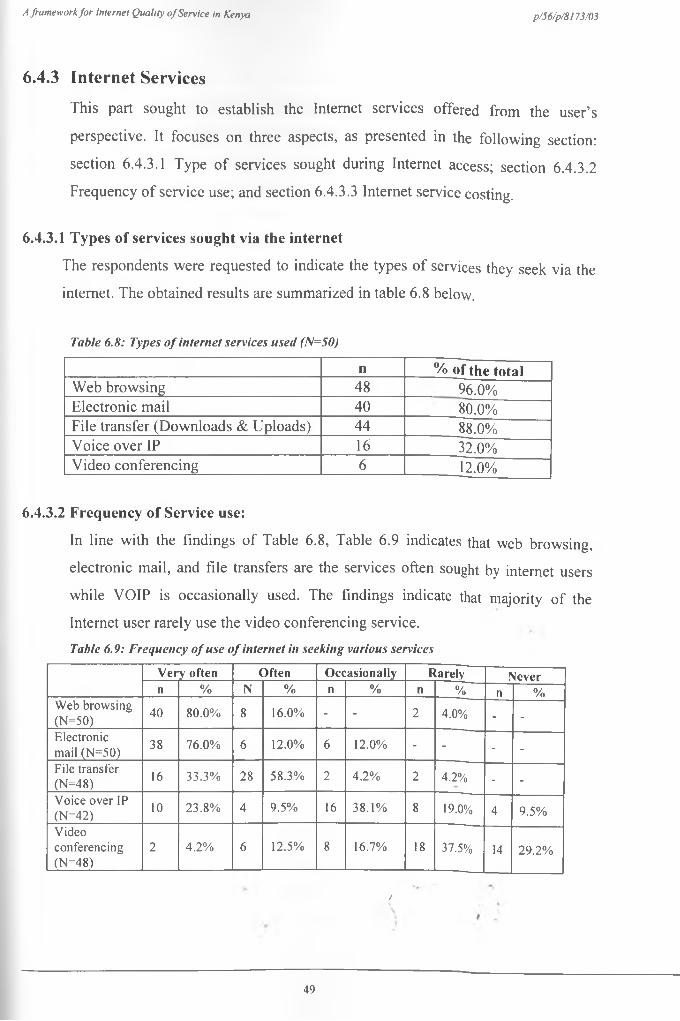
A framework fo r Internet Quality o f Service in Kenya p/56/p/8173/03
6.4.3 Internet Services
This part sought to establish the Internet services offered from the user’s
perspective. It focuses on three aspects, as presented in the following section:
section 6.4.3.1 Type of services sought during Internet access; section 6.4.3.2
Frequency of service use; and section 6.4.3.3 Internet service costing.
6.4.3.1 Types of services sought via the internet
The respondents were requested to indicate the types of services they seek via the
internet. The obtained results are summarized in table 6.8 below.
Table 6.8: Types of internet services used (N=50)
n % of the totalWeb browsing 48 96.0%Electronic mail 40 80.0%File transfer (Downloads & Uploads) 44 88.0%Voice over IP 16 32.0%Video conferencing 6 12.0%
6.4.3.2 Frequency of Service use:
In line with the findings of Table 6.8, Table 6.9 indicates that web browsing,
electronic mail, and file transfers are the services often sought by internet users
while VOIP is occasionally used. The findings indicate that majority of the
Internet user rarely use the video conferencing service.Table 6.9: Frequency of use of internet in seeking various services
Very often Often Occasionally Rarely Nevern % N % n % n % n %
Web browsing (N=50)
40 80.0% 8 16.0% - - 2 4.0% - -
Electronic mail (N=50)
38 76.0% 6 12.0% 6 12.0% - - - -
File transfer (N=48) 16 33.3% 28 58.3% 2 4.2% 2 4.2% - -
Voice over IP 04=42)
10 23.8% 4 9.5% 16 38.1% 8 19.0% 4 9.5%
Videoconferencing04=48)
2 4.2% 6 12.5% 8 16.7% 18 37.5% 14 29.2%
f
49
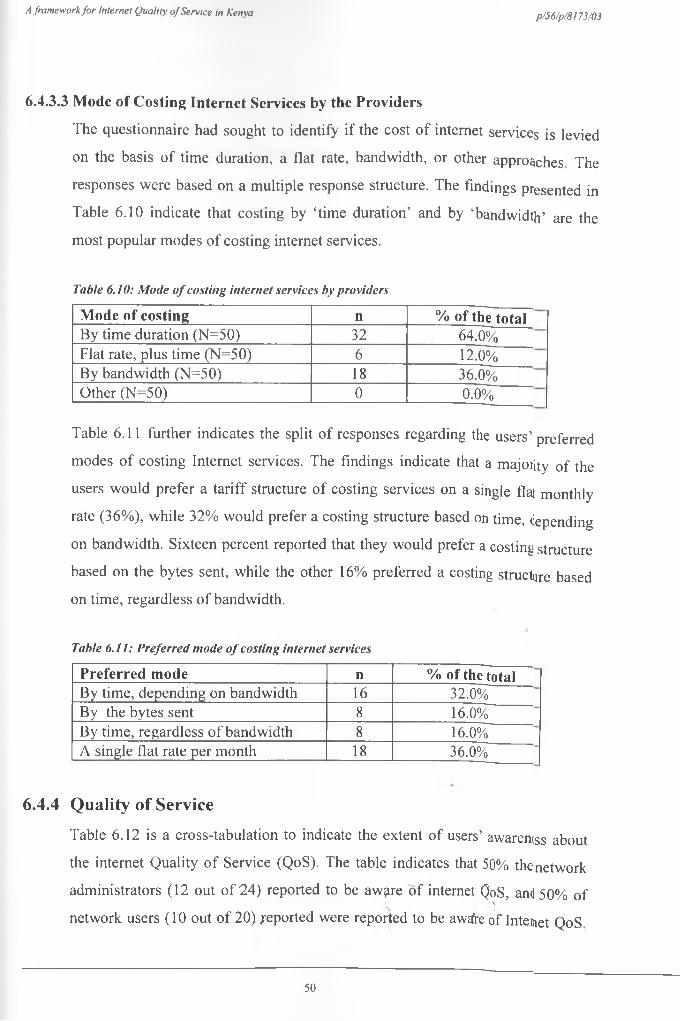
A framework fo r Internet Quality o f Service in Kenya p/56/p/8!73/03
6.4.3.3 Mode of Costing Internet Services by the Providers
The questionnaire had sought to identify if the cost of internet services is levied
on the basis of time duration, a flat rate, bandwidth, or other approaches The
responses were based on a multiple response structure. The findings presented in
Table 6.10 indicate that costing by ‘time duration’ and by ‘bandwidth’ are the
most popular modes of costing internet services.
Table 6.10: Mode of costing internet services by providers
Mode of costing n % of the totalBy time duration (N=50) 32 64.0%Flat rate, plus time (N=50) 6 12.0%By bandwidth (N=50) 18 36.0%Other (N=50) 0 0.0%
Table 6.11 further indicates the split of responses regarding the users’ preferred
modes of costing Internet services. The findings indicate that a majority of the
users would prefer a tariff structure of costing services on a single flat monthly
rate (36%), while 32% would prefer a costing structure based on time, depending
on bandwidth. Sixteen percent reported that they would prefer a costing structure
based on the bytes sent, while the other 16% preferred a costing structure based
on time, regardless of bandwidth.
Table 6.11: Preferred mode of costing internet services
Preferred mode n % of the totalBy time, depending on bandwidth 16 32.0%By the bytes sent 8 16.0%By time, regardless of bandwidth 8 16.0%A single flat rate per month 18 36.0%
6.4.4 Quality of Service
Table 6.12 is a cross-tabulation to indicate the extent of users’ awareness about
the internet Quality of Service (QoS). The table indicates that 50% the network
administrators (12 out of 24) reported to be aw^re of internet QoS, and 50% of\ * '
network users (10 out of 20) jeported were reported to be awafre of Internet QoS
50
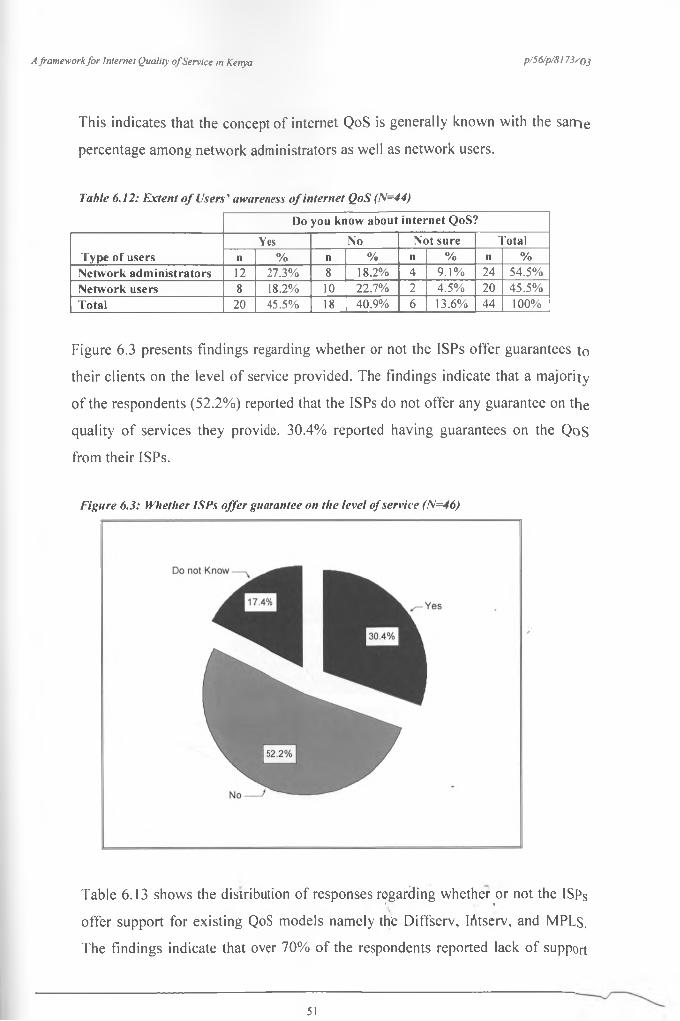
A framework fo r Interne I Quality o f Service in Kenya p/56/p/8173/() 3
This indicates that the concept of internet QoS is generally known with the sarrie
percentage among network administrators as well as network users.
Table 6.12: Extent of Users' awareness of internet QoS (N=44)
Do you know about internet QoS?
Type of usersYes No Not sure Total
n % n % n % n %Network administrators 12 27.3% 8 18.2% 4 9.1% 24 54.5%Network users 8 18.2% 10 22.7% 2 4.5% 20 45.5%Total 20 45.5% 18 40.9% 6 13.6% 44 100%
Figure 6.3 presents findings regarding whether or not the ISPs offer guarantees to
their clients on the level of service provided. The findings indicate that a majority
of the respondents (52.2%) reported that the ISPs do not offer any guarantee on the
quality of services they provide. 30.4% reported having guarantees on the QoS
from their ISPs.
Figure 6.3: Whether ISPs offer guarantee on the level of service (N=46)
Table 6.13 shows the distribution of responses regarding whether or not the ISps' i *offer support for existing QoS models namely the Diffserv, Irttserv, and MPLs.
The findings indicate that over 70% of the respondents reported lack of support
51
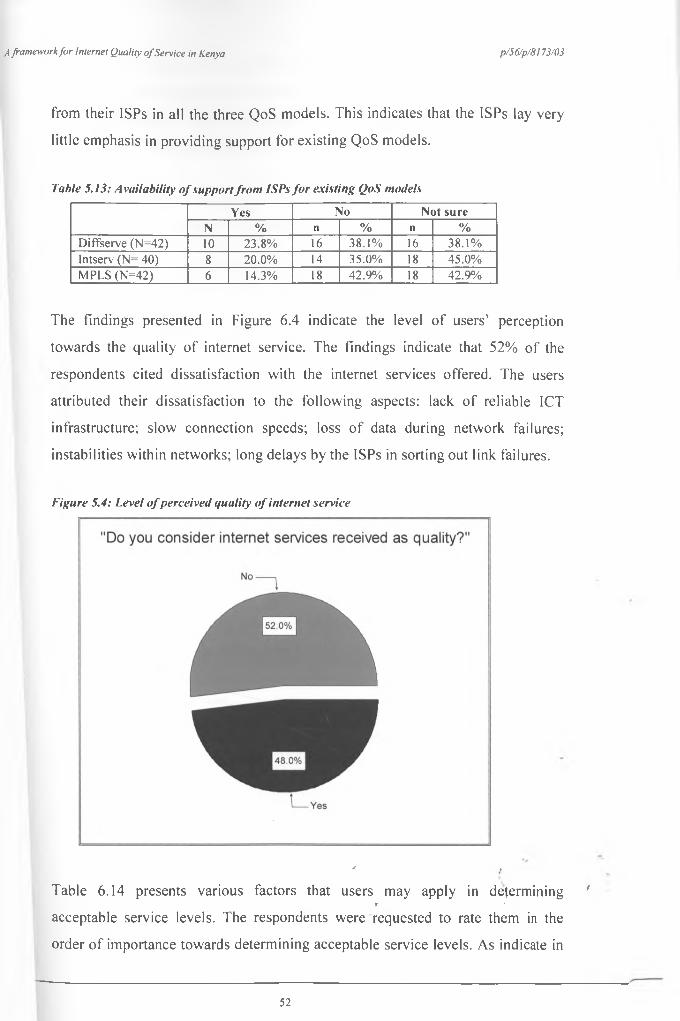
A framework fo r Internet Quality o f Service in Kenya p/56/p/8173/03
from their ISPs in all the three QoS models. This indicates that the ISPs lay very
little emphasis in providing support for existing QoS models.
Table 5.13: Availability of support from ISPs for existing QoS models
Yes No Not sureN % n % n %
Diffserve (N=42) 10 23.8% 16 38.1% 16 38.1%Intserv (N= 40) 8 20.0% 14 55.0% 18 45.0%MPLS (N=42) 6 14.3% 18 42.9% 18 42.9%
The findings presented in Figure 6.4 indicate the level of users’ perception
towards the quality of internet service. The findings indicate that 52% of the
respondents cited dissatisfaction with the internet services offered. The users
attributed their dissatisfaction to the following aspects: lack of reliable ICT
infrastructure; slow connection speeds; loss of data during network failures;
instabilities within networks; long delays by the ISPs in sorting out link failures.
Figure 5.4: Level ofperceived quality of internet service
' tTable 6.14 presents various factors that users may apply in determining '
* 'acceptable service levels. The respondents were requested to rate them in the
order of importance towards determining acceptable service levels. As indicate in
52
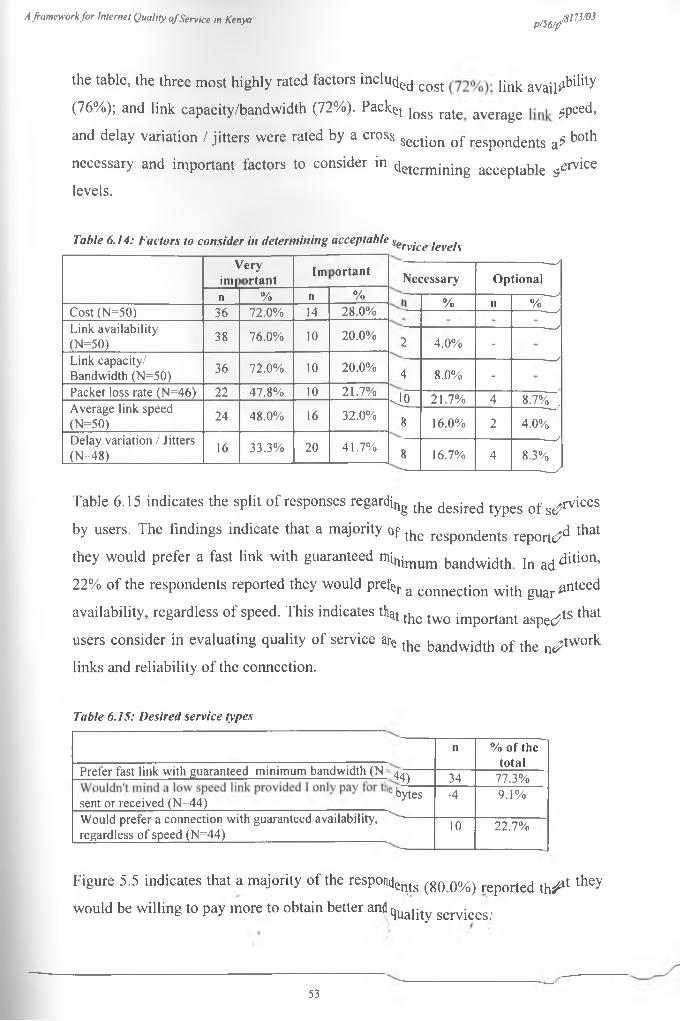
A framework fo r Interne l Quality o f Service in Kenyap W 8 , m 3
the table, the three most highly rated factors include cost link avail^bility
(76%); and link capacity/bandwidth (72%). Packet ioss rate averagC ^peed,
and delay variation / jitters were rated by a cross Section of respondents a? both
necessary and important factors to consider in determining acceptable service levels.
Table 6.14: Factors to consider in determining acceptable \eryjC(, /eVL./s
\ini |
/eryortant
Im lortant Necessary----------------- --/
Optionaln % n %
% 11-------___/
%Cost (N=50) 36 72.0% 14 28.0% ---- —— /
Link availability (N=S0)
38 76.0% 10 20.0% 2 4.0% ------------/
Link capacity/ Bandwidth (N=50) 36 72.0% 10 20.0% 4 8.0% -
------------
Packet loss rate (N=46) 22 47.8% 10 21.7% 4 ° 21.7% 4 8.7% ,Average link speed (N=50) 24 48.0% 16 32.0% 8 16.0% 2 4.0%Delay variation / Jitters (N=48) 16 33.3% 20 41.7% 8 16.7% 4
---------- s
8.3%y
Table 6.15 indicates the split of responses regard^ the desired types of s^rvices
by users. The findings indicate that a majority of the reSp0ndents report^ that
they would prefer a fast link with guaranteed ntinimum bandwidth In addition,
22% of the respondents reported they would prefer a connection with gUar*nteed
availability, regardless of speed. This indicates th^ the twQ important aspe^ts that
users consider in evaluating quality of service are the bandwidth of tbe n^twork
links and reliability of the connection.
Table 6.15: Desired service types
Prefer fast link with guaranteed minimum bandwidth (N
sent or received (N=44)Would prefer a connection with guaranteed availability, regardless o f speed (N=44)__________________________
n % of thetotal
44) 34 77.3%bytes -4 9.1%
10 22.7%
Figure 5.5 indicates that a majority of the respondepts (80 Oo/o) reported th ^ 1 they would be willing to pay more to obtain better andqUabty servjces:
53
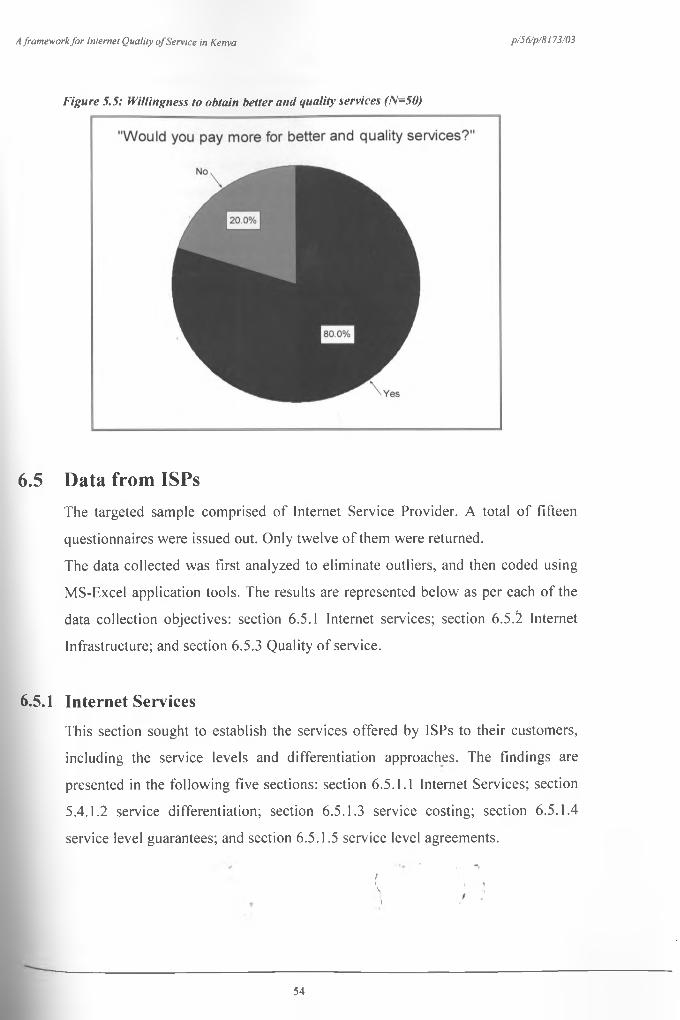
A framework fo r Internet Quality o f Service in Kenya p/56/p/8173/03
Figure 5.5: Willingness to obtain better and quality services (N=50)
6.5 Data from ISPsThe targeted sample comprised of Internet Service Provider. A total of fifteen
questionnaires were issued out. Only twelve of them were returned.
The data collected was first analyzed to eliminate outliers, and then coded using
MS-Excel application tools. The results are represented below as per each of the
data collection objectives: section 6.5.1 Internet services; section 6.5.^ Internet
Infrastructure; and section 6.5.3 Quality of service.
6.5.1 Internet ServicesThis section sought to establish the services offered by ISPs to their customers,
including the service levels and differentiation approaches. The findings are
presented in the following five sections: section 6 .5.1.1 Internet Services; section
5.4.1.2 service differentiation; section 6 .5.1.3 service costing; section 6 .5.1.4
service level guarantees; and section 6 .5.1.5 service level agreements.
t\I
54
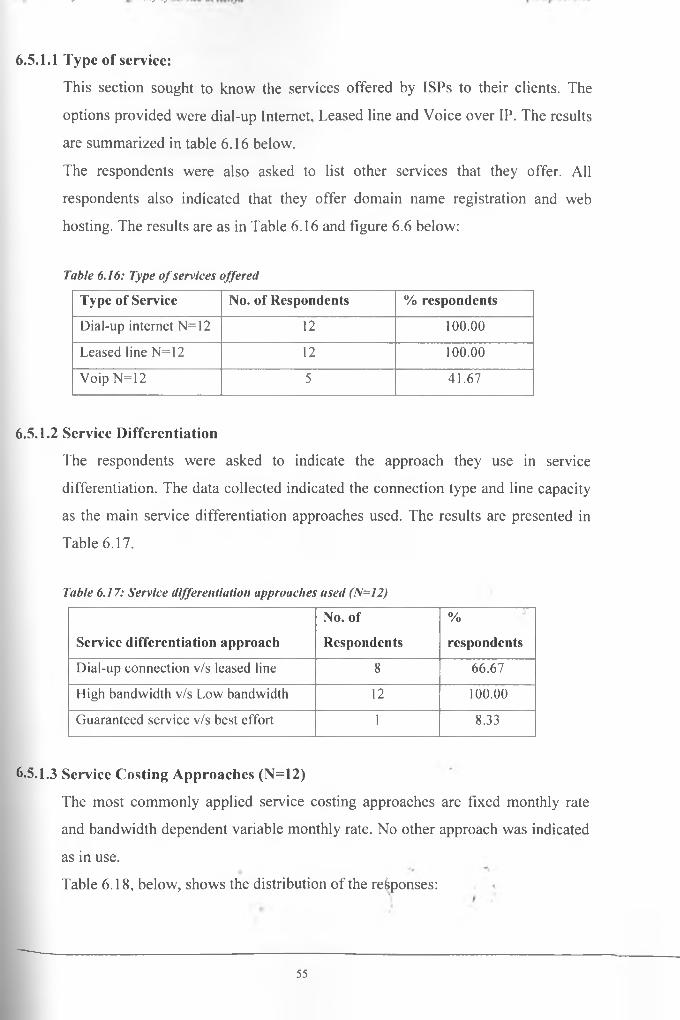
J --------- --/ *V
6.5.1.1 Type of service:
This section sought to know the services offered by ISPs to their clients. The
options provided were dial-up Internet, Leased line and Voice over IP. The results
are summarized in table 6.16 below.
The respondents were also asked to list other services that they offer. All
respondents also indicated that they offer domain name registration and web
hosting. The results are as in Table 6.16 and figure 6 . 6 below:
Table 6.16: Type of services offered
Type of Service No. of Respondents % respondentsDial-up internet N=12 12 100.00
Leased line N= 12 12 100.00
Voip N=12 5 41.67
6.5.1.2 Service Differentiation
The respondents were asked to indicate the approach they use in service
differentiation. The data collected indicated the connection type and line capacity
as the main service differentiation approaches used. The results are presented in
Table 6.17.
Table 6.17: Service differentiation approaches used (N=12)
Service differentiation approachNo. ofRespondents
%
respondentsDial-up connection v/s leased line 8 66.67
High bandwidth v/s Low bandwidth 12 100.00
Guaranteed service v/s best effort 1 8.33
6.5.1.3 Service Costing Approaches (N=12)
The most commonly applied service costing approaches are fixed monthly rate
and bandwidth dependent variable monthly rate. No other approach was indicated
as in use.
Table 6.18, below, shows the distribution of the responses:
55
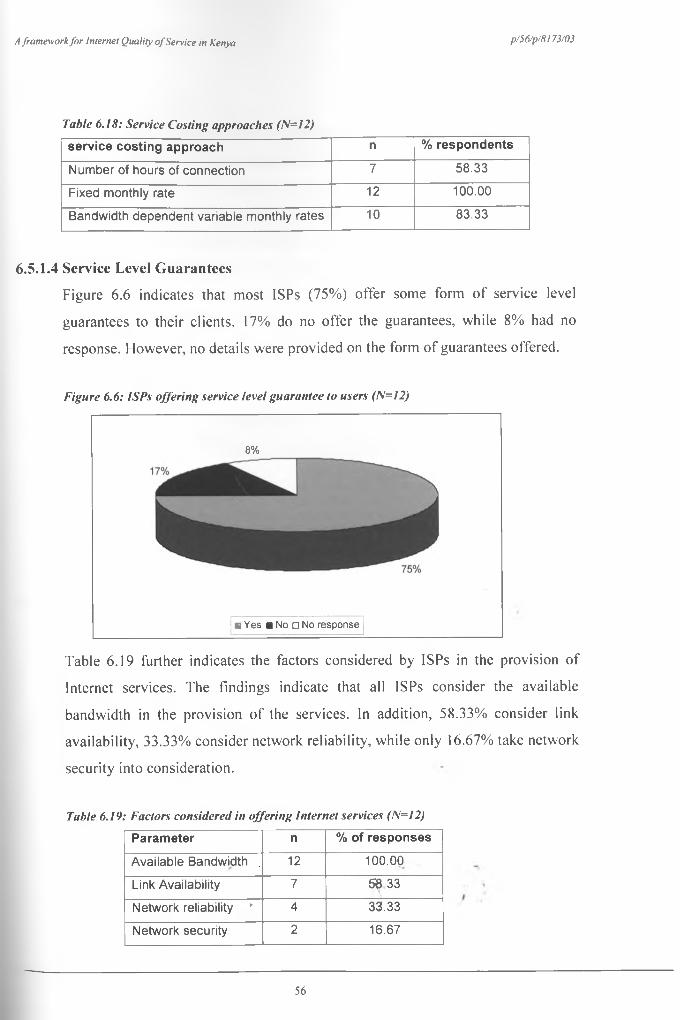
A framework fo r Internet Quality o f Service in Kenya p/56/p/8173/03
Table 6.18: Service Costing approaches (N=12)s e r v ic e c o s t in g a p p r o a c h n % re s p o n d e n ts
N u m b e r o f h o u rs o f c o n n e c tio n 7 58 .3 3
F ixed m o n th ly ra te 12 100.00
B a n d w id th d e p e n d e n t va ria b le m o n th ly ra tes 10 83 .3 3
6.5.1.4 Service Level Guarantees
Figure 6 . 6 indicates that most ISPs (75%) offer some form of service level
guarantees to their clients. 17% do no offer the guarantees, while 8 % had no
response. However, no details were provided on the form of guarantees offered.
Figure 6.6: ISPs offering service level guarantee to users (l\=12)
8%
□ Yes ■ No □ No response
Table 6.19 further indicates the factors considered by ISPs in the provision of
Internet services. The findings indicate that all ISPs consider the available
bandwidth in the provision of the services. In addition, 58.33% consider link
availability, 33.33% consider network reliability, while only 16.67% take network
security into consideration.
Table 6.19: Factors considered in offering Internet services (N=12)
P a r a m e te r n % o f r e s p o n s e s
A v a ila b le B a n d w id th 12 100 .00
L ink A v a ila b ility 7
COCO
£
N e tw o rk re lia b ility ’ 4 33 .33
N e tw o rk se cu rity 2 16 .67
56
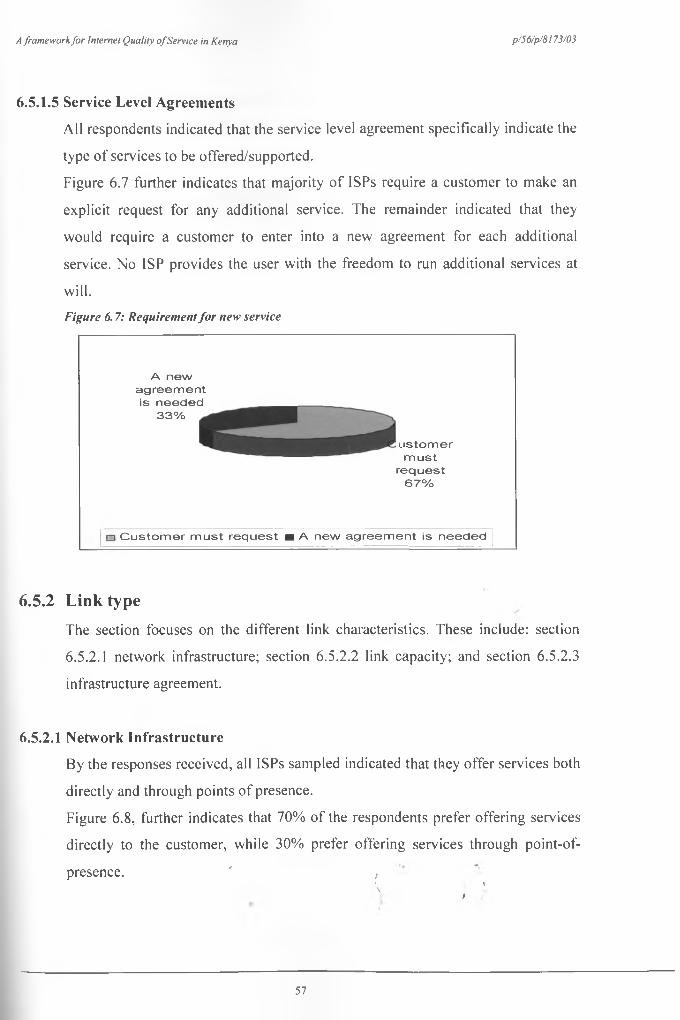
A framework fo r Internet Quality o f Service in Kenya p/S6/p/8l 73/03
6.5.1.5 Service Level Agreements
All respondents indicated that the service level agreement specifically indicate the
type of services to be offered/supported.
Figure 6.7 further indicates that majority of ISPs require a customer to make an
explicit request for any additional service. The remainder indicated that they
would require a customer to enter into a new agreement for each additional
service. No ISP provides the user with the freedom to run additional services at
will.Figure 6.7: Requirement for new service
A new agreement is needed
3 3 %
ustomermust
request6 7 %
□ Customer must request ■ A new agreement is needed
6.5.2 Link typeThe section focuses on the different link characteristics. These include: section
6.5.2.1 network infrastructure; section 6 .5.2.2 link capacity; and section 6 .5.2.3
infrastructure agreement.
6.5.2.1 Network Infrastructure
By the responses received, all ISPs sampled indicated that they offer services both
directly and through points of presence.
Figure 6 .8 , further indicates that 70% of the respondents prefer offering services
directly to the customer, while 30% prefer offering services through point-of-
presence. " ,\ \ *\ I
57
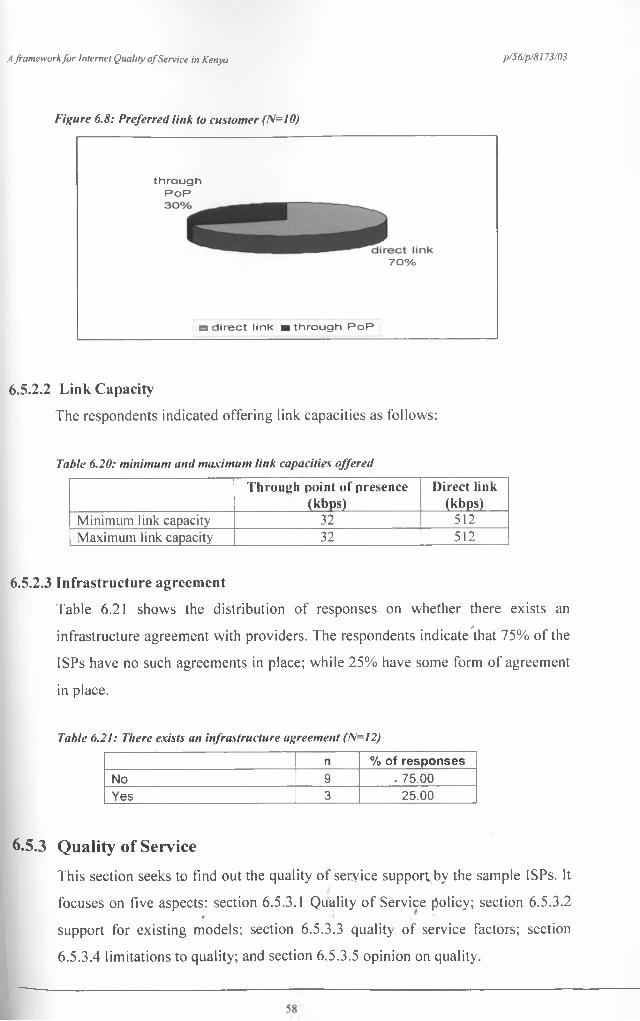
A framework fo r Internet Quality o f Service in Kenya p/56/p/8l 73/03
Figure 6.8: Preferred link to customer (1\=10)
throughPoP
7 0 %
□ direct link ■ through PoP
6.5.2.2 Link Capacity
The respondents indicated offering link capacities as follows:
Table 6.20: minimum and maximum link capacities offered
T h ro u g h p o in t o f p re se n ce
(k b p s )
D ir e c t l in k (k b p s )
Minimum link capacity 32 512Maximum link capacity 32 512
6.5.2.3 Infrastructure agreement
Table 6.21 shows the distribution of responses on whether there exists an/
infrastructure agreement with providers. The respondents indicate that 75% of the
ISPs have no such agreements in place; while 25% have some form of agreement
in place.
Table 6.21: There exists an infrastructure agreement (N=12)
n % o f r e s p o n s e s
N o 9 - 75 .0 0
Y es 3 25 .0 0
6.5.3 Quality of ServiceThis section seeks to find out the quality of service support by the sample ISPs. It
focuses on five aspects: section 6.5.3.1 Quality of Service policy; section 6 .5.3.29 t .
support for existing models; section 6 .5.3.3 quality of service factors; section
6 .5.3.4 limitations to quality; and section 6 .5.3.5 opinion on quality.
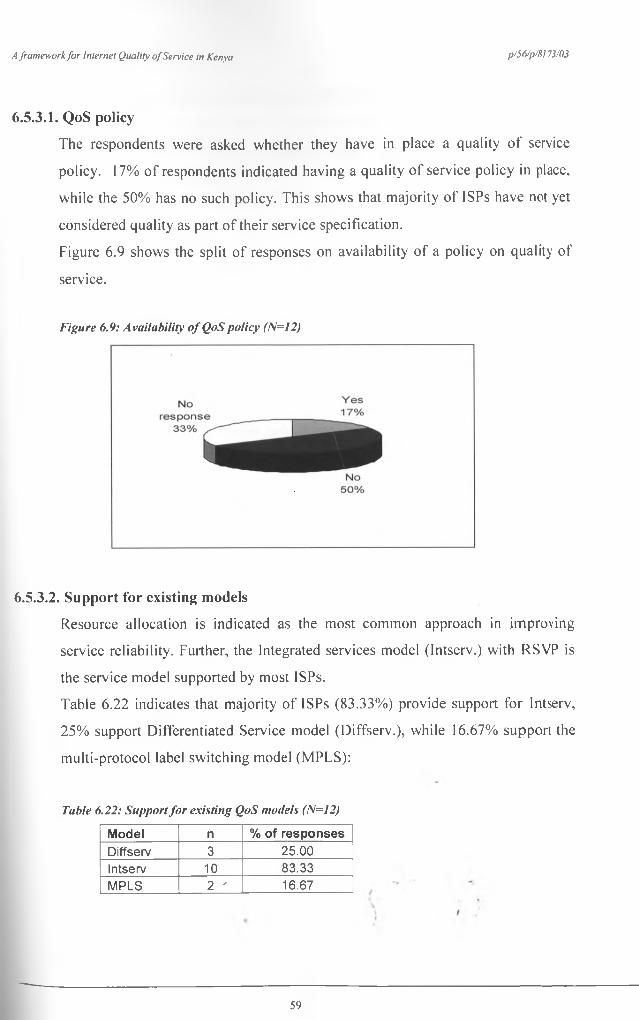
A framework fo r Internet Quality o f Service in Kenya p/56/p/8l 73/03
6.5.3.1. QoS policy
The respondents were asked whether they have in place a quality of service
policy. 17% of respondents indicated having a quality of service policy in place,
while the 50% has no such policy. This shows that majority of ISPs have not yet
considered quality as part of their service specification.
Figure 6.9 shows the split of responses on availability of a policy on quality of
service.
Figure 6.9: Availability of QoS policy (N=12)
6.5.3.2. Support for existing models
Resource allocation is indicated as the most common approach in improving
service reliability. Further, the Integrated services model (Intserv.) with RSVP is
the service model supported by most ISPs.
Table 6.22 indicates that majority of ISPs (83.33%) provide support for Intserv,
25% support Differentiated Service model (Diffserv.), while 16.67% support the
multi-protocol label switching model (MPLS):
Table 6.22: Support for existing QoS models (N=12)
M o d e l n % o f re s p o n s e s
D iffse rv 3 25 .0 0
In tse rv 10 83 .33
M P LS 2 ' 16.67
59
A framework fo r Internet Quality o f Service in Kenya p/56/p/8173/0l
6.5.3.3. QoS Factor:
The respondents further indicated bandwidth as the main factor considered in thf
implementation of QoS. 100% of the respondents would consider bandwidth
while only 16.67% (2) would consider delay variation. No other factor wa*
indicated for consideration.
6.5.3.4. Limitations to quality
The respondents were asked what they view as the limitations to the implementation
of quality Internet services in Kenya. The following are the factors, as per the
responses:
• Poor infrastructure
• Availability of bandwidth.
• Cost of available bandwidth.
• Cost of investing in quality infrastructure.
6.5.3.5. Opinion on Quality
All respondents had the following opinion on the Internet services in Kenya:
• The Internet services meet the minimum quality requirements.
• The Internet infrastructure in Kenya does not support QoS implementation.
Vt
t
60
A framework fo r Internet Quality o f Service in Kenya p/56/p/8173/03
Chapter 7: Proposed Framework7.1 Introduction
The key to the implementation of Internet Quality of Service is a QoS model. The
model defines the services, service parameters and service levels acceptable for a
quality service.
The “Kenya Internet Quality of Service (KiQoS)” model, proposed in this
study, represents a framework on which Quality of Service can be requested,
offered and judged within the Kenyan Internet market.
According to the findings in chapter 6 , the Internet users in Kenya can be grouped
into three categories on the basis on how they access the Internet services. The
first category consists of those who access the Internet services from cyber cafes.
This category forms the majority of the users (76%), as per table 6 .6 . The second
category comprises of users who have access to Internet services from their places
of work. These, according to the study, form 12% of users. The third category
comprises of users who have Internet connection to their computer at home or
private premises. This group also encompasses the fast growing number of mobile
Internet users.
The objectives of any organization, in the provision of Internet services to its
employees, are to service the mission critical applications. These applications
form the core business of the given organization and vary from one organization
to another. On the other hand, the key objective of a cyber cafe, in providing
Internet services, is to maximize on the profit of the enterprise. For an individual,
the goal may range from simple messaging and entertainment, to the access to
critical and real time data.
Quality of service gives a different meaning to each of these three categories of
users. To an organization, quality of service is judged’on the success of the
mission critical operations (processes) rather than the specific requirement of each
individual employee. QoS in business organizations, research institutions,
academic institutions and multinationals is thus an aggregation of the performance
factors, driven by the mission of the organization.
61
A framework fo r Internet Quality o f Service in Kenya p/56/p/8173/03
This category of users is characterized by high data rate connectivity, which is
reviewed regularly to provide more capacity and better performance. The
institutions have the budgetary capacity to overprovision for their Internet needs.
Cyber cafes in Kenya are typically linked via radio links with capacities of
between 128Kbps and 256Kbps. To a cyber cafe entrepreneur, quality of service
is a tight balance between customer satisfaction and profitability. The quality of
service for applications is a secondary factor, which is driven by the customer’s
need for a service, rather than a business strategy. The ability to add capacity is
limited, and thus over provisioning is not an option.
Users with connectivity to their personal computers, laptops, mobile phones, etc,
provide a different view of quality of service. To this group the services they
enjoy are essentially enough for the basic Internet access. The need to implement
other quality of service measures is then driven by the applications that the user
may need to access.
According to figure 6.2, the average link speed in Kenya was found to be
87.6Kbps on the minimum and 272.9Kbps on the maximum.
The proposed framework provides a way in which these three categories of users
can implement Internet Quality of Service using the existing infrastructure. It
provides a means by which users who wish to subscribe to QoS can make an
informed choice, and also for service providers to determine what QoS
capabilities they can offer.
According to tables 6.1 and 6.3, the Internet traffic can be either categorized as
data, voice or video. These categories are taken into consideration in the proposed
framework.
The following observations have also been made, and have been considered in the
framework.
• Cost is a key aspect in the provision of Internet services in Kenya. It has
served as the key indicator of service differentiation. For example; a
dedicated line service client pays more than a dial-up service client, though
there is no guarantee pf services all the time. This study establishes that>
Internet users are willing to pay for quality service provided the service level» •
is specified and guaranteed.
62
A framework fo r Internet Quality o f S e ^ en^a p/56/p/8173/03
• By definition 0°^ *s judged on the basis of user satisfaction with the service.
This implies user *s ina arbiter ° f 'good' or 'bad' QoS. Differentapplications Ji^and different service qualities. The proposed framework
presents the dferent °Pdons for implementing QoS for data, voice and video
applications.• QoS only wo s on uPstream/outbound data (data going from you to your
ISP) True Qo>ls ^ us onIy possible if it’s offered by the Service provider,
and understood ky the service user. The service level agreement need to be
specific on thdyPe service, parameters to measure, parameter levels and
the guaranteeddeve s-• Though Q o S ^ d ^ 6 applications, such as VoIP and Video Conferencing,
are growing iiuse *n the Kenyan Internet market, table 6.9 indicates that
these servicesare accessed on a once-off (rarely) bases. This study
established th1 the most commonly used Internet Services in Kenya,
(including we^rows*n8 ’ electronic mail and file transfer), are quite tolerant
to the perfoi# 1 0 6 the best-effort service. In addition, the users are
generally pati^ enough to wait or try another time. This provides little
incentive to thisuhscription to “full time” quality of service.
• In section 6 ^ ’ this study established that majority of Internet users
(including net'(()rh administrators) have little or no knowledge of Quality of
Service requif^ 1 1 * 8 and parameters. Similarly, the Internet users are not
conversant wil^he QoS features supported by their service providers. This
makes it diffi^ to implement the legacy (Diffserv or Intserv) models of
service on the f5nyan Internet market.In the following s tion, KiQoS model services, and their implementation, are
specified based t* the Intserv over Diffserv service model, as the above
observations.
/\
63
A framework fo r Internet Quality o f Service in Kenya* ^ S 5 6 /p /8 1 ^ °
7.2 Model implementation ComponentsThe provision of end-to-end quality of service is driven by specific obj^
are intended for the network services that are offered. In this frame
broad QOS objectives are:
• To provide an easier and convenient way of specifying QoS reqq
• To provide a way of QoS translation and implementation.
^tives t
V ork, V *
^ement^'
• To provide a QoS specification that is independent of the phy N ^y ical l i ^
type.
To implement QoS on the existing network infrastructure.
To satisfy QoS expectations from the user/application point of vi0
V
Based on the Intserv over Diffserv Service implementation model,
shall have ten ( 1 0 ) major components, placed in three categories:
1. Service specification components
2. Service implementation components
3. Service evaluation components
KIQ<T
Service Specification Components
(i) Application type - different applications have differing QoS req^
This identifies the type of applications that each KIQoS service type/
Three application types are specified: data, voice and video.
(ii) Infrastructure - the ability to support the QoS requirements
em ent^ '
Sl*pport^'
Qf a n /application is dependent on the link capacity of the connection bein&^Sed, a ^
well as the availability of the necessary bandwidth for comiqq
Though some applications are tolerant to delay, the KIQoS model (j
the minimum requirements on link capacity that will be.necessary t0
'Cation
6scribe^
sustainable QoS for each KIQoS type of Service.
(iii)User environment - access to Internet services can occur within a ^
^chieve^
or shared user environment. For example, if an organization wishes t0
video conferencing services to its employees, it is'essential to' deter^
icated
rovide
lc how
A framework fo r Internet Quality o f Service in Kenya p/56/p/S 173/03
many sessions can take place concurrently. This also has an impact on the
infrastructure requirements.
Service Implementation Components
(iv) Intserv Component - this provides a specification on the Intserv/RSVP
configurations recommended for each service. It also provides the reservation
limits as well as the typical bandwidth split for the services.
(v) Diffserv Component - this gives the required DSCP mappings for each of the
services offered.
(vi) Parameters - this specifies the parameters to be considered as weU as
targets for the parameters.
(vii) Special hardware or software - some services require the use ot special
hardware or software. Codecs are needed for both voice and video services.
Network accelerator/optimizing software may also be used.
Service Evaluation Components
(viii) User satisfaction - this takes into account the user’s perception ot the
service provided, as compared to the service that was requested. It serves as a
basis for evaluating the success of the QoS implementations.
(ix) Infrastructure - changes in infrastructure may affect the service offered, lo
implement new applications, or improve existing services, it is necessary to
review the capacity provided by the infrastructure.
The interaction between the model components is described in figure 7-3.
7.3 The KiQoS ServicesTo achieve the specified service objectives, three Service classes afe proposed,
each with specific QoS objectives. Namely:
1. Typel QoS (KiQoS Basic) -for data only services.
2. Type2 QoS (KiQoS Premium) - for networks that carry voice traffic over
the data network.3. Type3 QoS (KiQoS Assured) - for data networks requiring support tor
voice and video traffic. \ , •
65
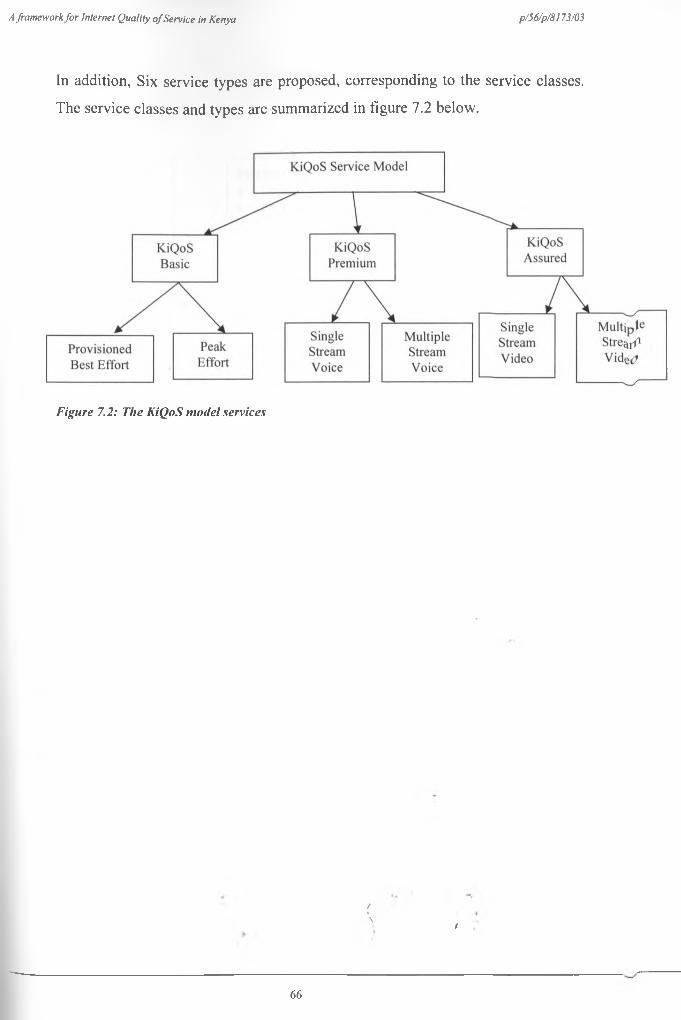
A framework fo r Internet Quality o f Service in Kenya p/56/p/8173/03
In addition, Six service types are proposed, corresponding to the service classes.
The service classes and types are summarized in figure 7.2 below.
Figure 7.2: The KiQoS model services
f\ t
66
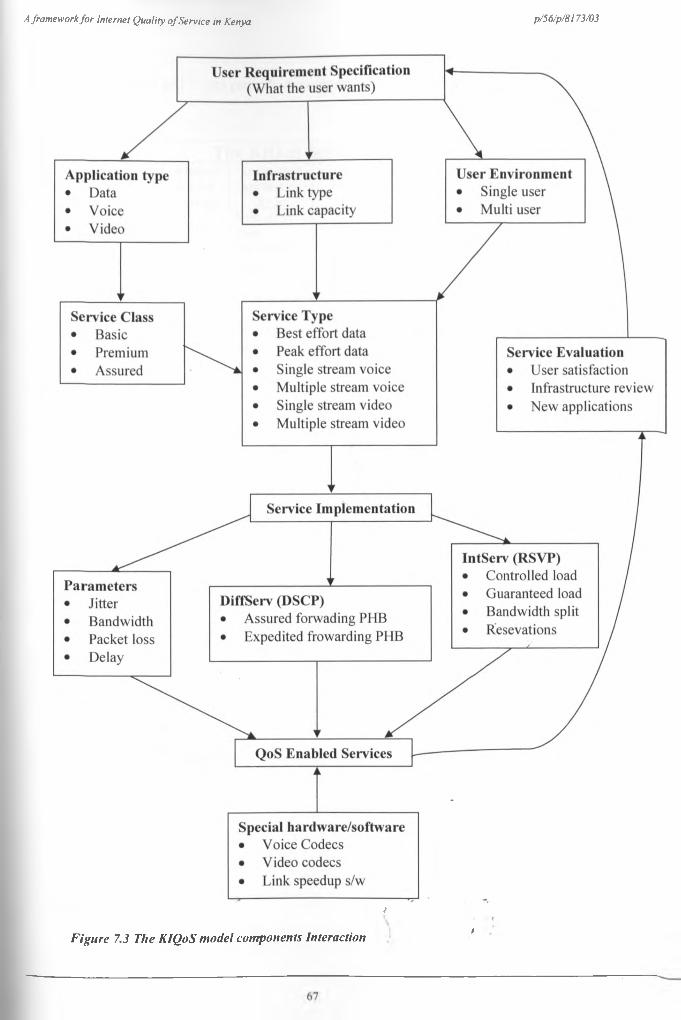
A framework fo r Internet Quality o f Service in Kenya p/56/p/8173/03
/
Figure 7.3 The KIQoS model components Interaction t
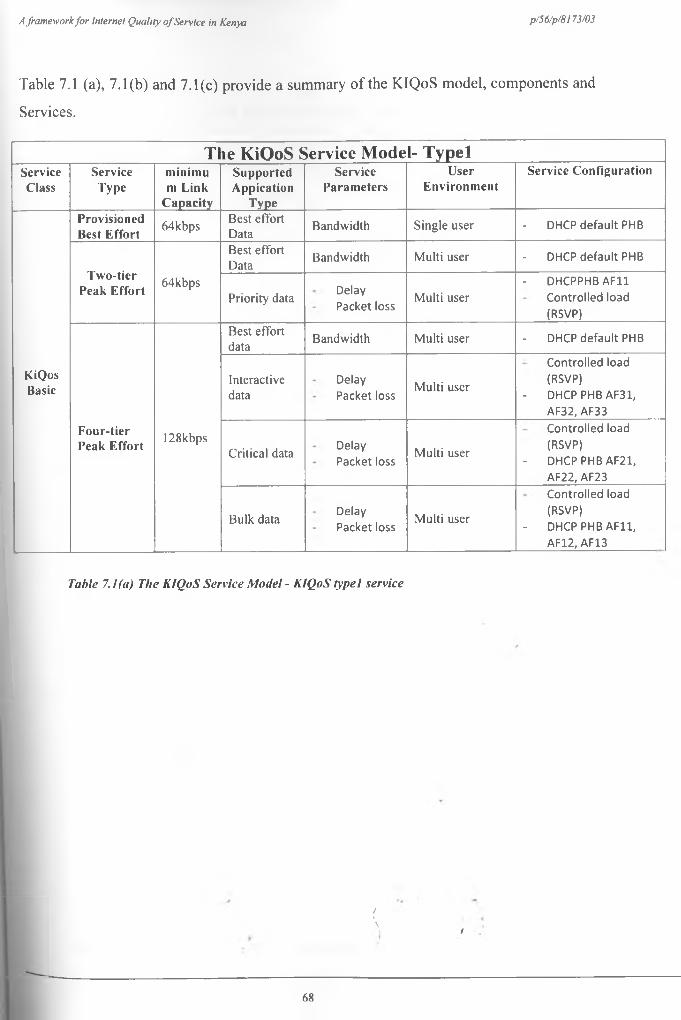
A framework fo r InterneI Quality o f Service in Kenya p/56/p/8173/03
Table 7.1 (a), 7.1(b) and 7.1(c) provide a summary of the KIQoS model, components and
Services.
T lie KiQoS Service Model- TypelServiceClass
S erv iceT yp e
m in im u m L in k
C a p a c ity
S u p p o rte dA p p ic a tio n
T yp e
S erv iceP a ram e te rs
U serE n v iro n m e n t
S erv ice C o n fig u ra tio n
K iQ osBasic
P ro v is io n e d Best E f fo r t
64kbps Best effort Data
Bandwidth Single user - DHCP default PHB
T w o - t ie r Peak E ffo r t
64kbps
Best effort Data
Bandwidth Multi user - DHCP default PHB
Priority dataDelayPacket loss
Multi user- DHCPPHB AF11
Controlled load (RSVP)
F o u r - t ie r Peak E ffo r t
128kbps
Best effort data
Bandwidth Multi user - DHCP default PHB
Interactivedata
DelayPacket loss
Multi user
Controlled load (RSVP)
- DHCP PHB AF31, AF32, AF33
Critical dataDelayPacket loss
Multi user
Controlled load (RSVP)
- DHCP PHB AF21, AF22, AF23
Bulk dataDelayPacket loss
Multi user
Controlled load (RSVP)
- DHCP PHB AF11, AF12, AF13
Table 7.1(a) The K/QoS Service Model - KIQoS typel service
/\ t
68
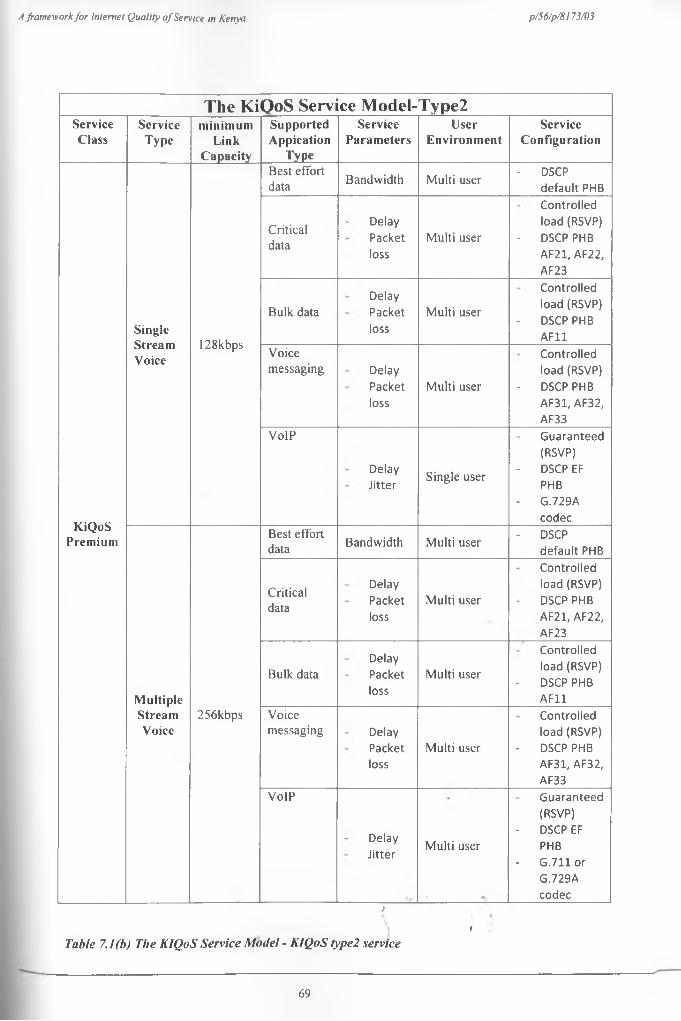
A framework fo r Internet Quality o f Service in Kenya p/56/p/8173/03
The KiQoS Service Model-Type2S erv iceC lass
S erv iceT yp e
m in im u mL in k
C a p a c ity
S u p p o rte dA p p ic a tio n
T yp e
S erv iceP a ram e te rs
U serE n v iro n m e n t
Serv iceC o n fig u ra tio n
K iQ o SP re m iu m
S ing leS tre a mV o ice
128kbps
Best effort data Bandwidth Multi user
- DSCPd e fa u lt PHB
Criticaldata
DelayPacketloss
Multi user
C ontro lled load (RSVP)
- DSCP PHB AF21, AF22,
AF23
Bulk dataDelayPacket
loss
Multi user
C ontro lled load (RSVP)
- DSCP PHB AF11
Voicemessaging Delay
Packet
loss
Multi user
C ontro lled load (RSVP)
- DSCP PHB AF31, AF32, AF33
VoIP
DelayJ itte r
Single user
G uaranteed(RSVP)
- DSCP EF PHB
- G.729A codec
M u lt ip leS treamV o ice
256kbps
Best effort data Bandwidth Multi user - DSCP
d e fa u lt PHB
Criticaldata
DelayPacketloss
Multi user
C ontro lled load (RSVP) DSCP PHB AF21, AF22, AF23
Bulk dataDelayPacketloss
Multi user
C ontro lled load (RSVP)
- DSCP PHB AF11
Voicemessaging Delay
Packetloss
Multi user
C ontro lled load (RSVP)
- DSCP PHB AF31, AF32, AF33
VoIP
DelayJ itte r
Multi user
G uaranteed(RSVP)
- DSCP EF PHB
- G.711 o r G.729A codec
/t
Table 7.1(b) The KIQoS Service Model - KlQoS type2 service
69
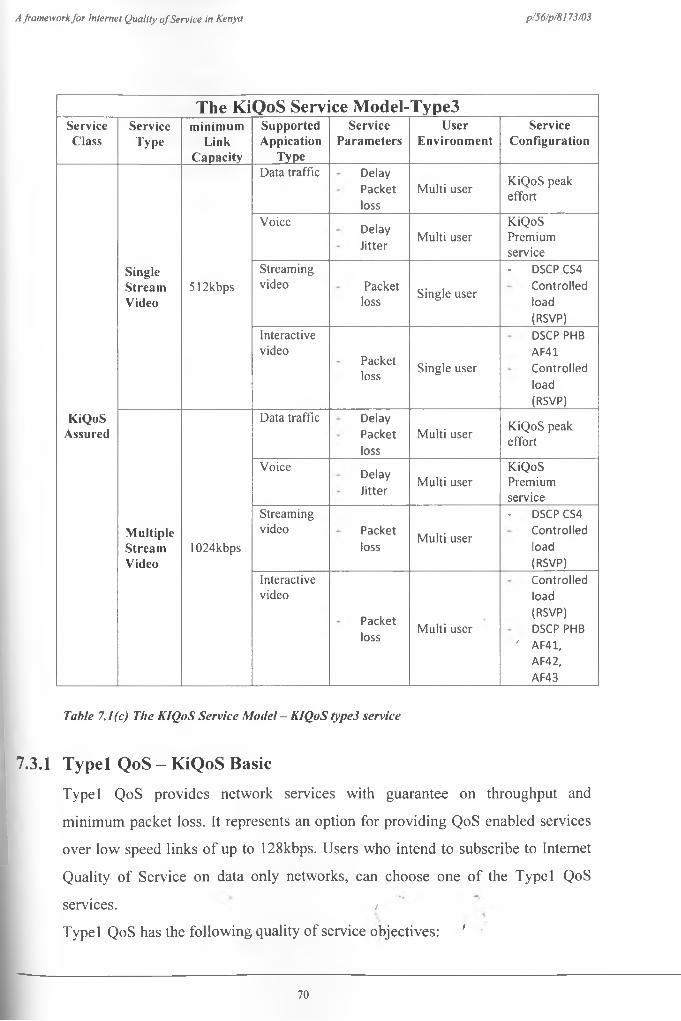
A framework fo r Internet Quality o f Service in Kenya p/56/p/8!73/03
The KiQoS Service ModeI-Type3S erv ice
C lassS erv ice
T yp em in im u m
L in kC a p a c ity
S u p p o rte dA p p ic a t io n
T yp e
S erv iceP a ram e te rs
U serE n v iro n m e n t
S erv iceC o n fig u ra tio n
K iQ o SA ssured
S ing leS tre a mV id e o
512kbps
Data traffic Delay
Packetloss
Multi user KiQoS peak effort
VoiceDelayJ itte r
Multi userKiQoSPremiumservice
Streamingvideo Packet
lossSingle user
- DSCP CS4
C ontro lled load (RSVP)
Interactivevideo
Packetloss
Single user
DSCP PHB AF41C ontro lled
load(RSVP)
M u lt ip leS tre a mV id e o
1024kbps
Data traffic DelayPacketloss
Multi user KiQoS peak effort
VoiceDelayJ itte r
Multi userKiQoSPremiumservice
Streamingvideo Packet
lossMulti user
- DSCP CS4 C ontro lled load (RSVP)
Interactivevideo
Packetloss
Multi user
C ontro lled load (RSVP)
DSCP PHB ' AF41,
AF42,
AF43
Table 7.1(c) The KIQoS Service Model - KlQoS type3 service
7.3.1 Typel QoS - KiQoS Basic
Typel QoS provides network services with guarantee on throughput and
minimum packet loss. It represents an option for providing QoS enabled services
over low speed links of up to 128kbps. Users who intend to subscribe to Internet
Quality of Service on data only networks, can choose one of the Typel QoS
services. >
Typel QoS has the following quality of service objectives: '
70
A framework fo r Internet Quality o f Service in Kenya p/56/p/8173/03
• Packet loss rates < 1 0 6
• One-way delay < 2s for interactive traffic, < 60s for bulk traffic and < 4s
for other traffic.
a. Provisioned Best Effort Service
One way of providing Network QoS is to provide extra capacity, such that the
possibility of loss, delay and congestion is considerably reduced. The provisioned
best effort service is just best effort service offered over a link with extra capacity.
Users can achieve this level of service by subscribing to more bandwidth than
they intend to use.
b. The Peak effort service
This is a data only service, meant for applications that can perform under best
effort service, but where users require guarantee on delay and loss parameters. It
provides for preferential treatment of some of the data traffic that is mission
critical to the individual or organization.
The peak effort service can be implemented as two-tier on a 64kbps link, or as
four-tier on a 128kbps link, with the specifications recommended in section 7.4.
7.3.2 Type2 QoS - KiQoS Premium
The KiQoS Premium Service is a high throughput service meant for networks that
support voice transmission on the data network. Voice traffic is sensitive to delay
and jitter and thus Type2 QoS provide guarantees based on these two. It also
provides guarantee on minimum packet loss rate.
The service is based on the Intserv’s guaranteed service and DifServ’s premium
service. This ensures that packets are not dropped due to network congestion.
The Type2 QoS has the following quality of service objectives:
• One way delay < 150ms
• Packet loss rate (PRL) < 1%
• Delay variation (one-way jitter) < 30ms
/» i *
71
A framework fo r Internet Quality o f Service in Kenya p/56/p/8173/03
The service can be implemented on links with a capacity of atleast 128kbps with
either a single voice stream or multiple voice streams supported. The
implementation specifications are given in sections 7.4.3 and 7.4.4 below.
7.3.3 Type3 QoS - KiQoS Assured
The KiQoS Assured Service - This is a high data rate and low loss service meant
for networks that support video applications. It is based on the Diffserv’s Assured
service and Intserv’s Controlled load service, thus it is suitable for applications
that are sensitive to loss, but not sensitive to delay. It provides no guarantees on
delay.
The Type3 QoS has the following quality of service objectives:
• One way delay < 150ms for video Conferencing and <5s for streaming
video
• Packet loss rate (PRL) < 1 %
• Delay variation (one-way jitter) < 30ms
The service may be implemented on a link of 512kbps or higher, with the
specifications recommended in section 7.4.5 below.
7.4 KiQoS Service Implementation7.4.1 Implementing Two-tier Peak Effort
The recommended minimum link capacity for this service is 64kbps.
Under this service, the data traffic is classified into two classes:
• Priority data
• Best effort data
The Intserv router implements RSVP with maximum reserved bandwidth as
48kbps, and maximum bandwidth per reservation as 24kbps. Intserv’s controlled
load service is used to map the priority data, while the rest of the data is treated as
best effort. A maximum of two reservations can be supported on the link at any
given time, while 25% of the link capacity (16kbps) remains unmapped at any
given time. This ensures non-starvation for best effort data.
72
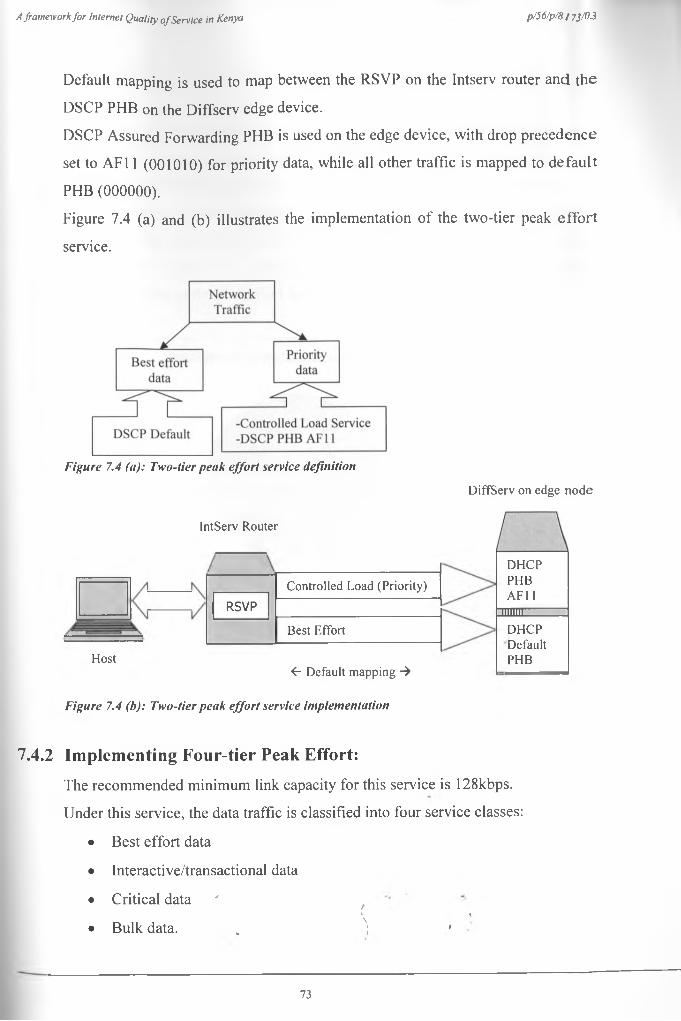
A framework fo r Internet Quality o f Service in Kenya p/56/p/8j 73/03
Default mapping is used to map between the RSVP on the Intserv router and the
DSCP PHB on the Diffserv edge device.
DSCP Assured Forwarding PHB is used on the edge device, with drop precedence
set to AF11 (001010) for priority data, while all other traffic is mapped to default
PHB (000000).
Figure 7.4 (a) and (b) illustrates the implementation of the two-tier peak effort
service.
Figure 7.4 (a): Two-tier peak effort service definition
DiffServ on edge node
IntServ Router
Controlled Load (Priority)
RSVP
Best Effort
Host<- Default mapping ->
Figure 7.4 (b): Two-tier peak effort service implementation
DHCP PHB AF11
ilium DHCP Default PHB
7.4,2 Implementing Four-tier Peak Effort:
The recommended minimum link capacity for this service is 128kbps.
Under this service, the data traffic is classified into four service classes:
• Best effort data
• Interactive/transactional data
• Critical data ' t\ ' '
• Bulk data. . | '
73
/\
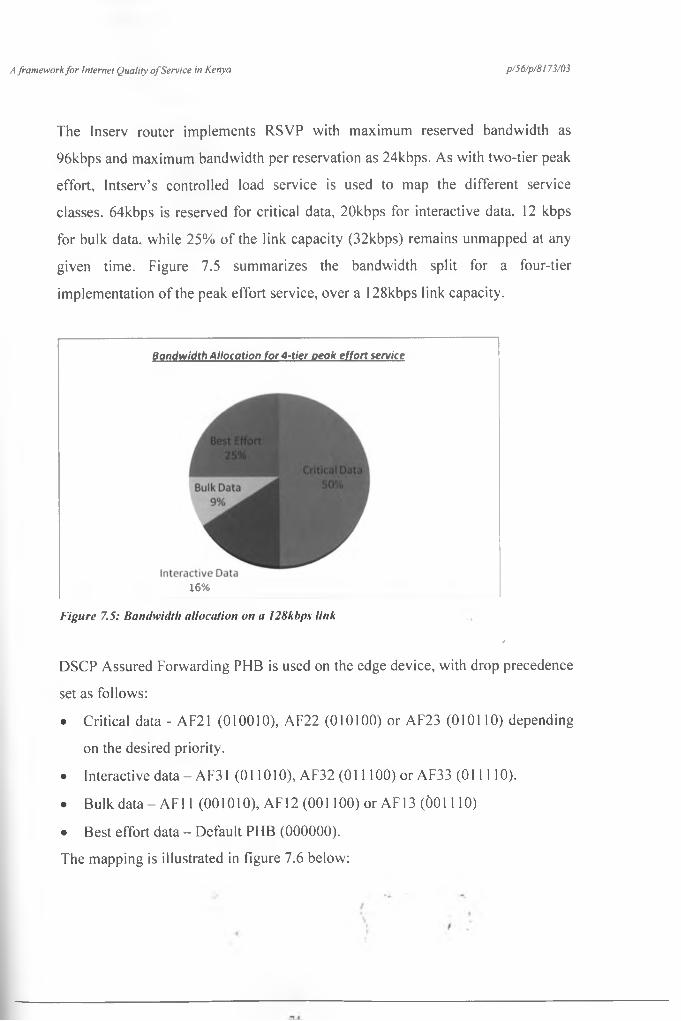
A framework fo r Internet Quality o f Service in Kenya p/56/p/8173/03
The Inserv router implements RSVP with maximum reserved bandwidth as
96kbps and maximum bandwidth per reservation as 24kbps. As with two-tier peak
effort, Intserv’s controlled load service is used to map the different service
classes. 64kbps is reserved for critical data, 20kbps for interactive data, 12 kbps
for bulk data, while 25% of the link capacity (32kbps) remains unmapped at any
given time. Figure 7.5 summarizes the bandwidth split for a four-tier
implementation of the peak effort service, over a 128kbps link capacity.
Bandwidth Allocation for 4-tier peak effort service
16%
F ig u r e 7 .5 : B a n d w id th a l lo c a t io n o n a 1 2 8 k b p s l i n k
/
DSCP Assured Forwarding PHB is used on the edge device, with drop precedence
set as follows:
• Critical data - AF21 (010010), AF22 (010100) or AF23 (010110) depending
on the desired priority.
• Interactive data - AF31 (011010), AF32 (011100) or AF33 (011110).
• Bulk data - AF11 (001010), AF12 (001100) or AF13 (001110)
• Best effort data - Default PHB (000000).
The mapping is illustrated in figure 7.6 below:

A framework fo r Internet Quality o f Service in Kenya p/56/p/8!73/03
IntServ Router DiffServ on edge node
Host
Ay
RSVP
Controlled Load (Bulk)
Controlled Load (Critical)
Controlled Load (Interactive)
Best Effort
Default mapping ->
AF11, AF12, AF13
AF21, AF22, AF23
II 111.1. LLAF31, AF32, AF33
DHCP Default PHB
F ig u r e 7 .6 : F o u r - t ie r p e a k e f f o r t s e rv ic e im p le m e n ta t io n
7.4.3 Implementing Single stream Voice Service
The minimum link capacity recommended for this service is 128kbps.
The service supports a single voice session at a time, over the data network. The
data on the network may be implemented as just best effort, or with peak effort
service. The voice data is separated into Voice over IP (interactive real time) and
voice messaging (non real time). Figure 6.7 shows the proposed traffic
categorization under this service.
F ig u r e 7.7: T r a f f i c C a te g o r iz a t io n u n d e r th e p r e m iu m s e rv ic e
75

A framework fo r Interne I Quality o f Service in Kenya p/S6/p/8173/03
The Intserv router implements RSVP with maximum reserved bandwidth as
96kbps, and maximum bandwidth per reservation as 32kbps. The voice traffic is
mapped to Intserv’s guaranteed service at the router, while controlled load is used
for critical data traffic. Other traffic is mapped to best-effort. 64kbps is reserved
for Voice traffic, 32kbps for data traffic, while 25% of the link capacity (32kbps)
remains unmapped at any given time to be used by best effort traffic. This is
F ig u r e 7 .8 : R e c o m m e n d e d b a n d w id th s p l i t f o r s in g le s t re a m v o ic e
At the Diffserv edge node, DSCP expedited forwarding PHB EF( 101110) is used
for VoIP traffic, while AF31 is used for voice control data. Voice messaging
traffic can then be assigned to AF32 and AF33. The critical data is mapped to
DHCP AF21, AF22 and AF23 depending on the drop precedence required, while
AF11 is used for bulk data. See figure 7.9 below.
The use of a low-bit-rate, frame based voice codec, such as G.729A, is
recommended. This ensures a maximum reserved bandwidth of 32kbps per VoIP
session, allowing more bandwidth for control and messaging voice traffic.
i\ i
16
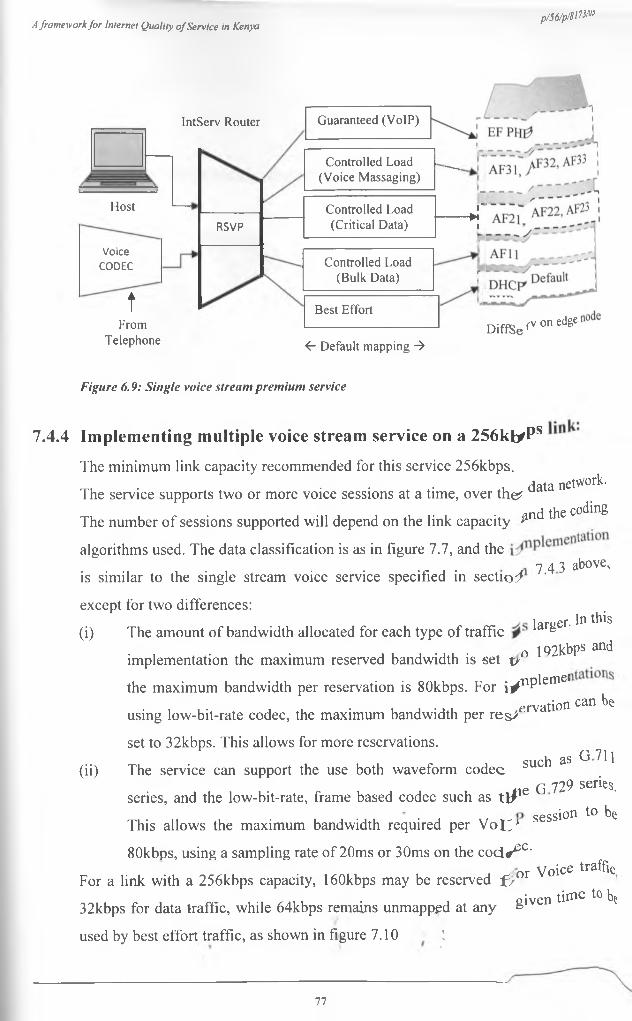
A framework fo r Internet Quality o f Service in Kenyap /S 6 /p /& W m
IntServ Router Guaranteed (VoIP)
Host
VoiceCODEC
t
Controlled Load (Voice Massaging)
---
Controlled Load (Critical Data)
FRSVP
--►iif'
Controlled Load(Bulk Data)
P1
Best EffortFrom
TelePhone <- Default mapping ->
F ig u r e 6 .9 : S in g le v o ic e s t r e a m p r e m iu m s e rv ic e
DiffSe °n edgC
7.4.4 Implementing multiple voice stream service on a 256klyPs
The minimum link capacity recommended for this service 256kbps.
The service supports two or more voice sessions at a time, over the? data netvvork.
• * • And the codingThe number of sessions supported will depend on the link capacity ^
algorithms used. The data classification is as in figure 7.7, and the7 4 3 above,
is similar to the single stream voice service specified in section '
except for two differences:In this
(i) The amount of bandwidth allocated for each type of traffic *ar£cr'o 1 92kbps andimplementation the maximum reserved bandwidth is set t/
the maximum bandwidth per reservation is 80kbps. For j^nplemeiervation can be
using low-bit-rate codec, the maximum bandwidth per res>
set to 32kbps. This allows for more reservations.r G 71 \
(ii) The service can support the use both waveform codec suc^ aSC 729 series.
series, and the low-bit-rate, frame based codec such as \\P esession to be
This allows the maximum bandwidth required per Vo]f ‘
80kbps, using a sampling rate of 20ms or 30ms on the cod*^c'or Voice traffic
For a link with a 256kbps capacity, 160kbps may be reserved £ /aiven time to be
32kbps for data traffic, while 64kbps remains unmapped at any »
used by best effort traffic, as shown in figure 7.10 1
77
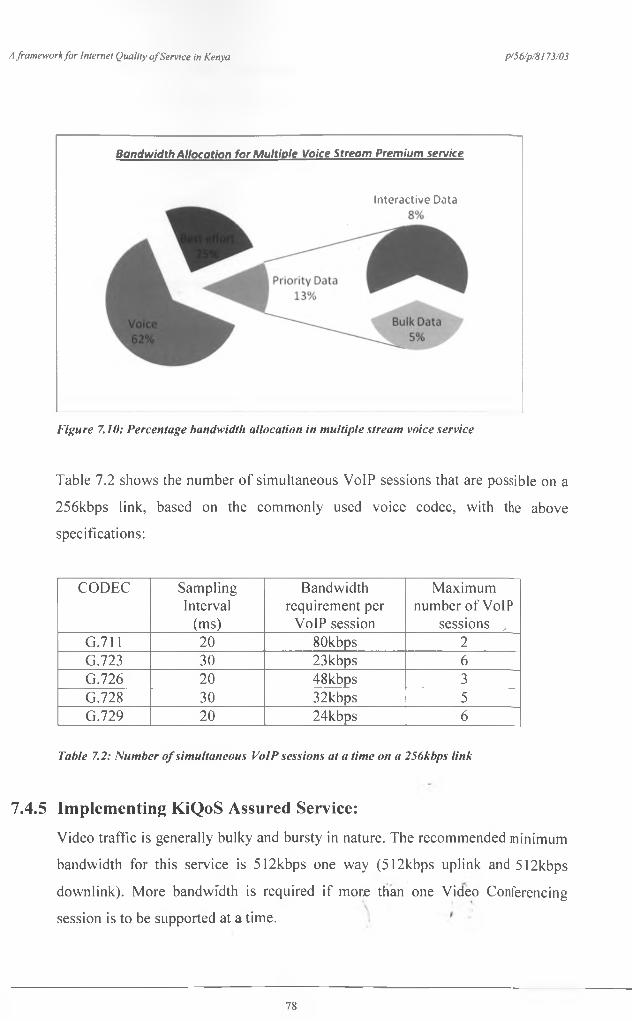
A framework fo r Internet Quality o f Service in Kenya p/56/p/8173/03
Bandwidth Allocation for Multiple Voice Stream Premium service
In teractive Data
F ig u r e 7 .1 0 : P e rc e n ta g e b a n d w id th a l lo c a t io n in m u l t ip le s tre a m v o ic e s e rv ic e
Table 7.2 shows the number of simultaneous VoIP sessions that are possible on a
256kbps link, based on the commonly used voice codec, with the above
specifications:
CODEC SamplingInterval
(ms)
Bandwidth requirement per
VoIP session
Maximum number of VoIP
sessions „•G.711 2 0 80kbps 2
G.723 30 23kbps 6
G.726 2 0 48kbps 3G.728 30 32kbps 5G.729 2 0 24kbps 6
T a b le 7 .2 : N u m b e r o f s im u lta n e o u s V o IP se ss io n s a t a t im e o n a 2 5 6 k b p s l i n k
7.4.5 Implementing KiQoS Assured Service:
Video traffic is generally bulky and bursty in nature. The recommended minimum
bandwidth for this service is 512kbps one way (512kbps uplink and 512kbps
downlink). More bandwidth is required if more than one Video Conferencing
session is to be supported at a time.
78
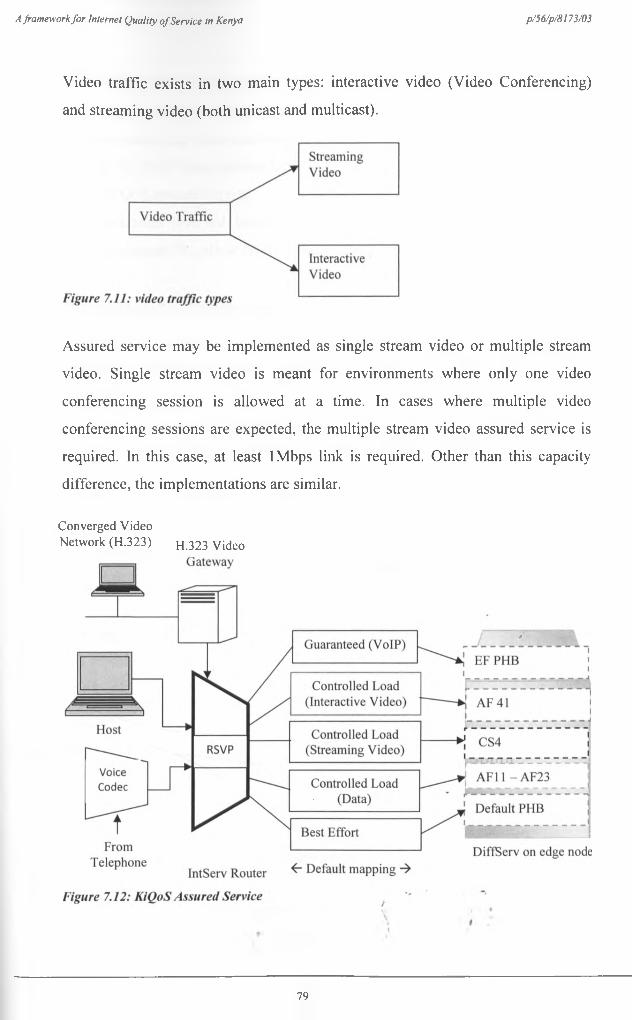
A framework fo r Internet Quality o f Service in Kenya p/56/p/8173/03
Video traffic exists in two main types: interactive video (Video Conferencing)
and streaming video (both unicast and multicast).
Assured service may be implemented as single stream video or multiple stream
video. Single stream video is meant for environments where only one video
conferencing session is allowed at a time. In cases where multiple video
conferencing sessions are expected, the multiple stream video assured service is
required. In this case, at least 1Mbps link is required. Other than this capacity
difference, the implementations are similar.
Converged VideoNetwork (H.323) h .323 Video
79
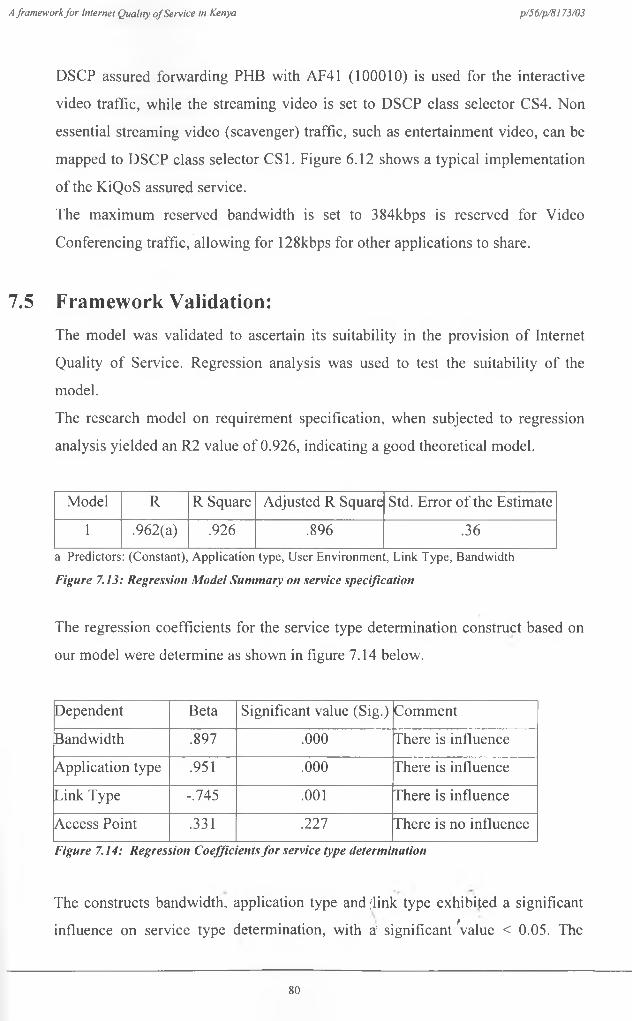
A framework fo r Internet Quality o f Service in Kenya p/56/p/8173/03
DSCP assured forwarding PHB with AF41 (100010) is used for the interactive
video traffic, while the streaming video is set to DSCP class selector CS4. Non
essential streaming video (scavenger) traffic, such as entertainment video, can be
mapped to DSCP class selector CS1. Figure 6.12 shows a typical implementation
of the KiQoS assured service.
The maximum reserved bandwidth is set to 384kbps is reserved for Video
Conferencing traffic, allowing for 128kbps for other applications to share.
7.5 Framework Validation:The model was validated to ascertain its suitability in the provision of Internet
Quality of Service. Regression analysis was used to test the suitability of the
model.
The research model on requirement specification, when subjected to regression
analysis yielded an R2 value of 0.926, indicating a good theoretical model.
Model R R Square Adjusted R Square Std. Error of the Estimate
1 .962(a) .926 .896 .36a Predictors: (Constant), Application type, User Environment, Link Type, Bandwidth
F ig u r e 7.1 3 : R e g re s s io n M o d e l S u m m a r y o n s e rv ic e s p e c i f ic a t io n
The regression coefficients for the service type determination construct based on
our model were determine as shown in figure 7.14 below.
Dependent Beta Significant value (Sig.) Comment
Bandwidth .897 . 0 0 0 There is influence
Application type .951 . 0 0 0 There is influence
Link Type -.745 . 0 0 1 There is influence
Access Point .331 .227 There is no influenceF ig u r e 7 .1 4 : R e g re s s io n C o e f f ic ie n ts f o r s e rv ic e ty p e d e te r m in a t io n
The constructs bandwidth, application type and flink type exhibited a significant
influence on service type determination, with a' significant Value < 0.05. The
80
A framework fo r Internet Quality o f Service in Kenya p/56/p/S) 7? /°3
access point (or environment of access) however did not exhibit influence ° n
service determination. This can be attributed to the fast changing Internet q£er
environment in Kenya, where users have access to Internet services via wirel£sS
devices, from hotels, airports, and hotspots within metropolitan regions.
Due to the technical nature of the service implementation constructs of ^ ur
framework, it was not possible to validate the model based on user percept^11,
thus it validated on the basis of conformity to established standards, the existJJ1®
models and frameworks, as well as the basic requirements for quality of service
for different Internet applications. The framework was found to conform to t^ e
existing market standards with respect to bandwidth, packet loss rates, delay apd
jitter parameters, as specified by the IETF standards. It further provides s im p lify
in the determination of the parameters, parameter levels and infrastrucu»re
specifications for each service type, making it an easy to implement model.
/\ t
81
A framework fo r Internet Quality o f Service in Kenya p/56/p/8173/03
Chapter 8: Conclusion and Recommendation8.1 Introduction
The purpose of this study was to establish the extent to which Quality of Service
is implemented in the provision of Internet services in Kenya. It also sought to
establish the suitability of the existing models, particularly Diffserv and Intserv,
as a means of implementing QoS, as well as the parameters used to measure
quality.
Finally the researcher endeavored to develop a framework, which can be used in
the implementation of Internet QoS in Kenya.
8.2 ConclusionThe overall objective of this study was to come up with a, proposed, framework,
for use in the implementation of Internet QoS in Kenya. In addition, the study had
five specific objectives, all of which were satisfactorily met.
The first objective of the study was to establish if there is currently a QoS
measure, in the provision of Internet services in Kenya. The researcher
established that there is no QoS measure, currently being implemented in the
Kenyan Internet market.
The second objective was to determine the applications that are sensitive to QoS.
The study established that, in addition to web content browsing, electronic mail
and file transfer, applications such as voice over Internet Protocol (VoIP) and
Video Conferencing are growing in popularity amongst Kenyan Internet users.
These two applications were identified as the main QoS sensitive applications in
the market. Other key applications include distance education, multimedia
desktop collaboration and video surveillance.
The third objective was to determine the key considerations in determining user
satisfaction for a network model in Kenya. It was established that, bandwidth,
cost and availability are the key determinants of Internet quality in Kenya. There
is little understanding on the need and application of other parameters, such as
loss, delay and jitter. In addition, it was established that Internet users in Kenya
are generally not aware of their entitlement to QoS. ,
82
A framework fo r Internet Quality o f Service in Kenya p/56/p/8173/03
The fourth objective was to determine whether the existing QoS models are
applicable to the Kenyan scenario. The researcher established that, though the
Kenyan Internet market has its uniqueness, it is possible to implement Internet
QoS based on the existing models. The KiQoS model proposed in this study is
actually based on the Diffserv and Intserv models.
The fifth objective was to determine how Internet users in Kenya access the
services. The study established that majority of Internet users access the services
from cyber cafes (76%). The other users access the services, either from work
place (12%) or from personal computers with Internet connectivity (24%).
In addition to meeting the specified objectives, the study also established that
there is no legal or policy framework in place, to govern the provision of Internet
services in Kenya. Also, there is very little documentation on the Internet services
in Kenya. This was a major challenge to the researcher in this study. This study is
thus expected to add to the available literature in the area.
During the study, the researcher encountered unwillingness, on the part of service
providers, to provide necessary information on the services provided.
8.3 RecommendationsThe study was limited to the service description, leaving out the technical aspects
of the implementation. The researcher thus recommends further study on the cost
and technical implications of the model implementation.
It is also anticipated that, with the commissioning of the undersea cable, the
Internet environment in Kenya will change. I thus recommend that further study
can be done on the adaptation of the KiQoS model, on the new infrastructure.
The researcher also recommends that the findings of this study, particularly the
proposed framework, be implemented as part of coming up with a policy
framework to govern Internet QoS in Kenya. In addition, appropriate legal and
policy guideline, for the implementation, need to be put in place by the market
regulator (CCK). This should also form the basis for further study in the subject.
f\ t '\
83
A framework fo r Internet Quality o f Service in Kenya p/56/p/8173/03
APPENDIX A: REFERENCES1. Andrew S. Tanenbaum: C o m p u te r N e tw o rk s 4 th E d i t io n ; Pearson Education inc., 2004.
2. Andreas Vogel, Brigitte Kerherve, Gregor von Bochmann, Jan Gecsei: D is t r ib u te d M u l t im e d ia a n d
Q O S : A S u rv e y , IEEE MultiMedia, 1995.
3. Avinash Tadimalla: Q u a l i t y o f S e rv ic e (Q o S ) P r im e r , Cisco Systems, 2006.
4. Bernet, Y „ et. Al.: A f r a m e w o r k f o r in te g ra te d s e rv ic e s o p e ra t io n o v e r D i f f s e r v n e tw o rk s ', RFC 2998,
Internet Engineering Task Force (IETF), Novem ber 2000.
5. Brent Wilson: Q o S Im p le m e n ta t io n G u id e o n C is c o R o u te rs , Network Consulting, 2001.
6. C C K P o l ic y G u id e l in e s o n th e P r o v is io n o f V o ic e o v e r In te rn e t P r o to c o l ( V o IP ) S e rv ic e s in K e n ya ',
CCK 2002.
7. Chengzhi Li, Almut Burchard, J'org Liebeherr: A N e tw o rk C a lc u lu s w i t h E f fe c t iv e B a n d w id th ,
University o f Virginia, 2003.
8. Chi-Huang Shih, Chung-Chih Liao: A t r a n s p a r e n t Q o S M e c h a n io s m to s u p p o r t In ts e rv /D if f s e r v
N e tw o rk ', National Cheng Kung University, Taiwan, 2002.
9. Cisco Systems: Im p le m e n t in g Q o S S o lu t io n s f o r H .3 2 3 V id e o C o n fe re n c in g o v e r IP , 2005.
10. Cisco systems: M u l t ip r o t o c o l L a b e l S w i tc h in g (M P L S ) T r a f f ic E n g in e e r in g , 2003.
11. Francisca Mweu: O v e rv ie w o f th e In te r n e t in K e n ya ', Telcom Kenya Limited, 2000.
12. Gerard Bos: Q o S s u p p o r t u s in g D i f fs e r v , University o f Twente, 2007.
13. ITU-T Recommendation E.800 - T e rm s a n d d e f in i t io n r e la te d to q u a l i t y o f s e rv ic e a n d n e tw o rk
p e r fo r m a n c e in c lu d in g d e p e n d a b i l i ty , 1994.
14. John Vicente, Michael Kounavis, Daniel Villela, Michah Lemer, Andrew Campbell: P r o g r a m m in g
In te rn e t Q u a l i t y o f S e rv ic e , Columbia University, NY, USA, 2000.
15. Lancope: D e l iv e r Q u a l i t y O f S e rv ic e U s in g T h e D if f s e r v M o d e l, Lancope, Inc., 2008.
16. Michael Malakata: R iv a l f i b e r - o p t i c c a b le s s e t f o r m a rk e t b a t t le in A f r ic a ', Computerworld Zambia,/2009.
17. Gil Hansen: Q u a l i t y o f S e rv ic e (Q oS )', Object Services and Consulting, Inc. 1997
18. Kanaka Juvva: Q u a l i t y O f S e rv ic e ', Carnegie Mellon University, 1998
19. Peng Hwa Ang, Berlinda Nadarajan: Is su e s in th e R e g u la t io n o f I n te r n e t Q u a l i t y o f S e rv ic e , Nanyang
Technological University Singapore and National Computer Board Singapore, 2001.
20. Peter Fishburn and Andrew Odlyzko: D y n a m ic B e h a v io r o f D i f f e r e n t ia l P r ic in g a n d Q u a l i t y o f S e rv ic e
O p t io n s f o r th e In te rn e t ', AT&T Labs Research, 1998.
21. Procurve Networking: L o w -L a te n c y Q u e u in g C o n f ig u r a t io n G u id e ', Hewlett-Packard Development
Company, 2005.
22. Ruediger Zarnekow,Walter Brenner, Malte Dous, Q u a l i t y o f S e rv ic e B u s in e s s M o d e ls f o r th e
B r o a d b a n d In te rn e t ', University o f St. Gallen, Switzerland 2006.
23. Sarat Chandra, Q o S in V o IP ', November 28, 2004. ( ,
84
A framework fo r Internet Quality o f Service in Kenya p/56/p/8173/03
24. Subha Dhesikan: Q u a li t y o f S e rv ic e f o r IP V id e o c o n fe re n c in g , Cisco Systems, 2001.
25. Tim Szieeti. Christina Hattingh: Q u a l i t y o f S e rv ic e D e s ig n O v e rv ie w , Cisco Press. 2004
26. Timothy M. O’Neil: N e tw o rk -B a s e d Q u a l i t y o f S e rv ic e f o r IP V id e o C o n fe re n c in g -, Polycom Inc. 2002.
27. Vasu Jolly, Shahram Latifi: A n o v e rv ie w o f m p ls a n d c o n s t ra in t b a s e d ro u t in g , University o f Nevada,
Las Vegas, USA, 2002.
28. Vuong Son and Xizheng Shi: A p r o p o r t io n a l D if fe re n t ia t io n S e rv ic e m o d e l f o r the F u tu re In te rn e t
D e jfe re n t ia te d S e rv ic e s 4, University of British Columbia, 2000.
29. Waema T., Kashorda M., Kyalo V.: K e n y a In te rn e t M a r k e t A n a ly s is S tu d y , F in a l R eport-,
Communications Commission of Kenya, 2007.
30. Weibin Zhao, David Olshefski and Henning Schulzrinne: In te rn e t Q u a l i t y o f S e rv ic e : a n O v e rv ie w ,
Columbia University, 2001.
31. Wojciech B., Halina T., Beben A., and marek D.: O v e rv ie w o f th e Q o S f r a m e w o r k f o r E u Q o S ; Warsaw
University of Technology, Warsaw, 2005.
32. Xinping Guo, Colin Pattinson: Q u a li t y o f S e rv ic e R e q u ire m e n ts f o r M u lt im e d ia C o m m u n ic a tio n s -,
School of Computing, Leeds Metropolitan University, 1997.
33. Xinping Guo, Colin Pattinson: Q u a li t y o f S e rv ic e R e q u ire m e n ts f o r M u lt im e d ia C o m m u n ic a t io n s
S c h o o l o f C o m p u t in g : Leeds Metropolitan University, 1997
http://www.hiraeth.com/conf/web97/papers/guo.html
34. Zheng Wang: In te rn e t Q o S -A rc h ite c tu re s a n d M e c h a n is m s f o r Q u a l i t y o f S e rv ic e ; Morgan Kaufmann,
2001.
35. http://www.voip-calculator.com/bandwidth.html: Bandwidth requirements for Voice over IP
transmissions, 2008.
36. http://forums.speedguide.net/showthread.php7t~ 191804: Bandwidth Requirements for Video
Conferencing; 2005
37. http://www.cisco.com/warp/public/105/video-qos.html: Implementing QoS solutions for H.323 Video
Conferencing over IP, 2006.
38. http://www.cisco.com/univercd/cc/td/doc/cisintwk/intsolns/qossol/qosvoip.htm: Quality of Service for
Voice over IP, 2008.
39. http://www.cisco.com/univercd/cc/td/doc/cisintwk/ito doc/aos.htm: Quality o f Service (QoS), 2007.
40. African Telecommunication/ICT Indicators 2008: At a crossroads; http://www.itu.int/ITU-
D/ict/publications/africa/2008/index.html
41. What Future Holds for Satellite Internet in Kenyap; http://fortvsouth.com/tag/undersea-fiber/
42. Africa undersea cables; http://manvpossibilities.net/african-undersea-cables/
85

A framework for Internet Quality o f Service in Kenya p/56/p/8l 73/03
APPENDIX B: COVER LETTER
Nicholas Kibaara Riungu,
c/o School of Computing and
Informatics,
University of Nairobi.
E-mail:
August 23, 2010
Dear respondent,
RE: DATA COLLECTION FOR ACADEMIC PURPOSEI am a Masters student at the school of Computing and Informatics, University of
Nairobi. As part of the course requirements, 1 am carrying out a study of the nature and
state of Internet services in Kenya with the aim of coming up with a proposed framework
for Quality of Service implementation. Of interest in this study, is the type and level of
service offered (by service providers), and the desired or expected level of service (by the
users).
The study is purely for academic purposes, as partial fulfillment of the requirement for
the Master of Science degree in Computer Information Systems, at the University of/
Nairobi.
I wish to request your assistance, in achieving the said goal, by completing the attached
questionnaire.The accuracy and completeness of the information provided is of utmost importance.
Once again I wish to assure the respondent that any information provided shall not be
divulged to any third party, and shall only be used for the intended purpose.
Thank you for your cooperation.
Yours Sincerely > - -i\ > '\ t» 1Nicholas Kibaara Riungu
86
A framework fo r Internet Quality o f Service in Kenya p/56/p/8173/03
APPENDIX C: QUESTIONNAIRE 11. Target Respondent
This questionnaire is meant for Internet service users.
2. Objectives
a. To determine users’ level of awareness on Quality of service.
b. To determine the users’ desired costing model.
c. To determine the users’ view of the Internet services as offered currently.
d. To determine the type of connection/link used by users.
e. To determine the most common internet-based user applications in Kenya.
f. To determine the key parameters from a users’ point of view.
3. Questionnaire structure
This questionnaire is divided into five (5) sections. Each of the section tries to
address a critical area of the required information.
a. Personal details.
b. Internet infrastructure.
c. Internet services.
d. Quality of service.
e. Additional remarks.
4. Mode of delivery/ presentations
For the purposes of presenting the questionnaire to the respondent, and receiving
the response, the following approach shall be adopted:
a. A random sample of Fifty (50) Internet service users will be selected.
b. A test run will be conducted on five (5) of the non-selected users.
c. Collections and alterations may be made based on the results of the test run.
d. A copy of the questionnaire shall be delivered, manually, to each of the
chosen respondents.
e. The completed questionnaires shall be collected, after seven days, for
analysis.
87
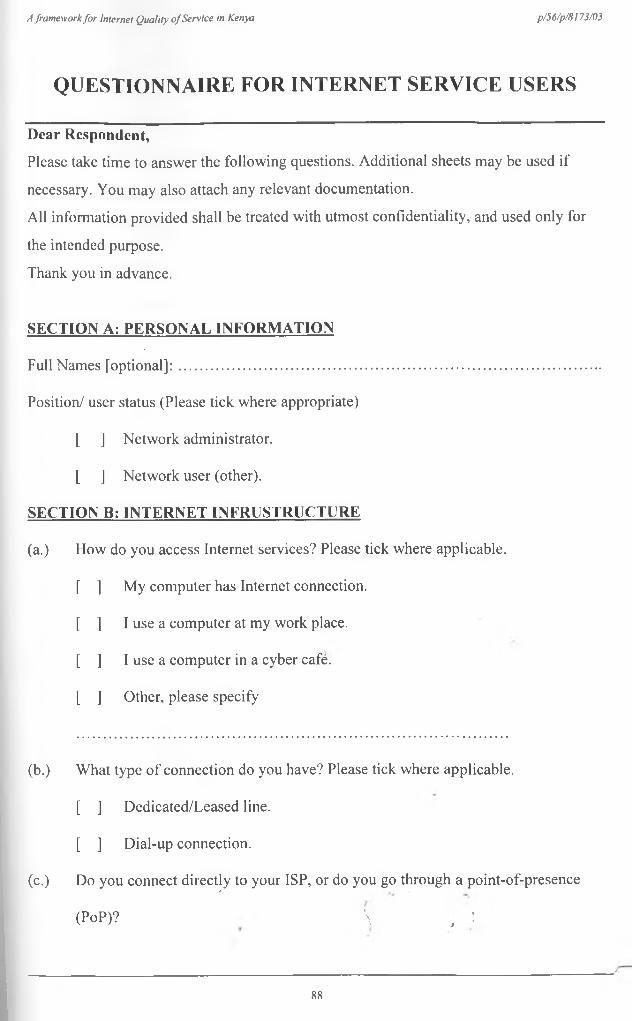
A framework fo r Internet Quality o f Service in Kenya p/56/p/8173/03
QUESTIONNAIRE FOR INTERNET SERVICE USERS
Dear Respondent,
Please take time to answer the following questions. Additional sheets may be used if
necessary. You may also attach any relevant documentation.
All information provided shall be treated with utmost confidentiality, and used only for
the intended purpose.
Thank you in advance.
SECTION A: PERSONAL INFORMATION
Full Names [optional]: ......................................................................................................
Position/ user status (Please tick where appropriate)
[ ] Network administrator.
[ ] Network user (other).
SECTION B; INTERNET 1NFRUSTRUCTURE
(a.) How do you access Internet services? Please tick where applicable.
[ ] My computer has Internet connection.
[ ] I use a computer at my work place.
[ ] I use a computer in a cyber cafe.
[ ] Other, please specify
(b.) What type of connection do you have? Please tick where applicable.
[ ] Dedicated/Leased line.
[ ] Dial-up connection.
(c.) Do you connect directly to your ISP, or do you go through a point-of-presence/
(PoP)? \ ; :
88

A framework fo r Internet Quality o f Service in Kenya p/56/p/8173/03
(d.) What is the connection speed (bandwidth), of your connection, as per the service
level agreement? Please tick where applicable.
[ ] 56kbps
[ ] 64kbps
[ ] 128kbps
[ ] 256kbps
[ ] Other, please specify
(e.) What is the minimum and maximum link/connection speed experienced in your
connection?
• Minimum ...........Kbps
• Maximum ...........Kbps
SECTION C: INTERNET SERVICES
(a.) What Internet service do you use? Please tick as applicable.
[ ] Web browsing
[ ] Electronic mail
[ ] File transfer (downloads and uploads)
[ ] Voice over IP
] Video conferencing
[ ] Other, Please specify
............................ ......... ......................................... ............/\ * '
(b.) How are the Internet services, charged? Please tick where applicable.
89
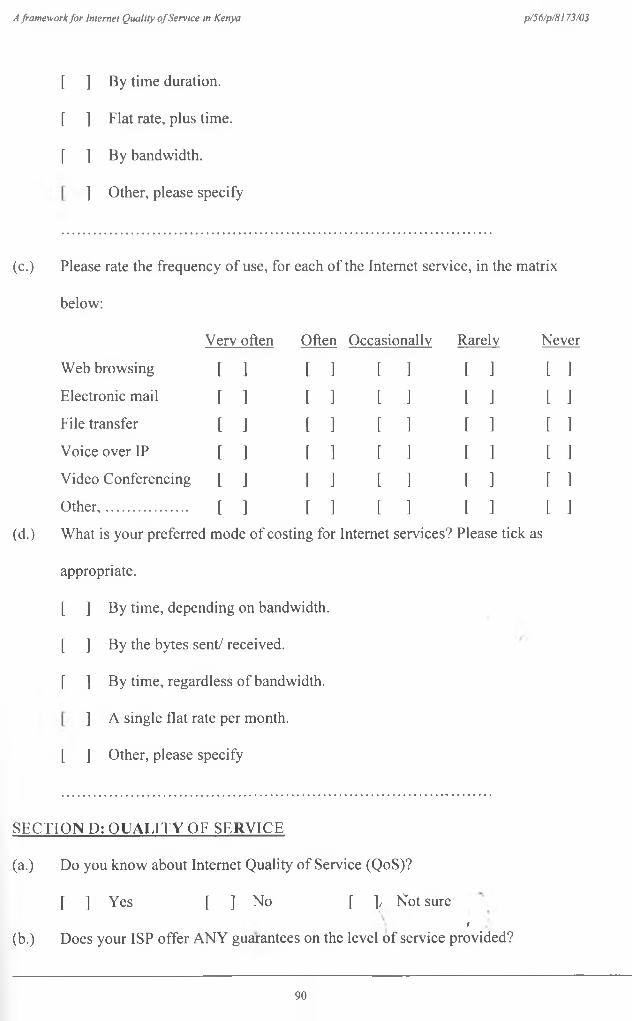
A framework fo r Internet Quality o f Service in Kenya p/56/p/8173/03
[ ] By time duration.
[ ] Flat rate, plus time.
[ ] By bandwidth.
] Other, please specify
(c.) Please rate the frequency of use, for each of the Internet service, in the matrix
below:
Verv often Often Occasionally Rarelv Never
Web browsing [ ] [ ] [ ] [ ] [ ]Electronic mail [ ] [ ] [ ] [ ] [ ]File transfer [ ] [ ] [ ] [ ] [ ]Voice over IP [ ] [ ] [ ] [ ] [ ]Video Conferencing [ ] [ ] [ ] [ ] [ ]Other...................... [ ] [ ] [ ] [ ] [ ]
(d.) What is your preferred mode of costing for Internet services? Please tick as
appropriate.
[ ] By time, depending on bandwidth.
[ ] By the bytes sent/ received.
[ ] By time, regardless of bandwidth.
] A single flat rate per month.
[ ] Other, please specify
SECTION D: QUALITY OF SERVICE
(a.) Do you know about Internet Quality of Service (QoS)?
[ ] Yes [ ] No [ ]/ Not suref
(b.) Does your ISP offer ANY guarantees on the level of service provided?
90
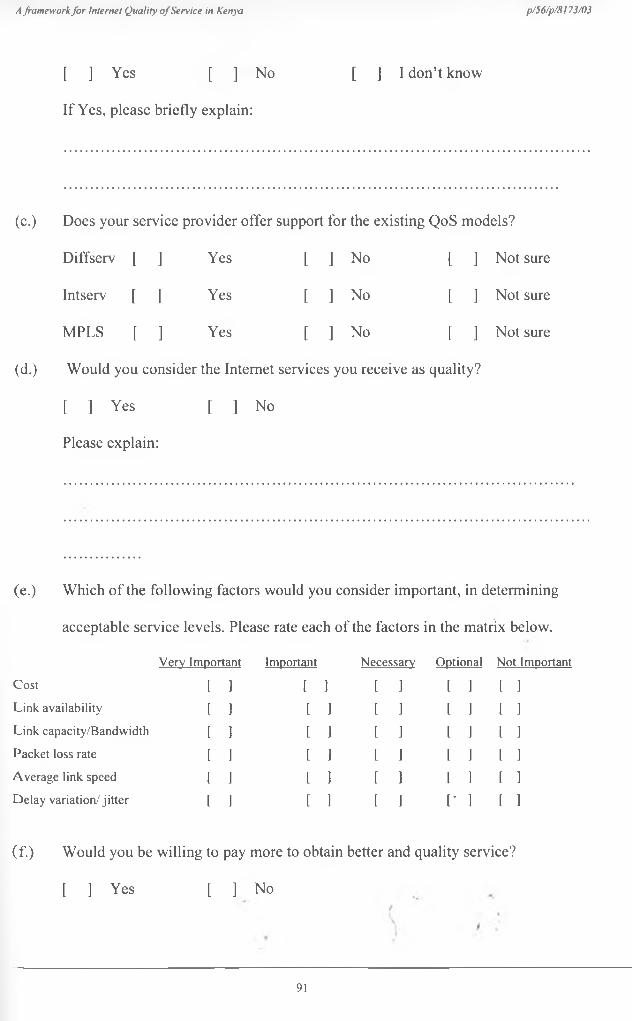
A framework fo r Internet Quality o f Service in Kenya p/56/p/8173/03
[ ] Yes [ ] No [ ] I don’t know
If Yes, please briefly explain:
(c.) Does your service provider offer support for the existing QoS models?
Diffserv [ ] Yes [ ] No [ ] Not sure
Intserv [ ] Yes [ ] No [ ] Not sure
MPLS [ ] Yes [ ] No [ ] Not sure
(d.) Would you consider the Internet services you receive as quality?
[ ] Yes [ ] No
Please explain:
(e.) Which of the following factors would you consider important, in determining
acceptable service levels. Please rate each of the factors in the matrix below.
Verv Important Important Necessarv Optional Not Important
Cost [ 1 1 1 [ 1 [ ] [ ]
Link availability [ 1 [ 1 [ ] [ ] [ ]
Link capacity/Bandwidth [ 1 [ 1 [ 1 [ ] [ ]
Packet loss rate [ 1 [ 1 1 1 t 1 [ ]
Average link speed [ 1 t 1 [ ] [ ] [ ]
Delay variation/jitter [ 1 [ ] [ 1 [' ] [ 1
(f.) Would you be willing to pay more to obtain better and quality service?
[ ] Yes [ ] No
91

A framework fo r Internet Quality o f Service in Kenya p/56/p/8173/03
(g.) Which of the following statements describes your desired service type? Please
tick where applicable.
[ ] 1 would prefer a fast link, with guaranteed minimum bandwidth.
[ ] I wouldn’t mind a low speed link, provided I only pay for the bytes sent/
received.
[ ] I would prefer a connection with guaranteed availability, regardless of
speed.
[ ] Other, please specify:
SECTION E: ADDITIONAL COMMENTS
Please provide ANY necessary additional comments, on the Internet Quality of Service,
in the space below:
t\ f
92
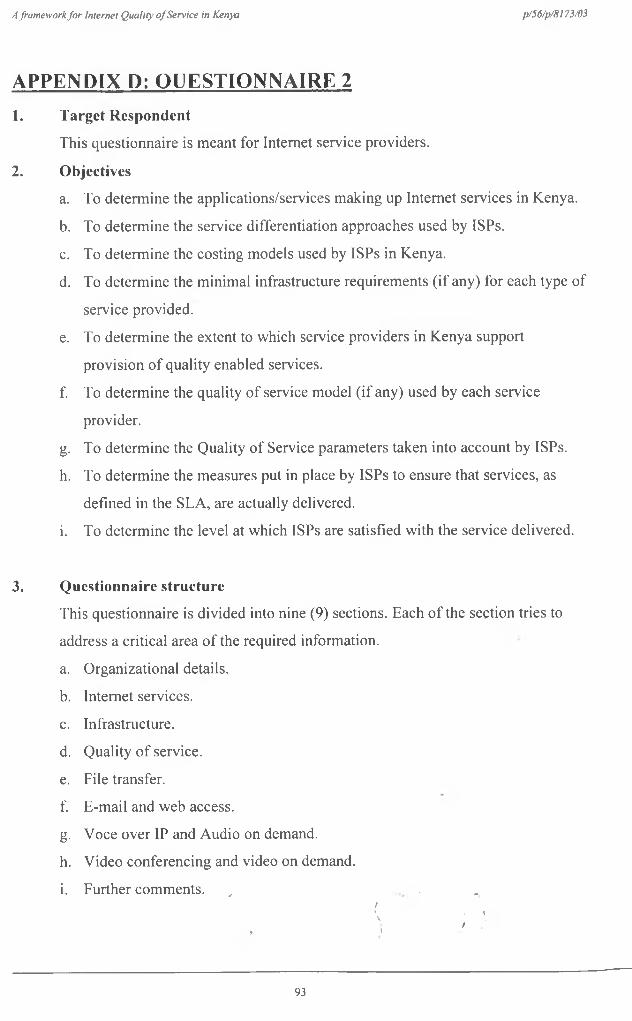
A framework fo r Internet Quality o f Service in Kenya p /5 6 /p /8173/03
APPENDIX D: QUESTIONNAIRE 21. Target Respondent
This questionnaire is meant for Internet service providers.
2. Objectives
a. To determine the applications/services making up Internet services in Kenya.
b. To determine the service differentiation approaches used by ISPs.
c. To determine the costing models used by ISPs in Kenya.
d. To determine the minimal infrastructure requirements (if any) for each type of
service provided.
e. To determine the extent to which service providers in Kenya support
provision of quality enabled services.
f. To determine the quality of service model (if any) used by each service
provider.
g. To determine the Quality of Service parameters taken into account by ISPs.
h. To determine the measures put in place by ISPs to ensure that services, as
defined in the SLA, are actually delivered.
i. To determine the level at which ISPs are satisfied with the service delivered.
3. Questionnaire structure
This questionnaire is divided into nine (9) sections. Each of the section tries to
address a critical area of the required information.
a. Organizational details.
b. Internet services.
c. Infrastructure.
d. Quality of service.
e. File transfer.
f. E-mail and web access.
g. Voce over IP and Audio on demand.
h. Video conferencing and video on demand.
i. Further comments. v . ./\ i t\ t
, I
93
A framework fo r Internet Quality o f Service in Kenya p /5 6 /p f173/03
4. Mode of delivery/ presentations
For the purposes of presenting the questionnaire to the respondent, and receiv*n®
the response, the following approach shall be adopted:
a. A random sample of ten (10) service providers, within Nairobi, will be
selected.
b. A test run will be conducted with one of the non-selected ISPs.
c. Collections and alterations may be made based on the results of the test ru11'
d. A copy of the questionnaire shall be delivered, manually, to each of the
chosen respondents.
e. The completed questionnaires shall be collected, after seven days, for
analysis.
f. Where clarification is necessary, an Interview shall be organized with one ° r
more of the respondents.
/t
94
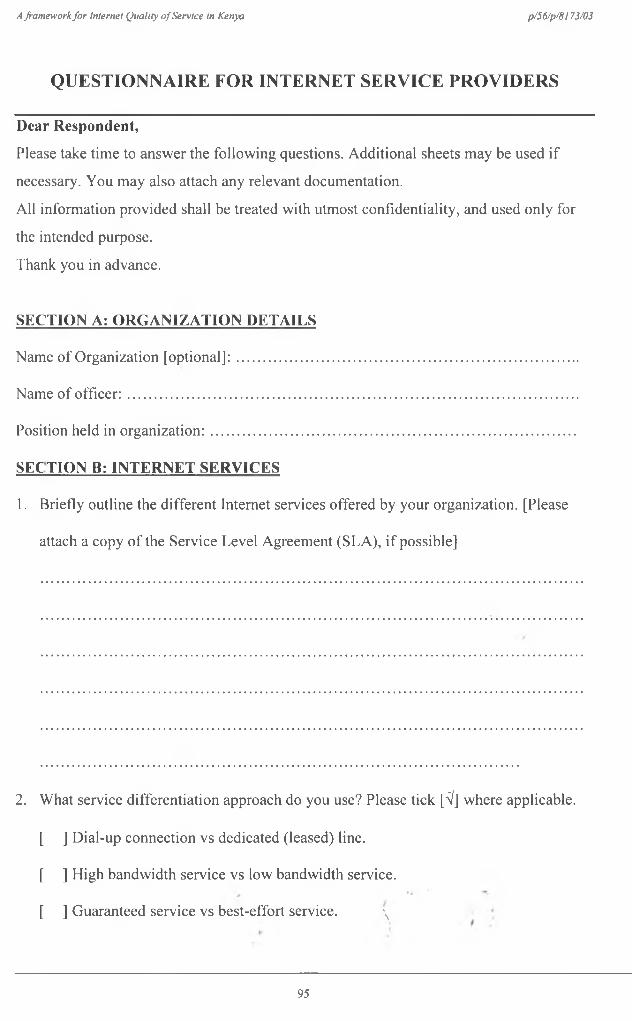
A framework fo r Internet Quality o f Service in Kenya p/56/p/8173/03
QUESTIONNAIRE FOR INTERNET SERVICE PROVIDERS
Dear Respondent,
Please take time to answer the following questions. Additional sheets may be used if
necessary. You may also attach any relevant documentation.
All information provided shall be treated with utmost confidentiality, and used only for
the intended purpose.
Thank you in advance.
SKCTION A: ORGANIZATION DETAILS
Name of Organization [optional]:.....................................................................................
Name of officer:................................................................................................................
Position held in organization:...........................................................................................
SKC TION B: INTERNET SERVICES
1. Briefly outline the different Internet services offered by your organization. [Please
attach a copy of the Service Level Agreement (SLA), if possible]
2. What service differentiation approach do you use? Please tick [V] where applicable.
[ ] Dial-up connection vs dedicated (leased) line.
[ ] High bandwidth service vs low bandwidth service.
[ ] Guaranteed service vs best-effort service. \
95
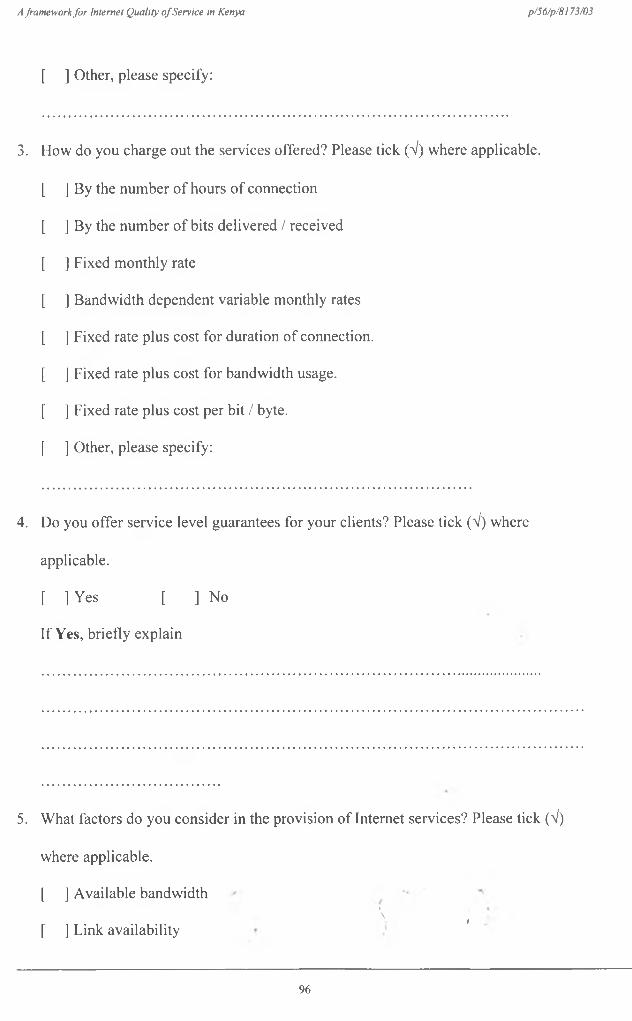
A framework fo r Internet Quality o f Service in Kenya p/56/p/8l73/03
[ ] Other, please specify:
3. How do you charge out the services offered? Please tick (V ) where applicable.
[ ] By the number of hours of connection
[ ] By the number of bits delivered / received
[ ] Fixed monthly rate
[ ] Bandwidth dependent variable monthly rates
[ ] Fixed rate plus cost for duration of connection.
[ ] Fixed rate plus cost for bandwidth usage.
[ ] Fixed rate plus cost per bit / byte.
[ ] Other, please specify:
4. Do you offer service level guarantees for your clients? Please tick (V ) where
applicable.
[ ]Yes [ ] No
If Yes, briefly explain
5. What factors do you consider in the provision of Internet services? Please tick (V )
where applicable.
[ ] Available bandwidth
[ ] Link availability
96
\ t
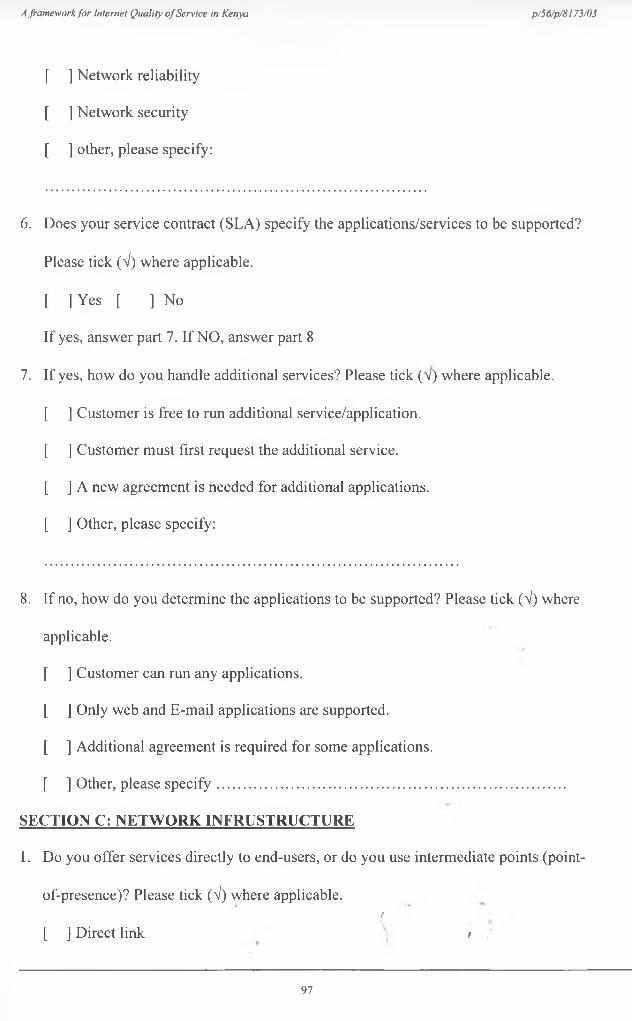
A framework fo r Internet Quality o f Service in Kenya p/56/p/8173/03
[ ] Network reliability
[ ] Network security
[ ] other, please specify:
6 . Does your service contract (SLA) specify the applications/services to be supported?
Please tick (V ) where applicable.
[ ] Yes [ ] No
If yes, answer part 7. If NO, answer part 8
7. If yes, how do you handle additional services? Please tick (v) where applicable.
[ ] Customer is free to run additional service/application.
[ ] Customer must first request the additional service.
[ ] A new agreement is needed for additional applications.
[ ] Other, please specify:
8. If no, how do you determine the applications to be supported? Please tick (V ) where
applicable.
[ ] Customer can run any applications.
[ ] Only web and E-mail applications are supported.
[ ] Additional agreement is required for some applications.
[ ] Other, please specify.......................................................................................
SECTION C: NETWORK INFRUSTRUCTURE
1. Do you offer services directly to end-users, or do you use intermediate points (point-
of-presence)? Please tick (V ) where applicable.f
[ ] Direct link > .'
97

A framework fo r Interne! Quality o f Service in Kenya p/56/p/8173/03
[ ] Through Point-of-presence
[ ] Both approaches
2. If both, which do you consider more preferable? Please explain:
3. What is the minimum link capacity that you currently support?
For direct link to client...................................
For link through point-of-presence............................
4. What is the maximum link capacity that you currently support?
For direct link to client...............................................
For link through point-of-presence................................
5. Do you have any specific agreements with infrastructure providers to ensure
minimum service levels are maintained?
[ ]Yes [ ] No
If Yes, please explain:
6 . How does offering services through an intermediate point affect the type and level of
service you can provide?
/
98
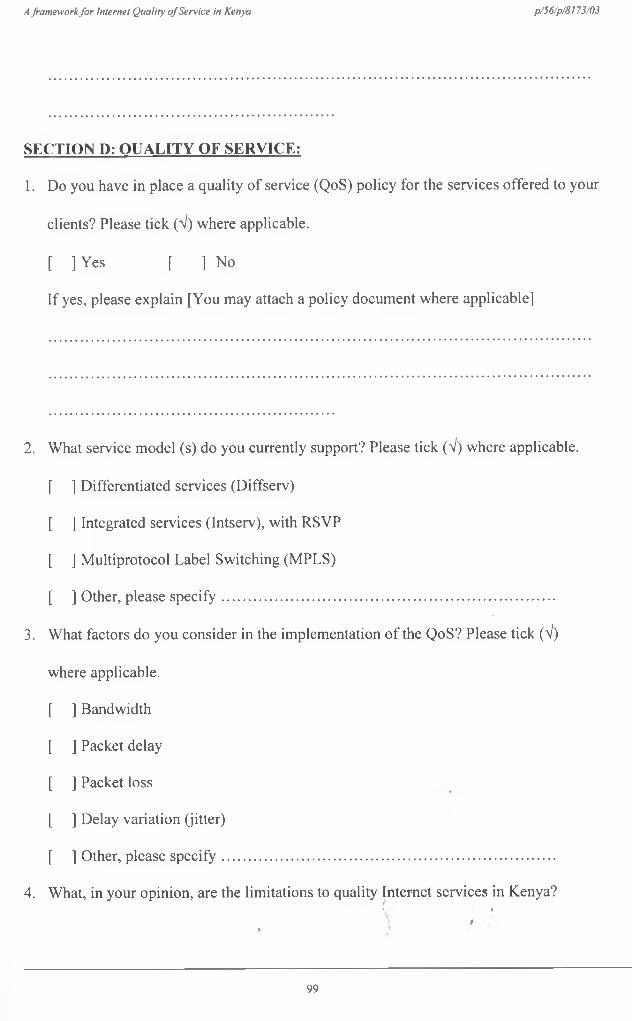
A framework fo r Internet Quality o f Service in Kenya p/56/p/8173/03
SECTION D: QUALITY OF SERVICE:
1. Do you have in place a quality of service (QoS) policy for the services offered to your
clients? Please tick (V ) where applicable.
[ ]Yes [ ] No
If yes, please explain [You may attach a policy document where applicable]
2 . What service model (s) do you currently support? Please tick (V ) where applicable.
[ ] Differentiated services (Diffserv)
[ ] Integrated services (Intserv), with RSVP
[ ] Multiprotocol Label Switching (MPLS)
[ ] Other, please specify...................................................................................
3. What factors do you consider in the implementation of the QoS? Please tick (V )
where applicable.
[ ] Bandwidth
[ ] Packet delay
[ ] Packet loss
[ ] Delay variation (jitter)
[ ] Other, please specify..................................................................................
4. What, in your opinion, are the limitations to quality Internet services in Kenya?\ * '
9' 9 .
99
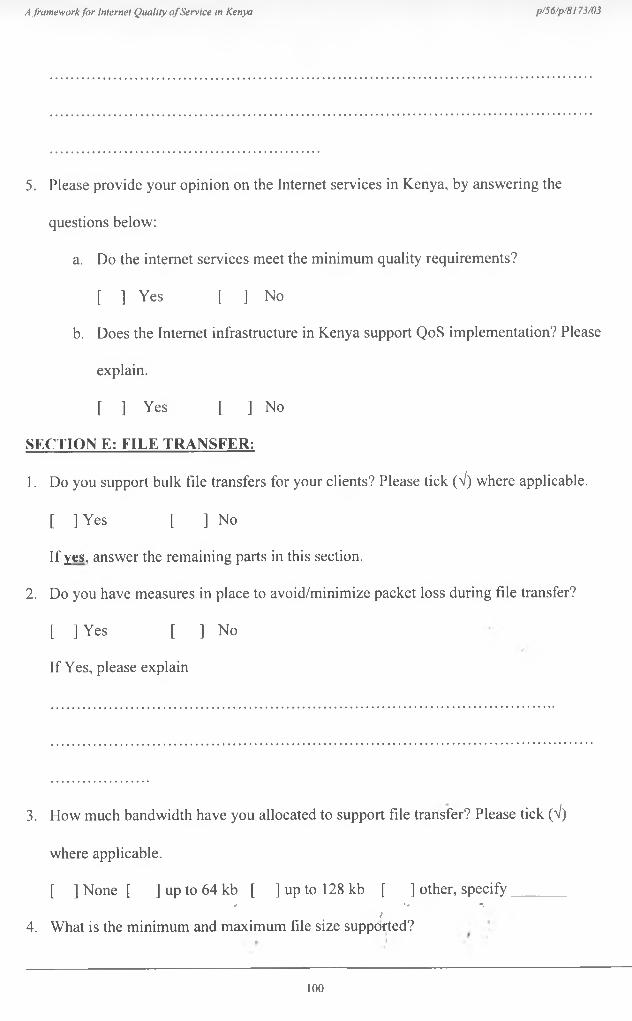
A framework fo r Internet Quality o f Service in Kenya p/56/p/8173/03
5. Please provide your opinion on the Internet services in Kenya, by answering the
questions below:
a. Do the internet services meet the minimum quality requirements?
[ ] Yes [ ] No
b. Does the Internet infrastructure in Kenya support QoS implementation? Please
explain.
[ ] Yes [ ] No
SECTION E: FILE TRANSFER:
1 . Do you support bulk file transfers for your clients? Please tick (V ) where applicable.
[ ]Yes [ ] No
If yes, answer the remaining parts in this section.
2. Do you have measures in place to avoid/minimize packet loss during file transfer?
[ ]Yes [ ] No
If Yes, please explain
3 . How much bandwidth have you allocated to support file transfer? Please tick (V )
where applicable.
[ ] None [ ] up to 64 kb [ ] up to 128 kb [ ] other, specify_______/ '» *.
/4. What is the minimum and maximum file size supported?
100
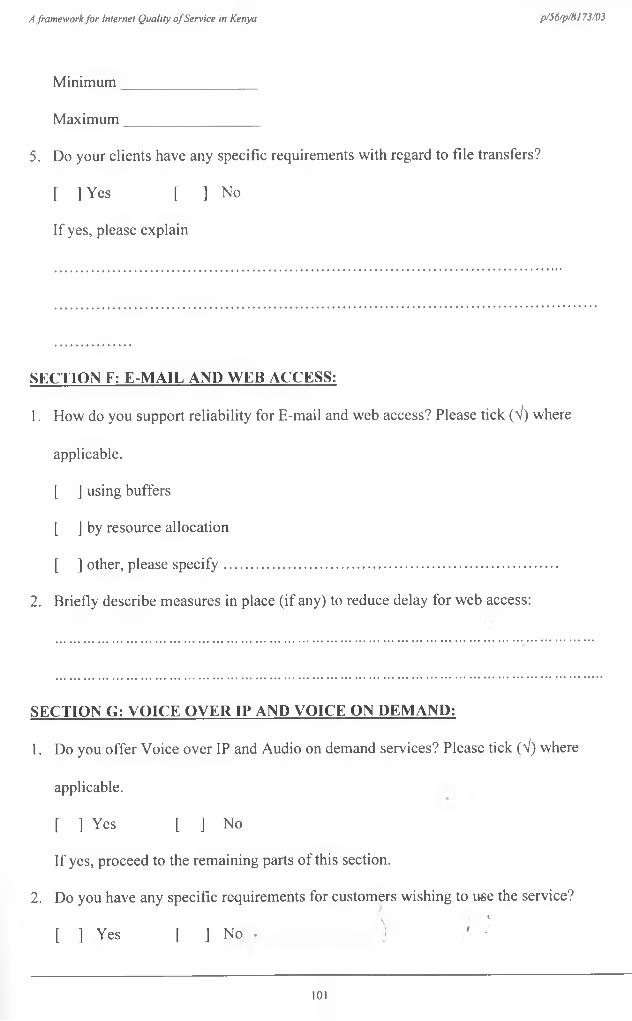
A framework fo r Internet Quality o f Service in Kenya p/56/p/a 173/03
Minimum_________________
Maximum_________________
5. Do your clients have any specific requirements with regard to file transfers?
[ ]Yes [ ] No
If yes, please explain
SECTION F: E-MAIL AND WEB ACCESS:
1 . How do you support reliability for E-mail and web access? Please tick (V ) where
applicable.
[ ] using buffers
[ ] by resource allocation
[ ] other, please specify...................................................................................
2. Briefly describe measures in place (if any) to reduce delay for web access:
SECTION G: VOICE OVER IP AND VOICE ON DEMAND:
1. Do you offer Voice over IP and Audio on demand services? Please tick (V ) where
applicable.
[ ] Yes [ ] No
If yes, proceed to the remaining parts of this section.
2. Do you have any specific requirements for customers wishing to use the service?\ ' '
[ ] Yes [ ] No . 1 • ■
101
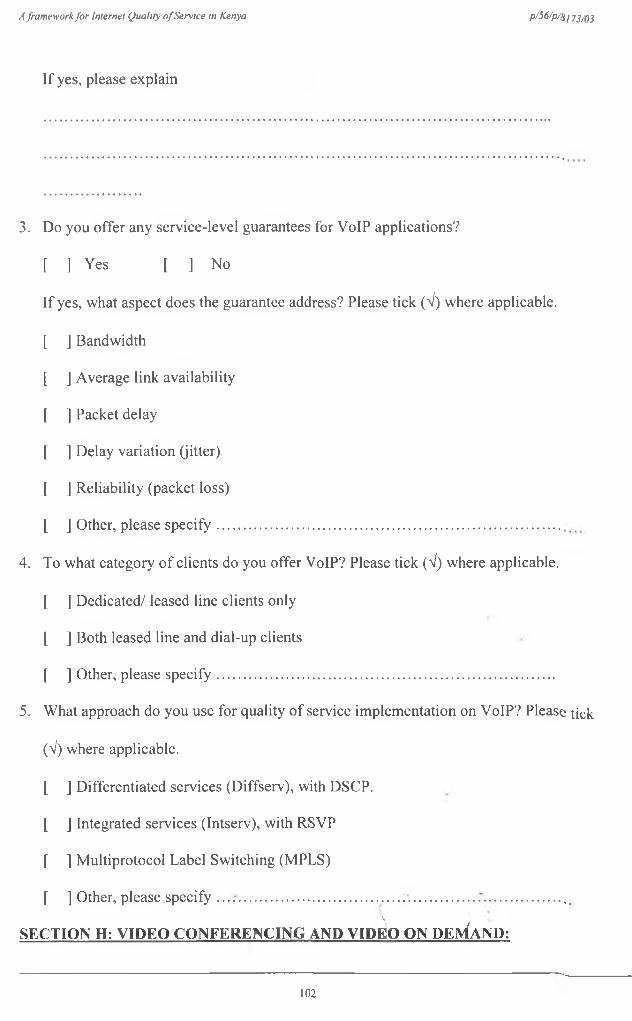
A framework fo r Internet Quality o f Service in Kenya p/56/p/Si 73/03
If yes, please explain
3. Do you offer any service-level guarantees for VoIP applications?
[ ] Yes [ ] No
If yes, what aspect does the guarantee address? Please tick (V ) where applicable.
[ ] Bandwidth
[ ] Average link availability
[ ] Packet delay
f ] Delay variation (jitter)
[ ] Reliability (packet loss)
[ ] Other, please specify......................................................................................
4. To what category of clients do you offer VoIP? Please tick (V ) where applicable.
[ ] Dedicated/ leased line clients only
[ ] Both leased line and dial-up clients
[ ] Other, please specify....................................................................................
5. What approach do you use for quality of service implementation on VoIP? Please tick
(V ) where applicable.
[ ] Differentiated services (Diffserv), with DSCP.
[ ] Integrated services (Intserv), with RSVP
[ ] Multiprotocol Label Switching (MPLS)
[ ] Other, please specify ...........................................................*................... ._\
SECTION H: VIDEO CONFERENCING AND VIDEO ON DEMAND:
102
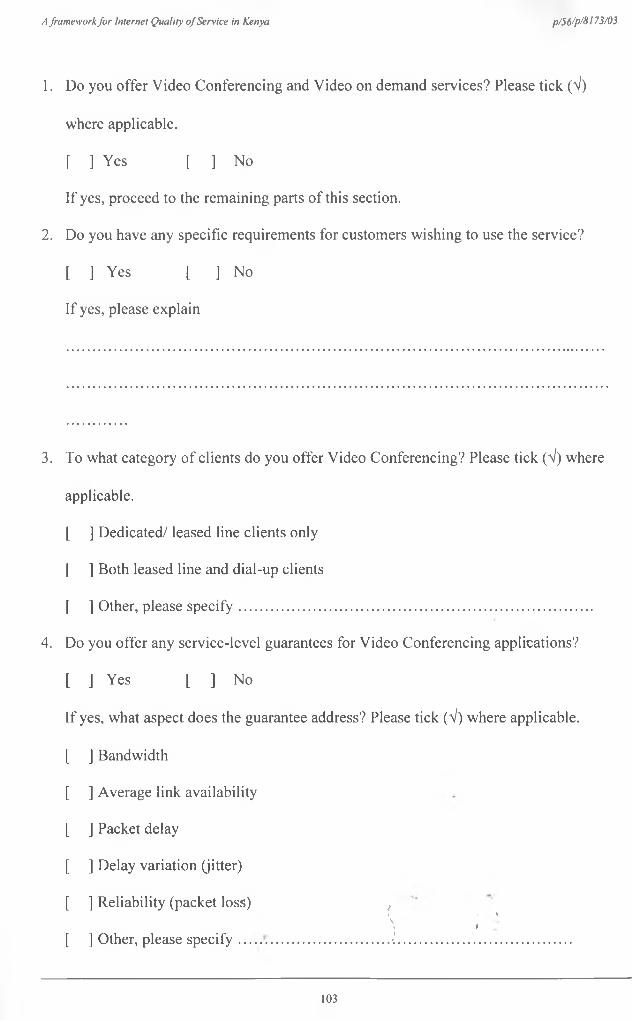
A framework fo r Internet Quality o f Service in Kenya p/56/p/S 173/03
1. Do you offer Video Conferencing and Video on demand services? Please tick (V )
where applicable.
[ ] Yes [ ] No
If yes, proceed to the remaining parts of this section.
2. Do you have any specific requirements for customers wishing to use the service?
[ ] Yes [ ] No
If yes, please explain
3. To what category of clients do you offer Video Conferencing? Please tick (V ) where
applicable.
[ ] Dedicated/ leased line clients only
[ ] Both leased line and dial-up clients
[ ] Other, please specify........................................................................................
4. Do you offer any service-level guarantees for Video Conferencing applications?
[ ] Yes [ ] No
If yes, what aspect does the guarantee address? Please tick (V ) where applicable.
[ ] Bandwidth
[ ] Average link availability
[ ] Packet delay
[ ] Delay variation (jitter)
[ ] Reliability (packet loss) ,* i *\ ,
[ ] Other, please specify..... ............................... •'.................. .........................
103
A framework fo r Internet Quality o f Service in Kenya p/S6/p/8173/03
5. What approach do you use for quality of service implementation on Video
Conferencing? Please tick (V) where applicable.
[ ] Differentiated services (Diffserv), with DSCP.
[ ] Integrated services (Intserv), with RSVP
[ ] Multiprotocol Label Switching (MPLS)
[ ] Other, please specify.......................................................................................
SECTION 1: OTHER SERVICES:
{Please complete a copy o f this section for each additional service)
1. Name of service/ application..................................................................................
2. Do you have any specific requirements for customers wishing to use this service?
[ ] Yes [ ] No
If yes, please explain
3 . To what category of clients do you offer the service? Please tick (V ) where applicable.
[ ] Dedicated/ leased line clients only
[ ] Both leased line and dial-up clients
[ ] Other, please specify........................................................................................
4. Do you offer any service-level guarantees for applications using this service?
[ ] Yes [ ] No
If yes, what aspect does the guarantee address? Please tick (V ) where applicable.
] Bandwidth > - -/\ i i\
[ ] Average link availability ,
104
A framework fo r Internet Quality o j erv'te 'n ^ enl'a p/56/p/8l73/03
[ ] Packet delay
[ ] Delay variation (jitter)
[ ] Reliability (pac^et *oss)
[ ] Other, please specif y ......................................................................................
5 What approach do y°u use f°r ° f service implementation? Please tick (V)
where applicable.
[ ] Differentiated S lices (Diffserv), with DSCP.
[ ] Integrated serves (Intserv), with RSVP
[ ] Multiprotocol l abel Switching (MPLS)
[ ] Other, please speclf y ......................................................................................
SECTION J: FURTHFj*-CQMMENTS:
Please provide your coni' 1 1 6 1 1 1 on the Internet Quality of Service in Kenya.
/\ f
105