An approach to determine the renewal timing of ships
61
World Maritime University World Maritime University The Maritime Commons: Digital Repository of the World Maritime The Maritime Commons: Digital Repository of the World Maritime University University World Maritime University Dissertations Dissertations 8-27-2017 An approach to determine the renewal timing of ships: Based on An approach to determine the renewal timing of ships: Based on the theory of annual average cost the theory of annual average cost Lu Dai Follow this and additional works at: https://commons.wmu.se/all_dissertations Part of the Business Analytics Commons, Management Sciences and Quantitative Methods Commons, and the Transportation Commons Recommended Citation Recommended Citation Dai, Lu, "An approach to determine the renewal timing of ships: Based on the theory of annual average cost" (2017). World Maritime University Dissertations. 1519. https://commons.wmu.se/all_dissertations/1519 This Dissertation is brought to you courtesy of Maritime Commons. Open Access items may be downloaded for non-commercial, fair use academic purposes. No items may be hosted on another server or web site without express written permission from the World Maritime University. For more information, please contact [email protected].
-
Upload
khangminh22 -
Category
Documents
-
view
1 -
download
0
Transcript of An approach to determine the renewal timing of ships
World Maritime University World Maritime University
The Maritime Commons: Digital Repository of the World Maritime The Maritime Commons: Digital Repository of the World Maritime
University University
World Maritime University Dissertations Dissertations
8-27-2017
An approach to determine the renewal timing of ships: Based on An approach to determine the renewal timing of ships: Based on
the theory of annual average cost the theory of annual average cost
Lu Dai
Follow this and additional works at: https://commons.wmu.se/all_dissertations
Part of the Business Analytics Commons, Management Sciences and Quantitative Methods
Commons, and the Transportation Commons
Recommended Citation Recommended Citation Dai, Lu, "An approach to determine the renewal timing of ships: Based on the theory of annual average cost" (2017). World Maritime University Dissertations. 1519. https://commons.wmu.se/all_dissertations/1519
This Dissertation is brought to you courtesy of Maritime Commons. Open Access items may be downloaded for non-commercial, fair use academic purposes. No items may be hosted on another server or web site without express written permission from the World Maritime University. For more information, please contact [email protected].
SHANGHAI MARITIME UNIVERSITY
WORLD MARITIME UNIVERSITY
An approach to determine the
Based on the theory of annual average cost
A research paper submitted to the World Maritime University i
fulfillment
INTERNATIOANL TRANSPORT AND LOGISTICS
Copyright Dai Lu, 2017
SHANGHAI MARITIME UNIVERSITY
WORLD MARITIME UNIVERSITY Shanghai, China
An approach to determine the
renewal timing of ships
Based on the theory of annual average cost
By
Dai Lu
China
A research paper submitted to the World Maritime University i
fulfillment of the requirements for the award of the degree of
MASTER OF SCIENCE
In
INTERNATIOANL TRANSPORT AND LOGISTICS
2017
SHANGHAI MARITIME UNIVERSITY
An approach to determine the
Based on the theory of annual average cost
A research paper submitted to the World Maritime University in partial
of the requirements for the award of the degree of
INTERNATIOANL TRANSPORT AND LOGISTICS
ii
DECLARATION
I certify that all the material in this research paper that is not my own work has been
identified, and that no material is included for which a degree has previously been
conferred on me.
The contents of this research paper reflect my own personal views, and are not
necessarily endorsed by the University.
(Signature)…………………………….
( Date) 2017/7/17
Supervised by
Professor Zhao Gang
Shanghai Maritime University

iii
Acknowledgement
I would like to express gratitude to all those people who has helped me during the
process of my paper writing.
Firstly, I want to thank all the professors I have met in the ITL program, they have
taught me a lot of knowledge not only on shipping area, they have shared their
experiences and ideas to us. All in all, they have inspired me a lot. Even though I have
any background related to shipping or transportation, professors’ understanding
teaching skill and quality make me absorb and digest most of subjects and knowledge.
Secondly, the deepest gratitude goes to my supervisor, Prof. Zhao Gang. His rich
experience in academic and guidance help me pave the way to where I am. His
responsibility contributes to my fulfillment of my final research paper. His constant
encouragement and guidance gives me courage to overcome all the difficulties during
the process of paper writing. His advices are very useful, not only enlighten me to
have the right logic of my paper, but also noticing me to avoid mistakes. Without his
consistent and illuminating instruction, this paper cannot reach this present form.
Last but not least, my thanks would go to my beloved family for their loving
considerations and great confidence in me all through these years. Due to their
support, I can fully enjoy my learning and life in SMU and WMU. I also owe my
sincere gratitude to my friends and my fellow classmates who doesn’t disturb me
when I carried out my paper writing. Thanks for everyone who takes time in listening
to me and helping me work out my problems during the difficult course of the thesis.
iv
ABSTRACT
Title of research paper: An approach to determine the renewal timing of ships
Degree: Master of Science in International Transport and
Logistics
Decisions regarding investments in capacity expansion or ship renewal require taking
into account both the operating fitness and the financial performance of the
investment. While several new requirements have been considered in the operations
research literature, the traditional method on ship renewal is not fit in new situation.
My paper introduces an approach for the ship renewal problem which is based on the
theory of annual average cost. Generally speaking, there are many factors can
influence the renewal timing of vessels, however, after simplified the original formula
of economic lifetime’ s calculation on vessels, there are two factors left---initial
investment on vessels and the gradient on vessel operating. To define value of the
gradient, the components of this item has been confirmed, which is the sum of annual
increasing expenditure and the loss in annual revenue. Moreover, the investment on
vessel is related to the market factor, while the gradient defined in different cases is
related to quite a lot different elements. In my paper, besides amount of influential
factors, I focus on the number of ECAs. The increasing number on this factor would
lead to higher fuel cost. Through calculation and analysis, the result of the approach
shows the best timing to renew the ship, which has the lowest annual average cost.
The solution on the ship renewal problem is also need to be discussed. To update or
sell or scrap, that is a question. By putting the controversial approach into real case
test, and through the result analysis and sensitivities analysis, the paper will draw a
conclusion of decision making on the ship renewal. My study is aim to enlighten ship
owners to have a better decision on ship renewal and help them to deal with practical
issue.
KEYWORDS: Ship renewal, annual average cost, freight rate, ECA
v
TABLE OF CONTENTS
Declaration ii
Acknowledgements iii
Abstract iv
Table of Contents v
List of Tables vii
List of Figures viii
List of Abbreviations ix
1 Introduction…..……………………………………………………………………1
1.1 Background…………………………………. ……………….……..……1
1.1.1 Preliminary basis on the ship renewal .……………………….…...1
1.1.2 New situations happened on the ship renewal…..…. ………..…...4
1.2 Purpose of Research………………………………. …………………... .6
1.3 Methodology…………………………………. ………………………...6
1.4 Outline……..…………………………………. ………………………...7
2 Literature Review…..........................................................................................9
2.1 Previous research on theory of renewal…………. ………………….....9
2.2 Previous research on ship renewal …………………………………..…11
3 Approach initiative and influential factors identification............................13
3.1 Methodology Explanation…..…………………….…………...……....13
3.2 Issue Identification……………………...……………………..…........18
3.2.1 Influential factors related to market….………..……………….........20
vi
3.2.2 Influential factor of the numbers of ECAs…….……………….........26
4 Case study..…..................................................................................................30
4.1 Model Instantiation……………………………….…………….……..30
4.1.1 Problem solved Process…………………….……...………..........33
4.1.2 Result analysis….………………………….……...………...........35
4.2 Uncertainties Analysis…..……………………………………..............38
4.2.1 Sensitivity Analysis….…………………………….……...…........39
4.2.2 Conclusion and Summary……………………………....................42
5 Summary and prospect ……….........……......................................................44
5.1 Disadvantages on this study…………. ………………….....................44
5.2 Prospect on further research……………………………………..…….45
6 References…………….……….........……......................................................47
vii
Lists of Tables
Table 1- Natural lifetime of different types of vessel……………………….……..2
Table 2- Result of immediate annuities analysis……….………………………….27
Table 3- Total cost calculation of the case study……….………………………….28
Table 4- Result calculation and analysis of the case study…………………………29
Table 5- Multi-factors sensitivity analysis (Part 1) ………………………………...38
Table 6- Multi-factors sensitivity analysis (Part 2) ………………………………...38
viii
List of Figures
Figure 1- Technique route and writing logic of the paper………………………..7
Figure 2- IRR analysis of oil tanker market………………………………...........15
Figure 3- IRR analysis of dry bulk market……………………………….............19
Figure 4- Sox limits globally and in ECAs and illustration of ECAs…………….24
Figure 5- Single-factor sensitivity analysis………………………………............37
ix
List of Abbreviations
AAC Average Annual Cost
CR Capital Recovery Factor
DWT Dead Weight Tonnage
ECA Emission Control Area
gPWF Geometric Present Worth Factor
HFO Heavy Fuel Oil
IMO International Maritime Organization
IRR Internal Rate of Return
LNG Liquefied Natural Gas
LSFO Low Sulphur Fuel Oil
MGO Marine Gas Oil
ROR Rate of Return
SA Sensitivity Analysis
SPW Series Present Worth Factor
S&P Sell and Purchase
TC Total Cost
VC Variable Cost
WACC Weighted Average Cost of Capital
1
Chapter 1 Introduction
1.1 Background
Naturally, vessel is the most valuable and essential fixed asset for the shipping
enterprises. Whether the ship can be operated efficiently or not will directly affect its
operating costs and final economic profits. However, during the operation and along
with the time passed, the ship will gradually depreciate due to all sorts of wear and
tear, and finally it will be discarded for both economic and technical reasons.
Therefore, the shipping corporations will inevitably encounter a problem of ship
renewal in the process of operation and management and it has to be solved correctly
for ship owners’ sake. The ship renewal is a compensation for the lost value of the
ship, and a necessary way for maintaining the expanded reproduction. It is also an
important means for the shipping companies to keep fleet’s optimal scale and to
improve the quality and technology level of the fleet constitution. It is beneficial not
only to improving the profitability of the vessels, but also to enhance the
competitiveness of shipping enterprises. If ship renewal is neglected because of
budget or market opportunities, then the ship corporations will lose its market share
caused by the higher cost and low technological level.
Generally speaking, nowadays, many shipping companies, especially small shipping
companies, the basis of determining the time of ship renewal is the visible tear and
worn of the vessels. However, from the perspective of business, the time to renew the
ship is the time when it lowers the total profit or increases the annual cost. The
purpose to define the time of ship renewal is aim to enlarge the profit that the
shipping company can earn. The time to renew the vessel can be different if we based
on the different concept of vessels’ lifetime. In my paper, to define and calculate the
economic lifetime of vessels is the starting point and breaking point.
1.1.1 Preliminary basis on the ship renewal
2
Since the importance of ship renewal has been emphasized, then how to decide when
to renew the ship is the key problem we need to address. There is a prevailing
classification on academic; generally the ship has three different lifetimes---economic
life, technological life and natural life. Different life cycle has its different timing to
renew the ship, we will discuss them respectively.
First is the natural life of a ship, this life cycle actually doesn’t need to discussed too
much. In definition, the natural life of ship is based on its working life. It is the time
from the ship put into use until the ship unable to satisfy the requirement for
navigability and navigation safety, incapable of providing its original functions. At
this moment, it is necessary to renew the ship. Under this situation, the ship’s working
life mainly depends on the extent of wear and tear in the ship hull and the main engine.
Usually, when maintained well and repaired in time, the main engine and other
mechanical equipment are worn and torn less seriously than the hull is. So, the ship
life is mainly determined by the corrosion speed of the hull. In practice, whether a
ship requires renewing is determined by the register authority’s inspection on its
operating condition and degree of corrosion.
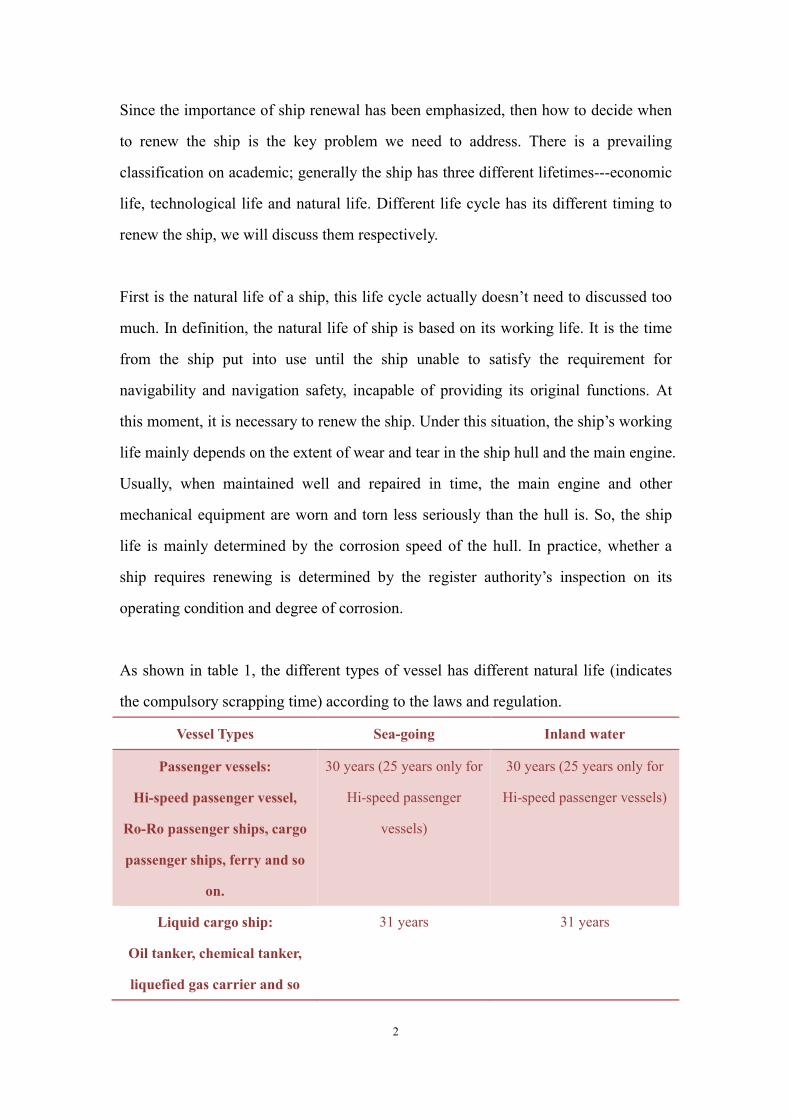
As shown in table 1, the different types of vessel has different natural life (indicates
the compulsory scrapping time) according to the laws and regulation.
Vessel Types Sea-going Inland water
Passenger vessels:
Hi-speed passenger vessel,
Ro-Ro passenger ships, cargo
passenger ships, ferry and so
on.
30 years (25 years only for
Hi-speed passenger
vessels)
30 years (25 years only for
Hi-speed passenger vessels)
Liquid cargo ship:
Oil tanker, chemical tanker,
liquefied gas carrier and so
31 years 31 years
3
on.
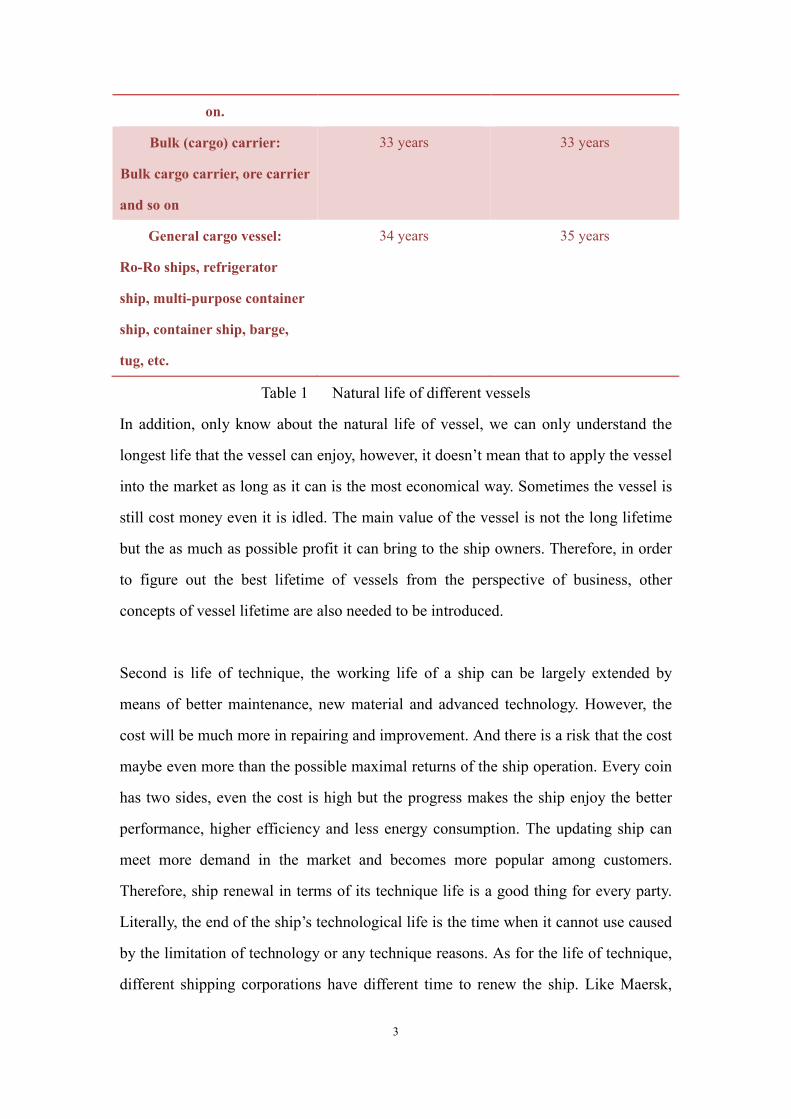
Bulk (cargo) carrier:
Bulk cargo carrier, ore carrier
and so on
33 years 33 years
General cargo vessel:
Ro-Ro ships, refrigerator
ship, multi-purpose container
ship, container ship, barge,
tug, etc.
34 years 35 years
Table 1 Natural life of different vessels
In addition, only know about the natural life of vessel, we can only understand the
longest life that the vessel can enjoy, however, it doesn’t mean that to apply the vessel
into the market as long as it can is the most economical way. Sometimes the vessel is
still cost money even it is idled. The main value of the vessel is not the long lifetime
but the as much as possible profit it can bring to the ship owners. Therefore, in order
to figure out the best lifetime of vessels from the perspective of business, other
concepts of vessel lifetime are also needed to be introduced.
Second is life of technique, the working life of a ship can be largely extended by
means of better maintenance, new material and advanced technology. However, the
cost will be much more in repairing and improvement. And there is a risk that the cost
maybe even more than the possible maximal returns of the ship operation. Every coin
has two sides, even the cost is high but the progress makes the ship enjoy the better
performance, higher efficiency and less energy consumption. The updating ship can
meet more demand in the market and becomes more popular among customers.
Therefore, ship renewal in terms of its technique life is a good thing for every party.
Literally, the end of the ship’s technological life is the time when it cannot use caused
by the limitation of technology or any technique reasons. As for the life of technique,
different shipping corporations have different time to renew the ship. Like Maersk,
4
the head of shipping industry. This company always leads the change of the size or
design of the vessel, in this case, the time period to renew the ship of Maersk is much
shorter than other companies. In terms of micro shipping companies, most ship
owners will renew their ships until they cannot meet the customers’ request or lost
their market share. Therefore, the decision on ship renewal is various according to
different priority in different shipping corporation.
The last but not the least, due to higher profit is what investors and ship owners chase
for, so the life of economics cannot be forget. Compare to other lifecycle, the
economical life is more complicated and hard to predicted, because there are a lot of
factors would influence it, such as the world economy situation, the change of the
shipping market and the trade restructure and so on. These factors will effects the
income of ship operation, and the budget of the shipping company is the determining
factor that the ship renewal will be carry out or not.
In real market, even if a ship operated for a period of time does not reach its effective
service life, with its technical performance still satisfying the requirement for
navigability and navigation safety, the renewal of the ship has yet to be carried out.
Otherwise, the market demand still exists, and the ship undergoes renewing instead of
make money in the market, shipping corporations will lost the opportunity cost and
suffer heavy economic losses. Therefore, compare to ship’s economic life, the ship
corporations are more focus on its technical life, because the technical problem is
visible and technical disadvantage and easy to figure out. For the businessmen, the
economic life is difficult to define. However, for the scholars’ perspective, this issue is
worth to study.
1.1.2 New situations happened on the ship renewal
According to previous discussion, in order to strengthen the overall competitiveness
and have a healthy development, so help the ship owners to evaluate the economic
5
lifecycle and to reasonably determine the renewal opportunity of the ship is a
significant problem to be urgently solved with solid scientific ground. However, due
to the characteristic of the life of economic, its complicated and importance make the
study of ship renewal is useful and various.
Since the economic life has been influenced by so many factors, therefore, the change
of any factors can make a difference on the result of the time to renew the ship. Even
there are quite a few studies on economic analysis on ship renewal, but recent years
the market is fluctuate, especially the change of freight rate in this case, new studies
are welcomed and worth to start.
In this paper, the new situation which I have paid attention to is the issue of
environmental protection. With the development of shipping industry, the growth of
fleet is dramatically and the size of vessel is bigger and bigger. Along with the
increasing momentum, more and more ships enter into the ocean, which leads to a
serious problem---emission pollution. Actually, the awareness of ocean environmental
protection begins very early, and different parties has made a great effort to improve
this problem. The law and regulation related to pollution has been improved and
perfect, such as the establishment of Emission Control Areas (ECAs) and advocation
of “Green Ship”. Every action indicates that protect environment and to have a
healthy, sustainable development is really matters. Therefore, besides the original
three basic lifecycle, some scholars come up a new lifecycle named environment life
cycle. Recent years, more and more ECAs have been set up, it limits those old
polluted vessel enter into certain water field. Sulphur Emission Control Area (SECAs)
or Emission Control Areas (ECAs) are sea areas in which stricter controls were
established to minimize airborne emissions from ships as defined by Annex VI of the
1997 MARPOL Protocol which came into effect in May 2005. To stand in ship
owners’ shoes, those old generation vessels have lost their market attraction,
furthermore, if the shipping company doesn’t have “Green ships”, it will finally be
eliminated by the market. Therefore, to study the influence of the growth of ECAs on
6
ship renewal has practical and realistic significance.
1.2 Purpose of research
The purpose of research is to solve practical issues. My paper is aim to answer
following four questions. There is why the tradition method of ship renewal should be
improved? What kind of factors should be considered? When is the better time to
renew the ship? What can ship owner benefits from my research? If the shipping
market participants can get some inspirations or benefits from my analysis and
research, then the goal of my paper has been achieved.
1.3 Methodology
In my paper, the theory of annual average cost is the method to help me figure out the
economic life of vessels and to determine the time to renew the ship. By means of
mathematical formulation, I have to choose related variables and quantize these
parameters.
Originally, in AAC(annual average cost) modal, the dependent variable is the annual
average cost, the independent variables are original capital investment; the general
consumption, includes maintenance fee, depreciation and operating cost; the revenue;
cash discount factor , year of ship renewal and so on. Differ from the general method,
I simplify the original formula based on scientific logic, the rest variables in the
simplified formula is the factors that I would take into consideration.
To reveal a little bit of the details, the new changes of recent years are quite a lot. But
in my research, the factors that would be involved into my study are concluded the
newbuilding market which would influence the investment on this industry; as the
most significant measurement---the freight rate has to be involved into this study,
which indicates the situation of shipping market and closely related to the profit; the
7
last factors I take into consideration is the increasing number of ECAs. Along with the
prevailing awareness of maritime environmental protection, there are would be more
and more Emission Control Areas, in order to pass through this area; switching to the
low sulphur fuel oil is the most common way to be adopted. Obviously, this situation
would increase the fuel cost of the ship due to the higher bunker price of cleaner
energy.
Based on the theory of annual average cost, and taking the factors I mentioned about
as the variables. Through the calculation and data analysis, I would come up with the
result of economic lifetime of vessels, which is the suggested timing to renew the
vessel. After the mathematic method, I will test this modal through the real case study.
1.4 Outline
Based on the logic above, there are five chapters in my paper. Chapter 2 is literature
review, intend to overview the previous related studies or researches from home and
aboard. Based on the inspiration of authoritative studies, the findings in new market
environment or changes in shipping industry can help me develop my own paper,
which can provide some useful suggestions to ship owners under the new situation.
Chapter 3 is to problem identification and methodology searching. To identify the
existing problems and the questions my study try to answer is one component, the
other part is searching a solution. Chapter 4 is case study, applied the methodology
and model instantiation. Through the scientific evident and result analysis to support
the thoughts I come up, then draw a conclusion of this study. Chapter 5 is summary
and suggestions, it concludes the deficiency and usefulness of this paper, and put
forward an outlook for further research.
Based on the outline above, the layout of the technique route of my paper should be
presented. It illuminates the starting point and standing points of my paper. See in
Figure 1.
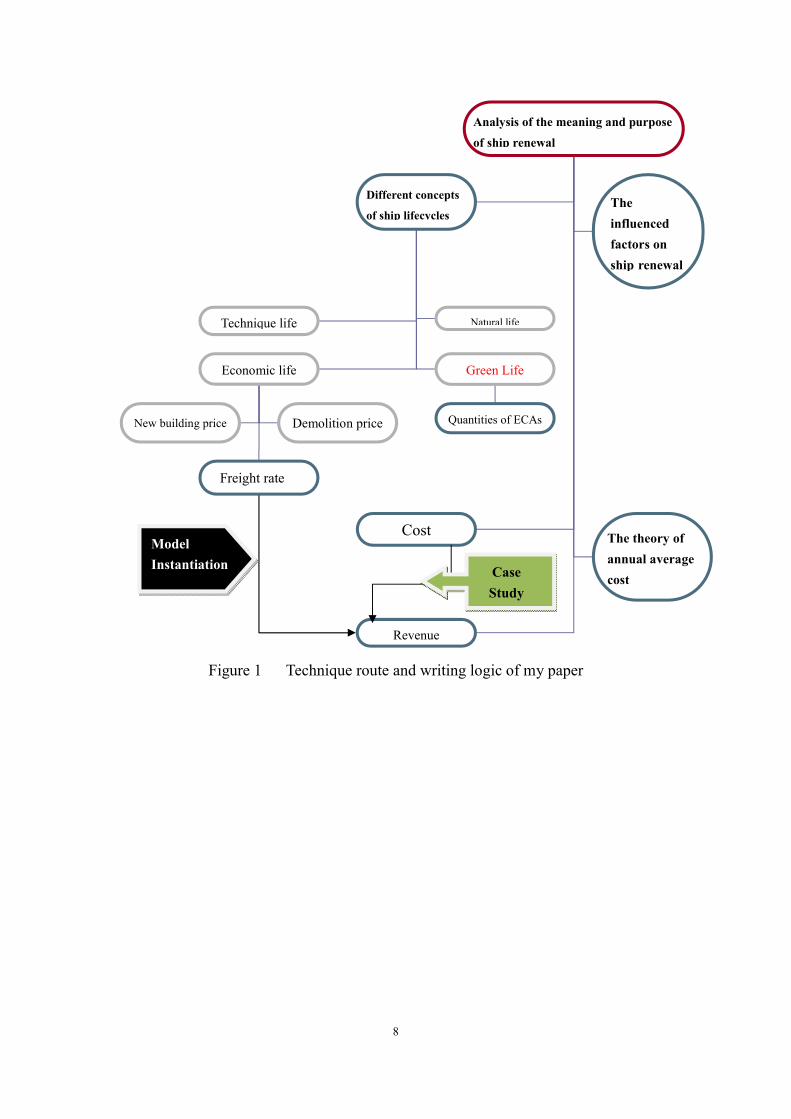
8
Figure 1 Technique route and writing logic of my paper
Analysis of the meaning and purpose
of ship renewal
Different concepts
of ship lifecycles The
influenced
factors on
ship renewal
Cost
Technique life Natural life
Economic life Green Life
Freight rate
Quantities of ECAs
Revenue
New building price Demolition price
The theory of
annual average
cost
Model
Instantiation Case
Study
9
Chapter 2 Literature Review
2.1 Previous research on ship renewal
Ship renewal is one of the important part of ship management, the authoritative
researches on this field in China are mainly lead by Professor Yang Siyuan, Hou
Yonghua and Xv Jianhua. They have made a great effort on the study of ship
management, and in terms of ship renewal, they used scientific methodology to
support the decision making on it, such as dynamic programming and mathematical
model. Their studies worth to be learned and applied, however, traditional studies
might not fit nowadays market context, therefore, new studies are needed.
Besides the economic analysis on ship renewal, there are also many studies are about
the maintenance of ship, mainly based on the life of technique or green life of ship. In
2011, the Doctor of Wuhan University of Technology, Wan Zhengtian has written a
paper about the research on evaluation system on the green level of ship renewal.
Through the model of Fuzzy-DEMATAL weighted the index to assess the green
degree during the ship renewal, putting forward a green idea to the ship owner. In
2009, in the article of Zhou Cunfeng, he has applied the LCA (life cycle assessment)
on the environmental impact of ship renewal, and draws a conclusion of its fitness and
usefulness. In Xiao Qing’s article (2003), the ship renewal decision-making economic
analysis is carried out in view of the present problem of lacking scientific ground for
economic rationality. The basic thoughts of ship renewal are put forward based on
economic life, operating benefit and shipping market, so as to provide a scientific and
reasonable analysis method and means in the shipping corporations. And in her
another essay (1999), with other professors---Lv Qing and Wen Chuang, they have
carried out a research on the decision support system of ship renewal. From their
study, we can see based on the experience and decision making technology, they have
put forward very useful and practical suggestion on the fleet renewal decision.

10
Recent year, the overseas studies on ship renewal which can relate to in 2016, several
Norwegian professors---Ove Mørch, Kjetil Fagerholt, Giovanni Pantuso and Jørgen
Rakke introduce a model for the renewal of shipping capacity which maximizes the
Average Internal Rate of Return (AIRR). Maximizing the AIRR sets stricter return
requirements on money expenditures than classic profit maximization models and
may describe more closely shipping investors ׳ preferences. Decisions regarding
investments in capacity expansion/renewal require taking into account both the
operating fitness and the financial performance of the investment. In Øyvind S.
Patricksson, Kjetil Fagerholt, Jørgen G. Rakke’s article (2015), we can see that the
authors come up a solution of fleet renewal when the problem of regional emission
limitation occurs. In 2015, two American scholars have studied the problem of bulk
ship fleet renewal and deployment under uncertainties by means of multi-stage
stochastic programming approach. Faced with simultaneous demand and charter cost
uncertainty, an industrial shipping company must determine a suitable fleet size, mix,
and deployment strategy to satisfy demand. Therefore, the study is introduced, and the
computational results indicate that this approach outperforms traditional methods
relying on expected value forecasts.
In order to analyze the issue of ship renewal, the research on lifecycle of ship cannot
be ignored. The study of ship lifecycle and emission control is carried out by Eduardo
Blanco-Davis and Peilin Zhou(2015), the purpose of this paper is to document that
LCA (Life Cycle Assessment), aside from showing indication of compliance to both
current IMO regulatory metrics (i.e. EEDI and EEOI) –not only as a practical
environmental indicator, but also as a tool able to highlight energy efficiency–, can
also be used in parallel to these, serving as a complementary utility able to assist with
their practical implementation. Results show that aside from the environmental score
of CO2 emissions per unit of work –recognised by the current regulatory metrics–,
LCA can also offer NOx and SOx scores, along with other hazardous releases.
Moreover, LCA –aside from showing compliance to the formulation of both IMO
regulatory metrics– is able to present material and energy utilization throughout
11
different stages within the vessel's lifetime.
2.2 Previous research on the theory of methodology
Ship is a fixed asset in shipping industry; therefore, the calculation on when to renew
the ship is similar as when to renew a fixture. So the theory we used in ship renewal
are mainly borrowed from equipment renewal or fixed asset renewal. Mainly, these
theories and methods are from engineering economic. One of the most popular books
of engineering economic is written by William. G.Sullivan, it is the official textbook
in many well-known university, like MIT, Tsinghua University and Harvard.
Equipment renewal is one element in the subject, and the book teaches us how to
calculate the time to renew equipment step by step.
In Liu Hai’s study (2006), he has analyzed the application of annual average cost on
the equipment updating. The efficiency of the theory used in equipment renewal has
been provided in this paper. Also the similar research on Kong Yanqing’s paper in
2006, he has carried out the research on decision-making model of equipment renewal,
which is based on Excel. The formulation of annual average cost has also been
applied in this study and it supports the effective decision on equipment updating.
This finding is very helpful and useful for my paper.
Except for the theory of annual average cost, there are also many other theories can be
used in equipment renewal. For example, in the 2005, Lu Ning has studied the
optimal decision-making model of equipment renewal. The purpose of this paper is
try to find the optimal timing to update the equipment and provide the best decision
on the solution of equipment renewal. In 2004, Zhang Xiaoming, Liu Wenyong and Li
Yongzhi have concluded the disadvantages and weakness of traditional theories of
equipment renewal and come up a theory of Life Cycle Cost (LCC). The theory has
provided a better predicted method and discussed the application in real market.
12
In abroad, the research of annual average cost is hard to find, maybe is because the
considerable factors in this formula is not comprehensive. I can only find some paper
relate to the cost efficiency analysis on ship management. Such as in the paper of M.
Wen, D. Pacino, C.A. Kontovas and H.N. Psaraftis(2017) , the purpose of this paper is
to investigate a multiple ship routing and speed optimization problem under time, cost
and environmental objectives. A branch and price algorithm as well as a constraint
programming model are developed that consider (a) fuel consumption as a function of
payload, (b) fuel price as an explicit input, (c) freight rate as an input, and (d)
in-transit cargo inventory costs. The alternative objective functions are minimum total
trip duration, minimum total cost and minimum emissions.
Several western professors, Osama Al Enezy, Edwin van Hassel, Christa Sys and
Thierry Vanelslander, they have developed a cost calculation modal for inland
waterway based on the western European market. This paper can inspire us a lot,
because the issue of economic crisis and overcapacity exists in every shipping market.
In this competitive environment, it is crucial for ship owners to have accurate
information on the cost of their service in order to avoid setting freight rates at
non-profitable levels. The aim of the paper is to develop a new cost calculation model
by vessel type, taking into account internal fixed and variable out-of-pocket costs,
from the ship owner's perspective, as well as external cost elements of inland
waterway transport. Subsequently, the methodology behind the input parameters, the
model computations, and the output is discussed and supported with a case study.
13
Chapter 3 Approach initiative and influential factors identification
From the above chapters, I have introduced different types of vessels’ lifetime and
past researches about ship renewal. In this chapter, I have to pave the path to my final
result; the starting point of my paper is the economic life of vessel. In this chapter, the
first step is to introduce the methodology of calculation and to propose an approach to
apply. And next step is based on the approach to discuss the related influential factors.
3.1 Methodology Explanation
The problem of ship renewal is always exists and the timing to renew the ship can be
different under different contexts. Based on the past research and analysis, the time to
renew the ship is around 15-18 years generally, however, the result won’t fit today’s
market. The theory and the model has no problem actually, the issue lies in the change
of market, which leads to the change of the relatively factors in the formula.
Nowadays, there are many ships meet their renewal timing at around 10 years.
Recently, there is a 7-year-old containership has been scrapped. Of course, there are
many different factors make influence on it, but the phenomenon indicates that the
past result cannot be adopted in current market. And in order to meet the current trend
of shipping market, new approach is needed to be carried out.
Actually, there are many different methods to calculate the economic life of vessel,
here I will introduce Professor Fu (1999)’s research, which has discussed the
feasibility of several approaches and final he focused on AAC (Average Annual Cost)
methodology.
First I need to explain Professor Fu’s finding and result before I use his methodology.
As we known, the basic formula of AAC is
14
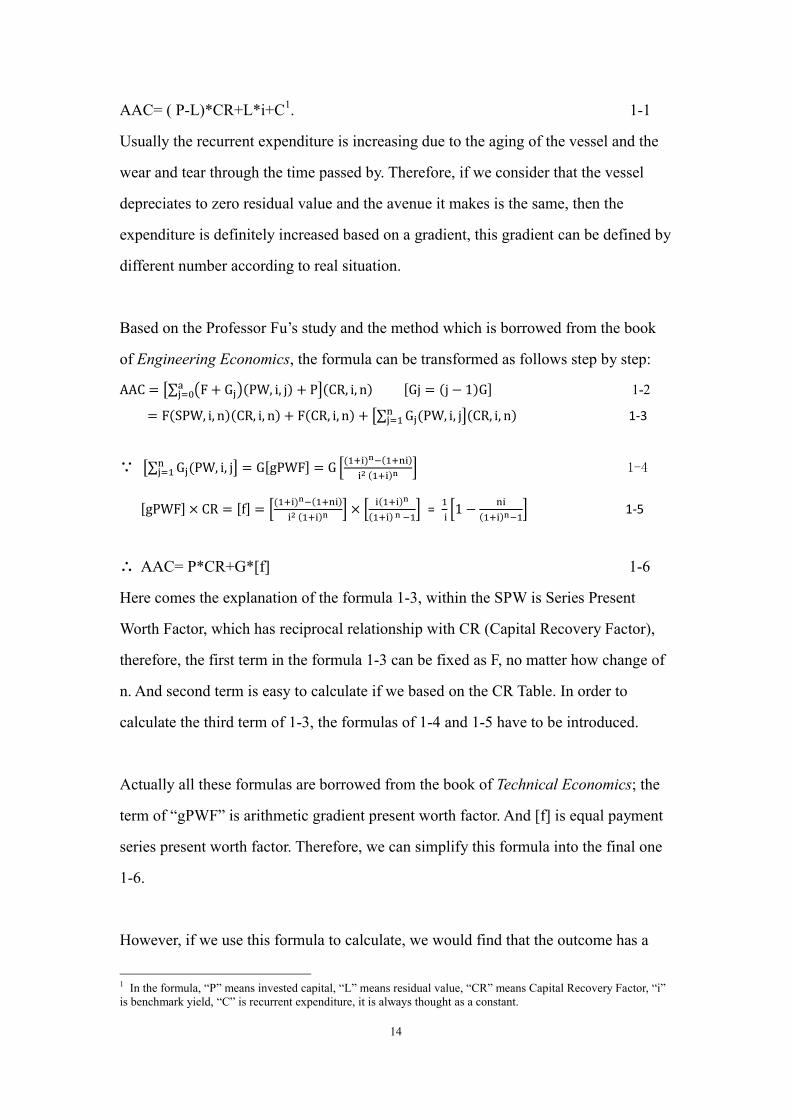
AAC= ( P-L)*CR+L*i+C1. 1-1
Usually the recurrent expenditure is increasing due to the aging of the vessel and the
wear and tear through the time passed by. Therefore, if we consider that the vessel
depreciates to zero residual value and the avenue it makes is the same, then the
expenditure is definitely increased based on a gradient, this gradient can be defined by
different number according to real situation.
Based on the Professor Fu’s study and the method which is borrowed from the book
of Engineering Economics, the formula can be transformed as follows step by step:
AAC = �∑ �F + G��(PW, i, j) + P���� �(CR, i, n) [Gj = (j − 1)G] 1-2
= F(SPW, i, n)(CR, i, n) + F(CR, i, n) + �∑ G�(PW, i, j���� �(CR, i, n) 1-3
∵ �∑ G�(PW, i, j���� � = G[gPWF] = G �
(���)��(����)
�� (���)� � 1-4
[gPWF] × CR = [f] = �(���)��(����)
�� (���)�� × �
�(���)�
(���) � ��� =
�
��1 −
��
(���)���� 1-5
∴ AAC= P*CR+G*[f] 1-6
Here comes the explanation of the formula 1-3, within the SPW is Series Present
Worth Factor, which has reciprocal relationship with CR (Capital Recovery Factor),
therefore, the first term in the formula 1-3 can be fixed as F, no matter how change of
n. And second term is easy to calculate if we based on the CR Table. In order to
calculate the third term of 1-3, the formulas of 1-4 and 1-5 have to be introduced.
Actually all these formulas are borrowed from the book of Technical Economics; the
term of “gPWF” is arithmetic gradient present worth factor. And [f] is equal payment
series present worth factor. Therefore, we can simplify this formula into the final one
1-6.
However, if we use this formula to calculate, we would find that the outcome has a
1 In the formula, “P” means invested capital, “L” means residual value, “CR” means Capital Recovery Factor, “i” is benchmark yield, “C” is recurrent expenditure, it is always thought as a constant.
15
correlation with the IRR (Internal Rate of Return), which is the “i” term in the
formulas. The higher IRR is, the longer renewal time comes. Actually it does make
sense, if the company lacks of foresight, the vessel would be put into the market until
it can’t make any money
The example in that book I won’t introduce in details, I have just emphasized the
outcome of this analysis. In Professor Fu’s research, he took oil tanker as an example,
through the calculation he found that the IRR should over than 20% if the vessel
would be used for over 30 years. However, the benchmark IRR of shipping industry is
around 10%. Through checking the final result table, if the IRR=10%, the vessel
economic life should be 20 years; if the IRR=8%, it should be 19 years. The law lies
in the change seems to be that every 2% decreases in IRR, 1 year less in the vessel
economic life. Based on the rules and regulation of Classification Society, the natural
lifetime of the type of oil tanker is 31. This is the difference between natural lifetime
and economic lifetime of vessels. If the concept of economic lifetime hasn’t been
introduced, maybe from many ship owners’ point of view, it is better to keep the
vessel in hand as long as possible, because it is the property belongs to them.
However, the mathematical model tells us sometimes give up the vessel instead of
owning it is a right way to save money.
In terms of how to define the timing to renew the vessel, the formula can be much
simpler if we assume that other factors can be compensated or offset. The formula I
use here is inspired from the book “Engineering Economy”, which is written by the
author Holger George Thuesen.
For example, the investment of a VLCC 315-320k DWT is $120 million in 2005, the
annual avenue is $8.5 m and the recurrent expenditure is $1.8m, the gradient is
supposed to be $0.8m. (Data sourced from Drewry and Clarkson). In order to define
the number of the gradient, we have to confirm that this number is consisted of the
increasing cost and loss in revenue in the next years. Because the precondition of this
16
methodology is that assumed the annual revenue remains the same. Under this context,
take the data of first year as a benchmark, and the change in the cost and revenue are
the components of the number of gradient. However, the factors that can influence the
cost and revenue is quite a lot and various, different shipping companies would meet
different situations, therefore, for different cases the defined value of the gradient is
different. Incomplete summary that the influential factors of the cost can be change of
the bunker price, the maintenance fee, the wages and welfare and so on; and as for the
influential factor of revenue is mainly about the change of freight rate, which is the
moat directly factor.
Nevertheless, in my paper, in the approach I introduce and I would focus on another
change that would make an influence on the cost, which is the increasing number of
ECAs. This factor would lead to the higher fuel cost; due to the price of low sulphur
oil is approximately 35% higher than heavy fuel oil. In terms of the revenue, I have
just taken the market report as references. Therefore, based on these two main
considerations and the data from Clarkson, I come up with the gradient of 0.8m in this
case.
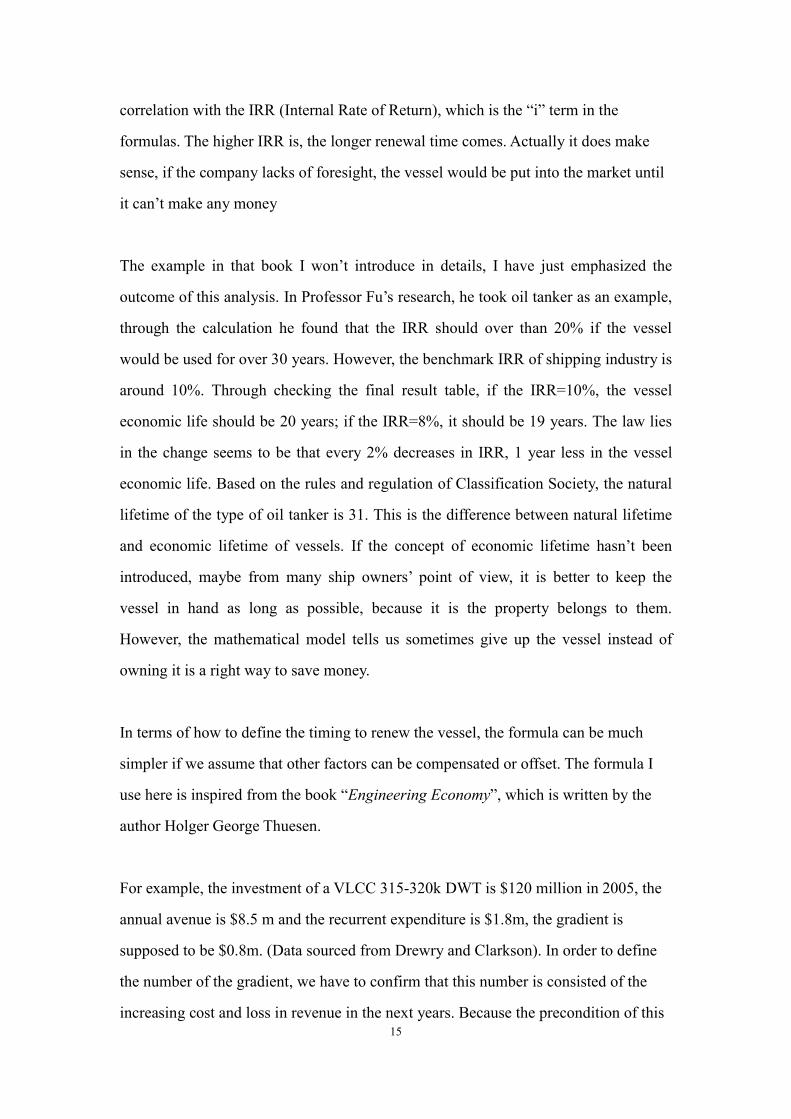
We assume X is the average annual cost, the investment of the vessel is P, and current
expenditure is F, the gradient is G, if the vessel can be used for n years. Based on the
formula 1-5, 1-6, we should calculate like that:
And according to , the formula can be
Due to the second derivative test is positive, therefore we can draw the conclusion
that when n=N, X would be the minimum value.
Based on this calculation, the result indicates that in the 17th year, the VLCC needs to
17
be updated in order to increase revenue or reduce OPEX, if it stays still, the cost will
go up and it is not what ship owner wants. Since we have known the result of
mathematical model, the real market situation also has to be taken into discussion.
Based on the 2015 annual report of Drewry, the average scrapping age of VLCC is 15
years, that is to say, the situation is much worse than we estimated. The result we
calculate is closed to the reality but it is still not reflected the real market. The reason
why that happened might because the influential factors I considered are limited,
otherwise the gradient should be different. Anyway, the formula still makes sense, and
it need to be discussed further. Moreover, the truth of average scrapping age is 15
highlights that the solution of ship renewal is no longer to update it due to the
overcapacity in the shipping market; the common ending for those vessels who meet
its renewal timing is to be sold or scrapped.
From the example, we extract the formula to put into the next study, which is N=���
� .
In the following study, to define the number of P and G is the key to figure out the
economic life and the renewal timing of vessels. Since we know what the theory tells
us, then we should back to the reality to explain the theory, the below information
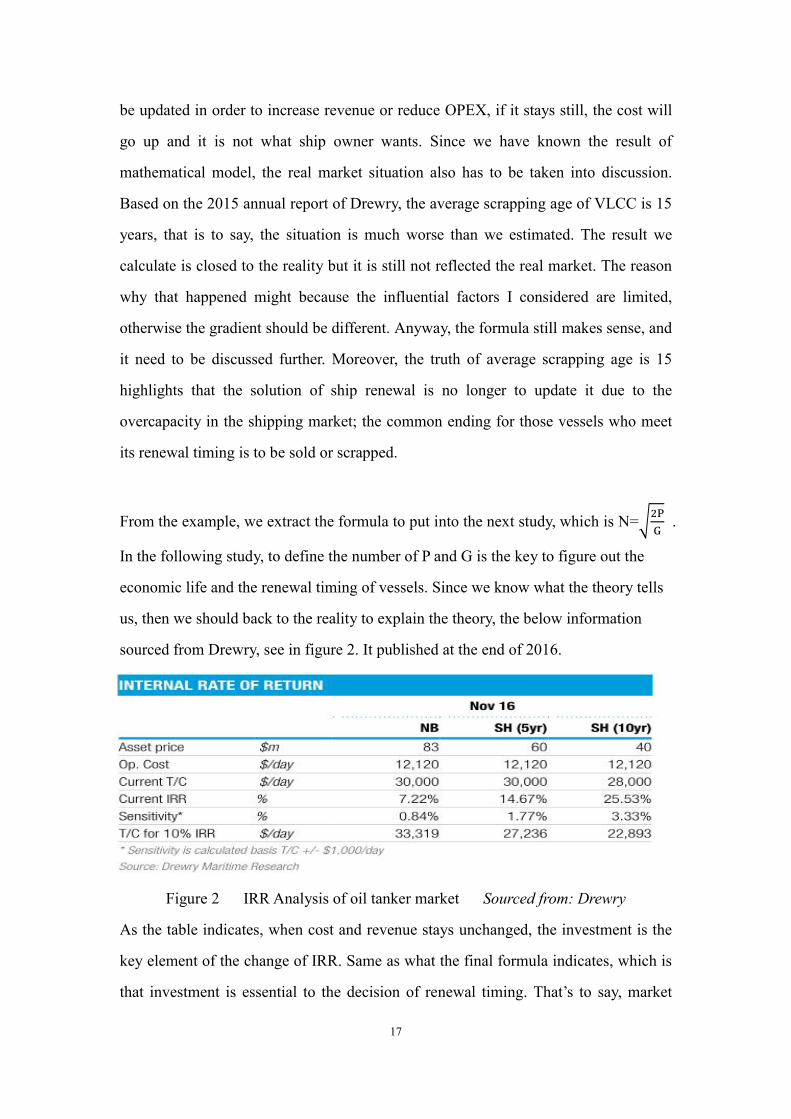
sourced from Drewry, see in figure 2. It published at the end of 2016.
Figure 2 IRR Analysis of oil tanker market Sourced from: Drewry
As the table indicates, when cost and revenue stays unchanged, the investment is the
key element of the change of IRR. Same as what the final formula indicates, which is
that investment is essential to the decision of renewal timing. That’s to say, market
18
factor contributes a lot on the influence of ship renewal, including the freight rate,
newbuilding price and secondhand price.
Except for the initial investment, the number of gradient in the formula is also needed
to be explained in details here. The gradient simply we can seem as the annual
increased quantity on the total cost of managing the vessel. However, the precondition
of the assumption should be paid attention; we supposed that the revenue remains the
same, in this case, the decrease on revenue should be added on the gradient. That’s
why the calculation of this methodology differs from on the above table, which is
soured from Drewry. In some analysis, the cost keeps the same, it is just for
simplifying the calculation and if there are too many uncertainties in a model, the
stability would be the problem. Therefore, the standing point is the same of my
analysis, in order to avoid complexity and instability, the formula is simplified to have
only two crucial elements in the discussion under the reasonable and scientific
approach. In the following chapters, I would relate these two elements to the factors in
the real market.
3.2 Issue Identification
The problem considered in this paper is a ship renewal problem with emission
limitations and market change, where a set of renewal decisions are made based on
ship characteristics (age, efficiency, etc.), cost aspects (fuel, chartering, upgrading etc),
and an underlying deployment problem. The emission limitations are characterized by
stricter emission regulations in special areas, so-called ECAs. The deployment
decisions will be affected, and the emission characteristics of the vessels will play an
important role, which ultimately might affect the vessel renewal decisions. To handle
this new aspect, I divided the vessels into three types: those that cannot enter an ECA
(non-compliant vessels), those that switch to low sulphur fuel when entering an ECA
(fuel-switch vessels) and those that have an exhaust gas scrubber installed and can
continue operations as usual (scrubber vessels). With the development of technology,
19
and to revitalize the ship building industry, the environment-friendly vessels---so
called “Green ships” are gradually prevailing in the market. In this case, the price of
the vessel is higher while the increasing ECAs are not a problem for such vessels. It
could be understood as the initial investment on the vessel is increased, while the cost
of the vessel is less than others. As for the rest types, the capital invests into the vessel
is less while the cost is definitely increased. Or those vessels might encounter the
unpopularity in market since the green ships have begun to attach the attention of the
community.
The vessel specific costs considered are divided in a fixed time charter cost (TC cost)
and variable piling costs. The TC cost is the annual cost of having the vessel with
crew available to the ship and is also covering costs capital costs, insurance and
scheduled maintenance. (Cariou and Wolff, 2013) In the following case study, these
costs would be introduced into calculation.
For the maritime sector, the renew problem is particularly important, due to the long
life expectancy of ships, large investment costs, and considerable uncertainty in
demand, freight rate and operational costs. In addition to these factors, environmental
changes, the natural ageing of vessels, new regulations, and the development of new
and more efficient technologies force market players to have their vessels up to date.
In particular, decisions related to replacement (which to replace, replace with what,
and when) and upgrading (which vessels should be upgraded, what upgrade is
favorable, etc.) are fundamental. Ship renewal is the basis of meeting the
requirements of new market.
From above analysis, we figure out that capital investment and cost is related to the
economic life and renewal timing of ship. And these two factors are perfectly matched
my topic of my paper, capital investment is about the vessel price which is related to
market, and no one can deny that cost is closely related to the change of the market
situation. As for environment factor, thanks to the control of emission and protection
20
of maritime environment, there are more and more ECAs establish, in order to pass
those areas and reduce the sulphur emission, the vessel should adopt LSCO (Light
Sweet Crude Oil) or install exhaust gas scrubber, both methods indicates the cost
would increase. Maybe the topic seems to be big, but in the next discussion, I have
tried to narrow the scope in order to highlight the theme of my paper. Actually, the
starting point of my paper is change of vessel price (including newbuilding price and
secondhand price) and the increased cost due to higher low surlphur fuel price or
updating fee. Based on these ideas to discussed to the problem of ship renewal, when
to renew the vessel and how to deal with it.
3.2.1 Influential factors related to market
Actually, the concept of market is quite wide. Except for the small points I pointed out
in former chapter. There are a lot of elements consist of market. First, as for the
market factor, there are several different shipping sectors exist, and based on different
classifications, the sectors are different. For instance, according to the lifecycle of
vessel, there are four different markets---freight market, S&P market, new building
market and demolition market. And in freight market, there are dry bulk, container
and tanker. In my paper, in terms of market factor, I discuss about the first groups of
markets, but frankly speaking, those two division is not totally separated, the case we
used in next chapter is about dry bulk market. That’s to say, it is impossible to clearly
or definitely draw a line between different markets, they closely related and there is a
mutual effect lies in their interactions.
Global dry bulk shipping market is an important element of global economy and trade.
Since newbuilding and secondhand vessels are often traded as assets and the freight
rate is the key determinant of vessel price, it is important for shipping market
participants to understand the market dynamics and price transmission mechanism
and decide the time to renew the vessel or scrap it over time to make suitable strategic
decision.
21
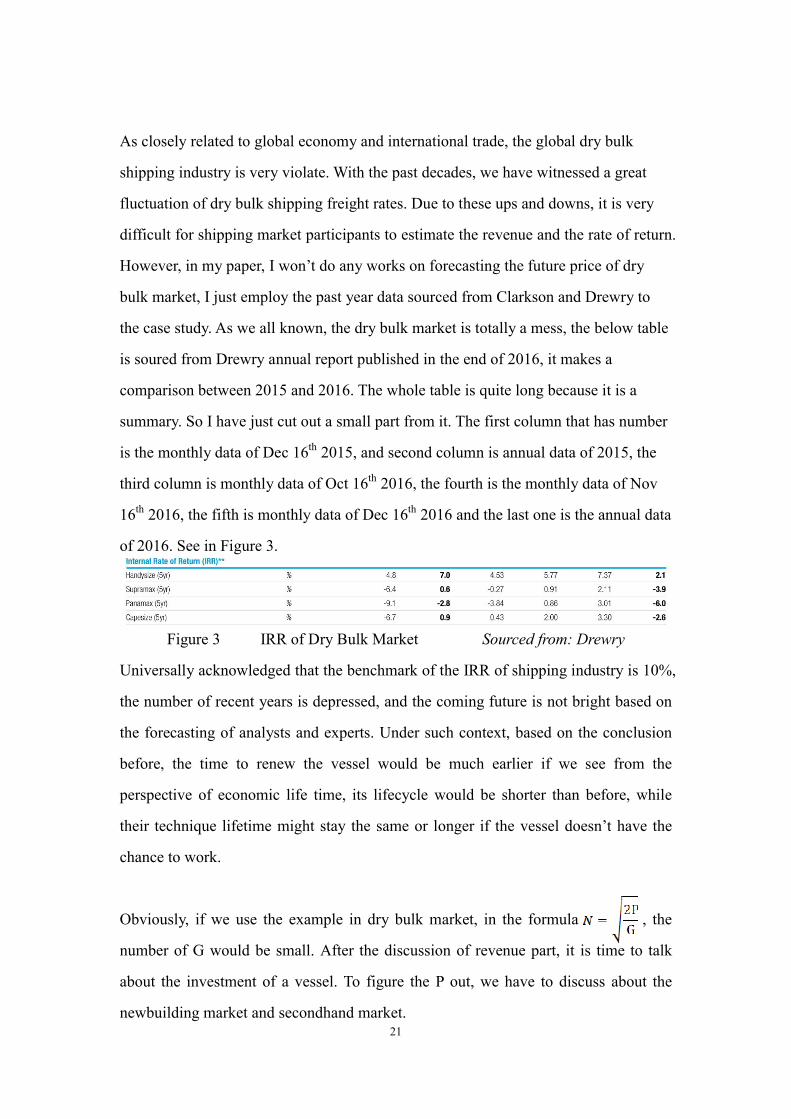
As closely related to global economy and international trade, the global dry bulk
shipping industry is very violate. With the past decades, we have witnessed a great
fluctuation of dry bulk shipping freight rates. Due to these ups and downs, it is very
difficult for shipping market participants to estimate the revenue and the rate of return.
However, in my paper, I won’t do any works on forecasting the future price of dry
bulk market, I just employ the past year data sourced from Clarkson and Drewry to
the case study. As we all known, the dry bulk market is totally a mess, the below table
is soured from Drewry annual report published in the end of 2016, it makes a
comparison between 2015 and 2016. The whole table is quite long because it is a
summary. So I have just cut out a small part from it. The first column that has number
is the monthly data of Dec 16th 2015, and second column is annual data of 2015, the
third column is monthly data of Oct 16th 2016, the fourth is the monthly data of Nov
16th 2016, the fifth is monthly data of Dec 16th 2016 and the last one is the annual data
of 2016. See in Figure 3.
Figure 3 IRR of Dry Bulk Market Sourced from: Drewry
Universally acknowledged that the benchmark of the IRR of shipping industry is 10%,
the number of recent years is depressed, and the coming future is not bright based on
the forecasting of analysts and experts. Under such context, based on the conclusion
before, the time to renew the vessel would be much earlier if we see from the
perspective of economic life time, its lifecycle would be shorter than before, while
their technique lifetime might stay the same or longer if the vessel doesn’t have the
chance to work.
Obviously, if we use the example in dry bulk market, in the formula , the
number of G would be small. After the discussion of revenue part, it is time to talk
about the investment of a vessel. To figure the P out, we have to discuss about the
newbuilding market and secondhand market.
22
Shipping investment for newbuildings is mainly categorized into replacement
expansionary and new entrance investment. Replacement shipping investment
involves the allocation of capital for the purposes of replacing vessels that are no
longer capable of fulfilling the company's requirements and are, therefore, available
for demolition. Major reasons for replacement realized through the newbuilding
market include technical obsolescence, market conditions, international regulations,
and company policy. Next expansionary shipping investment constitutes capital outlay
for materializing the growth strategy of shipping companies in response to prevailing
or expected market conditions that are usually accompanied by availability of ship
finance sources. Lastly, new entrance shipping investment involves the injection of
capital into newbuilding acquisitions by newcomers to the industry. The decision to
expand fleet capacity is mainly linked to freight market conditions (Engelen et al.,
2006; Adland and Strandenes, 2007; Stopford, 2009; Greenwood and Hanson, 2015
among others) as companies expand to maintain or increase their market share.
Secondhand prices and their relation to newbuilding prices (Merikas et al.,2008;
Stopford. 2009) also constitute a major influence in the decision to order new vessels
due to construction lags (Kalouptsidi, 2014), as shipping investors may demand
immediate delivery of vessels when freight rates are at high levels. On the other hand,
scrapping a vessel is a major decision that irreversibly disposes a capital-intensive
asset, while certain vessel features-age, technical obsolescence and condition-,
international regulations and the market state will influence the likelihood of a vessel
being sent for demolition. Generally, for older and poor condition vessels,
employment potential and scope for capital appreciation are limited, thus, leading to
higher scrapping levels. In addition to vessel age and deteriorating condition technical
obsolescence is also likely to result in reduced running cost efficiency, greater
maintenance and crew costs, and higher insurance premium; therefore, drive vessels
to the scrap yard. Furthermore, vessel retirement taking place due to regulatory
changes is a compulsory decision. In terms of market state, if freight conditions are
such that it is not economically feasible to operate vessels, then shipping investors are
23
faced with the decision to continue operations at a loss, lay-up or scrap the vessel.
Operating at a loss and lay-up are reversible options with expectations as to future
profitability playing an important role. In contrast, scrapping is an irreversible
decision that shipping investors have traditionally preferred to avoid, even during
severe oversupply conditions when outstanding debt obligations and equity base
depletion are further obstacles. The decisions to scrap vessels are linked to the
prevailing freight, secondhand and scrap market conditions. Buxton (1991) argues
that there is little economic sense in operating a vessel or selling her in the
sale-and-purchase market when both markets have deteriorated significantly. Knapp et
al. (2008) confirm the hypothesis of an inverse relation between vessel earnings and
the probability of a ship being scrapped, establish a positive relation between scrap
prices and scrapping probability, and find no significant relation between flag,
ownership or safety factors and scrapping.
Recently, Alizadeh et al. (2016) examine the capacity retirement in the dry bulk
market by employing a combination of vessel specific and market variables. The
study confirms the previously established negative association between earnings and
scrapping, and the fact that higher scrap prices lead to elevated scrapping activity
while the probability of scrapping increases with age, interest rates, and freight
volatility. Finally, market expectations are crucial in shipping investment or
divestment decisions under freight income uncertainty (Stopford, 2009) and the
application of real options theory provides shipping companies with valuable
flexibility in the decision making process (Dixit and Pindyck 1994; Dikos, 2008;
Gkochari, 2015; Kyriakou et al., 2017).
Shipping is one of the few industries having a separate and active market where the
main assets themselves (ships) are traded. The price of a ship, like that of every other
capital asset, depends on the ship’s expected future profitability or, in other words, on
the investor’s expectations regarding future developments in the markets he operates.
Prices, particularly those of secondhand ships, thus correlate strongly with freight
24
rates and, together with them, fluctuate widely. The timing of the investment is
therefore the single most important factor of business success. Volatility in
secondhand ship prices coupled with long delivery times of new ships gives rise to
considerable speculation (asset play). The yearly volume of secondhand ships
changing hands is indeed significant. Transactions in secondhand ships play an
important economic role in the shipping industry: They give ship owners and other
investors the opportunity to buy and sell ships directly, thus allowing easy entry and
exit to the freight market. This is a major condition for market competitiveness.
Instances of low freight rates usually coincide with low vessel values but, despite the
fact that this is bad news for owners of existing tonnage, it provides opportunities for
new investors to buy in at a low cost.
Shipbuilding too is a market whose variables (demand, supply and prices) are subject
to distinct cyclical fluctuations. Such volatility has repeatedly led to collapses in
newbuilding prices, as well as to disturbances in production, and, consequently, to
severe financial problems, even bankruptcy, for shipyards and ship owners. In
addition to market expectations, the price of new ships depends on shipbuilding costs
and shipyard capacity. New and secondhand ship prices also correlate among
themselves. Some would even argue that new and old ships are substitute
commodities: the first more technologically advanced, but also more expensive to
acquire and with long delivery times, the second usually cheaper and in immediate
delivery. In the face of a burgeoning demand and tight shipyard capacity, secondhand
ships would thus sell at a premium. On the contrary, in a depressed and over-supplied
market, secondhand ship prices would tend to converge to the ships’ scrap values
while newbuilding prices could still keep close to shipbuilding costs. All these
information we can learn from text book and past experience.
However, vessel ordering and scrapping activity is a strategic decision that, among
other factors. May be the outcome of ship owners revising their own market outlook
upon observing the actions of others, i. e., there is a degree of herd behavior involved.
25
Herd behavior is generally used to describe trading decisions that are based on the
collective actions in a market rather than personal beliefs and information (Hwang
and Salmon, 2004). This trading behavior can lead a group of investors to move in the
same direction and, as a consequence, herding can cause asset prices to deviate from
their fundamental values (Bikhchandani et al., 1992: Nofsinger and Sias, 1999).
Therefore, examining herd behavior may provide an understanding of its influence on
asset values (Chang et al., 2000). For example, investors might be interested in the
existence of herding, as reliance on common rather than private information may
cause assets to deviate from the fundamental values and present profitable
opportunities. Herding has also attracted the attention of academics because the
associated behavioral effects on asset price movements may affect their risk-return
characteristics and, therefore, can have implications for asset pricing models. In
addition, according to Scharfstein and Stein (1990), classical economic theory
suggests that investment decisions reflect the rationally formed expectations of agents,
i. e., decisions made utilizing all the available information in an efficient manner; in
contrast, investment may also be driven by group psychology (herd behavior), which
weakens the link between information and market outcomes. Our aim is to provide an
understanding of some of the forces that may lead to herd behavior in the shipping
markets. Existing literature on investigating herd behavior is mainly concentrated on
herding between institutional or retail investors (e. g. Lakonishok et al., 1992; Sias
2004; Kumar and Lee, 2006) or herding towards the market consensus (e. g., Christie
and Huang, 1995 ; Chang et al., 2000).
All in all, there are many complex factors influence the shipping market, including
subjective and objective things; visible and invisible things and so on. Similar
researches are quite a lot, my paper would not waste space to discuss these things
again. Based on the formula we used, in order to extend the vessel’s economic
lifetime, the initial investment on vessel is better to be less and the increasing cost
should be less as well as. Nevertheless, it is never easy to balance these two factors, to
find the best timing to invest into shipping market depends on knowledge, experience
26
and fortune.
3.2.2 Influential factor of the numbers of ECAs
A potentially important aspect of current ship renewal problem is regional emission
limitations, particularly indicates the increase of ECAs. Before this problem is not
attached much importance, with the improvement on related regulation or laws, the
complexity is increased mainly in that the deployment decisions will have to take into
account whether a vessel is ECA compliant not. Furthermore, if it is compliant the
cost of sailing inside an ECA will depend on type of compliance. This means that the
fuel cost which is by far the largest variable sailing cost for deep sea vessels
(AECOM. 2012), while currently there are more variables impact on this factor, such
as where a vessel sails (inside or outside an ECA), its emission characteristics, and
fuel type compatibility, in addition to fuel consumption and fuel price. Moreover,
since the cost and benefits related to emission reduction technology is strongly
correlated to the fuel price, the relative price difference of low sulphur fuel (e. g
marine gas oil (MGO)) and HFO will be of great importance.
In 2006, the first emission control area (ECA) was implemented in the Baltic Sea,
enforcing a strict limit on Sox emissions from ships in this region (International
Maritime Organization (IMO), 2014a). Since then, more regions have been added to
the list of ECAs, such as the North Sea and English Channel, and the North American
and US Caribbean coast. In 2012, the global limit was reduced from 4.5% to 3.5%
corresponding to emission levels resulting from regular combustion of fuel with a
sulphur content of respectively 4.5% and 3.5%. As illustrated in Fig.1, both the global
limit and the ECA limit will be even stricter in the future (IMO, 2014b). The largest
immediate concern is the reduction being effective from 1 January 2015, when the
maximum level of sulphur content in the fuel within ECAs was reduced from 1%
(current limit) to 0.1%. Frankly speaking, it would be a big challenge for many
shipping companies. The trend of numbers of ECAs and the change on the globally
27
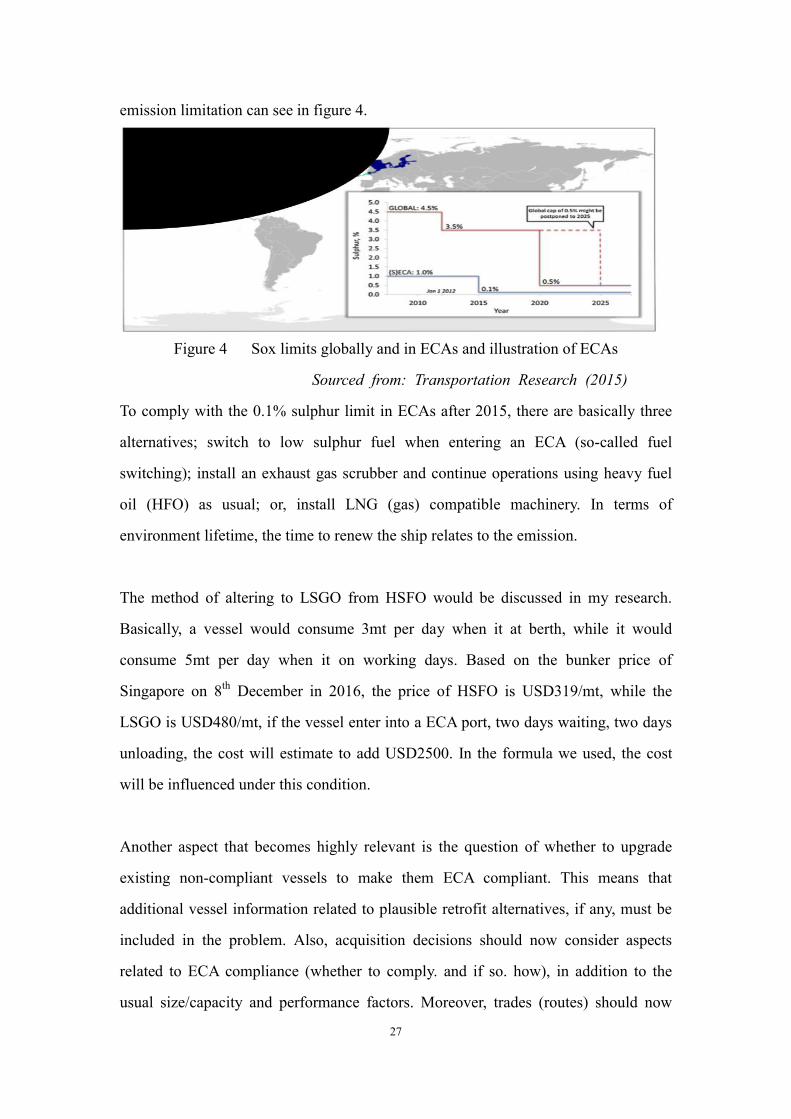
emission limitation can see in figure 4.
Figure 4 Sox limits globally and in ECAs and illustration of ECAs
Sourced from: Transportation Research (2015)
To comply with the 0.1% sulphur limit in ECAs after 2015, there are basically three
alternatives; switch to low sulphur fuel when entering an ECA (so-called fuel
switching); install an exhaust gas scrubber and continue operations using heavy fuel
oil (HFO) as usual; or, install LNG (gas) compatible machinery. In terms of
environment lifetime, the time to renew the ship relates to the emission.
The method of altering to LSGO from HSFO would be discussed in my research.
Basically, a vessel would consume 3mt per day when it at berth, while it would
consume 5mt per day when it on working days. Based on the bunker price of
Singapore on 8th December in 2016, the price of HSFO is USD319/mt, while the
LSGO is USD480/mt, if the vessel enter into a ECA port, two days waiting, two days
unloading, the cost will estimate to add USD2500. In the formula we used, the cost
will be influenced under this condition.
Another aspect that becomes highly relevant is the question of whether to upgrade
existing non-compliant vessels to make them ECA compliant. This means that
additional vessel information related to plausible retrofit alternatives, if any, must be
included in the problem. Also, acquisition decisions should now consider aspects
related to ECA compliance (whether to comply. and if so. how), in addition to the
usual size/capacity and performance factors. Moreover, trades (routes) should now
28
also include information regarding share of ECAs and the emission limits for the
various emissions in question. As the emission regulations will be varying with time,
the information about the emission limits should be time dependent.
Related to the various alternatives for coping with the stricter ECA limitations, some
are more relevant than others. For deep sea vessels using LNG is currently not
considered an alternative, as there still are many challenges to be solved. Fuel
availability and storage capacity are examples of such challenges. The fuel-switch
alternative requires only minor changes to the machinery, but can be expensive in the
long run, as the MGO price currently is considerably higher than the HFO price.
Moreover, due to an assumption of an increased demand for low sulphur fuels when
the new ECA regulations are introduced in 2025. It is assumed that the price
difference between HFO and MGO will be even larger in the future, increasing the
cost of the fuel-switch alternative even more (Mellenbach et. al., 2012). The perhaps
most interesting alternative is to install an exhaust gas scrubber system. This comes
with a considerable initial cost, increasing the construction cost for a new build, or, if
retrofitted, both a direct investment cost and indirect off-hire costs must be expected.
In addition, the system consumes some power, so an increase in fuel consumption
should also be taken into account. The (potentially large) upside of having an exhaust
gas scrubber installed is that the SOx emissions from running on HFO are reduced,
and the vessel is able to use HFO also inside ECAs.
Knowing that the two relevant alternatives for sailing in ECAs arc fuel-switching and
exhaust gas scrubber, where the former has a low investment cost but is dependent on
(traditionally) expensive low sulphur fuel (relative to HFO). While the latter has a
much higher investment cost today bur can run on the (today) cheaper HFO. It is
evident that future fuel is essential in the decision of ship renewal. The change of fuel
price is closely related to cost of managing the vessel.
Except for the influence on the fuel cost, along with the increasing number of ECAs,

29
the awareness to build up environmental-friendly vessels is more and more popular.
As I mentioned in Chapter 1, the acceptance of the concept of “green ships” is in
rising momentum, with the development in the new generation of vessels, it would
also accelerate the upgrading and renewal time of old vessels. This factor can be taken
into consideration in this discussion. However, so far it is hard to quantization this
factor, how much it contributes to increasing cost or decreasing revenue is not easily
measured in exact numbers. Therefore, in the following case, this factor wouldn’t be
pointed out again.
30
Chapter 4 Case Study
In order to test the analysis above, it is better to use a real example to test the
conclusion. Due to the information related to the business secrets of the company, so
some details would be concealed. Here is the introduction of the case, the RM
Company is located in Xiamen, and in 2004, and the company decides to invest to
establish a new vessel for expanding business used. They planned to build a vessel of
15,000 dead weight ton that for dual purposes of dry bulk and container shipping. The
route of this vessel is domestic coastal area. The total investment of this vessel is 67.5
million; including fixed cost is 65.25 m2 (mainly indicates the building materials) and
the working capital (cash flow) 2.25m. Thanks to the growing shipping market at that
time, there is a great demand on shipping dry bulk, for example, slat and sand.
Especially, the RM Company has a long-term cooperation relationship with a NH
logistic company. Therefore, under such bright future, RM Company decides to
purchase the new vessel. And following analysis is based on this company and the
new vessel they buy, by means of the methodology and formula I mentioned before to
figure out the economic life of this vessel and the best time for the RM Company to
deal with it.
4.1 Model instantiation
Under this context, I would use the formula that I extracted before; by using the real
data to help this company to figure out the renewal time of this vessel. The data of
real case would be different from the overall market situation that has been described
in the report. However, besides from the above real market analysis, this case would
provide evidence for the usefulness of this formula. The details of this case are as
following.
The company can put 34m into this project and rest of 33.5m is borrowed from the 2 The money in this case is all calculate in RMB.
31
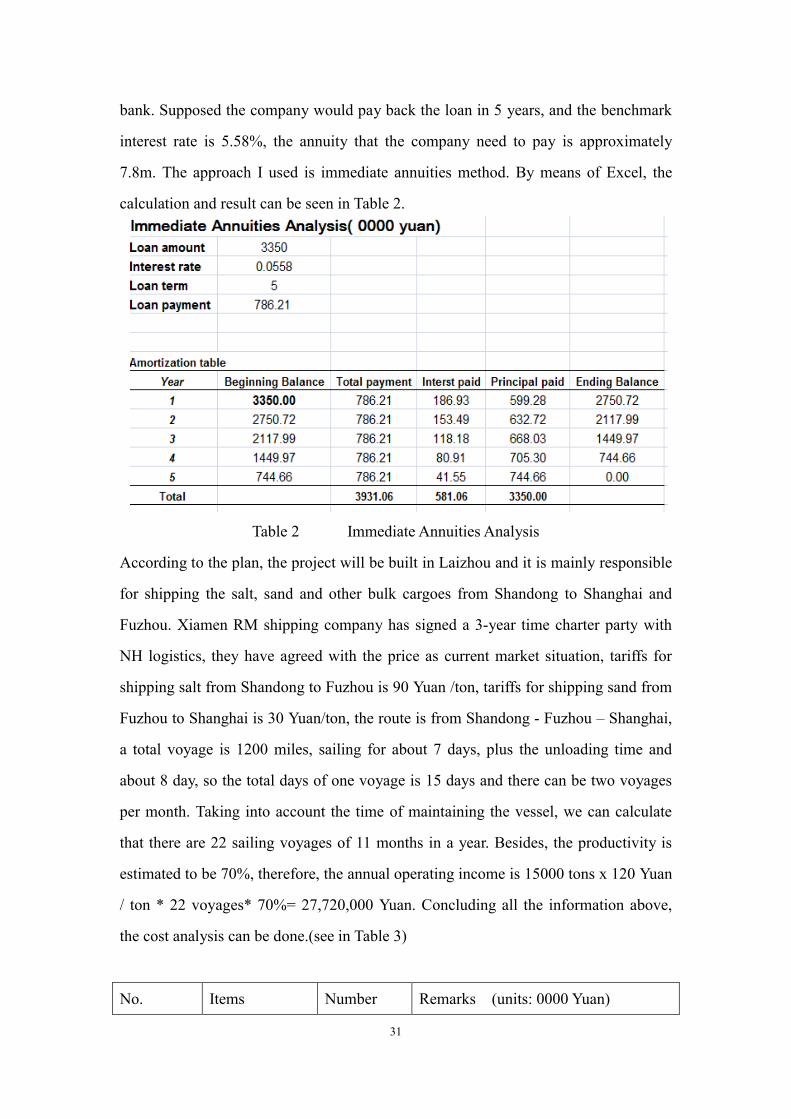
bank. Supposed the company would pay back the loan in 5 years, and the benchmark
interest rate is 5.58%, the annuity that the company need to pay is approximately
7.8m. The approach I used is immediate annuities method. By means of Excel, the
calculation and result can be seen in Table 2.
Table 2 Immediate Annuities Analysis
According to the plan, the project will be built in Laizhou and it is mainly responsible
for shipping the salt, sand and other bulk cargoes from Shandong to Shanghai and
Fuzhou. Xiamen RM shipping company has signed a 3-year time charter party with
NH logistics, they have agreed with the price as current market situation, tariffs for
shipping salt from Shandong to Fuzhou is 90 Yuan /ton, tariffs for shipping sand from
Fuzhou to Shanghai is 30 Yuan/ton, the route is from Shandong - Fuzhou – Shanghai,
a total voyage is 1200 miles, sailing for about 7 days, plus the unloading time and
about 8 day, so the total days of one voyage is 15 days and there can be two voyages
per month. Taking into account the time of maintaining the vessel, we can calculate
that there are 22 sailing voyages of 11 months in a year. Besides, the productivity is
estimated to be 70%, therefore, the annual operating income is 15000 tons x 120 Yuan
/ ton * 22 voyages* 70%= 27,720,000 Yuan. Concluding all the information above,
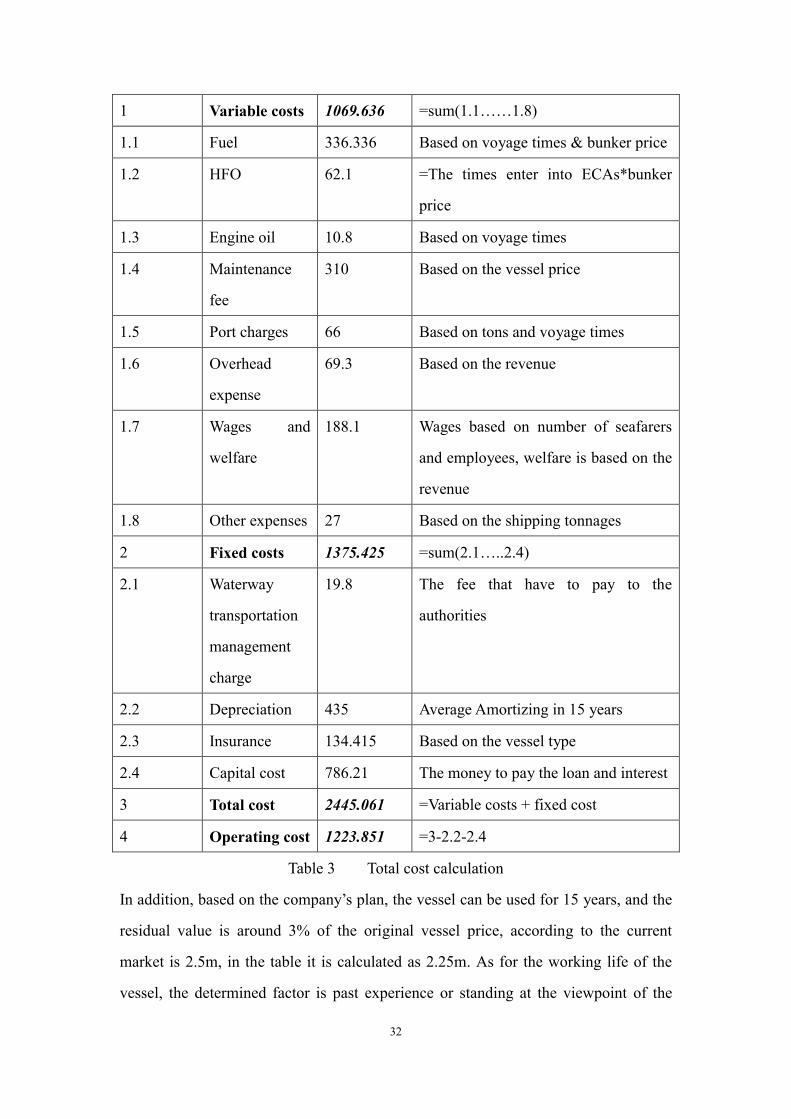
the cost analysis can be done.(see in Table 3)
No. Items Number Remarks (units: 0000 Yuan)
32
1 Variable costs 1069.636 =sum(1.1……1.8)
1.1 Fuel 336.336 Based on voyage times & bunker price
1.2 HFO 62.1 =The times enter into ECAs*bunker
price
1.3 Engine oil 10.8 Based on voyage times
1.4 Maintenance
fee
310 Based on the vessel price
1.5 Port charges 66 Based on tons and voyage times
1.6 Overhead
expense
69.3 Based on the revenue
1.7 Wages and
welfare
188.1 Wages based on number of seafarers
and employees, welfare is based on the
revenue
1.8 Other expenses 27 Based on the shipping tonnages
2 Fixed costs 1375.425 =sum(2.1…..2.4)
2.1 Waterway
transportation
management
charge
19.8 The fee that have to pay to the
authorities
2.2 Depreciation 435 Average Amortizing in 15 years
2.3 Insurance 134.415 Based on the vessel type
2.4 Capital cost 786.21 The money to pay the loan and interest
3 Total cost 2445.061 =Variable costs + fixed cost
4 Operating cost 1223.851 =3-2.2-2.4
Table 3 Total cost calculation
In addition, based on the company’s plan, the vessel can be used for 15 years, and the
residual value is around 3% of the original vessel price, according to the current
market is 2.5m, in the table it is calculated as 2.25m. As for the working life of the
vessel, the determined factor is past experience or standing at the viewpoint of the
33
concept of technical lifetime, however, from the economic lifetime point of view, the
decision might be different. As I emphasized before, the technical lifetime is focused
on the efficiency or productivity of the vessel, while the economic lifecycle is based
on the change of market.
4.1.1 Problem Solved Process
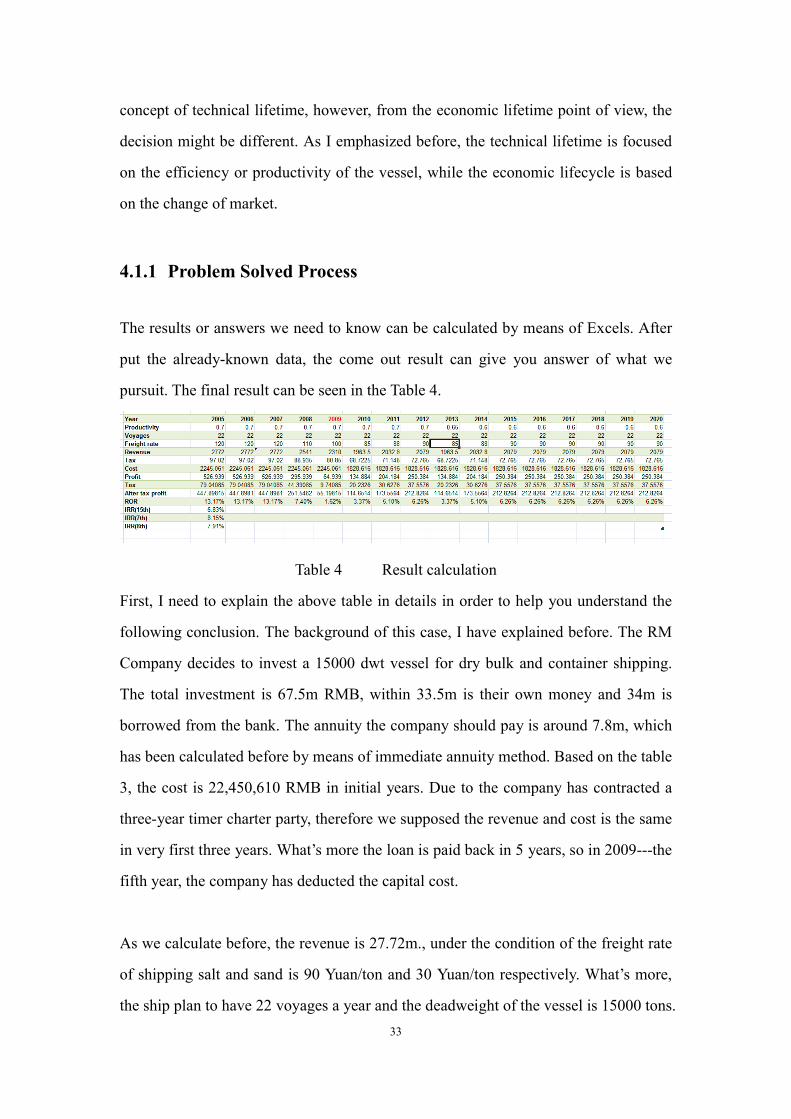
The results or answers we need to know can be calculated by means of Excels. After
put the already-known data, the come out result can give you answer of what we
pursuit. The final result can be seen in the Table 4.
Table 4 Result calculation
First, I need to explain the above table in details in order to help you understand the
following conclusion. The background of this case, I have explained before. The RM
Company decides to invest a 15000 dwt vessel for dry bulk and container shipping.
The total investment is 67.5m RMB, within 33.5m is their own money and 34m is
borrowed from the bank. The annuity the company should pay is around 7.8m, which
has been calculated before by means of immediate annuity method. Based on the table
3, the cost is 22,450,610 RMB in initial years. Due to the company has contracted a
three-year timer charter party, therefore we supposed the revenue and cost is the same
in very first three years. What’s more the loan is paid back in 5 years, so in 2009---the
fifth year, the company has deducted the capital cost.
As we calculate before, the revenue is 27.72m., under the condition of the freight rate
of shipping salt and sand is 90 Yuan/ton and 30 Yuan/ton respectively. What’s more,
the ship plan to have 22 voyages a year and the deadweight of the vessel is 15000 tons.
34
However, it is impossible to fully utilize all the space, so we supposed the
productivity is 70%. All in all, the annual income is equal to
15000*22*70%*(90+30)=27.72m.
There are two taxes on the above table, the first one is business tax, based on the
Chinese tax law, it is 3.5% of the revenue; the second one is corporate income tax,
according to the national standard, it is 15%. Under this context, we can have the
result of the after-tax profit and ROR (Rate of return). After the explanation of the
calculated table, we should introduce the formula we come up with in Chapter 3----
, that is the timing to renew the vessel is equal to the square root of initial
investment divided the gradient, the investment on the vessel is a fixed number, so
here what we need to determine is the number of the gradient. G is the number
indicates the following-up spending on this project; however it includes how much
you would lose in the revenue and how much you would add in the expenditure. Why
I need to emphasize it again, because in real market, they can do a really good job on
cost control and cost-deducting, but the driving force to be as much as possible
cost-efficiency is the depressing market. Therefore, the number of G can never be
zero or minus. Besides, as for the change on the cost of this project, I cannot reveal all
the details, but I would still explain the change, in the fifth year, due to the company
has pay back the loan, therefore the cost is decreased by 7.8m. However, other’s fee is
not maintaining the same, like fuel cost, maintenance fee and insurance. These cost
are increased so the degree of decreasing is not very significant, and as for the
following years, under the effort of the company, the cost is gradually decreased but
in a small percentage. In order to simplify the case, I assume the revenue and cost
would stay the same in the future. Frankly speaking, there is a small possibility that
there will be a big change on this vessel; therefore the assumption is reasonable and
acceptable.
If we keep all these preconditions in mind, then we can continue to test the formula.
The gradient is different from one to one, different company has different operating
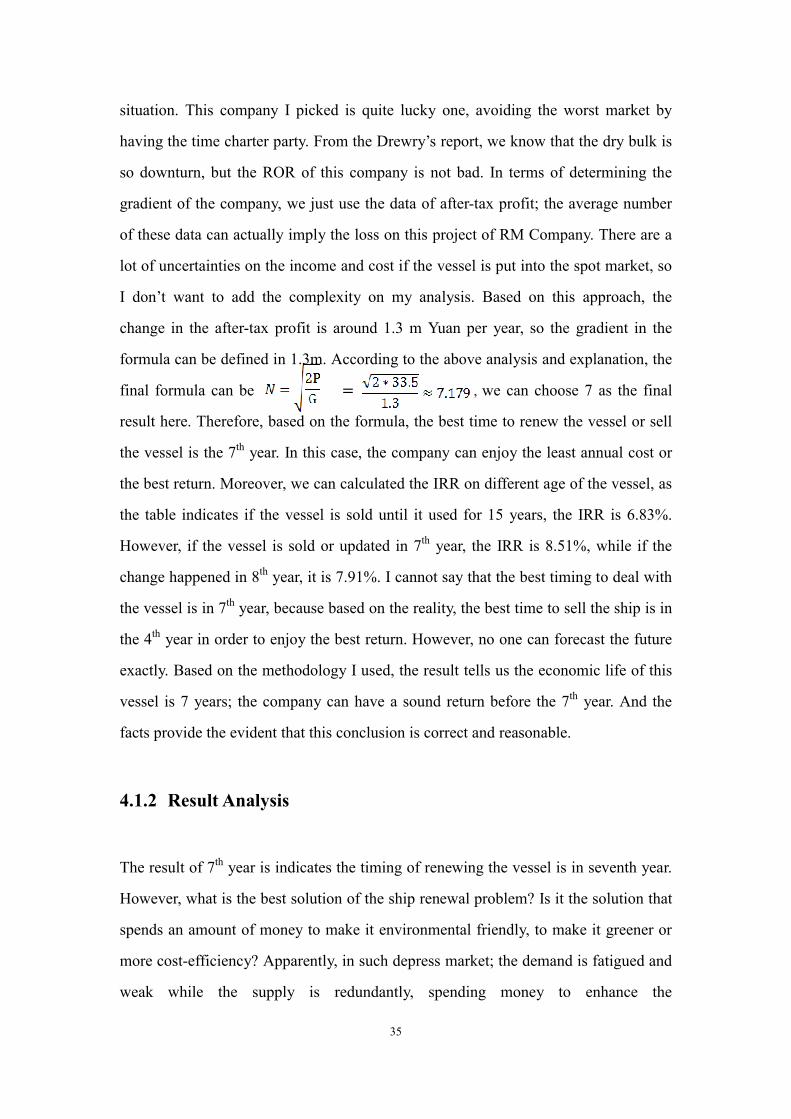
35
situation. This company I picked is quite lucky one, avoiding the worst market by
having the time charter party. From the Drewry’s report, we know that the dry bulk is
so downturn, but the ROR of this company is not bad. In terms of determining the
gradient of the company, we just use the data of after-tax profit; the average number
of these data can actually imply the loss on this project of RM Company. There are a
lot of uncertainties on the income and cost if the vessel is put into the spot market, so
I don’t want to add the complexity on my analysis. Based on this approach, the
change in the after-tax profit is around 1.3 m Yuan per year, so the gradient in the
formula can be defined in 1.3m. According to the above analysis and explanation, the
final formula can be = , we can choose 7 as the final
result here. Therefore, based on the formula, the best time to renew the vessel or sell
the vessel is the 7th year. In this case, the company can enjoy the least annual cost or
the best return. Moreover, we can calculated the IRR on different age of the vessel, as
the table indicates if the vessel is sold until it used for 15 years, the IRR is 6.83%.
However, if the vessel is sold or updated in 7th year, the IRR is 8.51%, while if the
change happened in 8th year, it is 7.91%. I cannot say that the best timing to deal with
the vessel is in 7th year, because based on the reality, the best time to sell the ship is in
the 4th year in order to enjoy the best return. However, no one can forecast the future
exactly. Based on the methodology I used, the result tells us the economic life of this
vessel is 7 years; the company can have a sound return before the 7th year. And the
facts provide the evident that this conclusion is correct and reasonable.
4.1.2 Result Analysis
The result of 7th year is indicates the timing of renewing the vessel is in seventh year.
However, what is the best solution of the ship renewal problem? Is it the solution that
spends an amount of money to make it environmental friendly, to make it greener or
more cost-efficiency? Apparently, in such depress market; the demand is fatigued and
weak while the supply is redundantly, spending money to enhance the
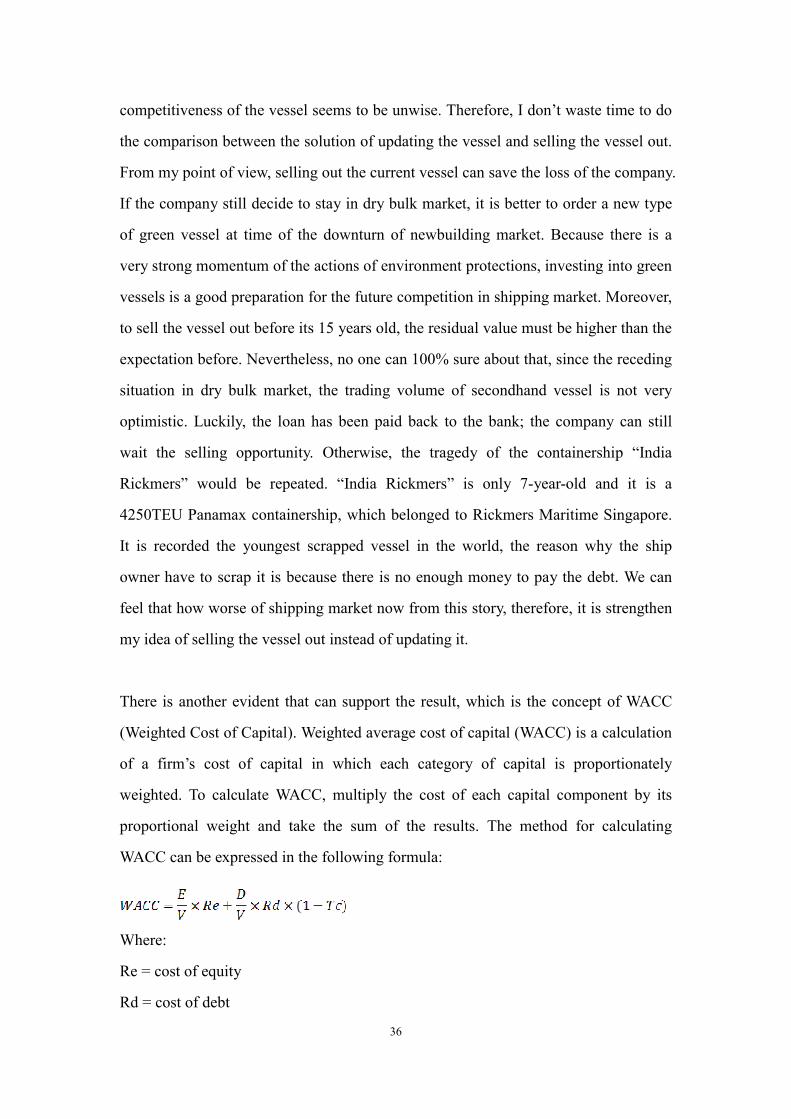
36
competitiveness of the vessel seems to be unwise. Therefore, I don’t waste time to do
the comparison between the solution of updating the vessel and selling the vessel out.
From my point of view, selling out the current vessel can save the loss of the company.
If the company still decide to stay in dry bulk market, it is better to order a new type
of green vessel at time of the downturn of newbuilding market. Because there is a
very strong momentum of the actions of environment protections, investing into green
vessels is a good preparation for the future competition in shipping market. Moreover,
to sell the vessel out before its 15 years old, the residual value must be higher than the
expectation before. Nevertheless, no one can 100% sure about that, since the receding
situation in dry bulk market, the trading volume of secondhand vessel is not very
optimistic. Luckily, the loan has been paid back to the bank; the company can still
wait the selling opportunity. Otherwise, the tragedy of the containership “India
Rickmers” would be repeated. “India Rickmers” is only 7-year-old and it is a
4250TEU Panamax containership, which belonged to Rickmers Maritime Singapore.
It is recorded the youngest scrapped vessel in the world, the reason why the ship
owner have to scrap it is because there is no enough money to pay the debt. We can
feel that how worse of shipping market now from this story, therefore, it is strengthen
my idea of selling the vessel out instead of updating it.
There is another evident that can support the result, which is the concept of WACC
(Weighted Cost of Capital). Weighted average cost of capital (WACC) is a calculation
of a firm’s cost of capital in which each category of capital is proportionately
weighted. To calculate WACC, multiply the cost of each capital component by its
proportional weight and take the sum of the results. The method for calculating
WACC can be expressed in the following formula:
Where:
Re = cost of equity
Rd = cost of debt
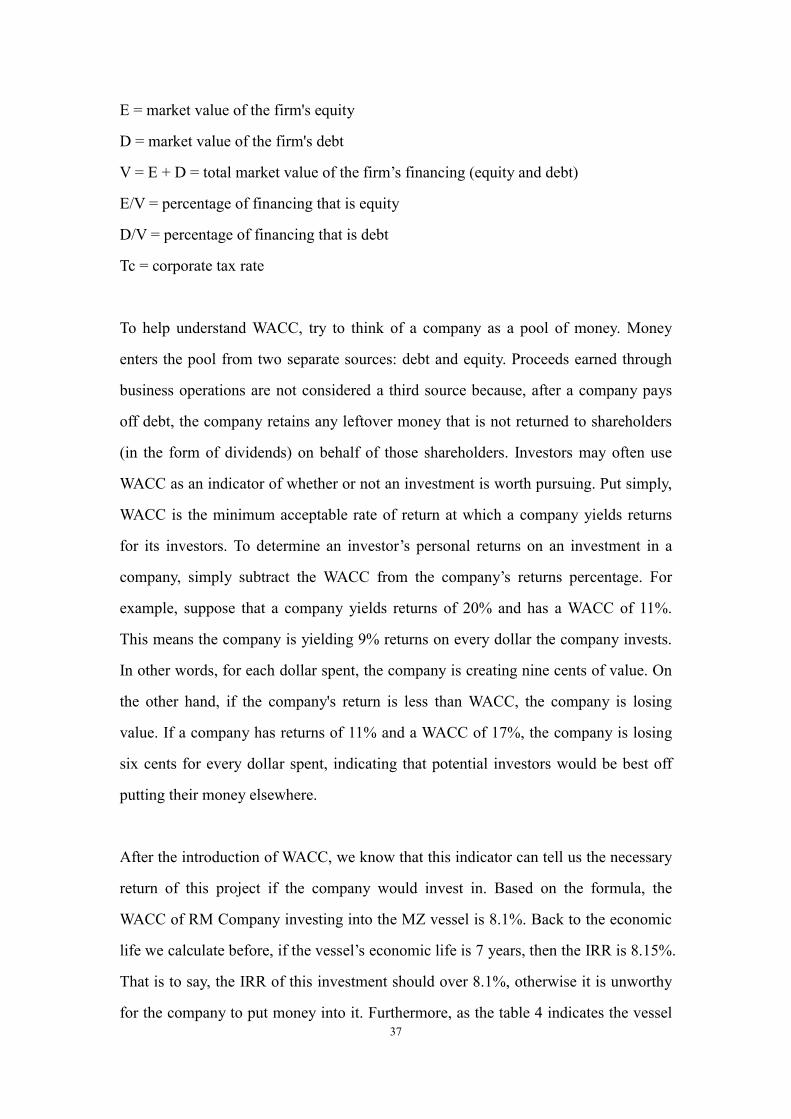
37
E = market value of the firm's equity
D = market value of the firm's debt
V = E + D = total market value of the firm’s financing (equity and debt)
E/V = percentage of financing that is equity
D/V = percentage of financing that is debt
Tc = corporate tax rate
To help understand WACC, try to think of a company as a pool of money. Money
enters the pool from two separate sources: debt and equity. Proceeds earned through
business operations are not considered a third source because, after a company pays
off debt, the company retains any leftover money that is not returned to shareholders
(in the form of dividends) on behalf of those shareholders. Investors may often use
WACC as an indicator of whether or not an investment is worth pursuing. Put simply,
WACC is the minimum acceptable rate of return at which a company yields returns
for its investors. To determine an investor’s personal returns on an investment in a
company, simply subtract the WACC from the company’s returns percentage. For
example, suppose that a company yields returns of 20% and has a WACC of 11%.
This means the company is yielding 9% returns on every dollar the company invests.
In other words, for each dollar spent, the company is creating nine cents of value. On
the other hand, if the company's return is less than WACC, the company is losing
value. If a company has returns of 11% and a WACC of 17%, the company is losing
six cents for every dollar spent, indicating that potential investors would be best off
putting their money elsewhere.
After the introduction of WACC, we know that this indicator can tell us the necessary
return of this project if the company would invest in. Based on the formula, the
WACC of RM Company investing into the MZ vessel is 8.1%. Back to the economic
life we calculate before, if the vessel’s economic life is 7 years, then the IRR is 8.15%.
That is to say, the IRR of this investment should over 8.1%, otherwise it is unworthy
for the company to put money into it. Furthermore, as the table 4 indicates the vessel
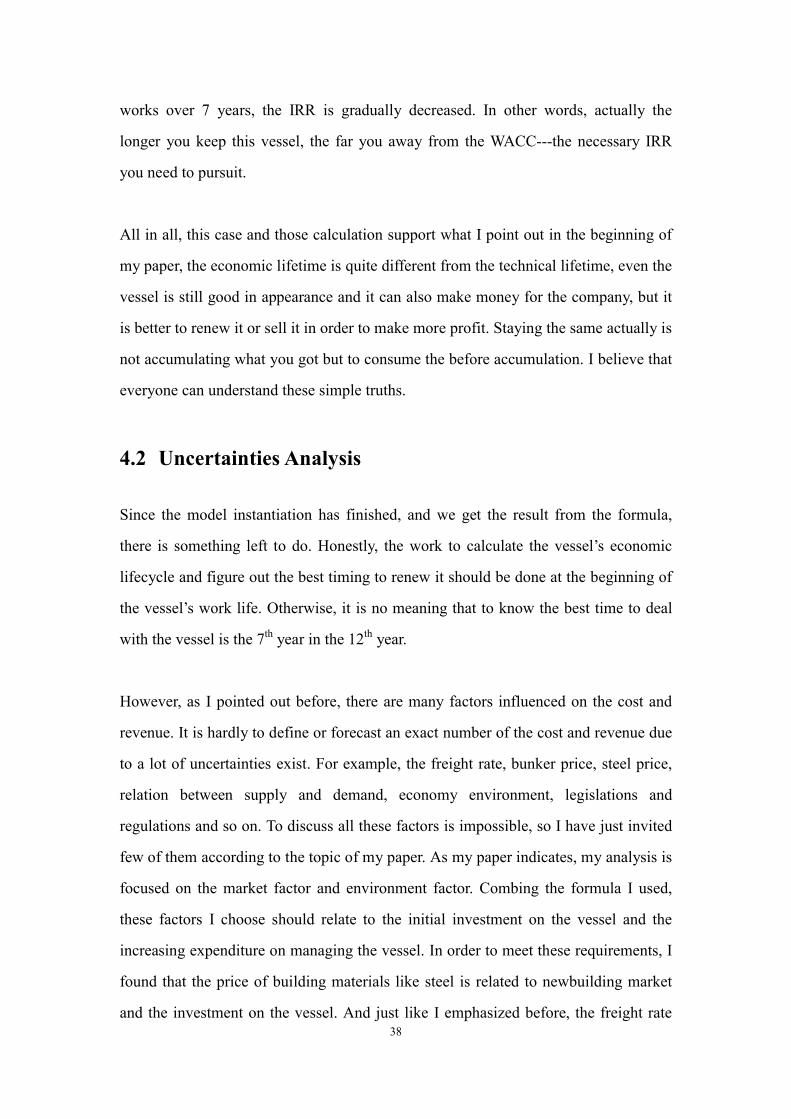
38
works over 7 years, the IRR is gradually decreased. In other words, actually the
longer you keep this vessel, the far you away from the WACC---the necessary IRR
you need to pursuit.
All in all, this case and those calculation support what I point out in the beginning of
my paper, the economic lifetime is quite different from the technical lifetime, even the
vessel is still good in appearance and it can also make money for the company, but it
is better to renew it or sell it in order to make more profit. Staying the same actually is
not accumulating what you got but to consume the before accumulation. I believe that
everyone can understand these simple truths.
4.2 Uncertainties Analysis
Since the model instantiation has finished, and we get the result from the formula,
there is something left to do. Honestly, the work to calculate the vessel’s economic
lifecycle and figure out the best timing to renew it should be done at the beginning of
the vessel’s work life. Otherwise, it is no meaning that to know the best time to deal
with the vessel is the 7th year in the 12th year.
However, as I pointed out before, there are many factors influenced on the cost and
revenue. It is hardly to define or forecast an exact number of the cost and revenue due
to a lot of uncertainties exist. For example, the freight rate, bunker price, steel price,
relation between supply and demand, economy environment, legislations and
regulations and so on. To discuss all these factors is impossible, so I have just invited
few of them according to the topic of my paper. As my paper indicates, my analysis is
focused on the market factor and environment factor. Combing the formula I used,
these factors I choose should relate to the initial investment on the vessel and the
increasing expenditure on managing the vessel. In order to meet these requirements, I
found that the price of building materials like steel is related to newbuilding market
and the investment on the vessel. And just like I emphasized before, the freight rate
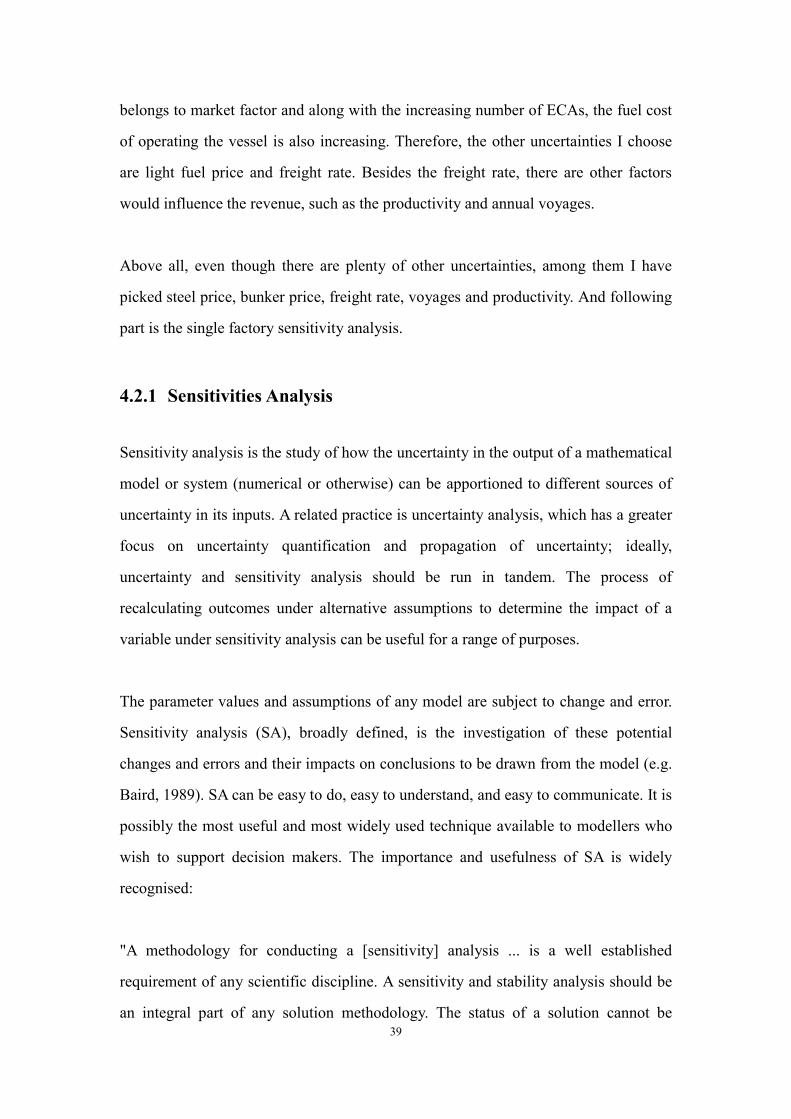
39
belongs to market factor and along with the increasing number of ECAs, the fuel cost
of operating the vessel is also increasing. Therefore, the other uncertainties I choose
are light fuel price and freight rate. Besides the freight rate, there are other factors
would influence the revenue, such as the productivity and annual voyages.
Above all, even though there are plenty of other uncertainties, among them I have
picked steel price, bunker price, freight rate, voyages and productivity. And following
part is the single factory sensitivity analysis.
4.2.1 Sensitivities Analysis
Sensitivity analysis is the study of how the uncertainty in the output of a mathematical
model or system (numerical or otherwise) can be apportioned to different sources of
uncertainty in its inputs. A related practice is uncertainty analysis, which has a greater
focus on uncertainty quantification and propagation of uncertainty; ideally,
uncertainty and sensitivity analysis should be run in tandem. The process of
recalculating outcomes under alternative assumptions to determine the impact of a
variable under sensitivity analysis can be useful for a range of purposes.
The parameter values and assumptions of any model are subject to change and error.
Sensitivity analysis (SA), broadly defined, is the investigation of these potential
changes and errors and their impacts on conclusions to be drawn from the model (e.g.
Baird, 1989). SA can be easy to do, easy to understand, and easy to communicate. It is
possibly the most useful and most widely used technique available to modellers who
wish to support decision makers. The importance and usefulness of SA is widely
recognised:
"A methodology for conducting a [sensitivity] analysis ... is a well established
requirement of any scientific discipline. A sensitivity and stability analysis should be
an integral part of any solution methodology. The status of a solution cannot be
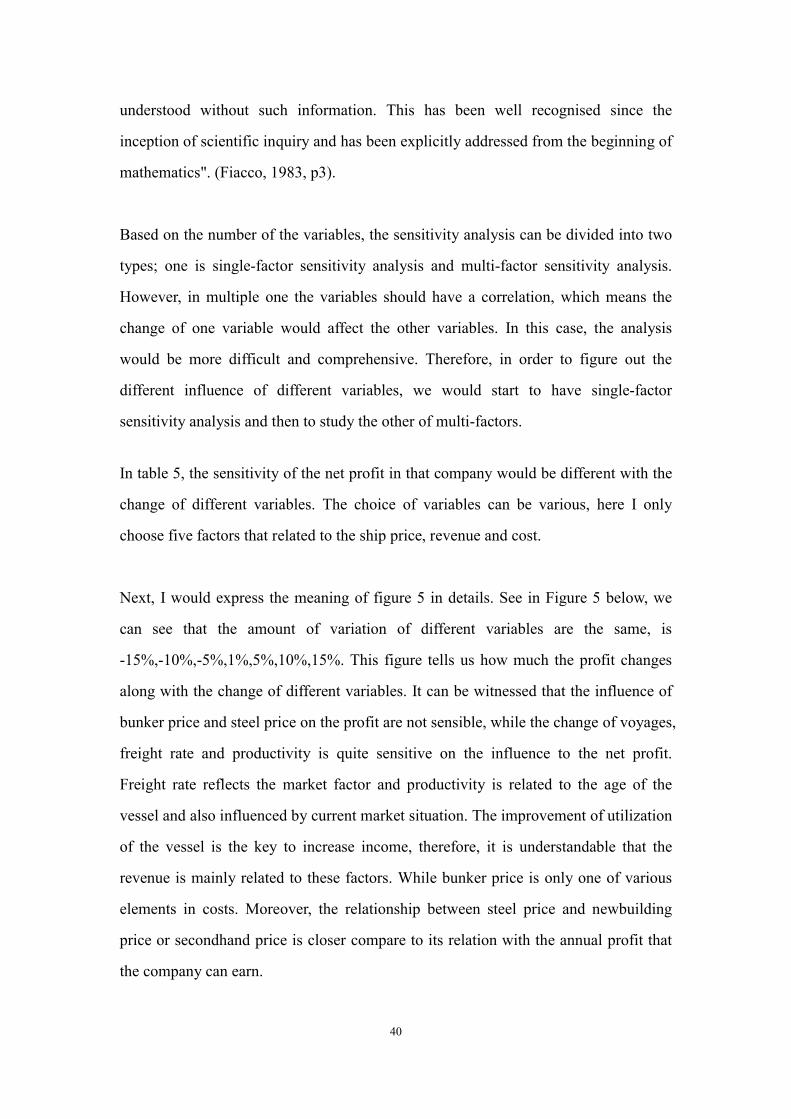
40
understood without such information. This has been well recognised since the
inception of scientific inquiry and has been explicitly addressed from the beginning of
mathematics". (Fiacco, 1983, p3).
Based on the number of the variables, the sensitivity analysis can be divided into two
types; one is single-factor sensitivity analysis and multi-factor sensitivity analysis.
However, in multiple one the variables should have a correlation, which means the
change of one variable would affect the other variables. In this case, the analysis
would be more difficult and comprehensive. Therefore, in order to figure out the
different influence of different variables, we would start to have single-factor
sensitivity analysis and then to study the other of multi-factors.
In table 5, the sensitivity of the net profit in that company would be different with the
change of different variables. The choice of variables can be various, here I only
choose five factors that related to the ship price, revenue and cost.
Next, I would express the meaning of figure 5 in details. See in Figure 5 below, we
can see that the amount of variation of different variables are the same, is
-15%,-10%,-5%,1%,5%,10%,15%. This figure tells us how much the profit changes
along with the change of different variables. It can be witnessed that the influence of
bunker price and steel price on the profit are not sensible, while the change of voyages,
freight rate and productivity is quite sensitive on the influence to the net profit.
Freight rate reflects the market factor and productivity is related to the age of the
vessel and also influenced by current market situation. The improvement of utilization
of the vessel is the key to increase income, therefore, it is understandable that the
revenue is mainly related to these factors. While bunker price is only one of various
elements in costs. Moreover, the relationship between steel price and newbuilding
price or secondhand price is closer compare to its relation with the annual profit that
the company can earn.
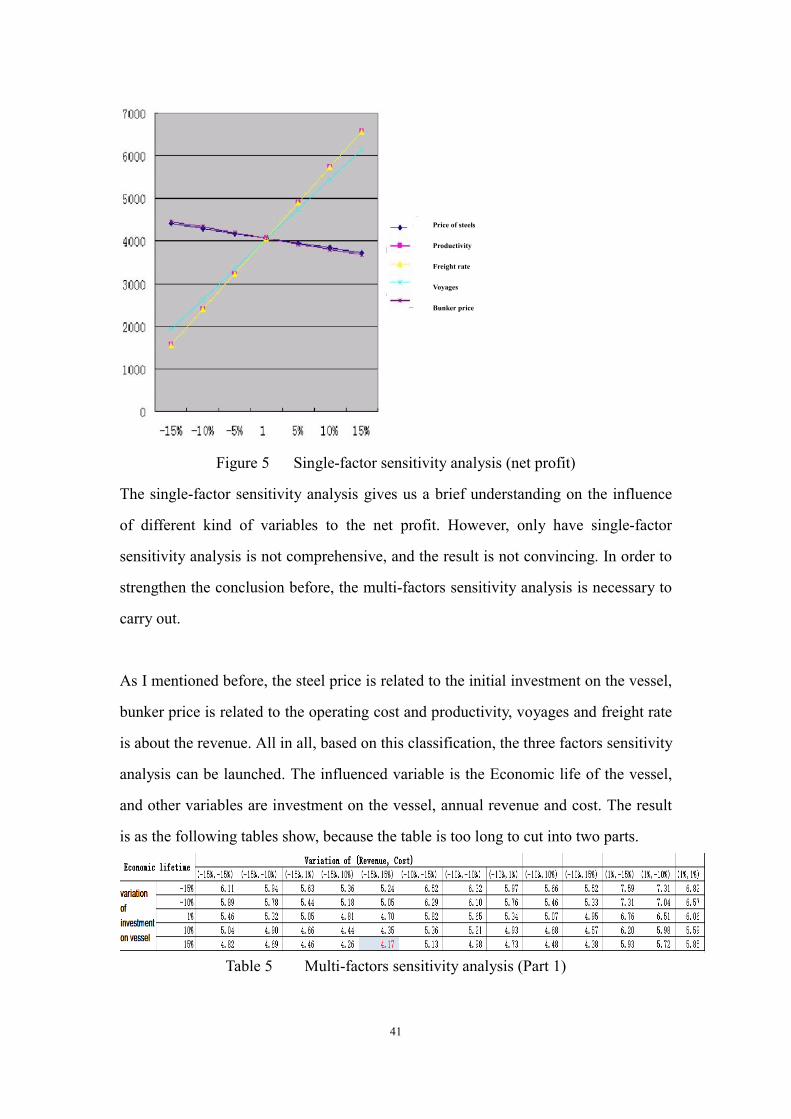
41
Figure 5 Single-factor sensitivity analysis (net profit)
The single-factor sensitivity analysis gives us a brief understanding on the influence
of different kind of variables to the net profit. However, only have single-factor
sensitivity analysis is not comprehensive, and the result is not convincing. In order to
strengthen the conclusion before, the multi-factors sensitivity analysis is necessary to
carry out.
As I mentioned before, the steel price is related to the initial investment on the vessel,
bunker price is related to the operating cost and productivity, voyages and freight rate
is about the revenue. All in all, based on this classification, the three factors sensitivity
analysis can be launched. The influenced variable is the Economic life of the vessel,
and other variables are investment on the vessel, annual revenue and cost. The result
is as the following tables show, because the table is too long to cut into two parts.
Table 5 Multi-factors sensitivity analysis (Part 1)
Price of steels
Productivity
Freight rate
Voyages
Bunker price
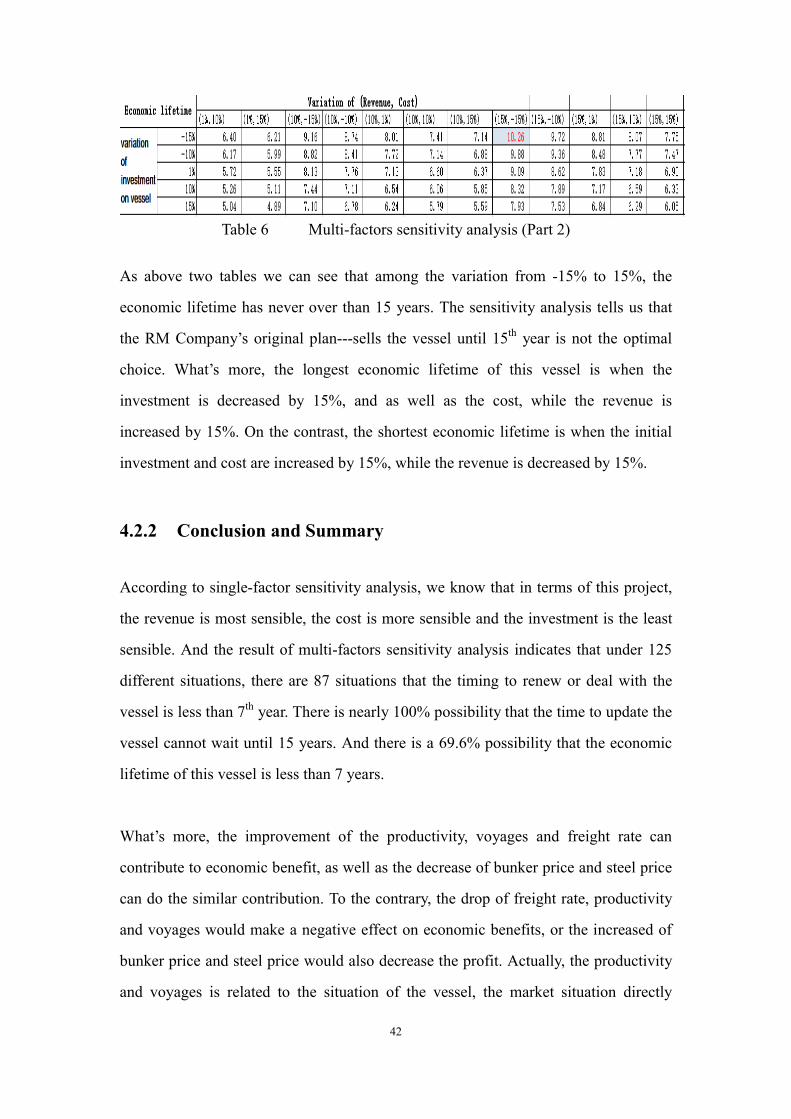
42
Table 6 Multi-factors sensitivity analysis (Part 2)
As above two tables we can see that among the variation from -15% to 15%, the
economic lifetime has never over than 15 years. The sensitivity analysis tells us that
the RM Company’s original plan---sells the vessel until 15th year is not the optimal
choice. What’s more, the longest economic lifetime of this vessel is when the
investment is decreased by 15%, and as well as the cost, while the revenue is
increased by 15%. On the contrast, the shortest economic lifetime is when the initial
investment and cost are increased by 15%, while the revenue is decreased by 15%.
4.2.2 Conclusion and Summary
According to single-factor sensitivity analysis, we know that in terms of this project,
the revenue is most sensible, the cost is more sensible and the investment is the least
sensible. And the result of multi-factors sensitivity analysis indicates that under 125
different situations, there are 87 situations that the timing to renew or deal with the
vessel is less than 7th year. There is nearly 100% possibility that the time to update the
vessel cannot wait until 15 years. And there is a 69.6% possibility that the economic
lifetime of this vessel is less than 7 years.
What’s more, the improvement of the productivity, voyages and freight rate can
contribute to economic benefit, as well as the decrease of bunker price and steel price
can do the similar contribution. To the contrary, the drop of freight rate, productivity
and voyages would make a negative effect on economic benefits, or the increased of
bunker price and steel price would also decrease the profit. Actually, the productivity
and voyages is related to the situation of the vessel, the market situation directly
43
reflects on the freight rate, the utilization of the vessel results from the market
environment and business strategies of the company. Generally speaking, the revenue
and initial investment are derived from the market perspective, and as for the
environment factor, the number of ECAs is the breakthrough point in my paper.
Especially, from the 1 January, besides the ports in Shanghai, Ningbo-Zhoushan,
Suzhou, Nantong, Shenzhen, there are more and more ports are becoming ECA in
China, including ports of Guangzhou, Zhuhai, Tianjin, Qing Huangdao, Tangshan,
and Huanghua. Based on this trend, the increasing of numbers of ECAs in China
would keep going, like the RM Company, their main business is domestic costal city,
and that is to say, in order to continue their business, the sulphur emission should be
pay attention and try their best to limit it. The new regulation says “the surphur
content of any fuel oil used on board vessels berthing at the core ports in the DECAs
(excluding the first hour after arrival and the last hour before departure) shall not
exceed 0.5% m/m on and after 1 January 2017.” In order to cope with the new
situation, as I mentioned before, there are two alternatives that shipping operators or
owners mainly choose, to switch to LSFO when enter into ECAs or to install gas
scrubber on the vessel. Anyway, both of these two approaches would increase the cost.
The sensitivity of the cost is only lower than the sensitivity of the revenue on
operating the vessel.
In a conclusion, the market factor makes the most significant influence and the impact
of environment factor is gradually increased. Actually, the market factor has already
attached a lot of attention of ship owners and operators. However, the influence of
environment factor is more and more significant, which has aroused the awareness of
shipping industry participants to reduce the emission and protect the maritime
environment.
44
Chapter 5 Summary and prospect
In the ship renewal problem, the key point is during the aging of vessel, when to
renew or sell the vessel can get the optimal return or have the least annual cost. There
are many methods on calculating the economic lifetime, in my paper and study the
AAC methodology is my choice, and I derived another simple formula from original
one. Then there are only two elements left in the formula, however, to define these
two numbers are not easy, and there are many variables get involved into the
considerations. Even I have done the innovation on this topic, but there are still many
aspects I haven’t taken into consideration. Therefore, in the following part, I would
draw a conclusion of strengthens and weaknesses on my paper. Based on that, the
improvements on further studies and researches are also needed to point out.
5.1 Disadvantages on this study
Firstly, the most significant disadvantage of my study is that methodology I used and
the formula I came up with doesn’t consider the time value of the capital. In other
words, the concept of NPV hasn’t been invited into the calculation. But actually, if
this idea have to be invited into calculation is not impossible, the way to solve this
problem is to calculate the net present value of the investment on the vessel, which is
the “P” in the formula.
Secondly, the way to calculate the number of “G” (Gradient) has never been
confirmed. Frankly speaking, to define the gradient is different from one to one.
Different company conditions and different expectations for the shipping market are
both contributed to the different gradient. That’s to say, the gradient can be various in
different cases.
Thirdly, the variables or influential factors I picked up is not enough, the story I told is
not comprehensive or reliable to some degree, because of those limited variables I
45
used. To define the economic life and environment life of the vessel is complicated,
especially the majority is more getting used to the traditional concept of vessel
lifecycle, which is so-called technique lifetime.
Even though I have many limitations and imperfections in my paper, the innovation of
my paper is to come up a simpler mathematical model to figure out the optimal timing
to renew the vessel or sell the vessel out. Moreover, the real case has testified the
usefulness of my model. Last but not least, to emphasize the issue of ECAs and the
concept of economic life and green life of the vessel are also my goals of this paper. If
my researches can help the company to get better benefits or arouse the interest or
awareness of green life of ships and maritime environment protection, I think I have
achieved the purpose and objectives. And I believe that in the current shipping market
or in the future market, it is always be a sub-optimal decision on the ship renewal
problem if these factors are not taken into considerations.
5.2 Prospect on further researches
As I pointed out, the model I develop is relatively simple. If there is chance to carry
out further study on this subject, I hope there will be a comparison on different
theoretical models, to figure out the most reliable and comprehensive methodology to
support the business strategies of shipping company. To develop a scientific approach
that can apply in strategic decisions related to capacity expansions or renewal.
Moreover, there is a difference between small companies and large corporations, the
fleet renewal problem is differing from the ship renewal issue, and the former one is
much more complicated. Therefore, more scenarios can be introduced in the further
researches. Besides, the standing point of my paper is minimizing the cost, but there is
another breakthrough point of maximizing the return. Maybe the result would be
different according to different desired value.
In a conclusion, several extensions or complementary analyses could be carried out in

46
further studies. The choice of variables could also be different, or enlarge the
multi-factor analysis. In addition, the evaluations could also be varied. As for the
potential future researches, there are many innovations could be done, and other
relations lie in the shipping market can be explained.
47
References
A.DeSilva, L. Atkinson; J. M. Prince (2002), An implementation plan for renewal of
the National Academic Research Fleet, OCEANS '02 MTS/IEEE, vol.3, pp. 1773 -
1779, DOI: 10.1109/OCEANS.2002.1191902
A. Maragkogianni, S. Papaefthimiou (2015), Evaluating the social cost of cruise ships
air emissions in major ports of Greece, Transportation Research Part D: Transport
and Environment, Volume 36, pp. 10-17
A. Zeng, Tianrui Li, Jie Hu, Hongmei Chen, Chuan Luo(2017),Dynamical updating
fuzzy rough approximations for hybrid data under the variation of attribute values,
Information Sciences, Volume 378, pp. 363-388
B. Davis, E.Eduardo, and P. Zhou (2016), Life Cycle Assessment as a Complementary
Utility to Regulatory Measure of Shipping Energy Efficiency, Ocean Engineering
E. B. David, P. Zhou(2015), Life Cycle Assessment as a complementary utility to
regulatory measures of shipping energy efficiency,
http://dx.doi.org/10.1016/j.oceaneng.2016.10.015
F. Chiara& D. Bo, (2016 November), The rate of return to investment in R&D: The
case of research infrastructures, Technological Forecasting and Social Change,
Volume 112, Pages 26–37
F. Xianghao (1984), Some thoughts on the mathematical methods on the calculation
of the economic life of ship, Journal of Shanghai Maritime Institute
G. Emilios, W.Rong and S. Spyrou (2015), Herding on fundamental information: A
48
comparative study, Journal of Banking & Finance
G. Pantuso, K. Fagerholt, SW.Wallace (2016), Uncertainty in fleet renewal: a case
from maritime transportation. Forthcoming in Transportation Science. From the web:
doi:10.1093/trsc.2014.0566.
G. Pantuso, K. Fagerholt, SW.Wallace (2016) Which uncertainty is important in
multistage stochastic programmes? A case from maritime transportation. Forthcoming
in IMA Journal of Management Mathematics. From the Web:
doi:10.1093/imaman/dpu026.
Haralambides, S.D. Tsolakis, C. Cridland (2004), Econometric Modeling of
Newbuilding and Seondhand Ship Price, Research in Transportation Economics,
Volume 12, Pages 65-105
K. Fagerholt, M. Christiansen, L.M. Hvattum, T.A.V. Johnsen, T.J. Vabø(2010), A
decision support methodology for strategic planning in maritime transportation,
Omega, 38 (2010), pp. 465–474
K. Marais, J. Rivas, I. Tetzloff, W. Crossley (2013), Modeling the impact of
maintenance on naval fleet total ownership cost, 2013 IEEE International Systems
Conference (SysCon) , pp. 801 - 808, DOI: 10.1109/SysCon.2013.6549975
K.P. Jain, J.F.J. Pruyn, J.J. Hopman (2017), Material flow analysis (MFA) as a tool to
improve ship recycling, Ocean Engineering, Volume 130, pp. 674-683
L. Dai, H. Hu & Di Zhang(2015, October), An empirical analysis of freight rate and
vessel price volatility transmission in global dry bulk shipping market, Journal of
Traffic and Transportation Engineering (English Edition), Volume 2, Issue 5, Pages
353-361
49
L.D. Schall, G.L. Sundem, W.R. Geijsbeek, Survey and analysis of capital budgeting
methods , Journal of Finance, 33 (1978), pp. 281–287
L. Hai(2006), The annual average cost in equipment updating, Resources Environment
& Engineering, Vol.20, pp.86-88
L.P. Perera, B.Mo (2016), Emission control based energy efficiency measures in ship
operations, Applied Ocean Research, Volume 60, pp. 29-46
M.A. Dulebenets (2017), The green vessel scheduling problem with transit time
requirements in a liner shipping route with Emission Control Areas , Alexandria
Engineering Journal
M. Stopford (2009), Maritime economics, Routledge, New York
M. Wen, D. Pacino, C.A. Kontovas, H.N. Psaraftis (2017), A multiple ship routing and
speed optimization problem under time, cost and environmental objectives,
Transportation Research Part D: Transport and Environment, Vol. 52, pp. 303-321
M. Z. Frank, T. Shen (2016), Investment and the weighted average cost of capital,
Journal of Financial Economics, Volume 119, Issue 2, pp. 300-315
N. C. Papapostolou, P. K. Pouliasis, I. Kyriakou (2017 August), Herd behavior in the
drybulk market: an empirical analysis of the decision to invest in new and retire
existing fleet capacity, Transportation Research Part E: Logistics and Transportation
Review, Volume 104, Pages 36-51
O.Al Enezy, E. van Hassel, C. Sys, T.Vanelslander (2017), Developing a cost
calculation model for inland navigation, Transportation Business & Management, Vol.
50
23, pp. 64-74
O. MØrch, K. Fagerholt, G. Pantuso, J. Rakke(2016), Maximizing the rate of return
on the capital employed in shipping capacity renewal, Omega, 67(2017), pp. 42-53
Ø. S. Patricksson, K. Fagerholt, J.G. Rakke(2015), The fleet renewal problem with
regional emission limitations: Case study from Roll-on/Roll-off shipping , Emerging
Technologies, Volume 56,pp. 346-358
R. Adkins, D. Paxson (2013), Deterministic models for premature and postponed
replacement, Omega, 41(2013), pp. 1008–1019
S. Mahjoub, , M. Baazaoui, , R. M’nassri, , E.K. Hlil, , M.Oumezzine (2016
September), Magnetocaloric study and estimation of the spontaneous magnetization
by a magnetic entropy analysis , Journal of Alloys and Compounds, Volume 680, 25
Pages 381–387
S.Utkarsh, G. Prakash, J.Dhar and A. Omar (2010), Auto regression and decision
making under uncertainty, Modern Applied Science
T. Andersson, , C. Haslam, , E. Lee, (2006 March) Financialized accounts:
Restructuring and return on capital employed in the S&P . Accounting Forum, Volume
30, Issue 1, Pages 21–41
W. G.Sullivan(2013), Engineering economic(15th), Qinghua University publisher
W. Zhengtian, W. Lizheng (2010), The Research for DEMATEL Method Applied to
Fuzzy Evaluation of Degree of Ship. The 6th International Conference on Advanced
Information Management and Service
X. Qing, L. Jing, W. Chuang(1999), Research and development on ship renewal
51
decision support system, Journal of Dalian Maritime University, Vol.25, pp. 1-4
X. Qing (2003), Ship renewal economic analysis for shipping enterprise, Journal of
Dalian Maritime University, Vol.29, pp. 18-20
Y. Bai, W. Liangjin(2016), Chapter 3 - Green Ship Concepts, Marine Structural
Design (Second Edition), Pages 39-47
Zhang Xiaoming, Liu Wenyong, Li yongzhi (2004), The research and application and
the theory of LCC on equipment updating, The Economists, Vol.10, pp.24-28