Change Ideas to Grow, Nurture, and Lift Ideas (CIGNAL) for ...
Journal of Mathematical Behavior22 (2003) 405–435
An analytical model for studying the development of learners’mathematical ideas and reasoning using videotape data�
Arthur B. Powell∗, John M. Francisco, Carolyn A. Maher
The Robert B. Davis Institute for Learning, Graduate School of Education, Rutgers University,10 Seminary Pl., New Brunswick, NJ, USA
Abstract
We review the literature on videotape methodology for observational research in mathematics education. Weorganize the review by presenting issues related to data collection, ethical concerns, data analysis, tapes as dataversus transcripts as data, and research presentation. To address a gap we perceive in the literature, we propose a modelfor analyzing data in the context of investigations into the mathematical work and growth of thinking of studentsengaged in mathematical inquiry. The model we propose is based on nearly two decades of research experiences inthe Robert B. Davis Institute for Learning, Graduate School of Education, Rutgers University, New Brunswick, NJ.© 2003 Elsevier Inc. All rights reserved.
Keywords:Video methodology; Observational studies; Development of mathematical ideas; Development of forms ofmathematical reasoning; Longitudinal study
This paper describes the theoretical basis of a model for analyzing videotape data, outlines eachphase of the model, and provides examples of the model in action. The model is based on longitu-dinal, cross-sectional study, now in its sixteenth year and sponsored mainly by the National ScienceFoundation,1 on the development of mathematical ideas of a focus group of students (Davis & Maher,1990, 1997; Maher, 2002; Maher & Martino, 1996a; Maher & Speiser, 1997). Through teaching experi-ments designed to create classroom environments in which sense making is a cultural norm, researchers
� This is an expanded version of “An Evolving Analytical Model for Studying the Development of Mathematical ThinkingUsing Videotape Data,” presented at the annual conference of the American Educational Research Association, Seattle, WA,April 12, 2001.
∗ Corresponding author.E-mail addresses:[email protected] (A.B. Powell), [email protected] (J.M. Francisco),[email protected] (C.A. Maher).
1 Two grants from the National Science Foundation supported the longitudinal study: MDR-9053597 (directed by R. B. Davisand C. A. Maher) and REC-9814846 (directed by C. A. Maher). Any opinions, findings, and conclusions or recommendationsexpressed in this paper are those of the authors and do not necessarily reflect the views of the National Science Foundation.Other support came from the New Jersey Department of Higher Education, the Johnson and Johnson Foundation, the ExxonEducation Foundation, and the AT&T Foundation.
0732-3123/$ – see front matter © 2003 Elsevier Inc. All rights reserved.doi:10.1016/j.jmathb.2003.09.002
406 A.B. Powell et al. / Journal of Mathematical Behavior 22 (2003) 405–435
engaged students in coherent strands of mathematics, including algebra, combinatorics, probability, andmathematical modeling. In the course of these experiments, a particularly striking outcome of the cul-ture of sense-making has been the emergence of argumentation, justification, and proof-making in thestudents’ discourse.
Mathematicians and educators who have viewed video-recordings of classroom interactions from thisproject have commented that they had previously not believed that children so young could reasonmathematically with such sophistication. Throughout the 16-year span of research, the Robert B. DavisInstitute for Learning has built up a rich archive of photographic, audio, and video recordings. We haveprogressively refined our methodological and interpretive approaches and have developed an evolvingmodel for analysis of video data. These refinements, moreover, have occasioned revisits of archived datato make deeper analyses. Consequently, we have detailed accounts of the development of mathematicalideas in individual students over many years, which are enhanced as we gather new data.
Our longitudinal research project has several goals: (1) to study in detail the development of mathe-matical ideas in students over several years; (2) to provide in-depth case studies of the development ofjustification and proof making in students; (3) to investigate the relationship of students’ earlier ideas andinsights to later justifications and proof building; (4) to trace the origin, development, and use of rep-resentations of student ideas, explorations, and insights relating to explanation, justification, and proofbuilding. Also, within the context of the learning community formed through our project, we have addi-tional goals: (5) to investigate the nature of researcher intervention in the growth of student mathematicalideas; and (6) to study individual cognition in the context of the movement of ideas within the communityof learners. Furthermore, we investigate questions that emerge from working with data at various phasesof analysis.
To accomplish these sets of goals and address emergent questions, we have produced videotapes ofstudents in classrooms and in after-school sessions as well as in a summer institute and individual orsmall-group clinical interviews. Before examining and commenting on our analytical model for investi-gating the mathematical work and thinking of learners engaged in mathematical inquiry, we review brieflysome of the literature on videotape methodology for research in mathematics education.
1. Brief review of literature on videotape methodology
For decades, researchers in mathematics education have been using technology to capture and study au-dio and then audio coupled with visual images of teachers and students engaged in mathematical activity.According toErickson (1992)inside and outside of educational research, the use of imaging technologiesfor studying interactions has intellectual antecedents in several analytic approaches. The approach ofcontext analysis, which emerged at the beginning of the 1950s, involved the study of detailed transcriptsof “cinema film of naturally occurring interactions” (p. 201). Roughly a decade later, the approach ofethnography of communicationused audio and video recordings to examine the “moment-by-momentorganization of the conduct of interaction” (p. 203). In the late 1950s, the sociologist Goffman, as Er-ickson reports, studied the presentation of self and, in part, used “still photography to glean insightson significant moments of interaction” (p. 203). In recent times, the capability of videotaping to recordthe moment-by-moment unfolding of sounds and sights of a phenomenon has made it a powerful andwidespread tool in the mathematics education research community. Employing video as data, researchershave contributed fascinating descriptions of teachers and students in both clinical and classroom settings

A.B. Powell et al. / Journal of Mathematical Behavior 22 (2003) 405–435 407
involved in an array of mathematical tasks. Some descriptions have emerged from large-scale, video-basedinternational surveys of classroom instruction, such as ones from the Videotape Classroom Study, a com-ponent of the Third International Mathematics and Science Study (TIMSS) (Stigler, Gonzales, Kawanaka,Knoll, & Serrano, 1999).
In the literature on the use of videotape data to inquire into students’ mathematical activity, someauthors discuss video-related methodological issues implicitly when reporting results of their research,while others do so explicitly, raising important methodological and theoretical issues concerning the useof videorecording in data collection, analysis and interpretation, as well as presentation and ethical issues.However, even though there is an increased and extensive use of audio and videotape data, it has beenonly recently that mathematics education researchers have begun to articulate explicit methodological andtheoretical issues and questions pertaining to videotape in research (see, for instance,Cobb & Whitenack,1996; Davis, 1989; Davis, Maher, & Martino, 1992; Hall, 2000; Lesh & Lehrer, 2000; Pirie, 1996, 2001;Roschelle, 2000). Despite the prevalence of video data,Hall (2000)claims that little is known and writtenabout the use of videotape for “collecting, watching, and interpreting video as a stable source of data forresearch and presentation purposes” (p. 647).
In education, medical and social sciences, and other disciplines, videotape has become a popularmedium for capturing and archiving data for both quantitative and qualitative researchers (Bottorff, 1994;Roschelle, 2000). Methodologically, video technology lends itself to a strict application or a mixture ofqualitative and quantitative approaches in both data collection and analyses. A salient reason for this is, asPirie (1996)observes in discussing video recording in mathematics education, that videotaping a class-room phenomenon is likely to be “the least intrusive, yet most inclusive, way of studying the phenomenon”(p. 554). In the next section, we present briefly ways in which researchers of mathematics teaching andlearning have begun to theorize about ways of collecting, watching, and interpreting videotape data.
1.1. Data collection
Video is an important, flexible instrument for collecting aural and visual information. It can capturerich behavior and complex interactions and it allows investigators to reexamine data again and again(Clement, 2000, p. 577). It extends and enhances the possibilities of observational research by capturingmoment-by-moment unfolding, subtle nuances in speech and non-verbal behavior (Martin, 1999, p. 79).It overcomes a human limitation of observation by being able to capture not just “part of the wholepicture” (Martin, 1999, p. 76) and is better than observer notes since it does not involve automaticediting (Martin, 1999, p. 81). QuotingGrimshaw (1982), Bottorff (1994) notes two main potentialsof videorecordings as a resource for research: density and permanence (p. 245). Density reflects theadvantage of videorecording over an observer who, even with access to all that a camera sees, hasdifficulty monitoring different, simultaneous details of ongoing behavior (p. 246). Furthermore, from theperspective of density, videorecordings capture two data streams — audio and visual — in real time.Bottorff’s notion of permanence will be discussed later in the data analysis section.
It is worthwhile highlighting a unique use and collection of video data in the TIMSS Videotape Class-room Study. Its goal was to understand how teachers construct and implement eighth-grade mathematicslessons in Germany, Japan, and the United States. As has been claimed, the study was the first timeanyone had used video to collect national probability samples of anything and in this case of teaching(Stigler & Hiebert, 1999, p. 17;Stigler et al., 1999, pp. v and 2). Besides videotapes, other data typesincluded teacher responses to questionnaires as well as textbook pages and worksheets corresponding to

408 A.B. Powell et al. / Journal of Mathematical Behavior 22 (2003) 405–435
lessons videotaped (Stigler & Hiebert, 1999, p. 18). In the end, the study produced a video survey of 231eighth-grade mathematics lessons in Germany, Japan, and the United States of America.
Though video is a valuable methodological instrument for gathering data, it is not unproblematic.Davis (1989)discusses practical methodological issues when videotaping interviews that probe children’sunderstanding and thought processes including scripting, pilot trials, group size and dynamics, and videotechnicalities.Bottorff (1994)lists three reasons why, like human observations, video data are incomplete:capable of selectivity because of mechanical limitations; incapable of discerning the subjective contentof behavior being recorded; and usually unable to convey historical context of captured behavior (p. 246).Along similar lines,Hall (2000)cautions “against taking this new media as relatively complete, direct, orveridical” (p. 663) and argues that video data is technology and theory laden. That is, during data collection,selections are made from ongoing phenomena on the basis of technology used and theoretical interests. Inturn, these realities both constrain and shape later analyses and presentation of results. Furthermore, videocannot capture everything. In aiming a video camera, researchers implicitly or explicitly edit and makesampling choices by focusing or not on particular events (Martin, 1999, p. 81).Pirie (1996)underscoresthis issue in the following way: “Who we are, where we place the cameras, even the type of microphonethat we use governs which data we get and which we will lose” (p. 553).
The question arises whether researchers can ameliorate human and technological biases of video-recordings.Roschelle (2000)warns researchers that there are no simple ways to overcome biases of themedium and that “videos are a constructed record” (p. 726). Nevertheless, to acquire data amenable torigorous research methods,Roschelle (2000)points out the importance of selecting appropriate videoequipment; developing competent videography techniques, and planning and documenting systematicrecording strategies consistent with clearly-defined research purposes. Further,Roschelle (2000)dis-cusses technical and practical details in recording research-quality videos, including the use of pilotstudies for improving videographic techniques and examining the effect of the camera on participants’behavior (pp. 726–727).
Recognizing that videorecording is both technology and theory laden, it is important to recognize thatvideorecording does not necessarily guarantee quality data collection and analysis. Researchers havesuggested ways of ameliorating the necessarily narrow window into phenomena that videos offer byaugmenting data sources.Pirie (1996)recommends coupling videorecording with students’ written workin order to have a more inclusive examination of students’ mathematical activity (p. 554).Lesh and Lehrer(2000)suggest that video data be combined with other data sources such as ethnographic observations,clinical interviews, and teaching experiments (p. 670).
Some researchers (for instance,Hall, 2000; Suchman and Trigg, 1991) recognize video as a construc-tion rather than a representation of relationships.Hall (2000)problematizes data collection, encouragingcaution in thinking of videorecordings as objective and theory-neutral data (p. 649). Both the possibil-ities and limitations of the video and audio technology as well as a researcher’s theoretical perspectiveconstrain and shape data records. He states that devices for capturing visual and aural images can be“deployed to record human activity in ways that make selections from ongoing interaction. . . creatingdata records that show just those parts of interaction we already find interesting and little more” (p. 659).
1.2. Ethical issues
Capturing information pertaining to individuals or groups of individuals with videos in both quantitativeand qualitative research introduces a variety of ethical issues, including and beyond informed consent.
A.B. Powell et al. / Journal of Mathematical Behavior 22 (2003) 405–435 409
Essentially, the principle of informed consent implies that researchers insure that participants in an activityto be videotaped are fully informed and understand what it means to participate, that they realize theintended implications of having their voice and body images captured on video, and that they consent tothe intended uses of the taped images.Roschelle (2000)suggests obtaining “progressive levels of consent”as they are needed. These include consent for “small research group use only,” “scientific conferences andmeetings,” and “general broadcast via TV, CD-ROM, or computer networks” (p. 726). Whatever level ofinformed consent is required, it should be in a formal and written form, specifying who has access to thedata and the use of the data.
However, informed consent does not necessarily protect consenters against a number of problematicsituations. Consent is typically given before videorecording commences. Nevertheless, consenters andresearchers may find themselves in a predicament. For instance, videographers may inadvertently record aparticipant performing an unbecoming behavior or, asRoschelle (2000)states it, “damaging material canbe acquired accidentally” (p. 726). In his turn,Hall (2000)points out a further problem that researchersconfront concerning appropriate uses of video as data obtained with support of public funds: the data as apublic resource may be used in unanticipated ways by the public (p. 648). As he indicates, once accessibleon the World Wide Web, stretches of videorecordings can be “repurposed in ways that undermine theentire research undertaking, regardless of the kind of surrounding details we attach to the records” (p. 662).
Ethical questions related to repurposing intersect with issues of validity. Some researchers attempt toprovide readers of their reports access to the data upon which their reports are based. Specifically, withinmany research traditions, researchers are concerned with adequately describing both behaviors and theircontexts so that readers can form their own judgment concerning a researcher’s analysis of what peopleare doing (McDermott, Gospodinoff, & Aron, 1978). To address this concern, researchers usually providereaders with a complete rendition of the transcript upon which an analysis is based. Moreover, since theadvent of digitized videos and Web-based video transfer protocols, readers can also obtain digitizedvideo segment corresponding to the transcript (see, for example,Koschmann, Glenn, & Conlee, 2000,p. 57, footnote 5). In this situation, even when videotaped participants have consented to public accessto their recorded voice and body images, they often cannot be fully aware of and, therefore, consent infully informed ways to how readers might repurpose a video segment that contains participants’ images.In general, repurposing raises serious issues for the extent to which informed consenters can be fullyinformed before consenting, especially given global access to streamlined video on the World Wide Web.
Who has access to captured information on video as well as in transcripts is an issue of confidentiality.The storage and disposition of the videotapes are also key issues of confidentiality. ForBottorff (1994),confidentiality and strategies to maintain it are as important as the usual concern for informed consent.Moreover, she insists that researchers must inform participants when videotaping is occurring and givethem the option to interrupt or discontinue a taping session (p. 252). She even suggests that researchersshould consider modifying identifying features to protect the identity of participants if otherwise researchcould not take place (p. 253).
1.3. Data analysis
Videorecordings offer many advantages for data analysis. As we mentioned earlier,Bottorff (1994)argues that a main potential of video data is its permanence.Stigler et al. (1999)note that live observationsintroduce significant problems to ensure that different observers record behavior in comparable ways(p. 3). Unlike the ephemeral nature of live observations, with videotapes, researchers can view recorded

410 A.B. Powell et al. / Journal of Mathematical Behavior 22 (2003) 405–435
events as frequently as necessary and in flexible ways such as “real time, slow motion, frame by frame,forward, backward,” and attend to their different features (Bottorff, 1994, p. 246). Similarly,Roschelle(2000)observes that video supports interpretations from multiple perspectives and offers the possibilityfor participants to assist in providing interpretations (p. 727). When examining the use of video to studythe growth of mathematical understanding,Martin (1999)notes that videorecordings provide researcherswith the possibility to make considered judgments and revisitings of the learning scene (p. 79) andborrowing fromErickson (1992), “reduce the dependence of the observer on premature interpretation”(p. 80). Roschelle (2000)indicates other potentials of video data for analysis such as interpretationsfrom different, multidisciplinary frames of analyses and opportunities for participants to share theirviewpoint concerning their behavior (p. 727). On this last point, viewing the other side of the coin,Martin (1999)observes that videotaping enables the researcher to interact with learners as they work andconsequently test nascent theories (pp. 85–86).Roschelle (2000)refers to data reduction and samplingchallenges with video data and mentions that computer software can be helpful in addressing thesechallenges. Significantly, for instance, videorecordings allow for in-depth examination of the developingmathematical work and thinking of the same students over several years as well as for the study andanalysis of the cognitive growth of individual students in the setting of a social group (Davis et al., 1992;Maher & Alston, 1991).
Detailed analyses of longitudinal as well as short-term video data are made efficacious by multipleviewings. Video not only allows for multiple viewings but also for viewing from multiple points of view.According toLesh and Lehrer (2000), a productive analysis of videotapes involves viewing throughmultiple windows or aspects, including theoretical aspects such as mathematical, psychological andteaching; physical aspects such as observers’ notes, transcripts, and videotapes from different cameras;and temporal aspects that include analyses of isolated sessions, analyses of group sessions, and analysesof similar sessions across several groups (p. 677). Further, they suggest going through “a series oftriangulation and consensus-building cycles” to test and refine interpretations (pp. 677–678).
Repeated viewing has the potential to enhance triangulation in data analysis. Despite this ability,Alstonand Maher (1990)note a limitation of data obtained from such episodes in that some children may bemore verbal than others. They write, “follow-up interviews could provide insight into the nature of theuncertainty category as well as an opportunity to probe for meanings that are unclear or inconsistent inwritten statements” (p. 9). Other researchers have also constructed methodological procedures to boosttriangulation in data analysis. In this regard,Maher and Martino (1996a, 1999)advance the notion of a“video portfolio” as a collection of different kinds of data centered at an episode or a series of episodes ofinterest. For them, a video portfolio contains (a) videotape “cuts” of the episodes, (b) documented episodesfrom videotapes that emerged from the analysis, (c) associated written work of students, and (d) researchernotes documenting the mathematical activity that researchers deem as a trace of the development of amathematical ideas (Maher & Martino, 1996a, p. 202). Importantly, a video portfolio can provide a visual,aural, and written account of learners thinking about mathematical situations and the development of theirideas over time. A documentary example of the use of longitudinal videotape data to trace a student’scognitive evolution from pattern recognizing to theory posing is contained inMaher and Martino (2000).
Some researchers transcribe video data, and their resulting transcripts constitute their analytic medium.This movement from video data to transcription is not without associated difficulties. Transcribing videodata involves representing interactions. Researchers attempt to produce as veridical a representation ofinteractions by including representations of not just verbal but also of gestic interactions. However, atranscript is not a simple, universal category. Even though, it is impossible to render an exact, genuine

A.B. Powell et al. / Journal of Mathematical Behavior 22 (2003) 405–435 411
transcript of verbal and gestic interactions captured on videotape, it is possible to produce transcripts that,on the one hand, are “necessarily selective” (Atkinson & Heritage, 1984, p. 12) and “theoretically guided”(Erickson, 1992, p. 219) and, on the other hand, are nonetheless close approximations to being exact andgenuine for particular research purposes. That is, transcripts can be more or less valid representations ofinteractions and their conventions depend on researchers’ analytic purposes (Erickson, 1992). Further-more, representation systems for transcribing interactions are not uniform. For instance, the transcriptionsystem evolved byJefferson (1984)has as its purpose to transfer to the page the sound and sequentialpositioning of talk. Whereas, the transcription convention used in the Video Classroom Study of TIMSS isdesigned to record speech only and not other behaviors that surround speech (Stigler et al., 1999, p. 161).
1.4. Tapes as data versus transcripts as data
A critical methodological issue with the use of videorecordings concerns whether either the tapes or thetranscripts of recordings are the data upon which to base analysis.Pirie (1998)describes this interestinglyas there are those for whom “the data are the tapes” and those for whom “the data are the transcripts”(p. 160). Each position has its merits and demerits. Digital video cameras certainly are the currently bestavailable tool for capturing and preserving the moment-by-moment unfolding of phenomena, revealingasDavis et al. (1992)state a “great complexity within what was once thought of as the ‘simple’ worldof ‘doing mathematics’ ” (p. 187). Superior to ethnographers’ field notes, tapes can make visible subtlenuances in speech as well as non-verbal behaviors. Although both require electronic equipment to reviewthem, compact discs or DVDs of digitized video are less bulky than tapes. In contrast, transcripts aremore portable than tapes and, unlike tapes, CDs, and DVDs, require no special equipment to access them.Indeed, with transcripts,Maher and Alston (1991)advance the idea that “careful analysis of videotapetranscripts of children doing mathematics enables a detailed study of how children deal with mathematicalideas that arise from the problem situation” (pp. 71–72).
Nevertheless, many things are potentially missed in the movement from tape or CD to transcript. CitingHammersley and Atkinson (1983), Martin (1999)notes that videotaping ironically can produce too muchdata and that transcribing makes it difficult to maintain contact with one’s theoretical perspective whilesampling. On this point of data saturation, in a discussion of clinical interview methodologies,Clement(2000)observes that “difficulty with rich source data like videotape is that there is too much data toanalyze in a meaningful way!” (p. 572). He remarks that an investigator must decide “what aspect of sucha continuous stream of behavior are most relevant to the purpose and context of the study” and “whatis relevant depending on the level of the research question in which he or she is interested” (p. 572).For meaningful analyses of extensive or non-extensive video data,Martin (1999)notes thatPirie (1996)advocates transcribing no tapes and instead working exclusively on the tapes (p. 82), a position held byother investigators, as well.
1.5. Presentation
Apart from analytical issues, both tapes and transcripts are useful for presentation purposes. From theposition thatPirie (1996)advances where analyses ought to be based exclusively on tapes, transcriptsof episodes of videorecordings are useful for presenting evidence for interpretations. A limitation of awritten format for presenting analyses of video data is that video segments are usually unavailable to thereader. Researchers attempt to make relevant features of visual material accessible through transcription
412 A.B. Powell et al. / Journal of Mathematical Behavior 22 (2003) 405–435
and description but, often, these provide results that are not wholly satisfying. Research reports madeavailable on the Web can circumvent this limitation. With advances in video-streaming technologies onthe World Wide Web and hyperlinks, researchers can integrate clips of videorecordings into researchreports, and readers with appropriate software resident in their computer can view these clips.
Videorecordings are appealing and helpful not only for written but also for oral communications. AsRoschelle (2000)notes videorecordings allow “a researcher to make more direct connections between ob-servable behaviors and interpretations” (p. 728). Yet the use of videorecordings in research presentationscan be problematic given the temptation for researchers to showcase their “best case” instead of the “moretypical performance” (p. 728). Video images can be powerful and persuasive.Stigler and Hiebert (1999)point out that “images produced by video can be too powerful, because they can focus attention on onestriking example, even when the example is not typical” (p. 22). To ameliorate the tendency of video imagesto falsely portray typicality, they combine impressionistic images with coded, quantified video data (Stigleret al., 1999). Roschelle (2000)warns researchers against presenting video clips without first explaining totheir audience contextual information and the criteria for selecting the clips. Without doing so, audiencesmay develop conflicting interpretations outside of the research context. To avoid such problems, he arguesthat the research community needs “to establish guidelines for presenting video clips” (p. 728).
2. An evolving analytical model in practice: various examples
We have just presented a review of issues related to the use of video data identified by researchersin education, in general, and in mathematics education, in particular. In our reading of the literature,despite the almost ubiquitous use of video technology in mathematics education research, we noticedessential voids in methodological discussions. Except forErickson (1992), we found no discussion ofcriteria indicating research situations for which video data collection is useful. Furthermore, we haveencountered little explicit elaboration of analytical methods for using video data for observational studiesof the development of mathematical thinking. Though not explicitly working in mathematics education,some researchers have proposed models for audiovisual data collection and analysis coupled with partic-ipant observation (Erickson, 1992, and the Santa Barbara Classroom Discourse Group at the Universityof California at Santa Barbara).
In mathematics education, specific discussions of methods for analyzing video data are sparse. Forinquiring into the teaching and learning of mathematics and science in classrooms, Clarke and his collab-orators (Clarke, 2001b) have developed a qualitative analytic approach, called Complementary AccountsMethodology. A distinguishing feature of this approach is that a common body of videotape and inter-view data, which include the retrospective construal of events by participants, is analyzed from multipletheoretical frameworks (Clarke, 2001a), with no common methodological approach to the analysis of thevideo data.Pirie (2001)discusses how she and her collaborators in the “�-group” at the University ofBritish Columbia undertake a common method for video analysis from multi-perspectives. In their work,they examine a set of data from several different theoretical perspectives that consider the growth ofmathematical understanding.Cobb and Whitenack (1996)present their four-phase method for analyzingvideorecordings and transcripts for case studies that they claim is consistent with the constant comparativemethod thatGlaser and Strauss (1967)advocate.
In contrast to the paucity of models for video data analysis for studying mathematical cognitive devel-opment, reports (journal articles, conference presentations, doctoral dissertations, and course activities)

A.B. Powell et al. / Journal of Mathematical Behavior 22 (2003) 405–435 413
that have emerged from the Robert B. Davis Institute for Learning (RBDIL) at Rutgers University containexplicit and implicit pointers to a general analytical approach that can accommodate different theoreticalframeworks. Our approach has developed over nearly two decades in an attempt to understand the de-velopment of mathematical ideas (Davis et al., 1992). It rests upon a longitudinal study, currently in itssixteenth year, on the development of mathematical ideas of a focus group of students (Davis & Maher,1990, 1997; Maher & Martino, 1996a; Maher & Speiser, 1997). To understand how students think andreason about a collection of mathematical ideas, the research and data analysis typically lead analy-ses of individual learners either in the context of clinical interviews or working in groups, constructingmathematical knowledge (Davis et al., 1992; Maher & Speiser, 1997; Speiser & Walter, 2000).
Through the longitudinal study, our research group at the RBDIL attempts to understand the growth ofmathematical understanding by examining temporally the discourse and inscriptions of students as theyengage in mathematical inquiry. The theoretical underpinnings of this study come from three sources:research on the development of mathematical ideas (Davis, 1984; Davis & Maher, 1990, 1997; Speiser& Walter, 2000), models of the growth of understanding (Pirie, 1988; Pirie & Kieren, 1989, 1994), andtheories concerning the generation of meaning (Dörfler, 2000).
A critical prerequisite for using video to capture data is to have clear criteria for employing this data col-lection and analytical device. In agreement withErickson’s (1992)general criteria for investing resourcesof time and energy into analyses of interaction within an educational study, we consider ethnographicanalysis of video particularly useful for research in mathematics education
when . . . events are rare or fleeting in duration or when the distinctive shape and character of. . .
events unfolds moment by moment, during which it is important to have accurate information on thespeech and nonverbal behavior of particular participants in the scene. . . when one wishes to identifysubtle nuances of meaning that occur in speech and nonverbal action — subtleties that may be shiftingover the course of activity that takes place. (pp. 204–205)
Using these criteria and particular ways of examining and analyzing video data can yield insights intoexplicit and implicit meanings of participants in an educational setting. Our analytical model for studyingthe development of mathematical thinking employs a sequence of seven interacting, non-linear phases:
1. Viewing attentively the video data2. Describing the video data3. Identifying critical events4. Transcribing5. Coding6. Constructing storyline7. Composing narrative.
This taxonomy of analytic phases that we propose is not meant to describe the way any particularresearcher might or should proceed with analysis of video data but rather to put forth our hypothesesabout appropriate phases of analysis.
Similar attempts to propose a research method using video data have tried to characterize the phe-nomenon under study (Erickson, 1992). In our analytical model, we view the development of mathemat-ical ideas and reasoning as complex and non-linear processes. We inquire into particular manifestationsof these processes such as learners’ presentations of their mathematical ideas and reasoning in talk, in-scriptions, and gestures. Nevertheless, our experience persuades us that it is ultimately a research issue

414 A.B. Powell et al. / Journal of Mathematical Behavior 22 (2003) 405–435
to determine the nature and contours of what constitutes mathematical ideas and reasoning. Our positioninvites researchers to decide in the context of their research theimportantaspects of ideas and reasoningto focus upon as well as the implementation sequence of the proposed phases.
Before discussing the phases of our model, we present a general sense-making, research tool: analyticalmemoranda. Our use of memoing extends beyond that described by some analysts (Charmaz, 1983; Miles& Huberman, 1994). In our model, as researchers watch, describe, code, and otherwise attend to theirvideo data they continually write in a notebook or an electronic PDA or computer-based file — called ananalytic notebook — about their emerging and evolving theoretic, analytic, and interpretive ideas; aboutannotative commentary of transcripts; about hypotheses concerning mathematical ideas and reasoningrevealed in participants’ discourse; about participants’ use of inscriptions to communicate ideas amongthemselves and with others; about connections between and among codes; about themes exiting acrosscodes; about larger divisions of categories; about an emergent central phenomena; about assemblages ofnarrative components; and so forth. In sum, asCreswell (1998)notes, these memoranda form preliminaryhypotheses, jottings about emerging categories and connections between them (p. 241). These memo-randa also produce an intermediate bridge between coding of the data and constructing a storyline as wellas composing drafts of a narrative report. Moreover, during the describing phase, analytical memorandacan serve as a repository of interpretive, inferential commentaries that sometimes creep into descriptiveaccounts of video data.
We will illustrate each of our analytic phases with examples based largely on one video portfoliofrom our longitudinal research project. The video portfolio includes approximately one hour and a half ofvideo recording of four students engaged in resolving a deliberately open-ended task, typical of our projecttasks, and two researchers interviewing them about their work as well as the students’ written work. Thetask comes from a strand of tasks in combinatorics that forms part of a larger, multi-strand collection ofmathematical tasks that we have developed in the course of our longitudinal research project. How weengage students with the tasks reflects our perspective on learning and teaching. Key to this perspective isthat knowledge and competence develop most effectively in situations where students work together onchallenging problems, discuss various strategies, argue about conflicting ideas, and regularly present jus-tifications for their solutions to each other and to the entire class. The role of the teacher–researcher, in ourresearch perspective, includes selecting and posing problems, then questioning, listening, and facilitatingdiscourse, usually without direct procedural instruction (Maher, 1998; Martino and Maher, 1999).
The task of our video portfolio — the Taxicab Problem — is presented inFig. 1in the exact form givento the four students.2 The task employs the non-Euclidian context of taxicab geometry (Krause, 1986;Menger, 1952, 1979) to provide a landscape and mathematical structure to the combinatorial situation.
To work on the Taxicab Problem, we invited four students — Brian, Jeff, Michael, and Romina —seniors at the David Brearley High School in the working-class town of Kenilworth, NJ. These studentshave participated in the longitudinal study since its inception and, in the course of it, have worked onproblems that lead them to build mathematical ideas that are similar to the underlying mathematicalstructure of the Taxicab Problem (seePowell, 2003). Consequently, in context of our research project,this problem was proposed as a culminating task with the following central guiding research questions:
1. How do learners come to understand the problem?2. What mathematical ideas do learners generate?
2 In the context of this problem, for detailed analyses of the students’ mathematical ideas and forms of reasoning through theirdiscourse and inscriptions, seePowell and Maher (2002, 2003)andPowell (2003).

A.B. Powell et al. / Journal of Mathematical Behavior 22 (2003) 405–435 415
Fig. 1. The problem task. In the original, from left to right, the four identified intersections are colored black, blue, red and green.
3. How do learners generalize the problem and their solution?4. How do learners construct isomorphisms between this problem and other problems on which they
have worked?
In what follows, we use as an analytic lens for examining these questions the theoretical ideas ofDörfler (2000)concerning prototypes and protocols as tools for constructing meaning. In the subsectionon coding, we present operational definitions of his three categories of prototypes and of his notion ofprotocol.
2.1. Viewing attentively the video data
To become familiar with the content of the video data, researchers watch and listen to the videotapesseveral times. In this phase, researchers watch and listen without intentionally imposing a specific analyt-

416 A.B. Powell et al. / Journal of Mathematical Behavior 22 (2003) 405–435
ical lens on their viewing. The goal is to become familiar with the research session in full. Depending on aresearcher’s general data collection and analytic framework, this phase may suggest, as in the case of, say,grounded theory, further data that ought to be collected (Charmaz & Mitchell, 2001; Corbin & Strauss,1990). Similarly, in the case of stimulated recall, specific episodes may be selected for participants toobserve and to reflect verbally (Davis, 1989) or, as in the circumstance of clinical interview, screening thevideo data may inform subsequent tasks in which to engage participants (Ginsburg, 1997; Haydar, 2002).
2.2. Describing the video data
Owing to the density of the medium, the use of video data often results in an enormous amount ofinformation. For analytic purposes, this poses the challenge of not only familiarizing oneself with thecontent of the videotape data but also knowing it in fine detail. The previous phase is one, preliminaryway of addressing this challenge. In that or a separate phase, as our model proposes, researchers notein an ethnographic-like fashion particular time-coded transitions of situations, activities, or meanings.For instance, with Pirie’s “time activity trace” (Pirie, 2001, p. 348), researchers write brief, time-codeddescriptions of a video’s content. These could be descriptions of 2- to 3- or even 5-min intervals. It isimportant, however, that, at this phase of work, the descriptions are indeed descriptive and not interpretativeor inferential. Researchers state what corporal actions and other movements can be seen as well as whatutterances and other noises that can be heard.Pirie (2001)notes that instead of “inferential remarks suchas: ‘He is trying to. . . ’ or ‘She seems to have. . . ’ or even ‘A confusing diagram on the board. . . ’ ”that simple, factual descriptions are best: “ ‘He writes. . . ’, ‘She says. . . ’, ‘The teacher draws. . . ’ ”(p. 349). In general, the idea is to map out the video data so that someone reading the descriptions wouldhave an objective idea of the content of the videotapes. Indispensably, descriptions help the researcherbecome ever more familiar with the data set than one does by attentively watching and listening to thevideo record. The time-coded descriptions also allow the researcher to locate quickly particular vignettesand episodes. Indicating time codes, with the aide of mechanical timers or software devices, is especiallyuseful for later locating particular video content. Software programs such as vPrism make it possible forresearchers to bring together electronically video content, text, and time code.
In Fig. 2, the first 4 min and 44 s of videotape are described. The three time intervals are chosen tobe small and thematic. In these intervals, the four students are seated around a trapezoidal table. After aresearcher distributes the task, the students ask questions about the task and among themselves wonderwhy all efficient routes to a particular destination point have the same length.
2.3. Identifying critical events
By viewing and describing video data, researchers acquire a fairly in-depth knowledge of the content oftheir videos. Afterward, researchers move to the next phase of data analysis, which consists of carefully re-viewing their tapes and identifying significant moments or, as we term them,critical events(Maher, 2002;Maher & Martino, 1996a, 1996b, 2000). Within our theoretical framework, to study the history, develop-ment, and use of learners’ thinking over time, in agreement withMaher and Speiser (2001), we identifyeventsas connected sequences of utterances and actions that, within the context of oura priori or a poste-riori research questions, require explanation by us, by the learners, or by both. An event is calledcriticalwhen it demonstrates a significant or contrasting change from previous understanding, a conceptual leapfrom earlier understanding (Kiczek, 2000; Maher, 2002; Maher & Martino, 1996a; Maher, Pantozzi, Mar-

A.B. Powell et al. / Journal of Mathematical Behavior 22 (2003) 405–435 417
TimeInterval Description 00:00:00-00:02:06
Researcher 1 pulls up a chair, sits down between two students on the right side of the table, thanks the group of fourstudents (from left to right: Michael, Romina, Jeff, and Brian)for coming, distributes the Taxicab Problem, and asks them to read and see whether they understand it. Afterward,Researcher 1 stands up and, as she backs away from the table,she removes her chair. With his head bent downward, facingthe problem statement, Jeff asks aloud whether one has to stayon the grid lines and whether they represent streets. Researcher 1 responds, “Exactly.” Romina, Brian, and Jeff discuss that 5 is the number of blocks it takes to reach the bluedestination point and that different routes to blue are the samelength as long as one doesn’t go beyond it. Brian says thatthey should prove it.
00:02:06-00:02:42
Researcher 1 walks back over to the table and asks the students for their understanding of the problem. Jeff says thatthe task is to find the shortest route while “staying on the streets.” Researcher 1 adds that it is about finding whether there is more than one shortest route. Both Brian and Rominaagree. Researcher 1 goes on to say that if there is more thanone, they have to determine how many shortest routes. Jeff inquires with Researcher 1 whether she is asking how manydifferent shortest routes? She says that not only do they haveto find the number of shortest routes but also that they will “have to convince us” that they have found all of them. Researcher 1 then walks away from the table.
00:02:42-00:04:44
Jeff asks for colored markers. Jeff, Romina, and Brian choose to each work on different destination points. Rominasays that it is five blocks to the blue point. Brian suggests counting them and being sure. Jeff asks why the length ofeach route to blue is the same. Michael explains that to get the blue point one has to go “four down and right one” since one cannot go backward or diagonally. Romina asks how to devise an area for that. Jeff and Michael tells her that it’s not area, it’s perimeter with each segment of the grid considered as one unit.
Fig. 2. Content description without interpretation of the nearly the first 5 min of video data.
tino, Steencken, & Deming, 1996; Steencken, 2001), or, asBruner (1960/1977)calls an intuitive mistake,“an interestingly wrong leap” (p. 68). Significant contrasting moments may be events that either confirm ordisaffirm research hypotheses; they may be instances of cognitive victories, conflicting schemes, or naı̈vegeneralizations; they may represent correct leaps in logic or erroneous application of logic; they may be anyevent that is somehow significant to a study’s research agenda. By connecting sequences of critical eventsand further analyzing them, for example, using constant comparisons (Glaser & Strauss, 1967), researchersbuild narratives that initially are amalgams of hypotheses and interpretations and that in turn influence sub-sequent identification and analyses of critical events. In this sense, critical events and narratives co-emerge.

418 A.B. Powell et al. / Journal of Mathematical Behavior 22 (2003) 405–435
Critical events are contextual. An event is critical in its relation to particular research questions pursued.Thus, an instance in which learners present a mathematical explanation or argument may be significantfor a research question concerned with students’ building of mathematical justification or proof and, assuch, be identified as a critical event. In contrast, a researcher concerned with the impact of teacher inter-ventions on students’ reflective abstraction or mathematical understanding might deem as critical thoseevents that connect teacher interventions and associated student articulations of their thinking. However,the relation between critical events and research questions pursued also implies that researchers mightidentify events as critical that include negative instances of a hypothesis, instances of wrong leaps, andsomehow significant to the study’s research question. It is also interesting to note that critical events aresimilar to whatGattegno (1970, 1974, 1987, 1988), observing learners doing mathematics, calls momentsof awareness and that these events or moments often compel researchers to reflect on their antecedentand consequent events.
Critical events are not only identified in the video record. Researchers may find critical events innon-video, artifactual material such as in students’ inscriptions or in the written statements of a studentjournal. Afterward, researchers may review the video record to locate antecedent events that can be used toexplain the identified critical event (for examples of this point, seePowell, 2003; Speiser & Walter, 2003).
Videorecordings greatly enhance the search and identification of critical events. Repeated watching,for instance, allows researchers to view the data as many times as necessary before deciding to flaga particular video episode as a critical event or to discard a previously chosen critical event. Sharedviewing and collaboration with other researchers greatly enhance the quality and validity of identifiedcritical events. The density of video can provide researchers with extensive data from which to selectcritical events. When studying, for instance, the development of mathematical ideas or the growth ofmathematical understanding, a critical event is associated with a time line, and researchers may thensearch for related events in the past and in the future. If the related events are critical and lead to growthin understanding, then the set of critical events form whatKiczek (2000)defines as apivotal strandor a pivotal mathematical strand(Steencken, 2001). Within a narrative such strands may emerge andpoint to, for example, the mathematical ideas and forms of reasoning learners develop that are key inbuilding learners’ mathematical understanding. Analytically, it is important to name the pivotal event,thereby indicating the narrative theme to which it belongs (Powell, 2003). Moreover, when analyzingthe discursive interaction of learners, a critical event that qualitatively changes their inquiry trajectory,we call awatershed critical event(Powell, 2003). Such an event is often preceded by a series of relatedcritical events that can be collected together as pivotal strand to indicate a discursive thread that begets thewatershed critical event. In turn, the watershed event initiates a cascade of events some of which may becritical. The antecedent and consequent data may already exist and further data may need to be collectedthrough subsequent investigations such as clinical or stimulated recall interviews. Digitized video on CDsor DVDs viewed with appropriate software such as vPrism help researchers to navigate through the datawhile looking for and pointing to related critical events. Some software allow researchers to juxtaposerelated critical events so as to highlight their relationships. Moreover, critical events are indispensable fora research narrative that discusses particular research questions in light of data. Critical events identifiedat this phase may provide evidence for findings described in the narrative itself.
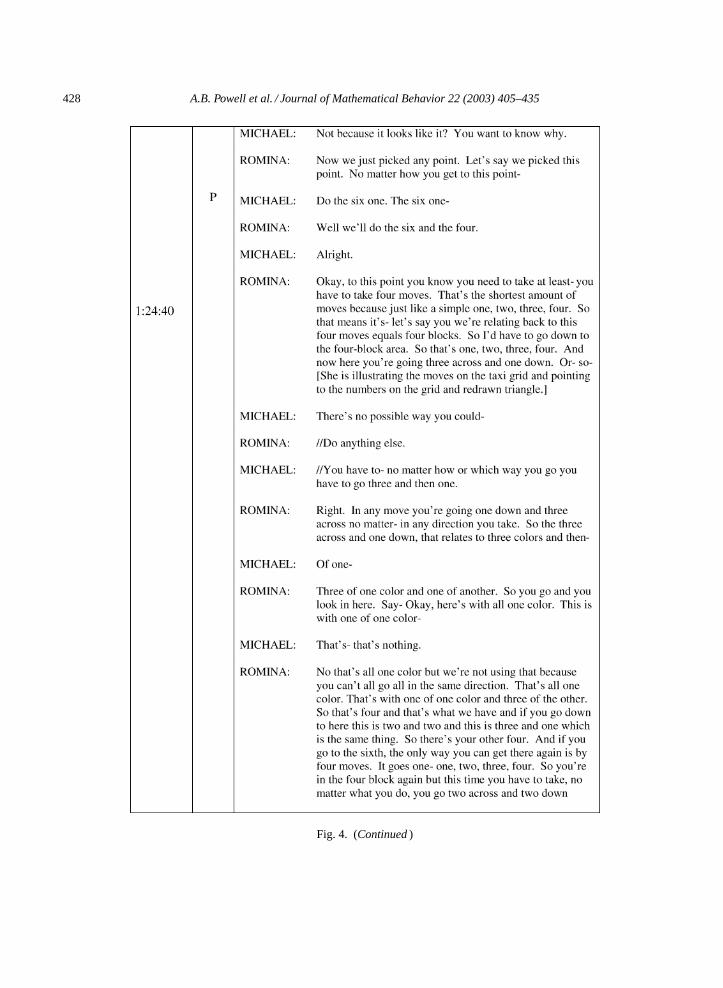
Fig. 3 contains commentary about and the transcript of an identified critical event that relates to thesecond guiding research question (What mathematical ideas do learners generate?) and fourth question(How do learners construct isomorphisms between this problem and other problems on which they haveworked?).

A.B. Powell et al. / Journal of Mathematical Behavior 22 (2003) 405–435 419
Time Commentary on and Transcript of a Critical Event
00:55:31
Before this episode, Jeff had suggested to Romina that they count the number of shortest routes by starting with ones easier than the red and green destination points. Between them, they spent time establishing a method for counting. Starting with a point that is 2 blocks east and 2 blocks south of the taxi stand (forming a 2 by 2 sub-grid), they count the number of shortest routes of several nearby points and record their results in the taxicab grid. After working with their 2 by 2 sub-grid for which they found 6 shortest routes, they worked on a 3 by 3, finding 15 shortest routes. They also worked on 2 by 4, 2 by 3, and 4 by 3 sub-grids. In this way, they were controlling for variables, a heuristic that they had developed and employed in several other tasks in our longitudinal study.
At the start of this episode, Michael is double-checking that the number of shortest routes for the 3 by3 sub-grid is 20. Meanwhile, Brian announces to Romina that he and Jeff have verified that 15 not 12 is the number of shortest routes in a 4 by 2 sub-grid. When Romina notes that 15 must also be the number of shortest routes for a 2 by 4 sub-grid, she voices her implicit awareness of a symmetrical property of the numerical pattern of shortest routes that she and Jeff have developed. Moreover, she observes that the pattern corresponds to Pascal’s triangle.
Nevertheless, Romina is concerned about their datum for the 3 by 3 sub-grid. Brian offers to recount the routes for that one, using his method of “down and over.” However, Michael had been counting the shortest routes for the 3 by 3 sub-grid and now states that he found 20. Suspecting that this confirms that they have Pascal’s triangle, Jeff states, “why does Pascal’s triangle work for this is the question.”
This event is critical since it points to key mathematical ideas that the students generate as well as heuristic and content connections they make to other problems. This event illustrates that the students seek to understand and explain reasons why Pascal’s triangle underlies the mathematical structure of the Taxicab Problem. In addition, at the end of this episode, Romina suggests that they relate (find an isomorphism between) this problem to the Towers Problem, a problem they have already met and resolved.
BRIAN: Did you figure out the five by five?
MICHAEL: Five by five? I’m doing three by three right now.
Fig. 3. This episode is identified as a critical event in relation to several guiding research questions.

420 A.B. Powell et al. / Journal of Mathematical Behavior 22 (2003) 405–435
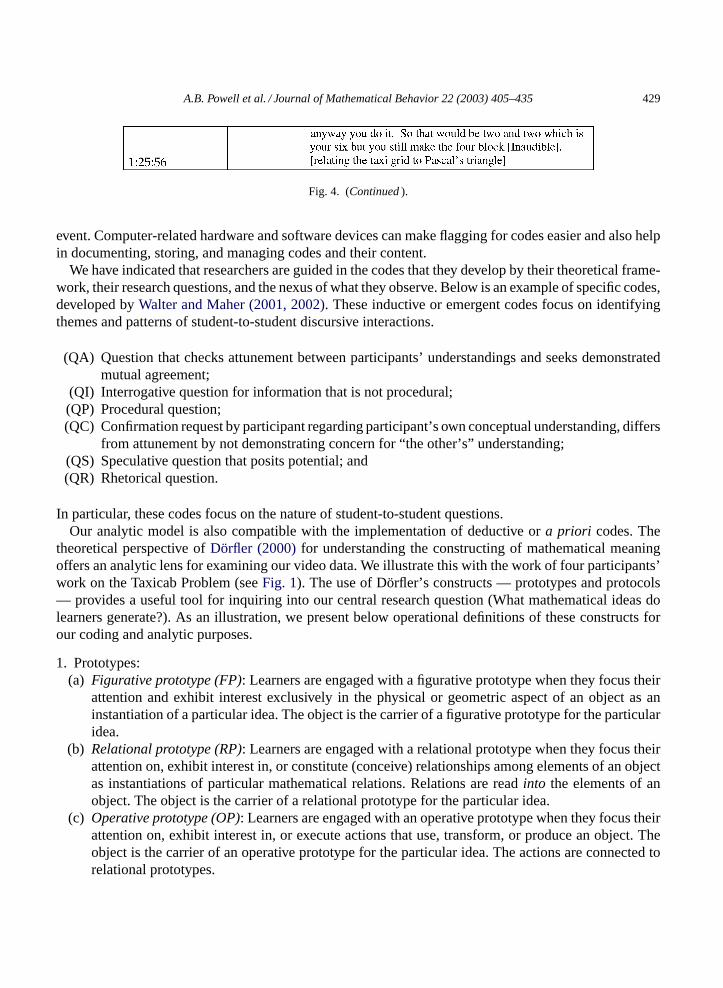
01:00:16
ROMINA: Did it again. You got twelve for this one? Fifteen I mean? [Romina changes the 9 in the second row to a 6.] You got twelve for this one? Fifteen I mean? [She rewrites the numbers on the grid and adds a 15 to the right of the 10 and under the 10.]
BRIAN: Which one are you expecting to be twenty? Three by three? [Romina nods, yes.]
MICHAEL: What are you guys all doing?
BRIAN: Checking.
ROMINA: I don’t think- here- he has- He was just doing three by three wasn’t he? [Romina looks through her papers.]
BRIAN: Yeah. It’s no big deal.
ROMINA: I’m already stuck. [Brian draws a 3 by 3 rectangle on his paper. Romina draws in shortest routes for the “imaginary” 3 by 3 on her grid. Romina’s pen stops when drawing a route.]
JEFF: You shouldn’t be. Where you going?
ROMINA: Three by three. [She shows the paper to Jeff.]
JEFF: You said F making the- the [Inaudible].
MICHAEL: Yeah I got twenty for that one.
JEFF: For three by three?
MICHAEL: Yeah.
JEFF: Alright well then- I mean can’t we explain why we think- well- alright. [Jeff waves his hand.]
MICHAEL: //They’re going to ask us-
JEFF: //Alright then the next question is why- //why-
ROMINA: //Now-
MICHAEL: //How do you know-
ROMINA: //Just relate this back to the //blocks. [Jeff points to the grid on the transparency with his marker.]
Fig. 3. (Continued)

A.B. Powell et al. / Journal of Mathematical Behavior 22 (2003) 405–435 421
00:56:56
BRIAN: Let’s just agree. If we already know what it is then we have to figure out-
MICHAEL: I just want to make sure that’s twenty. So- [Michael counts routes with his pen on his grid.]
MICHAEL: I’m missing two. T hat’s probably right though.
BRIAN: Did you get the, uh, staircase one?
MICHAEL: Which one? For the three by three?
BRIAN: Yeah. [Inaudible]. [Romina returns.]
ROMINA: Oh, you guys went and wrote on this didn’t you?
MICHAEL: I didn’t do it.
BRIAN: Did Jeff tell you?
ROMINA: What?
BRIAN: That this one-
ROMINA: For which one?
MICHAEL: //For-
BRIAN: //Four by two.
ROMINA: So you did get fifteen? So now it’s working? [Meaning that the pattern of shortest routes corresponds to Pascal’s triangle.] And then the two by four has to be fifteen too. Now if we do three by three and that’s twenty, then we’re done.
BRIAN: Which are you doing?
ROMINA: What?
BRIAN: He said he was off by two. [Inaudible]. [Romina begins to erase the numbers on the grid transparency then takes a new transparency with a grid on it.]
ROMINA: I’ll just turn this around.
BRIAN: It’s only a couple of numbers. [Romina is writing numbers in the grid; first row is 2 3 4 5; second is 3 9; third row is 4; and fourth row has a 5.]
Fig. 3. (Continued)

422 A.B. Powell et al. / Journal of Mathematical Behavior 22 (2003) 405–435
JEFF: //Wait- Why is this- why does the Pascal’s Triangle work for this is the question.
ROMINA: //Exactly. Relate it to the blocks. [The word “blocks” here refers to the Towers Problem.]
Fig. 3. (Continued).
2.4. Transcribing
One of the decisions researchers have to make when analyzing research data that includes recordings ofparticipants’ utterances and actions is whether to transcribe or not. The reasons to transcribe vary. Someresearchers transcribe to provide evidence of students’ assertions in a research report. Others transcribe inorder to use a particular analytic approach that relies heavily on transcript data. There are also researcherswho maintain that transcripts reveal important things not always visible otherwise. AsAtkinson andHeritage (1984)note, transcripts are “necessarily selective” (p. 12) and, according toErickson (1992),are “theoretically guided” (p. 219). It is therefore important to realize that it is impossible to render anexact, genuine transcript of verbal and gestic interactions captured on videotape. Nonetheless, it is possibleto produce transcripts that are close approximations to being exact and genuine for particular researchpurposes. Transcripts can be more or less valid representations of interactions and their conventionsdepending on researchers’ analytic purposes (Erickson, 1992, p. 219). A useful transcription system isone based on the one evolved byJefferson (1984)that has as its purpose to transfer to the page thesound and sequential positioning of talk. Such a transcript of discourse is from a hearer’s perspective andpresents tied sequences of utterances that constitute speakers’ turns at talk and at holding the floor.
There are essential reasons to transcribe videotapes. First, following procedures within data collectionand analytic traditions, researchers may implement an open-coding process on data to discover themesthat are above, beyond, and beside those suggested by specific,a priori guiding research questions anddeductive codes. The production of the transcript and the physical, static rendering of a research session af-fords researchers opportunities for extended, considered deliberations of talk and noted gestures. Second,researchers analyzing participants’ discursive practices, especially their dialogue, find it useful to viewthe printed, sequential rendering of speech to see what it reveals about the mathematical meanings and un-derstandings participants construct. Since discursive practices include actions that are not only utterances,researchers indicate in their transcripts relevant body movements as well as inscriptions (writings, draw-ings, sketches, and so on) that participants create. Third, transcripts are, for practical purposes, a permanentrecord and can reveal important categories that are not always capable of being discerned by viewing video-tapes since, notwithstanding the technology of replay, the visual and aural video images that the viewer’smind eye and ear captures are essentially ephemeral. Instead with transcript data, one can consider morethan momentarily the meaning of specific utterances. Fourth, researchers transcribe so that later, if andwhere appropriate in narrative reports, they can provide evidence of findings in the participants own words.
Transcripts allow researchers to perform synchronous coding with videotapes and other artifacts. As re-searchers code transcripts, they continually review corresponding episodes in the video record to perceivesubtle nuances in speech and non-verbal behaviors as well as visible influences on patterns of behavior.The importance of transcripts notwithstanding, examining the video record is indispensable to analyzecertain artifacts such as inscriptions since they are built in a layered fashion over time.

A.B. Powell et al. / Journal of Mathematical Behavior 22 (2003) 405–435 423
In our analytic model, researchers transcribe critical events to closely analyze elements such as languageand flow of ideas as well as for presentation purposes (seeFig. 3). We also transcribe portions of videodata, vignettes or episodes, that provide evidence for important theoretic or analytic matters relative toour guiding research questions (seeFig. 4). For whatever purpose a transcript has been produced, severalviewers check it for accuracy. However, our analyses are not based solely on inspection of transcriptsindependent of direct reference to original video recordings. Some researchers find voice recognitionequipment helpful and software such as vPrism, that allows researchers to attend simultaneously to thecontent of speech, the speakers’ gestures, and the time frame of episodes.
2.5. Coding
With or without transcripts, coding is crucial to analysis of video data. This activity is aimed at iden-tifying themes that help a researcher interpret data. In our model, this activity is similar to identifyingcritical events in that both require watching videos intensively and closely for long periods of time. Atthis phase of analysis, the difference is that researchers focus attention on the content of the criticalevents. Therefore, videorecording is helpful in this activity in much the same way as it is in enhancingthe identification of critical events. Importantly, employing observational coding schemes decided uponprior to observations or videotape viewing may blind researchers and make it difficult to notice unan-ticipated behaviors. Nevertheless, asAlasuutari (1996)argues, coding is not theoretically “innocent”(p. 373). Like identifying critical events, coding is directed by researchers’ theoretical perspective andresearch questions. Repeated and shared viewing, made possible by video technology, and the density ofvideo data enhance researchers’ ability to search and identify codes, whether these are predetermined oremergent.
Just as with critical events, codes are defined in relation to the research question pursued or emer-gent themes. Over the years of our investigation into the development of mathematical ideas, we havedeveloped coding schemes informed by our assumptions about mathematical thinking and our researchpractices into the development of mathematical ideas and forms of reasoning. We have found it par-ticularly useful and important to code for learners’ mathematical ideas, mathematical explanations orarguments, mathematical presentations (symbolic, pictorial, and gestic), and features and functions ofdiscourse. We have also refined codes related to several constructs such as critical events, trace, and theflow of ideas among learners in a group.
Inquiring into the development of probabilistic thinking, through coding data sets for critical events,Kiczek (2000)notices how these events are connected. In turn, she traces how particular probability ideasare built among her participants. The connected sequence of critical events leads to growth in understand-ing of particular probability ideas, andKiczek (2000)develops the construct of pivotal strand to describethis phenomenon. In tracing the growth of understanding of fractions among a class of fourth-graders,Steencken (2001)codes for learners’ representation of fractions with Cuisenaire rods. When in compar-ing fractions, Meredith builds two different models to support her reasoning, Steencken documents theemergence of the idea of equivalent fractions, traces retrospectively the origins of Meredith’s ideas, andthen follows the flow of Meredith’s ideas among her peers (Steencken, 2001;Steencken & Maher, 2003).Analyzing the contribution of participants, discursive practice on the mathematical ideas they build asthey resolve the Taxicab Problem,Powell (2003)distinguishes connected sequences of critical events inwhich participants, whose actions form a pivotal strand, implement a new agenda for action that qualita-tively changes their problem-solving activity, and thus he develops the construct of a watershed critical

424 A.B. Powell et al. / Journal of Mathematical Behavior 22 (2003) 405–435
Fig. 4. Coding and constructing a storyline. Coding for Dörfler’s prototypes and protocol. The commentary provides elementsof a storyline.

A.B. Powell et al. / Journal of Mathematical Behavior 22 (2003) 405–435 425
Fig. 4. (Continued)

426 A.B. Powell et al. / Journal of Mathematical Behavior 22 (2003) 405–435
Fig. 4. (Continued)

A.B. Powell et al. / Journal of Mathematical Behavior 22 (2003) 405–435 427
Fig. 4. (Continued)
428 A.B. Powell et al. / Journal of Mathematical Behavior 22 (2003) 405–435
Fig. 4. (Continued)
A.B. Powell et al. / Journal of Mathematical Behavior 22 (2003) 405–435 429
Fig. 4. (Continued).
event. Computer-related hardware and software devices can make flagging for codes easier and also helpin documenting, storing, and managing codes and their content.
We have indicated that researchers are guided in the codes that they develop by their theoretical frame-work, their research questions, and the nexus of what they observe. Below is an example of specific codes,developed byWalter and Maher (2001, 2002). These inductive or emergent codes focus on identifyingthemes and patterns of student-to-student discursive interactions.
(QA) Question that checks attunement between participants’ understandings and seeks demonstratedmutual agreement;
(QI) Interrogative question for information that is not procedural;(QP) Procedural question;(QC) Confirmation request by participant regarding participant’s own conceptual understanding, differs
from attunement by not demonstrating concern for “the other’s” understanding;(QS) Speculative question that posits potential; and(QR) Rhetorical question.
In particular, these codes focus on the nature of student-to-student questions.Our analytic model is also compatible with the implementation of deductive ora priori codes. The
theoretical perspective ofDörfler (2000)for understanding the constructing of mathematical meaningoffers an analytic lens for examining our video data. We illustrate this with the work of four participants’work on the Taxicab Problem (seeFig. 1). The use of Dörfler’s constructs — prototypes and protocols— provides a useful tool for inquiring into our central research question (What mathematical ideas dolearners generate?). As an illustration, we present below operational definitions of these constructs forour coding and analytic purposes.
1. Prototypes:(a) Figurative prototype (FP): Learners are engaged with a figurative prototype when they focus their
attention and exhibit interest exclusively in the physical or geometric aspect of an object as aninstantiation of a particular idea. The object is the carrier of a figurative prototype for the particularidea.
(b) Relational prototype (RP): Learners are engaged with a relational prototype when they focus theirattention on, exhibit interest in, or constitute (conceive) relationships among elements of an objectas instantiations of particular mathematical relations. Relations are readinto the elements of anobject. The object is the carrier of a relational prototype for the particular idea.
(c) Operative prototype (OP): Learners are engaged with an operative prototype when they focus theirattention on, exhibit interest in, or execute actions that use, transform, or produce an object. Theobject is the carrier of an operative prototype for the particular idea. The actions are connected torelational prototypes.

430 A.B. Powell et al. / Journal of Mathematical Behavior 22 (2003) 405–435
2. Protocol (P): Learners build a protocol when observing, reflecting on, or describing the essentialstages, phases, results, and products of activities, constructions, actions or flow of actions, includingspeech acts. Learners engaged with a protocol create inscriptions when they describe verbally or inwriting (symbols, systems of symbols, including diagrams) their actions. The symbolization or carrierof a protocol makes visible aspects of the results of learners’ cognitive process that may otherwisenot be perceptible. Researchers have evidence of protocols in the carriers that learners produce. Aparticular protocol arises from a specific situation but might be used to describe other, more generalsituations.
Learners can establish protocols by observing others carrying out actions and, according to theirinterpretations, noting those actions. The resulting protocol evidenced by its carrier expresses theirfocus of interest and attention.3
In Fig. 4, we present analyses of an episode from the video data of the research session with participantsworking on the Taxicab Problem. Next to excerpts of the transcript, researchers code for the instances ofthe participants engaged with prototypes and protocol. Above the excerpt, researchers write commentarythat discusses and justifies the identified material. At this phase, such commentary often manifests analyticthreads of a narrative or a storyline.
2.6. Constructing storyline
A phase that often follows coding in our data analysis is that of identifying or constructing a storyline.The storyline is the result of making sense of the data with particular attention to identified codes (seeFig. 4). In our model, researchers examine closely and intensively identified codes and their respectivecritical events, trying to discern an emerging and evolving narrative about the data. This process maybe as time consuming as identifying critical events or codes. At this analytical phase, data interpretationand inferences play important roles. Constructing a storyline requires the researcher to come up withinsightful and coherent organizations of the critical events, often involving complex flowcharting. Thisprocess often involves discerningtraces, which are a collection of events, first coded and then interpreted,to provide insight into a student’s cognitive development (Maher & Davis, 1996; Maher & Speiser, 1997).The trace contributes to the narrative of a student’s personal intellectual history as well as to the collectivehistory of a group of students who collaborate.
The process of making sense of the critical events and codes is complex and, more often than not,nonlinear. Researchers may have to go back and forth examining critical events, codes and other non-videodata such as participants’ inscriptions and researchers’ field notes. Some critical events or codes may bedropped and new ones searched for, as more evidence may be needed. Some researchers may wish toinclude participants or other researchers in data interpretations. Once again, much of the way in whichvideo recording enhances the identification of critical events and coding applies here. Repeated viewingallows researchers the opportunity to continually refine their interpretations of a particular episode ofvideo data. Shared viewing involving participants or other researchers, as well as the great detail thatoften accompanies video data can enhance the quality of the interpretations. Navigational tools of videotechnology allow researchers to search and juxtapose critical events in ways that highlight important
3 These coding categories are based on the work ofDörfler (2000): Means for meaning. In: P. Cobb, E. Yackel, & K. McClain(Eds.),Symbolizing and communicating in mathematics classrooms: perspectives on discourse, tools, and instructional design(pp. 99–131). Mahwah, NJ: Lawrence Erlbaum Associates, and on personal communications with Willi Dörfler.

A.B. Powell et al. / Journal of Mathematical Behavior 22 (2003) 405–435 431
insights on students’ mathematical thinking and understanding. This is particularly useful for longitudinalstudies, where important evidence may be lost over time.
2.7. Composing narrative
Although in our model a narrative phase appears last, narrative and other interpretive actions actuallybegin from the inception of research. Researchers’ questions as well as data-gathering procedures andmedia all imply explicit or implicit choices informed by open or hidden, conscious or unexaminedtheoretical perspectives. It is in this sense that the construction of a narrative begins at the initiation ofresearch and accounts for why somewhere within a research report, researchers outline their theoreticalbiases. Notwithstanding sampling decisions that occur before and while gathering data, writing occursin all phases of our research model even though our model announces that interpretive discussions andresults occur after data coding. Obviously, the writing of analytic memoranda is an obvious example ofresearchers engaging in interpretation before this phase. Nevertheless, at this phase, researchers view thewhole of whatever portion of recorded material form the data set to which research questions are beingaddressed. They decompose this whole into smaller segments, interpreting the smaller segments in lightof the whole and then recompose the whole in light of a storyline and explore a particular interpretationof the whole using data as evidence, thereby producing a written narrative (Erickson, 1992). Even inthe process of writing, the researcher is engaged in some form of data analysis, constantly revisiting thedata and refining earlier interpretations. Furthermore, it is important to note that, as mentioned earlier,advances in video-streaming technologies on the World Wide Web and hyperlinks enable researchers tointegrate clips of video recordings into reports accessible through the Web.4
2.8. Conclusion
We have reviewed some literature on the use of videotape in research on mathematics learning andteaching and we have outlined an evolving analytical model for use with video data when investigating thedevelopment of mathematical thinking. While reflecting on the model, the reader may recognize familiarstages of data analysis, only here referred to differently. While this may be true, our intent is to emphasizehow research on the development of mathematical thinking is enhanced by video data and how our modeltakes advantage of this enhancement.
Another issue in the presentation of our model concerns its sequential form. We do not intend to suggesta fixed, immutable order in which analysis of video data must proceed. We do recognize that video-dataanalysis can follow a different sequence and that certain analytic phases may not be emphasized orincluded in the analysis at all. Some researchers may decide not to write descriptions of the contentof videotapes as they watch them to familiarize themselves with the data. Instead, they might skip thedescribing phase and proceed directly to watching a tape and identifying critical events. Even when allphases occur in analysis, researchers may cycle back and forth revisiting other phases of the model intheir attempt to generate insightful and coherent narratives of students’ mathematical thinking.
It is important to note that our model rests on particular theoretical assumptions concerning math-ematical thinking and the practice of research. Over the years, theories on the development of mentalrepresentations (Davis et al., 1992) on the growth of mathematical understanding (Pirie, 1996; Pirie &
4 This can be accomplished, for example, with the application, VideoPaper Builder 2,http://vpb.concord.org/.

432 A.B. Powell et al. / Journal of Mathematical Behavior 22 (2003) 405–435
Kieren, 1994) and even more recent ideas on mathematical meaning (Dörfler, 2000) have contributedto the development of this model, especially on issues related to deciding how to go about studyingmathematical thinking. For instance, coding for mathematical representations rests on the assumptionthat “central to doing mathematics is the construction of external and internal (re)presentations” (Dörfler& Maher, under review). This implies examining carefully students’ exteriorizations of thinking, be itthrough gestures, speech, or written work.
Our analytic model also builds on assumptions about the practice of research. For instance, in contradis-tinction to research that focuses on investigating students’ misconceptions or what they otherwise do notdo correctly, a distinguishing feature of questions entertained in our research program concerns under-standing, as students are socially engaged in mathematical tasks,whatmathematical ideas do individualstudents build andhowdo they employ their ideas so as to attain growth in their mathematical thinking.In our research program, as (Maher & Speiser, 2001) specify, the “what” is descriptive and the “how”narrative. Moreover, the “what” and the “how” perspective of our research program, and consequently ofour analytical model, informs the codes we develop to flag critical events as well as even which eventswe consider critical. Furthermore, we recognize that research on such a complex phenomenon like thedevelopment of mathematical thinking is not a linear, unidirectional process. Rather, it is a complex,cyclic, and recursive process that requires multiple visits with data as well as collaborative exchangesamong researchers with different analytical and theoretical foci so as to provide rich descriptions andnarratives of the phenomenon studied (Maher & Davis, 1996; Pirie & Kieren, 1994). As already indicated,these research practices are greatly enhanced by the evolving analytic model we have presented.
In this article, we have focused on the use of video data in small-scale studies. Obviously, large-scalestudies are also important and allow researchers to generalize results to larger populations. Nevertheless,we contend that they too must be based on careful, detailed analyses that are attentive to the complexityof the variables that affect learning and teaching of mathematics. For this reason we maintain that carefulobservational as well as other ethnographic studies must precede and inform large-scale studies. Themodel we propose is a step forward in developing an analytic approach using video data for observationalinvestigations into the development of learners’ mathematical ideas and forms of reasoning.
Acknowledgments
We have appreciated and benefited from the critical comments of Hanna N. Haydar, Nancy Mack, ElenaSteencken, Elizabeth Uptegrove, and Janet Walter. We also thank Robert Speiser for helpful conversationsconcerning theoretical and practical issues of videotape data analysis.
References
Alasuutari, P. (1996). Theorizing in qualitative research: a cultural studies perspective.Qualitative Inquiry, 2(4), 371–384.Alston, A., & Maher, C. A. (1990). Children’s connections among representations of mathematical ideas. In: T. N. D. Mendicuti
(Ed.),Proceedings of the Fourteenth Conference of the International Group for the Psychology of Mathematics Education(Vol. 2, pp. 3–10), Mexico.
Atkinson, J. M., & Heritage, J. (Eds.). (1984).Structures of social action: studies in conversational analysis. Cambridge:Cambridge University Press.
Bottorff, J. L. (1994). Using videotaped recordings in qualitative research. In: J. M. Morse (Ed.),Critical issues in qualitativeresearch methods(pp. 244–261). Thousand Oaks, CA: Sage.

A.B. Powell et al. / Journal of Mathematical Behavior 22 (2003) 405–435 433
Bruner, J. (1960/1977).The process of education. Cambridge: Harvard University Press.Charmaz, K. (1983). The grounded theory method: an explanation and interpretation. In: R. M. Emerson (Ed.),Contemporary
field research: a collection of readings(pp. 109–126). Boston: Little Brown.Charmaz, K., & Mitchell, R. G. (2001). Grounded theory in ethnography. In: P. Atkinson, A. Coffey, & S. Delamont (Eds.),
Handbook of ethnography(pp. 160–174). London: Sage.Clarke, D. (2001a). Complementary accounts methodology. In: D. Clarke (Ed.),Perspectives on practice and meaning in
mathematics and science classrooms. Dordrecht: Kluwer Academic Publishers.Clarke, D. (Ed.). (2001b).Perspectives on practice and meaning in mathematics and science classrooms. Dordrecht: Kluwer
Academic Publishers.Clement, J. (2000). Analysis of clinical interviews: foundations and model viability. In: A. E. Kelly, & R. Lesh (Eds.),Handbook
of research data design in mathematics and science education(pp. 547–589). Mahwah, NJ: Lawrence Erlbaum Associates.Cobb, P., & Whitenack, J. W. (1996). A method for conducting longitudinal analysis of classroom videorecordings and transcripts.
Educational Studies in Mathematics, 30, 213–228.Corbin, J., & Strauss, A. (1990). Grounded theory research: procedures, canons, and evaluative criteria.Qualitative Sociology,
13(1), 3–21.Creswell, J. W. (1998).Qualitative inquiry and research design: choosing among five traditions. Thousand Oaks, CA: Sage.Davis, R. B. (1984).Learning mathematics: the cognitive science approach to mathematics education. Norwood: Ablex.Davis, G. E. (1989). Children talking about children’s mathematics.Mathematics Education Research Journal, 1(2), 35–42.Davis, R. B., & Maher, C. A. (1990). What do we do when we ‘do mathematics’? In: N. Noddings (Ed.),Constructivist views of
the teaching and learning of mathematics(Vol. Monograph No. 4). Reston, VA: National Council of Teachers of Mathematics.Davis, R. B., & Maher, C. A. (1997). How students think: the role of representations. In: L. English (Ed.),Mathematical
reasoning: analogies, metaphors, and images(pp. 93–115). Hillsdale, NJ: Lawrence Erlbaum.Davis, R. B., Maher, C., & Martino, A. (1992). Using videotapes to study the construction of mathematical knowledge of
individual children working in groups.Journal of Science, Education, and Technology, 1(3), 177–189.Dörfler, W. (2000). Means for meaning. In: P. Cobb, E. Yackel, & K. McClain (Eds.),Symbolizing and communicating in
mathematics classrooms: perspectives on discourse, tools, and instructional design(pp. 99–131). Mahwah, NJ: LawrenceErlbaum Associates.
Erickson, F. (1992). The interface between ethnography and microanalysis. In: M. D. LeCompte, W. L. Millroy, & J. Preissle(Eds.),The handbook of qualitative research in education(pp. 201–225). San Diego, CA: Academic Press.
Gattegno, C. (1970).What we owe children: the subordination of teaching to learning. New York: Avon.Gattegno, C. (1974).The commonsense of teaching mathematics. New York: Educational Solutions.Gattegno, C. (1987).The science of education: Part 1: theoretical considerations. New York: Educational Solutions.Gattegno, C. (1988).The science of education: Part 2B: the awareness of mathematization. New York: Educational Solution.Ginsburg, H. P. (1997).Entering the child’s mind: the clinical interview in psychological research and practice. New York:
Cambridge University Press.Glaser, B. G., & Strauss, A. L. (1967).The discovery of grounded theory: strategies for qualitative research. New York: Aldine.Grimshaw, A. D. (1982). Sound–image data records for research on social interaction: some questions and answers.Sociological
Methods and Research, 11, 121–144.Hall, R. (2000). Videorecording as theory. In: R. Lesh (Ed.),Handbook of research data design in mathematics and science
education(pp. 647–664). Mahwah, NJ: Lawrence Erblaum Associates.Hammersley, M., & Atkinson, P. (1983).Ethnography: principles in practice. London: Tavistock.Haydar, H. N. (2002).The effect of clinical assessment training on teachers’ instructional efficacy. Unpublished doctoral
dissertation, Teachers College, Columbia University.Jefferson, G. (1984). Transcript notation. In: J. Heritage (Ed.),Structures of social action: studies in conversation analysis
(pp. ix–xvi). New York: Cambridge University Press.Kiczek, R. D. (2000).Tracing the development of probabilistic thinking: profiles from a longitudinal study. Unpublished doctoral
dissertation, Rutgers University, New Brunswick.Koschmann, T., Glenn, P., & Conlee, M. (2000). When is a problem-based tutorial not a tutorial? Analyzing the tutor’s role
in the emergence of a learning issue. In: C. E. Hmelo (Ed.),Problem-based learning: a research perspective on learninginteractions(pp. 53–74). Mahwah, NJ: Lawrence Erlbaum Associates.
Krause, E. F. (1986).Taxicab geometry: an adventure in non-Euclidean geometry. Mineola, NY: Dover.

434 A.B. Powell et al. / Journal of Mathematical Behavior 22 (2003) 405–435
Lesh, R., & Lehrer, R. (2000). Iterative refinement cycles for videotape analyses of conceptual change. In: R. Lesh (Ed.),Handbook of research data design in mathematics and science education(pp. 665–708). Mahwah, NJ: Lawrence ErblaumAssociates.
Maher, C. A. (1998). Kommunikation och konstruktivistisk undervisning (Communication and constructivist teaching). In: A.Engrstom (Ed.),Matematik och reflektion: en introduktion till konstruktivismen inom matematikdidaktiken(pp. 124–143).Lund, Sweden: Studenlitteratur.
Maher, C. A. (2002). How students structure their own investigations and educate us: what we’ve learned from a fourteen yearstudy. In: A. D. Cockburn, & E. Nardi (Eds.),Proceedings of the Twenty-Sixth Conference of the International Group for thePsychology of Mathematics Education(Vol. 1, pp. 31–46). Norwich, UK: School of Education and Professional Development,University of East Anglia.
Maher, C. A., & Alston, A. (1991). Building a representation of multiplication: a description and analysis of Angel’s recon-struction. In: P. Boero (Ed.),Proceedings of the Fifteenth Annual Conference of the International Group for the Psychologyof Mathematics Education(pp. 70–76). Blacksburg, VA: Virginia Polytechnic University.
Maher, C. A., & Davis, R. B. (1996). Children’s explorations leading to proof. In:Proceedings of the Mathematical SciencesInstitute of Education Conference on Proof. University of London, UK.
Maher, C. A., & Martino, A. M. (1996a). The development of the idea of mathematical proof: a 5-year case study.Journal forResearch in Mathematics Education, 27(2), 194–214.
Maher, C. A., & Martino, A. M. (1996b). Young children invent methods of proof: the gang of four. In: P. Nesher, L. P. Steffe,P. Cobb, B. Greer, & J. Golden (Eds.),Theories of mathematical learning(pp. 431–447). Mahwah, NJ: Lawrence ErlbaumAssociates.
Maher, C. A., & Martino, A. M. (2000). From patterns to theories: conditions for conceptual change.Journal of MathematicalBehavior, 19(2), 247–271.
Maher, C. A., Pantozzi, R. S., Martino, A. M., Steencken, E. P., & Deming, L. S. (1996).Analyzing students’ personal histories:foundations of mathematical ideas. Paper presented at the American Educational Research Association, New York.
Maher, C. A., & Speiser, R. (1997). How far can you go with block tower? Stephanie’s intellectual development.Journal forResearch in Mathematics Education, 16(2), 125–132.
Maher, C. A., & Speiser, R. (2001, April 13).Polynomials, Pascal’s triangle and the building of isomorphisms. Paper presentedat the American Educational Research Association.
Martin, L. C. (1999).The nature of the folding back phenomenon within the Pirie–Kieren theory for the growth of mathematicalunderstanding and the associated implications for teachers and learners of mathematics. Unpublished doctoral dissertation,University of Oxford, Oxford, UK.
Martino, A. M., & Maher, C. A. (1999). Teacher questioning to promote justification and generalization in mathematics: whatresearch practice has taught us.Journal of Mathematical Behavior, 18(1), 53–78.
McDermott, R. P., Gospodinoff, K., & Aron, J. (1978). Criteria for an ethnographically adequate description of concertedactivities and their contexts.Semiotica, 24(3/4), 245–275.
Menger, K. (1952).You will like geometry: a guide book for the Illinois Institute of Technology geometry exhibition at theMuseum of Science and Industry, Chicago.
Menger, K. (1979).Selected papers in logic and foundations, didactics, economics. Dordrecht: Reidel.Miles, M. B., & Huberman, A. M. (1994).Qualitative data analysis: an expanded sourcebook(2nd ed.). Thousand Oaks, CA:
Sage.Pirie, S. (1988). Understanding: instrumental relational intuitive constructed formalised. . . ? How can we know?For the Learning
of Mathematics, 8(3), 2–6.Pirie, S. E. B. (1996).What are the data? An exploration of the use of video-recording as a data gathering tool in the mathematics
classroom. Paper presented at the Sixteenth Annual Meeting of the International Group for the Psychology of MathematicsEducation — North America, Florida State University, Panama City.
Pirie, S. E. B. (1998). Where do we go from here? In: A. R. Teppo (Ed.),Qualitative research methods in mathematics education(Vol. Monograph No. 9, pp. 156–163). Reston, VA: National Council of Teachers of Mathematics.
Pirie, S. E. B. (2001). Analysis, lies, and videotape. In: R. Speiser, C. A. Maher, & C. N. Walter (Eds.),Proceedings of theTwenty-Third Annual Meeting of the North American Chapter of the International Group for the Psychology of MathematicsEducation (Snowbird, Utah)(Vol. I, pp. 346–350). Columbus, OH: ERIC Clearinghouse for Science, Mathematics, andEnvironmental Education.

A.B. Powell et al. / Journal of Mathematical Behavior 22 (2003) 405–435 435
Pirie, S., & Kieren, T. (1989). A recursive theory of mathematical understanding.For the Learning of Mathematics, 9(3), 7–11.Pirie, S., & Kieren, T. (1994). Growth in mathematical understanding: how can we characterize it and how can we represent it?
Educational Studies in Mathematics, 26(2/3), 165–190.Powell, A. B. (2003).“So let’s prove it!”: emergent and elaborated mathematical ideas and reasoning in the discourse and
inscriptions of learners engaged in a combinatorial task. Unpublished doctoral dissertation, The State University of NewJersey, Rutgers.
Powell, A. B., & Maher, C. A. (2002). Inquiry into the interlocution of students engaged with mathematics: appreciatinglinks between research and practice. In: D. S. Mewborn, P. Sztajn, D. Y. White, H. G. Wiegel, R. L. Bryant, & K. Nooney(Eds.),Proceedings of the Twenty-Fourth Annual Meeting of the North American Chapter of the International Group for thePsychology of Mathematics Education (Athens, Georgia)(Vol. 1, pp. 317–329). Columbus, OH: ERIC Clearinghouse forScience, Mathematics, and Environmental Education.
Powell, A. B., & Maher, C. A. (2003). Heuristics of twelfth graders building isomorphisms. In: N. A. Pateman, B. J. Dougherty,& J. T. Zilliox (Eds.),Proceedings of the 2003 Joint Meeting of PME and PMENA(Vol. 4, pp. 23–30). Honolulu: CRDG,College of Education, University of Hawaii.
Roschelle, J. (2000). Choosing and using video equipment for data collection. In: R. Lesh (Ed.),Handbook of research datadesign in mathematics and science education(pp. 709–731). Mahwah, NJ: Lawrence Erblaum Associates.
Speiser, R., & Walter, C. (2000).Five women build a number system. Stamford, CT: Ablex.Speiser, B., & Walter, C. (2003). Getting at the mathematics: Sara’s journal. In: N. A. Pateman, B. J. Dougherty, & J. T. Zilliox
(Eds.),Proceedings of the 2003 Joint Meeting of PME and PMENA(Vol. 4, pp. 245–249). Honolulu: CRDG, College ofEducation, University of Hawaii.
Steencken, E. P. (2001).Tracing the growth of understanding of fraction ideas: a fourth grade case study. Unpublished doctoraldissertation. Dissertation Abstracts International 3009381, Rutgers University.
Steencken, E. P., & Maher, C. A. (2003). Tracing fourth grader’s learning of fractions: episodes from a yearlong teachingexperiment.The Journal for Mathematical Behavior, 22(2), 113–132.
Stigler, J. W., Gonzales, P., Kawanaka, T., Knoll, S., & Serrano, A. (1999).The TIMSS Videotape Classroom Study: methods andfindings from an exploratory research project on eighth-grade mathematics instruction in Germany, Japan, and the UnitedStates(Research and Development Report No. NCES 99-074). Washington, DC: U.S. Department of Education, NationalCenter for Education Statistics.
Stigler, J. W., & Hiebert, J. (1999).The teaching gap: best ideas from the world’s teachers for improving education in theclassroom. New York: Free Press.
Suchman, L. A., & Trigg, R. H. (1991). Understanding practice: video as a medium for reflection and design. In: J. Greenbaum,& M. Kyng (Eds.),Design at work: cooperative design of computer systems(pp. 65–89). Hillsdale, NJ: Lawrence Erlbaum.
Walter, J. G. (2001). Building mathematical meaning without teacher intervention: analysis of the discourse of precalculusstudents. In: R. Speiser, C. A. Maher, & C. N. Walter (Eds.),Proceedings of the Twenty-Fourth Annual Meeting of theNorth American Chapter of the International Group for the Psychology of Mathematics Education (Snowbird, Utah)(Vol. 1,pp. 539–548). Columbus, OH: ERIC Clearinghouse for Science, Mathematics, and Environmental Education.
Walter, J. G., & Maher, C. A. (2002). Student-to-student questioning in the development of mathematical understanding: sixhigh school students mathematizing a shell. In: K. Nooney (Ed.),Proceedings of the Twenty-Fourth Annual Meeting of theNorth American Chapter of the International Group for the Psychology of Mathematics Education (Athens, Georgia)(Vol.2, pp. 1009–1018). Columbus, OH: ERIC Clearinghouse for Science, Mathematics, and Environmental Education.
Copyright © 2022 FDOKUMEN