An analytic hierarchy process for ranking operating costs of low cost and full service airlines
7
An analytic hierarchy process for ranking operating costs of low cost and full service airlines Maria Berrittella a, * , Luigi La Franca b , Pietro Zito a a Centro Interdipartimentale di Ricerca per la Programmazione Informatica dell’Economia e Tecnologia, Universita ` degli Studi di Palermo, Palermo, Italy b Dipartimento di Ingegneria dei Trasporti, Universita ` degli Studi di Palermo, Palermo, Italy Keywords: Full service and low cost airlines Analytic hierarchy process Operating costs Monte Carlo Simulation abstract This paper develops an application of the analytic hierarchy process to rank the operating cost components of full service and low cost airlines. It takes into account the financial balance sheets and answers to a questionnaire submitted to the managers of selected airlines. The results suggest that the analytic hierarchy process can be appropriately used to obtain the ranking of the costs taking into account different views: financial, management and operative. Rental, office equipment and other supplies costs show the highest importance in the cost ranking, both for full services and low cost airlines. The robustness of the results is tested by Monte Carlo analysis. Ó 2008 Elsevier Ltd. All rights reserved. 1. Introduction Airline competition has increased considerably since deregula- tion in the US in the late 1970s. Subsequently, intra-EU traffic was liberalized in the late 1990s and any airline with a valid Air Oper- ators Certificate can operate within the Union’s borders. This has facilitated entry into the airline market and led to an increase in the number of low cost airlines (LCAs), mainly in Europe, but also in other parts of the world, such as Australia (Virgin Blue), Canada (West Jet) and Malaysia (Air Asia). Unlike a full service airline (FSA), an LCA focuses its strategy on cost minimization. Thus, an FSA bears much heavier overheads deriving from the hub and spoke modus operandi, which is based on the primary need to increase the load factor and to optimize aircraft capacity using feeder routes at the hubs. Alliances have allowed sharing of overheads and capacity more effectively. Promotional fares have been introduced to increase capacity (Lijesen et al., 2002). FSA alliances and code sharing have been put in place to face LCA competitiveness. Furthermore, high fixed costs combined with decreasing demand yield cyclical profits. The reduction in capacity during off peak periods is considered a crucial factor for cost control. A decrease in capacity also reduces associated variable costs – labour, fuel and maintenance (Gillen and Lall, 2004). Business passengers, who often seek frequent scheduling, inter- flight flexibility and ground service linkages, are the most impor- tant customers of the FSAs. They are willing to pay a premium for personal space and comfort on board, in-flight entertainment, free food and alcoholic drinks, frequent flier programmes, free airport lounges and use of major city airports, typically, with higher landing charges. By contrast, the LCA cuts costs by reducing over- heads, providing no frills service and often using secondary or regional airports with lower landing charges. Inventory manage- ment is simplified by the absence of feeder routes, direct or online booking and ticketless operation. Moreover, LCAs have opened up a wider range of point to point routes, many of them not served by FSAs. LCAs have attracted their share of passengers, often young and leisure travellers, who are more sensitive to fare levels (Morrell, 2005). Passengers travelling on LCAs place great importance on price and appear to arrange their itineraries using the cheapest fares. Travellers are willing to connect through secondary airports and to accept no frills in exchange for low fares. Instead, passengers travelling on FSAs place strong emphasis on reli- ability, quality, flight schedule, connections, frequent flier pro- grammes and comfort (O’Connell and Williams, 2005). For these reasons, LCAs usually fly point to point between European cities, and they may have difficulty getting suitable slots at large hub airports. Thus secondary airports are more attractive for these carriers. The arrival of an LCA leads to a permanent increase in traffic, so even if there are no differences in attributes of passengers that prefer LCAs, there is an increase in revenue from concessions and parking due to the number of flights. As Barbot (2006) argues, LCAs have important advantages through using secondary airports: no problem with the availability of slots, absence of congestion and low aeronautical charges. All this allows on schedule departures and arrivals and quick services. * Corresponding author. E-mail address: [email protected] (M. Berrittella). Contents lists available at ScienceDirect Journal of Air Transport Management journal homepage: www.elsevier.com/locate/jairtraman 0969-6997/$ – see front matter Ó 2008 Elsevier Ltd. All rights reserved. doi:10.1016/j.jairtraman.2008.11.006 Journal of Air Transport Management 15 (2009) 249–255
Transcript of An analytic hierarchy process for ranking operating costs of low cost and full service airlines
lable at ScienceDirect
Journal of Air Transport Management 15 (2009) 249–255
Contents lists avai
Journal of Air Transport Management
journal homepage: www.elsevier .com/locate/ ja i r t raman
An analytic hierarchy process for ranking operating costs of low cost and fullservice airlines
Maria Berrittella a,*, Luigi La Franca b, Pietro Zito a
a Centro Interdipartimentale di Ricerca per la Programmazione Informatica dell’Economia e Tecnologia, Universita degli Studi di Palermo, Palermo, Italyb Dipartimento di Ingegneria dei Trasporti, Universita degli Studi di Palermo, Palermo, Italy
Keywords:Full service and low cost airlinesAnalytic hierarchy processOperating costsMonte Carlo Simulation
* Corresponding author.E-mail address: [email protected] (M. Berr
0969-6997/$ – see front matter � 2008 Elsevier Ltd.doi:10.1016/j.jairtraman.2008.11.006
a b s t r a c t
This paper develops an application of the analytic hierarchy process to rank the operating costcomponents of full service and low cost airlines. It takes into account the financial balance sheets andanswers to a questionnaire submitted to the managers of selected airlines. The results suggest that theanalytic hierarchy process can be appropriately used to obtain the ranking of the costs taking intoaccount different views: financial, management and operative. Rental, office equipment and othersupplies costs show the highest importance in the cost ranking, both for full services and low costairlines. The robustness of the results is tested by Monte Carlo analysis.
� 2008 Elsevier Ltd. All rights reserved.
1. Introduction
Airline competition has increased considerably since deregula-tion in the US in the late 1970s. Subsequently, intra-EU traffic wasliberalized in the late 1990s and any airline with a valid Air Oper-ators Certificate can operate within the Union’s borders. This hasfacilitated entry into the airline market and led to an increase in thenumber of low cost airlines (LCAs), mainly in Europe, but also inother parts of the world, such as Australia (Virgin Blue), Canada(West Jet) and Malaysia (Air Asia). Unlike a full service airline (FSA),an LCA focuses its strategy on cost minimization. Thus, an FSA bearsmuch heavier overheads deriving from the hub and spoke modusoperandi, which is based on the primary need to increase the loadfactor and to optimize aircraft capacity using feeder routes at thehubs.
Alliances have allowed sharing of overheads and capacity moreeffectively. Promotional fares have been introduced to increasecapacity (Lijesen et al., 2002). FSA alliances and code sharing havebeen put in place to face LCA competitiveness. Furthermore, highfixed costs combined with decreasing demand yield cyclical profits.The reduction in capacity during off peak periods is considereda crucial factor for cost control. A decrease in capacity also reducesassociated variable costs – labour, fuel and maintenance (Gillen andLall, 2004).
Business passengers, who often seek frequent scheduling, inter-flight flexibility and ground service linkages, are the most impor-tant customers of the FSAs. They are willing to pay a premium for
ittella).
All rights reserved.
personal space and comfort on board, in-flight entertainment, freefood and alcoholic drinks, frequent flier programmes, free airportlounges and use of major city airports, typically, with higherlanding charges. By contrast, the LCA cuts costs by reducing over-heads, providing no frills service and often using secondary orregional airports with lower landing charges. Inventory manage-ment is simplified by the absence of feeder routes, direct or onlinebooking and ticketless operation. Moreover, LCAs have opened upa wider range of point to point routes, many of them not served byFSAs. LCAs have attracted their share of passengers, often youngand leisure travellers, who are more sensitive to fare levels (Morrell,2005).
Passengers travelling on LCAs place great importance onprice and appear to arrange their itineraries using the cheapestfares. Travellers are willing to connect through secondaryairports and to accept no frills in exchange for low fares. Instead,passengers travelling on FSAs place strong emphasis on reli-ability, quality, flight schedule, connections, frequent flier pro-grammes and comfort (O’Connell and Williams, 2005). For thesereasons, LCAs usually fly point to point between European cities,and they may have difficulty getting suitable slots at large hubairports. Thus secondary airports are more attractive for thesecarriers. The arrival of an LCA leads to a permanent increase intraffic, so even if there are no differences in attributes ofpassengers that prefer LCAs, there is an increase in revenuefrom concessions and parking due to the number of flights. AsBarbot (2006) argues, LCAs have important advantages throughusing secondary airports: no problem with the availability ofslots, absence of congestion and low aeronautical charges. Allthis allows on schedule departures and arrivals and quickservices.
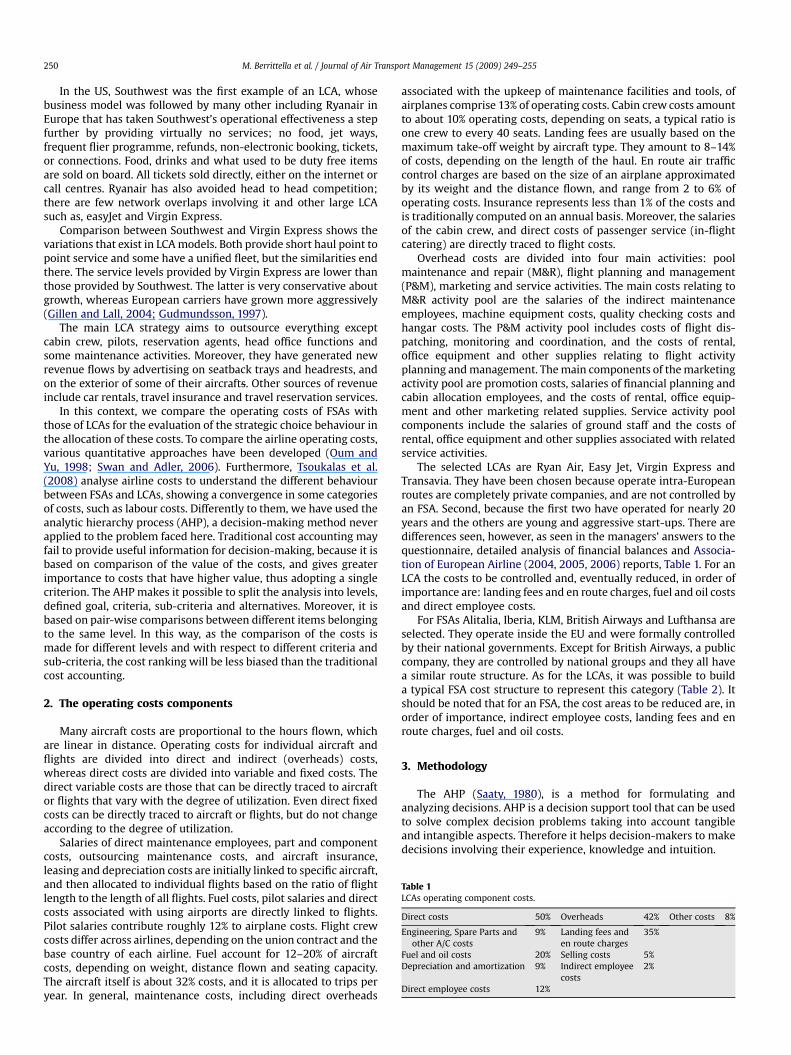
Table 1LCAs operating component costs.
Direct costs 50% Overheads 42% Other costs 8%
Engineering, Spare Parts andother A/C costs
9% Landing fees anden route charges
35%
Fuel and oil costs 20% Selling costs 5%Depreciation and amortization 9% Indirect employee
costs2%
Direct employee costs 12%
M. Berrittella et al. / Journal of Air Transport Management 15 (2009) 249–255250
In the US, Southwest was the first example of an LCA, whosebusiness model was followed by many other including Ryanair inEurope that has taken Southwest’s operational effectiveness a stepfurther by providing virtually no services; no food, jet ways,frequent flier programme, refunds, non-electronic booking, tickets,or connections. Food, drinks and what used to be duty free itemsare sold on board. All tickets sold directly, either on the internet orcall centres. Ryanair has also avoided head to head competition;there are few network overlaps involving it and other large LCAsuch as, easyJet and Virgin Express.
Comparison between Southwest and Virgin Express shows thevariations that exist in LCA models. Both provide short haul point topoint service and some have a unified fleet, but the similarities endthere. The service levels provided by Virgin Express are lower thanthose provided by Southwest. The latter is very conservative aboutgrowth, whereas European carriers have grown more aggressively(Gillen and Lall, 2004; Gudmundsson, 1997).
The main LCA strategy aims to outsource everything exceptcabin crew, pilots, reservation agents, head office functions andsome maintenance activities. Moreover, they have generated newrevenue flows by advertising on seatback trays and headrests, andon the exterior of some of their aircrafts. Other sources of revenueinclude car rentals, travel insurance and travel reservation services.
In this context, we compare the operating costs of FSAs withthose of LCAs for the evaluation of the strategic choice behaviour inthe allocation of these costs. To compare the airline operating costs,various quantitative approaches have been developed (Oum andYu, 1998; Swan and Adler, 2006). Furthermore, Tsoukalas et al.(2008) analyse airline costs to understand the different behaviourbetween FSAs and LCAs, showing a convergence in some categoriesof costs, such as labour costs. Differently to them, we have used theanalytic hierarchy process (AHP), a decision-making method neverapplied to the problem faced here. Traditional cost accounting mayfail to provide useful information for decision-making, because it isbased on comparison of the value of the costs, and gives greaterimportance to costs that have higher value, thus adopting a singlecriterion. The AHP makes it possible to split the analysis into levels,defined goal, criteria, sub-criteria and alternatives. Moreover, it isbased on pair-wise comparisons between different items belongingto the same level. In this way, as the comparison of the costs ismade for different levels and with respect to different criteria andsub-criteria, the cost ranking will be less biased than the traditionalcost accounting.
2. The operating costs components
Many aircraft costs are proportional to the hours flown, whichare linear in distance. Operating costs for individual aircraft andflights are divided into direct and indirect (overheads) costs,whereas direct costs are divided into variable and fixed costs. Thedirect variable costs are those that can be directly traced to aircraftor flights that vary with the degree of utilization. Even direct fixedcosts can be directly traced to aircraft or flights, but do not changeaccording to the degree of utilization.
Salaries of direct maintenance employees, part and componentcosts, outsourcing maintenance costs, and aircraft insurance,leasing and depreciation costs are initially linked to specific aircraft,and then allocated to individual flights based on the ratio of flightlength to the length of all flights. Fuel costs, pilot salaries and directcosts associated with using airports are directly linked to flights.Pilot salaries contribute roughly 12% to airplane costs. Flight crewcosts differ across airlines, depending on the union contract and thebase country of each airline. Fuel account for 12–20% of aircraftcosts, depending on weight, distance flown and seating capacity.The aircraft itself is about 32% costs, and it is allocated to trips peryear. In general, maintenance costs, including direct overheads
associated with the upkeep of maintenance facilities and tools, ofairplanes comprise 13% of operating costs. Cabin crew costs amountto about 10% operating costs, depending on seats, a typical ratio isone crew to every 40 seats. Landing fees are usually based on themaximum take-off weight by aircraft type. They amount to 8–14%of costs, depending on the length of the haul. En route air trafficcontrol charges are based on the size of an airplane approximatedby its weight and the distance flown, and range from 2 to 6% ofoperating costs. Insurance represents less than 1% of the costs andis traditionally computed on an annual basis. Moreover, the salariesof the cabin crew, and direct costs of passenger service (in-flightcatering) are directly traced to flight costs.
Overhead costs are divided into four main activities: poolmaintenance and repair (M&R), flight planning and management(P&M), marketing and service activities. The main costs relating toM&R activity pool are the salaries of the indirect maintenanceemployees, machine equipment costs, quality checking costs andhangar costs. The P&M activity pool includes costs of flight dis-patching, monitoring and coordination, and the costs of rental,office equipment and other supplies relating to flight activityplanning and management. The main components of the marketingactivity pool are promotion costs, salaries of financial planning andcabin allocation employees, and the costs of rental, office equip-ment and other marketing related supplies. Service activity poolcomponents include the salaries of ground staff and the costs ofrental, office equipment and other supplies associated with relatedservice activities.
The selected LCAs are Ryan Air, Easy Jet, Virgin Express andTransavia. They have been chosen because operate intra-Europeanroutes are completely private companies, and are not controlled byan FSA. Second, because the first two have operated for nearly 20years and the others are young and aggressive start-ups. There aredifferences seen, however, as seen in the managers’ answers to thequestionnaire, detailed analysis of financial balances and Associa-tion of European Airline (2004, 2005, 2006) reports, Table 1. For anLCA the costs to be controlled and, eventually reduced, in order ofimportance are: landing fees and en route charges, fuel and oil costsand direct employee costs.
For FSAs Alitalia, Iberia, KLM, British Airways and Lufthansa areselected. They operate inside the EU and were formally controlledby their national governments. Except for British Airways, a publiccompany, they are controlled by national groups and they all havea similar route structure. As for the LCAs, it was possible to builda typical FSA cost structure to represent this category (Table 2). Itshould be noted that for an FSA, the cost areas to be reduced are, inorder of importance, indirect employee costs, landing fees and enroute charges, fuel and oil costs.
3. Methodology
The AHP (Saaty, 1980), is a method for formulating andanalyzing decisions. AHP is a decision support tool that can be usedto solve complex decision problems taking into account tangibleand intangible aspects. Therefore it helps decision-makers to makedecisions involving their experience, knowledge and intuition.
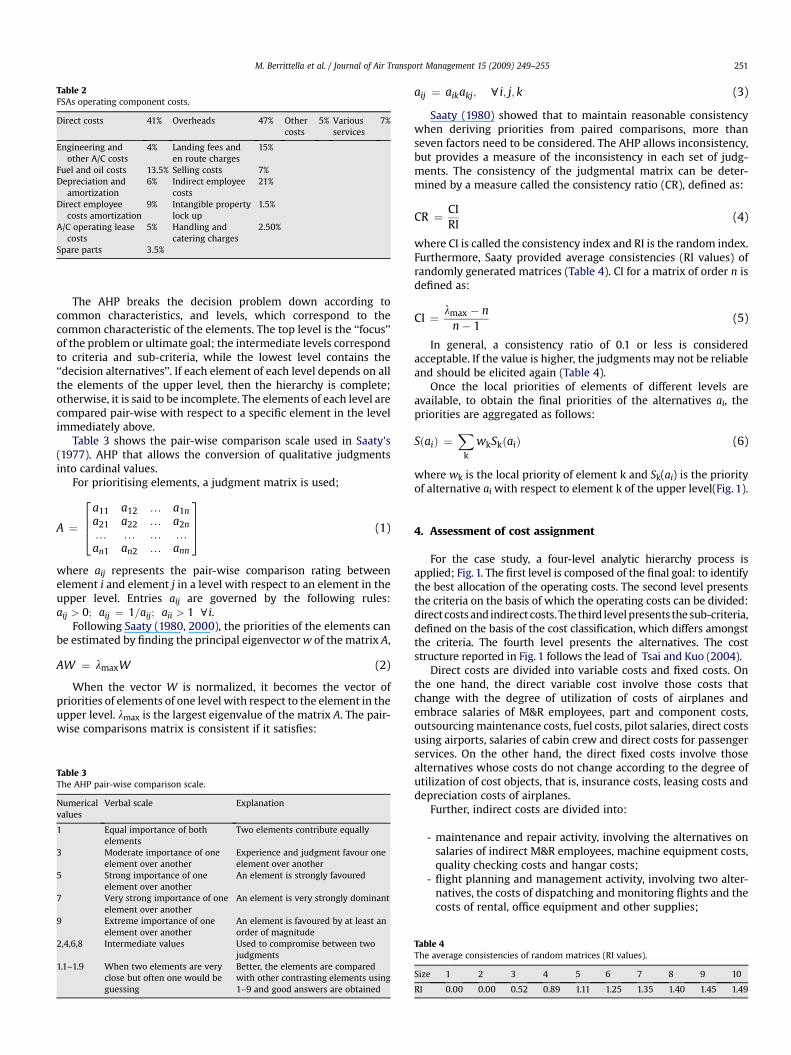
Table 2FSAs operating component costs.
Direct costs 41% Overheads 47% Othercosts
5% Variousservices
7%
Engineering andother A/C costs
4% Landing fees anden route charges
15%
Fuel and oil costs 13.5% Selling costs 7%Depreciation and
amortization6% Indirect employee
costs21%
Direct employeecosts amortization
9% Intangible propertylock up
1.5%
A/C operating leasecosts
5% Handling andcatering charges
2.50%
Spare parts 3.5%
M. Berrittella et al. / Journal of Air Transport Management 15 (2009) 249–255 251
The AHP breaks the decision problem down according tocommon characteristics, and levels, which correspond to thecommon characteristic of the elements. The top level is the ‘‘focus’’of the problem or ultimate goal; the intermediate levels correspondto criteria and sub-criteria, while the lowest level contains the‘‘decision alternatives’’. If each element of each level depends on allthe elements of the upper level, then the hierarchy is complete;otherwise, it is said to be incomplete. The elements of each level arecompared pair-wise with respect to a specific element in the levelimmediately above.
Table 3 shows the pair-wise comparison scale used in Saaty’s(1977). AHP that allows the conversion of qualitative judgmentsinto cardinal values.
For prioritising elements, a judgment matrix is used;
A ¼
2664
a11 a12 . a1na21 a22 . a2n. . . .an1 an2 . ann
3775 (1)
where aij represents the pair-wise comparison rating betweenelement i and element j in a level with respect to an element in theupper level. Entries aij are governed by the following rules:aij > 0; aij ¼ 1=aij; aii > 1 ci.
Following Saaty (1980, 2000), the priorities of the elements canbe estimated by finding the principal eigenvector w of the matrix A,
AW ¼ lmaxW (2)
When the vector W is normalized, it becomes the vector ofpriorities of elements of one level with respect to the element in theupper level. lmax is the largest eigenvalue of the matrix A. The pair-wise comparisons matrix is consistent if it satisfies:
Table 3The AHP pair-wise comparison scale.
Numericalvalues
Verbal scale Explanation
1 Equal importance of bothelements
Two elements contribute equally
3 Moderate importance of oneelement over another
Experience and judgment favour oneelement over another
5 Strong importance of oneelement over another
An element is strongly favoured
7 Very strong importance of oneelement over another
An element is very strongly dominant
9 Extreme importance of oneelement over another
An element is favoured by at least anorder of magnitude
2,4,6,8 Intermediate values Used to compromise between twojudgments
1.1–1.9 When two elements are veryclose but often one would beguessing
Better, the elements are comparedwith other contrasting elements using1–9 and good answers are obtained
aij ¼ aikakj; ci; j; k (3)
Saaty (1980) showed that to maintain reasonable consistencywhen deriving priorities from paired comparisons, more thanseven factors need to be considered. The AHP allows inconsistency,but provides a measure of the inconsistency in each set of judg-ments. The consistency of the judgmental matrix can be deter-mined by a measure called the consistency ratio (CR), defined as:
CR ¼ CIRI
(4)
where CI is called the consistency index and RI is the random index.Furthermore, Saaty provided average consistencies (RI values) ofrandomly generated matrices (Table 4). CI for a matrix of order n isdefined as:
CI ¼ lmax � nn� 1
(5)
In general, a consistency ratio of 0.1 or less is consideredacceptable. If the value is higher, the judgments may not be reliableand should be elicited again (Table 4).
Once the local priorities of elements of different levels areavailable, to obtain the final priorities of the alternatives ai, thepriorities are aggregated as follows:
SðaiÞ ¼X
k
wkSkðaiÞ (6)
where wk is the local priority of element k and Sk(ai) is the priorityof alternative ai with respect to element k of the upper level(Fig. 1).
4. Assessment of cost assignment
For the case study, a four-level analytic hierarchy process isapplied; Fig. 1. The first level is composed of the final goal: to identifythe best allocation of the operating costs. The second level presentsthe criteria on the basis of which the operating costs can be divided:directcosts and indirect costs. The third level presents the sub-criteria,defined on the basis of the cost classification, which differs amongstthe criteria. The fourth level presents the alternatives. The coststructure reported in Fig. 1 follows the lead of Tsai and Kuo (2004).
Direct costs are divided into variable costs and fixed costs. Onthe one hand, the direct variable cost involve those costs thatchange with the degree of utilization of costs of airplanes andembrace salaries of M&R employees, part and component costs,outsourcing maintenance costs, fuel costs, pilot salaries, direct costsusing airports, salaries of cabin crew and direct costs for passengerservices. On the other hand, the direct fixed costs involve thosealternatives whose costs do not change according to the degree ofutilization of cost objects, that is, insurance costs, leasing costs anddepreciation costs of airplanes.
Further, indirect costs are divided into:
- maintenance and repair activity, involving the alternatives onsalaries of indirect M&R employees, machine equipment costs,quality checking costs and hangar costs;
- flight planning and management activity, involving two alter-natives, the costs of dispatching and monitoring flights and thecosts of rental, office equipment and other supplies;
Table 4The average consistencies of random matrices (RI values).
Size 1 2 3 4 5 6 7 8 9 10
RI 0.00 0.00 0.52 0.89 1.11 1.25 1.35 1.40 1.45 1.49
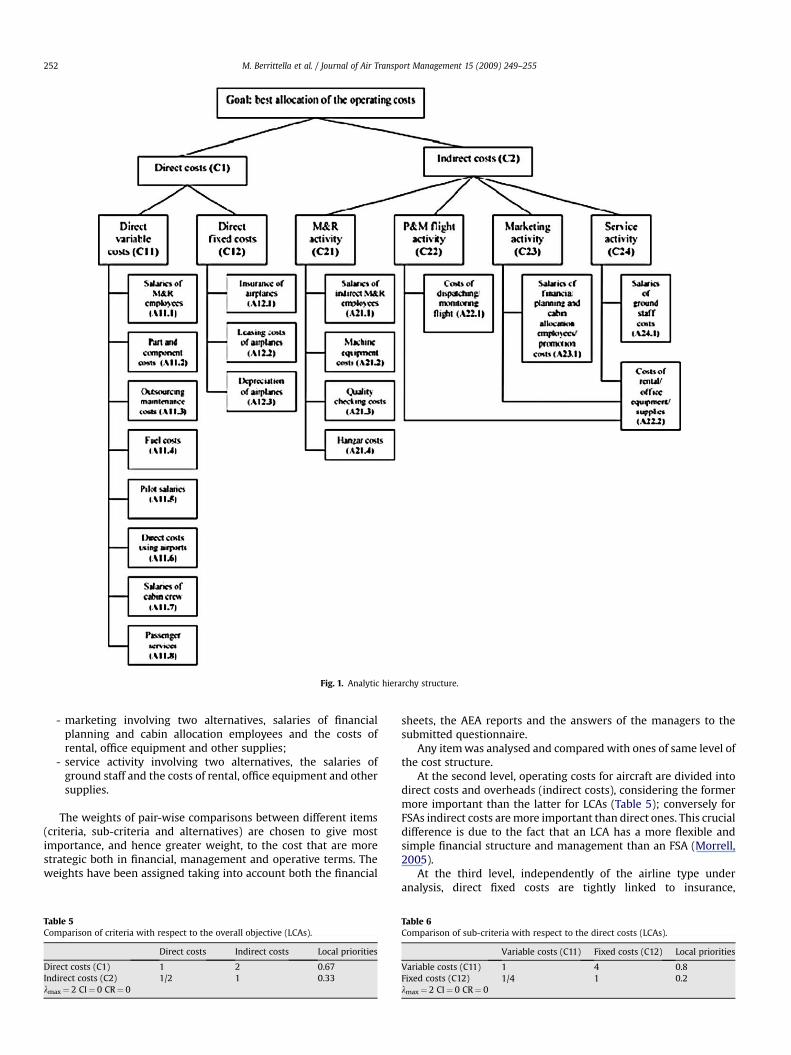
Fig. 1. Analytic hierarchy structure.
M. Berrittella et al. / Journal of Air Transport Management 15 (2009) 249–255252
- marketing involving two alternatives, salaries of financialplanning and cabin allocation employees and the costs ofrental, office equipment and other supplies;
- service activity involving two alternatives, the salaries ofground staff and the costs of rental, office equipment and othersupplies.
The weights of pair-wise comparisons between different items(criteria, sub-criteria and alternatives) are chosen to give mostimportance, and hence greater weight, to the cost that are morestrategic both in financial, management and operative terms. Theweights have been assigned taking into account both the financial
Table 5Comparison of criteria with respect to the overall objective (LCAs).
Direct costs Indirect costs Local priorities
Direct costs (C1) 1 2 0.67Indirect costs (C2) 1/2 1 0.33lmax¼ 2 CI¼ 0 CR¼ 0
sheets, the AEA reports and the answers of the managers to thesubmitted questionnaire.
Any item was analysed and compared with ones of same level ofthe cost structure.
At the second level, operating costs for aircraft are divided intodirect costs and overheads (indirect costs), considering the formermore important than the latter for LCAs (Table 5); conversely forFSAs indirect costs are more important than direct ones. This crucialdifference is due to the fact that an LCA has a more flexible andsimple financial structure and management than an FSA (Morrell,2005).
At the third level, independently of the airline type underanalysis, direct fixed costs are tightly linked to insurance,
Table 6Comparison of sub-criteria with respect to the direct costs (LCAs).
Variable costs (C11) Fixed costs (C12) Local priorities
Variable costs (C11) 1 4 0.8Fixed costs (C12) 1/4 1 0.2lmax¼ 2 CI¼ 0 CR¼ 0

Table 7Comparison of sub-criteria with respect to the indirect costs (LCAs).
M&Ractivity(C21)
P&M flightactivity (C22)
Marketingactivity (C23)
Serviceactivity(C24)
Localpriorities
M&R Activity(C21)
1 1/2 1/2 1/2 0.14
P&M flightactivity(C22)
2 1 1/2 1/2 0.2
Marketingactivity(C23)
2 2 1 1 0.33
Service activity(C24)
2 2 1 1 0.33
lmax¼ 4.05 CI¼ 0.018 CR¼ 0.02
M. Berrittella et al. / Journal of Air Transport Management 15 (2009) 249–255 253
depreciation of aircraft and leasing costs, which cannot easily bereduced, since they include the fleet characteristics, and in partic-ular the age and condition of the aircraft; by contrast, the directvariable costs can be reduced more effectively. For these reasons itis more appropriate to give a greater value to direct variable costs,equal to 4, than to direct fixed costs (Table 6). Related to indirectcosts, maintenance and repair activity costs can be reduced byusing a single aircraft typology. This choice allows scale economiesand reduction of spare parts and maintenance staff training costs.Planning and managing flight activity costs also depend essentiallyon aircraft typology and on the schedule adopted. Both types ofcarrier use scheduler software to optimize their networks, whichallows them to achieve savings in terms of time and rationalizationof route choices. Marketing and service activities costs are moreimportant than previous ones. They can be cut in order to reducethe indirect costs particularly for an LCA; whereas this is not truefor an FSA. In fact, service activities costs are mainly related toprovided ground services. Some FSAs engage a handling companyto market its services to others. For example, Alitalia Airline andwas accredited with the major part of Alitalia’s debts because itcould be helped by Italian government-subsidies; whereas Alitaliaitself could not. Thus, for most airlines, service activity costs cannotbe reduced, since services are regulated by contracts betweenairlines and handling companies. Furthermore for an FSA,marketing activities costs cannot easily be cut, since they havea complex financial structure. Thus higher weight are givencomponents for an LCA and lower weight for an FSA (Table 7).
Table 8Final priorities of the alternatives (LCAs).
Finalpriorities
Costs of rental, office equipment and other supplies (A22.2) 0.191Outsourcing maintenance costs (A11.3) 0.147Direct costs using airports (A11.6) 0.096Direct costs for passenger services (A11.8) 0.073Insurance of airplanes (A12.1) 0.066Part and component costs (A11.2) 0.052Salaries of cabin crew (A11.7) 0.046Salaries of M&R employees (A11.1) 0.044Pilot salaries (A11.5) 0.043Leasing costs of airplanes (A12.2) 0.041Salaries of financial planning and cabin allocation employees (A23.1) 0.037Salaries of ground staff (A24.1) 0.037Fuel costs (A11.4) 0.031Depreciation of airplanes (A12.3) 0.026Hangar costs (A21.4) 0.023Costs of dispatching and monitoring flights (A22.1) 0.022Machine equipment costs (A21.2) 0.011Salaries of indirect M&R employees (A21.1) 0.008Quality checking costs (A21.3) 0.005Total 1
At the fourth level, related to direct variable costs, salaries ofM&R Employees have the same share costs for both LCAs and FSAs;this item, like those relating to other salaries costs, is highlyinfluenced by trade unions, as well as fuel costs that have the samevalue for both airlines, because there is not a big fuel price differ-ence between them and they also introduce the so-called ‘‘FuelSurcharge Tax’’ into passengers’ tickets. Instead, great importance isgiven to ‘‘outsourcing maintenance costs’’ for LCAs, that usuallyoutsource this kind of services, while most FSAs have their ownmaintenance department. Almost all the basic passenger servicesduring LCA flights have been cut out and all others are sold, evenwith minimal comfort standards and services. On the other hand,all the FSAs give great importance to their comfort standards, sothese airlines do not cut these items in order to reduce theiroperating costs. The direct costs of using airports alternativehighlights the big difference between the airline typology. As LCAssearch for lower landing fees, usually at secondary airports, theFSAs operate from closer-to-town airports. For these reasons, for anLCA is give a greater value, three, with regard to outsourcingmaintenance, the direct costs of using airports and passengerservices, with a value of two, for the other cost components.Conversely, for an FSA more importance, a value of three, is given topart and component costs and passenger services.
Related to direct fixed costs, the fleet of most of the LCAs is madeup of new aircraft, in order to reduce the costs of maintenance andfuel consumption; so this kind of airline is less influenced bydepreciation. Instead, most of the FSAs have old and new aircrafts;thus, the insurance cost is slightly more significant than for theother items. Both the typologies of airlines have to offer the safetystandards imposed by the ICAO and FAA, so we decided do not focuson these costs.
A good supply and spare parts management is very important toreduce operating costs. From the view’s point of maintenance andrepair activity, the cost components related to hangar costs andmachine equipment costs are more important than other costs forboth kinds of airline, with assigned values, respectively, equal to 3and 2. This is due to the fact that such costs have a great impact onoperative management of an airline, age and type of aircraft,extension and type of airports’ network (supply hub and spoke,point to point and/or hybrid) and so on.
Relatively to flight planning and management (P&M), marketingand service activities, we decided to give great importance torental/office equipment/supplies, with a value equal to 4. In fact,this component is a very significant cost, mostly for FSAs, but alsofor some LCAs it may be too high. These costs can be reduced by i.e.kiosks or online/web check-in, or by outsourcing that make itpossible to reduce costs, as some LCAs are doing (e.g. Ryanair).
5. Results
By applying the procedure previously outlined, the results,reported in Table 5, indicate the higher importance of direct costs.
Table 9Impacts on alternative’ priorities of the Monte Carlo experiments of sub-criteria(LCAs).
Alternatives Mean%
Standarddeviation
Direct variable costs (A11.1–A11.8) 0.06 0.001–0.004Direct fixed costs (A12.1–A12.3) �0.23 0.003–0.007M&R activity (A21.1–A21.4) 0.36 0.001–0.002Costs of dispatching and monitoring flights (A22.1) 0.61 0.002Costs of rental, office equipment and other supplies
(A22.2)�0.06 0.003
Salaries of financial planning and cabin allocationemployees (A23.1)
�0.45 0.003
Salaries of ground staff (A24.1) �0.07 0.003
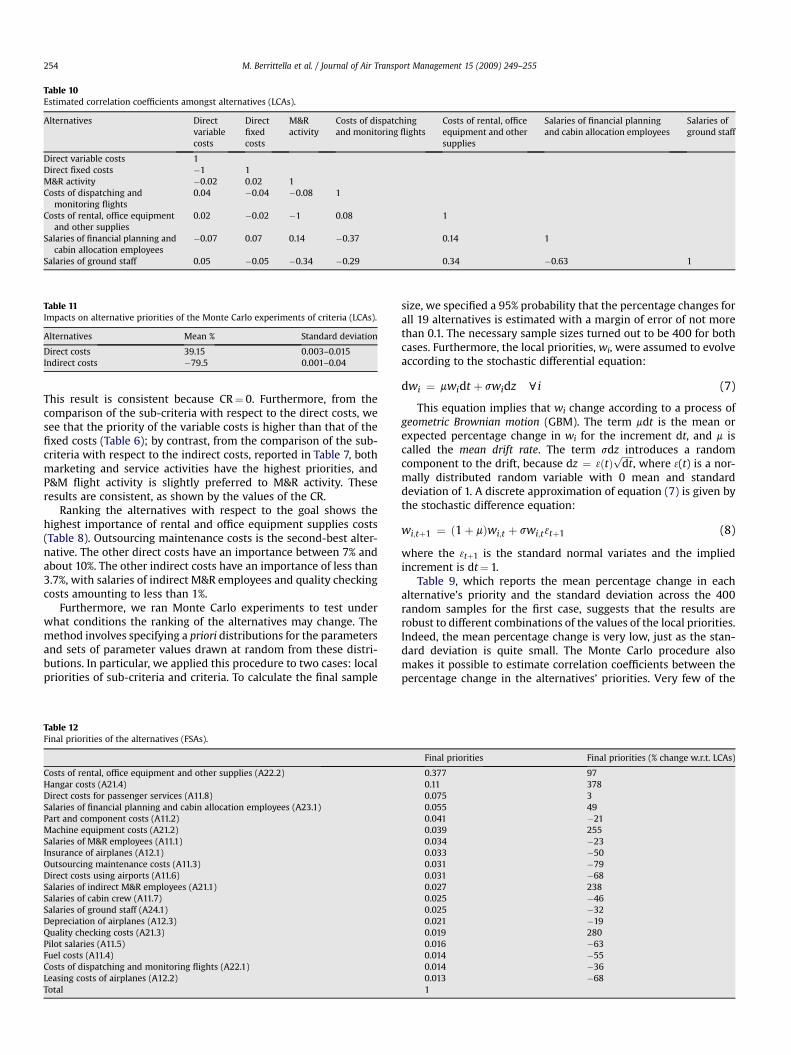
Table 10Estimated correlation coefficients amongst alternatives (LCAs).
Alternatives Directvariablecosts
Directfixedcosts
M&Ractivity
Costs of dispatchingand monitoring flights
Costs of rental, officeequipment and othersupplies
Salaries of financial planningand cabin allocation employees
Salaries ofground staff
Direct variable costs 1Direct fixed costs �1 1M&R activity �0.02 0.02 1Costs of dispatching and
monitoring flights0.04 �0.04 �0.08 1
Costs of rental, office equipmentand other supplies
0.02 �0.02 �1 0.08 1
Salaries of financial planning andcabin allocation employees
�0.07 0.07 0.14 �0.37 0.14 1
Salaries of ground staff 0.05 �0.05 �0.34 �0.29 0.34 �0.63 1
Table 11Impacts on alternative priorities of the Monte Carlo experiments of criteria (LCAs).
Alternatives Mean % Standard deviation
Direct costs 39.15 0.003–0.015Indirect costs �79.5 0.001–0.04
M. Berrittella et al. / Journal of Air Transport Management 15 (2009) 249–255254
This result is consistent because CR¼ 0. Furthermore, from thecomparison of the sub-criteria with respect to the direct costs, wesee that the priority of the variable costs is higher than that of thefixed costs (Table 6); by contrast, from the comparison of the sub-criteria with respect to the indirect costs, reported in Table 7, bothmarketing and service activities have the highest priorities, andP&M flight activity is slightly preferred to M&R activity. Theseresults are consistent, as shown by the values of the CR.
Ranking the alternatives with respect to the goal shows thehighest importance of rental and office equipment supplies costs(Table 8). Outsourcing maintenance costs is the second-best alter-native. The other direct costs have an importance between 7% andabout 10%. The other indirect costs have an importance of less than3.7%, with salaries of indirect M&R employees and quality checkingcosts amounting to less than 1%.
Furthermore, we ran Monte Carlo experiments to test underwhat conditions the ranking of the alternatives may change. Themethod involves specifying a priori distributions for the parametersand sets of parameter values drawn at random from these distri-butions. In particular, we applied this procedure to two cases: localpriorities of sub-criteria and criteria. To calculate the final sample
Table 12Final priorities of the alternatives (FSAs).
Costs of rental, office equipment and other supplies (A22.2)Hangar costs (A21.4)Direct costs for passenger services (A11.8)Salaries of financial planning and cabin allocation employees (A23.1)Part and component costs (A11.2)Machine equipment costs (A21.2)Salaries of M&R employees (A11.1)Insurance of airplanes (A12.1)Outsourcing maintenance costs (A11.3)Direct costs using airports (A11.6)Salaries of indirect M&R employees (A21.1)Salaries of cabin crew (A11.7)Salaries of ground staff (A24.1)Depreciation of airplanes (A12.3)Quality checking costs (A21.3)Pilot salaries (A11.5)Fuel costs (A11.4)Costs of dispatching and monitoring flights (A22.1)Leasing costs of airplanes (A12.2)Total
size, we specified a 95% probability that the percentage changes forall 19 alternatives is estimated with a margin of error of not morethan 0.1. The necessary sample sizes turned out to be 400 for bothcases. Furthermore, the local priorities, wi, were assumed to evolveaccording to the stochastic differential equation:
dwi ¼ mwidt þ swidz ci (7)
This equation implies that wi change according to a process ofgeometric Brownian motion (GBM). The term mdt is the mean orexpected percentage change in wi for the increment dt, and m iscalled the mean drift rate. The term sdz introduces a randomcomponent to the drift, because dz ¼ 3ðtÞ
ffiffiffiffiffidtp
, where 3(t) is a nor-mally distributed random variable with 0 mean and standarddeviation of 1. A discrete approximation of equation (7) is given bythe stochastic difference equation:
wi;tþ1 ¼ ð1þ mÞwi;t þ swi;t3tþ1 (8)
where the 3tþ1 is the standard normal variates and the impliedincrement is dt¼ 1.
Table 9, which reports the mean percentage change in eachalternative’s priority and the standard deviation across the 400random samples for the first case, suggests that the results arerobust to different combinations of the values of the local priorities.Indeed, the mean percentage change is very low, just as the stan-dard deviation is quite small. The Monte Carlo procedure alsomakes it possible to estimate correlation coefficients between thepercentage change in the alternatives’ priorities. Very few of the
Final priorities Final priorities (% change w.r.t. LCAs)
0.377 970.11 3780.075 30.055 490.041 �210.039 2550.034 �230.033 �500.031 �790.031 �680.027 2380.025 �460.025 �320.021 �190.019 2800.016 �630.014 �550.014 �360.013 �681
M. Berrittella et al. / Journal of Air Transport Management 15 (2009) 249–255 255
estimated correlation coefficients in Table 10 are large in magni-tude: only 3 estimated correlation coefficients are greater than 0.5(in absolute value). Thus, with some exceptions, the magnitude ofthe change in one type of costs provides little information about themagnitude of changes in other costs. This suggests that using onlyone or two costs could provide misleading information. MonteCarlo experiments for the second case show substantial variabilityin the mean percentage change (Table 11).
Finally, from comparison of the ranking of the alternativesbetween LCAs and FSAs, we see that costs relating to M&R activity(hangar costs, quality checking costs, salaries of indirect M&Remployees and machine equipment costs) substantially increasetheir importance in FSAs (Table 12).
6. Conclusions
The aim of this paper was to compare operating cost allocationof LCA versus FSA using the analytic hierarchy process. We assignedvalues of all the comparisons for any level by means of a question-naire submitted to the managers, an analysis of the airlines’financial sheets for selected FSAs and LCAs and AEA reports.Furthermore, a sensitivity analysis was carried out using MonteCarlo simulation, validating the robustness of the results. Theresults show that, differently to the traditional approaches, AHPcould be appropriately used to obtain the ranking of the coststaking into account different views: financial, management andoperative.
Costs of rental, office equipment and other supplies costs werefound to be the best alternative for both carriers. This is due to thecomplexity of the financial structure and management of thesecompanies, and suggests that the best way to reduce the operatingcosts is to simplify the airlines’ organization (for instance by kiosksor online/web check-in).
The second-best alternative is the hangar costs for FSAs. This isjustified by the fact that FSAs have a large number of groundedaircrafts, causing substantial loss of earnings. FSAs are still workingto fix this problem by re-planning the schedules of their flights inorder to better utilize their fleet capacity. For LCAs, the second-bestalternative is outsourcing maintenance costs, which are only in theninth position for FSAs. This is because many of the FSAs have theirown maintenance department.
It should be noted that salaries play a crucial role in costsreduction, since these costs allow high cost savings. LCAs havehigher aircraft and crew productivity than FSAs. This is possible inpart because of a single type fleet, but also because of the shorterturnaround times achieved through less catering and absence of
seat allocation. Pilot contracts encourage high productivity byreducing the fixed salary part, and increasing the variable partrelating to flight hours. This advantage is due to the differentbusiness model of an LCA compared to an FSA one. The real costsavings of an LCA are achieved by staff cuts and economies insubcontracts.
The most significant contribution to the lower cost of an LCAbusiness model comes from its labour productivity. In recruitmentand deployment of labour Ryanair, for example, faces a trade-offbetween providing inputs from within the airline and outsourcing.The latter leads to flexibility in choosing between differentsuppliers of service, such as aircraft maintenance, handling atairports, catering and in-flight magazines, since the company canchoose whether or not to renew contracts.
References
Association of European Airline, 2004. Operating Economy of AEA Airlines.Summary Report. AEA, Brussels.
Association of European Airline, 2005. Operating Economy of AEA Airlines.Summary Report. AEA, Brussels.
Association of European Airline, 2006. Operating Economy of AEA Airlines.Summary Report. AEA, Brussels.
Barbot, C., 2006. Low cost airlines, secondary airports, and state aid: an economicassessment of the Ryanair – Charleroi Airport agreement. Journal of AirTransport Management 12, 197–203.
Gillen, D., Lall, A., 2004. Competitive advantage of low cost carriers some implica-tions for airports. Journal of Air Transport Management 10, 41–50.
Gudmundsson, S.V., 1997. The difference between European and US airlinemanagement practice: the case of new entrant airlines. Journal of Air TransportManagement 3, 75–82.
Lijesen, M.G., Nijkamp, P., Rietveld, P., 2002. Measuring competition in civil aviation.Journal of Air Transport Management 8, 189–197.
Morrell, P., 2005. Airlines within airlines: an analysis of US network airlineresponses to low cost carriers. Journal of Air Transport Management 11,303–312.
O’Connell, J.F., Williams, G., 2005. Passengers’ perceptions of low cost airlines andfull service carriers: a case study involving Ryanair, Aer Lingus, Air Asia andMalaysia Airlines. Journal of Air Transport Management 11, 259–272.
Oum, T.H., Yu, C., 1998. Cost competitiveness of major airlines: an internationalcomparison. Transportation Research A 32, 407–422.
Saaty, T.L., 2000. Fundamentals of Decision Making and Priority Theory with theAnalytic Hierarchy Processes, (Analytic Hierarchy Process Series, Vol. 6). RWSPublications.
Saaty, T.L., 1980. The Analytic Hierarchy Process: Planning, Priority Setting andResource Allocation. McGraw-Hill, New York.
Saaty, T.L., 1977. A scaling method for priorities in hierarchial structures. Journal ofMathematical Psychology 15, 234–281.
Swan, M.W., Adler, N., 2006. Aircraft trip cost parameters: a function of stage lengthand seat capacity. Transportation Research E 42, 105–115.
Tsai, W.H., Kuo, L., 2004. Operating costs and capacity in the airline industry. Journalof Air Transport Management 10, 271–277.
Tsoukalas, G., Peter, Belobaba, Swelbar, W., 2008. Cost convergence in the US airlineindustry: an analysis of unit costs 1995–2006. Journal of Air TransportManagement 14, 179–187.