An Analysis of the Success Factors for Passenger Boarding ...
19
sustainability Article An Analysis of the Success Factors for Passenger Boarding Enthusiasm for Low-Cost Regional Airline Routes Enhou Zu 1 , Shao-Yu Liu 2 , Bi-Min Hsu 3 , Yu-Cheng Wang 4, * and Edwin M. Lau 4 1 School of Management, Henan University of Science & Technology, Luoyang City, Kaiyuan Avenue, Luoyang 471023, China; [email protected] 2 Department of Industrial Engineering and Management, National Kaohsiung University of Science and Technology, Kaohsiung 80778, Taiwan; [email protected] 3 Department of Industrial Engineering and Management, Cheng Shiu University, Kaohsiung City 83347, Taiwan; [email protected] 4 Department of Aeronautical Engineering, Chaoyang University of Technology, Taichung 41349, Taiwan; [email protected] * Correspondence: [email protected] Received: 12 July 2020; Accepted: 9 August 2020; Published: 14 August 2020 Abstract: Airports are important air transportation facilities, providing cargo transportation, aircraft takeoff and landing, and passenger services. Trade liberalization and globalization along with shifting economies and trading focuses have led to the rapid growth of airline and cargo transportation in Asia-Pacific regions. Therefore, Asian countries are constantly expanding and improving their airport facilities. Thus, improving and measuring airline service quality has attracted significant research attention in recent years. The Chinese Government has also actively promoted low-cost tourism, although competition in low-cost carrier markets was bound to be fierce. This not only promoted tourism industries but also attracted many foreign visitors to taking low-cost carriers to China for sightseeing. With international oil prices and regional economy issues, full-service carriers face considerable operational pressure on cost and competition. This study used the fuzzy delphi and decision making trial and evaluation laboratory methods to explore and analyze key factors for passengers choosing low-cost airlines. We considered passengers using U Airlines to travel from Shanghai to Taiwan (Taoyuan, Kaohsiung Far) and investigated service quality, low-price strategies, switching costs, and boarding willingness factors. We found that boarding willingness and service quality were strongly relevant to passenger satisfaction. Service quality should be prioritized, followed by switching cost, to enhance passenger boarding willingness. Low-cost regional airlines need to prioritize improving service quality empathy and service quality responsiveness with limited resources. Performance indicators such as willingness, service quality assurance, and service quality reliability showed significant benefits for overall service performance and passenger boarding willingness. Keywords: service quality; switching cost; boarding willingness; fuzzy delphi method; decision making trial and evaluation laboratory method 1. Introduction The first global low-cost carrier (LCC), Southwest Airlines, was established in the United States in 1978 with unprecedented low-cost, low-fare strategies to operate in the local civil aviation market. The innovation was widely favored by passengers and gradually expanded into a low-fare passenger airline market in the fiercely competitive civil aviation industry. Global passenger airline markets in Europe, Australia, and Southeast Asia subsequently started a new wave of low-cost carriers from 2000. Sustainability 2020, 12, 6600; doi:10.3390/su12166600 www.mdpi.com/journal/sustainability
-
Upload
khangminh22 -
Category
Documents
-
view
0 -
download
0
Transcript of An Analysis of the Success Factors for Passenger Boarding ...
sustainability
Article
An Analysis of the Success Factors for PassengerBoarding Enthusiasm for Low-Cost RegionalAirline Routes
Enhou Zu 1, Shao-Yu Liu 2, Bi-Min Hsu 3 , Yu-Cheng Wang 4,* and Edwin M. Lau 4
1 School of Management, Henan University of Science & Technology, Luoyang City, Kaiyuan Avenue,Luoyang 471023, China; [email protected]
2 Department of Industrial Engineering and Management, National Kaohsiung University of Science andTechnology, Kaohsiung 80778, Taiwan; [email protected]
3 Department of Industrial Engineering and Management, Cheng Shiu University,Kaohsiung City 83347, Taiwan; [email protected]
4 Department of Aeronautical Engineering, Chaoyang University of Technology, Taichung 41349, Taiwan;[email protected]
* Correspondence: [email protected]
Received: 12 July 2020; Accepted: 9 August 2020; Published: 14 August 2020�����������������
Abstract: Airports are important air transportation facilities, providing cargo transportation, aircrafttakeoff and landing, and passenger services. Trade liberalization and globalization along with shiftingeconomies and trading focuses have led to the rapid growth of airline and cargo transportationin Asia-Pacific regions. Therefore, Asian countries are constantly expanding and improving theirairport facilities. Thus, improving and measuring airline service quality has attracted significantresearch attention in recent years. The Chinese Government has also actively promoted low-costtourism, although competition in low-cost carrier markets was bound to be fierce. This not onlypromoted tourism industries but also attracted many foreign visitors to taking low-cost carriers toChina for sightseeing. With international oil prices and regional economy issues, full-service carriersface considerable operational pressure on cost and competition. This study used the fuzzy delphiand decision making trial and evaluation laboratory methods to explore and analyze key factors forpassengers choosing low-cost airlines. We considered passengers using U Airlines to travel fromShanghai to Taiwan (Taoyuan, Kaohsiung Far) and investigated service quality, low-price strategies,switching costs, and boarding willingness factors. We found that boarding willingness and servicequality were strongly relevant to passenger satisfaction. Service quality should be prioritized, followedby switching cost, to enhance passenger boarding willingness. Low-cost regional airlines need toprioritize improving service quality empathy and service quality responsiveness with limited resources.Performance indicators such as willingness, service quality assurance, and service quality reliabilityshowed significant benefits for overall service performance and passenger boarding willingness.
Keywords: service quality; switching cost; boarding willingness; fuzzy delphi method; decisionmaking trial and evaluation laboratory method
1. Introduction
The first global low-cost carrier (LCC), Southwest Airlines, was established in the United Statesin 1978 with unprecedented low-cost, low-fare strategies to operate in the local civil aviation market.The innovation was widely favored by passengers and gradually expanded into a low-fare passengerairline market in the fiercely competitive civil aviation industry. Global passenger airline markets inEurope, Australia, and Southeast Asia subsequently started a new wave of low-cost carriers from 2000.
Sustainability 2020, 12, 6600; doi:10.3390/su12166600 www.mdpi.com/journal/sustainability
Sustainability 2020, 12, 6600 2 of 19
Southeast Asia currently has the most active low-cost carriers in Asia. Due to the price pressure fromthese LCCs, all additional costs other than transportation were reduced and directly reflected in lowfares. Selling pure transportation became the commodity demand across the aviation industry duringthe sluggish period in the early 2000s and developed into a successful profit model. The new LCCmarket gradually crossed traditional regional markets, expanding northward to include China, Japan,and South Korea.
Air travel markets in China rapidly expanded in 2013, with almost a quarter of the populationtraveling by air each year. Airbus indicated that in the next 20 years, the number of people travelingby air in China would be equivalent to the Chinese total population, replacing the United States tobecome the largest global aviation market. The huge market potential would soon bring China into theLCC era to meet the needs of increasingly wealthy Chinese passengers.
The Chinese Government has also been actively promoting low-cost tourism. The Civil AviationAdministration planned to establish approximately 80 new airports by 2020 and advocated otherairports to expand existing facilities with new terminals to provide LCC markets. This naturallyengendered fierce market competition in the sector.
Low-cost carrier entry into the Chinese airline markets caused a significant impact on traditionalairline market shares. The operating modes, fares, and service levels provided by the two airline types(full service carriers (FSCs) and LCCs) are very different. Domestic passengers were still unfamiliarwith LCCs compared with traditional FSCs, and LCCs were quite controversial regarding servicequality. When LCC competition was only promoted through price battles, consumers easily built apoor impression of inferior aircraft grades or services.
Most previous LCC studies considered behavioral intentions and prices rather than quality issues.Chinese passengers have a range of opinions regarding LCCs, but most expect good service qualityregardless of cost. The main motivation for the present study was to investigate fundamental passengerpreferences. How could passenger acceptance could be aligned with LCC operating policies andconcepts? What gaps exist between passenger expectation and LCC operations? When passengerschose airlines, do they consider prices and service quality or simply choose traditional FSCs withsuperior services? This study considered LCC service quality to be the main effect, with the secondaryeffect being switching, to explain boarding (purchase) willingness. The study aims are describedas follows.
1. To investigate potential problems for LCCs under regional multi-point route demands.2. We derived three measure indicators from previous literature for service quality, switching cost,
and boarding willingness for airline service quality to explore their interaction.3. Expert questionnaires provided data to investigate key principles for passenger boarding
willingness for regional LCCs. This also helped us to understand underlying reasons affectingpassenger LCC choices.
4. The study conclusions provide suggestions and references for developing successful LCC routes.
The remainder of this paper is organized as follows. Section 2 reviews relevant literature,and Section 3 introduces the evaluation methodology employed. Section 4 verifies the proposedmethodology with an example considering passenger boarding willingness for regional LCC airlinesand explores success factors. Section 5 summarizes and concludes this paper and suggest some usefuldirections for future research.
2. Literature Review
2.1. Low-Cost Carriers
The International Air Transportation Association (IATA) indicated that the LCC definition isdifferent from that of FCCs. LCCs reduce operating costs based on low-cost strategies. FollowingBerster and Wilken, larger airlines or networks, i.e., FCCs, showed more competitive advantages withbusiness operation strategies emphasizing basic principles of simplicity and cost saving [1].
Sustainability 2020, 12, 6600 3 of 19
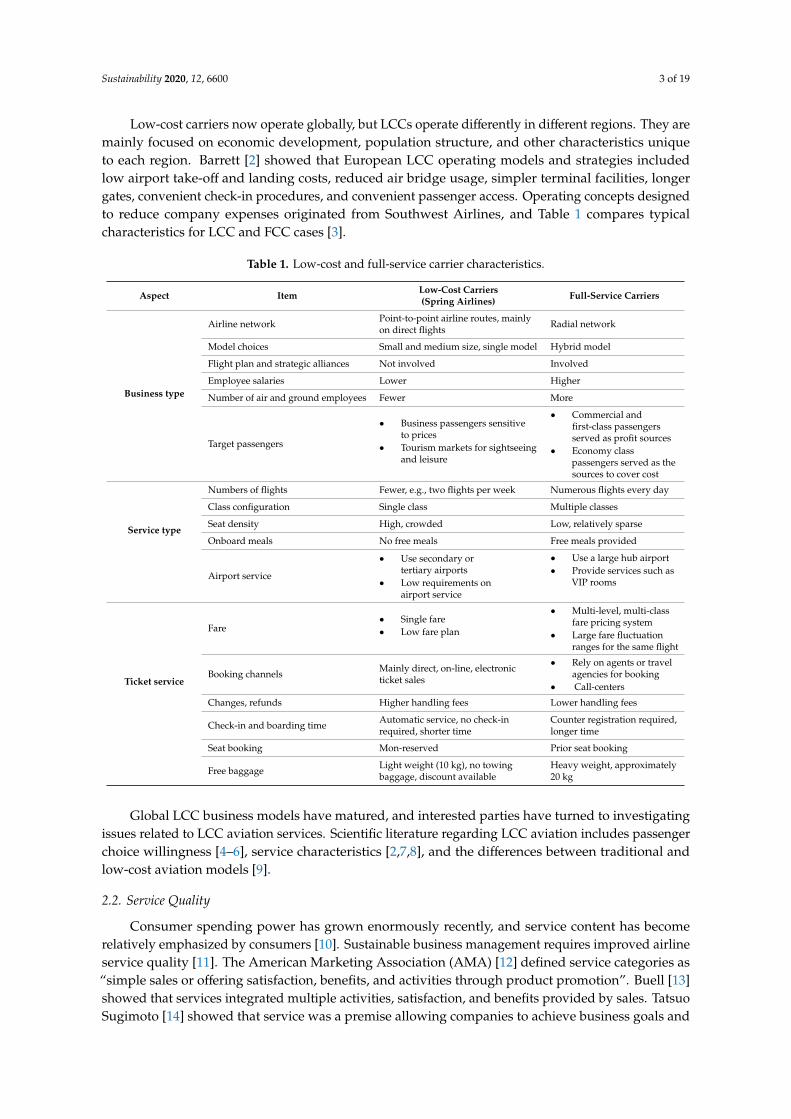
Low-cost carriers now operate globally, but LCCs operate differently in different regions. They aremainly focused on economic development, population structure, and other characteristics uniqueto each region. Barrett [2] showed that European LCC operating models and strategies includedlow airport take-off and landing costs, reduced air bridge usage, simpler terminal facilities, longergates, convenient check-in procedures, and convenient passenger access. Operating concepts designedto reduce company expenses originated from Southwest Airlines, and Table 1 compares typicalcharacteristics for LCC and FCC cases [3].
Table 1. Low-cost and full-service carrier characteristics.
Aspect Item Low-Cost Carriers(Spring Airlines) Full-Service Carriers
Business type
Airline network Point-to-point airline routes, mainlyon direct flights Radial network
Model choices Small and medium size, single model Hybrid model
Flight plan and strategic alliances Not involved Involved
Employee salaries Lower Higher
Number of air and ground employees Fewer More
Target passengers
• Business passengers sensitiveto prices
• Tourism markets for sightseeingand leisure
• Commercial andfirst-class passengersserved as profit sources
• Economy classpassengers served as thesources to cover cost
Service type
Numbers of flights Fewer, e.g., two flights per week Numerous flights every day
Class configuration Single class Multiple classes
Seat density High, crowded Low, relatively sparse
Onboard meals No free meals Free meals provided
Airport service
• Use secondary ortertiary airports
• Low requirements onairport service
• Use a large hub airport• Provide services such as
VIP rooms
Ticket service
Fare• Single fare• Low fare plan
• Multi-level, multi-classfare pricing system
• Large fare fluctuationranges for the same flight
Booking channels Mainly direct, on-line, electronicticket sales
• Rely on agents or travelagencies for booking
• Call-centers
Changes, refunds Higher handling fees Lower handling fees
Check-in and boarding time Automatic service, no check-inrequired, shorter time
Counter registration required,longer time
Seat booking Mon-reserved Prior seat booking
Free baggage Light weight (10 kg), no towingbaggage, discount available
Heavy weight, approximately20 kg
Global LCC business models have matured, and interested parties have turned to investigatingissues related to LCC aviation services. Scientific literature regarding LCC aviation includes passengerchoice willingness [4–6], service characteristics [2,7,8], and the differences between traditional andlow-cost aviation models [9].
2.2. Service Quality
Consumer spending power has grown enormously recently, and service content has becomerelatively emphasized by consumers [10]. Sustainable business management requires improved airlineservice quality [11]. The American Marketing Association (AMA) [12] defined service categories as“simple sales or offering satisfaction, benefits, and activities through product promotion”. Buell [13]showed that services integrated multiple activities, satisfaction, and benefits provided by sales. TatsuoSugimoto [14] showed that service was a premise allowing companies to achieve business goals and
Sustainability 2020, 12, 6600 4 of 19
provide relevant activities to meet consumer needs and ensure relevant activity’s interests. Garvin [15]indicated that good or bad service quality was a subjective consumer judgment rather than an objectiveevaluation. Parasuraman et al. [16] argued that cognitive service quality meant the result of comparingservices expected by consumers with actual cognitive services. Sugimoto [17] showed that consumerswere the only judges to evaluate service quality, and Goetsch and Davis [18] contended that qualitynot only referred to product quality but also included services, personnel, processes, and environment,at least for the service industries.
Service quality conceptualization and measurement has become a most controversial issue in theliterature regarding service marketing [19]. Different industries should use different measurementmethods to identify key factors to evaluate service quality [20]. When customers measure servicequality, they tend to initially consider methods that provide service during the service process. Thus,the complexity of evaluating service quality is increased. Consequently, many studies have proposedservice quality theory to measure the entire service quality. For example, Sasser et al. [21] contended thatservice quality should be measured by seven dimensions: security, consistency, attitude, completeness,condition, availability, and timing.
Lehtinen and Lehtinen [22] proposed three dimensions: service quality, physical quality,and interactive and corporate quality, which concentrate upon the company’s image or evaluation.Parasuraman et al. [17] continued Grönroos’ concept [23] to develop a set of service quality models,abbreviated as PZB. Various empirical studies showed that the 10 key quality elements overlapped.Parasuraman et al. [24] proposed 10 dimensions for common service quality parameters, which theymodified into five dimensions and 22 questions, as follows.
Tangibles: physical equipment, devices, and manpower.
1. Reliability. Capability realized from dependable and correct implementation.2. Responsiveness. Willingness to help customers and provide prompt service.3. Assurance. Knowledge and diligence shown by employees, and their capability to win customer trust.4. Empathy: providing customers with care and individual attention.
This scale allowed service quality to be more widely and practically used, and was an importantmilestone in service quality research.
Parasuraman et al. [25] partially modified the Service Quality (SERVQUAL) scale and added animportance measure to rank each dimension’s importance. The original 22 questions’ contents withnegative sentences were changed into positive sentences. The modified scale’s reliability and validitywas superior to those of the original, and it was chosen as the modified SERVQUAL scale.
This modified SERVQUAL scale was subsequently used for most service quality research forpractical applications [26], but some scholars argue different positions. Woodruff [27] and Carman [28]contended it was superfluous to measure service quality only through performance. Cronin andTaylor [29] also argued that measuring customer expectations was difficult and only service quality asperceived by customers should be used for evaluations.
In particular, the relationship Service quality (Q) = cognition (P) should first be established, and thenthe direct performance evaluation model used to measure the service performance (SERVPERF) scalefor service quality. Subsequent studies indicated the SERVPERF scale offered superior predictivecapability [29], but other studies used the SERVQUAL scale as a measurement basis and proposeda non-differential service quality measurement method (non-difference) to compare service qualitywith conformity between consumer expectation and cognition. The study found the non-differencescale was superior to SERVQUAL for reliability and validity [30]. However, Parsuraman et al. [31,32]contended that SERVQUAL measurement could provide ample diagnostic information. If managementadvice was required from surveys, then expected service should also be measured.
The SERVQUAL scale has been recently applied for aviation industry research. Gound andKloppenborg [33] showed that airline supervisors, passengers, and federal government officialshad significant differences in cognitive quality factors and that passenger satisfaction, in particular,
Sustainability 2020, 12, 6600 5 of 19
should be targeted to improve service quality. Ghobadin and Terry [34] proposed a quality functiondeployment model to measure passenger demand for service quality. They focused on technology, cost,and reliability using the quality planning concept to improve service quality. Park et al. [35] exploredwhether passengers’ boarding willingness would be affected by airline service quality. They showedthat passengers were affected by perceived service quality and passenger satisfaction. Differences inthe company’s image also affected decision making when choosing airlines. Chang et al. [36] showedthat convenient flight departure and arrival times, fares, flight safety, membership programs, servicequality, and crew languages were important factors affecting passenger airline choices. Similarly,Chang and Cheng [37] showed that fares, flight safety, service quality, and flights within a good timezone were the most important factors influencing passengers’ airline choices.
The SERVQUAL scale has also been employed for banking [38], healthcare [39], and educational [40]service quality studies. The current study considered LCC service quality using the SERVQUALscale [41] to construct airline service products to measure service quality.
3. Methodology
This study explored key factors of service quality, low-price strategies, and switching to identifypassenger influences on LCC boarding willingness. Most previous studies did not consider cognition,attitude, and preference factors and hence failed to sufficiently develop accurate predictive models.However, several recent transportation industry studies abroad have included these factors andprovided useful discussions.
Following those previous studies, we used fuzzy delphi method (FDM) and decision-making trialand evaluation laboratory (DEMATEL) approaches to solve problems, dividing the process into fourstages to construct key principles for regional LCC boarding willingness.
1. We considered service quality based on domestic and foreign expert opinions.2. We performed in-depth passenger interviews with experts, as well as expert questionnaires to better
leverage expert experience and knowledge. The Delphi method was applied to expert feedback andopinions to objectively derive key factors for passenger regional LCC boarding willingness.
3. We conducted decision-making trial-and-evaluation laboratory method (DEMATEL) analyses todevelop causality and relevance regarding the identified key factors for passenger regional LCCboarding willingness.
4. The research results were collated and reviewed for practical and specific reference for LCC operators.The final outcomes provide reliable key factors for passenger regional LCC boarding willingness.
3.1. Fuzzy Delphi Method
We used the FDM to objectively screen indicators for passenger regional LCC boarding willingnessto establish a credible and representative evaluation framework. FDM double triangle fuzzy numberswere employed to integrate expert opinions, with gray zone verification to verify whether experts hadreached consensus (convergence) [42,43]. Boarding willingness was then verified as below to ensureobjectivity and practicality.
3.2. Decision Making Trial and Evaluation Laboratory Decision Method
We employed DEMATEL [42,43] to investigate LLC route causality and relevance to passengerboarding willingness.
Step 1. Define Elements and Evaluation Scales.
We used the FDM to objectively screen passenger LCC route boarding willingness in terms ofcausality and correlation between identified key LCC principles. The evaluation scale proposedby Fontela and Gabus [44] was used with design integrated decision making trial and evaluationlaboratory based on analytic network process (DANP) and analytic network process (ANP) expert
Sustainability 2020, 12, 6600 6 of 19
questionnaires with four levels: 0 = no influence (0), 1 = slight influence, 2 = moderate influence,and 3 = considerable influence.
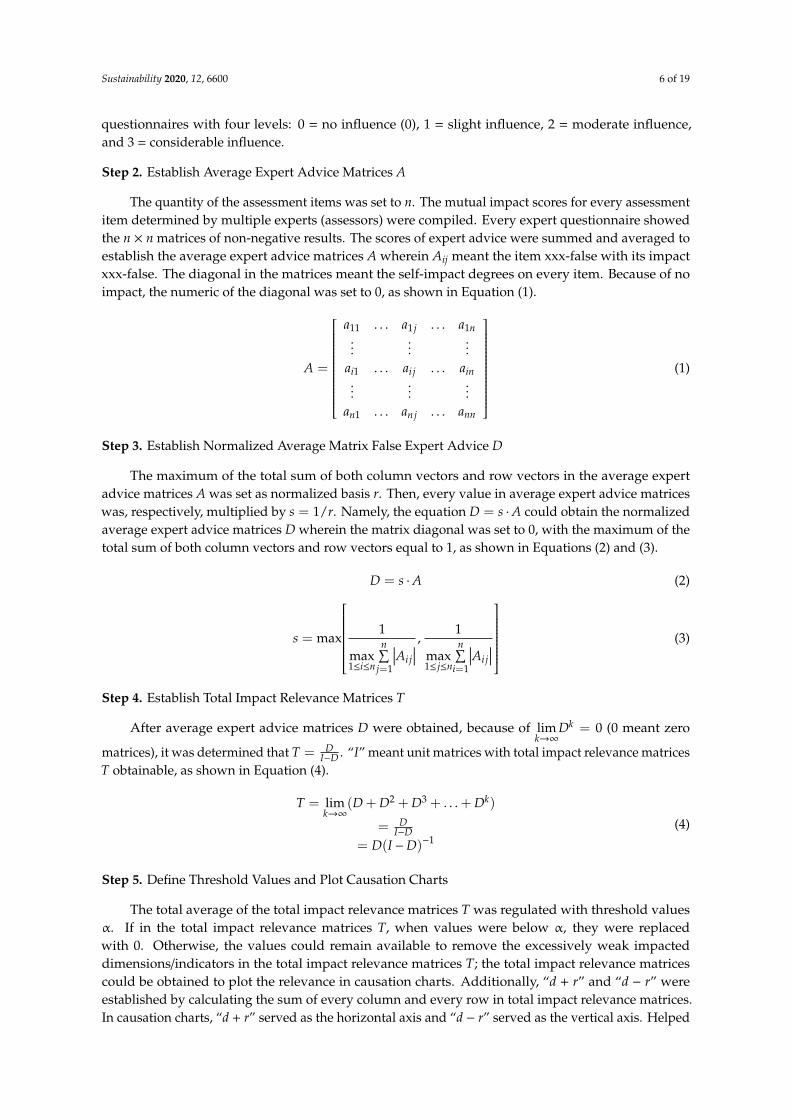
Step 2. Establish Average Expert Advice Matrices A
The quantity of the assessment items was set to n. The mutual impact scores for every assessmentitem determined by multiple experts (assessors) were compiled. Every expert questionnaire showedthe n × n matrices of non-negative results. The scores of expert advice were summed and averaged toestablish the average expert advice matrices A wherein Aij meant the item xxx-false with its impactxxx-false. The diagonal in the matrices meant the self-impact degrees on every item. Because of noimpact, the numeric of the diagonal was set to 0, as shown in Equation (1).
A =
a11 . . . a1 j . . . a1n...
......
ai1 . . . ai j . . . ain...
......
an1 . . . anj . . . ann
(1)
Step 3. Establish Normalized Average Matrix False Expert Advice D
The maximum of the total sum of both column vectors and row vectors in the average expertadvice matrices A was set as normalized basis r. Then, every value in average expert advice matriceswas, respectively, multiplied by s = 1/r. Namely, the equation D = s ·A could obtain the normalizedaverage expert advice matrices D wherein the matrix diagonal was set to 0, with the maximum of thetotal sum of both column vectors and row vectors equal to 1, as shown in Equations (2) and (3).
D = s ·A (2)
s = max
1
max1≤i≤n
n∑j=1
∣∣∣Ai j∣∣∣ ,
1
max1≤ j≤n
n∑i=1
∣∣∣Ai j∣∣∣ (3)
Step 4. Establish Total Impact Relevance Matrices T
After average expert advice matrices D were obtained, because of limk→∞
Dk = 0 (0 meant zero
matrices), it was determined that T = DI−D . “I” meant unit matrices with total impact relevance matrices
T obtainable, as shown in Equation (4).
T = limk→∞
(D + D2 + D3 + . . .+ Dk)
= DI−D
= D(I −D)−1(4)
Step 5. Define Threshold Values and Plot Causation Charts
The total average of the total impact relevance matrices T was regulated with threshold valuesα. If in the total impact relevance matrices T, when values were below α, they were replacedwith 0. Otherwise, the values could remain available to remove the excessively weak impacteddimensions/indicators in the total impact relevance matrices T; the total impact relevance matricescould be obtained to plot the relevance in causation charts. Additionally, “d + r” and “d − r” wereestablished by calculating the sum of every column and every row in total impact relevance matrices.In causation charts, “d + r” served as the horizontal axis and “d − r” served as the vertical axis. Helped
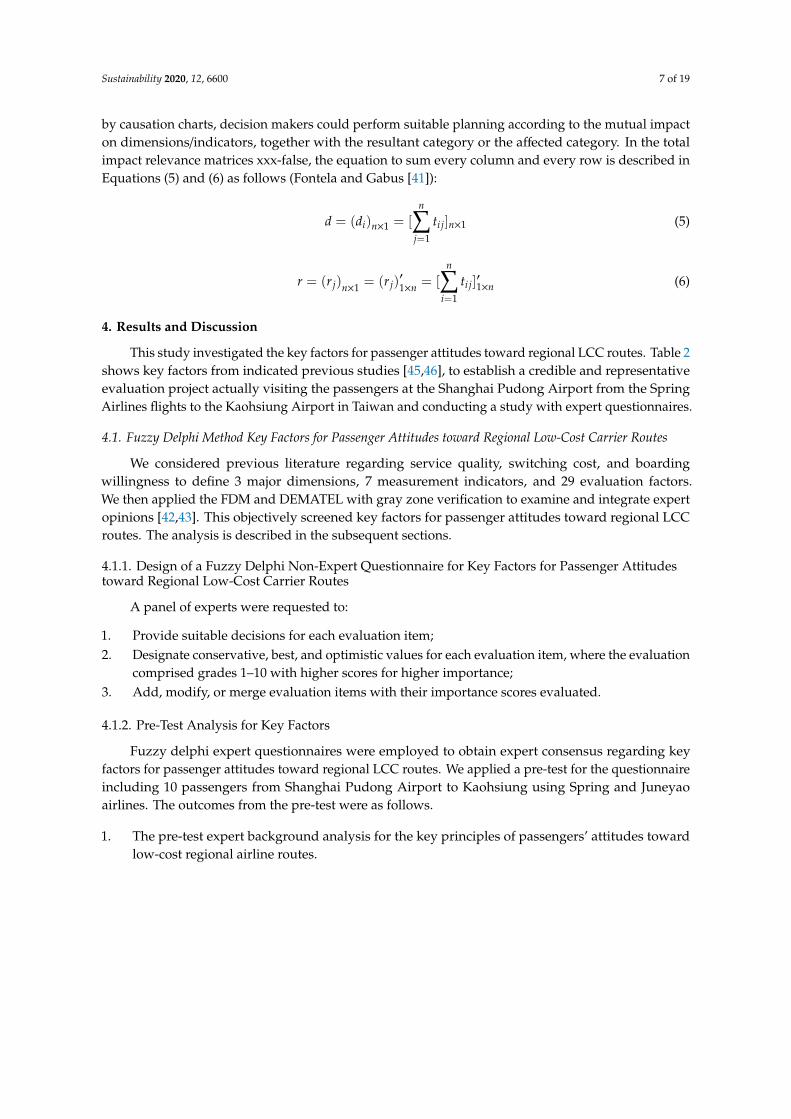
Sustainability 2020, 12, 6600 7 of 19
by causation charts, decision makers could perform suitable planning according to the mutual impacton dimensions/indicators, together with the resultant category or the affected category. In the totalimpact relevance matrices xxx-false, the equation to sum every column and every row is described inEquations (5) and (6) as follows (Fontela and Gabus [41]):
d = (di)n×1 = [n∑
j=1
ti j]n×1 (5)
r = (r j)n×1 = (r j)′
1×n = [n∑
i=1
ti j]′
1×n (6)
4. Results and Discussion
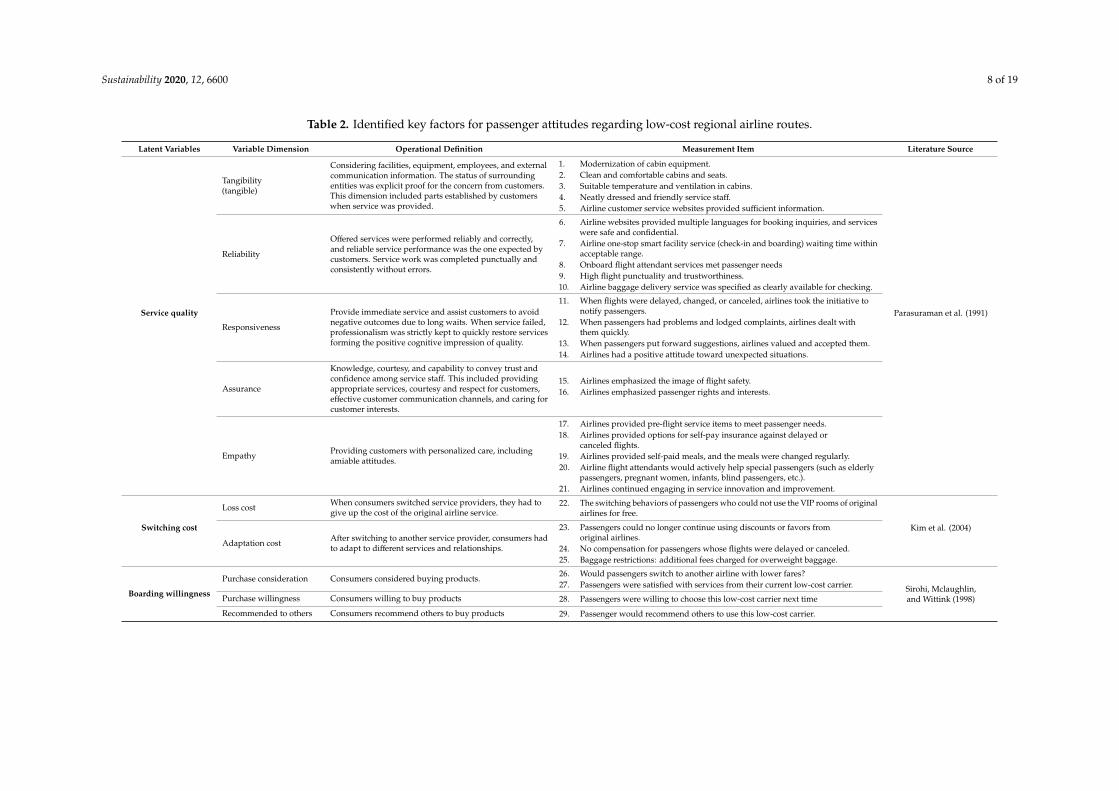
This study investigated the key factors for passenger attitudes toward regional LCC routes. Table 2shows key factors from indicated previous studies [45,46], to establish a credible and representativeevaluation project actually visiting the passengers at the Shanghai Pudong Airport from the SpringAirlines flights to the Kaohsiung Airport in Taiwan and conducting a study with expert questionnaires.
4.1. Fuzzy Delphi Method Key Factors for Passenger Attitudes toward Regional Low-Cost Carrier Routes
We considered previous literature regarding service quality, switching cost, and boardingwillingness to define 3 major dimensions, 7 measurement indicators, and 29 evaluation factors.We then applied the FDM and DEMATEL with gray zone verification to examine and integrate expertopinions [42,43]. This objectively screened key factors for passenger attitudes toward regional LCCroutes. The analysis is described in the subsequent sections.
4.1.1. Design of a Fuzzy Delphi Non-Expert Questionnaire for Key Factors for Passenger Attitudestoward Regional Low-Cost Carrier Routes
A panel of experts were requested to:
1. Provide suitable decisions for each evaluation item;2. Designate conservative, best, and optimistic values for each evaluation item, where the evaluation
comprised grades 1–10 with higher scores for higher importance;3. Add, modify, or merge evaluation items with their importance scores evaluated.
4.1.2. Pre-Test Analysis for Key Factors
Fuzzy delphi expert questionnaires were employed to obtain expert consensus regarding keyfactors for passenger attitudes toward regional LCC routes. We applied a pre-test for the questionnaireincluding 10 passengers from Shanghai Pudong Airport to Kaohsiung using Spring and Juneyaoairlines. The outcomes from the pre-test were as follows.
1. The pre-test expert background analysis for the key principles of passengers’ attitudes towardlow-cost regional airline routes.
Sustainability 2020, 12, 6600 8 of 19
Table 2. Identified key factors for passenger attitudes regarding low-cost regional airline routes.
Latent Variables Variable Dimension Operational Definition Measurement Item Literature Source
Service quality
Tangibility(tangible)
Considering facilities, equipment, employees, and externalcommunication information. The status of surroundingentities was explicit proof for the concern from customers.This dimension included parts established by customerswhen service was provided.
1. Modernization of cabin equipment.2. Clean and comfortable cabins and seats.3. Suitable temperature and ventilation in cabins.4. Neatly dressed and friendly service staff.5. Airline customer service websites provided sufficient information.
Parasuraman et al. (1991)
Reliability
Offered services were performed reliably and correctly,and reliable service performance was the one expected bycustomers. Service work was completed punctually andconsistently without errors.
6. Airline websites provided multiple languages for booking inquiries, and serviceswere safe and confidential.
7. Airline one-stop smart facility service (check-in and boarding) waiting time withinacceptable range.
8. Onboard flight attendant services met passenger needs9. High flight punctuality and trustworthiness.10. Airline baggage delivery service was specified as clearly available for checking.
Responsiveness
Provide immediate service and assist customers to avoidnegative outcomes due to long waits. When service failed,professionalism was strictly kept to quickly restore servicesforming the positive cognitive impression of quality.
11. When flights were delayed, changed, or canceled, airlines took the initiative tonotify passengers.
12. When passengers had problems and lodged complaints, airlines dealt withthem quickly.
13. When passengers put forward suggestions, airlines valued and accepted them.14. Airlines had a positive attitude toward unexpected situations.
Assurance
Knowledge, courtesy, and capability to convey trust andconfidence among service staff. This included providingappropriate services, courtesy and respect for customers,effective customer communication channels, and caring forcustomer interests.
15. Airlines emphasized the image of flight safety.16. Airlines emphasized passenger rights and interests.
Empathy Providing customers with personalized care, includingamiable attitudes.
17. Airlines provided pre-flight service items to meet passenger needs.18. Airlines provided options for self-pay insurance against delayed or
canceled flights.19. Airlines provided self-paid meals, and the meals were changed regularly.20. Airline flight attendants would actively help special passengers (such as elderly
passengers, pregnant women, infants, blind passengers, etc.).21. Airlines continued engaging in service innovation and improvement.
Switching cost
Loss cost When consumers switched service providers, they had togive up the cost of the original airline service.
22. The switching behaviors of passengers who could not use the VIP rooms of originalairlines for free.
Kim et al. (2004)
Adaptation cost After switching to another service provider, consumers hadto adapt to different services and relationships.
23. Passengers could no longer continue using discounts or favors fromoriginal airlines.
24. No compensation for passengers whose flights were delayed or canceled.25. Baggage restrictions: additional fees charged for overweight baggage.
Boarding willingness
Purchase consideration Consumers considered buying products. 26. Would passengers switch to another airline with lower fares?27. Passengers were satisfied with services from their current low-cost carrier. Sirohi, Mclaughlin,
and Wittink (1998)Purchase willingness Consumers willing to buy products 28. Passengers were willing to choose this low-cost carrier next time
Recommended to others Consumers recommend others to buy products 29. Passenger would recommend others to use this low-cost carrier.
Sustainability 2020, 12, 6600 9 of 19
The key factors for passenger attitudes were verified by the FDM. It meant using surveyedpassengers taking low-cost regional airline routes as sampling matrices to conduct questionnairesurveys and data analysis. Questionnaires were distributed at each airport station (the ShanghaiPudong T2 terminal lounge), with 10 passengers participating. All 10 questionnaires were valid andsuitable for inclusion in the subsequent analysis.
2. The pre-test analysis of measurement indicators for the key principles of passengers’ attitudestoward low-cost regional airline routes.
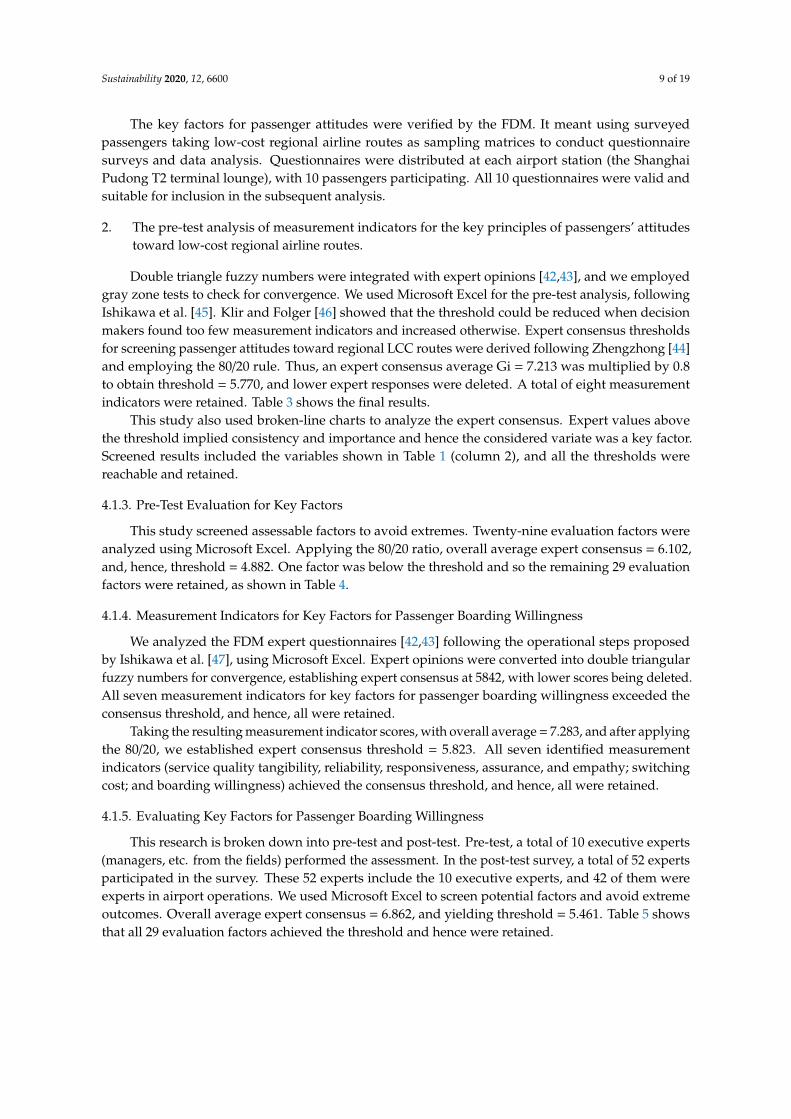
Double triangle fuzzy numbers were integrated with expert opinions [42,43], and we employedgray zone tests to check for convergence. We used Microsoft Excel for the pre-test analysis, followingIshikawa et al. [45]. Klir and Folger [46] showed that the threshold could be reduced when decisionmakers found too few measurement indicators and increased otherwise. Expert consensus thresholdsfor screening passenger attitudes toward regional LCC routes were derived following Zhengzhong [44]and employing the 80/20 rule. Thus, an expert consensus average Gi = 7.213 was multiplied by 0.8to obtain threshold = 5.770, and lower expert responses were deleted. A total of eight measurementindicators were retained. Table 3 shows the final results.
This study also used broken-line charts to analyze the expert consensus. Expert values abovethe threshold implied consistency and importance and hence the considered variate was a key factor.Screened results included the variables shown in Table 1 (column 2), and all the thresholds werereachable and retained.
4.1.3. Pre-Test Evaluation for Key Factors
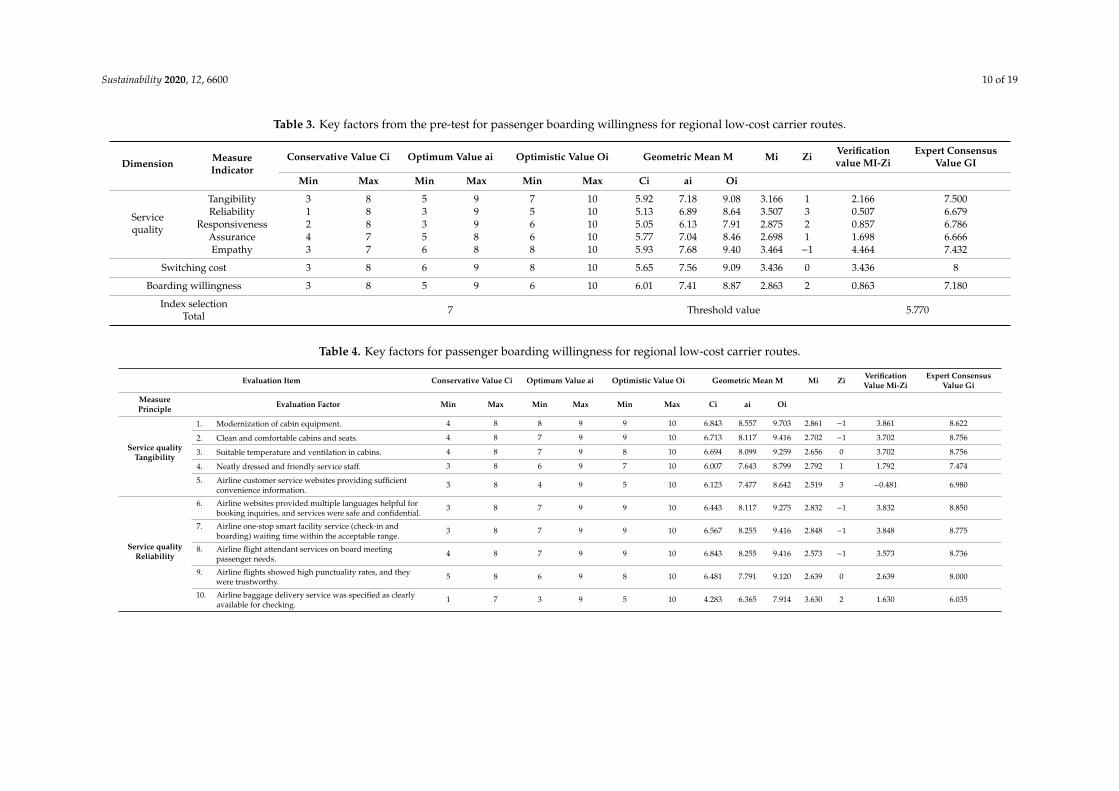
This study screened assessable factors to avoid extremes. Twenty-nine evaluation factors wereanalyzed using Microsoft Excel. Applying the 80/20 ratio, overall average expert consensus = 6.102,and, hence, threshold = 4.882. One factor was below the threshold and so the remaining 29 evaluationfactors were retained, as shown in Table 4.
4.1.4. Measurement Indicators for Key Factors for Passenger Boarding Willingness
We analyzed the FDM expert questionnaires [42,43] following the operational steps proposedby Ishikawa et al. [47], using Microsoft Excel. Expert opinions were converted into double triangularfuzzy numbers for convergence, establishing expert consensus at 5842, with lower scores being deleted.All seven measurement indicators for key factors for passenger boarding willingness exceeded theconsensus threshold, and hence, all were retained.
Taking the resulting measurement indicator scores, with overall average = 7.283, and after applyingthe 80/20, we established expert consensus threshold = 5.823. All seven identified measurementindicators (service quality tangibility, reliability, responsiveness, assurance, and empathy; switchingcost; and boarding willingness) achieved the consensus threshold, and hence, all were retained.
4.1.5. Evaluating Key Factors for Passenger Boarding Willingness
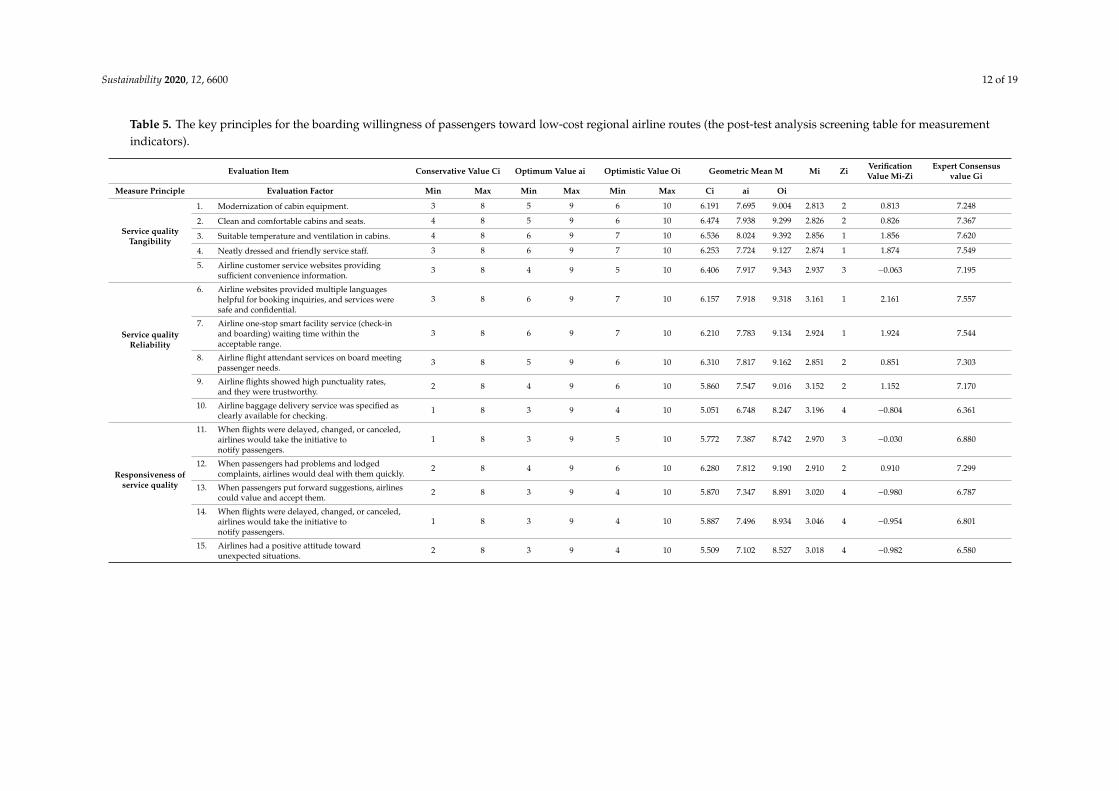
This research is broken down into pre-test and post-test. Pre-test, a total of 10 executive experts(managers, etc. from the fields) performed the assessment. In the post-test survey, a total of 52 expertsparticipated in the survey. These 52 experts include the 10 executive experts, and 42 of them wereexperts in airport operations. We used Microsoft Excel to screen potential factors and avoid extremeoutcomes. Overall average expert consensus = 6.862, and yielding threshold = 5.461. Table 5 showsthat all 29 evaluation factors achieved the threshold and hence were retained.
Sustainability 2020, 12, 6600 10 of 19
Table 3. Key factors from the pre-test for passenger boarding willingness for regional low-cost carrier routes.
Dimension MeasureIndicator
Conservative Value Ci Optimum Value ai Optimistic Value Oi Geometric Mean M Mi Zi Verificationvalue MI-Zi
Expert ConsensusValue GI
Min Max Min Max Min Max Ci ai Oi
Servicequality
Tangibility 3 8 5 9 7 10 5.92 7.18 9.08 3.166 1 2.166 7.500Reliability 1 8 3 9 5 10 5.13 6.89 8.64 3.507 3 0.507 6.679
Responsiveness 2 8 3 9 6 10 5.05 6.13 7.91 2.875 2 0.857 6.786Assurance 4 7 5 8 6 10 5.77 7.04 8.46 2.698 1 1.698 6.666Empathy 3 7 6 8 8 10 5.93 7.68 9.40 3.464 −1 4.464 7.432
Switching cost 3 8 6 9 8 10 5.65 7.56 9.09 3.436 0 3.436 8
Boarding willingness 3 8 5 9 6 10 6.01 7.41 8.87 2.863 2 0.863 7.180
Index selectionTotal 7 Threshold value 5.770
Table 4. Key factors for passenger boarding willingness for regional low-cost carrier routes.
Evaluation Item Conservative Value Ci Optimum Value ai Optimistic Value Oi Geometric Mean M Mi Zi VerificationValue Mi-Zi
Expert ConsensusValue Gi
MeasurePrinciple Evaluation Factor Min Max Min Max Min Max Ci ai Oi
Service qualityTangibility
1. Modernization of cabin equipment. 4 8 8 9 9 10 6.843 8.557 9.703 2.861 −1 3.861 8.622
2. Clean and comfortable cabins and seats. 4 8 7 9 9 10 6.713 8.117 9.416 2.702 −1 3.702 8.756
3. Suitable temperature and ventilation in cabins. 4 8 7 9 8 10 6.694 8.099 9.259 2.656 0 3.702 8.756
4. Neatly dressed and friendly service staff. 3 8 6 9 7 10 6.007 7.643 8.799 2.792 1 1.792 7.474
5. Airline customer service websites providing sufficientconvenience information.
3 8 4 9 5 10 6.123 7.477 8.642 2.519 3 −0.481 6.980
Service qualityReliability
6. Airline websites provided multiple languages helpful forbooking inquiries, and services were safe and confidential.
3 8 7 9 9 10 6.443 8.117 9.275 2.832 −1 3.832 8.850
7. Airline one-stop smart facility service (check-in andboarding) waiting time within the acceptable range.
3 8 7 9 9 10 6.567 8.255 9.416 2.848 −1 3.848 8.775
8. Airline flight attendant services on board meetingpassenger needs.
4 8 7 9 9 10 6.843 8.255 9.416 2.573 −1 3.573 8.736
9. Airline flights showed high punctuality rates, and theywere trustworthy.
5 8 6 9 8 10 6.481 7.791 9.120 2.639 0 2.639 8.000
10. Airline baggage delivery service was specified as clearlyavailable for checking.
1 7 3 9 5 10 4.283 6.365 7.914 3.630 2 1.630 6.035
Sustainability 2020, 12, 6600 11 of 19
Table 4. Cont.
Evaluation Item Conservative Value Ci Optimum Value ai Optimistic Value Oi Geometric Mean M Mi Zi VerificationValue Mi-Zi
Expert ConsensusValue Gi
MeasurePrinciple Evaluation Factor Min Max Min Max Min Max Ci ai Oi
Responsivenessof service quality
11. When flights were delayed, changed, or canceled, airlineswould take the initiative to notify passengers.
1 8 3 9 5 10 4.939 6.839 8.479 3.540 3 0.540 6.596
12. When passengers had problems and lodged complaints,airlines would deal with them quickly.
5 8 6 9 7 10 6.042 7.516 8.667 2.625 1 1.625 7.460
13. When passengers put forward suggestions, airlines couldvalue and accept them.
4 8 6 9 7 10 6.335 7.905 9.221 2.886 1 1.886 7.572
14. When flights were delayed, changed, or canceled, airlineswould take the initiative to notify passengers.
4 8 7 9 9 10 6.398 7.964 9.275 2.877 −1 3.877 8.833
15. Airlines had a positive attitude towardunexpected situations.
3 8 4 9 5 10 5.597 7.716 8.352 2.755 3 −0.245 6.747
Assurance ofservice quality
16. Airlines emphasized the image of flight safety. 1 8 2 9 3 10 4.549 6.533 7.796 3.246 5 −1.754 5.908
17. Airlines emphasized the rights and interests of passengers. 1 8 2 9 3 10 4.650 6.410 7.666 3.015 5 −1.985 5.910
Empathy ofservice quality
18. Airlines provided pre-flight service items to meetpassenger needs.
3 8 4 9 5 10 5.491 7.176 8.513 3.022 3 0.022 6.750
19. Airlines provided options for self-pay insurancecompensation against delayed or canceled flights.
3 7 4 8 5 9 5.656 6.843 8.137 2.481 2 0.481 6.400
20. Airlines provided self-paying meals, and these mealswould be changed regularly.
4 7 6 8 7 9 5.441 7.093 8.395 2.955 0 2.955 7.000
21. Airline flight attendants would actively help specialpassengers (such as elderly passengers, pregnant women,infants, blind passengers, etc.).
6 8 7 9 8 10 6.827 7.831 9.120 2.293 0 2.293 8.000
22. Airlines continued engaging in service innovationand improvement.
4 8 6 9 7 10 6.123 7.336 8.652 2.529 1 1.529 7.468
Switching cost
23. The switching behaviors of passengers who could not usethe VIP rooms of original airlines for free.
0 7 0 9 0 10 0.000 0.000 0.000 0.000 7 −7.000 0.0000
24. The switching behaviors of passengers who could nolonger continue using the discount or favors oforiginal airlines.
4 8 6 9 7 10 5.907 7.477 8.632 2.726 1 1.726 7.438
25. There was no compensation for passengers whose flightswere delayed or canceled.
4 8 6 9 7 10 5.965 7.477 8.799 2.833 1 1.833 7.469
26. Passengers faced baggage restrictions; if baggage wasoverweight, additional fees should be charged.
1 7 2 8 3 9 4.494 6.198 7.438 2.944 4 −1.056 5.557
Boardingwillingness
27. Due to price factors, you would switch to another airlinewith lower fares.
3 8 7 9 9 10 6.141 7.964 9.275 3.314 −1 4.134 8.871
28. You were satisfied with the services of the currentlow-cost carrier.
3 8 4 9 5 10 5.359 6.959 8.123 2.763 3 −0.237 6.625
29. If necessary, you were willing to choose this low-costcarrier next time
1 7 2 8 3 10 4.494 6.317 7.551 3.057 4 −0.343 5.580
30. I would recommend others to use a low-cost carrier. 1 8 2 9 3 10 4.650 6.284 7.666 3.015 5 −1.985 5910
Sustainability 2020, 12, 6600 12 of 19
Table 5. The key principles for the boarding willingness of passengers toward low-cost regional airline routes (the post-test analysis screening table for measurementindicators).
Evaluation Item Conservative Value Ci Optimum Value ai Optimistic Value Oi Geometric Mean M Mi Zi VerificationValue Mi-Zi
Expert Consensusvalue Gi
Measure Principle Evaluation Factor Min Max Min Max Min Max Ci ai Oi
Service qualityTangibility
1. Modernization of cabin equipment. 3 8 5 9 6 10 6.191 7.695 9.004 2.813 2 0.813 7.248
2. Clean and comfortable cabins and seats. 4 8 5 9 6 10 6.474 7.938 9.299 2.826 2 0.826 7.367
3. Suitable temperature and ventilation in cabins. 4 8 6 9 7 10 6.536 8.024 9.392 2.856 1 1.856 7.620
4. Neatly dressed and friendly service staff. 3 8 6 9 7 10 6.253 7.724 9.127 2.874 1 1.874 7.549
5. Airline customer service websites providingsufficient convenience information.
3 8 4 9 5 10 6.406 7.917 9.343 2.937 3 −0.063 7.195
Service qualityReliability
6. Airline websites provided multiple languageshelpful for booking inquiries, and services weresafe and confidential.
3 8 6 9 7 10 6.157 7.918 9.318 3.161 1 2.161 7.557
7. Airline one-stop smart facility service (check-inand boarding) waiting time within theacceptable range.
3 8 6 9 7 10 6.210 7.783 9.134 2.924 1 1.924 7.544
8. Airline flight attendant services on board meetingpassenger needs.
3 8 5 9 6 10 6.310 7.817 9.162 2.851 2 0.851 7.303
9. Airline flights showed high punctuality rates,and they were trustworthy.
2 8 4 9 6 10 5.860 7.547 9.016 3.152 2 1.152 7.170
10. Airline baggage delivery service was specified asclearly available for checking.
1 8 3 9 4 10 5.051 6.748 8.247 3.196 4 −0.804 6.361
Responsiveness ofservice quality
11. When flights were delayed, changed, or canceled,airlines would take the initiative tonotify passengers.
1 8 3 9 5 10 5.772 7.387 8.742 2.970 3 −0.030 6.880
12. When passengers had problems and lodgedcomplaints, airlines would deal with them quickly.
2 8 4 9 6 10 6.280 7.812 9.190 2.910 2 0.910 7.299
13. When passengers put forward suggestions, airlinescould value and accept them.
2 8 3 9 4 10 5.870 7.347 8.891 3.020 4 −0.980 6.787
14. When flights were delayed, changed, or canceled,airlines would take the initiative tonotify passengers.
1 8 3 9 4 10 5.887 7.496 8.934 3.046 4 −0.954 6.801
15. Airlines had a positive attitude towardunexpected situations.
2 8 3 9 4 10 5.509 7.102 8.527 3.018 4 −0.982 6.580
Sustainability 2020, 12, 6600 13 of 19
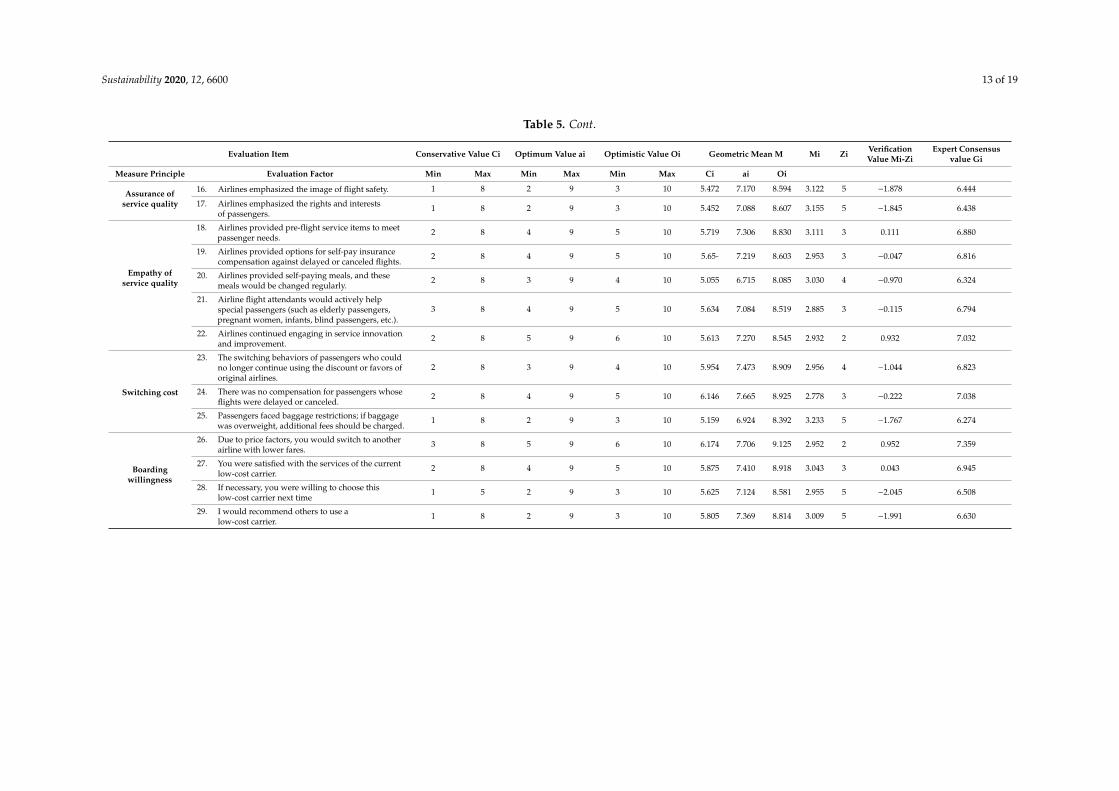
Table 5. Cont.
Evaluation Item Conservative Value Ci Optimum Value ai Optimistic Value Oi Geometric Mean M Mi Zi VerificationValue Mi-Zi
Expert Consensusvalue Gi
Measure Principle Evaluation Factor Min Max Min Max Min Max Ci ai Oi
Assurance ofservice quality
16. Airlines emphasized the image of flight safety. 1 8 2 9 3 10 5.472 7.170 8.594 3.122 5 −1.878 6.444
17. Airlines emphasized the rights and interestsof passengers.
1 8 2 9 3 10 5.452 7.088 8.607 3.155 5 −1.845 6.438
Empathy ofservice quality
18. Airlines provided pre-flight service items to meetpassenger needs.
2 8 4 9 5 10 5.719 7.306 8.830 3.111 3 0.111 6.880
19. Airlines provided options for self-pay insurancecompensation against delayed or canceled flights.
2 8 4 9 5 10 5.65- 7.219 8.603 2.953 3 −0.047 6.816
20. Airlines provided self-paying meals, and thesemeals would be changed regularly.
2 8 3 9 4 10 5.055 6.715 8.085 3.030 4 −0.970 6.324
21. Airline flight attendants would actively helpspecial passengers (such as elderly passengers,pregnant women, infants, blind passengers, etc.).
3 8 4 9 5 10 5.634 7.084 8.519 2.885 3 −0.115 6.794
22. Airlines continued engaging in service innovationand improvement.
2 8 5 9 6 10 5.613 7.270 8.545 2.932 2 0.932 7.032
Switching cost
23. The switching behaviors of passengers who couldno longer continue using the discount or favors oforiginal airlines.
2 8 3 9 4 10 5.954 7.473 8.909 2.956 4 −1.044 6.823
24. There was no compensation for passengers whoseflights were delayed or canceled.
2 8 4 9 5 10 6.146 7.665 8.925 2.778 3 −0.222 7.038
25. Passengers faced baggage restrictions; if baggagewas overweight, additional fees should be charged.
1 8 2 9 3 10 5.159 6.924 8.392 3.233 5 −1.767 6.274
Boardingwillingness
26. Due to price factors, you would switch to anotherairline with lower fares.
3 8 5 9 6 10 6.174 7.706 9.125 2.952 2 0.952 7.359
27. You were satisfied with the services of the currentlow-cost carrier.
2 8 4 9 5 10 5.875 7.410 8.918 3.043 3 0.043 6.945
28. If necessary, you were willing to choose thislow-cost carrier next time
1 5 2 9 3 10 5.625 7.124 8.581 2.955 5 −2.045 6.508
29. I would recommend others to use alow-cost carrier.
1 8 2 9 3 10 5.805 7.369 8.814 3.009 5 −1.991 6.630
Sustainability 2020, 12, 6600 14 of 19
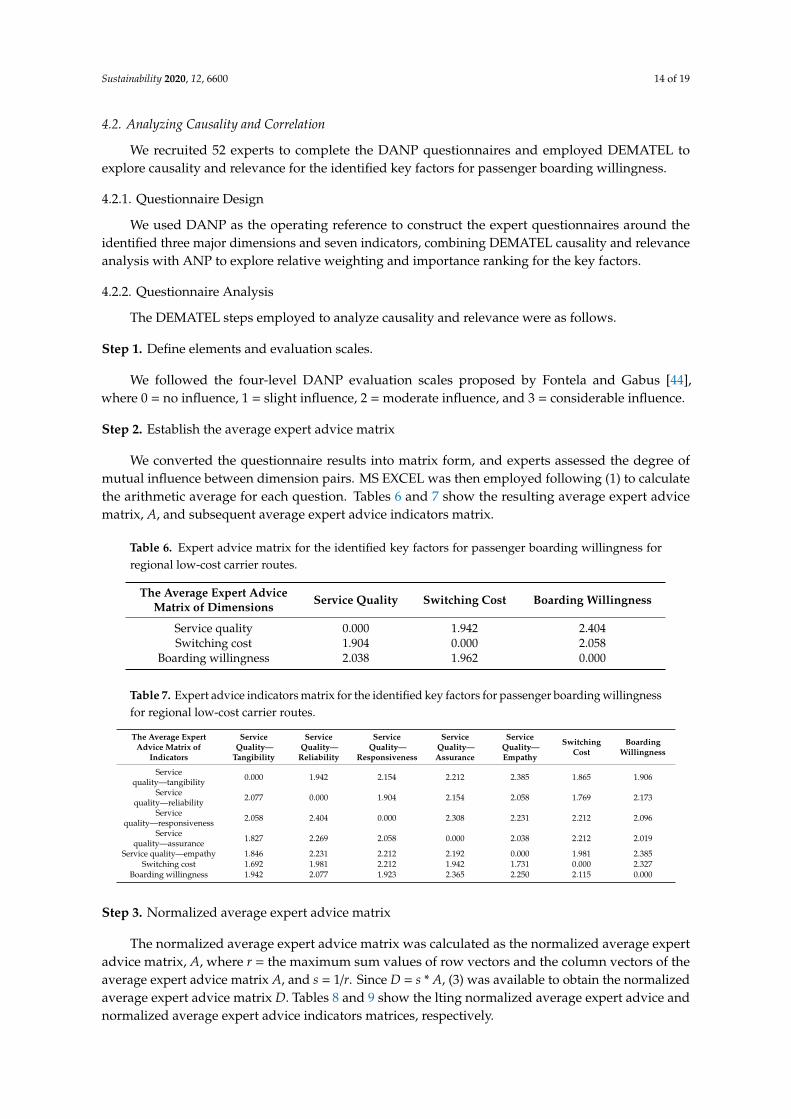
4.2. Analyzing Causality and Correlation
We recruited 52 experts to complete the DANP questionnaires and employed DEMATEL toexplore causality and relevance for the identified key factors for passenger boarding willingness.
4.2.1. Questionnaire Design
We used DANP as the operating reference to construct the expert questionnaires around theidentified three major dimensions and seven indicators, combining DEMATEL causality and relevanceanalysis with ANP to explore relative weighting and importance ranking for the key factors.
4.2.2. Questionnaire Analysis
The DEMATEL steps employed to analyze causality and relevance were as follows.
Step 1. Define elements and evaluation scales.
We followed the four-level DANP evaluation scales proposed by Fontela and Gabus [44],where 0 = no influence, 1 = slight influence, 2 = moderate influence, and 3 = considerable influence.
Step 2. Establish the average expert advice matrix
We converted the questionnaire results into matrix form, and experts assessed the degree ofmutual influence between dimension pairs. MS EXCEL was then employed following (1) to calculatethe arithmetic average for each question. Tables 6 and 7 show the resulting average expert advicematrix, A, and subsequent average expert advice indicators matrix.
Table 6. Expert advice matrix for the identified key factors for passenger boarding willingness forregional low-cost carrier routes.
The Average Expert AdviceMatrix of Dimensions Service Quality Switching Cost Boarding Willingness
Service quality 0.000 1.942 2.404Switching cost 1.904 0.000 2.058
Boarding willingness 2.038 1.962 0.000
Table 7. Expert advice indicators matrix for the identified key factors for passenger boarding willingnessfor regional low-cost carrier routes.
The Average ExpertAdvice Matrix of
Indicators
ServiceQuality—
Tangibility
ServiceQuality—
Reliability
ServiceQuality—
Responsiveness
ServiceQuality—Assurance
ServiceQuality—Empathy
SwitchingCost
BoardingWillingness
Servicequality—tangibility 0.000 1.942 2.154 2.212 2.385 1.865 1.906
Servicequality—reliability 2.077 0.000 1.904 2.154 2.058 1.769 2.173
Servicequality—responsiveness 2.058 2.404 0.000 2.308 2.231 2.212 2.096
Servicequality—assurance 1.827 2.269 2.058 0.000 2.038 2.212 2.019
Service quality—empathy 1.846 2.231 2.212 2.192 0.000 1.981 2.385Switching cost 1.692 1.981 2.212 1.942 1.731 0.000 2.327
Boarding willingness 1.942 2.077 1.923 2.365 2.250 2.115 0.000
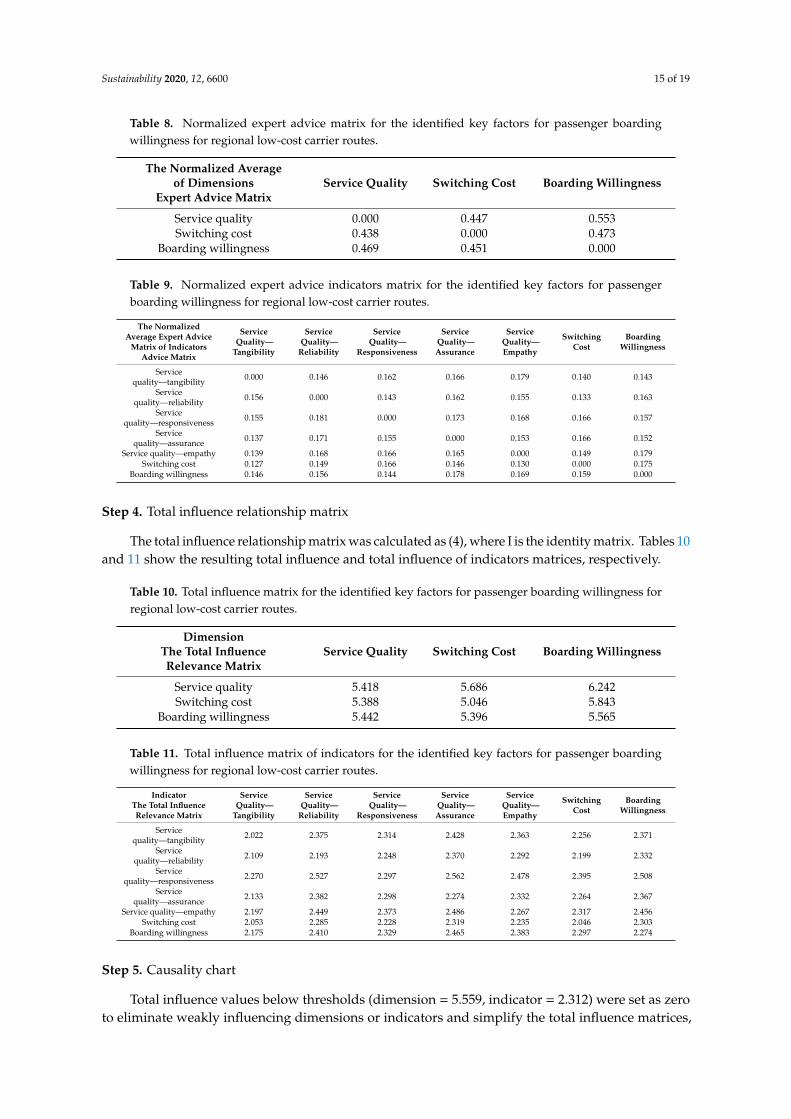
Step 3. Normalized average expert advice matrix
The normalized average expert advice matrix was calculated as the normalized average expertadvice matrix, A, where r = the maximum sum values of row vectors and the column vectors of theaverage expert advice matrix A, and s = 1/r. Since D = s * A, (3) was available to obtain the normalizedaverage expert advice matrix D. Tables 8 and 9 show the lting normalized average expert advice andnormalized average expert advice indicators matrices, respectively.
Sustainability 2020, 12, 6600 15 of 19
Table 8. Normalized expert advice matrix for the identified key factors for passenger boardingwillingness for regional low-cost carrier routes.
The Normalized Averageof Dimensions
Expert Advice MatrixService Quality Switching Cost Boarding Willingness
Service quality 0.000 0.447 0.553Switching cost 0.438 0.000 0.473
Boarding willingness 0.469 0.451 0.000
Table 9. Normalized expert advice indicators matrix for the identified key factors for passengerboarding willingness for regional low-cost carrier routes.
The NormalizedAverage Expert Advice
Matrix of IndicatorsAdvice Matrix
ServiceQuality—
Tangibility
ServiceQuality—
Reliability
ServiceQuality—
Responsiveness
ServiceQuality—Assurance
ServiceQuality—Empathy
SwitchingCost
BoardingWillingness
Servicequality—tangibility 0.000 0.146 0.162 0.166 0.179 0.140 0.143
Servicequality—reliability 0.156 0.000 0.143 0.162 0.155 0.133 0.163
Servicequality—responsiveness 0.155 0.181 0.000 0.173 0.168 0.166 0.157
Servicequality—assurance 0.137 0.171 0.155 0.000 0.153 0.166 0.152
Service quality—empathy 0.139 0.168 0.166 0.165 0.000 0.149 0.179Switching cost 0.127 0.149 0.166 0.146 0.130 0.000 0.175
Boarding willingness 0.146 0.156 0.144 0.178 0.169 0.159 0.000
Step 4. Total influence relationship matrix
The total influence relationship matrix was calculated as (4), where I is the identity matrix. Tables 10and 11 show the resulting total influence and total influence of indicators matrices, respectively.
Table 10. Total influence matrix for the identified key factors for passenger boarding willingness forregional low-cost carrier routes.
DimensionThe Total InfluenceRelevance Matrix
Service Quality Switching Cost Boarding Willingness
Service quality 5.418 5.686 6.242Switching cost 5.388 5.046 5.843
Boarding willingness 5.442 5.396 5.565
Table 11. Total influence matrix of indicators for the identified key factors for passenger boardingwillingness for regional low-cost carrier routes.
IndicatorThe Total InfluenceRelevance Matrix
ServiceQuality—
Tangibility
ServiceQuality—
Reliability
ServiceQuality—
Responsiveness
ServiceQuality—Assurance
ServiceQuality—Empathy
SwitchingCost
BoardingWillingness
Servicequality—tangibility 2.022 2.375 2.314 2.428 2.363 2.256 2.371
Servicequality—reliability 2.109 2.193 2.248 2.370 2.292 2.199 2.332
Servicequality—responsiveness 2.270 2.527 2.297 2.562 2.478 2.395 2.508
Servicequality—assurance 2.133 2.382 2.298 2.274 2.332 2.264 2.367
Service quality—empathy 2.197 2.449 2.373 2.486 2.267 2.317 2.456Switching cost 2.053 2.285 2.228 2.319 2.235 2.046 2.303
Boarding willingness 2.175 2.410 2.329 2.465 2.383 2.297 2.274
Step 5. Causality chart
Total influence values below thresholds (dimension = 5.559, indicator = 2.312) were set as zeroto eliminate weakly influencing dimensions or indicators and simplify the total influence matrices,
Sustainability 2020, 12, 6600 16 of 19
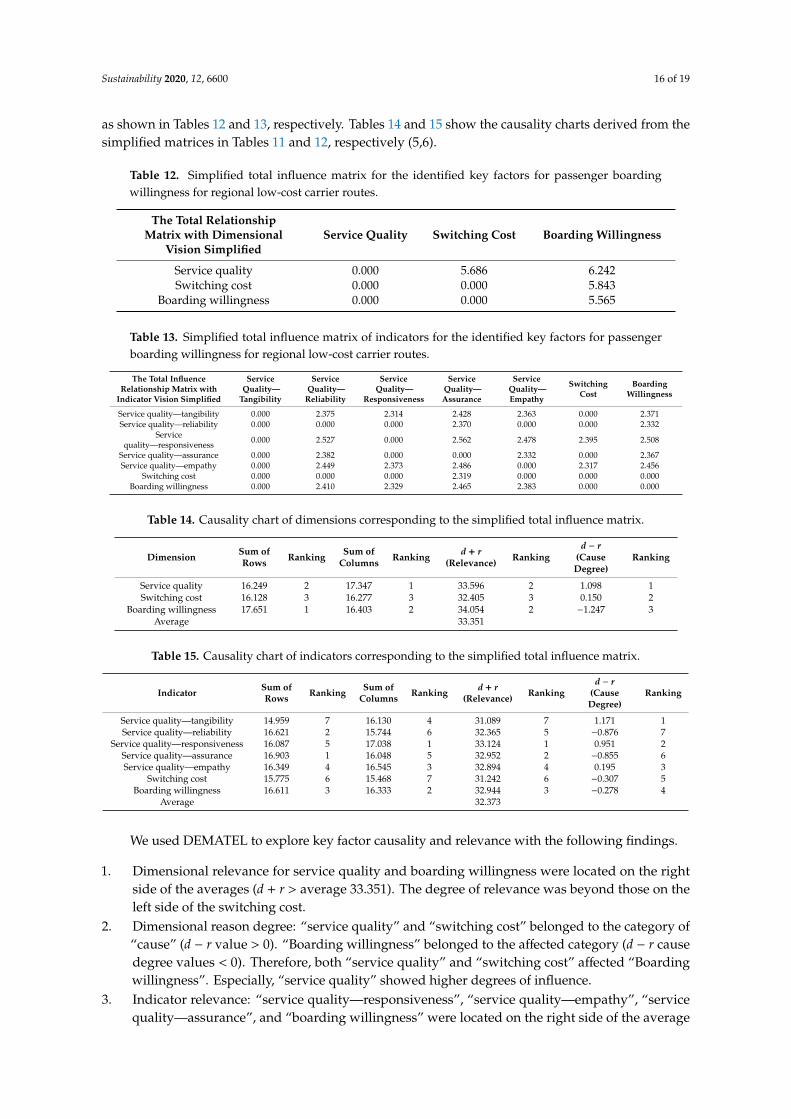
as shown in Tables 12 and 13, respectively. Tables 14 and 15 show the causality charts derived from thesimplified matrices in Tables 11 and 12, respectively (5,6).
Table 12. Simplified total influence matrix for the identified key factors for passenger boardingwillingness for regional low-cost carrier routes.
The Total RelationshipMatrix with Dimensional
Vision SimplifiedService Quality Switching Cost Boarding Willingness
Service quality 0.000 5.686 6.242Switching cost 0.000 0.000 5.843
Boarding willingness 0.000 0.000 5.565
Table 13. Simplified total influence matrix of indicators for the identified key factors for passengerboarding willingness for regional low-cost carrier routes.
The Total InfluenceRelationship Matrix with
Indicator Vision Simplified
ServiceQuality—
Tangibility
ServiceQuality—
Reliability
ServiceQuality—
Responsiveness
ServiceQuality—Assurance
ServiceQuality—Empathy
SwitchingCost
BoardingWillingness
Service quality—tangibility 0.000 2.375 2.314 2.428 2.363 0.000 2.371Service quality—reliability 0.000 0.000 0.000 2.370 0.000 0.000 2.332
Servicequality—responsiveness 0.000 2.527 0.000 2.562 2.478 2.395 2.508
Service quality—assurance 0.000 2.382 0.000 0.000 2.332 0.000 2.367Service quality—empathy 0.000 2.449 2.373 2.486 0.000 2.317 2.456
Switching cost 0.000 0.000 0.000 2.319 0.000 0.000 0.000Boarding willingness 0.000 2.410 2.329 2.465 2.383 0.000 0.000
Table 14. Causality chart of dimensions corresponding to the simplified total influence matrix.
Dimension Sum ofRows Ranking Sum of
Columns Ranking d + r(Relevance) Ranking
d − r(CauseDegree)
Ranking
Service quality 16.249 2 17.347 1 33.596 2 1.098 1Switching cost 16.128 3 16.277 3 32.405 3 0.150 2
Boarding willingness 17.651 1 16.403 2 34.054 2 −1.247 3Average 33.351
Table 15. Causality chart of indicators corresponding to the simplified total influence matrix.
Indicator Sum ofRows Ranking Sum of
Columns Ranking d + r(Relevance) Ranking
d − r(CauseDegree)
Ranking
Service quality—tangibility 14.959 7 16.130 4 31.089 7 1.171 1Service quality—reliability 16.621 2 15.744 6 32.365 5 −0.876 7
Service quality—responsiveness 16.087 5 17.038 1 33.124 1 0.951 2Service quality—assurance 16.903 1 16.048 5 32.952 2 −0.855 6Service quality—empathy 16.349 4 16.545 3 32.894 4 0.195 3
Switching cost 15.775 6 15.468 7 31.242 6 −0.307 5Boarding willingness 16.611 3 16.333 2 32.944 3 −0.278 4
Average 32.373
We used DEMATEL to explore key factor causality and relevance with the following findings.
1. Dimensional relevance for service quality and boarding willingness were located on the rightside of the averages (d + r > average 33.351). The degree of relevance was beyond those on theleft side of the switching cost.
2. Dimensional reason degree: “service quality” and “switching cost” belonged to the category of“cause” (d − r value > 0). “Boarding willingness” belonged to the affected category (d − r causedegree values < 0). Therefore, both “service quality” and “switching cost” affected “Boardingwillingness”. Especially, “service quality” showed higher degrees of influence.
3. Indicator relevance: “service quality—responsiveness”, “service quality—empathy”, “servicequality—assurance”, and “boarding willingness” were located on the right side of the average
Sustainability 2020, 12, 6600 17 of 19
(d + r relevance > the average indicator at 32.573). The higher degrees of relevance in “servicequality—tangibility”, “service quality—reliability”, and “switching cost” were located on the leftside of the average (d + r < average).
4. Indicator reason degree: “service quality—empathy”, “service quality—responsiveness”,and “service quality—tangibility” (d − r cause degree value > 0) belonged to resultant indicators.For “service quality—assurance”, “boarding willingness”, and “switching cost” (d − r reasonvalue < 0), they belonged to the affected category.
5. Conclusions
Low-cost carrier service quality differs from that for other service industries. Passenger willingnessto board and LCC service quality were closely related since service quality affects business operationalperformance [48]. Service quality for LCCs could not be directly compared with that for FCCs becausetheir operating characteristics are intentionally different: LCCs focus on reduced costs and expenseswhile maintaining profit growth, to provide passengers with lower fares.
This study directly contacted passengers taking LCCs from Shanghai Pudong airport to participatein a questionnaire probing service quality, switching cost, and boarding willingness. We used the FDMto identify key factors for passengers choosing regional LCC routes, and DEMATEL to explore thefactors’ causality and relevance for passenger choice. The research results were as described below.
1. FDM successfully identified key factors for passengers choosing regional LCC routes.2. LCC service quality improvement. We found the highest significance for service quality
empathy, responsiveness, and assurance. Thus, passengers attached great importance to LCCcapability to cope with problems, complaints, unexpected situations, protecting passenger rights,and innovative service. However, passengers showed the second lowest effect for servicequality tangibility and reliability, and the lowest for switching cost. LCCs, similar to mostindustries, continually change on a daily basis, and aviation staff uniforms, cabin equipment,and website ordering convenience and security have enormously improved in recent years.On the other hand, LCC passengers generally must pay extra for meals, luggage check-in,and insurance, and this is generally accepted on the ground, in contrast to the service providedby traditional FCCs. Therefore, service quality emphasis was one of the important factors forpassengers in evaluating carriers and could directly influence passenger willingness to board andswitch. Therefore, passengers still hold expectations regarding overall LCC service quality. Thus,increased passenger boarding willingness should be further researched to enhance LCC success.
3. Key factors to enhance low-cost carriers. Passengers showed strongly positive relationshipsbetween service quality responsiveness and empathy, and boarding willingness. Thus, althoughpassengers paid relatively low prices, they still expected excellent handling and quick responsesfrom crews to cope with urgent situations and demands.
4. Discover cheaper fares and save time. It is critical that airlines recognize that passengers takingLCCs have different concerns regarding their travel from those taking traditional FCCs. Thus,for LCCs to survive in the market, they need to enhance their services. They should offer moreincentives for passengers to choose LCCs but reduce the perceived gap with traditional FCCs,increasing consumer acceptance and hence enticing them to continuously take LCCs.
Author Contributions: Data curation, E.Z. and S.-Y.L.; formal analysis, E.Z., S.-Y.L., and Y.-C.W.; methodology,S.-Y.L. and Y.-C.W.; resources, B.-M.H. and Y.-C.W.; writing—review and editing, Y.-C.W. and E.M.L. All authorshave read and agreed to the published version of the manuscript.
Funding: This research received no external funding.
Acknowledgments: We are thankful to the referees for their careful reading of the manuscript and for valuablecomments and suggestions that greatly improved the presentation of this work.
Conflicts of Interest: The authors declare that there is no conflict of interest regarding the publication of this article.
Sustainability 2020, 12, 6600 18 of 19
References
1. Berster, P.; Wilken, D. Market penetration and demand generation of low cost carriers in Germany.In Proceedings of the Air Transport and Airport Research ATRS Conference, Istanbul, Turkey, 4–8 July 2004.
2. Barrett, S.D. How do the demands for airport services differ between full-service carriers and low-costcarriers? J. Air Transp. Manag. 2004, 10, 33–39. [CrossRef]
3. Francis, J.; LaFond, R.; Olsson, P.; Schipper, K. The market pricing of accruals quality. J. Account. Econ. 2005,39, 295–327. [CrossRef]
4. Weber, K.; Sparks, B. Consumer attributions and behavioral responses to service failures in strategic airlinealliance settings. J. Air Transp. Manag. 2004, 10, 361–367. [CrossRef]
5. Lim, J.; Lee, H.C. Comparisons of service quality perceptions between full service carriers and low costcarriers in airline travel. Curr. Issues Tour. 2020, 23, 1261–1276. [CrossRef]
6. Luke, S.; Cioffi-Revilla, C.; Panait, L.; Sullivan, K.; Balan, G. Mason: A multiagent simulation environment.Simulation 2005, 81, 517–527. [CrossRef]
7. Mason, K.J.; Alamdari, F. EU network carriers, low cost carriers and consumer behaviour: A Delphi study offuture trends. J. Air Transp. Manag. 2007, 13, 299–310. [CrossRef]
8. Evangelho, F.; Huse, C.; Linhares, A. Market Entry of A Low Cost Airline and Impacts on The BrazilianBusiness Travelers. J. Air Transp. Manag. 2005, 11, 99–105. [CrossRef]
9. Baker, D.M.A. Service quality and customer satisfaction in the airline industry: A comparison betweenlegacy airlines and low-cost airlines. Am. J. Tour. Res. 2013, 2, 67–77. [CrossRef]
10. Tan, C.-W.; Benbasat, I.; Ronald, T. IT-mediated customer service content and delivery in electronicgovernments: An empirical investigation of the antecedents of service quality. MIS Q. 2013, 37, 77–109.
11. Wu, K.J.; Liao, C.J.; Tseng, M.L.; Chou, P.J. Understanding innovation for sustainable business managementcapabilities and competencies under uncertainty. Sustainability 2015, 7, 13726–13760. [CrossRef]
12. Alexander, R.S. Marketing Definitions: A Glossary of Marketing Terms; American Marketing Association:Chicago, IL, USA, 1960; Volume 15.
13. Buell, V.P. Marketing Management: A strategic Planning Approach; McGraw-Hill College: New York, NY, USA, 1984.14. Gordon, A. Portraits of the Japanese Workplace: Labor Movements, Workers, and Managers; Routledge: London,
UK, 2018.15. Shetty, Y.K. Product quality and competitive strategy. Bus. Horiz. 1987, 30, 46–52. [CrossRef]16. Parasuraman, A.; Zeithaml, V.A.; Berry, L.L. A conceptual model of service quality and its implications for
future research. J. Mark. 1985, 49, 41–50. [CrossRef]17. Ladhari, R.; Brun, I.; Morales, M. Determinants of dining satisfaction and post-dining behavioral intentions.
Int. J. Hosp. Manag. 2008, 27, 563–573. [CrossRef]18. Goetsch, D.L.; Davis, S. Introduction to Total Quality: Quality, Productivity, Competitiveness; Prentice-Hall
International Edition; Macmillan Coll Div: New York, NY, USA, 1994.19. Brady, M.K.; Cronin, J.J. Some new thoughts on conceptualizing perceived service quality: A hierarchical
approach. J. Mark. 2001, 65, 34–49. [CrossRef]20. Griffin, J. Customer Loyalty: How to Earn, How to Keep It; Simon and Schuster Inc.: New York, NY, USA, 1995.21. Sasser, W.E.; Olsen, R.P.; Wyckoff, D.D. Management of Service Operation: Text, Cases and Reading; Ally and
Bacon Inc.: Boston, MA, USA, 1978.22. Lehtinen, U.; Lehtinen, J.R. Two Approaches to Service Quality Dimensions. Serv. Ind. J. 1991, 11, 287–304.
[CrossRef]23. Gronroos, C. A service quality model and its marketing implications. Eur. J. Mark. 1984, 18, 36–44. [CrossRef]24. Parasuraman, A.; Zeithaml, V.A.; Berry, L.L. Servqual: A multiple-item scale for measuring consumer perc.
J. Retail. 1988, 64, 12.25. Leonard, L.; Berry, L.L.; Parasuraman, A. Marketing Services: Competing through Quality; Free Press: New York,
NY, USA, 1991.26. Hong, S.C.; Goo, Y.J. A causal model of customer loyalty in professional service firms: An empirical study.
Int. J. Manag. 2004, 21, 531.27. Woodruff, R.B.; Cadotte, E.R.; Jenkins, R.L. Modeling consumer satisfaction processes using experience-based
norms. J. Mark. Res. 1983, 20, 296–304. [CrossRef]28. Carman, J.M. Consumer perceptions of service quality: An assessment of T. J. Retail. 1990, 66, 33.
Sustainability 2020, 12, 6600 19 of 19
29. Cronin, J.J., Jr.; Taylor, S.A. Measuring service quality: A reexamination and extension. J. Mark. 1992, 56,55–68. [CrossRef]
30. Brown, T.J.; Churchill, G.A., Jr.; Peter, J.P. Research note: Improving the measurement of service quality.J. Retail. 1993, 69, 127. [CrossRef]
31. Parasuraman, A.; Berry, L.L.; Zeithaml, V.A. Research note: More on improving quality measurement.J. Retail. 1993, 69, 140. [CrossRef]
32. Parasuraman, A.; Zeithaml, V.A.; Berry, L.L. Alternative scales for measuring service quality: A comparativeassessment based on psychometric and diagnostic criteria. J. Retail. 1994, 70, 201–230. [CrossRef]
33. Gourdin, K.M.; Gourdin, K.N.; Kloppenborg, T.J. Identifying service gaps in commercial air travel: The firststep toward quality improvement. Transp. J. 1991, 31, 22–30.
34. Terry, L.D. Leadership of Public Bureaucracies: The Administrator as Conservator; Routledge: London, UK, 1995.35. Park, J.W.; Robertson, R.; Wu, C.L. The effect of airline service quality on passengers’ behavioural intentions:
A Korean case study. J. Air Transp. Manag. 2004, 10, 435–439. [CrossRef]36. Chang, C.H.; Bond, S.; Cheung, C. Feasibility study on establishing a low cost carrier in Taiwan. In Proceedings
of the 10th Conference of Air Transport Research Society World Conference, Nagoya, Japan, 26–28 May 2006.37. Chang, Y.H.; Cheng, C.H. Recognition and perception of air travelers to LCCs and FSCs: A case study of
Taiwanese passengers departing from Taipei to Singapore. In Proceedings of the 10th Conference of AirTransport Research Society World Conference, Nagoya, Japan, 26–28 May 2006.
38. Razak, M.I.; Sakrani, S.N.R.; Wahab, S.A.; Abas, N.; Yaacob, N.J.A.; Rodzi, S.N.A.M. Adaptive of SERVQUALmodel in measuring customer satisfaction towards service quality provided by Bank Islam Malaysia Berhad(BIMB) in Malaysia. Int. J. Bus. Soc. Sci. 2013, 4, 189–198.
39. Purcărea, V.L.; Gheorghe, I.R.; Petrescu, C.M. The assessment of perceived service quality of public healthcare services in romania using the Seroquel scale. Procedia Econ. Financ. 2013, 6, 573–585. [CrossRef]
40. Yousapronpaiboon, K. Servqual: Measuring higher education service quality in Thailand. Procedia-Soc. Behav.Sci. 2014, 116, 1088–1095. [CrossRef]
41. Parasuraman, A.; Berry, L.; Zeithaml, V. Refinement and reassessment of the servqual scale. J. Retail. 2002,67, 114–139.
42. Ishikawa, K.; Nakamura, H.; Morikawa, K.; Kimura, S.; Kanaya, S. Cooperative stabilization of Escherichiacoli ribonuclease HI by insertion of Gly-80b and Gly-77. fwdarw. Ala substitution. Biochemistry 1993, 32,7136–7142. [CrossRef] [PubMed]
43. Hsu, H.M.; Chen, C.T. Aggregation of fuzzy opinions under group decision making. Fuzzy Sets Syst. 1996,79, 279–285.
44. Fontela, E.; Gabus, A. The DEMATEL Observer, DEMATEL Report; Battelle Geneva Research Center: Geneva,Switzerland, 1976.
45. Gabus, A.; Fontela, E. The DEMATEL Observer; Battelle Geneva Research Center: Geneva, Switzerland, 1976.46. Klir, G.J. Fuzzy sets. In Uncentainty and Information; Prentice Hall: Englewood Cliffs, NJ, USA, 1988. [CrossRef]47. Ishikawa, A.; Amagasa, M.; Shiga, T.; Tomizawa, G.; Tatsuta, R.; Mieno, H. The max-min Delphi method and
fuzzy Delphi method via fuzzy integration. Fuzzy Sets Syst. 1993, 55, 241–253. [CrossRef]48. Davido, W.H.; Uttal, B. Service Companies: Focus or Falter. Harv. Bus. Rev. 1989, 67, 77–85.
© 2020 by the authors. Licensee MDPI, Basel, Switzerland. This article is an open accessarticle distributed under the terms and conditions of the Creative Commons Attribution(CC BY) license (http://creativecommons.org/licenses/by/4.0/).