ethno-floristic study, vegetation structure and nutraceutical ...

Journal of Tropical Ecology (2000) 16:801–828. With 4 figuresCopyright 2000 Cambridge University Press
An analysis of the floristic composition anddiversity of Amazonian forests including thoseof the Guiana Shield
HANS TER STEEGE*†, DANIEL SABATIER‡, HERNAN CASTELLANOS§,TINDE VAN ANDEL*†, JOOST DUIVENVOORDEN#, ALEXANDREADALARDO DE OLIVEIRA¶, RENSKE EK*†, RAMESH LILWAH†**, PAULMAAS* and SCOTT MORI††
*Department of Plant Ecology, Utrecht University, PO Box 80084, 3504 TB Utrecht, The
Netherlands ([email protected])†The Tropenbos Guyana Programme, 12E Garnett Street, Campbellville, Georgetown,
Guyana‡ORSTOM, Laboratoire Botanique, 163 Rue A. Broussonet, 34000 Montpellier, France§Universidad Nacional Experimental de Guayana, Calle Chile, Urbaniz Chilemex, Puerto
Ordaz, Edo. Bolıvar, Venezuela#Hugo de Vries laboratory, University of Amsterdam, Kruislaan 318, 1098 SM Amster-
dam, The Netherlands¶Universidade Paulista, Lab. Botanica, Av. Paulista 900 1o andar., Sao Paulo-SP,
01310-100, Brazil**National Agricultural Research Institute, Mon Repos, ECD, Guyana††Institute of Systematic Botany, The New York Botanical Garden, Bronx, New York
10458-5126 USA
(Accepted 9th April 2000)
ABSTRACT. A large number of newly published and unpublished hectare plots inAmazonia and the Guiana Shield area allow an analysis of family composition andtesting of hypotheses concerning alpha-diversity in the south American rain forest.Using data from 94 plots the family-level floristic patterns in wet tropical SouthAmerica are described. To test diversity patterns, 268 plots are used in this largearea. Contrary to a widely held belief, western Amazonian plots are not necessarilythe most diverse. Several central Amazonian plots have equal or even higher treediversity. Annual rainfall is not a good estimator for tree diversity in the Amazoniaarea and Guiana shield. Plots in the Guiana Shield area (and eastern Amazonia)usually have lower diversity than those in central or western Amazonia. It is arguedthat this is not because of low rainfall or low nutrient status of the soil but becauseof the small area of the relatively isolated rain forest area in eastern Amazoniaand the Guiana Shield. The low diversity on nutrient-poor white sand soils in the
801

H A N S T E R S T E E G E E T A L .802
Amazon basin is not necessarily due to their low nutrient status but is, at leastpartly, caused by their small extent and fragmented nature.
KEY WORDS: Amazonia, floristic composition, Guiana Shield, rainfall, tree alphadiversity
INTRODUCTION
Neotropical rain forests have been considered the most species-rich foreststhat exist worldwide (Gentry 1988a, 1988b; Valencia et al. 1994). Very highalpha-diversities of trees, birds, butterflies, reptiles, amphibians and mammals(Gentry 1988a, and references therein) suggest that in particular westernAmazonia has an almost unrivalled species diversity. Forests in the east ofAmazonia and especially the Guianas are characterized by lower diversity whencompared to western Amazonia, both in plants (ter Steege 1998a) and mam-mals (Kay et al. 1997, Voss & Emmons 1996). In terms of plant families, Bomba-caceae, Meliaceae and Moraceae are richer in species in western Amazoniawhile Chrysobalanaceae and Lecythidaceae are relatively richer in species inthe eastern Amazonia and the Guianas (Gentry 1990, Ek & ter Steege 1998).However, while some general patterns have been described, a comparison oftree species composition and tree diversity between Amazonia and the GuianaShield has never been attempted. Below we briefly summarize the state ofknowledge at present.
Floristic patterns
A first attempt to classify the forest types of Amazonia was made by Ducke &Black (1954). Later classifications were by, for example, Pires & Prance (1984)and Prance (1987). The classification of forests was based on climate, soil andphysiognomy, with some account of species composition. A very thorough forestinventory has been carried out in Brazilian Amazonia (Radambrasil 1968–1978,SUDAM 1974) but the data of these inventories have never become availablein the literature (Rollet 1993). Thus, numerical comparisons over large areasremain scarce. In a recent publication in this journal Terborgh & Andresen(1998) produced an excellent first analysis of large-scale patterns in Amazonia,focusing on ‘family-composition’ gradients. Unfortunately, this analysis reliedheavily on plots in western Amazonia. Data from the Guiana Shield and alsofrom central Amazonia were scarce. Terborgh & Andresen (1998) concludedthat plots forming the outliers in the ordination were dominated by minorplant families (e.g. plots in Guyana by Chrysobalanaceae and a plot near SaoPaulo by Euphorbiaceae). However, plots on the edge of an ordination are notnecessarily ‘outliers’, and Chrysobalanaceae and Euphorbiaceae are not exactlyminor plant families with 400 and 2500 species in the neotropics respectively(Maas & Westra 1993).

Tree diversity in Amazonia and the Guiana Shield 803
Diversity patterns
Until now most studies examining the patterns of plant diversity in theneotropics have also relied heavily on plots in western Amazonia (Clinebell et
al. 1995, Gentry 1988a,b; Givnish 1999, Phillips et al. 1994). In westernAmazonia, species richness is strongly correlated with total annual rainfall(Gentry 1988a,b), which is often considered a proximate estimate of ecosystemproductivity (Clinebell et al. 1995, Gentry 1988a, b; Phillips et al. 1994). Rainfallshows a stronger correlation with species richness than do soil fertility and soiltoxicity factors (Clinebell et al. 1995). Givnish (1999) argued that by favouringnatural enemies of plants (fungi and insects), higher rainfall would promotemore density dependent mortality and hence higher diversity. Other studieshave confirmed the rainfall–diversity correlation (Hall 1980, 1994; Huston &Swaine 1976). In each of these studies fertility was negatively correlated withrainfall, complicating the search for single causal relationships. But the signalsare also confusing. Phillips et al. (1994) did not find a strong link betweenrainfall and diversity, allegedly, because they did not include the climaticextremes (Clinebell et al. 1995). Because probably 90% of the neotropical rainforests do not occur near ‘climatic extremes’, it appears that the model, asproposed by Clinebell et al. (1995), in which annual rainfall and periodicity arethe most important factors, may not be sufficient in predicting species diversityover major areas of Amazonia (as will be further shown below).
Habitat diversity contributes significantly to regional species diversity. Spe-cies may differentiate along topographical differences and soil types (Guianas:e.g. Sabatier et al. 1997, Schulz 1960, ter Steege et al. 1993, ter Steege 1998a;W. Amazonia: e.g. Duivenvoorden & Lips 1995, 1998; Tuomisto & Ruokolainen1997, Tuomisto et al. 1995).
Historical events are also considered to have had a large influence on divers-ity. As an example, Pleistocene fluctuations may have led to contracting andexpanding rain forests and through isolation of tree populations have contrib-uted to speciation (Prance 1982, for recent reviews see Bush 1994, Haffer1997). However, such hypotheses are notoriously difficult to test and often leadto circular reasoning (Tuomisto & Ruokolainen 1997) and in fact may havebeen based on collector artefacts (Nelson et al. 1990). Other evidence suggeststhat many of the present-day species may have evolved before the Pleistoceneclimate changes (see examples in Bush 1994, Kay et al. 1997).
The Guiana Shield
The number of floristic plots in the Guiana Shield area has risen steadilyover the years and, combined with the relatively well-known flora, this has ledto high quality data (Comiskey et al. 1994, Ek 1997, Johnston & Gillman 1995,Maas 1971, Sabatier 1990, D. Sabatier & M.F. Prevost, unpubl. data, T. vanAndel, unpubl. data). The forest is generally species-poor (ter Steege 1998a)over the full rainfall range (2000–5000 mm y−1). Including these plots of

H A N S T E R S T E E G E E T A L .804
species-poor forests, and several new plots from central and eastern Amazonia,occurring under rainfall regimes similar to the older studies in an analysis ofspecies composition and diversity may greatly increase our understanding ofcauses of diversity in the Amazon.
In the present paper we examine whether the rainfall-diversity hypothesis iscapable of explaining woody species diversity in a dataset that includes the forestsof the Guiana Shield and eastern Amazonia. We also present an analysis offamily-level floristic composition, comparing the Guianan forest block with thatof central and western Amazonia. From the large-scale patterns some smaller-scale patterns follow. To carry out these analyses we lent heavily on previouslypublished material but many plots are from previously unpublished data.
METHODS
Our analysis focuses on family-level floristic composition and diversity of 268forest plots that are well distributed over Amazonia and the adjacent GuianaShield (Figures 1, 3). However, the same information was not available for all
Figure 1. Locations and plot scores of 70 Amazonian terra firme (TF) plots used in a multidimensionalscaling ordination based on the abundance of the 16 most dominant tree families. Scores are indicated inthree classes: P < 0, L between 0–1, M > 1. The elliptic lines are isoclines of a spatial quadratic regression(see text) on MDS plot scores. The arrow from Guyana to Peru indicates the direction of a linear spatialregression (see text) and the major direction of the spatial gradient described.

Tree diversity in Amazonia and the Guiana Shield 805
Figure 2. Ordination by multidimensional scaling of 70 Amazonian terra firme (TF) plots on the basis oftheir similarity in numbers of individuals in 16 major plant families. Similarity was calculated with correla-tion coefficients. Symbols: R, central Amazonia, l, eastern Amazonia; p, Guiana Shield; m, westernAmazonia and Rondonia.
plots thus the floristic analyses and diversity analyses were carried out on dif-ferent subsets of the data.
Floristic composition
Less than half of the plots have floristic information in the form of thenumber of individuals by species or only by family. To avoid over-representationof certain sites, the number of plots per forest type (TF, terra firme; FL,floodplain; PZ, podzol; SW, swamp; DF, dry forest) was reduced to two per site.In this case we selected the site with the lowest diversity (highest dominance)and the highest diversity (lowest dominance). While strictly speaking this maybe considered pseudo-replication, plots closer to each will in principle be moresimilar to each other due to spatial auto-correlation (and they should also becloser on a gradient when ordinated). We tested for spatial auto-correlationwith Variowin 2.21 (Pannatier 1996) and with Spatialstats (S-PLUS 2000,Mathsoft Inc.).
For floristic analysis 105 plots were available (Appendix 1). Our first set of48 plots was derived from Table 2 of Terborgh & Andresen (1998). We couldduplicate the main results of Terborgh & Andresen (1998) by using the 16 mostabundant families reported in their Table 2. The 16 families were Annonaceae,Arecaceae, Bombacaceae, Burseraceae, Chrysobalanaceae, Euphorbiaceae,Lauraceae, Lecythidaceae, Leguminosae, Meliaceae, Moraceae, Myristicaceae,Rubiaceae, Sapotaceae, Sterculiaceae and Violaceae. We concluded that these

H A N S T E R S T E E G E E T A L .806
Figure 3. Location of Amazonian terra firme (TF) plots used in the analysis of tree alpha-diversity. Dotsize indicates the value of Fisher’s alpha (in case of overlap only the highest may be visible). Grey-scalesindicate interpolated values of Fisher’s alpha (with interdistance weighting up to 500 km).
abundantly present families, which amounted to 65–96% of all individuals onthe plots (Terborgh & Andresen 1998) dominated the analysis, and, not unim-portantly, neotropical rain forests.
To make the other plots comparable to the first set we used the same criteriaas Terborgh & Andresen (1998): a plot size of O 1 ha and only trees with DBHO 10 cm were used. Such plots capture a fair amount of the local diversity(Laurance et al. 1998, but see Condit et al. 1998). The plots were truncated to450 trees by randomly selecting 450 individuals and assigning these to theirrespective families (note that only the 16 families mentioned were used for theordinations below). We made a few exceptions to include plots of areas whereno other data were available:(i) Three plots with fewer individuals: San Pedro, Venezuela, 443 individuals
(Finol Urdaneto undated); Haut Camopi, French Guiana, 435 individuals(Sabatier & Prevost 1987); and Jaru, Rondonia, 442 individuals (Absy et al.1987).
(ii) In the case of Saimadodyi, Venezuela (Lizarralde 1997) and El Tigre, Boli-via (Bergmans & Vroomans 1995) only average numbers per family wereavailable for combined plots. Here we calculated the number of individualsper family not by random selection but by converting the percentage ofindividuals to numbers within a sample of 450 trees.

Tree diversity in Amazonia and the Guiana Shield 807
(iii) Two plots were based on plotless tree samples along a line (within oneforest type) rather than on a 1-ha plot basis (Mori & Boom 1987, Mori et
al. 1989). In this case the first 450 trees sampled were used.
Species and genus information was not used in the analysis. This is an ob-vious drawback as evolution and competition take place at this level ratherthan at the family level. However, as Terborgh & Andresen (1998) pointedout, the data at species and genus level contains too much noise to produceinterpretable results.
We recognized four main ‘forest types’: forests on ultisols and oxisols, socalled ‘terra firme’ forest (TF); forests on floodplains (FL); forests on whitesand podzols or spodosols (PZ); and swamp forests (SW). Initially, the plotswere assigned to eight regions: western Amazonia (WA), Rondonia (RO), cent-ral Amazonia (CA), eastern Amazonia (EA), Guiana Shield (GS), Choco, Cent-ral America, Atlantic Brazil.
Swamp plots (n = 2) were not included in the multivariate floristic analyses(see Terborgh & Andresen 1998). Because the floras from the Choco area,Central America and the Atlantic forest are relatively separated geographicallyfrom the main large Amazonian forest mass and because we had only a fewplots in them, we also omitted the plots from these areas from the final ana-lysis. The Rondonia plots resembled western Amazonian plots most closely,and because of their geographical proximity, were added to WA.
The remaining data (94 plots) were analysed with principal component ana-lysis and detrended correspondence analysis (MVSP 3.01, Kovach ComputingServices) on the basis of the 16 major plant families. We also compared theresults of these ordinations with multidimensional scaling (with both a correla-tion matrix and Euclidean distance matrix as input, Statistica 4.5, Statsoft,Inc.) and chose the ordination that best separated the data spatially.
We also analysed the data of the TF plots (n = 70) and FL plots (n = 24)separately.
Diversity patterns
Almost all plots (n = 258) have information on the number of individualsand number of species, which were used for the calculation of alpha-diversity(Appendix 1, Figure 3). Many of these plots were gathered from the literaturebut again a substantial portion of these plots comes from our own work.
Alpha-diversity was quantified with Fisher’s alpha (Fisher et al. 1943,Rosenzweig 1995, Taylor et al. 1976) using all individuals and species per plot.Fisher’s alpha, which is relatively insensitive to sample size, performs very wellon data of forest plots (Condit et al. 1998, Leigh 1995). Using all plots for thecalculation of alpha-diversity allows us to compare local differences of diversitywith regional differences. Core Amazonian rain forest plots were defined asthose occurring east of the Andes, between 8° S to 8° N, with rainfall O 2000mm. This set includes the hyper-diverse plots of Peru and Ecuador but excludes

H A N S T E R S T E E G E E T A L .808
the dry (deciduous) forest plots in Venezuela and Bolivia. Differences betweenregions and forests were analysed with ANOVA, post-hoc comparisons werecarried out with Scheffe’s tests. We tested for spatial auto-correlation withVariowin 2.21 (Pannatier 1996) and Spatialstats (S-PLUS 2000, Mathsoft Inc.).
Productivity
For just a few sites in the neotropics net primary productivity has beenestimated on the basis of field measurements—San Carlos de Rio Negro andReserva Ducke (Raich et al. 1991). We use one proxy estimate for productivity,rainfall (e.g. Clinebell et al. 1995, Gentry 1988a, b; Phillips et al. 1994), whichshows good correlation with modelled net primary productivity (Raich et al.1991). We analysed the relationship between alpha-diversity and rainfall forthe complete data set (including low rainfall plots) and various subsets, basedon region, edaphic condition and major soil type with regression analysis.
Maps were created with Arcview 3.1 (ESRI Inc.).
RESULTS
Floristic patterns
The 16 families considered in the analyses made up 79% of the tree popula-tions in the Amazonia, if we assume the plots to be representative for thearea. Leguminosae dominate the neotropical forests. On average 16% of allindividuals on the plots were Leguminosae (Table 1).
In half of the forest regions and forest types Leguminosae is the most abund-ant family (Table 1). Leguminosae are especially abundant in the Guianas infloodplain forests (Table 1) and forests on white sand podzols (an average of164 ind. in three 450-tree samples), and in fact, in the Guiana Shield in general(Table 1). Over the whole area considered, the abundance of Leguminosae istwice as high as those of the next two most abundant families – Arecaceae andLecythidaceae, with 9% and 8% respectively. These data also show that justthree families amount to nearly one-third of all trees in Amazonia. In forestson white sand podzols in the Guiana Shield (n = 3), Leguminosae and Bomba-caceae are very abundant (163–165 and 72–130 individuals in 450-tree samplesrespectively). Arecaceae and Moraceae are most abundant in the terra firmeforest of WA, as are Myristicaceae and Rubiaceae. Sapotaceae are most abund-antly found in CA and Burseraceae in both CA and EA. Lecythidaceae andChrysobalanaceae are most abundant in CA and GS. Arecaceae dominate thefloodplain forests in both WA and EA (Table 1) and also the swamp forests inWA (data not shown) and GS (van Andel, unpubl. data).
The DCA, PCA and MDS ordinations gave very similar results and the scoresof the plots on the first axis were highly correlated (Pearson’s r: DCA–PCA0.983; DCA–MDS −0.954). Because there are distinct floristic differencesbetween TF and FL plots (Table 1) the results of the TF and FL ordinationare discussed separately.

Tree diversity in Amazonia and the Guiana Shield 809
Table 1. Average number of individuals of 16 major tree families in random samples of 450 trees on smallplots in terra firme plots in four Amazonian regions. Abbreviations: WA, western Amazonia; CA, centralAmazonia; EA, eastern Amazonia; GS, Guiana Shield. The families have been ordered according to theirabundance from WA to GS. Differences in the superscript following the abundance indicate significantdifferences between regions. P indicates the level of significance as tested with one way ANOVA. Familiesthat show a significant difference between regions are in bold.
WA CA EA GS P
Terra firme forest
Number of plots 21 10 11 28Arecaceae 51.7a 13.1b 10.9b 10.0b 0.000Myristicaceae 28.7a 14.6ab 7.8b 6.1b 0.000Moraceae 50.6a 28.6b 18.8b 9.0b 0.000Rubiaceae 10.7a 3.1b 1.9b 4.0b 0.000Violaceae 11.6 7.6 8.5 3.4 0.305Sterculiaceae 11.7 3.9 11.5 5.0 0.320Sapotaceae 21.3b 59.8a 31.7b 28.3b 0.000Euphorbiaceae 21.3 11.8 29.7 16.8 0.104Meliaceae 12.1 6.8 19.3 9.4 0.176Burseraceae 19.3b 35.2a 41.5a 21.0b 0.007Lauraceae 14.3 21.2 14.0 18.9 0.337Bombacaceae 8.6 4.7 4.8 12.1 0.118Annonaceae 10.9 9.6 13.3 16.4 0.194Lecythidaceae 21.2b 59.7a 43.5b 56.7a 0.001Leguminosae 49.3b 55.9ab 77.6ab 94.6a 0.001Chrysobalanaceae 8.4b 27.5a 12.2b 38.4a 0.000
Floodplain forest
Number of plots 16 3 3 2Rubiaceae 10.1 10.7 0.0 0.0 0.185Moraceae 34.1 33.0 4.3 0.0 0.087Myristicaceae 25.4 28.0 3.0 3.0 0.087Violaceae 5.4 4.3 0.0 1.5 0.789Annonaceae 27.9 29.0 0.3 7.0 0.065Sapotaceae 18.1 31.3 3.7 3.0 0.060Sterculiaceae 9.5 6.0 7.7 2.5 0.514Lauraceae 9.8b 32.7a 0.0b 8.5ab 0.008Euphorbiaceae 20.8 33.3 21.0 9.5 0.604Arecaceae 100.1ab 17.3b 181.7a 0.0b 0.008Bombacaceae 22.8 7.0 16.0 14.0 0.676Chrysobalanaceae 6.9 15.0 31.3 2.0 0.160Burseraceae 3.0b 11.3a 19.3a 6.5a 0.002Meliaceae 16.7 7.0 22.0 31.0 0.402Lecythidaceae 4.8b 43.0a 16.7ab 48.5a 0.000Leguminosae 44.8b 49.0b 83.0b 236.0a 0.000
The ordination with MDS produced the best separation of TF plots by areain a bi-plot (Figures 1, 2). Explained variance is c. 27% for axis 1 and 11% foraxis 2, based on PCA and DCA ordination. In the MDS ordination (as in theothers) the plots are ordered more or less in a north-east to south-west direc-tion (Figure 1). Plots with a low score are found in the Guianas, EA and CA.Plots with a high score are mainly found in WA. However, the more centralportion of WA has lower scores than the more southern and northern parts.Although a linear spatial regression explains the variation of MDS plots scoresrelatively well (r = 0.699, P < 0.001, Figure 1), a quadratic function explainsthe variation better (r = 0.754, P < 0.001). The linear component can be inter-preted as the main gradient from Guyana–east Venezuela to Peru–Bolivia

H A N S T E R S T E E G E E T A L .810
(Figure 1). The quadratic model shows anisotropy caused by the fact that theplots on the edge of western Amazonia and the Guiana Shield are more similarto the plots in the Guianas than the plots in Peru. Auto-correlation analysis ofMDS plot scores results in an exponential variogram (r = 0.81, P < 0.01),suggesting that none of the plots are really spatially independent (no matterthe distance) but rather are ordered on a gradient.
Families that show the strongest correlation with MDS axis 1 are (Table2): Arecaceae, Myristicaceae and Moraceae, increasing in abundance from theGuianas towards western Amazonia, and Chrysobalanaceae and Lecythidaceaeincreasing towards the Guianas. Sapotaceae show an optimum in CA indicatedby only a significant 2nd order polynomial. Sterculiaceae and Violaceae showhighest abundance at the two ends of the gradient but the significance ismainly caused by one point with very high abundance.
The gradient for the 24 FL plots was less ‘method-independent’ (r: DCA–N-MPCA −0.612; DCA–MDS 0.891). However, the explained variance (DCA)was still 41% for the first two axes together. Arecaceae, Lecythidaceae andLeguminosae had strongest correlation with the first axis. Because all FL plotsin EA were also strongly dominated by Arecaceae, WA and EA plots werealways close together in the bi-plots.
Diversity patterns
The range found in Fisher’s alpha (in the complete data-set) was quitelarge – from 3.6 (GS: N (no. of individuals) = 395, S (no. of species) = 17) to221.8 (CA: N = 769, S = 322). Plots with very high alpha-diversity (Fisher’salpha > 200) are found in a wide area from western to central Amazonia(Figure 3). These plots include the hyper-diverse plots in Peru (Gentry 1988a)
Table 2. Coefficients of determination (r2) of a multiple regression of the scores of plots on the first axis ofthe multidimensional scaling and family abundance on these 70 TF plots in Amazonia and the Guiana Shieldarea. Significant regressions (with Bonferroni correction) are given in bold. With four families the 2ndorder polynomial is necessary to describe the relationship between axis and abundance well. Sapotaceae andLeguminosae show an optimum in the centre-axis scores, Sterculiaceae and Violaceae a minimum.
Family 1st order 2nd order significance
Annonaceae 0.04 0.05 nsArecaceae 0.74 0.78*Bombacaceae 0.00 0.00 nsBurseraceae 0.01 0.11 nsChrysobalanaceae 0.39 0.55*Euphorbiaceae 0.01 0.01 nsLauraceae 0.11 0.12 nsLecythidaceae 0.58 0.68*Leguminosae 0.06 0.19*Meliaceae 0.08 0.11 nsMoraceae 0.52 0.52*Myristicaceae 0.17 0.17*Rubiaceae 0.13 0.14 nsSapotaceae 0.13 0.18*Sterculiaceae 0.09 0.16*Violaceae 0.13 0.27*

Tree diversity in Amazonia and the Guiana Shield 811
and Ecuador (Valencia et al. 1994) but also in Brazil (Amaral 1996, Oliviera &Mori 1999). Most plots in eastern Amazonia, the Guianas and other areas havemuch lower diversity, except for some plots in the Choco (Faber-Langendoen &Gentry 1991) and French Guiana (Mori & Boom 1987). The variogram con-structed for alpha-diversity of TF plots suggests autocorrelation up to 300–500 km but contains a substantial amount of noise at larger distances. Forinterpolation of TF diversity an interdistance-weighting up to 500 km is usedin Figure 3.
Both region (WA+RO, CA, EA, GS) and forest type (only FL and TF tested)had a significant effect on Fisher’s alpha (Regions: F[3,137] = 12.23, P < 0.001;Forest type: F[1,137] = 23.24, P << 0.001; No interaction: F[1,137] = 1.45, P = 0.23)when tested together for the core Amazonian plots (8° S–8° N, rainfall O 2000mm y−1). Average alpha-diversity is highest in central Amazonia followedclosely by western Amazonia (Table 3). The most diverse floodplain forests arefound, on average, in western Amazonia. The plots on the Guiana Shield andeastern Amazonia have low diversities for terra firme and floodplain forest, aswell as forest on white sand podzols and in swamps (as compared to WA andCA). Post-hoc comparison (Scheffe’s test) shows that in terms of alpha-diversitythere are two regions. CA and WA plots are not significantly different fromeach other and neither are EA and GS plots. Between the CA–WA on one handand EA–GS on the other all combinations are significantly different. Thus, EAand GS plots have significantly lower diversity than WA and CA plots.
TF plots have significantly higher diversity than FL plots in all regions.Swamp plots appear to have lowest diversity, while white sand podzols havehigher diversity than floodplains. Neither were tested statistically because oftheir low numbers.
The overall relationship between rainfall (complete range) and diversity (allplots in WA+RO, CA, EA and GS) was very weak (Figure 4a). Rainfallexplained c. 8% of the variation in Fisher’s alpha (r = 0.279, df = 241, P <0.001). Two very rich plots in WA have a large influence on the correlationoutcome and show very high Cook’s distances (0.14, 0.15 vs. an average of 0.05)and can be considered as statistical outliers. But even with omission of fourplots with Fisher’s alpha > 200, the influence of rainfall is still significant (r =
Table 3. Average alpha-diversity for 1-ha plots in core Amazonian rain forest (8° S–8° N, annual rainfall O2000 mm). Abbreviations: GS, Guiana Shield; EA, eastern Amazonia; CA, central Amazonia; WA, westernAmazonia; TF, terra firme; FL, floodplain forest; PZ, forest on white sand podzols; SW, swamp forest. Max-imum Fisher’s-alpha per forest per region in parentheses. Superscripts indicate differences in averageFisher’s-alpha between the regions as tested with Scheffe’s post-hoc test (P < 0.05); P indicates significancefor single-way ANOVA per forest type.
Forest WA CA EA GS P
TF 124.5 (221.1)a 126.3 (221.8)a 56.0 (123.6)b 51.9 (155.5)b < 0.001FL 78.7 (131.7)a 46.1 (109.4)ab 20.8 (24.6)ab 16.7 (22.7)b < 0.01PZ 99.7 (142 2)a 24.3 (39.1)b < 0.05SW 33.7 (67.2) 7.5 (8.2) ns

H A N S T E R S T E E G E E T A L .812
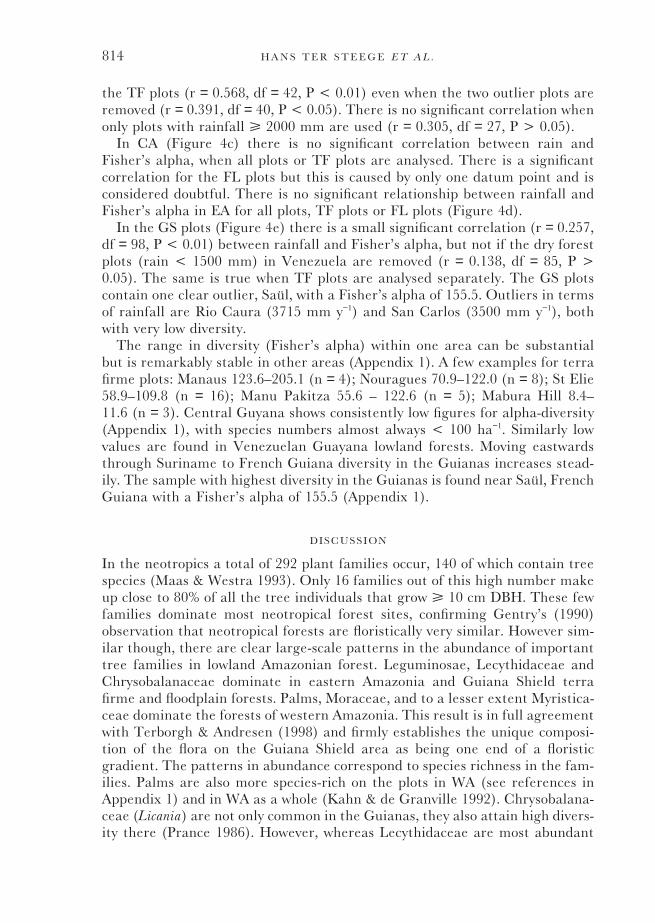
Figure 4. The relationship between annual rainfall (mm y−1) and Fisher’s alpha for (a) all plots in western,central, eastern Amazonia and the Guiana Shield, (b) plots in western Amazonia and Rondonia, (c) centralAmazonia, (d) eastern Amazonia, (e) Guiana Shield. Symbols: p, terra firme; l, floodplain; R, podzol; M,swamp; P, dry forest.
0.211, df = 237, P < 0.01). Both for TF and FL plots rainfall shows a significantcorrelation with Fisher’s alpha (r = 0.244, df = 172, P < 0.01; r = 0.445, df =37, P < 0.01). In the case of TF plots the relationship is no longer significantwhen the plots with annual rainfall < 2000 mm (in the dry regions of Boliviaand Venezuela) are removed (r = 0.041, df = 138, P > 0.05).
In WA+RO (Figure 4b) rainfall has a significant correlation with Fisher’salpha for all plots (r = 0.576, df = 79, P < 0.001). This is also the case for all

Tree diversity in Amazonia and the Guiana Shield 813
H A N S T E R S T E E G E E T A L .814
the TF plots (r = 0.568, df = 42, P < 0.01) even when the two outlier plots areremoved (r = 0.391, df = 40, P < 0.05). There is no significant correlation whenonly plots with rainfall O 2000 mm are used (r = 0.305, df = 27, P > 0.05).
In CA (Figure 4c) there is no significant correlation between rain andFisher’s alpha, when all plots or TF plots are analysed. There is a significantcorrelation for the FL plots but this is caused by only one datum point and isconsidered doubtful. There is no significant relationship between rainfall andFisher’s alpha in EA for all plots, TF plots or FL plots (Figure 4d).
In the GS plots (Figure 4e) there is a small significant correlation (r = 0.257,df = 98, P < 0.01) between rainfall and Fisher’s alpha, but not if the dry forestplots (rain < 1500 mm) in Venezuela are removed (r = 0.138, df = 85, P >0.05). The same is true when TF plots are analysed separately. The GS plotscontain one clear outlier, Saul, with a Fisher’s alpha of 155.5. Outliers in termsof rainfall are Rio Caura (3715 mm y−1) and San Carlos (3500 mm y−1), bothwith very low diversity.
The range in diversity (Fisher’s alpha) within one area can be substantialbut is remarkably stable in other areas (Appendix 1). A few examples for terrafirme plots: Manaus 123.6–205.1 (n = 4); Nouragues 70.9–122.0 (n = 8); St Elie58.9–109.8 (n = 16); Manu Pakitza 55.6 – 122.6 (n = 5); Mabura Hill 8.4–11.6 (n = 3). Central Guyana shows consistently low figures for alpha-diversity(Appendix 1), with species numbers almost always < 100 ha−1. Similarly lowvalues are found in Venezuelan Guayana lowland forests. Moving eastwardsthrough Suriname to French Guiana diversity in the Guianas increases stead-ily. The sample with highest diversity in the Guianas is found near Saul, FrenchGuiana with a Fisher’s alpha of 155.5 (Appendix 1).
DISCUSSION
In the neotropics a total of 292 plant families occur, 140 of which contain treespecies (Maas & Westra 1993). Only 16 families out of this high number makeup close to 80% of all the tree individuals that grow O 10 cm DBH. These fewfamilies dominate most neotropical forest sites, confirming Gentry’s (1990)observation that neotropical forests are floristically very similar. However sim-ilar though, there are clear large-scale patterns in the abundance of importanttree families in lowland Amazonian forest. Leguminosae, Lecythidaceae andChrysobalanaceae dominate in eastern Amazonia and Guiana Shield terrafirme and floodplain forests. Palms, Moraceae, and to a lesser extent Myristica-ceae dominate the forests of western Amazonia. This result is in full agreementwith Terborgh & Andresen (1998) and firmly establishes the unique composi-tion of the flora on the Guiana Shield area as being one end of a floristicgradient. The patterns in abundance correspond to species richness in the fam-ilies. Palms are also more species-rich on the plots in WA (see references inAppendix 1) and in WA as a whole (Kahn & de Granville 1992). Chrysobalana-ceae (Licania) are not only common in the Guianas, they also attain high divers-ity there (Prance 1986). However, whereas Lecythidaceae are most abundant

Tree diversity in Amazonia and the Guiana Shield 815
in Guyana, they have highest diversities in central Amazonia (Mori et al. inpress).
If rainfall is not a good predictor of large-scale patterns in alpha-diversity inAmazonia, what is? We briefly discuss four possible causes, specifically compar-ing the Guiana Shield area with central and western Amazonia.
Primary productivity
Primary productivity is thought to have an important influence on speciesrichness (e.g. Huston 1994, Rosenzweig 1995) and Phillips et al. (1994) foundthat the most productive sites in western Amazonia did indeed have highestspecies diversity. A higher turnover, leading to escape from competitive conclu-sion could be the mechanism (Huston 1994, Phillips et al. 1994). Unfortunately,rainfall, seasonality, temperature and soil quality may all independently affectproductivity.
Large-scale differences in NPP, between WA, CA and GS appear to be non-existent (see Raich et al. 1991). Most soils in the Amazon basin are poor, rain-fall ranges and temperatures are similar. However, the NPP as calculated byRaich et al. (1991) is based upon the FAO soil map of the world, which greatlyunderestimates the presence of ultisols in the western Amazon, which are allclassified as oxisols (Richter & Babbar 1991). Based on the data we have, wecannot conclude that differences in productivity are the cause of differences inthe large-scale diversity patterns over Amazonia.
Rainfall, as a proxy estimate for productivity, has been found to correlatestrongly with diversity (Clinebell et al. 1995). We find rainfall to be a poorestimator for tree alpha-diversity, especially when only plots with rainfallO2000 mm are taken into account, which would include most plots with rainforest. There is a difference in tree alpha-diversity between forests with verylow rainfall, dry forests, and the forests with higher rainfall, rain forests. How-ever, considering only rain forests, we cannot agree with Clinebell et al. (1995)that ‘Wet forests with an ample year-round moisture harbour the greatestnumber of woody plant species and should be a focus of conservation efforts’.Forest in central Amazonia with lower annual, more seasonal, precipitation,such as around Manaus can be just as species-rich as the aseasonal very wetforests of western Amazonia, and possibly several areas in between (Figure 3).On the other hand under a similarly large range in rainfall, tree alpha-diversityin the Guianas is consistently lower than that of CA or WA. In addition tothat, such a simple model easily leads to overemphasis of just one measure ofdiversity as a tool for preservation and neglects phytogeographic differencesand patterns of endemism (see below).
Ecosystem dynamics
Both intermediate disturbance hypothesis and dynamic equilibrium theorypredict higher species richness with intermediate disturbances that delay orprevent competitive exclusion (Huston 1994). Higher turnover has indeed been

H A N S T E R S T E E G E E T A L .816
reported from forests with higher diversity (Phillips et al. 1994). But morerecently such high diversities have also been reported from forests with verylow dynamics (Oliviera 1997, Rankin-de Merona et al. 1990). Some communitycharacteristics, related to shade tolerance such as an average large seed size(Hammond & Brown 1995) have been put forward as evidence that the Guianassuffer less large-scale disturbances than WA. Also within Guyana a decline inalpha-diversity is correlated with an increase in average community seed sizeand wood density, and a decrease in pioneers (H. ter Steege & D. S. Hammond,unpubl. data). This gradient in diversity has also been interpreted as a gradientin disturbance, possibly related to prehistoric Amerindian activities (H. terSteege & D. S. Hammond, unpubl. data). If higher turnover should also leadto shorter generation periods this could also affect diversity at longer(evolutionary) time scales (Rohde 1992). Marzluff & Dial (1991) indeed foundthat short generation time (and the ability to colonize new resources) wasassociated with higher diversity.
Area
Area probably holds more influence over the origin and maintenance ofdiversity at large and small scales than currently appreciated. It may, forexample, be largely responsible for the latitudinal gradient (Rosenzweig 1995,Terborgh 1973). Larger areas should have more species for four reasons – twopertaining to speciation rates and two pertaining to extinction rates(Rosenzweig 1995). Speciation rates in larger areas are higher because (a)larger areas are more likely to contain geographical barriers, important forallopatric speciation and (b) species with larger ranges have more genetic vari-ation and seem to evolve faster. Extinction rates in large areas/populations arelower because (c) larger ranges lead to larger populations that are less likelyto go extinct due to random population fluctuations and (d) larger rangesencompass more niche refugia, where populations may reside when largechanges (e.g. climatic) occur.
Because species richness in smaller areas is also influenced by the size of thetotal area it belongs to, caused by sink–source relationships, or mass effects(Rosenzweig 1995, Zobel 1997), 1-ha plots in large forest tracts should havemore species than those of smaller tracts. If we carefully consider the locationof the Guianas in relation to the rest of Amazonia, a much larger area, threebarriers exist between them. From the north to the south these are: the Llanos,the Guayana Highlands and the Transverse Dry Belt (Pires 1997). EasternAmazonia is separated from Central Amazonia by the same Transverse DryBelt in the west and is bordered on the south by dry deciduous forest. Themouth of the Amazon effectively separates Eastern Amazonia and the GuianaShield areas. Also the river drainage system of the three Guianas is almostcompletely separated from the Amazon drainage (e.g. Rosales-Godoy et al.1999). While the separation is by far not ‘species-tight’ only a pattern of thisscale can explain the consistent differences in species diversity between eastern

Tree diversity in Amazonia and the Guiana Shield 817
Amazonia and the Guiana Shield on one hand and central and westernAmazonia on the other hand.
Area may also help to explain why certain forest types are richer than others.Obvious conclusions sometimes force themselves upon us. We generally believethat floodplains and mangroves are poor places to live with severe physiologicalconstraints imposed by perpetual waterlogging and regular submersion by theseawater, allegedly limiting the pool of species that can grow (e.g. Clinebell et
al. 1995). But is this true? Mangroves and floodplains are also fringe habitats,small in area and heavily fragmented. Could this contribute to their low speciesrichness? Thinking long-term and large-scale, most likely it does (Rosenzweig1995, Terborgh 1973 and see above arguments). We would be surprised that,if mangroves covered an area the size of Amazonia, they would be as poor inspecies as they are now. In fact, where mangroves are more extensive (thePacific) they are indeed much richer in species (Tomlinson 1986).
In the light of the above, it should not be surprising that the forest thatcovers most of the ‘typical soils’ of Amazonia (ultisols and oxisols) is also therichest, not only in CA and WA but also within the Guianan area. Floodplainforests, swamps and forests on white sands are much smaller in extent (Table4) and more fragmented and for reasons stated above that should explain tosome extent their lower species richness. White sand podzols cover only 2.8% ofthe Amazon basin and 7.9% in Guyana (Table 4). Because of obvious ecologicaldifferences, they harbour, despite their low species richness, a flora relativelyrich in endemics (Huber 1995, Lleras 1997, ter Steege 1998a, ter Steege et al.2000). Had the situation been reversed with most of Amazonia being whitesand and just a few areas with ultisols/oxisols, undoubtedly the latter wouldhave been far poorer in species (we probably would have attributed this to the‘obvious’ aluminium toxicity of such soils). Floodplains are more species-richwhere they cover larger areas in WA. Within that area they had even fargreater extent in historical times (Rosales-Godoy et al. 1999).
Endemics are most often found in small distinct habitats, often fragmented(‘ecological islands’), such as white sand areas, serpentine rock, cloud forests(Gentry 1992, Huber 1995, Lleras 1997, ter Steege 1998a, ter Steege et al.2000). With the same reasoning mangrove-, floodplain- and swamp-restrictedspecies could be considered ‘ecological endemics’. Because small habitat areasare likely to have fewer species (see above) we expect the relationship between
Table 4. Percentage of soil types in four neotropical areas largely covered with rain forest. Oxisols andultisols cover the majority of these areas and are particularly extensive in the Brazilian Amazon. (Data:Guyana, Gross-Braun (1965); Brazil, Richter & Babbar (1991); Colombia, Duivenvoorden & Lips (1998);Peru, Salo et al. (1986).)
Podzols FL O/U Lithosols Total area (km2)
Guyana 7.9 8.2 51.5 16.7 214 056Brazilian Amazon 2.8 7.1 71.4 4.5 4 614 100Colombian Amazon (pro porte) 4.1 14.3 72.7 8.2? 6 700Peruvian Amazon na 12.0 na na 515 800

H A N S T E R S T E E G E E T A L .818
endemism and diversity to be negative within a phytogeographic region.Between regions or continents, i.e. areas with a separate evolutionary history,the relationship is undoubtedly positive: the more species the more endemics.
Two factors, area and disturbance regime, may be responsible for a largepart of the differences in alpha-diversity found between the Guiana Shield areaand eastern Amazonia as compared to central and western Amazonia. Veryrecently a third potential factor was added to this list: the ‘mid-domain effect’(Colwell & Lees 2000). This model suggests that even without environmentalgradients species richness should peak in the centre of a large biogeographicarea and is based on the range-size distribution found in species. The causesfor gradient in family composition could be both ecological and historical(Terborgh & Andresen 1998). Arecaceae and Moraceae are very abundant andspecies-rich in western Amazonia but they are not absent in the eastern areas.In several floodplain sites Arecaceae even dominate the forests in EA and thecoastal swamps of the Guianas. Similarly, Chrysobalanaceae and Lecythidaceaeare not absent from western Amazonia but less abundant. But why are Mora-ceae more abundant and rich in species in WA and are Chrysobalanaceae,Lecythidaceae and Leguminosae more abundant in GS? We believe that thedisturbance regime may be partly responsible (Hammond & Brown 1995; H.ter Steege & D. S. Hammond, unpubl. data). Higher dynamics may allow mem-bers of families with pioneer-like characteristics such as light wood, smallseeds, and short generation times (many Moraceae) to dominate over theslower growing species from the dense wooded and large-seeded families(Chrysobalanaceae, Lecythidaceae). In Guyana we found clear patterns of aver-age community seed size, wood density and diversity (H. ter Steege & D. S.Hammond, unpubl. data). At the larger scale, the seed size spectrum of Gui-anan forest is also strikingly different from that of Western Amazonia(Hammond & Brown 1995). Fast growing species tend to have short generationtimes, which may promote species richness of such taxa (Marzluff & Dial 1991).This may be an additional cause for the high diversity in western Amazonia.
ACKNOWLEDGEMENTS
We thank all our colleagues who have published materials that we needed somuch to carry out the analyses. We hope that this publication will stimulateothers to continue the search for causal effects on diversity and floristic pat-terns. We also thank Mark van Nieuwstadt, Rene Verburg for discussions andcomment, Roderick Zagt, Marinus Werger, Thijs Pons, John Terborgh, KalleRuokolainen, David Newbery and two anonymous reviewers for critical andstimulating comments on the manuscript, and Pitman et al. for their unpub-lished manuscript.
LITERATURE CITED
ABSY, M. L., PRANCE, G. T. & BARBOSA, E. M. 1987. Inventario florıstico de floresta natural na areada estrada Cuiaba-Porto Velho (BR – 364). Acta Amazonica 16/17(suppl.):85–121.

Tree diversity in Amazonia and the Guiana Shield 819
ALMEIDA, S. S., LISBOA, P. L. B. & SILVA, A. S. 1993. Diversidade florıstica de uma comunidadearborea na estacao cientıfica ‘Ferreira Pena’, em Caxiuana (Para). Boletim do Museu Paraense EmılioGoeldi. Serie Botanica 9:93–128.
AMARAL, I. L. 1996. Diversidade florıstica em floresta de terra firme, na regiao de Urucu – AM.Dissertacao de Mestrado, Instituto Nacional de Pesquisas da Amazonia (INPA) /FundacaoUniversidade do Amazonas (FUA). Manaus.
AYRES, J. M. 1981. Observacoes sobre a ecologia e o comportamento doc Cucius (Chiropotes satanes eC. satanus). MSc dissertation, INPA, Manaus.
AYRES, J. M. 1993. As matas da Varzea do Mamiraua. MCT-CNPq/ Sociedade Civil Mamiraua. Brasilia.BALEE, W. 1986. Analise preliminar de inventario florestal e a etnobotanica Ka’apor (Maranhao).
Boletim do Museu Paraense Emılio Goeldi. Serie Botanica 2:141–167.BALEE, W. 1987. A entnobotanica quantitativa dos ındios Tembe (Rio Gurupi, Para). Boletim do Museu
Paraense Emılio Goeldi. Serie Botanica 3:29–50.BALEE, W. & CAMPBELL, D. G. 1990. Evidence for the successional status of liana forest (Xingu river
basin, Amazonian Brazil). Biotropica 22:36–47.BALSLEV, H., LUTEYN, J., OLLGAARD, B. & HOLM-NIELSEN, L. B. 1987. Composition and structure
of adjacent unflooded and floodplain forest in Amazonian Ecuador. Opera Botanica 92:37–57.BALSLEV, H., VALENCIA, R., PAZ Y MINO, G., CHRISTENSEN, H. & NIELSEN, I. 1998. Species
count of vascular plants in one hectare of humid lowland forest in Amazonian Ecuador. Pp. 585–594in Dallmeier, F. & Comiskey, J. A. (eds). Forest biodiversity in North, Central and South America, and the
Caribbean. Research and monitoring. MAB Series Vol. 21. UNESCO, Paris.BERGMANS, F. & VROOMANS, V. 1995. Availability and sustainability of forest resources: a research to the
structure and species composition of a north Bolivian Amazon forest and its actual and future resource availability.Thesis, Larenstein Agricultural College, Velp, The Netherlands.
BLACK, G. A., DOBZHANSKY, T. H. & PAVAN, C. 1950. Some attempts to estimate species diversityand population density of trees in Amazonian forests. Botanical Gazette 111:413–425.
BONGERS, F., POPMA, J., MEAVE DEL CASTILLO, J. & CARABIAS, J. 1988. Structure and floristiccomposition of the lowland tropical rain forest of Los Tuxtlas, Mexico. Vegetatio 74:55–80.
BOOM, B. M. 1986. A forest inventory in Amazonian Bolivia. Biotropica 18:287–294.BUSH, M. B. 1994. Amazonian speciation: a necessarily complex model. Journal of Biogeography 21:5–17.CAIN, S. A., DE OLIVEIRA CASTRO, M., MURCA PIRES, J. & DA SILVA, N. T. 1956. Application of
some phytosociological techniques to Brazilian rain forest. American Journal of Botany 43:911–941.CAMPBELL, D. G., DALY, D. C., PRANCE, G. T. & UBIRAJARA, N. M. 1986. Quantitative ecological
inventory of terra firme and varzea tropical forest on the Rio Xingu, Brazilian Amazon. Brittonia
38:369–393.CAMPBELL, D. G., STONE, J. L. & ROSAS, A. 1992. A comparison of the phytosociology and dynamics
of three floodplain (varzea) forests of known ages, Rio Jurua, western Brazilian Amazon. Botanical
Journal of the Linnean Society 108:213–237.CASTELLANOS, H. G. 1998. Floristic composition and structure, tree diversity, and the relationship
between floristic distribution and soil factors in El Caura Forest Reserve, southern Venezuela. Pp.507–533 in Dallmeier, F. & Comiskey, J. A. (eds). Forest biodiversity in North, Central and South America,
and the Caribbean. Research and monitoring. MAB Series Vol. 21. UNESCO, Paris.CERON, C. E. & MONTALVO, C. A. 1997. Composicion y estructura de una hectarea de bosque en
la Amazonıa Ecuatoriana – con informacion etnobotanica de los Huaorani Pp. 153–172 in Valencia,R. & Balslev, H. (eds). Estudios sobre diversidad de plantas. Memorias de II congreso Ecuatoriana de Botanica.Pontificia Universidad Catolica del Ecuador, Quito.
CLINEBELL, R. R., PHILLIPS, O. L., GENTRY, A. H., STARK, N. & ZUURING, H. 1995. Predictionof neotropical tree and liana species richness from soil and climatic data. Biodiversity and Conservation
4:56–90.COLWELL, R. K. & LEES, D. C. 2000. The mid-domain effect: geometric constraints on the geography
of species richness. Trends in Ecology and Evolution 15:70–76.COMISKEY, J. A., AYMARD, G. & DALLMEIER, F. 1994. Structure and composition of lowland mixed
forest in the Kwakwani region of Guyana. Biollonia 10:13–28.CONDIT, R., FOSTER, R. B., HUBBELL, S. P., SUKUMAR, R., LEIGH, E. G., MANOKARAN, N.,
LOO DE LAO, S., LAFRANKIE, J. V. & ASHTON, P. S. 1998. Assessing forest diversity on smallplots: calibration using species-individual curves from 50-hectare plots. Pp. 247–268 in Dallmeier,F. & Comiskey, J. A. (eds). Forest biodiversity research, monitoring and modelling. Conceptual background and
Old World case studies. MAB Series Vol. 20. UNESCO, Paris.DALLMEIER, F., KABEL, M. & FOSTER, R. B. 1996. Floristic composition, diversity, mortality and
recruitment of different substrates: lowland tropical forest, Pakitza, Rio Manu, Peru. Pp. 61–88 inWilson, D. E. & Sandoval, A. (eds). Manu: the diversity of Southeastern Peru. Smithsonian Institution,Washington.

H A N S T E R S T E E G E E T A L .820
DAVIS, T. A. W. & RICHARDS, P. W. 1934. The vegetation of Moraballi creek, British Guiana. Anecological study of a limited area of tropical rain forest. II. Journal of Ecology 22:106–155.
DE WALT, S. J., BOURDY, G., CHAVEZ DE MICHEL, L. R. & QUENEVO, C. 1999. Ethnobotany ofthe Tacana. Quantitative inventories of two permanent plots of northwestern Bolivia. Economic Botany
53:237–260.DUCKE, A. & BLACK, G. A. 1954. Notas sobre a fitogeografia da Amazonia Brasileira. Boletim Technico
IAN (Belem) 29:1–62.DUIVENVOORDEN, J. F. & LIPS, J. M. 1995. A land-ecological study of soils, vegetation and plant diversity
in Colombian Amazonia. Tropenbos Series 12. Tropenbos Foundation, Wageningen, The Netherlands.DUIVENVOORDEN, J. F. & LIPS, J. M. 1998. Mesoscale patterns of tree species diversity in Colombian
Amazonia. Pp. 535–549 in Dallmeier, F. & Comiskey, J. A. (eds). Forest biodiversity in North, Central
and South America, and the Caribbean. Research and monitoring. MAB Series Vol. 21. UNESCO, Paris.EK, R. C. 1997. Botanical diversity in the tropical rain forest of Guyana. Tropenbos-Guyana Programme,
Georgetown, Guyana. Ph.D. thesis, Utrecht University, The Netherlands.EK, R. C. & TER STEEGE, H. 1998. The flora of the Mabura Hill area, Guyana. Botanischer Jahrbucher
fur Systematik 120:461–502.FABER-LANGENDOEN, D. & GENTRY, A. H. 1991. The structure and diversity of rain forests at Bajo
Calima, Choco, western Colombia. Biotropica 23:2–11.FERREIRA, L. V. 1997. Effects of the duration of flooding on species richness and floristic composition
in three hectares in the Jau National park in floodplain forest in central Amazonia. Biodiversity and
Conservation 6:1353–1363.FERREIRA, L. V. & PRANCE, G. T. 1998a. Structure and species richness of low-diversity floodplain
forest on the Rio Tapajos, Eastern Amazonia, Brazil. Biodiversity and Conservation 7:585–596.FERREIRA, L. V. & PRANCE, G. T. 1998b. Species richness and floristic composition in four hectares
in the Jau National Park in upland forests in Central Amazonia. Biodiversity and Conservation 7:1349–1364.
FERREIRA, L. V. & RANKIN-DE MERONA, J. M. 1998. Floristic composition and structure of aone-hectare forest in central Amazonia. Pp. 649–662 in Dallmeier, F. & Comiskey, J. A. (eds). Forest
biodiversity in North, Central and South America, and the Caribbean. Research and monitoring. MAB SeriesVol. 21. UNESCO, Paris.
FINOL URDANETA, H. UNDATED. Silvicultura de la Mora de Guiana (Mora gonggrijpii). Faculdad deCiencias Forestales. Instituto de Silvicultura, Merida, Venezuela. 73 pp.
FISHER, A. A., CORBET, A. S. & WILLIAMS, C. B. 1943. The relation between the number of speciesand the number of individuals in a random sample of an animal population. Journal of Animal Ecology
12:42–58.GALEANO, G., CEDIEL, J. & PARDO, M. 1998. Structure and floristic composition of a one-hectare
plot of wet forest at the Pacific coast of Choca, Colombia. Pp. 551–568 in Dallmeier, F. & Comiskey,J. A. (eds). Forest biodiversity in North, Central and South America, and the Caribbean. Research and monitoring.MAB Series Vol. 21. UNESCO, Paris.
GAZEL, M. 1983. Croissance des arbres et productivite des peuplement en foret dense equatoriale de Guyane. OfficeNational de Forets, Cayenne, France. 129 pp.
GENTRY, A. H. 1988a. Tree species richness of upper Amazonian forests. Proceedings of the National
Academy of Sciences, USA 85:156–159.GENTRY, A. H. 1988b. Changes in plant community diversity and floristic composition on environmental
and geographical gradients. Annals of the Missouri Botanical Garden 75:1–34.GENTRY, A. H. 1990. Floristic similarities and differences between southern Central America and upper
and central Amazonia. Pp. 141–157 in Gentry, A. H. (ed.). Four neotropical rain forests. Yale UniversityPress, New Haven.
GENTRY, A. H. 1992. Tropical forest biodiversity: distributional patterns and their conservationalsignificance. Oikos 63:19–28.
GENTRY, A. H. & TERBORGH, J. 1990. Composition and dynamics of the Cocha Cashu ‘mature’floodplain forest. Pp. 542–564 in Gentry, A. H. (ed.). Four neotropical rain forests. Yale University Press,New Haven.
GIVNISH, T. J. 1999. On the causes of gradients in tropical tree diversity. Journal of Ecology 87:193–210.GROSS-BRAUN, E. H., DERTING, J. & SUGGETT, R. (1965). Report of the soil survey project of British
Guiana VII: A report to accompany a general soil map of British Guiana. FAO, Rome.HAFFER, J. 1997. Alternative models of vertebrate speciation in Amazonia: an overview. Biodiversity and
Conservation 6:451–476.HALL, J. B. & SWAINE, M. D. 1976. Classification and ecology of closed-canopy forest in Ghana. Journal
of Ecology 64:913–951.HAMMOND, D. S. & BROWN, V. K. 1995. Seed size of woody plants in relation to disturbance,
dispersal, soil type in wet neotropical forests. Ecology 76:2544–2561.

Tree diversity in Amazonia and the Guiana Shield 821
HARTSHORN, G. 1983. Plants – introduction. Pp. 118–157 in Janzen, D. A. (ed.). Costa Rican natural
history. University of Chicago Press, Chicago.HEANY, A. & PROCTOR, J. 1990. Preliminary studies on forest structure and floristics on Volcan
Barva, Costa Rica. Journal of Tropical Ecology 6:307–320.HUBER, O. 1995. Vegetation. Pp. 97–160 in Berry, P. E., Holst, B. K. & Yatskievych, K. (eds). Flora of
Venezualan Guayana. Volume 1. Introduction. Missouri Botanical Garden, St. Louis.HUSTON, M. A. 1980. Soil nutrients and tree species richness in Costa Rican forests. Journal of
Biogeography 7:147–157.HUSTON, M. A. 1994. Biological diversity. The coexistence of species on changing landscapes. Cambridge
University Press, Cambridge, UK. 681 pp.IGAC, Instituto Geografico Augustin Codazzi 1993. Aspectos ambientales para el ordenamiento territorial del
occidente del departamento del Caqueta. Tropenbos Colombia, Bogota, Colombia. 1641 pp.JOHNSTON, M. & GILLMAN, M. 1995. Tree population studies in low-diversity forests, Guyana. I.
Floristic composition and stand structure. Biodiversity and Conservation 4:339–362.JONKERS, W. B. J. 1987. Vegetation structure logging damage and silviculture in a tropical rain forest in Suriname.
Wageningen Agricultural University, Wageningen, The Netherlands. 172 pp.KAHN, F. & DE GRANVILLE, J.-J. 1992. Palms in forest ecosystems of Amazonia. Ecological Studies 95.
Springer Verlag, Berlin. 226 pp.KAY, R. F., MADDEN, R. H., VAN SCHAIK, C. & HIGDON, D. 1997. Primate species richness is
determined by plant productivity: implications for conservation. Proceedings of the National Academy of
Sciences USA. 94:13023–13027.KORNING, J. & BALSLEV, H. 1994. Growth and mortality of trees in Amazonian tropical rain forest
in Ecuador. Journal of Vegetation Science 4:77–86.LAURANCE, W. F., FERREIRA, L. V., RANKIN-DE MERONA, J. M. & HUTCHINGS, R. W. 1998.
Influence of plot shape on estimates of tree diversity and community composition in central Amazonia.Biotropica 30:662–665.
LEIGH, E. G. 1995 Epilogue: Research on Barro Colorado Island 1980–1994. Pp. 496–503 in LeighE. G., Rand, A. S & Windsor D. M. (eds). The ecology of a tropical rain forest, seasonal rhythms and long
term changes. Smithsonian Institution Press, Washington.LIZARRALDE, M. 1997. Perception, knowledge and use of the rain forest: ethnobotany of the Bari of Venezuela.
PhD Thesis, University of California.LLERAS, E. 1997. Upper Rio Negro region. Brazil, Colombia, Venezuela. Pp. 333–337 in Davis, S. D.,
Heywood, V. H., Herrera-MacBryde, O., Vila-Lobos, J. & Hamilton, A. C. (eds). Centres of plant
diversity. A guide and strategy for their conservation. Volume 3. The Americas. World-Wide Fund for Nature &World Conservation Union, Gland.
LONDONA VEGA, A. C. 1993. Analisis estructural de dos bosques asociados a unidades fisiographicas contrastantes,
en la region de Araracuara (Amazonia Colombiana). Universidad de Colombia, Medellın, Colombia.MAAS, P. J. M. 1971. Floristic observations on forest types in western Suriname I and II. Proceedings of
the Koninklijke Nederlandse Academie van Wetenschappen Ser. C 74:269–302.MAAS, P. J. M. & WESTRA, L. Y. Th. 1993. Neotropical plant families. Koeltz Scientific Books, Koenigstein,
Germany. 290 pp.MACIEL, U. N. & LISBOA, P. L. B. 1989. Estudo florıstico de 1 hectarea de mata de terra firme Km
15 da rodovia Presidente Medici-Costa Marques (RO-429), Rondonia. Boletim do Museu Paraense Emılio
Goeldi. Serie Botanica 5:25–37.MARIN, E. & CHAVIEL, A. 1996. La vegetacion: bosques de tierra firme. Pp. 60–65 in Rosales, J. &
Huber O. (eds). Ecologıa de la Cuenca del Rıo Cauca, Venezuela I. Caracterizacion general. Scientia
Guaianae 6.MARZLUFF, J. M. & DIAL K. P. 1991. Life history correlates of taxonomic diversity. Ecology 72:428–
439.MILLIKEN, W. 1998. Structure and composition of one hectare of central Amazonian terra firme forest.
Biotropica 30:530–537.MILLIKEN, W. & RATTER, J. A. 1998. The vegetation of the Ilha de Maraca. Pp. 71–112 in Milliken
W. & Ratter J. A. (eds). Maraca: the biodiversity and environment of an Amazonian rain forest. John Wiley &Sons, New York.
MORI, S. A. & BOOM, B. M. 1987. The forest. Memoirs of the New York Botanical Garden 44:9–29.MORI, S. A., BOOM, B. M., CARVALHO, A. M. & DOS SANTOS, T. S. 1983. Southern Bahian moist
forests. Botanical Review 149:155–232.MORI, S. A., BECKER, P. & KINCAID, D. In press. Lecythidaceae of a central Amazonian lowland
forest: implications for conservation. In Bierregaard R. (ed.). Lessons from Amazonia. Yale UniversityPress, New Haven, USA.
MORI, S. A., RABELO, B. V., TSOU, C.-H. & DALY, D. 1989. Composition and structure of an easternAmazonian forest at Camaipa, Amapa, Brazil. Boletim do Museu Paraense Emılio Goeldi. Serie Botanica.
Serie Botanica 5:3–18.

H A N S T E R S T E E G E E T A L .822
NELSON, B. W., FERREIRA, C. A. C., DA SILVA, M. F. & KAWASAKI, M. L. 1990. Endemism centres,refugia and botanical collection density in Brazilian Amazonia. Nature 345:714–716.
OLIVEIRA, A. A. de 1997. Diversidade, estrutura e dinamica do componente arboreo de uma florestade terra firme de Manaus, Amazonas. Ph. D. dissertation, Instituto de Biociencias da Universidadede Sao Paulo.
OLIVEIRA, A. A. DE & MORI, S. A. 1999. A central Amazonian terra firme forest I. High tree speciesrichness on poor soils. Biodiversity and Conservation 8:1219–1244.
PANNATIER, Y. 1996. VARIOWIN: software for spatial data analysis in 2D. Springer-Verlag, New York,USA. 91 pp.
PERES, C. A. 1994. Primate response to phenological changes in an Amazonian terra firme forest.Biotropica 26:98–112.
PHILLIPS, O. L., HALL, P., GENTRY, A. H., SAWYER, A. S. & VASQUEZ, R. 1994. Dynamics andspecies richness of tropical rain forests. Proceedings of the National Academy of Sciences, USA 91:2805–2809.
PIRES, J. M. 1997. Transverse dry belt of Brazil. Pp. 319–324 in Davis, S. D., Heywood, V. H.,Herrera-MacBryde, O., Vila-Lobos, J. & Hamilton, A. C. (eds). Centres of plant diversity. A guide and
strategy for their conservation. Volume 3. The Americas. World-Wide Fund for Nature & World ConservationUnion, Gland.
PIRES, J. M., DOBZHANSKY, T. H. & BLACK, G. A. 1953. An estimate of the number of species oftrees in an Amazonian forest community. Botanical Gazette 114:467–477.
PIRES, J. M. & KOURY, H. M. 1958. Estudo de um trecho de mata varzea proximo Belem. Boletim
Technico I. A. N. 36:3–44.PIRES, J. M. & PRANCE, G. T. 1984. The vegetation types of the Brazilian Amazon. Pp. 109–145 in
Prance, G. T. & Lovejoy, T. E. (eds). Amazonia. Pergamon Press, Oxford.PITMAN, N. C. A., TERBORGH, J., SILMAN, M. R. & NUNEZ-V, P. 1999. Tree species distributions
in an upper Amazonian forest. Ecology 80:2651–2661.PRANCE, G. T. 1982. Forest refuges: evidence from woody angiosperms. Pp. 137–138 in Prance, G. T.
(ed.). Biological diversification in the tropics. Columbia University Press, New York.PRANCE, G. T. 1986. Chrysobalanaceae. Flora of the Guianas, Series A, fascicle 2. Koeltz Scientific Books,
Koenigstein, Germany. 148 pp.PRANCE, G. T. 1987. Vegetation. Pp. 28–45 in Whitmore T. C. & Prance, G. T. (eds). Biogeography and
quaternary history in tropical America. Clarendon Press, Oxford.PRANCE, G. T. 1990. Floristic composition of the forests of central Amazonian Brazil. Pp. 112–140 in
Gentry, A. H. (ed.). Four neotropical rain forests. Yale University Press, New Haven.RAICH, J. W., RASTETTER, E. B., MELILLO, J. M., KICKLIGHTER, D. W., STEUDLER, P. A.,
PETERSON, B. J., GRACE, A. L., MOORE III, B. & VOROSMARTY, C. J. 1991. Potential netprimary productivity in South America: application of a global model. Ecological Applications 1:399–429.
RAMDASS, I., SINGH, J., TAMESSAR, M. & GOPAUL, D. 1997. National activity on the use of biodiversity,
Guyana. UNDP/Office of the President/University of Guyana, Georgetown, Guyana.RADAMBRASIL. 1968–1978. Levantamento de Recursos Naturais. Vols 1–18. Ministerio de Minas e Energia.
Departamento Nacional de Producao Mineral, Rio de Janeiro.RANKIN-DE MERONA, J. M., HUTCHINGS, R. W. & LOVEJOY, T. E. 1990. Tree mortality and
recruitment over a five-year period in undisturbed upland rain forest of the central Amazon. Pp.573–584 in Gentry, A. H. (ed.). Four neotropical rain forests. Yale University Press, New Haven.
RANKIN-DE MERONA, J. M., PRANCE, G. T., HUTCHINGS, R. W., DA SILVA, M. F., RODRIGUES,W. A. & UEHLING, M. E. 1992. Preliminary results of a large-scale tree inventory of upland rainforest in the Central Amazon Acta Amazonica 22:493–534.
RICHTER, D. D. & BABBAR, L. I. 1991. Soil diversity in the tropics. Advances in Ecological Research
21:315–389.RODRIGUES, W. A. 1963. Estudo de 2,6 hectareas de mata terra firme da Serra do Navio, Territorio
do Amapa. Boletim do Museu Paraense Emılio Goeldi Nova Serie 19.ROHDE, K. 1992. Latitudinal gradients in species diversity: the search for the primary cause. Oikos
65:514–527.ROLLET, B. 1993. Tree populations in natural rain forests. A case study: Brazilian Amazonia. Bois et
Forets des Tropiques 236:43–55.ROSALES-GODOY, J., PETTS, G. & SALO, J. 1999. Riparian flooded forests of the Orinoco and Amazon
basins: a comparative review. Biodiversity and Conservation 8:551–586.ROSENZWEIG, M. L. 1995. Species diversity in space and time. Cambridge University Press, Cambridge,
UK. 436.SABATIER, D. 1990. Diversite des arbres et du peuplement forestier en Guyane. Pp. 41–47 in Gestion
de l’ecosysteme forestier et amenagement de l’espace regional. SEPANGUI Cayenne. pp.

Tree diversity in Amazonia and the Guiana Shield 823
SABATIER, D. & PREVOST, M. F. 1987. Une foret a Cacaoyers sauvages sure le Haut-Camopi, en Guyane
Francaise. ORSTOM, Cayenne, France. 29 pp.SABATIER, D., GRIMALDI, M., PREVOST, M.-F., GUILLAUME, J., GODRON, M., DOSSO, M. &
CURMI, P. 1997. The influence of soil cover organization on the floristic and structural heterogeneityof a Guianan rain forest. Plant Ecology 131:81–108.
SALO, J., KALLIOLA, R., HAKKINEN, I., MAKINEN, Y., NIEMELA, P., PUHAKKA, M. & COLEY, P.D. 1986. River dynamics and the diversity of Amazon lowland rain forest. Nature 322:254–258.
SALOMAO, R. P. 1991. Uso de parceles permanentes para estudos da vegetacao da floresta tropicalumida. I. Municıpio de Maraba, Para. Boletim do Museu Paraense Emılio Goeldi. Serie Botanica 7:543–604.
SALOMAO, R. P. & LISBOA, P. L. 1988. Analise ecologica da vegetacao de uma floresta pluvial tropicalde terra firme, Rondonia. Boletim do Museu Paraense Emılio Goeldi. Serie Botanica 4:195–233.
SALOMAO, R. P., SILVA, M. F. F. & LISBOA, P. L. 1988. Inventario ecologico em floresta pluvialtropical de terra firme, Serra Norte, Carajas, Para. Boletim do Museu Paraense Emılio Goeldi Serie
Botanica 4:1–46.SCHULZ, J. P. 1960. Ecological studies on rain forest in northern Surinam. Van Eedenfonds, Amsterdam, The
Netherlands.SILVA, A. S. L., LISBOA, P. L. B. & MACIEL, U. N. 1992. Diversidade florıstica e estrutura em floresta
densa da bacia do Rio Jurua-Am. Boletim do Museu Paraense Emılio Goeldi Serie Botanica 8:203–253.SILVA, M. F. F. & ROSA, N. A. 1989. Analise do estrato arboreo da vegetacao sobre jazidas de cobre
na Serra do Carajas–PA. Boletim do Museu Paraense Emılio Goeldi. Serie Botanica 5:175–206.SILVA, M. F. F., ROSA, N. A. & OLIVEIRA, J. 1987. Estudos botanicos na area do projecto Ferro
Carajas. 5. Aspectos florısticos da mata do Rio Gelado, Para. Boletim do Museu Paraense Emılio Goeldi.
Serie Botanica 3:1–20.SILVA, M. F. F., ROSA, N. A. & SALOMAO, R. P. 1986. Estudos botanicos na area do projecto Ferro
Carajas. 3. Aspectos florısticos da mata do aeroporto de Serra Norte – PA. Boletim do Museu Paraense
Emılio Goeldi. Serie Botanica 2:169–187.SMITH, D. N. & KILLEEN, T. J. 1998. A comparison of the structure and composition of montane and
lowland tropical forest in the Serrania Pilon, Beni, Bolivia. Pp. 681–700 in Dallmeier, F. & Comiskey,J. A. (eds). Forest biodiversity in North, Central and South America, and the Caribbean. Research and monitoring.MAB Series Vol. 21. UNESCO, Paris.
SPICHIGER, R., LOIZEAU, P.-A., LATOUR, C. & BARRIERA, G. 1996. Tree species richness of aSouth-Western Amazonian forest (Jenaro Herrera, Peru, 73° 40’W/ 4° 54’S). Candollea 51:559–577.
STERGIOS, B., COMISKEY, J. A., DALLMEIER, F. & LICATA A NINO, M. 1998. Species diversity,spatial distribution and structural aspects of semi-deciduous lowland gallery forests in the westernLlanos of Venezuela. Pp. 449–479 in Dallmeier, F. & Comiskey, J. A. (eds). Forest biodiversity in North,
Central and South America, and the Caribbean. Research and monitoring. MAB Series Vol. 21. UNESCO,Paris.
STERN, M. J. 1998. Field comparisons of two rapid vegetation assessment techniques with permanentplot inventory data in Amazonian Peru. Pp. 269–283 in Dallmeier, F. & Comiskey, J. A. (eds). Forest
biodiversity research, monitoring and modelling. Conceptual background and Old World case studies. MAB SeriesVol. 20. UNESCO, Paris.
SUDAM. 1974. Levantamentos florestais realizados pela missao FAO na Amazonia. Belem, Vol 2.TAYLOR, L. R., KEMPTON, R. A. & WOIWOD, I. P. 1976. Diversity statistics and the log-series model.
Journal of Animal Ecology 45:255–272.TER STEEGE, H. 1998a. The use of forest inventory data for a National Protected Area Strategy in
Guyana. Biodiversity and Conservation 7:1457–1483.TER STEEGE, H. 1998b. Biomass estimates for forest in Guyana and their use in carbon offsets. Iwokrama
International Centre for Rain Forest Conservation and Development/UNDP, Georgetown, Guyana.50 pp.
TER STEEGE, H., JANSEN-JACOBS M. J. & DATADIN, V. (2000). Can botanical collections assist ina National Protected Area Strategy in Guyana? Biodiversity and Conservation 9:215–240.
TER STEEGE, H., JETTEN, V. G., POLAK, M. & WERGER, M. J. A. 1993. The tropical rain foresttypes and soils of a watershed in Guyana, South America. Journal of Vegetation Science 4:705–716.
TERBORGH, J. 1973. On the notion of favorableness in plant ecology. American Naturalist 107:481–501.TERBORGH, J. & ANDRESEN, E. 1998. The composition of Amazonian forests: patterns at local and
regional scale. Journal of Tropical Ecology 14:645–664.TOMLINSON, P. B. 1986. The botany of mangroves. Cambridge University Press, Cambridge, UK. 413 pp.TUOMISTO, H. & RUOKOLAINEN, K. 1997. The role of ecological knowledge in explaining
biogeography and biodiversity in Amazonia. Biodiversity and Conservation 6:347–357.TUOMISTO, H., RUOKOLAINEN, K., KALLIOLA, R., LINNA, A., DANJOY, W. & RODRIGUEZ, Z.
1995. Dissecting Amazonian biodiversity. Science 269:63–66.

H A N S T E R S T E E G E E T A L .824
UHL, C. & MURPHY, P. G. 1981. Composition, structure, and regeneration of terra firme forest in theAmazon basin of Venezuela. Tropical Biology 22:219–237.
URREGO GIRRALDO, L. E. 1997. Los bosques inundables del Medio Caqueta. Caracterizacion y sucesion
Estudios en la Amazonia Colombiana XIV. Tropenbos Colombia, Bogota.VALENCIA, R., BALSEV, H., PALACIOS, W., NEILL, D., JOSSE, C., TIRADO, M. & SKOV, F. 1998.
Diversity and family composition of trees in different regions of Ecuador: a sample of 18 one-hectareplots. Pp. 569–584 in Dallmeier, F. & Comiskey, J. A. (eds). Forest biodiversity in North, Central and
South America, and the Caribbean. Research and monitoring. MAB Series Vol. 21. UNESCO, Paris, France.VALENCIA, R., BALSLEV, H. & PAZ Y MINO, G. 1994. High tree alpha-diversity in Amazonian
Ecuador. Biodiversity and Conservation 3:21–28.VEGA, L. C. 1968. La estructura y composicion de los bosques humedos tropicales del Carare, Colombia.
Turrialba 18:416–436.VOSS, R. S. & EMMONS, L. H. 1996. Mammalian diversity in neotropical lowland rain forests: a
preliminary assessment. Bulletin of the American Museum of Natural History 230:1–115.WORBES, M., KLINGE, H., REVILLA, J. D. & MARTIUS, C. 1992. On the dynamics, floristic subdivision
and geographical distribution of varzea forests in Central Amazonia. Journal of Vegetation Science 3:553–564.
ZOBEL, M. 1997. The relative role of species pools in determining plant species richness: an alternativeexplanation of species coexistence? Trends in Ecology and Evolution 12:266–269.

Tree diversity in Amazonia and the Guiana Shield 825A
ppen
dix
1.Pl
ots
used
inth
ean
alys
es.
Site
sar
eor
dere
dby
coun
try.
Site
and
loca
tion
are
give
nin
the
first
colu
mn.
Np,
num
ber
ofpl
ots
used
for
alph
a-di
vers
ity
calc
ulat
ions
atth
esi
te;
alph
a,av
erag
eFi
sher
’sal
pha;
alph
am
ax,
max
imum
Fish
er’s
alph
afo
und
atth
esi
te;
Nf,
num
ber
ofpl
ots
used
inflo
rist
ican
alys
is(b
ecau
sem
ore
fore
stty
pes
can
bepr
esen
tat
one
site
and
som
etim
espl
ots
are
give
nge
nera
lco
ordi
nate
sbu
tar
eno
tcl
ose,
mor
eth
aton
epe
rsi
teis
poss
ible
).
Cou
ntry
/Sit
e/C
oord
inat
esN
pal
pha
alph
am
axN
fR
efer
ence
s
Bol
ivia
Alt
oIv
on,1
1°45
′S,6
6°02
′W1
30.2
30.2
1B
oom
(198
6)A
mbo
ro,1
7°45
′S,6
3°44
′W1
20.7
20.7
Var
gas
(199
5)in
Smit
h&
Kill
een
(199
8)R
ioB
eni,
14°3
8′S,
66°1
8′W
212
.914
.82
Dal
lmei
eret
al.
(199
6)an
din
Ter
borg
h&
And
rese
n(1
998)
Chi
man
es,1
5°00
′S,6
6°30
′W1
24.2
24.2
De
Aqu
ila(1
996)
inSm
ith
&K
illee
n(1
998)
El
Tig
re,1
0°59
′S,6
5°43
′W4
23.5
24.5
1B
ergm
ans
&V
room
ans
(199
5)N
oel
Kem
pff,
14°3
5′S,
60°5
0′W
226
.531
.1Sa
ldia
set
al.
(199
4)in
Smit
h&
Kill
een
(199
8)Pe
rsev
eren
cia,
14°3
3′S,
62°4
5′W
129
.429
.4V
arga
set
al.
(199
4)in
Smit
h&
Kill
een
(199
8)R
ioB
eni,
14°2
2′S,
67°3
3′W
245
.247
.7D
eW
alt
etal.
(199
9)R
ioM
aniq
ui,1
4°30
′S,6
6°50
′W1
13.0
13.0
Pala
cios
etal.
(199
1)in
Cer
on&
Mon
talv
o(1
997)
Serr
ania
Pilo
n,14
°55′
S,67
°05′
W1
62.2
62.2
Smit
h&
Kill
een
(199
8)St
.Cru
zde
laSi
erra
,17°
47′S
,63°
04′W
19.
19.
1Pa
z(1
991)
inSi
lva
etal.
(199
2)B
razi
lA
ltam
ira,
3°12
′S,5
2°45
′W2
78.2
121.
0D
anta
s&
Mul
ler
(197
9)in
Cam
pbel
let
al.
(198
6),D
anta
set
al.
(198
9)in
Fer-
reir
a&
Ran
kin-
deM
eron
a(1
998)
Ari
puan
a,10
°10′
S,59
°27′
W1
0.0
0.0
1A
yres
(198
1)in
Ter
borg
h&
And
rese
n(1
998)
BD
FFP,
3°08
′S,6
0°02
′W2
176.
917
6.9
2Fe
rrei
ra&
Ran
kin-
deM
eron
a(1
998)
,R
anki
n-de
Mer
ona
etal.
(199
0),
Ran
kin-
deM
eron
aet
al.
(199
2)B
elem
,1°3
0′S,
47°5
9′W
225
.133
.21
Bla
cket
al.
(195
0)B
reve
s,1°
40′N
,50°
09′W
176
.876
.8Pi
res
(196
6)in
Cam
pbel
let
al.
(198
6)C
amai
pa,0
°10′
N,5
1°37
′W1
68.4
68.4
1M
ori
etal.
(198
9)C
apit
aoPo
co,1
°44′
S,47
°09′
W1
49.8
49.8
Dan
tas
etal.
(198
0)in
Cam
pbel
let
al.
(198
6)C
araj
as,6
°00′
S,50
°30′
W5
51.0
54.6
3Sa
lom
aoet
al.
(198
8),
Silv
a&
Ros
a(1
989)
,Silv
aet
al.
inSi
lva
&R
osa
(198
9),
Silv
aet
al.
(198
6)C
asta
nhal
,1°2
0′S,
47°5
0′W
153
.353
.31
Pire
set
al.
(195
3)C
axiu
ana,
3°50
′S,5
1°30
′W4
88.2
107.
71
Alm
eida
etal.
(199
3)C
osta
doM
arre
cao,
3°25
′S,6
0°46
′W1
28.3
28.3
Wor
bes
etal.
(199
2)G
uam
a,1°
20′S
,48°
30′W
124
.624
.61
Pire
s&
Kou
ry(1
958)
Ilha
deM
arac
a,3°
20′N
,61°
20′W
330
.641
.4M
illik
en&
Rat
ter
(199
8),T
hom
pson
etal.
(199
2)Ja
pura
,2°0
0′S,
66°0
0′W
459
.888
.81
Ayr
es(1
991)
,Ayr
es(1
993)
Jaru
,9°1
9′S,
61°4
5′W
261
.662
.2A
bsy
etal.
(198
7)Ja
ru,9
°23′
S,61
°03′
W2
56.0
56.7
1A
bsy
etal.
(198
7)Ja
ru,9
°37′
S,61
°50′
W2
62.4
67.1
Abs
yet
al.
(198
7)Ja
uN
P,2°
00′S
,62°
30′W
747
.071
.0Fe
rrei
ra&
Pran
ce(1
998b
),Fe
rrei
ra(1
997)
Man
aus,
2°25
′S,5
9°44
′W3
193.
020
5.1
3O
livie
ra&
Mor
i(1
999)

H A N S T E R S T E E G E E T A L .826
App
endi
x1.
con
t.
Cou
ntry
/Sit
e/C
oord
inat
esN
pal
pha
alph
am
axN
fR
efer
ence
s
Man
aus-
Itac
oati
ara,
3°08
′S,6
0°00
′W1
123.
612
3.6
Pran
ce(1
990)
Mar
aba,
5°45
′S,4
9°02
′W6
40.1
43.3
1Sa
lom
ao(1
991)
Mar
anha
o,3°
10′S
,45°
06′W
147
.047
.01
Bal
ee(1
986)
Mar
e,1°
45′N
,61°
15′W
110
0.2
100.
21
Mill
iken
(199
8)M
ucam
bo,1
°27′
S,48
°27′
W1
53.0
53.0
Cai
net
al.
(195
6)M
unic
ipio
Una
,15°
00′S
,41°
00′W
185
.585
.51
Mor
iet
al.
(198
3))
Rio
Gel
ado,
6°00
′S,5
0°30
′W1
45.8
45.8
1Si
lva
etal.
(198
7)R
ioG
urup
i,2°
20′S
,46°
30′W
167
.367
.31
Bal
ee(1
987)
Rio
Juru
a,4°
40′S
,66°
10′W
110
8.0
108.
01
Silv
aet
al.
(199
2)R
ioJu
rua,
4°47
′S,6
6°15
′W1
99.2
99.2
1Si
lva
etal.
(199
2)R
ioJu
rua,
4°50
′S,6
6°22
′W1
126.
412
6.4
1Si
lva
etal.
(199
2)R
ioJu
rua,
4°57
′S,6
6°35
′W1
147.
514
7.5
1Si
lva
etal.
(199
2)R
ioJu
rua,
7°38
′S,7
2°40
′W1
40.1
40.1
1C
ampb
ell
etal.
(199
2)R
ioT
apaj
os,2
°31′
S,54
°58′
W3
6.4
8.6
1Fe
rrei
ra&
Pran
ce(1
998a
)R
ioU
rucu
,5°0
0′S,
65°0
0′W
216
5.6
221.
81
Am
aral
(199
6),P
eres
(199
4);P
eres
(199
1)in
Ter
borg
h&
And
rese
n(1
998)
Rio
Xin
gu,3
°29′
S,51
°40′
W4
53.0
75.8
1C
ampb
ell
etal.
(198
6)R
ioX
ingu
,4°4
5′S,
52°3
6′W
165
.665
.6B
alee
&C
ampb
ell
(199
0)R
ioX
ingu
,4°4
9′S,
52°3
1′W
172
.672
.6B
alee
&C
ampb
ell
(199
0)R
ondo
nia,
11°0
0′S,
61°5
7′W
182
.582
.51
Salo
mao
&L
isbo
a(1
988)
Ron
doni
a,11
°15′
S,62
°50′
W2
39.8
50.2
1L
isbo
a&
Lis
boa
(198
4)in
Mac
iel
&L
isbo
a(1
989)
,Mac
iel
&L
isbo
a(1
989)
Serr
ado
Nav
io,0
°55′
N,5
2°01
′W2
36.1
36.9
Rod
rigu
es(1
963)
Uba
tuba
,23°
27′S
,45°
04′W
10.
00.
01
Silv
a&
Filh
o(1
982)
inT
erbo
rgh
&A
ndre
sen
(199
8)V
ilhen
a,12
°15′
S,60
°15′
W1
44.0
44.0
Sant
osin
Salo
mao
etal.
(198
8)C
olom
bia
Ara
racu
ara,
0°34
′S,7
2°08
′W5
76.9
131.
75
Lon
dona
Veg
a(1
993)
,Urr
ego
(199
7)A
rara
cuar
a,1°
00′S
,71°
30′W
510
6.6
176.
64
Dui
venv
oord
en&
Lip
s(1
995)
Baj
oC
alim
a,3°
55′N
,77°
00′W
115
2.6
152.
6Fa
ber-
Lan
gend
oen
&G
entr
y(1
991)
Car
are,
6°35
′N,7
3°56
′W4
21.8
29.1
Veg
a(1
968)
El
Am
arga
l,5°
34′N
,77°
31′W
162
.162
.1G
alea
noet
al.
(199
8)L
aT
agua
,Sol
ano,
0°12
′N,7
4°39
′W1
34.3
34.3
1IG
AC
(199
3)C
osta
Ric
aL
aSe
lva,
10°2
6′N
,84°
00′W
339
.844
.51
Har
tsho
rn(1
983)
,Hea
ny&
Proc
tor
(199
0),P
hilli
pset
al.
(199
4)E
cuad
or0.
00.
0A
nang
u,0°
32′S
,76°
26′W
385
.211
4.0
1B
alsl
evet
al.
(198
7),(
1998
);K
orni
ng&
Bal
slev
(199
4)C
harc
oV
icen
te,0
°43′
S,78
°53′
W1
48.5
48.5
Pala
cios
etal.
(199
1)in
Cer
on&
Mon
talv
o(1
997)
Cuy
aben
oR
eser
ve,0
°00′
N,7
6°10
′W1
211.
021
1.0
1V
alen
cia
etal.1
994)
,(19
98)
Jatu
nSa
cha,
1°04
′S,7
7°36
′W3
117.
113
1.2
Nei
let
al.
inC
eron
&M
onta
lvo
(199
7),N
eil
etal.
inV
alen
cia
etal.
1994
)

Tree diversity in Amazonia and the Guiana Shield 827A
ppen
dix
1.co
nt.
Cou
ntry
/Sit
e/C
oord
inat
esN
pal
pha
alph
am
axN
fR
efer
ence
s
Rio
Shir
ipun
o,1°
01′S
,76°
58′W
110
4.6
104.
61
Cer
on&
Mon
talv
o(1
997)
San
Mig
uel
Cay
apas
,0°4
5′S,
78°5
6′W
139
.239
.2Pa
laci
oset
al.
(199
1)in
Cer
on&
Mon
talv
o(1
997)
Fren
chG
uian
aH
aut
Cam
opi,
2°43
′N,5
3°08
′W1
65.3
65.3
1D
.Sab
atie
r&
M.F
.Pre
vost
(unp
ubl.
data
)In
ini,
3°39
′N,5
3°49
′W2
85.0
86.2
1D
.Sab
atie
r&
M.F
.Pre
vost
(unp
ubl.
data
)N
oura
gues
,4°0
5′N
,52°
42′W
897
.012
2.0
2D
.Sab
atie
r&
M.F
.Pre
vost
(unp
ubl.
data
)Sa
ul,3
°38′
N,5
3°12
′W1
155.
515
5.5
1M
ori
&B
oom
(198
7)St
Lau
rent
,5°3
0′N
,54°
00′W
219
.119
.6G
azel
(198
3)St
.Elie
,5°1
8′N
,53°
03′W
1684
.710
9.8
2D
.Sab
atie
r&
M.F
.Pre
vost
(unp
ubl.
data
)G
uyan
aA
saka
ta,7
°45′
N,5
9°05
′W1
6.7
6.7
T.v
anA
ndel
(unp
ubl.
data
)B
aram
a,7°
44′N
,59°
52′W
20.
00.
02
EC
TF
(unp
ubl.
data
)Iw
okra
ma,
4°35
′N,5
8°43
′W4
19.9
23.5
3Jo
hnst
on&
Gill
man
(199
5)K
ako,
5°44
′N,6
0°37
′W1
3.6
3.6
Ram
dass
etal.
(199
7)K
aria
ko,7
°23′
N,5
9°43
′W1
7.1
7.1
T.v
anA
ndel
(unp
ubl.
data
)K
aria
ko,7
°25′
N,5
9°44
′W1
33.8
33.8
1T
.van
And
el(u
npub
l.da
ta)
Kw
akw
ani,
5°30
′N,5
8°00
′W2
23.4
29.3
1C
omis
key
etal.
(199
4)M
abur
aH
ill,5
°02′
N,5
8°48
′W1
18.7
18.7
R.T
hom
as(u
npub
l.da
ta)
Mab
ura
Hill
,5°1
3′N
,58°
35′W
1116
.523
.04
R.C
.E
k&
R.J
.Z
agt
(unp
ubl.
data
),R
.C.
Ek
(unp
ubl.
data
),R
.L
ilwah
&H
.te
rSt
eege
(unp
ubl.
data
),R
.T
hom
as(u
npub
l.da
ta),
J.va
nE
ssen
(unp
ubl.
data
).M
abur
aH
ill,5
°13′
N,5
8°43
′W1
11.9
11.9
1R
.C.E
k,(u
npub
l.da
ta)
Mor
abal
li,6°
11′N
,58°
33′W
622
.428
.95
Dav
is&
Ric
hard
s(1
934)
,Ram
dass
etal.
(199
7)M
oruc
a,7°
36′N
,58°
57′W
133
.133
.11
T.v
anA
ndel
,(un
publ
.dat
a)M
oruc
a,7°
41′N
,58°
55′W
18.
28.
2T
.van
And
el,(
unpu
bl.d
ata)
St.C
uthb
erts
,6°2
2′N
,58°
05′W
122
.022
.0R
amda
sset
al.(
1997
)M
exic
oL
osT
uxtl
as,1
8°35
′N,9
5°07
′W1
35.1
35.1
Bon
gers
etal.
(198
8)Pa
nam
aB
arro
Col
orad
oIs
land
,9°0
9′N
,79°
51′W
236
.036
.01
Con
dit
etal.
(199
8)Pe
ruA
guaj
al,1
1°52
′S,7
1°21
′W1
47.9
47.9
Pitm
anet
al.
(199
9)B
arra
nco,
11°4
8′S,
71°2
8′W
110
9.7
109.
7Pi
tman
etal.
(199
9)B
arra
nco,
11°5
3′S,
71°2
3′W
174
.274
.2Pi
tman
etal.
(199
9)C
abez
ade
Mon
o,10
°20′
S,75
°18′
W1
87.0
87.0
1G
entr
y(1
988a
),T
erbo
rgh
&A
ndre
sen
(199
8)C
uz.A
maz
.,12
°35′
S,69
°07′
W2
0.0
0.0
2N
unez
&Ph
illip
sin
Ter
borg
h&
And
rese
n(1
998)
Jena
roH
erre
ra,4
°54′
S,73
°40′
W1
159.
015
9.0
1Sp
ichi
ger
(199
6)

H A N S T E R S T E E G E E T A L .828
App
endi
x1.
con
t.
Cou
ntry
/Sit
e/C
oord
inat
esN
pal
pha
alph
am
axN
fR
efer
ence
s
Mai
zal,
11°4
8′S,
71°2
8′W
110
9.7
109.
7Pi
tman
etal.
(199
9)M
anu,
11°4
5′S,
71°3
0′W
1363
.712
2.6
11D
allm
eije
ret
al.
(199
6)an
din
Ter
borg
h&
And
rese
n(1
998)
;G
entr
y(1
988a
),G
entr
y&
Ter
borg
h(1
990)
,Phi
llips
etal.
(199
4),T
erbo
rgh
&A
ndre
sen
(199
8),
Pitm
anet
al.
(199
9)M
anu,
12°0
3′S,
71°1
0′W
140
.840
.8Pi
tman
etal.
(199
9.M
isha
na,3
°47′
S,73
°30′
W1
142.
214
2.2
1G
entr
y(1
988a
);Ph
illip
set
al.
(199
3);G
entr
yin
Ter
borg
h&
And
rese
n(1
998)
Ren
acal
,11°
52′S
,71°
21′W
130
.330
.3Pi
tman
etal.
(199
9)T
ambo
pata
,12°
49′S
,69°
43′W
862
.987
.32
Phill
ips
etal.
(199
4),S
tern
(199
8)Y
anam
omo,
3°16
′S,7
2°54
′W1
221.
122
1.1
1G
entr
y(1
988a
),Ph
illip
set
al.
(199
4);G
entr
yin
Ter
borg
h&
And
rese
n(1
998)
Suri
nam
eB
lanc
heM
arie
Falls
,4°4
5′N
,56°
51′W
139
.439
.41
Maa
s(1
971)
Kam
isa
Falls
,5°0
6′N
,56°
20′W
141
.241
.21
Maa
s(1
971)
Map
ane,
5°26
′N,5
4°40
′W1
36.5
36.5
Schu
lz(1
960)
Pari
sJa
cob
Cre
ek,4
°54′
N,5
6°57
′W2
43.4
46.9
Maa
s(1
971)
Snak
eC
reek
,5°1
4′N
,56°
48′W
154
.654
.61
Maa
s(1
971)
Ton
ka,5
°15′
N,5
5°42
′W1
48.8
48.8
Jonk
ers
(198
7)W
inan
aC
reek
,5°1
5′N
,57°
04′W
231
.335
.5M
aas
(197
1)V
enez
uela
Cer
roN
eblin
a,0°
50′N
,66°
11′W
139
.139
.1G
entr
y(1
988a
),G
entr
y&
Ter
borg
h(1
990)
El
Bue
y,8°
14′N
,62°
11′W
1324
.330
.52
H.G
.Cas
tella
nos
(unp
ubl.
data
)Q
.Del
gadi
to,8
°49′
N,6
9°30
′W1
11.5
11.5
Ster
gios
etal.
(199
8)Q
.Igu
ez,8
°51′
N,6
9°12
′W1
13.4
13.4
Ster
gios
etal.
(199
8)R
ioC
aura
,4°0
9′N
,63°
44′W
118
.218
.2M
arin
&C
havi
el(1
996)
Rio
Cau
ra,4
°58′
N,6
4°47
′W1
30.0
30.0
Mar
in&
Cha
viel
(199
6)R
ioC
aura
,5°3
0′N
,64°
00′W
125
.325
.3M
arin
&C
havi
el(1
996)
Rio
Cau
ra,6
°18′
N,6
4°29
′W1
20.7
20.7
Mar
in&
Cha
viel
(199
6)R
ioC
aura
,6°2
1′N
,64°
59′W
531
.735
.72
Cas
tella
nos
(199
8);H
.G.C
aste
llano
s(u
npub
l.da
ta)
Rio
Port
ugue
sa,9
°04′
N,6
9°37
′W1
11.5
11.5
Ster
gios
etal.
(199
8)Sa
imad
odyi
,9°3
7′N
,72°
54′W
231
.231
.41
Liz
arra
lde
(199
7)Sa
nC
arlo
s,1°
56′N
,67°
03′W
123
.923
.9U
hl&
Mur
phy
(198
1)Sa
nPe
dro,
6°30
′N,6
2°23
′W1
8.6
8.6
1Fi
nol
Urd
anet
a(u
ndat
ed)
Copyright © 2022 FDOKUMEN


![[Human and wild mammal parasitosis in French Guiana]](https://static.fdokumen.com/doc/165x107/633660bb02a8c1a4ec022a28/human-and-wild-mammal-parasitosis-in-french-guiana.jpg)