an analysis of the effect of electronic filing - Georgetown ...
56
AN ANALYSIS OF THE EFFECT OF ELECTRONIC FILING ON INDIVIDUAL INCOME TAX COMPLIANCE A Thesis submitted to the Graduate School of Arts and Sciences at Georgetown University in partial fulfillment of the requirements for the degree of Master of Public Policy in the Georgetown Public Policy Institute By Tamami Matsuka, B.A. Washington, D.C. April 18, 2006
-
Upload
khangminh22 -
Category
Documents
-
view
0 -
download
0
Transcript of an analysis of the effect of electronic filing - Georgetown ...

AN ANALYSIS OF THE EFFECT OF ELECTRONIC FILING ON INDIVIDUAL INCOME TAX COMPLIANCE
A Thesis submitted to the Graduate School of Arts and Sciences
at Georgetown University in partial fulfillment of the requirements for the
degree of Master of Public Policy
in the Georgetown Public Policy Institute
By
Tamami Matsuka, B.A.
Washington, D.C. April 18, 2006
ii
AN ANALYSIS OF THE EFFECT OF ELECTRONIC FILING ON INDIVIDUAL INCOME TAX COMPLIANCE
Tamami Matsuka, B.A.
Thesis Advisor: Janet McCubbin, Ph.D.
ABSTRACT
Noncompliance has a negative influence on both tax equity and tax efficiency. In
analyzing tax compliance, it is important to study not only measures such as audits
and penalties which address noncompliance directly, but also measures that are not
primarily intended to improve compliance. This paper examines the effects of
electronic filing, using paid tax return preparation and self-preparation, on individual
income tax compliance, using panel data over six years aggregated at state level. The
results suggest that the Internal Revenue Service (IRS) should encourage taxpayers
who file their tax returns by themselves to use electronic filing. The IRS should be
encouraged to further examine the effect of electronic filing on compliance more
deeply and extensively by using individual taxpayer level data and more years of
data. It would result in more effective policy evaluation, leading to the improvement
of compliance.

iii
ACKNOWLEDGMENTS
I am deeply grateful to my advisor, Dr. Janet McCubbin, for her wise guidance and essential input on this paper. Regardless of my endless questions, she always encouraged and improved my study with crucially important comments. I also would like to thank Dr. Jeffrey Mayer for reviewing my paper, and all those in the Georgetown Public Policy Institute who supported me along the way. Last, but far from least, I would like to thank my parents who have made everything possible for me.
Tamami Matsuka April 2006
iv
TABLE OF CONTENTS
Chapter 1. Introduction........................................................................................1 1.1 Motivation....................................................................................1 1.2 Research Question .......................................................................2
Chapter 2. Literature Review ..............................................................................4 2.1 Compliance Studies .....................................................................4 2.2 Tax Preparation Modes................................................................7
Chapter 3. Model...............................................................................................12 3.1 Theoretical Model......................................................................12
3.1.1 Measures of Income Reporting Compliance ....................13 3.1.2 Determinants of Income Reporting Compliance ..............15
3.2 Statistical Model ........................................................................24 3.2.1 Endogeneity of Preparation and Filing Modes .................25 3.2.2 First-stage Equation ..........................................................27 3.2.3 Income Reporting Equation (Second-stage Equation) .....29
3.3 Hypotheses.................................................................................30 Chapter 4. Summary Statistics ..........................................................................32 Chapter 5. Regression Results...........................................................................38 Chapter 6. Conclusion .......................................................................................47 References .........................................................................................................48
v
LISTS OF TABLES AND FIGURES TABLES
Table 1: Data from e-file demographics, Tax Year 2003 ..............................18 Table 2: Data from the IRS Data Book, Fiscal Year 2004 ............................18 Table 3: Data from e-file demographics Tax Year 2003 & the IRS Data Book
Fiscal Year 2004 with three assumptions ........................................21 Table 4: Preparation and Filing Modes (Fiscal Year 2004 and Tax Year
2003) ...............................................................................................21 Table 5: Relevance Test and Endogeneity Test .............................................29 Table 6: Descriptive Statistics .......................................................................34 Table 7: Estimates of Income Reporting Compliance ...................................46
FIGURES
Figure 1: Percentage of Total Returns Filed Electronically by Either Paid-
Preparers or Self-Preparers by Year ................................................35 Figure 2: Percentage of Total Returns Filed Electronically by Paid-Preparers
by Year.............................................................................................35 Figure 3: Percentage of Total Returns Filed Electronically by Self-Preparers
by Year.............................................................................................35 Figure 4: Percentage of Total Returns Filed Electronically by Either Paid-
or Self-Preparers Using Instrumental Variables (IVs) in the OLS model by Year ..................................................................................36
Figure 5: Percentage of Total Returns Filed Electronically by Paid-Preparers Using IVs in the OLS model by Year..............................................36
Figure 6: Percentage of Total Returns Filed Electronically by Self-Preparers Using IVs in the OLS model by Year..............................................36
vi
Figure 7: Percentage of Total Returns Filed Electronically by Either Paid- or Self-Preparers Using IVs in the Fixed Effects (FE) model by
Year ..................................................................................................37 Figure 8: Percentage of Total Returns Filed Electronically by Paid-Preparers
Using IVs in the FE model by Year.................................................37 Figure 9: Percentage of Total Returns Filed Electronically by Self-Preparers
Using IVs in the FE model by Year.................................................37
1
Chapter 1. Introduction
Past research on the determinants of tax compliance focuses on a range of factors –
e.g., audits, penalties, and tax code complexity. However, probably because electronic filing
is relatively a new Internal Revenue Service (IRS) policy, there are few, if any, studies
focusing on the effect of electronic filing. The IRS has recently emphasized electronic filing
as well as the improvement of tax compliance. Therefore, an analysis of how and to what
extent electronic filing affects individual income tax compliance would be useful.
1.1 Motivation
Electronic filing is beneficial for the IRS, because it helps to improve taxpayer service
and make tax administration more effective. The IRS Strategic Plan, 2005-2009 explains that
offering electronic filing to simplify the tax process would enhance the improvement of
taxpayer service. It would also make the handling of tax returns more efficient, since mistakes
on tax returns filed electronically are likely to be fewer than on paper returns. In addition,
taxpayers receive several benefits from electronic filing: (1) an immediate confirmation that
the tax return was accepted by the IRS; (2) a much quicker refund due to the more efficient
process in the IRS, relative to handling of paper, and fewer mistakes; (3) a much lower error
2
rate than on paper returns, and thus reduced risk of audits and penalties; and (4) a greater
chance of discovering previously unknown opportunities for tax saving.1
At the same time, the improvement of individual income tax compliance is one of the
biggest challenges for the IRS. Many researchers inside and outside the IRS have analyzed
what kind of factors affect tax compliance, e.g., audit and penalty rates, the use of tax
practitioners, and tax code complexity. These studies are basically about the factors which
relate directly to compliance. However, policies that are not primarily intended to improve tax
compliance are also worth studying, because even policies not directly related to compliance
also might have some effect on it. Electronic filing is a good example of such a policy.
1.2 Research Question
Is electronic filing a useful tool to improve tax compliance? Or, is there a possibility
that efforts to promote electronic filing actually reduce compliance? The benefits taxpayers
get from electronic filing might work in a negative way in terms of individual income tax
compliance. Of the benefits for taxpayers from electronic filing stated above, both (3) the
reduced risk of audits and penalties and (4) the increase of the chance for tax saving might
have a negative influence on tax compliance. Erard (1993) concludes that the use of CPAs
and lawyers to prepare tax returns, which is also intended to reduce the risk of audits and
1 Kopczuk. W. and C.Pop-Eleches (2005), p.6.

3
penalties and increase the chances of realizing opportunities for tax saving, is associated with
increased noncompliance.
This study analyzes the effect of electronic filing on income reporting compliance. It
will explain whether electronic filing has any effect on compliance, as well as whether the
effect of electronic filing is same for self-preparation and paid preparation. I suspect that once
a taxpayer uses a paid tax practitioner, the distinction between paper and electronic filing is
irrelevant. An analysis of the influence of electronic filing on individual income tax
compliance would be useful for evaluating the IRS’s policy to encourage taxpayers to e-file.
This study uses data aggregated at state-level2 due to a lack of public access to
individual micro data. This paper is organized as follows. I review literature that examines
compliance and tax preparation modes in Chapter 2. In Chapter 3, a theoretical model of
income reporting compliance is developed, followed by a statistical model. After showing
summary statistics in Chapter 4, I discuss regression results in Chapter 5. In Chapter 6, I offer
concluding remarks.
2 The data of District of Columbia and Maryland is combined for all variables through six years, since the electronic filing data in the IRS
Data Book 1999 does not differentiate the two states.

4
Chapter 2. Literature Review
2.1 Compliance Studies
One of the primary theoretical papers on tax compliance, Allingham and Sandmo
(1972), analyzes individual income tax evasion. Many other studies are extensions or
refinements of this work. In their study, Allingham and Sandmo consider noncompliance as a
rational individual decision based on probabilities of detection and levels of penalty imposed;
taxpayers decide how much of their income to declare under the uncertain prospect of
detection and punishment. The authors’ model predicts that an increase in the probabilities of
audit or penalty improves tax compliance, but that the effect of the tax rate is ambiguous
because of a positive income effect and a negative substitution effect. The substitution effect
is negative, since an increase in the tax rate makes taxpayers underreport income on the
margin. On the other hand, the income effect is likely positive, since an increase in the tax
rate makes taxpayers less wealthy, and with an assumption that absolute risk aversion
decreases with income, taxpayers are less likely to underreport their income.
Dubin and Wilde (1988) estimate an OLS equation by audit class and instrumental
variables, using the 1969 IRS cross-sectional data set, including variables for seven audit
classes aggregated to the three-digit zip code level. They find that audits have a significant
deterrent effect on noncompliance. Moreover, they find that an increase in self-employment
5
rate or unemployment discourages compliance. Dubin, Graetz and Wilde (1990) used panel
data aggregated at the state level to estimate the effect of federal audit rates on reported taxes
per return and returns filed per capita. They also find a very large and significant deterrent
effect of audits.
However, in the United States, the percentage of individual income tax returns audited
is very small; only 0.77 % of individual returns were audited in Fiscal Year 2004.3
Considering that individual income tax compliance is relatively high in spite of the low audit
rate, although audits might have some effect on compliance, the effect might be small and
other factors than audit rates are likely to have larger effects on compliance. Alm, McClelland
and Schulze (1992) suggest that there might be a gap between the models in the above studies
and the way people actually decide to be compliant. They find that individual taxpayers
actually pay much more tax compared to what would be anticipated based on expected utility
theory.
Alm, McClelland and Schulze (1992) conducted six experiments in the Laboratory for
Economics and Psychology at the University of Colorado, with volunteers drawn from
undergraduate classes. These experiments, unlike the measures of tax evasion in other
empirical work, provide accurate and unambiguous measures of individual noncompliance,
although they examine the individual taxpayers’ response to tax, penalty, and audit rate
3 Combined District Plus Compliance (Service) Center Audits, IRS Audit Rates by Individual Audit Class: Nonbusiness and Business
Returns, Graphical Highlights, TRAC, Syracuse University. Also, using information from Table 10: Examination Coverage in the IRS Data
Book 2004, the percentage of returns examined can be calculated as well: 1,007,874 / 130,134,277 = 0.00774.
6
changes only in a controlled environment.4 Their study suggests that tax compliance partly
comes from taxpayers’ over-sensitiveness to or over-weighting of the low probability of audit
and also from taxpayers’ value on public goods financed by their tax payment. Conducting the
similar laboratory experiments, Alm, Jackson and Mckee (1992) conclude that taxpayers are
likely to report more income with greater audit and penalty rates, but not much.
Beron, Tauchen and Witte (1992) find relatively weak deterrent effects from audits by
estimating reported Adjusted Gross Income (AGI) and tax liability equations, using 1969 tax
return data, audit data from the IRS’s Project 778 data base and data from the IRS Statistics of
Income files on reported AGI, total tax liability, and on the number of returns filed. Most data
is aggregated at the 3-digit zip code level to match the audits data. In addition, their study
suggests that unemployment has a very weak effect on compliance, and that the finding by
Dubin and Wilde (1988) that an increase in unemployment rate is associated with a decrease
in compliance may reflect tax auditors’ ability to uncover overstated deductions.
These previous tax compliance studies have produced different results in terms of the
effect of audits and punishment on individual income tax compliance. Thus, they may propose
different measures to increase compliance. Dubin and Wilde (1988) and Dubin, Graetz and
Wilde (1990) seem to support an increase in tax rates and an effective application of penalties
in order to improve tax compliance; on the other hand, the research by Alm, McClelland and
Schulze (1992), Alm, Jackson and Mckee (1992) and Beron, Tauchen and Witte (1992) seems
4 Alm, Jackson and Mckee (1992), p.107.
7
to suggest other approaches. Thus, although with these studies the IRS does not have a clear
answer about whether or not it should strengthen enforcement policies, there is a consensus
that audits and punishment, which are major direct IRS compliance-related policies, have at
least some effect on compliance.
On the other hand, policies that are not primarily intended to promote compliance, also
might have some effect on compliance. Plumley (1996), using panel data aggregated at state-
level over ten years, and including a rich set of potential determinants of individual income
tax compliance in one filing compliance equation and three reporting compliance equations,
estimated that the IRS Taxpayer Service activities have a positive effect on filing compliance,
but not on reporting compliance. The IRS Taxpayer Service activities, which are included as
explanatory variables in Plumley’s model, are policies to primarily improve taxpayer service
and not specifically designed to have a direct effect on individual income tax compliance.
2.2 Tax Preparation Modes
With an increase in tax complexity, individual taxpayers tend to use a tax practitioner
in tax preparation. In studying individual income tax compliance, an analysis of the effect of
the use of a tax practitioner is important, since a tax practitioner’s knowledge is likely to
influence the level of client’s compliance. At least four studies, which estimate the choice
model of tax practitioners, are worth noting. Klepper, Mazur and Nagin (1991) examine the
8
factors which influence a taxpayer’s decision to hire a tax practitioner and the influence of a
practitioner on a taxpayer’s compliance. They use data from the 1982 Taxpayer Compliance
Measurement Program (TCMP) which includes the results of line-by-line audits of
approximately 50,000 individual income tax returns drawn from a random sample of
population. Due to the restriction on access to the individual level data, they use tabulations
stratifying individual taxpayers by two criteria: whether taxpayers hired a paid-preparer, and
eleven IRS-defined audit classes. They find that tax practitioners play different roles
depending on the ambiguity of the tax law. Tax practitioners are likely to promote compliance
on unambiguously defined line items but to promote noncompliance on more ambiguously
defined items. In addition, their findings suggest that the magnitude of the influence by a tax
practitioner as an ambiguity-exploiter will be directly associated with the quality of an
evasion opportunity.
Dubin, Graetz and Wilde (1992), Erard (1993), and Dubin and Udell (2001) provide
strong support for allowing for different types of tax practitioners in analyzing the tax
preparation modes. Dubin, Graetz and Wilde (1992) estimate a two-stage nested multinomial
logit model and analyze taxpayer choices of tax preparation modes (i.e., two types of non-paid
preparers, six types of paid third parties, and self-preparation) by aggregating the 1979 TCMP
to the IRS district level. They find significant differences between the effect of explanatory
9
variables on paid-preparers and practitioners.5 In addition, their results suggest differences
among practitioners in the effect of audit rates and the frequency of penalties on the demand
for tax assistance: while the effect of audit rates is limited to Certified Public Accountants
(CPAs), the effect of the frequency of penalties applies to all practitioners.
Erard (1993) uses micro-level data from the 1979 TCMP data files. He estimates a
trinary choice model of tax preparation mode by classifying tax practitioners into two groups:
a CPA or lawyer, and a non-CPA or non-lawyer including unpaid tax assistance. His findings
are largely consistent with the results of the previous studies. Taxpayers, who have many
and/or relatively complex tax forms to complete, are older, are married, and face higher tax
rates, are likely to use tax practitioners. More importantly, he finds that the use of tax
practitioners, especially CPAs and lawyers, is likely to increase noncompliance.
Noncompliance on returns prepared by CPAs and lawyers is more than four times larger than
it would have been if taxpayers had prepared their returns by themselves; and, noncompliance
on returns prepared by other tax practitioners is only about 15 percent larger.
In addition, he estimates an endogenous switching model of noncompliance that
jointly accounts for the choice of tax preparation mode and the level of noncompliance in
order to control for the role of self-selection in compliance. He raises the possibility that
unobserved factors that affect the decision to hire a tax practitioner are associated with
unobserved factors that affect noncompliance; e.g., taxpayers may seek assistance to reduce
5 In their study, practitioners are CPAs, attorneys, and public accountants, most of whom are licensed to represent taxpayers before the IRS.
Paid-preparers are national tax services, local tax services, and other paid-preparers.

10
tax liabilities and/or to reduce the time and anxiety costs of return preparation. In order to
control for the joint influence of unobserved factors on the preparation mode and compliance
choices, he uses a latent variable for the propensity of a taxpayer to be noncompliant, given
that s/he uses one of the preparation modes: a tax specialist, a non-specialist, and self-
preparation. As a result, he finds that taxpayer self-selection is likely to have a positive effect
on the observed level of noncompliance for each tax preparation mode. In other words, self-
selection matters in estimating the effect of preparation modes on compliance.
Dubin and Udell (2001) analyze how the type of return preparation mode affects tax
evasion, using 1979 TCMP data aggregated by IRS district and return type. They estimate a
four alternative switching regression model, and treat the amount of tax evasion found in each
alternative as endogenous and dependent on the choice of return preparation mode. They
specify four preparation modes: non-paid assistance, paid assistance except tax practitioners,
tax practitioners, and self-prepared. They find that the use of a tax practitioner lowers the
amount of noncompliance, while the use of non-paid assistance or paid assistance has no
effect on tax evasion. They also find that complexity does not increase the amount evaded if
practitioners preparer the returns, and that increased complexity may increase compliance
with the tax code if it results in an increase in the use of tax practitioners.
Their study also controls for the endogeneity of the mode of tax return preparation.
They argue that unobservable factors of the taxpayer’s behavior could simultaneously
increase the probability of selecting a tax practitioner and decrease noncompliance. In order to
11
deal with the selection bias, they estimate a model for each mode of return preparation using a
selectivity correction parameter under a set of assumptions for a discrete/continuous model
with logistic choice probabilities. They find that the coefficient of the correction parameter is
significant and positive for the preparation mode of practitioners, implying a negative
correlation between the unobservable characteristics affecting the choice of tax practitioner
mode and the amount of noncompliance found on the return. This result supports their
hypothesis that practitioners reduce noncompliance.

12
Chapter 3. Model
3.1 Theoretical Model
Most theoretical and empirical models of tax compliance focus on income
underreporting and would typically make no distinction between the decision of whether to
file a return and the decision of how much income to report. In my study, since electronic
filing plays a different role in the filing decision from the role it might play in the reporting
decision, distinguishing between filing and reporting may be useful. First, the influence of
electronic filing on filing compliance is expected to be positive. This is because electronic
filing is a voluntary system designed to make the tax return filing process simpler and helps
taxpayers complete tax process return more quickly.
The sign of the influence of electronic filing on reporting compliance is unclear. On
one hand, technology helps taxpayers avoid mistakes; taxpayers who e-file might be likely to
have fewer errors in reporting their income than taxpayers who file paper returns. In other
words, electronic filing would be associated with higher level of reporting compliance. At the
same time, electronic filing might encourage taxpayers to be noncompliant. Since electronic
filers might have lower probabilities of being audited and getting penalties due to the fewer
errors, those who believe that they have the reduced risk of audit and penalties might be likely
to report less income or more deduction than they would otherwise.
13
In addition, taxpayers who electronically file their tax returns by themselves,
especially those who use tax software, might have the increased chance to discover
opportunities for tax saving that they didn’t know of when they filed paper returns. As a
result, electronic filing might encourage them to underreport their income or overstate their
deduction. Thus, the effect of electronic filing on income reporting compliance could be both
positive and negative.
Non-filing and income reporting conditional on filing can be analyzed separately.
However, I do not have data on non-filers or on income reporting conditional on filing.
Therefore, this paper analyzes how electronic filing might affect unconditional income
reporting compliance; that is, non-filing and underreporting conditional on filing combined.
3.1.1 Measures of Income Reporting Compliance
In order to measure income reporting compliance, I will estimate the income reporting
rate, which is the percentage of reported Adjusted Gross Income (AGI) (i.e., the amount of
income before computing deduction), divided by Personal Income. AGI is determined by
subtracting the certain adjustment items from total income. Total income includes: salaries
and wages; taxable interest; dividends; taxable refunds, credits, or offsets of state and local
income taxes; alimony received; business net income; net capital gain; taxable individual
retirement arrangements (IRA); pensions and annuities; income from rental real estate,
14
royalties, partnerships, S corporations, and trusts; net farm income; unemployment
compensation; social security benefits; and other income (such as prizes and gambling
winnings). For Tax Year 2003, adjustments include: contributions to IRAs, student loan
interest, moving expenses, one-half of self-employment tax, self-employed health insurance
payments, self-employment retirement plans, penalty on early withdrawal of savings, alimony
paid, educator expenses, tuition and fees, and contributions to medical savings accounts. I use
the reported AGI aggregated by state from individual tax statistics from the IRS Statistics of
Income (SOI) database.6
Compared to AGI, Personal Income, used as the denominator, is a more
comprehensive income measure.7 It is the income received by all persons from all sources,8
estimated by Bureau of Economic Analysis (BEA),9 Department of Commerce. While BEA’s
estimate of Personal Income extensively uses tax return information,10 Personal Income,
unlike AGI, includes several significant items, for example: tax-exempt income such as tax-
exempt interest and nontaxable transfer payments; and misreporting adjustments which
estimate underreported income and non-filers’ income.11 Therefore, although it is not exactly
6 Retrieved October 8, 2005 from http://www.irs.gov/taxstats/indtaxstats/article/0,,id=103106,00.html.
7 Ledbetter (2005), p.30.
8 It is calculated as the sum of wage and salary disbursements, supplements to wages and salaries, proprietors' income with inventory
valuation and capital consumption adjustments, rental income of persons with capital consumption adjustment, personal dividend income,
personal interest income, and personal current transfer receipts, less contributions for government social insurance. BEA.
9 Regional Economic Accounts, BEA. Retrieved October 8, 2005 from http://www.bea.gov/bea/regional/statelocal.htm.
10 Parker (1984).
11 Ledbetter (2005), pp.30-31.
15
the true individual income to be reported on tax returns, it may be the most useful estimation
of individual income at state-level.
I assume that changes in the income reporting rate over time are attributable to
changes in compliance. Changes in tax laws could influence the estimates of AGI and thus the
income reporting rate. In fact, there have been some minor changes in definitions of AGI;
educator expenses as well as a tuition and fees deduction were newly included as adjustments
(i.e., subtracting them from total income) in Tax Year 2002. However, there are no ways to
adjust for these changes in this paper, because SOI tabulations by state do not include details
on the amount of all items.
3.1.2 Determinants of Income Reporting Compliance
I classified explanatory variables into four groups: preparation and filing modes, tax
policy, economics, and demographics. An explanation and a discussion of the sign of each
variable follow.
Preparation and Filing Modes:
Unlike Erard (1993), Dubin, Graetz and Wilde (1992), and Dubin and Udell (2001),
this study does not distinguish between different types of tax practitioners, due to a lack of
access to data. However, the state-level data allow me to estimate the effect of electronic

16
versus paper filing on compliance and to examine how self-preparation and paid preparation
affect the results, with some assumptions. In this paper, “self-prepare” is considered as a
single preparation mode. Since I do not have the data and also for simplicity, I do not
distinguish between taxpayers who use software and those who do not. Preparation assistance
other than paid-preparers (e.g., volunteers) is included in “self-prepare.” Thus, “paid-prepare”
is considered as the only other preparation mode. In addition, this paper considers two options
for taxpayers to file their tax returns: e-file or paper. Therefore, the combined preparation and
filing modes are four: self-preparation through e-file, paid preparation through e-file, paid
preparation through paper, and self-preparation through paper. These modes are expressed as
variables of eself, epaid, ppaid, and pself, respectively. This specification allows me to
compare the effect on individual income tax compliance of electronic versus paper filing, and
examine how paid preparation and self-preparation affect the results.
The four variables are measured by the number of returns for each preparation and
filing mode divided by the total number of returns filed. The first three preparation and filing
modes are used in the model. Thus, the effects of eself, epaid, and ppaid on compliance are
compared to the one of pself. Assuming electronic filing helps improve compliance, self-
preparation through e-file is expected to be positively associated with compliance, relative to
self-preparation through paper. Moreover, based on most prior research, paid preparation
through paper is expected to negatively relate to compliance, relative to self-preparation
17
through paper. The sign of epaid, paid preparation through e-file, is ambiguous; it depends on
whether the effect of electronic filing on compliance is larger than that of paid-preparers.
No publicly available dataset includes complete information on preparation and filing
modes. Therefore, two datasets are combined: e-file demographics (Tax Years 1998 – 2003)12
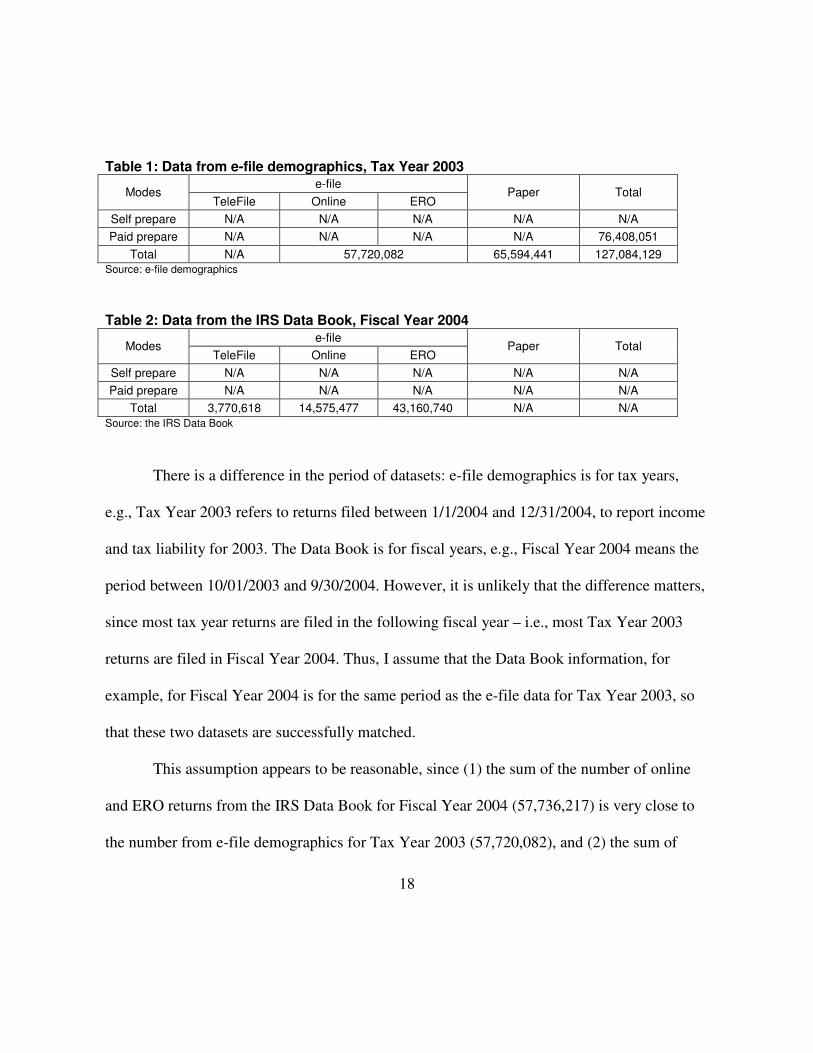
and IRS Data Book (Fiscal Years 1999 – 2004).13 As seen in Table 1, which shows the U.S.
total for Tax Year 2003, e-file demographics contains the number of returns completed by
paid-preparers and the number of returns filed either electronically or on paper for each state
for each tax year. In other words, paid-prepared returns include paper and e-file returns, and
both paper and e-file returns include returns completed by self-preparers and paid-preparers.
Note that in this dataset “e-file” means online14 and electronic return originator (ERO).15
TeleFile16 is not included in e-file returns but in the total returns. The IRS Data Book includes
the number of returns through TeleFile, online, and ERO for each state for each fiscal year.
Table 2 includes the U.S. total number of electronic returns by each electronic filing mode for
Fiscal Year 2004.
12 Retrieved October 25, 2005 from http://www.irs.gov/taxpros/providers/article/0,,id=141177,00.html. Tax Year 1998 and1999 data were
provided to the author by IRS.
13 Retrieved October 25, 2005 from http://www.irs.ustreas.gov/taxstats/article/0,,id=102174,00.html.
14 Online is an IRS e-file option that allows taxpayers to prepare and file tax return(s) using a personal computer. Online returns can be filed
through one of two processes: (1) users go to a Web site and fill out the return on that Web site without ever having downloaded any
software; and (2) users purchase a software package, load it to their own machines, prepare their returns, and transmit them to the IRS
through an online filing company. IRS (2004b).
15 An ERO is an Authorized IRS e-file Provider who originates (starts) the electronic submission of income tax returns to the IRS. EROs
may originate the electronic submission of income tax returns that have been prepared by themselves or preparers they employ, by taxpayers,
by other EROs, and by other paid-preparers. (Glossary, e-file demographics).
16 TeleFile allows the taxpayer to file using a touch-tone telephone. It can be used for Form 1040EZ. IRS (2004b).
18
Table 1: Data from e-file demographics, Tax Year 2003
e-file Modes
TeleFile Online ERO Paper Total
Self prepare N/A N/A N/A N/A N/A Paid prepare N/A N/A N/A N/A 76,408,051
Total N/A 57,720,082 65,594,441 127,084,129 Source: e-file demographics
Table 2: Data from the IRS Data Book, Fiscal Year 2004
e-file Modes
TeleFile Online ERO Paper Total
Self prepare N/A N/A N/A N/A N/A Paid prepare N/A N/A N/A N/A N/A
Total 3,770,618 14,575,477 43,160,740 N/A N/A Source: the IRS Data Book
There is a difference in the period of datasets: e-file demographics is for tax years,
e.g., Tax Year 2003 refers to returns filed between 1/1/2004 and 12/31/2004, to report income
and tax liability for 2003. The Data Book is for fiscal years, e.g., Fiscal Year 2004 means the
period between 10/01/2003 and 9/30/2004. However, it is unlikely that the difference matters,
since most tax year returns are filed in the following fiscal year – i.e., most Tax Year 2003
returns are filed in Fiscal Year 2004. Thus, I assume that the Data Book information, for
example, for Fiscal Year 2004 is for the same period as the e-file data for Tax Year 2003, so
that these two datasets are successfully matched.
This assumption appears to be reasonable, since (1) the sum of the number of online
and ERO returns from the IRS Data Book for Fiscal Year 2004 (57,736,217) is very close to
the number from e-file demographics for Tax Year 2003 (57,720,082), and (2) the sum of

19
TeleFile, online and e-file returns from the Data Book plus the number of paper returns from
the e-file demographics for Fiscal Year 2004 (127,101,276) is very close to the total number
of returns from e-file demographics for Tax Year 2003 (127,084,129). In order to test the
reasonableness of the assumption, I did the same tests for U.S. total in other years and also for
all of the states in each year. These tests show that the assumption is reasonable; most results
shows the difference is less than or about one percent, although the difference in U.S. total
and in some states in Fiscal Year 1999 and Tax Year 1998 is three to seven percent.17
In order to estimate the effect of electronic filing on compliance and to examine how
paid-preparers affect the results, it is necessary to calculate the number of tax returns through
e-file and paper for self-preparers and paid-preparers. To differentiate paid- and self-prepared
returns, I make three assumptions: (1) all TeleFile returns are self-prepared; (2) all online
returns are self-prepared; and (3) all ERO returns are paid-prepared.
Applying these assumptions to the data from e-file demographics Tax Year 2003 and
the IRS Data Book Fiscal Year 2004, whose numbers are shown in Table 1 and 2, yields the
detailed categories in Table 3. First, e-file returns are classified into self-prepared or paid-
prepared. By the first assumption, the number of self-prepared returns through TeleFile is
3,770,618 and the number of paid-prepared returns through TeleFile is zero; by the second
assumption, the number of self-prepared returns online is 14,575,477 and the number of paid-
prepared returns online is zero; and, by the third assumption, the number of self-prepared
17 I calculated the difference between them as follows: first, I subtracted the sum of the number of e-file from the number from e-file
demographics; and then I divided the result by the number from e-file demographics.
20
returns through ERO is zero and the number of paid-prepared returns through ERO is
43,160,740. By subtraction, using the data on total returns (127,084,129) and total paid-
prepared returns (76,408,051) from e-file demographics, the number of self-prepared returns
is 50,676,078. The numbers of paper returns self-prepared and paid-prepared are calculated by
subtraction; by subtracting e-file returns self-prepared from total returns self-prepared, the
number of paper returns self-prepared is 32,329,983; by subtracting e-file returns paid-
prepared from total returns paid-prepared, the number of paper returns paid-prepared is
33,247,311.
The sum of the number of paper returns by subtraction with the stated assumptions
should be close to the number from e-file demographics if the assumptions are valid. The sum
of the number of paper returns by self-preparers and paid-preparers (65,577,294) is very close
to the number from e-file demographics (65,594,441). Thus, the assumptions are reasonable
for Fiscal Year 2004 and Tax Year 2003. The same test demonstrates that the assumptions are
also reasonable for all other years. Moreover, I did the same tests for all states in each year to
check if the assumptions are reasonable not only for U.S. total but also for individual states.
These tests too were successful. The difference between the sum of the number of paper self-
prepared and paper paid-prepared returns, obtained by subtraction, and the total number of
paper returns from e-file demographics is about one percent for most of the tests.

21
Table 3: Preparation and Filing Modes – Data from e-file demographics Tax Year 2003 & the IRS Data Book Fiscal Year 2004 with Three Assumptions
e-file Modes TeleFile Online ERO
Paper Total
Self prepare 3,770,618 (by assumption 1)
14,575,477 (by assumption 2)
0 (by assumption 3)
32,329,983 (by subtraction, using
1, 2, and 3)
50,676,078 (by subtraction)
Paid prepare 0 (by assumption 1)
0 (by assumption 2)
43,160,740 (by
assumption 3)
33,247,311 (by subtraction, using
1, 2 and 3) 76,408,051
Total 3,770,618 14,575,477 43,160,740 65,594,441 127,084,129
For estimation, I ignore TeleFile and count only online and ERO returns as e-filed
returns. As a result, preparation and filing modes are classified into four categories: self-
prepared through e-file, self-prepared through paper, paid-prepared through e-file, and paid-
prepared through paper. For example, Fiscal Year 2004 and Tax Year 2003 numbers are
below. Note that the total number includes the number of returns through TeleFile.
Table 4: Preparation and Filing Modes (Fiscal Year 2004 and Tax Year 2003)
Modes e-file (Online + ERO) Paper Total*
Self prepare 14,575,477 32,329,983 50,676,078 Paid prepare 43,160,740 33,247,311 76,408,051
Total 57,720,082 65,594,441 127,084,129 * The total number includes the number of returns through TeleFile.
Tax Policy:
Tax rate and audit rate are included in the model. TaxRate is total tax liability divided
by personal income. Total tax liability data is from SOI.18 Considering that AGI and total tax
liability might influence each other, in order to avoid endogeneity, total tax liability is divided
18 Retrieved February 1, 2006 from http://www.irs.gov/taxstats/indtaxstats/article/0,,id=103106,00.html.

22
by personal income, not by AGI. Tax rate is likely negatively associated with income
reporting compliance.
I obtain AuditRate using the data from the Transactional Records Access
Clearinghouse (TRAC).19 AuditRate is lagged one year, because the audit rate for a given
fiscal year is not known when returns are filed. The audit data from TRAC is not for all
individual audits; it excludes correspondence exams. Also, it is not for each state but for each
of the 33 IRS administrative districts. Thus, I assume that states within a district have the
same audit rate as that of the district. In addition, the data are available only through Fiscal
Year 2000 because of the discontinuance of IRS reporting of audit data by district and region.
Therefore, with the data Fiscal Years 1998 – 2000, I estimate audit rate for Fiscal Years 2001
– 2003 with the assumption that the audit rate for each IRS district relative to the audit rate for
the United States overall, for Fiscal Years 2001 – 2003, is the same as the average over Fiscal
Years 1998 – 2000. Audit rate is likely to correlate positively with income reporting
compliance.
Economics:
Three explanatory economic variables are included in the model. UnemplRate denotes
unemployment rate, Percappi stands for Per Capita Personal Income, and Sqpercappi means
square of Per Capita Personal Income. For the unemployment rate, I use Local Area
19 District Enforcement, TRAC. Retrieved December 3, 2005 from http://trac.syr.edu/tracirs/findings/05/index.html. TRAC is a research
center at Syracuse University established in 1989.

23
Unemployment Statistics20 from the Current Population Survey, the household survey that is
the official measure of the labor force for the nation. The unemployment rate is the percentage
of the total labor force aged 16 years and older not employed. Although Beron, Tauchen and
Witte (1992) finds that this variable has a very weak effect on compliance, I expect that, as
Dubin and Wilde (1988) found, UnemplRate is negatively correlated with compliance,
because taxpayers might be unwilling to pay their tax when they have no job or have anxiety
about whether they can keep their current job.
My Percappi data come from BEA as do the Personal Income data used for my
dependent variable. Other studies find that people who earn higher income may underreport
that income. Thus, the predicted effect of income in my model is negatively associated with
compliance. BEA’s estimate of Per Capita Personal Income is the personal income of the
residents of a state divided by the state’s population as of July 1.21 In addition, I include
square of Per Capita Personal Income to allow the change of the effect to vary depending on
the level of income.
Demographics:
I include four demographic variables: Married for filing status, Under30 and Over60
for age, and SelfemplRate for Self-Employment. All of the data for these variables come from
e-file demographics. Married is the percentage of total returns filed with filing status Married
20 Retrieved November 8, 2005 from http://www.bls.gov/lau/.
21 Bureau of Economic Analysis (2005).
24
Filing Jointly. Marital status has been shown in other models to increase tax compliance
relative to singles. Age variables are included in the model primarily because other
researchers find that they are important. Under30 and Over60 are the percentages of total
returns filed with primary taxpayer’s age under 30 and over 60 respectively. SelfemplRate is
the number of Schedule C filers divided by the total number of returns filed. The sign of this
variable is likely to be negative, since relative to other taxpayers, self-employed people have
more discretion in deciding how much income to report.
3.2 Statistical Model
This study employs panel data analysis and uses a fixed effects model. Panel data
analysis can control for unobservable time-invariant characteristics that affect the outcome
variable. Since unobservable fixed effects, which may be correlated with the independent
variables, would lead to biased estimates, controlling for these fixed effects is necessary. In
addition, since unobservable fixed effects may be correlated with the independent variables,
the fixed effects model is the appropriate estimation strategy, rather than random effects
model, which is preferred if the unobservable fixed effect is uncorrelated with the
independent variables.
25
3.2.1 Endogeneity of Preparation and Filing Modes
In estimating a model of the effect of electronic filing and the use of paid-preparers on
individual income tax compliance, it is important to consider whether compliant or
noncompliant taxpayers tend to choose to use electronic filing and/or paid-preparers. For
example, electronic filing may be associated with a higher level of compliance, since
technology helps taxpayers reduce errors. In this case, encouraging taxpayers to choose
electronic filing would improve compliance. However, if compliant taxpayers are likely to
self-select into the use of electronic filing, it will be difficult to see if electronic filing helps to
improve tax compliance for noncompliant taxpayers. Thus, encouraging noncompliant
taxpayers to e-file might not improve compliance. Hence, in my study, controlling for effects
of self-selection of preparation and filing modes on compliance would be important.
Although panel data analysis is useful for eliminating the effect of omitted variables
which are consistent over time, omitted variables bias remains if time-varying, unobservable
factors of the income reporting rate are correlated with the variables of interest. Therefore, I
employ a Two-Stage Least Squares (2SLS) approach using instrumental variables in order to
control for self-selection for preparation and filing modes. The instrumental variable method
requires two conditions: instrument relevance and instrument exogeneity. Instrumental
variables should be highly relevant to each endogenous variable. Also, the instruments must
be uncorrelated with the error term; otherwise, 2SLS yields inconsistent coefficient estimates.
26
Five instrumental variables are used for the three variables of interest (i.e., electronic
filing by paid-preparers, electronic filing by self-preparers, and paper filing by paid-
preparers): acterorate, housecomp, intacc, itemdeduc, and bachemore. Acterorate is the count
of Electronic Return Originators (EROs) with an Electronic Filing Identification Number
(EFIN) who have transmitted returns each tax year divided by total returns. These data are
included in e-file demographics. EROs may prepare and submit returns electronically, or
submit returns electronically that are prepared by taxpayers or others. I assume that all returns
submitted by EROs are paid-prepared returns (see p.19). Therefore, Acterorate is a measure
of the availability of the electronic filing option, primarily for taxpayers who use paid-
preparers.
Housecomp is the percentage of households with computers and intacc is the
percentage of households with internet access. Data on both variables are only available by
state in the report by the Census Bureau for 1998, 2000, 2001, and 2003.22 These are
appropriate instruments, because taxpayers as well as tax preparers need computers and
internet access to file returns electronically. I assume that percentage of households with
computers or internet access can be lagged one year. Data for Fiscal Years 1999, 2001, 2002,
and 2004 are then available. For Fiscal Years 2000 and 2003, I take the average value of 1999
and 2001, and of 2002 and 2004, respectively.
22 Census Bureau. “Statistical Abstract of the U.S.” 2000 through 2005.
27
Itemdeduc is the percentage of total returns with itemized deductions. I use the number
of itemized deduction returns from SOI data. Compared to claiming the standard deduction,
itemizing deductions makes tax return preparation more complicated due to the need to
compute each deduction item and to keep the records for proof of the deduction. Other
researchers have found that taxpayers faced with complex tax returns are more likely to seek
paid-preparers. Thus, itemdeduc should be a meaningful instrumental variable.
Finally, bachemore is the percentage of the population 25 years and over with a
Bachelor's degree or more. These data are included in the Census information on educational
attainment of the populations.23 Other studies suggest that taxpayers with high levels of
educational attainment are likely to prepare their tax returns by themselves.24 So, this variable
could also affect preparation and filing mode variables.
3.2.2 First-stage Equation
The first step in the 2SLS approach is to estimate OLS and fixed effects models in
which each endogenous preparation and filing mode variable is a dependent variable as a
function of other variables, including all instrumental variables and exogenous variables, as
follows:
23 Retrieved February 23, 2006 from http://www.census.gov/population/www/socdemo/educ-attn.html.
24 Andreoni, J., B. Erard, and J. Feinstein (1998).

28
OLS Model
(1) eselfit = �0 + �1*acterorateit + �2*housecompit + �3*intaccit + �4*itemdeducit + �5*bachemoreit + �6*auditrateit + �7*taxrateit + �8*percappiit + �9*sqpercappiit + �10*unemplrateit + �11*under30it + �12*over60it + �13*marriedit + �14*selfemprateit + �*Yeart + uit
(2) epaidit = �0 + �1*acterorateit + �2*housecompit + �3*intaccit + �4*itemdeducit + �5*bachemoreit + �6*auditrateit + �7*taxrateit + �8*percappiit + �9*sqpercappiit + �10*unemplrateit + �11*under30it + �12*over60it + �13*marriedit + �14*selfemprateit + �*Yeart + uit
(3) ppaidit = �0 + �1*acterorateit + �2*housecompit + �3*intaccit + �4*itemdeducit + �5*bachemoreit + �6*auditrateit + �7*taxrateit + �8*percappiit + �9*sqpercappiit + �10*unemplrateit + �11*under30it + �12*over60it + �13*marriedit + �14*selfemprateit + �*Yeart + uit
Fixed Effects Model
(1) eselfit = �0 + �1*acterorateit + �2*housecompit + �3*intaccit + �4*itemdeducit + �5*bachemoreit + �6*auditrateit + �7*taxrateit + �8*percappiit + �9*sqpercappiit + �10*unemplrateit + �11*under30it + �12*over60it + �13*marriedit + �14*selfemprateit + �*Statei + �*Yeart + uit
(2) epaidit = �0 + �1*acterorateit + �2*housecompit + �3*intaccit + �4*itemdeducit + �5*bachemoreit + �6*auditrateit + �7*taxrateit + �8*percappiit + �9*sqpercappiit + �10*unemplrateit + �11*under30it + �12*over60it + �13*marriedit + �14*selfemprateit + �*Statei + �*Yeart + uit
(3) ppaidit = �0 + �1*acterorateit + �2*housecompit + �3*intaccit + �4*itemdeducit + �5*bachemoreit + �6*auditrateit + �7*taxrateit + �8*percappiit + �9*sqpercappiit + �10*unemplrateit + �11*under30it + �12*over60it + �13*marriedit + �14*selfemprateit + �*Statei + �*Yeart + uit
The fixed effects models include 49 state dummy variables (i = 1 to 49). Both models
include five year dummy variables (t = each fiscal year from 2000 to 2004). After estimating
29
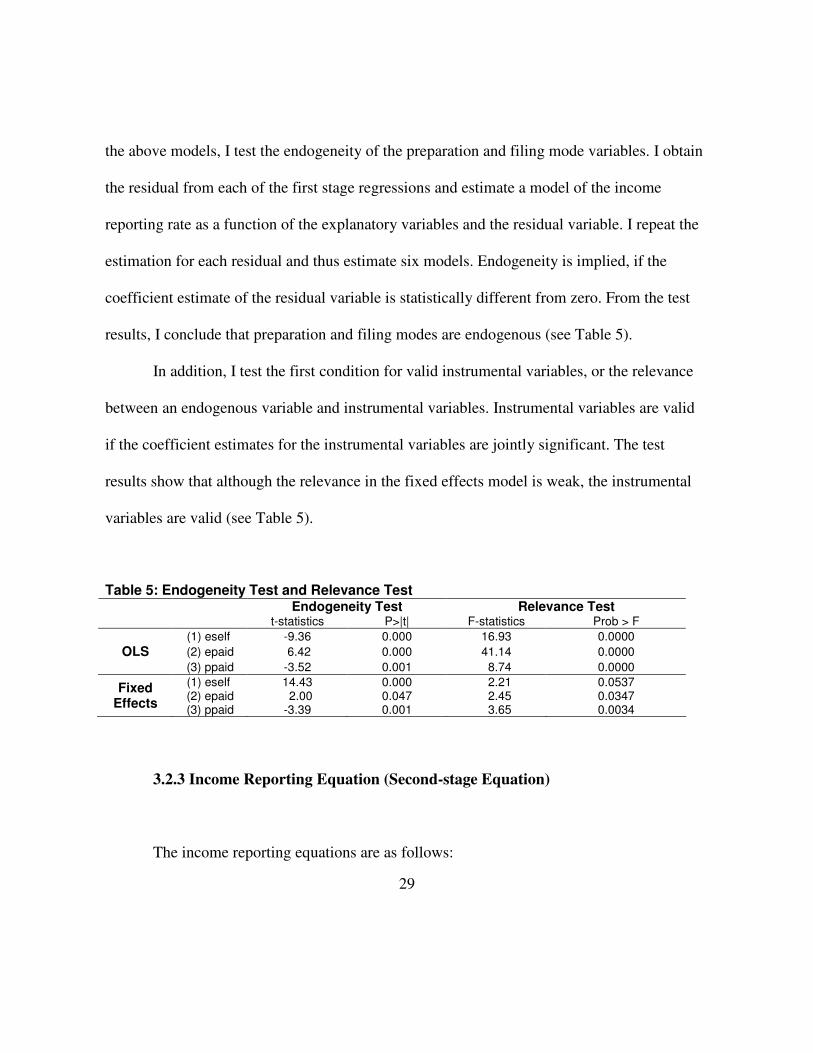
the above models, I test the endogeneity of the preparation and filing mode variables. I obtain
the residual from each of the first stage regressions and estimate a model of the income
reporting rate as a function of the explanatory variables and the residual variable. I repeat the
estimation for each residual and thus estimate six models. Endogeneity is implied, if the
coefficient estimate of the residual variable is statistically different from zero. From the test
results, I conclude that preparation and filing modes are endogenous (see Table 5).
In addition, I test the first condition for valid instrumental variables, or the relevance
between an endogenous variable and instrumental variables. Instrumental variables are valid
if the coefficient estimates for the instrumental variables are jointly significant. The test
results show that although the relevance in the fixed effects model is weak, the instrumental
variables are valid (see Table 5).
Table 5: Endogeneity Test and Relevance Test Endogeneity Test Relevance Test
t-statistics P>|t| F-statistics Prob > F
(1) eself -9.36 0.000 16.93 0.0000 OLS (2) epaid 6.42 0.000 41.14 0.0000
(3) ppaid -3.52 0.001 8.74 0.0000
Fixed Effects
(1) eself (2) epaid (3) ppaid
14.43 2.00 -3.39
0.000 0.047 0.001
2.21 2.45 3.65
0.0537 0.0347 0.0034
3.2.3 Income Reporting Equation (Second-stage Equation)
The income reporting equations are as follows:
30
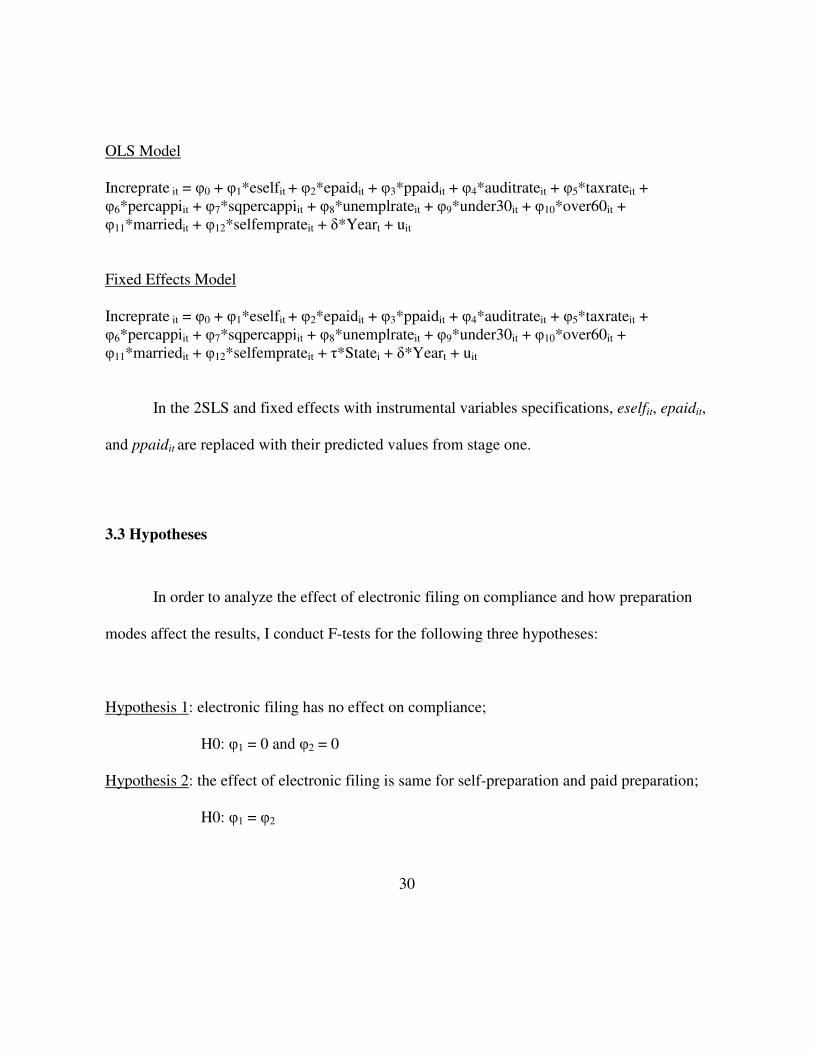
OLS Model
Increprate it = �0 + �1*eselfit + �2*epaidit + �3*ppaidit + �4*auditrateit + �5*taxrateit + �6*percappiit + �7*sqpercappiit + �8*unemplrateit + �9*under30it + �10*over60it + �11*marriedit + �12*selfemprateit + �*Yeart + uit
Fixed Effects Model
Increprate it = �0 + �1*eselfit + �2*epaidit + �3*ppaidit + �4*auditrateit + �5*taxrateit + �6*percappiit + �7*sqpercappiit + �8*unemplrateit + �9*under30it + �10*over60it + �11*marriedit + �12*selfemprateit + �*Statei + �*Yeart + uit
In the 2SLS and fixed effects with instrumental variables specifications, eselfit, epaidit,
and ppaidit are replaced with their predicted values from stage one.
3.3 Hypotheses
In order to analyze the effect of electronic filing on compliance and how preparation
modes affect the results, I conduct F-tests for the following three hypotheses:
Hypothesis 1: electronic filing has no effect on compliance;
H0: �1 = 0 and �2 = 0
Hypothesis 2: the effect of electronic filing is same for self-preparation and paid preparation;
H0: �1 = �2

31
Hypothesis 3: once a taxpayer uses a paid-preparer, the distinction between paper and
electronic filing is irrelevant;
H0: �2 = �3

32
Chapter 4. Summary Statistics
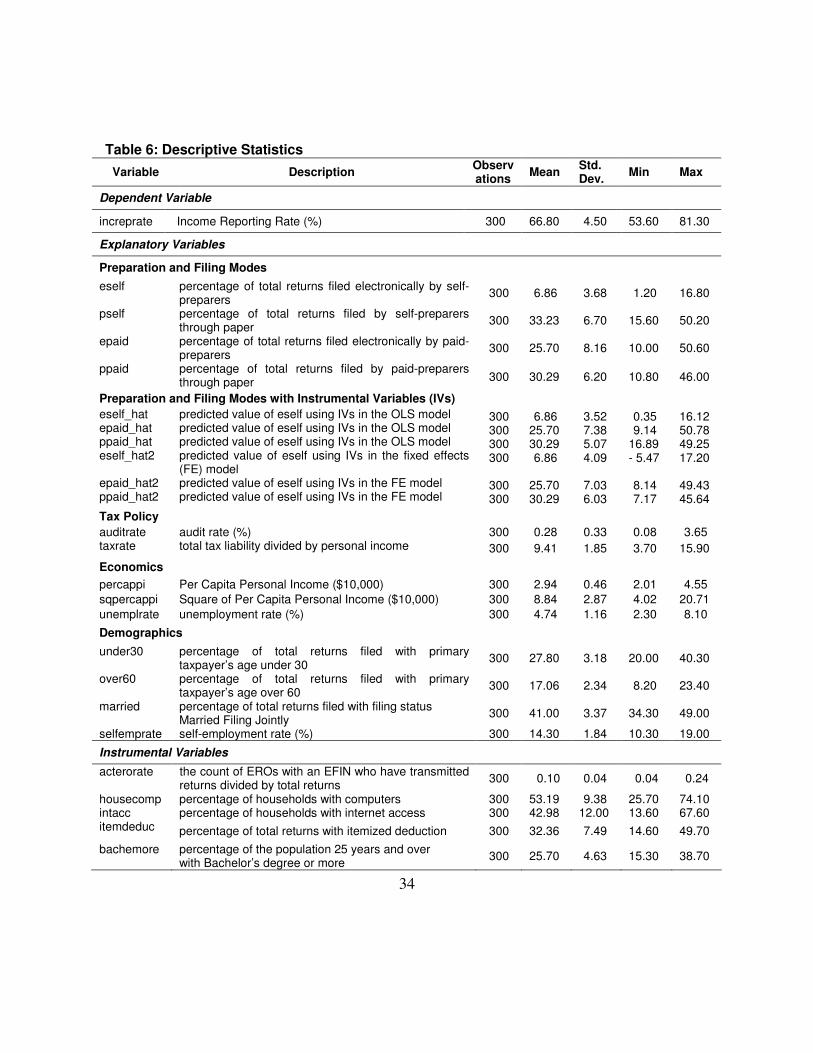
Table 6 contains each variable’s mean, standard deviation, and minimum and
maximum value. The variance of the income reporting rate, which is the dependent variable,
is relatively large and the difference between minimum and maximum is about 28%. This
implies that income reporting compliance varies by state or/and by year. Among the
preparation and filing mode variables, which are variables of interest, the mean of the
percentage of total returns filed electronically by self-preparers is much smaller than the
means through other preparation modes. In addition, the means and standard deviations for
paper returns by taxpayers themselves are quite similar to the ones for paper returns by tax-
preparers.
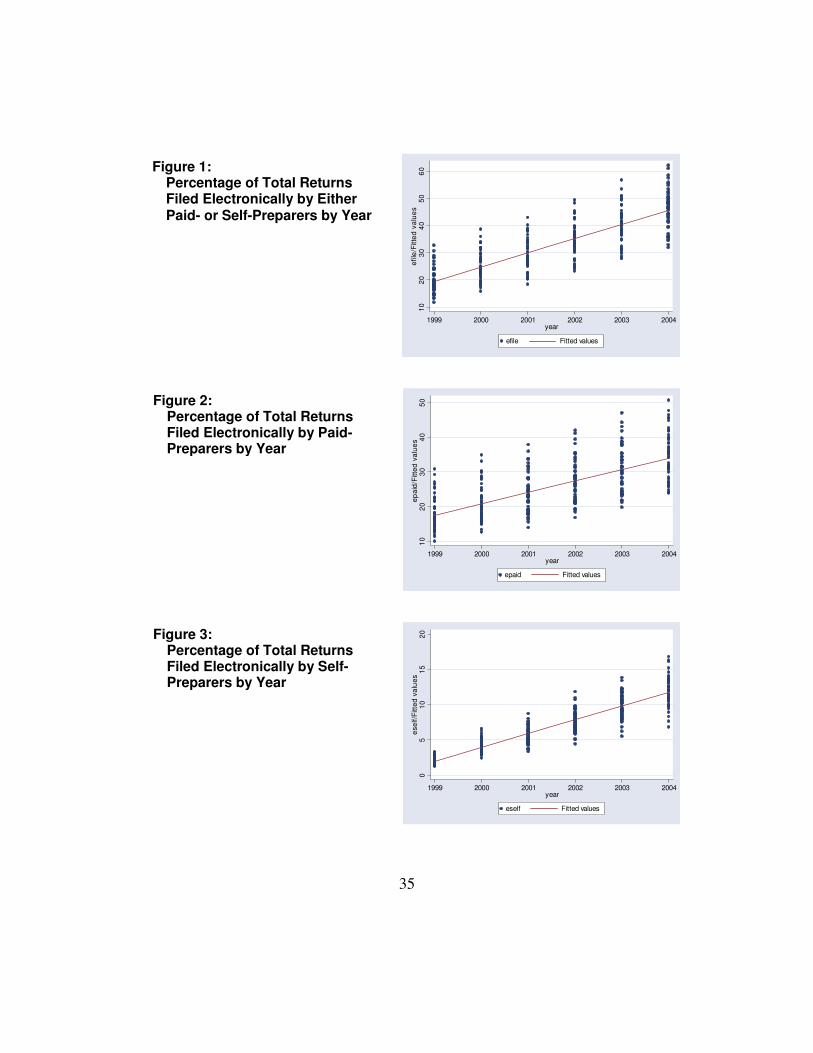
Figures 1, 2 and 3 suggest positive correlations between year and the percentages of
total returns filed electronically by either paid-preparers or self-preparers, the percentage of
total returns filed electronically by paid-preparers, or the percentage of total returns filed
electronically by self-preparers, implying that the number of electronic filing returns has been
increasing annually. The slope is slightly steeper for electronic filing by paid preparation than
by self-preparation. This means that the growth rate of electronic filing by tax-preparers is
larger than the growth rate of electronic filing by taxpayers themselves.
As shown in figures 2 and 3, the variance of the percentage of total returns filed
electronically by paid-preparers in each year is larger than that by self-preparers. This implies
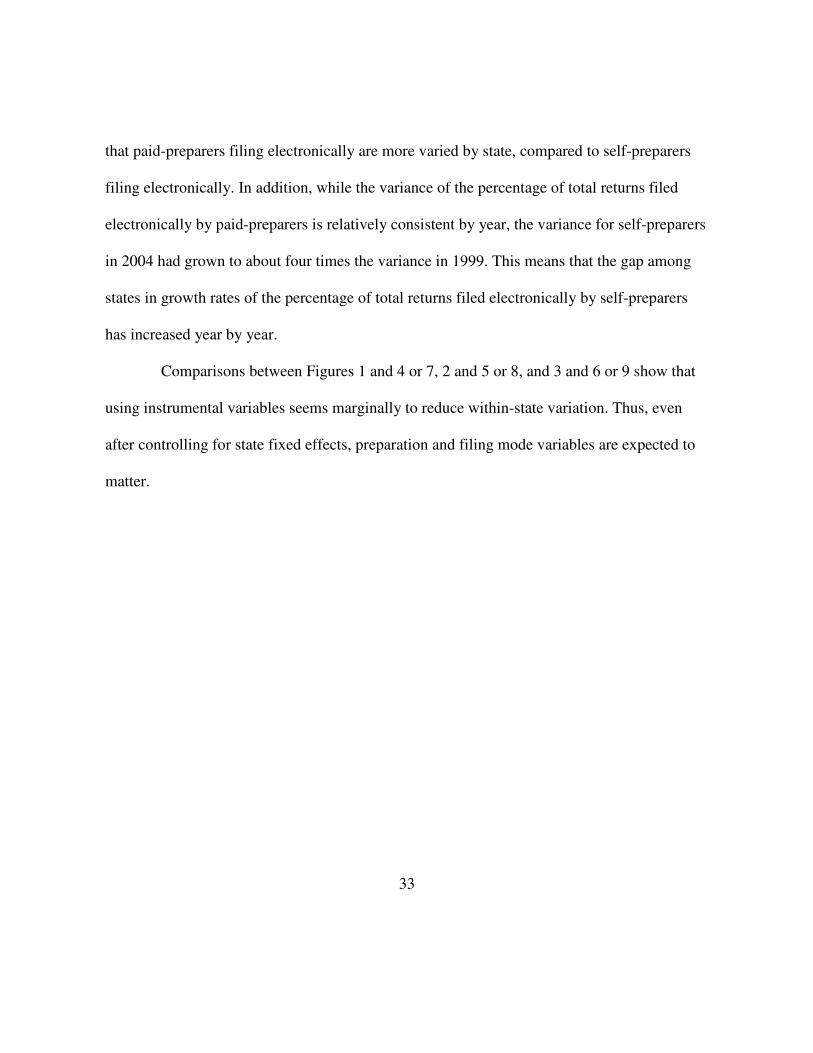
33
that paid-preparers filing electronically are more varied by state, compared to self-preparers
filing electronically. In addition, while the variance of the percentage of total returns filed
electronically by paid-preparers is relatively consistent by year, the variance for self-preparers
in 2004 had grown to about four times the variance in 1999. This means that the gap among
states in growth rates of the percentage of total returns filed electronically by self-preparers
has increased year by year.
Comparisons between Figures 1 and 4 or 7, 2 and 5 or 8, and 3 and 6 or 9 show that
using instrumental variables seems marginally to reduce within-state variation. Thus, even
after controlling for state fixed effects, preparation and filing mode variables are expected to
matter.
34
Table 6: Descriptive Statistics Variable Description Observ
ations Mean Std. Dev. Min Max
Dependent Variable
increprate Income Reporting Rate (%) 300 66.80 4.50 53.60 81.30
Explanatory Variables
Preparation and Filing Modes eself percentage of total returns filed electronically by self-
preparers 300 6.86 3.68 1.20 16.80
pself percentage of total returns filed by self-preparers through paper 300 33.23 6.70 15.60 50.20
epaid percentage of total returns filed electronically by paid-preparers 300 25.70 8.16 10.00 50.60
ppaid percentage of total returns filed by paid-preparers through paper 300 30.29 6.20 10.80 46.00
Preparation and Filing Modes with Instrumental Variables (IVs) eself_hat epaid_hat ppaid_hat eself_hat2 epaid_hat2 ppaid_hat2
predicted value of eself using IVs in the OLS model predicted value of eself using IVs in the OLS model predicted value of eself using IVs in the OLS model predicted value of eself using IVs in the fixed effects (FE) model predicted value of eself using IVs in the FE model predicted value of eself using IVs in the FE model
300 300 300 300
300 300
6.86 25.70 30.29 6.86
25.70 30.29
3.52 7.38 5.07 4.09
7.03 6.03
0.35 9.14
16.89 - 5.47 8.14 7.17
16.12 50.78 49.25 17.20 49.43 45.64
Tax Policy auditrate audit rate (%) 300 0.28 0.33 0.08 3.65 taxrate total tax liability divided by personal income 300 9.41 1.85 3.70 15.90
Economics percappi Per Capita Personal Income ($10,000) 300 2.94 0.46 2.01 4.55 sqpercappi Square of Per Capita Personal Income ($10,000) 300 8.84 2.87 4.02 20.71 unemplrate unemployment rate (%) 300 4.74 1.16 2.30 8.10 Demographics under30 percentage of total returns filed with primary
taxpayer’s age under 30 300 27.80 3.18 20.00 40.30
over60 percentage of total returns filed with primary taxpayer’s age over 60 300 17.06 2.34 8.20 23.40
married percentage of total returns filed with filing status Married Filing Jointly 300 41.00 3.37 34.30 49.00
selfemprate self-employment rate (%) 300 14.30 1.84 10.30 19.00
Instrumental Variables
acterorate the count of EROs with an EFIN who have transmitted returns divided by total returns 300 0.10 0.04 0.04 0.24
housecomp percentage of households with computers 300 53.19 9.38 25.70 74.10 intacc percentage of households with internet access 300 42.98 12.00 13.60 67.60 itemdeduc percentage of total returns with itemized deduction 300 32.36 7.49 14.60 49.70 bachemore percentage of the population 25 years and over
with Bachelor’s degree or more 300 25.70 4.63 15.30 38.70
35
1020
3040
5060
efile
/Fitt
ed v
alue
s
1999 2000 2001 2002 2003 2004year
efile Fitted values
1020
3040
50ep
aid/
Fitte
d va
lues
1999 2000 2001 2002 2003 2004year
epaid Fitted values
05
1015
20es
elf/F
itted
val
ues
1999 2000 2001 2002 2003 2004year
eself Fitted values
Figure 3:
Percentage of Total Returns Filed Electronically by Self-Preparers by Year
Figure 2:
Percentage of Total Returns Filed Electronically by Paid-Preparers by Year
Figure 1:
Percentage of Total Returns Filed Electronically by Either Paid- or Self-Preparers by Year

36
1020
3040
5060
efile
_hat
/Fitt
ed v
alue
s
1999 2000 2001 2002 2003 2004year
efile_hat Fitted values
1020
3040
50Fi
tted
valu
es
1999 2000 2001 2002 2003 2004year
Fitted values Fitted values
05
1015
Fitte
d va
lues
1999 2000 2001 2002 2003 2004year
Fitted values Fitted values
Figure 6:
Percentage of Total Returns Filed Electronically by Self-Preparers Using IVs in the OLS model by Year
Figure 5:
Percentage of Total Returns Filed Electronically by Paid-Preparers Using IVs in the OLS model by Year
Figure 4:
Percentage of Total Returns Filed Electronically by Either Paid- or Self-Preparers Using Instrumental Variables (IVs) in the OLS model by Year

37
020
4060
80ef
ile_h
at2/
Fitte
d va
lues
1999 2000 2001 2002 2003 2004year
efile_hat2 Fitted values
1020
3040
50X
b/Fi
tted
valu
es
1999 2000 2001 2002 2003 2004year
Xb Fitted values
-50
510
1520
Xb/
Fitte
d va
lues
1999 2000 2001 2002 2003 2004year
Xb Fitted values
Figure 9:
Percentage of Total Returns Filed Electronically by Self-Preparers Using IVs in the FE model by Year
Figure 8:
Percentage of Total Returns Filed Electronically by Paid-Preparers Using IVs in the FE model by Year
Figure 7:
Percentage of Total Returns Filed Electronically by Either Paid- or Self-Preparers Using IVs in the Fixed Effects (FE) model by Year

38
Chapter 5. Regression Results
Table 7 includes the estimates from four regression models: an OLS model, an OLS
model using 2SLS, a fixed effects model, and a fixed effects model using 2SLS. The results
are discussed below by group: Preparation and Filing Modes, Tax Policy, Economics,
Demographics, and Year Dummy. At the end, I discuss instrument exogeneity and limitations
of the data.
Preparation and Filing Modes:
The OLS model suggests that only electronic filing by paid-preparers has a significant
effect on compliance. The impact is small and negative, implying that electronic filing could
somewhat decrease reported income on tax returns when taxpayers hire a paid-preparer. In
addition, the insignificant coefficient of electronic filing by self-preparers suggests that
electronic filing does not help improve compliance in self-preparation. This result is at odds
with the assumption that technology helps taxpayers who prepare their tax filing by
themselves in reducing errors and thus improving compliance. Further, the OLS regression
results imply that whether or not taxpayers use a paid-preparer does not matter in the case of
paper filing. This result is inconsistent with other studies that find a significant effect of paid-
preparers on compliance.

39
Because I find that preparation and filing modes are endogenous (see p.29), I expect
the estimated OLS coefficients to be biased. I use instrumental variables to correct the bias
and find that the significance and size of the effects of electronic filing by self-preparers, and
of paper filing by paid-preparers are increased. In other words, I find self-selection of
preparation and filing modes biases the coefficients in electronic filing by self-preparers and
paper filing by paid-preparers downward, and the 2SLS approach corrects the bias to some
extent. This is consistent with the finding of Erard (1993) that taxpayer self-selection for tax
preparation modes is likely to have a negative effect on compliance.
The OLS model using 2SLS produces significant impacts on compliance for all three
preparation and filing mode variables at at least the 10% level. In particular, electronic filing
by self-preparers and paper filing by paid-preparers seem to have positive, very significant
effects on compliance, relative to paper filing by self-preparers.
On the other hand, the effect of electronic filing by paid-preparers on compliance is
negative and significant at just the10% level. These results imply that electronic filing likely
improves compliance when taxpayers themselves file tax returns. Thus, in self-preparation,
the positive effect from technology that may help improve compliance due to the fewer errors
that would otherwise trigger an audit and the increase of chances for tax saving appears to
outweigh any negative impact of electronic filing.
These results also suggest that paid-preparers have a dual role: paid-preparers are
likely to help improve compliance when they file through paper, while they may increase

40
noncompliance when using electronic filing. Since paid-preparers realize that electronic filing
reduces errors that would otherwise trigger an audit, they may be encouraged to find more
opportunities for tax saving. Moreover, paid-preparers may be likely to prepare more
complicated tax returns using electronic filing, increasing the possibility of errors and thus
lowering compliance. In addition, Klepper, Mazur and Nagin (1991) conclude that tax
preparers likely increase compliance on unambiguously defined line items. I find that paid-
preparers may tend to choose paper filing when line items are clearly defined. Although I
correct self-selection bias of preparation and filing modes, the relevance tests I conduct above
imply that the instrumental variables I use have a weaker relationship to paper filing by paid-
preparers than to electronic filing by paid-preparers in the OLS model (see p.29). It suggests
that the correction may not be enough for paper filing by paid-preparers and thus the result
may still be biased.
In the 2SLS model, I can easily reject the hypothesis that the effects of electronic
filing for both self-preparers and taxpayers using paid-preparers are jointly zero. The F-test
implies that whether or not a taxpayer hires a paid-preparer, electronic filing has an effect on
compliance. In addition, I reject the hypothesis that the effect of electronic filing is the same
for self-preparers as for taxpayers using paid-preparers. The F-test strongly suggests that the
effect of electronic filing differs depending on preparation modes. Thus, from the two F-tests,
the effect of electronic filing on compliance could be either positive or negative as I expected,
and the sign and size of the effect is different when a taxpayer hires a paid-preparer from

41
when s/he does not. Further, I reject the hypothesis that filing mode (electronic versus paper
filing) does not matter, once a taxpayer uses a paid-preparer. The result suggests that the role
of paid-preparers is varied depending on filing modes. Results of the F-tests are reported at
the bottom of Table 7.
The fixed effects models, with or without instrumental variables, produce insignificant
coefficient estimates on all types of preparation and filing modes. In other words, the results
suggest that neither electronic filing nor paid-preparers has an effect on compliance. Before
running the regression models, I thought a fixed effects model would be appropriate, since
controlling for unobservable time-invariant effects, which may be correlated with the
independent variables, especially preparation and filing mode variables, could lead to biased
estimates. However, the fixed effects models did not produce significant results, probably
because there is insufficient within-state variation; and also because including year dummy
variables in a model reduces the variation in preparation and filing modes and result in high
standard errors.
Tax Policy:
Both the OLS model and the OLS model using 2SLS show strong, negative effects of
the audit rate on compliance. This result is consistent with other studies such as Allingham
and Sandmo (1972), Dubin and Wilde (1988), and Dubin, Graetz and Wilde (1990). However,
42
using the fixed effects model and the fixed effects model using 2SLS, the effect becomes
insignificant, implying that the audit rate varies by state.
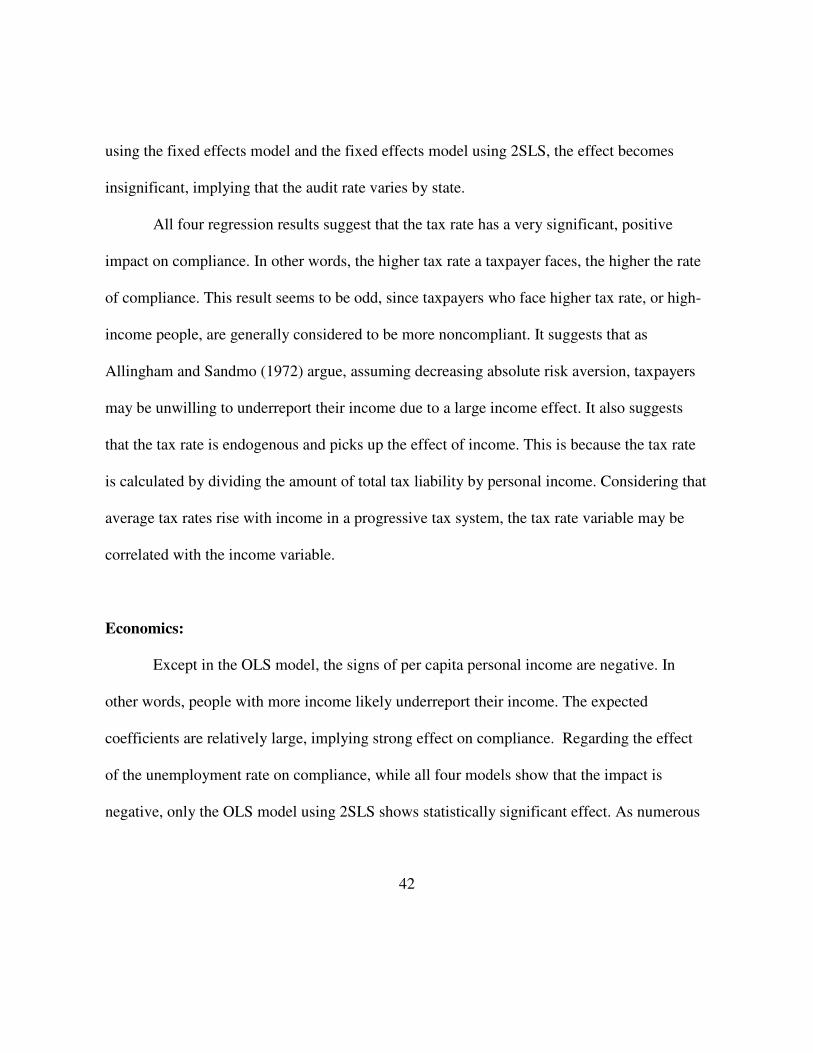
All four regression results suggest that the tax rate has a very significant, positive
impact on compliance. In other words, the higher tax rate a taxpayer faces, the higher the rate
of compliance. This result seems to be odd, since taxpayers who face higher tax rate, or high-
income people, are generally considered to be more noncompliant. It suggests that as
Allingham and Sandmo (1972) argue, assuming decreasing absolute risk aversion, taxpayers
may be unwilling to underreport their income due to a large income effect. It also suggests
that the tax rate is endogenous and picks up the effect of income. This is because the tax rate
is calculated by dividing the amount of total tax liability by personal income. Considering that
average tax rates rise with income in a progressive tax system, the tax rate variable may be
correlated with the income variable.
Economics:
Except in the OLS model, the signs of per capita personal income are negative. In
other words, people with more income likely underreport their income. The expected
coefficients are relatively large, implying strong effect on compliance. Regarding the effect
of the unemployment rate on compliance, while all four models show that the impact is
negative, only the OLS model using 2SLS shows statistically significant effect. As numerous

43
researchers have found, the result suggests that unemployment is negatively associated with
compliance.
Demographics:
The OLS model using 2SLS show negative, significant effects of age variables on
compliance, implying that relatively young or elderly taxpayers are likely to underreport their
income, compared to middle-aged taxpayers. In addition, the OLS model estimates that the
marital status variable seems to have a small and, as other studies find, positive impact on
compliance, although the effect becomes insignificant in the 2SLS model. Further, the results
from both the OLS model and the OLS model using 2SLS suggest that as Dubin and Wilde
(1988) find, self-employment has a significant negative effect on compliance. Note that the
fixed effects models produce insignificant impacts of demographics variables on compliance,
probably because there is not enough within-state variation in those variables.
Year Dummy:
The results do not suggest a clear impact of year on compliance. The fixed effects
model shows a significant, positive time-trend in compliance, implying that compliance for
entire states went up over time. On the other hand, the OLS model using 2SLS yields a
significant, negative time-trend in compliance, implying that compliance went down over
time. Considering that the OLS model using 2SLS generally produces significant effects for
44
other explanatory variables, the result of a significantly negative time-trend might be correct.
In addition, there might be multicollinearity between the year dummy variables and electronic
filing variables, causing the strong positive time-trend in the fixed effects model. In other
words, the year dummies may include the effect of electronic filing on compliance over years
within states.
Overall, the OLS model using 2SLS produces significant results. In order to see if the
model yields consistent coefficient estimates, I test for instrument exogeneity, which is the
second condition for valid instruments. I conduct the over-identifying restrictions test. First, I
obtain the 2SLS residuals and regress the residuals on all exogenous variables, including all
instruments. Then, using the R-squared from the regression, I test the null hypothesis that all
instrumental variables are uncorrelated with the disturbance term. In order to fail to reject the
null hypothesis, the value of the number of observations multiplied by the R-squared should
not exceed any conventional significance level value in the �2q distribution, where q is the
total number of endogenous variables subtracted from the number of instrumental variables,
or 2 (= 5 - 3) in this paper. The critical values in the �22 distribution are 4.61 at the 10%, 5.99
at the 5%, and 9.21 at the 1%. Since the value of the number of observations multiplied by the
R-squared is 2.37, I fail to reject the null hypothesis at any conventional significance level.
Therefore, I conclude that instrumental variables are exogenous.

45
Finally, it is important to mention the limitations that prevent this study from precisely
estimating the effect of determinants of income reporting compliance, especially that of
electronic filing on compliance. Two major limitations are: (1) individual micro level data is
not accessible; and (2) a fairly limited number of years of data are used in the analysis. As for
the first limitation, because each taxpayer has a different level of compliance, compliance
should be measured at an individual taxpayer level. Aggregation at state level reduces
variation in both the dependent and independent variables and causes large standard errors,
resulting in imprecise and/or insignificant impacts of determinants of compliance. The second
limitation also contributes to reducing the variation and causing the same problems. Since
electronic filing is a relatively new filing mode, the analysis in this paper could use only six
years. In order to have enough variation and see the time-trend in compliance, more years of
panel data should be used.

46
Table 7: Estimates of Income Reporting Compliance OLS Model Fixed Effects Model OLS 2SLS Fixed Effects 2SLS
Preparation and Filing Modes
eself 0.1337 (1.43)
1.8569* (5.63)
0.0436 (0.45)
-0.1153 (-0.09)
epaid -0.0693* (-2.69)
-0.1269† (-1.79)
0.0837 (0.81)
-1.9693 (-0.79)
ppaid -0.0159 (-0.47)
0.5003* (3.34)
0.1038 (1.10)
-1.6100 (-0.81)
Tax Policy
auditrate -1.5420* (-4.07)
-2.5682* (-3.10)
0.1742 (0.42)
-0.5812 (-0.55)
taxrate 2.5236* (16.53)
2.5310* (7.47)
3.6037* (28.96)
3.8659* (12.43)
Economics
percappi 2.4423 (1.05)
-8.6376* (-2.40)
-24.0891* (-7.49)
-8.8747 (-0.35)
sqpercappi -0.6057† (-1.72)
0.5751 (1.02)
2.3557* (6.07)
0.5099 (0.16)
unemplrate -0.1563 (-1.29)
-0.5612* (-3.01)
-0.1127 (-0.89)
-0.2023 (-0.85)
Demographics
under30 0.0600 (1.12)
-0.1551† (-1.95)
0.3578* (2.21)
0.4848 (1.32)
over60 -0.1114 (-1.40)
-0.3898* (-2.05)
0.0241 (0.09)
0.0299 (0.04)
married 0.0824† (1.90)
-0.0774 (-1.03)
0.0457 (0.26)
0.0681 (0.07)
selfemprate -0.2051* (-3.04)
-0.5607* (-3.38)
0.1476 (0.60)
1.3190 (1.22)
Year Dummy
y00 -1.1269* (-2.74)
-3.1731* (-3.81)
0.6987† (1.65)
3.4134 (0.65)
y01 -0.1016 (-0.19)
-3.3192* (-2.63)
2.1487* (3.00)
8.1022 (0.76)
y02 -0.0456 (-0.06)
-5.5714* (-2.68)
3.6002* (3.40)
14.7776 (0.80)
y03 -0.1762 (-0.17)
-7.2127* (-2.37)
5.5308* (4.15)
18.4450 (0.82)
y04 1.1462 (0.82)
-7.7276† (-1.83)
9.4846* (4.53)
26.3626 (0.89)
R-squared 0.8668 0.5985 0.9456 (within) 0.8454 (within) Hypothesis 1
(eself = epaid = 0) Prob > F = 0.0018
Prob > F = 0.0000
Prob > F = 0.6898
Prob > chi2 = 0.6035
Hypothesis 2 (eself = epaid)
Prob > F = 0.0233
Prob > F = 0.0000
Prob > F = 0.7494
Prob > chi2 = 0.3210
Hypothesis 3 (epaid = ppaid)
Prob > F = 0.0654
Prob > F = 0.0000
Prob > F = 0.4283
Prob > chi2 = 0.5041
Note: t-statistics in parenthesis; * Statistically significant at the 5% level; † Statistically significant at the 10% level.

47
Chapter 6. Conclusion
This study examined the effect of electronic filing on income reporting compliance,
using panel data over six years aggregated at state-level. The regression results suggest that it
is complicated to evaluate the IRS’s policy to encourage taxpayers to e-file. While the effect
of electronic filing by self-preparers on compliance is positive, the effect of electronic filing
by paid-preparers is negative. In other words, electronic filing might help taxpayers to
decrease calculation mistakes, but might be used by tax preparers to underreport income.
Therefore, the IRS should encourage at least taxpayers who file their tax returns by
themselves to file electronically. In addition, considering that the negative effect of electronic
filing by paid-preparers is relatively small and is not significant at 5% significance level,
noncompliance from the negative impact could be improved if the IRS carefully monitored
tax returns filed electronically by paid-preparers.
Unfortunately, the results in this study may be imprecise due to the limitations of the
data. More years of data and more micro-level, or individual taxpayer level data would help in
estimating the effect of electronic filing on compliance more precisely, leading to more
effective policy evaluation and thus improving compliance. Further, access to the data
necessary for estimating filing compliance would help to clarify the overall effect of
electronic filing on compliance.
48
References
Allingham, M.G., & Sandmo, A. (1972). Income tax evasion: a theoretical analysis. Journal
of Public Economics 1: 323-338.
Alm, J., Jackson, B. & Mckee, M. (1992). Estimating the determinants of taxpayer
compliance with experimental data. National Tax Journal, 45 (1): 107-114.
Alm, J., McClelland, G. & Schulze, W. (1992). Why do people pay taxes? Journal of Public
Economics 48: 21-38.
Andreoni, J., Erard, B. & Feinstein, J. (1998). Tax compliance. Journal of Economic
Literature, 36 (June): 818-860.
Beron, K.J., Tauchen, H.V. & Witte, A.D. (1992). The effect of audits and socioeconomic
variables on compliance. In J. Slemrod (Ed.), Why People Pay Taxes: Tax
Compliance and Enforcement (pp. 67-89). The University of Michigan Press, Ann
Arbor.
Bureau of Economic Analysis (2005). State Personal Income – 2004 methodology. October,
2005.
Dubin, J. & Wilde, L. (1988). An empirical analysis of federal income tax auditing and
compliance. National Tax Journal, 41(1): 61-74.
Dubin, J., Graetz, M. & Wilde, L. (1990). The effect of audit rates on the federal individual
income tax, 1977-1986. National Tax Journal 43: 395-409.

49
Dubin, J., Graetz, M. and Wilde, L. (1992). The demand for tax return preparation services.
Review of Economics and Statistics, 74: 75-82.
Dubin, J. & Udell, M. (2001). Tax Return Preparers and Tax Evasion. unpublished.
Erard, B. (1993). “Taxation with representation,” Journal of Public Economics, 52: 163-197.
Internal Revenue Service (2003). 2003 Form 1040 – Instructions.
Internal Revenue Service (2004a). IRS strategic plan, 2005-2009.
Internal Revenue Service (2004b). IRS Data Book: 2004.
Klepper, S., Mazur, M. & Nagin, D. (1991). Expert intermediaries and legal compliance: the
case of tax preparers. Journal of Law and Economics, 34: 205-299.
Kopczuk. W. & Pop-Eleches, C. (November 2005). Electronic filing, tax preparers, and
participation in the earned income tax credit. NBER Working Paper No. 11768.
Ledbetter, M. A. (2005). Comparison of BEA estimates of Personal Income and IRS estimates
of Adjusted Gross Income. Survey of Current Business, November 2005: 30-35.
Parker, R.P. (1984). Improved adjustments for misreporting of tax return information used to
estimate the national income and product accounts, 1977. Survey of Current
Business, June 1984: 17-25.
Plumley, A. (1996). The determinants of individual income tax compliance. Internal Revenue
Service, Publication 1916 (Rev. 11-96).

50
Plumley, A. (2002). The impact of the IRS on voluntary tax compliance: preliminary
empirical results. Prepared for National Tax Association, 95th Annual Conference on
Taxation, November, 2002.