An Analysis of Ground-Flight Loads Measured on the ...
130
DOTIFMAR-95/82 Office of Aviation Research Washington, D.C. 20591 An Analysis of Ground-Flight Loads Measured on the Instrumented B-727 N40 October 1995 Final Report This document is available to the U.S. public through the National Technical Information Service, Springfield, Virginia 22161. . U.S. Department of Transportation Federal Aviation Administration
-
Upload
khangminh22 -
Category
Documents
-
view
0 -
download
0
Transcript of An Analysis of Ground-Flight Loads Measured on the ...
DOTIFMAR-95/82
Office of Aviation Research Washington, D.C. 20591
An Analysis of Ground-Flight Loads Measured on the Instrumented B-727 N40
October 1995
Final Report
This document is available to the U.S. public through the National Technical Information Service, Springfield, Virginia 22161. .
U.S. Department of Transportation Federal Aviation Administration
NOTICE
This document is disseminated under the sponsorship of the U.S. Department of Transportation in the interest of information exchange. The United States Government assumes no liability for the contents or use thereof. The United States Government does not endorse products or manufacturers. Trade or manufacturer's names appear herein solely because they are considered essential to the objective of this report.
Technical Report Documentation Page
DOT/FAA/AR-95/02
n. Keywords
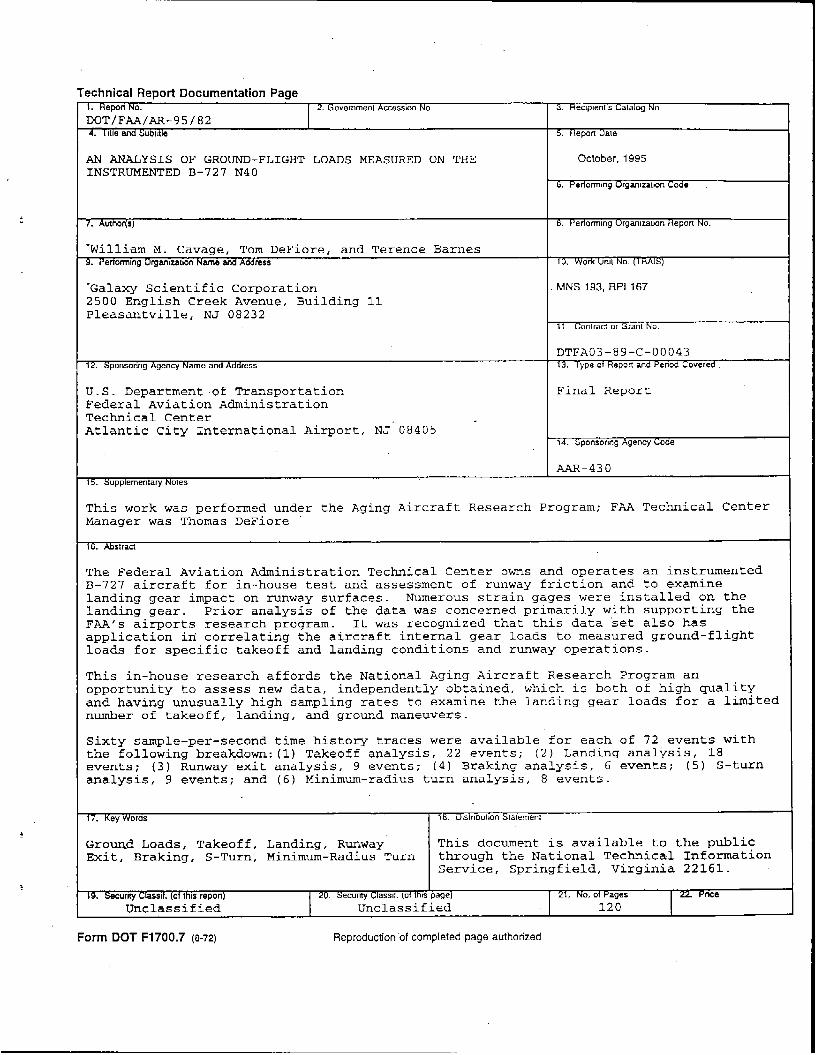
AN ANALYSIS OF GROUND-FLIGHT LOADS MEASURED ON THE INSTRUMENTED B - 7 2 7 N40
18. DiSlriDWOn Slalernent
7. Author(s)
Ground Loads, Takeoff, Landing, Runway Exit, Braking, S-Turn, Minimum-Radius Turn
'William M. Cavage, Tom DeFiore, and Terence Barnes 9. Perlorming Organization Name arid Add ress
*Galaxy Scientific Corporation 2500 English Creek Avenue, Building 11 Pleasantville, NJ 08232
This document is available to the public through the National Technical Information Service, Springfield, Virginia 22161.
12. Sponsoring Agency Name and Address
79. Securrty Classif. (of this repon) 20. Security Classif. (of this page) Unclassified Unclassified
U.S. Department'of Transportation Federal Aviation Administration Technical Center Atlantic City International Airport, NJ' 08405
21. No. of Pages 22. Pnce 120
15. Supplementary Notes
3. Hectpienl's Cala lq No.
'5. Repon Dare
October, 1995
6. Performing Vrganization Code
2. Performing Vrganizatlon Repon No.
70. Work Unit No. ( I HAlg
MNS 193. RPI 167
11. Contract or Grant No.
DTFA03-89-C-00043 13. Type ot Repon and Penoa Covered
Final Report
14. Sponsoring Agency Code
AAP-430
This work was performed under the Aging Aircraft Research Program; FAA Technical Center Manager was Thomas DeFiore
16. Abstract
The Federal Aviation Administration Technical Center owns and operates an instrumented B-727 aircraft for in-house test and assessment of runway friction and to examine landing gear impact on runway surfaces. Numerous strain gages were installed on the landing gear. Prior analysis of the data was concerned primarily with supporting the FAA's airports research program. It was recognized that this data 'set also has application in correlating the aircraft internal gear loads to measured ground-flight loads for specific takeoff and landing conditions and runway operations.
This in-house research affords the National Aging Aircraft Research Program an opportunity to assess new data, independently obtained, which is both of high quality and having unusually high sampling rates to examine the landing gear loads f o r a limited number of takeoff, landing, and ground maneuvers.
Sixty sample-per-second time history traces were available for each of 72 events with the following breakdown:(l) Takeoff analysis, 22 events; ( 2 ) Landing analysis, 18 events; ( 3 ) Runway exit analysis, 9 events; ( 4 ) Braking analysis, 6 events; (5) S-turn analysis, 9 events; and (6) Minimum-radius turn analysis, 8 events.
Form DOT F1700.7 (8-72) Reproduction of completed page authotized

TABLE OF CONTENTS
EXECUTIVE SUMhMRY
1. INTRODUCTION
1.1. Background 1.2. Scope
2. DATA ACQUISEION AND REDUCTION
2.1. Data Channels 2.2. Data Acquisition System and Data Reduction 2.3. Data Filtering
3. ANALYSIS
3.1. 3.2. 3.3. 3.4. 3.5. 3.6. 3.7.
General Analysis Techniques Takeoff Data Analysis Landing Data Analysis Runway Exit Data Analysis Braking Data Analysis S-Turn Data Analysis Minimum-Radius Turn Analysis
4. RlESULTS
4.1. Takeoffs 4.2. Landings 4.3. Runway Exits 4.4. Braking 4.5. S-Turns 4.6. Minimum-Radius Turns
5. CONCLUSIONS AND RECOMMENDATIONS
APPENDICES A - Listing of Tests B - Force Calibration Procedure C - Listing of Data Channels D - Data Reduction Software - Program Listing E - Axle Differential Load Analysis
Page ix
1
1 1
2
2 2 3
4
9
9 9 10 11 12 13
15
... 111
LIST OF ILLUSTRATIONS
Figure Page
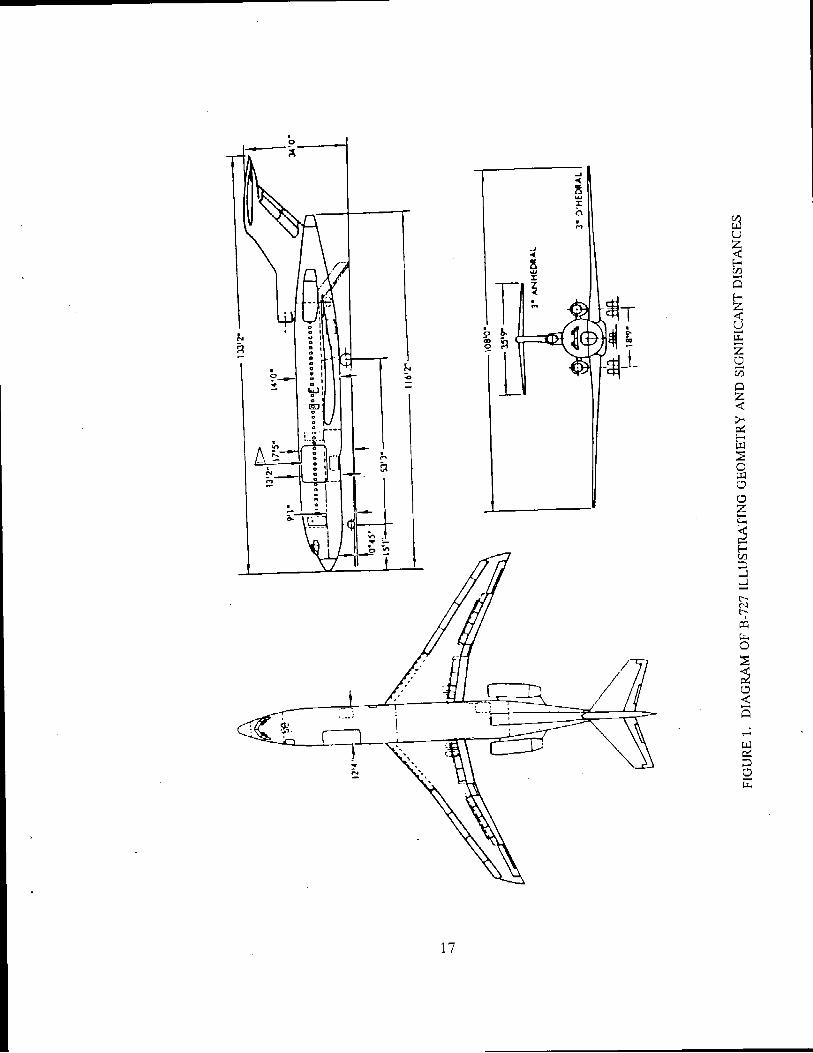
1. Diagram of B-727 Illustrating Geometry and Significant Distances
2.
3. Photo of Distance Sensor Mounted on the Nose Gear of the B-727 N40
17
18
18
19
19
Photo of the B-727 N40 Taxiing to Perform a Maneuver
4. Illustration of Strain Gage Locations on the B-727 N40 Landing Gear
5. Photo of Landing Gear Calibration Illustrating the Use of the Load Cell Platform
6. Top Diagram of Metraplex Hybrid High-speed Data Acquisition System
7. Example to Illustrate Effect of the Filter; F, = 30 Hz
8. Example to Illustrate Effect of the Filter; F, = 5 Hz
9. Illustration of Specific Takeoff Parameters
10. Illustration of Specific Landing Parameters
1 1. Illustration of Specific Runway Exit Parameters
12. Illustration of Specific Braking Parameters
13. Illustration of Specific Runway S-Turn Parameters
14. Illustration of Specific Minimum-Radius Turn Parameters
15. Multiple Time Trace Data Plot of a Typical Takeoff Event
16. Multiple Time Trace Data Plot of a Typical Takeoff Event
17. Pitch Angle and Pitch Rate Data of Two Typical Takeoff Events (a.) TST63006 and (b.) TSTll408
18. Histogram of Takeoff Longitudinal Acceleration Specific Event Values
19. Histogram of Takeoff Ground Speed Specific Event Values
20
21
21
22
22
23
23
24
24
25
26
27
29
29
iv
Figure
20. Hi: m of Adjusted Takeoff Speed Specific Event Valu
21. Histogram of Takeoff Distance Specific Event Values
S
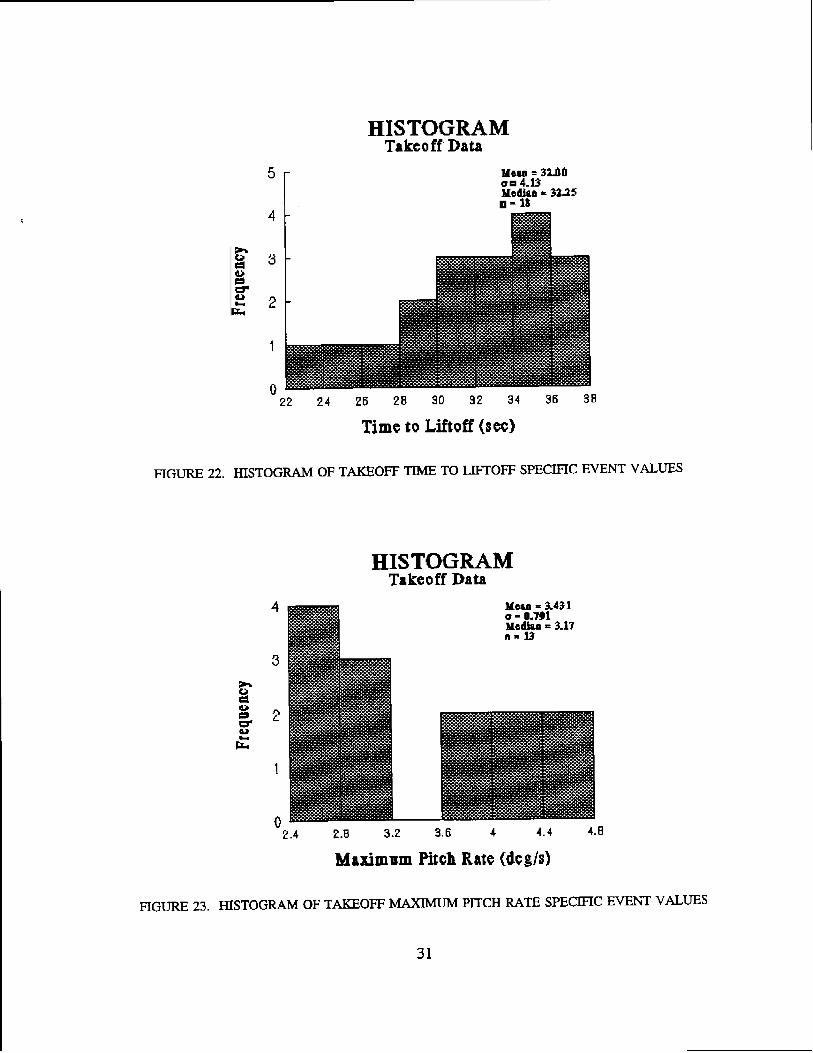
22. Histogram of Takeoff Time to Liftoff Specific Event Values
23. Histogram of Takeoff Maximum Pitch Rate Specific Event Values
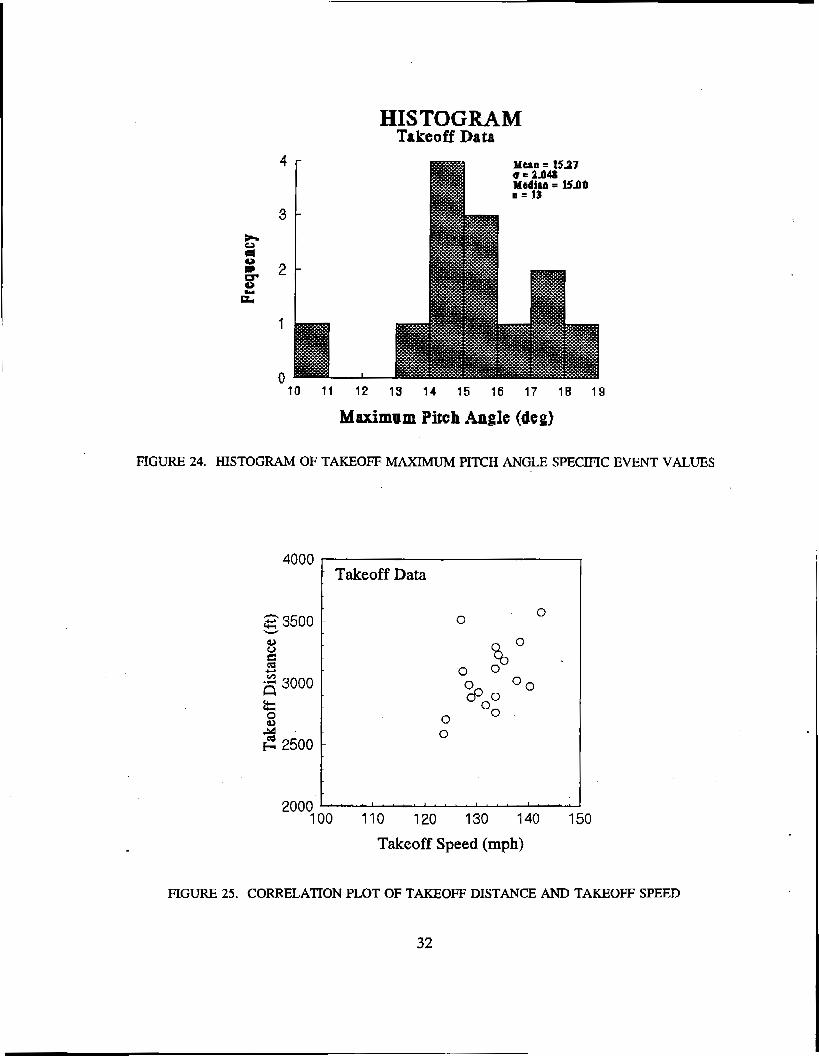
24. Histogram of Takeoff Maximum Pitch Angle Specific Event Values
25. Correlation Plot of Takeoff Distance and Takeoff Speed
26. Correlation Plot of Takeoff Distance and Aircraft Weight
27. Multiple Time Trace Data Plot of a Typical Landing Event
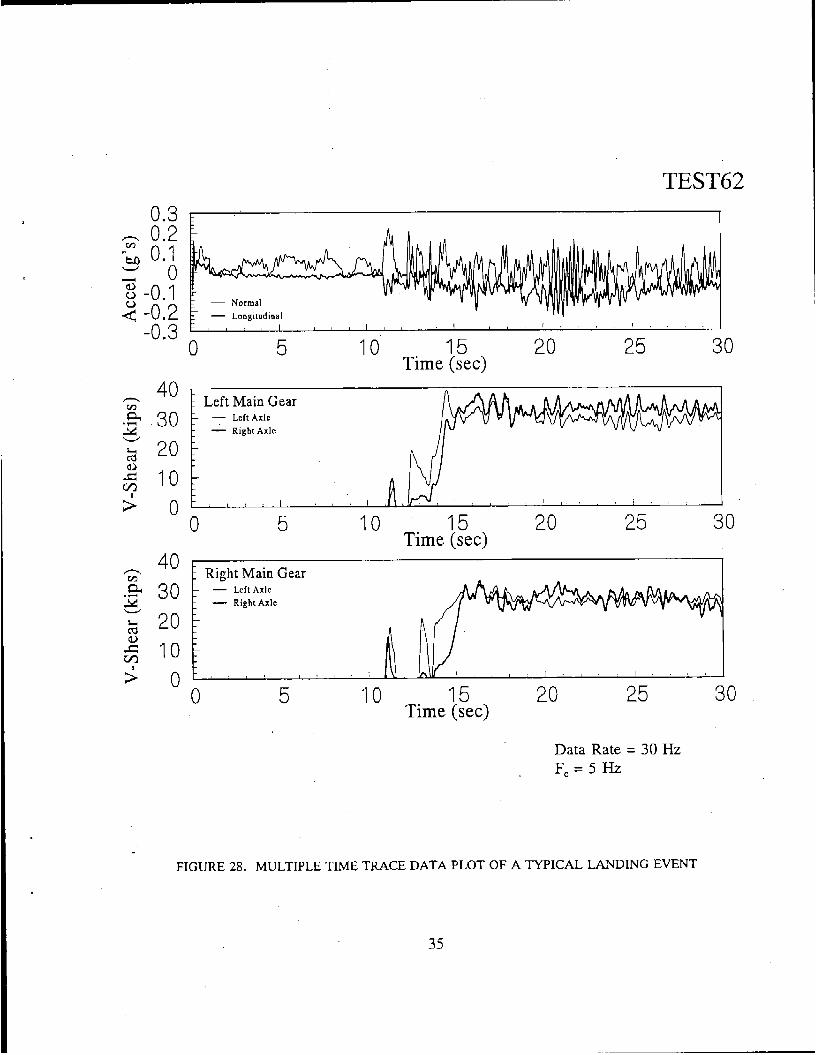
28. Multiple Time Trace Data Plot of a Typical Landing Event
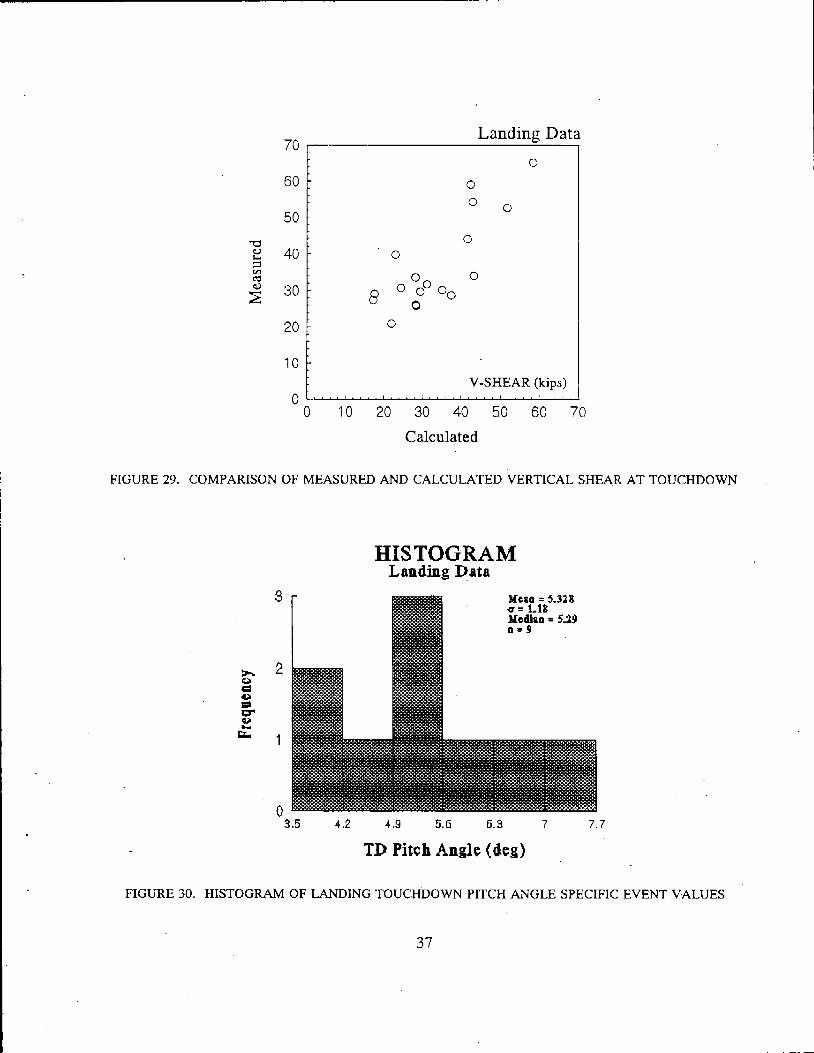
29. Comparison of Measured and Calculated Touchdown Vertical Shear at Touchdown
30. Histogram of Landing Touchdown Pitch Angle Specific Event Values
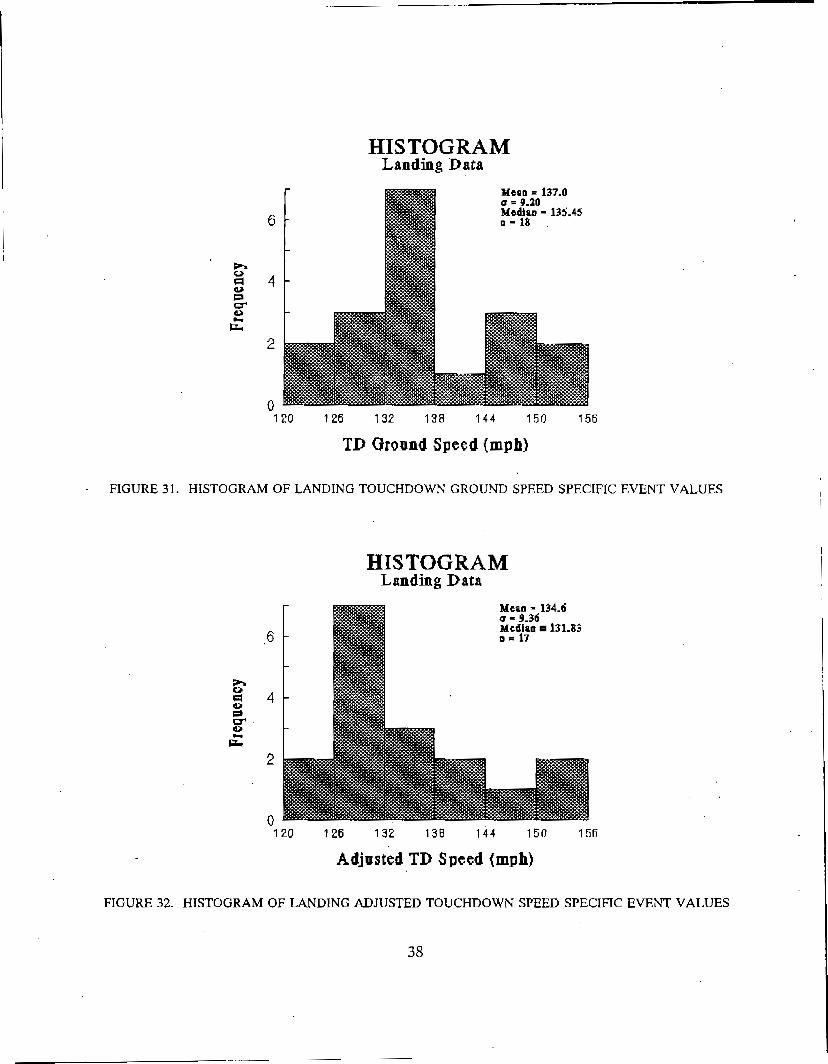
31. Histogram of Landing Touchdown Ground Speed Specific Event Values
'
32. Histogram of Landing Adjusted Touchdown Speed Specific Event Values
33. Histogram of Landing Normal Acceleration Specific Event Values
34. Histogram of Landing Touchdown Vertical Shear Specific Event Values
35. Correlation Plot of Pitch Angle and Aircraft Weight at Touchdown
36. Correlation Plot of Vertical Shear and Normal Acceleration at Touchdown
37. Multiple Time Trace Data Plot of a Typical Runway Exit at 40 Knots
38. Multiple Time Trace Data Plot of a Typical Runway Exit at 50 Knots
39. Multiple Time Trace Data Plot of a Typical Runway Exit at 60 Knots
Page
30
30
31
31
32
32
33
34
35
37
37
38
38
39
39
40
40
41
42
43
Figure
40. Comparison in Time of Side Force Coefficient and Lateral Acceleration for (a.) TST62904 and (b.) TST62907
4 1. Correlation in Time of Side Shear and Lateral Acceleration
42. Comparison of Measured and Calculated Average Lateral Acceleration
43. Comparison of Measured and Calculated Average Side Shear
44. Correlation Plot of Exit Ground Speed and Lateral Acceleration
45. Correlation Plot of Side Shear and Lateral Acceleration
46. Correlation Plot of Side Shear and Exit Ground Speed
47. Multiple Time Trace Data Plot of a Heavy Braking Event
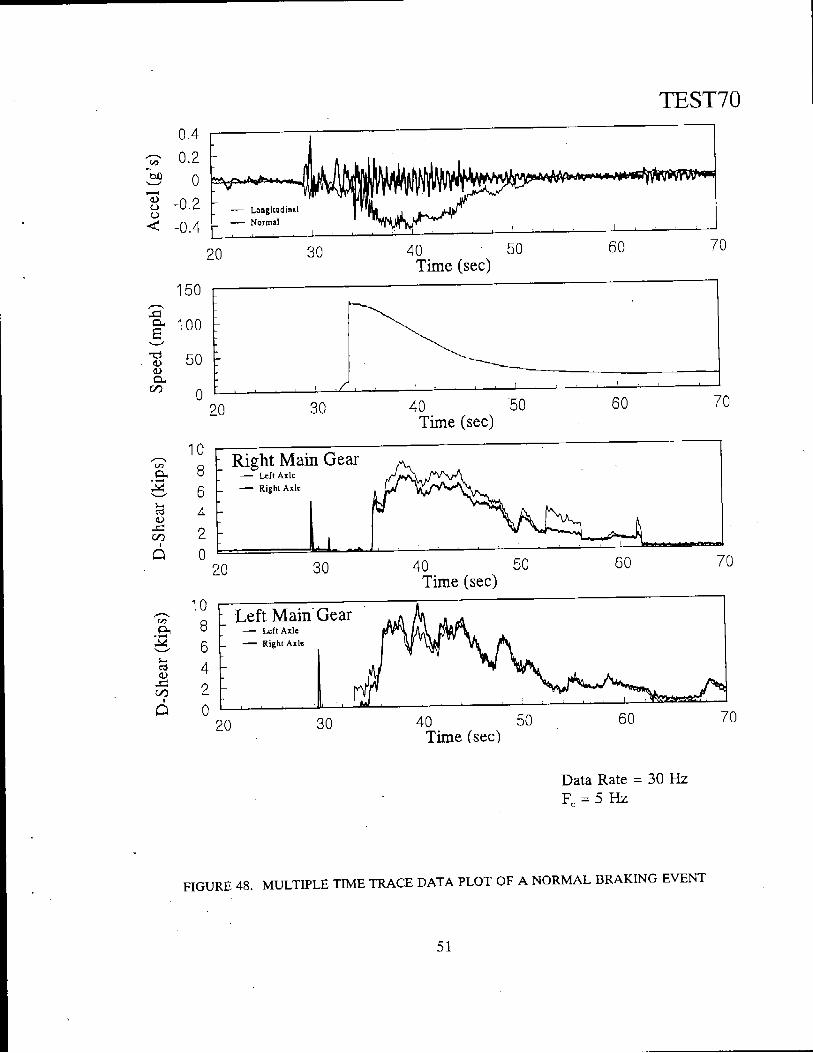
48. Multiple Time Trace Data Plot of a Normal Braking Event
49. Multiple Time Trace Data Plot of a Light Braking Event
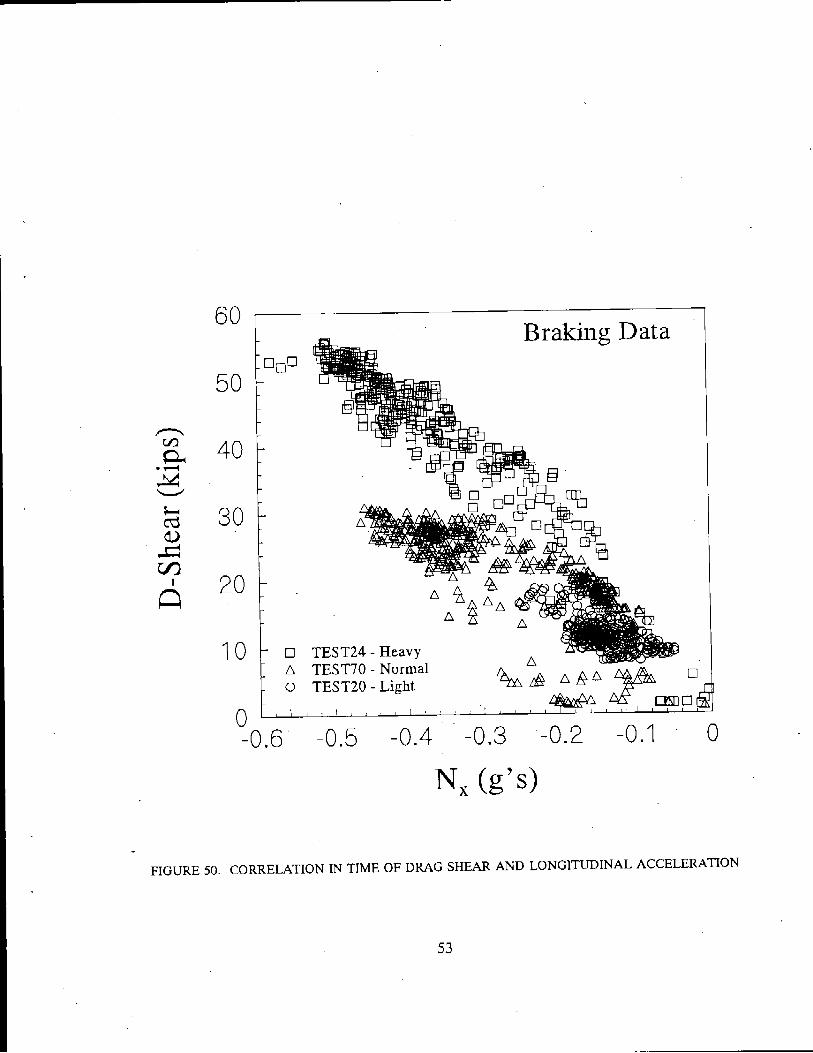
50. Correlation in Time of Drag Shear and Longitudinal Acceleration
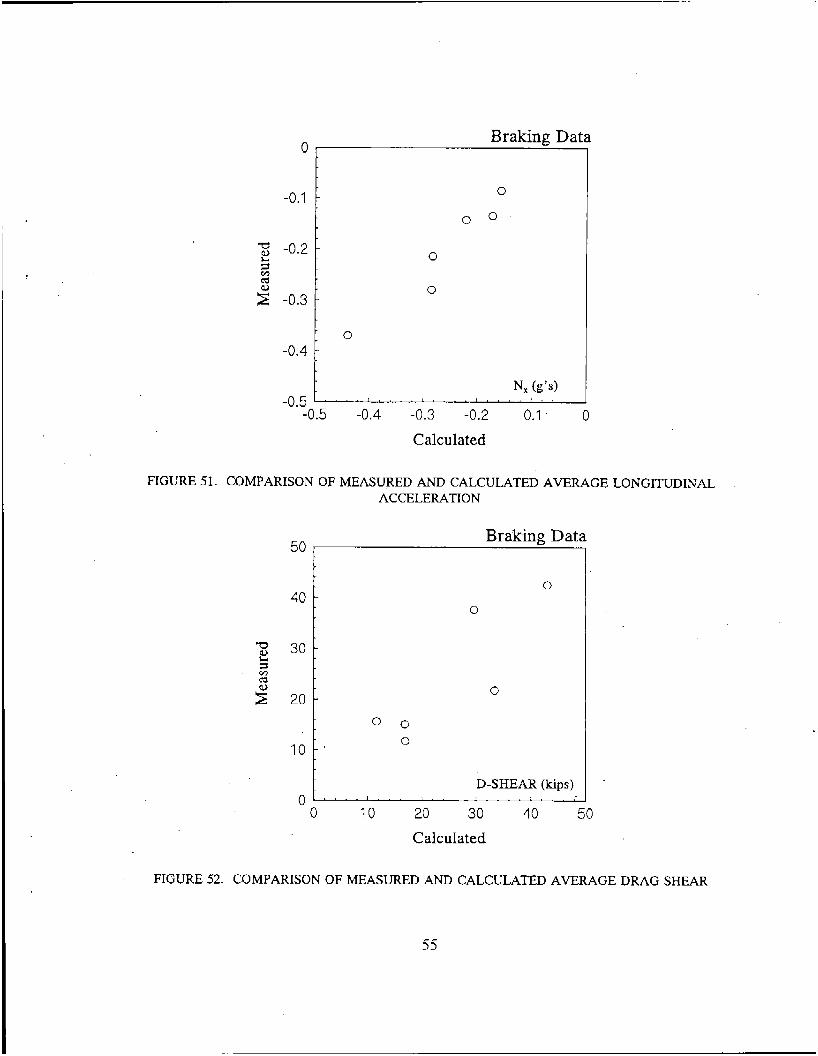
5 1. Comparison of Measured and Calculated Average Longitudinal Acceleration
52. Comparison of Measured and Calculated Average Drag Shear
53. Correlation Plot of Average Drag Shear and Longitudinal Acceleration
54. Multiple Time Trace Data Plot of a Typical S-Turn at 40 Knots
55. Multiple Time Trace Data Plot of a Typical S-Turn at 60 Knots
56. Multiple Time Trace Data Plot of a Typical S-Turn at 80 Knots
57. Comparison in Time of Side Force Coefficient and Lateral Accedation for (a.) TST7103 and @.) TST63008
58. -Side Shear and Axle Differential Load Plotted in Time for the Two Main Landing Gear; 40-Knot S-Turn
vi
Page
44
45
47
47
48
48
49
50
5 1
52
53
55
55
56
57
58
59
60
61 1
Figure
59. Side Shear and Axle Differential Load Plotted in Time for the Two Main Landing Geaq 6O-Knot S-Turn
60. Side Shear and Axle Differential Load Plotted in Time for the Two Main Landing Gear; 80-Knot $-Turn
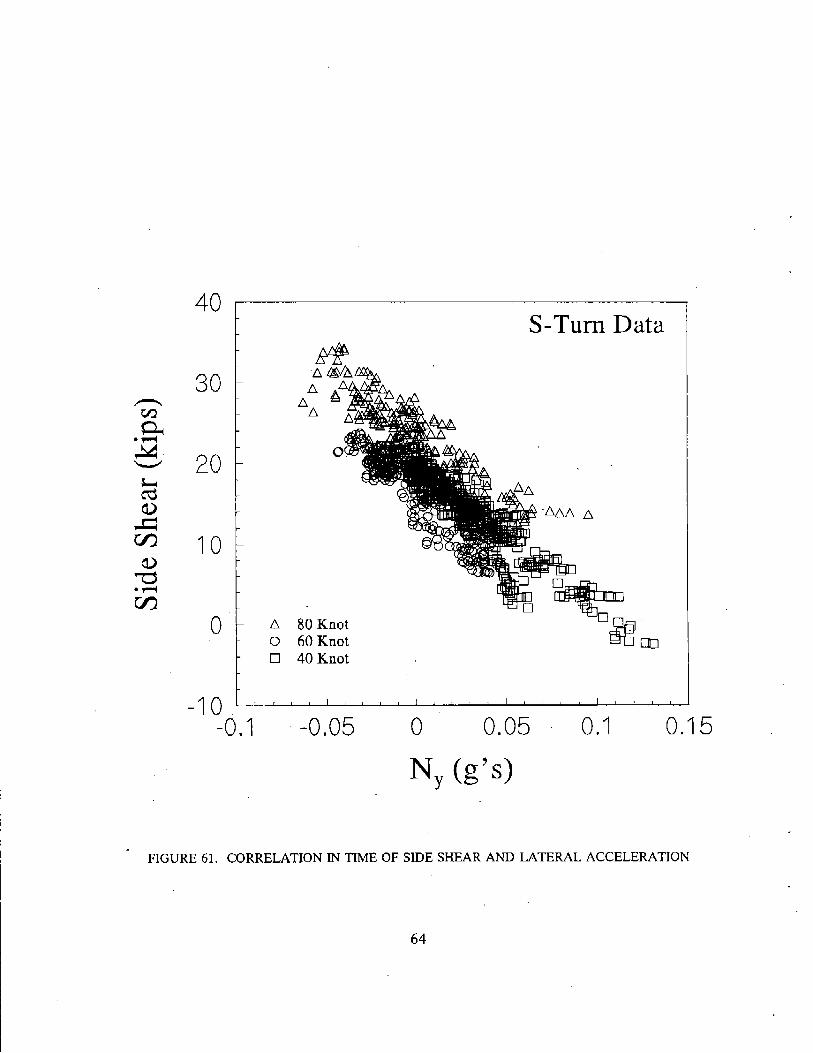
6 1. Correlation in Time of Side Shear and Lateral Acceleration
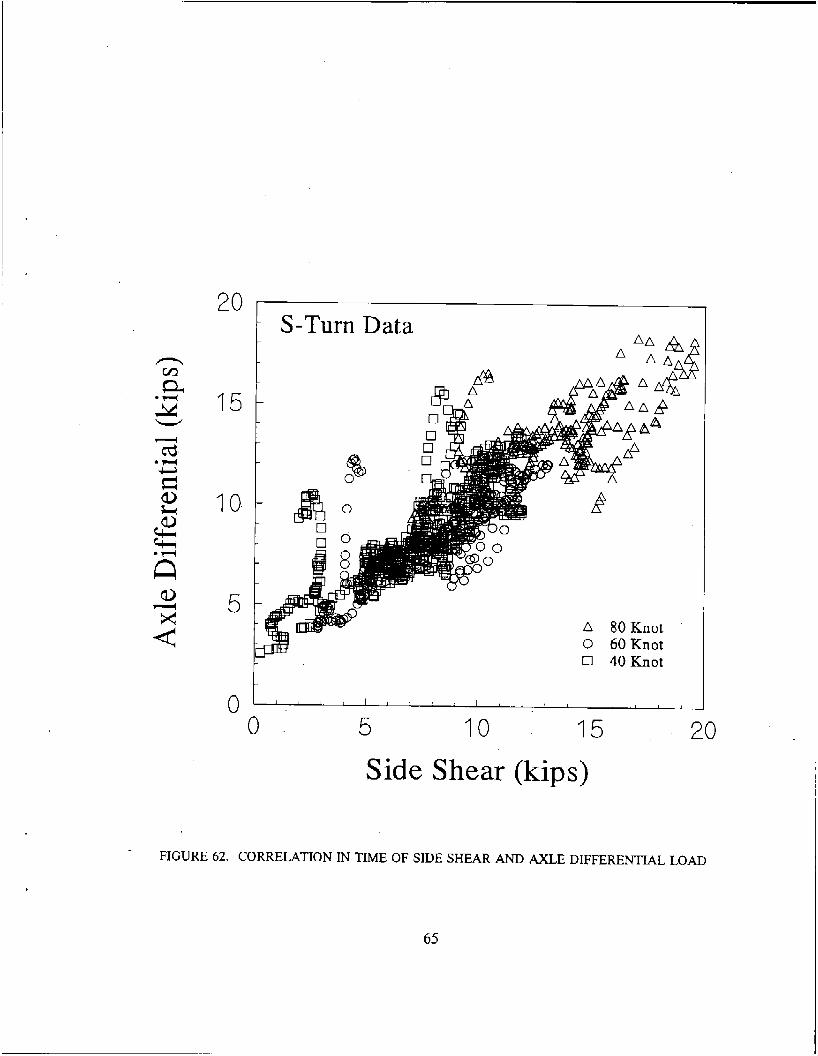
62. Correlation in Time of Side Shear and Axle Differential Load
63. Comparison of Measured and Calculated Average Side Shear
64. Correlation Plot of Side Shear and Lateral Acceleration
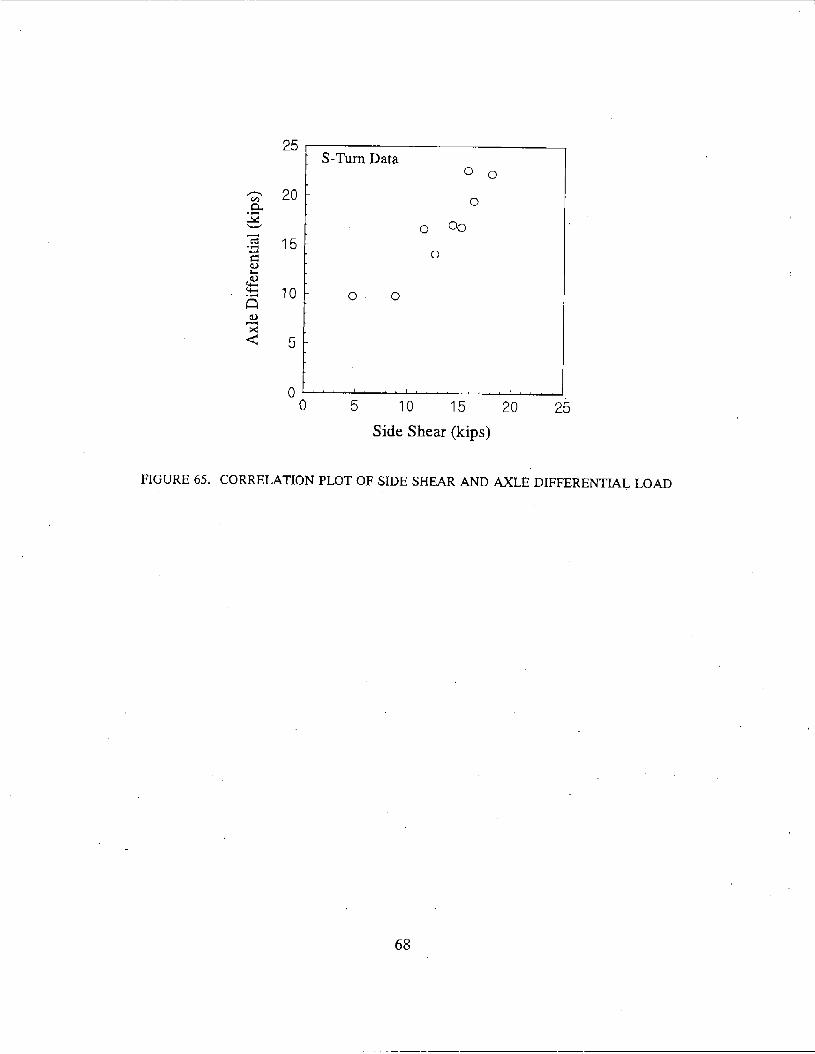
65. Correlation Plot of Side Shear and Axle Differential Load
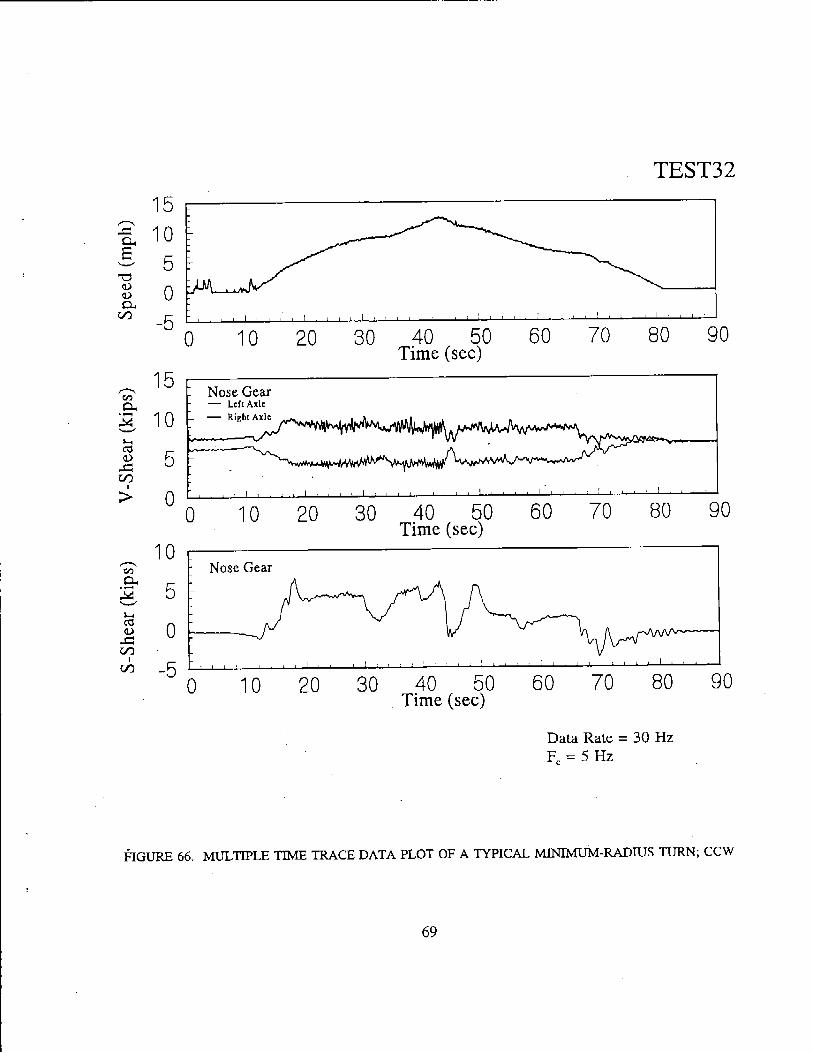
66. Multiple Time Trace Data Plot of a Typical Minimum-Radius Turn; CCW
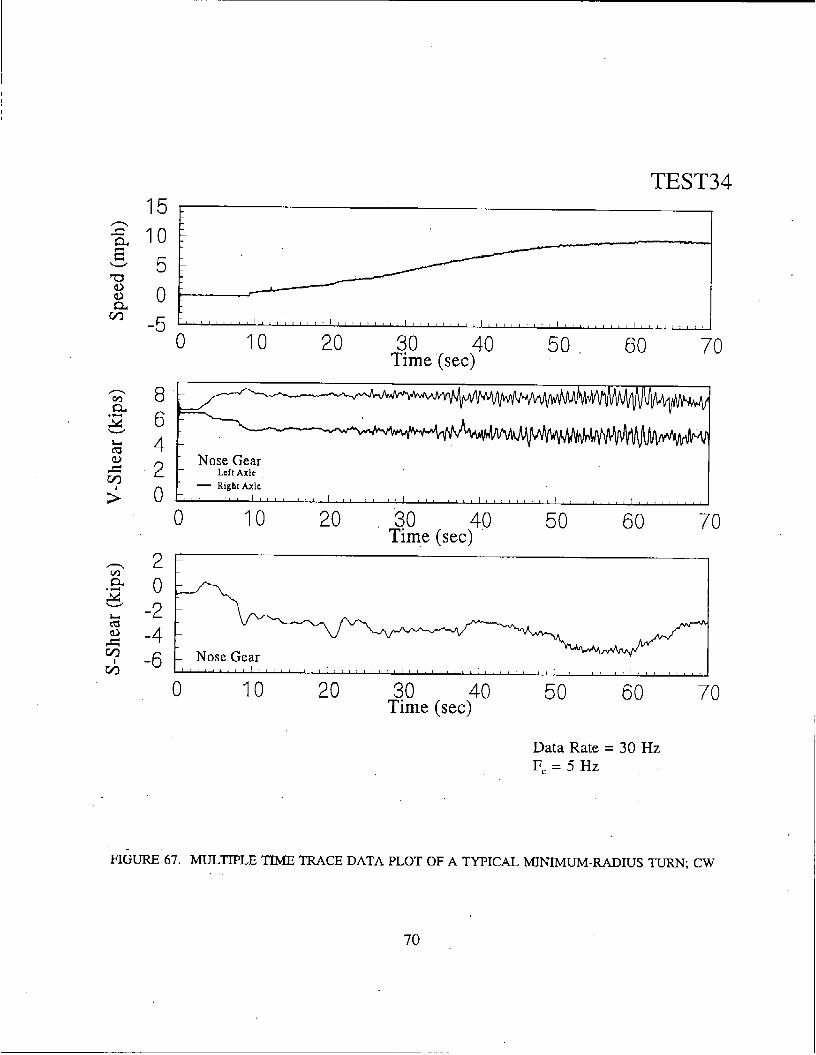
67. Multiple Time Trace Data Plot of a Typical Minimum-Radius Turn; CW
68. Photo of Nose Gear During Minimum-Radius Turn
69. Photo of Rubber Tire Tracks Deposited on Pavement
70. Comparison in Time of Side Shear and Axle Differential Load for (a.) TEST32 and @.) TEST34
71. Correlation in Time of Side Shear and Axle Differential Load
72. Correlation Plot of Nose Gear Average Side Shear and Axle Differential Load
Page
62
63
64
65
67
67
68
69
70
71
71
72
73
75
vii
LIST OF TABLES
Table
1. Table of Specific Event Parameters for the Takeoff Events
2. Table of Specific Event Parameters for the Landing Events
3. Table of Specific Event Parameters for the Runway Exit Events
4. Table of Specific Event Parameters for the Braking Events
5 . Table of Specific Event Parameters for the S-Turn Events
6. Table of Specific Event Parameters for the Minimum-Radius Turn Events
Page
28
36
46
54
66
74.
... V l l l
EXECUTIVE SUMMARY
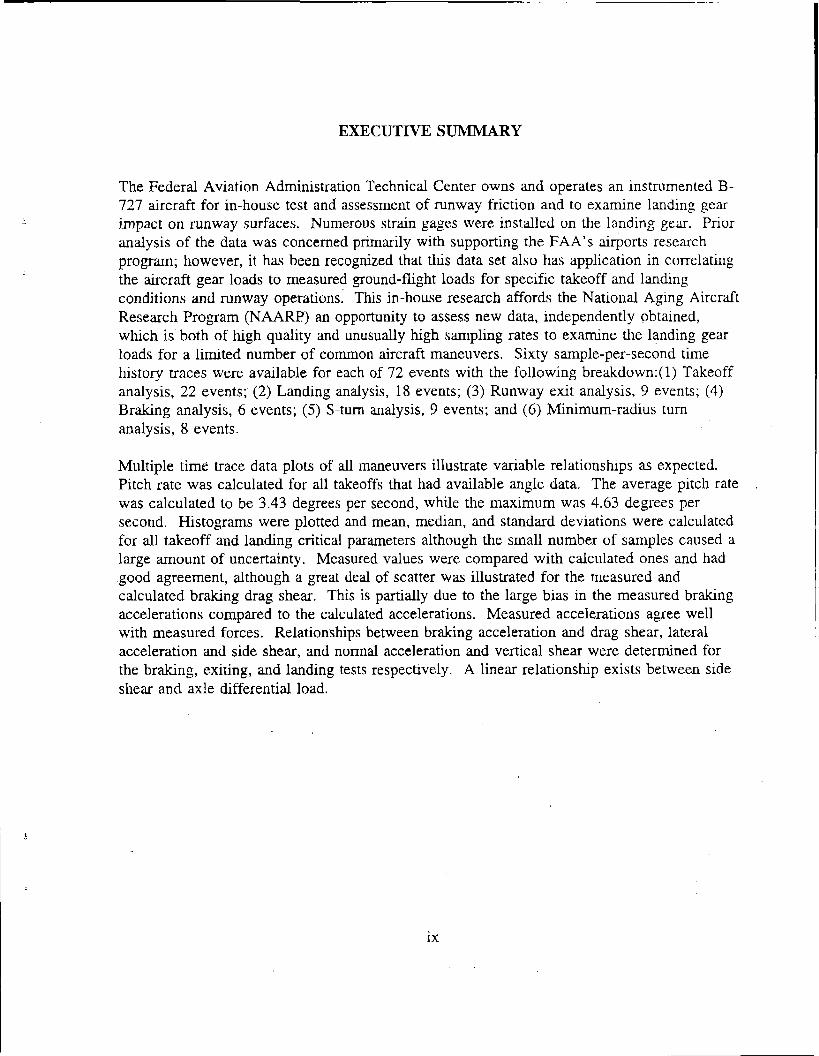
The Federal Aviation Administration Technical Center owns and operates an instrumented B- 727 aircraft for in-house test and assessment of runway friction and to examine landing gear impact on runway surfaces. Numerous strain gages were installed on the landing gear. Prior analysis of the data was concerned primarily with supporting the FAA’s airports research program; however, it has been recognized that thus data set also has application in correlating the aircraft gear loads to measured ground-flight loads for specific takeoff and landing conditions and runway operations. This in-house research affords the National Aging Aircraft Research Program (NAARP) an opportunity to assess new data, independently obtained, which is both of high quality and unusually high sampling rates to examine the landing gear loads for a limited number of common aircraft maneuvers. Sixty sample-per-second time history traces were available for each of 72 events with the following breakdown:( 1) Takeoff analysis, 22 events; (2) Landing analysis, 18 events; (3) Runway exit analysis, 9 events; (4) Braking analysis, 6 events; (5 ) S-turn analysis, 9 events; and (6) Minimum-radius turn analysis, 8 events.
Multiple time trace data plots of all maneuvers illustrate variable relationships as expected. Pitch rate was calculated for all takeoffs that had available angle data. The average pitch rate was calculated to be 3.43 degrees per second, while the maximum was 4.63 degrees per second. Histograms were plotted and mean, median, and standard deviations were calculated for all takeoff and landing critical parameters although the small number of samples caused a large amount of uncertainty. Measured values were compared with calculated ones and had good agreement, although a great deal of scatter was illustrated for the measured and calculated braking drag shear. This is partially due to the large bias in the measured braking accelerations compared to the calculated accelerations. Measured accelerations agree well with measured forces. Relationships between braking acceleration and drag shear, lateral acceleration and side shear, and normal acceleration and vertical shear were determined for the braking, exiting, and landing tests respectively. A linear relationship exists between side shear and axle differential load.
ix

1. INTRODUCTION.
1.1 Background.
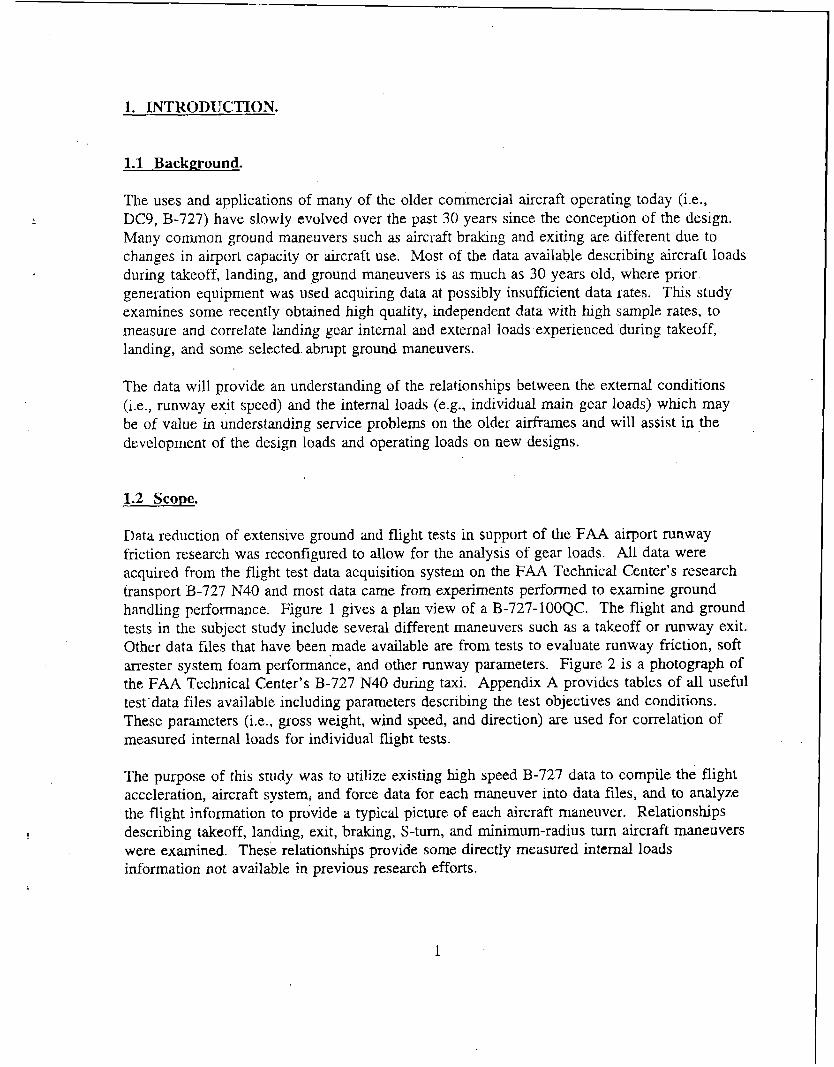
The uses and applications of many of the older commercial aircraft operating today (i.e., DC9, B-727) have slowly evolved over the past 30 years since the conception of the design. Many common ground maneuvers such as aircraft braking and exiting are different due to changes in airport capacity or aircraft use. Most of the data available describing aircraft loads during takeoff, landing, and ground maneuvers is as much as 30 years old, where prior generation equipment was used acquiring data at possibly insufficient data rates. This study examines some recently obtained high quality, independent data with high sample rates, to measure and correlate landing gear internal and external loads experienced during takeoff, landing, and some selected abrupt ground maneuvers.
The data will provide an understanding of the relationships between the external conditions (i.e., runway exit speed) and the internal loads (e.g., individual main gear loads) which may be of value in understanding service problems on the older airframes and will assist in the development of the design loads and operating loads on new designs.
1.2 Scope.
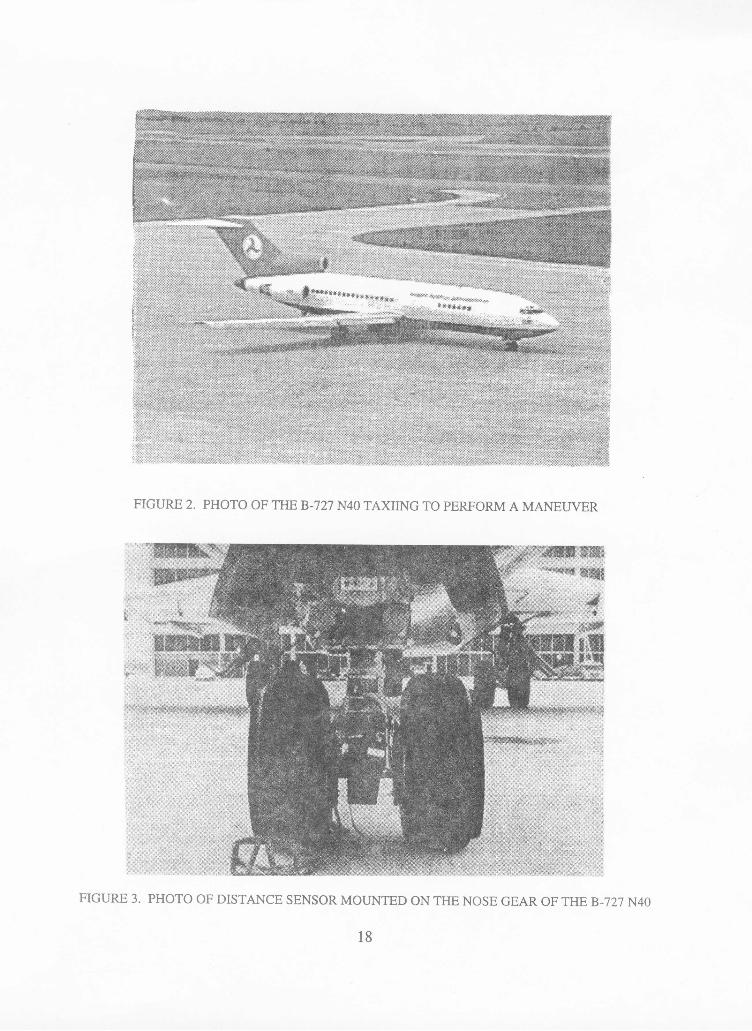
Data reduction of extensive ground and flight tests in support of the FAA airport runway friction research was reconfigured to allow for the analysis of gear loads. All data were acquired from the flight test data’acquisition system on the FAA Technical Center’s research transport B-727 N40 and most data came from experiments performed to examine ground handling performance. Figure 1 gives a plan view of a B-727-100QC. The flight and ground tests in the subject study include several different maneuvers such as a takeoff or runway exit. Other data files that have been made available are from tests to evaluate runway friction, soft arrester system foam performance, and other runway parameters. Figure 2 is a photograph of the FAA Technical Center’s B-727 N40 during taxi. Appendix A provides tables of all useful test -data files available including parameters describing the test objectives and conditions. These parameters ( i c , gross weight, wind speed, and direction) are used for correlation of measured internal loads for individual flight tests.
The purpose of this study was to utilize existing high speed B-727 data to compile the flight acceleration, aircraft system, and force data for each maneuver into data files, and to analyze the flight information to provide a typical picture of each aircraft maneuver. Relationships describing takeoff, landing, exit, braking, S-turn, and minimum-radius turn aircraft maneuvers were examined. These relationships provide some directly measured internal loads information not available in previous research efforts.
1
.. . ....
2. DATA ACQUISITION AND REDUCTION.
2.1 Data Channels.
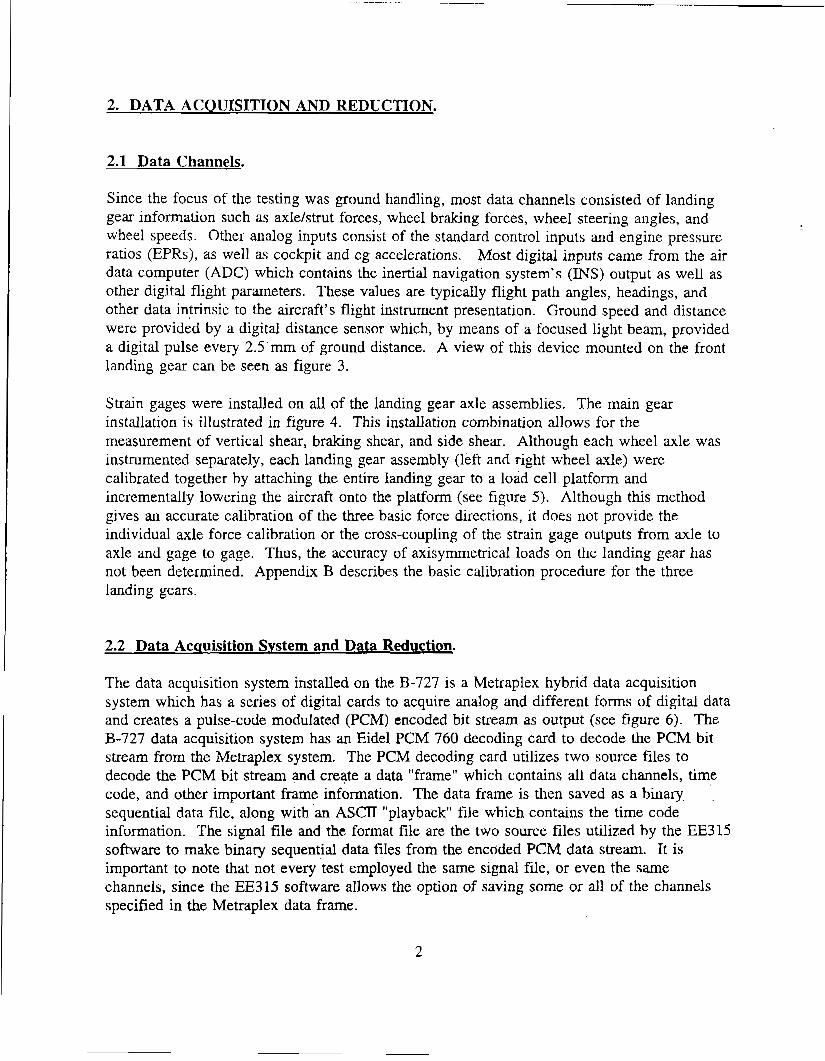
Since the focus of the testing was ground handling, most data channels consisted of landing gear information such as axlejstrut forces, wheel braking forces, wheel steering angles, and wheel speeds. Other analog inputs consist of the standard control inputs and engine pressure ratios (EPRs), as well as cockpit and cg accelerations. data computer (ADC) which contains the inertial navigation system's (INS) output as well as other digital flight parameters. These values are typically flight path angles, headings, and other data intrinsic to the aircraft's flight instrument presentation. Ground speed and distance were provided by a digital distance sensor which, by means of a focused light beam, provided a digital pulse every 2 . 5 . m of ground distance. A view of this device mounted on the front landing gear can be seen as figure 3.
Most digital inputs came from the air
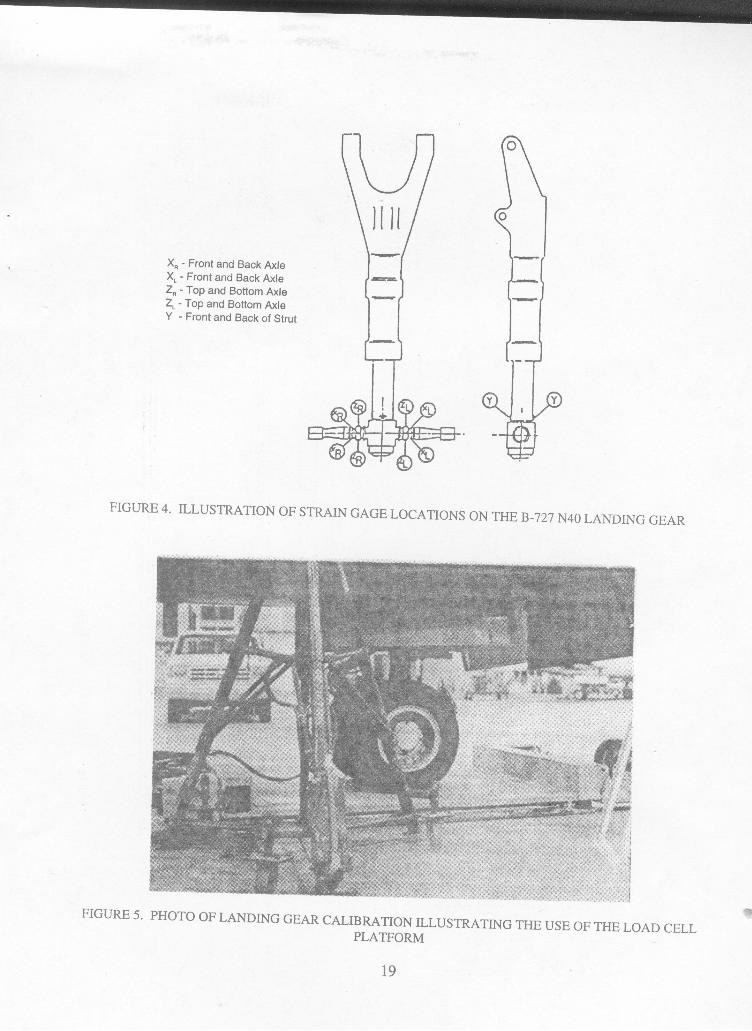
Strain gages were installed on all of the landing gear axle assemblies. The main gear installation is illustrated in figure 4. This installation combination allows for the measurement of vertical shear, braking shear, and side shear. Although each wheel axle was instrumented separately, each landing gear assembly (left and right wheel axle) were calibrated together by attaching the entire landing gear to a load cell platform and incrementally lowering the aircraft onto the platform (see figure 5) . Although this method gives an accurate calibration of the three basic force directions, it does not provide the individual axle force calibration or the cross-coupling of the strain gage outputs from axle to axle and gage to gage. Thus, the accuracy of axisymmetrical loads on the landing gear has not been determined. Appendix B describes the basic calibration procedure for the three landing gears.
2.2 Data Acquisition System and Data Reduction.
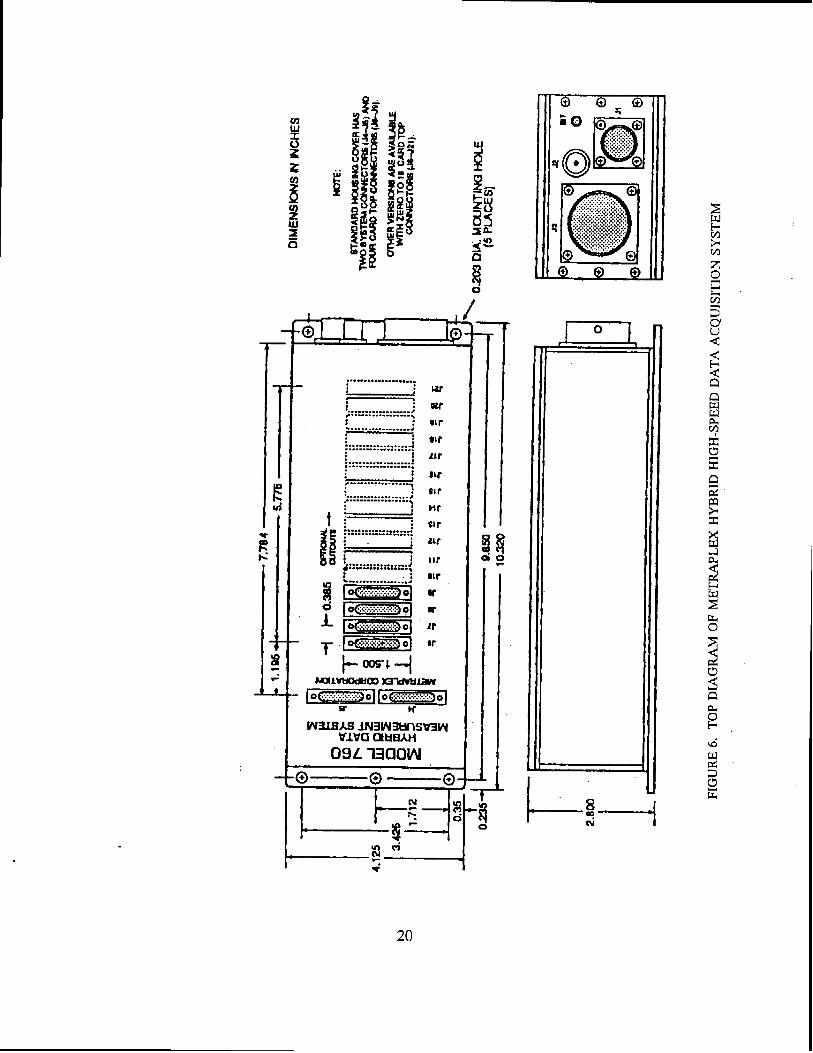
The data acquisition system installed on the B-727 is a Metraplex hybrid data acquisition system which has a series of digital cards to acquire analog and different forms of digital data and creates a pulse-code modulated (PCM) encoded bit stream as output (see figure 6). The B-727 data acquisition system has an Eidel PCM 760 decoding card to decode the PCM bit stream from the Metraplex system. The PCM decoding card utilizes two source files to decode the PCM bit stream and create a data "frame" which contains all data channels, time code, and other important frame information. The data frame is then saved as a binary sequential data file, along with an ASCII "playbackt file which contains the time code information. The signal file and the format file are the two source files utilized by the EE315 software to make binary sequential data files from the encoded PCM data stream. It is important to note that not every test employed the same signal file, or even the same channels, since the EE315 software allows the option of saving some or all of the channels specified in the Metraplex data frame.
2
In order to obtain an ASCII data file with a valid time code and data columns from the Eidel binary sequential file system, a software package was developed to allow the user to convert specified data from the file. This software is also used to.apply calibration factors and formulas, add or average columns, and filter the data by frequency. This program was written in QBasic and allows the user to obtain any data channels desired from the data frame for any specified time frame, as well as vary the output data rate. Because many data channels were redundant and unnecessary for this study, not all data channels were converted to ASCII for analysis. Appendix C gives a list of all data channels converted to ASCII with units and range. A listing of this program can be seen in appendix D.
2.3 Data Filtering.
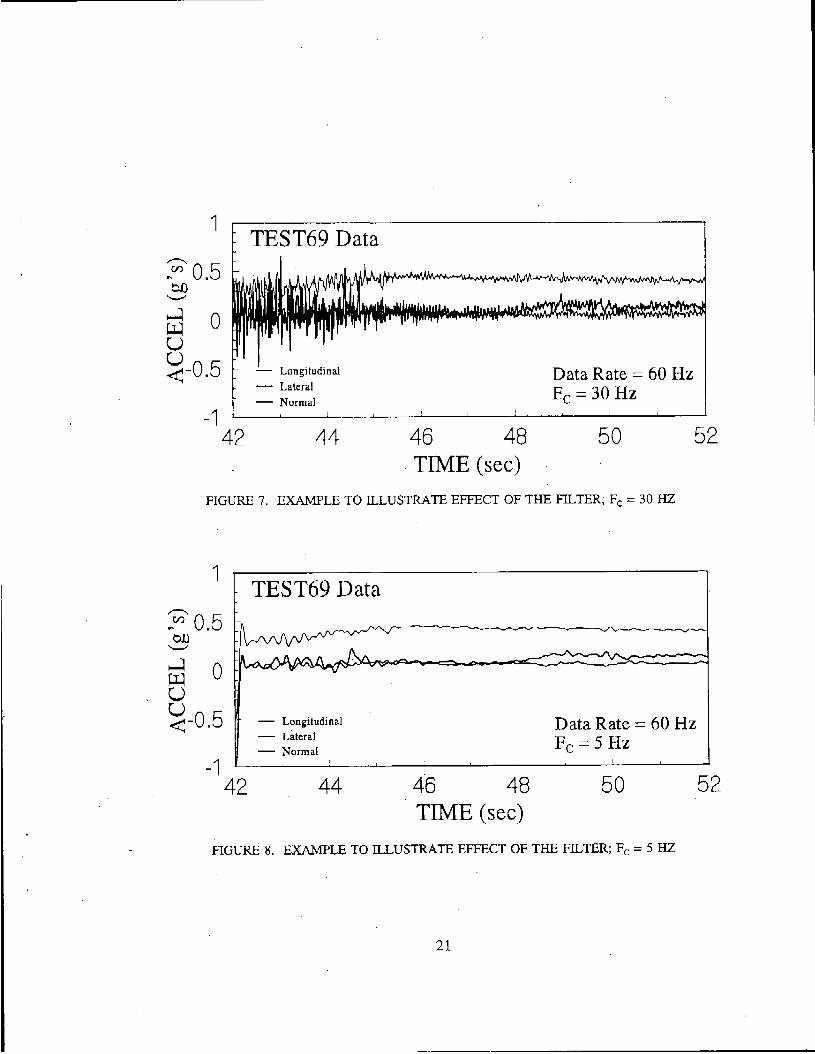
As is customary with most analog force related instrumentation measurements, the data was filtered in two stages. All strain gage signals are first passed through a signal conditioner, which amplifies and then low-pass filters the data for antialiasing. Most other analog signals contain some internal amplification and filtering. The analog and digital signals are then sent to the data acquisition system and stored. When the binary sequential data is processed and made into ASCII files, a fourth-order Butterworth IIR digital filter is applied to reduce high frequency noise, and to antialias signals that are stored at a lower sample rate in the ASCII files than in the original binary files. The effect of the filter on ten seconds of data can be seen in figures 7 and 8.
3
3. ANALYSIS.
3.1 General Analysis Techniques.
To reduce the data, the raw 60 Hz data were digitally filtered at 5 Hz and decimated by 2 (every second point eliminated). The cutoff frequency (F,) was chosen to allow for the lowest possible cutoff frequency that is significantly greater then the aircraft body natural frequency (3.5 Hz) and the data were decimated to allow for easier file management. This gives a reduced data rate of 30 Hz filtered at 5 Hz. The data were analyzed both in time history and for specific event values such as peak aircraft longitudinal acceleration which take place at or over some period of time.
For analysis in time, certain time trace data were correlated to verify the validity of the data and also to illustrate certain key parameter relationships. Correlation in time of two parameters was achieved by plotting each parameter on a separate axis for a selected time period. Relationships between the two parameters could then be observed and analyzed. When relating two parameters in time, they were related over a specific time period pertinent to the maneuver, and only data obtained during this specific time period were considered for correlation. All leading and lagging data points were "trimmed" to reduce data scatter. These special trimmed files also provided a basis for determining specific event values, which were often an average value over a small interval of time during the event.
For the analysis of specific event parameters, each aircraft maneuver specific event value was determined and tabulated. Each specific event parameter was chosen for its relevance to each maneuver (i.e., landing normal acceleration at touchdown). These values were tabulated for evaluation and possible correlation between tests, whereas each flight segment had a prime focus for analysis. Statistical analysis of these critical values was also performed for the takeoff and landing events, where a histogram of each specific event parameter was plotted and mean, median, and standard deviations were calculated for each histogram using CoStat, a commercial software package. Specific event parameters were also compared with calculated vaiues to gage the accuracy of the data and to verify the means by which acceleration is translated to force. Specific event values were also correlated with each other to determine possible relationships, although correlation of these values was difficult due to the limited amount of test events for each maneuver. However, even with this limited data, some significant relationships were determined.
3.2 Takeoff Data Analysis.
The primary focus of the takeoff data analysis was on takeoff velocity and rotation data. Some takeoff tests did not have aircraft flight path angles available for analysis, thus reducing the number of flight events available for analysis. The key parameters tabulated for each
4
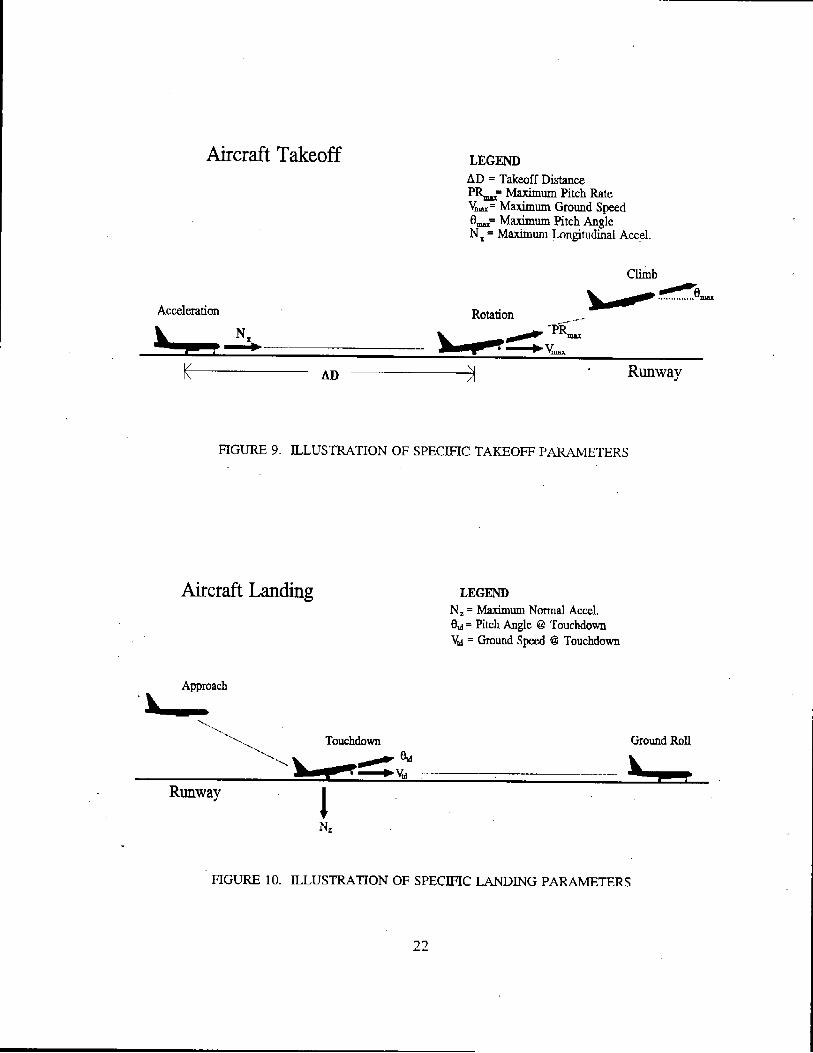
takeoff test other than the basic test information were peak longitudinal acceleration (NJ, maximurn ground speed (V,,,), runway distance used (AD), time to liftoff (td, maximum pitch angle (em,,), and maximum pitch rate (PL=). The maximum takeoff velocity adjusted for wind speed was also tabulated. These parameters are illustrated in figure 9. The peak longitudinal acceleration was approximated by drawing a best fit curve to the acceleration time trace, and then determining the peak value. The ground speed and distance sensor was located on the nose gear (see section 2.2) and these values had to be estimated after nose gear liftoff. hfaximum ground speed was assumed to be the ground speed at the start of rotation, and the runway distance utilized after rotation started was approximated by dividing the maximum ground speed by the time remaining until main gear liftoff. Histograms of each critical parameter were calculated and plotted for all tests and the mean value, median value, and standard deviation were calculated. Also, takeoff speed was correlated with takeoff distance and time to liftoff to determine the relationship between these takeoff parameters.
3.3 Landing Data Analysis.
The primary focus of the landing data analysis was data available on vertical cg acceleration and peak axle vertical shear at aircraft touchdown. The key parameters tabulated for each landing other than the basic flight information were peak vertical acceleration (Nz), nose gear touch down ground speed (V,,), touchdown-pitch angle (El,,), and peak main landing gear vertical shear (VSMLG). The touchdown ground speed adjusted for wind velocity was also tabulated. These parameters are illustrated in figure 10. Histograms were calculated and plotted for each critical parameter and the mean value, median value, and standard deviation were calculated. calculated using
In the
an attempt to gage the accuracy of the data, landing vertical shear was following equation and compared to the measured vertical shear.
Where WAC is the aircraft landing weight, vertical shear and normal acceleration are single peak values. Peak landing gear vertical shear was correlated with normal acceleration and also pitch angle at touchdown was correlated with aircraft weight in an attempt to determine the relationship between these landing parameters.
3.4 Runway Exit Data Analysis.
The main focus of the exit analysis was to obtain the relationship between landing gear side force and lateral acc-eleration, as it relates to different exit speeds on a standard runway exit ramp. Measured side shear was correlated in time with measured lateral acceleration for a 40-, 50-, and 6O-kn0t exit to illustrate the relationship between the two parameters and verify the quality of the measurements. As stated in section 3.1, only the period of time during which the aircraft was actually exiting the runway was analyzed. Time averages of some
5
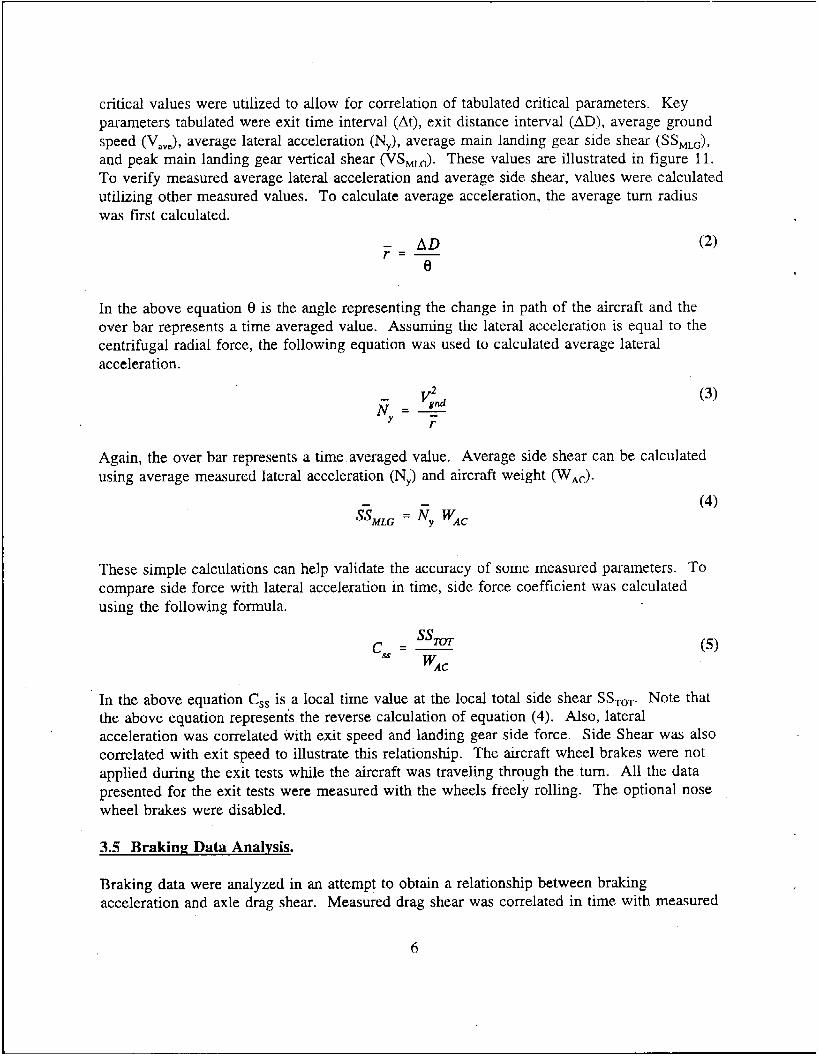
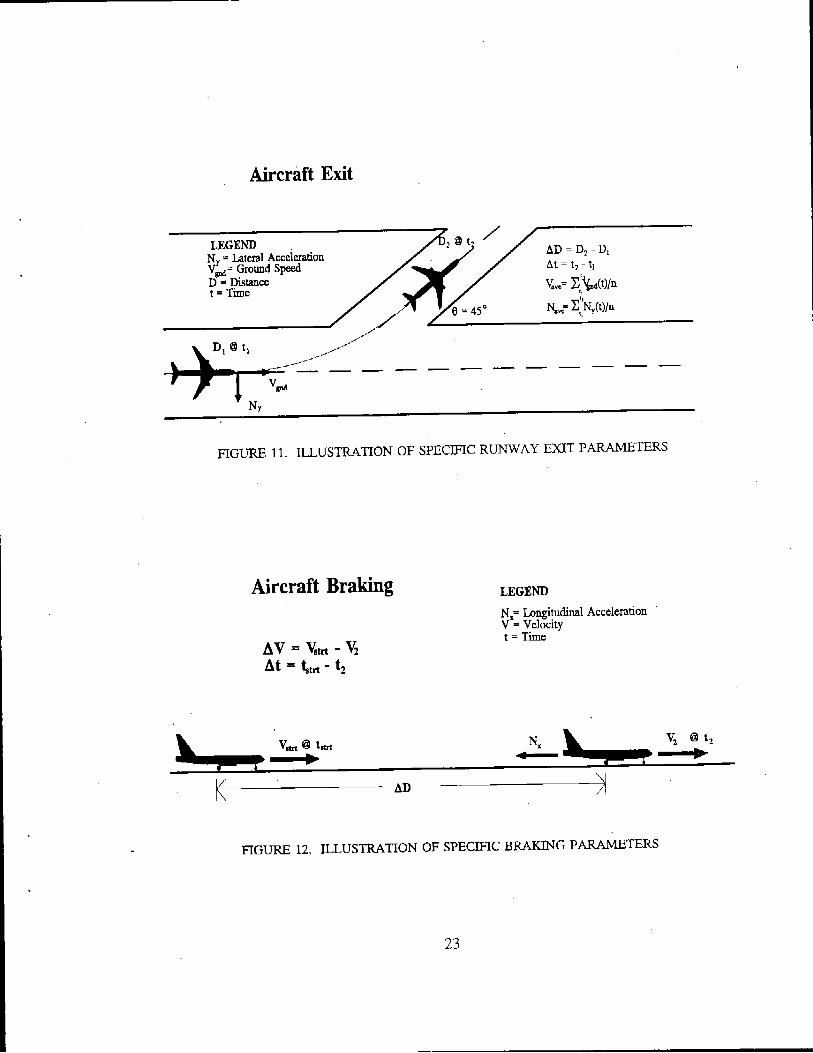
critical values were utilized to allow for correlation of tabulated critical parameters. Key parameters tabulated were exit time interval (At), exit distance interval (AD), average ground speed (V,,,), average lateral acceleration (NJ, average main landing gear side shear (SSMLG), and peak main landing gear vertical shear (VSMLG). These values are illustrated in figure 11. To verify measured average lateral acceleration and average side shear, values were calculated utilizing other measured values. To calculate average acceleration, the average turn radius was first calculated.
- AD r = - e
In the above equation 8 is the angle representing the change in path of the aircraft and the over bar represents a time averaged value. Assuming the lateral acceleration is equal to the centrifugal radial force, the following equation was used to calculated average lateral acceleration.
I.2 (3)
Again, the over bar represents a time averaged value. Average side shear can be calculated using average measured lateral acceleralion (N;) and aircraft weight (WAC).
I (4) sshm = Ny WAC
These simple calculations can help validate the accuracy of some measured parameters. To compare side force with lateral acceleration in time, side force coefficient was calculated using the following formula.
In the above equation C,, is a local time value at the local total side shear SSTOT. Note that the above equation represents the reverse calculation of equation (4). Also, lateral acceleration was correlated with exit speed and landing gear side force. Side Shear WAS also correlated with exit speed to illustrate this relationship. The aircraft wheel brakes were not applied during the exit tests while the aircraft was traveling through the turn. All the data presented for the exit tests were measured with the wheels freely rolling. The optional nose wheel brakes were disabled.
3.5 Braking; Data Analysis.
Braking data were analyzed in an attempt to obtain a relationship between braking acceleration and axle drag shear. Measured drag shear was correlated in time with measured
6
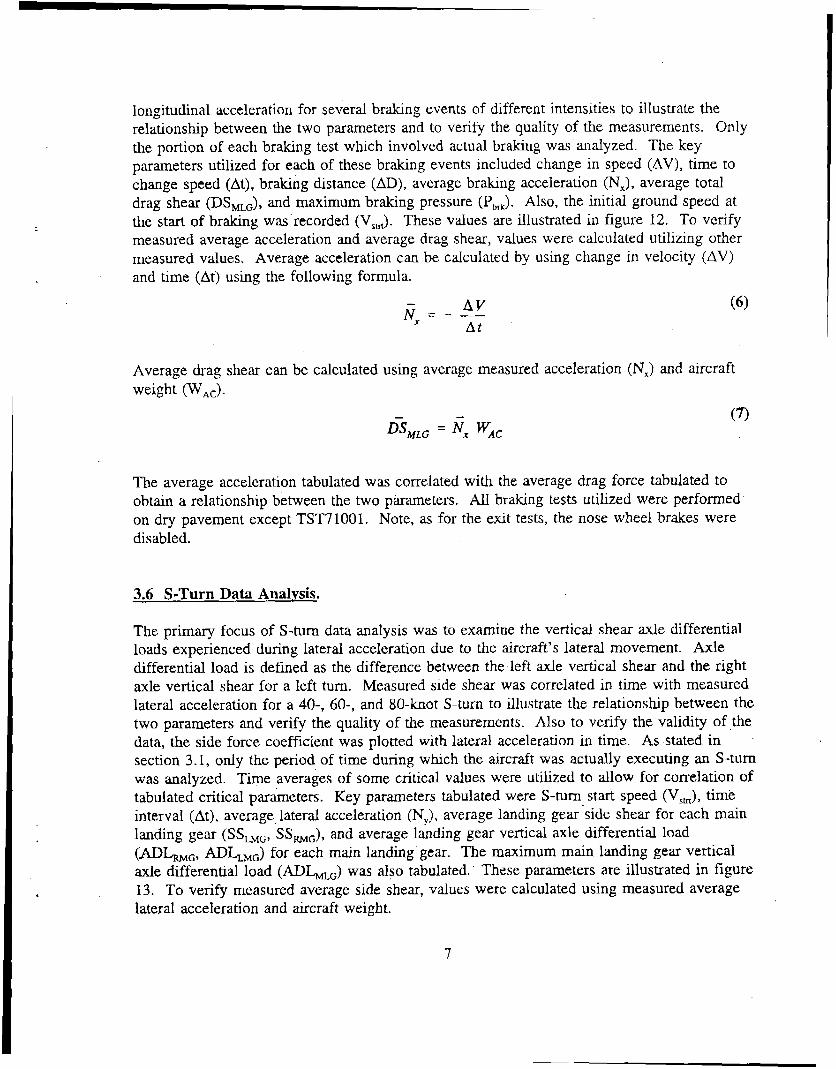
longitudinal acceleration for several braking events of different intensities to illustrate the relationship between the two parameters and to verify the quality of the measurements. Only the portion of each braking test which involved actual braking was analyzed. The key parameters utilized for each of these braking events included change in speed (AV), time to change speed (At), braking distance (AD), average braking acceleration (NJ, average total drag shear ( D S M L G ) , and maximum braking pressure (Pbrk). Also, the initial ground speed at the start of braking was recorded (Vsm). These values are illustrated in figure 12. To verify measured average acceleration and average drag shear, values were calculated utilizing other measured values. Average acceleration can be cdculated by using change in velocity (AV) and time (At) using the following formula.
- A V (6) N X = - - A t
Average drag shear can be calculated using average measured acceleration (N,) and aircraft weight (W,,).
The average acceleration tabulated was correlated with the average drag force tabulated to obtain a relationshq between the two pinmeters. All braking tests utilized were performed on dry pavement except TST71001. Note, as for the exit tests, the nose wheel brakes were disabled.
3.6 S-Turn Data Analysis.
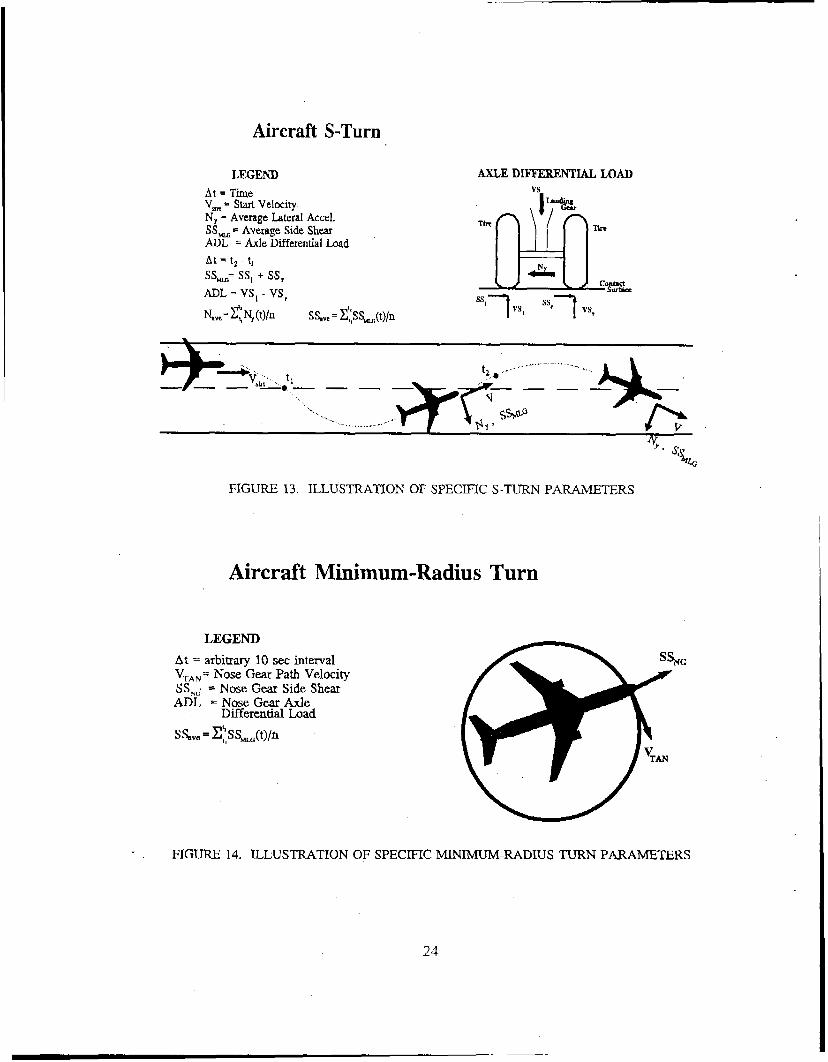
The primary focus of S-turn data analysis was to examine the vertical shear axle differential loads experienced during lateral acceleration due to the aircraft’s lateral movement. Axle differential load is defined as the difference between the left axle vertical shear and the right axle vertical shear for a left turn. Measured side shear was correlated in time with measured lateral acceleration for a 40-, 60-, and 80-knot S-turn to illustrate the relationship between the two parameters and verify the quality of the measurements. Also to verify the validity of the data, the side force coefficient was plotted with lateral acceleration in time. As stated in section 3.1, only the period of time during which the aircraft was actually executing an S-turn was analyzed. Time averages of some critical values were utilized to allow for correlation of tabulated critical parameters. Key parameters tabulated were S-turn start speed (Vsm), time interval (At), average lateral acceleration (NJ, average landing gear side shear for each main landing gear (SS,,, SS,,), and average landing gear vertical axle differential load (ADL,, ADLMG) for each main landing gear. The maximum main landing gear vertical axle differential load (ADL,,) was also tabulated. These parameters are illustrated in figure 13. To verify measured average side shear, values were calculated using measured average lateral acceleration and aircraft weight.
7
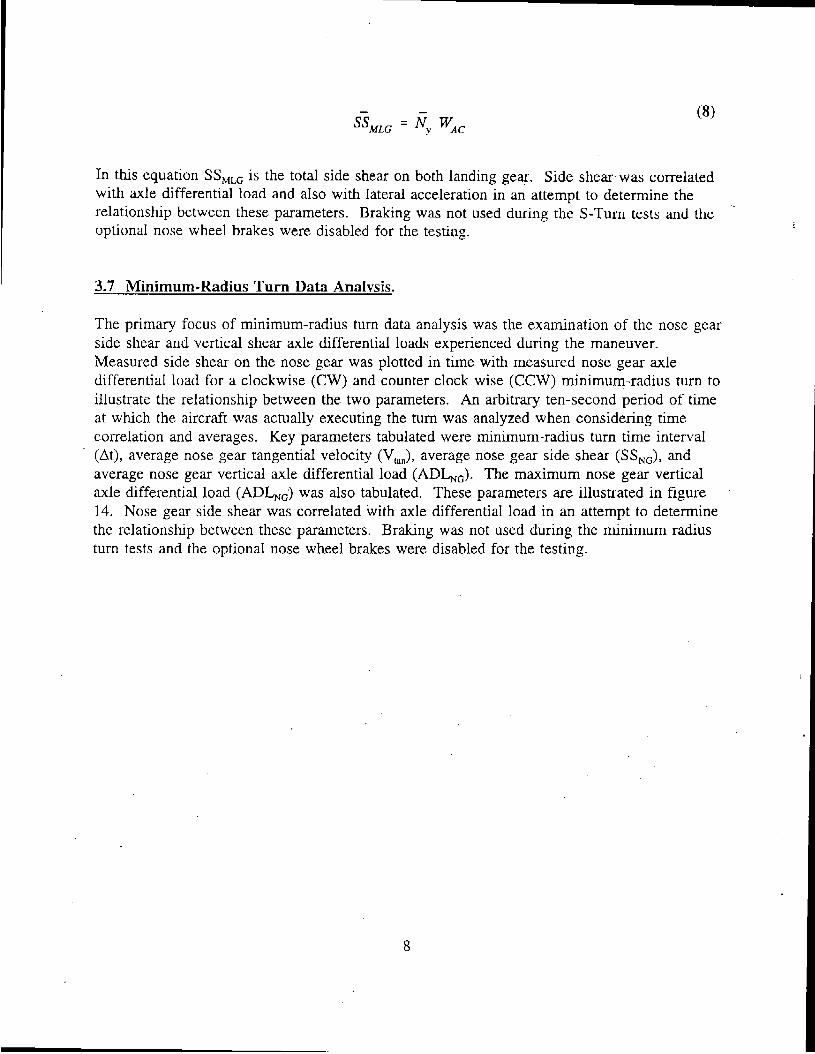
In this equation SSMLG is the total side shear on both landing gear. Side shear was correlated with axle differential load and also with lateral acceleration in an attempt to determine the relationship between these parameters. Braking was not used during the S-Turn tests and the optional nose wheel brakes were disabled for the testing.
3.7 Minimum-Radius Turn Data Analysis.
The primary focus of minimum-radius turn data analysis was the examination of the nose gear side shear and vertical shear axle differential loads experienced during the maneuver. Measured side shear on the nose gear was plotted in time with measured nose gear axle differential load for a clockwise (CW) and counter clock wise (CCW) minimum-radius turn to illustrate the relationship between the two parameters. An arbitrary ten-second period of time at which the aircraft was actually executing the turn was analyzed when considering time correlation and averages. Key parameters tabulated were minimum-radius turn time interval (At), average nose gear tangential velocity (V,,,), average nose gear side shear ( S S , , ) , and average nose gear vertical axle differential load (ADL,). The maximum nose gear vertical axle differential load (ADLG) was also tabulated. These parameters are illustrated in figure 14. Nose gear side shear was correlated with axle differential load in an attempt to determine the relationship between these parameters. Bralung was not used during the minimum radius turn tests and the optional nose wheel brakes were disabled for the testing.
8
4. RESULTS.
4.1 Takeoffs.
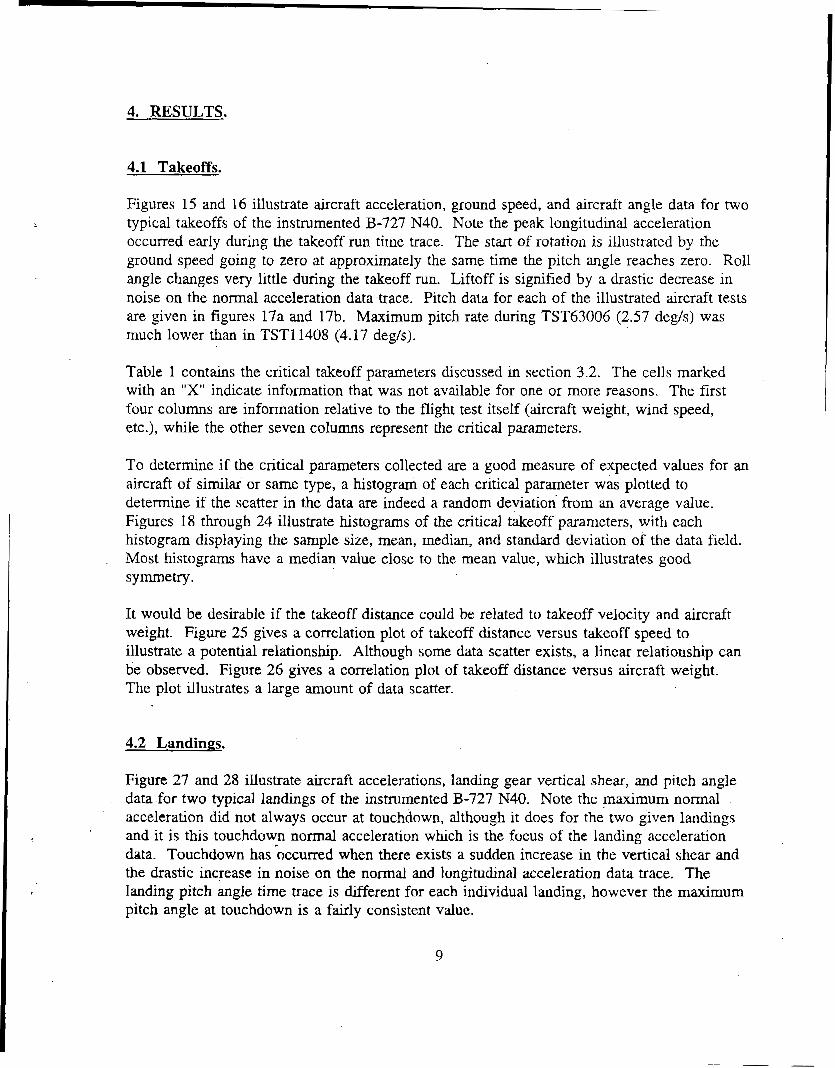
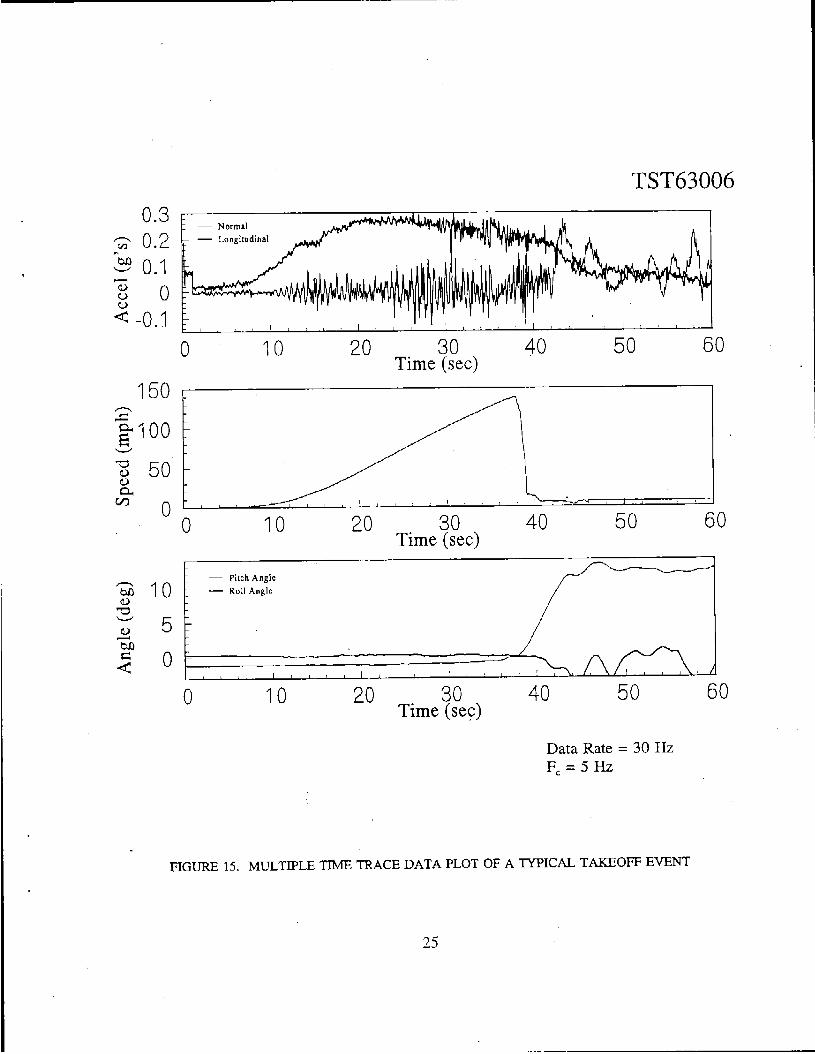
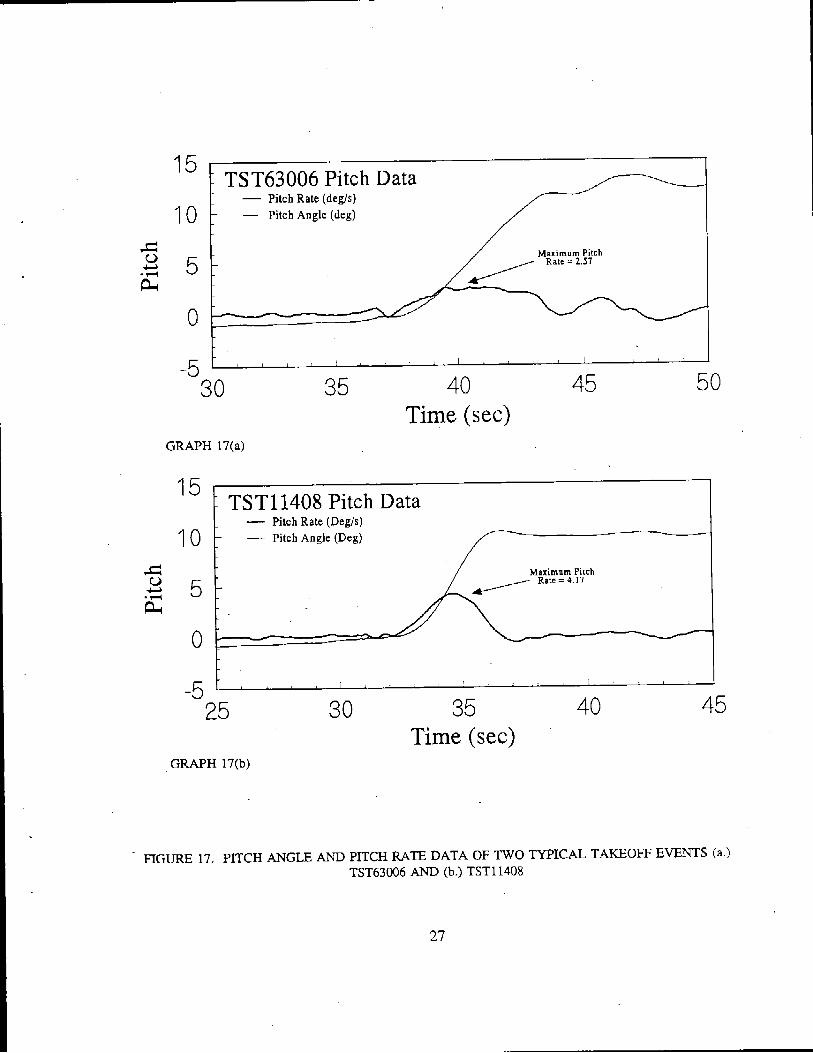
Figures 15 and 16 illustrate aircraft acceleration, ground speed, and aircraft angle data for two typical takeoffs of the instrumented B-727 N40. Note the peak longitudinal acceleration occurred early during the takeoff run time trace. The start of rotation is illustrated by the ground speed going to zero at approximately the same time the pitch angle reaches zero. Roll angle changes very little during the takeoff run. Liftoff is signified by a drastic decrease in noise on the normal acceleration data trace. Pitch data for each of the illustrated aircraft tests are given in figures 17a and 17b. Maximum pitch rate during TST63006 (2.57 deg/s) was much lower than in TST11408 (4.17 deg/s).
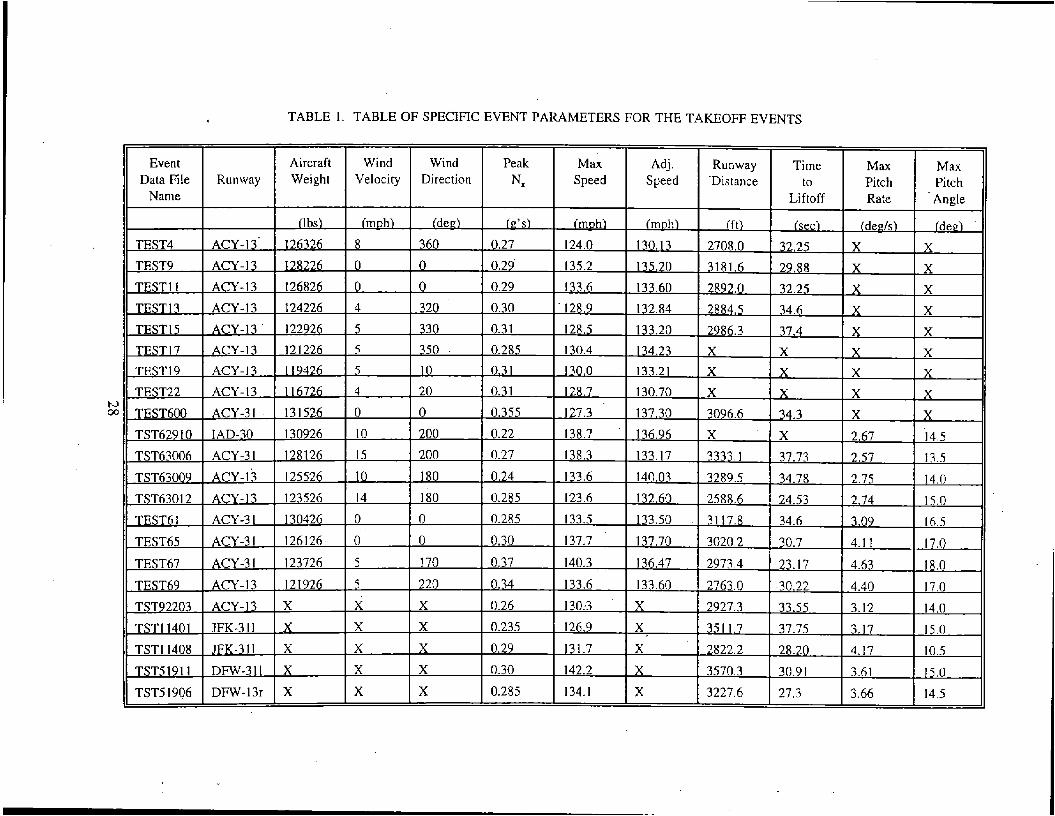
Table 1 contains the critical takeoff parameters discussed in section 3.2. The cells marked with an "X" indicate information that was not available for one or more reasons. The first four columns are information relative to the flight test itself (aircraft weight, wind speed, etc.), while the other seven columns represent the critical parameters.
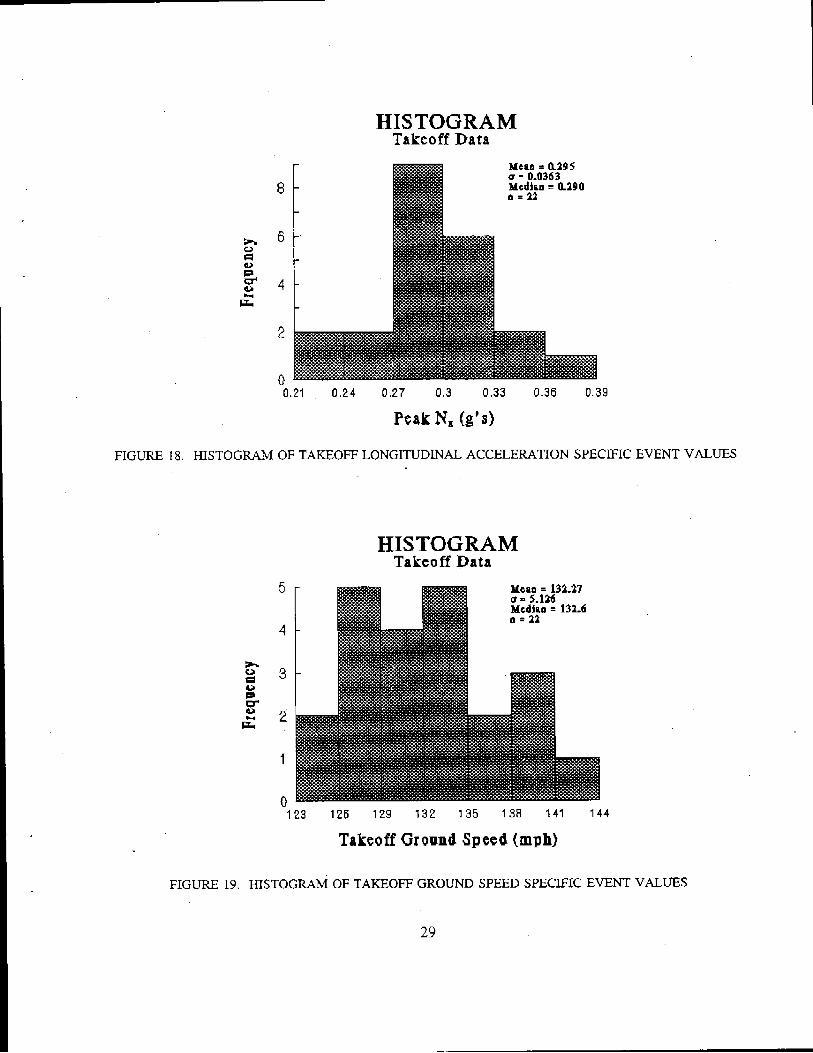
To determine if the critical parameters collected are a good measure of expected values for an aircraft of similu- or same type, a histogram of each critical parameter was plotted to determine if the scatter in the data are indeed a random deviation from an average value. Figures 18 through 24 illustrate histograms of the critical takeoff parameters, with each histogram displaying the sample size, mean, median, and standard deviation of the data field. Most histograms have a median value close to the mean value, which illustrates good symmetry.
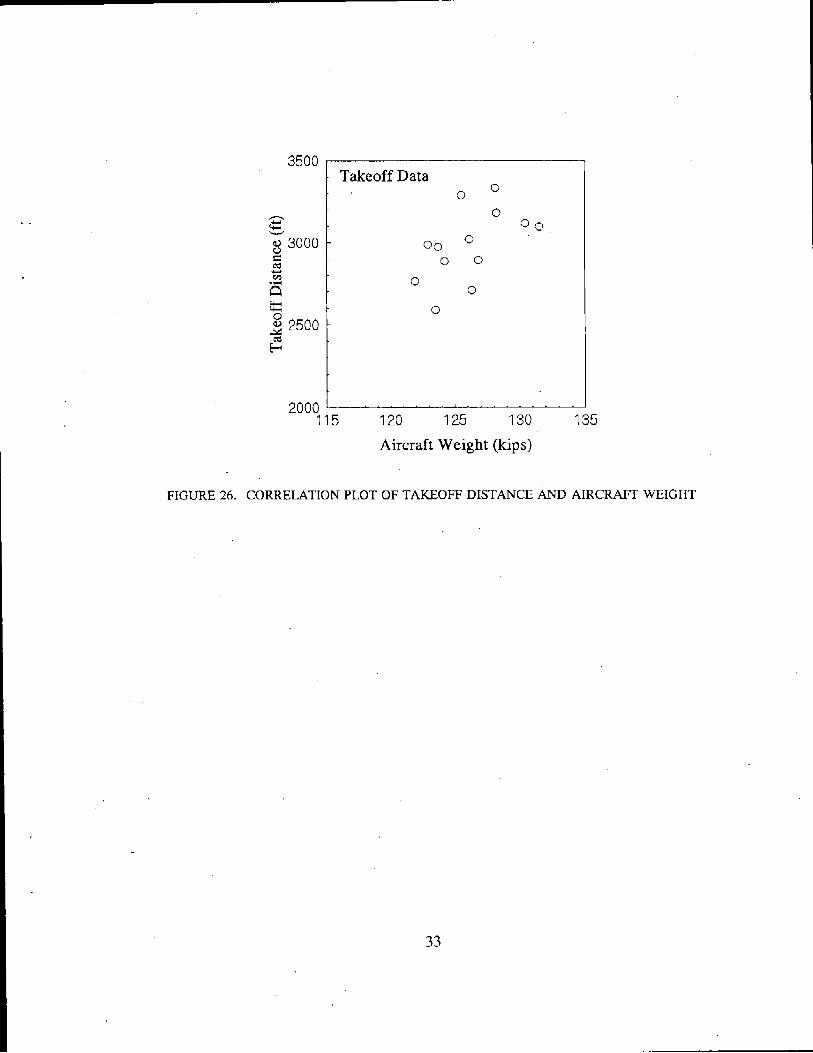
It would be desirable if the takeoff distance could be related to takeoff velocity and aircraft weight. Figure 25 gives a correlation plot of takeoff distance versus takeoff speed to illustrate a potential relationship. Although some data scatter exists, a linear relationship can be observed. Figure 26 gives a correlation plot of takeoff distance versus aircraft weight. The plot illustrates a large amount of data scatter.
4.2 Landings.
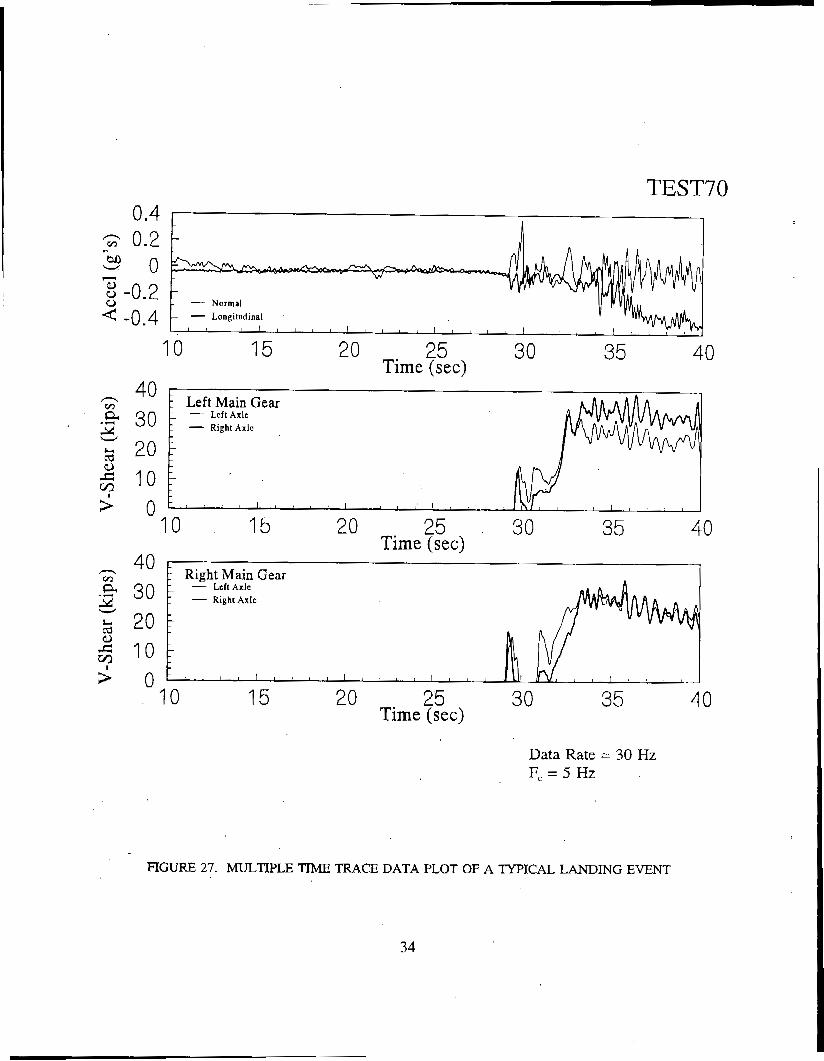
Figure 27 and 28 illustrate aircraft accelerations, landing gear vertical shear, and pitch angle data for two typical landings of the instrumented B-727 N40. Note the maximum normal .
acceleration did not always occur at touchdown, although it does for the two given landings and it is this touchdown normal acceleration which is the focus of the landing acceleration data. Touchdown has *occurred when there exists a sudden increase in the vertical shear and the drastic increase in noise on the normal and longitudinal acceleration data trace. The landing pitch angle time trace is different for each individual landing, however the maximum pitch angle at touchdown is a fairly consistent value.
9
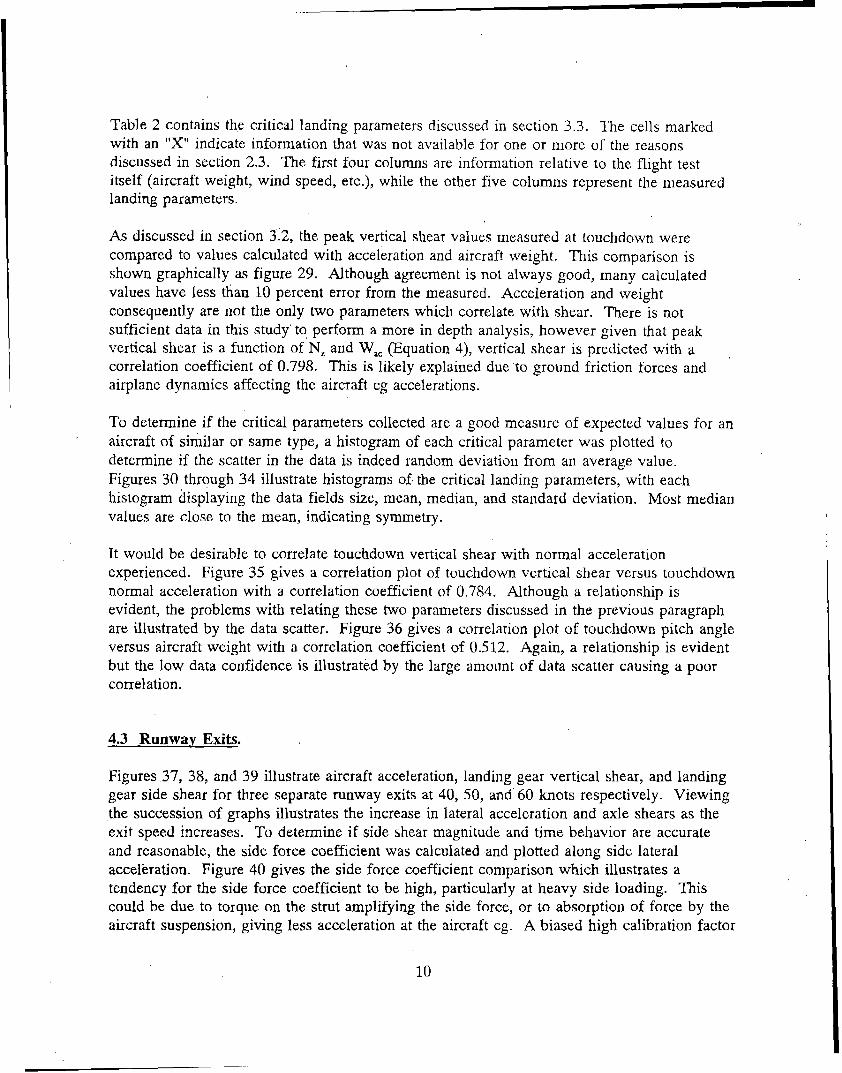
Table 2 contains the critical landing parameters discussed in section 3.3. The cells marked with an "X" indicate information that was not available for one or more of the reasons discussed in section 2.3. The first four columns are information relative to the flight test itself (aircraft weight, wind speed, etc.), while the other five columns represent the measured landing parameters.
As discussed in section 3.2, the peak vertical shear values measured at touchdown were compared to values calculated with acceleration and aircraft weight. This comparison is shown graphically as figure 29. Although agreement is not always good, many calculated values have less than 10 percent error from the measured. Acceleration and weight consequently are not the only two parameters which correlate with shear. There is not sufficient data in this study to perform a more in depth analysis, however given that peak vertical shear is a function of N, and W,, (Equation 4), vertical shear is predicted with a correlation coefficient of 0.798. This is likely explained due to ground friction forces and airplane dynamics affecting the aircraft cg accelerations.
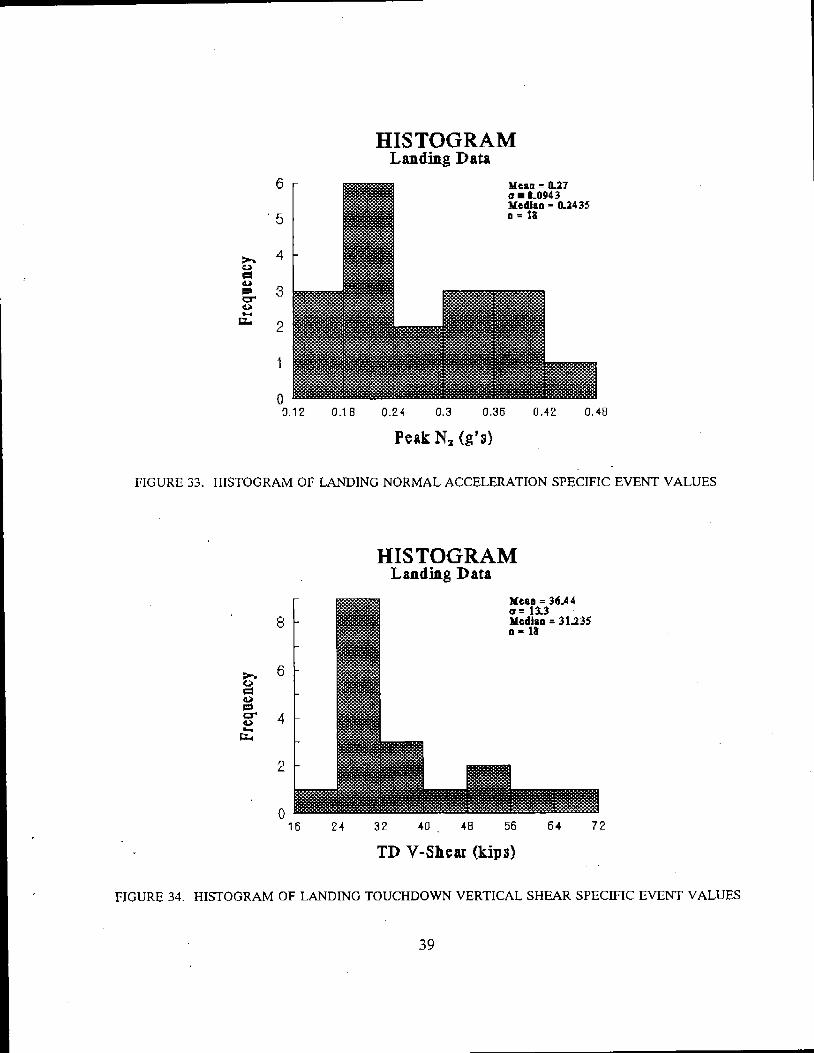
To determine if the critical parameters collected are a good measure of expected values for an aircraft of similar or same type, a histogram of each critical parameter was plotted to determine if the scatter in the data is indeed random deviation from an average value. Figures 30 through 34 illustrate histograms of the critical landing parameters, with each histogram displaying the data fields size, mean, median, and standard deviation. Most median values are close to the mean, indicating symmetry.
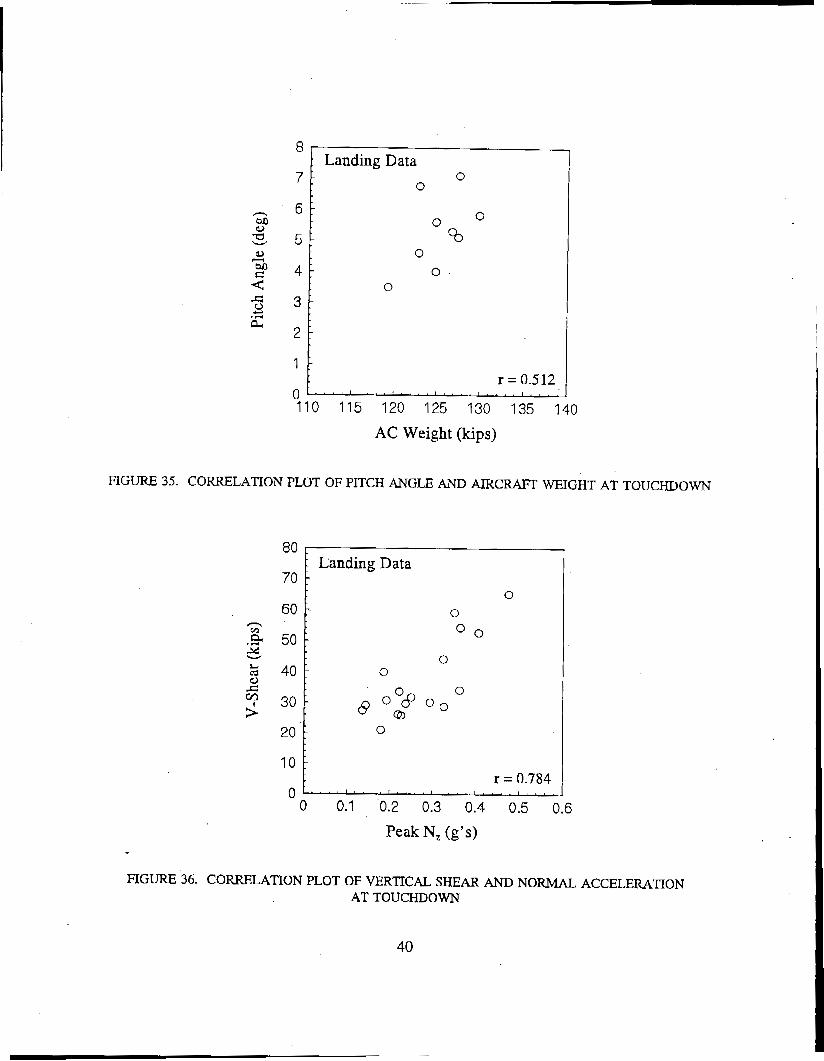
It would be desirable to correlate touchdown vertical shear with normal acceleration experienced. Figure 35 gives a correlation plot of touchdown vertical shear versus touchdown normal acceleration with a correlation coefficient of 0.7S4. Although a relationship is evident, the problems with relating these two parameters discussed in the previous paragraph are illustrated by the data scatter. Figure 36 gives a correlation plot of touchdown pitch angle versus aircraft weight with a correlation coefficient of 0.512. Again, a relationship is evident but the low data confidence is illustrated by the large amount of data scatter causing a poor correlation.
4.3 Runway Exits.
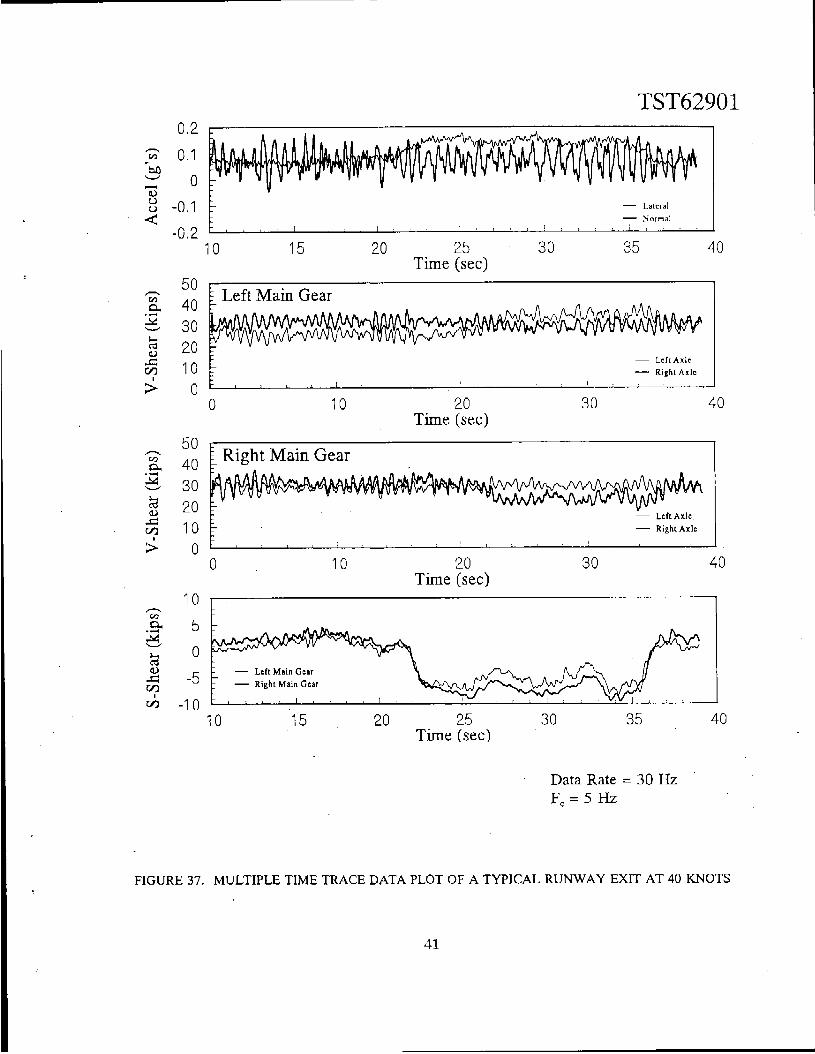
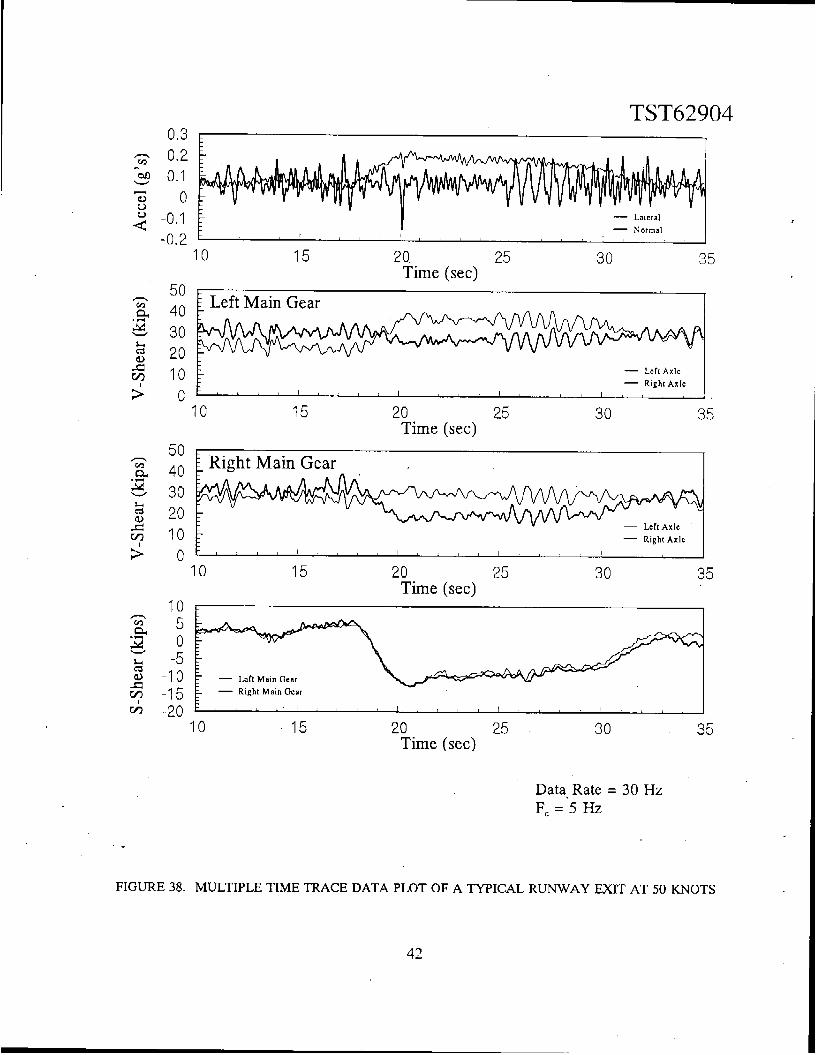
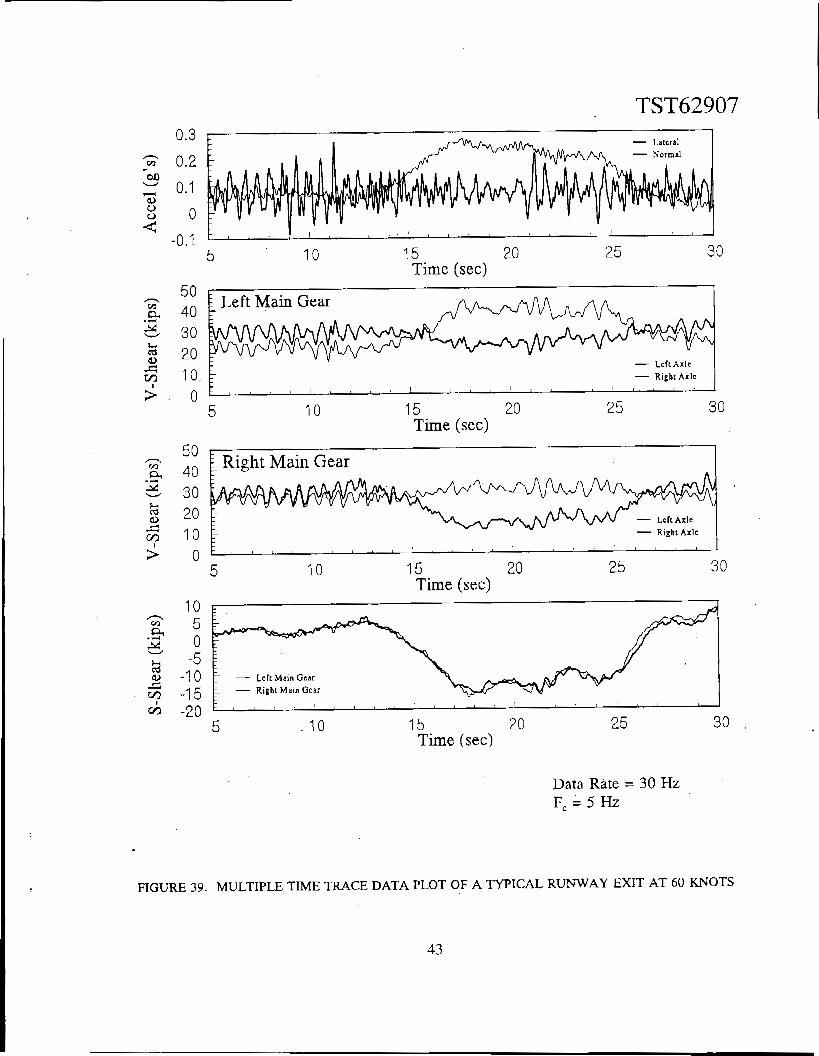
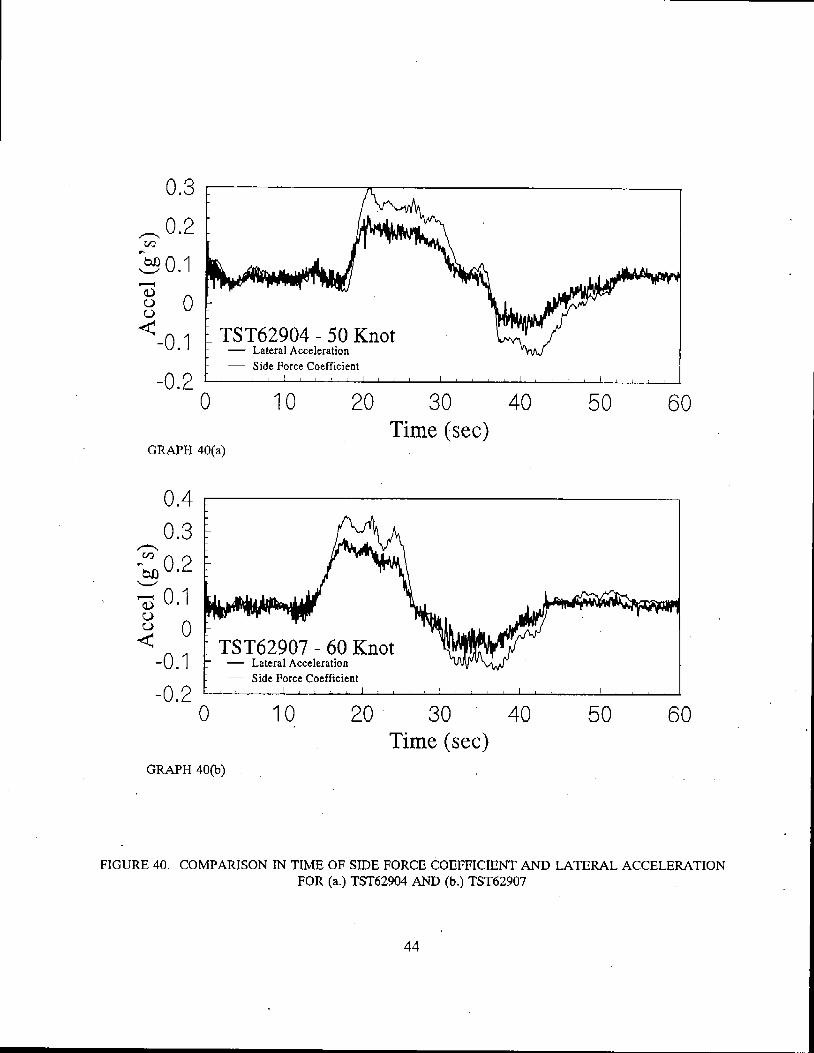
Figures 37, 38, and 39 illustrate aircraft acceleration, landing gear vertical shear, and landing gear side shear for three separate runway exits at 40, 50, and 60 knots respectively. Viewing the succession of graphs illustrates the increase in lateral acceleration and axle shears as the exit speed increases. To determine if side shear magnitude and time behavior are accurate and reasonable, the side force coefficient was calculated and plotted along side lateral accel'eration. Figure 40 gives the side force coefficient comparison which illustrates a tendency for the side force coefficient to be high, particularly at heavy side loading. This could be due to torque on the strut amplifying the side force, or to absorption of force by the aircraft suspension, giving less acceleration at the aircraft cg. A biased high calibration factor
10
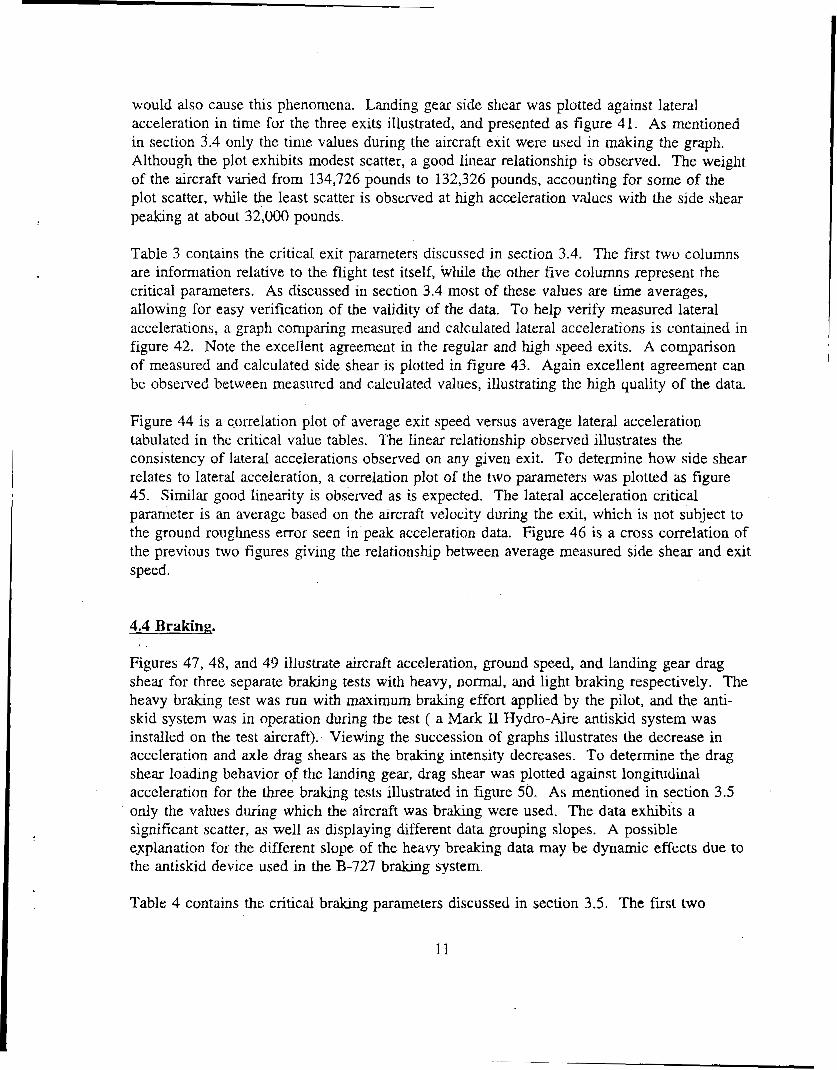
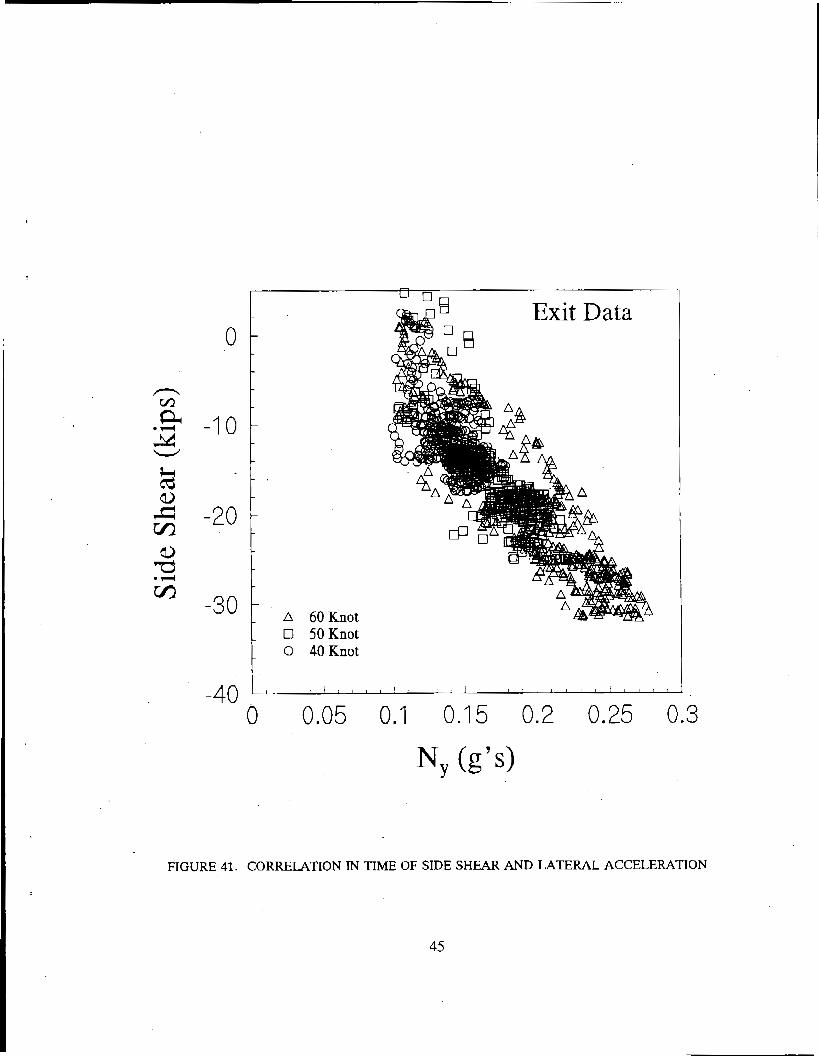
would also cause this phenomena. Landing gear side shear was plotted against lateral acceleration in time for the three exits illustrated, and presented as figure 41. As mentioned in section 3.4 only the time values during the aircraft exit were used in making the graph. Although the plot exhibits modest scatter, a good linear relationship is observed. The weight of the aircraft varied from 134,726 pounds to 132,326 pounds, accounting for some of the plot scatter, while the least scatter is observed at high acceleration values with the side shear peaking at about 32,000 pounds.
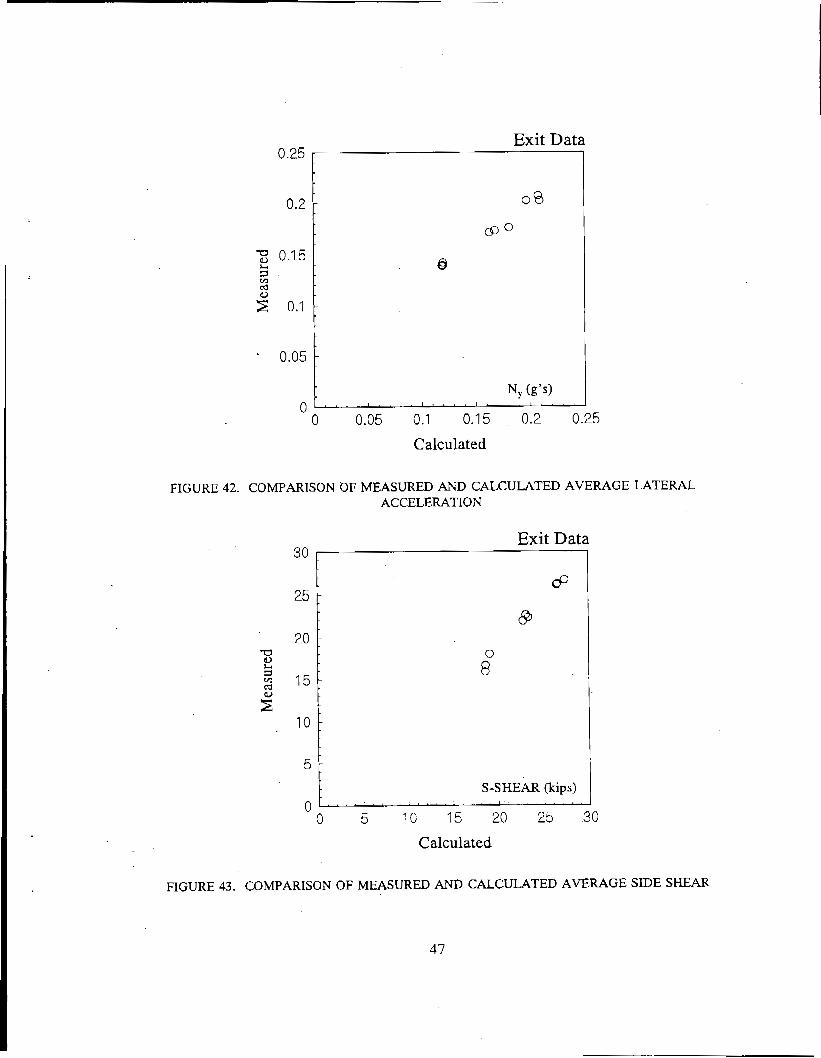
Table 3 contains the critical exit parameters discussed in section 3.4. The first two columns are information relative to the flight test itself, while the other five columns represent the critical parameters. As discussed in section 3.4 most of these values are time averages, allowing for easy verification of the validity of the data. To help verify measured lateral accelerations, a graph comparing measured and calculated lateral accelerations is contained in figure 42. Note the excellent agreement in the regular and high speed exits. A comparison of measured and calculated side shear is plotted in figure 43. Again excellent agreement can be observed between measured and calculated values, illustrating the high quality of the data.
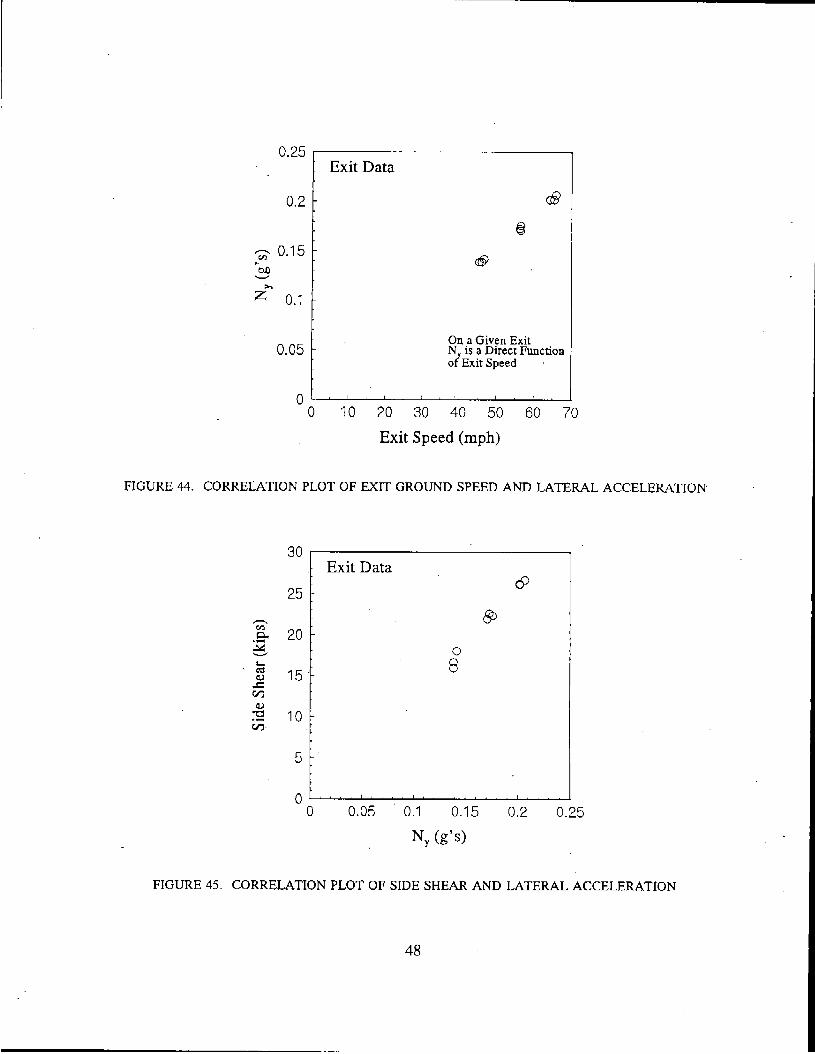
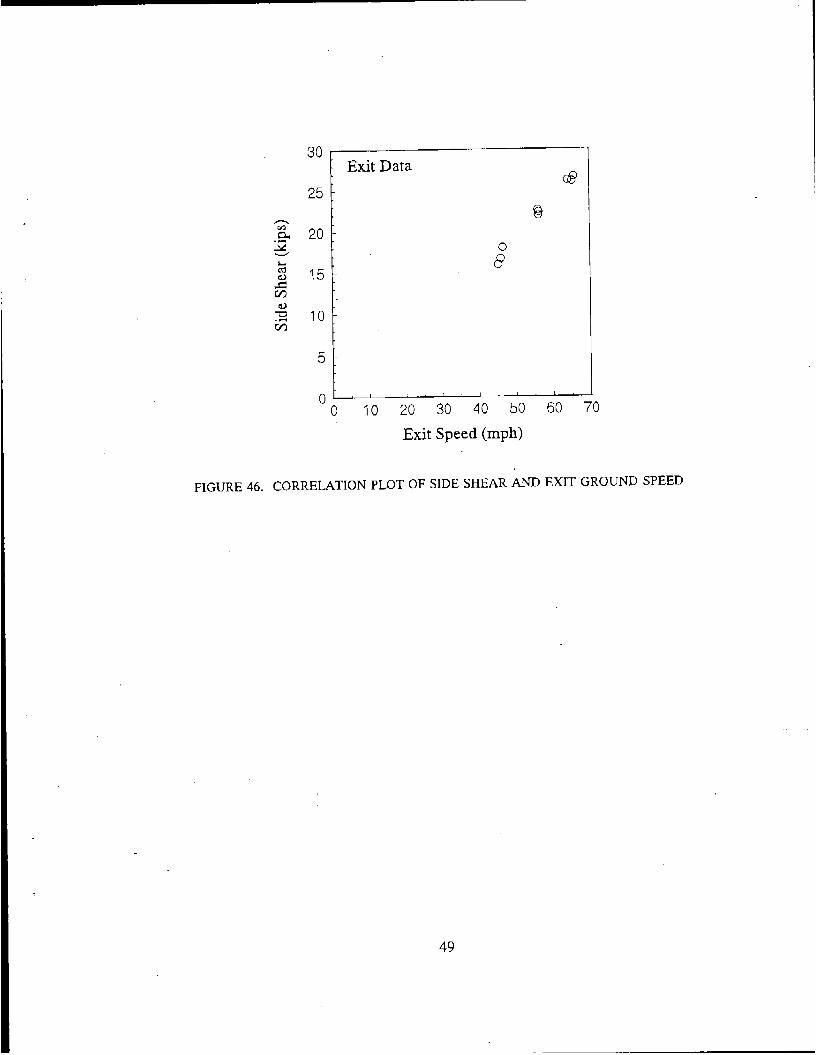
Figure 44 is a c-orrelation plot of average exit speed versus average lateral acceleration tabulated in the critical value tables. The linear relationship observed illustrates the consistency of lateral accelerations observed on any given exit. To determine how side shear relates to lateral acceleration, a correlation plot of the two parameters was plotted as figure 45. Similar good linearity is observed as is expected. The lateral acceleration critical parameter is an average based on the aircraft velocity during the exit, which is not subject to the ground roughness error seen in peak acceleration data. Figure 46 is a cross correlation of the previous two figures giving the relationship between average measured side shear and exit speed.
4.4 Braking.
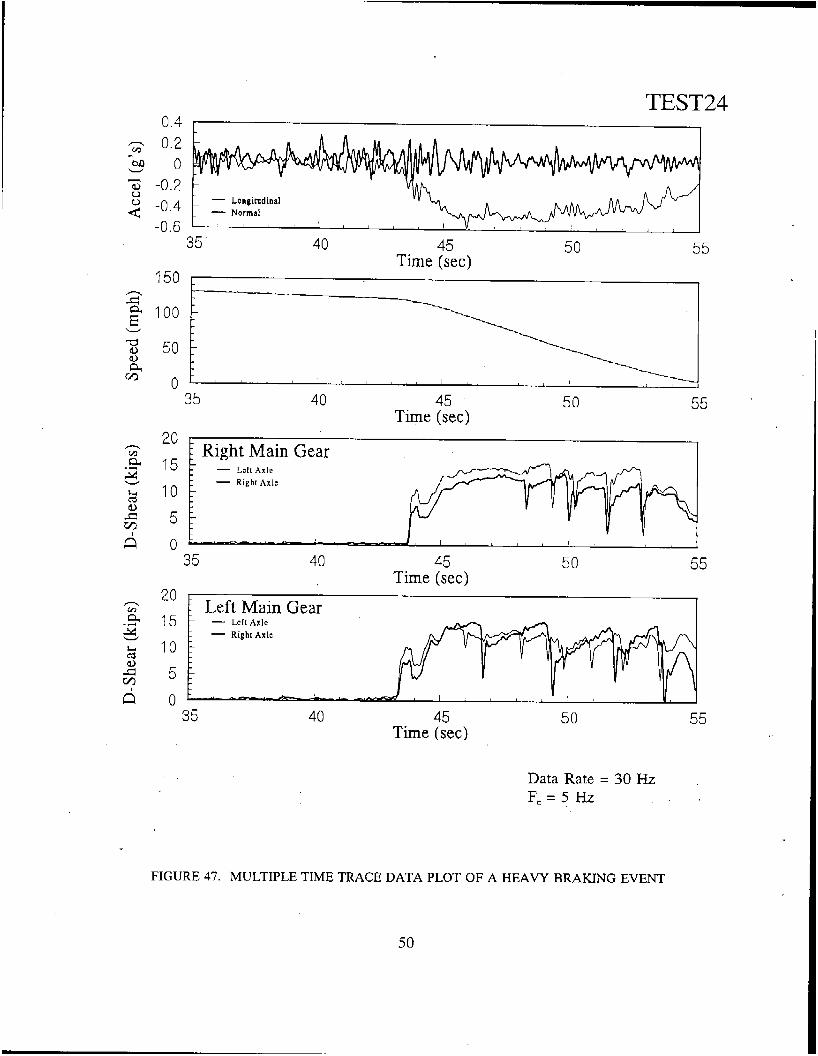
Figures 47, 48, and 49 illustrate aircraft acceleration, ground speed, and landing gear drag shear for three separate braking tests with heavy, normal, and light braking respectively. The heavy braking test was run with maximum braking effort applied by the pilot, and the anti- s h d system was in operation during the test ( a Mark II Hydro-Aire antiskid system was installed on the test aircraft). Viewing the succession of graphs illustrates the decrease in acceleration and axle drag shears as the braking intensity decreases. To determine the drag shear loading behavior of the landing gear, drag shear was plotted against longitudinal acceleration for the three braking tests illustrated in figure 50. As mentioned in section 3.5 only the values during which the aircraft was braking were used. The data exhibits a significant scatter, as well as displaying different data grouping slopes. A possible explanation for the different slope of the heavy breaking data may be dynamic effects due to the antiskid device used in the B-727 braking system.
Table 4 contains the critical braking parameters discussed in section 3.5. The first two
11
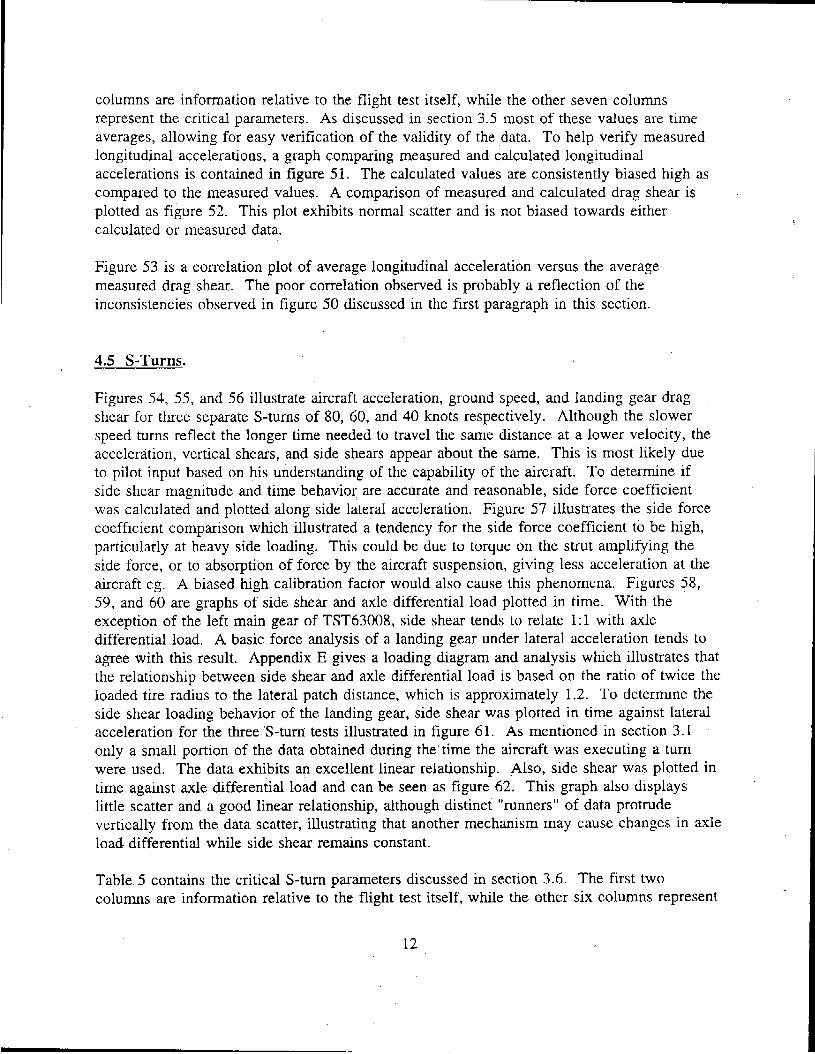
columns are information relative to the flight test itself, while the other seven columns represent the critical parameters. As discussed in section 3.5 most of these values are time averages, allowing for easy verification of the validity of the data. To help verify measured longitudinal accelerations, a graph comparing measured and calculated longitudinal accelerations is contained in figure 51. The calculated values are consistently biased high as compared to the measured values. A comparison of measured and calculated drag shear is plotted as figure 52. This plot exhibits normal scatter and is not biased towards either calculated or measured data.
Figure 53 is a correlation plot of average longitudinal acceleration versus the average measured drag shear. The poor correlation observed is probably a reflection of the inconsistencies observed in figure 50 discussed in the first paragraph in this section.
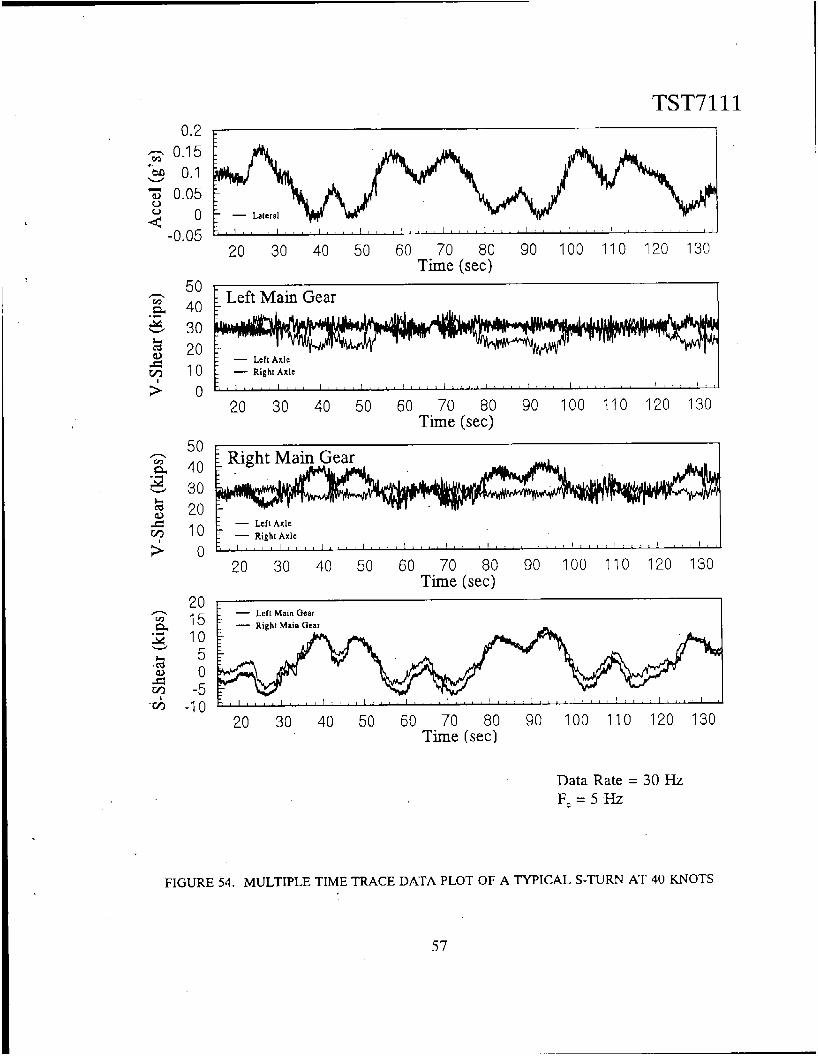
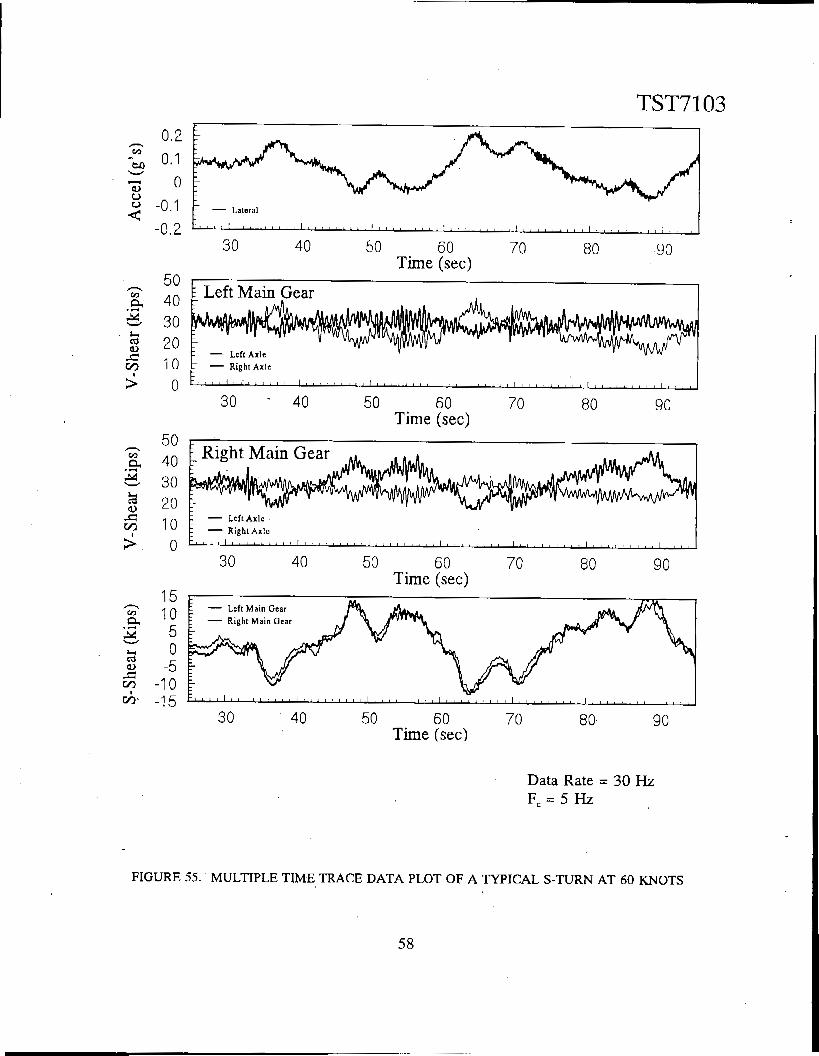
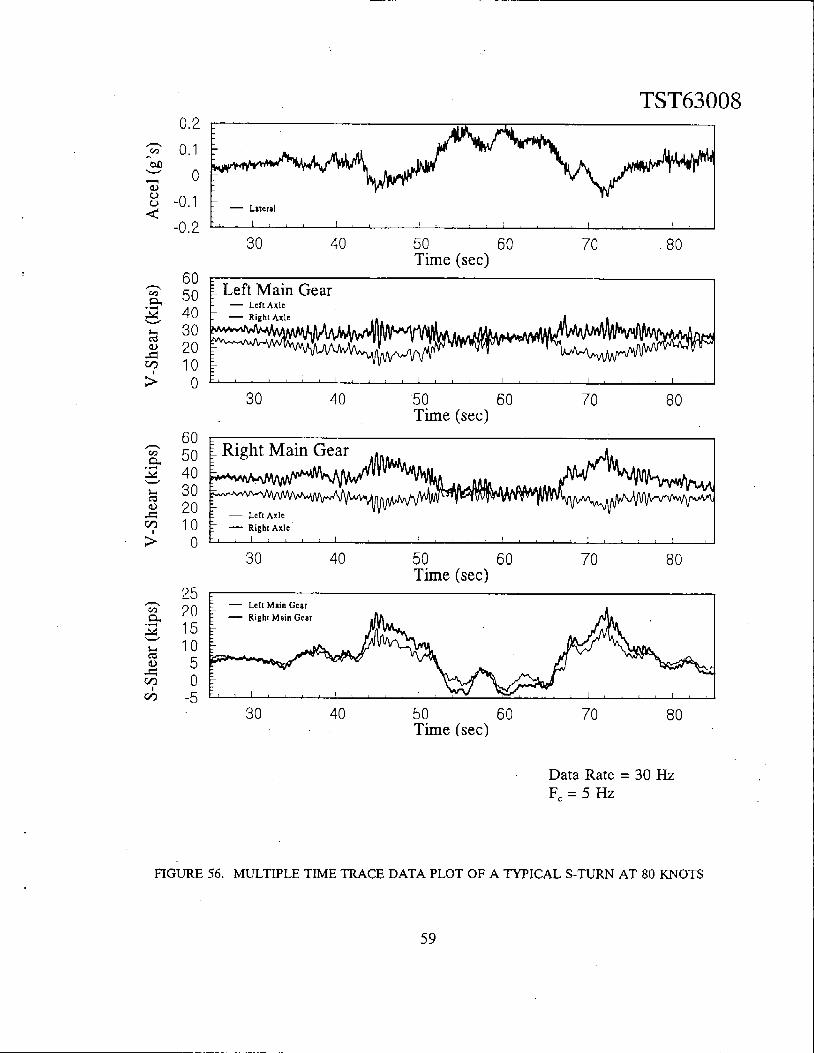
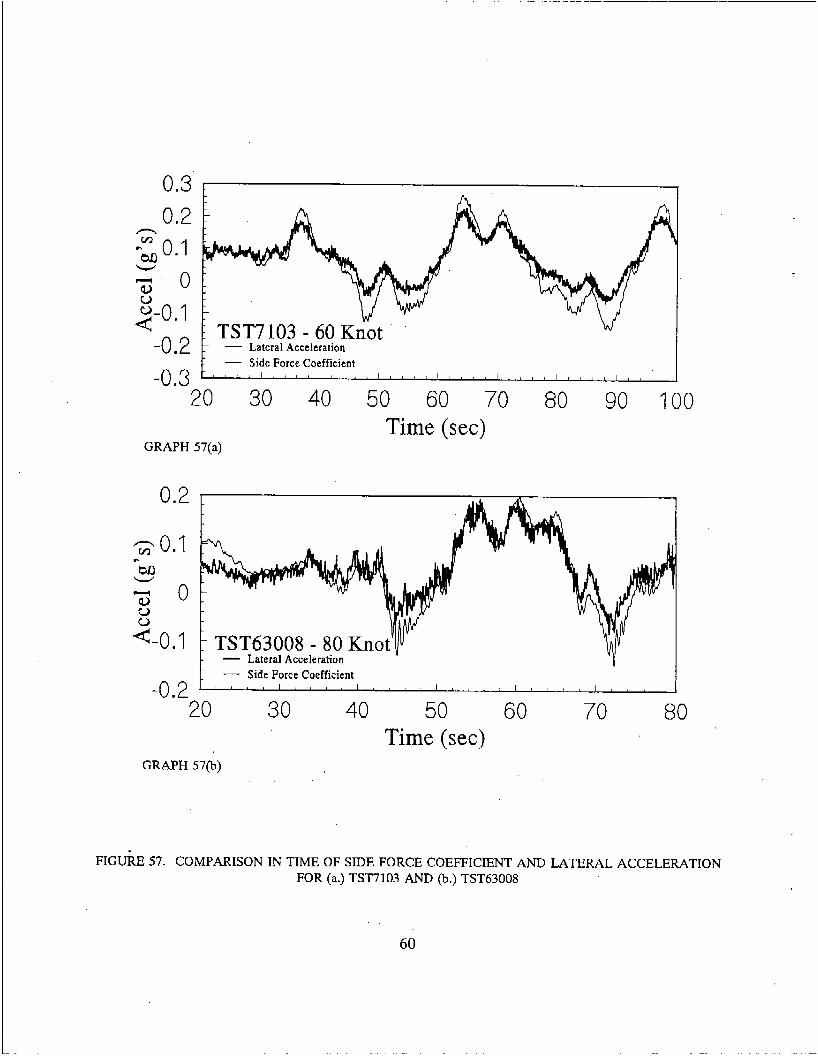
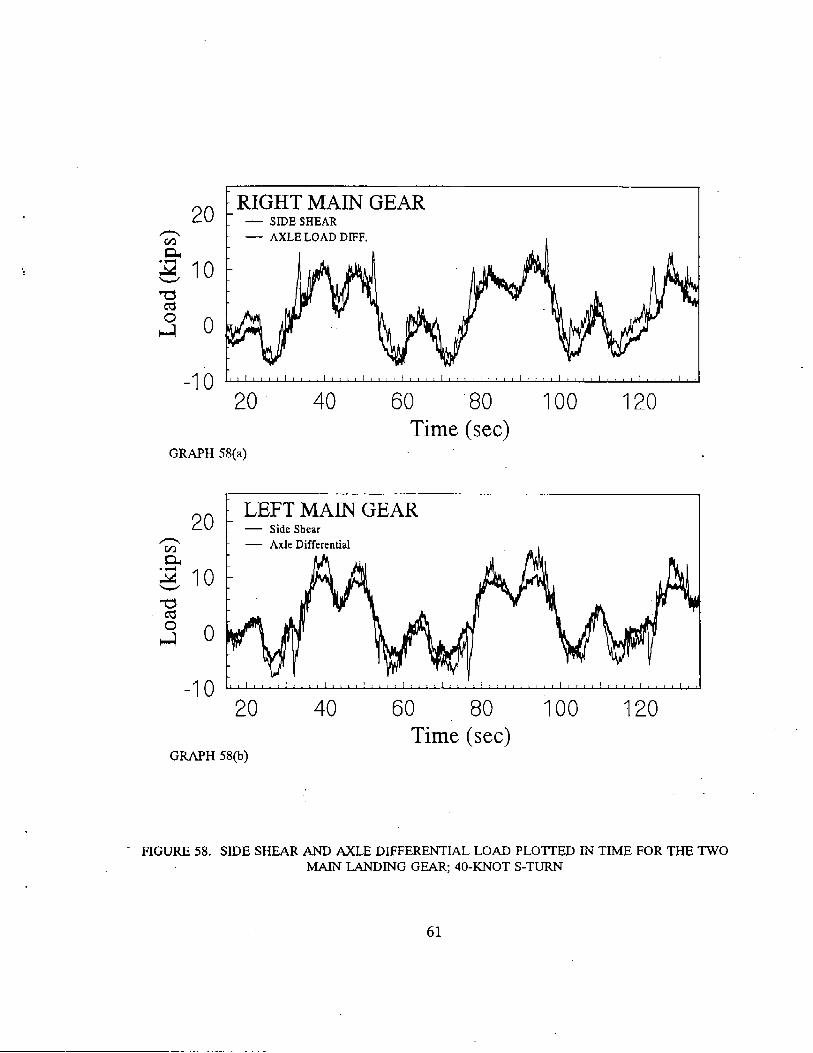
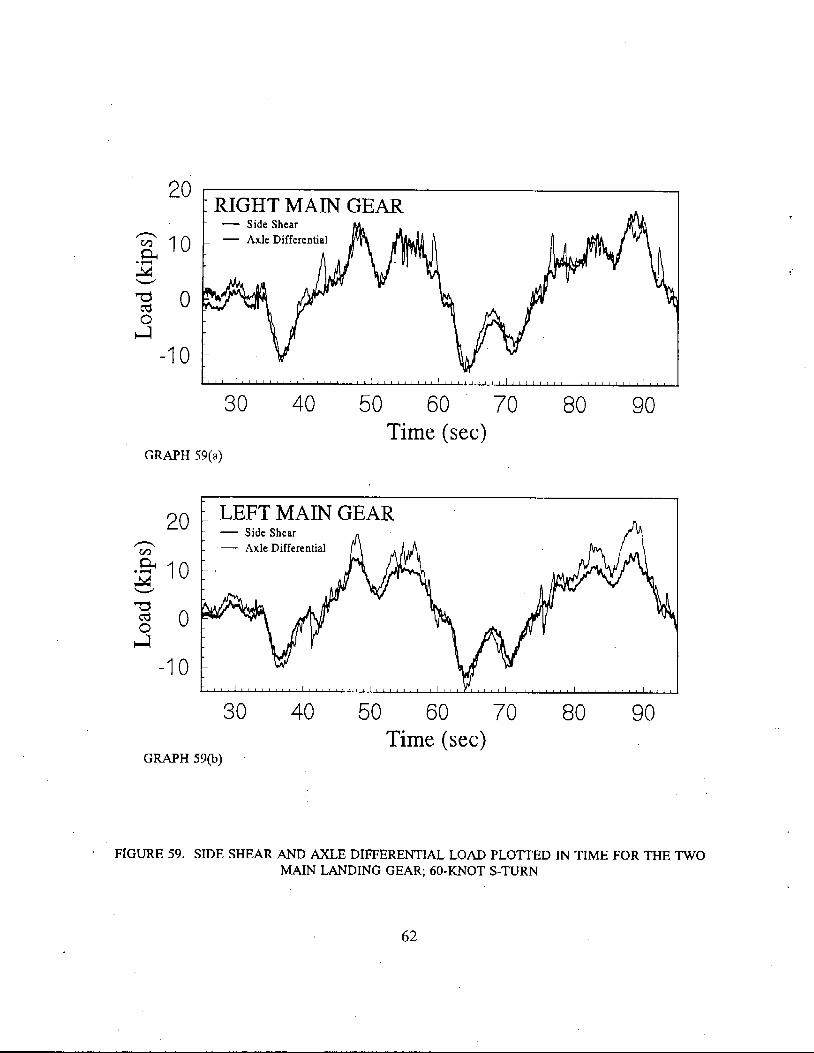
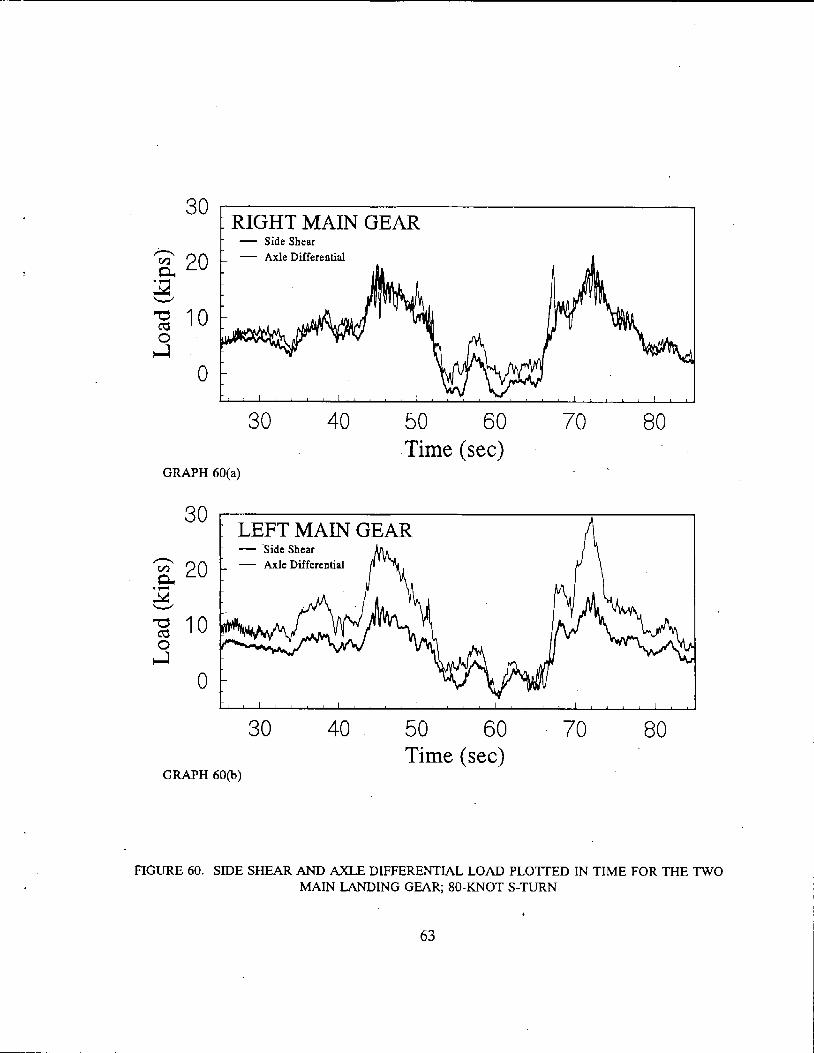
Figures 54, 55, and 56 illustrate aircraft acceleration, ground speed, and landing gear drag shear for three separate S-turns of 80, 60, and 40 knots respectively. Although the slower speed turns reflect the longer time needed to travel the same distance at a lower velocity, the acceleration, vertical shears, and side shears appear about the same. This is most likely due to pilot input based on his understanding of the capability of the aircraft. To determine if side shear magnitude and time behavior are accurate and reasonable, side force coefficient was calculated and plotted along side lateral acceleration. Figure 57 illustrates the side force coefficient comparison which illustrated a tendency for the side force coefficient to be high, particularly at heavy side loading. This could be due to torque on the strut amplifying the side force, or to absorption of force by the aircraft suspension, giving less acceleration at the aircraft cg. A biased high calibration factor would also cause this phenomena. Figures 58, 59, and 60 are graphs of side shear and axle differential load plotted in time. With the exception of the left main gear of TST63008, side shear tends to relate 1:l with axle differential load. A basic force analysis of a landing gear under lateral acceleration tends to agree with this result. Appendix E gives a loading diagram and analysis which illustrates that the relationship between side shear and axle differential load is based on the ratio of twice the loaded tire radius to the lateral patch distance, which is approximately 1.2. To determine the side shear loading behavior of the landing gear, side shear was plotted in time against lateral acceleration for the three 'S-turn tests illustrated in figure 61. As mentioned in section 3.1 only a small portion of the data obtained during the time the aircraft was executing a turn were used. The data exhibits an excellent linear relationship. ,Also, side shear was plotted in time against axle differential load and can be seen as figure 62. This graph also displays little scatter and a good linear relationship, although distinct "runners" of data protrude vertically from the data scatter, illustrating that another mechanism may cause changes in axle load differential while side shear remains constant.
Table 5 contains the critical S-turn parameters discussed in section 3.6. The first two columns are information relative to the flight test itself, while the other six columns represent
12
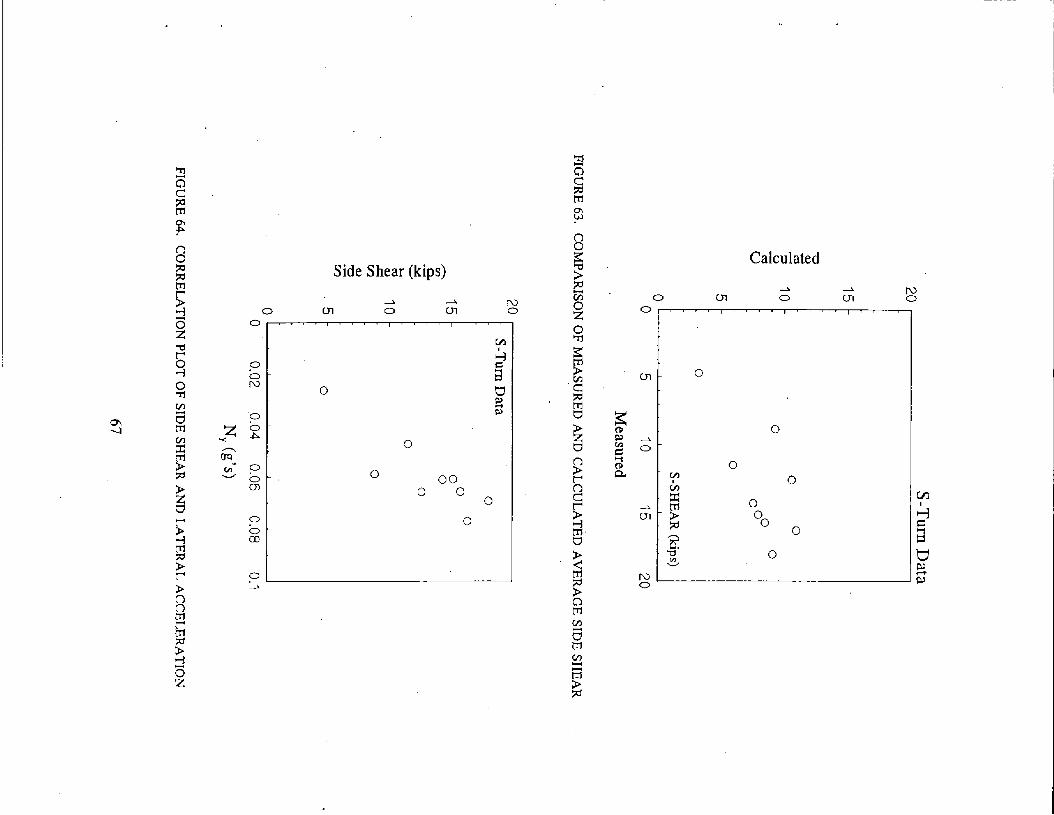
the critical parameters. As discussed in section 3.6 most of these values are time averages, allowing for easy verification of the validity of the data. To help verify measured side shear, a graph comparing measured and calculated side shear is, contained in figure 63. The measured values are consistently biased high as compared to the values calculated with measured acceleration. This agrees with figure 57, which also illustrates a high biased toward the measured values.
Figure 64 is a correlation plot of average lateral acceleration versus the average measured side shear. These shorr time average values illustrate a good linear relation. Figure 65 is a correlation plot of average measured side shear and average measured axle differential load. Again these values relate well linearly.
4.6 Minimum-Radius Turns.
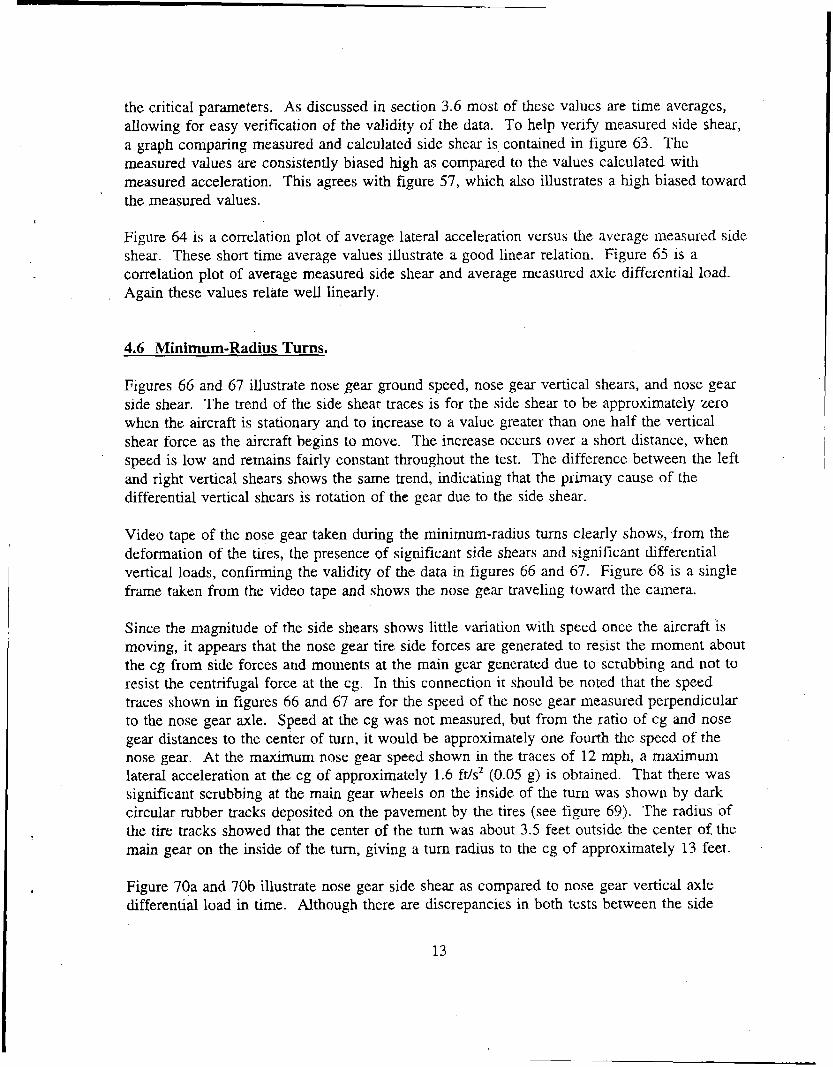
Figures 66 and 67 illustrate nose gear ground speed, nose gear vertical shears, and nose gear side shear. The trend of the side shear traces is for the side shear to be approximately zero when the aircraft is stationary and to increase to a value greater than one half the vertical shear force as the aircraft begins to move. The increase occurs over a short distance, when speed is low and remains fairly constant throughout the test. The difference between the left and right vertical shears shows the same trend, indicating that the primary cause of the differential vertical shears is rotation of the gear due to the side shear.
Video tape of the nose gear taken during the minimum-radius turns clearly shows, from the deformation of the tires, the presence of significant side shears and significant differential vertical loads, confirming the validity of the data in figures 66 and 67. Figure 68 is a single frame taken from the video tape and shows the nose gear traveling toward the camera.
Since the magnitude of the side shears shows little variation with speed once the aircraft is moving, it appears that the nose gear tire side forces are generated to resist the moment about the cg from side forces and moments at the main gear generated due to scrubbing and not to resist the centrifugal force at the cg. In this connection it should be noted that the speed traces shown in figures 66 and 67 are for the speed of the nose gear measured perpendicular to the nose gear axle. Speed at the cg was not measured, but from the ratio of cg and nose gear distances to the center of turn, it would be approximately one fourth the speed of the nose gear. At the maximum nose gear speed shown in the traces of 12 mph, a maximum lateral acceleration at the cg of approximately 1.6 ft/s2 (0.05 g) is obtained. That there was significant scrubbing at the main gear wheels on the inside of the turn was shown by dark circular rubber tracks deposited on the pavement by the tires (see figure 69). The radius of the tire tracks showed that the center of the turn was about 3.5 feet outside the center of the main gear on the inside of the turn, giving a turn radius to the cg of approximately 13 feet.
Figure 70a and 70b illustrate nose gear side shear as compared to nose gear vertical axle differential load in time. Although there are discrepancies in both tests between the side
shear and axle differential load, these can be generally associated with changes in speed. In test34 differential load and side shear agree very well during the first 45 seconds of the test when the nose wheel speed is increasing. Figure 71 is a correlation in time of nose gear side shear and axle differential load for both tests discussed above for an arbitrary 10-second time interval. Although the data from each test correspond very well, different characteristics are shown for clockwise and counter-clockwise turns.
Table 6 contains the critical minimum-radius turn parameters discussed in section 3.7. The first three columns are information relative to the flight test itself, while the other five columns represent the critical parameters. As discussed in section *3.7 most of these values are time averages, made over an arbitrary 10-second period during the turn, allowing for easy verification of the validity of the data.
Figure 72 illustrates a correlation of nose gear average side shear and average axle differential load. This graph illustrates two distinct groupings for the clockwise and the counter- clockwise turns which agree with figure 71. The cause of this behavior has not been detemined.
14
5. CONCLUSIONS AND RECOMMENDATIONS.
From this study of flight-ground loads measured on the B-727 N40, the following conclusions can be drawn.
0 Takeoff data had measured accelerations consistent with known reality and calculated maximum pitch rate had an average of 3.43 deg/s for the examined takeoffs with the maximum pitch rate observed being 4.17 deg/s. Although histograms were poor, mean values were consistent with median values. Most attempts at correlating specific event values illustrated a linear relationship, although correlation plots exhibit a great deal of scatter.
0 Landing data were consistent with known reality and measured specific event values for vertical shear were consistent with measured vertical acceleration values. Although histograms were poor, mean values were consistent with determined median values. Specific event vertical shear values correlated fairly well with vertical acceleration and aircraft weight, but touchdown pitch angle correlated poorly.
0 Runway exit time trace data illustrated the expected force-acceleration relationships, and measured side shear correlated very well with measured accelerations. Measured specific event values were consistent with calculated values and a direct relationship was established between exit speed and measured lateral accelerations. Side Shear force correlates well with exit speed and lateral acceleration.
Aircraft braking time trace data illustrated the expected force-acceleration relationships, and measured drag shear correlated well with measured longitudinal accelerations with different relationships being observed for the different levels of bralung. Measured specific event values were consistent with calculated values, with the measured accelerations being consistently higher than the calculated. Attempts to correlate drag force with longitudinal acceleration were difficult due to a small number of tests.
0 S-turn time trace data were consistent with known reality, and measured lateral acceleration agreed well with measured side shear. Main landing gear side shear and axle differential load illustrate a distinct relationship which relates linearly in time. Specific event values for lateral acceleration, main landing gear side shear, &d axle differential load all correlate well, illustrating their interwoven relationship.
0 Minimum-radius turn time trace data was consistent with known reality, and measured nose gear side shear related well with measured nose gear axle differential load, although it is unclear how they relate in time. Specific event
15
values for nose gear side shear and axle differential load agree poorly
Additional takeoff and landing test events would be useful in obtaining better histograms, and therefore more accurate statistical information. Similarly, more runway exit data with many different exit velocities would be useful to allow for more complete correlation plots between landing gear side shear, lateral acceleration, and exit velocity. More consistent braking data would be useful in more accurately predicting drag shear. Multiple braking runs with and without the antiskid device in use could also help determine why different braking slopes give different slope scatter patterns on a correlation plot of longitudinal acceleration versus drag force. Although an obvious relationship between side shear and axle differential load exists, a recalibration of the B-727 landing gear would be needed to obtain the definitive relationship.
16
17
................... : .................... 1 1.. ................ : .................
20
I
.
.
1 TEST69Data
'- - Longitudinal Data Rate = 60 Hz F C = 5 H z - Lateral
- Normal
d o w u 2-0.5 - Longitudinal
- Lateral - Normal
Data Rate = 60 Hz F, = 30 HZ
-1 42 44 46 48
TIME (sec) 50 52
FIGURE 7 . EXAMPLE TO ILLUSTRATE EFFECT OF THE FILTER; F, = 30 HZ
I
d o u u 4-0.5 -1
1 TEST69Data
42 44 46 -48 50 52 TIME (sec)
FIGURE 8. EXAMPLE TO ILLUSTRATE EFFECT OF THE FILTER; F, = 5 HZ
21
Aircraft Takeoff
Acceleration
LEGEND AD = Takeoff Distance P L = Maximum Pitch Rate Vu= Maximum Ground Speed Om= Maximum Pitch Angle N, = Maximum Longitudinal Accel.
Rotation
Climb w -.-. 4 " ........ .8max
a AD -1 a Runway
FIGURE 9. ILLUSTRATION OF SPECIFIC TAKEOFF PARAMETERS
Arrcraft Landing LEGEND N, = Maxirnum Normal Accel. Old= Pitch Angle 63 Touchdown Vd = Ground Speed B Touchdown
Ground Roll
FIGURE 10. ILLUSTRATION OF SPECIFIC LANDING P W T E R S
22
Aircraft Exit
NY
FIGURE 11. ILLUSTRATION OF SPECIFIC RUNWAY EXIT PARAMETERS
Aircraft Braking LEGEND N,= Longitudinal Acceleration V = Velocity t = Time
FIGURE 12. ILLUSTRATION OF SPECIFIC BRAKING PARAMETERS
23
Aircraft S-Turn
LEGEND AXLE DIFFERENTIAL LOAD At = Time V,= Start Velocity N, - Average Lateral Accel. SS, = Average Side Shear ADL = Axle Differential Load A t = t 2 - ti ss,= ss, + ss, ADL = vs, - vsr N,,=gYctYn ssyc= Q L ( t l / r l
%-- ++:w- - - k
---
$ Y l
FIGURE 13. ILLUSTRATION OF SPECIFIC S-TURN PARAMETERS
Aircraft Minimum-Radius Turn
LEGEND A t = arbitmy 10 sec interval VTAN= Nose Gear Path Velocity SS,, = Nose Gear Side Shear ADL = Nose Ge+r Axle
s%, = z:,sL(t)/h Differenual Load
FIGURE 14. ILLUSTRATION OF SPECIFIC MN.MLTM-RADIUS TURN PARAMETERS
24
TST63006
n
bll
G) 0 0
m n
W 3
0.3 0.2 0.1 0
3 -0.1
150
50
0
I0 5 0
0 10 30 40 Time (sec)
20 50 60
0 10 30 40 Time (sec)
20 50 60
- Pi tch Anglc - Roll Anglc
0 10 30 40 Time (sec)
20 50
Data Rate = 30 Hz F, = 5 Hz
FIGURE 15. MULTIPLE 'ITME TRACE DATA PLOT OF A TYPICAL TAKEOFF EVENT
60
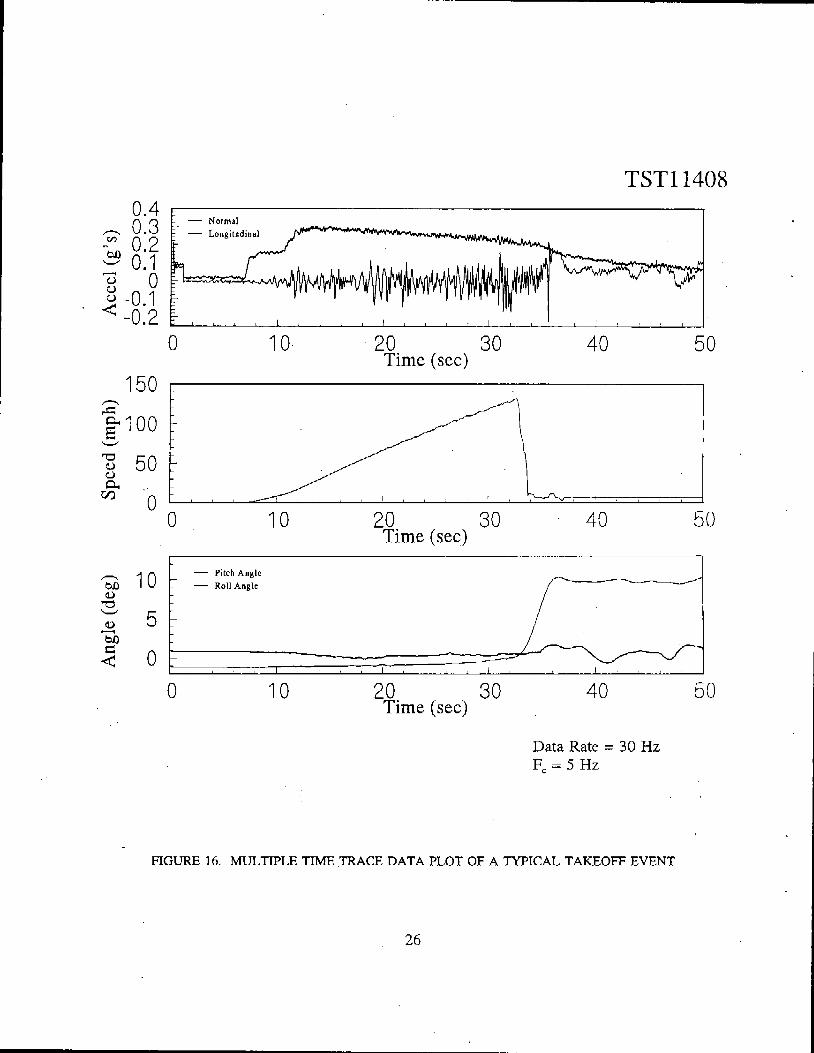
TST11408 0.4
n 0.3 -m 0.2 29 0.1 2; -0.1 -0.2
150
50
0
I0
5
0
- Longitudinal
0 I0 20 30 40 50 Time (sec)
0 I0 20 30 40 50 Time (sec)
!- 1 - Pitch Anglc - Roll Anglc
0 I0 20 30 40 Time (sec)
Data Rate = 30 Hz F, = 5 HZ
50
FIGURE 16. MULTIPLE TIME TRACE DATA PLOT OF A TYPICAL TAKEOFF EVENT
26
15
I0
5
0
-5
- - Pitch Rate (deds) - Pitch Angle (deg)
L
Maximum Pitch -
30
15
I0
5
0
-5
GRAPH 17(a)
GRAPH 17(b)
35 40 Time (sec)
45 50
TST11408 Pitch Data - Pitch Rate (Deg/s) - Pitch Angle (Deg) -
25 30 35 Time (sec)
40 45
FIGURE 17. PITCH ANGLE A N D PITCH RATE DATA OF TWO TYPICAL TAKEOFF EVENTS (a.) TST63MS6 AND (b.) TSTll408
27
N 00
E I Angle
TABLE 1. TABLE OF SPECIFIC EVENT PARAMETERS FOR THE TAKEOFF EVENTS
TST51906 I DFW-13r I X
Peak N x
(P’S)
0.27 0.29 0.29 0.30
0.31
0.285 0.3 1
0.31
0.355
0.22
0.27
0.24
0.285
0.285
0.30
0.37
0.34
0.26
0.235
0.29
0.30
0.285
Max Speed
(rnDh)
124.0
135.2
133.6 . 128.9
128.5 130.4
130.0
128.7
127.3
138.7
138.3 133.6
123.6 133.5
137.7
140.3
133.6
130:3
126.9
131.7
142.2
134.1
Max Pitch Rate
(dee/s) X X
X X X X X
X X 2.67
2.57
2.75 2.74
3.09 4.11
4.63 4.40
3.12
3.17
4.17
3.61
3.66
(deg)
X
X
X X X X X
X 14.5 13.5
14.0
15.0
16.5
17.0
18.0
17.0
14.0
15.0
10.5
15.0
14.5
HISTOGRAM Takeoff Data
6 d k; P
Y t a a = a295 u = 0.0363 M c d h = 0.290 0 = 12
Y t a a = a295 u = 0.0363 M c d h = 0.290 0 = 12
0.21 0.24 0.27 0.3 0.33 0.36 0.39
Peak N, (g’s)
FIGURE 18. HISTOGRAM OF TAKEOFF LONGITUDINAL ACCELERATION SPECIFIC EVENT VALUES
HISTOGRAM Ta kt o ff Data
Q) P
Y t a n = 132-97
M t d k a = 131.6
1 2 3 126 129 1 3 2 1 3 5 138 141 144
Takeoff Ground Speed (mph)
FIGURE 19. HISTOGRAM OF TAKEOFF GROUND SPEED SPECIFIC EVENT VALUES
29

8 r I
6 - -
4 - -
HISTOGRAM Takeoff Data
Mean = 133.81 a = 3.087 Mtdlaa = 133.5
126 128 130 132 1 3 4 136 138 140 142
Adjusted Takeoff Speed (mph)
FIGURE 20. HISTOGRAM OF ADJUSTED TAKEOFF SPEED SPECIFIC EVENT VALUES
HISTOGRAM Ta keo ff Data
3
2
1
0
30444 9 6 c 3003.3
2600 2800 3000 3200 3400 3600
Takeoff Distance {ft)
FIGURE 21. HISTOGRAM OF TAKEOFF DISTANCE SPECIFIC EVENT VALUES
30
HISTOGRAM Takeoff Data
Yuan = 32bO a 4.13 Median = #A5
= 18
U
22 24 26 28 30 3 2 34 36 38
Time t o Liftoff (sec)
FIGURE 22. HISTOGRAM OF TAKEOFF TlME TO LIFTOFF SPECIFIC EVENT VALUES
HISTOGRAM Takeoff Data
4
3
6
rz $ 2
1
Mean = X431 u - 0.791 M d h = 3.17 n = l 3
2.4 2 .E 3.2 3.6 4 4.4 4.0 0
Maximum Pitch Rate (degla)
FIGURE 23. HISTOGRAM OF TAKEOFF MAXIMUM PITCH RATE SPECIFIC EVENT VALUES
31
4 -
3 -
2 -
HISTOGRAM Takeoff Data
Mean = 1597 u - 2.048 Median = 15DO
10 11 12 13 14 15 16 17 1 B 1 9
Maximum Pitch Angle (deg)
FIGURE 24. HISTOGRAM OF TAKEOFF MAXIMUM PITCH ANGLE SPECIFIC EVENT VALUES
4000 I 1 Takeoff Data
t 2 3 5 0 0 1 w 1
8 2 U 2 3000 2z
+ 2500
0 2
0
so 0 ow 0 0 0 0 0 0
0 OO
0
0
2000' ' ' ' ' ' ' ' ' " " ' ' " " ' ' ' '
100 110 120 130 140 150
Takeoff Speed (mph)
FIGURE 25. CORRELATION PLOT OF TAKEOFF DISTANCE AND TAKEOFF SPEED
32
3500 I
n
5 5 n
y 3000
U .- rn
0 0 I Takeoff Data L
-
E 3 2500 b 3
-
0 0 0
0 00 0 0
0 0
0
2000' ' " ' I ' ' ' " ' ' " ' ' I
115 120 1 25 130 135
Aircraft Weight (kips)
FIGURE 26. CORRELATION PLOT OF TAKEOFF DISTANCE AND AIRCRAFT WEIGHT
33
TEST70 0.4
% 0.2 -
30 20
r.
3 3 0 -0.2
2 -0.4 I
I Left Main Gear
: - Lcft Axle ! - RightAxlc
-
30 20
4 u
30 20 I0 0
I Left Main Gear
: - Lcft Axle ! - RightAxlc
30 20 I0
I Right Main Gear
L 1
Lcft Axlc ! I Right Axlc
Data Rate = 30 Hz F, = 5 Hz
1
I Right Main Gear - - Lcft Axlc I - Right Axlc
-
-
I , , , , I ,
FIGUR.E 27. MULTIPLE TIME TRACE DATA PLOT OF A TYPICAL LANDING EVENT
34
TEST62
I Right Main Gear Lcft Axlc - _
- - Right Axlc
I
-
I , l , . I
0.3 n 0.2 mm b.0 0.1 - A
'g -0.1 2 -0.2 -0.3
40 30 20 I0 0
40 30 20 I0 0
I , , , , I , . , , I , I , , I . \ , I " . . '
0 5 I 0. 15 20 25 30 Time (sec)
Left Main Gear Lcft Axlc - RighrAxlc
0 5 15 20 Time (sec)
I0 25 30
0 5 15 20 Time (sec)
I0 25
Data Rate = 30 Hz F C = 5 ' H z
30
FIGURE 28. MULTIPLE TIME TRACE DATA PLOT OF A TYPICAL LANDING EVENT
35
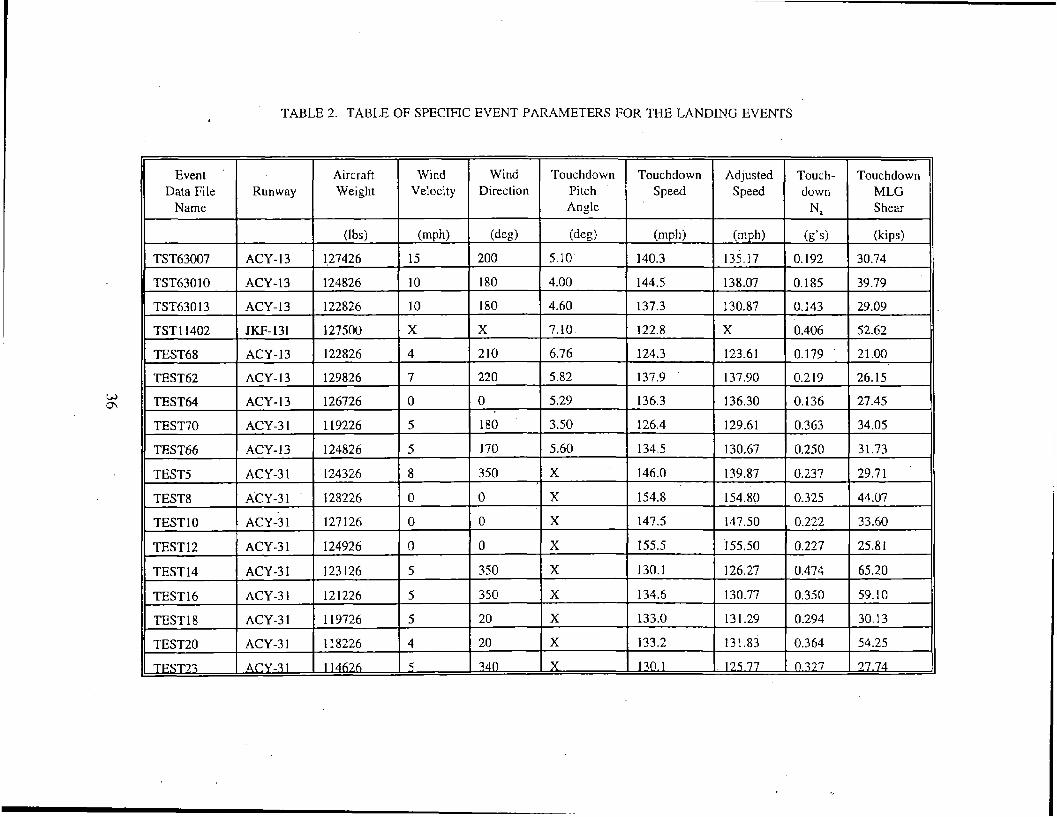
TABLE 2. TABLE OF SPECIFIC EVENT PARAMETERS FOR THE LANDING EVENTS
Ai,rcraft Wind Wind Runway Weight Velocity Direction
Event Data File
Name
Touchdown Pitch Angle
Touchdown Speed
1 ACY-13 I 122826 1 4 1 210 I 6.76
Adjusted Speed
Touch- down
Nz
k's)
0.192
0.185
0.143
0.404
0.179
0.219
0.136
0.363
0.250
0.237
0.325
0.222 ' 0.227
0.474
0.350
0.294
0.364
1) 77.7
Touchdown MLG Shear
(kips)
30.74
39.79
29.09
52.62
21 .oo 26.15
27.45
34.05
3 1.73
29.71
44.07
33.60
25.81
65.20
59.10
30.13
54.25
77.74
ACY-13
ACY-13
ACY- 13
JKF-131
(lbs) ( W h ) (d%) (deg)
1,27426 15 200 5.10
124826 10 180 4.00
122826 10 180 4.60
I27500 X X 7.10
TST63007
144.5 138.07
130.87
X
TST630 10
TST630 13
TSTl1402
137.3
122.8
124.3 123.61 TEST68
TEST62
TEST64
137.9 137.90
136.30
129.61
136.3
126.4 TEST70
TEST46 134.5
146.0
130.67
139.87 TEST5
TEST8 154.8
147.5
' 155.5
154.80
147.50 TEST 10
TEST 12 ' 155.50
126.27 130.1 TEST 14
TEST 1 6 134.6 130.77
131.29 133.0
133.2
TEST18
TEST20 131.83
L125&77 _TEST23
Landing Data 70
50 6o I 0
0
0 0
2o I,, , , , , , , , o , , , , , , , , , , ;, , , , , , , , , , , 10
fl V-SHEAR (kips)
0 10 20 30 40 50 60 70
Calculated
FIGURE 29. COMPARISON OF MEASURED AND CALCULATED VERTICAL SHEAR AT TOUCHDOWN
HISTOGRAM Landing Data
Mcoa = 5-328 u = 1.18 M t d h = 5-29 0 = 9
3 r
3.5 4.2 4.9 5.6 6.3 7 7.7
TD Pitch Angle (deg)
FIGURE 30. HISTOGRAM OF LANDING TOUCHDOWN PITCH ANGLE SPECIFIC EVENT VALUES
37
HISTOGRAM Landing Data
h u
6
4
2
0
Yein = 137.0
M t d h = 135.45 = 9.10
120 126 132 138 1 4 4 150 156
TD Ground Speed (mph)
FIGURE 31. HISTOGRAM OF LANDING TOUCHDOWN GROUND SPEED SPECIFIC EVENT VALUES
HISTOGRAM Landing Data
M t m = 134-6 a = 9-36 Mtdlao 131.83
,6 o = 17
4
2
0 120 126 132 138 1 4 4 150 156
Adjwsted TD Speed (mph)
FIGURE 32. HISTOGRAM OF LANDING ADJUSTED TOUCHDOWN SPEED SPECIFIC EVENT VALUES
38
HISTOGRAM Landing Data
FIGURE 33. HISTOGRAM OF LANDING NORMAL ACCELERATION SPECIFIC EVENT VALUES
Mean = Lf7 u 0-0943 Mtdfaa = 42435 o = 18
6
5
4
3
2
1
0.12 0.18 0.24 0.3 0.36 0.42 0.48
Peak N, (g's)
HISTOGRAM Landing Data
r Mean = 36A4 u = 1x3 Median = 31935 0 = 18
"
16 24 32 4 0 , 40 56 64 7 2
TD V-Shear (kips)
FIGURE 34. HISTOGRAM OF LANDING TOUCHDOWN VERTICAL SHEAR SPECIFIC EVENT VALUES
39
7 ;
0 0 Q
0 0
0
0
70
60
50
0
f Landing Data :
:- 1
r = 0.512 0 ' " ~ ' ' ' 1 ~ ' ' ' ' ' ' ' ' " ' " ~ ~ I . , . . .
110 115 120 125 130 135 140
AC Weight (kips)
40
30
20
10
FIGURE 35. CORRELATION PLOT OF PITCH ANGLE AND A I R C m WEIGHT AT TOUCHDOWN
1 1
1
:
0
0
0 0
0 0
0
r = 0.784 0 " . ' . ' I . ' . " " " ' 2 I , . 1 .
0 0.1 0.2 0.3 0.4 0.5 0.6
Peak N, (g's)
FIGURE 36. CORRELATION PLOT OF VERTICAL SHEAR AND NORMAL ACCELERATION AT TOUCHDOWN
40
0.2 0.1
0
-0.1
-0.2
50 40 30 20 10 0
50 40 30 20 10 0
I0 5 0 -5
-1 0
TST62901
- Latcral Normal - I
10 15 20 25 Time (sec)
30 35 40
Left Main Gear
c - Ltfr Axlc I Right Axlc
0 10 20 30 40 Time (sec)
[ Right Main Gear
- Ltlt A x l t . - Right Axlc
0 10 20 Time (sec)
30 40
- Left Main Gcar - I - Right Main Gcar
I , , < , I
10 15 20 25 Time (sec)
30 35 40
Data Rate = 30 Hz F , = 5 H z
FIGURE 37. MULTIPLE TIME TRACE DATA PLOT OF A TYPICAL RUNWAY EXIT AT 40 KNOTS
41
TST62904 0.3 t I - 0.2
a 0 -0.1 < -0.2
VJ - W 0.1 3
u
10 15 20 25 30 35 Time (sec)
50 40 30
10 ? + o
n
.r3
6) 2 20 c
10 15 20 25 30 35 Time (sec)
50 cr, 40 3 30 2 20
10 “;1 s o
n rn .,+
10 15 20 25 30 35 Time (sec)
- Lclt Main Gear
10 15 20 25 30 35 Time (sec)
Data* Rate = 30 Hz F, = 5 HZ
FIGURE 38. MULTIPLE TIME TRACE DATA PLOT OF A TYPICAL RUNWAY EXIT AT 50 KNOTS
42
TST62907 0.3 0.2 0.1 0
-0.1
50 40 30 20 10 0
50 40 30 20 10 0
I
Y 1 1 t 1 I I I - , , , , . , , , , , I . , , I , . I
5 10 15 20 Time (sec)
25 30
I
I I L / I ' I I
10 15 20 25 30 5 Time (sec)
Right Main Gear
, . . ,
10 15 20 25 30 5 Time (sec)
10 15 20 25 30 5 Time (sec)
Data Rate = 30 Hz F , = 5 H z
43
0.3 n 0.2 vl h
W ba 0.1
-0.1 < TST62904 - 50 Knot - Lateral Acceleration
1 - Side Force Coefficient
-0.2 0
GRAPH 40(a)
0.4 0.3
W - Q) 0.1
-0.1 -0.2
i o 20 30 40 Time (sec)
50 60
t I
TST62907 - 60 Knot - Lateral Acceleration - Side Porce Coefficient
I , , . , l , , , , I , , , , I , , , , 1 , , , ,
0 I0 20 30 40 50 60 Time (sec)
GRAPH 40(b)
FIGURE 40. COMPARISON IN TIME OF SIDE FORCE COEFFICIENT AND LATERAL ACCELERATION FOR (a.) TST62904 AND (b.) TST62907
44
0
n
-30 v3 A 60 Knot 0 50Knot 0 40 Knot i
-40 0 0.05 0.1 0.15 0.2 0.25 0.3
FIGURE 41. CORRELATION IN TIME OF SIDE SHEAR AND LATERAL ACCELERATJON
45
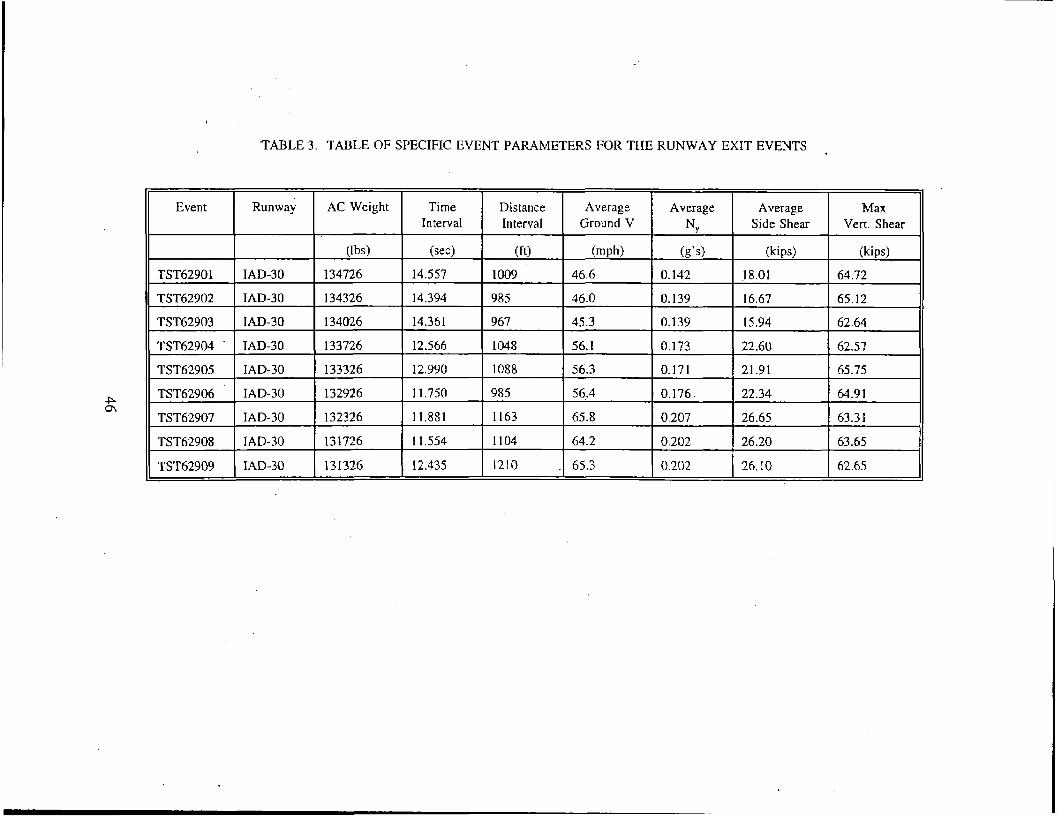
TABLE 3. TABLE OF SPECIFIC EVENT PARAMETERS FOR THE RUNWAY EXIT EVENTS .
Event I Runway I AC Weight Average Ground V
~~
Max Vert. Shear
Time Distance Interval Interval
Average Average N" Side Shear
(mph)
46.6 14.557
14.394
TST62901 IAD-30 134726
TST62902 IAD-30 134326 46.0 65.12
62.64
62.57
45.3 14.361
12.566
12.990
56. I
56.3
0.173 22.60
0.171 1 21.91 65.75 133326
11.750 I 985 56.4 64.9 1
63.31 P m
65.8
64.2
0.207 26.65
11.554 63.65
62.65 12.435 I 1210 65.3 131326 0.202 26.10
0'"' " " " " " " " " " "
0 0.05 0.1 0.15 0.2 0.25 Calculated
FIGURE 42. COMPARISON OF MEASURED A N D CALCULATED AVERAGE LATERAL ACCELERATION
0.2
0.15 LI
Lo s FQ
2 0.1
* 0.05
Exit Data 30 L
-
-
; -
Exit Data 0.25 r
25
20
15
-
-
-
1 , . , , , , , , , , , , , , S ; S H E i y k i p s ) 1 5 1 C 15 20 25 30
0 0
Calculated
FIGURE 43. COMPARISON OF MEASURED AND CALCULATED AVERAGE SIDE SHEAR
47
0.25
0.2
c
- 0.15 rA
M W
z" 0.1
0.05
0
FIGURE 44. CORRELATION PLOT OF EXIT GROUND SPEED AND LATERAL ACCELERATION
Exit Data
- &
f3
@ -
I On a Given Exit
ofExit Speed - N is a Direct Function
I . 1 / I 1 1 . I . I
30 1 Exit Data
15
10
20 25 i ';
-
0 ' ' ' ' " ' : ' " ' ' ' ' ' ' ' ' 1 ' ' ' '
0 0.05 0.1 0.15 0.2 0.25
FIGURE 45. CORRELATION PLOT OF SIDE SHEAR AND LATERAL ACCELERATION
48
Exit Data 25
10
5 :
20 i -
s"
0 0 10 20 30 40 50 60 70
Exit Speed (mph)
FIGURE 46. CORRELATION PLOT OF SIDE SHEAR A N D EXIT GROUND SPEED
49
TEST24 0.4 r 0.2 0
-0.2 -0.4 -0.6
35 40 45 Time fsecl
50 55
150 I
35 40 45 50 55 Time (sec) *'
15 : -
10 1
5 1
0-
Right Main Gear Left Axlc Right Axlc -
35 40 45 50 55 Time (sec)
20 15 - Lclt Axlc
I0 5 0
35 40 45 Time (sec)
50
Data Rate = 30 Hz F , = 5 H z
55
FIGURE 47. MULTIPLE TIME TRACE DATA PLOT OF A HEAVY BRAKING EVENT
50
TEST70
150
100
50
7
: I / I
V
20
10 8 6 4 2 0
30 40 50 Time (sec)
60 70
1
- Lclt Axle
40 50 60 70 20 30 Time (sec)
F- Left Main- Gear ~ ,A
60 70 ime (set)
Data Rate = 30 Hz F C = 5 H z
FIGURE 48. MULTIPLE TIME TRACE DATA PLOT OF A NORMAL BRAKING EVENT
51

TEST20
-0.4
0.2 0
-0.2 - Longitudinal
Normal - -
100
50
Right Axlc
2 -
:
1
1 , I I
Data Rate = 30 Hz F , = 5 H z
6 -
0 I I
- Right Main Gear - Lcft AXIC
6 - 4 - 2 -
FIGURE 49. MULTIPLE TIME TRACE DATA PLOT OF A LIGHT BRAKING EVENT
- Left Main Gear - Lclt Axle
Right Axlc - -
52
n
a 24
v3
-4
J
r! v3
d
60
50
40
30
20
I0
t
0 A 0
- Braking Data U
TEST24 - Heavy TEST70 - Normal TEST20 - Light
0 -0.6 -0.5 -0.4 -0.3 -0.2 -0.1 0
FIGURE 50. CORRELATION IN TIME OF DRAG SHEAR AND LONGITUDINAL ACCELERATION
53
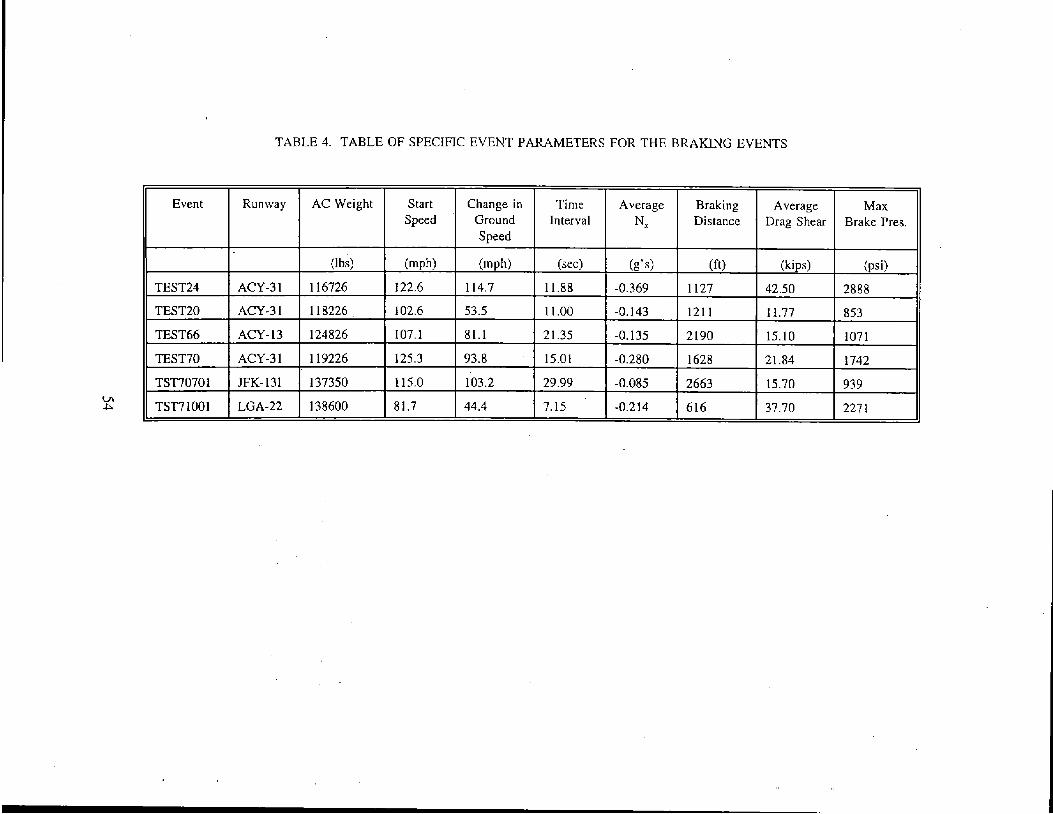
TABLE 4. TABLE OF SPECIFIC EVENT PARAMETERS FOR THE BRAKING EVENTS
Runway AC Weight
LGA-22 138600
Event Start Speed
Change in Ground Speed
Max Brake Pres.
Time Average Interval N x
(psi)
2888 TEST24 42.50
11.77
2190 15.10
TEST20 ACY-31 I 118226 102.6 53.5 a53
1071 TEST46
TEST70
107.1
125.3
81.1
93.8 15.01 -0.280 21.84
2663 15.70
37.70
1742
93 9 TST7070 1 JFK-131 1' 137350 115.0 103.2 29.99 -0.085
-0.214 wl P TST7 100 1 44.4 81.7 227 1
Braking Data
3 -0.2 2
5 -0.3
CT)
cd
- 0 , I
-
0
-0.1 1
40
30
20
10
-
-
-
- '
0
0 0
0
0
FIGURE 51. COMPARISON OF MEASURED AND CALCULATED AVERAGE LONGITUDINAL ACCELERATION
Braking Data 50 i
0 0 0
0
0
0
D-SHEAR (kips)
0 10 20 30 40 50 Calculated
' FIGURE 52. COMPARISON OF MEASURED AND CALCULATED AVERAGE DRAG SHEAR
55
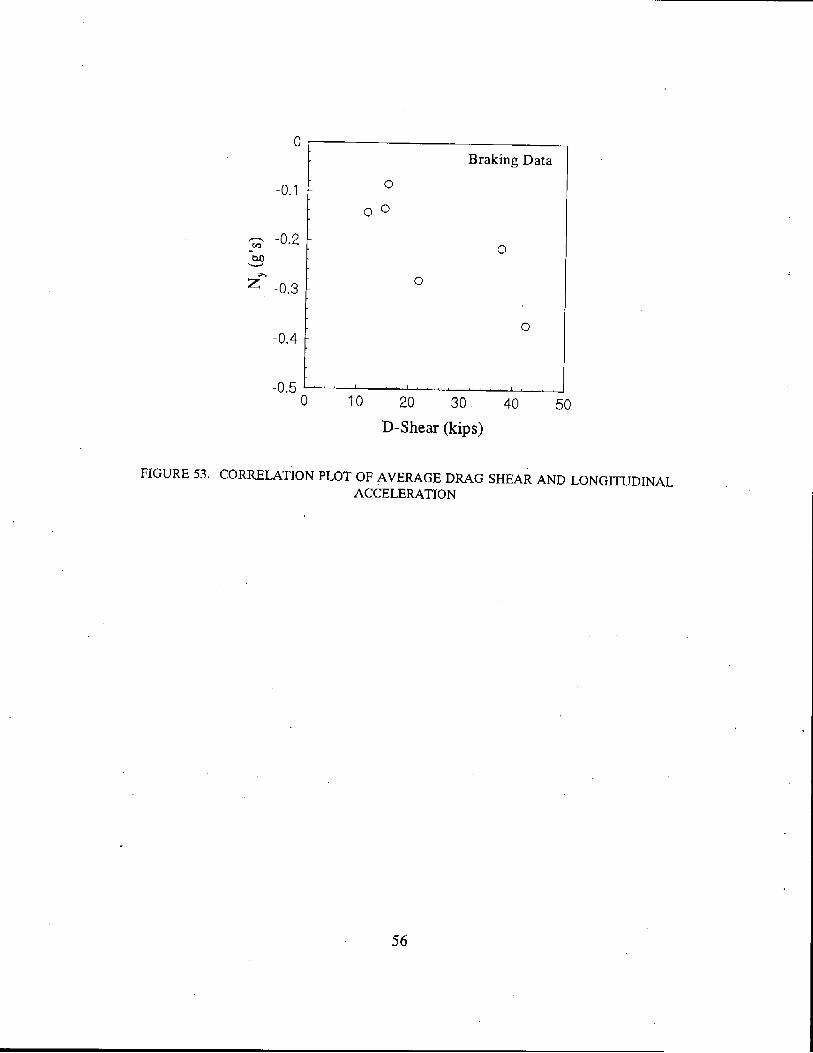
FIGURE 53.
-0.1
0 1
-
I t - -0.2 v1 - . M v
z" -0.3 1 1 -0.4
Braking Data
0
0 0
0
0
0
0 I 0 20 30 40 50 D-S he ar (kips)
CORRELATION PLOT OF AVERAGE DRAG SHEAR AND LONGITUDINAL ACCELERATION
56
TST7111 0.2 - 0.15
v1
"M W 0.1 Z 0.05
0 -0.05
0
2
50 40 30 20 10 0
50 40 30 20 10 0
20 15 10 5 0 -5
-1 0
Left Main Gear
- Left Axlc - Right Axle
l , , , , l , , , , l , , , , l , , , , l , , , ~ l , ~ ~ ~ l ~ ~ ~ I I I I I 1 I , , , , I I I . ' " ' > ' , , I
20 30 40 50 60 70 80 90 100 110 120 130 Time (sec)
c I
- Left Axle - Right Axlc ~ , , , , ~ , , , , ~ 1 , , , 1 , , , , 1 1 , , , 1 1 , 1 , I I L 1 8 I 1 I I 9 1 % I 1 1 ' 1 " 7 ' 1 1 1
20 30 40 50 60 70 80 90 100 110 120 130 Time (sec)
- Lcft Main Gear
20 30 40 50 60 70 80 90 100 110 120 130 Time [sec)
Data Rate = 30 Hz Fc = 5 -Hz
FIGURE 54. MULTIPLE TIME TRACE DATA PLOT OF A TYPICAL S-TURN AT 40 KNOTS
57
TST7103
c - Lclt Axlc : - RightAxlc -
-0.1 1 - Latcral
-0.2 - , ' ' ' I ' ' ' ' ' ' ' ' ' I ' ' ' ' ' ' ' ' ' 1 ' ' ' ' ' ' ' ' ' ' ' ' ' ' ' ' I 1 j ' ' I 1 I I , L I I I , , I , ,
40 50 60 70 80 90 30 Time (sec)
50 1 Left Main Gear
-1 u - Right Axle
0
50 40 30 20 10 0
15 10 5 0 -5
-1 0 -1 5
30 - 40 50 60 70 80 Time (sec)
90
Data Rate = 30 Hz F , = 5 H z
FIGURE 55. ' MULTIPLE TIME TRACE DATA PLOT OF A TYPICAL S-TURN AT 60 KNOTS
58
0.2 0.1
0
-0.1 -0.2
60 50 40 30 20 10 0
60 50 40 30 20 10 0
25 20 15 10 5 0
-5
TST63008
- Lateral
30 40 50 60 Time (sec)
70 .80
Left Main Gear - Lcft Axlc
I , .
30 40 50 60 70 80 Time (sec)
L
- t c f t A X l C
- Lcft Main Gcar - Right Main Gcar
30 40 50 60 70 80 Time (sec)
Data Rate = 30 Hz F , = 5 H z
FIGURE 56. MULTIPLE TIME TRACE DATA PLOT OF A TYPICAL S-TURN AT 80 KNOTS
59
0.3 0.2
--- 0.1 - 0 a b13 W
0 4-0.1 -0.2 -0.3
- Lateral Acceleration - Side Force Coefficient
20 30 40 50 60 70 80 90 I00 Time (sec)
GRAPH 57(a)
0.2
'v; 0.1
4-0.1
-0.2
TST63008 - 80 Knot - Lateral Acceleration - Side Porce Coefficient
20
GRAPH 57(b)
30 40 50 60 Time (sec)
70 80
FIGURE 57. COMPARISON IN TIME OF SIDE FORCE COEFFICIENT AND LATERAL ACCELERATION FOR (a.) TST7103 AND (b.) TST63008
60
20
I0
0
-1 0
RIGHT MAIN GEAR - SIDESHEAR t - AXLE LOAD DFF.
GRAPH .%(a)
n
a v3
3 w Tts cb
20
I0
0
-1 0
1 LEFT MAIN GEAR L - Side Shear - Axle Differential
20 40 60 80 I00 120 Time (sec)
GRAPH 58(b)
FIGURE 58. SIDE SHEAR AND AXLE DIFFERENTIAL LOAD PLO'ITED IN TIME FOR THE TWO MAIN LANDING GEAR; 40-KNOT S-TURN
61
- Side Shear
30 40 50 60 70 80 90 Time (sec)
GRAPH 59(a)
30 40 50 60 70 80 90 Time (sec)
GRAPH 59(b)
FIGURE 59. SIDE SHEAR AND AXLE DIFFERENTIAL LOAD PLOTTED IN TIME FOR THE TWO MAIN LANDING GEAR; 60-KNOT S-TURN
62
-. . . . .. . . . - .- . . . -. - - .. . . .. . . . . . . . .
30
'v; a 20
0
1 RIGHT MAIN GEAR - - Side Shear - Axle Differential 1
30 40 50 60 70 80 Time (sec)
GRAPH 60(a)
30
" 20 a .d
A4 J
2 I0 3
0
LEFT MAIN GEAR - Axle Differential
30 40 50 60 - 70 80 Time (sec)
GRAPH 60@)
FIGURE 60. SIDE SHEAR AND AXLE DIFFERENTIAL LOAD PLOITED IN TIME FOR THE TWO MAIN LANDING GEAR; 80-KNOT S-TURN
63
40
30
20
10
0 A 0 0
S-Turn Data
A A
AA
80 Knot 60 Knot 40 Knot
017
-1 0 -0.1 -0.05 0 0.05 0.1 0.1 5
FIGURE 61. CORRELATION IN TIME OF SIDE SHEAR AND LATERAL ACCELERATION
64
n
a v3
s J
d) k
20
15
I0
5
0
A 80Rnot 0 60Knot 0 40Knot
0 5 I0 15 Side Shear (kips)
20
FIGURE 62. CORRELATION IN TIME OF SIDE SHEAR AND AXLE DIFFERENTIAL LOAD
65
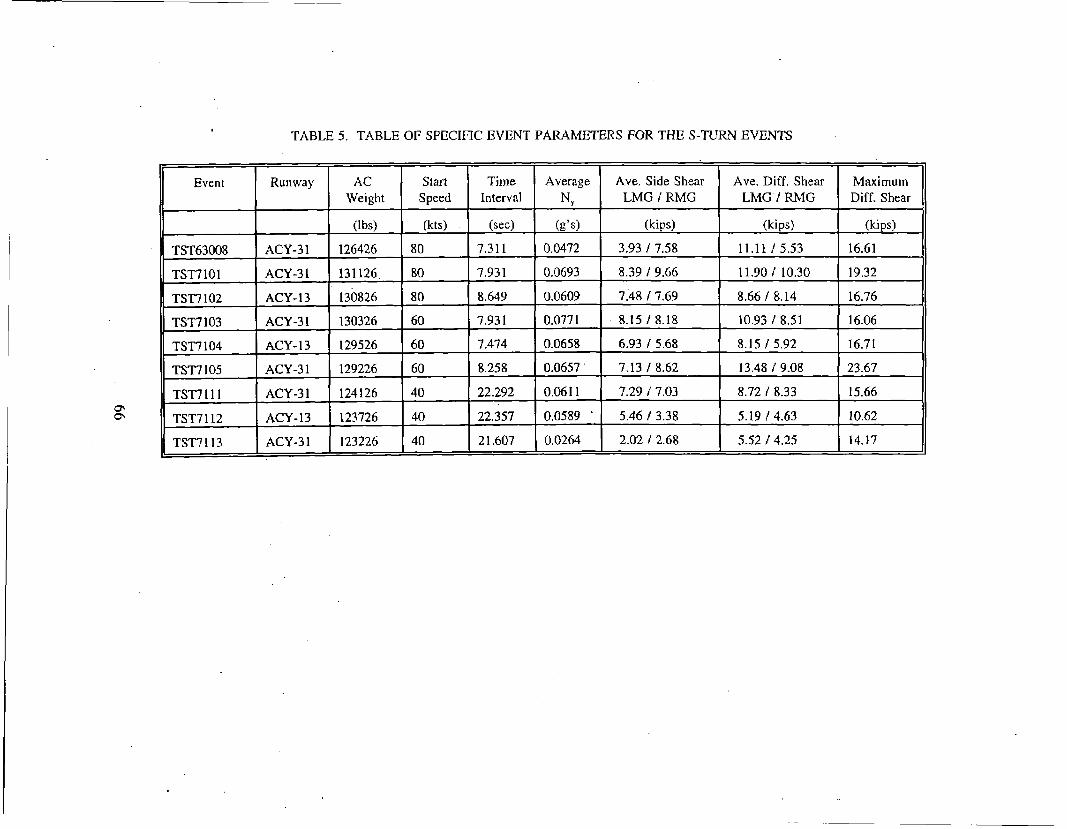
TABLE 5 . TABLE OF SPECIFIC EVENT PARAMETERS FOR THE S-TURN EVENTS
TST7 104 ACY-13
TST" 105 ACY-3 1
TSl7lll ACY-3 1
TST7112 ACY- 13
i TST7113 ACY-3 1
11 Event 1 Runway
TST63008
TSnlOl
TS'I"102
TSl7 103
ACY -3 1
ACY-3 I
ACY-13
ACY-3 1
Ave. Diff. Shear Maximum LMG / RMG Diff. Shear
(kips) (kips)
1 1 . 1 1 I 5 . 5 3 16.61
11.90 / 10.30 19.32
8.66 / 8.14 16.76
13.48 / 9.08 23.67
5.19 14.63
5.52 I 4 . 2 5 14.17
m P
Side Shear (kips) 2 A
0 r n 0 u7 0 0
0
N 0
'X h
P 0 cn
P 0 OD
0 2
0
0
0
Calculated
Iu 0 -37 0 u1 0
2 3
0
u1
A
0
_1
ul
10 0
0
0
0
0
O0 0
0
: S-TurnData 0 0
2o i l 5 F
i!
0
0 00
0
0 i 0 5 10 15 20 2
Side Shear (kips)
FIGURE 65. CORRELATION PLOT OF SIDE SHEAR AND AXLE DIFFERENTIAL LOAD
68
TEST32 15 I0 5 0 -5
15
I0
5 0
10
5 0
-5
L
I0 20 30 40 50 60 70 80 90 Time (sec)
0
I NoseGear - - Lcft Axlc - - Right Ax le
1 1 1 1 1 1 1 1 1 ~ ~ ' ~ " " " " " " " ' ' ~ ~ ' ' 1 ' " '
I0 20 30 40 50 60 70 80 90 Time (sec)
0
Nose Gear
0 I0 20 30 40 50 60 70 80 90 Time (sec)
Data Rate = 30 Hz F , = 5 H z
nGURE 66. MULTIPLE TIME TRACE DATA PLOT OF A TYPICAL MINIMJM-RADIUS TLTRN; CCW
69
TEST34 15 1 I
Nose Gear 2 - - Lcft Axle
0 r s t
- Right Axle " " " 1 1 1 1 1 1 1 ~ 1 1 1 1 ~ I I I I I I 1 1 I I I I I I I , , I I I I I I I I I , I 1 , , I I , L , , l , , , , , , , , ,
0 I0 20 30 40 50 60 70 Time (sec) 2 -
-6 - NoseGear 1 1 1 1 1 1 1 1 1 , 1 , , , , , , , , , ~ , , , , , , , , 1 ~ 1 , , , , , , , 1 , , , , , , , , ,
0 I0 20 30 40 50 60 70 Time (sec)
Data Rate = 30 Hz F, = 5 Hz
l?IGURE 67. MULTIPLE TIME TRACE DATA PLOT OF A TYPICAL MINIMUM-RADIUS TURN; CW
70
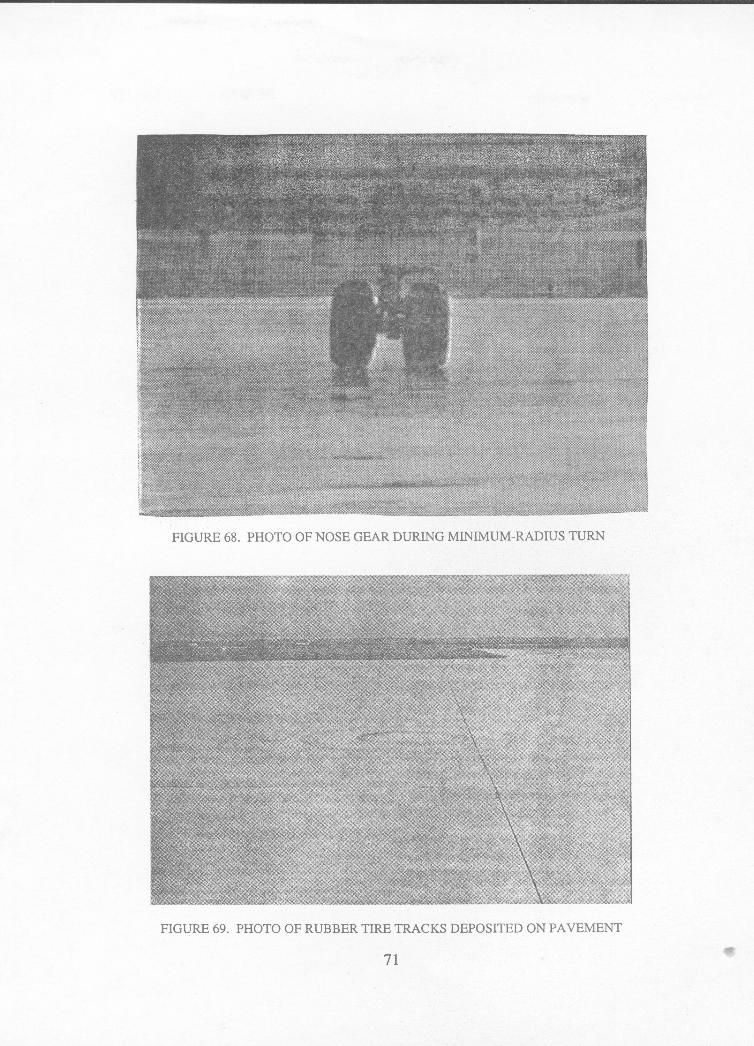
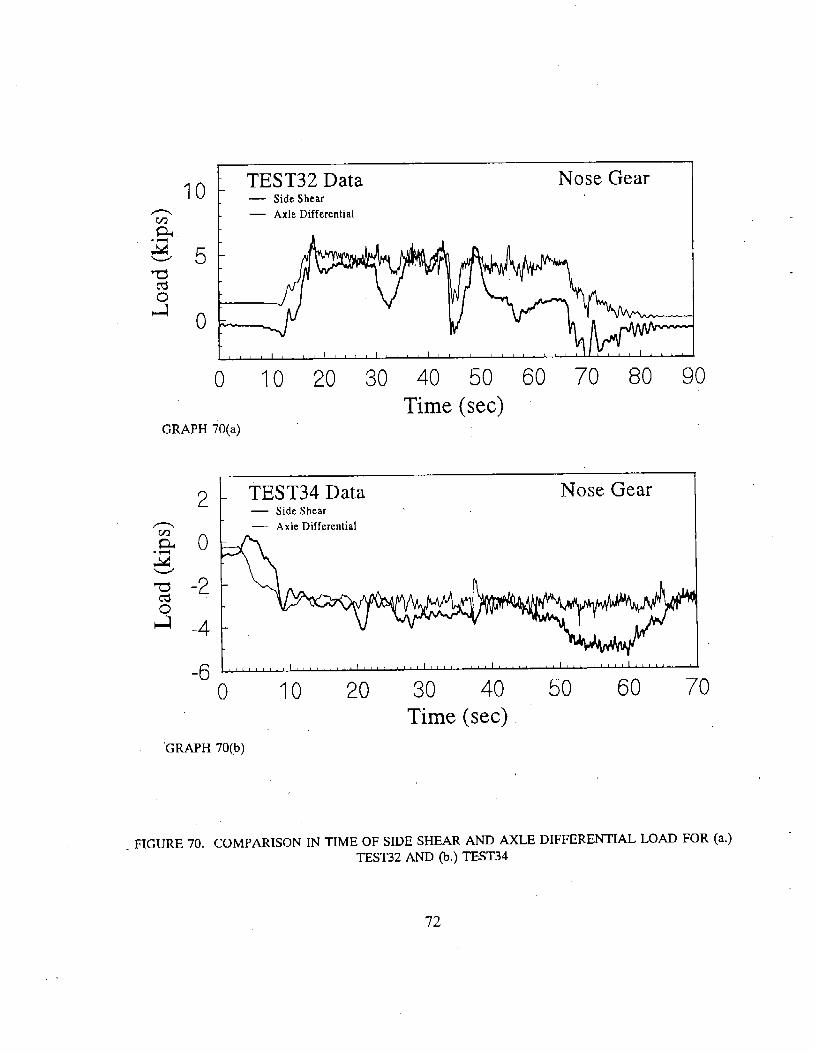
I0 n m pc 2 3 5 Td
TEST32 Data - Side Shear - Axle Differential
Nose Gear
0 I0 20 30 40 50 60 70 80 90 Time (sec)
GRAPH iO(a>
2 TEST34Data Side Shear -
Nose Gear
n - Axle Differential
K O 2 - -2 W
cd
8 -4
0 I0 20 30 40 50 60 70 Time (sec)
-6
GRAPH 70(b)
- FIGURE 70. COMPARISON IN TIME OF SIDE SHEAR AND AXLE DIFFERENTIAL LOAD FOR (a.) TEST32 AND (b.) TEST34
7 2
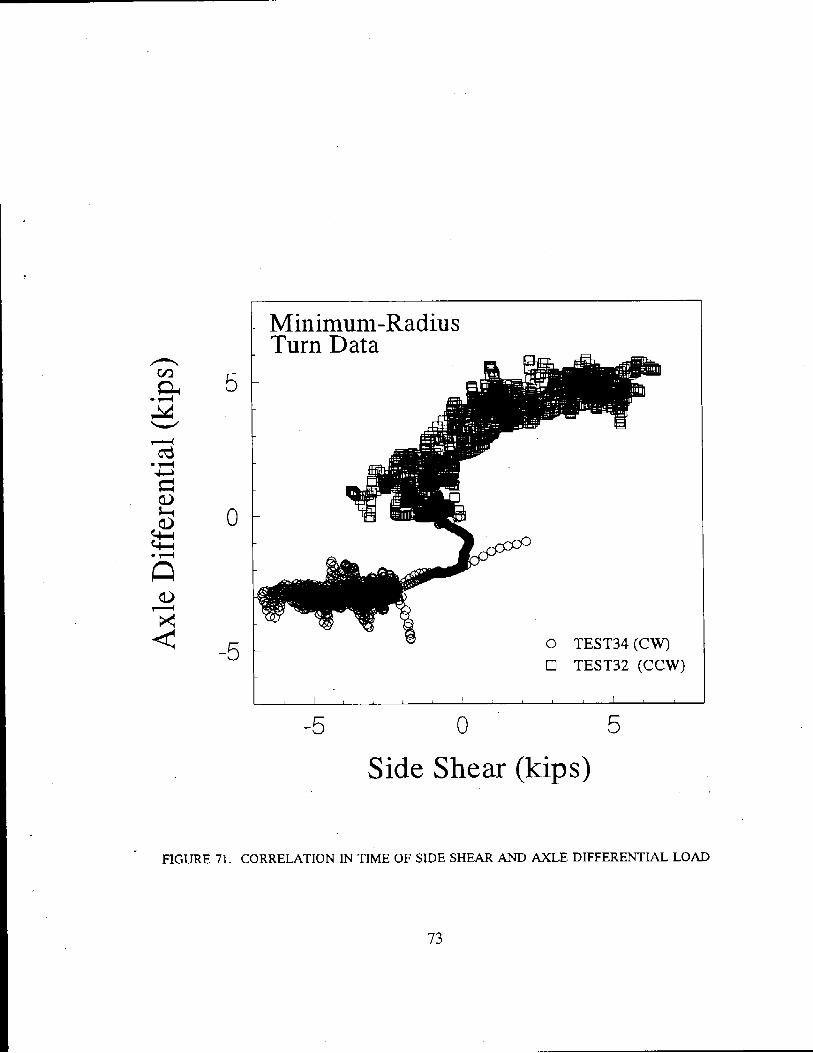
9-
44 J
4) 1
5
0
-5
Minimum-Radius Turn Data
0 TEST34(CW) 0 TEST32 (CCW)
I I I
-5 0 5 Side Shear (kips)
FIGURE 71. CORRELATION IN TIME OF SIDE SHEAR AND AXLE DIFFERENTIAL LOAD
73
. ..
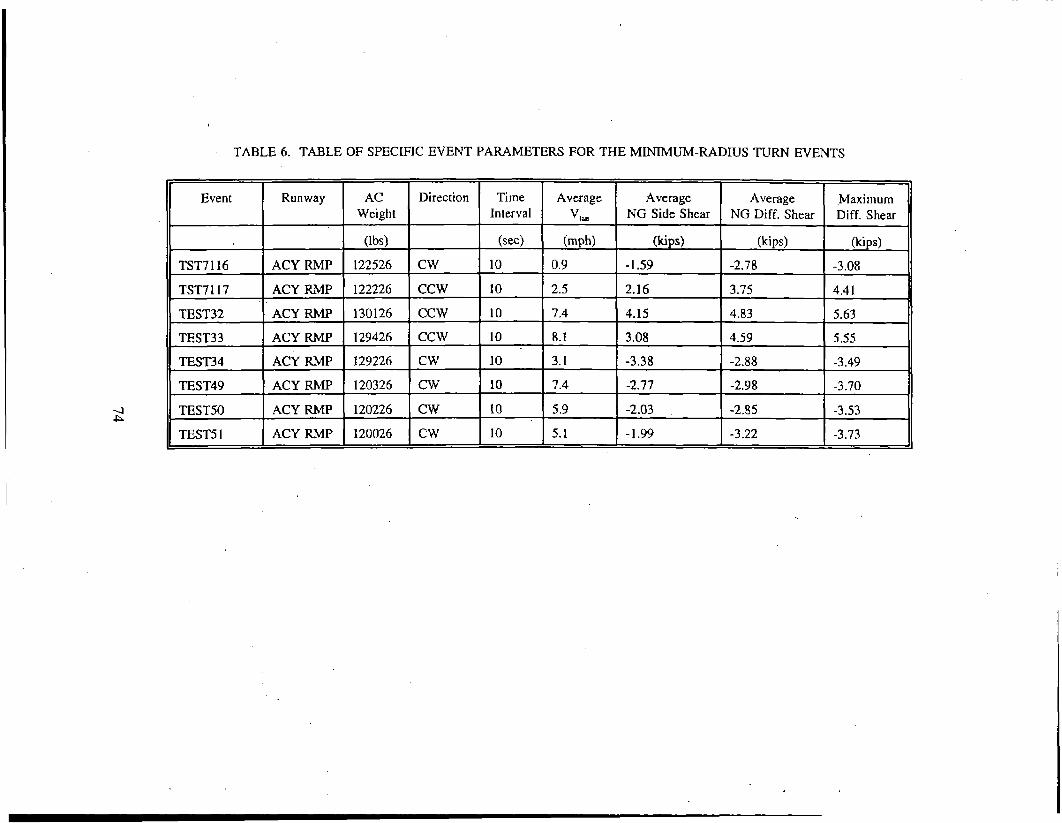
TABLE 6. TABLE OF SPECIFIC EVENT PARAMETERS FOR THE MJNIMUM-RADIUS TURN EVENTS
Event Runway
TST7116 ACY RMP
AC Weight
(lbs)
122526
122226
130126
TST7117 ACY RMP + TEST32 ACY RMP
Direction Time Interval
(set)
CW 10
CCW 10
CCW 10
TEST49 ACY RMP
ACY RMP
129226 I zz 1 ii 120226 CW
120026 CW
~ 120326
2.5
7.4
8. I
3. I
~ 7.4
1 5.9
5.1
Average NG Side Shear
2.16
4.15
3.08
-3.38
-2.77
-2.03
- 1.99
Average 1 Maximum 11 NG Diff. Shear Diff. Shear
4.59 5.55
-2.88 -3.49
-2.98 -3.70
-2.85 -3.53
-3.22 -3.73
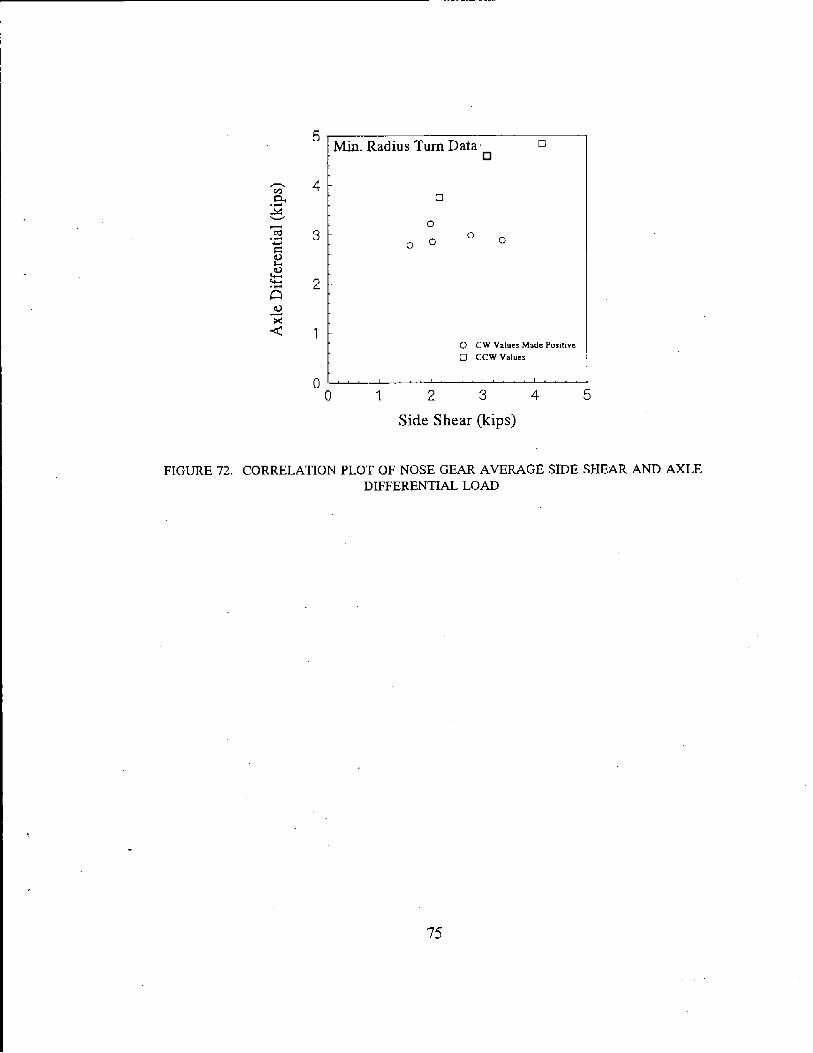
- Min. Radius Turn Data 0
3 t
2 -
1 - 0 CW Values Made Positive 0 CCWValues
v
0 1 2 3 4
Side Shear (kips) 5
FIGURE 72. CORRELATION PLOT OF NOSE GEAR AVERAGE SIDE SHEAR AND AXLE DEFERENTIAL LOAD
75

'APPENDIX A
Listing of Tests

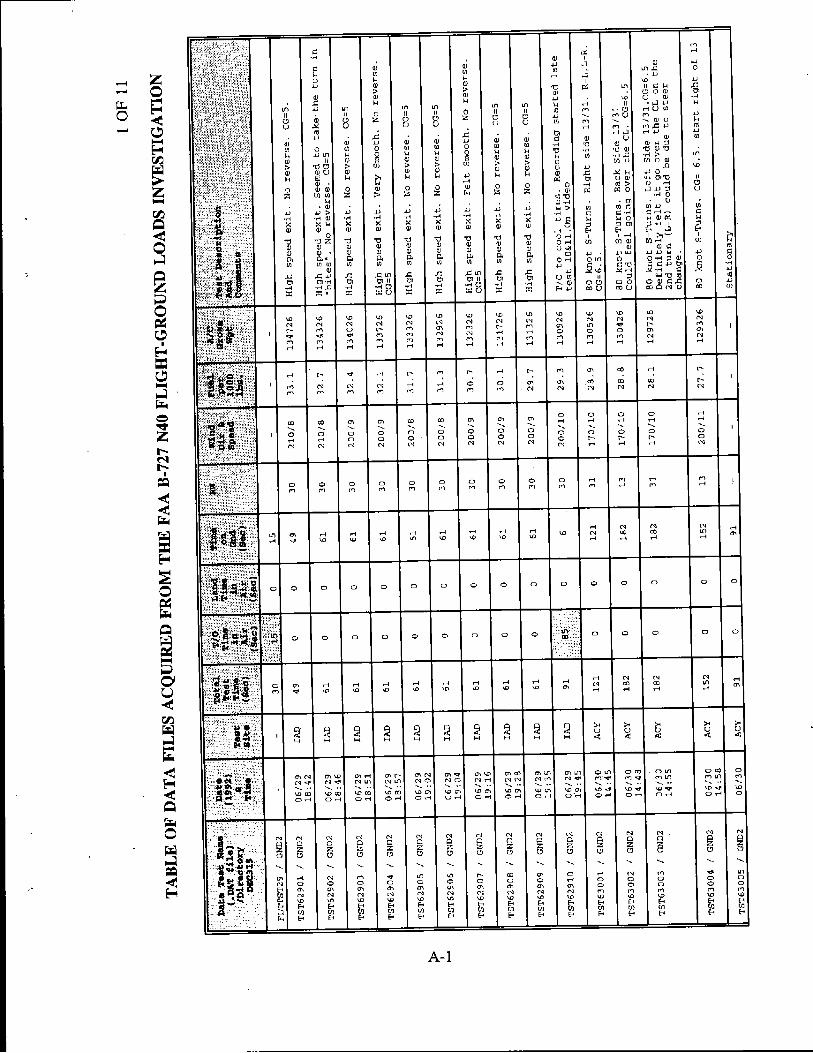
A- 1
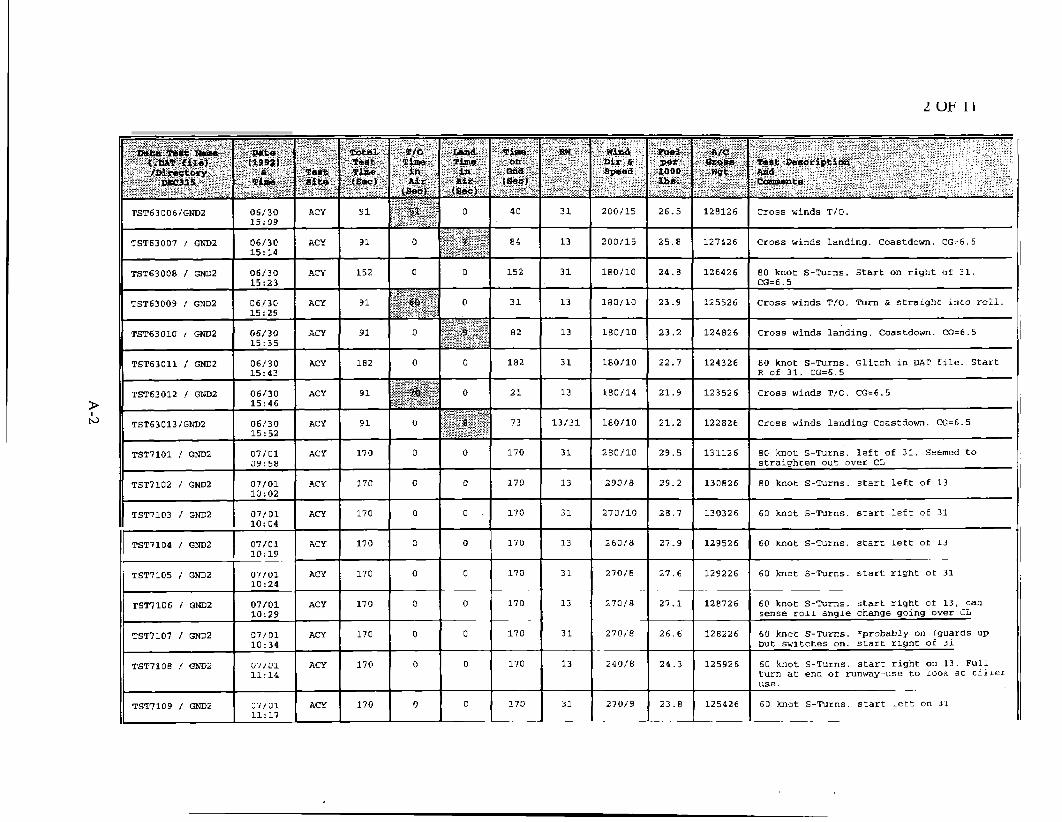
2 0 F 11
ACY 170 0 0 170 13 26018 27.9 129526 60 knot S-Turns. s t a r t left of 13
ACY 170 0 0 170 31 270/8 27.6 129226 60 knot S-Turns. start right of 31
ACY 170 0 0 170 13 270/8 27.1 128726 60 knot S-Turns. start rlght of 13, can sense roll angle change going over CL
I ACY 170 0 0 170 31 270/8 26.6 128226 60 knot S-Turns. 'probably on (guards UP
but switches on. start right of 31
ACY 170 0 0 170 13 240/8 24.3 125926 60 knot S-Turns. start right on 13. F u l l turn at end of runway-use to look at tiller use.
ACY 170 0 0 170 31 270/9 23.8 125426 60 knot S-Turns. start left on 31
? N
TST7105 / GND2
TST7106 / GNDZ
TST7107 / GNDZ
TST710B / GND2
TST7109 / GND2
TST6 3 00 6 /GND2 I 06/30 15:09
07/01 10: 24
07/01 10:29
07/01 10: 34
07/01 11: 14
07/01 11: 17
TST63007 / GNDZ 06/30 15: 14
TST63008 / GND2 06/30 15:23
TST63009 / GND2 06/30 15:29
TST63010 1 GND2 06/30 15: 35
TST63011 / GND2 06/30 15: 43
~~
TST63012 / GNDZ I 06/30 15: 46
TST63013/GND2 06/30 15: 52
TST7101 / GNDZ 07/01 0 9 : 5 8
TST7102 / GND2 07/01 10: 02
TST7103 / GND2 07/01 10:04
TST7104 / GND2 1 07/01 10:19
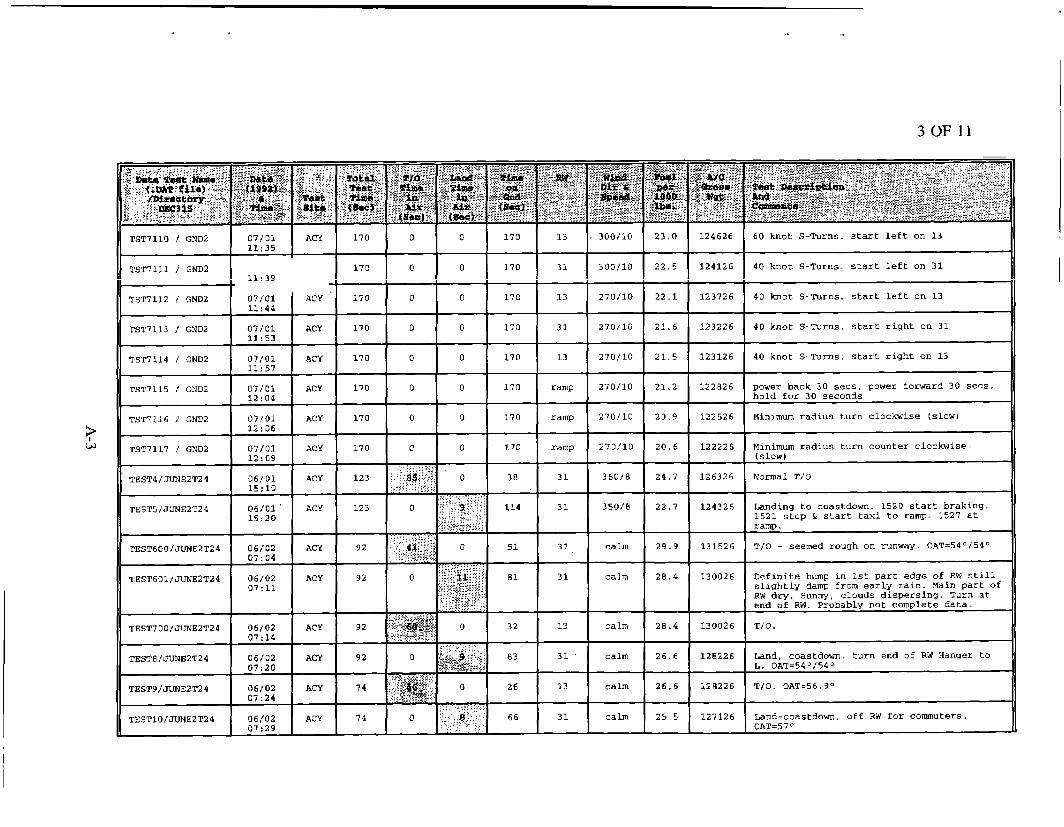
? w
TST7110 / GND2 ~~ ~
TST7111 / GND2
TST7112 / GND2
TST7113 / GND2
TST7114 / GND2
TST7115 / GND.?
TST7116 1 G N D 2
TST7117 / GND2
TEST4 /JUNEZT24
TEST5 / JUNE2T2 4
TEST7 0 0 /JUNE2T2 4
TEST813UNEZT24
TESTS/JUNE2T2 4
07/01 I ACY 1 1 : 3 5
11~39
07/01 11: 44
11: 53 =c 11: 57 = 12: 0 4
12:06
07/01
15:lO
06/01 ' 1s: 20
0 6 / 0 2
07: 11
07 : 14
07: 20
06/02
zlz 0 7 ~ 2 9
17 0 0 0 170
170 0 0 170
170 0 0 170
170 0 0 170
170 I 0 I 0 I 170
31 calm 28.4 130026 Definite bump in 1st part edge of RW still slightly damp from early rain. Main p a r t of RW dry. Sunny, c l o u d s dispersing. T u r n at end of RW. Probably not complete data.
calm 28.4 130026 T/O. 13
31 ' calm 26.6 128226 Land, coastdown, t u r n end of RW Hanger to L. 0AT=54O/5d0
13 calm 26.6 128226 T / O . o A T ~ 5 6 . 9 ~
31 calm 25.5 127126 Land-coastdown, o f f RW for commuters. OhT=57O
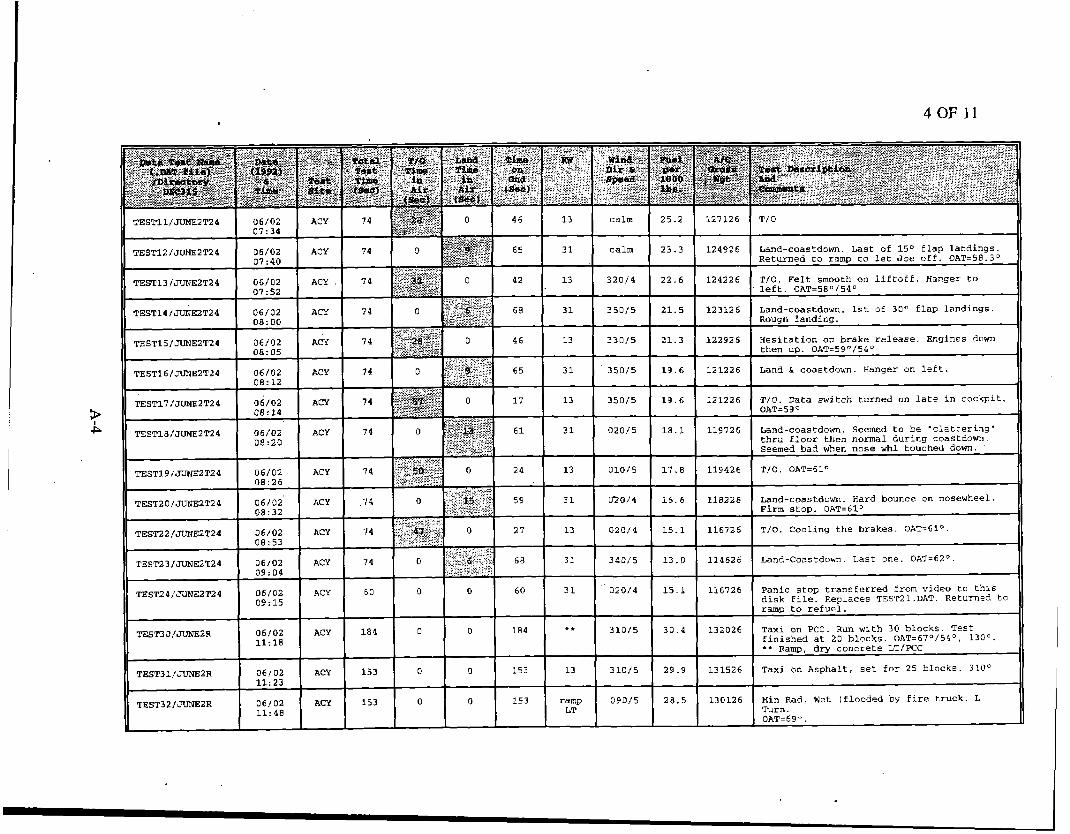
? P
4 0 F I1
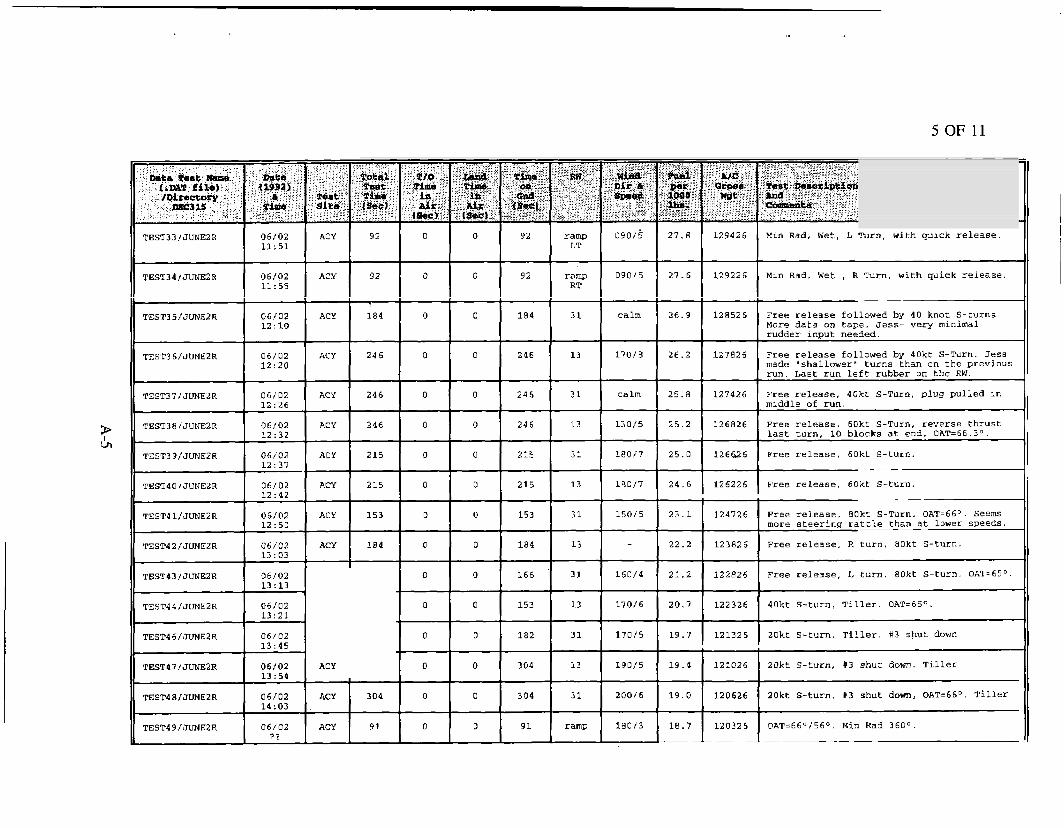
5 OF 11
TEST3 3 / JUNE2 R 06/02 11: 51
27.8 129426 Min Rad, Wet, L Turn, with quick release.
27.6 129226 Min Rad, Wet , R Turn, with quick release. TEST3 4 /JUNE2 R ' 06/02 11: 55
TEST3 5 / JUNE2 A 06/02 12 : 10
26.9 128526 Free release followed by 4 0 knot 5-turns. More data on tape. Jess- very minimal rudder input needed.
26.2 127826 Free release followed by 40kt S-Turn. Jess made "shallower' turns than on the previous run. Last run left rubber on the RW.
25.8 127426 Free release, 40kt S-Turn, plug pulled in middle of run.
25.2 126826 Free release, 60kt S-Turn, reverse thrust last turn, 10 blocks at end. OAT=66.3O.
25.0 126W6 Free release, 60kt S-turn.
06/02 12:20
TEST3 6/JUNE2R
TEST37IJUNEZR 06/02 12: 26
06/02 12: 32
ACY 1 246 ? ul 06/02 , 12:37
06/02 12: 4 2
~~
24.6- 1 126226 1 Free release, 60kt S - t u r n . TEST4OIJUNE2R
1 06/02 12 : 50
23.1 124726 Free release, BOkt S-Turn. OAT-66O. Seems more steering rattle than at lower speeds.
22.2 123826 Free release, R turn, 8Okt S-turn.
21.2 122826 Free release, L turn, 80kt S-turn. OAT=6!i0.
20.7 122326 40kt S-turn, Tiller. OAT=65O.
ACY 153
TEST42 /JUNE2R 06/02 13 : 03
06/02 13 : 13
~~ ~
TEST4 3 / JUNE2 R
ACY
06/02 13:21
06/02 13: 4 5
06/02 13 : 54
06/02 ' 14:03
06/02 ? ?
19.7 1 121326 1 2Okt S-turn. Tiller. # 3 shut down ij_l 1 121026 1 20kt 5-turn, #3 shut down. Tiller
120326 OAT=66O/56O. Min Rad 360O.
120626 20kt S-turn, #3 shut down, OAT=66". Tiller
TEST47 /JUNE2R
TEST4 8 lJUNE2R
ACY 1 91
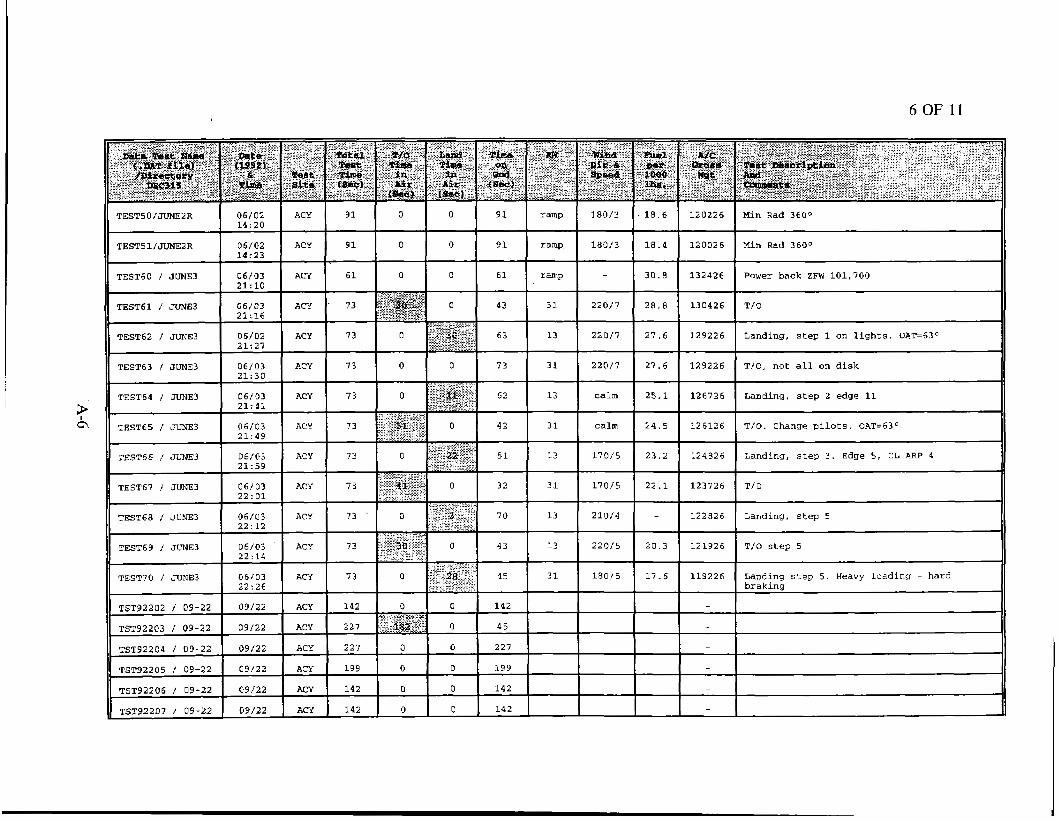
6 O F 11
TEST50/JUNE2R 06/02 ACY 91 0 0 91 ramp 180/3 . 18.6 14: 20
TESTSl/JUNE2R 06/02 A C I 91 0 0 91 ramp, 180/3 18.4
TST92202 / 09-22 09/22 ACY 142 0 0 142 " "
TST92203 / 09-22 09/22 ACY 227 :: &&+; " . "" a 45 I L
130426 I TI0
~~ ~ ~
126126 T / O . Change pilots. OAT=63O
124626 Landing, step 3. Edge 5, CL ARP 4
123726 T I 0
122826 Landing, s tep 5
121926 T/O step 5
119226 Landing step 5. Heavy loading - hard braking
TST92204 / 09-22 09/22 ACY 227 0 0 227
TST92205 / 09-22 09/22 ACY 199 0 0 199
TST92206 / 09-22 09/22 ACY 142 0 0 142
TST92207 1 09-22 09/22 ACY 142 0 0 142
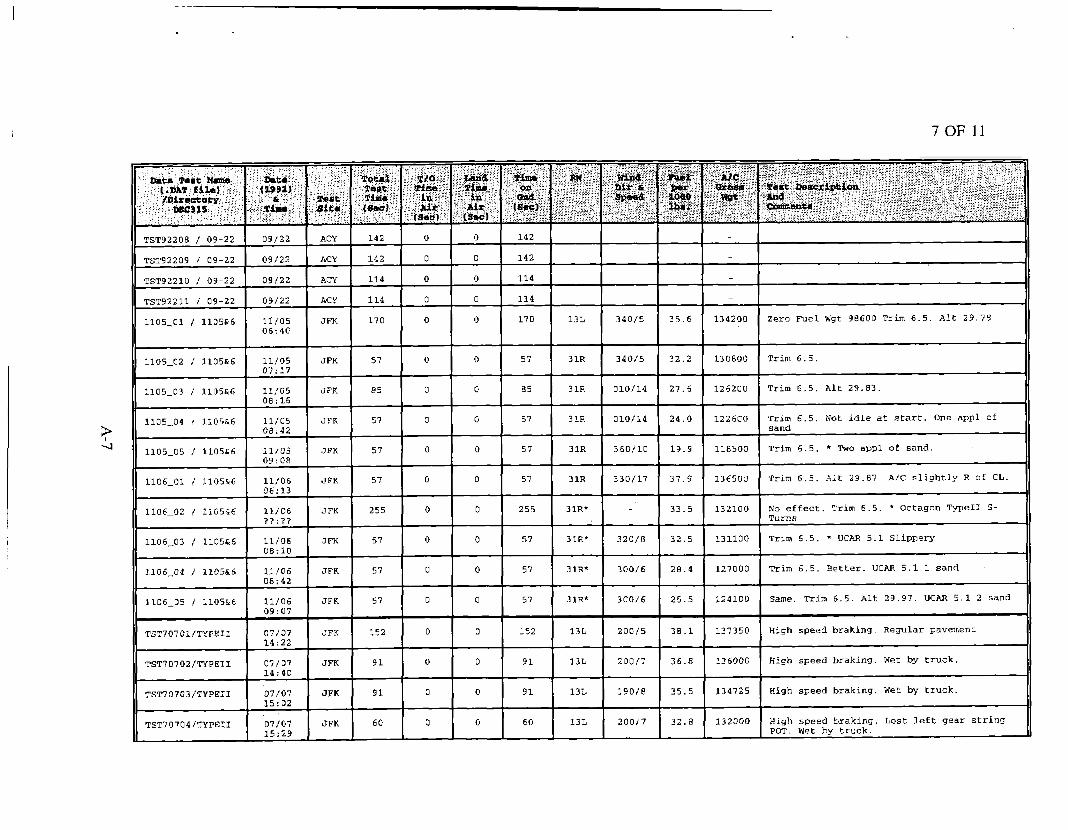
7 0 F 11
rim 6 . 5 . + Two appl of sand.
TST70701 TYPE11
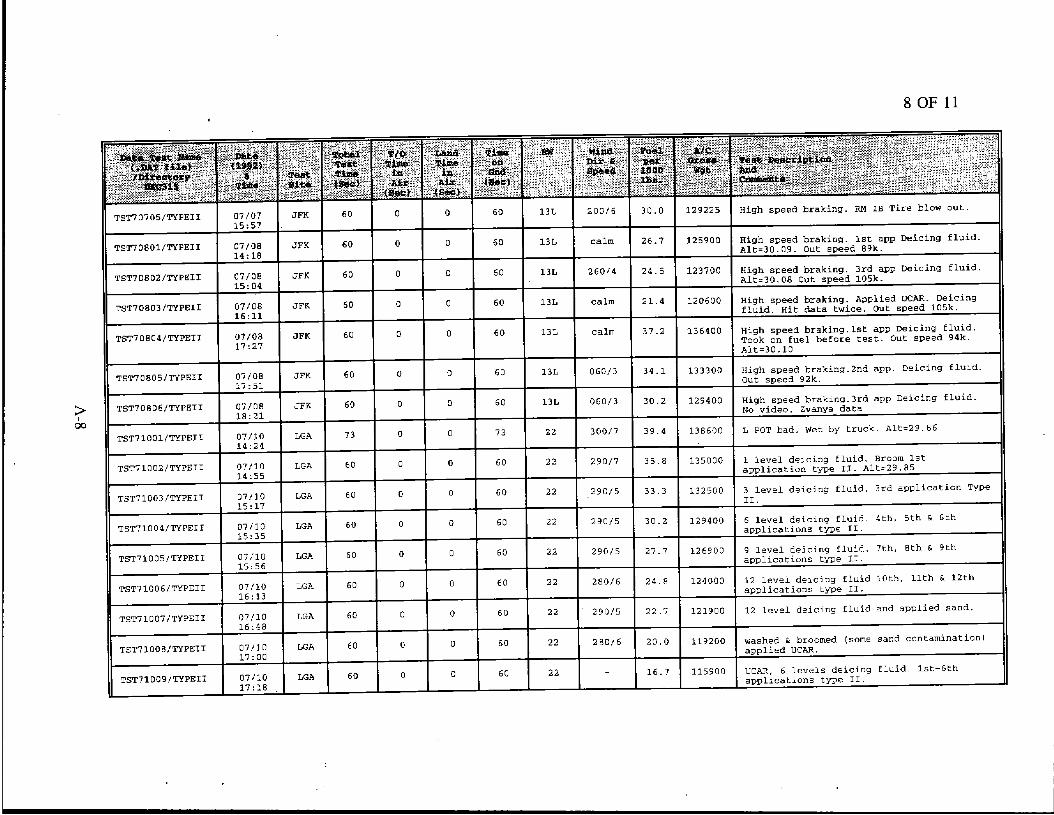
? 00
8 OF 11
TST70705/TYPEJI
TST7 0 80 5 / TYPE11
TST71006/TYPEII
TST7 3 00 B / TYPE11
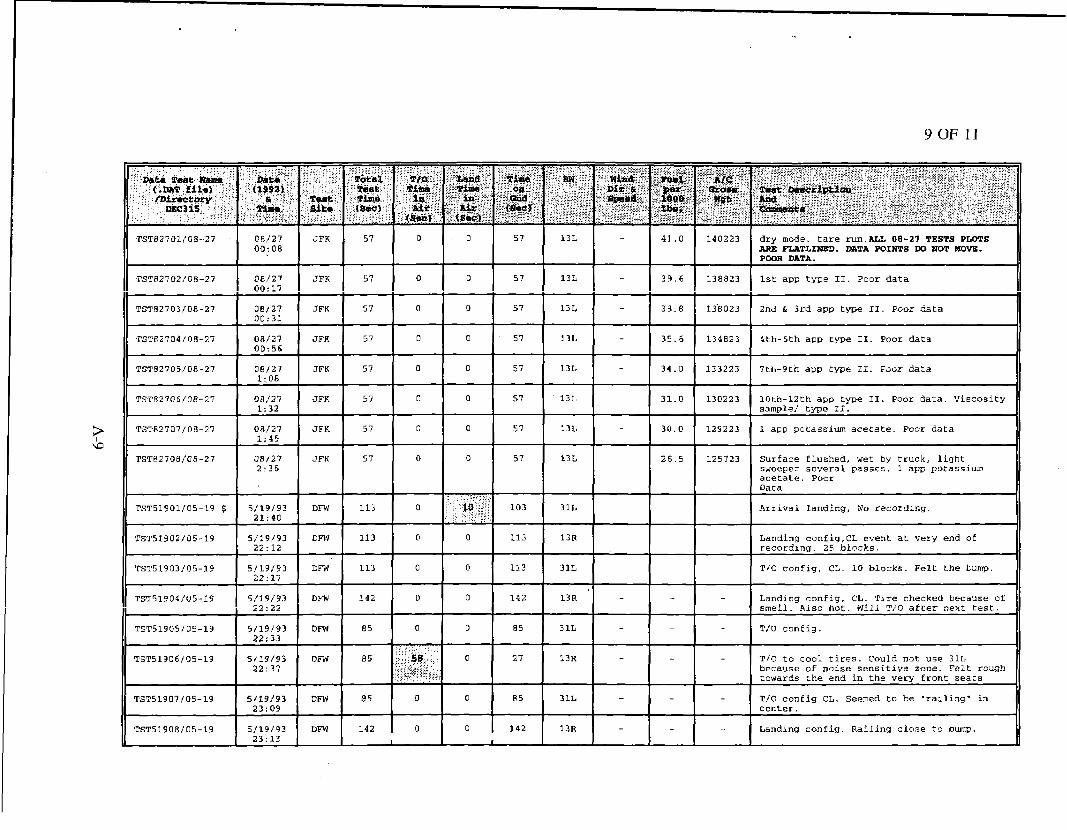
9 O F 11
TST62701/08-27 08/27 JFK 57 0 , o 57 13L 41.0 140223 dry mode. tare r u n . N A 0 8 - 2 7 TESTS PulTS O O l O B ARE FIATLINED. DATA pDIB"S Do WOT KOVE.
POOR DATA.
TST82702/06-27 08/27 JFK 57 0 0 57 13L 39.6 138823 1st app type 11. Poor data 00:17
TST82703/08-27 0 8 / 2 7 JFK 57 0 0 57 13L 38.8 13'6023 2nd & 3rd app type 11. Poor data 00: 31
TST82704/08-27 08/27 JFK 57 0 0 57 13L 35.6 134823 4th-6th app type 11. Poor data 00:56
TST82705/08-27 08/27 JFK 57 0 . o 57 13L 34.0 133223 7th-9th app type 11. Poor data
TST51902 05-19
TST51903/05-19
31.0 130223 lOth-12th app type 11. Poor data. Viscosity samplel type 11.
- 30.0 129223 1 app potassium acetate. Poor data
26.5 125723 Surface flushed, wet by t r u c k , light sweeper several passes. 1 a p p potassium acetate. Poor Data
Arrival landing, No recording.
Landing config,CL event at very end of recording. 25 blocks.
T/O config, CL. 10 b l o c k s . Felt the bump.
TST51904/05-19 5/19/93 nm 142 0 0 142 13R - Landing config, CL. Tire checked because of 22: 22 smell. A l s o hot. Will T/O after next test.
TST51905/05-19 5/19/93 DFW 8 5 0 0 a5 31L T/O config. 22:33
TST51906/05-19 5/19/93 DFW 0 27 13R - TI0 to cool tires. Could not use 31L because of noise sensitive zone. Felt rough towards the end in the very front seats
22:37
TST51907/05-19 5/19/93 DFW as 0 0 B5 31L - T/O conCig CL. Seemed to be 'railing' in 23:09 center.
TST51908/05-19 5/19/93 DFW 142 0 0 142 13R Landing config. Railing close to bump. 23:13
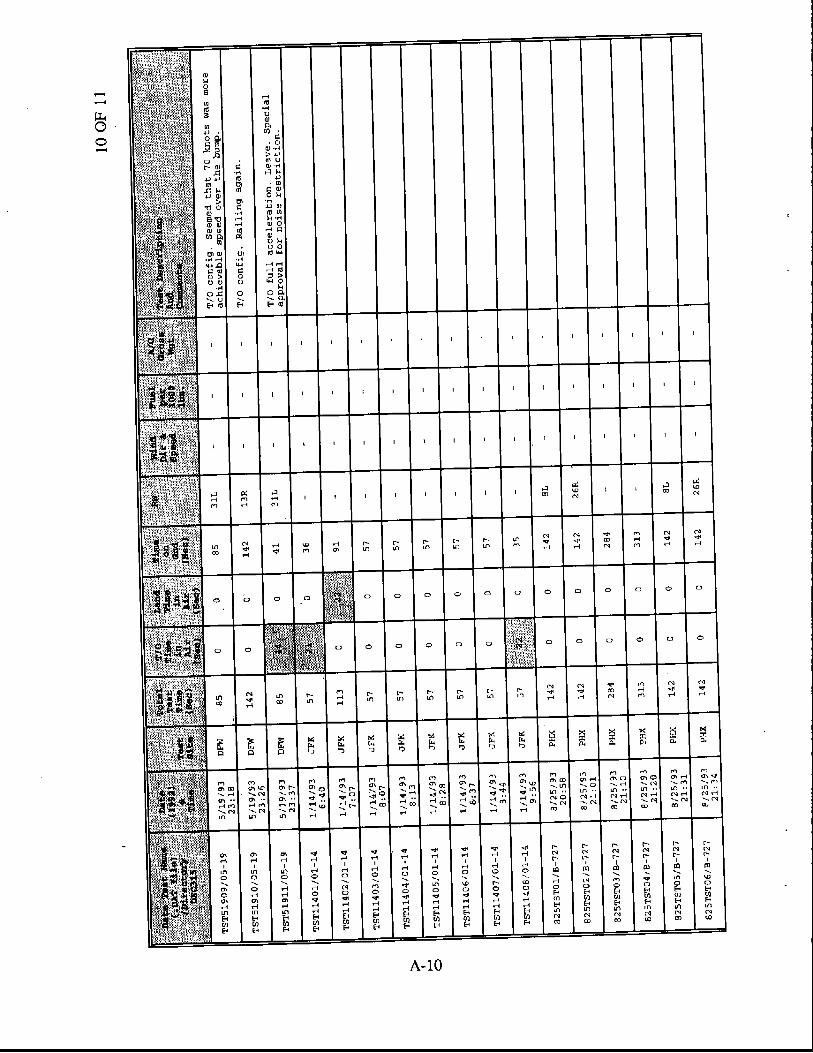
A-10
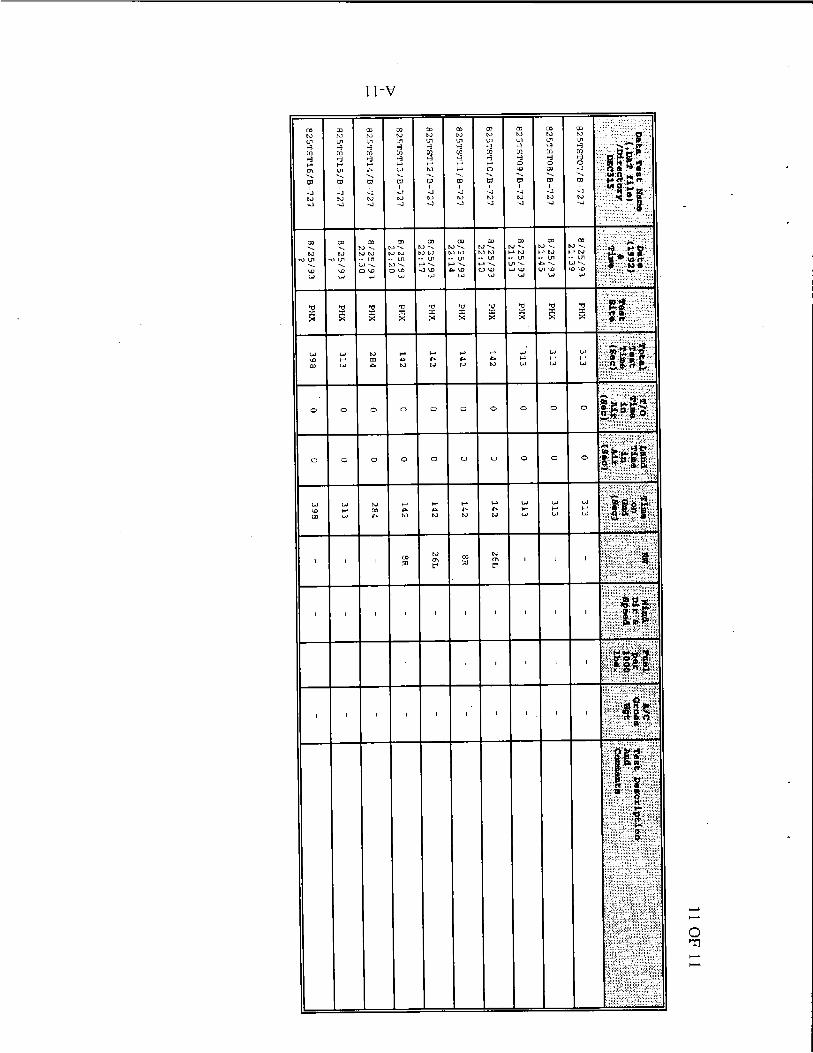
I I-V
m m N N w w
t : G : z z 9 " Y m w . . \ 4 - 1 N N 4 4
m m \ \ N N .\) w -9 Ln \ , w \ D w w
2 ; x x
L I W \ O F m w
0 0
0 0
L I W W P m w
I I
I I
I I
I I
N
P.1 K I
1
I N m P
I
I

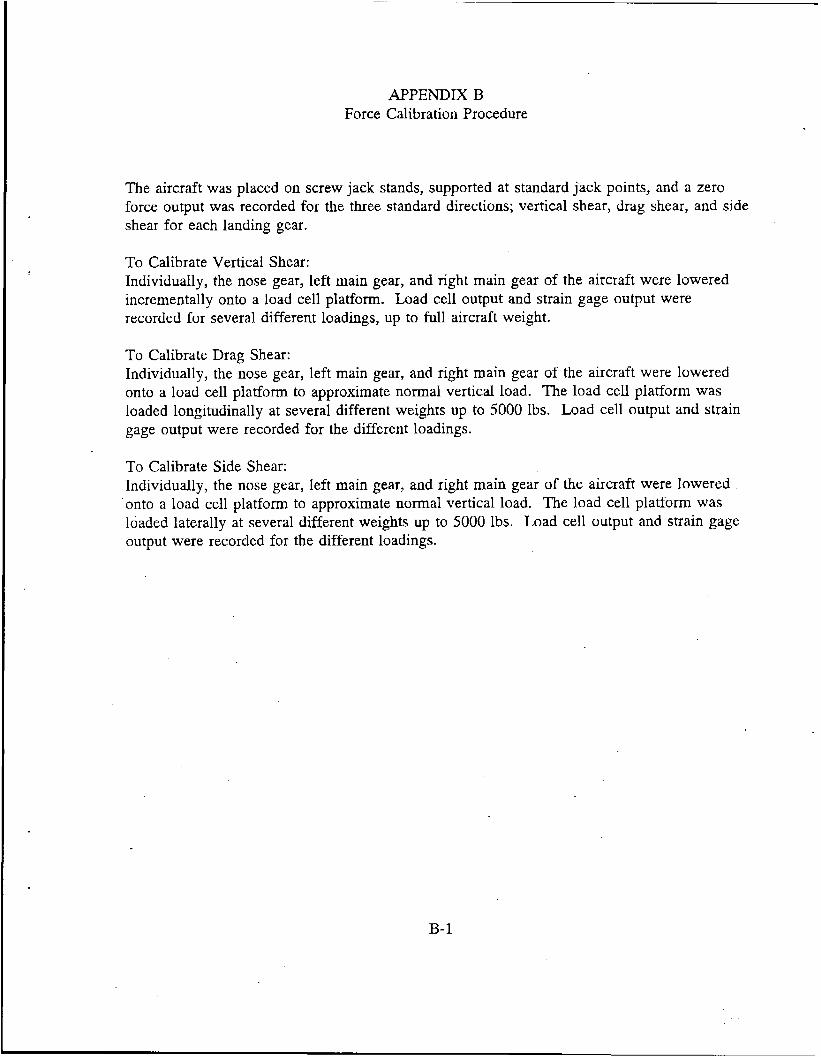
APPENDIX B Force Calibration Procedure
The aircraft was placed on screw jack stands, supported at standard jack points, and a zero force output was recorded for the three standard directions; vertical shear, drag shear, and side shear for each landing gear.
To Calibrate Vertical Shear: Individually, the nose gear, left main gear, and right main gear of the aircraft were lowered incrementally onto a load cell platform. Load cell output and strain gage output were recorded for several different loadings, up to full aircraft weight.
To Calibrate Drag Shear: Individually, the nose gear, left main gear, and right main gear of the aircraft were lowered onto a load cell platform to approximate normal vertical load. The load cell platform was loaded longitudinally at several different weights up to 5000 lbs. Load cell output and strain gage output were recorded for the different loadings.
To Calibrate Side Shear: Individually, the nose gear, left main gear, and right main gear of the aircraft were lowered onto a load cell platform to approximate normal vertical load. The load cell platform was loaded laterally at several different weights up to 5000 lbs. Load cell output and strain gage output were recorded for the different loadings.
B- 1

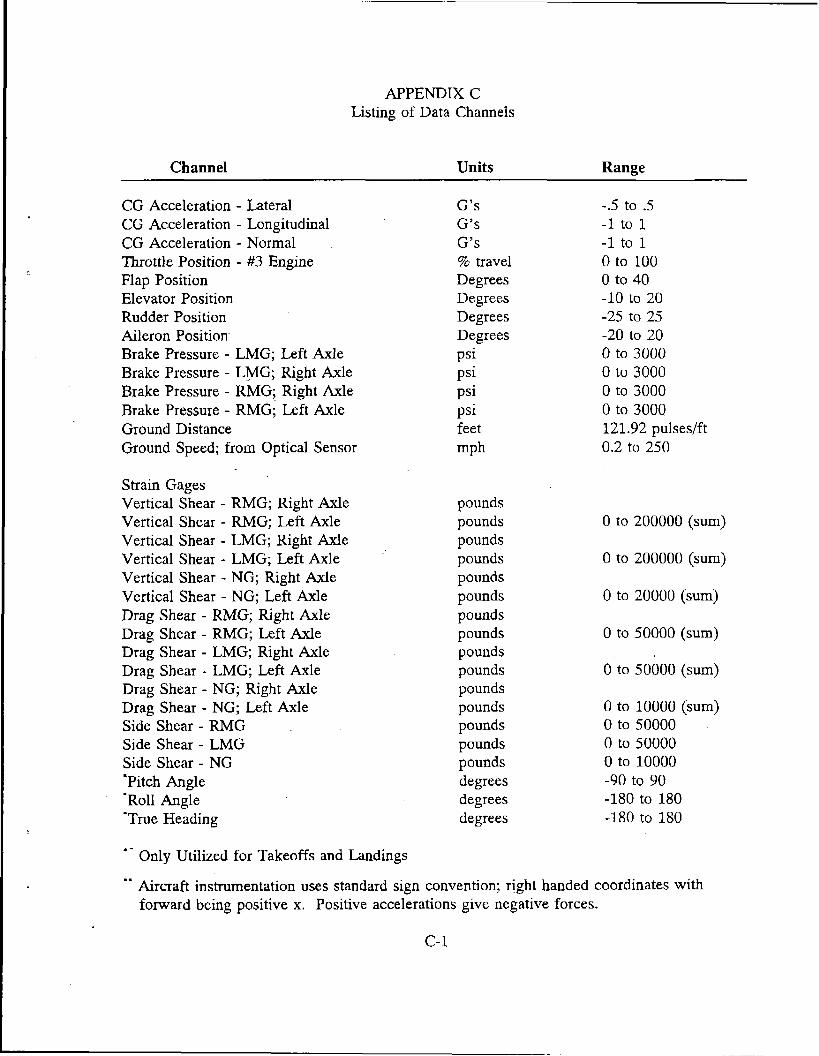
APPENDIX C Listing of Data Channels
Channel Units Range
CG Acceleration - Lateral CG Acceleration - Longitudinal CG Acceleration - Normal Throttle Position - #3 Engine Flap Position Elevator Position Rudder Position Aileron Position Brake Pressure - LMG; Lxft Axle Brake Pressure - LMG; Right Axle Brake Pressure - RMG; Right Axle Brake Pressure - RMG; Left Axle Ground Distance Ground Speed; from Optical Sensor
G’s G’s G’s % travel Degrees Degrees Degrees Degrees psi psi psi psi feet mPh
Strain Gages Vertical Shear - RMG; Right Axle Vertical Shear - RMG; Left Axle Vertical Shear - LMG; Right Axle Vertical Shear - LMG; Left Axle Vertical Shear - NG; Right Axle Vertical Shear - NG; Left Axle Drag Shear - RMG; Right Axle Drag Shear - RMG; Left Axle Drag Shear - LMG; Right Axle Drag Shear - LMG; Left Axle Drag Shear - NG; Right Axle Drag Shear - NG; Left Axle Side Shear - RMG Side Shear - LMG Side Shear - NG ‘Pitch Angle ‘Roll Angle -True Heading
pounds pounds pounds pounds pounds pounds pounds pounds pounds pounds pounds pounds pounds pounds pounds degrees degrees degrees
-.5 to .5 -1 to 1 -1 to 1 0 to 100 0 to 40 -10 to 20 -25 to 25 -20 to 20 0 to 3000 0 to 3000 0 to 3000 0 to 3000 121.92 pulses/ft 0.2 to 250
0 to 200000 (sum)
0 to 200000 (sum)
0 to 20000 (sum)
0 to 50000 (sum)
0 to 50000 (sum)
0 to 10000 (sum) 0 to 50000 0 to 50000 0 to 10000 -90 to 90 -180 to 180 -180 to 180
* - Only Utilized for Takeoffs and Landings ..
Aircraft instrumentation uses standard sign convention; right handed coordinates with forward being positive x. Positive accelerations give negative forces.
c- 1

APPENDIX D
Data Reduction Software Program Listing

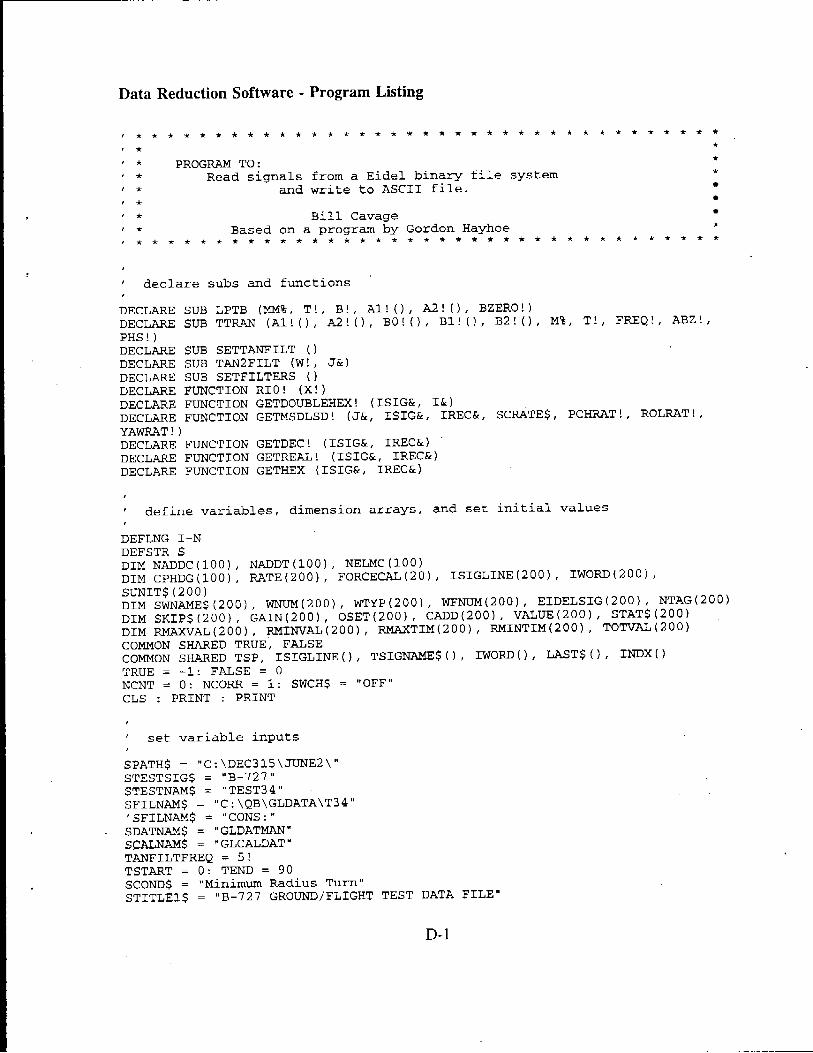
Data Reduction Software - Program Listing
. . . . . . . . . . . . . . . . . . . . . . . . . . . . . . . . . . . . . .
r * P R O G M TO: r * R e a d signals from a Eidel binary file system I * and write to ASCII f i l e .
r * Bill Cavage r * Based on a program by Gordon Hayhoe , * * * * * + * * * + * * * * * + * * + * * * * * * * * * * * * * * * * * * * + *
r * * * *
* I *
' declare subs and functions
DECLARE SUB LPTB (MM%, T!, B!, A 1 ! ( ) , A2!(), BZERO!) DECLARE SUB TTRAN (Al!(), A 2 ! ( ) , B O ! O , Bl!(), B2!(), M%, T!, FREQ!, ABZ! , PHS ! ) DECLARE SUB SETTANFILT ( ) DECLARE SUB TAN2FILT (W!# J&) DECLARE SUB SETFILTERS ( ) DECLARE FUNCTION RIO! (X!) DECLARE FUNCTION GETDOUBLEHEX! ( I S I G S r , I&) DECLARE FUNCTION GETMSDLSD! (J&, ISIG&, IREC&, SCRATES, PCHRAT!, ROLRAT!, YAWRAT ! ) DECLARE FUNCTION GETDEC! (ISIG&, IREC&) '
DECLARE FUNCTION GETREAL! (ISIGL, IREC&) DECLARE FUNCTION GETHEX (ISIG&, IREC&)
D I M NADDC(IOO), NADDT(100), NELMC(100) DIM CPHDG(100), RATE(200), FORCECAL(20), ISIGLINE(200), IWORD(200), SUNIT$ ( 2 0 0 ) DIM SWNAMES ( 2 0 0 ) , WNLTM(200), WTYP(200), WFNWM(200), EIDELSIG(200), NTAG(200) DIM SKIP$(200), GAIN(200), OSET(200), CADD(200), VALUE(200), STATS(200) DIM RMAXVAL(200), RMINVAL(200), RMAXTIM(200), RMINTIM(200), TOTVAL(200) COMMON SHARED TRUE, FALSE COMMON SHARED TSP, ISIGLINEO, TSIGNAME$(), IWORD(), L A S T $ ( ) , INDX() m rRUE = -1: FALSE = 0 NCNT = 0 : NCORR = 1 : SWCH$ = "OFF" CLS : PRINT : PRINT
' set variable inputs
SPATH$ = "C: \DEC315\JLR\TE2\"
STESTNAM$ = "TEST3 4 " SFILNAMS = "C: \QB\GLDATA\T34" ' SFILNAMS = "CONS : " SDATNAMS = "GLDATMAN" SCALXAM$ = "GLCALDAT" TANFILTFREQ = 5! TSTART = 0 : TEND = 9 0 SCONDS = "Minimum Radius Turn" STITLEIS = "B-727 GROUND/FLIGHT TEST DATA FILE"
STESTSIGS = "B-727"
D- 1
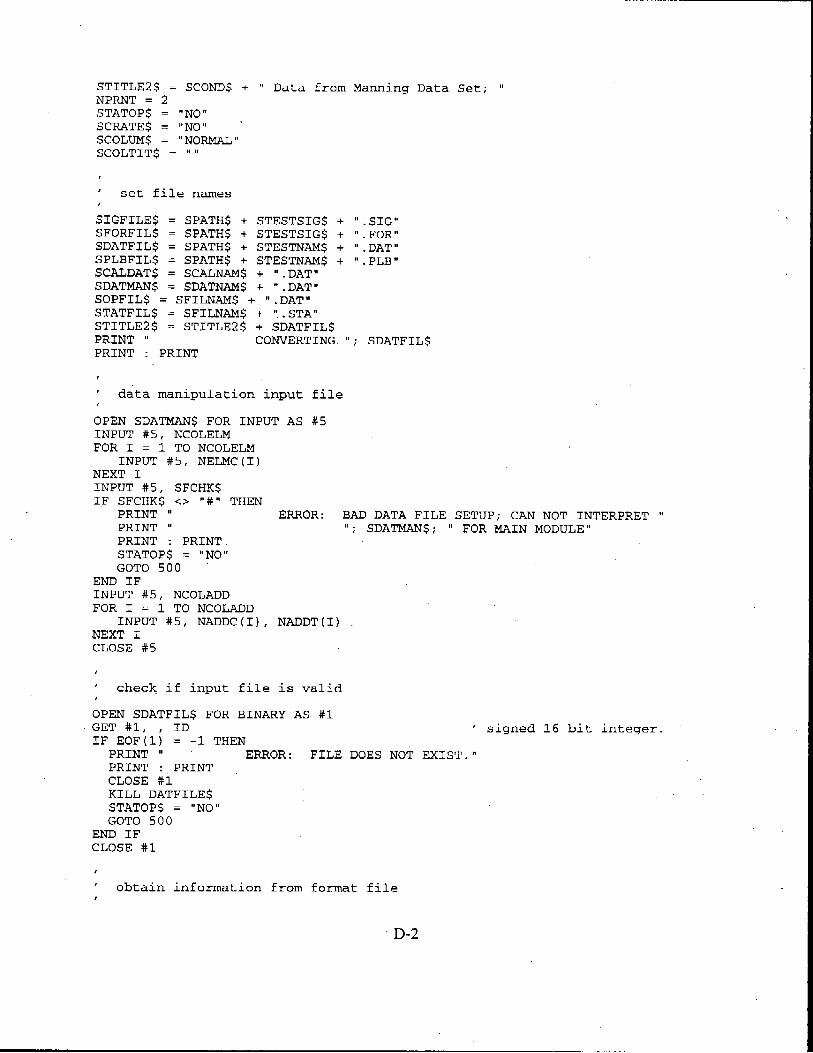
STITLE2$ = SCOND$ + " Data f r o m Manning Data Set; "
NPRNT = 2 STATOPS = "NO" SCRATE$ = "NO" SCOLTJMS = " NORMAL " SCOLTITS = ' ' I
' set file names
SIGFILES = SPATHS + STESTSIG$ + ".SIG" SFORFILS = SPATHS f STESTSIGS + " . F O R " SDATFILS = SPATHS + STESTNAMS + " .DAT" SPLBFILS = SPATHS + STESTNAMS + ".PLB" SCALDAT$ = SCALNAMS + " .DAT" SDATMANS = SDATNAMS + ".DAT" SOPFILS = SFILNAMS + " .DAT" STATFILS = SFILNAMS + '!.STA" STITLE2S = STJTLE2$ + SDATFILS PRINT " CONVERTING "; SDATFILS PRINT : PRINT
' data manipulation input f i l e
OPEN SDATMANS FOR INPUT AS #5 INPUT #5, NCOLELM FOR I = 1 TO NCOLELM
NEXT I INPUT #5, SFCHKS IF SFCHKS <> " # " THEN
INPUT #5, NELMC (I)
PRINT " ERROR: BAD DATA FILE SETUP; CAN NOT INTERPRET "
PRINT " ' I ; SDATMANS; " FOR MAIN MODULE" PRINT : PRINT STATOPS = "NO" GOTO 500
END IF INPUT #5, NCOLADD FOR I = 1 TO NCOIJlDD
NEXT I CLOSE #5
INPUT #5, NADDC(1) , NADDT(1)
' check if input file is valid
OPEN SDATFILS FOR BINARY AS #1 GET #1, , ID ' signed 16 bit integer. IF E O F ( 1 ) = -1 THEN PRINT " ERROR: FILE DOES NOT EXIST. I' PRINT : PRINT CLOSE #1 KILL DATFILES STATOPS = "NO" GOTO 500
END IF CLOSE #1 I
' obtain information from format file
D-2
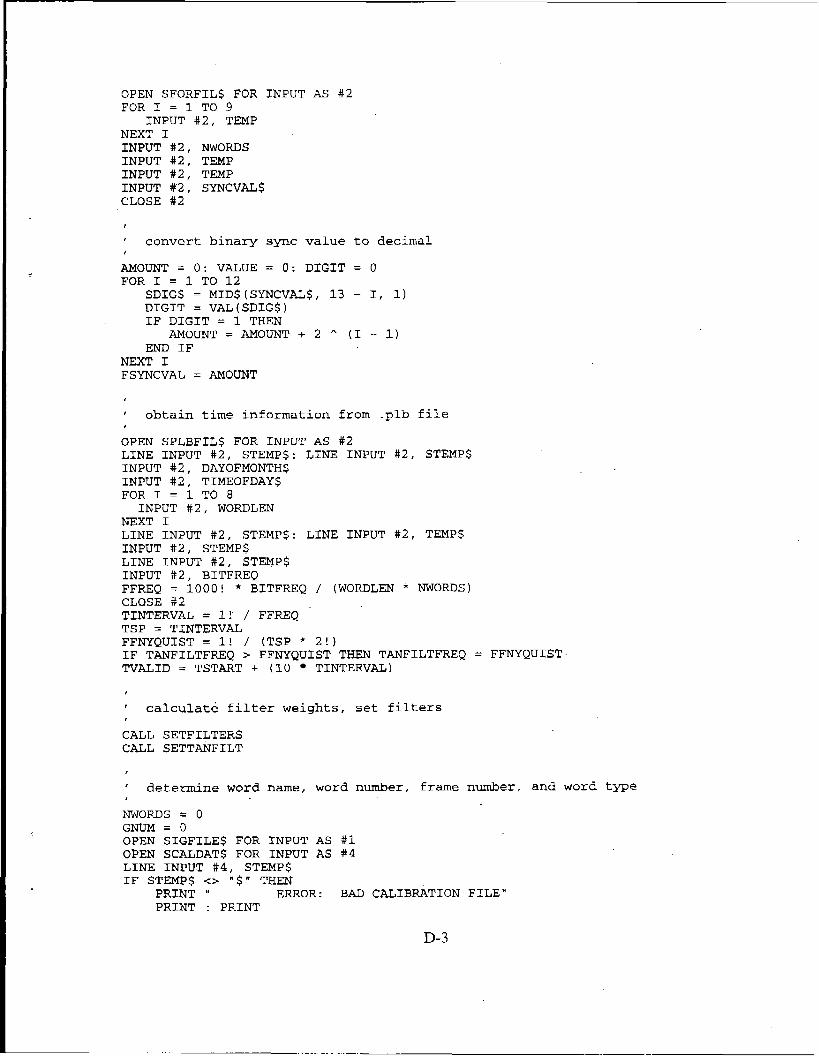
OPEN SFORFILS FOR INPUT AS # 2 FOR I = 1 TO 9
NEXT I INPUT # 2 , W O R D S INPUT # 2 , TEMP INPUT # 2 , TEMP INPUT #2, SYNCVALS CLOSE #2
INPUT # 2 , TEMP
I
' convert binary sync value to decimal I
AMOUNT = 0: VALUE = 0: DIGIT = 0 FOR I = 1 TO 12
SDIG$ = MID$ (SYNCVALS, 13 - I, 1) DIGIT = VAL(SDIG$) IF DIGIT = 1 THEN
END IF AMOUNT = AMOUNT + 2 * (I - 1)
NEXT I FSYNCVAL = AMOUNT
' obtain time information from .plb file
OPEN SPLBFILS FOR INPUT AS #2 LINE INPUT #2, STEMPS: LINE INPUT # 2 , STEMP$ INPUT # 2 , DAYOFMONTHS INPUT # 2 , TIMEOFDAYS FOR I = 1 TO 8
NEXT I LINE INPUT #2, STEMPS: LINE INPUT #2, TEMP$ INPUT # 2 , STEMP$ LINE I N P U T # 2 , STEMP$ INPUT # 2 , BITFREQ FFREQ = l O O O ! * BITFREQ / (WORDLEN * NWORDS) CLQSE #2 TINTERVAL = I! / FFREQ TSP = TINTERVAL FFNYQUIST = I! / (TSP * 2 ! ) IF TANFILTFREQ > FFNYQUIST THEN TANFILTFREQ = FFNYQUIST TVALID = TSTART + (10 TINTERVAL)
INPUT #2, WORDLEN
I
' calculate filter weights, set filters
CALL SETFILTERS CALL SETTANFILT
' determine word name, word number, frame number, and word t ype
W O R D S = 0 GNUM = 0 OPEN SIGFILES FOR INPUT AS OPEN SCALDAT$ FOR INPUT AS #4 LINE INPUT # 4 , STEMPS IF STEMP$ <> " $ " THEN
PRINT " ERROR: BAD CALIBRATION FILE" PRINT : PRINT
D-3
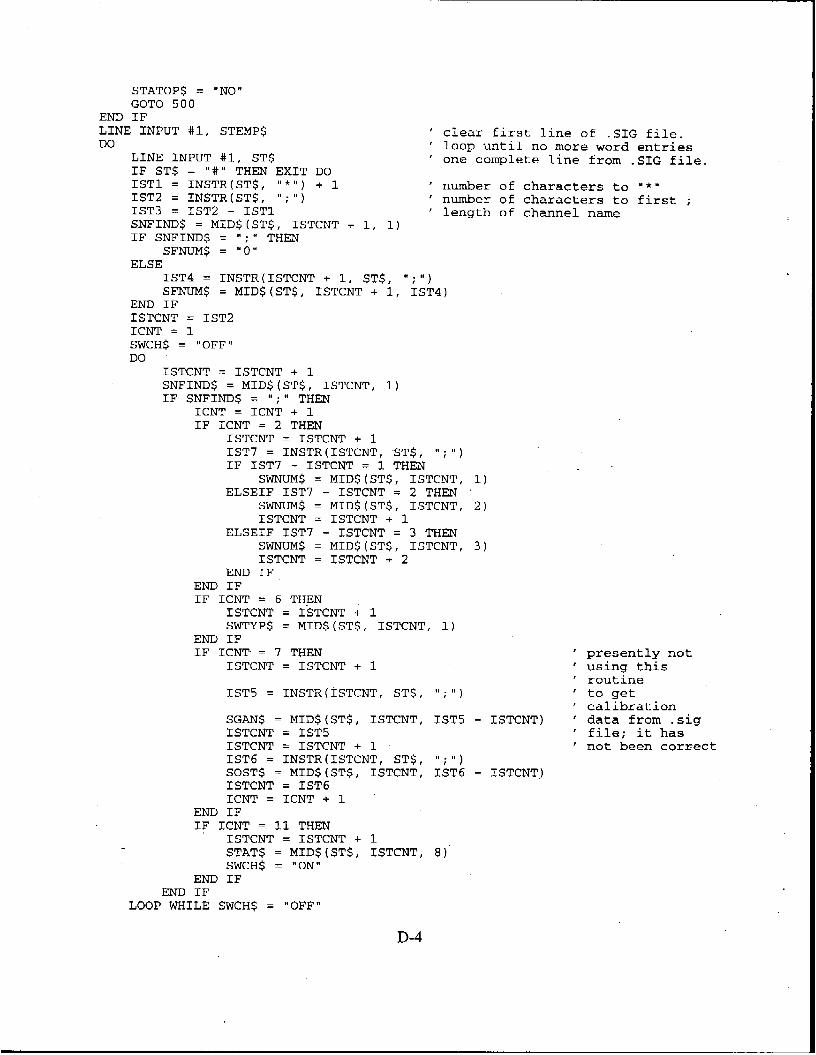
STATOPS = "NO" GOT0 500
END IF LINE INPUT #1, STEMP$ Do
LINE INPUT #I, ST$ IF ST$ = " # " THEN EXIT DO ISTl = INSTR(ST$, " * " ) + 1 IST2 = INSTR( ST$, " ; " )
SNFINDS = MID$(ST$, ISTCNT + 1, 1) IF SNFINDS = ";" THEN
ELSE
IST3 = IST2 - ISTl I
S F m $ = "-0"
IST4 = INSTR(1STCNT + 1, ST$, " ; " ) SFNUM$ = MID$(ST$, ISTCNT + 1, ISTQ)
END IF ISTCNT = IST2 ICNT = 1 SWCH$ = "OFF" DO
ISTCNT = ISTCNT + 1 SNFIND$ = MID$(ST$, ISTCNT, 1) IF SNFINDS = I I ; " THEN
ICNT = ICNT + 1 IF ICNT = 2 THEN
ISTCNT = ISTCNT + 1 IST7 = INSTR( ISTCNT, ST$, " ; " ) IF IST7 - ISTCNT = 1 THEN
ELSEIF IST7 - ISTCNT = 2 THEN SWNUM$ = MID$(ST$, ISTCNT,
S-$ = MID$(ST$, ISTCNT, ISTCNT = ISTCNT + I SWNUM$ = MID$(ST$, ISTCNT, ISTCNT = ISTCNT + 2
ELSEIF IST7 - ISTCNT = 3 THEN
END IF END IF IF ICNT = 6 THEN
ISTCNT = ISTCNT + 1 SWTYP$ = MID$(ST$, ISTCNT, 1)
END IF IF ICNT = 7 THEN
ISTCNT = ISTCNT + 1
clear first line of .SIG f i l e . loop until no more word entries one complete line from .SIG f i l e .
number of characters to " * I '
number of characters to first ; length of channel name
IST5 = INSTR(ISTCNT, ST$,
SEAN$ = MID$(ST$, ISTCNT, ISTCNT = IST5 ISTCNT = ISTCNT + 1 IST6 = INSTR(ISTCNT, ST$, SOST$ = MID$(ST$, ISTCNT, ISTCNT = IST6 ICNT = ICNT + 1
END IF IF ICNT = I1 THEN
ISTCNT = ISTCNT + 1 STAT$ = MID$(ST$, ISTCNT, SWCH$ = "ON"
END IF END I F
LOOP WHILE SWCH$ = "OFF"
IST5 - ISTCNT) '
UP ; v v ) XST6 - ISTCNT)
presently not using this routine to get calibration data from .sig file; it has not been correct
D-4
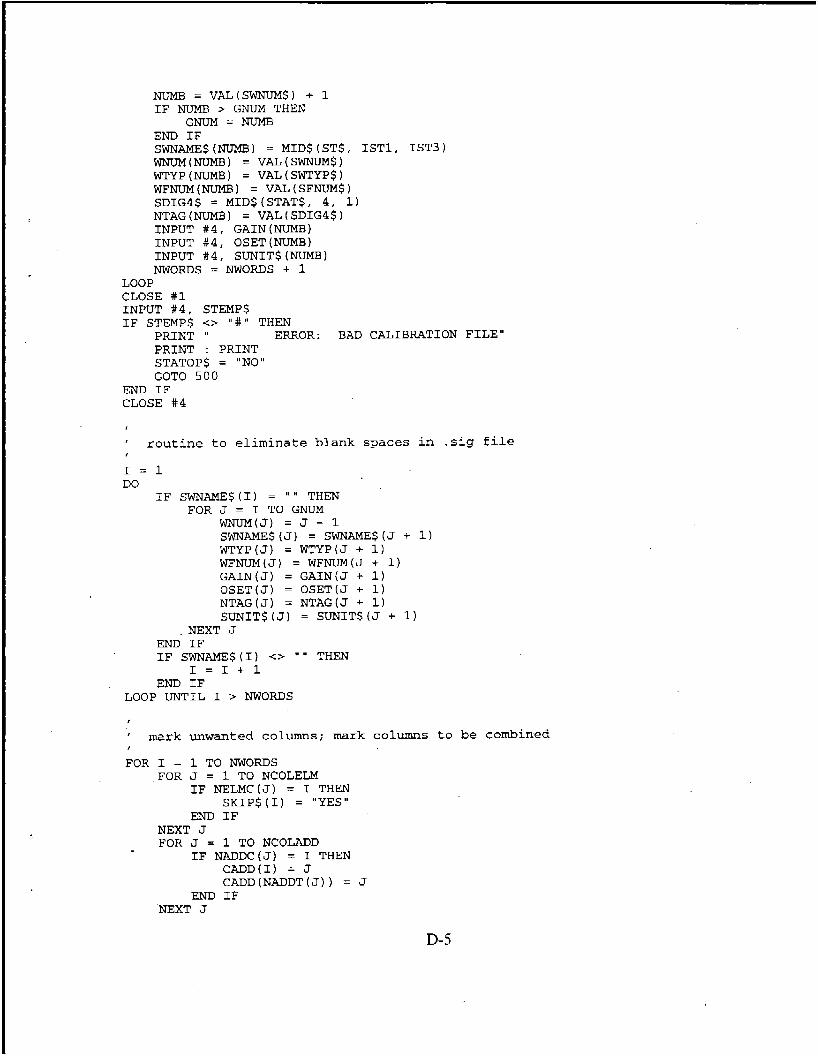
NUME = VAL(SWNUM$) + 1 IF NUMB > GNUM THEN
GNUM = NUMB END IF SWNAME$(NUMB) = MID$(ST$, IST1, I S T 3 )
WTYP(NUMB) = VAL(SWTYP$) WFNUM(NUMB) = VAL(SFNUM$) SDLG4$ = MID$ (STAT$, 4 , 1) NTAG(NUMB) = VAL(SDIG4$) INPUT #4, GAIN(NUMB) INPUT #4, OSET(NUMB) INPUT #4, SUNIT$(NUMB) NWORDS = moms + 1
CJNVM(NITMB) = VAL(SWNuM$)
LOOP CLOSE #1 INPUT # 4 , STEMPS IF STEMPS c- " # " THEN
PRINT " ERROR: BAD CALIBRATION FILE" PRINT : PRINT STATOPS = "NO" GOT0 500
END IF CLOSE # 4
' routine to eliminate blank spaces in .sig file
I = 1 DO
IF SWNAME$(I) = " I ' THEN
W ( J ) = J - 1 SWNME$(S) = SWNME$(J + 1) WTYP(J) = WTYP(J + 1) WFNUM(J) = WFNUM(J + 1) GAIN(J) = GAIN(J f 1) OSET(J) = OSET(J -t 1) NTAG(J) = NTAG(J + 1) SUNIT$(J) = SUNIT$(J + 1)
FOR J = I TO GNUM
. NEXT J END IF IF SWNAME$(I) <> " * THEN
END IF I = I + l
LOOP UNTIL I > NWORDS
I
' mark unwanted columns; mark columns to be combined
FOR I = 1 TO NWORDS FOR J = 1 TO NCOLELM
IF NELMC(J) = I THEN SKIP$(I) = "YES"
END IF NEXT J FOR J = 1 TO NCOLADD
IF NAnDC(J) = I THEN CADD(1) = J CADD(NADDT(J)) = J
END IF NEXT J
D-5
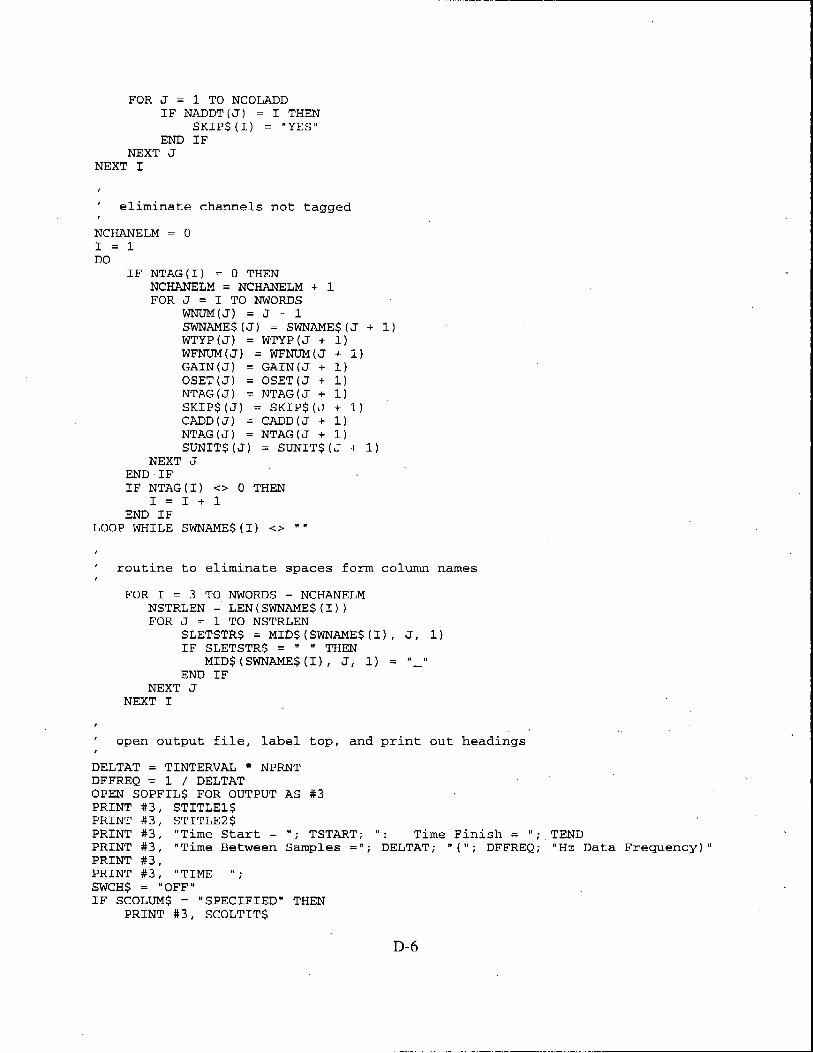
FOR J = 1 TO NCOLADD IF NADDT(J) = I THEN
SKIP$ (I) = "YES" END IF
NEXT J NEXT I
I
' eliminate channels not tagged
NCHANELM = 0 I = 1 DO
IF NTAG(1) = 0 THEN NCHANELM = NCHANELM + 1 FOR J = I TO NWORDS
WNUM(J) = J - 1 SWNAMES (J) = SWNAME$ (J + 1) WTYP(J) = WTYP(J + 1) WFNITM(J) = WFNcTM(J + 1) GAIN(J) = GAIN(J + 1) OSET(J) = OSET(J + 1) NTAG(J) = NTAG(J + 1) SKIP$ (J) = SKIP$ (J + 1) CADD(J) = CADD(J + 1) NTAG(J) = NTAG(J + 1) SUNIT$ [J) = SUNIT$ (J -t 1)
NEXT J END IF rF NTAG(I) <> o THEN
I = I + 1 END I F
LOOP WHILE SWNAMES (I) <> '"'
' routine t o eliminate spaces form column names
FOR I = 3 TO NWORDS - NCHANELM NSTRLEN = LEN(SWNAME$(I)) FOR J = 1 TO NSTRLEN
SLETSTRS = MID$(SWNAME$(I), J, 1) IF SLETSTRS = "
MID$ (SWNAMES END IF
NEXT J NEXT I
' open output file, label
DELTAT = TINTERVAL NPRNT DFFREQ = 1 / DELTAT OPEN SOPFILS FOR OUTPUT AS PRINT $3, STITLEl$ PRINT #3, STITLE2$ PRINT #3, "Time Start = ";
" THEN I), J, 1
top, and p r i n t ou t headings
#3
TSTART; ' I : T i m e Finish = "; TEND PRINT #3, "Time Between Samples = ' I ; DELTAT; 'I ( ' I ; DFFREQ; "Hz Data Frequency) 'I PRINT #3. PRINT #3, "TIME "; SWCH$ = "OFF" IF SCOLUM$ = "SPECIFIED" THEN
PRINT #3, SCOLTITS
D-6
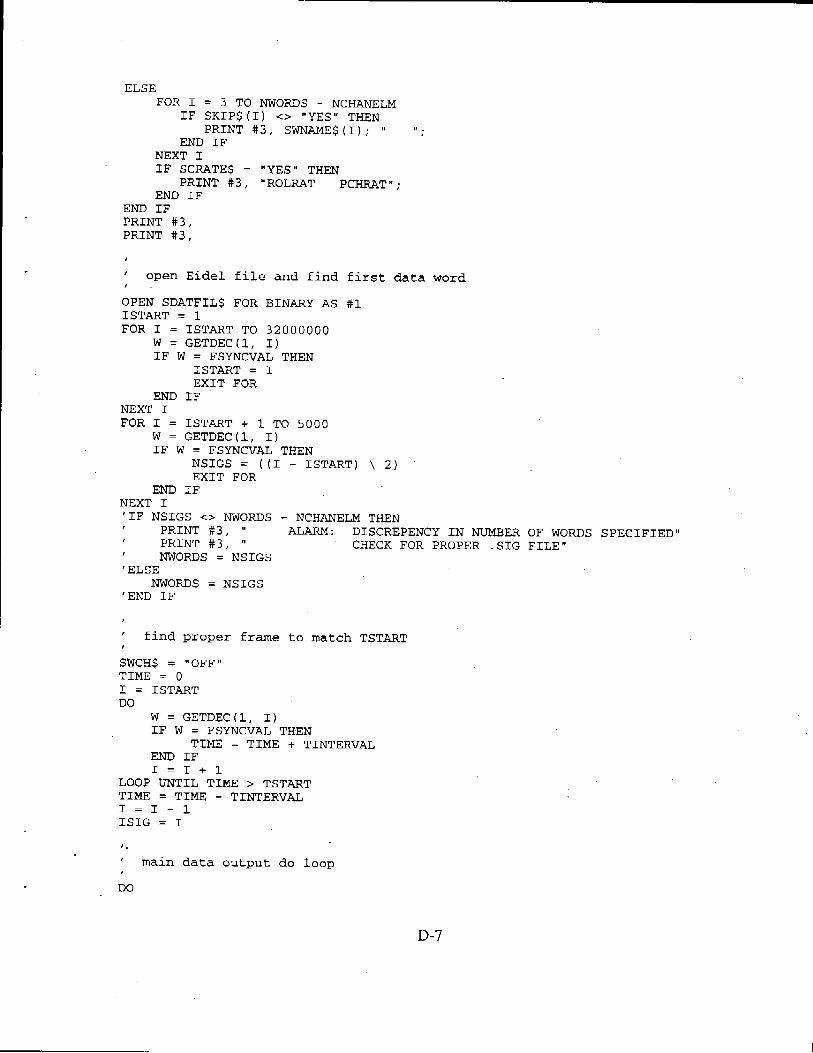
ELSE FOR I = 3 TO NWORDS - NCHANELM
IF SKIP$ (I) <> "YES" THEN
END IF P R I N T # 3 , SWNAME$ (I) ; " I) .
NEXT I I F SCRATES = "YES" THEN
END IF PRINT #3, "ROLRAT PCHRAT" ;
END IF PRINT #3 , PRINT # 3 ,
I
' open Eidel f i l e and f ind f irst data w o r d
OPEN SDATFILS FOR BINARY AS #1 ISTART = 1 FOR I = ISTART TO 32000000
I -
W = GETDEC(1, I) IF W = FSYNCVAL THEN
ISTART = I EXIT FOR
END IF NEXT I FOR I = ISTART + 1 TO 5 0 0 0
W = GETDEC(1, I) IF W = FSYNCVAL THEN
NSIGS = ((I - ISTART) \ 2 ) EXIT FOR
END IF NEXT I 'IF NSIGS <> NWORDS - NCHANELM THEN
PRINT # 3 , " ALARM: DISCREPENCY I N NUMBER O F WORDS SPECIFIED" PRINT # 3 , " CHECK FOR PROPER .SIG FILE" NWORDS = NSIGS
' ELSE
'END IF NWORDS = NSIGS
' f ind proper frame t o match TSTART
SWCH$ = "OFF" TIME = 0 I: = ISTART DO
I
W = GETDEC(1, I) IF W = FSYNCVAL TH-EN
END IF I = I + 1
TIME = TIME + TINTERVAL
LOOP UNTIL TIME > TSTART TIME = TIME - TINTERVAL I = I - 1 ISIG = I
1 .
' main data output do loop
Do
D-7
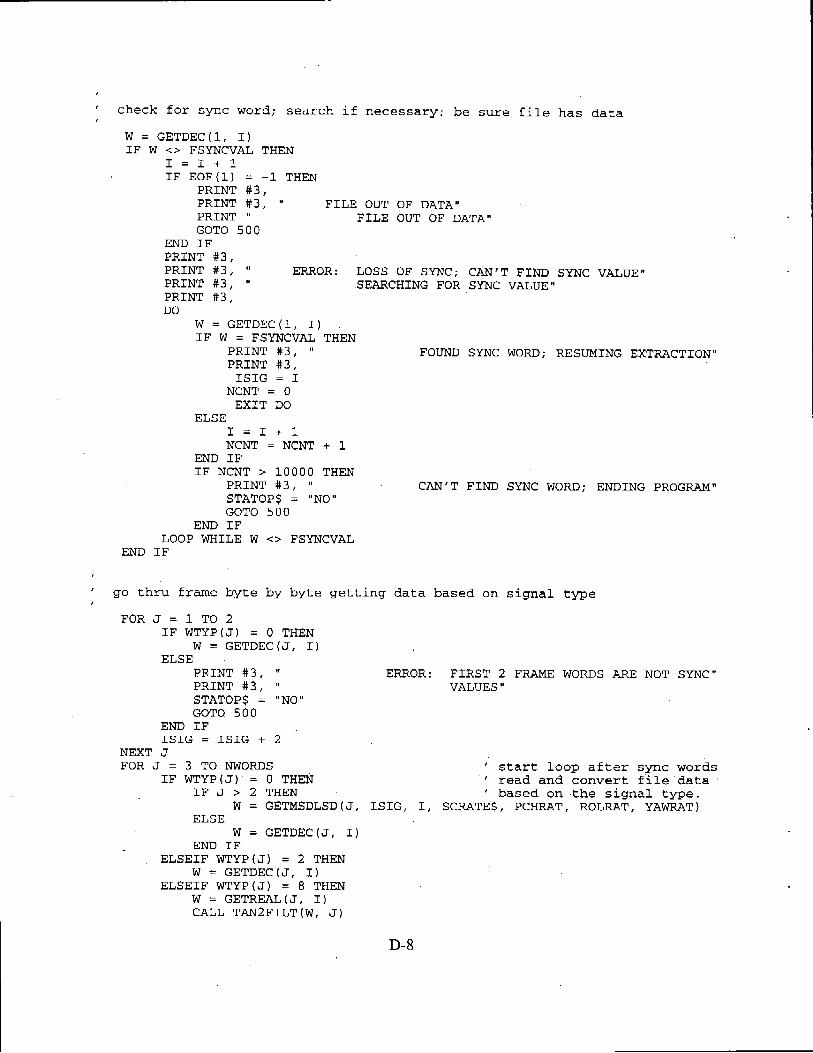
' check €or sync word; search if necessary: be sure file has data
W = GETDEC(1, I) IF W C- FSYNCVAL THEN
I = I + 1 IF EOF(1) = -1 THEN
PRINT # 3 , PRINT # 3 , " FILE OUT OF DATA" PRINT ' I FILE OUT OF DATA" GOTO 500
END IF PRINT #3, PRINT # 3 , " ERROR: LOSS OF SYNC; CAN'T FIND SYNC VALUE" PRINT #3, " SEARCHING FOR SYNC VALUE" PRINT #3, DO
W = GETDEC(1, I) IF W = FSYNCVAL THEN
PRINT #3, " FOUND SYNC WORD; RESUMING EXTRACTION" PRINT #3. ISIG = I
NCNT = 0 EXIT DO
I = I + 1 NCNT = NCNT + 1
ELSE
END IF IF NCNT > 10000 THEN
PRINT #3, "
STATOPS = "NO" GOTO 500
LOOP WHILE W <> FSYNCVAL END IF
END IF
CAN'T FIND SYNC WORD; ENDING PROGRAM"
' go thru frame byte by byte getting data based on signal type
FOR J = 1 TO 2 IF WTYP(J) = 0 THEN
W = GETDEC(J, I)
PRINT #3, " ERROR: FIRST 2 FRAME WORDS ARE NOT SYNC" PRINT #3, " VALUES " STATOPS = "NO" GOTO 500
END IF ISIG = ISIG + 2
ELSE
NEXT J FOR J = 3 TO NWORDS start loop after sync words
IF WTYP(J) = 0 THEN read and convert f i l e data IF J > 2 THEN ' based on the signal type.
W = GETMSDLSD(J, ISIG, I, SCRATES, PCHRAT, ROLRAT, YAWRAT) ELSE
W = GETDEC(J, I) END IF
ELSEIF WTYP(J) = 2 THEN W = GETDEC(J, I)
ELSEIF WTYP(J) = 8 THEN W = GETREAL(J, I) CALL TAN2FILT(W, J)
D-8
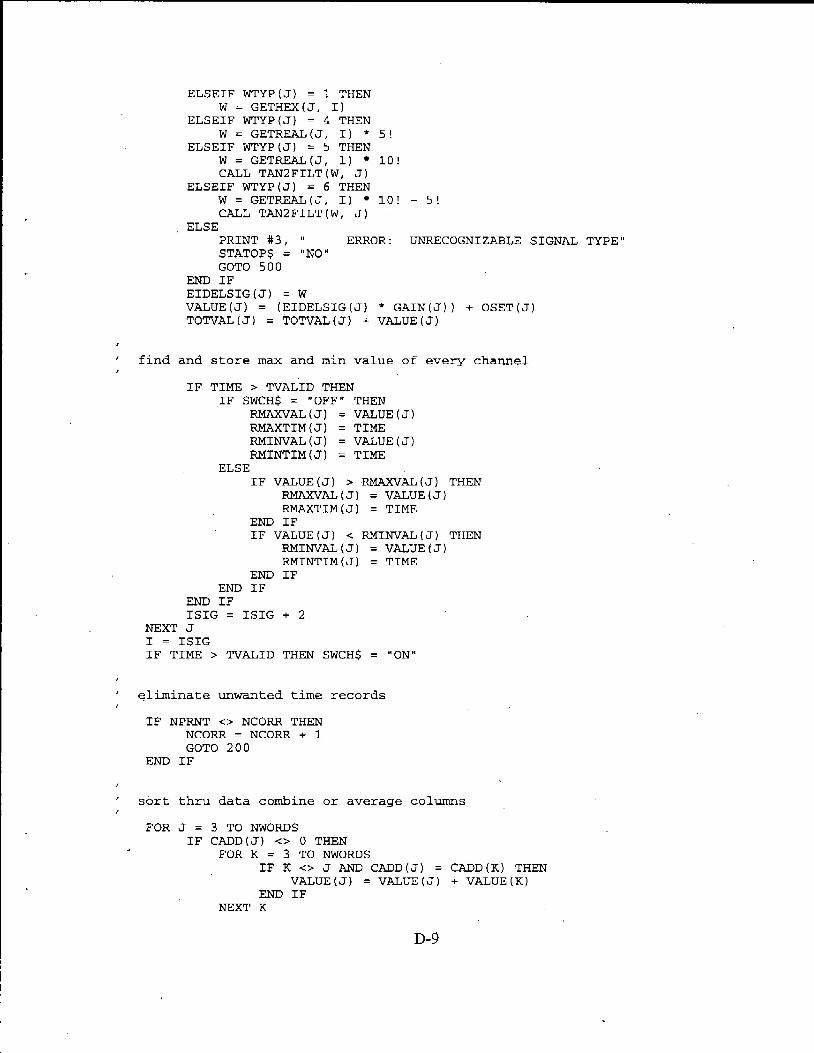
I .
ELSEIF WTYP(J) = 1 THEN W = GETHEX(J, I)
ELSEIF WTYP(J) = 4 THEN W = GETREAL(J, I) * 5 !
ELSEIF WTYP(J) = 5 THEN W = GETREAL(J, I) lo! CALL TAN2FILT(WI J)
ELSEIF WTYP(J) = 6 THEN
CALL TAN2FILT(WI J)
PRINT # 3 , " ERROR: UNRECOGNIZABLE SIGNAL TYPE" STATOPS = "NO" GOTO 500
END IF EIDELSIG(J) = W VALUE(J) = (EIDELSIG(J) * G A I N ( 5 ) ) + OSET(J) TOTVAL(J1 = TOTVAL(5) + VALUE(J)
W = GETREAL(J, I) lo! - 5 !
, ELSE
find and s t o r e m a x and m i n value of every channel I
IF TIME > TVALID THEN IF SWCH$ = "OFF" THEN
RMAXVAL(J) = VALUE(J) RMAXTIM(J) = TIME RMINVAL(J) = VALUE(J) RMINTIM(J) = TIME
IF VALUE(J) > RMAXVAL(J1 THEN RMAXVAL(J) = VALUE(J) RMAXTIM(J) = TIME
ELSE
END IF IF VALUE (J) < RMINVAL (J) THEN
RMINVAL(J) = VALUE(J) RMINTIM(J) = TIME
END IF END IF
END IF ISIG = ISIG + 2
NEXT J I = ISIG IF TIME > TVALID THEN SWCH$ = "ON"
' eliminate unwanted time records
I F NPRNT <> NCORR THEN NCORR = NCORR + 1 GOTO 200
END IF
' sort thru data combine or average columns
FOR J = 3 TO NWORDS IF CADD(J) <> 0 THEN
FOR K = 3 TO NWORDS IF K <> J AND CADD(J) = CADD(K) THEN
END IF VALUE(J) = VALUE(J) + VALUE(K)
NEXT K
D-9
END IF NEXT J
I
' print columns specified and derived values
PRINT # 3 , USING ' I # # # . # # # # ' I ; TIME; FOR J = 3 TO NWORDS
IF SKIP$ (J) <> "YES" THEN
END IF PRINT # 3 , USING ' I # # # # . # # # # " ; VALUE (J) ;
NEXT J IF SCRATES = "YES" THEN
PRINT #3, USING ' I # # # . # # # # "; ROLRAT; PCHRAT; END IF PRINT # 3 , NCORR = 1
TIME = TIME + TINTERVAL 200
LOOP WHILE TIME < TEND
500
' calculate mean and varience; print ou t max and rnin
IF STATOPS = "YES" THEN OPEN STATFILS FOR OUTPUT AS #6
PRINT #6, "Max, Min, Median, and Average: "; SCONDS PRINT # 6 , "Time Start = ' I ; TSTART; " : Time Stop = "; TEND PRINT #6, FOR I = 3 TO NWORDS
PRINT #6, "TIME CHANNEL STATISTICAL BREAKDOWN - "; SDATFILS
IF SKIP$ (I) <> "YES" THEN RMEDIAN = (RMAXVAL(1) + RMINVAL(1)) / 2 AVERAGE = TOTVAL(1) / (TIME * DFFREQ NPRNT)
PRINT #6, "Maximum Value = 'I; RMAXVAL(1); '' @ time = "; RMAXTIM(1) PRINT #6, "Minimum Value = 'I ; RMINVAL (I) ; 'I @ time = '' ; RMINTIM (I) PRINT # 6 , "Median = ' I ; RMEDIAN; " : Average = ' I ; AVERAGE PRINT #6,
PRINT #6, SWNAME$(I); " - ( ' I ; SUNIT$(I); ' I ) "
END IF NEXT I CLOSE #6
END IF
' close f i l e s and end program
CLOSE # 3 CLOSE #1 END
D-10
Subroutines
DEFSNG S ' ' IREC = byte position in binary f i l e f o r start byte of the cur ren t record. FUNCTION GETDEC (ISIG, IREC) STATIC '
DIM ID AS INTEGER
ISIG = signal number in binary file records, starting at 1.
GET #1, ISIG 2 - 2 + IREC, ID
IF ID i 0 THEN W = W + 6 5 5 3 6 ! GETDEC = W / 16!
. W = I D ' signed 16 bit integer .
' positive REAL in 16 bit range. ' positive REAL in 12 bit range.
END FUNCTION
' ISIG = signal number in binary file records, starting at 1. ' IREC = byte position in binary file for star t byte of the current record. FUNCTION GETDOUBLEHEX (ISIG. 1) DIM ID AS INTEGER, IDI 'AS INTEGER DEFLNG I-N
ITEMP = ISIG * 2 + IREC GET #1, ITEMP - 2 , ID ID = ID AND 127 W 1 # = ID ID = ID' \ 4 ID1 = ID W1# = ID 'W1#' / 4#
' Signed 16 bit integer.
' Positive €PAL in 12 bit range.
GET #1, ITEMP, ID ID = ID 'AND 4095 ID = ID ' \ 4 W2# = ID IF ID < 0 THEN W2# = W 2 # + 65536# W2# = W2# \ 64
PRINT SIGN; ID1; ID; W1#; W2#
W2# = ( W 1 # / 128! + W2# / 131072!) * 180! GETDOUBLEHEX = W2#
END FUNCTION
' ISIG = signal number in binary file records, starting at 1. ' IREC = byte position in binary file f o r start byte of the current record. FUNCTION GETHEX (ISIG, IREC) STATIC DIM HBO AS STRING * 1,.HB1 AS STRING * 1, HB2 AS STRING * 1, HB3 AS STRING 1 DIM TEMP2 AS STRING,.ID AS INTEGER SHARED FIRSTHEX$, SECONDHEX AS STRING
ITEMP = ISIG 2 - 2 + IREC GET #1, ITEMP + 0, HBO: GET #1, ITEMP + 1, HB1 GET #1, ITEMP + 2, HB2: GET #1, ITEMP + 3, HB3
ITEMP = ASC(HB0): FIRSTLO = ITEMP IF ITEMP -= 0 THEN TEMP2 = " 0 0 " ELSE TEMP2 = HEX$(ITEMP) IF-LEN(TEMP2) = 1 THEN TEMP2 = "0" + TEMP2
ITEMP = ASC (HB1) : FIRsTHI = ITEMP IF ITEMP = 0 THEN FIRSTHEX$ = "00" ELSE FIRSTHEX$ = HEX$(ITEMP) IF LEN(FIRSTHEX$) = 1 THEN FIRSTHEX$ = "0" + FIRSTHEX$
D-11
FIRSTHEX$ = FIRSTHEX$ + TEMP2
ITEMP = ASC(HB2): SECONDLO = ITEMP IF ITEMP = 0 THEN TEMP2 = "00" ELSE TEMP2 = HEX$(ITEMP) IF LEN(TEMP2) = 1 THEN TEMP2 = " 0 " + TEMP2
ITEMP = ASC(HB3): SECONDHI = ITEMP IF ITEMP = 0 THEN SECONDHEX = " 0 0 " ELSE SECONDHEX = HEX$(ITEMP) IF LEN(SEC0NDHEX) = 1 THEN SECONDHEX = "0" + SECONDHEX SECONDHEX = SECONDHEX + TEMP2
IWl = (FIRSTHI * 256 + FIRSTLO) \ 64 IWl = IW1 AND 127 W1 = IW1 'ID IW2 = (SECONDHI 256 + SECONDLO) \ 64 w2 = IW2
GETHEX = (W1 / 128! + W2 / 131072!) * 180!
END FUNCTION
' ISIG = signal number in binary file records, starting at 1. ' IREC = byte position in binary file f o r start byte of t he current record. FUNCTION GETMSDLSD (J, ISIG, IREC, SCRATES, PCHRAT, ROLRAT, YAWRAT) STATIC DIM ID AS INTEGER SHARED NWPHDG, CPHDGO I NSIGS, SWNAME$O, RATE(), TINTERVAL
' get rnsd/lsd values and apply formula
TEMPS = SWNAMES (J) ITEMP = J 2 + IREC
Wl# = ID IF ID < 0 THEN W1# = W1# + 65536# W1# = W1# / 16# GET #1, ITEMP, ID W2# = ID IF ID < 0 THEN W2# = W2# + 65536# W2# = W2# / 16# W3# = (W1# * 256! ' + W2#) * .0054931
GET #1, ITEMP - 2, ID ' Signed 16 bit integer
' ' Positive REAL in 16 bit range Positive REAL in 12 bit range
apply proper formula f o r proper channel
IF TEMP$ = "ROLL-(MSD) " THEN IF W3# > 180# AND W3# <= 360# THEN W3# = W3# - 3 6 0 # ' calculate roll rate IF SCRATE$ = "YES" THEN
IF ITEMP > 2 NWPHDG * NSIGS THEN R = O ! FOR K = I TO NWPHM:
IOFFSET = K * NSIGS * 2 GET #1, ITEMP - 2 + IOFFSET, ID W1# = ID IF ID < 0 THEN W1# = W1# + 65536# Wl# = W1# / 16#
GET #I, ITEMP + IOFFSET, ID W2# '= ID IF ID < 0 THEN W2# = W2# + 65536#
' signed 16 bit integer
' change to 12 bit range
D-12
W2# = W2# / 16#
WPLUS# = (W1# * 2 5 6 ! + W2#) * .0054931 IF WPLUS# > 180# AND WPLUS# <= 360# THEN WPLUS# = WPLUS# - 360#
GET #1, ITEMP - 2 - IOFFSET, ID ' signed 16 bit integer W1# = ID IF ID < 0 THEN W1# = W1# + 6 5 5 3 6 # W1# = W1# / 16# ' change to 12 bit range
GET #1, ITEMP - IOFFSET, ID W2# = ID IF ID < 0 THEN W2# = W2# + 65536# W2# = W2# / 16#
wMrms# = (wi# 2s6! + w2#) -0054931 IF WMINLTS# > 180# AND WINUS# <= 360# THEN WMINUS# = WMINUS# -
360# R = R + (WPLUS# - WINUS#) * CPHM;(K)
NEXT K ROLRAT = R
END IF END IF
IF W3# > 180# AND W3# <= 360# THEN W3# = W3# - 3 6 0 # W3# = -W3# ' calculate pitch ra te IF SCRATES = "YES" THEN
ELSEIF TEMP$ = "PITCH-(MSD) " THEN
IF ITEMP > 2 * NWPHDG NSIGS THEN R = o ! FOR K = 1 TO NWPHDG
IOFFSET = K * NSIGS 2 GET #1, ITEMP - 2 + IOFFSET, ID ' signed 16 b i t integer W1# = ID IF ID < 0 THEN W1# = W1# + 65536# W 1 # = W1S / 16# ' change to 12 b i t range
GET #1, ITEMP + IOFFSET, ID W2# = ID IF ID i 0 THEN W2# = W2# + 65536# W2# = W2# / 16#
WPLUS# = (W1# * 256! + W2#) * -0054931 IF WPLUS# > 180# AND WPLUS# <= 360# THEN WPLUS# = WPLUS# - 360#
GET #1, ITEMP - 2 - IOFFSET, ID ' signed 16 bit integer W1# = ID IF I D i 0 THEN W1# = W1# + 65536# Wl# = W1# / 16# ' change to 12 bit range
GET #1, ITEMP - IOFFSET, ID W2# = ID IF ID i 0 THEN W2# = W2# + 65536# W2# = W2# / 16#
WMINLTS# = (W1# * 256! + W2#) * . 0 0 5 4 9 3 1 IF WINUS# > 180# AND WMINUS# <= 3 6 0 # THEN WMINUS# = WMINUS# -
3-6 0 #
END
R = R + (WPLUS# - WMINUS#) * CPHDG(K) NEXT K
IF PCHRAT = -R
D-13
END IF ELSEIF TEMP$ = "P/HDG-(MSD)" THEN
W3# = W3# - PCORRECT# IF SGN(W3#) = -1 THEN W3# = W3# + 3 6 0 # ' calculate yaw rate IF SCRATES = "YES" THEN
IF ITEMP > 2 * NWPHDG * NSIGS THEN R = O! FOR K = 1 TO NWPHDG
IOFFSET = K NSIGS 2
W1# = ID IF ID < 0 THEN W1# = W1# + 6 5 5 3 6 # W1# = W1# / 16#
GET.#l, ITEMP - 2 + IOFFSET, ID ' signed 16 bit integer
' change to 12 bit range
GET #1, ITEMP + IOFFSET, ID W2# = ID IF ID < 0 THEN W2# = W2# + 65536# W2# = W2# / 1 6 #
WPLUS# = (Wl# * 2 5 6 ! + W2#) .0054931 IF SGN(WPLUS#) = -1 THEN WPLWS# = WPLUS# + 3 6 0 #
GET #1, ITEMP - 2 - IOFFSET, ID ' signed 16 bit integer W1# = ID IF ID < 0 THEN W 1 # = W1# + 6 5 5 3 6 # w1# = W1# / 16# ' change to 12 bit range
GET #1, ITEMP - IOFFSET, ID W2# = ID IF ID < 0 THEN W2# = W 2 # + 65536# W2# = W2# / 1 6 #
WMINUS# = ( W 1 # * 2 5 6 ! + W2#) * . 0 0 5 4 9 3 1 IF SGN(WMINUS#) = -1 THEN WMINUS# = WMINUS# + 3 6 0 # R = R + (WPLUS# - WMINUS#) * CPHDG(K)
NEXT K YAWRAT = R
END IF END IF
ELSEIF LEFT$(TEMP$, 3) = "EPR" THEN W3# = W3# * .008333
ELSEIF TEMP$ = ''OPT/DIST_MSD" THEN W3# = W1# 16 + W2# / 256
END IF
w = W3# GETMSDLSD = W END FUNCTION
' ISIG = signal number i n binary f i l e records, starting at 1. ' IREC = ,byte position in binary file f o r start byte of the current record. FUNCTION GETREAL (ISIG, IREC) STATIC SHARED NWPHM:, CPHDGO, NSIGS DIM ID AS INTEGER
IPOSN = ISIG * 2 + IREC GETd#l, ISIG * 2 - 2 + IREC, ID W = ID IF ID < 0 THEN W = W + 65536! GETREAL = W / 65536!
D- 14
' signed 16 bit integer.
' positive REAL in 16 b i t range. ' put in range 0.0 to 1.0.
GET’ #1, I S I G 2 - 2 + IREC, ID W = I D I F ID < 0 THEN W = W + 65536! W = W / 65536! GETREAL = W
’ signed 16 bit integer .
’ positive REAL in 16 bit range. ‘ put in range 0 . 0 to 1.0.
END FUNCTION
DEFINT I-N SUB LPTB (MM, T, B, A l O , A 2 0 , BZERO) STATIC M = M M ANG = 3 . 1 4 1 5 9 3 B * T FACT = SIN(ANG) / Cos (ANG) MI = M - M / 2 F = l! FFN = M SECTOR = 3.141593 / FFN WEDGE = SECTOR / 2 ! FOR I = 1 TO M1
FFN = I - 1 AJIG = FFN * SECTOR + WEDGE AM = FACT S I N ( A N G ) BM = FACT COS(ANG) hMs=AM*AM DEN = (l! + BM) * 2 + m s A1(I) = - 2 ! * ((I! - BM * BM) - AMS) / DEN A2(I) = ((I! - BM) * 2 + AMS) / DEN F = F (l! + Al(1) + A2(I)) / 4 !
NEXT I BZERO = F * (l! / M1)
END SUB
DEFSNG I-N FUNCPION RIO ( X ) STATIC DEFINT I-N y = X / 2 ! : T = 1E-08: E = I!: DE = I = O DO I = I + 1
RIO = E - END FUNCTION
DEFLNG I - N SUB SETFILTERS STATIC SHARED NWPHM;, CPHDG ( )
’ calculate filter weights .
PI = 3 . 1 4 1 5 9 : TWOPI = 2 ! * PI NWPHDG = 16 FB = 2 TSP
ALPHA = 3.395 ’ 40 dB ‘ALPHA = 5 . 6 5 3 ‘ 60 dB A10 = RIO(ALPHA)
’ convert from H z to range 0 to 0 . 5 ‘ALPHA = 2 . 7 8 3 ’ 3 5 dB
D-15
CPHDG(K) = RIO(XI0) / A10 OMEGA = TWOPI * AK * FB
CPHDG(K) = CPHM:(K) TEMP / TSP TEMP = I! * (SIN(0MEGA) / AK - TWOPI * FB * COS(0MEGA)) / (AK * PI)
NEXT K I = O : Y = O ! FOR K = 1 TO NWPHM;
1 NEXT R YSEOPE = Y FOR I = 1 TO NWPHM:
NEXT I
Y = Y + TSP ((1 + K) - (I - K)) * CPHDG(K) 'Linear slope = TSP per s tep =
CPHDG(1) = CPHDG(1) / YSLOPE
GOT0 NOCHECK FOR I = 1 TO
NEXT I PRINT I; CPHDG(1)
FOR IFR = 0 TO 18 FREQ = IFR .O2 HF = O! FOR I = 1 TO NWPHM; A1 = I HF = 2 ! CPHDG(1) * SIN(TWOP1 * A1 * FREQ) + HF
NEXT I PRINT USING " # # # . # # # # "; FREQ / TSP; HF / TWOPI
NEXT IFR
PRINT TSP FOR I = 0 TO 1 Y = O! FOR K = 1 TO NWPHDG
Y = Y + TSP * ((I + K) - (I - K)) CPHDG(K)'Linear slope = TSp per step =
NEXT K PRINT I; Y; YSLOPE
NEXT I END NOCHECK :
END SUB
SUB SETTANFILT STATIC DIM ALl(100)' AL2(100), BL0(100), BL1(100), BL2(100), HF(100) DIM MM AS INTEGER SHARED B o 1 , B02, All, A12, A21, A22, TANFILTFREQ
TWOPI = 6.2831853#: PI = TWOPI / 2 ! M M = 4 FB = TANFILTFREQ ' PRINT TSP
Eigh pass section. CALL LPTB(MM, TSP, FB, AL1(), AL2 ( ) , BZERO) FOR-I = 1 TO MM / 2
BLO(1) = l! BZERO: BLl(1) = 2 ! * BZERO: BL2(I) = l! * BZERO ' PRINT USING ' I # # # . # # # # # "; ALl(1); AL2(1); BLO(1); BLl(1); BL2(I) NEXT I
D-16
B01 = BLO(1) : B02 = BLO(2) A 1 1 = ALl(1): A12 = ALl(2): A21 = AL2(1): A22 = AL2(2)
GOT0 SKIPCHECK FOR I = 1 TO 15
FREQ = I * 2 CALL TTRAN(AL10, AL2(), BLO(), B L 1 0 , BL2(), MM, TSP, FREQ, -2, PHS) PRINT USING ' I # # . # # # # # . # # # # # ' I ; FREQ; ABZ HF(1) = ABZ
NEXT I END SKIPCHECK:
END SUB
SUB TAN2FILT (W, 5) STATIC DIM WM1(80), WM2(80), YlM1(80), YlM2(80),'Y2M1(80), Y2M2(80) SHARED B01, B02, All, A12, A21, A22
Y1 = B01 * (W + 2! WMl(J) + WM2(J)) - All YlMl(J) - A21 * YlM2(J) Y2 = B02 (Y1 + 2 ! * YlMl(J) + YlMZ(J)) - A12 * Y2M1(J) - A22 * Y2M2(J) Y1M2(J) = YlMI(J): YlMl(J) = Y1 Y2M2 (J) = Y2M1 (J) : Y2M1 (J) = Y2 WM2(J) = WMl(J): WMI(J) = W w = Y2
END SUB
DEFINT I-N SUB TTRAN ( A l ( ) , A 2 0 , B O O , B 1 0 , B 2 0 , M, T, FREQ, A B Z , PHS) STATIC
FACT = 6.283185 * T
ADD = O! PREV = O! FD = FREQ * FACT S1 = SIN(FD) C1 = COS(FD) A = 2 ! * FD S2 = S I N ( A ) C2 = COS(A) ABSA = l! PHSA = O ! FOR J = 1 TO IP
XP = M - M / 2
AR = BO(J) + Bl(J) C1 + B2(J) * C2 A1 = -Bl(J) * S1 -,S2(J) * S2 ANM = AR AR + A1 * A1 PND = O ! IF A1 <> O! OR AR <r O! THEN PND = ATN(A1 / AR) AR = l! f Al(J) C1 + A2(J) C2 A1 = -Al(J) * S1 - A2(5) * S2 ABSA = ABSA * ANM / (AR * AR + A1 A I )
NEXT J ABZ = SQR(ABSA)
END SUB
D-17

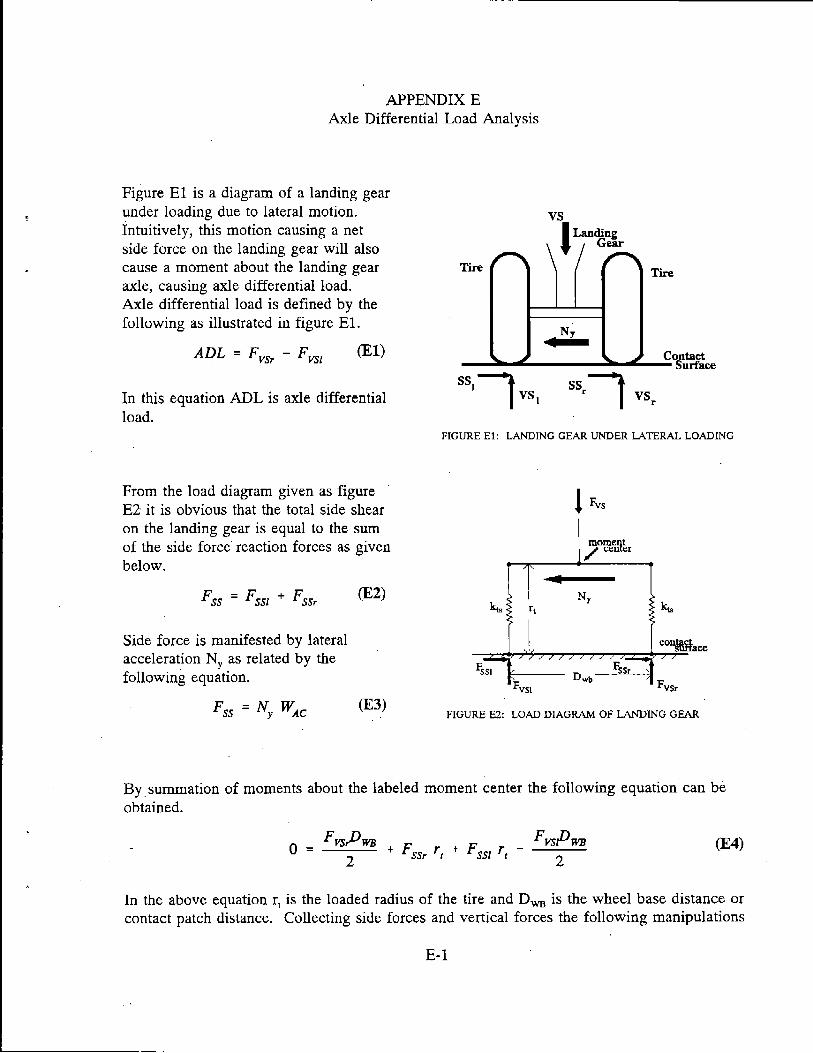
APPENDIX E Axle Differential Load Analysis
Figure E l is a diagram of a landing gear under loading due to lateral motion. Intuitively, this motion causing a net side force on the landing gear will also cause a moment about the landing gear axle, causing axle differential load. Axle differential load is defined by the following as illustrated in figure El.
In this equation ADL is axle differential load.
FIGURE El: LANDING GEAR UNDER LATERAL LOADING
From the load diagram given as figure E2 it is obvious that the total side shear on the landing gear is equal to the sum of the side force' reaction forces as given below.
Side force is manifested by lateral acceleration N, as related by the following equation.
Fss = Ny WA C
I "
IT- I
FIGURE E2: LOAD DIAGRAM OF LANDING GEAR
By summation of moments about the labeled moment center the following equation can be obtained.
In the above equation rr is the loaded radius of the tire and D, is the wheel base distance or contact patch distance. Collecting side forces and vertical forces the following manipulations
E- 1
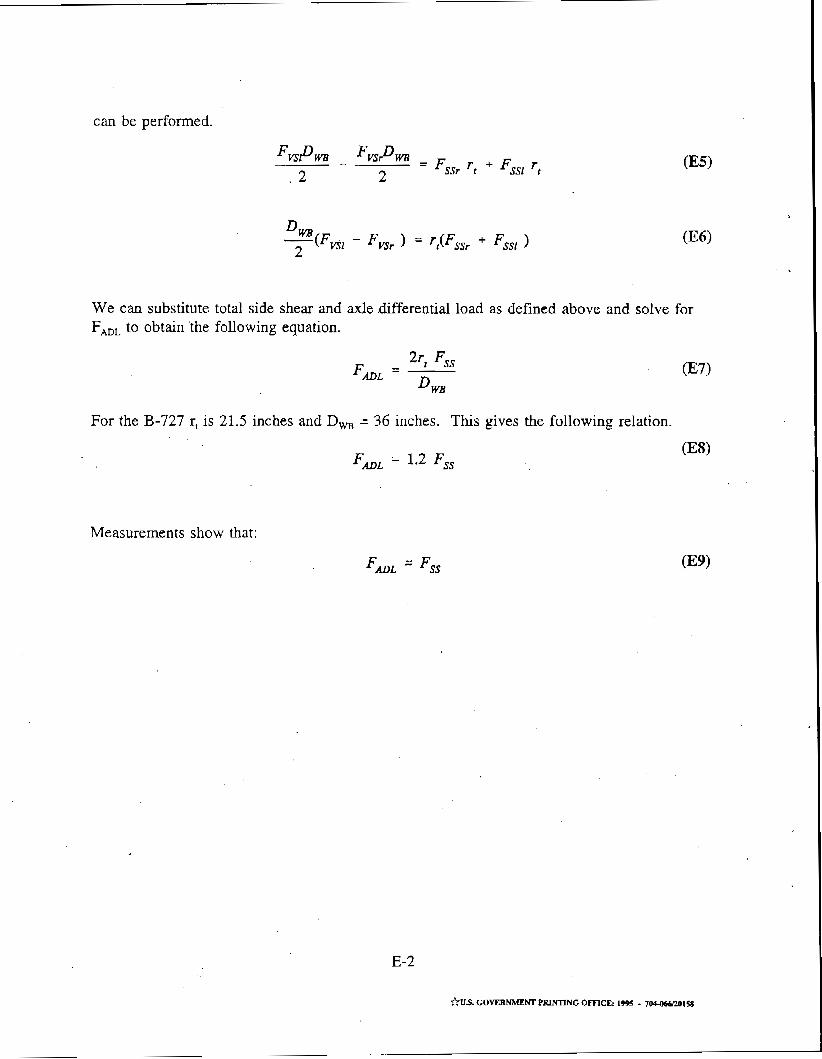
can be performed.
We can substitute total side shear and axle .differential load as defined above and solve for FADL to obtain the following equation.
2 5 Fss
DWB
FmL = -
For the B-727 r, is 21.5 inches and DWB = 36 inches. This gives the following
FaL = 1,2 Fss
Measurements show that:
E-2
*US. GOVERNMENT PRINTING OFFICE: 1995 - 7-20158