An advanced CFD model to study the effect of non ...
9
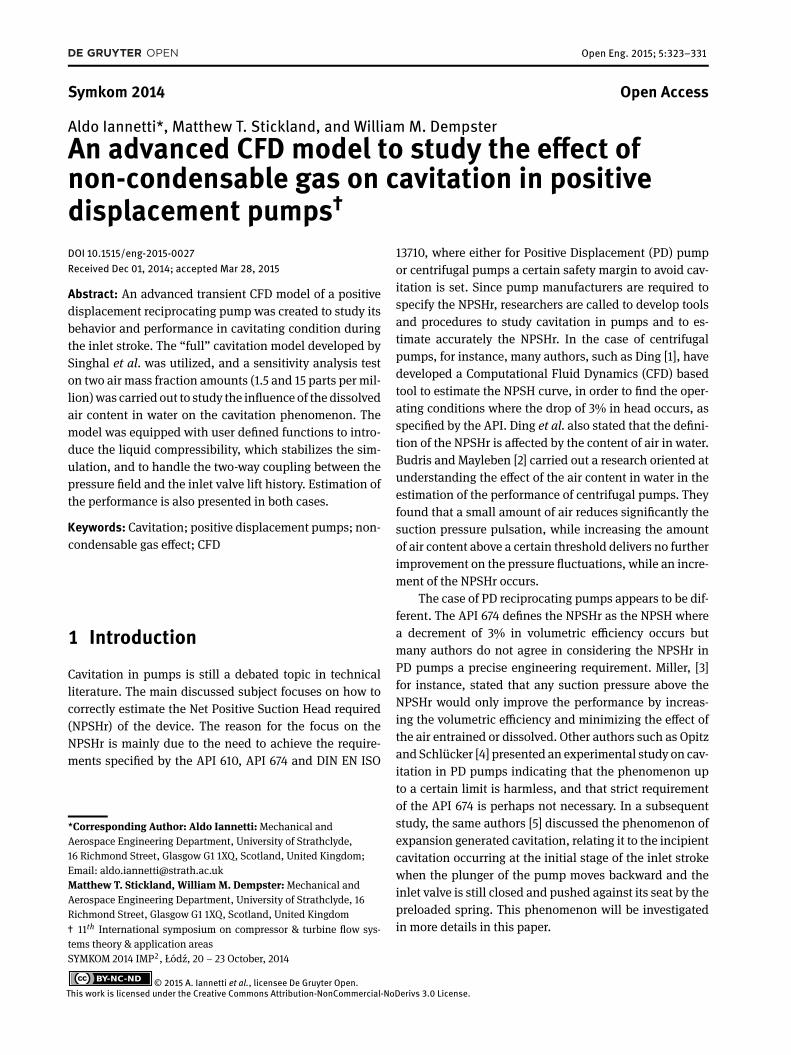
© 2015 A. Iannetti et al., licensee De Gruyter Open. This work is licensed under the Creative Commons Attribution-NonCommercial-NoDerivs 3.0 License. Open Eng. 2015; 5:323–331 Symkom 2014 Open Access Aldo Iannetti*, Matthew T. Stickland, and William M. Dempster An advanced CFD model to study the effect of non-condensable gas on cavitation in positive displacement pumps † DOI 10.1515/eng-2015-0027 Received Dec 01, 2014; accepted Mar 28, 2015 Abstract: An advanced transient CFD model of a positive displacement reciprocating pump was created to study its behavior and performance in cavitating condition during the inlet stroke. The “full” cavitation model developed by Singhal et al. was utilized, and a sensitivity analysis test on two air mass fraction amounts (1.5 and 15 parts per mil- lion) was carried out to study the influence of the dissolved air content in water on the cavitation phenomenon. The model was equipped with user defined functions to intro- duce the liquid compressibility, which stabilizes the sim- ulation, and to handle the two-way coupling between the pressure field and the inlet valve lift history. Estimation of the performance is also presented in both cases. Keywords: Cavitation; positive displacement pumps; non- condensable gas effect; CFD 1 Introduction Cavitation in pumps is still a debated topic in technical literature. The main discussed subject focuses on how to correctly estimate the Net Positive Suction Head required (NPSHr) of the device. The reason for the focus on the NPSHr is mainly due to the need to achieve the require- ments specified by the API 610, API 674 and DIN EN ISO *Corresponding Author: Aldo Iannetti: Mechanical and Aerospace Engineering Department, University of Strathclyde, 16 Richmond Street, Glasgow G1 1XQ, Scotland, United Kingdom; Email: [email protected] Matthew T. Stickland, William M. Dempster: Mechanical and Aerospace Engineering Department, University of Strathclyde, 16 Richmond Street, Glasgow G1 1XQ, Scotland, United Kingdom † 11 th International symposium on compressor & turbine flow sys- tems theory & application areas SYMKOM 2014 IMP 2 , Łódź, 20 – 23 October, 2014 13710, where either for Positive Displacement (PD) pump or centrifugal pumps a certain safety margin to avoid cav- itation is set. Since pump manufacturers are required to specify the NPSHr, researchers are called to develop tools and procedures to study cavitation in pumps and to es- timate accurately the NPSHr. In the case of centrifugal pumps, for instance, many authors, such as Ding [1], have developed a Computational Fluid Dynamics (CFD) based tool to estimate the NPSH curve, in order to find the oper- ating conditions where the drop of 3% in head occurs, as specified by the API. Ding et al. also stated that the defini- tion of the NPSHr is affected by the content of air in water. Budris and Mayleben [2] carried out a research oriented at understanding the effect of the air content in water in the estimation of the performance of centrifugal pumps. They found that a small amount of air reduces significantly the suction pressure pulsation, while increasing the amount of air content above a certain threshold delivers no further improvement on the pressure fluctuations, while an incre- ment of the NPSHr occurs. The case of PD reciprocating pumps appears to be dif- ferent. The API 674 defines the NPSHr as the NPSH where a decrement of 3% in volumetric efficiency occurs but many authors do not agree in considering the NPSHr in PD pumps a precise engineering requirement. Miller, [3] for instance, stated that any suction pressure above the NPSHr would only improve the performance by increas- ing the volumetric efficiency and minimizing the effect of the air entrained or dissolved. Other authors such as Opitz and Schlücker [4] presented an experimental study on cav- itation in PD pumps indicating that the phenomenon up to a certain limit is harmless, and that strict requirement of the API 674 is perhaps not necessary. In a subsequent study, the same authors [5] discussed the phenomenon of expansion generated cavitation, relating it to the incipient cavitation occurring at the initial stage of the inlet stroke when the plunger of the pump moves backward and the inlet valve is still closed and pushed against its seat by the preloaded spring. This phenomenon will be investigated in more details in this paper.
-
Upload
khangminh22 -
Category
Documents
-
view
5 -
download
0
Transcript of An advanced CFD model to study the effect of non ...
© 2015 A. Iannetti et al., licensee De Gruyter Open.This work is licensed under the Creative Commons Attribution-NonCommercial-NoDerivs 3.0 License.
Open Eng. 2015; 5:323–331
Symkom 2014 Open Access
Aldo Iannetti*, Matthew T. Stickland, and William M. DempsterAn advanced CFD model to study the effect ofnon-condensable gas on cavitation in positivedisplacement pumps†DOI 10.1515/eng-2015-0027Received Dec 01, 2014; accepted Mar 28, 2015
Abstract: An advanced transient CFD model of a positivedisplacement reciprocating pump was created to study itsbehavior and performance in cavitating condition duringthe inlet stroke. The “full” cavitation model developed bySinghal et al. was utilized, and a sensitivity analysis teston two air mass fraction amounts (1.5 and 15 parts per mil-lion)was carried out to study the influence of the dissolvedair content in water on the cavitation phenomenon. Themodel was equipped with user defined functions to intro-duce the liquid compressibility, which stabilizes the sim-ulation, and to handle the two-way coupling between thepressure field and the inlet valve lift history. Estimation ofthe performance is also presented in both cases.
Keywords: Cavitation; positive displacement pumps; non-condensable gas effect; CFD
1 IntroductionCavitation in pumps is still a debated topic in technicalliterature. The main discussed subject focuses on how tocorrectly estimate the Net Positive Suction Head required(NPSHr) of the device. The reason for the focus on theNPSHr is mainly due to the need to achieve the require-ments specified by the API 610, API 674 and DIN EN ISO
*Corresponding Author: Aldo Iannetti:Mechanical andAerospace Engineering Department, University of Strathclyde,16 Richmond Street, Glasgow G1 1XQ, Scotland, United Kingdom;Email: [email protected] T. Stickland, WilliamM. Dempster:Mechanical andAerospace Engineering Department, University of Strathclyde, 16Richmond Street, Glasgow G1 1XQ, Scotland, United Kingdom† 11th International symposium on compressor & turbine flow sys-tems theory & application areasSYMKOM 2014 IMP2, Łódź, 20 – 23 October, 2014
13710, where either for Positive Displacement (PD) pumpor centrifugal pumps a certain safety margin to avoid cav-itation is set. Since pump manufacturers are required tospecify the NPSHr, researchers are called to develop toolsand procedures to study cavitation in pumps and to es-timate accurately the NPSHr. In the case of centrifugalpumps, for instance, many authors, such as Ding [1], havedeveloped a Computational Fluid Dynamics (CFD) basedtool to estimate the NPSH curve, in order to find the oper-ating conditions where the drop of 3% in head occurs, asspecified by the API. Ding et al. also stated that the defini-tion of the NPSHr is affected by the content of air in water.Budris and Mayleben [2] carried out a research oriented atunderstanding the effect of the air content in water in theestimation of the performance of centrifugal pumps. Theyfound that a small amount of air reduces significantly thesuction pressure pulsation, while increasing the amountof air content above a certain threshold delivers no furtherimprovement on the pressure fluctuations, while an incre-ment of the NPSHr occurs.
The case of PD reciprocating pumps appears to be dif-ferent. The API 674 defines the NPSHr as the NPSH wherea decrement of 3% in volumetric efficiency occurs butmany authors do not agree in considering the NPSHr inPD pumps a precise engineering requirement. Miller, [3]for instance, stated that any suction pressure above theNPSHr would only improve the performance by increas-ing the volumetric efficiency and minimizing the effect ofthe air entrained or dissolved. Other authors such as Opitzand Schlücker [4] presented an experimental study on cav-itation in PD pumps indicating that the phenomenon upto a certain limit is harmless, and that strict requirementof the API 674 is perhaps not necessary. In a subsequentstudy, the same authors [5] discussed the phenomenon ofexpansion generated cavitation, relating it to the incipientcavitation occurring at the initial stage of the inlet strokewhen the plunger of the pump moves backward and theinlet valve is still closed and pushed against its seat by thepreloaded spring. This phenomenon will be investigatedin more details in this paper.
324 | A. Iannetti et al.
Figure 1. 2D section of the PD pump utilised to create the fluid volume and the mesh for the CFD.
Nomenclature is provided.
Figure 2. Decomposition pattern of the fluid volumes (Iannetti, Stickland, and Dempster 2014).
1) Inlet 2) Outlet 3) Inlet valve 4) Outlet valve 5) Plunger (TDC) 6) Spring retainer 7) Spring 8) External case
1
2
3
4
5
6 7
7
8
Static mesh
Expanding/compressing mesh
Translating mesh
Mesh(t1)=Mesh(t2)
STATIC MESH
Mesh (time 1)
Mesh (time 2)
TRANSLATING MESH
Mesh (t1) Mesh (t2)
EXPANDING MESH
1
3
2
4 5
6
7
8
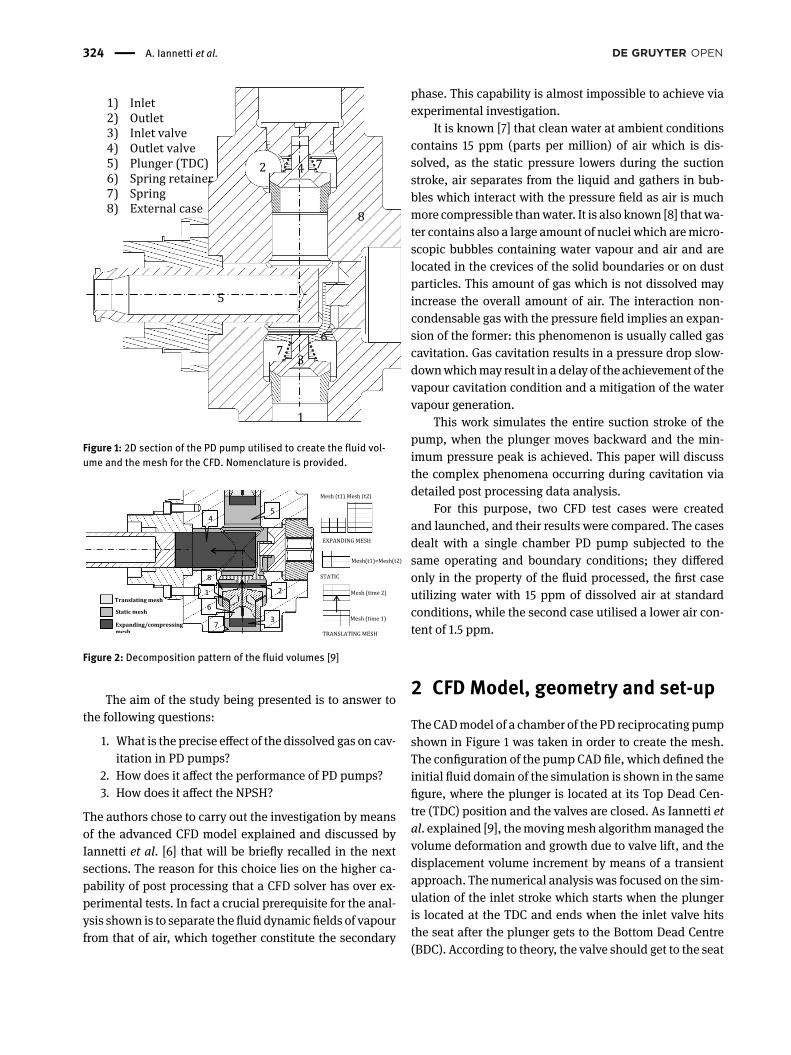
Figure 1: 2D section of the PD pump utilised to create the fluid vol-ume and the mesh for the CFD. Nomenclature is provided.
Figure 1. 2D section of the PD pump utilised to create the fluid volume and the mesh for the CFD.
Nomenclature is provided.
Figure 2. Decomposition pattern of the fluid volumes (Iannetti, Stickland, and Dempster 2014).
1) Inlet 2) Outlet 3) Inlet valve 4) Outlet valve 5) Plunger (TDC) 6) Spring retainer 7) Spring 8) External case
1
2
3
4
5
6 7
7
8
Static mesh
Expanding/compressing mesh
Translating mesh
Mesh(t1)=Mesh(t2)
STATIC MESH
Mesh (time 1)
Mesh (time 2)
TRANSLATING MESH
Mesh (t1) Mesh (t2)
EXPANDING MESH
1
3
2
4 5
6
7
8
Figure 2: Decomposition pattern of the fluid volumes [9]
The aim of the study being presented is to answer tothe following questions:
1. What is the precise effect of the dissolved gas on cav-itation in PD pumps?
2. How does it affect the performance of PD pumps?3. How does it affect the NPSH?
The authors chose to carry out the investigation by meansof the advanced CFD model explained and discussed byIannetti et al. [6] that will be briefly recalled in the nextsections. The reason for this choice lies on the higher ca-pability of post processing that a CFD solver has over ex-perimental tests. In fact a crucial prerequisite for the anal-ysis shown is to separate the fluid dynamic fields of vapourfrom that of air, which together constitute the secondary
phase. This capability is almost impossible to achieve viaexperimental investigation.
It is known [7] that clean water at ambient conditionscontains 15 ppm (parts per million) of air which is dis-solved, as the static pressure lowers during the suctionstroke, air separates from the liquid and gathers in bub-bles which interact with the pressure field as air is muchmore compressible thanwater. It is also known [8] thatwa-ter contains also a large amount of nuclei which aremicro-scopic bubbles containing water vapour and air and arelocated in the crevices of the solid boundaries or on dustparticles. This amount of gas which is not dissolved mayincrease the overall amount of air. The interaction non-condensable gas with the pressure field implies an expan-sion of the former: this phenomenon is usually called gascavitation. Gas cavitation results in a pressure drop slow-downwhichmay result in adelay of the achievement of thevapour cavitation condition and a mitigation of the watervapour generation.
This work simulates the entire suction stroke of thepump, when the plunger moves backward and the min-imum pressure peak is achieved. This paper will discussthe complex phenomena occurring during cavitation viadetailed post processing data analysis.
For this purpose, two CFD test cases were createdand launched, and their results were compared. The casesdealt with a single chamber PD pump subjected to thesame operating and boundary conditions; they differedonly in the property of the fluid processed, the first caseutilizing water with 15 ppm of dissolved air at standardconditions, while the second case utilised a lower air con-tent of 1.5 ppm.
2 CFD Model, geometry and set-upTheCADmodel of a chamber of the PD reciprocating pumpshown in Figure 1 was taken in order to create the mesh.The configuration of the pump CAD file, which defined theinitial fluid domain of the simulation is shown in the samefigure, where the plunger is located at its Top Dead Cen-tre (TDC) position and the valves are closed. As Iannetti etal. explained [9], themovingmesh algorithmmanaged thevolume deformation and growth due to valve lift, and thedisplacement volume increment by means of a transientapproach. The numerical analysis was focused on the sim-ulation of the inlet stroke which starts when the plungeris located at the TDC and ends when the inlet valve hitsthe seat after the plunger gets to the Bottom Dead Centre(BDC). According to theory, the valve should get to the seat
CFD of PD pumps to investigate the non-condensable gas effect on cavitation | 325
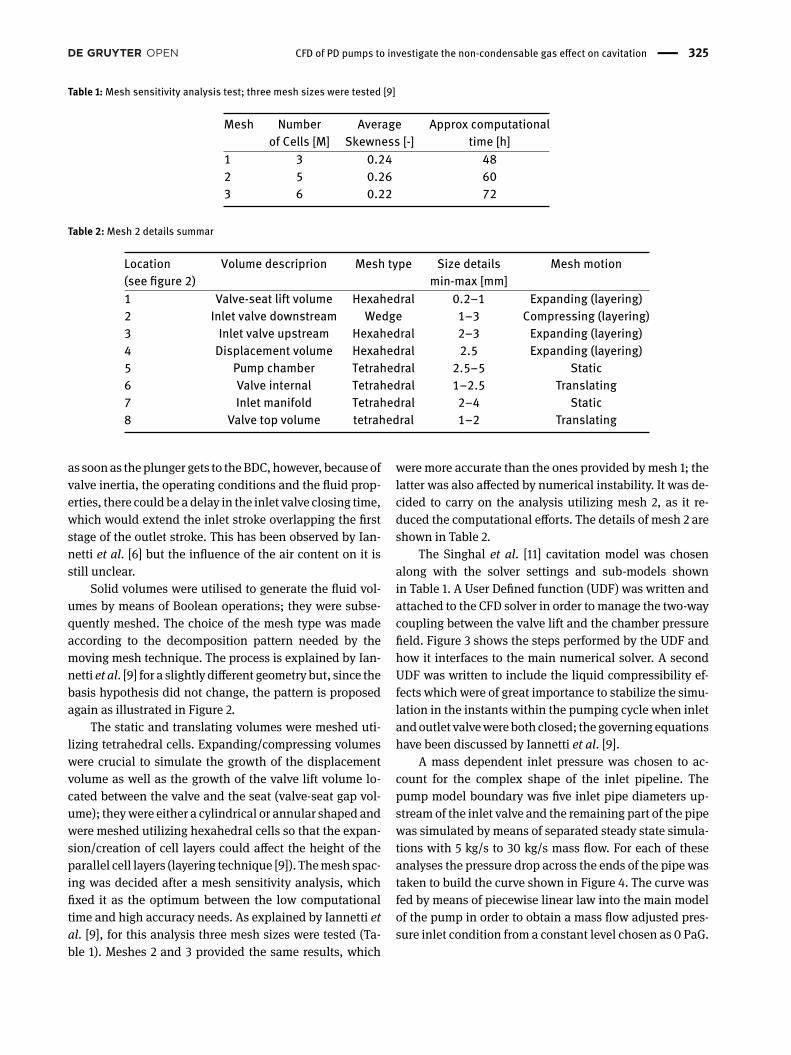
Table 1:Mesh sensitivity analysis test; three mesh sizes were tested [9]
Mesh Number Average Approx computationalof Cells [M] Skewness [-] time [h]
1 3 0.24 482 5 0.26 603 6 0.22 72
Table 2:Mesh 2 details summar
Location Volume descriprion Mesh type Size details Mesh motion(see figure 2) min-max [mm]1 Valve-seat lift volume Hexahedral 0.2–1 Expanding (layering)2 Inlet valve downstream Wedge 1–3 Compressing (layering)3 Inlet valve upstream Hexahedral 2–3 Expanding (layering)4 Displacement volume Hexahedral 2.5 Expanding (layering)5 Pump chamber Tetrahedral 2.5–5 Static6 Valve internal Tetrahedral 1–2.5 Translating7 Inlet manifold Tetrahedral 2–4 Static8 Valve top volume tetrahedral 1–2 Translating
as soonas theplunger gets to theBDC,however, because ofvalve inertia, the operating conditions and the fluid prop-erties, there could be a delay in the inlet valve closing time,which would extend the inlet stroke overlapping the firststage of the outlet stroke. This has been observed by Ian-netti et al. [6] but the influence of the air content on it isstill unclear.
Solid volumes were utilised to generate the fluid vol-umes by means of Boolean operations; they were subse-quently meshed. The choice of the mesh type was madeaccording to the decomposition pattern needed by themoving mesh technique. The process is explained by Ian-netti et al. [9] for a slightly different geometry but, since thebasis hypothesis did not change, the pattern is proposedagain as illustrated in Figure 2.
The static and translating volumes were meshed uti-lizing tetrahedral cells. Expanding/compressing volumeswere crucial to simulate the growth of the displacementvolume as well as the growth of the valve lift volume lo-cated between the valve and the seat (valve-seat gap vol-ume); theywere either a cylindrical or annular shaped andwere meshed utilizing hexahedral cells so that the expan-sion/creation of cell layers could affect the height of theparallel cell layers (layering technique [9]). Themesh spac-ing was decided after a mesh sensitivity analysis, whichfixed it as the optimum between the low computationaltime and high accuracy needs. As explained by Iannetti etal. [9], for this analysis three mesh sizes were tested (Ta-ble 1). Meshes 2 and 3 provided the same results, which
were more accurate than the ones provided by mesh 1; thelatter was also affected by numerical instability. It was de-cided to carry on the analysis utilizing mesh 2, as it re-duced the computational efforts. The details of mesh 2 areshown in Table 2.
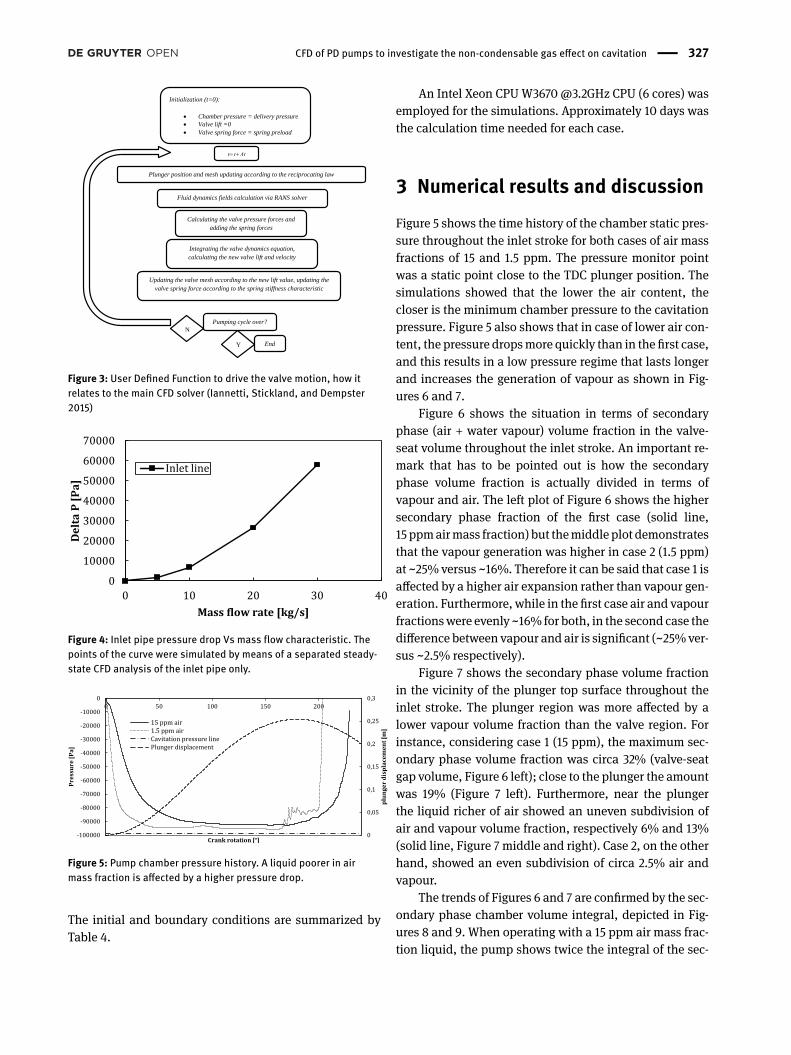
The Singhal et al. [11] cavitation model was chosenalong with the solver settings and sub-models shownin Table 1. A User Defined function (UDF) was written andattached to the CFD solver in order to manage the two-waycoupling between the valve lift and the chamber pressurefield. Figure 3 shows the steps performed by the UDF andhow it interfaces to the main numerical solver. A secondUDF was written to include the liquid compressibility ef-fects which were of great importance to stabilize the simu-lation in the instants within the pumping cycle when inletandoutlet valvewereboth closed; the governing equationshave been discussed by Iannetti et al. [9].
A mass dependent inlet pressure was chosen to ac-count for the complex shape of the inlet pipeline. Thepump model boundary was five inlet pipe diameters up-stream of the inlet valve and the remaining part of the pipewas simulated by means of separated steady state simula-tions with 5 kg/s to 30 kg/s mass flow. For each of theseanalyses the pressure drop across the ends of the pipe wastaken to build the curve shown in Figure 4. The curve wasfed by means of piecewise linear law into the main modelof the pump in order to obtain a mass flow adjusted pres-sure inlet condition from a constant level chosen as 0 PaG.
326 | A. Iannetti et al.
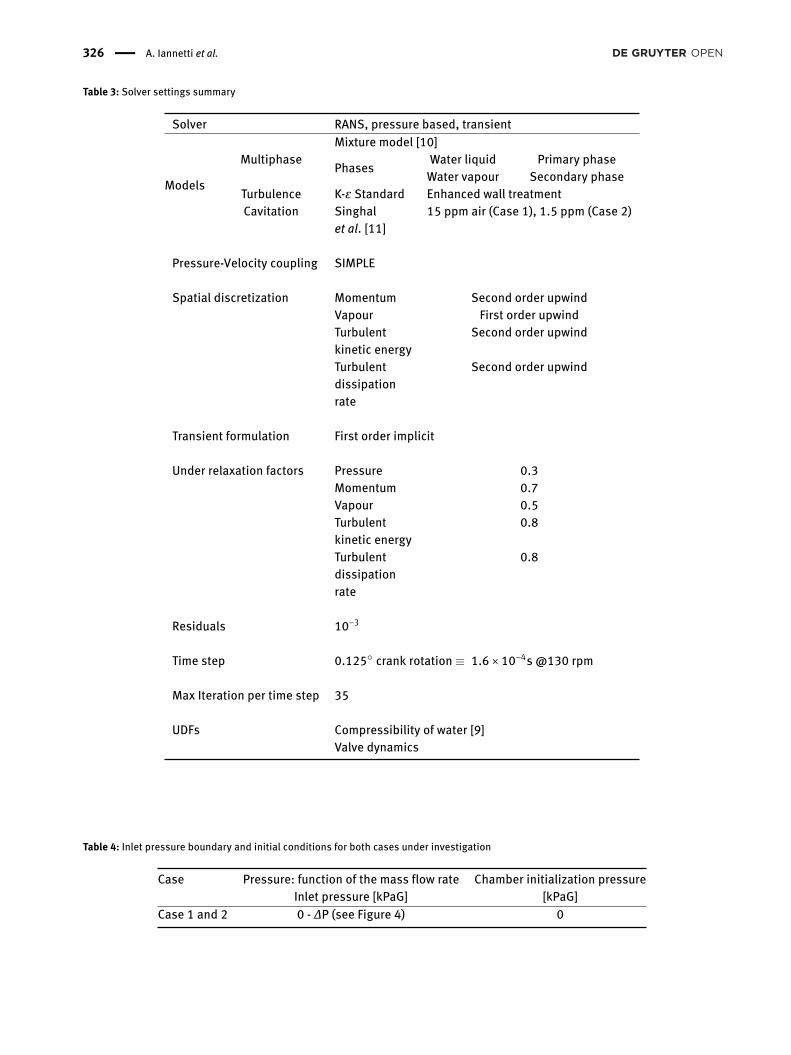
Table 3: Solver settings summary
Solver RANS, pressure based, transient
Models
MultiphaseMixture model [10]
Phases Water liquid Primary phaseWater vapour Secondary phase
Turbulence K-ε Standard Enhanced wall treatmentCavitation Singhal 15 ppm air (Case 1), 1.5 ppm (Case 2)
et al. [11]
Pressure-Velocity coupling SIMPLE
Spatial discretization Momentum Second order upwindVapour First order upwindTurbulent Second order upwindkinetic energyTurbulent Second order upwinddissipationrate
Transient formulation First order implicit
Under relaxation factors Pressure 0.3Momentum 0.7Vapour 0.5Turbulent 0.8kinetic energyTurbulent 0.8dissipationrate
Residuals 10−3
Time step 0.125∘ crank rotation≡ 1.6 × 10⁻⁴s @130 rpm
Max Iteration per time step 35
UDFs Compressibility of water [9]Valve dynamics
Table 4: Inlet pressure boundary and initial conditions for both cases under investigation
Case Pressure: function of the mass flow rate Chamber initialization pressureInlet pressure [kPaG] [kPaG]
Case 1 and 2 0 - ∆P (see Figure 4) 0
CFD of PD pumps to investigate the non-condensable gas effect on cavitation | 327
Figure 3. User Defined Function to drive the valve motion, how it relates to the main CFD solver (Iannetti, Stickland, and Dempster 2015)
Figure 4. Inlet pipe pressure drop Vs mass flow characteristic. The points of the curve were simulated by means of a separated steady-state CFD analysis of the inlet pipe only.
0
10000
20000
30000
40000
50000
60000
70000
0 10 20 30 40
De
lta
P [
Pa
]
Mass flow rate [kg/s]
Inlet line
Initialization (t=0):
Chamber pressure = delivery pressure
Valve lift =0
Valve spring force = spring preload
t=t+Δt
Plunger position and mesh updating according to the reciprocating law
Fluid dynamics fields calculation via RANS solver
Calculating the valve pressure forces and
adding the spring forces
Integrating the valve dynamics equation,
calculating the new valve lift and velocity
Updating the valve mesh according to the new lift value, updating the
valve spring force according to the spring stiffness characteristic
Pumping cycle over?
Y End
N
Figure 3: User Defined Function to drive the valve motion, how itrelates to the main CFD solver (Iannetti, Stickland, and Dempster2015)
Figure 3. User Defined Function to drive the valve motion, how it relates to the main CFD solver (Iannetti, Stickland, and Dempster 2015)
Figure 4. Inlet pipe pressure drop Vs mass flow characteristic. The points of the curve were simulated by means of a separated steady-state CFD analysis of the inlet pipe only.
0
10000
20000
30000
40000
50000
60000
70000
0 10 20 30 40
De
lta
P [
Pa
]
Mass flow rate [kg/s]
Inlet line
Initialization (t=0):
Chamber pressure = delivery pressure
Valve lift =0
Valve spring force = spring preload
t=t+Δt
Plunger position and mesh updating according to the reciprocating law
Fluid dynamics fields calculation via RANS solver
Calculating the valve pressure forces and
adding the spring forces
Integrating the valve dynamics equation,
calculating the new valve lift and velocity
Updating the valve mesh according to the new lift value, updating the
valve spring force according to the spring stiffness characteristic
Pumping cycle over?
Y End
N
Figure 4: Inlet pipe pressure drop Vs mass flow characteristic. Thepoints of the curve were simulated by means of a separated steady-state CFD analysis of the inlet pipe only.
Figure 5. Pump chamber pressure history. A liquid poorer in air mass fraction is affected by a higher pressure drop.
0
0,05
0,1
0,15
0,2
0,25
0,3
-100000
-90000
-80000
-70000
-60000
-50000
-40000
-30000
-20000
-10000
0
0 50 100 150 200
plu
ng
er
dis
pla
cem
en
t [m
]
Pre
ssu
re [
Pa
]
Crank rotation [°]
15 ppm air1.5 ppm airCavitation pressure linePlunger displacement
Figure 5: Pump chamber pressure history. A liquid poorer in airmass fraction is affected by a higher pressure drop.
The initial and boundary conditions are summarized byTable 4.
An Intel Xeon CPUW3670 @3.2GHz CPU (6 cores) wasemployed for the simulations. Approximately 10 days wasthe calculation time needed for each case.
3 Numerical results and discussionFigure 5 shows the time history of the chamber static pres-sure throughout the inlet stroke for both cases of air massfractions of 15 and 1.5 ppm. The pressure monitor pointwas a static point close to the TDC plunger position. Thesimulations showed that the lower the air content, thecloser is the minimum chamber pressure to the cavitationpressure. Figure 5 also shows that in case of lower air con-tent, the pressure dropsmore quickly than in the first case,and this results in a low pressure regime that lasts longerand increases the generation of vapour as shown in Fig-ures 6 and 7.
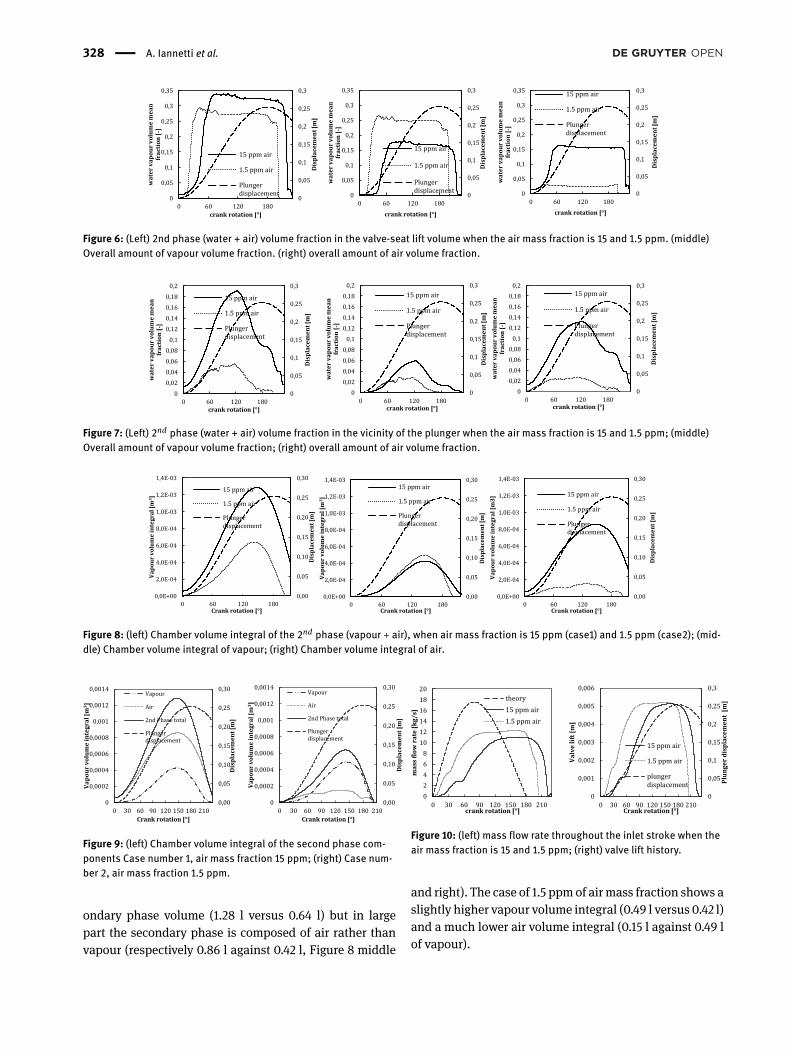
Figure 6 shows the situation in terms of secondaryphase (air + water vapour) volume fraction in the valve-seat volume throughout the inlet stroke. An important re-mark that has to be pointed out is how the secondaryphase volume fraction is actually divided in terms ofvapour and air. The left plot of Figure 6 shows the highersecondary phase fraction of the first case (solid line,15 ppmairmass fraction) but themiddle plot demonstratesthat the vapour generation was higher in case 2 (1.5 ppm)at ~25% versus ~16%. Therefore it can be said that case 1 isaffected by a higher air expansion rather than vapour gen-eration. Furthermore, while in the first case air and vapourfractionswere evenly ~16% for both, in the second case thedifference between vapour and air is significant (~25%ver-sus ~2.5% respectively).
Figure 7 shows the secondary phase volume fractionin the vicinity of the plunger top surface throughout theinlet stroke. The plunger region was more affected by alower vapour volume fraction than the valve region. Forinstance, considering case 1 (15 ppm), the maximum sec-ondary phase volume fraction was circa 32% (valve-seatgap volume, Figure 6 left); close to the plunger the amountwas 19% (Figure 7 left). Furthermore, near the plungerthe liquid richer of air showed an uneven subdivision ofair and vapour volume fraction, respectively 6% and 13%(solid line, Figure 7 middle and right). Case 2, on the otherhand, showed an even subdivision of circa 2.5% air andvapour.
The trends of Figures 6 and 7 are confirmed by the sec-ondary phase chamber volume integral, depicted in Fig-ures 8 and 9. When operating with a 15 ppm air mass frac-tion liquid, the pump shows twice the integral of the sec-
328 | A. Iannetti et al.
Figure 6. (Left) 2nd phase (water + air) volume fraction in the valve-seat lift volume when the air
mass fraction is 15 and 1.5 ppm. (middle) Overall amount of vapour volume fraction. (right) overall amount of air volume fraction.
0
0,05
0,1
0,15
0,2
0,25
0,3
0
0,05
0,1
0,15
0,2
0,25
0,3
0,35
0 60 120 180
Dis
pla
cem
en
t [m
]
wa
ter
va
po
ur
vo
lum
e m
ea
n
fra
ctio
n [
-]
crank rotation [°]
15 ppm air
1.5 ppm air
Plungerdisplacement 0
0,05
0,1
0,15
0,2
0,25
0,3
0
0,05
0,1
0,15
0,2
0,25
0,3
0,35
0 60 120 180
Dis
pla
cem
en
t [m
]
wa
ter
va
po
ur
vo
lum
e m
ea
n
fra
ctio
n [
-]
crank rotation [°]
15 ppm air
1.5 ppm air
Plungerdisplacement 0
0,05
0,1
0,15
0,2
0,25
0,3
0
0,05
0,1
0,15
0,2
0,25
0,3
0,35
0 60 120 180
Dis
pla
cem
en
t [m
]
wa
ter
va
po
ur
vo
lum
e m
ea
n
fra
ctio
n [
-]
crank rotation [°]
15 ppm air
1.5 ppm air
Plungerdisplacement
Figure 6: (Left) 2nd phase (water + air) volume fraction in the valve-seat lift volume when the air mass fraction is 15 and 1.5 ppm. (middle)Overall amount of vapour volume fraction. (right) overall amount of air volume fraction.
Figure 7. (Left) 2nd phase (water + air) volume fraction in the vicinity of the plunger when the air
mass fraction is 15 and 1.5 ppm. (middle) Overall amount of vapour volume fraction. (right) overall amount of air volume fraction.
Figure 8. (left) Chamber volume integral of the 2nd phase (vapour + air), when air mass fraction is 15 ppm (case1) and 1.5 ppm (case2). (middle) Chamber volume integral of vapour. (right) Chamber
volume integral of air.
0
0,05
0,1
0,15
0,2
0,25
0,3
0
0,02
0,04
0,06
0,08
0,1
0,12
0,14
0,16
0,18
0,2
0 60 120 180
Dis
pla
cem
en
t [m
]
wa
ter
va
po
ur
vo
lum
e m
ea
n
fra
ctio
n [
-]
crank rotation [°]
15 ppm air
1.5 ppm air
Plungerdisplacement
0
0,05
0,1
0,15
0,2
0,25
0,3
0
0,02
0,04
0,06
0,08
0,1
0,12
0,14
0,16
0,18
0,2
0 60 120 180
Dis
pla
cem
en
t [m
]
wa
ter
va
po
ur
vo
lum
e m
ea
n
fra
ctio
n [
-]
crank rotation [°]
15 ppm air
1.5 ppm air
Plungerdisplacement
0
0,05
0,1
0,15
0,2
0,25
0,3
0
0,02
0,04
0,06
0,08
0,1
0,12
0,14
0,16
0,18
0,2
0 60 120 180
Dis
pla
cem
en
t [m
]
wa
ter
va
po
ur
vo
lum
e m
ea
n
fra
ctio
n [
-]
crank rotation [°]
15 ppm air
1.5 ppm air
Plungerdisplacement
0,00
0,05
0,10
0,15
0,20
0,25
0,30
0,0E+00
2,0E-04
4,0E-04
6,0E-04
8,0E-04
1,0E-03
1,2E-03
1,4E-03
0 60 120 180
Dis
pla
cem
en
t [m
]
Va
po
ur
vo
lum
e i
nte
gra
l [m
3]
Crank rotation [°]
15 ppm air
1.5 ppm air
Plungerdisplacement
0,00
0,05
0,10
0,15
0,20
0,25
0,30
0,0E+00
2,0E-04
4,0E-04
6,0E-04
8,0E-04
1,0E-03
1,2E-03
1,4E-03
0 60 120 180
Dis
pla
cem
en
t [m
]
Va
po
ur
vo
lum
e i
nte
gra
l [m
3]
Crank rotation [°]
15 ppm air
1.5 ppm air
Plungerdisplacement
0,00
0,05
0,10
0,15
0,20
0,25
0,30
0,0E+00
2,0E-04
4,0E-04
6,0E-04
8,0E-04
1,0E-03
1,2E-03
1,4E-03
0 60 120 180
Dis
pla
cem
en
t [m
]
Va
po
ur
vo
lum
e i
nte
gra
l [m
3]
Crank rotation [°]
15 ppm air
1.5 ppm air
Plungerdisplacement
Figure 7: (Left) 2nd phase (water + air) volume fraction in the vicinity of the plunger when the air mass fraction is 15 and 1.5 ppm; (middle)Overall amount of vapour volume fraction; (right) overall amount of air volume fraction.
Figure 7. (Left) 2nd phase (water + air) volume fraction in the vicinity of the plunger when the air
mass fraction is 15 and 1.5 ppm. (middle) Overall amount of vapour volume fraction. (right) overall amount of air volume fraction.
Figure 8. (left) Chamber volume integral of the 2nd phase (vapour + air), when air mass fraction is 15 ppm (case1) and 1.5 ppm (case2). (middle) Chamber volume integral of vapour. (right) Chamber
volume integral of air.
0
0,05
0,1
0,15
0,2
0,25
0,3
0
0,02
0,04
0,06
0,08
0,1
0,12
0,14
0,16
0,18
0,2
0 60 120 180
Dis
pla
cem
en
t [m
]
wa
ter
va
po
ur
vo
lum
e m
ea
n
fra
ctio
n [
-]
crank rotation [°]
15 ppm air
1.5 ppm air
Plungerdisplacement
0
0,05
0,1
0,15
0,2
0,25
0,3
0
0,02
0,04
0,06
0,08
0,1
0,12
0,14
0,16
0,18
0,2
0 60 120 180
Dis
pla
cem
en
t [m
]
wa
ter
va
po
ur
vo
lum
e m
ea
n
fra
ctio
n [
-]
crank rotation [°]
15 ppm air
1.5 ppm air
Plungerdisplacement
0
0,05
0,1
0,15
0,2
0,25
0,3
0
0,02
0,04
0,06
0,08
0,1
0,12
0,14
0,16
0,18
0,2
0 60 120 180
Dis
pla
cem
en
t [m
]
wa
ter
va
po
ur
vo
lum
e m
ea
n
fra
ctio
n [
-]
crank rotation [°]
15 ppm air
1.5 ppm air
Plungerdisplacement
0,00
0,05
0,10
0,15
0,20
0,25
0,30
0,0E+00
2,0E-04
4,0E-04
6,0E-04
8,0E-04
1,0E-03
1,2E-03
1,4E-03
0 60 120 180
Dis
pla
cem
en
t [m
]
Va
po
ur
vo
lum
e i
nte
gra
l [m
3]
Crank rotation [°]
15 ppm air
1.5 ppm air
Plungerdisplacement
0,00
0,05
0,10
0,15
0,20
0,25
0,30
0,0E+00
2,0E-04
4,0E-04
6,0E-04
8,0E-04
1,0E-03
1,2E-03
1,4E-03
0 60 120 180
Dis
pla
cem
en
t [m
]
Va
po
ur
vo
lum
e i
nte
gra
l [m
3]
Crank rotation [°]
15 ppm air
1.5 ppm air
Plungerdisplacement
0,00
0,05
0,10
0,15
0,20
0,25
0,30
0,0E+00
2,0E-04
4,0E-04
6,0E-04
8,0E-04
1,0E-03
1,2E-03
1,4E-03
0 60 120 180
Dis
pla
cem
en
t [m
]
Va
po
ur
vo
lum
e i
nte
gra
l [m
3]
Crank rotation [°]
15 ppm air
1.5 ppm air
Plungerdisplacement
Figure 8: (left) Chamber volume integral of the 2nd phase (vapour + air), when air mass fraction is 15 ppm (case1) and 1.5 ppm (case2); (mid-dle) Chamber volume integral of vapour; (right) Chamber volume integral of air.
Figure 9. (left) Chamber volume integral of the second phase components Case number 1, air mass fraction 15 ppm. (right) Case number 2, air mass fraction 1.5 ppm.
Figure 10. (left) mass flow rate throughout the inlet stroke when the air mass fraction is 15 and 1.5 ppm. (right) valve lift history.
Figure 11. Case 1 (15 ppm air mass fraction) at 120° of crank rotation . (left) total second phase volume fraction. (middle) air volume fraction. (right) vapour volume fraction.
0,00
0,05
0,10
0,15
0,20
0,25
0,30
0
0,0002
0,0004
0,0006
0,0008
0,001
0,0012
0,0014
0 30 60 90 120 150 180 210
Dis
pla
cem
en
t [m
]
Va
po
ur
vo
lum
e i
nte
gra
l [m
3]
Crank rotation [°]
Vapour
Air
2nd Phase total
Plungerdisplacement
0,00
0,05
0,10
0,15
0,20
0,25
0,30
0
0,0002
0,0004
0,0006
0,0008
0,001
0,0012
0,0014
0 30 60 90 120 150 180 210
Dis
pla
cem
en
t [m
]
Va
po
ur
vo
lum
e i
nte
gra
l [m
3]
Crank rotation [°]
Vapour
Air
2nd Phase total
Plungerdisplacement
0
0,05
0,1
0,15
0,2
0,25
0,3
0
0,001
0,002
0,003
0,004
0,005
0,006
0 30 60 90 120 150 180 210
Plu
ng
er
dis
pla
cem
en
t [
m]
Va
lve
lif
t [m
]
Crank rotation [°]
15 ppm air
1.5 ppm air
plungerdisplacement
0
2
4
6
8
10
12
14
16
18
20
0 30 60 90 120 150 180 210
ma
ss f
low
ra
te [
kg
/s]
crank rotation [°]
theory
15 ppm air
1.5 ppm air
Figure 9: (left) Chamber volume integral of the second phase com-ponents Case number 1, air mass fraction 15 ppm; (right) Case num-ber 2, air mass fraction 1.5 ppm.
ondary phase volume (1.28 l versus 0.64 l) but in largepart the secondary phase is composed of air rather thanvapour (respectively 0.86 l against 0.42 l, Figure 8 middle
Figure 9. (left) Chamber volume integral of the second phase components Case number 1, air mass fraction 15 ppm. (right) Case number 2, air mass fraction 1.5 ppm.
Figure 10. (left) mass flow rate throughout the inlet stroke when the air mass fraction is 15 and 1.5 ppm. (right) valve lift history.
Figure 11. Case 1 (15 ppm air mass fraction) at 120° of crank rotation . (left) total second phase volume fraction. (middle) air volume fraction. (right) vapour volume fraction.
0,00
0,05
0,10
0,15
0,20
0,25
0,30
0
0,0002
0,0004
0,0006
0,0008
0,001
0,0012
0,0014
0 30 60 90 120 150 180 210
Dis
pla
cem
en
t [m
]
Va
po
ur
vo
lum
e i
nte
gra
l [m
3]
Crank rotation [°]
Vapour
Air
2nd Phase total
Plungerdisplacement
0,00
0,05
0,10
0,15
0,20
0,25
0,30
0
0,0002
0,0004
0,0006
0,0008
0,001
0,0012
0,0014
0 30 60 90 120 150 180 210
Dis
pla
cem
en
t [m
]
Va
po
ur
vo
lum
e i
nte
gra
l [m
3]
Crank rotation [°]
Vapour
Air
2nd Phase total
Plungerdisplacement
0
0,05
0,1
0,15
0,2
0,25
0,3
0
0,001
0,002
0,003
0,004
0,005
0,006
0 30 60 90 120 150 180 210
Plu
ng
er
dis
pla
cem
en
t [
m]
Va
lve
lif
t [m
]
Crank rotation [°]
15 ppm air
1.5 ppm air
plungerdisplacement
0
2
4
6
8
10
12
14
16
18
20
0 30 60 90 120 150 180 210
ma
ss f
low
ra
te [
kg
/s]
crank rotation [°]
theory
15 ppm air
1.5 ppm air
Figure 10: (left) mass flow rate throughout the inlet stroke when theair mass fraction is 15 and 1.5 ppm; (right) valve lift history.
and right). The case of 1.5 ppmof air mass fraction shows aslightly higher vapour volume integral (0.49 l versus 0.42 l)and a much lower air volume integral (0.15 l against 0.49 lof vapour).
CFD of PD pumps to investigate the non-condensable gas effect on cavitation | 329
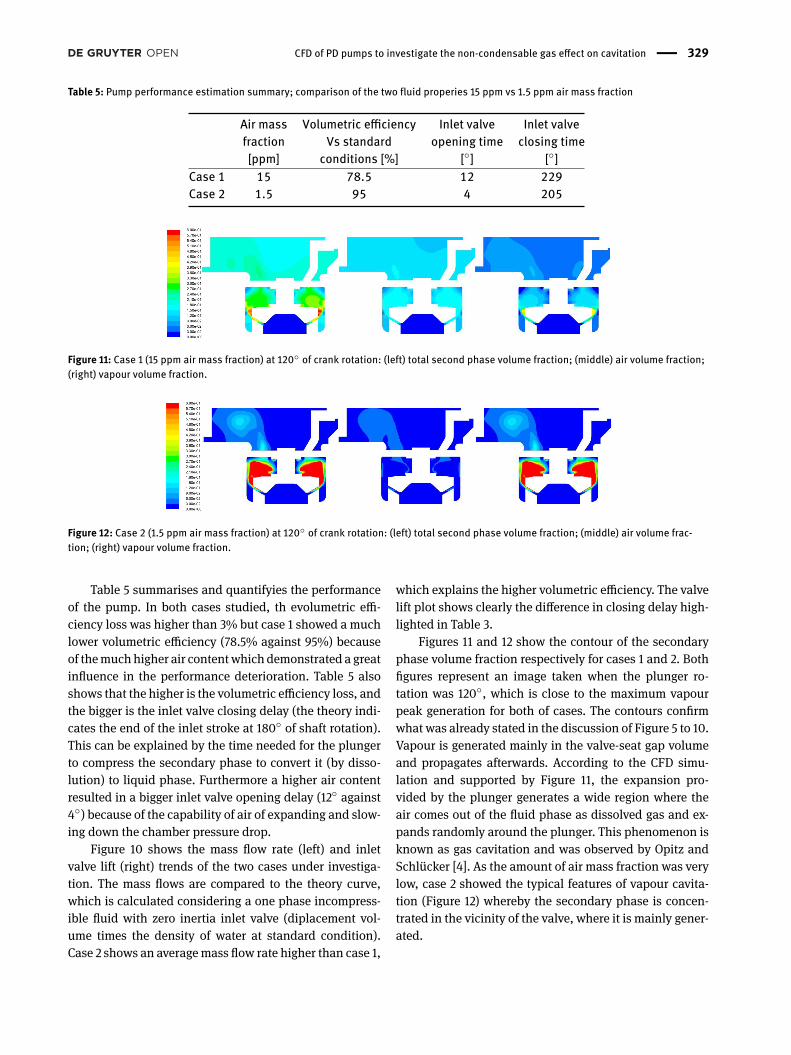
Table 5: Pump performance estimation summary; comparison of the two fluid properies 15 ppm vs 1.5 ppm air mass fraction
Air mass Volumetric eflciency Inlet valve Inlet valvefraction Vs standard opening time closing time[ppm] conditions [%] [∘] [∘]
Case 1 15 78.5 12 229Case 2 1.5 95 4 205
Figure 9. (left) Chamber volume integral of the second phase components Case number 1, air mass fraction 15 ppm. (right) Case number 2, air mass fraction 1.5 ppm.
Figure 10. (left) mass flow rate throughout the inlet stroke when the air mass fraction is 15 and 1.5 ppm. (right) valve lift history.
Figure 11. Case 1 (15 ppm air mass fraction) at 120° of crank rotation . (left) total second phase volume fraction. (middle) air volume fraction. (right) vapour volume fraction.
0,00
0,05
0,10
0,15
0,20
0,25
0,30
0
0,0002
0,0004
0,0006
0,0008
0,001
0,0012
0,0014
0 30 60 90 120 150 180 210
Dis
pla
cem
en
t [m
]
Va
po
ur
vo
lum
e i
nte
gra
l [m
3]
Crank rotation [°]
Vapour
Air
2nd Phase total
Plungerdisplacement
0,00
0,05
0,10
0,15
0,20
0,25
0,30
0
0,0002
0,0004
0,0006
0,0008
0,001
0,0012
0,0014
0 30 60 90 120 150 180 210
Dis
pla
cem
en
t [m
]
Va
po
ur
vo
lum
e i
nte
gra
l [m
3]
Crank rotation [°]
Vapour
Air
2nd Phase total
Plungerdisplacement
0
0,05
0,1
0,15
0,2
0,25
0,3
0
0,001
0,002
0,003
0,004
0,005
0,006
0 30 60 90 120 150 180 210
Plu
ng
er
dis
pla
cem
en
t [
m]
Va
lve
lif
t [m
]
Crank rotation [°]
15 ppm air
1.5 ppm air
plungerdisplacement
0
2
4
6
8
10
12
14
16
18
20
0 30 60 90 120 150 180 210
ma
ss f
low
ra
te [
kg
/s]
crank rotation [°]
theory
15 ppm air
1.5 ppm air
Figure 11: Case 1 (15 ppm air mass fraction) at 120∘ of crank rotation: (left) total second phase volume fraction; (middle) air volume fraction;(right) vapour volume fraction.
Figure 12. Case 2 (1.5 ppm air mass fraction) at 120° of crank rotation . (left) total second phase volume fraction. (middle) air volume fraction. (right) vapour volume fraction. Figure 12: Case 2 (1.5 ppm air mass fraction) at 120∘ of crank rotation: (left) total second phase volume fraction; (middle) air volume frac-
tion; (right) vapour volume fraction.
Table 5 summarises and quantifyies the performanceof the pump. In both cases studied, th evolumetric effi-ciency loss was higher than 3% but case 1 showed a muchlower volumetric efficiency (78.5% against 95%) becauseof themuchhigher air contentwhich demonstrated a greatinfluence in the performance deterioration. Table 5 alsoshows that the higher is the volumetric efficiency loss, andthe bigger is the inlet valve closing delay (the theory indi-cates the end of the inlet stroke at 180∘ of shaft rotation).This can be explained by the time needed for the plungerto compress the secondary phase to convert it (by disso-lution) to liquid phase. Furthermore a higher air contentresulted in a bigger inlet valve opening delay (12∘ against4∘) because of the capability of air of expanding and slow-ing down the chamber pressure drop.
Figure 10 shows the mass flow rate (left) and inletvalve lift (right) trends of the two cases under investiga-tion. The mass flows are compared to the theory curve,which is calculated considering a one phase incompress-ible fluid with zero inertia inlet valve (diplacement vol-ume times the density of water at standard condition).Case 2 shows an averagemass flow rate higher than case 1,
which explains the higher volumetric efficiency. The valvelift plot shows clearly the difference in closing delay high-lighted in Table 3.
Figures 11 and 12 show the contour of the secondaryphase volume fraction respectively for cases 1 and 2. Bothfigures represent an image taken when the plunger ro-tation was 120∘, which is close to the maximum vapourpeak generation for both of cases. The contours confirmwhat was already stated in the discussion of Figure 5 to 10.Vapour is generated mainly in the valve-seat gap volumeand propagates afterwards. According to the CFD simu-lation and supported by Figure 11, the expansion pro-vided by the plunger generates a wide region where theair comes out of the fluid phase as dissolved gas and ex-pands randomly around the plunger. This phenomenon isknown as gas cavitation and was observed by Opitz andSchlücker [4]. As the amount of air mass fraction was verylow, case 2 showed the typical features of vapour cavita-tion (Figure 12) whereby the secondary phase is concen-trated in the vicinity of the valve, where it is mainly gener-ated.
330 | A. Iannetti et al.
4 ConclusionA transient and comprehensive CFD model of a one-chamber PD pump was created to estimate the perfor-mance of the device under different working fluid prop-erties. Two cases were investigated; in case 1 water with15 ppm of air mass fraction content was considered, whilecase 2 dealt with a 1.5 ppm air mass fraction dissolved.The operating conditions (i.e. shaft angular speed and in-let pressure) were designed to achieve the full cavitatingconditions so that the effect of the non-condensable gasmass fraction content on cavitation could be investigated.The CFD model made use of the Singhal et al. cavitationmodel [11], the multiphase mixture model [10, 12] and twoUDFs modelled the compressibility of the fluid and thetwo-way coupling between the valve lift and the pressurefield. The valve spring effect and the valve inertiawere alsotaken into account. A complete inlet strokewas simulated,from the initialization point (plunger located at the TDC)untill the end of the valve lift history. The two cases, in factdemonstrated a different dynamics and in case 2 the valveended the lift sooner than case 1.
General remarks on cavitation
According to the CFD model and under the investigatedoperating conditions, the plunger expansion created thepressure drop needed for the vapour cavitation to ap-pear but the air expansion (gas cavitation) prevented thevapour formation in the vicinity of the plunger which wasaffected by the vapour previously generated by the valverather than that generated by the plunger itself. Once theaverage static pressure in the chamber ranged around thevapour pressure, and the flowing velocity in the valve-seatgap volume exceeded a certain treshold, vapour cavitationappeared and affected primarily the lift volume; it moveddownstream towards the plunger afterwards. The trigger-ing cause of cavitation was the high flow velocity (flow in-duced cavitation [4]) rather than the expansion cavitationwhich appeared to be just a prerequisite.
Influence of the non-condensable massfraction on cavitation
Non-condensable gas mass fraction influences the cham-ber pressure history (Figure 5), the dissolved air slowsdown the pressure drop while it comes out of the liquidand expands. Air expansion tends to fill the void left by the
plunger at the beginning of the inlet stroke when the valveis closed and delays vapour cavitation appearance. Case 1,which deals with a higher gas content fluid, shows a lowervapour volume integral than case 2, which deals with alower air content (Figures 8 and 9). On the other hand theair content is itself a source of volumetric efficiency loss asshown by Table 3. Figure 9 demonstrates that the overallsecondary phase content (vapour and air) defines the vol-umetric efficiency rather than the vapour content itself; infact, case 1, which shows the highest secondary phase vol-ume integral, also shows the lowest veolumetric efficiency.Figure 5 demonstrate also that the higher the air content,the higher the minimum pressure (absolute value), thisprovides a further safety factor on cavitation and increasesthe NPSH of the pump.
The analisys demonstrated the importance of theworking liquid properties for an accurate estimation of theperformance of the pump as well as the prediction of thecavitationdamage.Although theoverall content of air (dis-solved air plus the nuclei content) is not harmful for thepump, taking into account the non-condensable air massfraction in cavitation results in a better estimation of thevapour volume fraction prediction. Despite air cavitation,vapour bubbles can harm the pump significantly. An ac-curate prediction of the amount and the location may re-sult in a better understanding of the design and operatingparameters affecting cavitation and this implies a reliablesupport for pump designers and manufacturers.
Future improvement of the analysis presented in thispaper is planned, the authors are currently working on atest rig to valdidate the CFD data herein presented.
References[1] H. Ding, F. C. Visser, and Y. Jiang, A practical approach to speed
up NPSHR prediction of centrifugal pumps using CFD cavita-tionmodel, in Proceedings of the ASME 2012 Fluids EngineeringSummer Meeting., 2012, p. Paper No. FEDSM2012–72282.
[2] A. R. Budris and P. A. Mayleben, Effects of entrained air, NPSHmargin, and suction piping on cavitation in centrifugal pumps,in Proceeding of the 15th international pump users symposium,1998, pp. 99–108.
[3] J. E. Miller, The reciprocating pump, theory design and use, Sec-ond Edi. Krieger publishing company, 1995.
[4] K. Opitz and E. Schlücker, Detection of Cavitation Phenomena inReciprocating Pumps using a High-Speed Camera, Chem. Eng.Technol., vol. 33, no. 10, pp. 1610–1614, Jul. 2010.
[5] K. Opitz, E. Schlücker, and O. Schade, Cavitation in reciprocat-ing positive displacement pumps, in Twenty-seventh interna-tional pump users symposium, 2011, pp. 27–33.
[6] A. Iannetti, M. T. Stickland, and W. M. Dempster, A CFD studyon themechanismswhich cause cavitation in positive displace-
CFD of PD pumps to investigate the non-condensable gas effect on cavitation | 331
ment reciprocating pumps, J. Hydraul. Eng., vol. 1, no. 1, pp. 47–59, 2015.
[7] G. Kuiper, Cavitation in ship propulsion, Delft: Delft Universityof Technology, 2010.
[8] P. Eisenberg, Cavitation Damage, Oflce of Naval Research,1963.
[9] A. Iannetti, M. T. Stickland, and W. M. Dempster, A computa-tional fluid dynamics model to evaluate the inlet stroke perfor-mance of a positive displacement reciprocating plunger pump,Proc. Inst. Mech. Eng. Part A J. Power Energy, vol. 228, no. 5, pp.574–584, Apr. 2014.
[10] ANSYS, ANSYS Fluent Theory Guide, vol. 15317, no. November,ANSYS Fluent, 2011.
[11] A. Singhal and M. Athavale, Mathematical basis and validationof the full cavitation model, J. Fluids Eng., vol. 124, no. 3, p. 617,2002.
[12] ANSYS, ANSYS FLUENT User’s Guide, vol. 15317, no. November.ANSYS Inc., 2011.