Amorphization kinetics under swift heavy ion irradiation: A cumulative overlapping-track approach
6
Amorphization kinetics under swift heavy ion irradiation: A cumulative overlapping-track approach G. Garcia a '*, A. Rivera b , M.L. Crespillo c , N. Gordillo cl , J. Olivares c ' d , F. Agulló-López c 'ALBA Synchrotron Light Source (CELLS-ALBA), 08290, Cerdanyola del Valles, Barcelona, Spain b Instituto de Fusión Nuclear (UPM), José Gutiérrez Abascal 2, E-28006 Madrid, Spain c Centro de Micmanalisis de Materiales (CMAM), Universidad Autónoma de Madrid (UAM), Cantoblanco, E-28049 Madrid, Spain d Instituto de Óptica, Consejo Superior de Investigaciones Científicas (CSIC), C/Serrano 121, E-28006 Madrid, Spain ABSTRACT Keywords: Irradiation Damage Dynamics Swift ion A simple illustrative physical model is presented to describe the kinetics of damage and amorphization by swift heavy ions (SHI) in LiNb0 3 . The model considers that every ion impact generates initially a defective region (halo) and a full amorphous core whose relative size depends on the electronic stopping power. Below a given stopping power threshold only a halo is generated. For increasing fluences the amorphized area grows monotonically via overlapping of a fixed number N of halos. In spite of its simplicity the model, which provides analytical solutions, describes many relevant features of the kinetic behaviour. In particular, it predicts approximate Avrami curves with parameters depending on stopping power in qualitative accordance with experiment that turn into Poisson laws well above the threshold value. 1. Introduction Increasing attention is being paid to the structural damage in- duced in dielectric materials by swift ions in which the electronic stopping power is dominant. Recent experiments on many dielec- tric and semiconductor crystals have conclusively shown that the damage has some peculiar features such as thresholding [1-4] and cumulative [3-7] character. The existence of a stopping power threshold to cause lattice amorphization has been satisfactorily explained by the thermal spike model [1,2,8-10] as a melting- resolidification process around the ion trajectory (latent track for- mation). On the other hand, the cumulative (additive) damage behaviour under successive irradiation is not consistent with such a model. In other words, below threshold no amorphization should be induced, while above the threshold the model predicts Poisson- like amorphization kinetics as a result of track overlapping. Exper- imental results[ll-14] on LiNb0 3 show clear evidence of the cumulative behaviour through the observation of an Avrami-like (sigmoidal) kinetics, S = 1 - exp{-(^/^) 0 ) n }, for the growth of the normalized disordered area S as a function of fluence, for irradia- tion conditions below as well as above threshold. For irradiations well above threshold the measured Avrami curves correspond to the Poisson limit (n = 1), whereas for conditions below threshold, the Avrami curves present parameters n and <j> 0 , that steadily in- crease on decreasing electronic stopping power. The experimental data as collected in a recent paper [13] are shown in Fig. 1. Cumulative microscopic models for defect creation have been recently proposed [14-16] that reasonably account for the Avrami amorphization regimes. In particular, a non-radiative exciton- decay model has been recently developed [15,16], that describes amorphization as a defect-driven transition from a crystalline to an amorphous phase when the local radiation-induced defect concentration reaches a critical value. Within those cumulative models every ion impact is expected to produce an inner amor- phous core surrounded by a defective halo [17-19] when the electronic stopping power overcomes a certain threshold that gen- erates such critical defect concentration. Below threshold only a halo (defective region) should be produced without causing amor- phization. Unequivocal experimental proof for the existence of the defective halo is difficult, although abundant evidence has been gathered for diverse materials [20-22]. Anyhow, new evidence for the complex structure of the track is being gathered [23-24] and is expected to play a key role in determining the kinetics of amorphiza- tion through track overlapping. Therefore, a suitable cumulative model would offer a useful proof for the track structure and a relevant test for the theoretical modelling of the damage process. The purpose of this paper is to explore in detail the cumulative effects derived from the dual core-halo structure of the tracks and clarify the physical reasons behind the empirical Avrami kinetic behaviour. To that end we have developed a simple damage model
Transcript of Amorphization kinetics under swift heavy ion irradiation: A cumulative overlapping-track approach
Amorphization kinetics under swift heavy ion irradiation: A cumulative overlapping-track approach
G. Garciaa'*, A. Riverab, M.L. Crespilloc, N. Gordillocl, J. Olivaresc'd, F. Agulló-Lópezc
'ALBA Synchrotron Light Source (CELLS-ALBA), 08290, Cerdanyola del Valles, Barcelona, Spain b Instituto de Fusión Nuclear (UPM), José Gutiérrez Abascal 2, E-28006 Madrid, Spain c Centro de Micmanalisis de Materiales (CMAM), Universidad Autónoma de Madrid (UAM), Cantoblanco, E-28049 Madrid, Spain d Instituto de Óptica, Consejo Superior de Investigaciones Científicas (CSIC), C/Serrano 121, E-28006 Madrid, Spain
A B S T R A C T
Keywords: Irradiation Damage Dynamics Swift ion
A simple illustrative physical model is presented to describe the kinetics of damage and amorphization by swift heavy ions (SHI) in LiNb03. The model considers that every ion impact generates initially a defective region (halo) and a full amorphous core whose relative size depends on the electronic stopping power. Below a given stopping power threshold only a halo is generated. For increasing fluences the amorphized area grows monotonically via overlapping of a fixed number N of halos. In spite of its simplicity the model, which provides analytical solutions, describes many relevant features of the kinetic behaviour. In particular, it predicts approximate Avrami curves with parameters depending on stopping power in qualitative accordance with experiment that turn into Poisson laws well above the threshold value.
1. Introduction
Increasing attention is being paid to the structural damage induced in dielectric materials by swift ions in which the electronic stopping power is dominant. Recent experiments on many dielectric and semiconductor crystals have conclusively shown that the damage has some peculiar features such as thresholding [1-4] and cumulative [3-7] character. The existence of a stopping power threshold to cause lattice amorphization has been satisfactorily explained by the thermal spike model [1,2,8-10] as a melting-resolidification process around the ion trajectory (latent track formation). On the other hand, the cumulative (additive) damage behaviour under successive irradiation is not consistent with such a model. In other words, below threshold no amorphization should be induced, while above the threshold the model predicts Poisson-like amorphization kinetics as a result of track overlapping. Experimental results[ll-14] on LiNb03 show clear evidence of the cumulative behaviour through the observation of an Avrami-like (sigmoidal) kinetics, S = 1 - exp{-(^/^)0)n}, for the growth of the normalized disordered area S as a function of fluence, for irradiation conditions below as well as above threshold. For irradiations well above threshold the measured Avrami curves correspond to
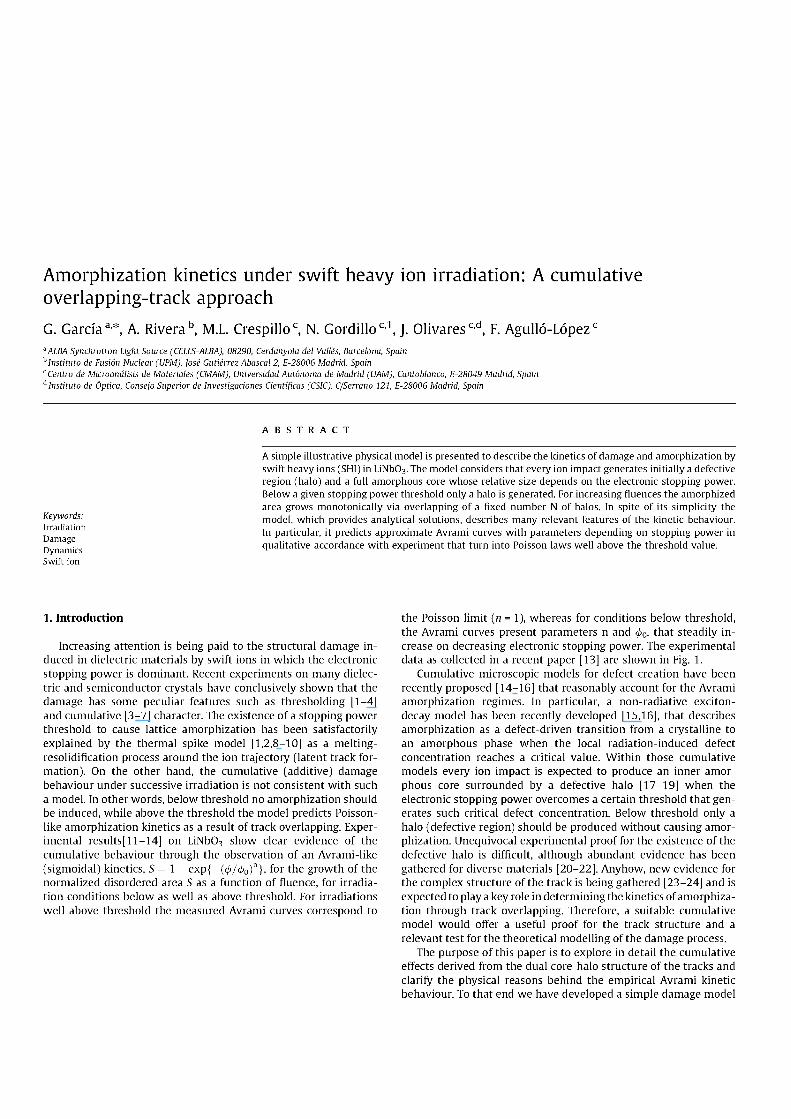
the Poisson limit (n = 1), whereas for conditions below threshold, the Avrami curves present parameters n and <j>0, that steadily increase on decreasing electronic stopping power. The experimental data as collected in a recent paper [13] are shown in Fig. 1.
Cumulative microscopic models for defect creation have been recently proposed [14-16] that reasonably account for the Avrami amorphization regimes. In particular, a non-radiative exciton-decay model has been recently developed [15,16], that describes amorphization as a defect-driven transition from a crystalline to an amorphous phase when the local radiation-induced defect concentration reaches a critical value. Within those cumulative models every ion impact is expected to produce an inner amorphous core surrounded by a defective halo [17-19] when the electronic stopping power overcomes a certain threshold that generates such critical defect concentration. Below threshold only a halo (defective region) should be produced without causing amorphization. Unequivocal experimental proof for the existence of the defective halo is difficult, although abundant evidence has been gathered for diverse materials [20-22]. Anyhow, new evidence for the complex structure of the track is being gathered [23-24] and is expected to play a key role in determining the kinetics of amorphization through track overlapping. Therefore, a suitable cumulative model would offer a useful proof for the track structure and a relevant test for the theoretical modelling of the damage process.
The purpose of this paper is to explore in detail the cumulative effects derived from the dual core-halo structure of the tracks and clarify the physical reasons behind the empirical Avrami kinetic behaviour. To that end we have developed a simple damage model
6 8 10
Se (keV/nm)
Fig. 1. Avrami parameters <j>0 and n, as determined from a fit to experimental data, shown as a function of the stopping power Se of the incident ion (extracted from Ref. [13]).
offering analytical solutions wherein every ion impact generates a uniform amorphous core together with an also uniform preamor-phous halo. For simplicity it is assumed that a fixed number N of tracks is required to induce amorphization through the superposition of N overlapping halos. The analysis of the model would provide a definite physical meaning to the parameters of the Avrami kinetics. Other overlapping approaches along similar lines have been reported in the literature in connection with elastic nuclear collisions [25-27]. However, as far as we know, it is the first time that this impact-overlapping strategy is applied to electronic excitation damage. In fact, the structure of this damage is simpler than that of nuclear mechanisms and so offers a more fruitful scenario for detailed kinetics studies.
Moreover, this general and very simple scheme can accommodate a variety of underlying physics scenarios, provided that the following basic hypotheses are fulfilled:
• The defect production cross-section depends on the electronic stopping power in a strongly superlinear way.
• The defect concentration induced by the electronic stopping power accumulates linearly as a function of the fluence.
• When the defect concentration reaches locally a well defined threshold, the material shows macroscopic damage (amorphization).
A specific MonteCarlo approach accounting for this behaviour and, therefore, providing physical support to the impact-overlapping dynamics described in this paper, has been presented in Ref. [19].
2. Brief summary of Avrami kinetics
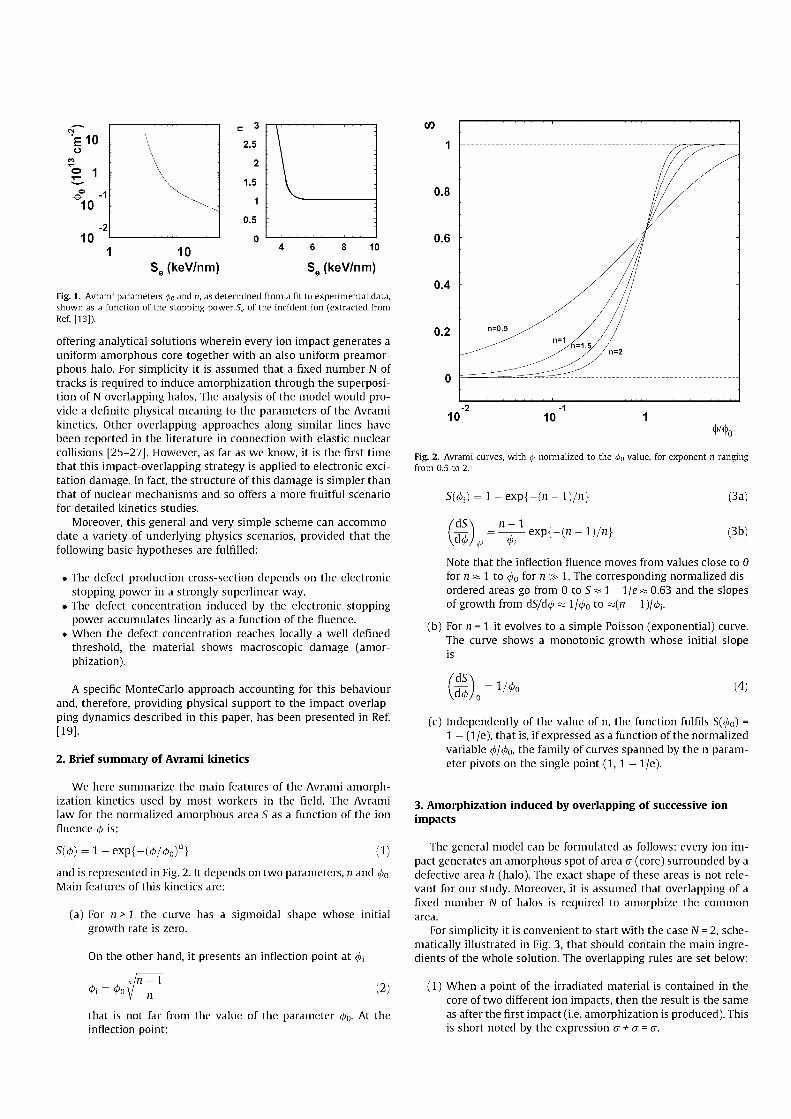
We here summarize the main features of the Avrami amorphization kinetics used by most workers in the field. The Avrami law for the normalized amorphous area S as a function of the ion fluence <j> is:
S(</>) = 1 - exp{-«>/</>0)n} (1)
and is represented in Fig. 2. It depends on two parameters, n and 4>o. Main features of this kinetics are:
(a) For n > J the curve has a sigmoidal shape whose initial growth rate is zero.
On the other hand, it presents an inflection point at <pi
J n - 1 (2)
that is not far from the value of the parameter <j>0. At the inflection point:
Fig. 2. Avrami curves, with cf> normalized to the 4>o value, for exponent n ranging from 0.5 to 2.
S(^) = l - e x p { - ( n - l ) / n }
Hf)„ = 5 i l e x p { - ( n - 1 ) / n >
(3a)
(3b)
Note that the inflection fluence moves from values close to 0 for n ss 1 to 4>o for n » 1. The corresponding normalized disordered areas go from 0 to Sss 1 - 1/e ss 0.63 and the slopes of growth from dS/d</) ss l /$ 0 to ss(n - 1 )/<ft.
(b) For n = 1 it evolves to a simple Poisson (exponential) curve. The curve shows a monotonic growth whose initial slope is
= V*o (4)
(c) Independently of the value of n, the function fulfils S(<fo) = 1 - (1/e), that is, if expressed as a function of the normalized variable <̂ /<̂ 0, the family of curves spanned by the n parameter pivots on the single point ( 1 , 1 - 1/e).
3. Amorphization induced by overlapping of successive ion impacts
The general model can be formulated as follows: every ion impact generates an amorphous spot of area a (core) surrounded by a defective area h (halo). The exact shape of these areas is not relevant for our study. Moreover, it is assumed that overlapping of a fixed number JV of halos is required to amorphize the common area.
For simplicity it is convenient to start with the case JV = 2, schematically illustrated in Fig. 3, that should contain the main ingredients of the whole solution. The overlapping rules are set below:
(1) When a point of the irradiated material is contained in the core of two different ion impacts, then the result is the same as after the first impact (i.e. amorphization is produced). This is short noted by the expression a + a = a.
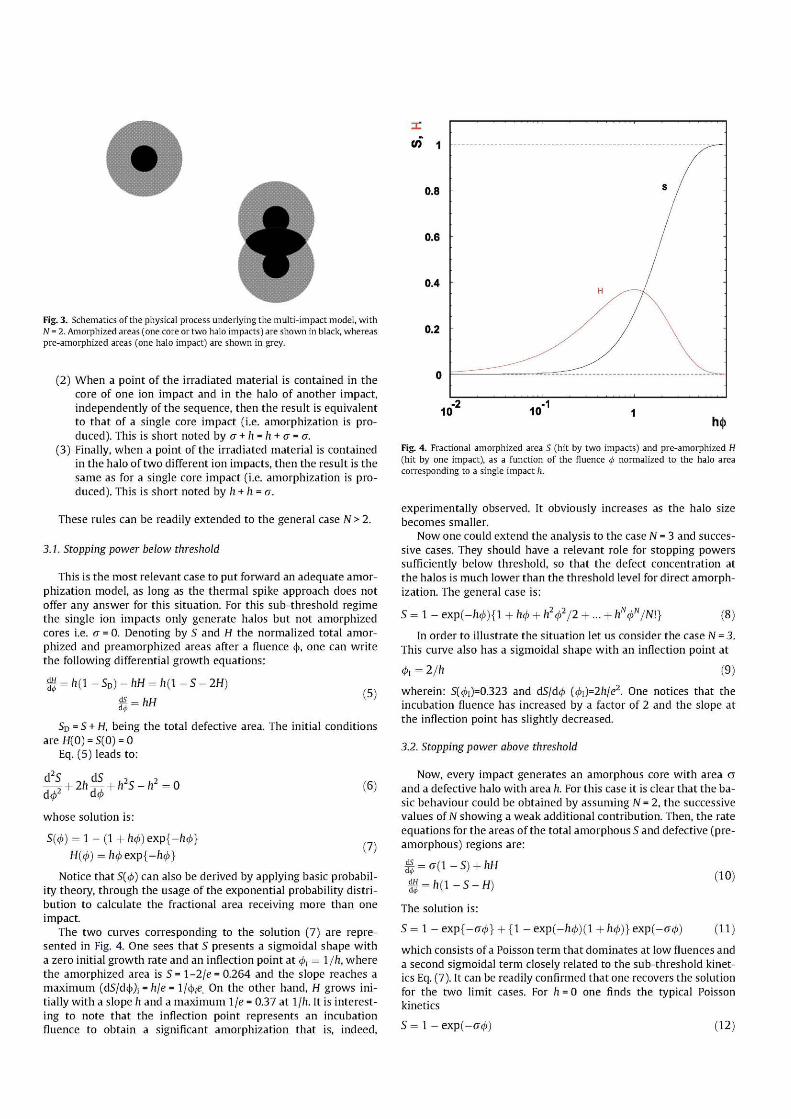
Fig. 3. Schematics of the physical process underlying the multi-impact model, with N = 2. Amorphized areas (one core or two halo impacts) are shown in black, whereas pre-amorphized areas (one halo impact) are shown in grey.
(2) When a point of the irradiated material is contained in the core of one ion impact and in the halo of another impact, independently of the sequence, then the result is equivalent to that of a single core impact (i.e. amorphization is produced). This is short noted by a + h = h + a = a.
(3) Finally, when a point of the irradiated material is contained in the halo of two different ion impacts, then the result is the same as for a single core impact (i.e. amorphization is produced). This is short noted by h + h = a.
These rules can be readily extended to the general case N > 2.
3.1. Stopping power below threshold
This is the most relevant case to put forward an adequate amorphization model, as long as the thermal spike approach does not offer any answer for this situation. For this sub-threshold regime the single ion impacts only generate halos but not amorphized cores i.e. a = 0. Denoting by S and H the normalized total amorphized and preamorphized areas after a fluence 4>, one can write the following differential growth equations:
d</> " : h(\ - SD) -hH=h(\-S- 2H) (5)
SD = S + H, being the total defective area. The initial conditions are H(0) = S(0) = 0
Eq. (5) leads to:
(6)
(7)
<J4 + 2h-g + h2S-h2=0 d<¡>2 &<t>
whose solution is:
S(4>) = l-(l+/i4>)exp{-/i<¿>} H{(j>) = h(j)exp{-h(j)}
Notice that S(4>) can also be derived by applying basic probability theory, through the usage of the exponential probability distribution to calculate the fractional area receiving more than one impact.
The two curves corresponding to the solution (7) are represented in Fig. 4. One sees that S presents a sigmoidal shape with a zero initial growth rate and an inflection point at <j>¡ = \/h, where the amorphized area is S = 1-2/e = 0.264 and the slope reaches a maximum (dS/dt^ = h\e = l/4>¡e On the other hand, H grows initially with a slope h and a maximum 1/e = 0.37 at \\h. It is interesting to note that the inflection point represents an incubation fluence to obtain a significant amorphization that is, indeed,
Fig. 4. Fractional amorphized area S (hit by two impacts) and pre-amorphized H (hit by one impact), as a function of the fluence <j> normalized to the halo area corresponding to a single impact h.
experimentally observed. It obviously increases as the halo size becomes smaller.
Now one could extend the analysis to the case N = 3 and successive cases. They should have a relevant role for stopping powers sufficiently below threshold, so that the defect concentration at the halos is much lower than the threshold level for direct amorphization. The general case is:
2 j . 2 , S = 1 - exp(-h(¡)){\ +h4> + hÁ4>¿/2 -hN-N r/N\} (8)
In order to illustrate the situation let us consider the case N = 3. This curve also has a sigmoidal shape with an inflection point at
<k = 2/h (9)
wherein: S(<£i)=0.323 and dS/d<£ (<£i)=2h/e2. One notices that the incubation fluence has increased by a factor of 2 and the slope at the inflection point has slightly decreased.
3.2. Stopping power above threshold
Now, every impact generates an amorphous core with area a and a defective halo with area h. For this case it is clear that the basic behaviour could be obtained by assuming N = 2, the successive values of N showing a weak additional contribution. Then, the rate equations for the areas of the total amorphous S and defective (pre-amorphous) regions are:
3§ = ff(i-s) + wi
% = h(\-S-H)
The solution is:
(10)
S = 1 - exp{-<7< )̂} + {1 - exp(-/i<£)(l + h(j>)} e x p ( - o » (11)
which consists of a Poisson term that dominates at low fluences and a second sigmoidal term closely related to the sub-threshold kinetics Eq. (7). It can be readily confirmed that one recovers the solution for the two limit cases. For h = 0 one finds the typical Poisson kinetics
S = 1 - exp(-cf(j)) (12)
10 10 1 0(()
Fig. 5. Fractional area amorphized S (hit by two impacts) as a function of the fluence <j> normalized to the core area corresponding to a single impact a, for different values of the ratio h/a (ranging from 0 to 5).
For cr = 0, i.e. the amorphization stage (core) has not yet been reached, one arrives at
S = 1 - (1 + h(j>) exp(-h^) (13)
as derived for the previous case. The dependence of S on the normalized fluence a 4>, for differ
ent values of the h\a ratio, is shown in Fig. 5. Note that increasing the area h of the halo enhances the sigmoidal contribution in Eq. (11) leading to a smaller incubation fluence and a higher maximum amorphization rate.
4. Relation to Avrami kinetics
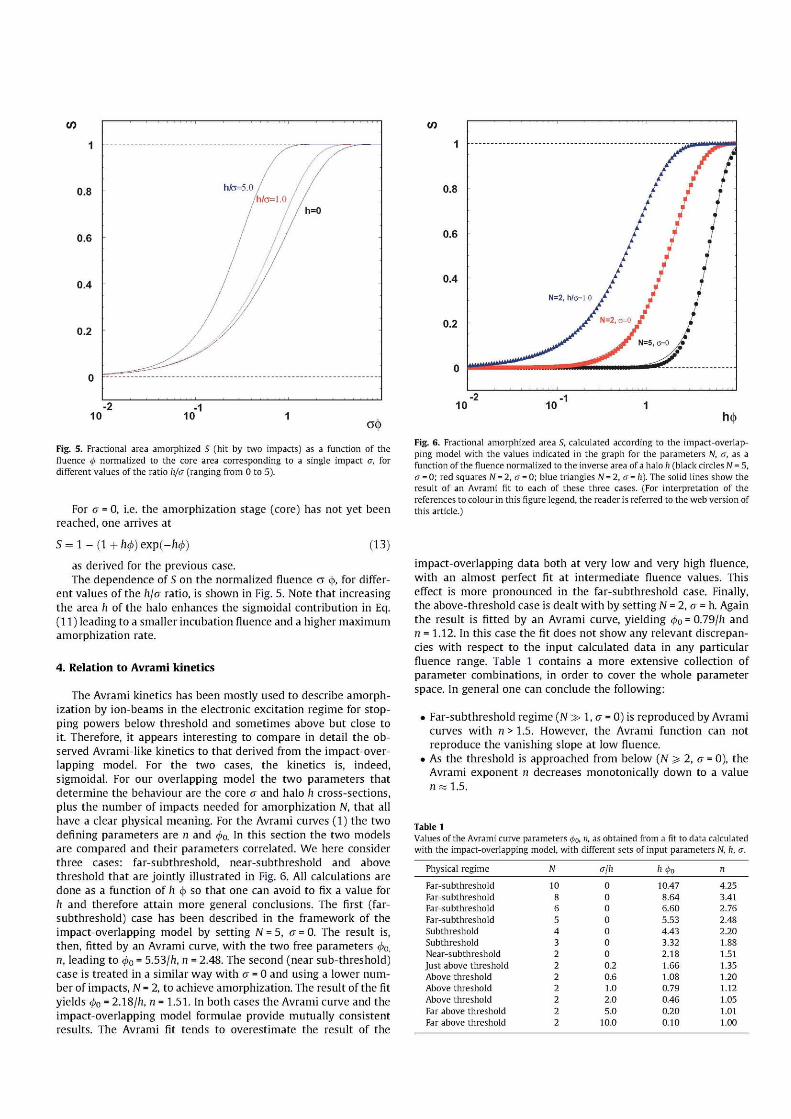
The Avrami kinetics has been mostly used to describe amorphization by ion-beams in the electronic excitation regime for stopping powers below threshold and sometimes above but close to it. Therefore, it appears interesting to compare in detail the observed Avrami-like kinetics to that derived from the impact-overlapping model. For the two cases, the kinetics is, indeed, sigmoidal. For our overlapping model the two parameters that determine the behaviour are the core a and halo h cross-sections, plus the number of impacts needed for amorphization N, that all have a clear physical meaning. For the Avrami curves (1) the two defining parameters are n and <po. In this section the two models are compared and their parameters correlated. We here consider three cases: far-subthreshold, near-subthreshold and above threshold that are jointly illustrated in Fig. 6. All calculations are done as a function of h 4> so that one can avoid to fix a value for h and therefore attain more general conclusions. The first (far-subthreshold) case has been described in the framework of the impact-overlapping model by setting N = 5, a = 0. The result is, then, fitted by an Avrami curve, with the two free parameters <po, n, leading to <po = 5.53/h, n = 2.48. The second (near sub-threshold) case is treated in a similar way with a = 0 and using a lower number of impacts, N = 2, to achieve amorphization. The result of the fit yields <j>0 = 2.18/h, n = 1.51. In both cases the Avrami curve and the impact-overlapping model formulae provide mutually consistent results. The Avrami fit tends to overestimate the result of the
1
0.8
0.6
0.4 / I
N=2, h/o=1.0 / I
0 2 jF N=2 , o=0 J"
M/T JF N=5,O=0
0 m uuUUt^mmmmmmatSr n f i ^
-2 -1 10 10 1
h§
Fig. 6. Fractional amorphized area S, calculated according to the impact-overlapping model with the values indicated in the graph for the parameters N, a, as a function of the fluence normalized to the inverse area of a halo h (black circles N = 5, a = 0; red squares N = 2, a = 0; blue triangles N = 2, a = h). The solid lines show the result of an Avrami fit to each of these three cases. (For interpretation of the references to colour in this figure legend, the reader is referred to the web version of this article.)
impact-overlapping data both at very low and very high fluence, with an almost perfect fit at intermediate fluence values. This effect is more pronounced in the far-subthreshold case. Finally, the above-threshold case is dealt with by setting N = 2, a = h. Again the result is fitted by an Avrami curve, yielding <po = 0.79/h and n = 1.12. In this case the fit does not show any relevant discrepancies with respect to the input calculated data in any particular fluence range. Table 1 contains a more extensive collection of parameter combinations, in order to cover the whole parameter space. In general one can conclude the following:
• Far-subthreshold regime (N > 1, a = 0) is reproduced by Avrami curves with n>1.5. However, the Avrami function can not reproduce the vanishing slope at low fluence.
• As the threshold is approached from below (N > 2, a = 0), the Avrami exponent n decreases monotonically down to a value n « 1 . 5 .
Table 1 Values of the Avrami curve parameters 4>0, n, as obtained from a fit to data calculated with the impact-overlapping model, with different sets of input parameters N, h, a.
Physical regime
Far-subthreshold Far-subthreshold Far-subthreshold Far-subthreshold Subthreshold Subthreshold Near-subthreshold Just above threshold Above threshold Above threshold Above threshold Far above threshold Far above threshold
Af
10 8 6 5 4 3 2 2 2 2 2 2 2
0-//1
0 0 0 0 0 0 0 0.2 0.6 1.0 2.0 5.0
10.0
Mo
10.47 8.64 6.60 5.53 4.43 3.32 2.18 1.66 1.08 0.79 0.46 0.20 0.10
n
4.25 3.41 2.76 2.48 2.20 1.88 1.51 1.35 1.20 1.12 1.05 1.01 1.00
• Once above threshold (N = 2, a > 0), as ajh spans the range from 0 (i.e. just at the threshold) to infinity (i.e. pure Poisson behaviour), the Avrami exponent n again decreases monotonically, now from 1.5 down to 1. Notice that the choice N = 2 is somewhat arbitrary and that a larger fixed value of N could also be considered, as is indeed the case when the model is compared to experimental data in the next section.
5. Comparison with experiment
Although the objective of the paper is not to achieve a good quantitative match to experiments in view of the simplicity of our model, the theoretical predictions are in good qualitative (and even fair quantitative) accordance with available experimental data. As a representative example, Fig. 7 shows the fractional amorphized area corresponding to irradiations with 0 at 5 MeV, CI at 11 MeV, Br at 22 MeV and Br at 45 MeV. They are data obtained with the RBS/C technique that is mostly used to measure the degree of amorphization. On the same plots the best fits obtained with Avrami-type kinetics or those for our overlapping-impact model are included.
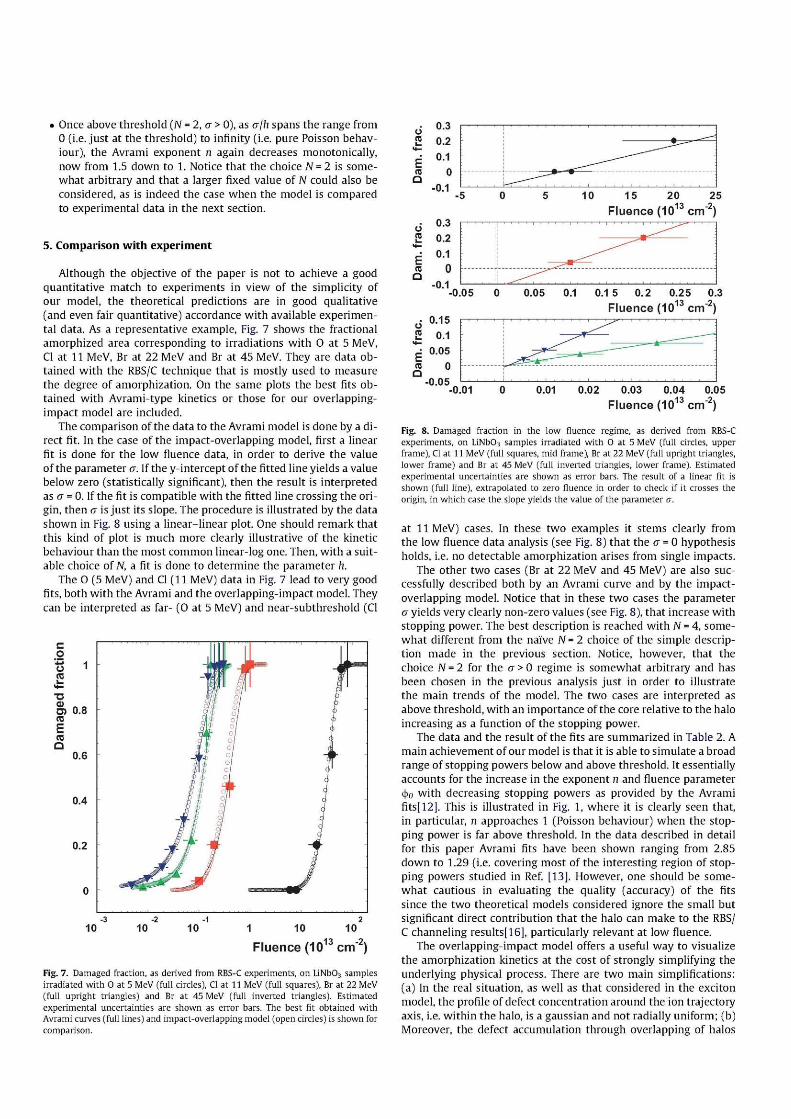
The comparison of the data to the Avrami model is done by a direct fit. In the case of the impact-overlapping model, first a linear fit is done for the low fluence data, in order to derive the value of the parameter a. If the y-intercept of the fitted line yields a value below zero (statistically significant), then the result is interpreted as a = 0. If the fit is compatible with the fitted line crossing the origin, then a is just its slope. The procedure is illustrated by the data shown in Fig. 8 using a linear-linear plot. One should remark that this kind of plot is much more clearly illustrative of the kinetic behaviour than the most common linear-log one. Then, with a suitable choice of N, a fit is done to determine the parameter h.
The O (5 MeV) and CI (11 MeV) data in Fig. 7 lead to very good fits, both with the Avrami and the overlapping-impact model. They can be interpreted as far- (0 at 5 MeV) and near-subthreshold (CI
Fluence (1013 cm"2)
Fig. 7. Damaged fraction, as derived from RBS-C experiments, on LiNb03 samples irradiated with O at 5 MeV (full circles), CI at 11 MeV (full squares), Br at 22 MeV (full upright triangles) and Br at 45 MeV (full inverted triangles). Estimated experimental uncertainties are shown as error bars. The best fit obtained with Avrami curves (full lines) and impact-overlapping model (open circles) is shown for comparison.
0.05 Fluence (1013 cm"2)
Fig. 8. Damaged fraction in the low fluence regime, as derived from RBS-C experiments, on LiNb03 samples irradiated with O at 5 MeV (full circles, upper frame), CI at 11 MeV (full squares, mid frame), Br at 22 MeV (full upright triangles, lower frame) and Br at 45 MeV (full inverted triangles, lower frame). Estimated experimental uncertainties are shown as error bars. The result of a linear fit is shown (full line), extrapolated to zero fluence in order to check if it crosses the origin, in which case the slope yields the value of the parameter a.
at 11 MeV) cases. In these two examples it stems clearly from the low fluence data analysis (see Fig. 8) that the a = 0 hypothesis holds, i.e. no detectable amorphization arises from single impacts.
The other two cases (Br at 22 MeV and 45 MeV) are also successfully described both by an Avrami curve and by the impact-overlapping model. Notice that in these two cases the parameter a yields very clearly non-zero values (see Fig. 8), that increase with stopping power. The best description is reached with N = 4, somewhat different from the naive N= 2 choice of the simple description made in the previous section. Notice, however, that the choice N = 2 for the a > 0 regime is somewhat arbitrary and has been chosen in the previous analysis just in order to illustrate the main trends of the model. The two cases are interpreted as above threshold, with an importance of the core relative to the halo increasing as a function of the stopping power.
The data and the result of the fits are summarized in Table 2. A main achievement of our model is that it is able to simulate a broad range of stopping powers below and above threshold. It essentially accounts for the increase in the exponent n and fluence parameter 4>0 with decreasing stopping powers as provided by the Avrami fits[12]. This is illustrated in Fig. 1, where it is clearly seen that, in particular, n approaches 1 (Poisson behaviour) when the stopping power is far above threshold. In the data described in detail for this paper Avrami fits have been shown ranging from 2.85 down to 1.29 (i.e. covering most of the interesting region of stopping powers studied in Ref. [13]. However, one should be somewhat cautious in evaluating the quality (accuracy) of the fits since the two theoretical models considered ignore the small but significant direct contribution that the halo can make to the RBS/ C channeling results[16], particularly relevant at low fluence.
The overlapping-impact model offers a useful way to visualize the amorphization kinetics at the cost of strongly simplifying the underlying physical process. There are two main simplifications: (a) In the real situation, as well as that considered in the exciton model, the profile of defect concentration around the ion trajectory axis, i.e. within the halo, is a gaussian and not radially uniform; (b) Moreover, the defect accumulation through overlapping of halos
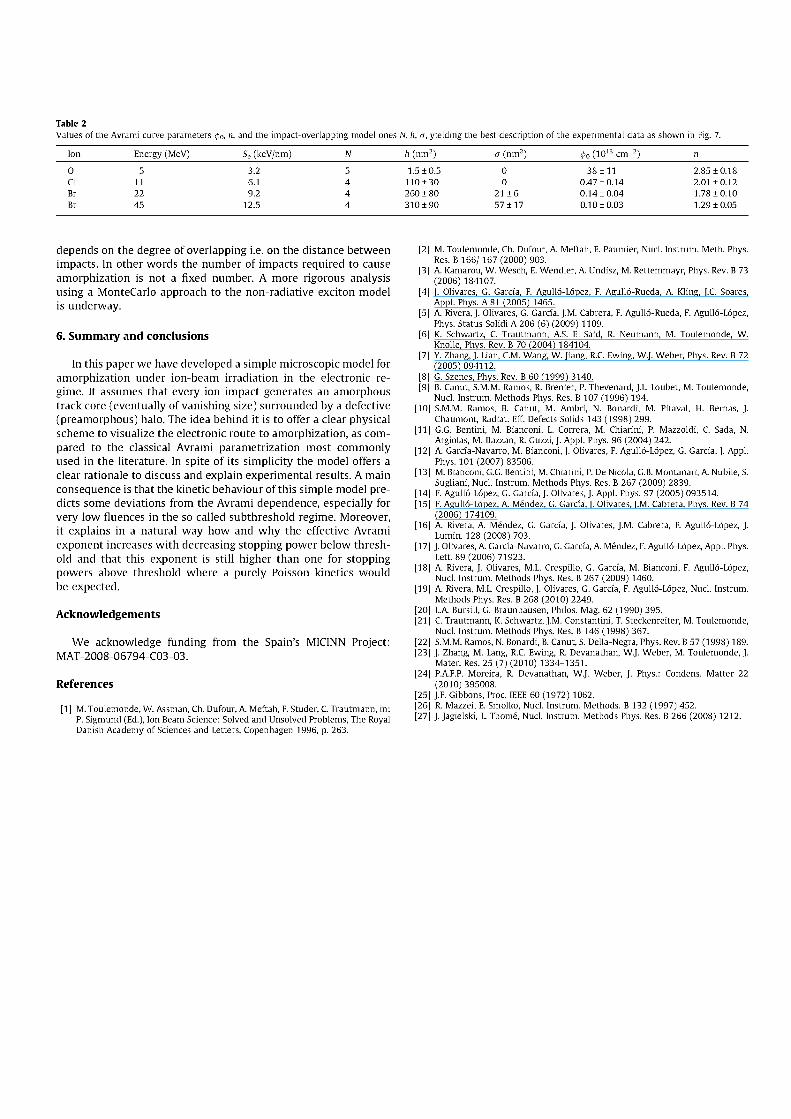
Table 2 Values of the Avrami curve parameters 4>0, n, and the impact-overlapping model ones N, h, a, yielding the best description of the experimental data as shown in Fig. 7.
Ion Energy (MeV) Se (keV/nm) h (ran2 a (nm2 4>0 (1013 cm-2) n
0
a Br Br
5 11 22 45
3.2 6.1 9.2
12.5
1.5 ±0.5 110±30 260 ± 80 310 ±90
0 0
21 ±6 57±17
38 ±11 0.47 ± 0.14 0.14 ± 0.04 0.10 ±0.03
2.85 ±0.18 2.01 ±0.12 1.78 ±0.10 1.29 ±0.05
depends on the degree of overlapping i.e. on the distance between impacts. In other words the number of impacts required to cause amorphization is not a fixed number. A more rigorous analysis using a MonteCarlo approach to the non-radiative exciton model is underway.
6. Summary and conclusions
In this paper we have developed a simple microscopic model for amorphization under ion-beam irradiation in the electronic regime. It assumes that every ion impact generates an amorphous track core (eventually of vanishing size) surrounded by a defective (preamorphous) halo. The idea behind it is to offer a clear physical scheme to visualize the electronic route to amorphization, as compared to the classical Avrami parametrization most commonly used in the literature. In spite of its simplicity the model offers a clear rationale to discuss and explain experimental results. A main consequence is that the kinetic behaviour of this simple model predicts some deviations from the Avrami dependence, especially for very low fluences in the so called subthreshold regime. Moreover, it explains in a natural way how and why the effective Avrami exponent increases with decreasing stopping power below threshold and that this exponent is still higher than one for stopping powers above threshold where a purely Poisson kinetics would be expected.
Acknowledgements
We acknowledge funding from the Spain's MICINN Project: MAT-2008-06794-C03-03.
References
[1 ] M. Toulemonde, W. Assman, Ch. Dufour, A. Meftah, F. Studer, C. Trautmann, in: P. Sigmund (Ed.), Ion Beam Science: Solved and Unsolved Problems, The Royal Danish Academy of Sciences and Letters, Copenhagen 1996, p. 263.
[2] M. Toulemonde, Ch. Dufour, A. Meftah, E. Paumier, Nucl. Instrum. Meth. Phys. Res. B 166/ 167 (2000) 903.
[3] A. Kamarou, W. Wesch, E. Wendler, A. Undisz, M. Rettemmayr, Phys. Rev. B 73 (2006) 184107.
[4] J. Olivares, G. García, F. Agulló-López, F. Agulló-Rueda, A. Kling, J.C. Soares, Appl. Phys. A 81 (2005) 1465.
[5] A. Rivera, J. Olivares, G. Garcia, J.M. Cabrera, F. Agulló-Rueda, F. Agulló-López, Phys. Status Solidi A 206 (6) (2009) 1109.
[6] K. Schwartz, C. Trautmann, AS. El-Said, R. Neumann, M. Toulemonde, W. Knolle, Phys. Rev. B 70 (2004) 184104.
[7] Y. Zhang, J. Lian, CM. Wang, W. Jiang, R.C. Ewing, W.J. Weber, Phys. Rev. B 72 (2005)094112.
[8] G. Szenes, Phys. Rev. B 60 (1999) 3140. [9] B. Canut, S.M.M. Ramos, R. Brenier, P. Thevenard, J.L Loubet, M. Toulemonde,
Nucl. Instrum. Methods Phys. Res. B 107 (1996) 194. 10] S.M.M. Ramos, B. Canut, M. Ambri, N. Bonardi, M. Pitaval, H. Bernas, J.
Chaumont, Radiat. Eff. Defects Solids 143 (1998) 299. 11] G.G. Bentini, M. Bianconi, L. Correrá, M. Chiarini, P. Mazzoldi, C. Sada, N
Argiolas, M. Bazzan, R. Guzzi, J. Appl. Phys. 96 (2004) 242. 12] A. García-Navarro, M. Bianconi, J. Olivares, F. Agulló-López, G. García, J. Appl.
Phys. 101 (2007) 83506. 13] M. Bianconi, G.G. Bentini, M. Chiarini, P. De Nicola, G.B. Montanari, A. Nubile, S.
Sugliani, Nucl. Instrum. Methods Phys. Res. B 267 (2009) 2839. 14] F. Agulló-López, G. García, J. Olivares, J. Appl. Phys. 97 (2005) 093514. 15] F. Agulló-López, A. Méndez, G. Garcia, J. Olivares, J.M. Cabrera, Phys. Rev. B 74
(2006) 174109. 16] A. Rivera, A. Méndez, G. García, J. Olivares, J.M. Cabrera, F. Agulló-López, J.
Lumin. 128 (2008) 703. 17 ] J. Olivares, A. García-Navarro, G. García, A. Méndez, F. Agulló-López, Appl. Phys.
Lett. 89 (2006) 71923. 18] A. Rivera, J. Olivares, M.L. Crespillo, G. Garcia, M. Bianconi, F. Agulló-López,
Nucl. Instrum. Methods Phys. Res. B 267 (2009) 1460. 19] A. Rivera, M.L Crespillo, J. Olivares, G. García, F. Agulló-López, Nucl. Instrum.
Methods Phys. Res. B 268 (2010) 2249. 20] L.A Bursill, G. Braunhausen, Philos. Mag. 62 (1990) 395. 21] C. Trautmann, K. Schwartz, J.M. Constantini, T. Steckenreiter, M. Toulemonde,
Nucl. Instrum. Methods Phys. Res. B 146 (1998) 367. 22] S.M.M. Ramos, N. Bonardi, B. Canut, S. Della-Negra, Phys. Rev. B 57 (1998) 189. 23] J. Zhang, M. Lang, R.C. Ewing, R. Devanathan, W.J. Weber, M. Toulemonde, J.
Mater. Res. 25 (7) (2010) 1334-1351. 24] P.A.F.P. Moreira, R Devanathan, W.J. Weber, J. Phys.: Condens. Matter 22
(2010) 395008. 25] J.F. Gibbons, Proc. IEEE 60 (1972) 1062. 26] R. Mazzei, E. Smolko, Nucl. Instrum. Methods. B 132 (1997) 452. 27] J. Jagielski, L Thome, Nucl. Instrum. Methods Phys. Res. B 266 (2008) 1212.