tefl guide - Eteaching & Learning – Affordable Internationally ...
AMERICANS’ATTITUDESTOWARDTHEAFFORDABLECAREACT:WOULDBETTERPUBLICUNDERSTANDINGINCREASEORDECREASEFAVORABILITY?
WENDY GROSS1
TOBIAS H. STARK2 JON KROSNICK3 JOSH PASEK4 GAURAV SOOD5 TREVOR TOMPSON
6 JENNIFER AGIESTA7 DENNIS JUNIUS8
ThisresearchwasconductedwithsupportfromtheRobertWoodJohnsonFoundation,GfK,StanfordUniversity,andtheAssociatedPress.TheauthorsthankArthurLupiaandMichaelTomzforhelpfulcommentsonthismanuscript.
1GfK.wendy.gross@gfk.com2StanfordUniversityandUtrechtUniversity.t.h.stark@uu.nl3StanfordUniversity.krosnick@stanford.edu4UniversityofMichigan.jpasek@umich.edu5PrincetonUniversity,[email protected]‐NORCCenterforPublicAffairsResearch.tompson‐[email protected]@[email protected]
AbstractNationalsurveysconductedin2010and2012suggestthefollowingconclusions:
‐ AmericanunderstandingofwhatisandisnotintheACAhasbeenfarfromperfect.
‐ Correctunderstandingoftheelementsofthebillweexaminedvariedwithpartyidentification:Democratsunderstoodthemost,independentsless,andRepublicansstillless.
‐ Olderpeopleandmoreeducatedpeoplehaveunderstoodtheelementsofthebillweexaminedbetterthanhaveyoungerandlesseducatedpeople.
‐ Between2010and2012,publicunderstandingoftheelementsofthebillweexamined
didnotchangenotably.‐ MostpeoplehavefavoredmostoftheelementsoftheACAthatweexamined,butnot
everyonerecognizedthattheseelementswereallintheplan.‐ Mostpeopleopposedpoliciesthatweresometimesfalselythoughttobepartsofthe
ACA..‐ Ifthepublichadperfectunderstandingoftheelementsthatweexamined,the
proportionofAmericanswhofavorthebillmightincreasefromthecurrentlevelof32%to70%.
Takentogether,allthissuggeststhatifeducationeffortsweretocorrectpublicmisunderstandingofthebill,publicfavorabilitymightincreaseconsiderably.
1
IntroductionThePatientProtectionandAffordableCareActof2010(ACA)enactedaseriesofsignificantchangestotheAmericanhealthcaresystem.The900‐page‐longbill,whichelicitedanextremelypartisanreactionandsubstantialnewsmediainterest,amendedtheU.S.codetopreventinsurancecompaniesfromdenyingcoverageforpre‐existingconditions,provideforhealthcareexchangeswhereindividualscouldpurchasecaredirectly,requireallindividualstohavehealthinsuranceorpayafine,andmore.InJune,2012,theU.S.SupremeCourtupheldacentralelementofthislaw.
PublicdebateaboutthebillcalledattentiontomanyaspectsofthelawthatwereincludedintheversionthatCongressapproved.Butduringthecourseofpublicdebate,anumberofinaccurateclaimsweremade,assertingthatthebillincludedprovisionsthatwerenotincludedinthefinalversion.Someofthewidelydiscussedcomponentswerepartofthelegislation,suchastheplantoallowchildrentostayontheirparents’healthplanthroughage26.Butotherwidelydiscussednotionswereneverconsideredforinclusion,suchastheclaimthatapanelofbureaucratscoulddecidewhencoveragewouldbegiven(theso‐called“deathpanels”).Thelegislationincludedavarietyofless‐oftendiscussedprovisions,suchaschargingafeetoinsurancecompaniesthatofferedparticulartypesofinsurance.
Manysurveyswereconductedbothbeforethebill’spassageandafteritsenactmenttogaugetheAmericanpublic’sreactiontoit.Inearly2010,publicopinionwasfairlyevenlysplit.Forexample,accordingtoaKaiserFamilyFoundation(KFF)surveyinAprilofthatyear,46%ofAmericanssaidtheyhadafavorableopinionofthebill,and40%saidtheyhadanunfavorableopinion.Ayearlater,inApril2011,KFFreportedthesetwostatisticstobe41%and41%,respectively.AndinJanuary2012,thefigureswere37%and44%,respectively,perhapssuggestingaslightshiftintheunfavorabledirectionastimehaspassed.InMay2012,thefigureswereidentical:37%and44%,solidifyingevidenceofthatslightshift.AndinAugust2012,thesefigureswere38%and43%,respectively.
AsimilarportraitwaspaintedbyAP‐GfKpolls.InMay,2010,39%ofrespondentssaidtheysupportedtheACA,and46%saidtheyopposedit.InJune,2012,thosenumberswere33%and47%,respectively.Thus,asmalldecreaseintheproportionsupporting,andasmallincreaseintheproportionopposing.
Surveysdonebyotherorganizationsprovidedsimilar,thoughnotidentical,portraitsofthebalanceandtrajectoryofopinions.Forexample,aNBCNews/WallStreetJournalpolldoneinMay,2010,found38%ofrespondentssayingtheythoughttheACAwasagoodidea,and44%saiditwasabadidea.AsofJune,2012,thatorganizationfoundthesefigurestobe35%and41%.Thus,theproportionexpressingapositiveopiniondroppedslightly,liketheKFFpolls.Buttheproportionexpressinganegativeopinionalsodroppedslightly.
Onlyoneprominentnationalsurveyresearchorganization,ThePewResearchCenter,reportedresultssuggestingmovementintheoppositedirection.InJanuary,2011,41%oftheirrespondentsapprovedoftheACA,and48%opposed.Theirmostrecentsurvey,inJune‐July,2012,foundthat47%approved,and43%opposed.
2
Puttogether,mostnationalsurveysduringthelasttwoyearssupporttwoprincipalconclusions:(1)publicopinionhasnotmanifestedasizableandconsistentleaningtowardbeingfavorableorunfavorabletowardtheACA,and(2)aslightshiftinthenegativedirectionmayhaveoccurredsincethelawwaspassed.
ItwouldbeunderstandabletolookatsuchevidenceasanindicationthattheAmericanpublicdoesnotstronglysupportthispieceoflegislation.Afterall,ifaboutasmanypeoplefavoritasopposeit,andifwehaveneverseenamajorityfavoringit,thathardlysendsastrongsignalofsupport.Furthermore,itiseasytoimaginethatsincepassageofthebill,Americanshavehadtimetoconsiderthebillanditsimplicationsinmoreandmoredepth,andifsuchconsiderationleadstoashiftinthenegativedirection,thatcertainlysignalsquitetheoppositeofenthusiasm.Thus,suchdatacouldbetakenasasignalthatRepublicaneffortstorepealthebillwouldbewarmlywelcomedbyagrowinggroupofAmericans.
Atthesametime,theverysamepollingevidencecanbeviewedfromtheoppositeviewpoint.AlthoughamajorityofAmericanshavenotfavoredthebill,itisalsotruethatamajorityhaveneveropposedit,either.Andevenaftertherecentsmallincreaseinopposition,theproportionopposingitdoesnotexceed50%.Sodirectquestionsaskingaboutpositivevs.negativeevaluationsoftheplanhavenotdocumentedamandatefromthepublictorepealthebill.9Takentogether,allthisevidenceportraystheAmericanpublicinwhatmightseematypicalway:splitaboutevenly,andnotprovidingaclearmandatetoelectedrepresentativesonewayoranother.
Itwouldthereforenotbeunreasonableforthoserepresentativestolookatthispollingevidence,reachthatconclusion,andproceedtotakeactionsinkeepingwiththeguardianshipviewofdemocracy:decidingwhattheyfeelisbestforthecountryandtakingaction(ordoingnothing)accordingly,regardlessofpublicopinion.
Suchignoringofpublicopinionmightalsobejustifiedfromanotherperspectiveaswell.Insomanysurvey‐basedinvestigationsoftheAmericanpublicformanydecades,peoplehavebeenfoundtoperformquitepoorlyonquizzesassessingfactualknowledgeaboutdomainsinwhichsignificantlegislationhasbeenconsideredorpassed.Ifmostpeoplelackthefactsneededtotrulyunderstandtheproblemstobesolvedbyapieceoflegislationandthesolutionsofferedbythatlegislation,whyshouldpublicevaluationsofthelegislationbetakenseriously?Thatis,thepublicmightfeelverydifferentlyiftheytrulyunderstoodabill,soopinionsbasedonpartialinformationorsubstantialmisconceptionscancertainlynotbedescribedas“wise”andshouldperhapsthereforebeignoredbylegislators.
Ofcourse,ignoringpublicopinion,evenuninformedpublicopinion,mayplacelegislatorsatriskcomeelection‐time.Evenwhenthepublicdoesnotunderstandapieceoflegislation,membersoftheelectoratemaynonethelessholdstrongopinionsaboutit,eitherfavorableorunfavorable,andthoseopinionsmayshapetheirvotingdowntheroad.Indeed,agreatdealofresearchsuggeststhatpublicopiniononpolicyissuesdoessometimesshapevotechoices(seeAnand&Krosnick,2003;Krosnick,1988).Soalegislatorwhovotesagainstapieceoflegislationthatvotersfavormay9QuestionsaskingwhetherthebillshouldberepealedhavesometimesshownamajorityofAmericansansweringaffirmatively.
3
findhimselforherselflaterpayinganelectoralpriceifthatvotebecomeswellpublicizedbythelegislator’sopponentduringacampaign,evenifpublicunderstandingofthelegislationisseriouslywanting.
Inasituationsuchasthis,legislatorswhowishtoseeapieceoflegislationpassed(oravoiditsrepeal)alwayshavetheoptionofinformingtheAmericanpublicaboutwhatthelegislationwouldtrulydo,inthehopethatbetterunderstandingwouldleadthepublictoofferastrongersignalofsupporttotheirelectedrepresentatives.Butwouldsucheducationindeedleadtomoresupport?Thispresumablydependsonthenatureofthepublic’smisunderstandingsandonthepublic’sevaluationsoftheelementstheybelievecomposethelegislationandoftheelementsthatinfactcomposeit.
Inthispaper,wereportaninvestigationofexactlytheseissueswithregardtotheACA.Usingdatafromtwosurveys(oneconductedin2010andtheotherin2012),weexplored:
1) HowaccuratelyAmericanshaveunderstoodwhatisintheACAandwhatisnot.2) Howtheaccuracyofpeople’sunderstandinghaschangedduringthetwoyearssincethe
billwaspassed.3) HowknowledgeaccuracyisrelatedtofavoringtheACA–thatis,whetherpeoplewho
knowmoreaboutwhat’sintheACAlikeitmoreorlikeitless,4) HowthepublicwouldfeelabouttheACAifeveryoneunderstoodthataseriesofits
centralelementsareindeedincludedintheACAandthataseriesoffrequentlydiscussedbutultimatelyomittedelementsarenotinit.
Alongtheway,weinvestigatedtwootherissues:
1) Thepredictorsofaccurateunderstandingoftheplan‐thatis,whichtypesofpeoplearemoreandlesslikelytoscorewellonaquiz.
2) Thepopularityofvariousspecificelementsthatwereincludedintheplan,andhowpopularareelementsthatwerenotincludedbutweresometimesclaimedtobe.
Incarryingoutthisinvestigation,weimplementedanewapproachtomeasuringpublicunderstandingofapublicpolicyissue.Insurveysdoneduringthelast80years,ithasbeenroutinetotestknowledgebyaskingpeoplefactualquestionsandgradingpeopleaseithercorrectorincorrectbaseduponwhethertheiranswermatchedthefactsornot.Butthisapproachignoresasimpleandunavoidablefact:thatarespondentsayingtoasurveyinterviewerthatmembersoftheRepublicanPartyoutnumbermembersoftheDemocraticPartyintheU.S.HouseofRepresentativesdoesnotnecessarilymeanthattherespondentbelievesthistobetrue.Whenaskedwhichpartyholdsmoreseats,arespondentmightsimplyguessandendupgivingthecorrectanswerbychancealone.Thisresponsewouldnotrevealabeliefthattherespondentgenuinelyholds,norwouldthatpurportedbeliefhaveanyimpactonhisorherthinking,becauseheorshedoesnottrulyholdthatperceptionoftheworld.Guessingseemslikelytoespeciallydistortanswerstoquizquestionsthatofferonlytworesponsechoices,asweusedhere(isthisincludedintheACAornotincludedintheACA?).
4
Onemightimaginethatthisproblemcanbeovercomebyexplicitlyofferingsurveyrespondentstheopportunitytodeclinetoanswerasurveyquestionbysayingthey“don’tknow”theanswerandencouragingthemtodoso.Butagreatdealofresearchsuggeststhatthisstrategyisunwise.Insteadofattractingonlyandallofthepeoplewhotrulydonotholdabeliefonanissue.“don’tknow”responseoptionsattractmanyrespondentswhotrulyholdopinionsandfailtoattractrespondentswhoholdopinionswithlittleornocertainty(forareview,seeKrosnick,2002).
Thesolutiontothisproblemissuggestedinsteadbyaliteratureinpsychologyoncertainty.Theintendedpurposeofofferinga“don’tknow”optionistypicallyexpressedasfilteringoutpeoplewhowouldexpressajudgmentwithnocertaintyatall.Thatis,apersonmightsay“IthinkthattheDemocratsholdmoreseats,butI’mnotatallconfidentaboutthatguess.”Thus,thepreferablesolutionistofirstaskpeopletomaketheirbestguessandthentoaskthemtoratethecertaintywithwhichtheyexpressthatbelief.Thisallowsresearcherstofilteroutpeoplewhoofferopinionswithlittleornocertainty.
Acollateralbenefitofthisapproachisthatcertaintystronglycorrelateswithuseofbeliefsduringdecision‐making.Peoplewhoholdabeliefwithconfidenceareinclinedtouseitwhenmakinghighlyrelevantdecisions.Incontrast,peoplewhoholdabeliefwithminimalconfidenceareunlikelytouseit(forareview,seePetty&Krosnick,1995).Thus,givingsurveyrespondents“credit”foraccuratelypossessingabeliefonlywhentheyexpresshighcertaintyallowsustoidentifythosebeliefsthatarealsolikelytohaveshapedpeople’soverallevaluationsoftheACA.
Therefore,inkeepingwiththisperspective,whenweadministeredquizquestionsassessingpublicunderstandingoftheACA,eachquestionwasfollowedbyaquestionaskingrespondentshowsuretheywereabouttheiranswertothepriorquestion.Peoplewhoexpressedhighdegreesofconfidencewhengivingacorrectanswerweretreatedasholdinganaccuratebelief,andpeoplewhogaveacorrectanswerwhileexpressedlowdegreesofconfidencewerenotcreditedashavinganaccuratebelief,norwerepeoplewhoansweredthequizquestionsincorrectly.
TheelementsoftheACAthatwereaddressedbythequizquestionswereselectedcarefullytocovermostofthecentralelementsoftheplan.Intheirdocumententitled“FocusonHealthReform:SummaryofNewHealthReformLaw”(Publication#8061;www.kff.org),theKaiserFamilyFoundationprovidedwhattheycalleda“summaryofthelawandchangesmadetothelawbysubsequentlegislation.”WereliedonthissummarytoselecttheelementsoftheACAtoaskaboutinoursurvey.WealsoaskedaboutanadditionalsetofpoliciesthatwerenotultimatelyincludedintheACAbutwerediscussedduringthepublicdebateofit.
DataandMethodsThedataforthisstudycomefromtwocross‐sectionalsurveysofnationallyrepresentativesamplesofAmericanadultsconductedviatheInternetbyGfK(formerlyKnowledgeNetworks).RespondentsweredrawnfromtheKnowledgePanel®‐anationallyrepresentativepanelrecruitedviarandomdigitdialingandbyaddress‐basedsampling.Thesamplingdesigncovers97%oftheAmericanpopulation,includinghouseholdsthatdonothaveInternetaccessoralandlinetelephone.Allpanelistswereremuneratedfortheirparticipation;peoplewhodidnotalreadyhave
5
eitheracomputerorInternetaccesswereprovidedthem.Uponjoiningthepanel,panelistsfirstcompletedacoreprofilequestionnairethatcapturedinformationabouttheirrace,gender,age,income,education,andmore.Foreachsubsequentsurvey,panelmemberswereselectedusingaprobabilityproportionaltosize(PPS)weightedsamplingdesign,producingasamplethatisrepresentativeoftheAmericanpopulation.
ThefirstsurveyforthisprojectwasconductedbetweenAugust31andSeptember7,2010.Arandomsampleof1,815adultswasinvitedtoparticipate,and1,271completedthesurvey(completionrate=70%).Themediantimespentcompletingthequestionnairewas26minutes.
ThesecondsurveywasconductedbetweenAugust3and13,2012.GfKinvited2,344Americanadultstoparticipate,and1,334completedthequestionnaire,acompletionrateof57%.Themediantimespentcompletingthequestionnaire(whichwasmuchshorterthanthequestionnaireusedin2010)was17minutes.
Allanalysesreportedbelowwereconductedusingweightstoadjustforunequalprobabilityofselectionandpost‐stratifyingbasedondemographics.
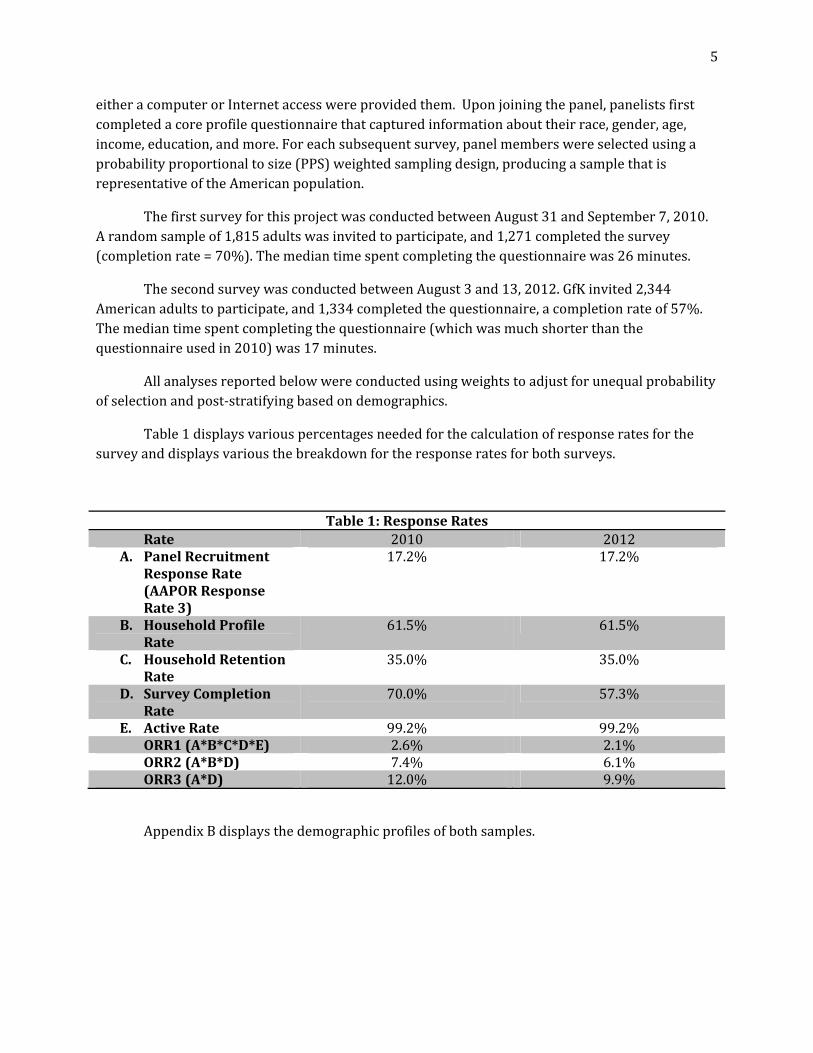
Table1displaysvariouspercentagesneededforthecalculationofresponseratesforthesurveyanddisplaysvariousthebreakdownfortheresponseratesforbothsurveys.
Table1:ResponseRatesRate 2010 2012
A. PanelRecruitmentResponseRate(AAPORResponseRate3)
17.2% 17.2%
B. HouseholdProfileRate
61.5% 61.5%
C. HouseholdRetentionRate
35.0% 35.0%
D. SurveyCompletionRate
70.0% 57.3%
E. ActiveRate 99.2% 99.2%ORR1(A*B*C*D*E) 2.6% 2.1%ORR2(A*B*D) 7.4% 6.1%ORR3(A*D) 12.0% 9.9%
AppendixBdisplaysthedemographicprofilesofbothsamples.
6
Measures
KnowledgeandCertaintyRespondentswereasked18knowledgequizquestions,probingwhetherspecificprovisionswereinthehealthcarebill.Respondentsreadonedescriptionatatimeandindicatedwhethertheythoughttheprovisionwas“inthebill”or“notinthebill”thatCongresspassedin2010.
TwelveoftheelementswereprincipalprovisionsoftheACA.Theremainingsixelementswerenotinthebillbuthadbeenfrequentlydiscussedinpublicdebate;theseelementswereidentifiedbyexpertsattheAssociatedPressandresearchersatStanfordUniversity.AppendixAshowstheinstructionsforrespondents,thefulllistofquestions,andthecorrectanswerforeachitem.
Followingeachquizquestion,respondentswereasked,“Howsureareyouaboutthis?”Theanswers“extremelysure”and“verysure”werecoded1(certain),andtheanswers“moderatelysure”,“slightlysure”,and“notsureatall”werecoded0(uncertain).
Tomeasureeachrespondent’slevelofknowledge,wefirstcomputedthepercentofthe12provisionsoftheACAthattherespondentscorrectlyidentifiedassuchwithhighconfidence.Next,wecomputedthepercentofthe6provisionsnotintheACAthattherespondentcorrectlyidentifiedassuchwithhighconfidence.Then,weaveragesthesetwopercentagestoyieldafinalknowledgescoreforeachrespondent.Consequently,thefactthattwiceasmanyquestionstappedknowledgeaboutprovisionsinthebillastappedprovisionsnotinthebilldidnotcausethefinalindexscoretobebasedmoreonunderstandingoftheelementsinthebillthanonunderstandingoftheelementsnotinthebill.Thefinalknowledgescorerangedfrom0%forpeoplewhodidnotidentifyanyprovisioncorrectlywithhighconfidence,to100%forpeoplewhoproperlyidentifiedallprovisionswithhighconfidence.
EvaluationoftheACAInthe2012survey,respondentswereasked,“Ingeneraldoyoufavor,oppose,orneitherfavornoropposethelawchangingthehealthcaresystemthattheU.S.CongresspassedinMarch2010?”Theresponses“favorstrongly”and“favorsomewhat”werecoded1(indicatingfavoring),andtheresponses“neitherfavornoroppose”,“opposesomewhat”,and“opposestrongly”werecodedas0(notfavoring).
SupportforACAPlanElementsRespondentswerealsoaskedtoindicatewhethertheyfavoredoropposedeachofthe18provisionsaddressedbythequizquestions.Oneachscreen,respondentswereasked“Doyoufavoropposethischange?”alongwithastatementdescribingtheprovision.Responseswerecodedinthesamefashionasforthegeneralfavorabilityquestion,“favor”versus“notfavor”.
PartisanshipTwodummyvariableswerecreatedtodistinguishRepublicansandDemocratsfrompeoplewithoutapartyaffiliation.RespondentswerecodedtobeaDemocratoraRepublicaniftheyanswered“Democrat”or“Republican”tothequestion“DoyouconsideryourselfaDemocrat,aRepublican,an
7
independent,ornoneofthese?”Allotherrespondentsweretreatedasindependents.Twenty‐sevenrespondentsrefusedtoanswerthisquestionandweretreatedasmissinginanalysesusingthisvariable.
MediaUseRespondentswereasked,“Howoftendoyougetnewsfromeachofthefollowing?”andpresentedwithalistof“LocalTVNews,”“FoxNewscablechannel,”“MSNBCcablenews,”“CNNcablenews,”“NationaleveningnetworktelevisionnewsonCBS,ABC,orNBC”,“Radionews”,and“newsfromtheinternet.”Responsestothesequestionswerecoded1iftherespondentsanswered“extremelyoften”or“veryoften”.Theresponses“moderatelyoften”,“rarely”,and“never”werecoded0.
DemographicInformationAgewascodedtorangefrom0to1.DummyvariablesdistinguishedbetweenWhite,Black,Hispanicrespondentsandthosewhoindicatedtheybelongedtoanotherethnicgroup.Variablesindicatingeducationseparatedpeoplewithahigh‐schooldegreeorlessfrompeoplewhoindicatedhavingattendedsomecollegeeducationbutnodegreeandpeoplewhograduatedfromcollege.Finally,twodummyvariablesdistinguishedthreeequallylargegroupsofpeoplewhoindicatedhavinglowincome(lessthan$39,999),moderateincome(between$40,000and$84,999),orhighincome(morethan$85,000).
Results
Favoringvs.OpposingtheACAin2012In2012,32%ofrespondentssaidtheyfavoredtheACA,36%saidtheyopposedit,and32%saidtheyneitherfavorednoropposedit.Thefactthatnegativeresponsesslightlyoutnumberedpositiveresponsesresemblesresultsproducedbyvariousotherpollingorganizationsinrecentmonths.
Notsurprisingly,evaluationsofthebillvariedaccordingtopoliticalpartyidentification.AmongDemocrats,51%favorthebill;29%ofindependentsexpressedthesameopinion,and8%ofRepublicansdidso.Thepartisangapof43percentagepointsisnotatypicalinAmericanevaluationsofpiecesoflegislationthesedays.
KnowledgeabouttheACAin2012In2012,whenimplementingthemethodusedinmostpaststudiesofgivingcredittorespondentswhogavecorrectanswersregardlessofcertainty,frequencyofcorrectanswerswasstrikinglyhighforsomeelementsoftheplan(seecolumn2ofTable2).Forexample,80%saidthatchildrencouldbecoveredbytheirparents’policy.And80%saidthatcompanieswithmorethan50employeeswererequiredtoprovidehealthinsurancetotheiremployees.Majorities,andoftenlargemajorities,gavecorrectanswersregardingmostoftheprovisionsinthebill.Foronlytwoofthetwelveprovisionsweaskedabout(newfeestobechargedtohealthinsurancecompaniesandpharmaceuticalcompanies)didmajoritiesgivetheincorrectanswer(only44%and37%gavecorrectanswers,respectively).
8
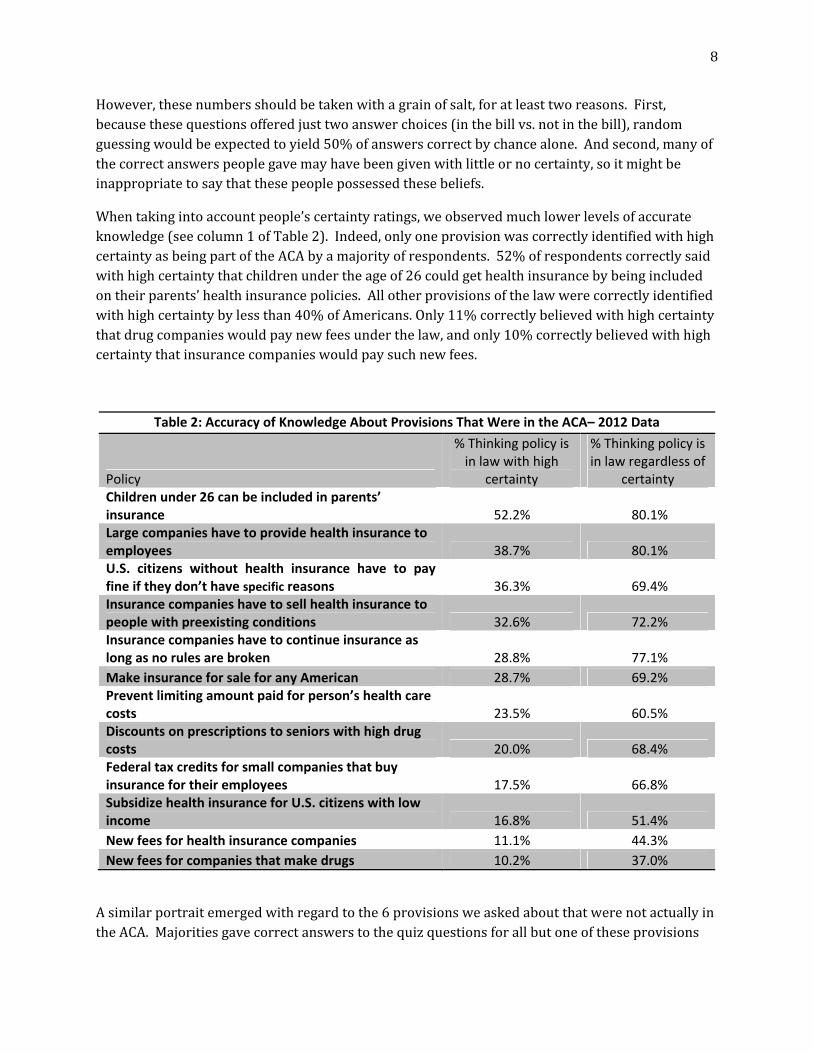
However,thesenumbersshouldbetakenwithagrainofsalt,foratleasttworeasons.First,becausethesequestionsofferedjusttwoanswerchoices(inthebillvs.notinthebill),randomguessingwouldbeexpectedtoyield50%ofanswerscorrectbychancealone.Andsecond,manyofthecorrectanswerspeoplegavemayhavebeengivenwithlittleornocertainty,soitmightbeinappropriatetosaythatthesepeoplepossessedthesebeliefs.
Whentakingintoaccountpeople’scertaintyratings,weobservedmuchlowerlevelsofaccurateknowledge(seecolumn1ofTable2).Indeed,onlyoneprovisionwascorrectlyidentifiedwithhighcertaintyasbeingpartoftheACAbyamajorityofrespondents.52%ofrespondentscorrectlysaidwithhighcertaintythatchildrenundertheageof26couldgethealthinsurancebybeingincludedontheirparents’healthinsurancepolicies.Allotherprovisionsofthelawwerecorrectlyidentifiedwithhighcertaintybylessthan40%ofAmericans.Only11%correctlybelievedwithhighcertaintythatdrugcompanieswouldpaynewfeesunderthelaw,andonly10%correctlybelievedwithhighcertaintythatinsurancecompanieswouldpaysuchnewfees.
Table 2: Accuracy of Knowledge About Provisions That Were in the ACA– 2012 Data
Policy
% Thinking policy is in law with high
certainty
% Thinking policy is in law regardless of
certainty Children under 26 can be included in parents’ insurance 52.2% 80.1% Large companies have to provide health insurance to employees 38.7% 80.1% U.S. citizens without health insurance have to pay fine if they don’t have specific reasons 36.3% 69.4% Insurance companies have to sell health insurance to people with preexisting conditions 32.6% 72.2% Insurance companies have to continue insurance as long as no rules are broken 28.8% 77.1%
Make insurance for sale for any American 28.7% 69.2% Prevent limiting amount paid for person’s health care costs 23.5% 60.5% Discounts on prescriptions to seniors with high drug costs 20.0% 68.4% Federal tax credits for small companies that buy insurance for their employees 17.5% 66.8% Subsidize health insurance for U.S. citizens with low income 16.8% 51.4%
New fees for health insurance companies 11.1% 44.3%
New fees for companies that make drugs 10.2% 37.0%
Asimilarportraitemergedwithregardtothe6provisionsweaskedaboutthatwerenotactuallyintheACA.Majoritiesgavecorrectanswerstothequizquestionsforallbutoneoftheseprovisions
9
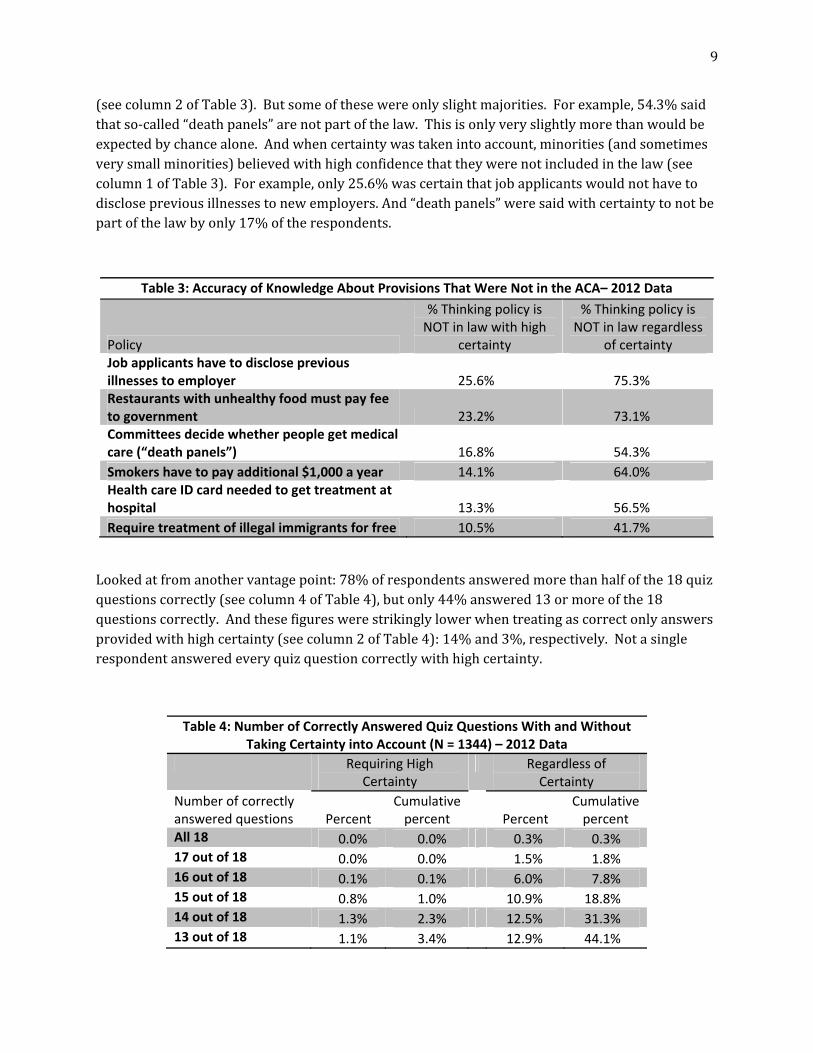
(seecolumn2ofTable3).Butsomeofthesewereonlyslightmajorities.Forexample,54.3%saidthatso‐called“deathpanels”arenotpartofthelaw.Thisisonlyveryslightlymorethanwouldbeexpectedbychancealone.Andwhencertaintywastakenintoaccount,minorities(andsometimesverysmallminorities)believedwithhighconfidencethattheywerenotincludedinthelaw(seecolumn1ofTable3).Forexample,only25.6%wascertainthatjobapplicantswouldnothavetodisclosepreviousillnessestonewemployers.And“deathpanels”weresaidwithcertaintytonotbepartofthelawbyonly17%oftherespondents.
Table 3: Accuracy of Knowledge About Provisions That Were Not in the ACA– 2012 Data
Policy
% Thinking policy is NOT in law with high
certainty
% Thinking policy is NOT in law regardless
of certainty Job applicants have to disclose previous illnesses to employer 25.6% 75.3% Restaurants with unhealthy food must pay fee to government 23.2% 73.1% Committees decide whether people get medical care (“death panels”) 16.8% 54.3%
Smokers have to pay additional $1,000 a year 14.1% 64.0% Health care ID card needed to get treatment at hospital 13.3% 56.5%
Require treatment of illegal immigrants for free 10.5% 41.7%
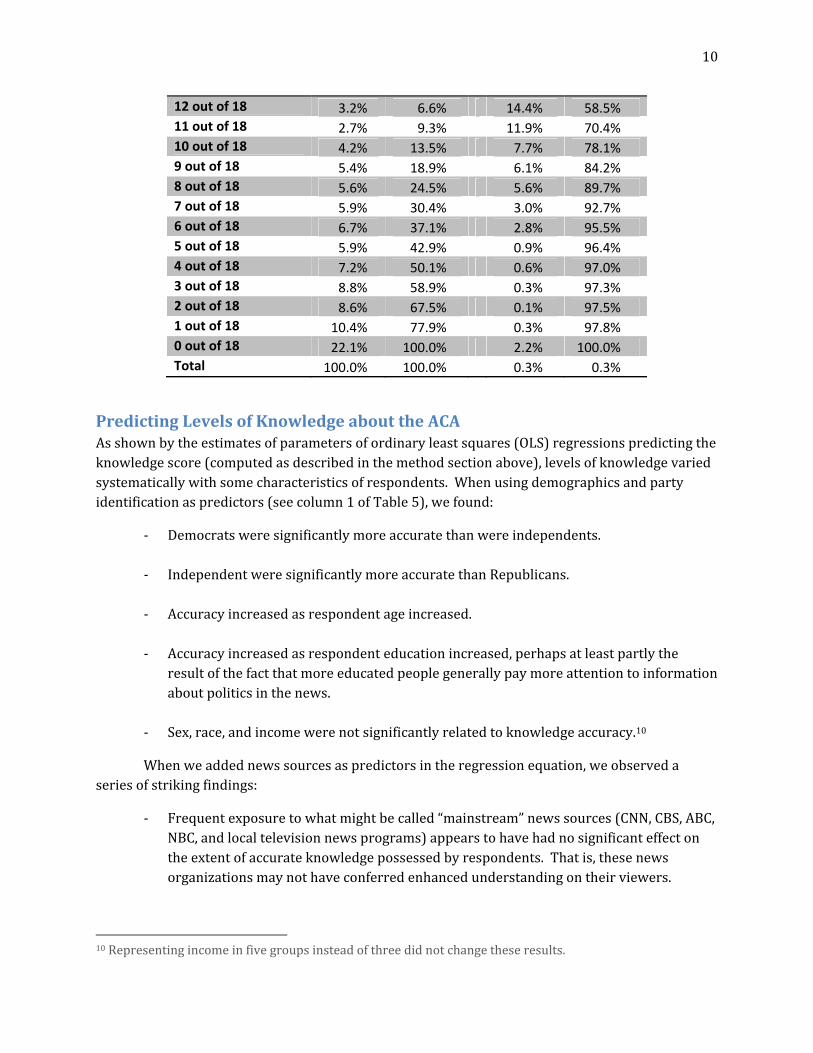
Lookedatfromanothervantagepoint:78%ofrespondentsansweredmorethanhalfofthe18quizquestionscorrectly(seecolumn4ofTable4),butonly44%answered13ormoreofthe18questionscorrectly.Andthesefigureswerestrikinglylowerwhentreatingascorrectonlyanswersprovidedwithhighcertainty(seecolumn2ofTable4):14%and3%,respectively.Notasinglerespondentansweredeveryquizquestioncorrectlywithhighcertainty.
Table 4: Number of Correctly Answered Quiz Questions With and Without Taking Certainty into Account (N = 1344) – 2012 Data
Requiring High Certainty
Regardless of Certainty
Number of correctly answered questions Percent
Cumulative percent Percent
Cumulative percent
All 18 0.0% 0.0% 0.3% 0.3% 17 out of 18 0.0% 0.0% 1.5% 1.8% 16 out of 18 0.1% 0.1% 6.0% 7.8% 15 out of 18 0.8% 1.0% 10.9% 18.8% 14 out of 18 1.3% 2.3% 12.5% 31.3% 13 out of 18 1.1% 3.4% 12.9% 44.1%
10
12 out of 18 3.2% 6.6% 14.4% 58.5% 11 out of 18 2.7% 9.3% 11.9% 70.4% 10 out of 18 4.2% 13.5% 7.7% 78.1% 9 out of 18 5.4% 18.9% 6.1% 84.2% 8 out of 18 5.6% 24.5% 5.6% 89.7% 7 out of 18 5.9% 30.4% 3.0% 92.7% 6 out of 18 6.7% 37.1% 2.8% 95.5% 5 out of 18 5.9% 42.9% 0.9% 96.4% 4 out of 18 7.2% 50.1% 0.6% 97.0% 3 out of 18 8.8% 58.9% 0.3% 97.3% 2 out of 18 8.6% 67.5% 0.1% 97.5% 1 out of 18 10.4% 77.9% 0.3% 97.8% 0 out of 18 22.1% 100.0% 2.2% 100.0% Total 100.0% 100.0% 0.3% 0.3%
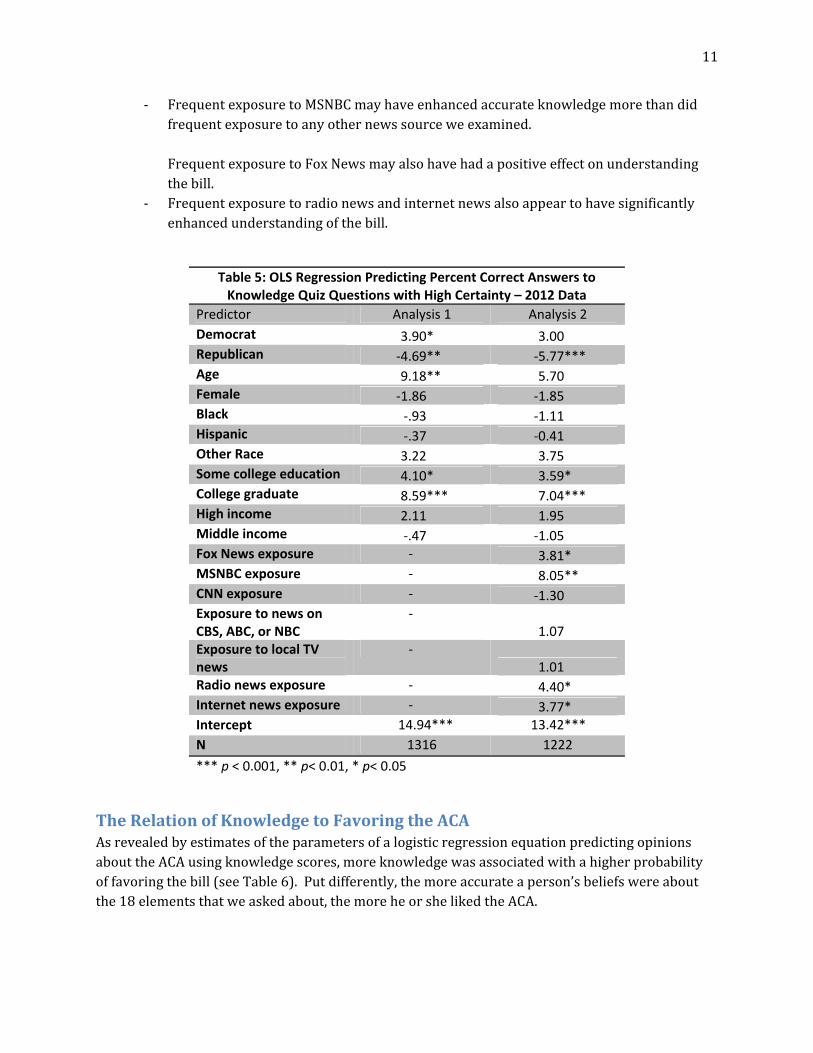
PredictingLevelsofKnowledgeabouttheACAAsshownbytheestimatesofparametersofordinaryleastsquares(OLS)regressionspredictingtheknowledgescore(computedasdescribedinthemethodsectionabove),levelsofknowledgevariedsystematicallywithsomecharacteristicsofrespondents.Whenusingdemographicsandpartyidentificationaspredictors(seecolumn1ofTable5),wefound:
‐ Democratsweresignificantlymoreaccuratethanwereindependents.
‐ IndependentweresignificantlymoreaccuratethanRepublicans.‐ Accuracyincreasedasrespondentageincreased.‐ Accuracyincreasedasrespondenteducationincreased,perhapsatleastpartlythe
resultofthefactthatmoreeducatedpeoplegenerallypaymoreattentiontoinformationaboutpoliticsinthenews.
‐ Sex,race,andincomewerenotsignificantlyrelatedtoknowledgeaccuracy.10
Whenweaddednewssourcesaspredictorsintheregressionequation,weobservedaseriesofstrikingfindings:
‐ Frequentexposuretowhatmightbecalled“mainstream”newssources(CNN,CBS,ABC,NBC,andlocaltelevisionnewsprograms)appearstohavehadnosignificanteffectontheextentofaccurateknowledgepossessedbyrespondents.Thatis,thesenewsorganizationsmaynothaveconferredenhancedunderstandingontheirviewers.
10Representingincomeinfivegroupsinsteadofthreedidnotchangetheseresults.
11
‐ FrequentexposuretoMSNBCmayhaveenhancedaccurateknowledgemorethandidfrequentexposuretoanyothernewssourceweexamined.
FrequentexposuretoFoxNewsmayalsohavehadapositiveeffectonunderstandingthebill.
‐ Frequentexposuretoradionewsandinternetnewsalsoappeartohavesignificantlyenhancedunderstandingofthebill.
Table 5: OLS Regression Predicting Percent Correct Answers to Knowledge Quiz Questions with High Certainty – 2012 Data
Predictor Analysis 1 Analysis 2
Democrat 3.90* 3.00 Republican ‐4.69** ‐5.77*** Age 9.18** 5.70 Female ‐1.86 ‐1.85 Black ‐.93 ‐1.11 Hispanic ‐.37 ‐0.41 Other Race 3.22 3.75 Some college education 4.10* 3.59* College graduate 8.59*** 7.04*** High income 2.11 1.95 Middle income ‐.47 ‐1.05 Fox News exposure ‐ 3.81* MSNBC exposure ‐ 8.05** CNN exposure ‐ ‐1.30 Exposure to news on CBS, ABC, or NBC
‐ 1.07
Exposure to local TV news
‐ 1.01
Radio news exposure ‐ 4.40* Internet news exposure ‐ 3.77* Intercept 14.94*** 13.42***
N 1316 1222
*** p < 0.001, ** p< 0.01, * p< 0.05
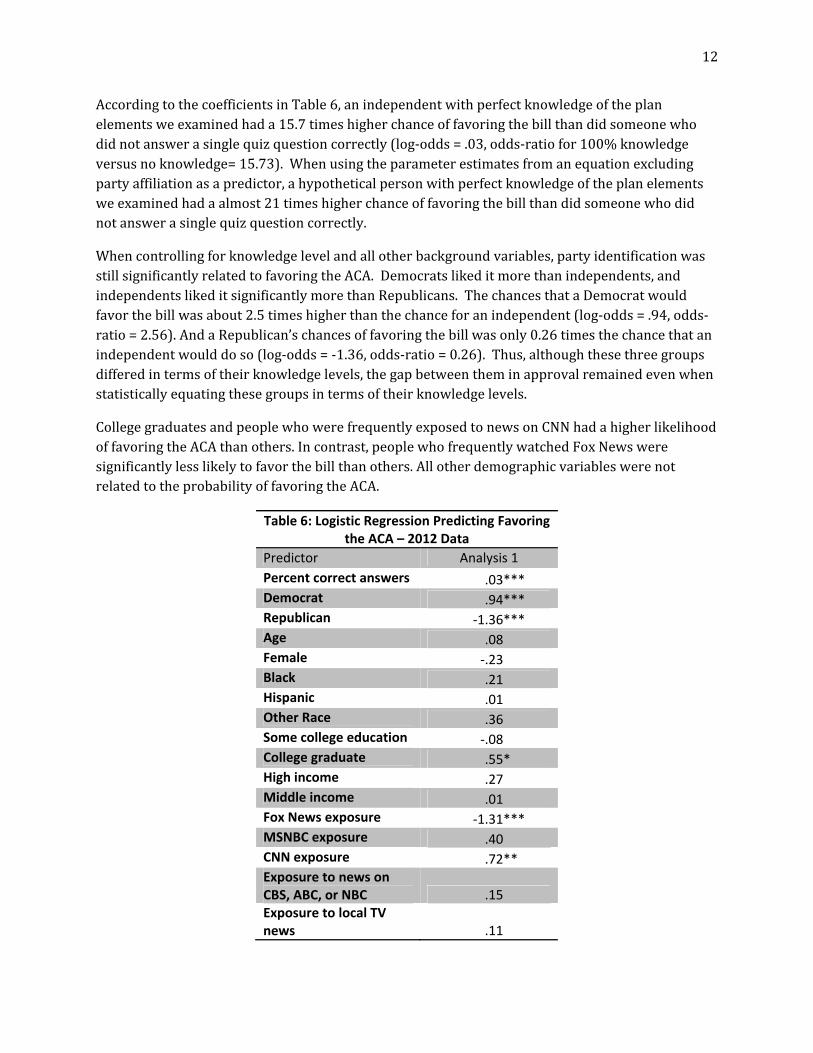
TheRelationofKnowledgetoFavoringtheACAAsrevealedbyestimatesoftheparametersofalogisticregressionequationpredictingopinionsabouttheACAusingknowledgescores,moreknowledgewasassociatedwithahigherprobabilityoffavoringthebill(seeTable6).Putdifferently,themoreaccurateaperson’sbeliefswereaboutthe18elementsthatweaskedabout,themoreheorshelikedtheACA.
12
AccordingtothecoefficientsinTable6,anindependentwithperfectknowledgeoftheplanelementsweexaminedhada15.7timeshigherchanceoffavoringthebillthandidsomeonewhodidnotanswerasinglequizquestioncorrectly(log‐odds=.03,odds‐ratiofor100%knowledgeversusnoknowledge=15.73).Whenusingtheparameterestimatesfromanequationexcludingpartyaffiliationasapredictor,ahypotheticalpersonwithperfectknowledgeoftheplanelementsweexaminedhadaalmost21timeshigherchanceoffavoringthebillthandidsomeonewhodidnotanswerasinglequizquestioncorrectly.
Whencontrollingforknowledgelevelandallotherbackgroundvariables,partyidentificationwasstillsignificantlyrelatedtofavoringtheACA.Democratslikeditmorethanindependents,andindependentslikeditsignificantlymorethanRepublicans.ThechancesthataDemocratwouldfavorthebillwasabout2.5timeshigherthanthechanceforanindependent(log‐odds=.94,odds‐ratio=2.56).AndaRepublican’schancesoffavoringthebillwasonly0.26timesthechancethatanindependentwoulddoso(log‐odds=‐1.36,odds‐ratio=0.26).Thus,althoughthesethreegroupsdifferedintermsoftheirknowledgelevels,thegapbetweentheminapprovalremainedevenwhenstatisticallyequatingthesegroupsintermsoftheirknowledgelevels.
CollegegraduatesandpeoplewhowerefrequentlyexposedtonewsonCNNhadahigherlikelihoodoffavoringtheACAthanothers.Incontrast,peoplewhofrequentlywatchedFoxNewsweresignificantlylesslikelytofavorthebillthanothers.AllotherdemographicvariableswerenotrelatedtotheprobabilityoffavoringtheACA.
Table 6: Logistic Regression Predicting Favoring the ACA – 2012 Data
Predictor Analysis 1
Percent correct answers .03*** Democrat .94*** Republican ‐1.36*** Age .08 Female ‐.23 Black .21 Hispanic .01 Other Race .36 Some college education ‐.08 College graduate .55* High income .27 Middle income .01 Fox News exposure ‐1.31*** MSNBC exposure .40 CNN exposure .72** Exposure to news on CBS, ABC, or NBC .15 Exposure to local TV news .11
13
Radio news exposure ‐.10 Internet news exposure .28 Intercept ‐1.95***
N 1316
*** p < 0.001, ** p< 0.01, * p< 0.05
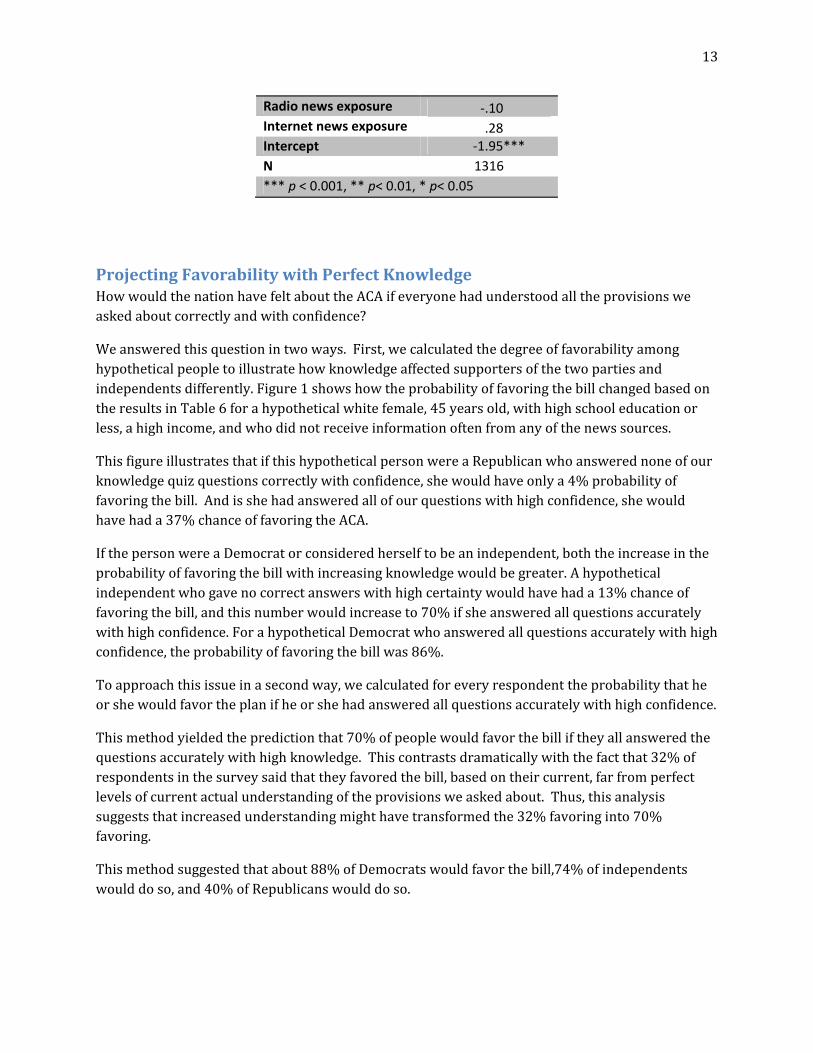
ProjectingFavorabilitywithPerfectKnowledgeHowwouldthenationhavefeltabouttheACAifeveryonehadunderstoodalltheprovisionsweaskedaboutcorrectlyandwithconfidence?
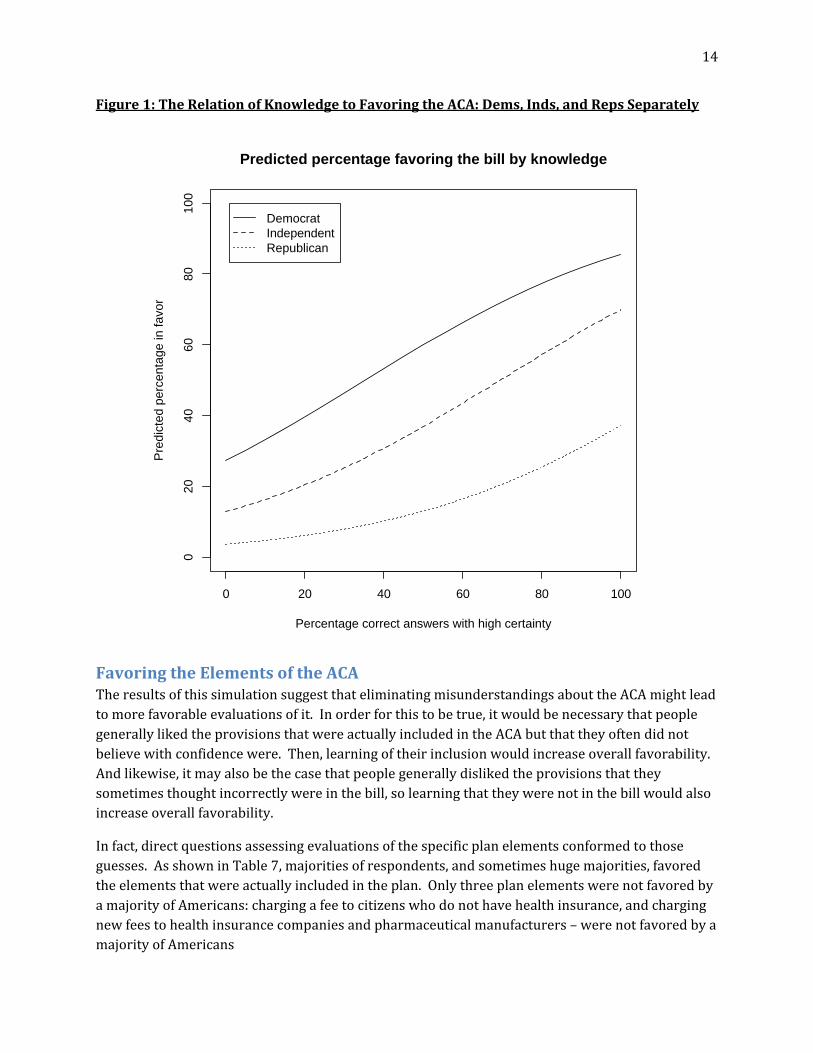
Weansweredthisquestionintwoways.First,wecalculatedthedegreeoffavorabilityamonghypotheticalpeopletoillustratehowknowledgeaffectedsupportersofthetwopartiesandindependentsdifferently.Figure1showshowtheprobabilityoffavoringthebillchangedbasedontheresultsinTable6forahypotheticalwhitefemale,45yearsold,withhighschooleducationorless,ahighincome,andwhodidnotreceiveinformationoftenfromanyofthenewssources.
ThisfigureillustratesthatifthishypotheticalpersonwereaRepublicanwhoanswerednoneofourknowledgequizquestionscorrectlywithconfidence,shewouldhaveonlya4%probabilityoffavoringthebill.Andisshehadansweredallofourquestionswithhighconfidence,shewouldhavehada37%chanceoffavoringtheACA.
IfthepersonwereaDemocratorconsideredherselftobeanindependent,boththeincreaseintheprobabilityoffavoringthebillwithincreasingknowledgewouldbegreater.Ahypotheticalindependentwhogavenocorrectanswerswithhighcertaintywouldhavehada13%chanceoffavoringthebill,andthisnumberwouldincreaseto70%ifsheansweredallquestionsaccuratelywithhighconfidence.ForahypotheticalDemocratwhoansweredallquestionsaccuratelywithhighconfidence,theprobabilityoffavoringthebillwas86%.
Toapproachthisissueinasecondway,wecalculatedforeveryrespondenttheprobabilitythatheorshewouldfavortheplanifheorshehadansweredallquestionsaccuratelywithhighconfidence.
Thismethodyieldedthepredictionthat70%ofpeoplewouldfavorthebilliftheyallansweredthequestionsaccuratelywithhighknowledge.Thiscontrastsdramaticallywiththefactthat32%ofrespondentsinthesurveysaidthattheyfavoredthebill,basedontheircurrent,farfromperfectlevelsofcurrentactualunderstandingoftheprovisionsweaskedabout.Thus,thisanalysissuggeststhatincreasedunderstandingmighthavetransformedthe32%favoringinto70%favoring.
Thismethodsuggestedthatabout88%ofDemocratswouldfavorthebill,74%ofindependentswoulddoso,and40%ofRepublicanswoulddoso.
14
Figure1:TheRelationofKnowledgetoFavoringtheACA:Dems,Inds,andRepsSeparately
FavoringtheElementsoftheACATheresultsofthissimulationsuggestthateliminatingmisunderstandingsabouttheACAmightleadtomorefavorableevaluationsofit.Inorderforthistobetrue,itwouldbenecessarythatpeoplegenerallylikedtheprovisionsthatwereactuallyincludedintheACAbutthattheyoftendidnotbelievewithconfidencewere.Then,learningoftheirinclusionwouldincreaseoverallfavorability.Andlikewise,itmayalsobethecasethatpeoplegenerallydislikedtheprovisionsthattheysometimesthoughtincorrectlywereinthebill,solearningthattheywerenotinthebillwouldalsoincreaseoverallfavorability.
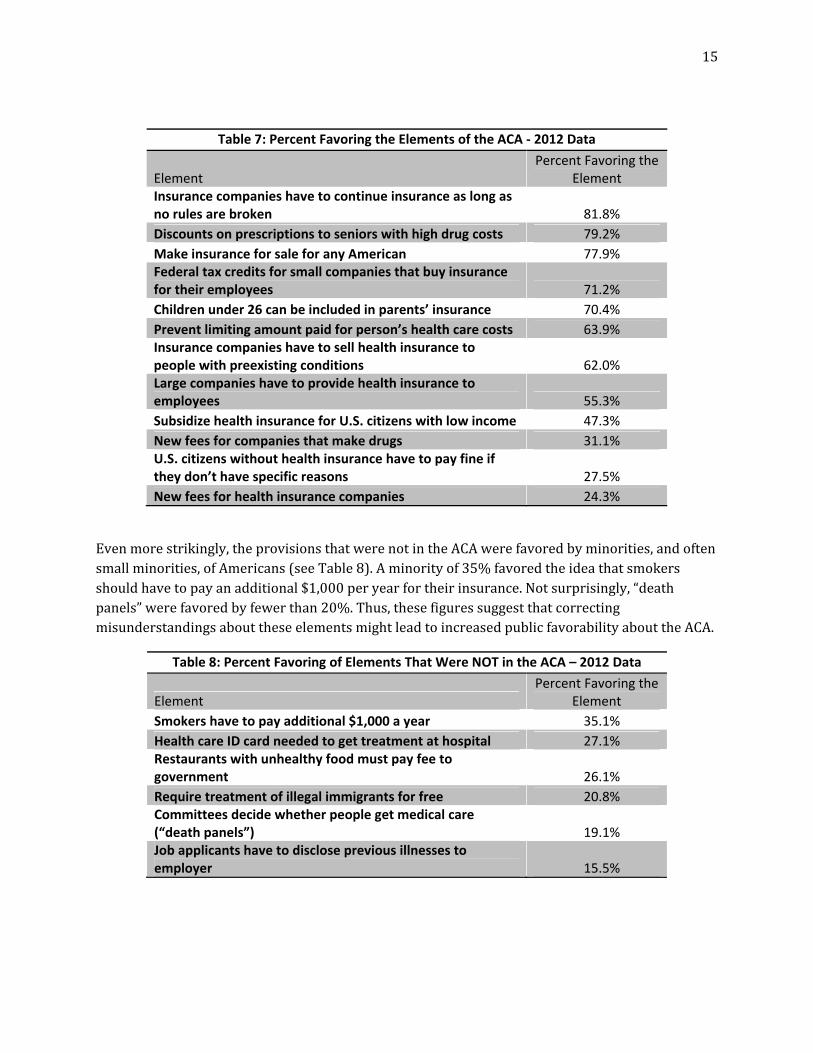
Infact,directquestionsassessingevaluationsofthespecificplanelementsconformedtothoseguesses.AsshowninTable7,majoritiesofrespondents,andsometimeshugemajorities,favoredtheelementsthatwereactuallyincludedintheplan.OnlythreeplanelementswerenotfavoredbyamajorityofAmericans:chargingafeetocitizenswhodonothavehealthinsurance,andchargingnewfeestohealthinsurancecompaniesandpharmaceuticalmanufacturers–werenotfavoredbyamajorityofAmericans
0 20 40 60 80 100
020
4060
8010
0
Predicted percentage favoring the bill by knowledge
Percentage correct answers with high certainty
Pre
dict
ed p
erce
ntag
e in
favo
r
DemocratIndependentRepublican
15
Table 7: Percent Favoring the Elements of the ACA ‐ 2012 Data
Element Percent Favoring the
Element Insurance companies have to continue insurance as long as no rules are broken 81.8%
Discounts on prescriptions to seniors with high drug costs 79.2%
Make insurance for sale for any American 77.9% Federal tax credits for small companies that buy insurance for their employees 71.2%
Children under 26 can be included in parents’ insurance 70.4%
Prevent limiting amount paid for person’s health care costs 63.9% Insurance companies have to sell health insurance to people with preexisting conditions 62.0% Large companies have to provide health insurance to employees 55.3%
Subsidize health insurance for U.S. citizens with low income 47.3%
New fees for companies that make drugs 31.1% U.S. citizens without health insurance have to pay fine if they don’t have specific reasons 27.5%
New fees for health insurance companies 24.3%
Evenmorestrikingly,theprovisionsthatwerenotintheACAwerefavoredbyminorities,andoftensmallminorities,ofAmericans(seeTable8).Aminorityof35%favoredtheideathatsmokersshouldhavetopayanadditional$1,000peryearfortheirinsurance.Notsurprisingly,“deathpanels”werefavoredbyfewerthan20%.Thus,thesefiguressuggestthatcorrectingmisunderstandingsabouttheseelementsmightleadtoincreasedpublicfavorabilityabouttheACA.
Table 8: Percent Favoring of Elements That Were NOT in the ACA – 2012 Data
Element Percent Favoring the
Element
Smokers have to pay additional $1,000 a year 35.1%
Health care ID card needed to get treatment at hospital 27.1% Restaurants with unhealthy food must pay fee to government 26.1%
Require treatment of illegal immigrants for free 20.8% Committees decide whether people get medical care (“death panels”) 19.1% Job applicants have to disclose previous illnesses to employer 15.5%
16
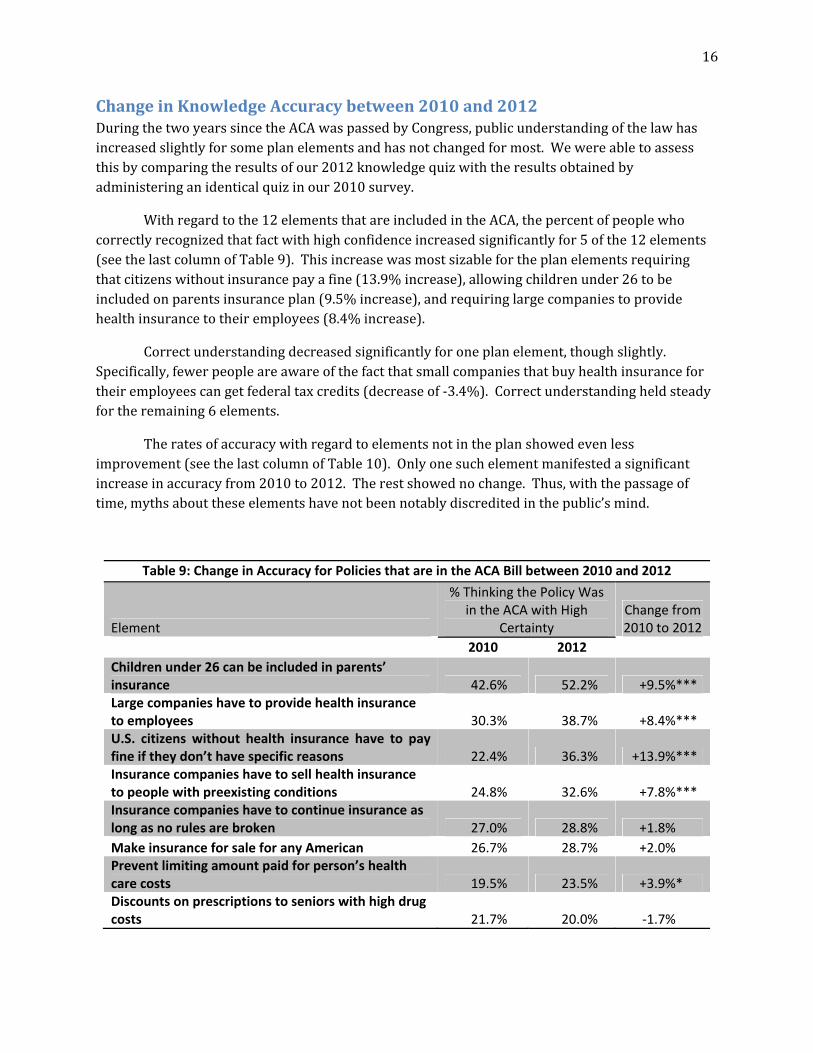
ChangeinKnowledgeAccuracybetween2010and2012DuringthetwoyearssincetheACAwaspassedbyCongress,publicunderstandingofthelawhasincreasedslightlyforsomeplanelementsandhasnotchangedformost.Wewereabletoassessthisbycomparingtheresultsofour2012knowledgequizwiththeresultsobtainedbyadministeringanidenticalquizinour2010survey.
Withregardtothe12elementsthatareincludedintheACA,thepercentofpeoplewhocorrectlyrecognizedthatfactwithhighconfidenceincreasedsignificantlyfor5ofthe12elements(seethelastcolumnofTable9).Thisincreasewasmostsizablefortheplanelementsrequiringthatcitizenswithoutinsurancepayafine(13.9%increase),allowingchildrenunder26tobeincludedonparentsinsuranceplan(9.5%increase),andrequiringlargecompaniestoprovidehealthinsurancetotheiremployees(8.4%increase).
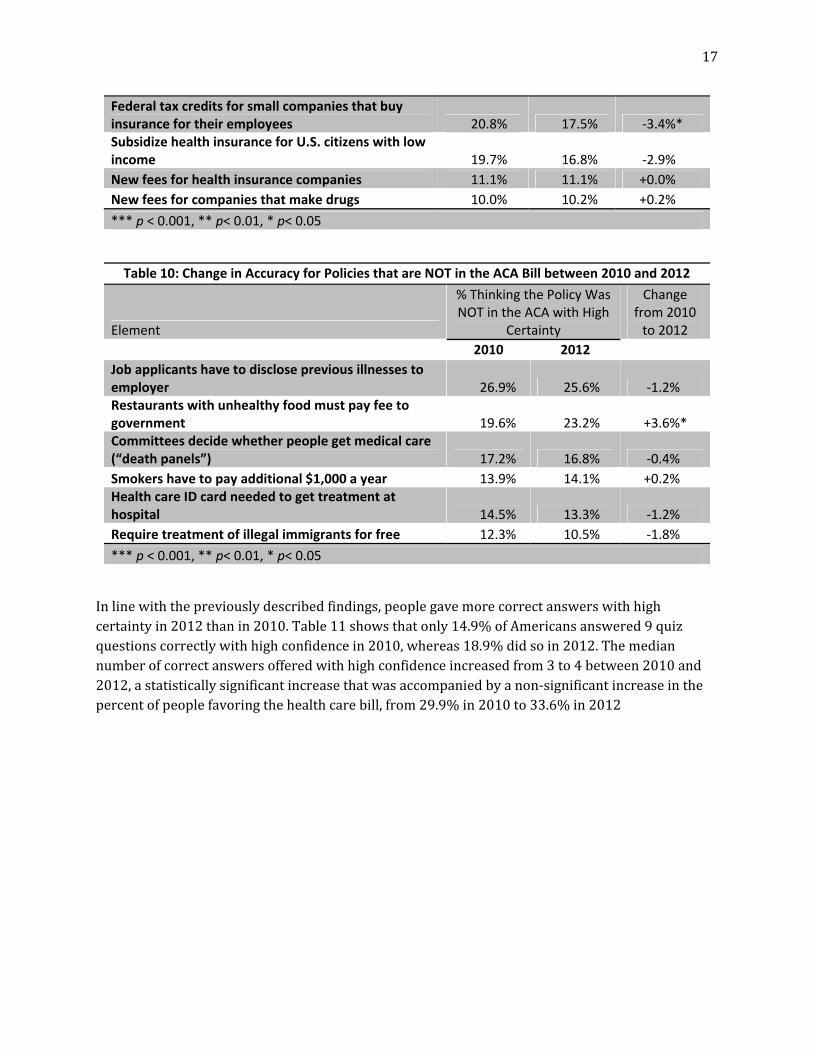
Correctunderstandingdecreasedsignificantlyforoneplanelement,thoughslightly.Specifically,fewerpeopleareawareofthefactthatsmallcompaniesthatbuyhealthinsurancefortheiremployeescangetfederaltaxcredits(decreaseof‐3.4%).Correctunderstandingheldsteadyfortheremaining6elements.
Theratesofaccuracywithregardtoelementsnotintheplanshowedevenlessimprovement(seethelastcolumnofTable10).Onlyonesuchelementmanifestedasignificantincreaseinaccuracyfrom2010to2012.Therestshowednochange.Thus,withthepassageoftime,mythsabouttheseelementshavenotbeennotablydiscreditedinthepublic’smind.
Table 9: Change in Accuracy for Policies that are in the ACA Bill between 2010 and 2012
Element
% Thinking the Policy Was in the ACA with High
Certainty Change from 2010 to 2012
2010 2012
Children under 26 can be included in parents’ insurance 42.6% 52.2% +9.5%*** Large companies have to provide health insurance to employees 30.3% 38.7% +8.4%*** U.S. citizens without health insurance have to pay fine if they don’t have specific reasons 22.4% 36.3% +13.9%*** Insurance companies have to sell health insurance to people with preexisting conditions 24.8% 32.6% +7.8%*** Insurance companies have to continue insurance as long as no rules are broken 27.0% 28.8% +1.8%
Make insurance for sale for any American 26.7% 28.7% +2.0% Prevent limiting amount paid for person’s health care costs 19.5% 23.5% +3.9%* Discounts on prescriptions to seniors with high drug costs 21.7% 20.0% ‐1.7%
17
Federal tax credits for small companies that buy insurance for their employees 20.8% 17.5% ‐3.4%* Subsidize health insurance for U.S. citizens with low income 19.7% 16.8% ‐2.9%
New fees for health insurance companies 11.1% 11.1% +0.0%
New fees for companies that make drugs 10.0% 10.2% +0.2%
*** p < 0.001, ** p< 0.01, * p< 0.05
Table 10: Change in Accuracy for Policies that are NOT in the ACA Bill between 2010 and 2012
Element
% Thinking the Policy Was NOT in the ACA with High
Certainty
Change from 2010 to 2012
2010 2012
Job applicants have to disclose previous illnesses to employer 26.9% 25.6% ‐1.2% Restaurants with unhealthy food must pay fee to government 19.6% 23.2% +3.6%* Committees decide whether people get medical care (“death panels”) 17.2% 16.8% ‐0.4%
Smokers have to pay additional $1,000 a year 13.9% 14.1% +0.2% Health care ID card needed to get treatment at hospital 14.5% 13.3% ‐1.2%
Require treatment of illegal immigrants for free 12.3% 10.5% ‐1.8%
*** p < 0.001, ** p< 0.01, * p< 0.05
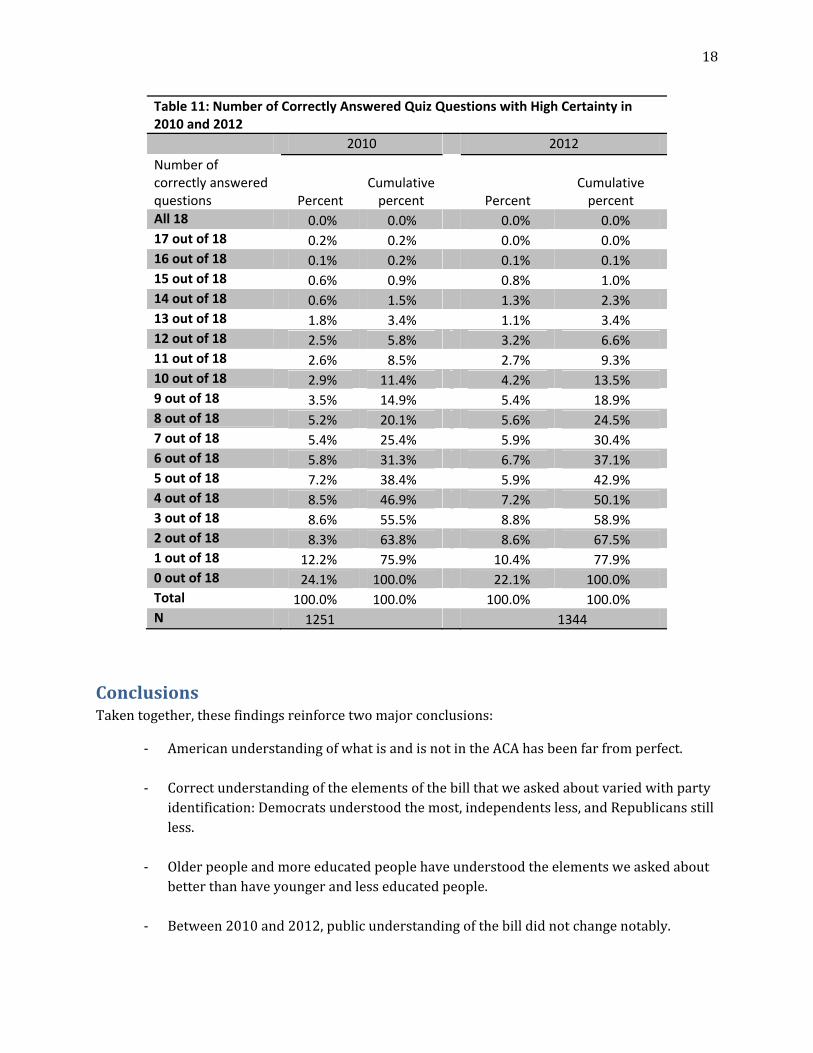
Inlinewiththepreviouslydescribedfindings,peoplegavemorecorrectanswerswithhighcertaintyin2012thanin2010.Table11showsthatonly14.9%ofAmericansanswered9quizquestionscorrectlywithhighconfidencein2010,whereas18.9%didsoin2012.Themediannumberofcorrectanswersofferedwithhighconfidenceincreasedfrom3to4between2010and2012,astatisticallysignificantincreasethatwasaccompaniedbyanon‐significantincreaseinthepercentofpeoplefavoringthehealthcarebill,from29.9%in2010to33.6%in2012
18
Table 11: Number of Correctly Answered Quiz Questions with High Certainty in 2010 and 2012
2010 2012
Number of correctly answered questions Percent
Cumulative percent Percent
Cumulative percent
All 18 0.0% 0.0% 0.0% 0.0% 17 out of 18 0.2% 0.2% 0.0% 0.0% 16 out of 18 0.1% 0.2% 0.1% 0.1% 15 out of 18 0.6% 0.9% 0.8% 1.0% 14 out of 18 0.6% 1.5% 1.3% 2.3% 13 out of 18 1.8% 3.4% 1.1% 3.4% 12 out of 18 2.5% 5.8% 3.2% 6.6% 11 out of 18 2.6% 8.5% 2.7% 9.3% 10 out of 18 2.9% 11.4% 4.2% 13.5% 9 out of 18 3.5% 14.9% 5.4% 18.9% 8 out of 18 5.2% 20.1% 5.6% 24.5% 7 out of 18 5.4% 25.4% 5.9% 30.4% 6 out of 18 5.8% 31.3% 6.7% 37.1% 5 out of 18 7.2% 38.4% 5.9% 42.9% 4 out of 18 8.5% 46.9% 7.2% 50.1% 3 out of 18 8.6% 55.5% 8.8% 58.9% 2 out of 18 8.3% 63.8% 8.6% 67.5% 1 out of 18 12.2% 75.9% 10.4% 77.9% 0 out of 18 24.1% 100.0% 22.1% 100.0% Total 100.0% 100.0% 100.0% 100.0% N 1251 1344
ConclusionsTakentogether,thesefindingsreinforcetwomajorconclusions:
‐ AmericanunderstandingofwhatisandisnotintheACAhasbeenfarfromperfect.
‐ Correctunderstandingoftheelementsofthebillthatweaskedaboutvariedwithpartyidentification:Democratsunderstoodthemost,independentsless,andRepublicansstillless.
‐ Olderpeopleandmoreeducatedpeoplehaveunderstoodtheelementsweaskedaboutbetterthanhaveyoungerandlesseducatedpeople.
‐ Between2010and2012,publicunderstandingofthebilldidnotchangenotably.
19
‐ MostpeoplehavefavoredmostoftheelementsoftheACAthatweexamined,butnoteveryonerecognizedthattheseelementswereallintheplan.
‐ MostpeopleopposedtheelementsweaskedaboutthatwerenotintheACA,butsome
peoplethoughttheseelementswereintheplan.‐ Ifthepublichadperfectunderstandingoftheelementsthatweexamined,the
proportionofAmericanswhofavorthebillmightincreasefromthecurrentlevelof32%to70%.
Takentogether,allthissuggeststhatifeducationeffortsweretocorrectpublicmisunderstandingofthebill,publicevaluationsmightincreaseconsiderablyinfavorability.
20
ReferencesAnand,S.,&Krosnick,J.A.(2003).Theimpactofattitudestowardforeignpolicygoalsonpublic
preferencesamongpresidentialcandidates:Astudyofissuepublicsandtheattentivepublicinthe2000U.S.Presidentialelection.PresidentialStudiesQuarterly,33,31‐71.
Krosnick,J.A.(1988).Theroleofattitudeimportanceinsocialevaluation:Astudyofpolicy
preferences,presidentialcandidateevaluations,andvotingbehavior.JournalofPersonalityandSocialPsychology,55,196‐210.
Krosnick,J.A.(2002).Thecausesofno‐opinionresponsestoattitudemeasuresinsurveys:Theyarerarelywhattheyappeartobe.InR.M.Groves,D.A.Dillman,J.L.Eltinge,&R.J.A.Little(Eds.),Surveynonresponse.NewYork:Wiley.
Petty,R.E.,&Krosnick,J.A.(Eds.).(1995).Attitudestrength:Antecedentsandconsequences.
Hillsdale,NJ:Erlbaum.
21
AppendixA:QuestionWordingsofKnowledgeQuestions
Respondentswereshownthefollowingtextononescreen:
We’dliketofindoutpeople’simpressionsaboutthelawthattheU.S.CongresspassedbackinMarch2010tochangetheU.S.healthcaresysteminmanyways.
We’dliketofindoutpeople’simpressionsaboutwhatthatlawsayswillhappen.
BeforethelawwaspassedbytheCongress,therewasalotoftalkinthenewsaboutthingsthattheplanmightormightnotdo.
Next,youwillreadalistofthesethings,oneatatime.
Mostthethingsyou’llreadweretalkedaboutaspossiblybeinginthelaw.
Butonlysomeofthethingsyou’llreadareactuallyinthelawthattheCongresspassedinMarch2010.
We’dliketolearnyourbestguessesaboutwhichofthesethingsareinthelawandwhicharenot.
Wewillalsoaskyouhowsureyouarethateachansweryougiveiscorrect.
It’sfineifyouaresureofananswerorifyouarenotsureofananswer.Wejustwanttofindoutyourbestguesses.
WewanttoknowwhatpeoplethinkwithoutaskingsomeoneelsefortheanswersandwithoutlookinguptheanswersontheInternetorinanyotherway.Sopleasedonotdoanyofthesethings.Pleasejustgiveusyourbestguesses.
Onaseriesofscreens,respondentswereasked:
Doyouthinkthatthenewlawwillorwillnotdothefollowingafterthelawisfullyineffect?
[STATEMENTAPPEAREDHERE]
Howsureareyouaboutthat?
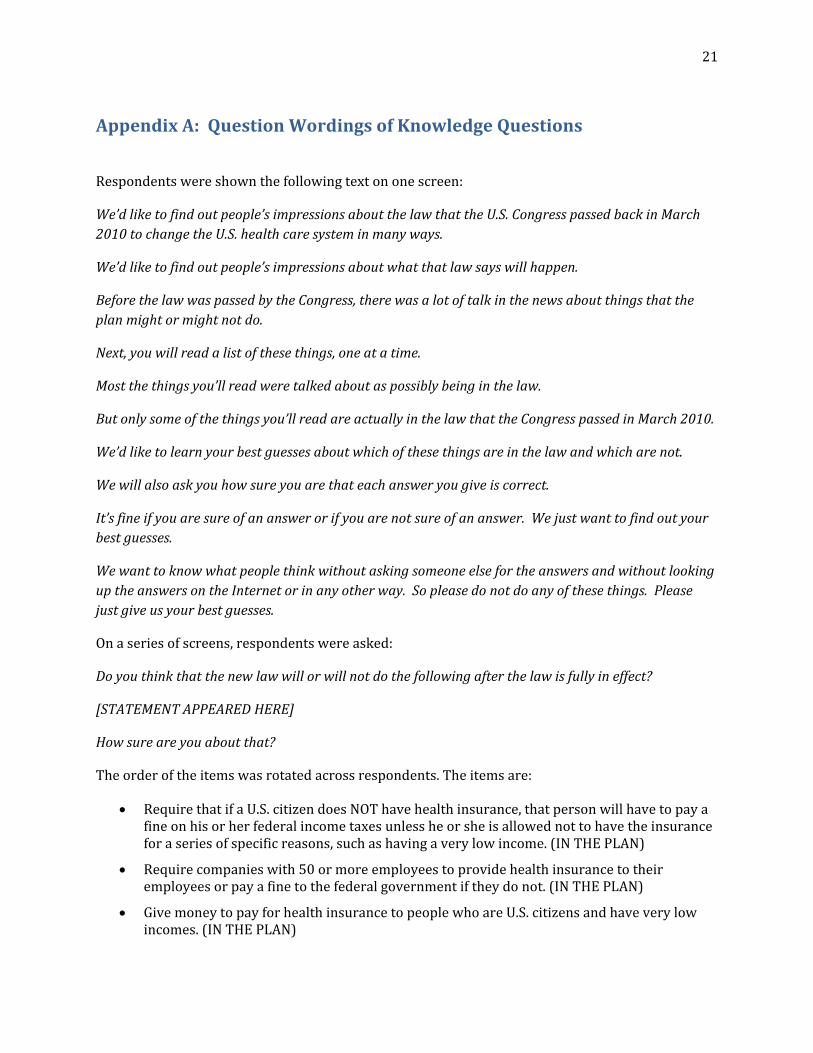
Theorderoftheitemswasrotatedacrossrespondents.Theitemsare:
RequirethatifaU.S.citizendoesNOThavehealthinsurance,thatpersonwillhavetopayafineonhisorherfederalincometaxesunlessheorsheisallowednottohavetheinsuranceforaseriesofspecificreasons,suchashavingaverylowincome.(INTHEPLAN)
Requirecompanieswith50ormoreemployeestoprovidehealthinsurancetotheiremployeesorpayafinetothefederalgovernmentiftheydonot.(INTHEPLAN)
GivemoneytopayforhealthinsurancetopeoplewhoareU.S.citizensandhaveverylowincomes.(INTHEPLAN)
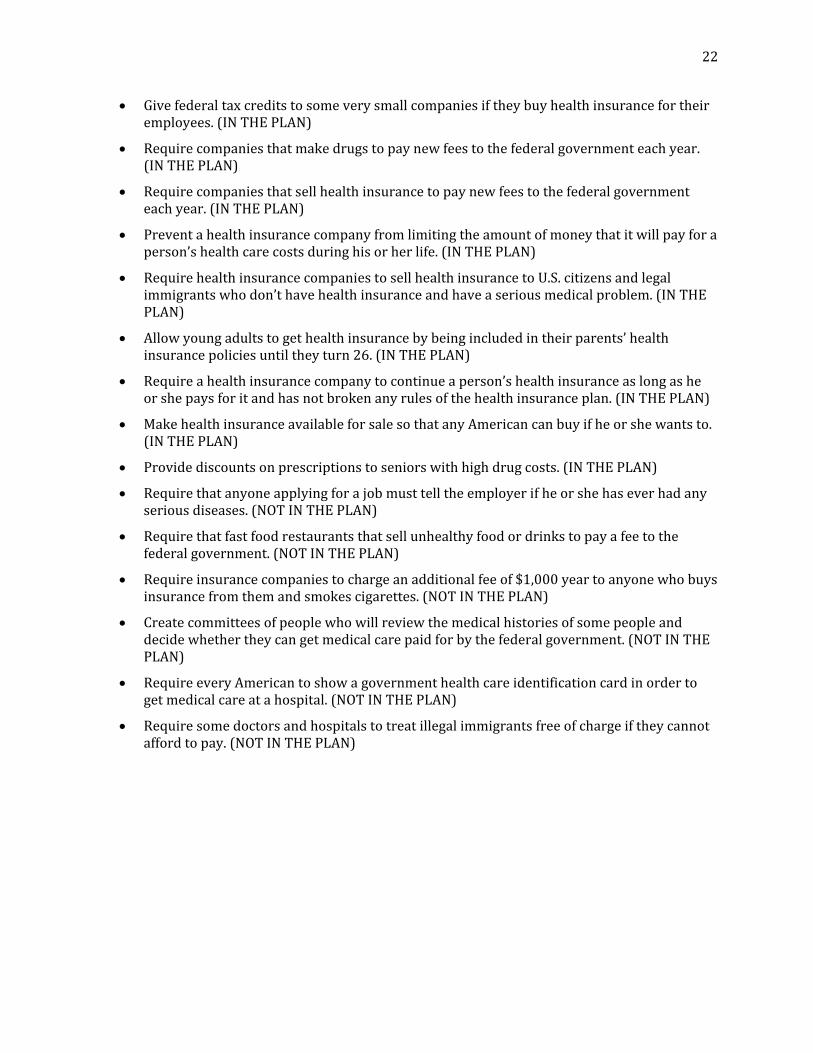
22
Givefederaltaxcreditstosomeverysmallcompaniesiftheybuyhealthinsurancefortheiremployees.(INTHEPLAN)
Requirecompaniesthatmakedrugstopaynewfeestothefederalgovernmenteachyear.(INTHEPLAN)
Requirecompaniesthatsellhealthinsurancetopaynewfeestothefederalgovernmenteachyear.(INTHEPLAN)
Preventahealthinsurancecompanyfromlimitingtheamountofmoneythatitwillpayforaperson’shealthcarecostsduringhisorherlife.(INTHEPLAN)
RequirehealthinsurancecompaniestosellhealthinsurancetoU.S.citizensandlegalimmigrantswhodon’thavehealthinsuranceandhaveaseriousmedicalproblem.(INTHEPLAN)
Allowyoungadultstogethealthinsurancebybeingincludedintheirparents’healthinsurancepoliciesuntiltheyturn26.(INTHEPLAN)
Requireahealthinsurancecompanytocontinueaperson’shealthinsuranceaslongasheorshepaysforitandhasnotbrokenanyrulesofthehealthinsuranceplan.(INTHEPLAN)
MakehealthinsuranceavailableforsalesothatanyAmericancanbuyifheorshewantsto.(INTHEPLAN)
Providediscountsonprescriptionstoseniorswithhighdrugcosts.(INTHEPLAN)
Requirethatanyoneapplyingforajobmusttelltheemployerifheorshehaseverhadanyseriousdiseases.(NOTINTHEPLAN)
Requirethatfastfoodrestaurantsthatsellunhealthyfoodordrinkstopayafeetothefederalgovernment.(NOTINTHEPLAN)
Requireinsurancecompaniestochargeanadditionalfeeof$1,000yeartoanyonewhobuysinsurancefromthemandsmokescigarettes.(NOTINTHEPLAN)
Createcommitteesofpeoplewhowillreviewthemedicalhistoriesofsomepeopleanddecidewhethertheycangetmedicalcarepaidforbythefederalgovernment.(NOTINTHEPLAN)
RequireeveryAmericantoshowagovernmenthealthcareidentificationcardinordertogetmedicalcareatahospital.(NOTINTHEPLAN)
Requiresomedoctorsandhospitalstotreatillegalimmigrantsfreeofchargeiftheycannotaffordtopay.(NOTINTHEPLAN)
23
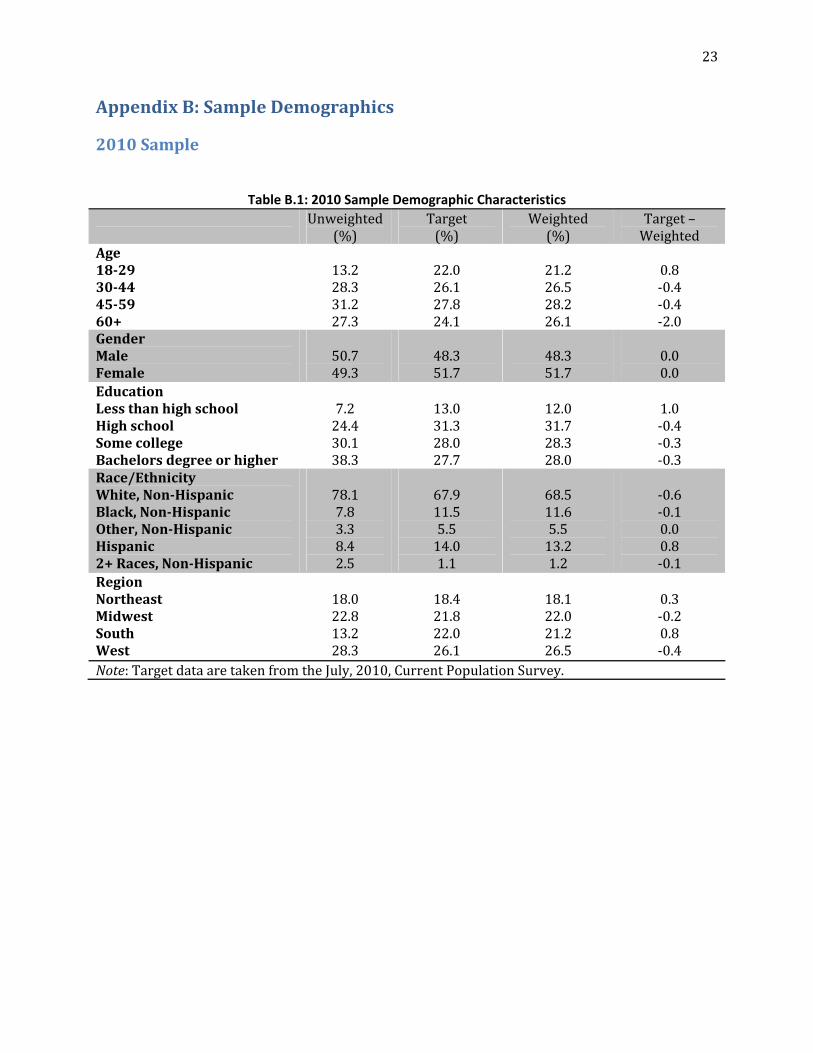
AppendixB:SampleDemographics
2010Sample
Table B.1: 2010 Sample Demographic Characteristics
Unweighted(%)
Target(%)
Weighted(%)
Target–Weighted
Age18‐2930‐4445‐5960+
13.228.331.227.3
22.026.127.824.1
21.226.528.226.1
0.8‐0.4‐0.4‐2.0
GenderMaleFemale
50.749.3
48.351.7
48.351.7
0.00.0
EducationLessthanhighschoolHighschoolSomecollegeBachelorsdegreeorhigher
7.224.430.138.3
13.031.328.027.7
12.031.728.328.0
1.0‐0.4‐0.3‐0.3
Race/EthnicityWhite,Non‐HispanicBlack,Non‐HispanicOther,Non‐HispanicHispanic2+Races,Non‐Hispanic
78.17.83.38.42.5
67.911.55.514.01.1
68.511.65.513.21.2
‐0.6‐0.10.00.8‐0.1
RegionNortheastMidwestSouthWest
18.022.813.228.3
18.421.822.026.1
18.122.021.226.5
0.3‐0.20.8‐0.4
Note:TargetdataaretakenfromtheJuly, 2010, CurrentPopulationSurvey.
24
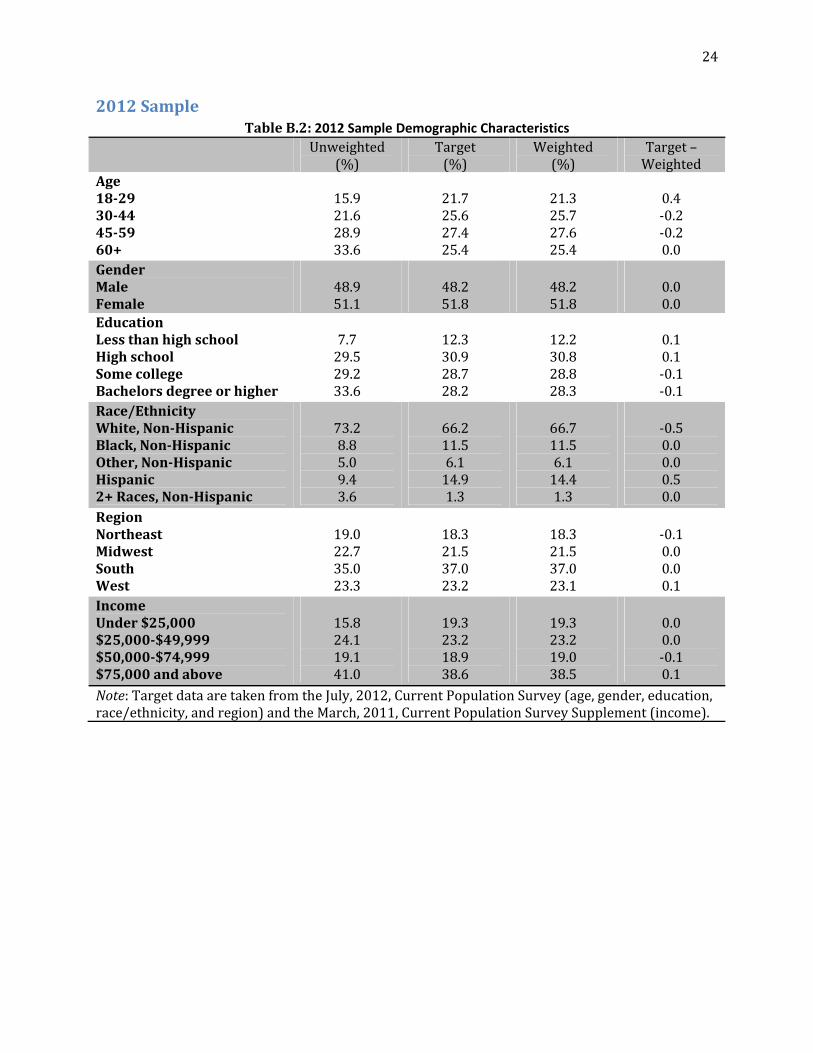
2012SampleTableB.2:2012 Sample Demographic Characteristics
Unweighted(%)
Target(%)
Weighted(%)
Target–Weighted
Age18‐2930‐4445‐5960+
15.921.628.933.6
21.725.627.425.4
21.325.727.625.4
0.4‐0.2‐0.20.0
GenderMaleFemale
48.951.1
48.251.8
48.251.8
0.00.0
EducationLessthanhighschoolHighschoolSomecollegeBachelorsdegreeorhigher
7.729.529.233.6
12.330.928.728.2
12.230.828.828.3
0.10.1‐0.1‐0.1
Race/EthnicityWhite,Non‐HispanicBlack,Non‐HispanicOther,Non‐HispanicHispanic2+Races,Non‐Hispanic
73.28.85.09.43.6
66.211.56.114.91.3
66.711.56.114.41.3
‐0.50.00.00.50.0
RegionNortheastMidwestSouthWest
19.022.735.023.3
18.321.537.023.2
18.321.537.023.1
‐0.10.00.00.1
IncomeUnder$25,000$25,000‐$49,999$50,000‐$74,999$75,000andabove
15.824.119.141.0
19.323.218.938.6
19.323.219.038.5
0.00.0‐0.10.1
Note:TargetdataaretakenfromtheJuly, 2012,CurrentPopulationSurvey (age,gender,education,race/ethnicity,andregion)andtheMarch,2011,CurrentPopulationSurveySupplement(income).
Copyright © 2022 FDOKUMEN