
AlphaScreen TruHits Kit - PerkinElmer
28
PerkinElmer Life and Analytical Sciences, Inc. USING THE ALPHASCREEN™ TRUHITS™ KIT CATALOG NUMBERS: 6760627D, 6760627M For Laboratory Use Only Research Chemicals for Research Purposes Only
-
Upload
khangminh22 -
Category
Documents
-
view
0 -
download
0
Transcript of AlphaScreen TruHits Kit - PerkinElmer

PerkinElmer Life and Analytical Sciences, Inc.
USING THE ALPHASCREEN™
TRUHITS™ KIT
CATALOG NUMBERS:
6760627D, 6760627M
For Laboratory Use Only
Research Chemicals for Research Purposes Only
2
Precautions
• AlphaScreen™ beads are light-sensitive. All assays using
the AlphaScreen™ TruHits™ kit should be performed
under subdued laboratory lighting of less than 100 lux.
Alternatively, green filters (Roscolux filters #389 from
Rosco, or the equivalent) can be applied to light fixtures.
Plates can be covered by an opaque microplate to minimize
the effect of light.
• Small volumes used in the assay may be prone to evapora-
tion. It is recommended that microplates be covered with
TopSeal-A adhesive sealing film (PerkinElmer® catalog
number # 6005185) to reduce evaporation during incuba-
tion. Microplates can be read with the TopSeal-A film in
place.
• Beads should be stored in the dark at 4°C.
3
TABLE OF CONTENTS
I. BEFORE STARTING 4
II. INTRODUCTION 7
III. SCREENING FOR SINGLET OXYGEN QUENCHERS,
COLOR QUENCHERS AND LIGHT SCATTERERS 11
IV. SCREENING FOR BIOTIN MIMETICS 16
V. CHARACTERIZING INTERFERING COMPOUNDS 18
VI. TROUBLESHOOTING GUIDE 25
4
I. BEFORE STARTING
Receiving the AlphaScreenTM TruHitsTM kit
Upon receiving the AlphaScreen TruHits kit, ensure that the kit is on
blue ice and that the ice packs are not completely melted. Verify that
all components are present in the kit using the table on the next page.
Store the kit at 4°C.
Provided Reagents and Materials
The following kit sizes are available:
• 1,000 assay points kit* (catalog number # 6760627D)
• 10,000 assay points kit* (catalog number # 6760627M)
* The number of assay points is based on an assay volume of 25 µL
using the AlphaScreen TruHits beads at the recommended
concentrations.
The reagents and materials provided in the AlphaScreen TruHits kits
are listed in the table on the next page:
5
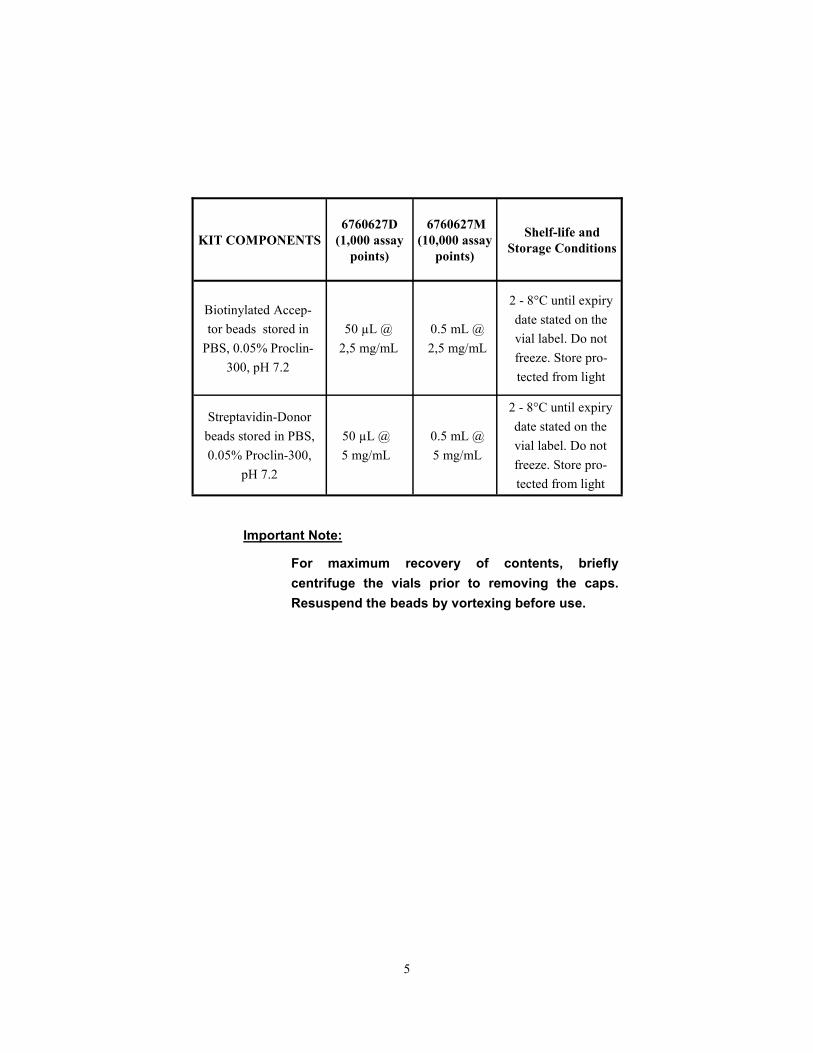
Important Note:
For maximum recovery of contents, briefly
centrifuge the vials prior to removing the caps.
Resuspend the beads by vortexing before use.
KIT COMPONENTS
6760627D
(1,000 assay
points)
6760627M
(10,000 assay
points)
Shelf-life and
Storage Conditions
Biotinylated Accep-
tor beads stored in
PBS, 0.05% Proclin-
300, pH 7.2
50 µL @
2,5 mg/mL
0.5 mL @
2,5 mg/mL
2 - 8°C until expiry
date stated on the
vial label. Do not
freeze. Store pro-
tected from light
Streptavidin-Donor
beads stored in PBS,
0.05% Proclin-300,
pH 7.2
50 µL @
5 mg/mL
0.5 mL @
5 mg/mL
2 - 8°C until expiry
date stated on the
vial label. Do not
freeze. Store pro-
tected from light
6
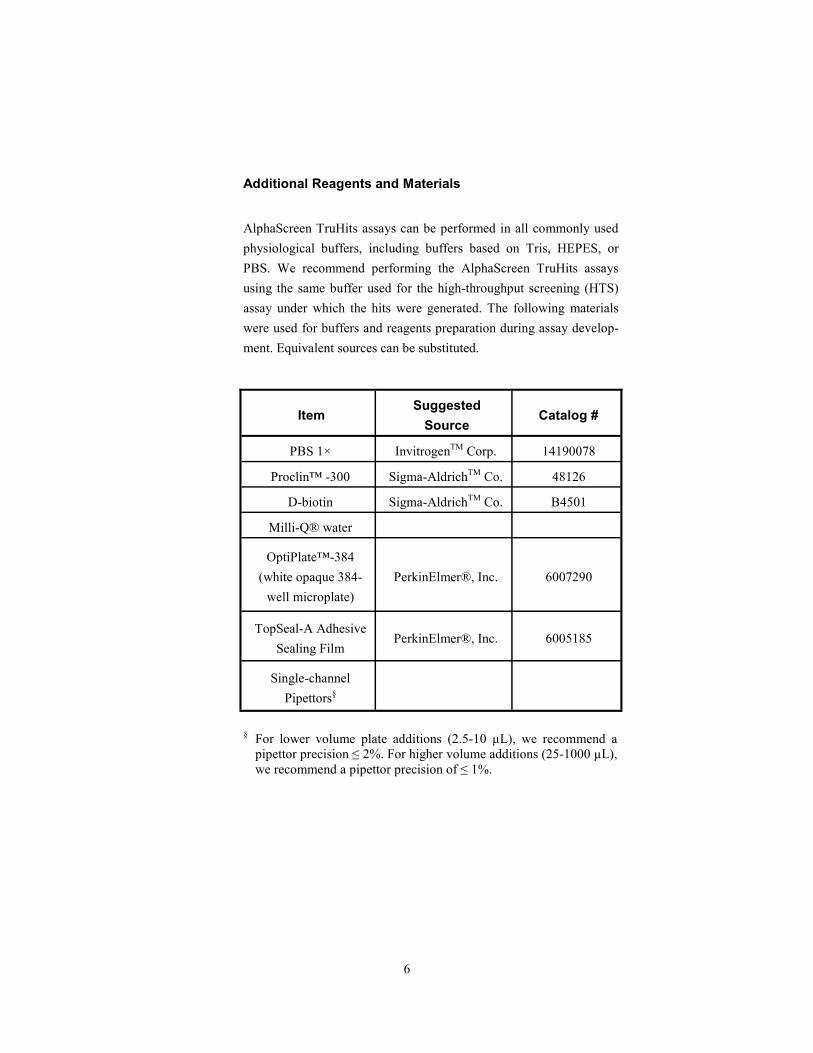
Additional Reagents and Materials
AlphaScreen TruHits assays can be performed in all commonly used
physiological buffers, including buffers based on Tris, HEPES, or
PBS. We recommend performing the AlphaScreen TruHits assays
using the same buffer used for the high-throughput screening (HTS)
assay under which the hits were generated. The following materials
were used for buffers and reagents preparation during assay develop-
ment. Equivalent sources can be substituted.
§ For lower volume plate additions (2.5-10 µL), we recommend a
pipettor precision ≤ 2%. For higher volume additions (25-1000 µL),
we recommend a pipettor precision of ≤ 1%.
Item Suggested
Source Catalog #
PBS 1× InvitrogenTM Corp. 14190078
Proclin™ -300 Sigma-AldrichTM Co. 48126
D-biotin Sigma-AldrichTM Co. B4501
Milli-Q® water
OptiPlate™-384
(white opaque 384-
well microplate)
PerkinElmer®, Inc. 6007290
TopSeal-A Adhesive
Sealing Film PerkinElmer®, Inc. 6005185
Single-channel
Pipettors§
7
II. INTRODUCTION
“True hits” are compounds which act at the level of the therapeutic
target subject to screening. These active molecules are usually en-
zyme inhibitors or receptor agonists or antagonists. “False positives”
are compounds interfering with the HTS assay in ways that are unre-
lated to the screen target. When the false positive rate in an assay is
too high, the quality of the results and the reliability of the whole
screening process become questionable.
Characterizing each of the hits generated during an HTS campaign
can be time-consuming and expensive. For this reason, it is essential
to identify false positives as early as possible in the screening process.
The AlphaScreen TruHits kit has been especially designed for this
purpose and allows the early identification of false positives in a cost-
effective manner. In addition, the AlphaScreen TruHits kit allows for
the determination of the root cause of compound interference. Using
this kit will allow the AlphaScreen user to rapidly focus on true hits,
and thus significantly increase the value of screening campaigns.
AlphaScreenTM TruHitsTM and Compound Interference
The AlphaScreen TruHits kit contains Streptavidin Donor (SA-D)
beads and biotinylated Acceptor (b-A) beads. Biotinylated Acceptor
beads are coated with biotinylated bovine serum albumin (BSA).
Biotin molecules conjugated on the BSA will bind tightly to the
streptavidin on the Donor beads to form a bead complex generating an
AlphaScreen signal upon irradiation at 680 nm (Fig. 1). The two
beads interact together in the absence of any probe or bridging
component.
False positives arise in all HTS campaigns, no matter the technologi-
cal platform used. These compounds interfere with one of the assay
components in a non-specific manner, or with assay signal generation
and/or detection.

8
Figure 1. Schematic Illustration of the AlphaScreen TruHits Kit. The
Streptavidin Donor (SA-D) bead and biotinylated Acceptor (b-A)
beads form a complex that emits light between 520 and 620 nm upon
laser irradiation at 680 nm.
Compounds which interfere with AlphaScreen assays belong to one of
the following classes:
1) Singlet Oxygen Quenchers. These types of compounds ac-
tually bind to, or react with, singlet oxygen molecules gener-
ated by the irradiation of the donor bead at 680 nm, prevent-
ing singlet oxygen from reaching the acceptor bead and gen-
erating a signal. Examples of singlet oxygen quenchers in-
clude azide, ascorbate, and some transition metal ions such as
Zn2+, Cu2+, Fe2+ and Fe3+.
2) Color Quenchers (also known as Inner Filters). These
colored molecules absorb light either at 680 nm (wavelength
used for Donor bead excitation) or between 520-620 nm
(range of emission of the Acceptor beads). These compounds
are usually blue/green or blue, and are often easy to detect by
simply examining the plates of compounds. Examples of
dyes acting as color quenchers in AlphaScreen assays include
malachite green and dextran blue. Color quenchers or inner
filters are found in all HTS technologies that are based on
light detection.
11OO22
Excitation
@ 680 nm
Emission
@ 520-620 nm11OO22
11OO22
11OO22
11OO2211OO22
11OO22
11OO22
SA-D
11OO22
11OO2211OO22
11OO2d2d
b-A
11OO22
Excitation
@ 680 nm
Emission
@ 520-620 nm11OO22
11OO22
11OO22
11OO2211OO22
11OO22
11OO22
SA-D
11OO22
11OO2211OO22
11OO2d2d
b-A
9
3) Light Scatterers. Light scattering is produced by insoluble
compound aggregates. A significant proportion of com-
pounds from HTS libraries falls out of solution to various
extent when diluted in aqueous buffers. Compound aggre-
gates diffract light at the excitation and/or emission wave-
lengths. Light scatterers interfere with all HTS technologies
based on light detection.
4) Biotin Mimetics. AlphaScreen assays involve the binding of
a biotinylated element, or probe, to the Streptavidin Donor
beads. Some rare library compounds possess biotin-like bind-
ing properties, and will decrease the AlphaScreen signal by
competing for this interaction. These compounds are either
small molecules with biotin-like moieties, or short peptides.
Biotin mimetic compounds will generate false positives with
all technologies using the interaction of a biotinylated probe
with streptavidin.
5) Acceptor Bead Competitors. Acceptor bead competitors
interact directly with the binding partner conjugated to the
Acceptor beads. These compounds prevent the capture of the
assay probe by the Acceptor bead, resulting in signal de-
crease. This type of interference is assay dependent but oc-
curs more commonly with the AlphaScreen Nickel Chelate
kit. The positive control component available with each Al-
phaScreen kit is a valuable tool for the detection of false
positives that are Acceptor bead competitors. These com-
pounds will generate a signal drop when incubated with the
kit components in the presence of the positive control probe.
Positive control probes for the different AlphaScreen kits can
be purchased from PerkinElmer, Inc. The AlphaScreen Tru-
Hits kit is not intended for the identification of Acceptor bead
competitors.
The AlphaScreen TruHits kit will detect compounds that belong to the
first four classes of interfering compounds (Fig. 2), and will help de-
termine if active compounds in HTS assays are potential active hits or
false positives. In TruHits assays, library compounds which interfere
with the AlphaScreen signal are considered false positives while com-
pounds which exhibit no effect on the signal are potential true hits.
10
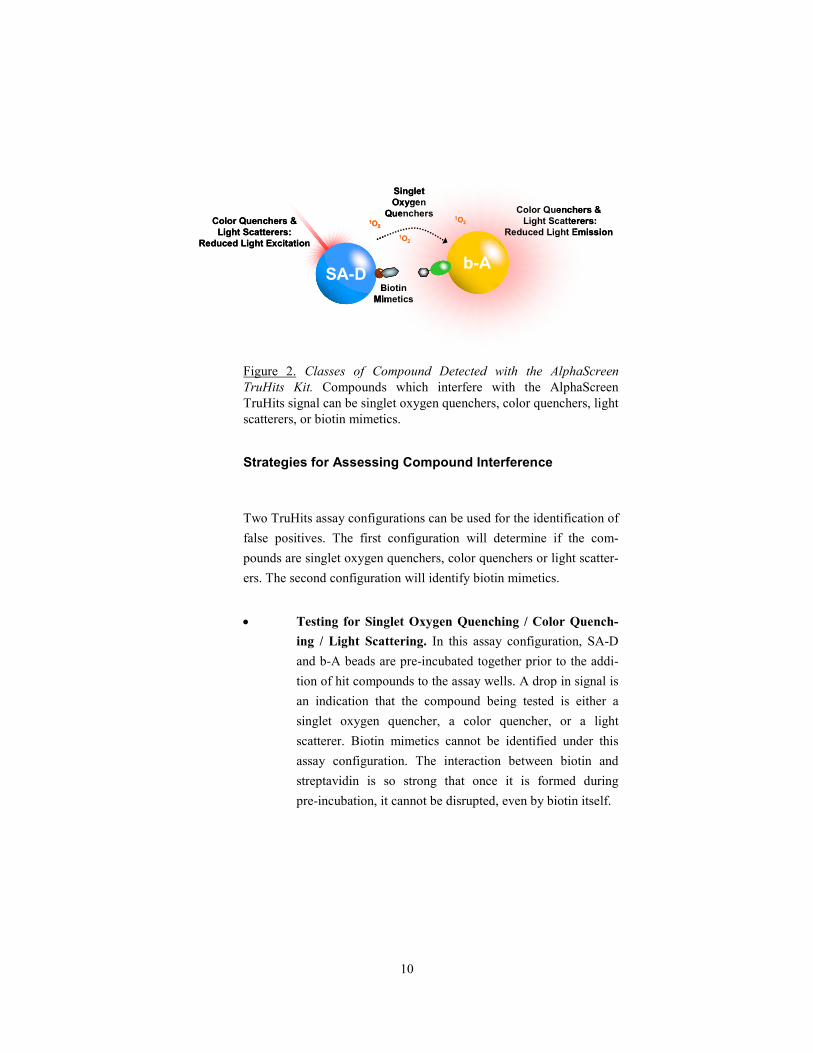
Figure 2. Classes of Compound Detected with the AlphaScreen
TruHits Kit. Compounds which interfere with the AlphaScreen
TruHits signal can be singlet oxygen quenchers, color quenchers, light
scatterers, or biotin mimetics.
Strategies for Assessing Compound Interference
Two TruHits assay configurations can be used for the identification of
false positives. The first configuration will determine if the com-
pounds are singlet oxygen quenchers, color quenchers or light scatter-
ers. The second configuration will identify biotin mimetics.
• Testing for Singlet Oxygen Quenching / Color Quench-
ing / Light Scattering. In this assay configuration, SA-D
and b-A beads are pre-incubated together prior to the addi-
tion of hit compounds to the assay wells. A drop in signal is
an indication that the compound being tested is either a
singlet oxygen quencher, a color quencher, or a light
scatterer. Biotin mimetics cannot be identified under this
assay configuration. The interaction between biotin and
streptavidin is so strong that once it is formed during
pre-incubation, it cannot be disrupted, even by biotin itself.
Biotin
Mimetics
Singlet
Oxygen
Quenchers11OO22
11OO22
Color Quenchers &
Light Scatterers:
Reduced Light Emission11OO22
SA-Db-A
Color Quenchers &
Light Scatterers:
Reduced Light Excitation
Biotin
Mimetics
Singlet
Oxygen
Quenchers11OO22
11OO22
Color Quenchers &
Light Scatterers:
Reduced Light Emission11OO22
SA-Db-A
Color Quenchers &
Light Scatterers:
Reduced Light Excitation
11
• Testing for Biotin Mimetics. Compounds that did not alter
the TruHits signal using the first assay configuration could
be biotin mimetics. The TruHits kit allows for the specific
identification of biotin mimetics using a procedure where
compounds are pre-incubated with the SA-D beads, prior to
adding the b-A beads. Biotin mimetic compounds will bind
to the streptavidin on Donor beads and generate a signal
loss. Note that biotin mimetics will not interfere with the
AlphaScreen cAMP assay (catalog number # 6760625). The
biotinylated cAMP probe in the AlphaScreen cAMP assay
is preincubated with the SA-D beads prior to bead addition
to cells stimulated by the compounds.
If a compound identified as a hit in an AlphaScreen primary screen
does not reduce the TruHits signal in one of the two assay configura-
tions, it can be considered to be a potential true hit.
III. SCREENING FOR SINGLET OXYGEN QUENCHERS,
COLOR QUENCHERS AND LIGHT SCATTERERS
The final concentration of compounds in the TruHits assay should be
the same as the final concentration used in the primary screen that
lead to the identification of the hit compounds (usually 10 µm or
below). It is recommended to vortex and then quick spin the
AlphaScreen TruHits beads prior to pipetting from the stock
suspensions. The assay is performed in a volume of 25 µL in white
384-well OptiPlates (PerkinElmer® catalog number # 6007290).
Reagent Preparation
• Prepare 1× assay buffer
• Prepare 5× intermediate dilutions of hit compounds in assay
buffer (1× being the final concentration used in the original
screen)
12
• Prepare a TruHits bead premix as follows*:
Reagent Volume [Premix] [Final]
1× assay buffer 1.99 mL - -
SA-D beads 5 µL 12.5 µg/mL 10 µg/mL
b-A beads 5 µL 6.25 µg/mL 5 µg/mL
• Incubate premix for 30 min at room temperature.
* This volume of premix is sufficient for ~ 90 assay points. Adjust
volumes according to the number of compounds to be tested. Prepare
the bead premix fresh.
Reagent Addition
• Add to the wells of a 384-well microplate:
• 20 µL of bead premix
• 5 µL of the 5× compound solution or buffer (as a
control)
• Cover the plate with a TopSeal-A sealing film
• Incubate for 10 min at room temperature
• Read plate using an AlphaScreen multiplate reader
Interpreting the Data
In this assay configuration, the Donor and Acceptor beads are pre-
mixed prior to compound addition. Any signal decrease will result
from either color quenching, light scattering or singlet oxygen
quenching. A signal lower than the average of control wells by more
than two standard deviations indicates an interfering compound. An
example of interference by singlet oxygen quenching and color
quenching is presented in Figure 3. As explained earlier, biotin
13
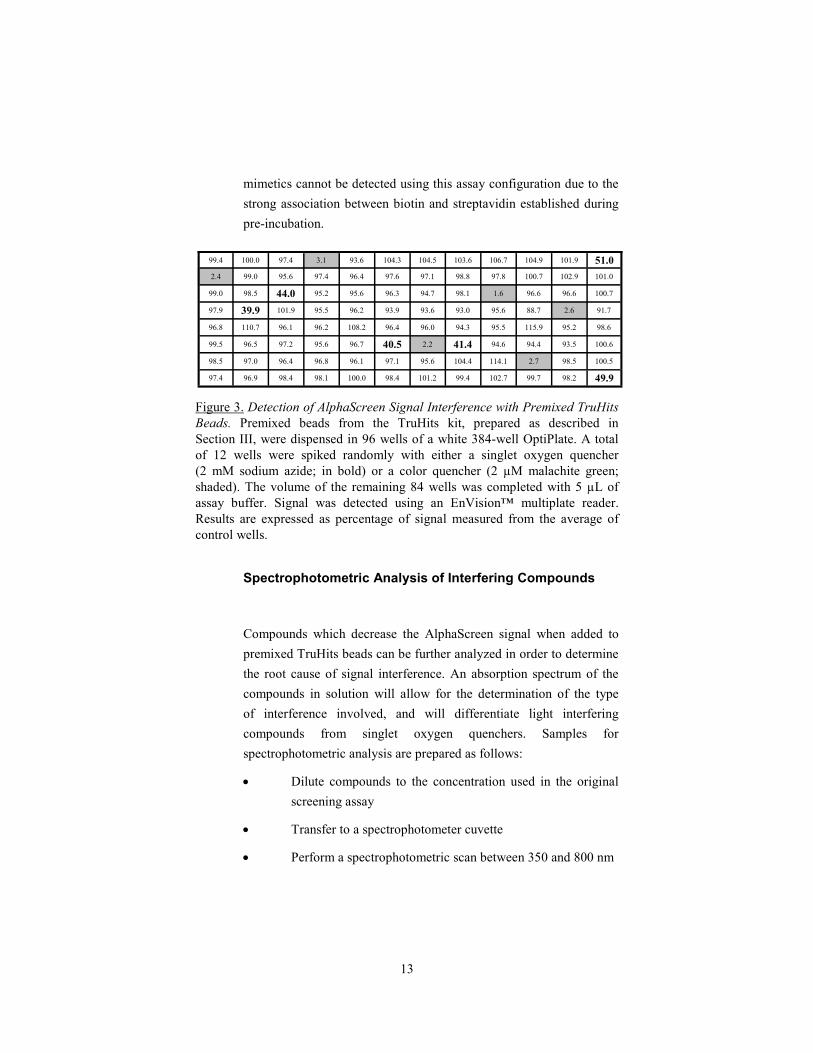
mimetics cannot be detected using this assay configuration due to the
strong association between biotin and streptavidin established during
pre-incubation.
Figure 3. Detection of AlphaScreen Signal Interference with Premixed TruHits
Beads. Premixed beads from the TruHits kit, prepared as described in
Section III, were dispensed in 96 wells of a white 384-well OptiPlate. A total
of 12 wells were spiked randomly with either a singlet oxygen quencher
(2 mM sodium azide; in bold) or a color quencher (2 µM malachite green;
shaded). The volume of the remaining 84 wells was completed with 5 µL of
assay buffer. Signal was detected using an EnVision™ multiplate reader.
Results are expressed as percentage of signal measured from the average of
control wells.
Spectrophotometric Analysis of Interfering Compounds
Compounds which decrease the AlphaScreen signal when added to
premixed TruHits beads can be further analyzed in order to determine
the root cause of signal interference. An absorption spectrum of the
compounds in solution will allow for the determination of the type
of interference involved, and will differentiate light interfering
compounds from singlet oxygen quenchers. Samples for
spectrophotometric analysis are prepared as follows:
• Dilute compounds to the concentration used in the original
screening assay
• Transfer to a spectrophotometer cuvette
• Perform a spectrophotometric scan between 350 and 800 nm
99.4 100.0 97.4 3.1 93.6 104.3 104.5 103.6 106.7 104.9 101.9 51.0 2.4 99.0 95.6 97.4 96.4 97.6 97.1 98.8 97.8 100.7 102.9 101.0
99.0 98.5 44.0 95.2 95.6 96.3 94.7 98.1 1.6 96.6 96.6 100.7
97.9 39.9 101.9 95.5 96.2 93.9 93.6 93.0 95.6 88.7 2.6 91.7
96.8 110.7 96.1 96.2 108.2 96.4 96.0 94.3 95.5 115.9 95.2 98.6
99.5 96.5 97.2 95.6 96.7 40.5 2.2 41.4 94.6 94.4 93.5 100.6
98.5 97.0 96.4 96.8 96.1 97.1 95.6 104.4 114.1 2.7 98.5 100.5
97.4 96.9 98.4 98.1 100.0 98.4 101.2 99.4 102.7 99.7 98.2 49.9

14
The absorption spectrum of hit compounds can be of three types:
1) Spectrum with a defined peak of absorption which overlaps
with the excitation (680 nm) or emission (520-620 nm) wave-
lengths of the AlphaScreen assays. This type of spectrum is
typical of compounds that are color quenchers. Figure 4
shows the absorption spectra of malachite green, a blue com-
pound that quenches a large fraction of the AlphaScreen red
light emission.
Figure 4. Absorption Spectra of Malachite Green. The dye was dis-
solved in PBS at a concentration of 10 µM. The shaded area between
520 and 620 nm represents the emission wavelengths of AlphaScreen
Acceptor beads while the dotted arrow at 680 nm indicates the wave-
length of excitation of Donor beads. Note the significant overlap of
the absorption peak of malachite green with the emission of the Ac-
ceptor beads.
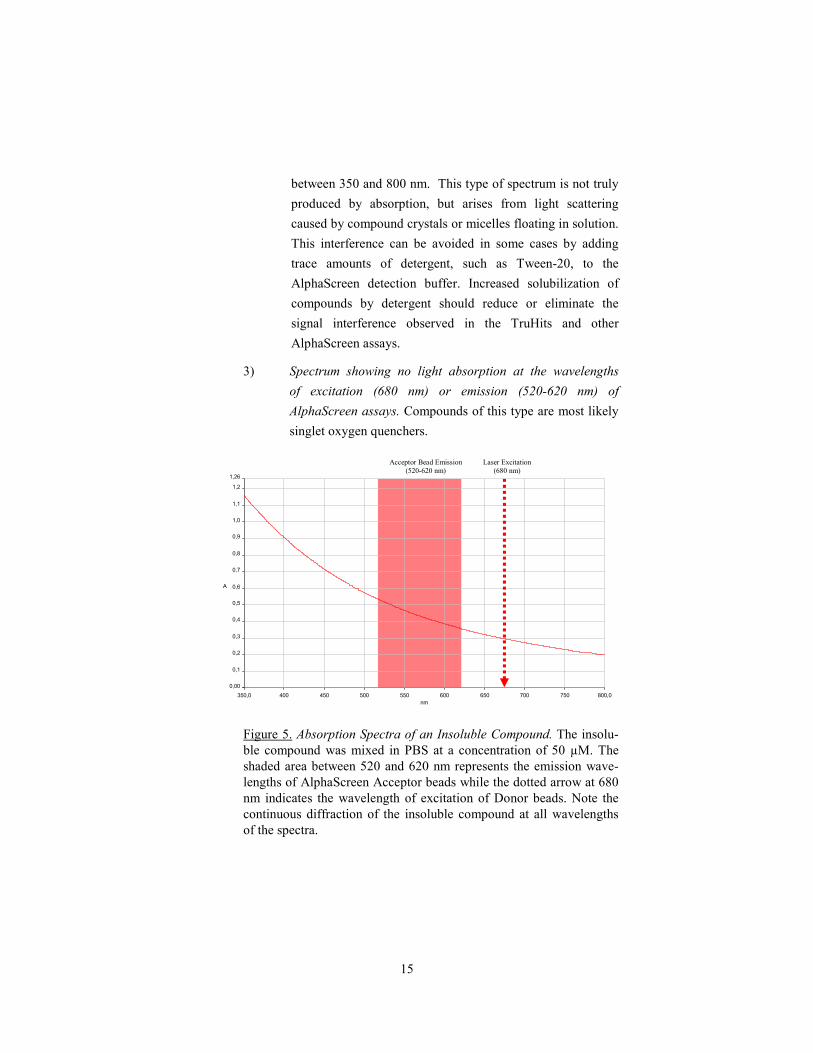
2) Undefined “absorption spectrum” from insoluble com-
pounds. Although they do not actually absorb light, insoluble
compounds show a typical absorption spectrum similar to the
one presented in Figure 5. This peculiar spectrum shows
optical density (OD) values above 0.05 for all wavelengths
Acceptor Bead Emission Laser Excitation
350,0 400 450 500 550 600 650 700 750 800,0 0,00 0,1 0,2 0,3 0,4 0,5 0,6 0,7 0,8 0,9 1,0 1,1 1,2 1,26
Wavelength (nm)
A
15
between 350 and 800 nm. This type of spectrum is not truly
produced by absorption, but arises from light scattering
caused by compound crystals or micelles floating in solution.
This interference can be avoided in some cases by adding
trace amounts of detergent, such as Tween-20, to the
AlphaScreen detection buffer. Increased solubilization of
compounds by detergent should reduce or eliminate the
signal interference observed in the TruHits and other
AlphaScreen assays.
3) Spectrum showing no light absorption at the wavelengths
of excitation (680 nm) or emission (520-620 nm) of
AlphaScreen assays. Compounds of this type are most likely
singlet oxygen quenchers.
Figure 5. Absorption Spectra of an Insoluble Compound. The insolu-
ble compound was mixed in PBS at a concentration of 50 µM. The
shaded area between 520 and 620 nm represents the emission wave-
lengths of AlphaScreen Acceptor beads while the dotted arrow at 680
nm indicates the wavelength of excitation of Donor beads. Note the
continuous diffraction of the insoluble compound at all wavelengths
of the spectra.
350,0 400 450 500 550 600 650 700 750 800,0
0,00
0,1
0,2
0,3
0,4
0,5
0,6
0,7
0,8
0,9
1,0
1,1
1,2
1,26
nm
A
Acceptor Bead Emission
(520-620 nm)
Laser Excitation
(680 nm)
16
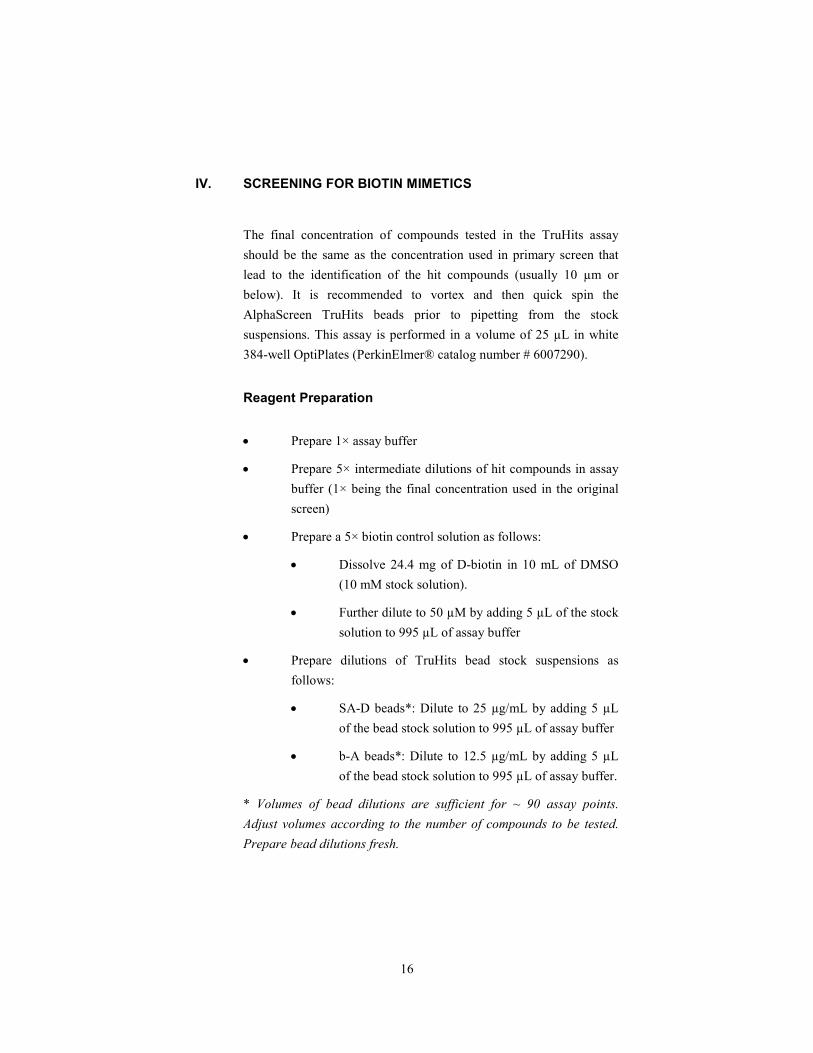
IV. SCREENING FOR BIOTIN MIMETICS
The final concentration of compounds tested in the TruHits assay
should be the same as the concentration used in primary screen that
lead to the identification of the hit compounds (usually 10 µm or
below). It is recommended to vortex and then quick spin the
AlphaScreen TruHits beads prior to pipetting from the stock
suspensions. This assay is performed in a volume of 25 µL in white
384-well OptiPlates (PerkinElmer® catalog number # 6007290).
Reagent Preparation
• Prepare 1× assay buffer
• Prepare 5× intermediate dilutions of hit compounds in assay
buffer (1× being the final concentration used in the original
screen)
• Prepare a 5× biotin control solution as follows:
• Dissolve 24.4 mg of D-biotin in 10 mL of DMSO
(10 mM stock solution).
• Further dilute to 50 µM by adding 5 µL of the stock
solution to 995 µL of assay buffer
• Prepare dilutions of TruHits bead stock suspensions as
follows:
• SA-D beads*: Dilute to 25 µg/mL by adding 5 µL
of the bead stock solution to 995 µL of assay buffer
• b-A beads*: Dilute to 12.5 µg/mL by adding 5 µL
of the bead stock solution to 995 µL of assay buffer.
* Volumes of bead dilutions are sufficient for ~ 90 assay points.
Adjust volumes according to the number of compounds to be tested.
Prepare bead dilutions fresh.

17
Reagent Addition
• Add to the wells of a 384-well OptiPlate:
• 10 µL of SA-D beads
• 5 µL of compounds to test
Note: Include a few wells with buffer only as
well as some wells spiked with the 50 µM
D-biotin control solution
• Cover plate with another opaque microplate
• Incubate for 30 min at room temperature
• Add 10 µL of b-A beads
• Cover plate with a TopSeal-A sealing film
• Incubate for 30 min at room temperature
• Read plate on an AlphaScreen reader
Interpreting the Data
In the TruHits assay, preincubating the SA-D beads with potential
biotin mimetics will allow these compounds to saturate streptavidin
binding sites and thus compete for the interaction with the Acceptor
bead. A signal lower than the average of control wells by more than
two standard deviations indicates a biotin-mimetic compound. An
inhibition curve of the TruHits signal by D-biotin is presented in
Figure 8.
In HTS campaigns performed with regular AlphaScreen kits, biotin
mimetics prevent biotinylated assay probes from being captured by
the SA-D beads. With most AlphaScreen assays, it is possible to
eliminate the interference by biotin mimetics by pre-incubating the
SA-D beads with the biotinylated assay probe for 30 min prior to
compound addition. This simple adjustment to the protocol requires
an extra incubation step, but completely eliminates the interference by
biotin mimetics.
18
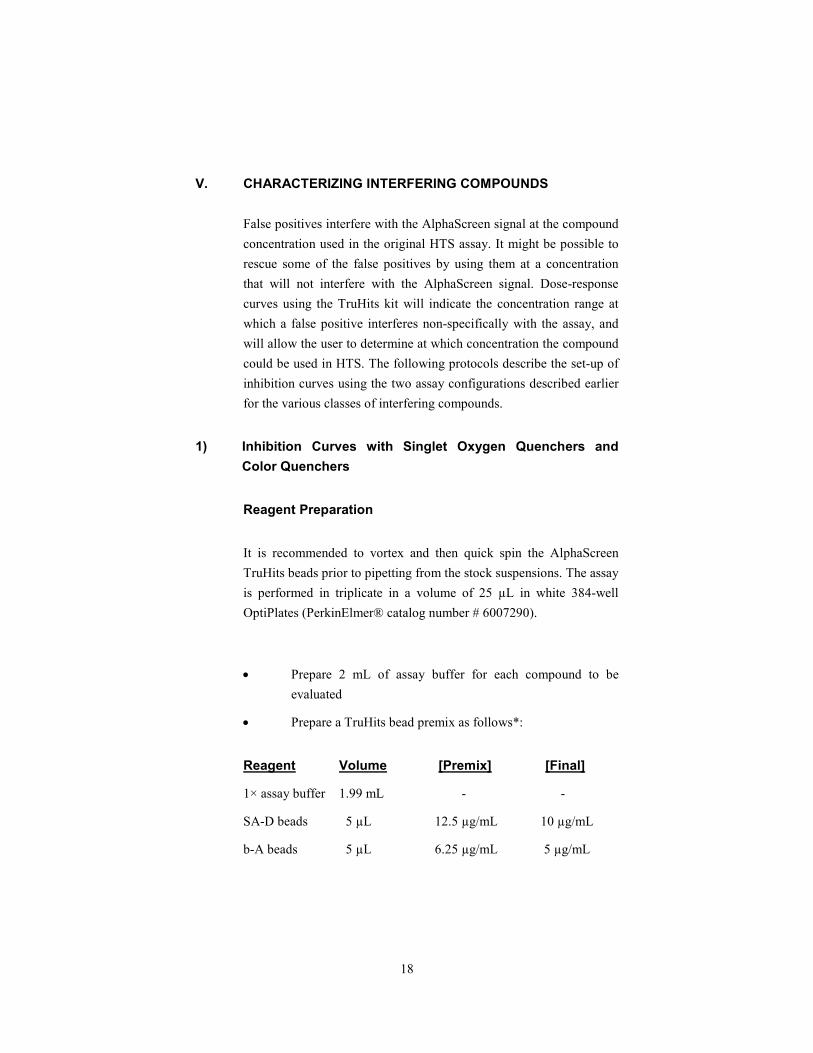
V. CHARACTERIZING INTERFERING COMPOUNDS
False positives interfere with the AlphaScreen signal at the compound
concentration used in the original HTS assay. It might be possible to
rescue some of the false positives by using them at a concentration
that will not interfere with the AlphaScreen signal. Dose-response
curves using the TruHits kit will indicate the concentration range at
which a false positive interferes non-specifically with the assay, and
will allow the user to determine at which concentration the compound
could be used in HTS. The following protocols describe the set-up of
inhibition curves using the two assay configurations described earlier
for the various classes of interfering compounds.
1) Inhibition Curves with Singlet Oxygen Quenchers and
Color Quenchers
Reagent Preparation
It is recommended to vortex and then quick spin the AlphaScreen
TruHits beads prior to pipetting from the stock suspensions. The assay
is performed in triplicate in a volume of 25 µL in white 384-well
OptiPlates (PerkinElmer® catalog number # 6007290).
• Prepare 2 mL of assay buffer for each compound to be
evaluated
• Prepare a TruHits bead premix as follows*:
Reagent Volume [Premix] [Final]
1× assay buffer 1.99 mL - -
SA-D beads 5 µL 12.5 µg/mL 10 µg/mL
b-A beads 5 µL 6.25 µg/mL 5 µg/mL
19
• Incubate the premix for 30 min at room temperature
* This volume of premix is sufficient for ~ 90 wells. Adjust volumes
according to the number of compounds to be tested. Prepare the bead
premix fresh.
• Prepare initial 5× compound dilutions in assay buffer (1×
being the final concentration used in the original screen)
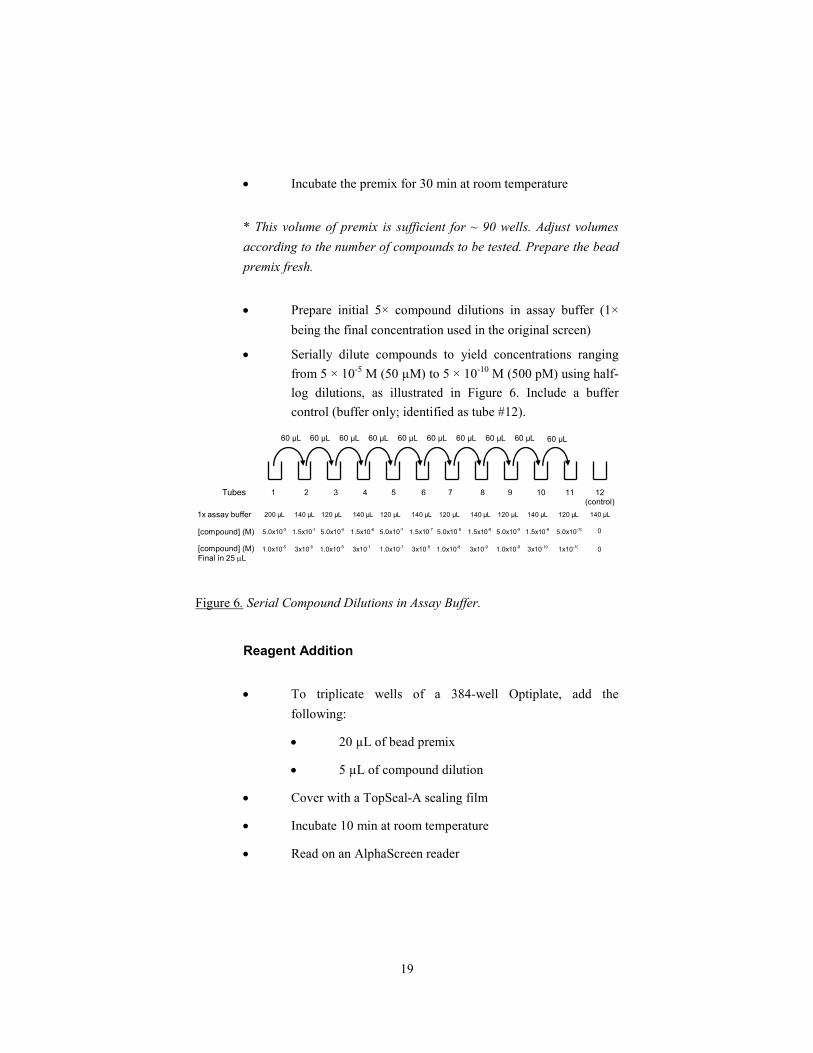
• Serially dilute compounds to yield concentrations ranging
from 5 × 10⁻⁵ M (50 µM) to 5 × 10⁻¹⁰ M (500 pM) using half-
log dilutions, as illustrated in Figure 6. Include a buffer
control (buffer only; identified as tube #12).
Figure 6. Serial Compound Dilutions in Assay Buffer.
Reagent Addition
• To triplicate wells of a 384-well Optiplate, add the
following:
• 20 µL of bead premix
• 5 µL of compound dilution
• Cover with a TopSeal-A sealing film
• Incubate 10 min at room temperature
• Read on an AlphaScreen reader
Tubes
60 µL
1 2 3 4 5 6 7 8 9 10 11 12 (control)
60 µL 60 µL 60 µL 60 µL 60 µL 60 µL 60 µL 60 µL 60 µL
1x assay buffer
[compound] (M)
200 µL
1.5x10⁻⁵ 5.0x10
-5 0
[compound] (M)
Final in 25 µL 3x10
-6 1.0x10
-5 0
1.5x10⁻⁶ 5.0x10
-6 1.5x10
-7 5.0x10
-7 1.5x10
-8 5.0x10
-8 1.5x10
-9 5.0x10
-9 5.0x10
-10
140 µL 120 µL 140 µL 120 µL 120 µL 120 µL 140 µL 140 µL 140 µL 120 µL
3x10⁻⁷ 1.0x10
-6 3x10
-8 1.0x10
-7 3x10
-9 1.0x10
-8 3x10
-10 1.0x10
-9 1x10
-10
140 µL

20
Interpreting the Data
Compound inhibition curves are graphed as scatter plots, with
compound concentration on the X-axis and AlphaScreen signal on the
Y-axis. If there is a concentration-dependent inhibition of signal, the
data will yield a sigmoidal curve showing a signal decrease in the
presence of increasing concentrations of the interfering compound.
The IC50 of the curve represents the concentration of compound lead-
ing to a 50% decrease in signal (Fig. 7).
Inhibition curves allow the user to determine if a false positive could
be rescued and retested in the primary HTS assay at a lower concen-
tration. This would be the case, for example, if the percentage of sig-
nal inhibition observed in the primary HTS assay was significantly
higher than the percentage of inhibition observed with the TruHits
assay at the same concentration. The compound could then be a true
hit, interfering only partially with the AlphaScreen signal detection.
If the percentage of signal inhibition observed in the primary screen is
similar to the percentage of signal inhibition observed in the TruHits
assay at the same screening concentration, the possibility of rescuing
a compound would then depend on its IC50 in the TruHits assay. If the
IC50 is in the micromolar (µM) range or above, diluting the compound
three to ten-fold should solve most of the interference issue. However,
if the IC50 for the inhibition is in the nanomolar (nM) range, it is
unlikely that diluting the compound will allow rescue for the primary
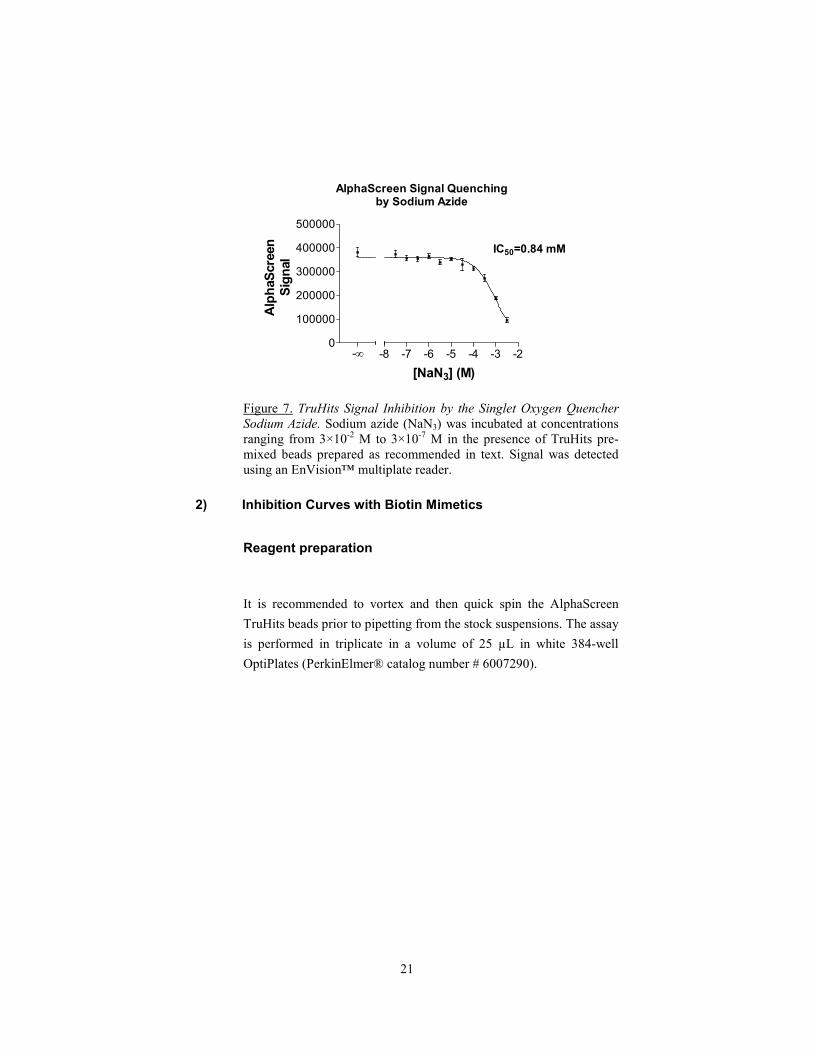
HTS screen. Figure 7 shows an inhibition curve obtained with the
singlet oxygen quencher sodium azide (NaN3). The IC50 of sodium
azide for the TruHits assay is 0.84 mM (~ 0.005%). This very clearly
illustrates why buffers containing sodium azide should not be used
when working with AlphaScreen.
21
Figure 7. TruHits Signal Inhibition by the Singlet Oxygen Quencher
Sodium Azide. Sodium azide (NaN3) was incubated at concentrations
ranging from 3×10⁻² M to 3×10⁻⁷ M in the presence of TruHits pre-
mixed beads prepared as recommended in text. Signal was detected
using an EnVision™ multiplate reader.
2) Inhibition Curves with Biotin Mimetics
Reagent preparation
It is recommended to vortex and then quick spin the AlphaScreen
TruHits beads prior to pipetting from the stock suspensions. The assay
is performed in triplicate in a volume of 25 µL in white 384-well
OptiPlates (PerkinElmer® catalog number # 6007290).
AlphaScreen Signal Quenchingby Sodium Azide
0
100000
200000
300000
400000
500000
IC50=0.84 mM
-8 -7 -6 -5 -4 -3 -2-∞
[NaN3] (M)
AlphaScreen
Signal
22
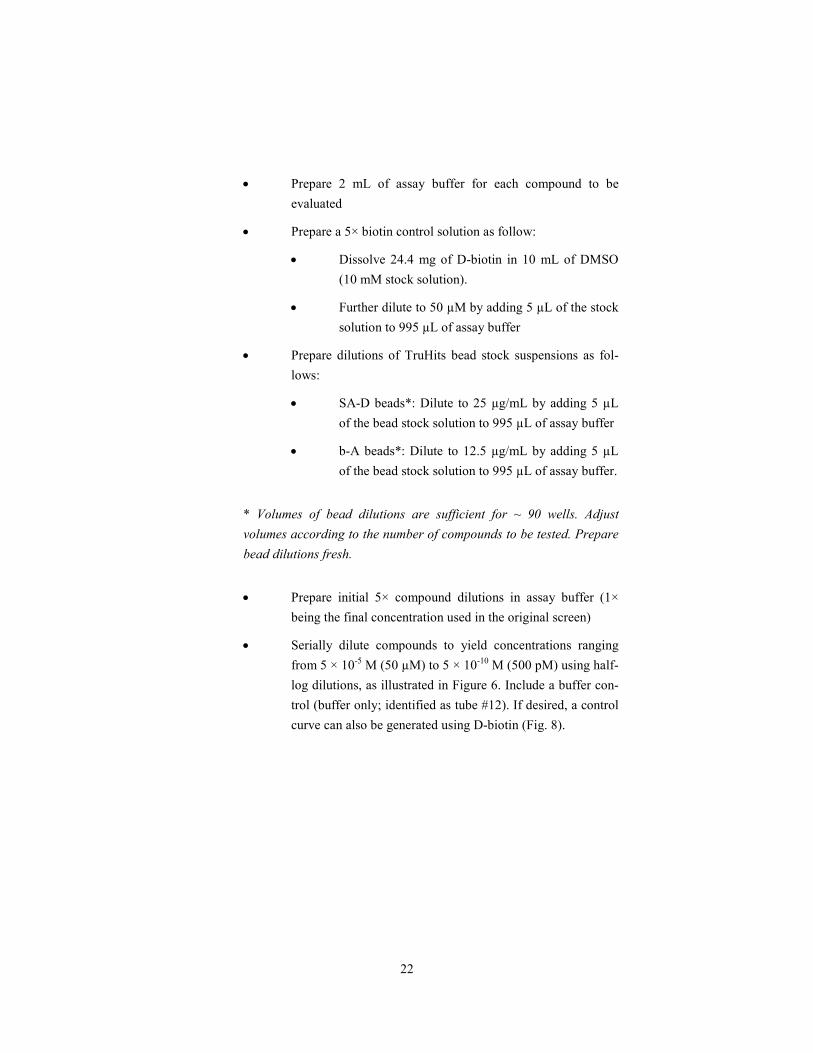
• Prepare 2 mL of assay buffer for each compound to be
evaluated
• Prepare a 5× biotin control solution as follow:
• Dissolve 24.4 mg of D-biotin in 10 mL of DMSO
(10 mM stock solution).
• Further dilute to 50 µM by adding 5 µL of the stock
solution to 995 µL of assay buffer
• Prepare dilutions of TruHits bead stock suspensions as fol-
lows:
• SA-D beads*: Dilute to 25 µg/mL by adding 5 µL
of the bead stock solution to 995 µL of assay buffer
• b-A beads*: Dilute to 12.5 µg/mL by adding 5 µL
of the bead stock solution to 995 µL of assay buffer.
* Volumes of bead dilutions are sufficient for ~ 90 wells. Adjust
volumes according to the number of compounds to be tested. Prepare
bead dilutions fresh.
• Prepare initial 5× compound dilutions in assay buffer (1×
being the final concentration used in the original screen)
• Serially dilute compounds to yield concentrations ranging
from 5 × 10⁻⁵ M (50 µM) to 5 × 10⁻¹⁰ M (500 pM) using half-
log dilutions, as illustrated in Figure 6. Include a buffer con-
trol (buffer only; identified as tube #12). If desired, a control
curve can also be generated using D-biotin (Fig. 8).
23
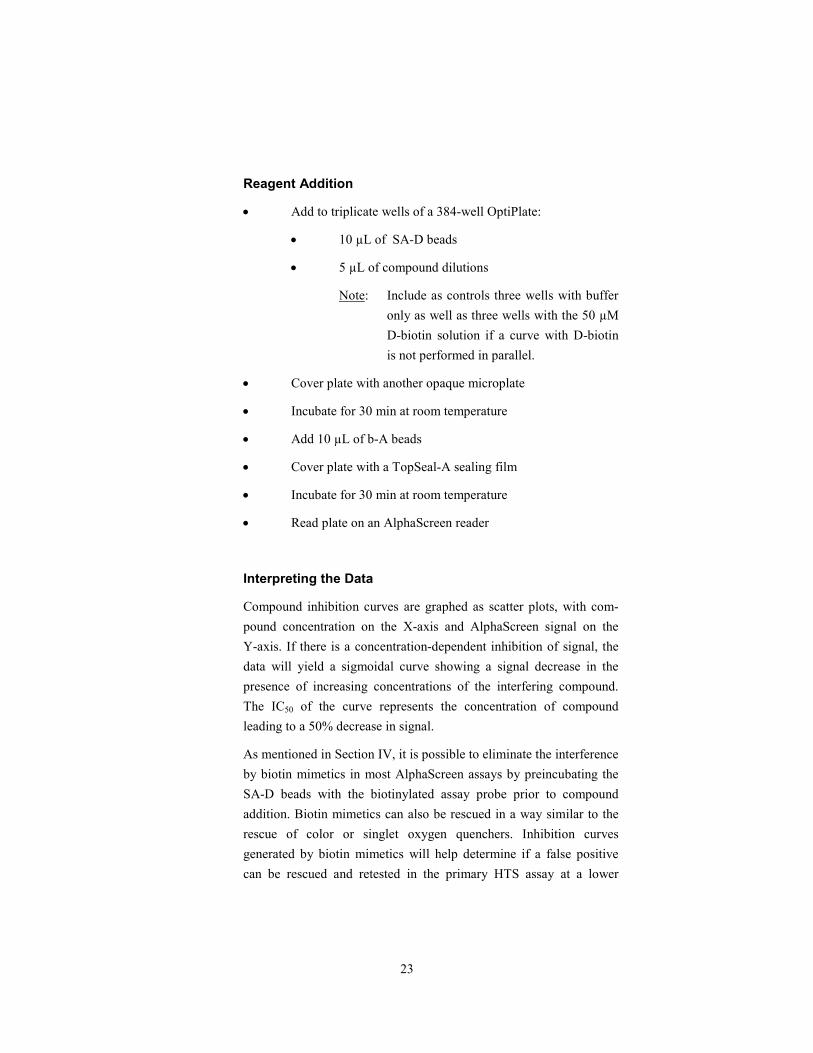
Reagent Addition
• Add to triplicate wells of a 384-well OptiPlate:
• 10 µL of SA-D beads
• 5 µL of compound dilutions
Note: Include as controls three wells with buffer
only as well as three wells with the 50 µM
D-biotin solution if a curve with D-biotin
is not performed in parallel.
• Cover plate with another opaque microplate
• Incubate for 30 min at room temperature
• Add 10 µL of b-A beads
• Cover plate with a TopSeal-A sealing film
• Incubate for 30 min at room temperature
• Read plate on an AlphaScreen reader
Interpreting the Data
Compound inhibition curves are graphed as scatter plots, with com-
pound concentration on the X-axis and AlphaScreen signal on the
Y-axis. If there is a concentration-dependent inhibition of signal, the
data will yield a sigmoidal curve showing a signal decrease in the
presence of increasing concentrations of the interfering compound.
The IC50 of the curve represents the concentration of compound
leading to a 50% decrease in signal.
As mentioned in Section IV, it is possible to eliminate the interference
by biotin mimetics in most AlphaScreen assays by preincubating the
SA-D beads with the biotinylated assay probe prior to compound
addition. Biotin mimetics can also be rescued in a way similar to the
rescue of color or singlet oxygen quenchers. Inhibition curves
generated by biotin mimetics will help determine if a false positive
can be rescued and retested in the primary HTS assay at a lower

24
concentration. This would be the case, for example, if the percentage
of signal inhibition observed in the primary HTS assay was
significantly higher than the percentage of inhibition observed with
the TruHits assay at the same compound concentration. The com-
pound could then be a true hit, interfering only partially with the
AlphaScreen signal detection.
If the percentage of inhibition is similar in the primary screen and in
the TruHits assay at the same screening concentration, the possibility
of rescuing a compound would then depend on its IC50 in the TruHits
assay. If the IC50 is in the micromolar (µM) range or above, diluting
the compound three to ten-fold should solve most of the interference
issue. However, if the IC50 for the inhibition is in the nanomolar (nM)
range, it is unlikely that diluting the compound will allow rescue for
the primary HTS screen. Preincubation of the assay probe with the
SA-D bead would then be indicated. Figure 8 shows an inhibition
curve obtained with D-biotin. The IC50 for D-biotin is 17 nM, which
represents approximately 50% of the biotin-binding capacity of
streptavidin molecules conjugated to the Donor beads.
Figure 8. TruHits Signal Inhibition by Increasing Concentration of
D-biotin. D-biotin final concentrations ranging from 1×10⁻⁶ M to
1×10-11 M were used. D-biotin was preincubated for 30 min with the
SA-D beads as described in text. Acceptor beads were then added
and the AlphaScreen signal was monitored 30 min later using an
EnVision™.
Effect of D-Biotin on theTruHits Signal
0
100000
200000
300000
400000
IC50=17 nM
-12 -11 -10 -9 -8 -7 -6-∞∞∞∞
[D-biotin] (M)
AlphaScreen
Signal

25
VI. TROUBLESHOOTING GUIDE
This section describes possible problems that could be encountered
with the TruHits kit and proposes simple solutions. If more
information is required, please consult the PerkinElmer® technical
support division (see last page for customer support information).
Low Counts
• Vortex and then quick spin the tubes of AlphaScreen TruHits
beads using a micro-centrifuge in “Pulse” mode to ensure
that all of the beads are recovered from the cap and walls of
the tube.
• AlphaScreen beads are light sensitive. Pipet in a subdued
light environment (≤100 lux) or use green filters on light
sources.
• Ensure that the correct amount of Acceptor and Donor beads
were used.
• Incubation temperature should be maintained at 21°C or
above.
Day-to-day Variation
• Check room temperature variations. Variations in tempera-
ture will cause variations in signal.
• Work in subdued light environment (≤100 lux). Exposure of
Donor beads to bright light will reduce signal.
26
MANUFACTURED BY:
PerkinElmer BioSignal, Inc.
1744, William Street
Montreal, Quebec Canada H3J 1R4
For further technical information or to place an order, call:
PerkinElmer LAS, Inc.
710 Bridgeport Avenue
Shelton, CT 06484
USA
800-762-4000 or 203-925-4600
European Headquarters:
PerkinElmer LAS, Inc.
Imperiastraat 8
BE-1930 Zaventem
Belgium
Country Telephone
Austria 0800 293 515
Belgium 0800 94 540
Denmark 80 88 3477
France 0800 90 77 62
Germany 0800 1 81 00 32
Italy 0800 79 03 10
Netherlands 0800 02 23 042
Norway 800 11 947
Spain 900 973 255
Sweden 020 79 07 35
Switzerland 0800 55 50 27
United Kingdom 0800 89 60 46

27

28
PerkinElmer Life and Analytical Sciences, Inc. 710 Bridgeport Avenue
Shelton, CT 06484-4794 USA (800) 762-4000 or (+1) 203-925-4602
www.perkinelmer.com
For a complete listing of our global offices, visit www.perkinelmer.com/lasoffices
PC5367-0305
M-6760627-01