Takaful ‒ Foundations and Standardization of Islamic Insurance by ...
Upload
khangminh22Category
view
0download
0
1

3

4
Contents
5
Chairman's Report
Management Discussion and Analysis Report
Auditor's Report on Corporate Governance
Report on Corporate Governance
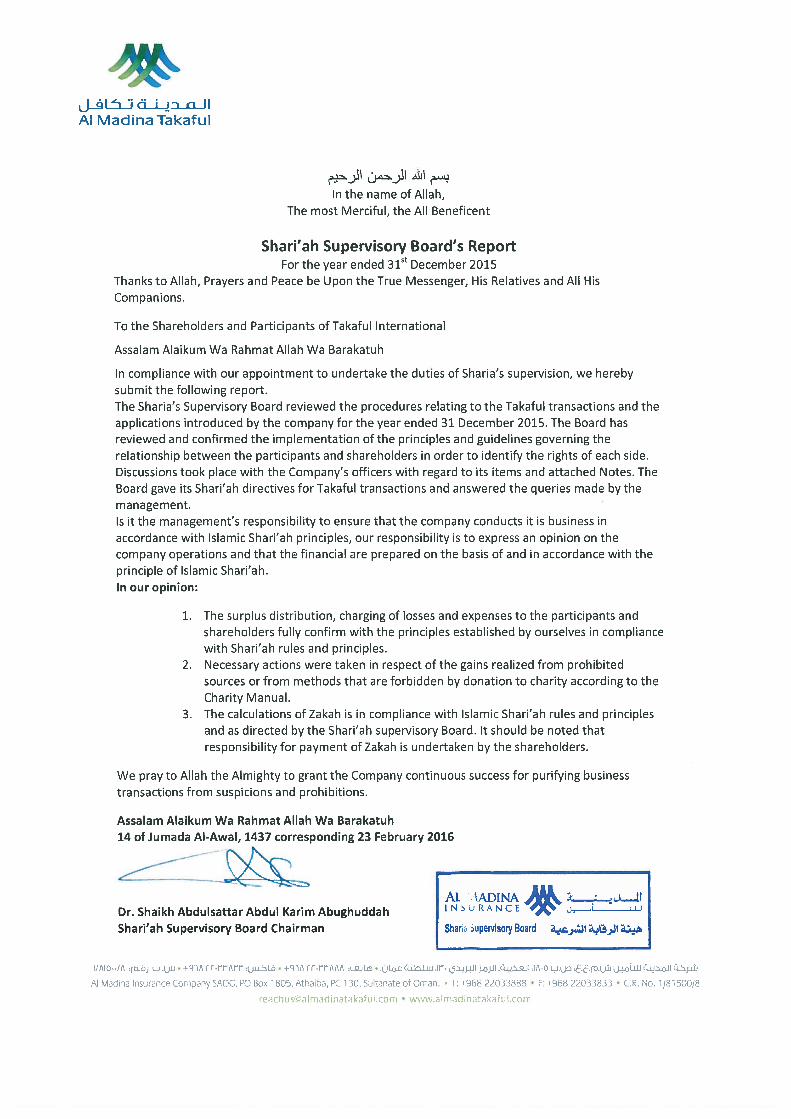
Shari'ah Supervisory Board's Report
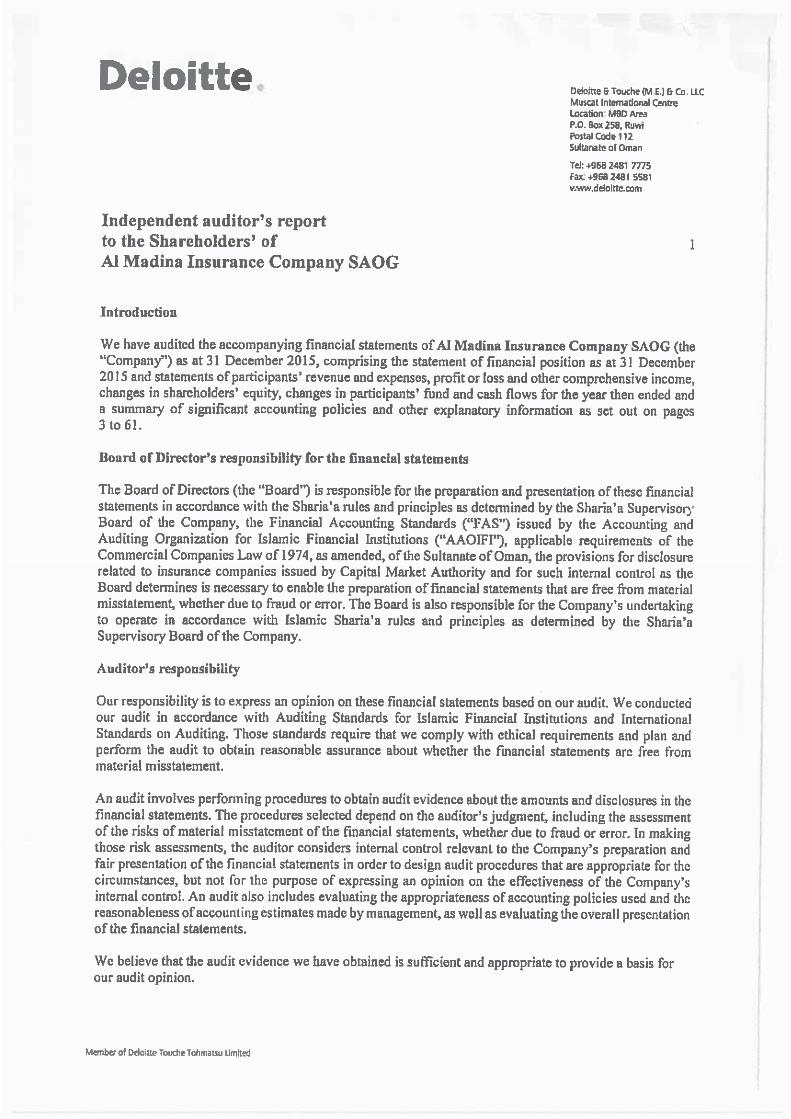
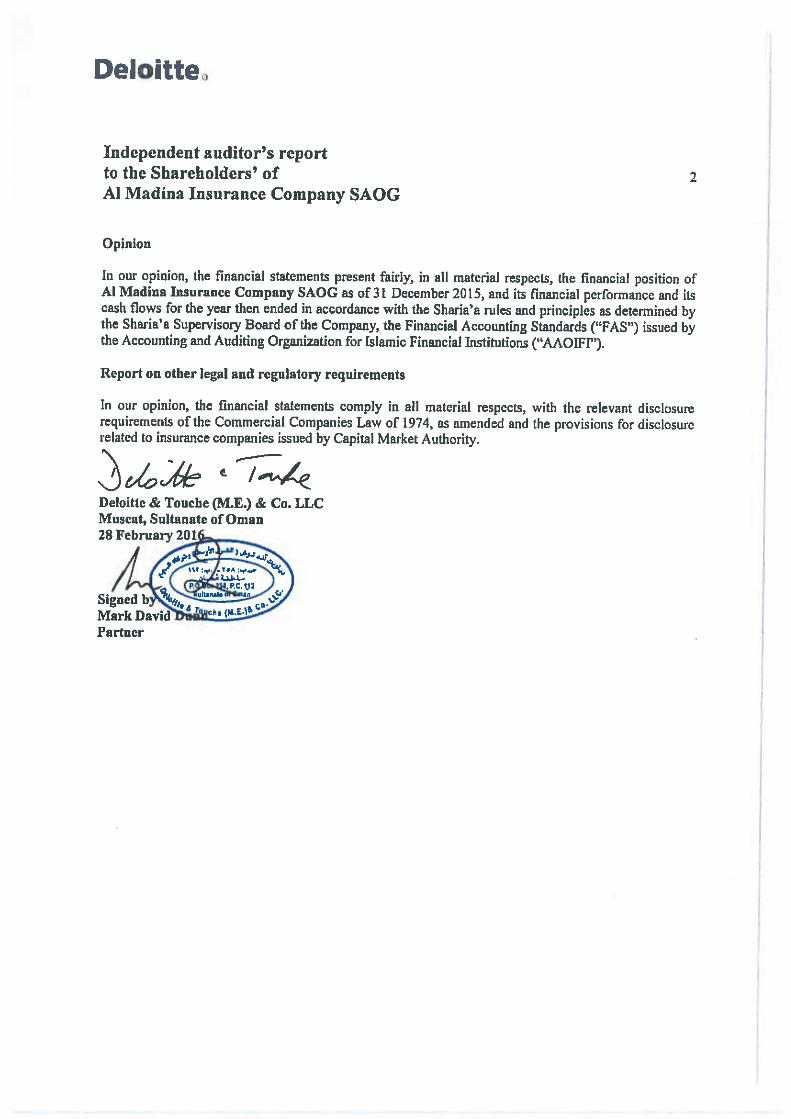
Auditor's Report to shareholders
Statement of Financial Position
Statement of Participants' Revenue and Expenses
Statement of Comprehensive Income
Statement of Changes in Equity
Statement of Cash Flows
Notes to the Financial Statements
9
12
16
17
26
27
30
33
35
36
39
41

6
Board of Directors

7
Shari'ah Board Members

8
Management Team
9
Chairman's Report
10
Dear Shareholders,
May the Peace, Mercy and Blessing of Allah be with
you.
On behalf of the Board of Directors, and Management
team of Al Madina Insurance Co, I am pleased to
present to you a report on the detailed financial year
2015.
The 2015 financial results delivered by your Company
reflect our intent, capacity and expectations and
I believe that the company is steadily poised to
continue to reward both you as shareholders and as
policyholders (customers) as we go into the future.
The growth in gross contribution was over 34%.
The Company had to take a onetime impairment in
respect of its investment in National Takaful Company
(Watania) in UAE which has resulted in lower profit for
2015.
The management in Watania has taken steps to
improve its performance and synergies in the
operations of both the companies will help in reducing
cost and increasing profitability. Due to increase in
legal awards our motor portfolio experienced a slight
setback this year. It also contributed to the increase
in over all claims experience from 60% to 71%. The
management has taken corrective measures and its
positive impact will be evident in 2016. This will help
in getting Policyholder’s Fund back in surplus in the
current year.
As a leader in the Takaful industry in Oman, it has
been both an opportunity and a challenge for your
company to propel growth and continue to gain
share of the market. After a period of high growth, the
Oman insurance industry is now in the realm of steady
performance in 2015. While the market is registering
growth, the relative growth in revenues continues to
be impacted by several factors such as the increase
in the number of players and the resultant over
capacity, the competitive nature of the business, and
the overwhelming challenges in the larger economic
and fiscal context.
The momentum that we gained in 2014 was quickly
contested by the steady decline in oil prices and its
negative impact on the overall fiscal environment as
the year unfolded. Our preparedness for the situation
and our philosophy of looking at every challenge as
an opportunity helped us to consolidate our position,
and look at new ways to deliver success.
The year saw us to continue to inspire our customers,
business partners and stakeholders with our
innovative approach towards growth of businesses,
overall profitability and strengthening the presence of
Takaful in the Sultanate.
The company launched mInsurance: Oman’s first
mobile app for Insurance, supported by a dedicated
24/7 Call Center. It is a matter of pride that the software
backbone for our digital offerings are developed
in-house at Al Madina, under the name ‘Tameenet’.
We also recognized the increasing need for us to be
closer to our customers prompting us to arrive at a
strategic model of adopting kiosks at malls, placing
us in the everyday lives of our customers.
We continued our partnership with corporate Oman
by conducting workshops with key clients and
collaborating with them to develop bespoke Takaful
solutions for their needs, whilst enabling them to get
an understanding of Takaful and its principles.
Among the many initiatives that we engaged with the
11
community, our presence at the students’ career fair
stands out as it served well to increase the awareness
of Takaful amongst the young audience.
We also continued to build on the success of ‘Connect’
our internal newsletter, which has grown from being
an information tool to one that helps us engage with
all stakeholders, form employees, customers, to
regulators and media and increase the awareness for
Takaful.
The year also saw us initiate a series of internal email
campaigns for employee well-being and awareness
at the workplace, contributing to our healthy people
and HR strategy.
As you will know, the global economy, and especially
the region, continues to reel under the steady decline
of oil prices. It is important to recognise that the
situation is here to stay, and the recovery will be slow.
As a result, Government spending in the economy is
expected to be considerably lower which will have
negative impact on growth.
Adverse as it may sound, at Al Madina we have
always remained optimistic about our approach. I
believe that cyclical downturns is a time to introspect,
becoming more focused, disciplined and look out for
opportunities.
Becoming more cost efficient, enhancing our focus on
customer service, retaining our talented employees
are some of the ways in which we can come out of
these challenging conditions tougher, smarter and
profitable.
Innovation has never been more important to
organistions, and we need to work in synergy in the
areas of finding newer segments such as the growing
SME base, product development, distribution and
leveraging technology to elevate our levels of service
to customers.
With businesses becoming more cautious, insurance
will occupy a bigger role in the economy and the
changing regulations will mean companies that are
better managed and are financially strong will have a
key advantage going into the future.
Our successful journey as the flagbearer of the
Takaful industry in Oman is a consolidated effort
of all stakeholders. We particularly recognize the
continuous support of the CMA and their committed
people.
As a testimony to our leadership position and strong
governance, we proudly received two coveted
recognitions. Al Madina Takaful was named ‘General
Takaful Company of the Year’ at the 2nd Middle East
Insurance Industry Awards 2015 which attracted
close to 280 nominations in different categories from
across the region. In quick succession, we were
named the ‘Oman Insurer of the Year’ at the MENAIR
Insurance Awards 2016, which was even more special
to us as it was heavily contested by both Takaful
and conventional insurance providers operating in
Oman. Al Madina Takaful was named finalist in three
categories and was the only insurance company
from Oman, both local and global, to be recognized
at this year’s MENAIR Awards programme. Oman is
a relatively new entrant into the world of Takaful, and
securing these awards in the nascent stages of the
industry will give all the players confidence and the
encouragement to go further.
On behalf of the Board of Directors, I take this
opportunity to thank the Insurance community, both in
Oman and overseas, for the confidence reposed in the
company. I would also like to thank the Management
Team and all our employees for their dedication and
commitment to press ahead amid the challenging situation to reach higher levels of excellence.
The Board of Directors is deeply grateful to His Majesty
Sultan Qaboos Bin Said for his vision and guidance,
which has helped the country along its path of growth
and prosperity.
May the Peace, Mercy and Blessing of Allah be with
you. May God Bless you all.
Dr. Mohammed Ali Al BarwaniChairman of the Board
12
Management Discussion &Analysis Reportfor the financial year ended 31 December 2015
13
INTRODUCTIONThe oil prices, which started falling in the last quarter of 2014, had a slowdown effect on Oman’s economy in 2015. The GDP has fallen down by around 15% in 2015 as compared to the previous year. The contribution by Petroleum sector has fallen by around 40%. While the contribution from the crude oil has dropped by 42% the natural gas has posted a rise of 20% over the previous year. Construction has shown an increase of 8%. As a result there was heavy pressure on corporates to reduce the costs. This aided with softening of reinsurance market in the region as well as globally has resulted into steep reductions in premium rates in the Corporate Sector. The retail sector felt the pinch as well with consumer finance slowing down on lending and new car sales was down
OPERATIONAL PERFORMANCE
(in OMR ‘000) Shareholders General Takaful
Family Takaful
Consolidated
2015 2014Gross Written Contributions - 29,062 1,983 31,045 23,114
Net Retained Contributions - 12,443 517 12,960 12,898
Net Earned Contributions - 12,451 492 12,943 10,934
Net Claims Incurred (8,833) (217) (9,051) (6,233)
Provision for bad and doubtful debt (159) -- (159) (23)
Surplus from Takaful Operations before Wakala Fees -
3,296 172 3,468 4,152
Investment income 570 91 1 662 776
Loss on AFS Investment* (773) (773) --
Wakala Fees 5,176 (4,779) (397) -- --
Mudaraba Fee 64 (63) (1) -- --
Other Income 1 - - 1 11
General and administrative expenses
(4,141) - - (4,141) (3,707)
Policy Holder Surplus / Deficit - (1,457) (224) (1,681) 6
Profit before tax 897 -- -- 897 1,227
(Tax) / Refundable tax (69) - - (69) (210)
Profit after tax 828 -- -- 828 1,017
Earnings per share (in Baiza) 0.005 - - 0.005 0.006
Book value per share (in Baiza) 0.129 - - 0.129 0.120
* Note: The loss on AFS pertains to Company’s investment in National Takaful Company (Watania)
by 38%. On an average we have experienced 20% reductions from the expiring premium rates.
The crowning glory for Al Madina in 2015 was winning the coveted awards of being the General Takaful Company of the year in the Middle East, by Middle East Insurance Review and Oman Insurer of the Year by MENA Insurance Review. In a short span of 9 years since its inception to be recognized as the leader in its business segment and the market is an accolade that all its members can be proud of. These awards will also motivate the company to raise its performance bar few notches higher and continue to set innovative trends in fulfilling its vision of being the leading Takaful company in the region. The absence of Takaful law and regulations continue to challenge the industry but support received from Capital Market Authority has been very positive.
BUSINESSOman witnessed sluggish growth in GDP and ended the year with MSM index decline of 15%. The insurance market recorded double digit growth and
bulk of it was driven by medical insurance. Though the economy has slowed down, the projects that were sanctioned in 2014 or before came for implementation in 2015 thereby bringing in new premium to the books.
14
Al Madina was successful in getting some key projects as well as large operational accounts. We could succeed in striking a balance due to our favorable positioning in the regional and global markets based on our excellent underwriting strength, high retentions and a good branding. We have maintained our placements with A and above rated reinsurers.The Company continued to focus on building awareness in the community on Takaful through its Knowledge Forum. It sponsored in partnership with CMA and Deloitte a symposium to discuss the development of Takaful.
The Company continued to innovate by using technology in distribution and customer service. It launched mInsurance the first mobile insurance application offering products and claims services to its customers on their mobile phones. It also launched self-service Kiosks, which will be deployed across the country more and more in the coming years.
INVESTMENTSPerformance of the Company’s investment book was negatively impacted by the fall in the regional equity markets in the 4th quarter of 2015. Benchmark index (MSM Sharia index) for the company fell by 11.5% in 2015 impacting the performance of company’s equity portfolio. Although company’s fixed income generating assets provided some stability to the overall investment performance, still the total investment income fell well short of its budget. The company generated total investment income of RO 0.56 million in 2015 (before an impairment loss of RO 0.77 which the company had to take on a strategic investment, Watania) as against RO .78 million in 2014.
The equity markets are expected to remain volatile in 2016 due to looming uncertainty over the fate of the oil prices and its impact on the regional economies. The company plans to focus on diversifying its investment book into more stable investment portfolio and at the same time look for profitable opportunities in the equity segment.
CLAIMSThe first three quarters of the year witnessed higher accidents and slowly the fourth quarter witnessed lower accident rates due to ROP conducting awareness programs and laying stringent rules on the use of mobile phones during drive and Traffic fines on speed.
The trends of court awards for injury compensations have taken a higher level of awards which the country witnessed RO 230,000 awarded for a permanent disability which is the highest award for a single injury as far as the market is concerned , the increase in awards have significant hit in the financials of insurance companies which is a growing concern for the Industry .The accident death rate during 2013 was 913 , 816 during 2014 and same has fallen to 502 as of Sep 2015 which is 21 % fall in the average / month compared to the previous year.
The agencies continued to cut their discount rates which were offered previously and have parked their participation on participating in consolidated repairs due to growing complaints on repair quality to PACP .The effect on this we witnessed an increase of 8% increase in our agency repairs over the previous year.
New claim intimation process was implemented during the second half of the year where quality audit been put place to monitor the process quality, documentation and turnaround time to enhance the service standards to the clients along with operations centralized to process the claims intimated across Oman under one head . To mitigate the incurred claims new empanelment of garages across the branches being driven along with a new look on exploring of salvages through our counterpart in Abu Dhabi.
Proposal on handling recovery claims through Watniah being presented to the management considering the past cooperation issues with the UAE market and to ease the recovery procedures going forward with an outlook to ease the service facilitation to our mutual clients and trim the recoveries.
MANPOWER AND HRHR team launched an automated Performance Management System to align the corporate goals and objectives to individual goals. The system facilitates to monitor performance “As it Happens” and empowers performance monitoring at individual, departmental, and organizational levels.
HRA team launched a learning management system during 2015 which is aimed to facilitate self-paced learning and enabling employees to review their learning processes.
As a result of these initiatives, the HR team has been contributing to further a positive and performance
15
based culture in the organization. HR has embarked on the process of empowering employees to be able to understand how their individual performances contribute to the overall achievement of business objectives on one side, and on the other, it also empowers them to review their learning and development progresses. HRA team shall stay focused on these aspects for the year 2016.
Omanization percentage of 68.24% was achieved for the year 2015.
IT SERVICESThe management has recognized the need that utilization of innovative technological advancement in IT services can act as the driver to bring about great improvements in the quality of service rendered. Accordingly the management has continued to increase its investment in this domain which has resulted in the following:--Unique E Initiatives includes Product offering and Customer Services through Internet, Mobile devices and Interactive Kiosks as part of fulfilling our mission “to provide cost effective insurance and superior customer service in a manner that takes into account the culture, social ethos and needs of the community”. With these applications one can: -
• Know about us and the way how we work by ‘Takaful’ model
• Contact the team for assistance• Check offers, insurance packages and special
pricing • Buy a featured policy• Get assisted when met with an accident;• Get notified on claim movements• Sit back at home and track the claim• Identify our nearest branch and agency network• Identify the Garage and Hospital network
Internal Audit & ComplianceAl Madina Insurance Company continued to focus on the Internal Audit and Compliance Department through:
• Supporting and developing the Company’s internal audit function through identifying operational, financial, and administrative risks of the company.
• Supporting and developing the Company’s compliance function through consistent follow up on the Company’s operations to be according to
the rules and regulations governing the Sultanate of Oman.
• Supporting and developing of the Company’s complaints department through contacting the company’s clients and coordination with the Capital Market Authority.
• Audit & follow up commitment to the decisions & instructions of the Sharia’a Board with respect to all operational, financial, and administrative activities of the company.
• Supporting and developing the continuous training of the department’s staff members and encourage them to get professional certificates to compliment the Company’s progress.
FUTURE OUTLOOKWe anticipate a further slow down in 2016 but expect Government spending on infrastructure to be on track, thereby giving positive outlook on project insurances. There will be significant cutbacks in budgets and what is deemed as non-essential expenditures. There will be withdrawal of various subsidies like petrol, diesel, gas, water and electricity. Oil price will continue to fluctuate which will result in a volatile equity market for the region. Lower investments, reduction in subsidies, cutting back on benefits will have a negative impact on consumer spending and insurance price will be under severe pressure. Reinsurance markets, in the absence of major catastrophe losses continues to be soft and competitive which will act as a catalyst in keeping premiums low. In this kind of scenario companies will do well to hold their market share and maintain underwriting surplus after meeting all expenses. Focusing on profitable segments and discipline in keeping costs low will be key to success. Notwithstanding the economic prognosis we are optimistic about our future. Over the years we have invested in technology to increase our penetration in distribution, in sophisticated MIS to identify and competitively price the profitable segments and innovative applications that enhances customer experience and increases productivity. The Company has also invested in territorial diversification through its sister company Watania in Abu Dhabi. This will help in bringing down the cost of its reinsurance by building scale and share the cost of highly skilled resources ensuring quality in its offerings and at the same time reducing its expenses. We believe 2016 will be challenging but with the right mix of effort, focus and discipline there will be opportunities for the company that will have a positive outcome.
17
Report on CorporateGovernance
18
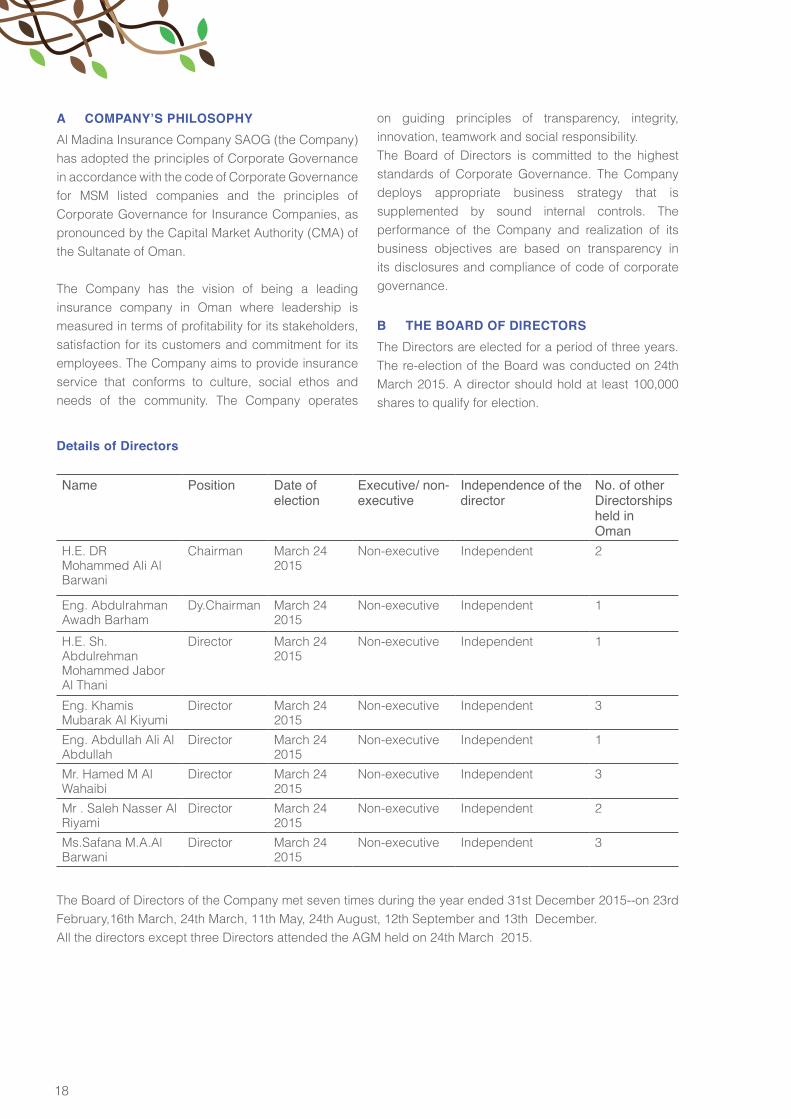
A COMPANY’S PHILOSOPHYAl Madina Insurance Company SAOG (the Company) has adopted the principles of Corporate Governance in accordance with the code of Corporate Governance for MSM listed companies and the principles of Corporate Governance for Insurance Companies, as pronounced by the Capital Market Authority (CMA) of the Sultanate of Oman.
The Company has the vision of being a leading insurance company in Oman where leadership is measured in terms of profitability for its stakeholders, satisfaction for its customers and commitment for its employees. The Company aims to provide insurance service that conforms to culture, social ethos and needs of the community. The Company operates
on guiding principles of transparency, integrity, innovation, teamwork and social responsibility.The Board of Directors is committed to the highest standards of Corporate Governance. The Company deploys appropriate business strategy that is supplemented by sound internal controls. The performance of the Company and realization of its business objectives are based on transparency in its disclosures and compliance of code of corporate governance.
B THE BOARD OF DIRECTORSThe Directors are elected for a period of three years. The re-election of the Board was conducted on 24th March 2015. A director should hold at least 100,000 shares to qualify for election.
Details of Directors
Name Position Date ofelection
Executive/ non-executive
Independence of thedirector
No. of other Directorships held inOman
H.E. DR Mohammed Ali AlBarwani
Chairman March 242015
Non-executive Independent 2
Eng. AbdulrahmanAwadh Barham
Dy.Chairman March 242015
Non-executive Independent 1
H.E. Sh. Abdulrehman Mohammed JaborAl Thani
Director March 242015
Non-executive Independent 1
Eng. KhamisMubarak Al Kiyumi
Director March 242015
Non-executive Independent 3
Eng. Abdullah Ali AlAbdullah
Director March 242015
Non-executive Independent 1
Mr. Hamed M AlWahaibi
Director March 242015
Non-executive Independent 3
Mr . Saleh Nasser AlRiyami
Director March 242015
Non-executive Independent 2
Ms.Safana M.A.AlBarwani
Director March 242015
Non-executive Independent 3
The Board of Directors of the Company met seven times during the year ended 31st December 2015--on 23rd February,16th March, 24th March, 11th May, 24th August, 12th September and 13th December.All the directors except three Directors attended the AGM held on 24th March 2015.
19
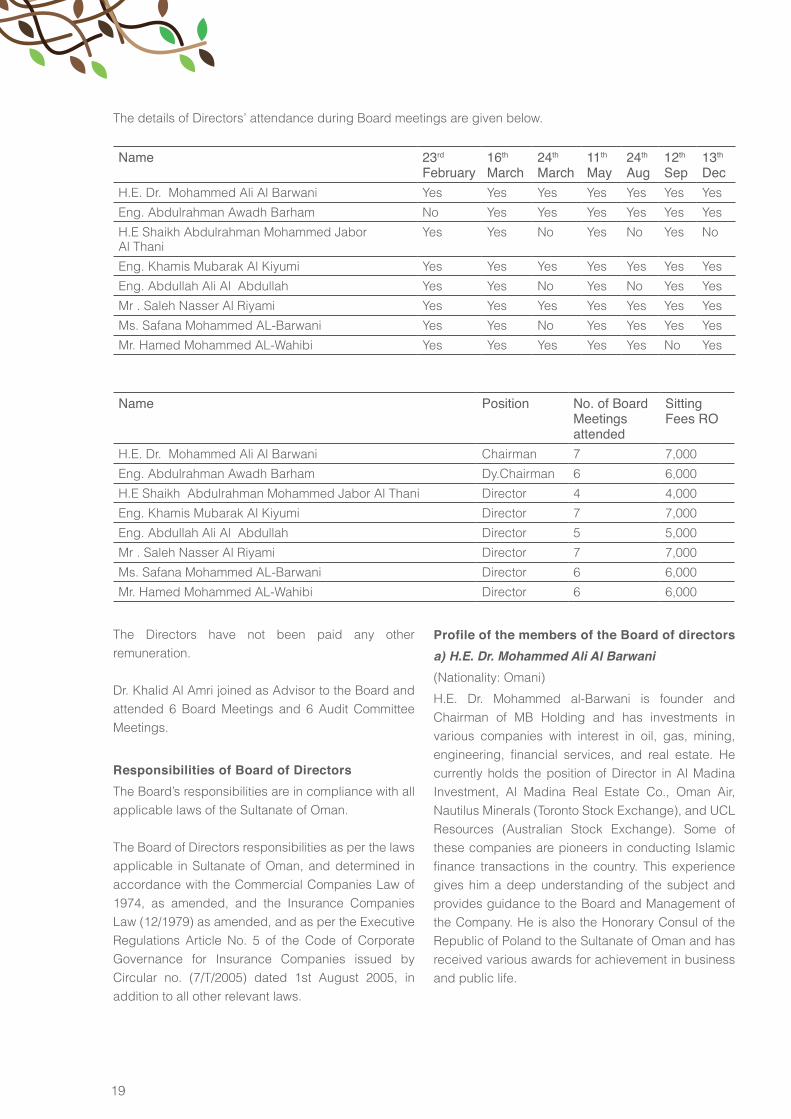
The details of Directors’ attendance during Board meetings are given below.
Name 23rd
February 16th
March 24th
March 11th
May 24th
Aug 12th
Sep 13th
DecH.E. Dr. Mohammed Ali Al Barwani Yes Yes Yes Yes Yes Yes Yes
Eng. Abdulrahman Awadh Barham No Yes Yes Yes Yes Yes Yes
H.E Shaikh Abdulrahman Mohammed JaborAl Thani
Yes Yes No Yes No Yes No
Eng. Khamis Mubarak Al Kiyumi Yes Yes Yes Yes Yes Yes Yes
Eng. Abdullah Ali Al Abdullah Yes Yes No Yes No Yes Yes
Mr . Saleh Nasser Al Riyami Yes Yes Yes Yes Yes Yes Yes
Ms. Safana Mohammed AL-Barwani Yes Yes No Yes Yes Yes Yes
Mr. Hamed Mohammed AL-Wahibi Yes Yes Yes Yes Yes No Yes
Name Position No. of Board Meetingsattended
SittingFees RO
H.E. Dr. Mohammed Ali Al Barwani Chairman 7 7,000
Eng. Abdulrahman Awadh Barham Dy.Chairman 6 6,000
H.E Shaikh Abdulrahman Mohammed Jabor Al Thani Director 4 4,000
Eng. Khamis Mubarak Al Kiyumi Director 7 7,000
Eng. Abdullah Ali Al Abdullah Director 5 5,000
Mr . Saleh Nasser Al Riyami Director 7 7,000
Ms. Safana Mohammed AL-Barwani Director 6 6,000
Mr. Hamed Mohammed AL-Wahibi Director 6 6,000
The Directors have not been paid any other remuneration.
Dr. Khalid Al Amri joined as Advisor to the Board and attended 6 Board Meetings and 6 Audit Committee Meetings.
Responsibilities of Board of DirectorsThe Board’s responsibilities are in compliance with all applicable laws of the Sultanate of Oman.
The Board of Directors responsibilities as per the laws applicable in Sultanate of Oman, and determined in accordance with the Commercial Companies Law of 1974, as amended, and the Insurance Companies Law (12/1979) as amended, and as per the Executive Regulations Article No. 5 of the Code of Corporate Governance for Insurance Companies issued by Circular no. (7/T/2005) dated 1st August 2005, in addition to all other relevant laws.
Profile of the members of the Board of directorsa) H.E. Dr. Mohammed Ali Al Barwani(Nationality: Omani)
H.E. Dr. Mohammed al-Barwani is founder and Chairman of MB Holding and has investments in various companies with interest in oil, gas, mining, engineering, financial services, and real estate. He currently holds the position of Director in Al Madina Investment, Al Madina Real Estate Co., Oman Air, Nautilus Minerals (Toronto Stock Exchange), and UCL Resources (Australian Stock Exchange). Some of these companies are pioneers in conducting Islamic finance transactions in the country. This experience gives him a deep understanding of the subject and provides guidance to the Board and Management of the Company. He is also the Honorary Consul of the Republic of Poland to the Sultanate of Oman and has received various awards for achievement in business and public life.
20
b) Eng. Abdulrehman Awadh Barham(Nationality: Omani)
Eng. Barham is the Vice Chairman of the Company and has over 25 years of experience in handling and planning projects. He currently holds the position of CEO and investment committee member in Al Madina Real Estate. He has a profound understanding of the products relevant to finance real estate projects. He also holds the position of Director in Salalah Mills Company SAOG, Tilal Development Company SAOC, Shaden Development Company SAOC and Shaza Muscat Hotel Company SAOC.
c) H.E. Sheikh Abdulrehman Mohammed JabrAl Thani (Nationality: Qatari)
H.E. Sheikh Al Thani has over 35 years of experience in industrial investments and private sector. He currently holds the position of Vice Chairman in Al Madina investment, Director in Oman & Qatar Company and Qatar Industrial Manufacturing. He is involved closely with Islamic financial institutions in Qatar and is able to provide guidance based on his knowledge and expertise gained from these institutions.
d) Eng. Khamis Mubarak Al Kiyumi(Nationality: Omani)
Eng. Kiyumi, an Industrial Engineer, has over 30 years of experience in industrial investments and private sector.He is one of the pioneers in introducing Islamic finance services in the country. His close relationship with leading experts in Islamic Financial Services in Malaysia helps him to bring the changes in the global Islamic financial services industry to Oman. He currently holds the position of CEO and Director in Al Madina Investment He also holds the position of Chairman in Gulf Mushroom Products Company SAOG, Al Madina Real Estate Company SAOC and Shaden Development Company SAOC.
e) Eng. Abdullah Ali Abdullah (Nationality: Qatari)
Eng. Abdullah has over 35 years of experience in investments. He currently holds the position of Director in Trans Gulf Investment Holding, Al Madina Investment Finance and Al Madina Real State. He is closely associated with leading Islamic financial institutions in Qatar and brings a wealth of experience and knowledge gained from his dealings with such institutions.
f) Saleh Nasser Sulaiman Al Riyami(Nationality: Omani)Mr. Riyami has more than 15 years of experience as an investment expert. He currently holds the position of Vice Chairman at Oman Ceramics and Taageer Finance. Mr. Riyami has put in an effort to attract key Islamic Shariah scholars who are experts in Islamic financial services in the GCC region to provide consultation in the field of Islamic financial services in coordination with Omani consulting firms.
g) Safana Mohammed Ali Al Barwani(Nationality: Omani)
Ms. Safana has 10 years of experience in investment, insurance and real estate. She holds the position of Director in Mazoon Petro Gas, Risk Management Services and Interior Hotels.
h) Hamed Mohammed Al Wahaibi(Nationality: Omani)
Mr. Hamad Mohammad Hamood Al Wahaibi has been the Director of Investment at Ministry of Defense Pension Fund for the last seven years. He also serves as a board member of Galfar Engineering and Contracting Company and Voltamp Energy Company. Al Wahaibi holds an MBA, specializing in Finance, and is a Chartered Financial Analyst (CFA) and Chartered Alternative Investment Analyst (CAIA) charterholder.
i) Khalid Al Amri (Nationality: Omani)
Dr. Khalid Al Amri PhD, has joined as an Advisor to the Board of Directors of Al Madina Insurance Co. SAOG . Dr. Khalid has done his PhD in Risk Management and Insurance (Major) and Finance (2nd Major) from the Temple University – Fox School of Business Philadelphia, USA. He is a Msc. In Actuarial Science from Boston University, USA and is currently Assistant Professor at the College of Economics and Political Science, Sultan Qaboos University.
C AUDIT COMMITTEE The Audit Committee comprising of three non-executive and independent members is constituted by the Board, to guide the Finance, Audit and Accounting functions and to ensure adherence to best practices. The Audit Committee met six times during the year ended 31st December 2015 on 23rd February, 23rd April, 29th July, 19th August, 25th October and 1st December 2015.
21
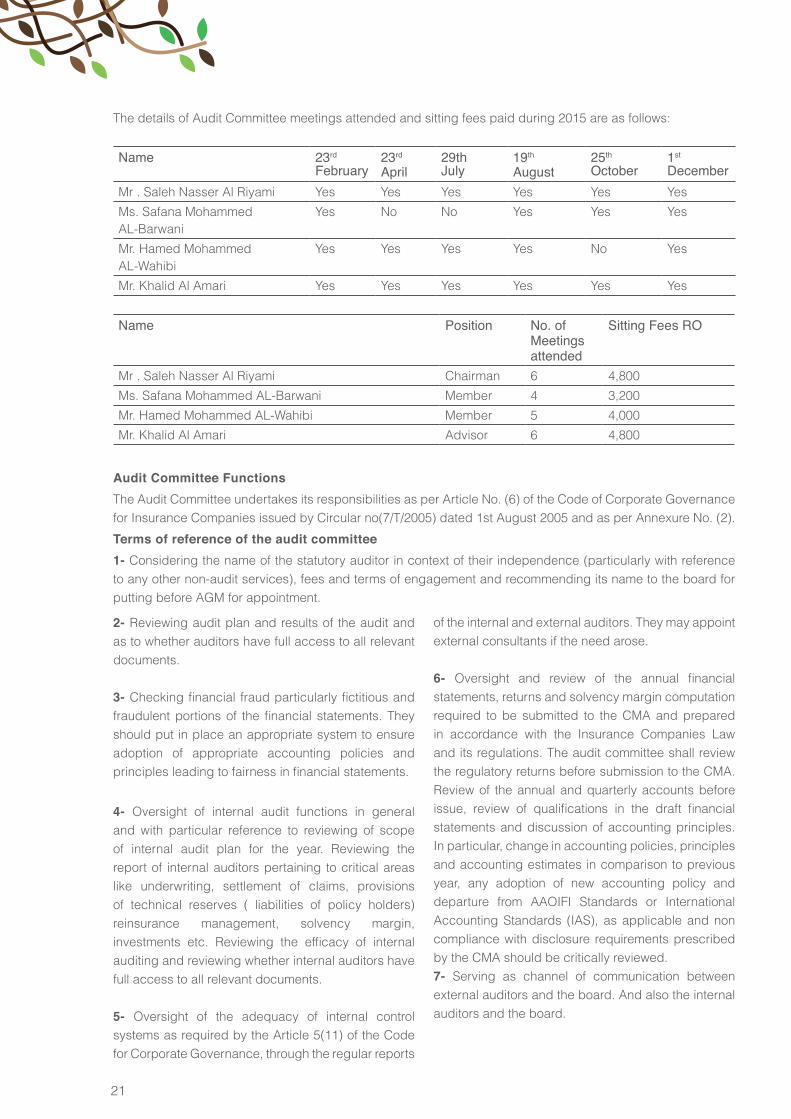
The details of Audit Committee meetings attended and sitting fees paid during 2015 are as follows:
Name 23rd
February 23rd
April29thJuly
19th
August 25th
October 1st
DecemberMr . Saleh Nasser Al Riyami Yes Yes Yes Yes Yes Yes
Ms. Safana MohammedAL-Barwani
Yes No No Yes Yes Yes
Mr. Hamed MohammedAL-Wahibi
Yes Yes Yes Yes No Yes
Mr. Khalid Al Amari Yes Yes Yes Yes Yes Yes
Name Position No. of Meetingsattended
Sitting Fees RO
Mr . Saleh Nasser Al Riyami Chairman 6 4,800
Ms. Safana Mohammed AL-Barwani Member 4 3,200
Mr. Hamed Mohammed AL-Wahibi Member 5 4,000
Mr. Khalid Al Amari Advisor 6 4,800
Audit Committee FunctionsThe Audit Committee undertakes its responsibilities as per Article No. (6) of the Code of Corporate Governance for Insurance Companies issued by Circular no(7/T/2005) dated 1st August 2005 and as per Annexure No. (2).
Terms of reference of the audit committee1- Considering the name of the statutory auditor in context of their independence (particularly with reference to any other non-audit services), fees and terms of engagement and recommending its name to the board for putting before AGM for appointment.
2- Reviewing audit plan and results of the audit and as to whether auditors have full access to all relevant documents.
3- Checking financial fraud particularly fictitious and fraudulent portions of the financial statements. They should put in place an appropriate system to ensure adoption of appropriate accounting policies and principles leading to fairness in financial statements.
4- Oversight of internal audit functions in general and with particular reference to reviewing of scope of internal audit plan for the year. Reviewing the report of internal auditors pertaining to critical areas like underwriting, settlement of claims, provisions of technical reserves ( liabilities of policy holders) reinsurance management, solvency margin, investments etc. Reviewing the efficacy of internal auditing and reviewing whether internal auditors have full access to all relevant documents.
5- Oversight of the adequacy of internal control systems as required by the Article 5(11) of the Code for Corporate Governance, through the regular reports
of the internal and external auditors. They may appoint external consultants if the need arose.
6- Oversight and review of the annual financial statements, returns and solvency margin computation required to be submitted to the CMA and prepared in accordance with the Insurance Companies Law and its regulations. The audit committee shall review the regulatory returns before submission to the CMA. Review of the annual and quarterly accounts before issue, review of qualifications in the draft financial statements and discussion of accounting principles. In particular, change in accounting policies, principles and accounting estimates in comparison to previous year, any adoption of new accounting policy and departure from AAOIFI Standards or International Accounting Standards (IAS), as applicable and non compliance with disclosure requirements prescribed by the CMA should be critically reviewed.7- Serving as channel of communication between external auditors and the board. And also the internal auditors and the board.
22
8- Reviewing risk management policies of the insurer as required by the article 5 (3) of the Code for Corporate Governance of Insurance Companies.9- Reviewing proposed specific transactions with the related parties for making suitable recommendations to the board.
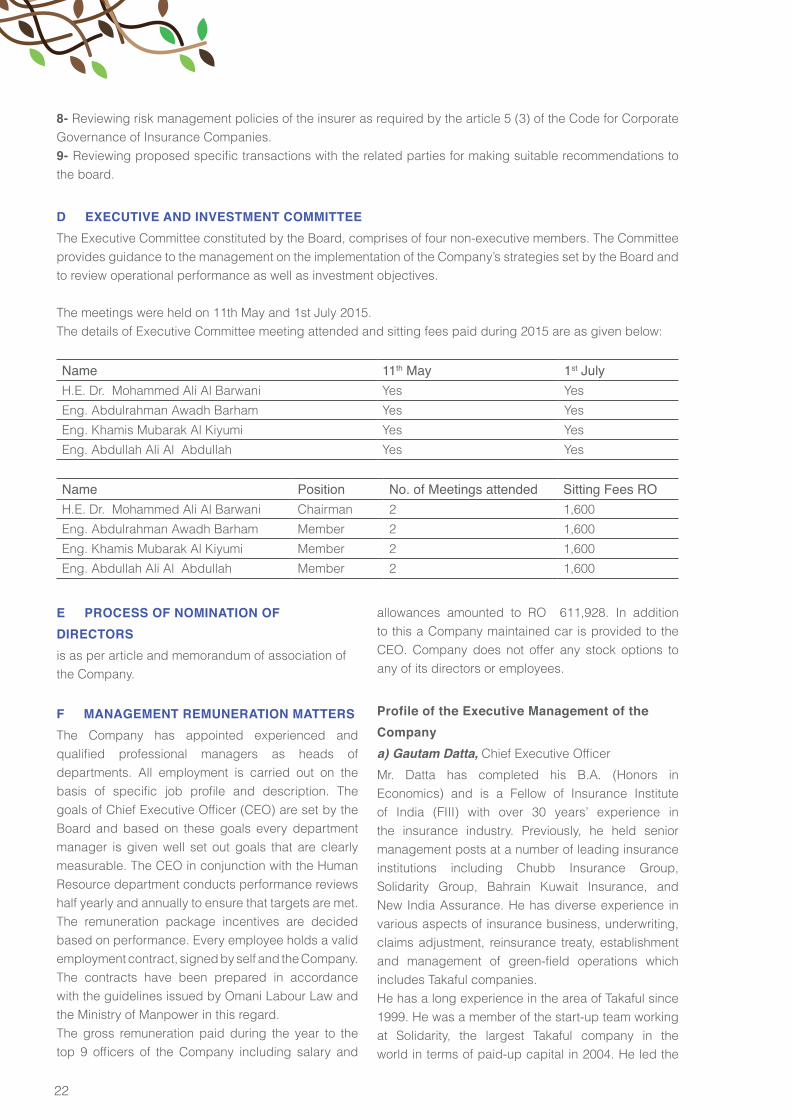
D EXECUTIVE AND INVESTMENT COMMITTEE The Executive Committee constituted by the Board, comprises of four non-executive members. The Committee provides guidance to the management on the implementation of the Company’s strategies set by the Board and to review operational performance as well as investment objectives.
The meetings were held on 11th May and 1st July 2015.The details of Executive Committee meeting attended and sitting fees paid during 2015 are as given below:
Name 11th May 1st JulyH.E. Dr. Mohammed Ali Al Barwani Yes Yes
Eng. Abdulrahman Awadh Barham Yes Yes
Eng. Khamis Mubarak Al Kiyumi Yes Yes
Eng. Abdullah Ali Al Abdullah Yes Yes
Name Position No. of Meetings attended Sitting Fees ROH.E. Dr. Mohammed Ali Al Barwani Chairman 2 1,600
Eng. Abdulrahman Awadh Barham Member 2 1,600
Eng. Khamis Mubarak Al Kiyumi Member 2 1,600
Eng. Abdullah Ali Al Abdullah Member 2 1,600
E PROCESS OF NOMINATION OF DIRECTORSis as per article and memorandum of association of the Company.
F MANAGEMENT REMUNERATION MATTERSThe Company has appointed experienced and qualified professional managers as heads of departments. All employment is carried out on the basis of specific job profile and description. The goals of Chief Executive Officer (CEO) are set by the Board and based on these goals every department manager is given well set out goals that are clearly measurable. The CEO in conjunction with the Human Resource department conducts performance reviews half yearly and annually to ensure that targets are met. The remuneration package incentives are decided based on performance. Every employee holds a valid employment contract, signed by self and the Company. The contracts have been prepared in accordance with the guidelines issued by Omani Labour Law and the Ministry of Manpower in this regard. The gross remuneration paid during the year to the top 9 officers of the Company including salary and
allowances amounted to RO 611,928. In addition to this a Company maintained car is provided to the CEO. Company does not offer any stock options to any of its directors or employees.
Profile of the Executive Management of the Companya) Gautam Datta, Chief Executive Officer
Mr. Datta has completed his B.A. (Honors in Economics) and is a Fellow of Insurance Institute of India (FIII) with over 30 years’ experience in the insurance industry. Previously, he held senior management posts at a number of leading insurance institutions including Chubb Insurance Group, Solidarity Group, Bahrain Kuwait Insurance, and New India Assurance. He has diverse experience in various aspects of insurance business, underwriting, claims adjustment, reinsurance treaty, establishment and management of green-field operations which includes Takaful companies.He has a long experience in the area of Takaful since 1999. He was a member of the start-up team working at Solidarity, the largest Takaful company in the world in terms of paid-up capital in 2004. He led the
23
initiative to obtain a license for the company in KSA. He participated actively with members of the Shariah Board in the process of establishing structures for Wakala fees and wrote a number of essays in tackling this topic. The Company was established as a joint project with Solidarity with all its systems created by the latter to be compatible with the Takaful system. He joined as the CEO of the Company to help it understand the model of Takaful business and operations.
b) Usama Al Barwani, Deputy CEO
Mr. Usama is pursuing his MBA and has completed his Postgraduate Diploma in HRM and Diploma in Information System Management and Education. He is a Certified Islamic Specialist in Islamic Insurance and a Certified Compliance Officer. He has over 23 years of experience in HR and Administration. He is involved in the meetings held with specialists in Shariah consulting services in respect of transforming the Company’s activities into Takaful based insurance.
c) Ajay Srivastava, General Manager – Commercial
Mr. Srivastava has completed his Bachelor of Science (Honors). He has a Bachelor’s degree in Law and is an Associate of Insurance Institute of India (AIII), with over 24 years of insurance experience in Indian & London Insurance markets. Amongst his experiences, he has been involved in one of India’s largest petrochemical plant (ONGC) and with one of the large auto manufacturer of India (Daewoo Motors). He developed and serviced one of UK’s largest furnishing Chain (ROSEBYS) and Hotel Chains (Aurora group) during his career.
d) Sandeep Mahajan, General Manager – Specialty
Mr. Mahajan has completed his BE (Mechanical), MBA (Finance) & is a Fellow of Insurance Institute of India (FIII). He has over 20 years’ experience in technical departments of various local and multinational insurance companies in India and GCC including AIG and Oriental Insurance. As a loss control engineer, he has more than 500 risk surveys to the credit, including petrochemicals and major properties like Zuari Agro Chemicals, Deepak Fertilizers, Tata Motors, etc. Over the period, he moved to underwriting and reinsurance and has handled major programs including Sohar Aluminum, Ministry of Defence and Oman Gas amongst others. He has been dealing with major international reinsurers and brokers in the current role.
e) R. M. Sundaram, General Manager - Finance and
Accounts
Mr. Sundaram has completed his Bachelors in Science. He is also an Associate of Institute of Cost & Works Accountants of India and Certified Management Accountant, issued by the Institute of Certified Management Accountants, New Jersey, USA, with over 30 years of experience in Insurance and Banking in India and the GCC.
f) Nasser Al Shueili, General Manager – Claims
Mr. Nasser has completed his Diploma in Insurance (CIII). He has over 18 years of experience in underwriting, audit, non-motor and motor claims in Omani and multinational insurance companies in the region.
g) Mahmud Attar, General Manager - Compliance
and Internal Audit
Mr. Mahmud has completed his Bachelor in Administrative Science & Accounting. He has over 30 years of experience in Islamic Banking and retail sector in the Gulf, expertise in audit and compliance functions.
Whilst at Bahrain Islamic Bank, he was instrumental in defining audit manual and overseeing the audit programs, risk assessments criteria and risk assessment audits. He was a key member of the team that was responsible for changing the Company’s activities to the Takaful insurance system and its obtainment of the necessary license from the CMA.
h) Girish Gopinath, Senior Manager – IT
Mr. Gopinath has more than 23 years of experience in software product development. He is the Chief architect for the Company’s own brand ‘Tameenet’ which supports retail product development, customer services and online delivery. Prior to joining the Company, Mr. Girish has worked for Oman United Insurance and Veritas DGC Ltd. He has completed his Bachelor in Computer Science and Masters in Banking and Insurance from India.
G AREAS OF NON COMPLIANCEDuring the year there have been no strictures or penalties imposed on the Company by the Muscat Security Market or Capital Market Authority for non-compliance with the code of Corporate Governance For Insurance Companies.
24
H MEANS OF COMMUNICATION WITH SHAREHOLDERSAs per the legal requirements, a notice is sent to the shareholders for the Annual General Meeting together with the annual audited financial statements including details of related party transactions (which are entered into on an arm’s length basis) along with the Chairman’s Report and MD & A Report. The nature and value of related party transactions are disclosed by way of a note to the financial statements.
The Company has become a public joint stock company in December 2013. The quarterly results of the company are disclosed to the public through announcements in MSM website as per statutory requirements.
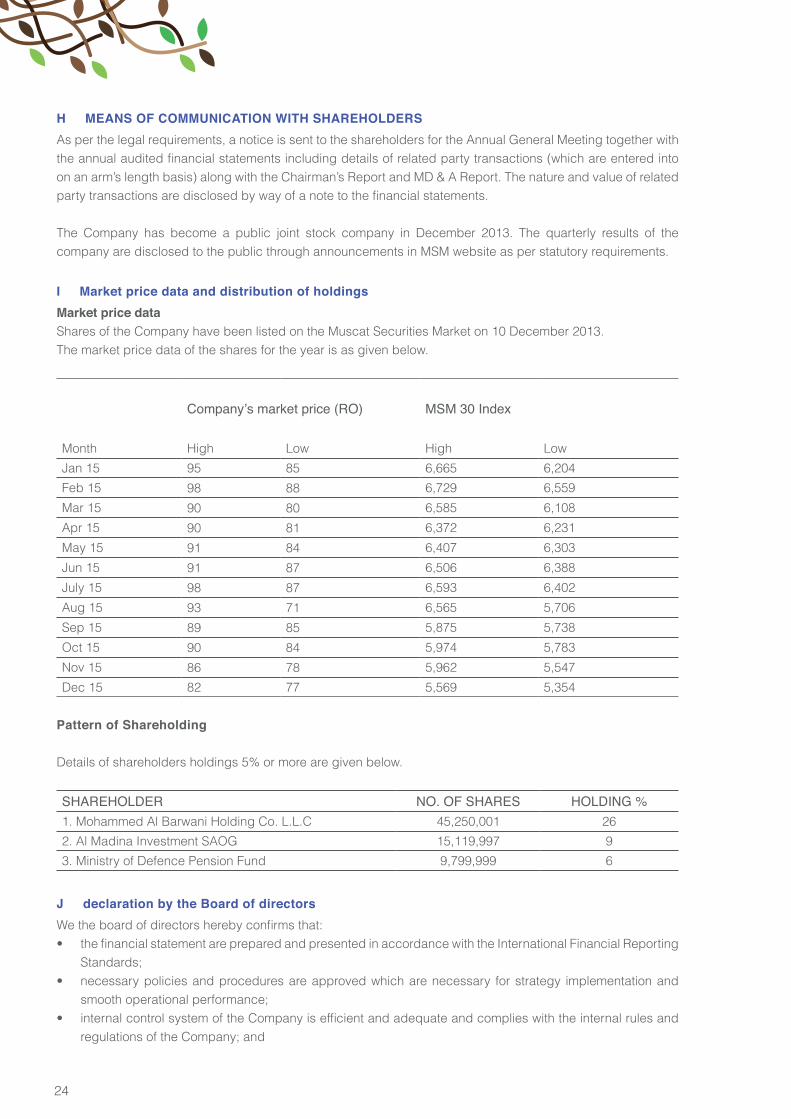
I Market price data and distribution of holdingsMarket price dataShares of the Company have been listed on the Muscat Securities Market on 10 December 2013.The market price data of the shares for the year is as given below.
Company’s market price (RO) MSM 30 Index
Month High Low High Low
Jan 15 95 85 6,665 6,204
Feb 15 98 88 6,729 6,559
Mar 15 90 80 6,585 6,108
Apr 15 90 81 6,372 6,231
May 15 91 84 6,407 6,303
Jun 15 91 87 6,506 6,388
July 15 98 87 6,593 6,402
Aug 15 93 71 6,565 5,706
Sep 15 89 85 5,875 5,738
Oct 15 90 84 5,974 5,783
Nov 15 86 78 5,962 5,547
Dec 15 82 77 5,569 5,354
Pattern of Shareholding
Details of shareholders holdings 5% or more are given below.
SHAREHOLDER NO. OF SHARES HOLDING %1. Mohammed Al Barwani Holding Co. L.L.C 45,250,001 26
2. Al Madina Investment SAOG 15,119,997 9
3. Ministry of Defence Pension Fund 9,799,999 6
J declaration by the Board of directorsWe the board of directors hereby confirms that:• the financial statement are prepared and presented in accordance with the International Financial Reporting
Standards;• necessary policies and procedures are approved which are necessary for strategy implementation and
smooth operational performance;• internal control system of the Company is efficient and adequate and complies with the internal rules and
regulations of the Company; and
25
• there are no material matters, which will affect the Company’s ability to continue its operations in the coming financial years.
K PROFILE OF THE STATUTORY AUDITORSAbout DeloitteDeloitte refers to one or more of Deloitte Touche Tohmatsu Limited, a UK private company limited by guarantee (“DTTL”), its network of member firms, and their related entities. DTTL and each of its member firms are legally separate and independent entities. DTTL (also referred to as “Deloitte Global”) does not provide services to clients. Please see www.deloitte.com/about/ for a more detailed description of DTTL and its member firms.Deloitte provides audit, consulting, financial advisory, risk management, tax and related services to public and private clients spanning multiple industries. With a globally connected network of member firms in more than 150 countries and territories, Deloitte brings world-class capabilities and high-quality service to clients, delivering the insights they need to address their most complex business challenges. Deloitte’s more than 220,000 professionals are committed to making an impact that matters.
About Deloitte & Touche (M.E.)Deloitte & Touche (M.E.) is a member firm of Deloitte Touche Tohmatsu Limited (DTTL) and is a leading professional services firm established in the Middle East region with uninterrupted presence since 1926.Deloitte provides audit, tax, consulting, and financial advisory services through 26 offices in 15 countries with more than 3,300 partners, directors and staff. It is a Tier 1 Tax advisor in the GCC region since 2010 (according to the International Tax Review World Tax Rankings). It has also received numerous awards in the last few years which include best employer in the Middle East, best consulting firm, the Middle East Training & Development Excellence Award by the Institute of Chartered Accountants in England and Wales (ICAEW), as well as the best CSR integrated organization.
For the year 2015, professional fee (Statutory Audit RO 10,250 and other services RO 5,650) has been charged for RO 15,900 by them to the organization.
For Al Madina Insurance Company SAOG
26
27
28
29
Financial Statementsfor the financial year ended 31 December 2015
30
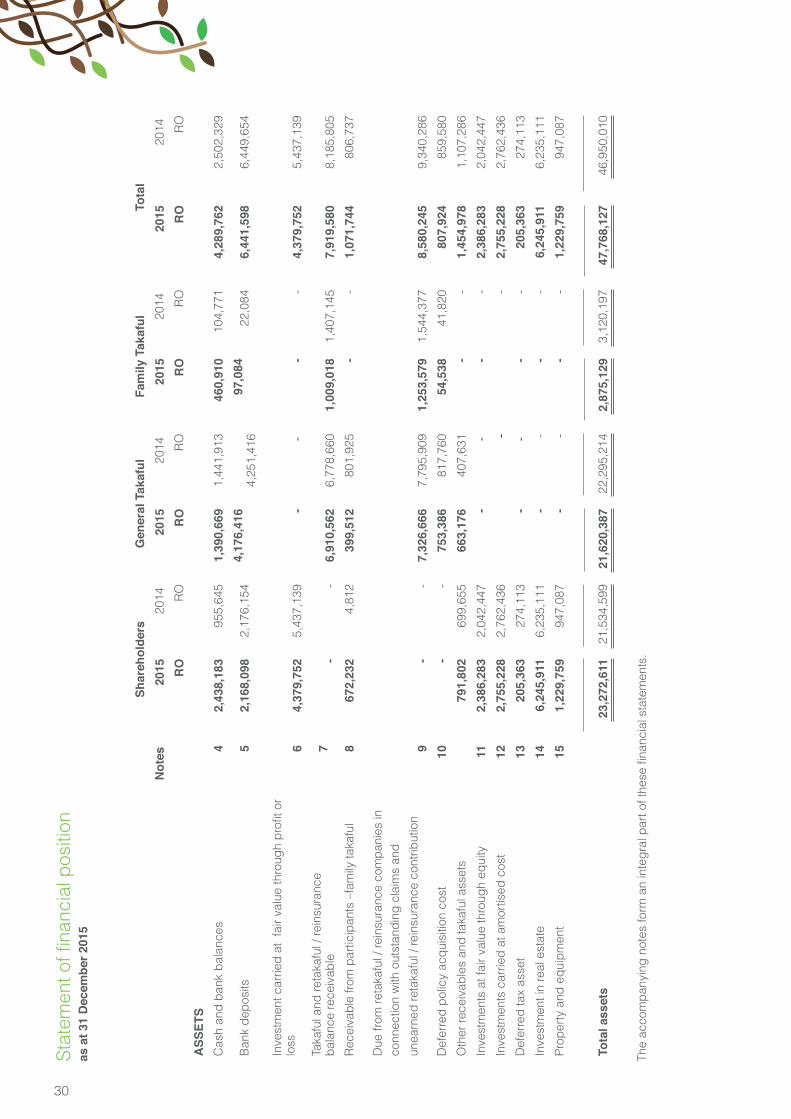
Stat
emen
t of fi
nanc
ial p
ositi
on
as a
t 31
Dec
embe
r 201
5
Shar
ehol
ders
Gen
eral
Tak
aful
Fam
ily T
akaf
ulTo
tal
Not
es20
1520
14
2015
2014
20
1520
14
2015
2014
RO
RO
RO
RO
RO
RO
RO
RO
ASS
ETS
Cas
h an
d ba
nk b
alan
ces
42,
438,
183
955,
645
1,39
0,66
91,
441,
913
460,
910
104,
771
4,28
9,76
2 2
,502
,329
Ban
k de
posi
ts5
2,16
8,09
82,
176,
154
4,17
6,41
6
4
,251
,416
97,0
8422
,084
6,44
1,59
8 6
,449
,654
Inve
stm
ent c
arrie
d at
fai
r val
ue th
roug
h pr
ofit o
rlo
ss6
4,37
9,75
25,
437,
139
- -
--
4,37
9,75
2 5
,437
,139
Tak
aful
and
reta
kafu
l / re
insu
ranc
eba
lanc
e re
ceiv
able
7-
-6,
910,
562
6,77
8,66
01,
009,
018
1,40
7,14
57,
919,
580
8,18
5,80
5
Rec
eiva
ble
from
par
ticip
ants
–fa
mily
taka
ful
867
2,23
24,
812
399,
512
801,
925
--
1,07
1,74
480
6,73
7
Due
from
reta
kafu
l / re
insu
ranc
e co
mpa
nies
in c
onne
ctio
n w
ith o
utst
andi
ng c
laim
s an
d
unea
rned
reta
kafu
l / re
insu
ranc
e co
ntrib
utio
n 9
--
7,32
6,66
6 7
,795
,909
1,25
3,57
91,
544,
377
8,58
0,24
5 9
,340
,286
Def
erre
d po
licy
acqu
isiti
on c
ost
10-
-75
3,38
681
7,76
054
,538
41,8
2080
7,92
485
9,58
0
Oth
er re
ceiv
able
s an
d ta
kafu
l ass
ets
791,
802
699,
655
663,
176
407,
631
--
1,45
4,97
81,
107,
286
Inve
stm
ents
at f
air v
alue
thro
ugh
equi
ty11
2,38
6,28
32,
042,
447
- -
--
2,38
6,28
3 2
,042
,447
Inve
stm
ents
car
ried
at a
mor
tised
cos
t12
2,75
5,22
82,
762,
436
--
2,75
5,22
8 2
,762
,436
Def
erre
d ta
x as
set
1320
5,36
327
4,11
3-
- -
-20
5,36
327
4,11
3
Inve
stm
ent i
n re
al e
stat
e14
6,24
5,91
16,
235,
111
--
--
6,24
5,91
1 6
,235
,111
Prop
erty
and
equ
ipm
ent
151,
229,
759
947,
087
--
--
1,22
9,75
994
7,08
7
Tota
l ass
ets
23,2
72,6
11 2
1,53
4,59
921
,620
,387
22,2
95,2
142,
875,
129
3,12
0,19
747
,768
,127
46,9
50,0
10
The
acco
mpa
nyin
g no
tes
form
an
inte
gral
par
t of t
hese
fina
ncia
l sta
tem
ents
.
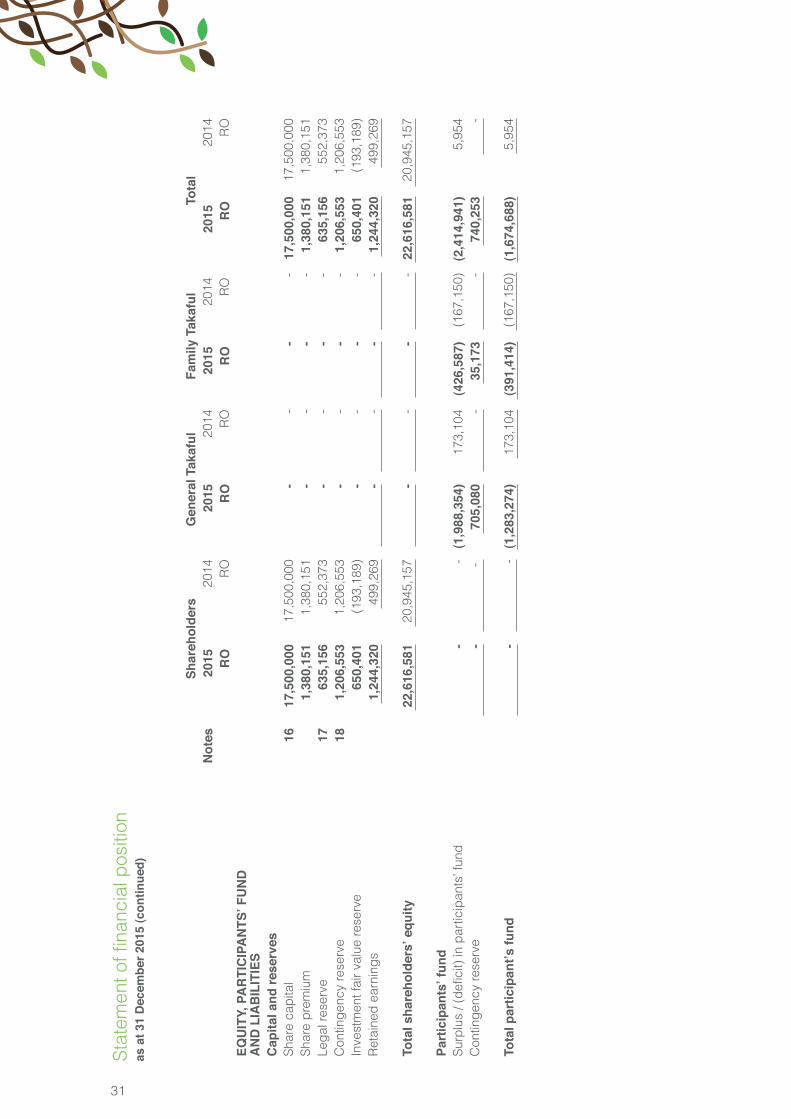
31
Stat
emen
t of fi
nanc
ial p
ositi
on
as a
t 31
Dec
embe
r 201
5 (c
ontin
ued)
Shar
ehol
ders
Gen
eral
Tak
aful
Fam
ily T
akaf
ulTo
tal
Not
es20
1520
1420
1520
1420
1520
1420
15
2014
RO
RO
RO
RO
RO
RO
RO
RO
EQU
ITY,
PA
RTI
CIP
AN
TS’ F
UN
DA
ND
LIA
BIL
ITIE
SC
apita
l and
rese
rves
Shar
e ca
pita
l16
17,5
00,0
0017
,500
,000
--
--
17,5
00,0
00 1
7,50
0,00
0Sh
are
prem
ium
1,38
0,15
11,
380,
151
--
--
1,38
0,15
1 1
,380
,151
Lega
l res
erve
1763
5,15
655
2,37
3-
--
-63
5,15
655
2,37
3C
ontin
genc
y re
serv
e18
1,20
6,55
31,
206,
553
--
--
1,20
6,55
3 1
,206
,553
Inve
stm
ent f
air v
alue
rese
rve
650,
401
(193
,189
)-
--
-65
0,40
1(1
93,1
89)
Ret
aine
d ea
rnin
gs1,
244,
320
499,
269
-
-
-
-1,
244,
320
499,
269
Tota
l sha
reho
lder
s’ e
quity
22,6
16,5
8120
,945
,157
-
-
-
-
22,6
16,5
81 2
0,94
5,15
7
Part
icip
ants
’ fun
dSu
rplu
s / (
defic
it) in
par
ticip
ants
’ fun
d-
-(1
,988
,354
)17
3,10
4(4
26,5
87)
(167
,150
)(2
,414
,941
)5,
954
Con
tinge
ncy
rese
rve
-
-
705,
080
-35
,173
-74
0,25
3
-
Tota
l par
ticip
ant’s
fund
-
-
(1,2
83,2
74)
173,
104
(391
,414
)(1
67,1
50)
(1,6
74,6
88)
5,95
4
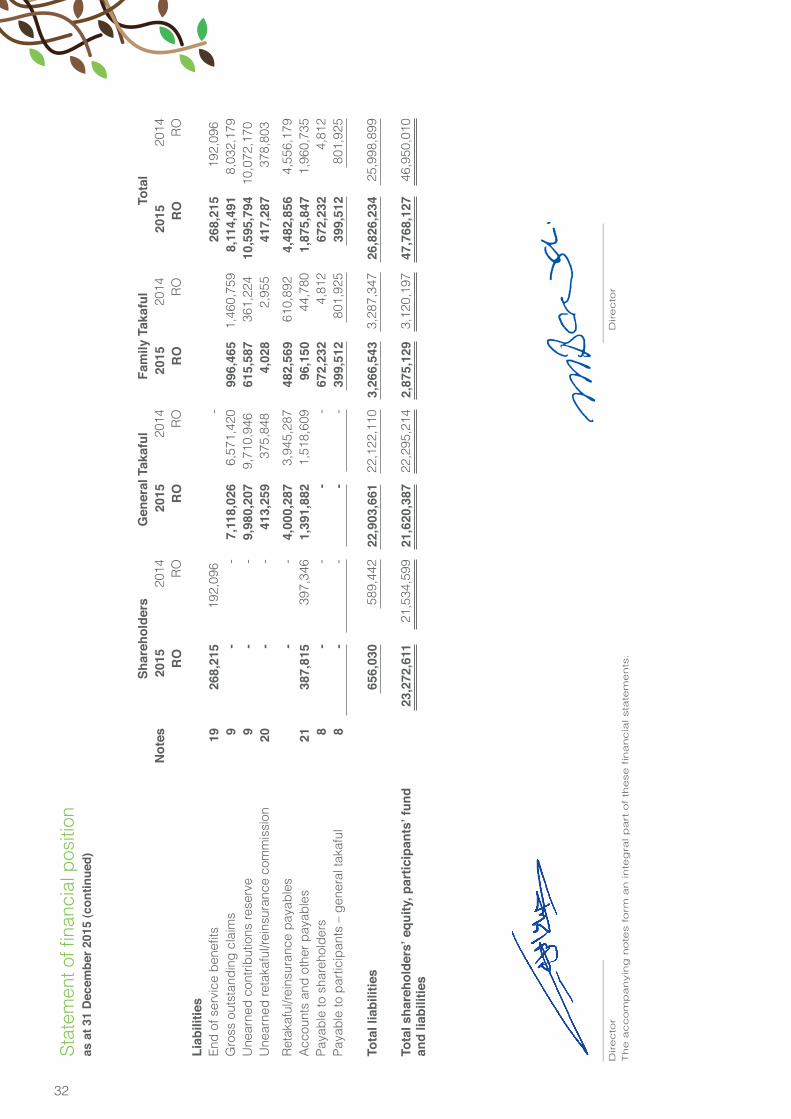
32
Stat
emen
t of fi
nanc
ial p
ositi
on
as a
t 31
Dec
embe
r 201
5 (c
ontin
ued)
Liab
ilitie
sEn
d of
ser
vice
ben
efits
1926
8,21
5 1
92,0
96
-26
8,21
5 1
92,0
96
Gro
ss o
utst
andi
ng c
laim
s9
--
7,11
8,02
66,
571,
420
996,
465
1,4
60,7
598,
114,
491
8,03
2,17
9U
near
ned
cont
ribut
ions
rese
rve
9-
-9,
980,
207
9,7
10,9
46
615,
587
361
,224
10
,595
,794
10,
072,
170
Une
arne
d re
taka
ful/r
eins
uran
ce c
omm
issi
on20
--
413,
259
375
,848
4,
028
2,9
55
417,
287
378
,803
Ret
akaf
ul/re
insu
ranc
e pa
yabl
es-
-4,
000,
287
3,94
5,28
748
2,56
9 6
10,8
92
4,48
2,85
64,
556,
179
Acc
ount
s an
d ot
her p
ayab
les
2138
7,81
539
7,34
61,
391,
882
1,5
18,6
0996
,150
44,
780
1,87
5,84
71,
960,
735
Paya
ble
to s
hare
hold
ers
8-
--
-67
2,23
24,
812
672,
232
4,81
2Pa
yabl
e to
par
ticip
ants
– g
ener
al ta
kafu
l8
-
-
-
-
399,
512
801,
925
399,
512
801,
925
Tota
l lia
bilit
ies
656,
030
589,
442
22,9
03,6
6122
,122
,110
3,26
6,54
33,
287,
347
26,8
26,2
3425
,998
,899
Tot
al s
hare
hold
ers’
equ
ity, p
artic
ipan
ts’ f
und
and
liabi
litie
s23
,272
,611
21,
534,
599
21,6
20,3
8722
,295
,214
2,87
5,12
93,
120,
197
47,7
68,1
2746
,950
,010
_________________
____________________
Directo
r
D
irecto
r The a
ccom
panyin
g n
ote
s f
orm
an inte
gra
l p
art
of
these
fin
an
cia
l sta
tem
en
ts.
Shar
ehol
ders
Gen
eral
Tak
aful
Fam
ily T
akaf
ulTo
tal
Not
es20
1520
1420
1520
1420
1520
1420
15
2014
RO
RO
RO
RO
RO
RO
RO
RO
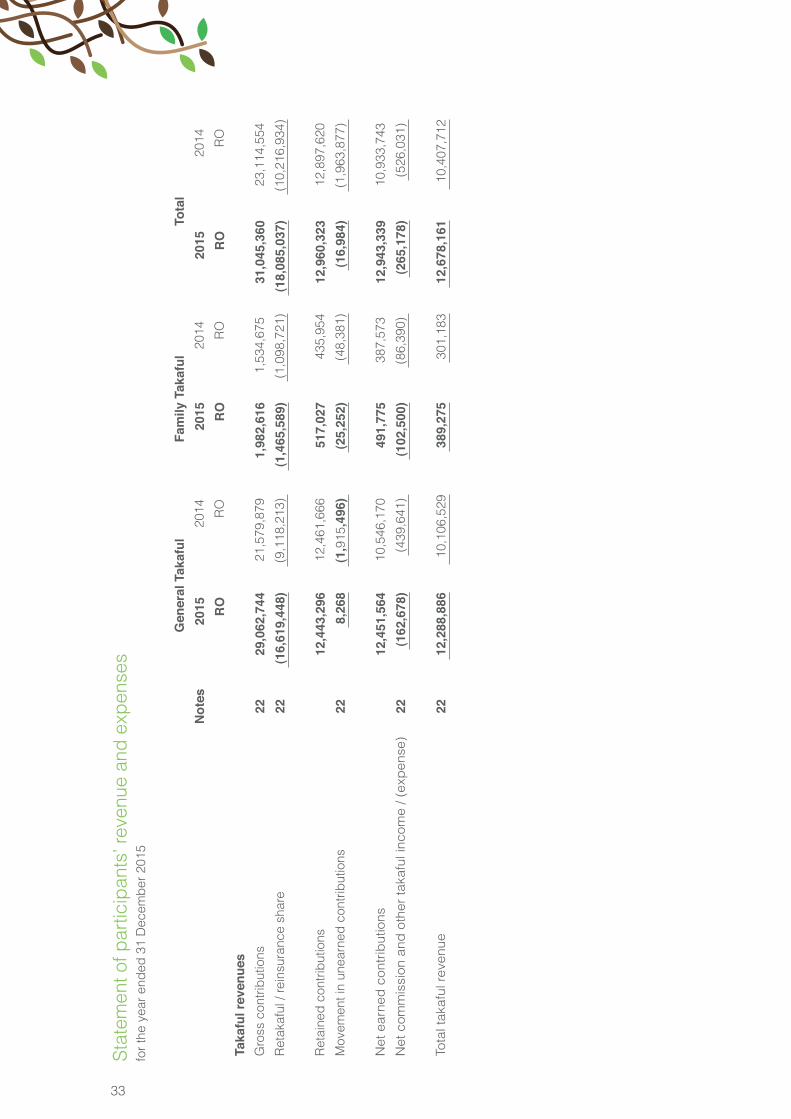
33
Stat
emen
t of p
artic
ipan
ts’ r
even
ue a
nd e
xpen
ses
for t
he y
ear e
nded
31
Dec
embe
r 201
5
Gen
eral
Tak
aful
Fam
ily T
akaf
ulTo
tal
Not
es20
1520
1420
1520
1420
1520
14
RO
RO
RO
RO
RO
RO
Taka
ful r
even
ues
Gro
ss c
ontri
butio
ns22
29,0
62,7
44 2
1,57
9,87
9 1,
982,
616
1,5
34,6
75
31,0
45,3
60 2
3,11
4,55
4
Ret
akaf
ul /
rein
sura
nce
shar
e22
(16,
619,
448)
(9,1
18,2
13)
(1,4
65,5
89)
(1,0
98,7
21)
(18,
085,
037)
(10,
216,
934)
Ret
aine
d co
ntrib
utio
ns12
,443
,296
12,
461,
666
517,
027
435
,954
12,9
60,3
23 1
2,89
7,62
0
Mov
emen
t in
unea
rned
con
tribu
tions
228,
268
(1,9
15,4
96)
(25,
252)
(48,
381)
(16,
984)
(1,9
63,8
77)
Net
ear
ned
con
trib
utio
ns12
,451
,564
10,
546,
170
491,
775
387
,573
12
,943
,339
10,
933,
743
Net
com
mis
sion
and
oth
er ta
kafu
l inc
ome
/ (ex
pen
se)
22(1
62,6
78)
(439
,641
) (1
02,5
00)
(86,
390)
(2
65,1
78)
(526
,031
)
Tota
l tak
aful
rev
enue
2212
,288
,886
10,
106,
529
389,
275
301,
183
12,6
78,1
61 1
0,40
7,71
2
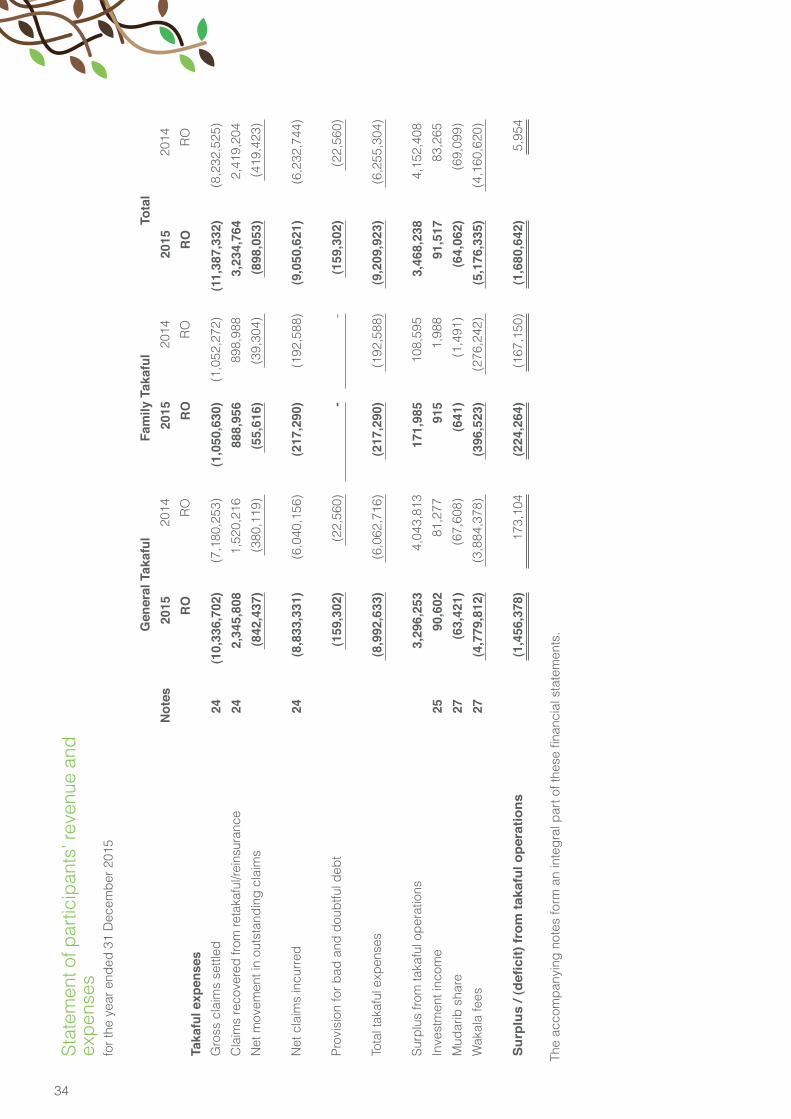
34
Gen
eral
Tak
aful
Fam
ily T
akaf
ulTo
tal
Not
es20
1520
1420
1520
1420
1520
14
RO
RO
RO
RO
RO
RO
Stat
emen
t of p
artic
ipan
ts’ r
even
ue a
nd
expe
nses
for t
he y
ear e
nded
31
Dec
embe
r 201
5
Tak
aful
exp
ense
sG
ross
cla
ims
settl
ed24
(10,
336,
702)
(7,1
80,2
53)
(1,0
50,6
30)
(1,0
52,2
72)
(11,
387,
332)
(8,2
32,5
25)
Cla
ims
reco
vere
d fro
m re
taka
ful/r
eins
uran
ce24
2,34
5,80
8 1
,520
,216
88
8,95
6 8
98,9
88
3,23
4,76
4 2
,419
,204
Net
mov
emen
t in
outs
tand
ing
clai
ms
(842
,437
)(3
80,1
19)
(55,
616)
(39,
304)
(8
98,0
53)
(419
,423
)
Net
cla
ims
incu
rred
24(8
,833
,331
)(6
,040
,156
)(2
17,2
90)
(192
,588
)(9
,050
,621
)(6
,232
,744
)
Prov
isio
n fo
r bad
and
dou
btfu
l deb
t(1
59,3
02)
(22,
560)
-
-
(159
,302
)(2
2,56
0)
Tota
l tak
aful
exp
ense
s(8
,992
,633
)(6
,062
,716
)(2
17,2
90)
(192
,588
)(9
,209
,923
)(6
,255
,304
)
Sur
plus
from
taka
ful o
pera
tions
3,29
6,25
34,
043,
813
171,
985
108,
595
3,46
8,23
8 4
,152
,408
Inve
stm
ent i
ncom
e25
90,6
02 8
1,27
7 91
5 1
,988
91
,517
83,
265
Mud
arib
sha
re27
(63,
421)
(67,
608)
(6
41)
(1,4
91)
(64,
062)
(69,
099)
Wak
ala
fees
27(4
,779
,812
)(3
,884
,378
) (3
96,5
23)
(276
,242
) (5
,176
,335
)(4
,160
,620
)
Sur
plus
/ (d
efici
t) fr
om ta
kafu
l ope
ratio
ns(1
,456
,378
)
1
73,1
04(2
24,2
64)
(167
,150
)(1
,680
,642
)5,
954
The
acco
mpa
nyin
g no
tes
form
an
inte
gral
par
t of t
hese
fina
ncia
l sta
tem
ents
.
35
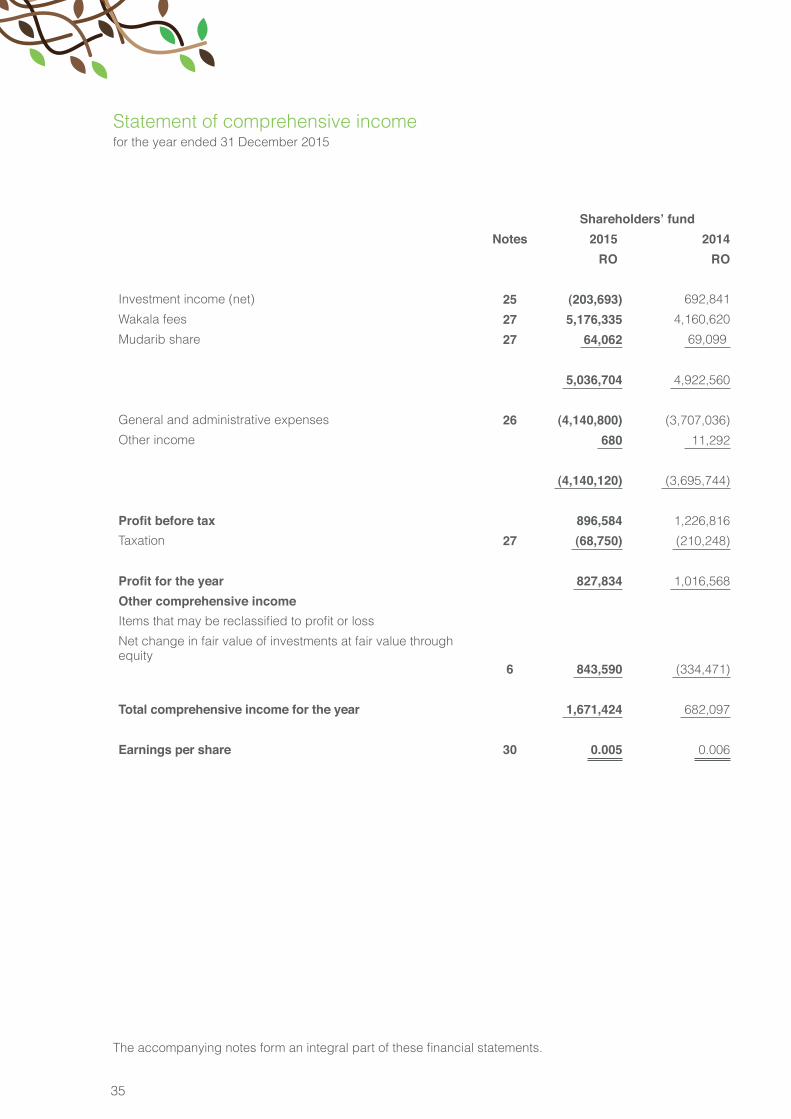
Statement of comprehensive income for the year ended 31 December 2015
Shareholders’ fundNotes 2015 2014
RO RO
Investment income (net) 25 (203,693) 692,841
Wakala fees 27 5,176,335 4,160,620
Mudarib share 27 64,062 69,099
5,036,704 4,922,560
General and administrative expenses 26 (4,140,800) (3,707,036)
Other income 680 11,292
(4,140,120) (3,695,744)
Profit before tax 896,584 1,226,816
Taxation 27 (68,750) (210,248)
Profit for the year 827,834 1,016,568
Other comprehensive incomeItems that may be reclassified to profit or loss
Net change in fair value of investments at fair value throughequity
6 843,590 (334,471)
Total comprehensive income for the year 1,671,424 682,097
Earnings per share 30 0.005 0.006
The accompanying notes form an integral part of these financial statements.
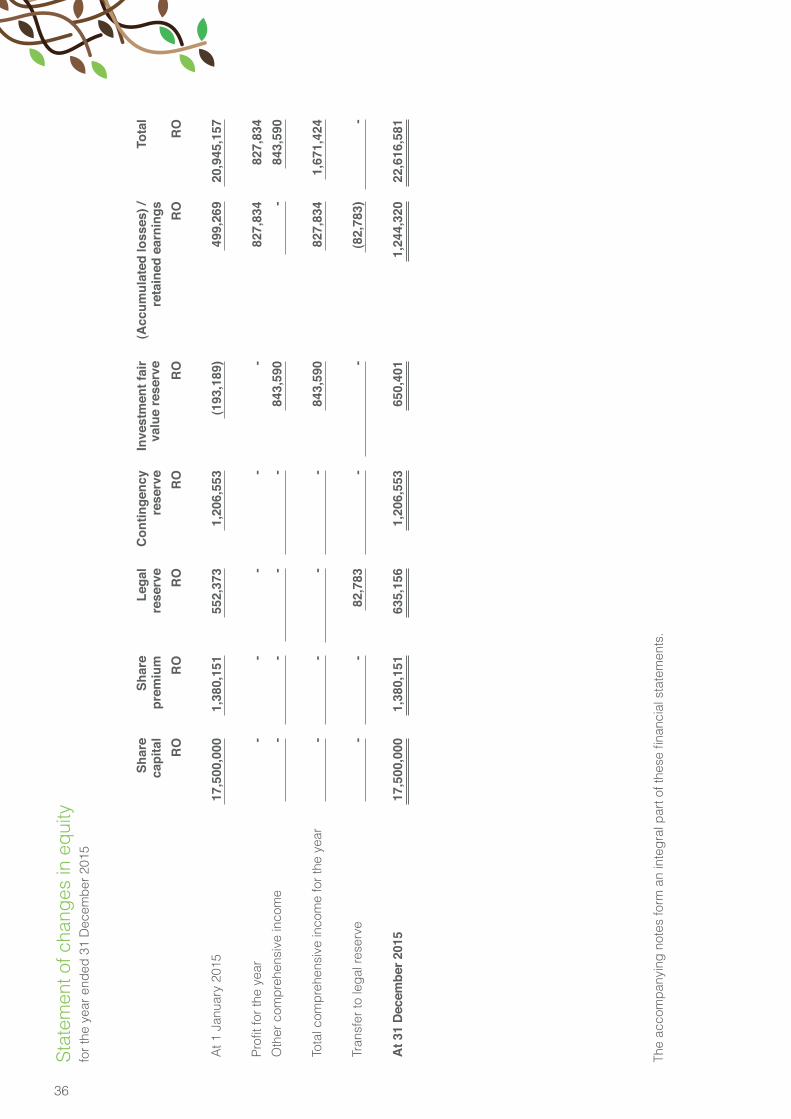
36
Stat
emen
t of c
hang
es in
equ
ityfo
r the
yea
r end
ed 3
1 D
ecem
ber 2
015
Shar
eca
pita
l S
hare
prem
ium
Leg
alre
serv
e C
ontin
genc
yre
serv
e In
vest
men
t fai
rva
lue
rese
rve
(Acc
umul
ated
loss
es) /
reta
ined
ear
ning
sTo
tal
RO
RO
RO
RO
RO
RO
RO
At 1
Jan
uary
201
517
,500
,000
1,38
0,15
155
2,37
31,
206,
553
(193
,189
)49
9,26
920
,945
,157
Profi
t for
the
year
--
--
-82
7,83
482
7,83
4O
ther
com
preh
ensi
ve in
com
e
-
-
-
-
843,
590
-84
3,59
0
Tota
l com
preh
ensi
ve in
com
e fo
r the
yea
r
-
-
-
-
843,
590
827,
834
1,67
1,42
4
Tra
nsfe
r to
lega
l res
erve
-
-82
,783
-
-(8
2,78
3)
-
At 3
1 De
cem
ber 2
015
17,5
00,0
001,
380,
151
635,
156
1,20
6,55
365
0,40
11,
244,
320
22,6
16,5
81
The
acco
mpa
nyin
g no
tes
form
an
inte
gral
par
t of t
hese
fina
ncia
l sta
tem
ents
.
37
Stat
emen
t of c
hang
es in
equ
ityfo
r the
yea
r end
ed 3
1 D
ecem
ber 2
015
(con
tinue
d)
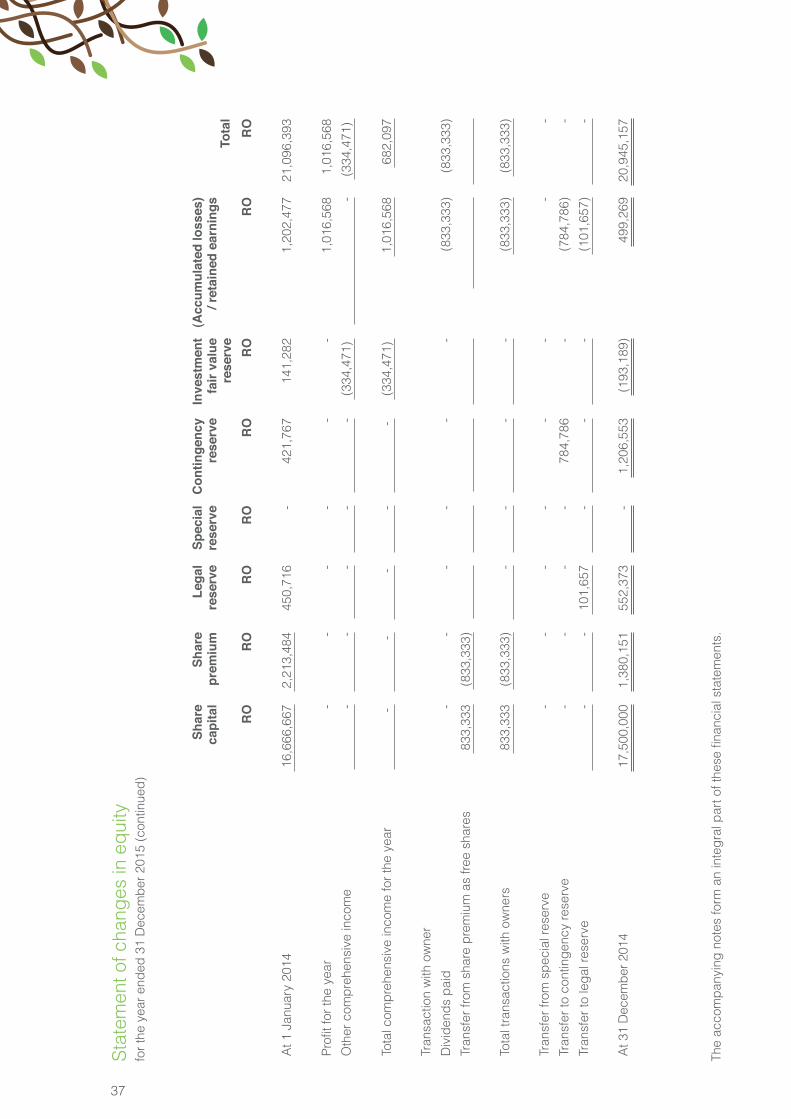
Shar
eca
pita
l S
hare
prem
ium
Leg
alre
serv
e S
peci
alre
serv
e C
ontin
genc
yre
serv
e In
vest
men
t fa
ir va
lue
rese
rve
(Acc
umul
ated
loss
es)
/ ret
aine
d ea
rnin
gsTo
tal
RO
RO
RO
RO
RO
RO
RO
RO
At 1
Jan
uary
201
416
,666
,667
2,21
3,48
445
0,71
6-
421,
767
141,
282
1,20
2,47
721
,096
,393
Profi
t for
the
year
--
--
--
1,01
6,56
81,
016,
568
Oth
er c
ompr
ehen
sive
inco
me
-
-
-
-
-(3
34,4
71)
-(3
34,4
71)
Tota
l com
preh
ensi
ve in
com
e fo
r the
yea
r
-
-
-
-
-
(334
,471
) 1,
016,
568
682,
097
Tran
sact
ion
with
ow
ner
Div
iden
ds p
aid
--
--
--
(833
,333
)(8
33,3
33)
Tran
sfer
from
sha
re p
rem
ium
as
free
shar
es83
3,33
3(8
33,3
33)
Tota
l tra
nsac
tions
with
ow
ners
833,
333
(833
,333
)
-
-
-
-
(833
,333
)(8
33,3
33)
Tran
sfer
from
spe
cial
rese
rve
--
--
--
--
Tran
sfer
to c
ontin
genc
y re
serv
e-
--
-78
4,78
6-
(784
,786
)-
Tran
sfer
to le
gal r
eser
ve
-
-
101,
657
-
-
-
(101
,657
)
-
At 3
1 D
ecem
ber 2
014
17,5
00,0
001,
380,
151
552,
373
-1,
206,
553
(193
,189
)49
9,26
920
,945
,157
The
acco
mpa
nyin
g no
tes
form
an
inte
gral
par
t of t
hese
fina
ncia
l sta
tem
ents
.
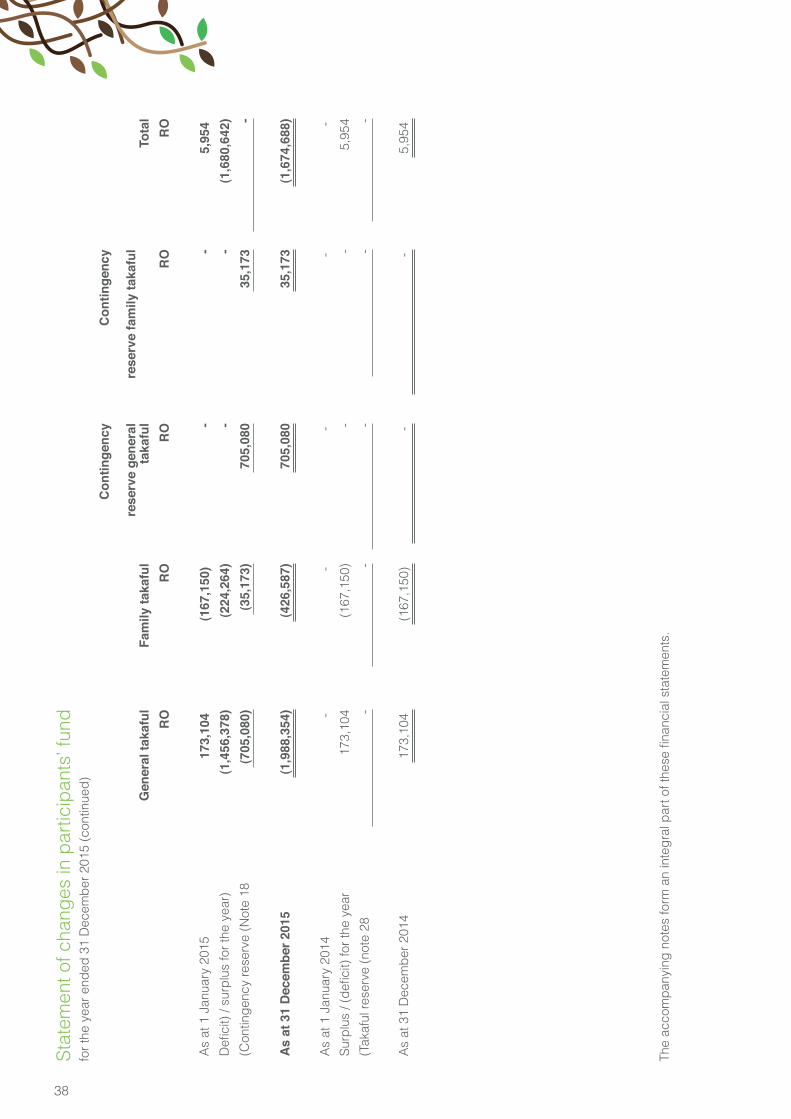
38
Stat
emen
t of c
hang
es in
par
ticip
ants
’ fun
dfo
r the
yea
r end
ed 3
1 D
ecem
ber 2
015
(con
tinue
d)
Gen
eral
taka
ful
Fam
ily ta
kafu
l
Con
tinge
ncy
rese
rve
gene
ral
taka
ful
Con
tinge
ncy
rese
rve
fam
ily ta
kafu
lTo
tal
RO
RO
RO
RO
RO
As
at 1
Jan
uary
201
5 1
73,1
04
(167
,150
)
-
- 5
,954
D
efici
t) / s
urpl
us fo
r the
yea
r)(1
,456
,378
)(2
24,2
64)
--
(1,6
80,6
42)
(Con
tinge
ncy
rese
rve
(Not
e 18
(705
,080
)(3
5,17
3)70
5,08
035
,173
-
As
at 3
1 D
ecem
ber 2
015
(1,9
88,3
54)
(426
,587
)70
5,08
035
,173
(1,6
74,6
88)
As
at 1
Jan
uary
201
4
-
-
-
-
-
Surp
lus
/ (de
ficit)
for t
he y
ear
173,
104
(167
,150
)-
-5,
954
(Tak
aful
rese
rve
(not
e 28
-
-
-
-
-
As
at 3
1 D
ecem
ber 2
014
173,
104
(167
,150
)
-
- 5,
954
The
acco
mpa
nyin
g no
tes
form
an
inte
gral
par
t of t
hese
fina
ncia
l sta
tem
ents
.
39
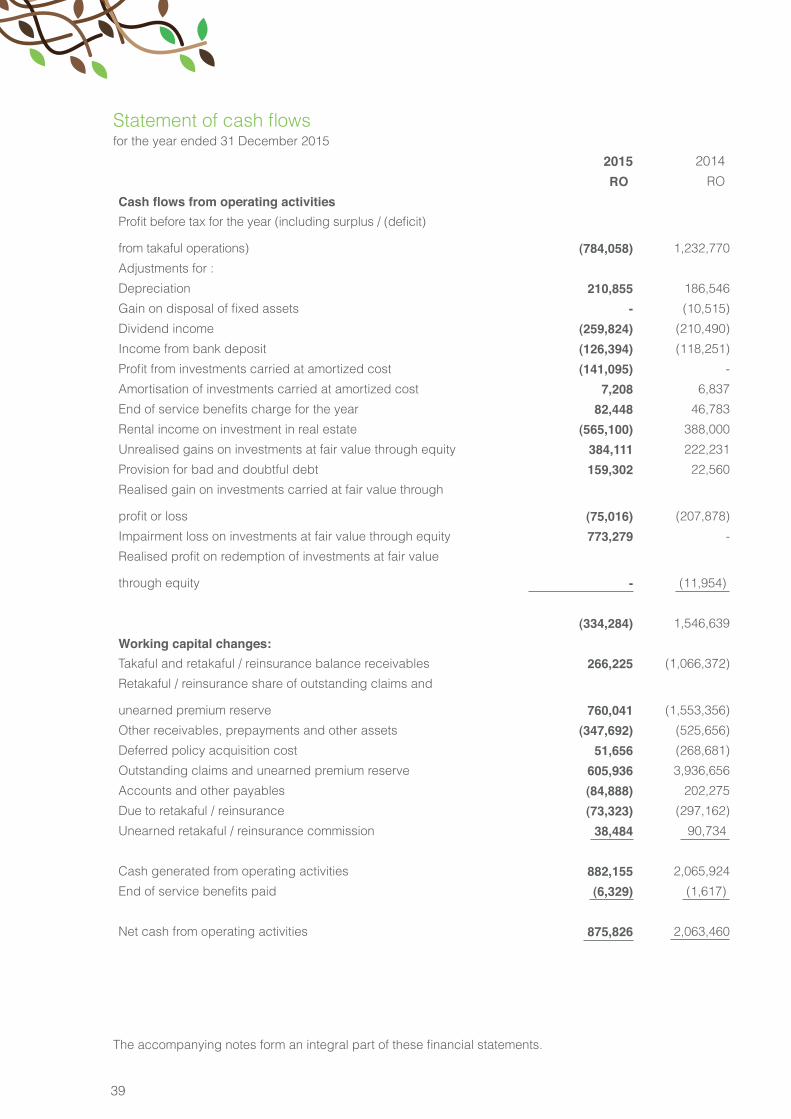
Statement of cash flows for the year ended 31 December 2015
2015 2014
RO RO
Cash flows from operating activities Profit before tax for the year (including surplus / (deficit)
from takaful operations) (784,058) 1,232,770
Adjustments for :
Depreciation 210,855 186,546
Gain on disposal of fixed assets - (10,515)
Dividend income (259,824) (210,490)
Income from bank deposit (126,394) (118,251)
Profit from investments carried at amortized cost (141,095) -
Amortisation of investments carried at amortized cost 7,208 6,837
End of service benefits charge for the year 82,448 46,783
Rental income on investment in real estate (565,100) 388,000
Unrealised gains on investments at fair value through equity 384,111 222,231
Provision for bad and doubtful debt 159,302 22,560
Realised gain on investments carried at fair value through
profit or loss (75,016) (207,878)
Impairment loss on investments at fair value through equity 773,279 -
Realised profit on redemption of investments at fair value
through equity - (11,954)
(334,284) 1,546,639
Working capital changes:Takaful and retakaful / reinsurance balance receivables 266,225 (1,066,372)
Retakaful / reinsurance share of outstanding claims and
unearned premium reserve 760,041 (1,553,356)
Other receivables, prepayments and other assets (347,692) (525,656)
Deferred policy acquisition cost 51,656 (268,681)
Outstanding claims and unearned premium reserve 605,936 3,936,656
Accounts and other payables (84,888) 202,275
Due to retakaful / reinsurance (73,323) (297,162)
Unearned retakaful / reinsurance commission 38,484 90,734
Cash generated from operating activities 882,155 2,065,924
End of service benefits paid (6,329) (1,617)
Net cash from operating activities 875,826 2,063,460
The accompanying notes form an integral part of these financial statements.
40
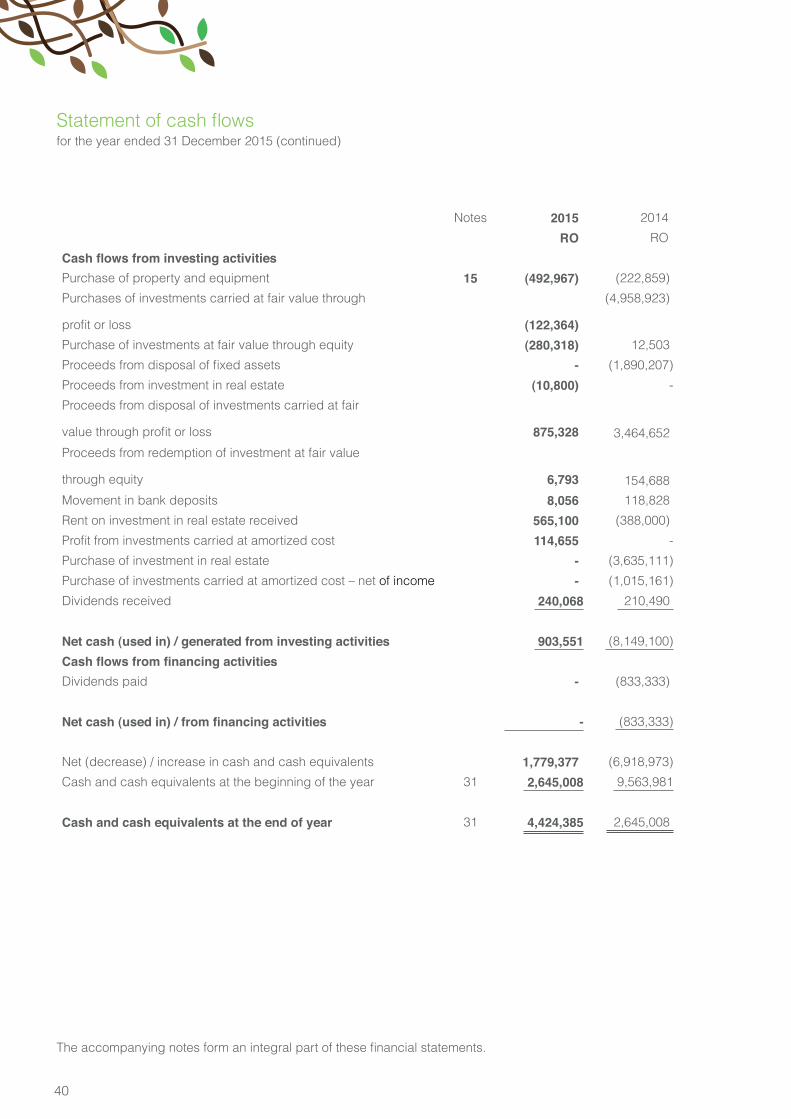
Statement of cash flows for the year ended 31 December 2015 (continued)
Notes 2015 2014
RO RO
Cash flows from investing activitiesPurchase of property and equipment 15 (492,967) (222,859)
Purchases of investments carried at fair value through
profit or loss (122,364)
(4,958,923)
Purchase of investments at fair value through equity (280,318) 12,503
Proceeds from disposal of fixed assets - (1,890,207)
Proceeds from investment in real estate (10,800) -
Proceeds from disposal of investments carried at fair
value through profit or loss 875,328 3,464,652
Proceeds from redemption of investment at fair value
through equity 6,793 154,688
Movement in bank deposits 8,056 118,828
Rent on investment in real estate received 565,100 (388,000)
Profit from investments carried at amortized cost 114,655 -
Purchase of investment in real estate - (3,635,111)
Purchase of investments carried at amortized cost – net of income - (1,015,161)
Dividends received 240,068 210,490
Net cash (used in) / generated from investing activities 903,551 (8,149,100)
Cash flows from financing activitiesDividends paid - (833,333)
Net cash (used in) / from financing activities - (833,333)
Net (decrease) / increase in cash and cash equivalents 1,779,377 (6,918,973)
Cash and cash equivalents at the beginning of the year 31 2,645,008 9,563,981
Cash and cash equivalents at the end of year 31 4,424,385 2,645,008
The accompanying notes form an integral part of these financial statements.
41
Notes to the financial statementsfor the year ended 31 December 2015
1. General Al Madina Insurance Company SAOG (formerly Al Madina Insurance Company SAOC) (the “Company”) was incorporated on 15 May 2006 as a closed joint stock company in the Sultanate of Oman. On 10 December 2013, the Company has become a public joint stock company. The Company operates in Oman and is engaged in the business of General and Family Takaful activities by adopting a Wakala model. The Company also adopts a Mudarabha model for its investments, on behalf of the participants in accordance with the Islamic Sharia’a principles. The retakaful / reinsurance activities organised on an underwriting year basis with the participants pooling their contributions to cover for losses suffered in the pool on occurrence of a defined event.
The Company commenced commercial operations from 1 August 2006. The Company was granted license from Capital Market Authority (CMA) on 15 July 2006. The Company started Takaful operations on 1 January 2014 after being granted the Takaful license by the CMA.
2. Summary of significant accounting policies Statement of complianceThe financial statements have been prepared in accordance with the Financial Accounting Standards (“FAS”) issued by the Accounting and Auditing Organization for Islamic Financial Institutions (“AAOIFI”), for the matters which are not covered by AAOIFI standards, International Financial Reporting Standards (“IFRS”) have been applied. The financial statements comply with the disclosure related to insurance companies issued by Capital Market Authority and the requirements of the Commercial Companies Law of 1974, as amended.
AAOIFI standards have been applied prospectively from the date of the 1 January 2014 as allowed under such standards. The application of AAOIFI has resulted in the additional disclosures relating to General Takaful and Family Takaful Business, Shareholders’ Fund and Participants’ Fund. The statement of profit or loss and other comprehensive income has been divided into two statements namely “Statement of Participants’ Revenues and Expenses” and “Statement of Profit or Loss and Other Comprehensive Income”. Further, statement of change in equity has been divided into two statements namely “Statement of changes in Participants’ Fund” and “Statement of change in Shareholders’ Equity”.
CMA has issued the Draft Takaful Law which is under final stages of approval. As and when any new regulations and instructions are issued by CMA regarding Takaful Business management will ensure that the basis of preparation of financial statements complies with such regulations.
Basis of preparation The financial statements are prepared under the historical cost convention and using going concern assumption, except for the measurement of financial assets classified as held for trading and Equity type instruments carried at fair value through equity investments and investment property which are measured at fair value.
Historical cost is generally based on the fair value of the consideration given in exchange for goods and services.
The financial statements are presented in Rials Omani (“RO”), which is the Company’s functional and presentation currency.
The Company presents its statement of financial position broadly in order of liquidity.
The preparation of financial statements in conformity with FAS requires the use of certain critical accounting estimates.
42
Notes to the financial statementfor the year ended 31 December 2015 (continued)
2. Summary of significant accounting policies (continued) Basis of preparation (continued)
It also requires management to exercise its judgment in the process of applying the Company’s accounting policies.
The accounting policies have been consistently applied by the Company and are consistent with those used in the previous year. The principal accounting policies are set out as below:
Foreign currencyFunctional and presentation currencyItems included in the financial statements of the Company are measured and presented in Rial Omani (“RO”) being the currency of the primary economic environment in which the Company operates (functional currency).
Transactions and balancesForeign currency transactions are translated into Rial Omani at the exchange rate prevailing on the transaction date. Foreign currency assets and liabilities are translated into Rial Omani at the exchange rate prevailing at the statement of financial position date. Differences on exchange are dealt with in profit or loss as they arise
Takaful operationsAs an Islamic insurance (takaful) provider, the Company issues contracts that are based on co-operative activity by risk sharing or financial risk, or both. The Company classifies all its contracts individually as either takaful contracts or investment contracts.
Takaful contracts are those contracts where the insurer accepts significant takaful risk from the participants by agreeing to cover the participants if a specified uncertain future event adversely affects the participants. As a general guideline, the Company defines significant takaful risk as the possibility of having to pay benefits on the occurrence of an insured event.
Investment contracts are contracts where there is insignificant transfer of insurance risk from the participants to the Company. They are accounted for as financial instruments and revenue arising from such contracts is recognized in accordance with Financial Accounting Standards No. 25 “Investment in sukuk, shares and similar instruments” issued by AAOIFI.
The Company mainly issues short term takaful contracts in connection with property and motor (collectively known as fire and accident) and marine risks. The Company also issues family and life takaful contracts.
Property takafulProperty takaful is designed to cover contract holders for damage suffered to properties or for the value of property lost. Contract holders could also receive coverage for the loss of earnings caused by the inability to use the insured properties.
Motor takafulMotor takaful is designed to cover contract holders for damage suffered to their vehicles or liability to third parties arising through accidents. Contract holders could also receive coverage for fire or theft of their vehicles.
43
Notes to the financial statementsfor the year ended 31 December 2015 (continued)
2. Summary of significant accounting policies (continued) Basis of preparation (continued)Takaful operations (continued)
Marine takafulMarine takaful is designed to cover contract holders for damage and liability arising through loss or damage to marine craft and accidents at sea or land resulting in the total or partial loss of cargo.
Life and family takafulLife and family takaful is designed to cover contract holders for loss of life or limbs of the insured.
General takafulGross contributions represent the total business written in the year, including contributions on annual takaful contracts covering part or all of the year. In addition, gross contributions include certain contributions derived from local inward business under co-takaful arrangements. Gross contributions in respect of annual takaful contracts are recognized in the statement of income at takaful contract inception. In respect of longer term takaful contracts, contributions are spread over the tenure of the takaful contracts on a straight-line basis and the unexpired portion of such contributions is included within “unearned contributions” in the statement of financial position for the initial year and the balance unexpired portion of such contribution is included in the other payables.
Unearned contributions represent the portion of contributions received on in-force contracts that relate to unexpired risks at the statement of financial position date. Takaful contributions are recognized as revenue (earned contributions) proportionally over the year of coverage. A proportion of net retained premiums is provided as ‘unearned contribution reserve’ (UPR) to cover portions of risks which have not expired at the statement of financial position date. An additional provision created to cover shortfall, if any, for each class of business between the total amount in the unearned premium reserve and the amount required by the Oman.
Insurance Company Law of 1979 calculated at 45% of the net retained premiums for the year for all classes of business.
In order to minimize financial exposure from large claims the Company enters into agreements with other parties for retakaful/reinsurance purposes. Claims receivable from retakaful / reinsurance companies are estimated in a manner consistent with the claim liability and in accordance with the retakaful / reinsurance contract. These amounts are shown as “Due from retakaful / reinsurance companies in connection with outstanding claims and deferred retakaful / reinsurance contribution” in the statement of financial position until the claim is paid by the Company. Once the claim is paid the amount due from the retakaful / reinsurance company in connection with the paid claim is transferred to “takaful and retakaful / reinsurance balance receivables”.
At each reporting date, the Company assesses whether there is any indication that a retakaful/reinsurance asset may be impaired. Where an indicator of impairment exists, the Company makes a formal estimate of recoverable amount. Where the carrying amount of a re-takaful asset exceeds its recoverable amount the asset is considered impaired and is written down to its recoverable amount.
Retakaful / reinsurance commission income and commission paid are recognized at the time when retakaful / reinsurance contracts are written.
The commission income attributable to the retakaful / reinsurance ceded contributions are deferred and classified as unearned retakaful / reinsurance commission. Unearned retakaful / reinsurance commission is calculated at 45% of the retakaful / reinsurance commission income for the year for all classes of business.
44
Notes to the financial statementsfor the year ended 31 December 2015 (continued)
2. Summary of significant accounting policies (continued) General takaful (continued)
The costs attributable to the acquisition of new business and renewing existing contracts are disclosed under deferred policy acquisition cost. All other costs are recognized as expenses when incurred. The deferred policy acquisition cost is calculated at 45% of the total commission expense for the year for all classes of business.
Gross claims settled are charged to the statement of income in the year in which the claims payable to policyholders and third parties is determined as per the terms of the takaful contracts. This includes the settlement and handling costs of paid and outstanding claims arising from events occurring during the financial year.
Claims, comprising amounts payable to takaful contract holders and third parties and related loss adjustment expenses, net of salvage and other recoveries, are charged to statement of participants’ revenue and expenses as incurred. Claims comprise the estimated amounts payable, in respect of claims reported to the Company and those not reported at the statement of financial position date.
Claims recovered from retakaful / reinsurance and other parties include amounts recovered from retakaful / reinsurance companies in respect of the gross claims paid by the Company, in accordance with the retakaful / reinsurance contracts held, together with salvage and other claims recoveries.
Gross outstanding claims comprise the gross estimated cost of claims incurred but not settled at the statement of financial position date, whether reported or not. Provisions for gross outstanding claims is based on estimates of the outstanding loss which will eventually be payable on each reported claim, established by management based on currently available information and past experience modified for changes reflected in current conditions, increased exposure, rising claims costs and the severity and frequency of recent claims, as appropriate.
In addition, a provision based on management’s judgment and the Company’s prior experience is maintained for the cost of settling claims incurred but not reported at the statement of financial position date. Outstanding claim provisions are not discounted for their value of money.
In addition a provision based on management judgment and the Company’s prior experience is maintained for the cost of settling claims incurred but not reported (IBNR) at the statement of financial position date. Any difference between the provisions at the statement of financial position date and settlements and provisions for the following year is included in the underwriting result for that year.
The Company does not discount its liability for unpaid claims.
Liability adequacy tests are performed at each statement of financial position date to ensure the adequacy of the takaful liabilities using current best estimates of future contractual cash flows under takaful contracts. Any
deficiency is immediately charged to the statement of income by establishing a provision for losses arising from liability adequacy tests.
Family takafulFamily takaful technical reserves represent the present value of future benefit obligations in respect of family takaful contracts in force at the statement of financial position date. The reserve consists of two types of funds namely protection takaful and savings takaful.
45
Notes to the financial statementsfor the year ended 31 December 2015 (continued)
2. Summary of significant accounting policies (continued) Family takaful (continued)
The protection takaful and savings takaful reserve is determined annually by the Company’s appointed actuary.
Maturity and survival benefits are charged against the technical reserve when due. Encashment and surrenders are accounted for when paid or when cover ceases. Death and disability claims are accounted for when notified.
Gross contributions are recognized in the statement of income on the due date of the premium. Unearned contributions represent the portion of contributions received on in-force contracts that relate to unexpired risks at the statement of financial position date. Takaful contributions are recognized as revenue (earned contributions) proportionally over the year of coverage. A proportion of net retained premiums is provided as ‘unearned contribution reserve’ (UPR) to cover portions of risks which have not expired at the statement of financial position date. An additional provision created to cover shortfall, if any, for each class of business between the total amount in the unearned premium reserve and the amount required by the Oman.
Gross claims settled are charged to the statement of income in the year in which the claims payable to policyholders and third parties is determined as per the terms of the takaful contracts. This includes the settlement and handling costs of paid and outstanding claims arising from events occurring during the financial year.
Claims, comprising amounts payable to takaful contract holders and third parties and related loss adjustment expenses, net of salvage and other recoveries, are charged to statement of participants’ revenue and expenses as incurred. Claims comprise the estimated amounts payable, in respect of claims reported to the Company and those not reported at the statement of financial position date.
Claims recovered from retakaful / reinsurance and other parties include amounts recovered from retakaful / reinsurance companies in respect of the gross claims paid by the Company, in accordance with the retakaful / reinsurance contracts held, together with salvage and other claims recoveries.
Gross outstanding claims comprise the gross estimated cost of claims incurred but not settled at the statement of financial position date, whether reported or not.
Outstanding claim provisions are not discounted for their value of money.
Any difference between the provisions at the statement of financial position date and settlements and provisions for the following year is included in the underwriting result for that year.
Retakaful / reinsurance share represents amounts paid to retakaful / reinsurance companies in accordance with retakaful / reinsurance contracts entered into by the Company. In respect of proportional retakaful / reinsurance contracts and non-proportional retakaful / reinsurance contracts, the amounts are recognized in the statement of income in accordance with the terms of these contracts.
Retakaful / reinsurance commission income and commission paid are recognized at the time retakaful / reinsurance contracts are written.
Financial assetsLoans and receivablesThese assets are non-derivative financial assets with fixed or determinable payments that are not quoted in an active market. They arise principally through the provision of services to customers and also incorporate other types of contractual monetary asset. They are initially recognized at fair value plus transaction costs that are directly attributable to their acquisition or issue, and are subsequently carried at amortised cost using the effective profit rate method, less provision for impairment.
46
Notes to the financial statements for the year ended 31 December 2015 (continued)
2. Summary of significant accounting policies (continued) Financial assets (continued)
The Company’s loans and receivables comprises of retakaful / reinsurance and takaful receivables, due from retakaful / reinsurance companies in connection with outstanding claims and cash and cash equivalents in the statement of financial position.
Retakaful / reinsurance and takaful receivablesThe benefits to which the Company is entitled under its retakaful / reinsurance contracts held are recognized as retakaful/reinsurance assets. These assets consists of balances due from retakaful / reinsurance companies on settlement of claims and other receivables such as retakaful / reinsurance commissions and amounts recoverable from retakaful / reinsurance companies in connection with outstanding claims, that are dependent on the expected claims and benefits arising under the related takaful contracts. Amounts recoverable from or due to retakaful / reinsurance companies are recognized consistently with the amounts associated with the underlying takaful contracts and in accordance with the terms of each retakaful / reinsurance contract.
Retakaful / reinsurance and takaful balances receivable are stated at cost less any impairment losses. Amounts receivable from retakaful / reinsurance companies relating to claims are estimated in a manner consistent with the claim liability associated with the retakaful / reinsurance companies.
The Company assesses its retakaful / reinsurance assets for impairment on a quarterly basis. If there is objective evidence that the retakaful / reinsurance asset is impaired, the Company reduces the carrying amount of the retakaful / reinsurance asset to its recoverable amount and recognises that impairment loss in the statement of income. Objective evidence for impairment is assessed as a result of an event that occurred after initial recognition of the retakaful / reinsurance asset that the company may not be able to receive all the amounts due under the terms of the contract and that the event has a reliably measurable impact on the amounts that the Company will receive from the retakaful / reinsurance Company.
Investment real estateInvestment in real estate are properties which are held either to earn rental income, for capital appreciation or for both. Investment in real estate are stated at fair value. External independent valuers having appropriate recognized professional qualifications and experience, value the investment. The fair values are based on market values, being the estimated amount for which a property could be exchanged on the date of valuation between a willing buyer and willing seller in an arm’s length transaction, after proper marketing, wherein the parties had each acted knowledgeably, prudently and without compulsion. Any gain or loss arising from the change in fair value of the investments is recognized in the statement of financial position.
InvestmentsInvestments comprise of investments carried at amortized cost, investments carried at fair value through profit or loss and investments at fair value through equity.
All investments, are initially recognised at cost, being the fair value of the consideration given including acquisition charges associated with the investment, except in the case of investments carried at fair value through profit or loss.
47
Notes to the financial statementsfor the year ended 31 December 2015 (continued)
2. Summary of significant accounting policies (continued)Investments (continued)
Investments carried at amortized cost Investments which have fixed or determinable payments and where the Company has both the intent and ability to hold to maturity are classified as investments carried at amortized cost. Such investments are carried at amortised cost, less provision for impairment in value. Amortised cost is calculated by taking into account any premium or discount on acquisition. Any gain or loss on such instruments is recognised in the statement of comprehensive income when the instruments are de-recognised or impaired.
Investments at fair value through equity Subsequent to acquisition, equity type instruments are remeasured at fair value, with unrealized gains and losses recognised in a separate component of equity until the investment is derecognized or the investment is determined to be impaired. On derecognition or impairment, the cumulative gain or loss previously recorded in equity is recognised in the statement of comprehensive income for the year.
Impairment losses on equity type instruments carried at fair value through equity are not reversed through the statement of comprehensive income and increases in their fair value after impairment are recognised directly in owners’ equity.
Investments carried at fair value through profit or loss These are subsequently re-measured at fair value. All related realised and unrealized gains or losses are included in the statement of profit or loss.
Fair valuesFair value is determined for each financial asset individually in accordance with the valuation policies set out below:
(i) For investments that are traded in organized financial markets, fair value is determined by reference to the quoted market bid prices prevailing on the statement of financial position date.
(ii) For unquoted investments, fair value is determined by reference to recent significant buy or sell transactions with third parties that are either completed or are in progress. Where no recent significant transactions have been completed or are in progress, fair value is determined by reference to the current market value of similar investments. For others, the fair value is based on the net present value of estimated future cash flows, or other relevant valuation methods.
(iii) For investments that have fixed or determinable cash flows, fair value is based on the net present value of estimated future cash flows determined by the Company using current profit rates for investments with similar terms and risk characteristics.
(iv)Investments which cannot be remeasured to fair value using any of the above techniques are carried at cost, less accumulated impairment, if any.
Investment income
Investment income is recognized on a time proportion basis.
DividendsDividend income is recognized when the right to receive dividend is established.
48
Notes to the financial statementsfor the year ended 31 December 2015 (continued)
2. Summary of significant accounting policies (continued)
Derecognition of financial assets and financial liabilities Financial assets A financial asset (or, where applicable, a part of a financial asset or part of a group of similar financial assets) is derecognised where:
• the rights to receive cash flows from the asset have expired; or • the Company retains the right to receive cash flows from the asset, but has assumed an obligation to pay
them in full without material delay to a third party under a “pass-through” arrangement; or • the Company has transferred its rights to receive cash flows from the asset and either: (a) has transferred
substantially all the risks and rewards of the assets, or (b) has neither transferred nor retained substantially all the risks and rewards of the asset, but has transferred control of the asset.
When the Company has transferred its rights to receive cash flows from an asset and has neither transferred nor retained substantially all the risks and rewards of the asset nor transferred control of the asset, the asset is recognised to the extent of the Company’s continuing involvement in the asset.
Financial liabilities A financial liability is derecognised when the obligation specified in the contract is discharged, cancelled or expired.
Impairment Financial assetsAn assessment is made at each reporting date to determine whether there is objective evidence that a specific financial asset or group of assets may be impaired. If such evidence exists, any impairment loss is recognized in the profit or loss.
Impairment is determined as follows:
• for assets carried at fair value, impairment is the difference between cost and fair value, less any impairment loss previously recognized in the statement of comprehensive income;
• for assets carried at cost, impairment is the difference between carrying value and the estimated recoverable value;
Individually significant financial assets are tested for impairment on an individual basis. The remaining financial assets are assessed collectively in groups that share similar credit risk characteristics.
A provision for impairment of takaful and retakaful / reinsurance receivables is established when there is objective evidence that the Company will not be able to collect all amounts due according to the original terms of receivables. Significant financial difficulties of the debtor, probability that the debtor will enter bankruptcy or financial reorganization, and default or delinquency in payments are considered indicators that the takaful receivable is impaired. The amount of the provision is the difference between the asset’s carrying amount and the estimated recoverable value. The amount of any provision is recognized in the participants’ revenue and expenses. Subsequent recoveries of amounts previously written of are credited in participants’ revenue and expenses.
In the case of equity investments classified as investments at fair value through equity, a significant or prolonged decline in the fair value of the security below its cost is also evidence that the assets are impaired.
49
Notes to the financial statementsfor the year ended 31 December 2015 (continued)
2. Summary of significant accounting policies (continued)Financial assets ( continued)
If any such evidence exists for investments at fair value through equity, the cumulative loss - measured as the difference between the acquisition cost and the current fair value, less any impairment loss on that financial asset previously recognized in the statement of comprehensive income is removed from equity and recognized in the statement of profit or loss.
Impairment losses recognized in the profit or loss on such equity instruments are not reversed through the profit or loss.
An impairment loss is reversed if the reversal can be related objectively to an event occurring after the impairment loss was recognized. For financial assets measured at cost, the reversal is recognized in the profit or loss.
Non-financial assetsThe carrying amounts of the Company’s non-financial assets are reviewed at each reporting date to determine whether there is any indication of impairment. If any such indications exist then the asset’s recoverable amount is estimated. An impairment loss is recognized if the carrying amount of an asset or cash generating unit exceeds its recoverable amount. Recoverable amount is the greater of its value in use and its fair value less costs to sell.
Impairment losses recognized in prior years are assessed at each reporting date for any indications that the loss has decreased or no longer exists. An impairment loss is reversed if there has been a change in estimates used to determine the recoverable amount. An impairment loss is reversed only to the extent that the asset’s carrying amount does not exceed the carrying amount that would have been determined, net of depreciation or amortisation, if no impairment loss had been recognized.
OffsettingFinancial assets and financial liabilities are only offset and the net amount reported in the statement of financial position when there is a legally enforceable right to set off the recognized amounts and the Company intends to either settle on a net basis, or to realise the asset and settle the liability simultaneously.
Property and equipment and accumulated depreciationProperty and equipment are stated at cost less accumulated depreciation and any identified impairment loss. The cost of property and equipment is their purchase price together with any incidental expenses. Subsequent costs are included in the asset’s carrying amount or recognized as a separate asset, as appropriate, only when it is probable that future economic benefits associated with the item will flow to the Company and the cost of the item can be measured reliably. All other repairs and maintenance are charged to the profit or loss during the financial year in which they are incurred.
Depreciation is charged to the statement of profit or loss on a straight-line basis over the estimated useful lives of items of property and equipment. The estimated useful economic lives are as follows:
YearsBuildings 20Office furniture and equipment 3 - 5Motor vehicles 5Leasehold improvements 3 - 5
The assets’ residual values and useful lives are reviewed and adjusted, if appropriate, at the end of each reporting year.
50
Notes to the financial statementsfor the year ended 31 December 2015 (continued)
2. Summary of significant accounting policies (continued)Property and equipment and accumulated depreciation( continued)
Where the carrying amount of an asset is greater than its estimated recoverable amount it is written down immediately to its recoverable amount.
Gains and losses on disposals of property and equipment are determined by reference to their carrying amounts, are recognized within ‘other income’ and are taken into account in determining operating profit.
Capital work-in-progress is stated at cost. When commissioned, capital work-in-progress is transferred to the appropriate property and equipment category and depreciated in accordance with the Company’s policy.
Borrowing costs on borrowings to finance specific property, plant equipment are capitalized, during the year that is required to bring the asset to a condition when it is ready for use.
Cash and cash equivalentsCash and cash equivalents consist of cash and bank balances and bank deposits with a maturity of three months or less from the date of placement.
Financial liabilityThe financial liabilities of the Company consist of retakaful / reinsurance and takaful payables and other liabilities and provisions. These financial liabilities are initially recognized at fair value and are subsequently remeasured at amortised cost using the effective profit rate method.
Retakaful / reinsurance and takaful payablesRetakaful / reinsurance balances payable are primarily contributions payable for retakaful / reinsurance contracts and are recognized as an expense when due.
Liability adequacy tests are performed at each statement of financial position date to ensure the adequacy of the takaful liabilities using current best estimates of future contractual cash flows under takaful contracts. Any deficiency is immediately charged to the statement of income by establishing a provision for losses arising from liability adequacy tests.
ProvisionsA provision is recognized in the statement of financial position when the Company has a legal or constructive obligation as a result of a past event, and it is probable that an outflow of economic benefits will be required to settle the obligation.
Other liabilities and accrualsLiabilities are recognized initially at fair value and subsequently measured at amortized cost. Liabilities are recognized for amounts to be paid for goods and services received, whether or not billed to the Company.
Employee benefitsEnd of service benefits are accrued in accordance with the terms of employment of the Company’s employees at the reporting date, having regard to the requirements of the Oman Labour Law 2003 and its amendments. Employee entitlements to annual leave and leave passage are recognized when they accrue
51
Notes to the financial statementsfor the year ended 31 December 2015 (continued)
2. Summary of significant accounting policies (continued)Employee benefits (continued)
to employees and an accrual is made for the estimated liability arising as a result of services rendered by employees up to the reporting date. These accruals are included in current liabilities, while that relating to end of service benefits is disclosed as a liability.
Contributions to a defined contribution retirement plan and occupational hazard takaful for Omani employees in accordance with the Omani Social Insurances Law of 1991 are recognized as an expense in the statement of profit or loss as incurred.
Bonus is being paid on annual basis and accounting for bonus is being carried out based on actual payment basis.
LeasesLeases where a significant portion of the risks and rewards of ownership are retained by the lessor are classified as operating leases. Payments made under operating leases (net of any incentives received from the lessor) are charged to the statement of income on a straight-line basis over the year of the lease. The aggregate benefit of lease incentives is recognised as a reduction of the rental expense over the lease term on a straight-line basis.
Share capitalFinancial instruments issued by the Company are classified as equity only to the extent that they do not meet the definition of a financial liability or financial asset. The Company’s ordinary shares are classified as equity instruments.
Earnings per shareThe Company presents basic earnings per share (EPS) data for its ordinary shares. Basic EPS is calculated by dividing the profit or loss attributable to ordinary shareholders of the Company by the weighted average number of ordinary shares outstanding during the year.
Other incomeOther income is accounted for on the accruals basis, unless collectability is in doubt.
Earnings prohibited by Sharia’aThe Company is committed to avoid recognizing any income generated from non-Islamic sources. Accordingly, all non-Islamic income is credited to a charity account where the Company uses these funds for charitable purposes.
Dividends distributionDividends to the Company’s shareholders is recognized as a liability in the year in which the dividends are approved by the Company’s shareholders. In the case of dividends to equity shareholders, this is when declared by the directors. In the case of final dividends, this is when approved by the shareholders at the Annual General Meeting.
Directors’ remunerationThe board of directors’ remuneration is accrued within the limits specified by the Capital Market Authority and the requirements of the Commercial Companies Law of the Sultanate of Oman.
52
Notes to the financial statementsfor the year ended 31 December 2015 (continued)
2. Summary of significant accounting policies (continued)
General and administrative expensesThe expenses incurred in the normal course of business are recorded under general and administrative expenses. Of these expenses, the amounts incurred to operate and service the investment department are allocated and shown seperately as “investment related allocated costs”. General and administrative expenses which are allocated to the investment department include staff costs of the investment department, executive management, and the support service departments, depreciation, rent and utilities, IT expenses, communication, board expenses, business travel and others.
Income taxIncome tax on profit for the year comprises current and deferred tax. Current tax and deferred tax are recognized in the statement of profit or loss except to the extent that it relates to a business combination, or items recognized directly in equity or in statement of other comprehensive income.
Current tax is the expected tax payable on the taxable income for the year, using tax rates enacted or substantially enacted at the statement of financial position date, and any adjustment to tax payable in respect of previous years.
Deferred tax is calculated using liability method, providing for temporary differences between the carrying amounts of assets and liabilities for financial reporting purposes and the amounts used for taxation purposes. The amount of deferred tax provided is based on the expected manner of realization or settlement of the carrying amount of assets and liabilities, using tax rates enacted or substantially enacted at the statement of financial position date.
A deferred tax asset is recognized only to the extent that it is probable that future taxable profits will be available against which the asset can be utilized. Deferred tax assets are reduced to the extent that it is no longer probable that the related tax benefit will be realized.
Operating segmentAn operating segment is a component of the Company that engages in business activities from which it may earn revenues and incur expenses, including revenues and expenses that relate to transactions with any of the Company’s other components. All operating segments’ operating results are reviewed regularly by the CEO to make decisions about resources to be allocated to the segment and assess its performance.
3. Critical accounting estimates and judgmentsIn the process of applying the Company’s accounting policies, which are described in Note 2, management has made judgements that have the most significant effect on the amounts recognized in the financial statements and applied certain assumptions, and other key sources of estimation uncertainty at the reporting date as discussed below
Estimates and underlying assumptions are reviewed on an ongoing basis. Revision to accounting estimates are recognized in the year in which the estimates are revised and in any future year affected. Such estimates are necessarily based on assumptions about several factors involving varying, and possibly significant, degrees of judgement and uncertainty and actual results may differ from management’s estimates resulting in future changes in estimated liabilities.
53
Notes to the financial statementsfor the year ended 31 December 2015 (continued)
3. Critical accounting estimates and judgments (continued)
Impairment of Investment at fair value through equityThe Company follows the guidance of FAS 25 to determine when an investment at fair value through equity is impaired. This determination requires significant judgements. In making this judgements, the Company evaluates, among other factors, the duration and extent to which the fair value of an investment is less than its cost; and the financial health of and short-term business outlook for the investee, including factors such as industry and sector performance, changes in technology and operational and financing cash flow.
Key sources of estimation uncertaintyThe key assumptions concerning the future, and other key sources of estimation uncertainty at the reporting date, that have a significant risk of causing a material adjustment to the carrying amounts of assets and liabilities within the next financial year, are discussed below :
(a) Claims outstandingIn particular, estimates have to be made both for the expected ultimate cost of claims reported at the statement of financial position date and for the expected ultimate cost of claims incurred but not yet reported (IBNR) at the statement of financial position date. The management uses the initial value of the claim provided by the surveyor for the expected ultimate cost of claims reported at the financial position date. The primary technique adopted by management in estimating the cost of notified and IBNR claims, is that of using past claim settlement trends to predict future claims settlement trends. At each reporting date, prior year claims estimates are reassessed for adequacy and changes are made to the provision. General takaful claims provisions are not discounted for the time value of money.
(b) Impairment of receivables An estimate of the collectible amount of takaful and other receivables is made when collection of the full amount is no longer probable. This determination of whether these takaful and other receivables are impaired entails the Company evaluating, the credit and liquidity position of the policy holders and the takaful companies, historical recovery rates including detailed investigations carried out during the year and feedback received
from their legal department. The difference between the estimated collectible amount and the carrying value is recognized as an expense in the statement of participants’ revenue and expenses. Any difference between the amounts actually collected in the future years and the amounts expected will be recognized in the statement of participants’ revenue and expenses at the time of collection.
4. Cash and bank balances
2015 2014RO RO
Cash and bank balancesCash and bank balances 3,785,602 1,910,842
Cash and Bank Balances 504,160 591,487
Cash Balances with Investment Managers 4,289,762 2,502,329
54
Notes to the financial statementsfor the year ended 31 December 2015 (continued)
5. Bank deposits
Bank deposits Bank deposits with maturity of less than three monthsfrom the date of placement
134,623 142,679
Bank deposits with maturity of more than three monthsfrom the date of placement
6,306,975 6,306,975
6,441,598 6,449,654
Bank deposits amounting to RO 51,975 (2014 - RO 51,975) are denominated in foreign currencies. Bank deposits carry profit rates in range of 1.20% to 2.50% per annum (2014 – 1.20% to 2.50% per annum).
Bank deposit amounting to RO 269,787 (2014 – 263,589) is allocated for payment to be made to retakaful / reinsurance reserve.
Restrictions on transfer of assetsIn accordance with the law governing the operation of insurance companies within the Sultanate of Oman, the Company identified certain specific bank deposits with carrying value of RO 6,255,000 (2014 - RO 6,255,000) to the CMA. The Company can only transfer these assets with the prior approval of the Capital Market Authority.
6. Investments carried at fair value through profit or lossInvestments from shareholders’ fund
Fair value Cost Fair value Cost
2015 2015 2014 2014
RO RO RO RO
Service sector 2,402,730 2,602,546 2,959,186 2,917,495
Industrial sector 1,934,035 2,109,132 2,277,067 2,516,621
Financial sector 42,987 52,185 200,886 225,174
4,379,752 4,763,863 5,437,139 5,659,290
The above investments are local and foreign quoted investments.
The cost and fair value of the foreign investments at the year / year end as follows:
Fair value Cost Fair value Cost
2015 2015 2014 2014
RO RO RO RO
Foreign investments 1,047,580 1,217,883 1,745,889 1,764,437
2015 2014RO RO
55
Notes to the financial statementsfor the year ended 31 December 2015 (continued)
6. Investments carried at fair value through profit or loss (continued)
Restrictions on transfer of assetsIn accordance with the law governing the operation of insurance companies within the Sultanate of Oman, the Company identified certain specific investments with the carrying value of RO 2,453,878 (31 December 2014 - RO 900,280) to the Capital Market Authority. The Company can only transfer these assets with the prior approval of the Capital Market Authority.
7. Takaful and retakaful / reinsurance contract receivables
2015 2014
RO RO
Takaful receivable 6,794,989 7,323,452
Retakaful / reinsurance balances receivable 1,635,274 1,213,734
Gross receivables 8,430,263 8,537,186
Less: provision for impairment of receivables (510,683) (351,381)
7,919,580 8,185,805
Aging of receivables is as follows :
Not due 4,452,220 5,134,396
Above 121 days :
Past due but not impaired 3,467,360 3,051,409
Past due and impaired 510,683 351,381
8,430,263 8,537,186
The normal credit year allowed to takaful debtors and retakaful / reinsurance companies is 120 days, after which amounts are considered as past due. As at 31 December 2015, past due receivables above 121 days of RO 3,467,360 (31 December 2014 - RO 3,051,409) were considered recoverable, as these are due from government and quasi-government entities, brokers and corporate with which the Company deals in the normal course of takaful business and with which there is no recent history of default.
At 31 December 2015, takaful debtors of RO 510,683 (31 December 2014 - RO 351,381) were impaired and provided for fully.
56
Notes to the financial statementsfor the year ended 31 December 2015 (continued)
7. Takaful and retakaful / reinsurance contract receivables (continued)
Movement in the provision for impairment of receivables during the year / year is as follows:
2015 2014
RO RO
At the beginning of the year / year 351,381 328,821
Provision made during the year / year
159,302 22,560
At the end of the year / year 510,683 351,381
8. Receivable from shareholders’ and payable to shareholders’
Receivable from participants includes due from General takaful and Family takaful policyholders’ on account of wakala fees, mudarib share and inter-entity balances.
9. Outstanding claims and unearned contributions reserve
2015 2014
GrossRetakaful /
reinsurance Net Gross
Retakaful /reinsurance Net
RO RO RO RO RO RO
A) General TakafulClaims outstanding 6,734,664 (2,799,225) 3,935,439 6,299,915 (3,520,609) 2,779,306
Claims incurred butnot reported
383,362 (146,717) 236,645 271,505 (172,105) 99,400
7,118,026 (2,945,942) 4,172,084 6,571,420 (3,692,714) 2,878,706
Unearned contribu-tions reserve
9,980,207 (4,380,724) 5,599,483 9,710,946 (4,103,195) 5,607,751
17,098,233 (7,326,666) 9,771,567 16,282,366 (7,795,909) 8,486,457
B) Family TakafulClaims outstanding 528,592 (452,690) 75,902 277,121 (236,016) 41,105
Claims incurred butnot reported
467,873 (346,078) 121,795 1,183,638 (1,082,661) 100,977
996,465 (798,768) 197,697 1,460,759 (1,318,677) 142,082
Unearned contribu-tions reserve
615,587 (454,811) 160,776 361,224 (225,700) 135,524
1,612,052 (1,253,579) 358,473 1,821,983 (1,544,377) 277,606
18,710,285 (8,580,245) 10,130,040 18,104,349 (9,340,286) 8,764,063
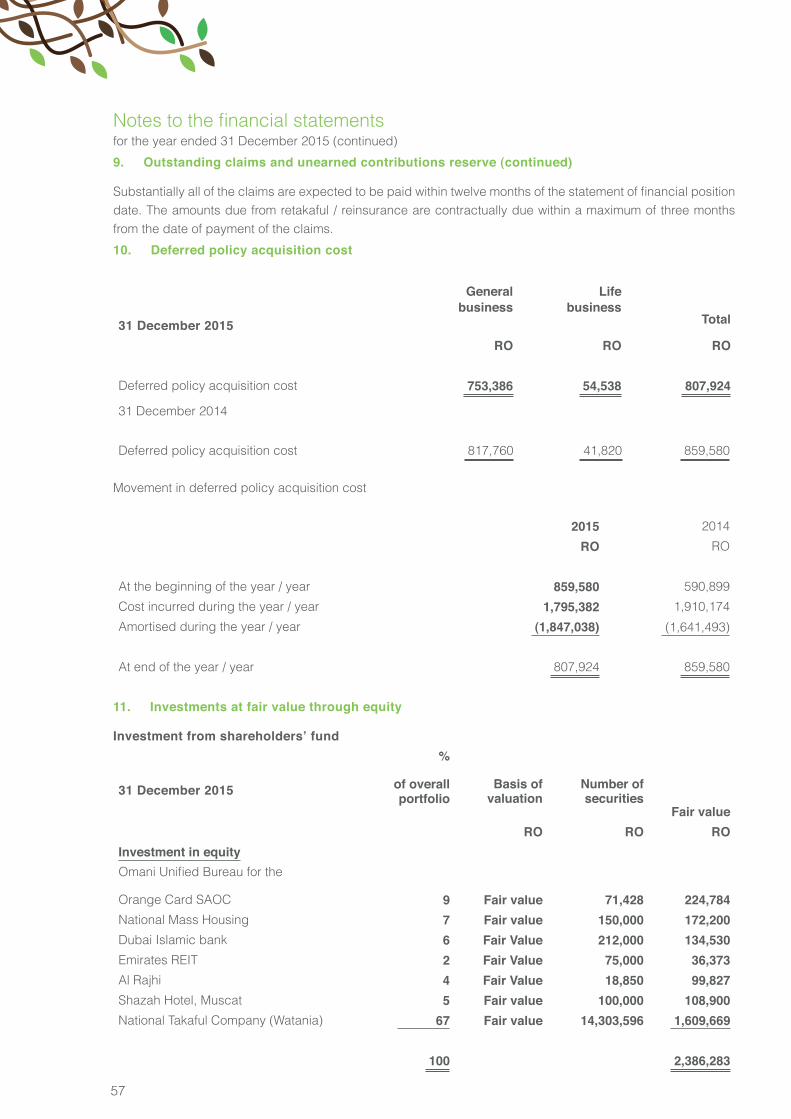
57
Notes to the financial statementsfor the year ended 31 December 2015 (continued)
9. Outstanding claims and unearned contributions reserve (continued)
Substantially all of the claims are expected to be paid within twelve months of the statement of financial position date. The amounts due from retakaful / reinsurance are contractually due within a maximum of three months from the date of payment of the claims.
10. Deferred policy acquisition cost
31 December 2015
Generalbusiness
Lifebusiness
Total
RO RO RO
Deferred policy acquisition cost 753,386 54,538 807,924
31 December 2014
Deferred policy acquisition cost 817,760 41,820 859,580
Movement in deferred policy acquisition cost
2015 2014
RO RO
At the beginning of the year / year 859,580 590,899
Cost incurred during the year / year 1,795,382 1,910,174
Amortised during the year / year (1,847,038) (1,641,493)
At end of the year / year 807,924 859,580
11. Investments at fair value through equity
Investment from shareholders’ fund
31 December 2015
%
of overallportfolio
Basis ofvaluation
Number ofsecurities
Fair valueRO RO RO
Investment in equityOmani Unified Bureau for the
Orange Card SAOC 9 Fair value 71,428
224,784National Mass Housing 7 Fair value 150,000 172,200Dubai Islamic bank 6 Fair Value 212,000 134,530Emirates REIT 2 Fair Value 75,000 36,373Al Rajhi 4 Fair Value 18,850 99,827Shazah Hotel, Muscat 5 Fair value 100,000 108,900National Takaful Company (Watania) 67 Fair value 14,303,596 1,609,669
100 2,386,283
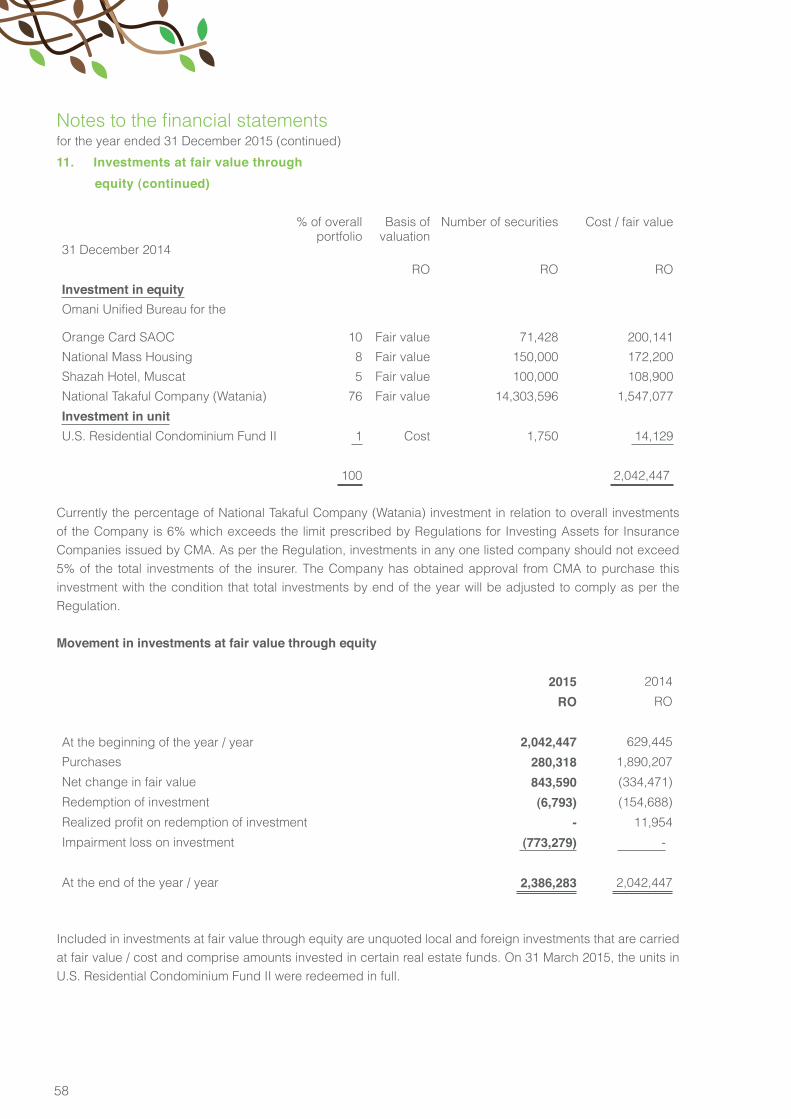
58
Notes to the financial statementsfor the year ended 31 December 2015 (continued)
11. Investments at fair value through equity (continued)
31 December 2014
% of overallportfolio
Basis ofvaluation
Number of securities Cost / fair value
RO RO RO
Investment in equityOmani Unified Bureau for the
Orange Card SAOC 10 Fair value 71,428 200,141
National Mass Housing 8 Fair value 150,000 172,200
Shazah Hotel, Muscat 5 Fair value 100,000 108,900
National Takaful Company (Watania) 76 Fair value 14,303,596 1,547,077
Investment in unitU.S. Residential Condominium Fund II 1 Cost 1,750 14,129
100 2,042,447
Currently the percentage of National Takaful Company (Watania) investment in relation to overall investments of the Company is 6% which exceeds the limit prescribed by Regulations for Investing Assets for Insurance Companies issued by CMA. As per the Regulation, investments in any one listed company should not exceed 5% of the total investments of the insurer. The Company has obtained approval from CMA to purchase this investment with the condition that total investments by end of the year will be adjusted to comply as per the Regulation. Movement in investments at fair value through equity
2015 2014
RO RO
At the beginning of the year / year 2,042,447 629,445
Purchases 280,318 1,890,207
Net change in fair value 843,590 (334,471)
Redemption of investment (6,793) (154,688)
Realized profit on redemption of investment - 11,954
Impairment loss on investment (773,279) -
At the end of the year / year 2,386,283 2,042,447
Included in investments at fair value through equity are unquoted local and foreign investments that are carried at fair value / cost and comprise amounts invested in certain real estate funds. On 31 March 2015, the units in U.S. Residential Condominium Fund II were redeemed in full.
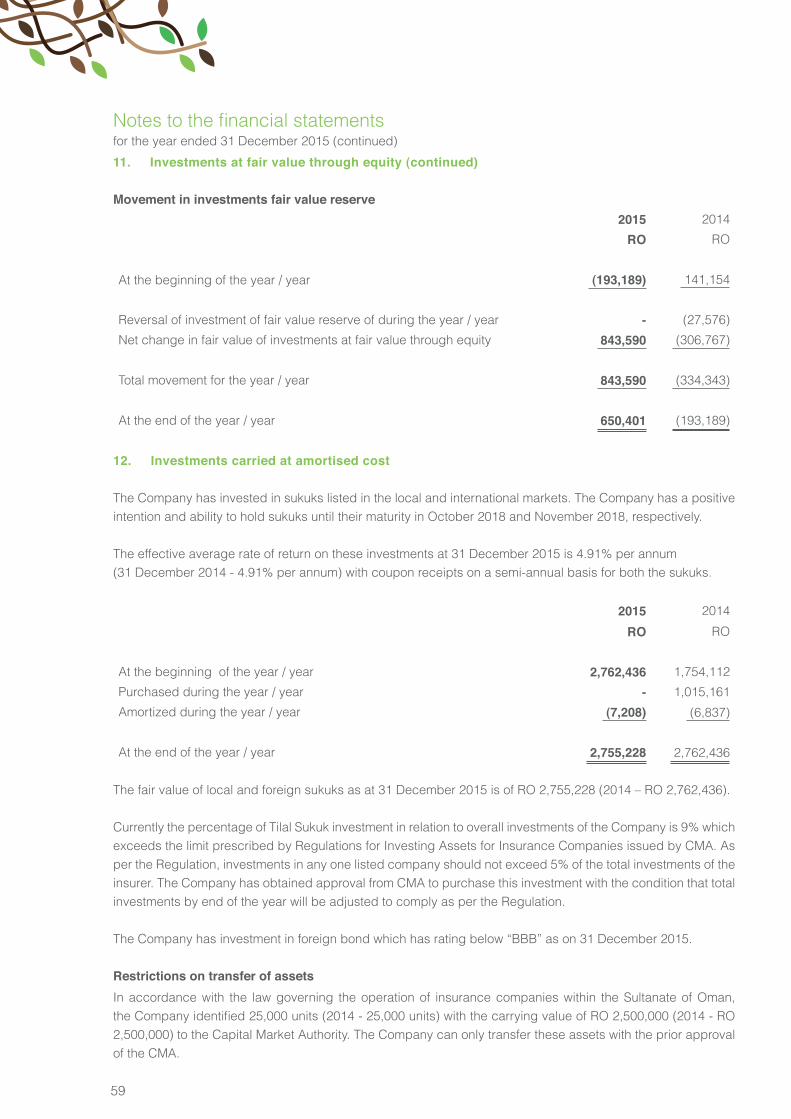
59
Notes to the financial statementsfor the year ended 31 December 2015 (continued)
11. Investments at fair value through equity (continued)
Movement in investments fair value reserve2015 2014
RO RO
At the beginning of the year / year (193,189) 141,154
Reversal of investment of fair value reserve of during the year / year - (27,576)
Net change in fair value of investments at fair value through equity 843,590 (306,767)
Total movement for the year / year 843,590 (334,343)
At the end of the year / year 650,401 (193,189)
12. Investments carried at amortised cost
The Company has invested in sukuks listed in the local and international markets. The Company has a positive intention and ability to hold sukuks until their maturity in October 2018 and November 2018, respectively.
The effective average rate of return on these investments at 31 December 2015 is 4.91% per annum(31 December 2014 - 4.91% per annum) with coupon receipts on a semi-annual basis for both the sukuks.
2015 2014
RO RO
At the beginning of the year / year 2,762,436 1,754,112
Purchased during the year / year - 1,015,161
Amortized during the year / year (7,208) (6,837)
At the end of the year / year 2,755,228 2,762,436
The fair value of local and foreign sukuks as at 31 December 2015 is of RO 2,755,228 (2014 – RO 2,762,436).
Currently the percentage of Tilal Sukuk investment in relation to overall investments of the Company is 9% which exceeds the limit prescribed by Regulations for Investing Assets for Insurance Companies issued by CMA. As per the Regulation, investments in any one listed company should not exceed 5% of the total investments of the insurer. The Company has obtained approval from CMA to purchase this investment with the condition that total investments by end of the year will be adjusted to comply as per the Regulation.
The Company has investment in foreign bond which has rating below “BBB” as on 31 December 2015.
Restrictions on transfer of assetsIn accordance with the law governing the operation of insurance companies within the Sultanate of Oman, the Company identified 25,000 units (2014 - 25,000 units) with the carrying value of RO 2,500,000 (2014 - RO 2,500,000) to the Capital Market Authority. The Company can only transfer these assets with the prior approval of the CMA.
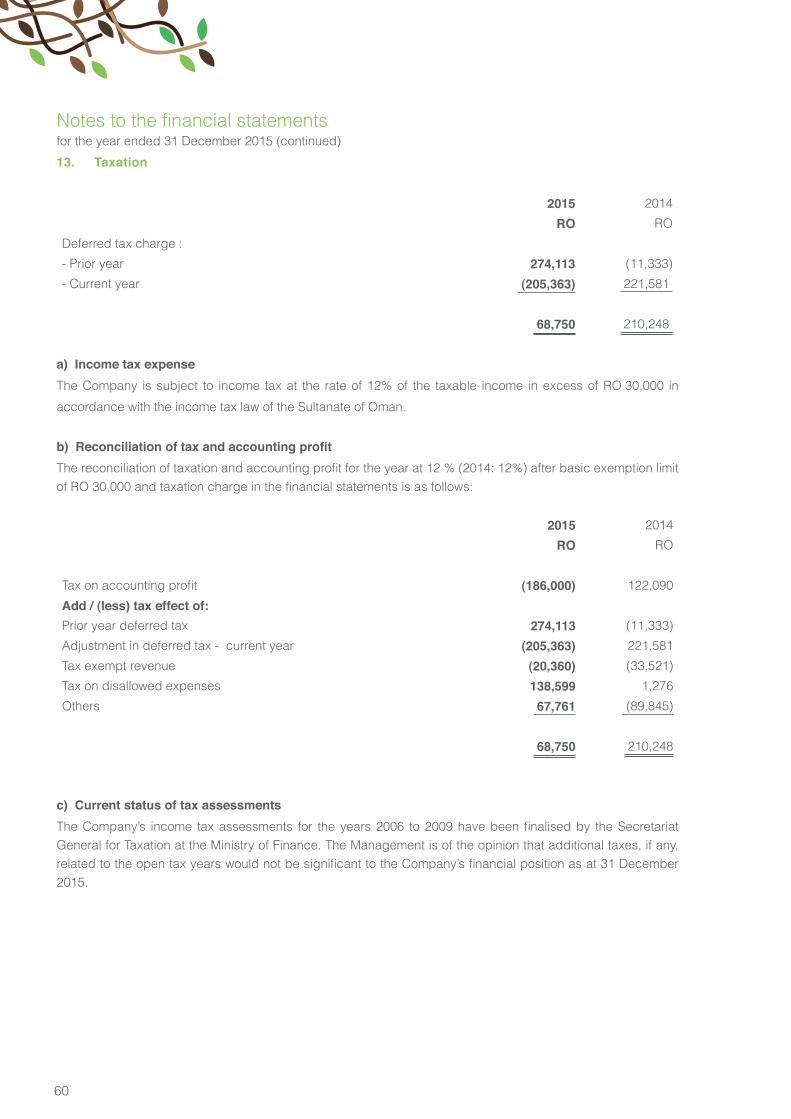
60
Notes to the financial statementsfor the year ended 31 December 2015 (continued)
13. Taxation
2015 2014
RO RO
Deferred tax charge :
- Prior year 274,113 (11,333)
- Current year (205,363) 221,581
68,750 210,248
a) Income tax expenseThe Company is subject to income tax at the rate of 12% of the taxable income in excess of RO 30,000 in
accordance with the income tax law of the Sultanate of Oman.
b) Reconciliation of tax and accounting profitThe reconciliation of taxation and accounting profit for the year at 12 % (2014: 12%) after basic exemption limit of RO 30,000 and taxation charge in the financial statements is as follows:
2015 2014
RO RO
Tax on accounting profit (186,000) 122,090
Add / (less) tax effect of:Prior year deferred tax 274,113 (11,333)
Adjustment in deferred tax - current year (205,363) 221,581
Tax exempt revenue (20,360) (33,521)
Tax on disallowed expenses 138,599 1,276
Others 67,761 (89,845)
68,750 210,248
c) Current status of tax assessmentsThe Company’s income tax assessments for the years 2006 to 2009 have been finalised by the Secretariat General for Taxation at the Ministry of Finance. The Management is of the opinion that additional taxes, if any, related to the open tax years would not be significant to the Company’s financial position as at 31 December 2015.
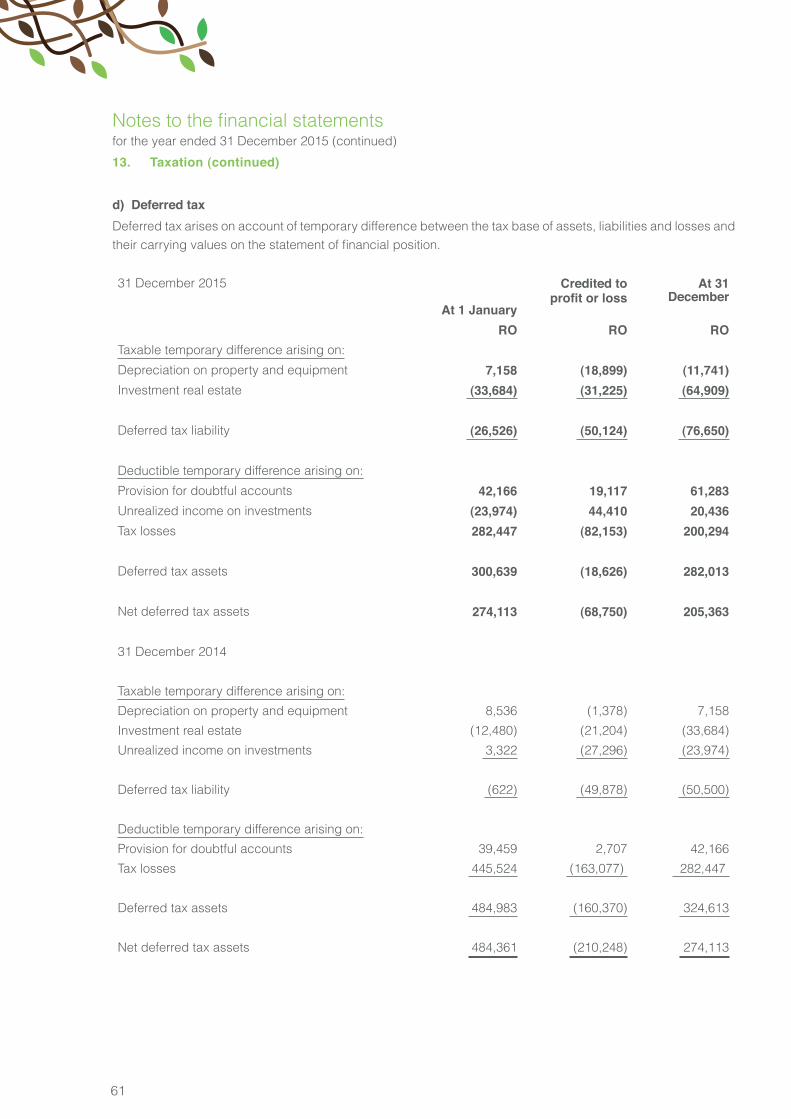
61
Notes to the financial statementsfor the year ended 31 December 2015 (continued)
13. Taxation (continued)
d) Deferred tax Deferred tax arises on account of temporary difference between the tax base of assets, liabilities and losses and their carrying values on the statement of financial position.
31 December 2015
At 1 January
Credited toprofit or loss
At 31December
RO RO ROTaxable temporary difference arising on:
Depreciation on property and equipment 7,158 (18,899) (11,741)Investment real estate (33,684) (31,225) (64,909)
Deferred tax liability (26,526) (50,124) (76,650)
Deductible temporary difference arising on:
Provision for doubtful accounts 42,166 19,117 61,283Unrealized income on investments (23,974) 44,410 20,436Tax losses 282,447 (82,153) 200,294
Deferred tax assets 300,639 (18,626) 282,013
Net deferred tax assets 274,113 (68,750) 205,363
31 December 2014
Taxable temporary difference arising on:
Depreciation on property and equipment 8,536 (1,378) 7,158
Investment real estate (12,480) (21,204) (33,684)
Unrealized income on investments 3,322 (27,296) (23,974)
Deferred tax liability (622) (49,878) (50,500)
Deductible temporary difference arising on:
Provision for doubtful accounts 39,459 2,707 42,166
Tax losses 445,524 (163,077) 282,447
Deferred tax assets 484,983 (160,370) 324,613
Net deferred tax assets 484,361 (210,248) 274,113
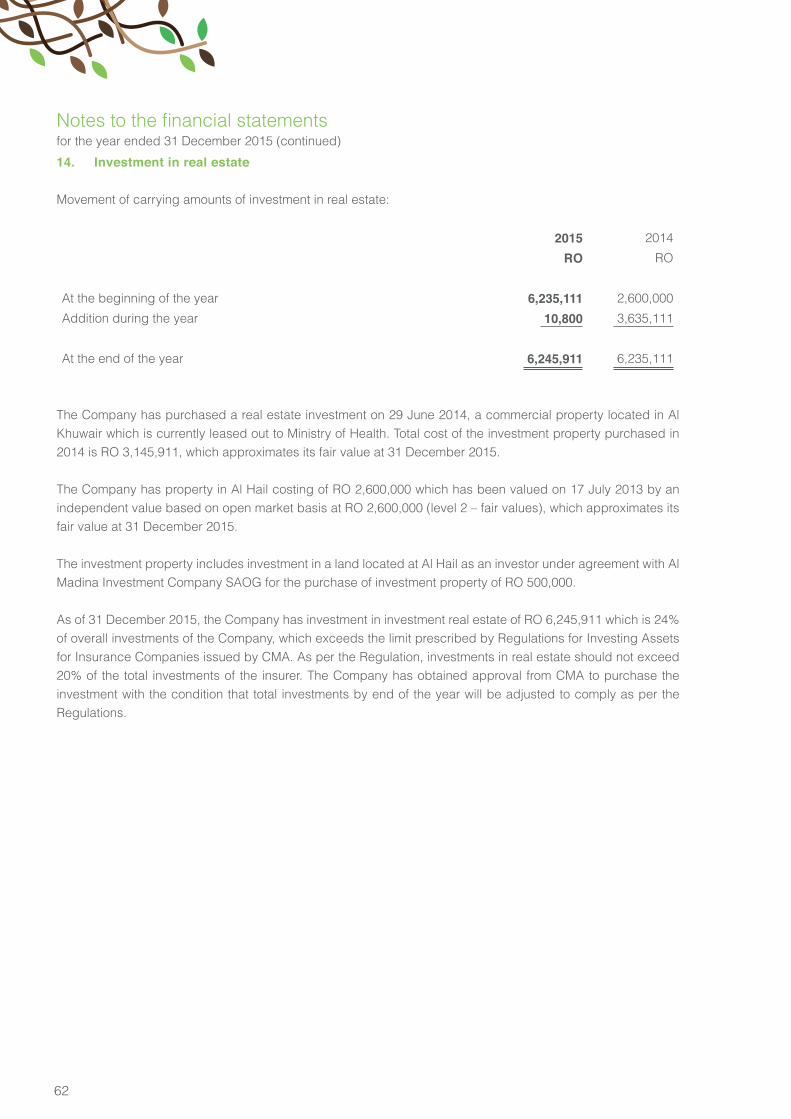
62
Notes to the financial statementsfor the year ended 31 December 2015 (continued)
14. Investment in real estate
Movement of carrying amounts of investment in real estate:
2015 2014
RO RO
At the beginning of the year 6,235,111 2,600,000
Addition during the year 10,800 3,635,111
At the end of the year 6,245,911 6,235,111
The Company has purchased a real estate investment on 29 June 2014, a commercial property located in Al Khuwair which is currently leased out to Ministry of Health. Total cost of the investment property purchased in 2014 is RO 3,145,911, which approximates its fair value at 31 December 2015.
The Company has property in Al Hail costing of RO 2,600,000 which has been valued on 17 July 2013 by an independent value based on open market basis at RO 2,600,000 (level 2 – fair values), which approximates its fair value at 31 December 2015.
The investment property includes investment in a land located at Al Hail as an investor under agreement with Al Madina Investment Company SAOG for the purchase of investment property of RO 500,000.
As of 31 December 2015, the Company has investment in investment real estate of RO 6,245,911 which is 24% of overall investments of the Company, which exceeds the limit prescribed by Regulations for Investing Assets for Insurance Companies issued by CMA. As per the Regulation, investments in real estate should not exceed 20% of the total investments of the insurer. The Company has obtained approval from CMA to purchase the investment with the condition that total investments by end of the year will be adjusted to comply as per the Regulations.
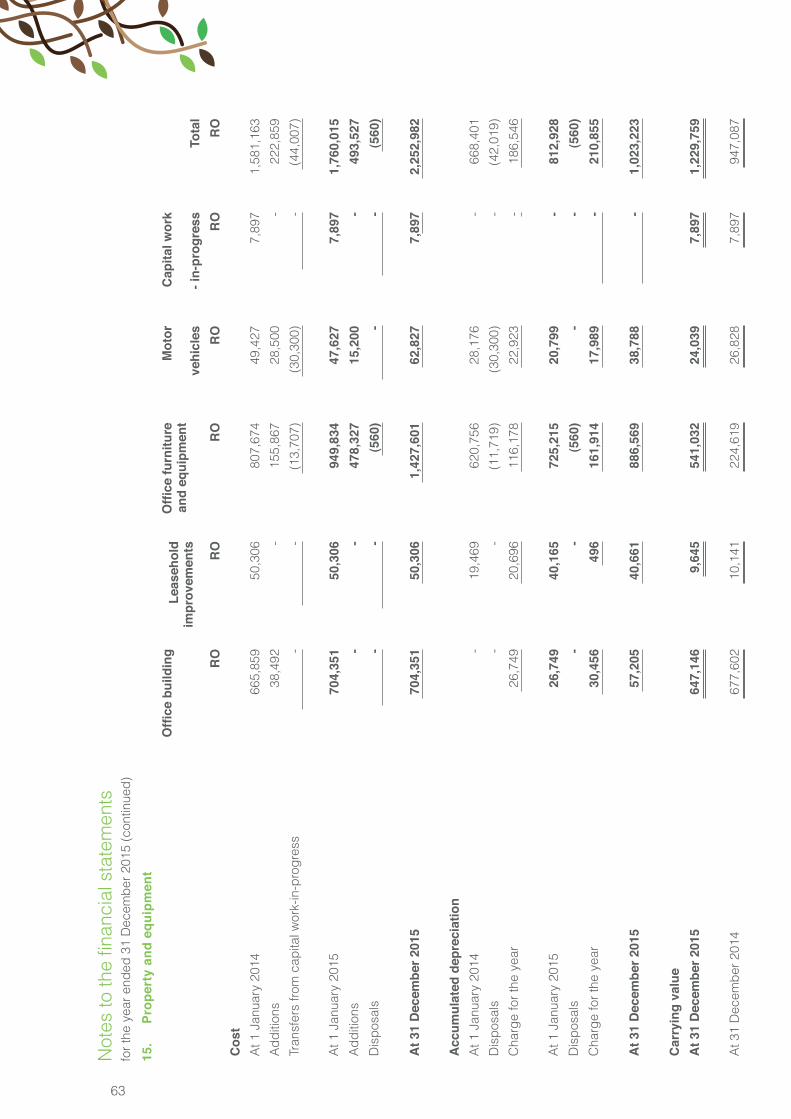
63
Not
es to
the
finan
cial
sta
tem
ents
for t
he y
ear e
nded
31
Dec
embe
r 201
5 (c
ontin
ued)
15.
Pr
oper
ty a
nd e
quip
men
tO
ffice
bui
ldin
g L
ease
hold
impr
ovem
ents
Offi
ce fu
rnitu
rean
d eq
uipm
ent
Mot
or
vehi
cles
Cap
ital w
ork
- in-
prog
ress
Tota
lR
OR
OR
OR
OR
OR
OC
ost
At 1
Jan
uary
201
466
5,85
950
,306
807,
674
49,4
277,
897
1,58
1,16
3
Add
ition
s 3
8,49
2-
15
5,86
7
28
,500
-
2
22,8
59
Tran
sfer
s fro
m c
apita
l wor
k-in
-pro
gres
s
-
-(1
3,70
7)(3
0,30
0)
-(4
4,00
7)
At 1
Jan
uary
201
570
4,35
150
,306
949
,834
47,6
277,
897
1,76
0,01
5A
dditi
ons
--
478,
327
15,2
00-
493,
527
Dis
posa
ls
-
-
(560
)
-
-
(560
)
At 3
1 D
ecem
ber 2
015
704,
351
50,3
061,
427,
601
62,8
277,
897
2,25
2,98
2
Acc
umul
ated
dep
reci
atio
nA
t 1 J
anua
ry 2
014
-19
,469
620,
756
28,1
76-
668,
401
Dis
posa
ls-
-(1
1,71
9)(3
0,30
0)-
(42,
019)
Cha
rge
for t
he y
ear
26,7
4920
,696
116,
178
22,9
23-
186,
546
At 1
Jan
uary
201
526
,749
40,1
6572
5,21
520
,799
-81
2,92
8D
ispo
sals
--
(560
)-
-(5
60)
Cha
rge
for t
he y
ear
30,
456
496
161,
914
17,9
89
-
210,
855
At 3
1 D
ecem
ber 2
015
57,2
0540
,661
886,
569
38,7
88
-
1,02
3,22
3
Car
ryin
g va
lue
At 3
1 D
ecem
ber 2
015
647,
146
9,64
554
1,03
224
,039
7,89
71,
229,
759
At 3
1 D
ecem
ber 2
014
677,
602
10,1
4122
4,61
926
,828
7,89
794
7,08
7
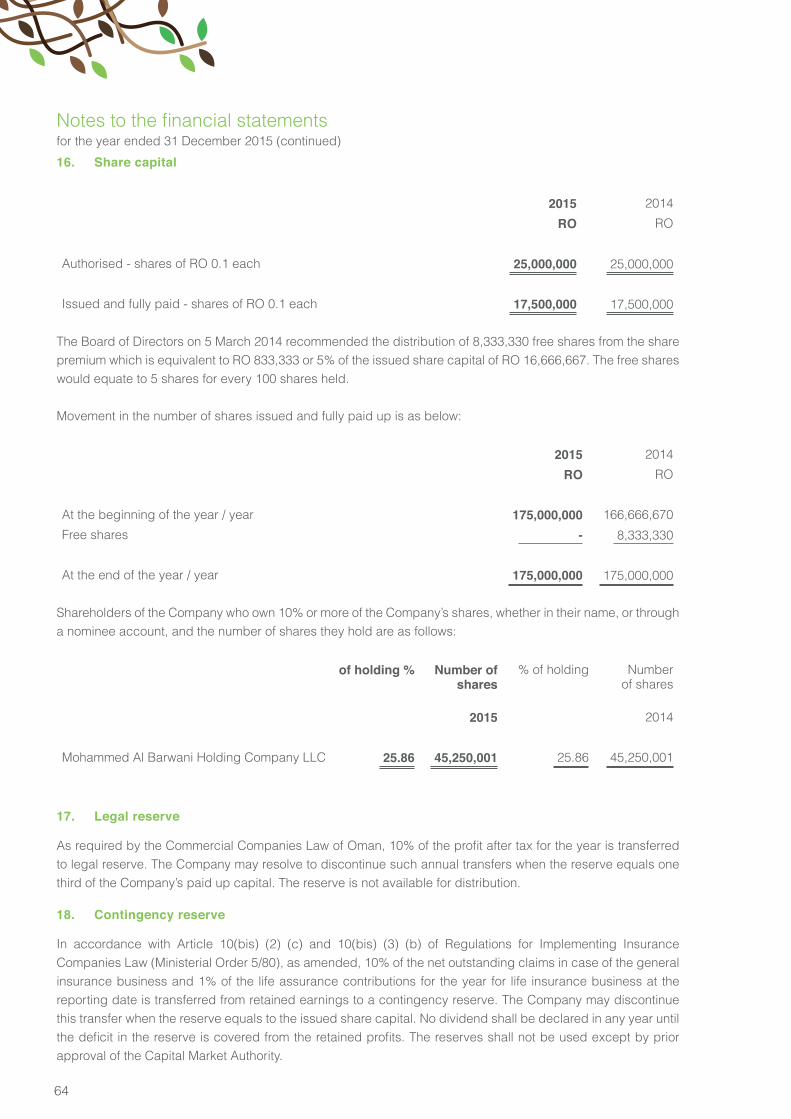
64
Notes to the financial statementsfor the year ended 31 December 2015 (continued)
16. Share capital
2015 2014
RO RO
Authorised - shares of RO 0.1 each 25,000,000 25,000,000
Issued and fully paid - shares of RO 0.1 each 17,500,000 17,500,000
The Board of Directors on 5 March 2014 recommended the distribution of 8,333,330 free shares from the share premium which is equivalent to RO 833,333 or 5% of the issued share capital of RO 16,666,667. The free shares would equate to 5 shares for every 100 shares held.
Movement in the number of shares issued and fully paid up is as below:
2015 2014
RO RO
At the beginning of the year / year 175,000,000 166,666,670
Free shares - 8,333,330
At the end of the year / year 175,000,000 175,000,000
Shareholders of the Company who own 10% or more of the Company’s shares, whether in their name, or through a nominee account, and the number of shares they hold are as follows:
of holding % Number ofshares
% of holding Numberof shares
2015 2014
Mohammed Al Barwani Holding Company LLC 25.86 45,250,001 25.86 45,250,001
17. Legal reserve
As required by the Commercial Companies Law of Oman, 10% of the profit after tax for the year is transferred to legal reserve. The Company may resolve to discontinue such annual transfers when the reserve equals one third of the Company’s paid up capital. The reserve is not available for distribution.
18. Contingency reserve
In accordance with Article 10(bis) (2) (c) and 10(bis) (3) (b) of Regulations for Implementing Insurance Companies Law (Ministerial Order 5/80), as amended, 10% of the net outstanding claims in case of the general insurance business and 1% of the life assurance contributions for the year for life insurance business at the reporting date is transferred from retained earnings to a contingency reserve. The Company may discontinue this transfer when the reserve equals to the issued share capital. No dividend shall be declared in any year until the deficit in the reserve is covered from the retained profits. The reserves shall not be used except by prior approval of the Capital Market Authority.
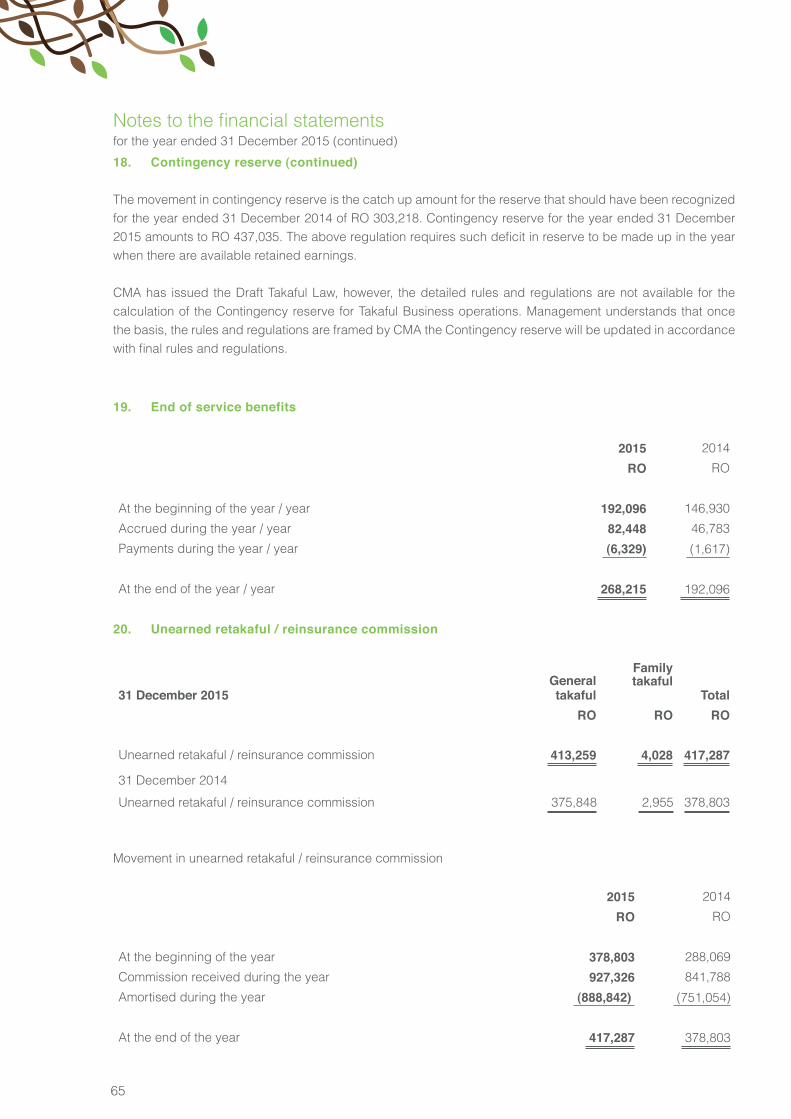
65
Notes to the financial statementsfor the year ended 31 December 2015 (continued)
18. Contingency reserve (continued)
The movement in contingency reserve is the catch up amount for the reserve that should have been recognized for the year ended 31 December 2014 of RO 303,218. Contingency reserve for the year ended 31 December 2015 amounts to RO 437,035. The above regulation requires such deficit in reserve to be made up in the year when there are available retained earnings.
CMA has issued the Draft Takaful Law, however, the detailed rules and regulations are not available for the calculation of the Contingency reserve for Takaful Business operations. Management understands that once the basis, the rules and regulations are framed by CMA the Contingency reserve will be updated in accordance with final rules and regulations.
19. End of service benefits
2015 2014
RO RO
At the beginning of the year / year 192,096 146,930
Accrued during the year / year 82,448 46,783
Payments during the year / year (6,329) (1,617)
At the end of the year / year 268,215 192,096
20. Unearned retakaful / reinsurance commission
31 December 2015 General
takaful
Familytakaful
TotalRO RO RO
Unearned retakaful / reinsurance commission 413,259 4,028 417,287
31 December 2014
Unearned retakaful / reinsurance commission 375,848 2,955 378,803
Movement in unearned retakaful / reinsurance commission
2015 2014
RO RO
At the beginning of the year 378,803 288,069
Commission received during the year 927,326 841,788
Amortised during the year (888,842) (751,054)
At the end of the year 417,287 378,803
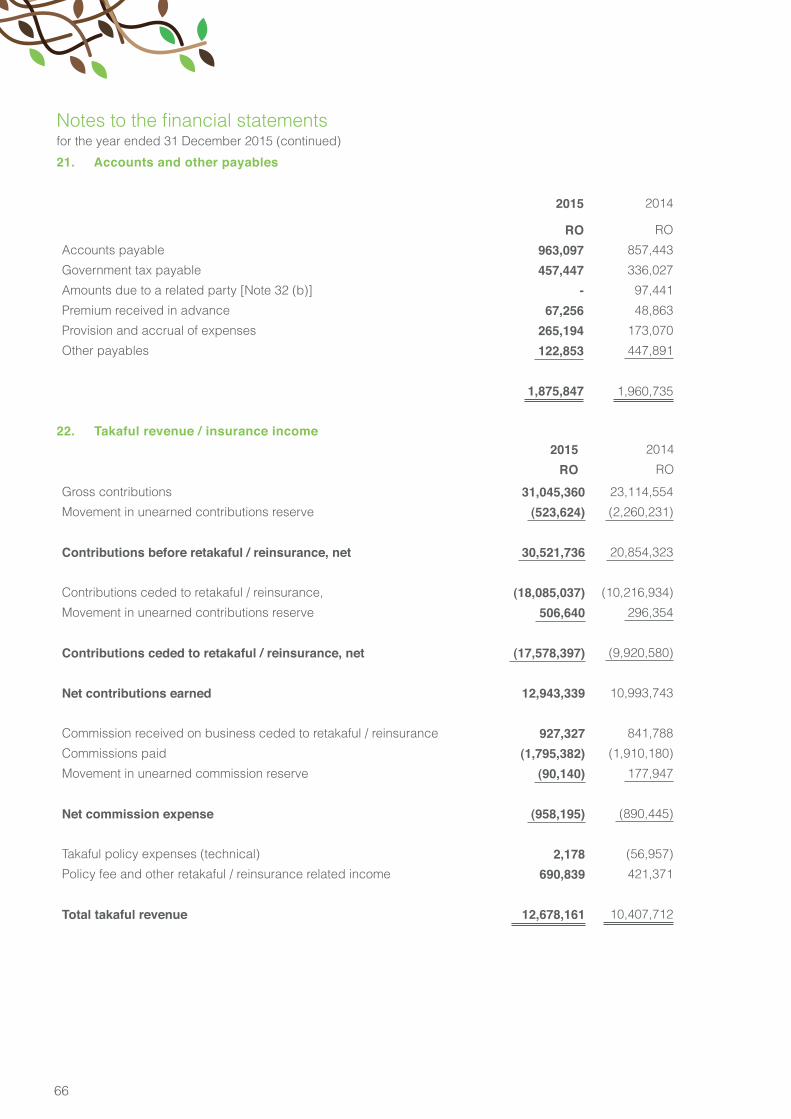
66
2015 2014
RO RO
Notes to the financial statementsfor the year ended 31 December 2015 (continued)
21. Accounts and other payables
2015
RO
2014
RO
Accounts payable 963,097 857,443
Government tax payable 457,447 336,027
Amounts due to a related party [Note 32 (b)] - 97,441
Premium received in advance 67,256 48,863
Provision and accrual of expenses 265,194 173,070
Other payables 122,853 447,891
1,875,847 1,960,735
22. Takaful revenue / insurance income
Gross contributions 31,045,360 23,114,554
Movement in unearned contributions reserve (523,624) (2,260,231)
Contributions before retakaful / reinsurance, net 30,521,736 20,854,323
Contributions ceded to retakaful / reinsurance, (18,085,037) (10,216,934)
Movement in unearned contributions reserve 506,640 296,354
Contributions ceded to retakaful / reinsurance, net (17,578,397) (9,920,580)
Net contributions earned 12,943,339 10,993,743
Commission received on business ceded to retakaful / reinsurance 927,327 841,788
Commissions paid (1,795,382) (1,910,180)
Movement in unearned commission reserve (90,140) 177,947
Net commission expense (958,195) (890,445)
Takaful policy expenses (technical) 2,178 (56,957)
Policy fee and other retakaful / reinsurance related income 690,839 421,371
Total takaful revenue 12,678,161 10,407,712
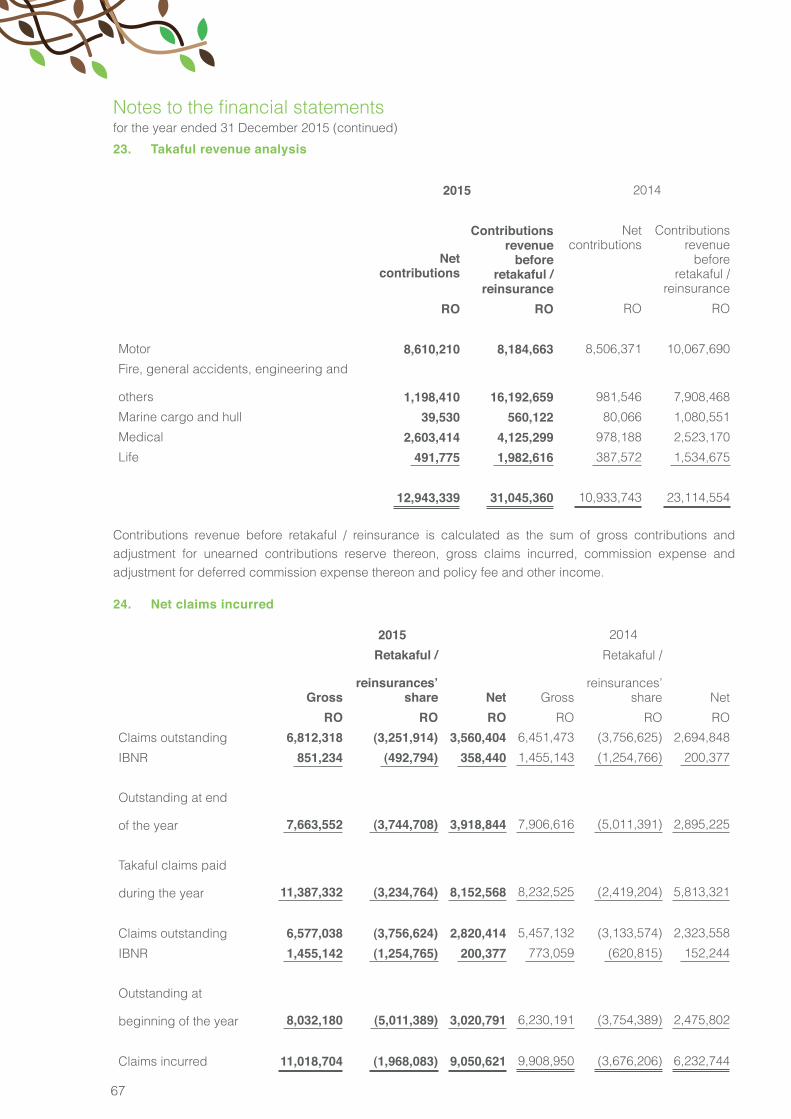
67
Notes to the financial statementsfor the year ended 31 December 2015 (continued)
23. Takaful revenue analysis
2015 2014
Netcontributions
Contributions revenue
before retakaful /
reinsurance
Netcontributions
Contributions revenue
before retakaful /
reinsurance
RO RO RO RO
Motor 8,610,210 8,184,663 8,506,371 10,067,690
Fire, general accidents, engineering and
others 1,198,410 16,192,659 981,546 7,908,468
Marine cargo and hull 39,530 560,122 80,066 1,080,551
Medical 2,603,414 4,125,299 978,188 2,523,170
Life 491,775 1,982,616 387,572 1,534,675
12,943,339 31,045,360 10,933,743 23,114,554
Contributions revenue before retakaful / reinsurance is calculated as the sum of gross contributions and adjustment for unearned contributions reserve thereon, gross claims incurred, commission expense and adjustment for deferred commission expense thereon and policy fee and other income.
24. Net claims incurred
2015 2014
Gross
Retakaful /
reinsurances’share Net Gross
Retakaful /
reinsurances’share Net
RO RO RO RO RO RO
Claims outstanding 6,812,318 (3,251,914) 3,560,404 6,451,473 (3,756,625) 2,694,848
IBNR 851,234 (492,794) 358,440 1,455,143 (1,254,766) 200,377
Outstanding at end
of the year 7,663,552 (3,744,708) 3,918,844 7,906,616 (5,011,391) 2,895,225
Takaful claims paid
during the year 11,387,332 (3,234,764) 8,152,568 8,232,525 (2,419,204) 5,813,321
Claims outstanding 6,577,038 (3,756,624) 2,820,414 5,457,132 (3,133,574) 2,323,558
IBNR 1,455,142 (1,254,765) 200,377 773,059 (620,815) 152,244
Outstanding at
beginning of the year 8,032,180 (5,011,389) 3,020,791 6,230,191 (3,754,389) 2,475,802
Claims incurred 11,018,704 (1,968,083) 9,050,621 9,908,950 (3,676,206) 6,232,744
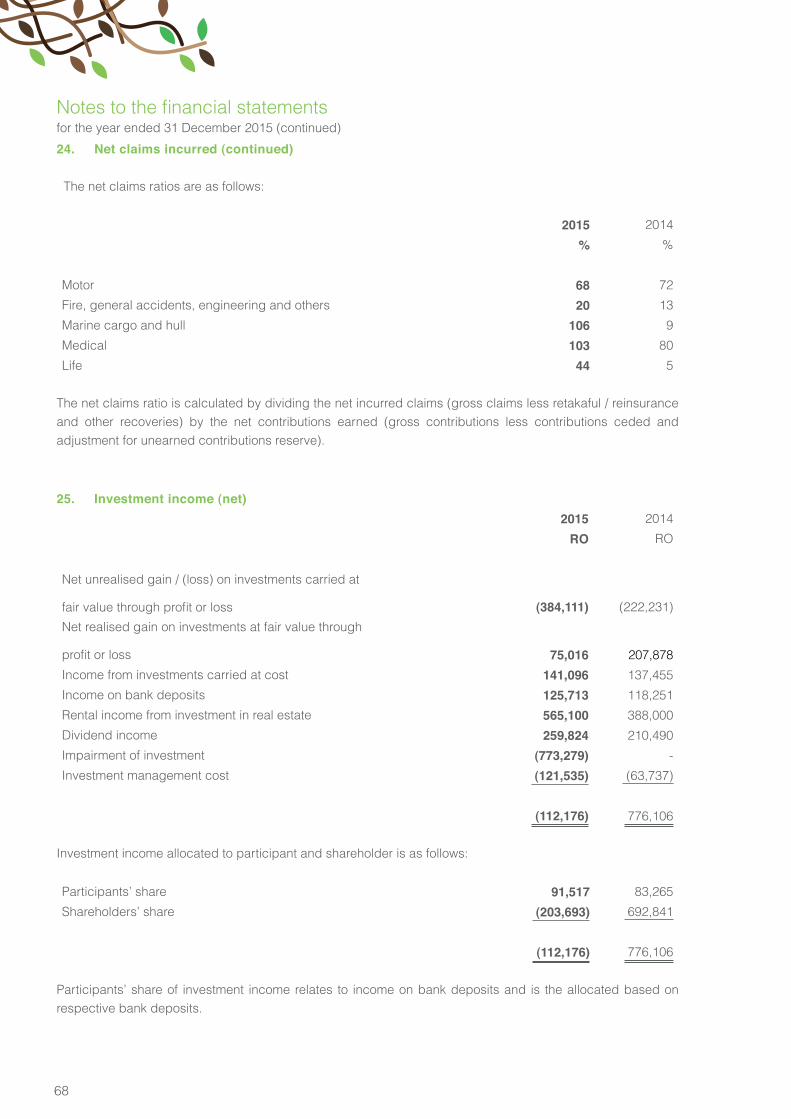
68
Notes to the financial statementsfor the year ended 31 December 2015 (continued)
24. Net claims incurred (continued)
The net claims ratios are as follows:
2015 2014
% %
Motor 68 72
Fire, general accidents, engineering and others 20 13
Marine cargo and hull 106 9
Medical 103 80
Life 44 5
The net claims ratio is calculated by dividing the net incurred claims (gross claims less retakaful / reinsurance and other recoveries) by the net contributions earned (gross contributions less contributions ceded and adjustment for unearned contributions reserve).
25. Investment income (net)2015 2014
RO RO
Net unrealised gain / (loss) on investments carried at
fair value through profit or loss (384,111) (222,231)
Net realised gain on investments at fair value through
profit or loss 75,016 207,878
Income from investments carried at cost 141,096 137,455
Income on bank deposits 125,713 118,251
Rental income from investment in real estate 565,100 388,000
Dividend income 259,824 210,490
Impairment of investment (773,279) -
Investment management cost (121,535) (63,737)
(112,176) 776,106
Investment income allocated to participant and shareholder is as follows:
Participants’ share 91,517 83,265
Shareholders’ share (203,693) 692,841
(112,176) 776,106
Participants’ share of investment income relates to income on bank deposits and is the allocated based on respective bank deposits.
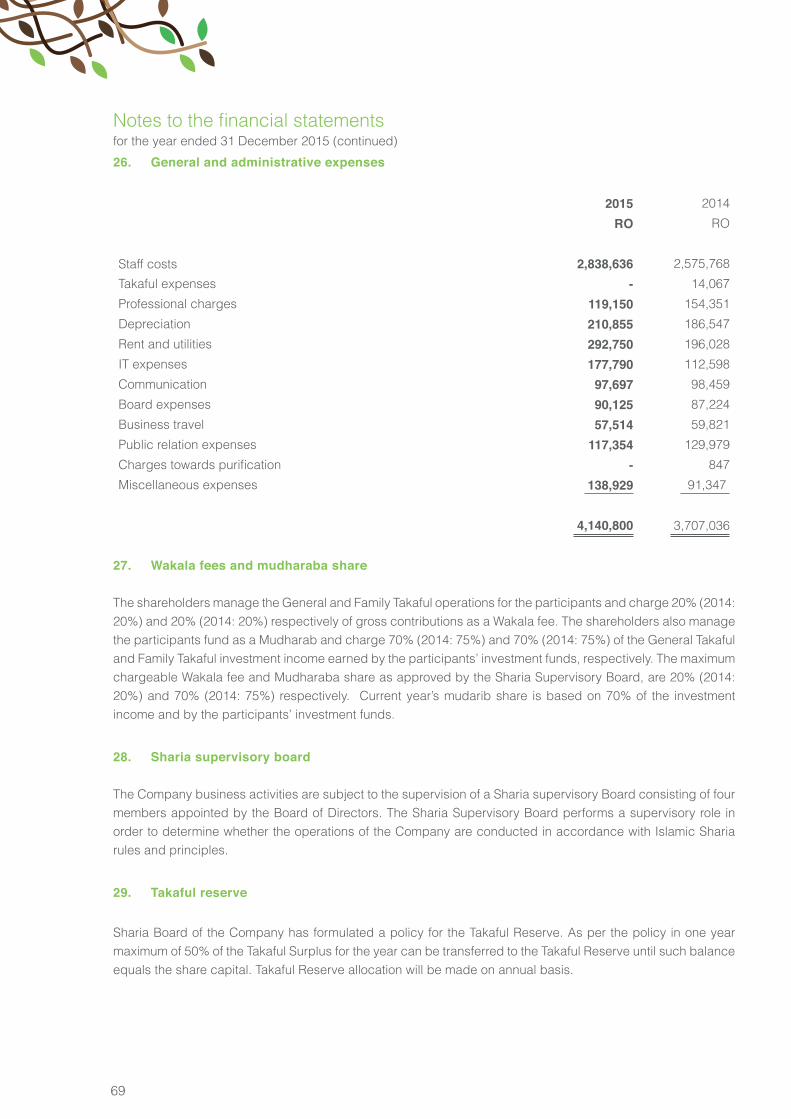
69
Notes to the financial statementsfor the year ended 31 December 2015 (continued)
26. General and administrative expenses
2015 2014
RO RO
Staff costs 2,838,636 2,575,768
Takaful expenses - 14,067
Professional charges 119,150 154,351
Depreciation 210,855 186,547
Rent and utilities 292,750 196,028
IT expenses 177,790 112,598
Communication 97,697 98,459
Board expenses 90,125 87,224
Business travel 57,514 59,821
Public relation expenses 117,354 129,979
Charges towards purification - 847
Miscellaneous expenses 138,929 91,347
4,140,800 3,707,036
27. Wakala fees and mudharaba share
The shareholders manage the General and Family Takaful operations for the participants and charge 20% (2014: 20%) and 20% (2014: 20%) respectively of gross contributions as a Wakala fee. The shareholders also manage the participants fund as a Mudharab and charge 70% (2014: 75%) and 70% (2014: 75%) of the General Takaful and Family Takaful investment income earned by the participants’ investment funds, respectively. The maximum chargeable Wakala fee and Mudharaba share as approved by the Sharia Supervisory Board, are 20% (2014: 20%) and 70% (2014: 75%) respectively. Current year’s mudarib share is based on 70% of the investment income and by the participants’ investment funds.
28. Sharia supervisory board
The Company business activities are subject to the supervision of a Sharia supervisory Board consisting of four members appointed by the Board of Directors. The Sharia Supervisory Board performs a supervisory role in order to determine whether the operations of the Company are conducted in accordance with Islamic Sharia rules and principles.
29. Takaful reserve
Sharia Board of the Company has formulated a policy for the Takaful Reserve. As per the policy in one year maximum of 50% of the Takaful Surplus for the year can be transferred to the Takaful Reserve until such balance equals the share capital. Takaful Reserve allocation will be made on annual basis.
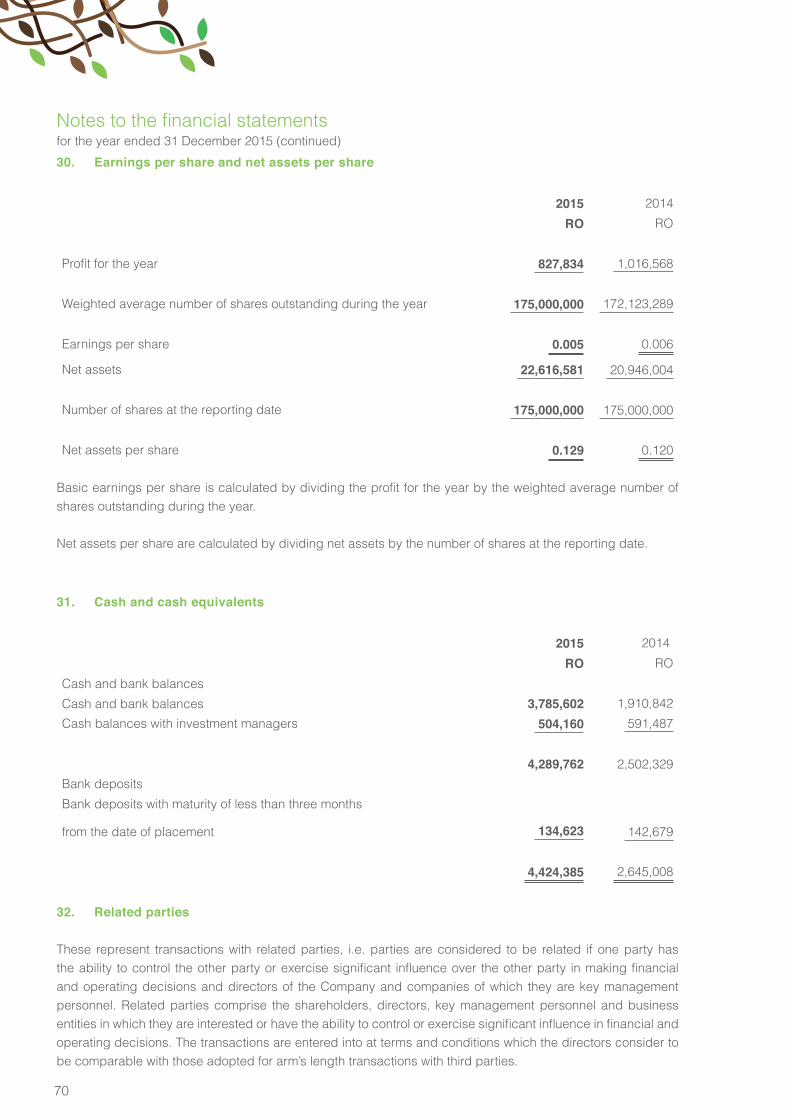
70
Notes to the financial statementsfor the year ended 31 December 2015 (continued)
30. Earnings per share and net assets per share
2015 2014
RO RO
Profit for the year 827,834 1,016,568
Weighted average number of shares outstanding during the year 175,000,000 172,123,289
Earnings per share 0.005 0.006
Net assets 22,616,581 20,946,004
Number of shares at the reporting date 175,000,000 175,000,000
Net assets per share 0.129 0.120
Basic earnings per share is calculated by dividing the profit for the year by the weighted average number of shares outstanding during the year.
Net assets per share are calculated by dividing net assets by the number of shares at the reporting date.
31. Cash and cash equivalents
2015 2014
RO RO
Cash and bank balances
Cash and bank balances 3,785,602 1,910,842
Cash balances with investment managers 504,160 591,487
4,289,762 2,502,329
Bank deposits
Bank deposits with maturity of less than three months
from the date of placement 134,623 142,679
4,424,385 2,645,008
32. Related parties
These represent transactions with related parties, i.e. parties are considered to be related if one party has the ability to control the other party or exercise significant influence over the other party in making financial and operating decisions and directors of the Company and companies of which they are key management personnel. Related parties comprise the shareholders, directors, key management personnel and business entities in which they are interested or have the ability to control or exercise significant influence in financial and operating decisions. The transactions are entered into at terms and conditions which the directors consider to be comparable with those adopted for arm’s length transactions with third parties.
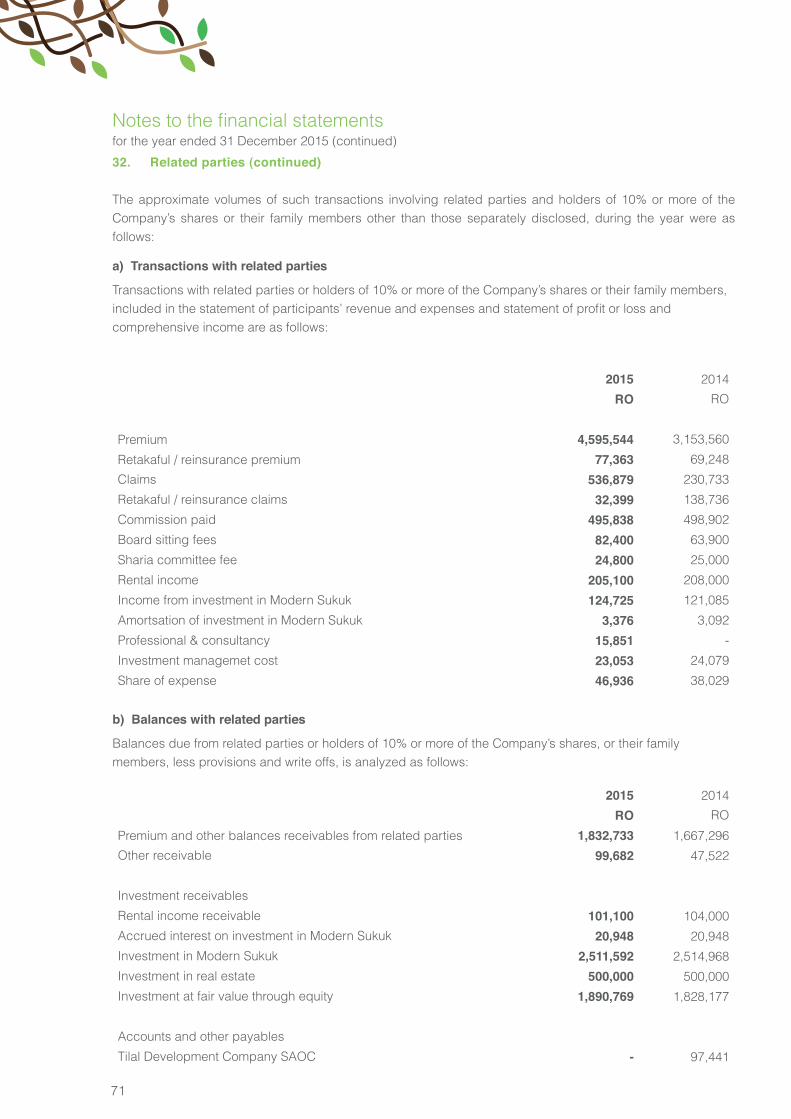
71
Notes to the financial statementsfor the year ended 31 December 2015 (continued)
32. Related parties (continued)
The approximate volumes of such transactions involving related parties and holders of 10% or more of the Company’s shares or their family members other than those separately disclosed, during the year were as follows:
a) Transactions with related parties
Transactions with related parties or holders of 10% or more of the Company’s shares or their family members, included in the statement of participants’ revenue and expenses and statement of profit or loss andcomprehensive income are as follows:
2015 2014
RO RO
Premium 4,595,544 3,153,560
Retakaful / reinsurance premium 77,363 69,248
Claims 536,879 230,733
Retakaful / reinsurance claims 32,399 138,736
Commission paid 495,838 498,902
Board sitting fees 82,400 63,900
Sharia committee fee 24,800 25,000
Rental income 205,100 208,000
Income from investment in Modern Sukuk 124,725 121,085
Amortsation of investment in Modern Sukuk 3,376 3,092
Professional & consultancy 15,851 -
Investment managemet cost 23,053 24,079
Share of expense 46,936 38,029
b) Balances with related parties
Balances due from related parties or holders of 10% or more of the Company’s shares, or their familymembers, less provisions and write offs, is analyzed as follows:
2015 2014
RO RO
Premium and other balances receivables from related parties 1,832,733 1,667,296
Other receivable 99,682 47,522
Investment receivables
Rental income receivable 101,100 104,000
Accrued interest on investment in Modern Sukuk 20,948 20,948
Investment in Modern Sukuk 2,511,592 2,514,968
Investment in real estate 500,000 500,000
Investment at fair value through equity 1,890,769 1,828,177
Accounts and other payables
Tilal Development Company SAOC - 97,441
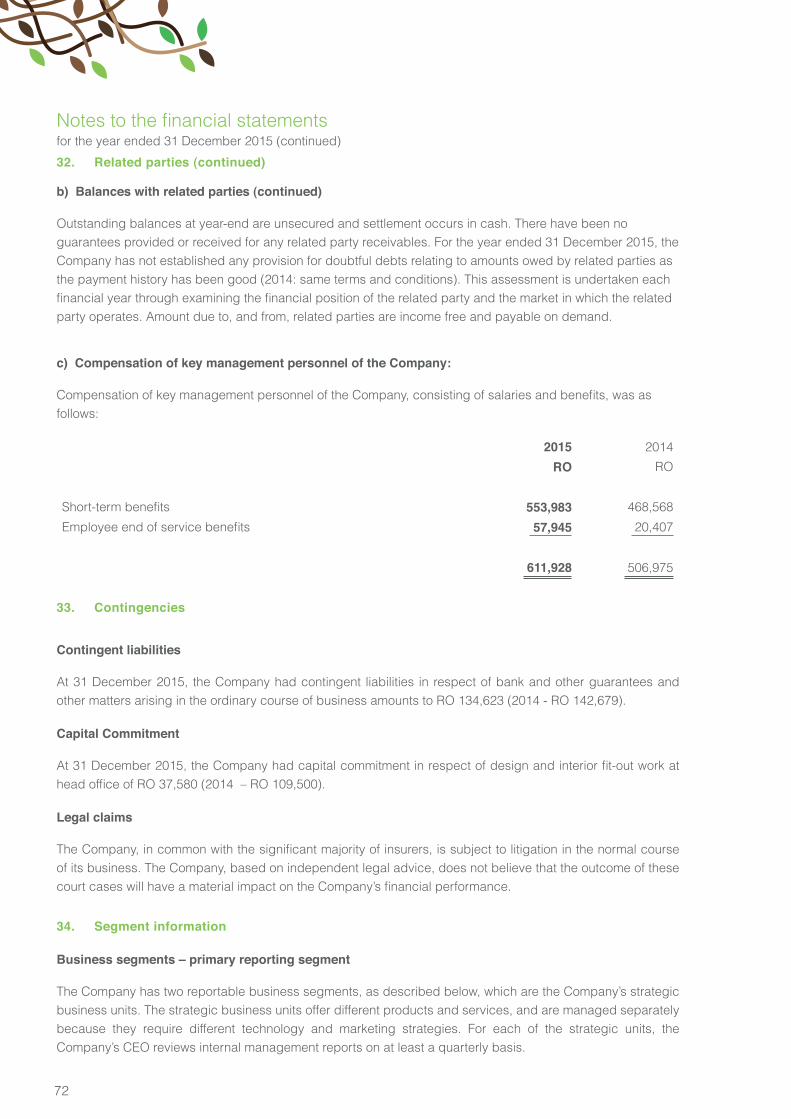
72
Notes to the financial statementsfor the year ended 31 December 2015 (continued)
32. Related parties (continued)
b) Balances with related parties (continued)
Outstanding balances at year-end are unsecured and settlement occurs in cash. There have been no guarantees provided or received for any related party receivables. For the year ended 31 December 2015, the Company has not established any provision for doubtful debts relating to amounts owed by related parties as the payment history has been good (2014: same terms and conditions). This assessment is undertaken each financial year through examining the financial position of the related party and the market in which the relatedparty operates. Amount due to, and from, related parties are income free and payable on demand.
c) Compensation of key management personnel of the Company:
Compensation of key management personnel of the Company, consisting of salaries and benefits, was asfollows:
2015 2014
RO RO
Short-term benefits 553,983 468,568
Employee end of service benefits 57,945 20,407
611,928 506,975
33. Contingencies
Contingent liabilities
At 31 December 2015, the Company had contingent liabilities in respect of bank and other guarantees and other matters arising in the ordinary course of business amounts to RO 134,623 (2014 - RO 142,679).
Capital Commitment
At 31 December 2015, the Company had capital commitment in respect of design and interior fit-out work at head office of RO 37,580 (2014 – RO 109,500).
Legal claims
The Company, in common with the significant majority of insurers, is subject to litigation in the normal course of its business. The Company, based on independent legal advice, does not believe that the outcome of these court cases will have a material impact on the Company’s financial performance.
34. Segment information
Business segments – primary reporting segment
The Company has two reportable business segments, as described below, which are the Company’s strategic business units. The strategic business units offer different products and services, and are managed separately because they require different technology and marketing strategies. For each of the strategic units, the Company’s CEO reviews internal management reports on at least a quarterly basis.
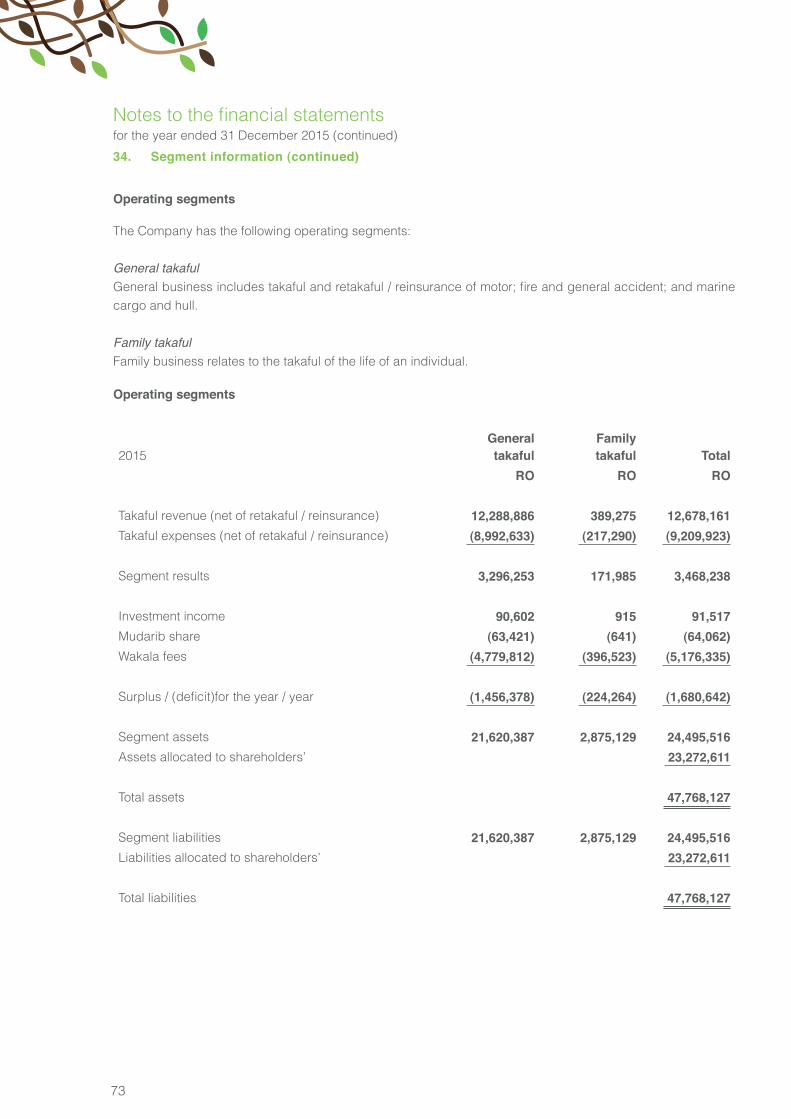
73
Notes to the financial statementsfor the year ended 31 December 2015 (continued)
34. Segment information (continued)
Operating segments
The Company has the following operating segments:
General takafulGeneral business includes takaful and retakaful / reinsurance of motor; fire and general accident; and marine cargo and hull.
Family takafulFamily business relates to the takaful of the life of an individual. Operating segments
2015 General
takaful Familytakaful Total
RO RO RO
Takaful revenue (net of retakaful / reinsurance) 12,288,886 389,275 12,678,161Takaful expenses (net of retakaful / reinsurance) (8,992,633) (217,290) (9,209,923)
Segment results 3,296,253 171,985 3,468,238
Investment income 90,602 915 91,517Mudarib share (63,421) (641) (64,062)Wakala fees (4,779,812) (396,523) (5,176,335)
Surplus / (deficit)for the year / year (1,456,378) (224,264) (1,680,642)
Segment assets 21,620,387 2,875,129 24,495,516Assets allocated to shareholders’ 23,272,611
Total assets 47,768,127
Segment liabilities 21,620,387 2,875,129 24,495,516Liabilities allocated to shareholders’ 23,272,611
Total liabilities 47,768,127
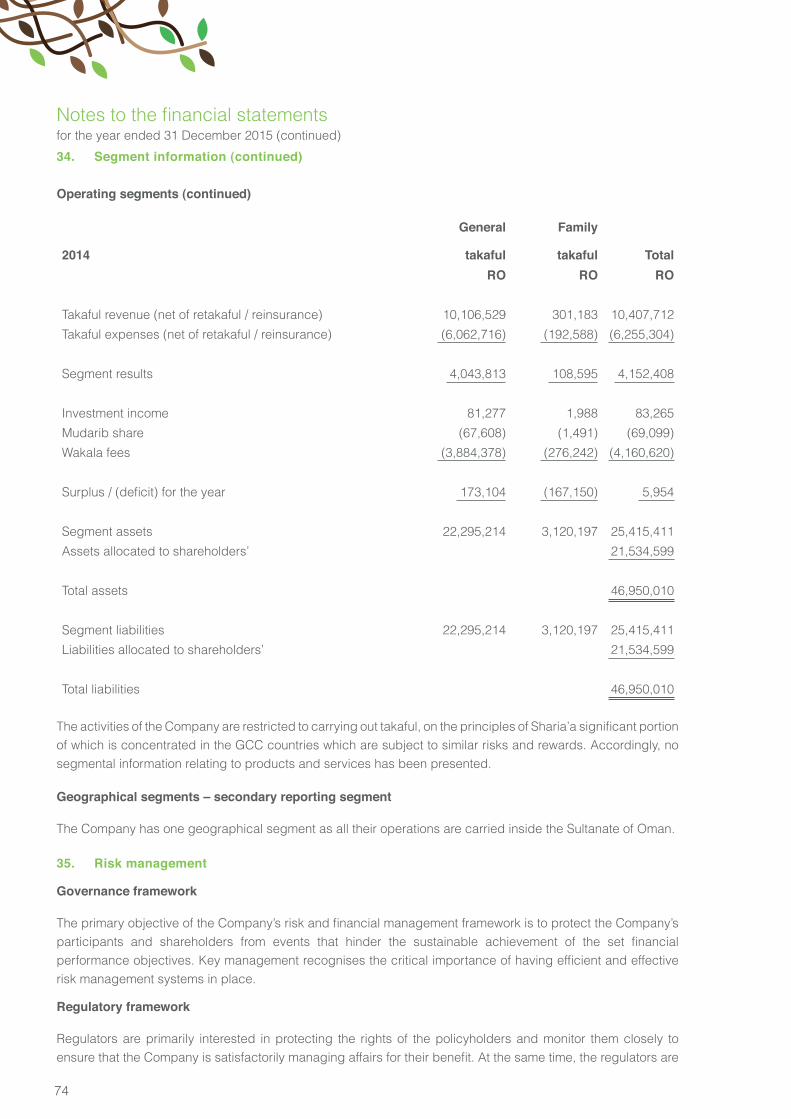
74
Notes to the financial statementsfor the year ended 31 December 2015 (continued)
34. Segment information (continued)
Operating segments (continued)
2014
General
takaful
Family
takaful TotalRO RO RO
Takaful revenue (net of retakaful / reinsurance) 10,106,529 301,183 10,407,712
Takaful expenses (net of retakaful / reinsurance) (6,062,716) (192,588) (6,255,304)
Segment results 4,043,813 108,595 4,152,408
Investment income 81,277 1,988 83,265
Mudarib share (67,608) (1,491) (69,099)
Wakala fees (3,884,378) (276,242) (4,160,620)
Surplus / (deficit) for the year 173,104 (167,150) 5,954
Segment assets 22,295,214 3,120,197 25,415,411
Assets allocated to shareholders’ 21,534,599
Total assets 46,950,010
Segment liabilities 22,295,214 3,120,197 25,415,411
Liabilities allocated to shareholders’ 21,534,599
Total liabilities 46,950,010
The activities of the Company are restricted to carrying out takaful, on the principles of Sharia’a significant portion of which is concentrated in the GCC countries which are subject to similar risks and rewards. Accordingly, no segmental information relating to products and services has been presented. Geographical segments – secondary reporting segment
The Company has one geographical segment as all their operations are carried inside the Sultanate of Oman.
35. Risk management
Governance framework
The primary objective of the Company’s risk and financial management framework is to protect the Company’s participants and shareholders from events that hinder the sustainable achievement of the set financial performance objectives. Key management recognises the critical importance of having efficient and effectiverisk management systems in place.
Regulatory framework
Regulators are primarily interested in protecting the rights of the policyholders and monitor them closely to ensure that the Company is satisfactorily managing affairs for their benefit. At the same time, the regulators are
75
Notes to the financial statementsfor the year ended 31 December 2015 (continued)
35. Risk management (continued)
Regulatory framework (continued)
also interested in ensuring that the Company maintains an appropriate solvency position to meet unforeseen liabilities arising from economic shocks or natural disasters.
The operations of the Company are also subject to regulatory requirements within the jurisdictions where it operates. Such regulations not only prescribe approval and monitoring of activities, but also impose certain restrictive provisions (e.g. capital adequacy) to minimise the risk of default and insolvency on the part of thetakaful companies to meet unforeseen liabilities as these arise.
Takaful risk
The principal risk the Company faces under takaful contracts is that the actual claims and benefit payments or the timing thereof, differ from expectations. This is influenced by the frequency of claims, severity of claims, actual benefits paid and subsequent development of long-term claims. Therefore the objective of the Companyis to ensure that sufficient reserves are available to cover these liabilities.
The Company manages the takaful risk through the careful selection and implementation of its underwriting strategy guidelines together with the adequate retakaful / reinsurance arrangements and proactive claimshandling.
The concentration of takaful risk exposure is mitigated by the implementation of the underwriting strategy of the Company, which attempts to ensure that the risks underwritten are well diversified across a large portfolio in terms of type, level of insured benefits, and amount of risk, industry and geography. Underwriting limits are inplace to enforce risk selection criteria.
The Company principally issues general takaful contracts which constitutes mainly motor, marine and aviationand fire and general risks as well as life and medical takaful contracts.
The Company, in the normal course of business, in order to minimise financial exposure arising from large claims, enters into contracts with other parties for retakaful / reinsurance purposes. Such retakaful / reinsurance arrangements provide for greater diversification of business, allow management to control exposure to potential losses arising from large risks, and provide additional capacity for growth. A significant portion of the retakaful /reinsurance is effected under treaty, facultative and excess-of-loss retakaful / reinsurance contracts.
Amounts recoverable from retakaful / reinsurance companies are estimated in a manner consistent with theoutstanding claims provision and are in accordance with the retakaful / reinsurance contracts.
To minimize its exposure to significant losses from retakaful / reinsurance company insolvencies, the Company evaluates the financial condition of its retakaful / reinsurance companies and monitors concentrations of credit risk arising from similar geographic regions, activities or economic characteristics of the retakaful / reinsurancecompanies.
The Company only deals with retakaful / reinsurance companies approved by the management, which aregenerally international companies that are rated by international rating agencies.
The Company’s placement of retakaful / reinsurance is diversified such that it is neither dependent on a single retakaful / reinsurance company nor are the operations of the Company substantially dependent upon anysingle retakaful / reinsurance contract.
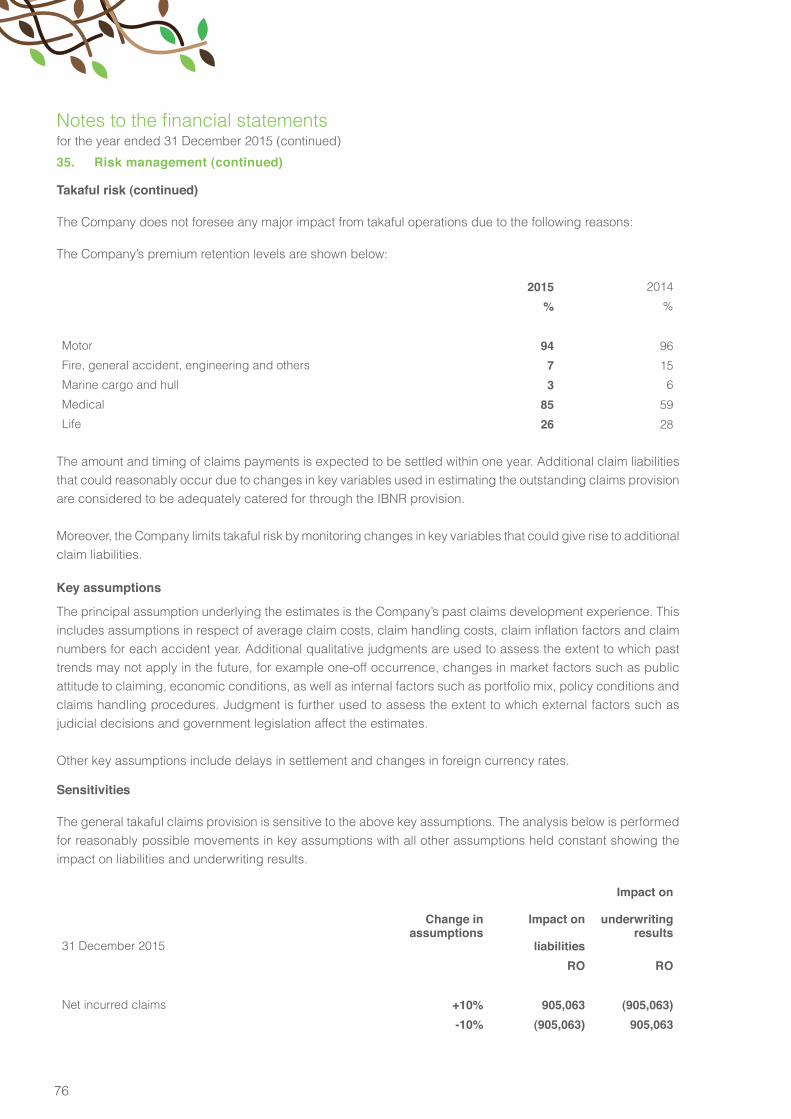
76
Notes to the financial statementsfor the year ended 31 December 2015 (continued)
35. Risk management (continued)
Takaful risk (continued)
The Company does not foresee any major impact from takaful operations due to the following reasons:
The Company’s premium retention levels are shown below:
2015 2014
% %
Motor 94 96
Fire, general accident, engineering and others 7 15
Marine cargo and hull 3 6
Medical 85 59
Life 26 28
The amount and timing of claims payments is expected to be settled within one year. Additional claim liabilities that could reasonably occur due to changes in key variables used in estimating the outstanding claims provision are considered to be adequately catered for through the IBNR provision.
Moreover, the Company limits takaful risk by monitoring changes in key variables that could give rise to additional claim liabilities.
Key assumptions
The principal assumption underlying the estimates is the Company’s past claims development experience. This includes assumptions in respect of average claim costs, claim handling costs, claim inflation factors and claim numbers for each accident year. Additional qualitative judgments are used to assess the extent to which past trends may not apply in the future, for example one-off occurrence, changes in market factors such as public attitude to claiming, economic conditions, as well as internal factors such as portfolio mix, policy conditions and claims handling procedures. Judgment is further used to assess the extent to which external factors such as judicial decisions and government legislation affect the estimates.
Other key assumptions include delays in settlement and changes in foreign currency rates.
Sensitivities
The general takaful claims provision is sensitive to the above key assumptions. The analysis below is performed for reasonably possible movements in key assumptions with all other assumptions held constant showing theimpact on liabilities and underwriting results.
31 December 2015
Change inassumptions
Impact on
liabilities
Impact on
underwritingresults
RO RO
Net incurred claims +10% 905,063 (905,063)-10% (905,063) 905,063
77
Notes to the financial statementsfor the year ended 31 December 2015 (continued)
Sensitivities (continued)
31 December 2014
Net incurred claims +10% 623,274 (623,274)
-10% (623,274) 623,274
Claims development
The Company maintains strong reserves in respect of its takaful business in order to protect against adverse future claims experience and developments. The uncertainties about the amount and timing of claim payments are normally resolved within one year.
Financial risks
The Company’s principal financial instruments are receivables arising from takaful and retakaful / reinsurance contracts, listed and unlisted investments, cash and cash equivalents and bank deposits. The main risks arising from the Company’s financial instruments are:
Credit risk
Credit risk is the risk of financial loss if a customer or counterparty to a financial instrument fails to meet its contractual obligations. The carrying amount of the financial assets, other than those relating to retakaful / reinsurance contracts and other receivables, represent the maximum credit exposure. The Company monitors receivables on a regular basis and ensures bank balances and deposits are placed with reputable financialinstitutions with minimum credit rating of P-2 as per Moody’s Investors Service.
Concentrations of credit risk indicate the relative sensitivity of the Company’s performance to developments affecting a particular industry or geographical location.
The maximum credit exposure to credit risk at the reporting date by type was shown as below:
2015 2014
RO RO
Cash and bank balances 4,281,671 2,490,089
Bank deposits 6,441,598 6,449,654
Takaful and retakaful / reinsurance balance receivable 7,919,580 8,185,805
Receivable from participants 1,071,744 806,737
Other receivables and takaful assets 1,297,023 1,107,286
Investments in investments carried at amortized cost 2,755,228 2,762,436
23,766,844 21,802,007
The Company’s bank balances and sukuk investments are maintained with a range of international and local banks in accordance with limits set by the board of directors. For banks and financial institutions, banks with better ratings are accepted.The maximum credit exposure to credit risk for bank deposits and bank balances and cash balance with
Change inassumptions
Impact on
liabilities
Impact on
underwritingresults
RO RO
78
Notes to the financial statementsfor the year ended 31 December 2015 (continued)
35. Risk management (continued)
Credit risk (continued)
investment managers at the reporting date, by classification of counterparties, is as follows:
2015 2014
RO RO
P1 3,629,164 3,811,685
P2 6,475,448 4,424,208
Unrated 618,657 703,850
10,723,269 8,939,743
Takaful receivables comprise a number of customers within Oman and local and foreign retakaful / reinsurance companies. The 5 largest retakaful / reinsurance companies account for 76% of the credit exposure at 31 December 2015 (31 December 2014 - 78%). The Company monitors these receivables on a regular basis. Most of the credit customers and retakaful / reinsurance companies have been dealing with the Company for over 2 years and losses have occurred infrequently. The Company establishes an allowance for impairment that represents its estimate of likely losses in respect of these receivable accounts in accordance with the guidelines of the credit policy along with individually assessing each receivable for impairment. This assessment is carried out annually and the adequacy of the provision for impairment is also assessed. With respect to retakaful / reinsurance companies, as per Company policy of managing takaful risk, such contracts are placed only with internationally reputed well rated retakaful / reinsurance companies.
The other classes within receivables do not contain impaired assets. The Company does not hold any collateral as security.The maximum credit exposure to credit risk for takaful and retakaful / reinsurance contract receivables at the reporting date by geographic region is as follows:
2015 2014
RO RO
Oman 6,975,964 7,225,017
Middle east 830,356 774,355
Others 113,260 186,433
7,919,580 8,185,805
The maximum credit exposure to credit risk for takaful and retakaful / reinsurance contract receivables at the reporting date by classification of counterparties is as follows:
79
Notes to the financial statementsfor the year ended 31 December 2015 (continued)
35. Risk management (continued)
Credit risk (continued)
2015 2014
RO RO
Brokers and agents 5,447,878 6,030,664
Individuals and corporate clients 1,080,574 1,122,240
Retakaful / reinsurance companies 1,391,128 1,032,901
7,919,580 8,185,805
Ageing of the takaful and retakaful / reinsurance contract receivables at the reporting date and movement of the provision of impairment of receivables during the year is disclosed in note 10 to the financial statements.
Debt type instruments carried at amortised cost is investment in Sukuk which are secured through underlying assets of the investee companies.
Liquidity risk
Liquidity risk is the risk that the Company will encounter difficulty in raising funds to meet commitments associated with its financial liabilities that are settled by delivering cash or another financial asset. Liquidity requirements are monitored on a weekly basis and management ensures that sufficient funds are available to meet any commitments as they arise.
Maturity profiles
The table below summarises the maturity profile of the financial liabilities of the Company based on remaining undiscounted contractual obligations. Repayments which are subject to notice are treated as if notice were to be given immediately.
Within one year Total2015 2014 2015 2014
RO RO RO RO
Gross outstanding claims 8,114,491 8,032,179 8,114,491 8,032,179
Accounts and other payables 1,875,847 1,960,735 1,875,847 1,960,735
Retakaful / reinsurance payables 4,482,856 4,556,179 4,482,856 4,556,179
Payable to shareholders 1,071,744 806,737 1,071,744 806,737
15,544,938 15,355,830 15,544,938 15,355,830
80
Notes to the financial statementsfor the year ended 31 December 2015 (continued)
35. Risk management (continued)
Market risk
Market risk is the risk that changes in market prices, such as foreign exchange rates and equity prices will affect the Company’s income or the value of its holdings of financial instruments. These changes could be factors specific to the individual security, or its issuer, or factors affecting all securities in the market. The objective of market risk management is to manage and control market risk exposures within acceptable parameters, whileoptimizing the return on risk.
The Company is exposed to market risk with respect to its investments. The Company limits market risk by maintaining a diversified portfolio and by continuous monitoring of the market. In addition, the Company monitorsactively the key factors that affect stock market movements.
Foreign currency risk
Currency risk is the risk that the value of a financial instrument will fluctuate due to changes in foreign exchangerates.
The Company is exposed to foreign exchange risk arising from currency exposures primarily with respect to US Dollar, AED, Qatari Rial, Saudi Rial and Pounds sterling.
The Company’s exposure to foreign currency risk was as follows:
Amounts shown in RO2015 2014
Financial assets USD
Othercurrencies
USD
Othercurrencies
Cash and bank balances 627,262 3,617,500 325,091 2,177,238
Investments carried at fair value
through profit or loss - 4,379,752 - 1,745,889
Takaful and retakaful/reinsurance
contract receivables 2,262,776 5,656,804 2,165,055 6,020,750
Investments at fair value through equity 36,372 2,349,910 14,129 2,028,318
Bank deposits 51,975 6,389,623 51,975 6,389,623
Investments carried at amortized cost 243,636 2,511,592 247,468 2,507,760
Amounts shown in RO2015 2014
Financial liabilities USD
Othercurrencies
USD
Othercurrencies
Retakaful/reinsurance payables 2,178,320 2,304,536 1,849,513 2,706,666
Accounts and other payables 694 1,875,153 1,048 1,959,687
81
Notes to the financial statementsfor the year ended 31 December 2015 (continued)
35. Risk management (continued)
Sensitivity analysis
The rate of exchange between the US Dollar and the Rial Omani has remained unchanged since 1986. Management, therefore, does not consider any significant risk arising from transactions in US Dollar.
During 2015, Rial Omani were to have strengthened or weakened by 1% against currencies other than US Dollar with all other variables held constant, pre-tax losses for the year would have been higher or lower by approximately RO 207,255 (2014 - RO 162,032).
Profit rate risk
Profit rate risk is the risk that the value or future cash flows of a financial instrument will fluctuate The Company invests in securities and has deposits that are subject to profit rate risk. Profit rate risk to the Company is the risk of changes in market profit rates reducing the overall return on its profit bearing securities. The Companylimits profit rate risk by monitoring changes in profit rates.
Change inassumptions
2015 2014
RO RO
Income from bank deposit and investments carried
at amortized cost
+0.5% 48,984 46,060
-0.5% (45,984) (46,060)
At the reporting date, the profit rates and maturity profile of the Company’s profit bearing financial instruments was as follows:
The Company’s profit rate risk based on contractual maturity at 31 December 2015 was as follows:
2015
Less than
1 year
Over
1 year TotalRO RO RO
Bank deposits 150,000 6,291,598 6,441,598 Investments carried at amortizedcost
- 2,755,228 2,755,228
2014
Bank deposits 150,000 6,299,654 6,449,654 Investments carried at amortizedcost
- 2,762,436 2,762,436
82
Notes to the financial statementsfor the year ended 31 December 2015 (continued)
35. Risk management (continued)
Financial risks (continued)
Price risk
The Company is exposed to market price risk with respect to its investments. The Company limits market risk by maintaining a diversified portfolio and by continuous monitoring of the market. In addition the Companymonitors actively the key factors that affect stock market movements.
85% (2014 - 56%) of the Company’s equity investments at the statement of financial position date are within the Sultanate of Oman.
A 10% change in fair value of the Company’s investments carried at fair value through profit or loss investments would have impact on profit / (loss) of approximately RO 437,975 (2014 - RO 543,714).
A 10% change in fair value of the Company’s investments at fair value through equity would have impact on equity of approximately RO 238,628 (2014 - RO 204,245).Fair value estimation
The table below analyses financial instruments that are measured subsequent to initial recognition at fair value, by valuation techniques. The different levels have been defined as follows:
Level 1: quoted prices (unadjusted) in active markets for identical assets or liabilities
Level 2: inputs other than quoted prices included within Level 1 that are observable for the asset or liability, either directly (i.e., as prices) or indirectly (i.e., derived from prices)
Level 3: inputs for the asset or liability that are not based on observable market data.
2015 Level 1 Level 2 Level 3 TotalRO RO RO RO
Investments carried at cost through profit or loss 4,376,352 - 3,400 4,379,752Investments at fair value through equity 1,880,399 505,884 - 2,386,283
6,256,751 505,884 3,400 6,766,0352014
Investments carried at cost through
profit or loss 5,433,739 - 3,400 5,437,139
Investments at fair value through equity 1,547,077 200,141 - 1,747,218
6,980,816 200,141 3,400 7,184,357
The fair values of other financial assets and liabilities with a maturity of less than one year approximates to their carrying amounts.
Certain investments in equity instruments, classified as Equity type instruments carried at fair value through equity investments, are carried at cost. These investments do not have a quoted market price in an active market, range of reasonable fair value measurement is significant and probabilities of various estimates cannot be reasonably assessed.
83
Notes to the financial statementsfor the year ended 31 December 2015 (continued)
36. Capital risk management
The Company manages its capital so as to maintain both adequate working capital as well as meet regulatory solvency margin requirements as prescribed by the CMA and the Commercial Companies Law of 1974, as amended.
CMA has issued the Draft Takaful Law which is under final stages of approval. As and when any new regulations and instructions are issued by CMA regarding Takaful Business management will ensure that the solvency margin complies with such regulations.
The board policy is to maintain a strong capital base so as to maintain participants and counter party confidence and to maintain future development of the business. The Company’s objectives for managing capital are:
• To safeguard the Company’s ability to continue as a going concern so that it can contribute to provide return for the participants and shareholders and benefit for the other stakeholders.
• Provide an adequate return to participants and shareholders by pricing products and services in commensuration with the level of risk.
The Company is also subject to the capital requirement imposed by the local regulatory authority. It is the company’s policy to hold capital as an aggregate of the capital requirement of the capital market authority and a specified margin to absorb charges in both capital and capital requirements.
Takaful risk is also carefully managed as described in note 35 to ensure that the Company underwrites risk commensurate to its capital base. The company has retakaful / reinsurance treaties and excess of loss covers to manage retention levels of the premium, thereby safeguarding the capital from any significant takaful risk exposure.
37. Earnings prohibited under Sharia’a
The Company have deposits and investments which are not complied with regulation of Sharia’a as at the reporting date. Management is in process to identify those assets which is not complied with Sharia’a regulation during the year.
Earnings retained during the previous year from transactions which are not permitted under Sharia’a and are recorded as part of accounts and other payables amounted to RO 7,555 (2014: RO 5,849). All non-Islamic income is credited to a charity account where the Company uses these funds for charitable purposes.
38. Comparative figures
Certain comparative figures have been reclassified in order to conform to the presentation adopted for the current year. Such reclassifications do not affect previously reported results or equity.
39. Events after reporting date
No events have occurred subsequent to 31 December 2015 and before the date of the report that would have a significant effect on these financial statements.
40. Approval of financial statements
The financial statements were approved by the Board and authorized for issue on 28 February 2016

84
Al Madina Takaful has become the proud recipient of some of the most coveted awards in the insurance industry in the Middle East. the company was named ‘General Takaful of the Year’ at the 2nd Middle East Insurance Industry Awards 2015 held on 17 November, 2015 in Dubai
MIDDLE EAST INSURANCE INDUSTARY AWARD 2015"General Takaful Company of the Year Al Madina Takaful"
Al Madina Takaful Wins Oman Insurer of the Yearat the MENAIR Insurance awards2016.
In addition, the company was also named 'Oman Insurer of the Year' at the MENAIR Insurance Award 2016 held on 27 January, 2016 in Dubai. The awards are judged by an independent panel of experts and recognize excellence of companies and people in the industry. Furthermore, Al Madina was the only insurance company from Oman to be recognized at the MENAIR Insurance Awards 2016.
Copyright © 2022 FDOKUMEN