all india cold storage capacity and technology - baseline study
426
© COPYRIGHT 2014 ALL INDIA COLD STORAGE CAPACITY AND TECHNOLOGY - BASELINE STUDY Insights from Hansa Research Group Pvt. Ltd FINAL REPORT 10-12-14 By Hansa Research Group Final report of an extensive all India Baseline Survey of Cold Storage facilities conducted in 2013. The report provides a compilation of the data analytics from information collated during the period March 2013 to September 2013 plus subsequent fieldwork done based on DMI database and databases provided by states in June 2014
-
Upload
khangminh22 -
Category
Documents
-
view
3 -
download
0
Transcript of all india cold storage capacity and technology - baseline study
© COPYRIGHT 2014
ALL INDIA COLD STORAGE CAPACITY AND TECHNOLOGY - BASELINE STUDY
Insights from Hansa Research Group Pvt. Ltd FINAL REPORT
10-12-14 By Hansa Research Group
Final report of an extensive all India Baseline Survey of Cold Storage facilities conducted in 2013. The report provides a compilation of the data analytics from information collated during the period March 2013 to September 2013 plus subsequent fieldwork done based on DMI database and databases provided by states in June 2014

© COPYRIGHT 2014 2
INDEX
INDEX
SR. NO. DESCRIPTION PAGE NO.
1 ABBREVIATIONS USED 4
2 SAFETY MEASURES FOR FIELD TEAMS 5
3 INTRODUCTION 6
4 EXECUTIVE SUMMARY 11
5 CHAPTER 5: PRIMARY DATA ON INFRASTRUCTURE 18
6 CHAPTER 6: UPKEEP OF FACILITY & CS TYPES 37
7 CHAPTER 7:GENERAL LAYOUT AND GEO TAGGED LINKS 55
8 CHAPTER 8: CATCHEMENT AREA NEAR FACILITY & PRODUCT TYPE STORED
120
9 CHAPTER 9: SERVICE MODEL OF THE FACILITY 155
10 CHAPTER 10:OWNERSHIP AND MANAGEMENT STRUCTURE 159
11 CHAPTER 11: ACCESSIBILITY TO THE INFRASTRUCTUREBY VALUE CHAIN STAKEHOLDERS
163
12 CHAPTER 12 :BACKEND INFRASTRUTURE AVAILABILITY 179
13 CHAPTER 13:TECHNOLOGY & EQUIPMENTS USED IN CS’S 185

© COPYRIGHT 2014 3
INDEX…..contd
INDEX
SR. NO. DESCRIPTION PAGE NO.
14 CHAPTER 14 :MAINTAINENCE PRACTICES 246
15 CHAPTER 15: CAPACITY UTILIZATION & PATTERNS 265
16 CHAPTER 16 :POWER SOURCE & ITS UTILIZATION 272
17 CHAPTER 17 :AUTOMATION IN MATERIAL HANDLING 295
18 CHAPTER 18:BUSINESS PROCESS & DOCUMENTATION 319
19 CHAPTER 19 :SUBSIDIES & ASSISTANCE 341
20 CHAPTER 20 :EMPLOYMENT OF MANAGERIAL, SUPERVISORY, TECHNICAL AND LABOUR STAFF
367
21 OTHERS 384

© COPYRIGHT 2014 4
1 ABBREVIATIONS USED
ABBREVIATION TERMINOLOGY
A & N Andaman & Nicobar Islands
AP Andhra Pradesh
AMC Annual Maintenance Contracts
BTU British Thermal Unit
C’garh Chhattisgarh
CS Cold Store
CA store Controlled Atmosphere Cold Store
DIC District Industries Center
DK/CS Don’t Know / Can’t Say
ERW Energy Recovery wheel
FCAOI Federation of Cold Storage Association of India
FSSA Food Safety Standards Authority of India
HRG Hansa Research Group
HACCP Hazard Analysis and Critical Control Points
HP Horse Power
IQF Individual Quick Freezing
ISO International Organization for Standardization
J & K Jammu & Kashmir
kVA Kilo Volt Ampere
kW Kilowatts
MP Madhya Pradesh
MT Metric Tons
NABARD National Bank for Agriculture & Rural Development
NCCD National Centre for Cold chain Development.
NH National Highway
NHB National Horticulture Board
NHM National Horticulture Mission
PUF Panel Poly Urethane Foam Panel
PEB Pre-Engineered Buildings
PLC Program Logic Controllers
PSU Public Sector Undertaking
RCC Reinforced Cement Concrete
TN Tamil Nadu
Type H products Horticulture / Agriculture Based Products
Type P products Processed Food Based Products
Type M products Animal Husbandry Based Products
Type Q products Pharmaceutical Based Products
Type O Products Other Type Products (X-ray films)
UP Uttar Pradesh
VFD Variable Frequency Drive
WB West Bengal

© COPYRIGHT 2014 5
2 SAFETY MEASURES FOR FIELD REPRESENTATIVES
HRG (Hansa Research Group) field representatives were provided with the below mentioned safety guidelines to be adhered to while visiting Cold Storage facilities:
Field representatives were always to follow safety instructions by the cold storage operator. If entering a cold room, the representatives were supposed to have an escort with them.
Cold stores can be subzero chambers and can create sudden thermal shock and chill to the body. If entering a cold store, do not spend too much time inside the room. Each cold store will have a supply of warm jackets as needed.
Refrigeration machines are located outside the cold rooms in open or inside a designated machine room. Stand well clear of operational machines; do not wear loose clothes like scarves that can get sucked into running fans.
CA cold stores can have very low oxygen levels - Do not enter inside a CA chamber.
Cold stores can have icy and slippery floors and usually humid. Always wear proper laced shoes for conducting this survey.
If required, wear the provided hard hat, especially in cold stores with overhead storage.
When visiting cold chambers designed for spices, wear the face mask provided at the facility to avoid inhaling strong spice aroma.
Do not enter any enclosed space without permission and then only when you are accompanied by an escort.
Follow walking zones and markings to avoid mishap with machines and working staff.
Do not touch or press any buttons or switches at the facility visited.
These facilities are primarily food zones – maintain personal hygiene when visiting cold stores. Do not conduct survey if you are suffering fever, cold or contagious disease.
If you hear any alarm, immediately evacuate to the closest exit and stand clear for the operators to function.
Return entry passes (if any) to the facility manager before leaving the location.
A ready reckoner list of cold storage equipment and component types was also provided to regional heads for reference along with related familiarization sessions.

© COPYRIGHT 2014 6
3 INTRODUCTION
One word pithily describes the current Indian fruit and vegetable industry - Paradox. On one hand, we are one of the biggest producers of Vegetables & Fruit in the world, on the other hand, there is reported a notably large wastage of the same in the country.
Cold storages are considered as an integral component for reduction in food wastage. Realizing the significance of the same there is a strong sentiment of growth in the cold storage industry predicted by the market experts. A recent report released by ASSOCHAM claims the Indian cold chain industry, which stood at Rs 10,200 crore in 2009, is expected to register a compound annual growth rate of 25.8% to reach Rs 64,000 crore by 2017. The report also states the country’s cold storage capacity is unevenly distributed and that the country has cold chain capacity available for only 9 million tonnes vegetables, leading to huge wastage.
There have been other similar studies and reports from leading research and industry organizations where the stated cold storage capacity figures are seen in contradiction to each other. This gave rise to the need to understand the current cold storage sector, in terms of the storage capacity and the technology used. It is only after in-depth assessment of the current cold storage scenario; one would be able to tread better on the lines of improvement, process streamlining and eventually growth. This introspection was initiated in form of a full-fledged quantitative CENSUS of cold storages in India.
Along with sustained growth in food production, reports also indicate a considerable increase in the construction and expansion of cold storage facility in the recent 10 years. Steps have been taken by the government to support improved designs and standards in the storage infrastructure as well as to build additional cold storage capacity through provision of fiscal and tax incentives.
With such rapid development and growth witnessed, a primary baseline survey was conceived to help assess firsthand the current status of cold storage capacity and the technology deployed. This base line survey is the first such attempt in this sector and the learning’s from this could lead to more detailed studies subsequently.
Hansa Research Group (HRG) was deputed to conduct the All India cold storage capacity and technology survey, by the National Horticulture Board (NHB). The data collection instrument was planned as a series of questions with some close ended and open ended responses from cold storage management. Field teams were provided modern tabs with software to file Geo-tagged photographs and random voice recordings. The project approach, methodology and timelines were shared with and ratified by NHB before the commissioning and launching of the survey.

© COPYRIGHT 2014 7
3.1.1 COLD STORAGE SECTOR: CURRENT SCENARIO
The cold storages are the nodal points in the overall cold-chain distribution network and they must cope with uneven demands across a variety of produce and cargo types and capacity need fulfillments. The cold-chain from farm to retail can comprise of a combination of the following components; source points or originating production units, temperature controlled first leg transportation, consolidation hubs or long term cold storages, environment controlled long haul transport, transshipment or distribution hubs, last mile temperature controlled distribution and retail end storage and merchandising infrastructure.
In case of cold storages, two primary types persist. The first is farm gate storage that is deployed close to producing regions for long term storage of farm produce. These storage types are typically designed for single commodity large volume storage where the produce is seasonal, with the intention to safely store the product for subsequent sale over an extended period over its marketable life. These stores are predominated by potato stores and those for spices and specific crops like carrots, apples, oranges, onions, etc. Controlled Atmosphere stores, due to their base intent of extending shelf life and maintaining freshness over the long term, also fall under this category. Produce stored in such a cold store is not intended for repetitive handling and these stores can also serve as initiating points for subsequent market links.
The second type of cold stores, are more transient in their nature of service. These are the in transit handling points or distribution hubs that feed the market and those that are at point of consumption (retail outlets), etc. The goods handled in these stores have shorter shelf life, those that have exited bulk storage, and those that are enroute to market or final consumption. Majority of horticultural crops have a limited shelf life even within the cold-chain and cannot be stored across seasons. Additionally, all products towards the end of their storage life need to transit to market through such cold-chain facilities. Such cold storage infrastructure has only recently been developed in India.
The typical stated challenges faced by cold storages are high operation costs that stem from a lack of skilled manpower, higher energy utilization, low technology adoption and seasonal capacity utilization. As nodal points and hubs in the perishable food distribution network, the impact of cold storages on the overall integrity in the distribution mechanism is important to counter food perishability and to ensure reduction in wastage. To achieve this objective, as a pre-requisite, cold storages need to deploy advanced technology, appropriate infrastructure designs and superior operational processes.
At the start of this baseline survey, it was estimated that India had about 6,100 cold stores in the country, the bulk of which were not networked and operated as standalone units, largely for storing potato. This total estimate was derived from secondary reports and database listing as available from government departments.

© COPYRIGHT 2014 8
3.1.2 PROJECT APPROACH
The project envisaged site visits by field teams to every cold store facility in the country, specifically those that were open to public lease as a service. The project was not intended to cover cold storages built for captive use by industrial units or processing units, unless leasing out the capacity to others. The entire base line study involved collecting data in the form of responses from facility managers or owners to a prescribed questionnaire. The location was also recorded through geo-tagging of photographs (external picture of each facility visited). Some cold storage owners also permitted pictures of the inside of their infrastructure.
The project approach stemmed from the provision of a comprehensive address database of all known cold storages across India by National Horticulture Board (NHB) and through their offices from other government records. In addition to the database provided by NHB, the HRG offices additionally initiated and referred addresses from other sources which included national and local cold store associations, Agrimarket and other web based secondary data.
The main challenge to conduct such an extensive nationwide primary study in the limited time duration (4 months of field work), was to plan the efficient deployment of field teams. The project work was structured into zones covering each state or region. As a first step, each zonal level team would require accurate location addresses and establish appointments with the cold storage management.
To facilitate the study in a timely and well-coordinated manner, an inception report after the first set of pilot interviews was conceived and presented to NHB. This allowed for initial review and recommendations on the project proposal and to further refine the data collection instrument. Post the inception report and feedback from NHB, approved revisions were made to the questionnaire and a full scale collection of data was planned for all the field teams in all the states of India. It was expected that in the course of conducting the study other cold storages which are not in the collated database, may also be identified.
In ensuring the maximum coverage of all the cold storages, the field work was executed district after district in every state, using a readied database and applying snow balling technique. The responses to the queries designed with NHB, were collected from owners or managers of the cold storages conducting face to face interviews across India. Subsequent data checks involved follow ups over phone and repeat visits where needed.
The entire study was planned for completion in a 6 month period and undertaken accordingly. The time frame included familiarization sessions, pilot runs, submission and review of inception report, final sign off from NHB, full scale field work and final report preparation. But due to a compilation of much higher address database of over 8,800 as compared to original estimation of 6,100 cold stores, the draft report was submitted in 7 months. Also inception report though presented in a month’s time, the presentation meeting got delayed by a month, and based on feedback, the study was re-launched with revised questionnaire. In all, 8833 address locations were visited across India at the writing of this report.

© COPYRIGHT 2014 9
3.1.3 METHODOLOGY
From methodology point of view, any study consists of four aspects; one is targeting and building the appropriate research query points, accessing that information/data procurement, building checks and verification on data collection, analyzing & processing procured information to the best of the knowledge/understanding.
The data procurement and checks were done by interviews with relevant people and using technology to validate the information.
An appropriate healthy mix of research approaches were utilized to create the knowledge-base:
Interview of key decision makers and experts on suitability and viability of questionnaire.
Hansa Research deployed and leveraged network of research professionals around the country for conducting field study.
Assessment of infrastructure developments based on published information from NHB, FCAOI, NABARD etc.
Regular interactions with NHB designees with online feedback mechanism of the survey status.
In the instances where appointments were not immediately available, repeat visits were made. Out of the repeat visits made, an average of 4.5 attempts was undertaken. This is more than the minimum of 3 repeat calls as per the original project proposal.
In the instances that no cold store was located at the address, a photograph of the location was recorded. In the cases where the address was not traceable, a process that included checks at the local post office, police station and municipal or other local authority was attempted before listing a database item as non-traceable.
For each touch point (database address), the responses underwent systemic checks which included random recording and geo-tagged photographs.
Wherever the cold storage unit was not providing permission for interview, NHB assistance for additional support was sought; in such cases, the facility manager required a direct communication or letter from NHB. In other cases, relevant permissions for seaports and airports were obtained from related ministries.
A web link was provided to NHB to enable daily checks of the status of the work done for enabling transparency and better coordination of efforts.
A list of the total address database was provided to NHB with the inception report for coordinating on any errors or omissions.
Despite an increase in the total expected address list, all methodology and checks were fulfilled, as detailed in the project proposal.
The, following schematic demonstrates the data procurement and validation for this study.

© COPYRIGHT 2014 10
HANSA RESEARCH GROUP DATA PROCUREMENT AND VALIDATION PROCESS
The study did not include dedicated captive cold storage units of hotels, pharmaceutical companies, processors, abattoirs where they are not open to public as for utility. The study was intended to provide an insight into the state of cold storage sector where it is available to customers for lease or rentals.
The methodology includes photographing each cold storage location accessed and these would be uploaded to an online map. Further inputting of cold store details on each map geo-coordinate could be undertaken additionally, thereby creating a comprehensive visualization of the all India cold storage capacity.
110 GPS enabled tablets were used nationwide for collecting the responses.

© COPYRIGHT 2014 11
No. of
CSs
Average
capacity Tons
Completed full interviews 5003
5003
25030009
Temporarily closed 61 305183
Refused & Existing 7 CA stores not covered 303 1515909
Total of above 3 – Operational CSs 5367 26851101
Permanently closed including address found but CS not there 1219 6098657
Total created capacity 6596 32949758
4 EXECUTIVE SUMMARY
4.1.1 Overview
The base line survey envisaged site visits by field teams of Hansa Research Group (HRG) to every cold store facility in the country, specifically those that were open to public lease as a service. The project was not intended to cover cold storages built for captive use by industrial units or processing units, unless leasing out the capacity to others. The entire base line study involved collecting data in the form of responses from facility managers or owners to a prescribed questionnaire duly approved by NHB.
In ensuring the maximum coverage of all the cold storages, the field work was executed district after district in every state, using a readied database and applying snow balling technique. In all HRG team members visited over 9,000 address locations, as against around 6,100 envisaged earlier, at the time of writing the final report.
All data collected from the owners or managers of cold stores on a face to face interview. In the instances where appointments were not immediately available, repeat visits were made. Out of the repeat visits made, on an average 4.5 attempts were undertaken. This is more than the minimum of 3 repeat calls as per the original project proposal of HRG.
In the instances that no cold store was located at the address, a photograph of the location was recorded. In the cases where the address was not traceable, a process that included checks at the local post office, police station and municipal or other local authority was attempted before listing a database item as non-traceable.
No. of cold stores and their capacities
Thus the total created capacity visible today is 32.94 million tones. If we exclude permanently
closed and address found, but CS not found, the existing capacity is 26.85 million tones
In addition to the above, 837 addresses could not be traced from database, as the addresses
were not complete. If these are to be included in created capacity, this will be additional 4.1
million tones capacity. There are also 254 cases where the address was found, but there was no
cold storage in the address, this is already included in the permanently closed row.
In many cases we have photographs of structures of permanently closed units which have been
uploaded in geo-tagged links along with existing units

© COPYRIGHT 2014 12
SUMMARY AND RECOMMENDATIONS
Infrastructure of CSs
Farm Gate CSs form 68% of the cold stores. But horticulture CSs account for 75% of CSs, as there are CSs even in urban and distribution centres
Mean capacity is at 5003 tons. East zone has the highest mean capacity of 8543 tons mainly contributed by WB with 11113 tons
As the bulk of the CSs stock raw potatoes, the chamber temperature is between 0 to 100 Celsius. Frozen chambers are found more in animal husbandry CSs
While horticultural CSs stock mainly single commodities, processed food CSs and Pharma CSs, stock other products including horticultural products
74% of the CSs are having brick and mortar structures with West zone and animal husbandry CSs having comparatively more PEB structures
Upkeep of facilities
External condition of buildings, external hygiene conditions, internal road areas, internal vehicular movement are all rated good on observation. The percentages reported good are at around 70%. That means there is nearly a third which needs improvement in the above elements. These CSs are to be identified and educated on upkeep of facilities
The percentage of CSs having covered drainage is at 41%. This needs to be improved, so that hygiene of the facilities can be improved to maintain food safety standards
General layout of the facilities
The mean boundary area is 4567 Sqmts while the mean covered area is 3568 Sqmts.
Nearly a third of CSs have only ground floor while 36% have four floors in their buildings.
Mezzanine type of stacking is more prevalent in CSs and generally gunny nags are the smallest storage unit in the CS.
27% of the CSs had recent upgrades and the main reason for upgrade is to expand capacity
In terms of insulation thermocol/EPS are used as add on panels to prevent outside heat affecting the CSs. Only in animal husbandry CSs 50% have PUF panels.
58% of CSs have single gates while 36% have 2 gates. The rest have more than 2 gates
67% of CSs had uncovered parking space while the other 33% had covered parking space. On an average 22 vehicles can be parked in the CSs
Transport services were not provided by 79% of the CSs. Even those facilitated the service, mostly they used hired out services.
Only 4% provided reefer truck facilities and that too only half of them had their own reefer trucks

© COPYRIGHT 2014 13
SUMMARY AND RECOMMENDATIONS
Catchment area facilities and products stored Analysis of capacity utilisation of products stocked shows that the CSs generally have
enough clientele to stock the products.
Overall average capacity utilisation is 75% which shows that the CS’s catchment area is sustainable. While the average is at a good level, the CSs having lower capacity utilisation are to be identified from database and their problems need to be identified and solved so that they do not end up a defunct CS in the future
Product wise capacity utilization (given in subsequent pages) shows that Type H, Type P and Type M have over 70% utilization, while Type Q has 67% utilization
Raw potatoes is stocked by majority of horticultural CSs. Other products stocked are apples, bananas, spices, pulses, grapes, different vegetables and seeds.
Among animal husbandry CSs, sea food is stocked by bulk of CSs
In processed food CSs, main items stocked are butter and milk
In CSs stocking pharma products, vaccines are stocked by majority of CSs
Service model of CSs 75% of CSs operate on pure lease rental model. Only among animal husbandry CSs, there
are CSs operating on captive use model
As bulk of CSs operate on pure lease rental model, there is necessity for marketing support to enhance capacity utilisation, especially of those CSs whose capacity utilisation is lower
Ownership and management structure 92% of CSs are owned and operated by private sector – proprietorship, partnership, private
limited company or public limited company.
There are only 3% Cooperative and another 2% govt/PSU CSs in the list
Accessibility to infrastructure by value chain stakeholders The average distance to a highway – either national or state highway – is 4 kms for all CSs.
As transport services are not provided by 79% of CSs, logistics companies lift the stock and transport them to trading centres. The proximity to highways is facilitating this service adequately
The average distance from railways is over 10 kms. Distance to airports and seaports were higher at 45 kms and 35 kms respectively, though these are relevant for export trade.
Backend infrastructure availability Over 50% have ante rooms and over 40% have sorting and grading facilities, and pack
houses.
Analysis of CSs built post 2009 shows that there is improvement in existence of these back end infrastructure.
Importance of back end infrastructure needs to be educated to CS owners so that they can create the infrastructure. If required concessional rate of interest can be provided for the loans to facilitate the infrastructure in CSs

© COPYRIGHT 2014 14
SUMMARY AND RECOMMENDATIONS
Technology and equipments used in CSs Though bunker coil system is to be terminated, a third of CSs are still using bunker coil
system. In fact over 40% have refrained from answering the question as they are not sure of what system they are using.
Analysis by age wise CSs reveal that post 2009 the percentage using bunker coil system has dropped. Only in North zone, usage of bunker coil system has significantly dropped post 2009.Like wise, there is a significant drop in usage of bunker coil in horticultural and pharma CSs
Multiple systems are used in every CS to detect and fight fire in CSs. Gas based extinguishers are prevalent in majority – over 70% - of the CSs. Though technology has improved, CSs also depend on manual rounds to detect fire
UP accounts for 27% of CSs and accounts for 37% of capacity. West Bengal, though accounts for fourth in terms of no. of cold stores (9%), ranks second in capacity with 21% share in all India capacity
Average no. of chambers are 2.8 per Cs, average no of chambers are 3.6, average no. of evaporators are 4.2 and average no. of DG sets are 1.6 per CS.
Maintenance practices 32% have AMCs for their plant or gen sets. Of this 91% have AMC for plant and equipments
while 65% have AMC for gensets
Spare parts are maintained by over 70% for both refrigeration equipment and power unit
53% have periodic maintenance. 65% of CS reported 0 breakdown days. Only pharma CSs reported more than 2 breakdown days on an average in a year
Capacity utilisation and patterns In the last three years, there has been consistent average 74-75% capacity utilization of the
CSs
Overall Capacity utilization is 75%. Even in East where the average capacity is the highest, the capacity utilization is also robust at 77%

© COPYRIGHT 2014 15
SUMMARY AND RECOMMENDATIONS
Analysis by capacity and capacity utilization also showed that even CSs with higher capacity
had over 75% capacity utilization
Though capacity utilization is robust, need to identify CSs having lower capacity utilization and arrive at problems for lower utilization and solve them so that their business prospers.
Power source and utilization On an average most CS’s get a sanctioned load OF 168 kVA.
Gujarat, Kerala, and West Bengal are states which have been sanctioned more than 200 kVA of load which is higher than the national average of 168 kVA.
Some Bigger states like Karnataka and Rajasthan have extremely low sanctioned loads which may be an area of concern for the CS’s located there.
Average energy cost per cold store has increased over the past three years from Rs 15 lakhs to 18 lakhs
The availability of grid power has also increased from 16 hours to 17 hours per day. Diesel consumption on the other hand has reduced from 18000 liters to 16000 liters
Automation in material handling While 24% are using conveyer belt for loading and unloading there is another 22% using
had pellet lifters and 18% use manual labour to load and unload products
Automatic ventilation system is available only in 21% of CSs
Only 18% of CSs have automatic system to detect gas leakage
CO2 sensors are available only in 26% of CSs
Only 23% have automation in drives
Automation in ventilation drives, CO2 sensors etc will improve efficiency of the CSs in maintaining the right temperature resulting in better product storage. Hence NHB should educate the CS owners on these automation facilities available
Product type Capacity Utilization %
Horticulture 75%
Processed food 71%
Animal Husbandry 74%
Pharma products 70%
Others 65%

© COPYRIGHT 2014 16
SUMMARY AND RECOMMENDATIONS
Business process documentation Only 17% of CSs have business process documentation/certificate.
FSSA, HACCP and ISO are the certificates held by around 40% of those having any certification
Though HACCP and ISO certification is voluntary, FSSA is compulsory and even this certificate is not held by majority of CSs.
There is intention to have FSSA certification as it has become mandatory
NHB needs to check that FSSA certification is in place with all CSs so that upkeep of facility and hygiene of the facility will improve resulting in improved food safety for the end consumers
Subsidies availed and usage of subsidies Only 42% of CSs have availed of subsidies for their CSs
The main purpose of using the subsidy related to capacity expansion followed by training staff and modernisation of facilities
CSs are interested in availing subsidies from NHB in future as well.
Employment On an average 20 people are employed in a CS. This accounts for over 1 lakh people
employed in CSs. And on an average there are 2.5 reefer technicians in a CS.
In the last one year 33% of CSs have made their employees attend training programmes. Most of the training programmes attended were organised internally or by private companies
CSs are interested in sending their employees for training if organised by NHB
Subsidies have been used for sending people for management training as well. Thus NHB can train people and also educate at the same time about the usefulness of having backend infrastructure, adopting more modern techniques in ventilation, drives, CO2 sensors etc.
© COPYRIGHT 2014 17
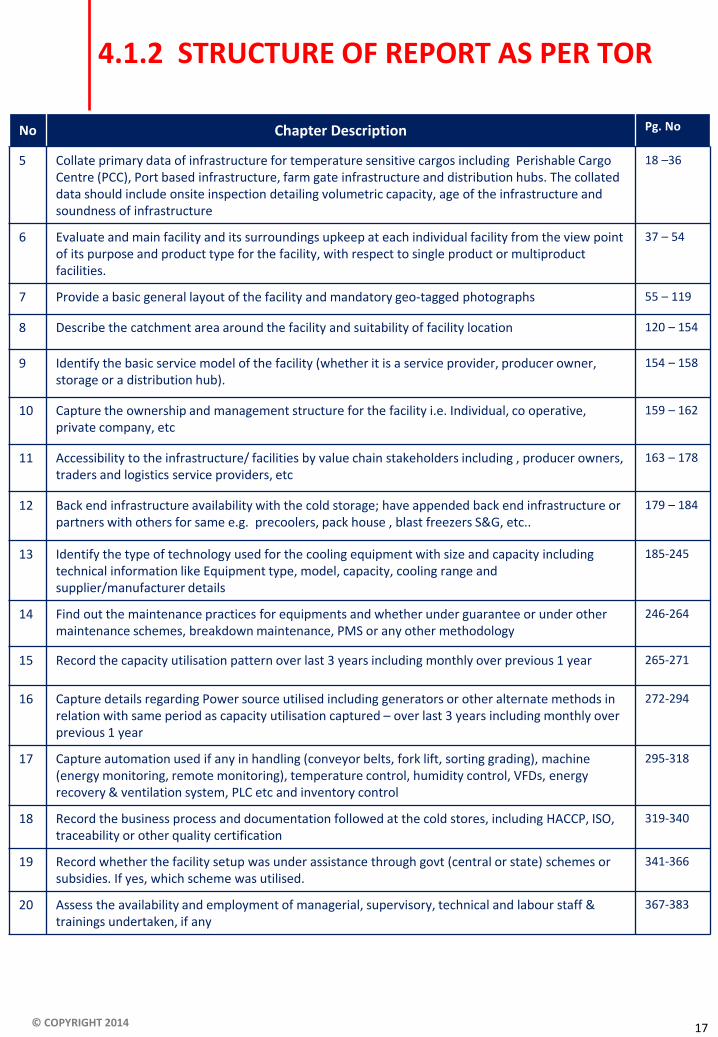
4.1.2 STRUCTURE OF REPORT AS PER TOR
No Chapter Description Pg. No
5 Collate primary data of infrastructure for temperature sensitive cargos including Perishable Cargo Centre (PCC), Port based infrastructure, farm gate infrastructure and distribution hubs. The collated data should include onsite inspection detailing volumetric capacity, age of the infrastructure and soundness of infrastructure
18 –36
6 Evaluate and main facility and its surroundings upkeep at each individual facility from the view point of its purpose and product type for the facility, with respect to single product or multiproduct facilities.
37 – 54
7 Provide a basic general layout of the facility and mandatory geo-tagged photographs 55 – 119
8 Describe the catchment area around the facility and suitability of facility location 120 – 154
9 Identify the basic service model of the facility (whether it is a service provider, producer owner, storage or a distribution hub).
154 – 158
10 Capture the ownership and management structure for the facility i.e. Individual, co operative, private company, etc
159 – 162
11 Accessibility to the infrastructure/ facilities by value chain stakeholders including , producer owners, traders and logistics service providers, etc
163 – 178
12 Back end infrastructure availability with the cold storage; have appended back end infrastructure or partners with others for same e.g. precoolers, pack house , blast freezers S&G, etc..
179 – 184
13 Identify the type of technology used for the cooling equipment with size and capacity including technical information like Equipment type, model, capacity, cooling range and supplier/manufacturer details
185-245
14 Find out the maintenance practices for equipments and whether under guarantee or under other maintenance schemes, breakdown maintenance, PMS or any other methodology
246-264
15 Record the capacity utilisation pattern over last 3 years including monthly over previous 1 year 265-271
16 Capture details regarding Power source utilised including generators or other alternate methods in relation with same period as capacity utilisation captured – over last 3 years including monthly over previous 1 year
272-294
17 Capture automation used if any in handling (conveyor belts, fork lift, sorting grading), machine (energy monitoring, remote monitoring), temperature control, humidity control, VFDs, energy recovery & ventilation system, PLC etc and inventory control
295-318
18 Record the business process and documentation followed at the cold stores, including HACCP, ISO, traceability or other quality certification
319-340
19 Record whether the facility setup was under assistance through govt (central or state) schemes or subsidies. If yes, which scheme was utilised.
341-366
20 Assess the availability and employment of managerial, supervisory, technical and labour staff & trainings undertaken, if any
367-383

© COPYRIGHT 2014
CHAPTER 5
PRIMARY DATA ON INFRASTRUCTURE
Page no 18 to 36
A Note on Structure of Report. In every chapter from now on, a
summary is provided first and then each item is discussed in detail by
type of products stored, zone wise and state wise. Summary pages have
the “red square bullet” as used here, while the details have a “dot bullet”
Also a few issues are repeated in different chapters as they are relevant
under different chapters as well.

© COPYRIGHT 2014 19
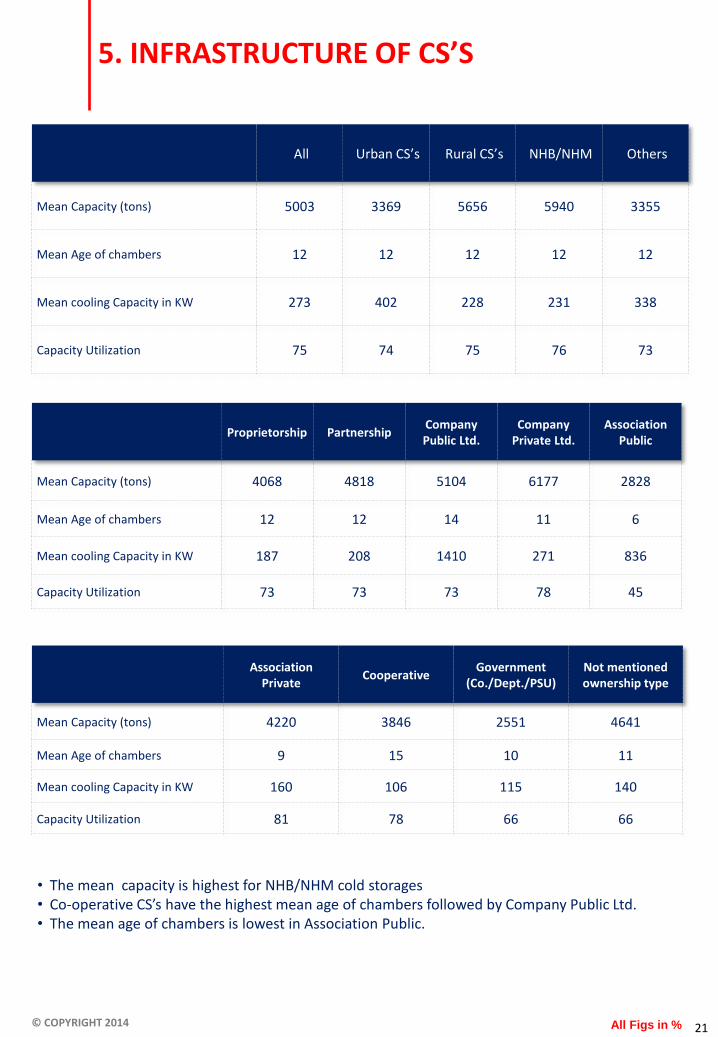
5. INFRASTRUCTURE OF CS’s
The report is made on the basis of 5,003 CSs contacted and who agreed to be interviewed and shared data. The distribution of CSs by temperature sensitive cargo including PCC, port based infrastructure, farm gate infrastructure and distribution hubs, their capacity and age of CSs are given below in the table
Thus overall mean capacity of 5003 CSs is 5,003 MT. The average age is 11.84 years. Farm gate horticulture infrastructure formed the maximum with 68% CSs. Also the capacity of farm gate horticulture CSs is much higher compared to other CSs, barring pharma CSs
The average storing capacity is highest among pharma based storages, which are stand alone infrastructure as well.
It should be noted that overall horticultural CSs have higher mean capacity. What is shown here only related to horticultural CSs located at farm gate
Type of cold stores
%
distributi
on*
Mean
capacity
(tons)
Mean
capacity in
Vol. Cubic
meters)
Mean age
of CSs –
(years)
Mean
Cooling
Capacity(in
KW)
Capacity
Utilization
Farm gate CSs (horticulture)
68% 5,531 18,805 11.64 250 75
Pharma CSs 1% 6,108 20,767 15.91 429 69
Animal husbandry 7% 1,681 5,715 12.57 232 74
Processed food 8% 4,043 13,746 12.64 209 71
Dedicated to Mandi 8% 5,004 17,014 12.29 476 69
PCC - Port based infrastructure – include sea, air and railway
2% 2,405 8,177 10.46 1,606 60
Dedicated to pack houses – distribution hubs
0.50% 2,861 9,727 11.12 124 65
Part of network of cold stores – for distribution
1% 4,870 16,558 7.27 85 79
Dedicated to industrial facilities or own use
5% 4,624 15,722 10.52 227 68
Total
5003 CSs % adds to over 100%
as a few stock more than 1 type of product
5,003 17,010 11.79 273 75

© COPYRIGHT 2014 20
5. INFRASTRUCTURE OF CS’S
All Type H Type P Type M Type Q Any Other Products
Mean Capacity (tons) 5003 5492 3809 1818 5017 6903
Mean Age of chambers 12 12 12 12 14 15
Mean cooling Capacity in KW 273 283 316 362 1175 236
Capacity Utilization 75 75 71 74 70 65
All Figs in %
All North East West South
Mean Capacity (tons) 5003 5391 8543 3108 2850
Mean Age of chambers 12 13 14 11 8
Mean cooling Capacity in KW 273 246 256 501 116
Capacity Utilization 75 75 78 71 76
• The mean capacity is highest for type H (Horticulture) products followed by Type Q (Pharma). • Type Q has very high cooling capacity compared to other types. • With respect to zones, the Eastern zone has highest average storage capacity. • The mean age of chambers is lowest in South.
© COPYRIGHT 2014 21
5. INFRASTRUCTURE OF CS’S
All Urban CS’s Rural CS’s NHB/NHM Others
Mean Capacity (tons) 5003 3369 5656 5940 3355
Mean Age of chambers 12 12 12 12 12
Mean cooling Capacity in KW 273 402 228 231 338
Capacity Utilization 75 74 75 76 73
All Figs in %
Proprietorship Partnership Company Public Ltd.
Company Private Ltd.
Association Public
Mean Capacity (tons) 4068 4818 5104 6177 2828
Mean Age of chambers 12 12 14 11 6
Mean cooling Capacity in KW 187 208 1410 271 836
Capacity Utilization 73 73 73 78 45
Association Private
Cooperative Government
(Co./Dept./PSU) Not mentioned ownership type
Mean Capacity (tons) 4220 3846 2551 4641
Mean Age of chambers 9 15 10 11
Mean cooling Capacity in KW 160 106 115 140
Capacity Utilization 81 78 66 66
• The mean capacity is highest for NHB/NHM cold storages • Co-operative CS’s have the highest mean age of chambers followed by Company Public Ltd. • The mean age of chambers is lowest in Association Public.

© COPYRIGHT 2014 22
Temperature zones of CS by location type are given below
Type of cold stores Mild Chill
>10C
Chill betn.
0 & 10C
Frozen
below 0C
Farm gate CSs (horticulture) 3 81 3
Pharma CSs - 62 17
Animal husbandry 1 21 54
Processed food 5 51 17
Dedicated to Mandi 4 75 7
PCC Port based infrastructure – include sea,
air and railway 1 49 24
Dedicated to pack houses – distribution hubs 1 64 13
Part of network of cold stores – for
distribution 8 51 27
Dedicated to industrial facilities or own use 5 70 12
5. INFRASTRUCTURE OF CS’S

© COPYRIGHT 2014 23
5. INFRASTRUCTURE OF CS’S - CAPACITY
All Figs in %
All Type H Type P Type M Type Q Other Products
On/After 2009
(n=1183)
Before 2009
(n=3691)
On/After 2009
(n=1034)
Before 2009
(n=3187)
On/After 2009
(n=112)
Before 2009
(n=400)
On/After 2009
(n=106)
Before 2009
(n=335)
On/After 2009 (n=7)
Before 2009
(n=35)
On/After 2009 (n=6)
Before 2009
(n=20)
0-10 7 5 7 5 10 8 5 8 14 3 - 5
10-50 6 3 6 2 7 7 8 6 14 6 17 5
50-100 3 3 2 2 6 5 9 9 - 3 - 10
100-500 4 6 3 4 5 8 17 27 - - 17 20
500.1-1000 4 5 3 4 4 6 13 14 - 17 - 5
1000.1-2000 3 8 3 8 4 7 3 9 - 11 17 10
2000.1-3000 3 8 3 8 4 7 6 3 - 3 - -
3000.1-5000 12 15 13 16 9 15 8 3 29 14 17 5
Above 5000 26 33 29 37 16 21 7 6 - 29 17 25
No Response 31 14 31 13 35 17 25 16 43 14 17 15
MEAN 4140 5217 4509 5736 3464 3919 2078 1755 2264 5384 2937 8357
Median value 3968 3995 4954 4499 1250 2406 463 367 50 3000 818 450
All (n=5003)
Type H (n=4333)
Type P (n=523)
Type M (n=452)
Type Q (n=44)
Other Products
(n=27)
6
4
3
6
5
7
7
14
31
18
4
7
7
19
4
15
0
7
22
15
5
3
2
3
4
7
7
16
35
18
8
7
5
7
5
6
7
13
20
21
7
6
9
24
14
7
4
4
6
19
5
7
2
0
14
9
2
16
23
23
0-10
10-50
50-100
100-500
500.1-1000
1000.1-2000
2000.1-3000
3000.1-5000
Above 5000
No Response
• Close to one fourth of the Type M (animal husbandry) storages have storage capacity between 100-500MT.
• A little more than one third of Type H storages have storage capacity above 5,000MT. • Overall, the CSs that came up post 2009, have lower capacity compared to CSs installed before
2009

© COPYRIGHT 2014 24
25
14
4
9
5
6
2
6
5
25
16
17
8
11
7
10
7
7
10
10
5.INFRASTRUCTURE OF CS’S – STORAGE CAPACICY VS. COOLING CAPACITY
All Figs in %
5
3
3
6
5
8
7
14
32
18
All (n=13752)
0-10
10-50
50-100
100-500
500.1-1000
1000.1-2000
2000.1-3000
3000.1-5000
Above 5000
No Response
0.1-10.0 (n=453)
8
4
3
9
7
12
13
18
24
3
50.1-100.0 (n=1193)
1
2
2
6
5
9
9
22
39
5
100.1-200.0 (n=1403)
1
3
2
2
8
9
5
17
52
2
200.1-300.0 (n=665)
0
2
0
5
7
4
5
14
62
2
300.1-400.0 (n=469)
1
1
1
2
7
4
9
9
63
3
400.1-500.0 (n=277)
6
3
1
0
3
11
5
9
61
1
Above 500 (n=540)
10.1-50.0 (n=882)
Storage capacity
in MT
• Here the analysis done by storage capacity and cooling capacity of all cold stores • Over 60% of the CS with cooling capacity more than 300KW, has storage capacity of more than
5,000MT. • One fourth of the CS with cooling capacity between 0.1-10KW, has storage capacity between 0-
10MT.
Cooling Capacity
in KW

© COPYRIGHT 2014 25
5. INFRASTRUCTURE OF CS’s
We interviewed a total of 5003 cold storages. 69% cold storages are Farm Gates. Compared to them, animal husbandry, pharma, processed food type stocking cold storages are lower in number.
A minute 1% of cold stores contacted store Pharmaceutical products but these cold storages report to have the highest mean storage capacity. They are also the older type of cold storages with an average age of 16 years. Cold storages that dwell in the Eastern zones have high average storage capacity of 8,543 MT and are relatively the oldest ones. When talking about the cooling capacity, port based infrastructures top the list. At the distant second position we have Type Q cold storages with higher cooling capacity.
Cold storages storing horticulture and animal husbandry related products predominantly store single commodities. Type P(processed) and Type Q (Pharma) cold storages are more likely to stock multiple products.
More than half of Type M cold storages have frozen chambers.
The cold storage facilities were also categorized based on the type of structure. Primarily the following types were indicated: Pre-Engineered Building (PEB) and Brick and Mortar type structure.
It was observed that 74% of the cold stores structures were of the Brick and Mortar type, while 17% of the CS’s that have adopted Modern Pre-Engineered Building structures. On an all India basis, about 8% of the facilities had both kinds of structures. A minimal 1% did not fall under either category (tin, asbestos and indigenous type).
Incidence of PEB structures is comparatively higher in the Western zone and among the cold storages stocking Type M (animal husbandry) products.

© COPYRIGHT 2014 26
83
14 1
56
40
3
71 25 1 3
67 27
1
5
64 33
1
2
72 25
1 2 30
48
15
7 27
66
2 5
Single Commodity Multi-commodity MA Store CA Store No Response
5.1 COLD STORAGE TYPES
All Figs in % All Respondents
• Close to 3/4ths of the CS’s stock single commodities. • More than half of the cold stores for processed foods (type P) store multiple commodities. • Like wise close to 67% of cold stores for Pharmaceutical products (Type Q) store multiple
commodities
Zone wise
All (n=5003)
North (n=2142)
East (n=803)
West (n=1013)
South (n=1045)
• Cold storages in North predominantly store single commodities. • Around 1 out of 3 CS’s in West and East stock multiple commodities. • Proportion of multi commodity stores in the South is even higher over 40%.
71 25 1 3
42
54
1
1
3 62
31
1
6
All (n= 5003)
Type H (n= 4333)
Type P (n= 523)
Type M (n= 452)
Type Q (n= 44)
Other Products (n= 27)
Single Commodity Multi-commodity MA Store CA Store No Response

© COPYRIGHT 2014 27
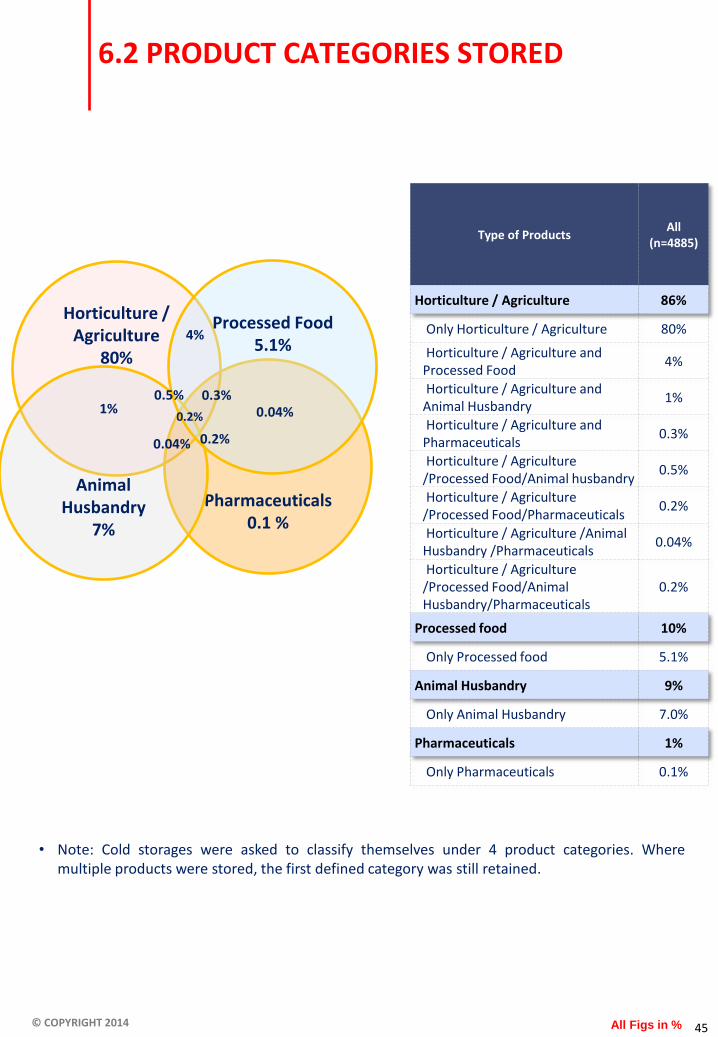
6.2 PRODUCT CATEGORIES STORED
All Figs in %
• Note: Cold storages were asked to classify themselves under 4 product categories. Where multiple products were stored, the first defined category was still retained.
• The Venn diagram shows the overlap of product categories stored by CSs
Horticulture / Agriculture
80%
Pharmaceuticals 0.1 %
Animal Husbandry
7%
Processed Food 5.1%
4%
1% 0.3% 0.5%
0.04%
Type of Products All
(n=4885)
Horticulture / Agriculture 86%
Only Horticulture / Agriculture 80%
Horticulture / Agriculture and Processed Food
4%
Horticulture / Agriculture and Animal Husbandry
1%
Horticulture / Agriculture and Pharmaceuticals
0.3%
Horticulture / Agriculture /Processed Food/Animal husbandry
0.5%
Horticulture / Agriculture /Processed Food/Pharmaceuticals
0.2%
Horticulture / Agriculture /Animal Husbandry /Pharmaceuticals
0.04%
Horticulture / Agriculture /Processed Food/Animal Husbandry/Pharmaceuticals
0.2%
Processed food 10%
Only Processed food 5.1%
Animal Husbandry 9%
Only Animal Husbandry 7.0%
Pharmaceuticals 1%
Only Pharmaceuticals 0.1%
0.04%
0.2%
0.2%

© COPYRIGHT 2014 28
5.3 YEAR OF CONSTRUCTION
All Figs in % All Respondents
Less than 1 yr (2012 to 2013)
2 to 5yrs (2009 to 2011)
6 to 10yrs (2004 to 2008)
11 to 15yrs (1999 to 2003)
16 to 20yrs (1994 to 1998)
21 to 25yrs (1993 to 1989)
26 to 30yrs (1984 to 1988)
More than 30 yrs
DK/CS
8
15
18
16
14
7
4
16
3
All (n=5003)
Type H (n=4333)
Type P (n=523)
Type M (n=452)
Type Q (n=44)
Other Products
(n=27)
11
11
4
11
11
15
7
26
4
8
16
18
16
13
6
4
16
3
7
15
14
18
13
7
5
19
2
7
16
20
13
15
8
5
14
2
7
9
7
18
11
11
2
30
5
• Type Q storages seem to be the oldest ones, with 30% of them being more than 30 years old and with an average age of 19.7 years.
• Type H, P & M are typically 14-16 years old.
All (n=5003)
North (n=2142)
East (n=803)
West (n=1013)
South (n=1045)
Zone wise
8
15
18
16
14
7
4
16
3
15
24
21
16
12
4
2
5
1
5
13
16
16
14
7
4
20
5
8
10
18
14
8
5
10
28
1
8
16
16
17
18
10
2
11
2
• The CS’s in the Southern zone are the youngest with a mean age of 10.0 years. • Eastern Zone CS’s are comparatively the older ones with a large chunk of 28% storages being
more than 30 years old.
Year of Construction
Less than 1 yr (2012 to 2013)
2 to 5yrs (2009 to 2011)
6 to 10yrs (2004 to 2008)
11 to 15yrs (1999 to 2003)
16 to 20yrs (1994 to 1998)
21 to 25yrs (1993 to 1989)
26 to 30yrs (1984 to 1988)
More than 30 yrs
DK/CS

© COPYRIGHT 2014 29
5.3 YEAR OF CONSTRUCTION
All Figs in %
• A vast majority of 70% CS’s in Delhi are over 30 years old. • Apart from Sikkim (low base) AP and Karnataka have CS’s which are youngest in terms of recent
year of construction.
All Respondents
States
All (n=5003)
Maharashtra (n=451)
UP (n=1371)
A & N (n=10)
AP (n=600)
Assam (n=22)
Bihar (n=169)
Chandigarh (n=3)
Less than 1 yr (2012 to 2013)
8 7 4 - 17 9 7 -
2 to 5yrs (2009 to 2011) 15 14 13 10 28 18 15 33
6 to 10yrs (2004 to 2008) 18 19 21 40 20 41 21 -
11 to 15yrs (1999 to 2003) 16 18 16 - 17 23 15 -
16 to 20yrs (1994 to 1998) 14 16 11 - 11 5 2 33
21 to 25yrs (1993 to 1989) 7 12 7 20 3 - 2 -
26 to 30yrs (1984 to 1988) 4 2 5 10 0 - 4 -
More than 30 yrs 16 10 18 20 2 5 33 33
DK/CS 3 2 4 - 1 - 1 -
M E A N (in yrs) 14.7 14.1 15.8 17.4 8.4 9.2 16.9 17.8
All (n=5003)
C’garh (n=76)
Delhi (n=35)
Goa (n=7)
Gujarat (n=399)
Haryana (n=185)
HP (n=14)
J & K (n=16)
Less than 1 yr (2012 to 2013)
8 17 - - 10 12 14 -
2 to 5yrs (2009 to 2011) 15 17 9 14 21 8 7 13
6 to 10yrs (2004 to 2008) 18 11 - 29 17 6 21 6
11 to 15yrs (1999 to 2003) 16 22 3 14 14 14 14 13
16 to 20yrs (1994 to 1998) 14 1 9 14 19 19 14 -
21 to 25yrs (1993 to 1989) 7 4 - 14 9 9 - 19
26 to 30yrs (1984 to 1988) 4 16 11 - 2 2 7 6
More than 30 yrs 16 12 69 14 7 23 21 44
DK/CS 3 - - - 2 8 - -
M E A N (in yrs) 14.7 13.8 27.4 15.1 12.4 17.3 15.3 22.6

© COPYRIGHT 2014 30
5.3 YEAR OF CONSTRUCTION (CONT’D)
All Figs in %
• In West Bengal, 32% CS’s are more than 30 years old.
All Respondents
States
All (n=5003)
Jharkhand (n=19)
Karnataka(n=188)
Kerala (n=143)
MP (n=156)
Nagaland (n=1)
Orissa (n=38)
Pondicherry (n=2)
Punjab (n=402)
Less than 1 yr (2012 to 2013)
8 5 18 11 9 - 11 - 5
2 to 5yrs (2009 to 2011) 15 - 26 12 9 - 11 - 16
6 to 10yrs (2004 to 2008) 18 26 23 20 9 100 11 - 8
11 to 15yrs (1999 to 2003) 16 21 12 10 20 - 18 - 11
16 to 20yrs (1994 to 1998) 14 5 13 14 21 - 18 50 25
21 to 25yrs (1993 to 1989) 7 - 4 7 4 - 3 - 8
26 to 30yrs (1984 to 1988) 4 11 - 6 4 - 8 - 1
More than 30 yrs 16 26 4 18 23 - 16 50 20
DK/CS 3 5 1 1 1 - 5 - 5
M E A N (in yrs) 14.7 18.1 9.0 15.3 17.1 8.0 15.7 25.0 16.7
All (n=5003)
Rajasthan (n=104)
Sikkim (n=5)
TN (n=102)
Tripura (n=9)
Uttaranchal (n=12)
WB (n=464)
North East (n=37)
Less than 1 yr (2012 to 2013)
8 4 - 4 11 8 7 8
2 to 5yrs (2009 to 2011) 15 19 60 17 - 8 6 19
6 to 10yrs (2004 to 2008) 18 9 20 23 33 8 16 38
11 to 15yrs (1999 to 2003) 16 28 - 24 44 25 11 24
16 to 20yrs (1994 to 1998) 14 18 - 20 - 8 10 3
21 to 25yrs (1993 to 1989) 7 5 - 4 - 8 6 -
26 to 30yrs (1984 to 1988) 4 2 20 5 - 8 11 3
More than 30 yrs 16 15 - 5 11 17 32 5
DK/CS 3 - - - - 8 1 -
M E A N (in yrs) 14.7 14.9 9.3 12.8 12.1 16.7 19.7 9.9

© COPYRIGHT 2014 31
10 31
18 41
2
91
2 5 1
88
4 7 3
63 14
20
Mild Chill >10C Frozen below 0C Chill betn. 0 & 10C DK/CS
5.4 TEMPERATURE ZONES IN CHAMBERS
All Figs in % CS’s that mentioned Any Chamber
4
72 8
16
• In type M CSs, frozen chambers are more prevalent.
Zone wise
30
41 13
17 4
80
3 13
4
53
17
27 2 21
52
25
1
68 13
18
Mild Chill >10C Frozen below 0C Chill betn. 0 & 10C DK/CS
• Zone wise analysis shows that in North , chillness between 0-10 c is in over 90% of the CSs.
All (n=13855)
Type H (n=12157)
Type P (n=1702)
Type M (n=1172)
Type Q (n=193)
Other Products (n=101)
North (n=5646)
East (n=2230)
West (n=3444)
South (n=2535)
4
72 8
16
All (n=13855)

© COPYRIGHT 2014 32
All (n=13855)
Rajasthan (n=287)
Sikkim (n=12)
TN (n=351)
Tripura (n=30)
Uttaranchal (n=33)
WB (n=1280)
North East (n=116)
Mild Chill >10 0 C 4 2 8 7 - 6 1 3
Chill betn. 0 0 & 10 0C 72 59 75 44 100 88 94 91
Frozen below -18 0C 8 5 - 26 - - 3 1
DK / CS 16 34 17 23 - 6 3 6
5.4 TEMPERATURE ZONES IN CHAMBERS
All Figs in %
• In all states, chillness is reported between 0- 10 degree Celsius predominantly. • Frozen temperatures were reported higher in Kerala, Andaman and Nicobar.
States
All (n=13855)
Maharashtra (n=1783)
UP (n=3542)
A & N (n=17)
AP (n=1477)
Assam (n=72)
Bihar (n=454)
Chandigarh (n=9)
Mild Chill >10 0 C 4 3 1 24 12 - 2 -
Chill betn. 0 0 & 10 0C 72 58 97 12 29 89 88 67
Frozen below -18 0C 8 15 0 41 9 4 - 33
DK / CS 16 25 1 24 50 7 10 -
All (n=13855)
C’garh (n=213)
Delhi (n=131)
Goa (n=14)
Gujarat (n=1237)
Haryana (n=493)
HP (n=26)
J & K (n=43)
Mild Chill >10 0 C 4 5 18 - 2 9 - 2
Chill betn. 0 0 & 10 0C 72 70 36 14 63 71 65 40
Frozen below -18 0C 8 9 24 36 18 8 - -
DK / CS 16 15 22 50 16 13 35 58
All (n=13855)
Jharkhand (n=82)
Karnataka (n=416)
Kerala (n=268)
MP (n=410)
Nagaland (n=2)
Orissa (n=85)
Pondicherry (n=6)
Punjab (n=1082)
Mild Chill >10 0 C 4 - 13 0 4 - 1 - 1
Chill betn. 0 0 & 10 0C 72 100 35 13 85 100 47 100 96
Frozen below -18 0C 8 - 13 68 1 - 22 - 1
DK / CS 16 - 39 18 10 - 29 - 1
CS’s that mentioned Any Chamber

© COPYRIGHT 2014 33 All Figs in % All Respondents
• 20% of the Company Public Ltd CS have temperature below -18 0 C • Among Urban CS, 55% of them have temperature between 0 0 & 10 0C. The corresponding
temperature among rural CS is 80%.
Proprietorship (n=3561)
Partnership (n=4658)
Company Public Ltd.
(n=588)
Company Private Ltd.
(n=4392)
Association Public (n=15)
Mild Chill >10 0 C 7 4 1 2 -
Chill betn. 0 0 & 10 0C 70 77 68 72 73
Frozen below -18 0C 7 7 20 9 27
DK / CS 16 12 11 18 -
Association Private (n=28)
Cooperative (n=322)
Government (Co./Dept./PSU)
(n=233)
Not mentioned ownership type
(n=58)
Mild Chill >10 0 C 11 1 6 3
Chill betn. 0 0 & 10 0C 57 66 60 62
Frozen below -18 0C 14 9 12 9
DK / CS 18 24 22 26
5.4 TEMPERATURE ZONES IN CHAMBERS
All (n=5003)
Urban CS’s (n=4061)
Rural CS’s (n=9794)
NHB/NHM (n=8325)
Others (n=5530)
Mild Chill >10 0 C 4 8 2 4 4
Chill betn. 0 0 & 10 0C 72 55 80 79 62
Frozen below -18 0C 8 16 5 4 15
DK / CS 16 21 13 13 19

© COPYRIGHT 2014 34
5.5 BUILDING STRUCTURE OF COLD STORAGES
All Figs in % All Respondents
Brick & Mortar structure / RCC
Modern Pre Engineered Building (PEB)
Both
Others
All (n=5003)
Type H (n=4333)
Type P (n=523)
Type M (n=452)
Type Q (n=44)
Other Products
(n=27)
74
17
8
1
59
22
19
0
76
16
7
1
66
20
13
1
58
28
14
0
66
14
20
0
All (n=5003)
North (n=2142)
East (n=803)
West (n=1013)
South (n=1045)
64
18
13
4
78
17
5
0
84
6
10
0
69
23
8
0
• 3 out of 4 CS’s have a brick and mortar structure. • A 17% cold stores are Modern Pre Engineered Buildings.
• West zone comparatively has more number of cold stores which are modern PEB structures.
Zone wise
Brick & Mortar structure / RCC
Modern Pre Engineered Building (PEB)
Both
Others
74
17
8
1

© COPYRIGHT 2014 35
All (n=5003)
Rajasthan (n=104)
Sikkim (n=5)
TN (n=102)
Tripura (n=9)
Uttaranchal (n=12)
WB (n=464)
North East (n=37)
Brick & Mortar structure / RCC
74 96 60 50 67 67 97 73
Modern Pre Engineered Building (PEB)
17 2 40 34 11 33 2 16
Both 8 2 - 16 22 - 1 8
Others 1 - - - - - - 3
5.5 BUILDING STRUCTURE OF COLD STORAGES
All Figs in % All Respondents
States
• Across states brick and mortar cold stores are a clear majority except in Orissa, Goa and Sikkim, though the absolute numbers in these states are low.
• UP has the maximum number - in terms of absolute number - of modern PEB structured cold stores.
All (n=5003)
Maharashtra (n=451)
UP (n=1371)
A & N (n=10)
AP (n=600)
Assam (n=22)
Bihar (n=169)
Chandigarh (n=3)
Brick & Mortar structure / RCC
74 69 74 90 76 77 60 100
Modern Pre Engineered Building (PEB)
17 19 23 - 13 14 7 -
Both 8 12 2 10 5 5 34 -
Others 1 - 0 - 6 5 - -
All (n=5003)
C’garh (n=76)
Delhi (n=35)
Goa (n=7)
Gujarat (n=399)
Haryana (n=185)
HP (n=14)
J & K (n=16)
Brick & Mortar structure / RCC
74 83 91 43 60 92 57 81
Modern Pre Engineered Building (PEB)
17 4 6 57 34 5 43 19
Both 8 11 3 - 6 2 - -
Others 1 3 - - 1 - - -
All (n=5003)
Jharkhand (n=19)
Karnataka (n=188)
Kerala (n=143)
MP (n=156)
Nagaland (n=1)
Orissa (n=38)
Pondicherry (n=2)
Punjab (n=402)
Brick & Mortar structure / RCC
74 68 47 49 94 100 45 - 78
Modern Pre Engineered Building (PEB)
17 21 22 25 3 - 45 100 6
Both 8 11 29 26 3 - 11 - 15
Others 1 - 2 - - - - - 1

© COPYRIGHT 2014 36 All Figs in % All Respondents
• 3 out of 4 government based cold storages are brick and mortar structures. • The percentage of brick and mortar structures is the maximum among the cooperative type of
cold storages.
Proprietorship (n=1336)
Partnership (n=1677)
Company Public Ltd.
(n=174)
Company Private Ltd.
(n=1563)
Association Public (n=5)
Brick & Mortar structure / RCC 73 74 67 76 100
Modern Pre Engineered Building (PEB)
17 17 20 17 -
Both 8 8 13 7 -
Others 2 1 1 0 -
Association Private (n=12)
Cooperative (n=130)
Government (Co./Dept./PSU)
(n=82)
Not mentioned ownership type
(n=24)
Brick & Mortar structure / RCC 83 82 76 54
Modern Pre Engineered Building (PEB)
8 4 23 13
Both 8 12 1 33
Others - 2 - -
5.5 BUILDING STRUCTURE OF COLD STORAGES
All (n=5003)
Urban CS’s (n=1481)
Rural CS’s (n=3522)
NHB/NHM (n=3061)
Others (n=1942)
Brick & Mortar structure / RCC 74 70 76 78 69
Modern Pre Engineered Building (PEB) 17 17 17 15 20
Both 8 11 7 7 10
Others 1 2 0 1 1

© COPYRIGHT 2014
CHAPTER 6
UPKEEP OF FACILITY & CS TYPES
Page no 37 to 54
© COPYRIGHT 2014 38
6. UPKEEP OF FACILITY
As witnessed in the earlier section, single commodity cold storages are higher in number except in the states of Tamil Nadu, Jharkhand and Delhi where number of multi commodity cold storages outnumber the single ones. Of the 87% of Type H cold storages, 72% only store single commodities.
Single commodity cold storages also have higher storage capacity as compared to multi commodity storages.
Upkeep of facilities were ascertained based on observation by researchers who visited the facilities.
More than 80% single commodity cold storages are considered to have good external condition. Over 70% of them also have good external hygiene and internal road area.
Across zones majority of the cold storages have been given good ratings when it comes to their internal open area and building external condition. States namely MP and Bihar have a scope for improvement on these parameters.
When it comes to the drainage facility, majority of cold storages in states of Maharashtra, AP, Kerala, Karnataka and TN have covered drainage systems.

© COPYRIGHT 2014 39
6. UPKEEP OF FACILITY W.R.T SINGLE/MULTIPLE PRODUCT STORAGE
Nationwide the cold stores were asked to categorise themselves as single commodity or multi-commodity storage basis infrastructure design. The survey revealed that 3,561 cold stores categorised themselves as single commodity cold stores.
Storage type and capacity
As unit owners mostly reported in metric tons, a uniform factor of 3.4 m³ per ton used to arrive at volumetric capacity
This table is only for the CSs interviewed
Type of Cold Store Number of
CS's
Mean
Capacity
(in metric
tons)
Total
capacity
(in million
metric
tons)
Total
Capacity in
Vol. Mln
Cubic
meters
All 5003 5003 25.03 85.1
Single Commodity 3561 5372 19.13 65.0
Multi-commodity 1273 4089 5.21 17.7
CA Store (Controlled
Atmosphere) 29 3073 0.09 0.3
MA Store (Modified
Atmosphere) 8 2404 0.02 0.1

© COPYRIGHT 2014 40
6.PRODUCT CATEGORIES STORED
From the total number of cold stores queried, a total of 86% reported they stored fresh horticulture produce, with 516 storing processed foods (vegetarian), 456 stored meat types (processed and non-processed) and 43 stored pharmaceutical goods and other products.
There was overlap between types of products stored as evidenced in this Venn diagram.
Of the 516 that stored processed foods, 52% of them also stored fresh horticultural produce with 211 of them not catering to fresh fruits and vegetables.
Horticulture / Agriculture
80%
Pharmaceuticals 0.1 %
Animal Husbandry
7%
Processed Food 5.1%
4%
1% 0.04% 0.5% 0.2%
0.2%

© COPYRIGHT 2014 41
Upkeep of facilities were generally observed to be good. These were based on observation by researcher visiting the sites.
27% of the CSs reported upgrading the building in the recent past. 55% of Orissa CSs and 44% of WB CSs reported having upgraded the building.
Description of upkeep
(Percentage rated as good for
different conditions)
Single
commo
dity
stores
Multiple
commod
ity stores
CA stores MA
stores
External condition of CS - good (If
building is well maintained, looks
good, painted or looking shabby) 82 79 86 100
External Hygiene of CSs- good
(boundary is not littered, clean,
separate place for dumping
waste)
74 67 83 88
Internal road area- good (If paved
TAR road or cement road, tiled
road) 71 68 86 88
Condition of internal vehicle
movement – good (Adequate
space for movement, paved road,
adequate parking space)
72 72 86 88
External drainage – covered
drainage 41 53 55 75
6. UPKEEP OF FACILITY

© COPYRIGHT 2014 42
83
14 1
56
40
3
71 25 1 3
67 27
1
5
64 33
1
2
72 25
1 2 30
48
15
7 27
66
2 5
Single Commodity Multi-commodity MA Store CA Store No Response
6.1 COLD STORAGE TYPES
All Figs in % All Respondents
• Close to 3/4ths of the CS’s stock single commodities. • More than half of the cold stores for processed foods (type P) store multiple commodities. • Like wise , 66% of cold stores for Pharmaceutical products (Type Q) store multiple commodities
Zone wise
All (n=5003)
North (n=2142)
East (n=803)
West (n=1013)
South (n=1045)
• Cold storages in North predominantly store single commodities. • Around 1 out of 3 CS’s in West and East stock multiple commodities. • Proportion of multi commodity stores in the South is even higher over 40%.
71 25 1 3
42
54
1
1
3 62
31
1
6
All (n= 5003)
Type H (n= 4333)
Type P (n= 523)
Type M (n= 452)
Type Q (n= 44)
Other Products (n= 27)
Single Commodity Multi-commodity MA Store CA Store No Response

© COPYRIGHT 2014 43
All (n=5003)
Rajasthan (n=104)
Sikkim (n=5)
TN (n=102)
Tripura (n=9)
Uttaranchal (n=12)
WB n=464)
North East (n=37)
Single Commodity 71 51 40 13 56 58 80 35
Multi-commodity 25 42 20 83 22 42 14 41
CA Store 1 - - 1 - - - 3
MA Store 0 - - 1 - - 0 -
No Response 3 7 40 2 22 - 6 22
6.1 COLD STORAGE TYPES
All Figs in % All Respondents
States
All (n=5003)
Maharashtra (n=451)
UP (n=1371)
A & N (n=10)
AP (n=600)
Assam (n=22)
Bihar (n=169)
Chandigarh (n=3)
Single Commodity 71 55 94 80 67 27 62 67
Multi-commodity 25 41 6 20 32 50 38 33
CA Store 1 1 - - 0 5 - -
MA Store 0 0 - - 0 - - -
No Response 3 3 - - 1 18 - -
All (n=5003)
C’garh (n=76)
Delhi (n=35)
Goa (n=7)
Gujarat (n=399)
Haryana (n=185)
HP (n=14)
J & K (n=16)
Single Commodity 71 32 11 57 85 45 36 6
Multi-commodity 25 61 89 43 12 39 21 69
CA Store 1 - - - 1 4 43 25
MA Store 0 - - - - - - -
No Response 3 8 - - 2 12 - -
All (n=5003)
Jharkhand (n=19)
Karnataka (n=188)
Kerala (n=143)
MP (n=156)
Nagaland (n=1)
Orissa (n=38)
Pondicherry (n=2)
Punjab (n=402)
Single Commodity 71 32 36 71 38 - 50 - 87
Multi-commodity 25 68 63 11 61 100 42 100 13
CA Store 1 - 1 - - - - - -
MA Store 0 - - - - - 8 - -
No Response 3 - - 18 1 - - - -
• States namely Tamil Nadu, Jharkhand, Delhi, Chhattisgarh, J&K and Assam have higher number of cold stores storing multiple commodities compared to single commodities.

© COPYRIGHT 2014 44 All Figs in % All Respondents
• 77% of the rural cold storages store single commodity. • 38% of the Urban CS are store multi commodity. The corresponding score in rural CS is 20%.
Proprietorship (n=1336)
Partnership (n=1677)
Company Public Ltd.
(n=174)
Company Private Ltd.
(n=1563)
Association Public (n=5)
Single Commodity 70 74 68 72 80
Multi-commodity 27 23 24 26 20
CA Store 0.2 0.4 2 1 -
MA Store 0.1 0.1 1 0.3 -
No Response 3 3 5 2 -
Association Private (n=12)
Cooperative (n=130)
Government (Co./Dept./PSU)
(n=82)
Not mentioned ownership type
(n=24)
Single Commodity 42 69 48 50
Multi-commodity 58 28 45 46
CA Store - - 2 -
MA Store - - 1 -
No Response - 3 4 4
7.1 BUILDING STRUCTURE OF COLD STORAGES
All (n=5003)
Urban CS’s (n=1481)
Rural CS’s (n=3522)
NHB/NHM (n=3061)
Others (n=1942)
Single Commodity 71 57 77 73 69
Multi-commodity 25 38 20 23 29
CA Store 1 1 0.4 0.4 1
MA Store 0.2 0.2 0.1 0.2 0.2
No Response 3 3 3 4 1
© COPYRIGHT 2014 45
6.2 PRODUCT CATEGORIES STORED
All Figs in %
• Note: Cold storages were asked to classify themselves under 4 product categories. Where multiple products were stored, the first defined category was still retained.
Horticulture / Agriculture
80%
Pharmaceuticals 0.1 %
Animal Husbandry
7%
Processed Food 5.1%
4%
1% 0.3% 0.5%
0.04%
Type of Products All
(n=4885)
Horticulture / Agriculture 86%
Only Horticulture / Agriculture 80%
Horticulture / Agriculture and Processed Food
4%
Horticulture / Agriculture and Animal Husbandry
1%
Horticulture / Agriculture and Pharmaceuticals
0.3%
Horticulture / Agriculture /Processed Food/Animal husbandry
0.5%
Horticulture / Agriculture /Processed Food/Pharmaceuticals
0.2%
Horticulture / Agriculture /Animal Husbandry /Pharmaceuticals
0.04%
Horticulture / Agriculture /Processed Food/Animal Husbandry/Pharmaceuticals
0.2%
Processed food 10%
Only Processed food 5.1%
Animal Husbandry 9%
Only Animal Husbandry 7.0%
Pharmaceuticals 1%
Only Pharmaceuticals 0.1%
0.04%
0.2%
0.2%

© COPYRIGHT 2014 46
Good Fair Not Satisfactory
6.3 BUILDING EXTERNAL CONDITION
All Figs in % All respondents
• Close to 90% of the cold stores in South have good external condition. Other zones also have a relatively high percentage of CS’s with good external condition.
81
17 2
• The recording of the condition of facilities were based on observation of researchers visiting the cold stores.
• The external condition of over 80% of the cold stores is rated to be good.
Zone wise
89
11
80
18 2
80
20 1
88
10 2
77 20
2
81
17 2
89
10 1
72 25
3
78
20 2
Good Fair Not Satisfactory
All (n=5003)
Type H (n=4333)
Type P (n=523)
Type M (n=452)
Type Q (n=44)
Other Products
(n=27)
All (n=5003)
North (n=2142)
East (n=803)
West (n=1013)
South (n=1045)
82
16 2
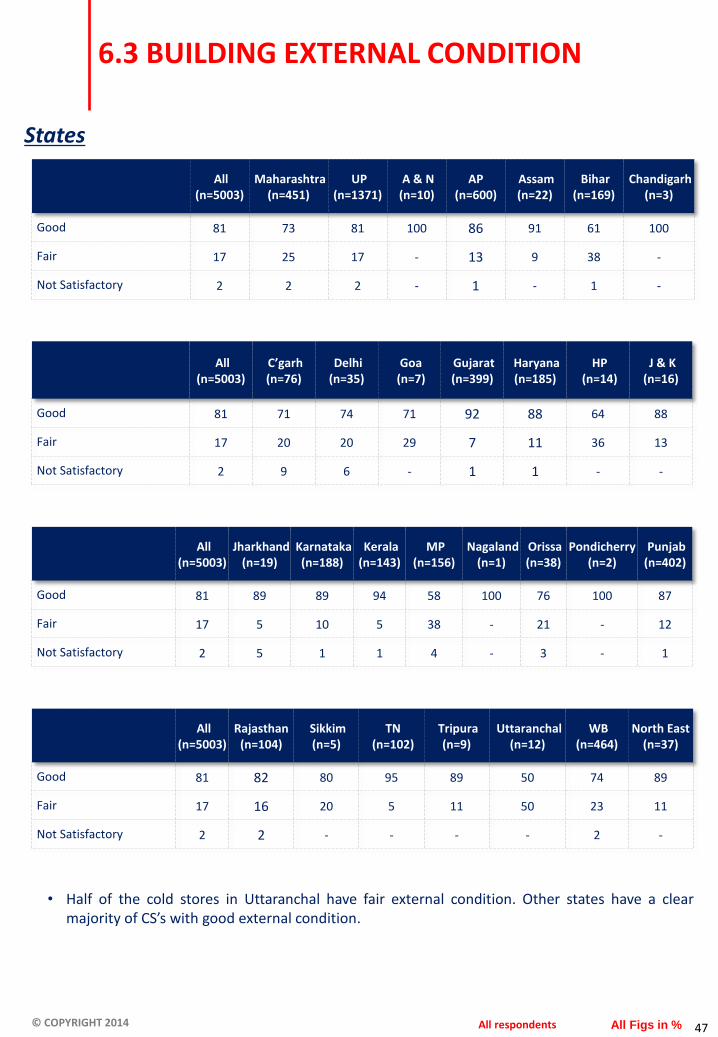
© COPYRIGHT 2014 47
All (n=5003)
Rajasthan (n=104)
Sikkim (n=5)
TN (n=102)
Tripura (n=9)
Uttaranchal (n=12)
WB (n=464)
North East (n=37)
Good 81 82 80 95 89 50 74 89
Fair 17 16 20 5 11 50 23 11
Not Satisfactory 2 2 - - - - 2 -
6.3 BUILDING EXTERNAL CONDITION
All Figs in % All respondents
States
• Half of the cold stores in Uttaranchal have fair external condition. Other states have a clear majority of CS’s with good external condition.
All (n=5003)
Maharashtra (n=451)
UP (n=1371)
A & N (n=10)
AP (n=600)
Assam (n=22)
Bihar (n=169)
Chandigarh (n=3)
Good 81 73 81 100 86 91 61 100
Fair 17 25 17 - 13 9 38 -
Not Satisfactory 2 2 2 - 1 - 1 -
All (n=5003)
C’garh (n=76)
Delhi (n=35)
Goa (n=7)
Gujarat (n=399)
Haryana (n=185)
HP (n=14)
J & K (n=16)
Good 81 71 74 71 92 88 64 88
Fair 17 20 20 29 7 11 36 13
Not Satisfactory 2 9 6 - 1 1 - -
All (n=5003)
Jharkhand (n=19)
Karnataka (n=188)
Kerala (n=143)
MP (n=156)
Nagaland (n=1)
Orissa (n=38)
Pondicherry (n=2)
Punjab (n=402)
Good 81 89 89 94 58 100 76 100 87
Fair 17 5 10 5 38 - 21 - 12
Not Satisfactory 2 5 1 1 4 - 3 - 1

© COPYRIGHT 2014 48
6.4 INTERNAL OPEN AREA
All Figs in % All respondents
Good Fair Not Satisfactory
• Large number of CS’s in the South Zone have internal areas which are in good condition. • 37% CS’s in the Western zone have fair to not satisfactory internal space.
71 26
4
• The condition of Internal area is good in a predominant number of cold stores. • Animal Husbandry CSs are rated better on internal areas • The above mentioned mean scores are on a 3 point scale, where 1 is for good, 2 for fair and 3
for not satisfactory. Thus closer the mean number to 1, better is the upkeep of the facility.
Zone wise
78
22 70 26
4
66 31
3
77 19
4
64 36
71 26
4
82
16 2
73 22
4
62 33
5
60 37
3
1.3 1.3 1.4 1.3 1.4 1.2
1.3 1.3 1.4 1.4 1.2
Good Fair Not Satisfactory
Mean
Mean
All (n=5003)
Type H (n=4333)
Type P (n=523)
Type M (n=452)
Type Q (n=44)
Other Products
(n=27)
All (n=5003)
North (n=2142)
East (n=803)
West (n=1013)
South (n=1045)

© COPYRIGHT 2014 49
6.4 INTERNAL OPEN AREA
All Figs in % All respondents
States
• Almost all states have majority CS’s with good internal area, 43% in Bihar, 46% of CSs in MP and 92% of CSs in Uttaranchal have internal areas which are in a fair condition.
All (n=5003)
Maharashtra (n=451)
UP (n=1371)
A & N (n=10)
AP (n=600)
Assam (n=22)
Bihar (n=169)
Chandigarh (n=3)
Good 71 60 71 30 78 64 53 67
Fair 26 35 24 50 20 32 43 33
Not Satisfactory 4 5 5 20 2 5 4 -
Mean 1.3 1.5 1.3 1.9 1.2 1.4 1.5 1.3
All (n=5003)
C’garh (n=76)
Delhi (n=35)
Goa (n=7)
Gujarat (n=399)
Haryana (n=185)
HP (n=14)
J & K (n=16)
Good 71 51 71 29 63 90 64 69
Fair 26 41 20 71 35 8 36 19
Not Satisfactory 4 8 9 - 2 2 - 13
Mean 1.3 1.6 1.4 1.7 1.4 1.1 1.4 1.4
All (n=5003)
Jharkhand (n=19)
Karnataka (n=188)
Kerala (n=143)
MP (n=156)
Nagaland (n=1)
Orissa (n=38)
Pondicherry (n=2)
Punjab (n=402)
Good 71 84 82 93 51 100 63 100 75
Fair 26 5 13 4 46 - 16 - 20
Not Satisfactory 4 11 4 3 3 - 21 - 5
Mean 1.3 1.3 1.2 1.1 1.5 1.0 1.6 1.0 1.3
All (n=5003)
Rajasthan (n=104)
Sikkim (n=5)
TN (n=102)
Tripura (n=9)
Uttaranchal (n=12)
WB (n=464)
North East (n=37)
Good 71 77 80 91 78 8 66 84
Fair 26 20 20 8 22 92 30 16
Not Satisfactory 4 3 - 1 - - 4 -
Mean 1.3 1.3 1.2 1.1 1.2 1.9 1.4 1.2

© COPYRIGHT 2014 50
6.5 INTERNAL TRAFFIC AREA
All Figs in % All respondents
Tarmac Road
Paved / Brick Tiling
Earthwork
Grassy
Others specify
39
36
26
17
1
67
26
11
11
0
36
38
28
18
1
48
27
22
15
2
56
35
10
5
3
50
20
34
9
0
Tarmac Road
Paved / Brick Tiling
Earthwork
Grassy
Others specify
39
36
26
17
1
69
20
13
4
2
29
45
27
20
1
29
49
30
25
1
37
26
33
16
3
• More than a third of CSs had internal road of either Tarmac road or paved brick tiling road. Only in Q type products storage CSs, Earthwork road was present in one third of the installations
• Zone wise analysis shows that South zone had tarmac roads mainly, where as in all the other zones different road types were present.
• In North and East paved / brick tiling was prevalent in nearly 50% of CSs, while in West over a third had either Tarmac or earthwork roads
Zone wise
All (n=5003)
Type H (n=4333)
Type P (n=523)
Type M (n=452)
Type Q (n=44)
Other Products
(n=27)
All (n=5003)
North (n=2142)
East (n=803)
West (n=1013)
South (n=1045)

© COPYRIGHT 2014 51
6.5 INTERNAL TRAFFIC AREA
All Figs in % All respondents
States
• In state wise analysis it is seen that there is a good variety in road types. • Majority of CSs in AP. Chandigarh, Delhi, J&K, Karnataka, Kerala, Rajasthan and TN are having
tarmac road • Paved/brick tiling was present in Maharashtra, UP, Haryana, HP, Jharkhand, Punjab,
Uttaranchal and WB. • Earth work roads were prevalent in Chhattisgarh and Gujarat
All (n=5003)
Maharashtra (n=451)
UP (n=1371)
A & N (n=10)
AP (n=600)
Assam (n=22)
Bihar (n=169)
Chandigarh (n=3)
Tarmac Road 39 39 20 90 76 18 37 67
Paved / Brick Tiling 36 34 47 - 20 59 19 33
Earthwork 26 26 33 10 9 27 31 -
Grassy 17 18 25 - 3 23 37 -
Others specify 1 2 1 - 2 9 1 -
All (n=5003)
C’garh (n=76)
Delhi (n=35)
Goa (n=7)
Gujarat (n=399)
Haryana (n=185)
HP (n=14)
J & K (n=16)
Tarmac Road 39 9 63 14 41 49 29 69
Paved / Brick Tiling 36 17 23 14 18 41 64 6
Earthwork 26 72 17 71 46 11 7 25
Grassy 17 13 3 - 3 1 7 -
Others specify 1 4 3 - 6 - - -

© COPYRIGHT 2014 52
6.5 INTERNAL TRAFFIC AREA
All Figs in % All respondents
States
All (n=5003)
Jharkhand (n=19)
Karnataka (n=188)
Kerala (n=143)
MP (n=156)
Nagaland (n=1)
Orissa (n=38)
Pondicherry (n=2)
Punjab (n=402)
Tarmac Road 39 16 59 48 19 100 39 100 36
Paved / Brick Tiling 36 53 13 44 24 100 13 - 48
Earthwork 26 5 28 4 19 - 42 - 17
Grassy 17 26 7 3 46 100 24 - 21
Others specify 1 - 2 1 2 - - - 1
All (n=5003)
Rajasthan (n=104)
Sikkim (n=5)
TN (n=102)
Tripura (n=9)
Uttaranchal (n=12)
WB (n=464)
North East (n=37)
Tarmac Road 39 59 20 73 22 25 29 22
Paved / Brick Tiling 36 13 40 2 89 67 66 65
Earthwork 26 27 40 23 11 - 23 24
Grassy 17 3 20 7 - 8 23 19
Others specify 1 - - 1 - - - 5

© COPYRIGHT 2014 53
6.6 EXTERNAL DRAINAGE FACILITY
All Figs in % All respondents
• While around 70% CS’s in North and East have open drainage facility, in West and South the percentage is higher for covered drainages.
56
44
• 59% of Type H storages have open drainage facility. Over 50% of all other type of storages have a covered drainage system.
Zone wise
33
67
59 41
43
57
40
60
36
64
56
44
29
71
69 31 74
26 41
59
Open Covered
Open Covered
All (n=5003)
North (n=2142)
East (n=803)
West (n=1013)
South (n=1045)
All (n= 5003)
Type H (n= 4333)
Type P (n= 523)
Type M (n= 452)
Type Q (n= 44)
Other Products (n= 27)

© COPYRIGHT 2014 54
6.6 EXTERNAL DRAINAGE FACILITY
All Figs in % All respondents
States
• Major number of CS’s in States like TN AP, Kerala, Karnataka, Punjab, Maharashtra and HP have covered drainages. On the other hand UP, Chhattisgarh, Haryana, Jharkhand and Rajasthan predominantly have open drainages.
All (n=5003)
Maharashtra (n=451)
UP (n=1371)
A & N (n=10)
AP (n=600)
Assam (n=22)
Bihar (n=169)
Chandigarh (n=3)
Open 56 26 78 70 35 59 58 67
Covered 44 74 22 30 65 41 42 33
All (n=5003)
C’garh (n=76)
Delhi (n=35)
Goa (n=7)
Gujarat (n=399)
Haryana (n=185)
HP (n=14)
J & K (n=16)
Open 56 75 51 - 52 76 29 25
Covered 44 25 49 100 48 24 71 75
All (n=5003)
Jharkhand (n=19)
Karnataka(n=188)
Kerala (n=143)
MP (n=156)
Nagaland (n=1)
Orissa (n=38)
Pondicherry (n=2)
Punjab (n=402)
Open 56 89 35 12 58 - 53 - 32
Covered 44 11 65 88 42 100 47 100 68
All (n=5003)
Rajasthan (n=104)
Sikkim (n=5)
TN (n=102)
Tripura (n=9)
Uttaranchal (n=12)
WB (n=464)
North East (n=37)
Open 56 90 80 7 56 83 81 59
Covered 44 10 20 93 44 17 19 41

© COPYRIGHT 2014
CHAPTER 7
GENERAL LAYOUT AND GEO TAGGED LINKS
Page no 55 to 119

© COPYRIGHT 2014 56
The cold storage facilities were also categorized based on the type of structure. Primarily the following types were indicated: Pre-Engineered Building (PEB) and Brick and Mortar type structure.
It was observed that 74% of the cold stores structures were of the Brick and mortar type, while 17% of the CS’s that have adopted Modern Pre-engineered Building structures. On an all India basis, about 8% of the facilities had both kinds of structures. A minimal 1% did not fall under either category (tin, asbestos and indigenous type).
The proportion of brick and mortar structures is relatively higher in the Eastern zone. Whereas 1/3rd cold storages in Tamil Nadu and Gujarat are PEB structures.
On an average, 32% of the cold stores were constructed with only one ground floor level. Another 36% had more than four floors. The remaining had between 2 to 4 floors per facility.
The mean land boundary area of all CSs was 4,566.8 sq. meters
The mean covered area of all CSs was 3,568.3 sq meters.
Page 49 has hyperlinks to Google maps which indicate location of the Cold store in the respective state.
All (n=5003)
Mean
4566.8
Type H (n=4333)
Mean
4868.1
Type P (n=523)
Mean
3933.1
Type M (n=452)
Mean
3105.8
Type Q (n=44)
Mean
4818.4
Other Products
(n=27)
Mean
4759.8
All (n=5003)
Mean
3568.3
Type H (n=4333)
Mean
3775.9
Type P (n=523)
Mean
2885.5
Type M (n=452)
Mean
2205.3
Type Q (n=44)
Mean
2837.8
Other Products
(n=27)
Mean
3366.7
7. GENERAL LAYOUT OF THE FACILITY

© COPYRIGHT 2014 57
7. GENERAL LAYOUT OF THE FACILITY STORAGE PLATFORMS & TYPE
Type of storage platforms used (%)
In context of the storing platform, almost 96% of the cold stores were designed with wooden,
RCC or steel mezzanine floors. These designs primarily stored goods in gunny bags, crates and boxes. The rest of the cold stores had metal and wooden rack system as the primary platform.
Storing unit types in use (%)
Gunny bags were the main small storage inside the CSs followed by corrugated boxes.
Gunny bags are prominently used in Type H cold storages. 77% of Type H cold storages use gunny bags for storing purposes. Around 40% each of Type Q store products in gunny bags, CFD boxes and plastic crates. Over 70% of Type M and Type Q CSs store in CFD boxes.
Thermocol / EPS / XPS as add-on slabs are the most common insulations type used across India more so in the Eastern zone. A higher percentage of Cold storages in North, utilize fillers like Husk / Rock / Wool etc. Close to 50% Type M cold stores use PUF panels for insulation purposes.
78
19 10
3 3 2
Wooden mezzanineplatform
RCC Levels Steel mezzanineplatform
Metal Rackingsystem
Bins stacking system DKCS
Wooden mezzanine + RCC Levels + Steel mezzanine unduplicated NET value = 96%
69
20
16
11
5
Gunny Bags
CFB Boxes
Plastic Crates
Wooden Boxes
Any Bulk storage

© COPYRIGHT 2014 58
Majority of the cold storages have not had any recent upgrade. This is true across all zones and cold storages stocking various type of products.
Of the Cold storages that have had upgrades, 60% have expanded their capacities.
58% of the cold storage facilities had only a single access gate (main gate to facility), while 36% have two access gates facilitating easy turn-around of traffic. The remaining reported more than two gates with an all India average of 1.6 gates per facility.
The majority of the cold stores (67%) had uncovered parking for visiting trucks with 12% having both covered and uncovered parking lots. Only 21% offered exclusively covered parking inside their boundary wall. A third of Type Q cold storages offer covered parking spaces.
On an average, parking space for 22 vehicles is available inside a facility. The vast land boundary in the North and East offers parking spaces for 25 and 28 trucks respectively.
Transport services were not provided by 79% of the cold storage units. Of the 21% that provided transportation, 67% own the asset base.
Reefer truck facility is available in a meagre 4% cold storages. Of them 68% own the trucks and 47% outsource the services. The percentage adds to over 100% as 14% have own asset base and also use others vehicles
Each facility location was also recorded through geo-tagging of photographs (external picture of each facility visited). Some cold storage owners also permitted pictures of the inside of their infrastructure.
The geotag photographs links are provided here.
7. GENERAL LAYOUT OF THE FACILITY
27
72
2
Yes No DK/CS
Recent upgrade in the Building

© COPYRIGHT 2014 59
7. GEOTAGGED PHOTOGRAPHS
When the link is clicked the state map will open with points of locations of cold storages. When we click on the location, the photograph with the name of the cold store will pop up.
The locations of existing CSs, permanently closed CSs, temporarily closed CSs are indicated along with the photographs
State Link
Andaman & Nicobar http://goo.gl/maps/QvBMj
Andhra Pradesh http://goo.gl/maps/zyxz3
Assam http://goo.gl/maps/7aW0p
Bihar http://goo.gl/maps/1oPE8
Chandigarh http://goo.gl/maps/O7Miz
Chhattisgarh http://goo.gl/maps/Dzqpn
Delhi http://goo.gl/maps/wOUhy
Goa http://goo.gl/maps/VtbBD
Gujarat http://goo.gl/maps/RFF93
Haryana http://goo.gl/maps/tWs1Q
Himachal Pradesh http://goo.gl/maps/fkAp2
Jammu & Kashmir http://goo.gl/maps/dJC6u
Jharkhand http://goo.gl/maps/ftPrt
Karnataka http://goo.gl/maps/3QavX
Kerala http://goo.gl/maps/eFQCl
Maharashtra http://goo.gl/maps/ySGVR
Madhya Pradesh http://goo.gl/maps/kBAqD
North East http://goo.gl/maps/wU1V3
Orissa http://goo.gl/maps/zosjE
Punjab http://goo.gl/maps/Ne8AU
Rajasthan http://goo.gl/maps/92BzC
Tamil Nadu http://goo.gl/maps/r9Ptz
Uttar Pradesh http://goo.gl/maps/Fb5RE
Uttaranchal http://goo.gl/maps/n96aJ
West Bengal http://goo.gl/maps/t0gzu

© COPYRIGHT 2014 60 All Figs in % All Respondents
• 3 out of 4 CS’s have a brick and mortar structure. • A 17% cold stores are Modern Pre Engineered Buildings.
• West zone comparatively has more number of cold stores which are modern PEB structures. • In contrast, East has the least number of PEB structures
Zone wise
Brick & Mortar structure / RCC
Modern Pre Engineered Building (PEB)
Both
Others
All (n=5003)
Type H (n=4333)
Type P (n=523)
Type M (n=452)
Type Q (n=44)
Other Products
(n=27)
74
17
8
1
59
22
19
0
76
16
7
1
66
20
13
1
58
28
14
0
66
14
20
0
All (n=5003)
North (n=2142)
East (n=803)
West (n=1013)
South (n=1045)
74
17
8
1
64
18
13
4
78
17
5
0
84
6
10
0
69
23
8
0
Brick & Mortar structure / RCC
Modern Pre Engineered Building (PEB)
Both
Others
7.1 BUILDING STRUCTURE OF COLD STORAGES

© COPYRIGHT 2014 61 All Figs in % All Respondents
States
• Across states brick and mortar cold stores are a clear majority except in Orissa, Goa and Sikkim, though the absolute numbers in these states are low.
• UP has the maximum number - in terms of absolute number - of modern PEB structured cold stores.
All (n=5003)
Maharashtra (n=451)
UP (n=1371)
A & N (n=10)
AP (n=600)
Assam (n=22)
Bihar (n=169)
Chandigarh (n=3)
Brick & Mortar structure / RCC
74 69 74 90 76 77 60 100
Modern Pre Engineered Building (PEB)
17 19 23 - 13 14 7 -
Both 8 12 2 10 5 5 34 -
Others 1 - 0 - 6 5 - -
All (n=5003)
C’garh (n=76)
Delhi (n=35)
Goa (n=7)
Gujarat (n=399)
Haryana (n=185)
HP (n=14)
J & K (n=16)
Brick & Mortar structure / RCC
74 83 91 43 60 92 57 81
Modern Pre Engineered Building (PEB)
17 4 6 57 34 5 43 19
Both 8 11 3 - 6 2 - -
Others 1 3 - - 1 - - -
All (n=5003)
Jharkhand
(n=19)
Karnataka
(n=188)
Kerala (n=143)
MP (n=156)
Nagaland (n=1)
Orissa (n=38)
Pondicherry (n=2)
Punjab (n=402)
Brick & Mortar structure / RCC
74 68 47 49 94 100 45 - 78
Modern Pre Engineered Building (PEB)
17 21 22 25 3 - 45 100 6
Both 8 11 29 26 3 - 11 - 15
Others 1 - 2 - - - - - 1
7.1 BUILDING STRUCTURE OF COLD STORAGES
All (n=5003)
Rajasthan (n=104)
Sikkim (n=5)
TN (n=102)
Tripura (n=9)
Uttaranchal (n=12)
WB (n=464)
North East (n=37)
Brick & Mortar structure / RCC
74 96 60 50 67 67 97 73
Modern Pre Engineered Building (PEB)
17 2 40 34 11 33 2 16
Both 8 2 - 16 22 - 1 8
Others 1 - - - - - - 3

© COPYRIGHT 2014 62 All Figs in % All Respondents
• 3 out of 4 government based cold storages are brick and mortar structures. • The percentage of brick and mortar structures is the maximum among the cooperative type of
cold storages.
Proprietorship (n=1336)
Partnership (n=1677)
Company Public Ltd.
(n=174)
Company Private Ltd.
(n=1563)
Association Public (n=5)
Brick & Mortar structure / RCC 73 74 67 76 100
Modern Pre Engineered Building (PEB)
17 17 20 17 -
Both 8 8 13 7 -
Others 2 1 1 0 -
Association Private (n=12)
Cooperative (n=130)
Government (Co./Dept./PSU)
(n=82)
Not mentioned ownership type
(n=24)
Brick & Mortar structure / RCC 83 82 76 54
Modern Pre Engineered Building (PEB)
8 4 23 13
Both 8 12 1 33
Others - 2 - -
7.1 BUILDING STRUCTURE OF COLD STORAGES
All (n=5003)
Urban CS’s (n=1481)
Rural CS’s (n=3522)
NHB/NHM (n=3061)
Others (n=1942)
Brick & Mortar structure / RCC 74 70 76 78 69
Modern Pre Engineered Building (PEB) 17 17 17 15 20
Both 8 11 7 7 10
Others 1 2 0 1 1

© COPYRIGHT 2014 63
33
56
11
7.2 RECENT UPGRADE TO THE BUILDING
All Figs in % All Respondents
• Almost 3/4ths of CS’s have not had any recent upgrade. This trend holds true for Type H CS’s which drives the All India figure.
• 38% of Type M CS’s have had recent upgrades
• Across zones, majority of the CS’s have not had any recent upgrade.
Zone wise
27
72
2
25
73
1
Yes No DK/CS
Yes No DK/CS
36
62
2
38
60
2 27
66
7
26
71
3 27
72
2 24
75
1
36
63
1 27
72
1
All (n=5003)
Type H (n=4333)
Type P (n=523)
Type M (n=452)
Type Q (n=44)
Other Products
(n=27)
All (n=5003)
North (n=2142)
East (n=803)
West (n=1013)
South (n=1045)

© COPYRIGHT 2014 64
• Majority CS’s across almost all states have had no recent upgrades. • More than 50% cold stores in Orissa and 44% in WB have had recent upgrades in the building.
7.2 RECENT UPGRADE TO THE BUILDING
All Figs in % All Respondents
States
All (n=5003)
Maharashtra (n=451)
UP (n=1371)
A & N (n=10)
AP (n=600)
Assam (n=22)
Bihar (n=169)
Chandigarh (n=3)
Yes 27 27 28 40 23 23 25 33
No 72 71 72 50 74 77 73 67
DK/CS 2 2 1 10 3 - 2 -
All (n=5003)
C’garh (n=76)
Delhi (n=35)
Goa (n=7)
Gujarat (n=399)
Haryana (n=185)
HP (n=14)
J & K (n=16)
Yes 27 18 31 29 24 12 29 19
No 72 79 69 71 74 85 71 81
DK/CS 2 3 - - 1 3 - -
All (n=5003)
Jharkhand (n=19)
Karnataka (n=188)
Kerala (n=143)
MP (n=156)
Nagaland (n=1)
Orissa (n=38)
Pondicherry (n=2)
Punjab (n=402)
Yes 27 - 18 42 30 - 55 100 16
No 72 95 75 56 69 100 45 - 82
DK/CS 2 5 7 2 1 - - - 2
All (n=5003)
Rajasthan (n=104)
Sikkim (n=5)
TN (n=102)
Tripura (n=9)
Uttaranchal (n=12)
WB (n=464)
North East (n=37)
Yes 27 20 60 28 11 42 44 24
No 72 80 40 71 89 58 56 76
DK/CS 2 - - 1 - - 0 -

© COPYRIGHT 2014 65
• 45% of the cooperatives have had an upgrade recently. • Close to 3 out of 4 government run cold storages have not had an upgrade recently.
7.2 RECENT UPGRADE TO THE BUILDING
All Figs in % All Respondents
Proprietorship (n=1336)
Partnership (n=1677)
Company Public Ltd.
(n=174)
Company Private Ltd.
(n=1563)
Association Public (n=5)
Yes 22 24 30 31 80
No 75 75 68 68 20
DK/CS 3 1 1 1 -
Association Private (n=12)
Cooperative (n=130)
Government (Co./Dept./PSU)
(n=82)
Not mentioned ownership type
(n=24)
Yes 25 45 29 29
No 67 55 65 71
DK/CS 8 - 6 -
All (n=5003)
Urban CS’s (n=1481)
Rural CS’s (n=3522)
NHB/NHM (n=3061)
Others (n=1942)
Yes 27 25 28 28 25
No 72 73 71 71 73
DK/CS 2 3 1 1 2

© COPYRIGHT 2014 66
7.3 YEAR UPGRADED THE BUILDING
All Figs in %
Less than 1 yr (2012 to 2013)
2 to 5yrs (2009 to 2011)
6 to 10yrs (2004 to 2008)
11 to 15yrs (1999 to 2003)
16 to 20yrs (1994 to 1998)
21 to 25yrs (1993 to 1989)
26 to 30yrs (1984 to 1988)
More than 30 yrs
30
27
21
10
6
3
2
2
All (n=1340)
Type H (n=1101)
Type P (n=188)
Type M (n=172)
Type Q (n=12)
Other Products
(n=9)
33
11
22
0
22
0
11
0
29
25
21
11
7
3
2
2
31
32
20
6
4
3
2
2
39
33
19
3
2
2
2
2
33
33
17
8
8
0
0
0
• Of the 1340 CSs, having upgrades, almost 30% CS’s have had upgrades in the last 1 year. • Over 60% of Type M,Q & P CS’s have had upgrades in the last 5 years.
All (n=1340)
North (n=510)
East (n=292)
West (n=269)
South (n=269)
Zone wise
30
27
21
10
6
3
2
2
42
32
17
4
2
0
1
1
22
24
25
14
7
3
2
3
31
24
19
9
9
5
2
2
29
29
20
9
7
2
3
1
• Of the CSs who have had upgrades, over 40% of the Southern based CS’s have had upgrades in the last 1 year.
Less than 1 yr (2012 to 2013)
2 to 5yrs (2009 to 2011)
6 to 10yrs (2004 to 2008)
11 to 15yrs (1999 to 2003)
16 to 20yrs (1994 to 1998)
21 to 25yrs (1993 to 1989)
26 to 30yrs (1984 to 1988)
More than 30 yrs
CS’s that have recently upgraded/ majorly overhauled the building

© COPYRIGHT 2014 67
7.3 YEAR UPGRADED THE BUILDING
All Figs in %
States
• 1 out of every 3 CS’s (where upgrades were done) in Maharashtra which have had upgrades were in the last 1 year.
• Over 50% of CS in Gujarat , Haryana, AP, Bihar, Maharashtra Punjab, Orissa, Kerala, Karnataka and WB were upgraded in the last 5 years.
All (n=1340)
Maharashtra (n=123)
UP (n=377)
A & N (n=4)
AP (n=140)
Assam (n=5)
Bihar (n=43)
Chandigarh (n=1)
Less than 1 yr (2012 to 2013)
30 34 20 50 58 40 23 -
2 to 5yrs (2009 to 2011) 27 28 22 - 31 20 26 100
6 to 10yrs (2004 to 2008) 21 24 26 50 6 40 30 -
11 to 15yrs (1999 to 2003) 10 3 14 - 3 - 14 -
16 to 20yrs (1994 to 1998) 6 2 8 - - - 5 -
21 to 25yrs (1993 to 1989) 3 4 4 - - - 2 -
26 to 30yrs (1984 to 1988) 2 2 2 - 1 - - -
More than 30 yrs 2 1 3 - 1 - - -
M E A N(in yrs) 6.9 5.9 8.9 4.3 2.9 4.1 6.6 3.5
All (n=1340)
C’garh (n=14)
Delhi (n=11)
Goa (n=2)
Gujarat (n=97)
Haryana (n=22)
HP (n=4)
J & K (n=3)
Less than 1 yr (2012 to 2013)
30 29 27 50 27 36 50 33
2 to 5yrs (2009 to 2011) 27 43 36 - 33 27 25 67
6 to 10yrs (2004 to 2008) 21 14 27 50 12 23 - -
11 to 15yrs (1999 to 2003) 10 14 9 - 13 9 25 -
16 to 20yrs (1994 to 1998) 6 - - - 10 5 - -
21 to 25yrs (1993 to 1989) 3 - - - 1 - - -
26 to 30yrs (1984 to 1988) 2 - - - 1 - - -
More than 30 yrs 2 - - - 2 - - -
M E A N(in yrs) 6.9 4.6 4.8 4.3 7.1 5.0 4.4 2.5
CS’s that have recently upgraded/ majorly overhauled the building

© COPYRIGHT 2014 68
7.3 YEAR UPGRADED THE BUILDING
All Figs in %
States
• Over 40% cold stores in Orissa have had upgraded in the last 1 year.
All (n=1340)
Jharkhand (n=-)
Karnataka (n=34)
Kerala (n=60)
MP (n=47)
Nagaland (n=-)
Orissa (n=21)
Pondicherry (n=2)
Punjab (n=66)
Less than 1 yr (2012 to 2013)
30 - 21 28 21 - 43 - 26
2 to 5yrs (2009 to 2011) 27 - 35 35 26 - 24 50 32
6 to 10yrs (2004 to 2008)
21 - 29 28 21 - 24 - 21
11 to 15yrs (1999 to 2003)
10 - 9 3 15 - - - 11
16 to 20yrs (1994 to 1998)
6 - 3 3 11 - 5 - 8
21 to 25yrs (1993 to 1989)
3 - - 2 - - 5 - 2
26 to 30yrs (1984 to 1988)
2 - - - 6 - - 50 -
More than 30 yrs 2 - 3 - - - - - 2
M E A N(in yrs) 6.9 - 6.3 5.1 8.3 - 4.9 15.8 6.5
CS’s that have recently upgraded/ majorly overhauled the building
All (n=1340)
Rajasthan (n=21)
Sikkim (n=3)
TN (n=29)
Tripura (n=1)
Uttaranchal (n=5)
WB (n=205)
North East (n=9)
Less than 1 yr (2012 to 2013)
30 19 33 21 100 60 31 44
2 to 5yrs (2009 to 2011) 27 5 33 31 - 20 22 22
6 to 10yrs (2004 to 2008)
21 38 - 34 - - 15 22
11 to 15yrs (1999 to 2003)
10 29 33 7 - 20 9 11
16 to 20yrs (1994 to 1998)
6 10 - 7 - - 11 -
21 to 25yrs (1993 to 1989)
3 - - - - - 6 -
26 to 30yrs (1984 to 1988)
2 - - - - - 3 -
More than 30 yrs 2 - - - - - 2 -
M E A N(in yrs) 6.9 8.7 5.7 6.1 0.5 3.6 8.3 4.2
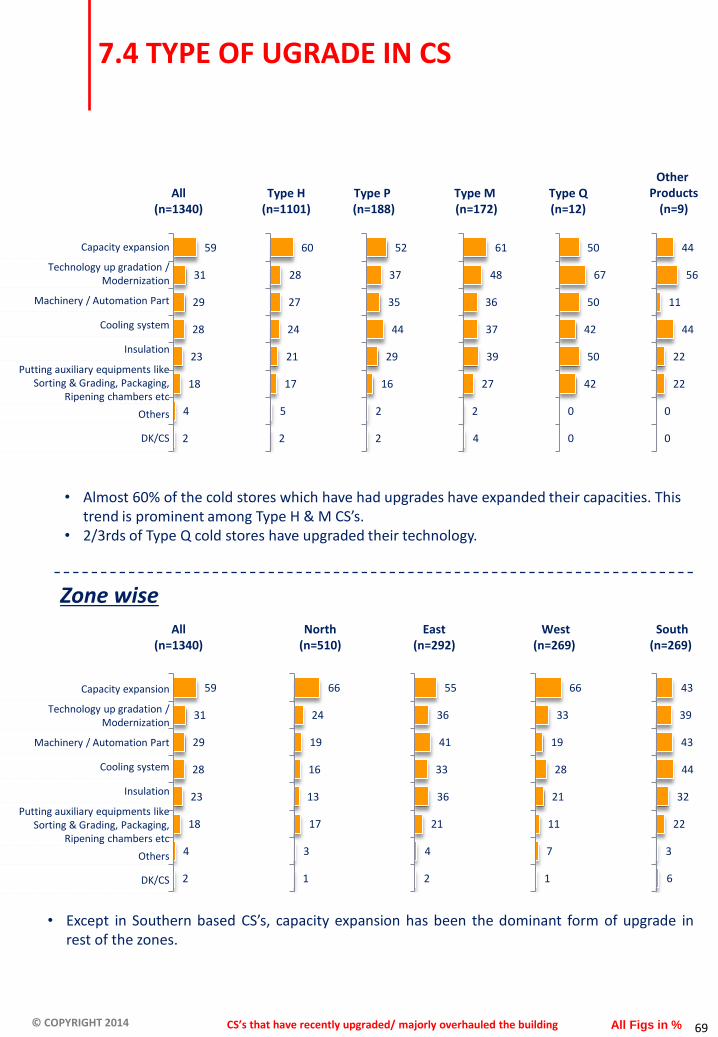
© COPYRIGHT 2014 69
7.4 TYPE OF UGRADE IN CS
All Figs in %
• Except in Southern based CS’s, capacity expansion has been the dominant form of upgrade in rest of the zones.
Capacity expansion
Technology up gradation / Modernization
Machinery / Automation Part
Cooling system
Insulation
Putting auxiliary equipments like Sorting & Grading, Packaging,
Ripening chambers etc
Others
DK/CS
59
31
29
28
23
18
4
2
All (n=1340)
Type H (n=1101)
Type P (n=188)
Type M (n=172)
Type Q (n=12)
Other Products
(n=9)
44
56
11
44
22
22
0
0
60
28
27
24
21
17
5
2
52
37
35
44
29
16
2
2
61
48
36
37
39
27
2
4
50
67
50
42
50
42
0
0
• Almost 60% of the cold stores which have had upgrades have expanded their capacities. This trend is prominent among Type H & M CS’s.
• 2/3rds of Type Q cold stores have upgraded their technology.
Zone wise
59
31
29
28
23
18
4
2
All (n=1340)
North (n=510)
East (n=292)
West (n=269)
South (n=269)
43
39
43
44
32
22
3
6
66
24
19
16
13
17
3
1
55
36
41
33
36
21
4
2
66
33
19
28
21
11
7
1
Capacity expansion
Technology up gradation / Modernization
Machinery / Automation Part
Cooling system
Insulation
Putting auxiliary equipments like Sorting & Grading, Packaging,
Ripening chambers etc
Others
DK/CS
CS’s that have recently upgraded/ majorly overhauled the building

© COPYRIGHT 2014 70
7.4 TYPE OF UGRADE IN CS
All Figs in %
• Maharashtra, UP, Haryana and Gujarat have major number of CS’s which have under gone capacity expansion.
States
All (n=1340)
Maharashtra (n=123)
UP (n=377)
A & N (n=4)
AP (n=140)
Assam (n=5)
Bihar (n=43)
Chandigarh (n=1)
Capacity expansion 59 64 69 - 33 - 42 -
Technology up gradation / Modernization
31 49 25 75 30 20 44 -
Machinery / Automation Part
29 24 20 25 33 80 19 -
Cooling system 28 42 16 - 44 20 26 -
Insulation 23 33 13 - 25 20 19 100
Putting auxiliary equipments like Sorting & Grading, Packaging, Ripening chambers etc
18 15 20 - 16 - 23 -
Others 4 3 2 - 5 - 2 -
DK/CS 2 2 2 - 7 20 2 -
All (n=1340)
C’garh (n=14)
Delhi (n=11)
Goa (n=2)
Gujarat (n=97)
Haryana (n=22)
HP (n=4)
J & K (n=3)
Capacity expansion 59 71 18 100 71 73 25 33
Technology up gradation / Modernization
31 43 73 100 19 18 - 33
Machinery / Automation Part
29 50 45 50 10 9 - 33
Cooling system 28 64 18 50 22 9 75 33
Insulation 23 21 45 50 12 5 - -
Putting auxiliary equipments like Sorting & Grading, Packaging, Ripening chambers etc
18 14 9 - 7 9 - 33
Others 4 7 9 - 8 5 - -
DK/CS 2 7 - - 2 - - -
CS’s that have recently upgraded/ majorly overhauled the building

© COPYRIGHT 2014 71
7.4 TYPE OF UGRADE IN CS
All Figs in % CS’s that have recently upgraded/ majorly overhauled the building
States
All (n=1340)
Jharkhand (n=-)
Karnataka (n=34)
Kerala (n=60)
MP (n=47)
Nagaland (n=-)
Orissa (n=21)
Pondicherry (n=2)
Punjab (n=66)
Capacity expansion 59 - 50 50 57 - 29 100 50
Technology up gradation / Modernization
31 - 38 55 19 - 57 100 18
Machinery / Automation Part
29 - 50 52 21 - 33 100 24
Cooling system 28 - 29 45 4 - 19 100 18
Insulation 23 - 41 42 9 - 14 100 11
Putting auxiliary equipments like Sorting & Grading, Packaging, Ripening chambers etc
18 - 3 42 6 - 14 100 17
Others 4 - - - 15 - - - 11
DK/CS 2 - 9 3 - - 5 - 2
All (n=1340)
Rajasthan (n=21)
Sikkim (n=3)
TN (n=29)
Tripura (n=1)
Uttaranchal (n=5)
WB (n=205)
North East (n=9)
Capacity expansion 59 95 - 69 - 80 62 -
Technology up gradation / Modernization
31 10 - 41 - 20 32 11
Machinery / Automation Part
29 - 33 62 - - 45 56
Cooling system 28 5 67 59 - 40 34 33
Insulation 23 - 33 38 100 - 43 33
Putting auxiliary equipments like Sorting & Grading, Packaging, Ripening chambers etc
18 - 33 34 - - 21 11
Others 4 - - 7 - - 5 -
DK/CS 2 - - - - - 1 11

© COPYRIGHT 2014 72
7.4 TYPE OF UGRADE IN CS
All Figs in % CS’s that have recently upgraded/ majorly overhauled the building
Ownership Type
Proprietorship (n=297)
Partnership (n=407)
Company Public Ltd.
(n=53)
Company Private Ltd.
(n=487)
Association Public (n=4)
Capacity expansion 55 58 55 63 100
Technology up gradation / Modernization
31 30 34 32 50
Machinery / Automation Part 25 23 26 35 50
Cooling system 23 23 23 32 50
Insulation 17 19 23 28 75
Putting auxiliary equipments like Sorting & Grading, Packaging, Ripening chambers etc
17 17 15 19 50
Others 4 4 2 5 -
DK/CS 4 2 4 1 -
Association Private (n=3)
Cooperative (n=58)
Government (Co./Dept./PSU)
(n=24)
Not mentioned ownership type
(n=7)
Capacity expansion - 60 50 57
Technology up gradation / Modernization
- 36 42 43
Machinery / Automation Part - 34 46 14
Cooling system 33 40 63 29
Insulation 67 34 42 14
Putting auxiliary equipments like Sorting & Grading, Packaging, Ripening chambers etc
- 10 46 14
Others 33 3 - -
DK/CS - 5 - -
• In every type ownership of CSs, capacity expansion is the highest mentioned up-gradation. • As many as 63% of the private limited companies have expanded their capacities in a recent
upgrade.

© COPYRIGHT 2014 73
7.4 TYPE OF UGRADE IN CS
All Figs in % CS’s that have recently upgraded/ majorly overhauled the building
All (n=1340)
Urban CS’s (n=368)
Rural CS’s (n=972)
NHB/NHM (n=849)
Others (n=491)
Capacity expansion 59 54 61 58 61
Technology up gradation / Modernization
31 35 30 30 34
Machinery / Automation Part 29 32 28 29 28
Cooling system 28 30 27 26 31
Insulation 23 25 23 23 24
Putting auxiliary equipments like Sorting & Grading, Packaging, Ripening chambers etc
18 16 18 18 18
Others 4 3 5 4 4
DK/CS 2 4 2 3 2
URBAN/RURAL/NHB/NHM
• In every type whether it is urban or rural or NHB assisted or others, capacity expansion is the highest mentioned up-gradation.

© COPYRIGHT 2014 74
7.5 TOTAL LAND BOUNDARY (IN SQ METERS)
All Respondents ALL UNIT IN SQ METERS
• The total land boundary is maximum for Type H cold stores and the ones located in the Northern region.
• Type M storages have the least land boundary. Comparing the zones, Southern CS’s are having lesser total land boundary.
Zone wise
All (n=5003)
Mean
4566.8
North (n=2142)
Mean
5458.4
East (n=803)
Mean
5274.8
West (n=1013)
Mean
4132.7
South (n=1045)
Mean
3689.7
All (n=5003)
Mean
4566.8
Type H (n=4333)
Mean
4868.1
Type P (n=523)
Mean
3993.1
Type M (n=452)
Mean
3105.8
Type Q (n=44)
Mean
4818.4
Other Products
(n=27)
Mean
4759.8

© COPYRIGHT 2014 75
7.5 TOTAL LAND BOUNDARY (IN SQ METERS)
All Figs in % All Respondents ALL UNIT IN SQ METERS
States
All (n=5003)
Maharashtra (n=451)
UP (n=1371)
A & N (n=10)
AP (n=600)
Assam (n=22)
Bihar (n=169)
Chandigarh (n=3)
MEAN (in sq meters) 4566.8 3424.3 7026.3 3167.3 4207.6 2177.8 4784.7 997.9
All (n=5003)
C’garh (n=76)
Delhi (n=35)
Goa (n=7)
Gujarat (n=399)
Haryana (n=185)
HP (n=14)
J & K (n=16)
MEAN (in sq meters) 4566.8 5773.4 2164.9 3222.5 4303.0 3517.4 5959.2 -
All (n=5003)
Jharkhand (n=19)
Karnataka (n=188)
Kerala (n=143)
MP (n=156)
Nagaland (n=1)
Orissa (n=38)
Pondicherry (n=2)
Punjab (n=402)
MEAN (in sq meters) 4566.8 5812.6 2433.0 2587.5 6216.6 - 4727.8 8102.0 5566.6
All (n=5003)
Rajasthan (n=104)
Sikkim (n=5)
TN (n=102)
Tripura (n=9)
Uttaranchal (n=12)
WB (n=464)
North East (n=37)
MEAN (in sq meters) 4566.8 3530.9 504.0 4778.0 4862.3 4566.5 6427.0 2526.4
• The average land area is higher for states of UP, WB, HP, Jharkhand, MP and Punjab with an area running in more than 5000 sq meters

© COPYRIGHT 2014 76
7.5 TOTAL LAND BOUNDARY (IN SQ METERS)
All Figs in % All Respondents ALL UNIT IN SQ METERS
Ownership Type/Urban/Rural/NHB/NHM
Proprietorship (n=1336)
Partnership (n=1677)
Company Public Ltd.
(n=174)
Company Private Ltd.
(n=1563)
Association Public (n=5)
MEAN (in sq meters) 4030.9 4870.2 4896.9 4835.4 1660.5
Association Private (n=12)
Cooperative (n=130)
Government (Co./Dept./PSU)
(n=82)
Not mentioned ownership type
(n=24)
MEAN (in sq meters) 4204.9 3935.0 3861.0 3938.1
All (n=5003)
Urban CS’s (n=1481)
Rural CS’s (n=3522)
NHB/NHM (n=3061)
Others (n=1942)
MEAN (in sq meters) 4566.8 3484.5 5303.9 4958.8 4113.8
• The mean land boundary is highest among Rural CS.

© COPYRIGHT 2014 77
7.6 TOTAL COVERED AREA (IN SQ METERS)
All Figs in % All Respondents ALL UNIT IN SQ METERS
Zone wise
All (n=5003)
Mean
3568.3
North (n=2142)
Mean
4621.8
East (n=803)
Mean
3957.3
West (n=1013)
Mean
2732.1
South (n=1045)
Mean
2525.6
All (n=5003)
Mean
3568.3
Type H (n=4333)
Mean
3775.9
Type P (n=523)
Mean
2885.5
Type M (n=452)
Mean
2205.3
Type Q (n=44)
Mean
2837.8
Other Products
(n=27)
Mean
3366.7
• Type H CS’s comparatively have the highest total area covered. In spite of having a higher base, the area covered is way too higher than that for other type of CS’s.
• Compared to all the zones, CS’s in the Northern Zone have the highest average area covered with over 4600 sq meters followed by East, West and South in that order

© COPYRIGHT 2014 78
7.6 TOTAL COVERED AREA (IN SQ METERS)
All Figs in % All Respondents ALL UNIT IN SQ METERS
• Across states UP has the highest average covered area followed by WB and Punjab
States
All (n=5003)
Maharashtra (n=451)
UP (n=1371)
A & N (n=10)
AP (n=600)
Assam (n=22)
Bihar (n=169)
Chandigarh (n=3)
MEAN (in sq meters) 3568.3 2411.8 5609.6 7356.8 2960.4 1244.8 2943.8 2689.5
All (n=5003)
C’garh (n=76)
Delhi (n=35)
Goa (n=7)
Gujarat (n=399)
Haryana (n=185)
HP (n=14)
J & K (n=16)
MEAN (in sq meters) 3568.3 2535.5 1916.6 1079.6 2859.1 1664.7 3712.1 4274.2
All (n=5003)
Jharkhand (n=19)
Karnataka (n=188)
Kerala (n=143)
MP (n=156)
Nagaland (n=1)
Orissa (n=38)
Pondicherry (n=2)
Punjab (n=402)
MEAN (in sq meters) 3568.3 2530.9 1640.6 1734.0 3241.7 8105.0 2637.9 4051.0 4592.3
All (n=5003)
Rajasthan (n=104)
Sikkim (n=5)
TN (n=102)
Tripura (n=9)
Uttaranchal (n=12)
WB (n=464)
North East (n=37)
MEAN (in sq meters) 3568.3 2366.1 1792.6 2524.2 2894.0 4047.1 4928.0 1885.52

© COPYRIGHT 2014 79
7.6 TOTAL COVERED AREA (IN SQ METERS)
All Figs in % All Respondents ALL UNIT IN SQ METERS
Proprietorship (n=1336)
Partnership (n=1677)
Company Public Ltd.
(n=174)
Company Private Ltd.
(n=1563)
Association Public (n=5)
MEAN (in sq meters) 3119.1 3740.6 4166.4 3789.2 904.3
Association Private (n=12)
Cooperative (n=130)
Government (Co./Dept./PSU)
(n=82)
Not mentioned ownership type
(n=24)
MEAN (in sq meters) 2032.9 3253.7 3232.9 2966.6
All (n=5003)
Urban CS’s (n=1481)
Rural CS’s (n=3522)
NHB/NHM (n=3061)
Others (n=1942)
MEAN (in sq meters) 3568.3 2419.1 4144.0 3936.2 3019.3
Ownership Type/Urban/Rural/NHB/NHM
• Rural CSs have higher covered areas compared to urban CSs. • Like wise, public limited companies have higher covered areas compared to other ownership CSs

© COPYRIGHT 2014 80
2
11
6
9
21
32
15
2
1
1
7
4
8
22
36
17
2
1
4
20
15
11
18
18
8
2
1
4
38
24
11
9
8
3
1
0
0
10
19
10
17
24
14
2
0
12
28
8
8
12
12
16
0
0
7.7 HEIGHT OF THE FACILITY
All Figs in %
13.2 Mean 14.0 10.6 7.7 9.7
0.10 - 3
3. 1 – 6
6. 1 – 9
9.1 – 12
12.1 – 15
15.1 – 18
18.1 – 21
21.1 – 24
24.1 – 27
All (n=4907)
Type H (n=4250)
Type P (n=512)
Type M (n=443)
Type Q (n=42)
Other Products
(n=25)
12.4
• Over 50% of the facilities have heights between 12-18 meters. This holds true for Type H CS’s as well, which is driving the overall status.
• 2 out of 3 Type M cold stores have heights between 3-9 meters.
CS’s that claimed to know the height of the facility ALL UNIT IN METERS

© COPYRIGHT 2014 81
0
1
2
10
30
38
14
2
1
1
3
3
3
13
56
16
2
1
2
13
16
13
21
19
10
3
2
5
33
8
6
8
16
21
1
0
2
11
6
9
21
32
15
2
1
7.7 HEIGHT OF THE FACILITY
All Figs in %
14.4 15.2 11.6 10.5
North (n=2097)
East (n=797)
West (n=976)
South (n=1037)
Zone Wise
• 56% storages in the Eastern zone have heights between 15-18 meters. • Close to 1/3rd of the CS’s in South are 3-6 meters tall, this in turn is reducing the mean height of
the facility in the zone.
13.2 Mean
0.10 - 3
3. 1 – 6
6. 1 – 9
9.1 – 12
12.1 – 15
15.1 – 18
18.1 – 21
21.1 – 24
24.1 – 27
All (n=4907)
CS’s that claimed to know the height of the facility ALL UNIT IN METERS

© COPYRIGHT 2014 82
7.7 HEIGHT OF THE FACILITY
All Figs in %
States
All (n=4907)
Maharashtra (n=424)
UP (n=1333)
A & N (n=10)
AP (n=598)
Assam (n=22)
Bihar (n=168)
Chandigarh (n=3)
0.10 – 3 2 3 0 - 2 5 - -
3. 1 – 6 11 20 0 100 22 14 1 33
6. 1 – 9 6 26 1 - 4 - 2 -
9.1 – 12 9 15 6 - 4 9 5 -
12.1 – 15 21 17 27 - 8 36 17 33
15.1 – 18 32 8 45 - 24 18 58 33
18.1 – 21 15 7 16 - 32 5 12 -
21.1 – 24 2 1 2 - 2 - 2 -
24.1 – 27 1 1 1 - 1 - - -
MEAN 13.2 9.5 15.1 3.8 13.1 12.1 15.1 10.8
All (n=4907)
C’garh (n=71)
Delhi (n=34)
Goa (n=7)
Gujarat (n=391)
Haryana (n=183)
HP (n=13)
J & K (n=16)
0.10 – 3 2 4 - 14 1 - - -
3. 1 – 6 11 3 3 43 10 5 8 13
6. 1 – 9 6 3 6 29 12 7 8 19
9.1 – 12 9 3 12 - 13 26 31 25
12.1 – 15 21 27 50 14 27 24 38 13
15.1 – 18 32 32 18 - 25 19 - 19
18.1 – 21 15 23 9 - 10 13 - 6
21.1 – 24 2 3 - - 1 6 8 6
24.1 – 27 1 1 3 - 2 - - -
MEAN 13.2 14.4 13.1 5.8 12.2 13.1 11.7 11.7
• 45% CS’s in UP and 58% in Bihar have facility height between 15-18 meters. • 1/3rd CS’s in AP have height between 18-21 meters.
CS’s that claimed to know the height of the facility ALL UNIT IN METERS

© COPYRIGHT 2014 83
7.7 HEIGHT OF THE FACILITY (CONT’D)
All Figs in % CS’s that claimed to know the height of the facility ALL UNIT IN METERS
States
All (n=4907)
Jharkhand (n=19)
Karnataka (n=185)
Kerala (n=140)
MP (n=154)
Nagaland (n=1)
Orissa (n=38)
Pondicherry (n=2)
Punjab (n=401)
0.10 – 3 2 - 12 9 1 - 3 - 1
3. 1 – 6 11 5 49 58 1 - 26 50 0
6. 1 – 9 6 5 10 19 1 - 11 - 3
9.1 – 12 9 11 5 6 6 100 5 50 15
12.1 – 15 21 21 5 3 15 - 8 - 36
15.1 – 18 32 16 5 2 34 - 32 - 31
18.1 – 21 15 21 9 1 21 - 11 - 10
21.1 – 24 2 5 1 - 12 - 3 - 2
24.1 – 27 1 11 1 - 3 - - - 1
MEAN 13.2 15.1 7.1 5.4 16.2 9.0 11.2 7.5 13.7
• 2 out of every 3 CS’s in WB are 15-18 meters tall. • The average height is higher in states of UP, Bihar, Chhattisgarh, Jharkhand and MP.
All (n=4907)
Rajasthan (n=103)
Sikkim (n=5)
TN (n=102)
Tripura (n=9)
Uttaranchal (n=11)
WB (n=464)
North East (n=37)
0.10 – 3 2 - 20 4 - - 1 5
3. 1 – 6 11 6 20 34 - - 2 11
6. 1 – 9 6 5 40 13 - 18 2 5
9.1 – 12 9 14 20 14 - 18 2 11
12.1 – 15 21 39 - 21 67 27 7 38
15.1 – 18 32 21 - 10 22 18 66 16
18.1 – 21 15 10 - 4 11 9 18 5
21.1 – 24 2 1 - 1 - - 2 -
24.1 – 27 1 3 - - - 9 1 -
MEAN 13.2 13.5 5.7 8.9 14.3 13.1 16.0 11.6

© COPYRIGHT 2014 84
Ground floor only Ground plus one floor
Four Floors
Three Floors
More than Four Floors
Ground floor only Ground plus one floor
Four Floors
Three Floors
More than Four Floors
7.8 NUMBER OF FLOORS
All Figs in % All Respondents
• At an all India level, where 1/3rd of the CS only have ground floors other 1/3rd have more than 4 floors.
• Majority of Type P & M cold stores have ground floors only. • 40% of Type H cold stores have 4 floors and more.
• 80% of cold stores in the East have 4 floors or more, which is distinctly different to other zones • Around a third of the CS’s in North and West have either ground floor only or have over 4 floors. • In the Southern zone over 40% CS’s have only ground floor and a similar proportion have more
than 4 floors.
Zone wise
32
10 7
16
36
37
26 11 11
15 28
8 7
17
40
41
13 8 13
25 59
26
5 4 6 23
23
20 14
20
All (n=5003)
Type H (n=4333)
Type P (n=523)
Type M (n=452)
Type Q (n=44)
Other Products
(n=27)
32
10 7 16
36
45
5 4 5
40
35
10 4 13
38
6 4 10
40 40
36
16 12
12
23
All (n=5003)
North (n=2142)
East (n=803)
West (n=1013)
South (n=1045)

© COPYRIGHT 2014 85
7.8 NUMBER OF FLOORS
All Figs in % All Respondents
States
• Karnataka, MP and Kerala have over 60% cold stores which have ground floor only. • AP, Bihar, Gujarat, Jharkhand and Punjab have higher percentage of cold storages with more
than 4 floors.
All (n=5003)
Maharashtra (n=451)
UP (n=1371)
A & N (n=10)
AP (n=600)
Assam (n=22)
Bihar (n=169)
Chandigarh (n=3)
Ground floor only 32 37 44 100 29 9 8 33
Ground plus one floor 10 22 11 - 2 - 1 -
Three Floors 7 21 2 - 4 23 6 -
Four Floors 16 13 5 - 5 36 17 33
More than Four Floors 36 7 39 - 61 32 69 33
All (n=5003)
C’garh (n=76)
Delhi (n=35)
Goa (n=7)
Gujarat (n=399)
Haryana (n=185)
HP (n=14)
J & K (n=16)
Ground floor only 32 5 20 71 24 22 79 50
Ground plus one floor 10 16 34 29 11 7 7 6
Three Floors 7 37 6 - 5 11 7 19
Four Floors 16 21 11 - 16 28 - 6
More than Four Floors 36 21 29 - 45 32 7 19
All (n=5003)
Jharkhand (n=19)
Karnataka (n=188)
Kerala (n=143)
MP (n=156)
Nagaland (n=1)
Orissa (n=38)
Pondicherry (n=2)
Punjab (n=402)
Ground floor only 32 - 64 80 62 - 39 100 12
Ground plus one floor 10 - 9 18 12 100 11 - 3
Three Floors 7 5 5 - 5 - 8 - 5
Four Floors 16 26 3 1 4 - 24 - 36
More than Four Floors 36 68 19 1 17 - 18 - 45
All (n=5003)
Rajasthan (n=104)
Sikkim (n=5)
TN (n=102)
Tripura (n=9)
Uttaranchal (n=12)
WB (n=464)
North East (n=37)
Ground floor only 32 23 60 44 - 92 2 14
Ground plus one floor 10 28 40 6 22 8 3 14
Three Floors 7 13 - 10 33 - 6 22
Four Floors 16 15 - 20 33 - 54 30
More than Four Floors 36 20 - 21 11 - 36 22

© COPYRIGHT 2014 86
7.9 STORAGE PLATFORM SYSTEM
All Figs in % All Respondents
Wooden mezzanine platform
RCC Levels
Steel mezzanine platform
Metal Racking system
Bins stacking system
DK/CS
78
19
10
3
3
2
52
22
19
4
4
4
84
16
9
2
2
1
48
39
18
9
6
5
47
34
19
10
5
8
59
34
23
14
7
5
52
33
11
6
3
4
93
7
9
1
1
1
82
22
3
2
3
3
71
28
18
5
6
3
• Across all type of storages, mezzanine platforms are extremely common. • Among mezzanine platforms, wooden mezzanine platforms are popular.
• Across all zones, majority of storages have mezzanine platforms.
Zone wise
All (n=5003)
Type H (n=4333)
Type P (n=523)
Type M (n=452)
Type Q (n=44)
Other Products
(n=27)
North (n=2142)
East (n=803)
West (n=1013)
South (n=1045)
Wooden mezzanine platform
RCC Levels
Steel mezzanine platform
Metal Racking system
Bins stacking system
DK/CS
78
19
10
3
3
2
All (n=5003)

© COPYRIGHT 2014 87
7.9 STORAGE PLATFORM SYSTEM
All Figs in % All Respondents
States
All (n=5003)
Maharashtra (n=451)
UP (n=1371)
A & N (n=10)
AP (n=600)
Assam (n=22)
Bihar (n=169)
Chandigarh (n=3)
Wooden mezzanine platform
78 57 97 50 66 86 63 33
RCC Levels 19 45 7 10 20 27 60 -
Steel mezzanine platform 10 16 1 20 8 5 5 33
Metal Racking system 3 8 0 - 5 9 1 -
Bins stacking system 3 11 1 - 2 9 6 -
Others 2 4 0 20 5 - - 33
All (n=5003)
C’garh (n=76)
Delhi (n=35)
Goa (n=7)
Gujarat (n=399)
Haryana (n=185)
HP (n=14)
J & K (n=16)
Wooden mezzanine platform
78 42 94 29 78 89 57 69
RCC Levels 19 53 9 100 17 5 21 19
Steel mezzanine platform 10 9 6 - 25 21 21 31
Metal Racking system 3 - - - 3 1 - -
Bins stacking system 3 1 3 - 2 3 - -
Others 2 4 3 - 3 1 - -
• Across states mezzanine platforms are extensively constructed for stacking purposes.

© COPYRIGHT 2014 88
7.9 STORAGE PLATFORM SYSTEM
All Figs in % All Respondents
States
All (n=5003)
Jharkhand (n=19)
Karnataka (n=188)
Kerala (n=143)
MP (n=156)
Nagaland (n=1)
Orissa (n=38)
Pondicherry (n=2)
Punjab (n=402)
Wooden mezzanine platform
78 74 35 37 94 100 74 - 80
RCC Levels 19 16 51 45 3 - 13 100 8
Steel mezzanine platform
10 5 19 12 10 - 8 - 32
Metal Racking system 3 5 9 8 1 - 21 - 3
Bins stacking system 3 16 7 - 1 - 3 - 2
Others 2 - 1 8 1 - - - 1
• Across states mezzanine platforms are extensively constructed for stacking purposes.
All (n=5003)
Rajasthan (n=104)
Sikkim (n=5)
TN (n=102)
Tripura (n=9)
Uttaranchal (n=12)
WB (n=464)
North East (n=37)
Wooden mezzanine platform
78 92 40 25 100 92 97 84
RCC Levels 19 4 - 62 - - 5 16
Steel mezzanine platform
10 13 20 11 - 8 1 5
Metal Racking system 3 2 - 5 - - 2 5
Bins stacking system 3 1 - 2 22 - 2 11
Others 2 1 40 - 11 - 4 8

© COPYRIGHT 2014 89
7.10 CARGO STORING UNIT
All Figs in % All Respondents
Gunny Bags
CFD Boxes
Plastic Crates
Wooden Boxes
Any Bulk storage
69
20
16
11
5
44
67
44
30
7
77
15
13
11
5
40
37
43
25
8
21
74
35
15
3
48
70
34
32
5
69
20
16
11
5
44
29
27
7
10
85
10
8
9
1
82
15
11
16
4
50
37
28
16
9
• Zone wise, all zones use gunny bags for storing the products, West and South zones also use CFD boxes and plastic crates.
Zone wise
Gunny Bags
CFD Boxes
Plastic Crates
Wooden Boxes
Any Bulk storage
• 3 out of 4 Type H CS’s use gunny bags for storing cargo. • Type M and Q use more of CFD boxes for storing • Plastic crates are highly used in Type P.
All (n=5003)
Type H (n=4333)
Type P (n=523)
Type M (n=452)
Type Q (n=44)
Other Products
(n=27)
All (n=5003)
North (n=2142)
East (n=803)
West (n=1013)
South (n=1045)

© COPYRIGHT 2014 90
7.10 CARGO STORING UNIT
All Figs in % All Respondents
States
• While gunny bags are predominantly used in all states plastic crates are used more in Rajasthan Karnataka, Maharashtra, HP, J&K and Gujarat compared to other states.
All (n=5003)
Maharashtra (n=451)
UP (n=1371)
A & N (n=10)
AP (n=600)
Assam (n=22)
Bihar (n=169)
Chandigarh (n=3)
Gunny Bags 69 22 92 - 64 68 78 100
CFD Boxes 20 53 3 30 11 41 14 33
Plastic Crates 16 39 3 70 20 23 12 67
Wooden Boxes 11 23 6 - 8 27 27 -
Any Bulk storage 5 17 1 - 16 5 5 -
All (n=5003)
C’garh (n=76)
Delhi (n=35)
Goa (n=7)
Gujarat (n=399)
Haryana (n=185)
HP (n=14)
J & K (n=16)
Gunny Bags 69 61 29 14 66 61 21 63
CFD Boxes 20 29 66 43 30 28 36 56
Plastic Crates 16 9 29 86 21 16 43 44
Wooden Boxes 11 11 29 14 14 15 14 44
Any Bulk storage 5 3 6 - 3 2 7 6
All (n=5003)
Jharkhand (n=19)
Karnataka (n=188)
Kerala (n=143)
MP (n=156)
Nagaland (n=1)
Orissa (n=38)
Pondicherry (n=2)
Punjab (n=402)
Gunny Bags 69 74 31 4 96 100 45 - 80
CFD Boxes 20 11 24 92 9 - 45 - 11
Plastic Crates 16 21 60 12 8 - 21 100 10
Wooden Boxes 11 32 12 3 3 100 21 - 9
Any Bulk storage 5 11 6 1 1 - 3 - 2
All (n=5003)
Rajasthan (n=104)
Sikkim (n=5)
TN (n=102)
Tripura (n=9)
Uttaranchal (n=12)
WB (n=464)
North East (n=37)
Gunny Bags 69 83 40 17 78 75 92 68
CFD Boxes 20 38 20 57 - - 9 27
Plastic Crates 16 31 80 25 33 17 8 32
Wooden Boxes 11 20 40 3 22 17 10 30
Any Bulk storage 5 2 - 2 11 - 4 5

© COPYRIGHT 2014 91 All Figs in %
Mezzanine System
7.11 STORAGE LEVELS
Zone Wise
1-5
6-10
DK/CS
35
57
9
65
23
12
31
61
8
52
41
7
62
21
16
54
39
7
• 2/3rds of the Type H cold stores have 6-10 levels in their mezzanine systems with an average of 5.9 levels.
• 1 out of every 2 Type P & Q storages have 1-5 levels in the mezzanine systems. • Over 60% of Type M cold stores too have 1-5 levels in the mezzanine platforms.
35
57
9
57
25
19
19
79
2
35
55
10
48
40
12
• Nearly 80% of the storages in the Northern region have 6-10 levels in their platforms. • In the Southern zone there are 57% cold stores with 1-5 levels in the mezzanine platforms.
All (n=4807)
Type H (n=4230)
Type P (n=467)
Type M (n=397)
Type Q (n=41)
Other Products
(n=26)
North (n=2115)
East (n=781)
West (n=962)
South (n=949)
1-5
6-10
DK/CS
All (n=4807)
CS’s that have mezzanine floors

© COPYRIGHT 2014 92
7.11 STORAGE LEVELS
All Figs in %
States
All (n=4807)
Maharashtra (n=419)
UP (n=1364)
A & N (n=8)
AP (n=546)
Assam (n=21)
Bihar (n=163)
Chandigarh (n=2)
1-5 35 57 16 - 42 33 28 50
6-10 57 28 82 13 32 48 67 50
DK/CS 9 15 2 88 26 19 5 -
M E A N 5.7 4.3 6.3 10.0 5.0 5.9 6.4 7.0
All (n=4807)
C’garh (n=72)
Delhi (n=33)
Goa (n=7)
Gujarat (n=383)
Haryana (n=179)
HP (n=14)
J & K (n=16)
1-5 35 26 36 14 41 11 57 63
6-10 57 65 58 71 45 87 43 38
DK/CS 9 8 6 14 14 2 - -
M E A N 5.7 6.0 6.2 7.0 5.4 6.8 5.1 4.4
• Over 80% storages in UP and Haryana have 6-10 levels per platform.
All (n=4807)
Jharkhand (n=17)
Karnataka (n=172)
Kerala (n=125)
MP (n=153)
Nagaland (n=1)
Orissa (n=34)
Pondicherry (n=2)
Punjab (n=392)
1-5 35 6 78 83 42 - 53 - 17
6-10 57 71 13 10 56 - 41 100 81
DK/CS 9 24 8 7 2 100 6 - 2
M E A N 5.7 7.7 2.7 2.3 5.4 - 4.5 6.0 7.4
All (n=4807)
Rajasthan (n=103)
Sikkim (n=3)
TN (n=96)
Tripura (n=9)
Uttaranchal (n=12)
WB (n=461)
North East
(n=34)
1-5 35 52 33 72 22 25 40 29
6-10 57 47 67 24 56 75 49 50
DK/CS 9 1 - 4 22 - 11 21
M E A N 5.7 5.2 5.7 4.5 5.9 6.7 5.7 5.9
CS’s that have mezzanine floors

© COPYRIGHT 2014 93
7.12 STORAGE LEVELS
All Figs in %
Racking System
Zone Wise
1-5
6-10
DK/CS
55
33
13
0
0
0
56
34
10
51
37
12
54
29
17
80
0
20
• Rack system is adopted only 128 CSs. • Over half of the Type H cold stores have 1-5 levels and 1/3rd of them have between 6-10 levels in
their racking systems.
55
33
13
67
19
15
19
81
0
64
27
9
51
34
15
• 67% cold stores in the Southern zone have 1-5 levels in their racking systems. • Even in East and West 1-5 level is used in the racking system • In contrast in North zone, 81% of CSs have 6-10 levels of storage in rack system
All (n=128)
Type H (n=73)
Type P (n=41)
Type M (n=35)
Type Q (n=5)
Other Products
(n=-)
All (n=128)
North (n=16 )
East (n=11)
West (n=47)
South (n=54)
1-5
6-10
DK/CS
CS’s that have mezzanine floors

© COPYRIGHT 2014 94
7.12 STORAGE LEVELS
All Figs in %
States
CS’s that have mezzanine floors
• Low bases.
All (n=128)
Maharashtra (n=36)
UP (n=3)
A & N (n=-)
AP (n=26)
Assam (n=1)
Bihar (n=1)
Chandigarh (n=-)
1-5 55 56 33 - 58 - 100 -
6-10 33 28 67 - 31 - - -
DK/CS 13 17 - - 12 100 - -
M E A N 4.4 3.9 5.7 - 4.4 - 4.0 -
All (n=128)
C’garh (n=-)
Delhi (n=-)
Goa (n=-)
Gujarat (n=10)
Haryana (n=1)
HP (n=-)
J & K (n=-)
1-5 55 - - - 40 - - -
6-10 33 - - - 50 100 - -
DK/CS 13 - - - 10 - - -
M E A N 4.1 - - - 5.7 6.0 - -
All (n=128)
Jharkhand (n=1)
Karnataka (n=12)
Kerala (n=11)
MP (n=1)
Nagaland (n=-)
Orissa (n=4)
Pondicherry (n= -)
Punjab (n=10)
1-5 55 - 67 82 - - 75 - 10
6-10 33 100 8 9 100 - 25 - 90
DK/CS 13 - 25 9 - - - - -
M E A N 4.1 6.0 2.4 2.7 9.0 - 3.3 - 7.4
All (n=128)
Rajasthan (n=2)
Sikkim (n=-)
TN (n=5)
Tripura (n=-)
Uttaranchal (n=-)
WB (n=4)
North East
(n=1)
1-5 55 50 - 80 - - 75 -
6-10 33 50 - - - - 25 -
DK/CS 13 - - 20 - - - 100
M E A N 4.1 4.5 - 2.5 - - 5.3 -

© COPYRIGHT 2014 95
7.13 CHAMBER INSULATION - TYPES
All Figs in %
• At all India level 77% of chambers have add-on panel insulation using thermacol/EPS/XPS. The trend is same by type of products stored.
• Nearly 50% of Type M use sandwich panels as well • Fillers are more common in H type product storage compared to others
80
11
16
2
5
1
77
28
5
6
2
1
57
47
2
2
3
1
68
25
9
14
5
5
56
26
11
15
4
15
All (n=5003)
Type H (n=4333)
Type P (n=523)
Type M (n=452)
Type Q (n=44)
Other Products
(n=27)
Add on slabs (Tharmocol, EPS, XPS)
Sandwich PUF Panels
Filler (Husk/Raw/Rock wool/Cork)
Brick & mortar
Others (specify)
DK/CS
77
15
14
3
4
1
CS’s that have mentioned any chamber

© COPYRIGHT 2014 96
7.13 CHAMBER INSULATION - TYPES
All Figs in %
Zone Wise
• Zone wise analysis shows that East zone used more of add-on panel insulation compared to others.
• Though North also uses add-on panel in most cases, the usage of fillers for insulation is higher compared to other zones
• Nearly 30% in West and South use sandwich PUF panels.
North (n=2142)
East (n=803)
West (n=1013)
South (n=1045)
Add on slabs (Tharmocol, EPS, XPS)
Sandwich PUF Panels
Filler (Husk/Raw/Rock wool/Cork)
Brick & mortar
Others (specify)
DK/CS
77
15
14
3
4
1
75
6
30
1
7
0
93
5
6
3
3
1
74
28
3
2
1
1
74
31
0
6
2
2
All (n=5003)
CS’s that have mentioned any chamber

© COPYRIGHT 2014 97
7.13 CHAMBER INSULATION - TYPES
All Figs in %
States
All (n=5003)
Maharashtra (n=451)
UP (n=1371)
A & N (n=10)
AP (n=600)
Assam (n=22)
Bihar (n=169)
Chandigarh (n=3)
Add on slabs (Thermocol, EPS, XPS)
77 71 70 90 83 95 91 67
Sandwich PUF Panels 15 33 4 30 20 9 3 33
Filler (Husk/Raw/Rock wool/Cork)
14 4 42 - 0 14 4 -
Brick & mortar 3 4 0 - 2 18 5 -
Others (specify) 4 2 9 - 2 5 4 -
Don’t know 1 2 0 - 1 - 1 -
All (n=5003)
C’garh (n=76)
Delhi (n=35)
Goa (n=7)
Gujarat (n=399)
Haryana (n=185)
HP (n=14)
J & K (n=16)
Add on slabs (Thermocol, EPS, XPS)
77 88 77 29 73 64 64 56
Sandwich PUF Panels 15 14 34 71 30 13 21 19
Filler (Husk/Raw/Rock wool/Cork)
14 11 3 - 1 26 - 31
Brick & mortar 3 4 6 - 2 2 - -
Others (specify) 4 3 9 - - 7 21 6
Don’t know 1 - - - 1 1 - -
• There is a quite variation across states. • UP, Haryana and HP, though add-on insulation is more prevalent, fillers are also used in a
considerable number of chambers. • In Delhi, PUF is used next after add-on insulation • In AP mainly add-on insulation is used
CS’s that have mentioned any chamber
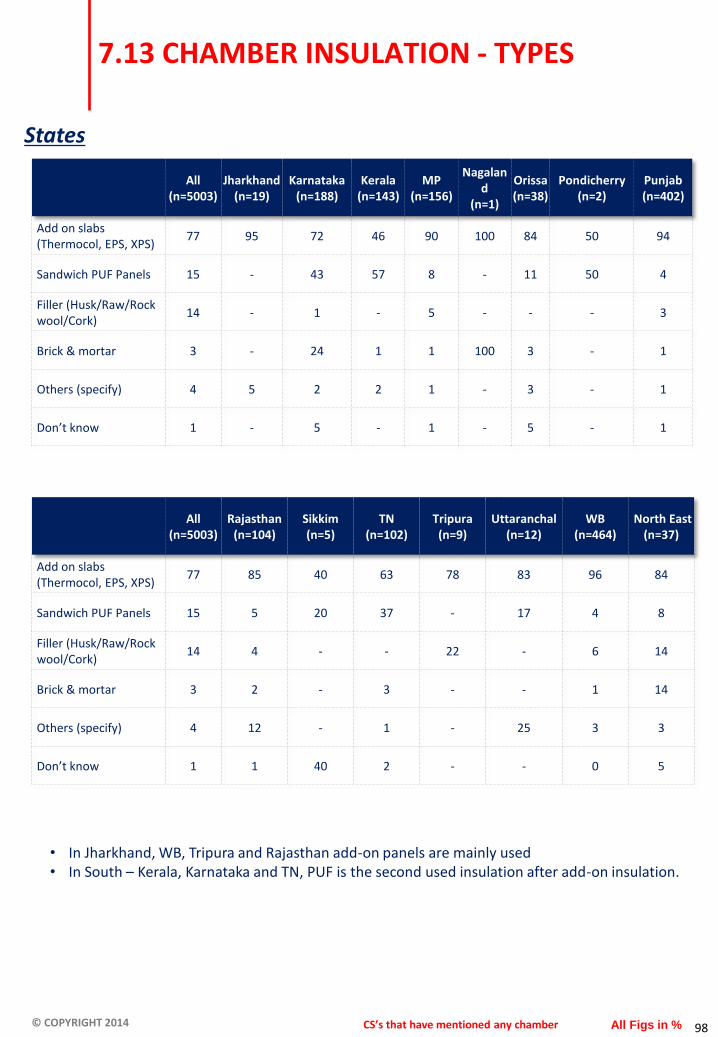
© COPYRIGHT 2014 98
7.13 CHAMBER INSULATION - TYPES
All Figs in %
States
• In Jharkhand, WB, Tripura and Rajasthan add-on panels are mainly used • In South – Kerala, Karnataka and TN, PUF is the second used insulation after add-on insulation.
All (n=5003)
Jharkhand (n=19)
Karnataka (n=188)
Kerala (n=143)
MP (n=156)
Nagaland
(n=1)
Orissa (n=38)
Pondicherry (n=2)
Punjab (n=402)
Add on slabs (Thermocol, EPS, XPS)
77 95 72 46 90 100 84 50 94
Sandwich PUF Panels 15 - 43 57 8 - 11 50 4
Filler (Husk/Raw/Rock wool/Cork)
14 - 1 - 5 - - - 3
Brick & mortar 3 - 24 1 1 100 3 - 1
Others (specify) 4 5 2 2 1 - 3 - 1
Don’t know 1 - 5 - 1 - 5 - 1
All (n=5003)
Rajasthan (n=104)
Sikkim (n=5)
TN (n=102)
Tripura (n=9)
Uttaranchal (n=12)
WB (n=464)
North East (n=37)
Add on slabs (Thermocol, EPS, XPS)
77 85 40 63 78 83 96 84
Sandwich PUF Panels 15 5 20 37 - 17 4 8
Filler (Husk/Raw/Rock wool/Cork)
14 4 - - 22 - 6 14
Brick & mortar 3 2 - 3 - - 1 14
Others (specify) 4 12 - 1 - 25 3 3
Don’t know 1 1 40 2 - - 0 5
CS’s that have mentioned any chamber
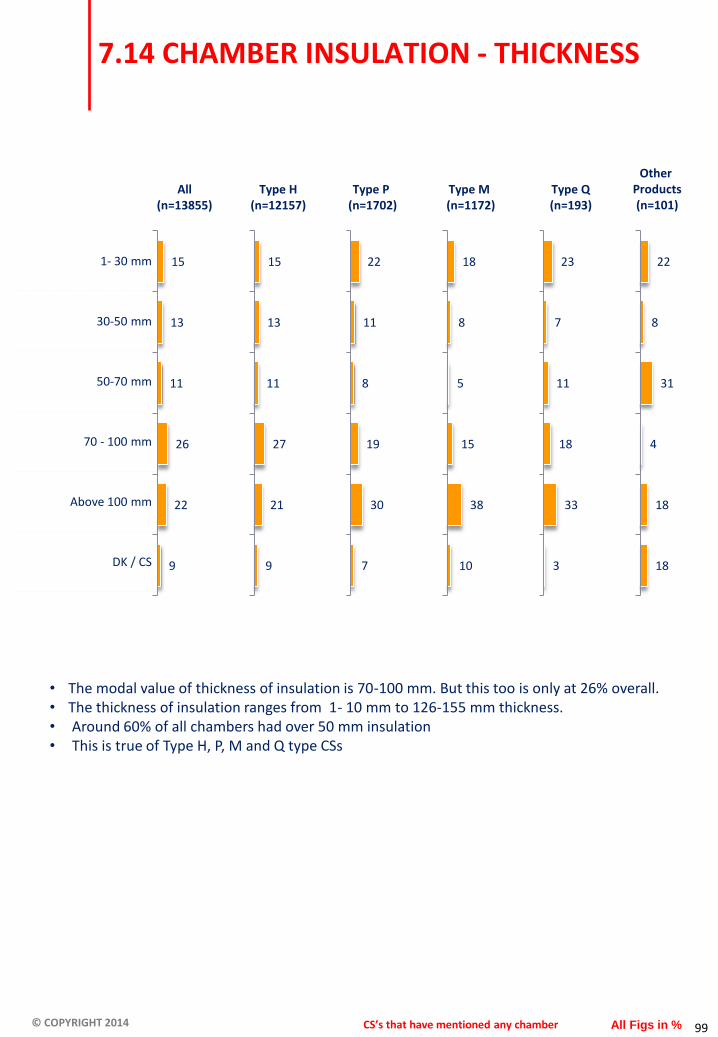
© COPYRIGHT 2014 99
7.14 CHAMBER INSULATION - THICKNESS
All Figs in %
• The modal value of thickness of insulation is 70-100 mm. But this too is only at 26% overall. • The thickness of insulation ranges from 1- 10 mm to 126-155 mm thickness. • Around 60% of all chambers had over 50 mm insulation • This is true of Type H, P, M and Q type CSs
1- 30 mm
30-50 mm
50-70 mm
70 - 100 mm
Above 100 mm
DK / CS
15
13
11
26
22
9
15
13
11
27
21
9
22
11
8
19
30
7
18
8
5
15
38
10
23
7
11
18
33
3
22
8
31
4
18
18
All (n=13855)
Type H (n=12157)
Type P (n=1702)
Type M (n=1172)
Type Q (n=193)
Other Products (n=101)
CS’s that have mentioned any chamber

© COPYRIGHT 2014 100
7.14 CHAMBER INSULATION - THICKNESS
All Figs in %
Zone Wise
• Analysis by zone, reveal that 70% of chambers in West had over 50 mm thickness in insulation followed by South with 60% and East with 55%.
• In North this percentage drops to 53%
15
13
11
26
22
9
14
14
11
19
23
11
20
16
9
28
18
7
12
10
10
35
26
6
20
10
13
27
20
8
1- 30 mm
30-50 mm
50-70 mm
70 - 100 mm
Above 100 mm
DK / CS
North (n=5646)
East (n=2230)
West (n=3444)
South (n=2535)
All (n=13855)
CS’s that have mentioned any chamber

© COPYRIGHT 2014 101
7.14 CHAMBER INSULATION - THICKNESS
All Figs in %
States
All (n=13855)
Maharashtra (n=1783)
UP (n=3542)
A & N (n=17)
AP (n=1477)
Assam (n=72)
Bihar (n=454)
Chandigarh (n=9)
1- 30 mm 15 17 17 24 15 51 30 0
30-50 mm 13 13 18 12 10 8 14 78
50-70 mm 11 11 13 24 17 22 5 -
70 - 100 mm 26 32 14 24 24 7 22 -
Above 100 mm 22 19 18 12 25 6 17 22
DK / CS 9 6 9 6 7 6 9 -
All (n=13855)
C’garh (n=213)
Delhi (n=131)
Goa (n=14)
Gujarat (n=1237)
Haryana (n=493)
HP (n=26)
J & K (n=43)
1- 30 mm 15 11 3 7 3 9 0 26
30-50 mm 13 8 2 0 6 7 0 0
50-70 mm 11 2 2 21 7 8 4 2
70 - 100 mm 26 26 31 - 37 32 35 47
Above 100 mm 22 39 57 71 40 18 8 21
DK / CS 9 8 5 - 4 6 54 5
• There are variations across states on thickness of insulation. • Delhi, Uttaranchal, Goa and Gujarat had over 80% of chambers having over 50 mm insulation
compared to other states • Sikkim (0%), Tripura(0%), Nagaland(0%) and Kerala (18%) has the least percentages of
chambers which was having higher than 50 mm insulation.
CS’s that have mentioned any chamber

© COPYRIGHT 2014 102
7.14 CHAMBER INSULATION - THICKNESS
All Figs in % CS’s that have mentioned any chamber
States
All (n=13855)
Jharkhand (n=82)
Karnataka (n=416)
Kerala (n=268)
MP (n=410)
Nagaland (n=2)
Orissa (n=85)
Pondicherry (n=6)
Punjab (n=1082)
1- 30 mm 15 63 23 45 11 100 41 17 9
30-50 mm 13 5 17 7 11 0 14 0 8
50-70 mm 11 - 8 2 13 - - 83 8
70 - 100 mm 26 29 40 9 40 - 4 - 29
Above 100 mm 22 0 5 9 11 0 34 0 24
DK / CS 9 1 7 19 10 - 6 - 22
All (n=13855)
Rajasthan (n=287)
Sikkim (n=12)
TN (n=351)
Tripura (n=30)
Uttaranchal (n=33)
WB (n=1280)
North East (n=116)
1- 30 mm 15 9 75 17 47 0 11 53
30-50 mm 13 3 0 1 7 0 19 7
50-70 mm 11 1 - 9 - 21 13 14
70 - 100 mm 26 6 - 34 - 58 35 4
Above 100 mm 22 75 0 24 10 18 16 6
DK / CS 9 6 25 8 13 - 6 9

© COPYRIGHT 2014 103
7.15 FACILITY ACCESS GATE
All Figs in % All respondents
Number of Main Access Gate
1
2
3
More than 3
DK/CS
58
36
4
2
0
52
37
4
7
0
57
37
4
2
0
62
29
3
5
0
61
33
3
3
0
55
36
2
7
0
58
36
4
2
0
76
20
2
3
0
52
44
3
1
0
43
49
7
2
0
64
27
5
4
0
• Majority number of CS’s have 1 access gate.
• A little over 1/3rd CSs across all types have 2 access gates.
• Every alternate CS in the Eastern zone have 2 access gates. • 3 out of 4 CS’s in South only have 1 access gate.
Zone wise
1
2
3
More than 3
DK/CS
All (n=5003)
Type H (n=4333)
Type P (n=523)
Type M (n=452)
Type Q (n=44)
Other Products
(n=27)
North (n=2142)
East (n=803)
West (n=1013)
South (n=1045)
All (n=5003)

© COPYRIGHT 2014 104
7.15 FACILITY ACCESS GATE
All Figs in % All respondents
States
• Over 80% CS’s in AP have only 1 access gate. • Karnataka has an average of 2.3 access gates, which is the highest across states.
All (n=5003)
Maharashtra (n=451)
UP (n=1371)
A & N (n=10)
AP (n=600)
Assam (n=22)
Bihar (n=169)
Chandigarh (n=3)
1 58 60 43 80 82 68 52 67
2 36 33 52 - 16 32 41 33
3 4 5 4 - 1 - 5 -
More than 3 2 2 1 0 2 0 2 0
DK/CS 0 - 0 20 - - 1 -
M E A N 1.6 1.5 1.6 1.0 1.4 1.3 2.1 1.3
All (n=5003)
C’garh (n=76)
Delhi (n=35)
Goa (n=7)
Gujarat (n=399)
Haryana (n=185)
HP (n=14)
J & K (n=16)
1 58 87 26 71 61 59 71 100
2 36 12 54 29 26 37 29 -
3 4 1 9 - 7 1 - -
More than 3 2 0 11 0 7 3 0 0
DK/CS 0 - - - - - - -
M E A N 1.6 1.1 2.2 1.3 1.7 1.6 1.3 1.0

© COPYRIGHT 2014 105
7.15 FACILITY ACCESS GATE
All Figs in % All respondents
States
• Around 60% cold stores in Uttaranchal and WB have 2 access gates.
All (n=5003)
Jharkhand (n=19)
Karnataka (n=188)
Kerala (n=143)
MP (n=156)
Nagaland (n=1)
Orissa (n=38)
Pondicherry (n=2)
Punjab (n=402)
1 58 68 51 76 84 - 66 50 78
2 36 32 38 22 13 100 32 - 19
3 4 - 3 2 - - - - 2
More than 3 2 0 8 1 3 0 0 50 1
DK/CS 0 - - - - - 3 - -
M E A N 1.6 1.3 2.3 1.3 1.2 2.0 1.3 2.5 1.5
All (n=5003)
Rajasthan (n=104)
Sikkim (n=5)
TN (n=102)
Tripura (n=9)
Uttaranchal (n=12)
WB (n=464)
North East (n=37)
1 58 44 60 89 78 33 27 68
2 36 50 20 9 22 58 61 30
3 4 5 - - - 8 10 -
More than 3 2 1 20 2 0 0 2 3
DK/CS 0 - - - - - - -
M E A N 1.6 1.6 3.8 1.6 1.2 1.8 2.0 1.7

© COPYRIGHT 2014 106
7.16 TRUCK PARKING SPACE
All Figs in %
All (n=5003)
North (n=2142)
East (n=803)
West (n=1013)
South (n=1045)
5 4 4 4 8
95 96 96 96 92 Yes
No
All Respondents
• Across zones cold stores have parking spaces which is essential for loading and unloading purposes.
Truck Parking Space
• Almost all type of CS’s have parking spaces available for trucks.
Zone wise
All (n=5003)
Type H (n=4333)
Type P (n=523)
Type M (n=452)
Type Q (n=44)
other products (n=27)
5 4 5 5 5 15
95 96 95 95 95 85 Yes
No

© COPYRIGHT 2014 107
7.16 TRUCK PARKING SPACE
All Figs in % All Respondents
States
• Across states, most cold stores have parking spaces available.
All (n=5003)
Maharashtra (n=451)
UP (n=1371)
A & N (n=10)
AP (n=600)
Assam (n=22)
Bihar (n=169)
Chandigarh (n=3)
Yes 95 95 98 80 91 95 96 100
No 5 5 2 20 9 5 4 -
All (n=5003)
C’garh (n=76)
Delhi (n=35)
Goa (n=7)
Gujarat (n=399)
Haryana (n=185)
HP (n=14)
J & K (n=16)
Yes 95 99 83 100 96 92 93 94
No 5 1 17 - 4 8 7 6
All (n=5003)
Jharkhand (n=19)
Karnataka (n=188)
Kerala (n=143)
MP (n=156)
Nagaland (n=1)
Orissa (n=38)
Pondicherry (n=2)
Punjab (n=402)
Yes 95 89 93 97 99 100 95 50 93
No 5 11 7 3 1 - 5 50 7
All (n=5003)
Rajasthan (n=104)
Sikkim (n=5)
TN (n=102)
Tripura (n=9)
Uttaranchal (n=12)
WB (n=464)
North East (n=37)
Yes 95 94 80 98 78 83 97 89
No 5 6 20 2 22 17 3 11

© COPYRIGHT 2014 108
7.17 NUMBER OF TRUCKS PARKED
All Figs in %
1-5
6-10
11-15
16-20
21-25
Above 25
All (n=4773)
Type H (n=4147)
Type P (n=499)
Type M (n=430)
Type Q (n=42)
Other Products
(n=23)
20
24
11
13
6
25
13
26
9
13
4
26
16
23
11
14
6
28
27
27
11
11
4
19
44
27
10
8
3
7
19
31
0
12
2
36
All (n=4773)
North (n=2061)
East (n=773)
West (n=973)
South (n=966)
20
24
11
13
6
25
39
25
11
11
2
11
12
24
11
15
7
30
11
17
10
14
8
40
24
28
12
12
5
18
• Type H & Q cold stores comparatively can accommodate more number of trucks. • Almost 70% of Type M cold stores have parking space for 1-10 trucks.
• Northern and Eastern zone CS’s have comparatively higher parking space available for more number of trucks with East zone having the highest average of 28 trucks.
Zone wise
1-5
6-10
11-15
16-20
21-25
Above 25
CS’s that have parking space

© COPYRIGHT 2014 109
7.17 NUMBER OF TRUCKS PARKED
All Figs in %
States
All (n=4773)
Maharashtra (n=429)
UP (n=1350)
A & N (n=8)
AP (n=544)
Assam (n=21)
Bihar (n=162)
Chandigarh (n=3)
1-5 20 28 6 63 28 24 17 67
6-10 24 32 18 38 28 14 24 0
11-15 11 13 10 - 13 10 10 -
16-20 13 10 16 - 14 14 15 -
21-25 6 4 8 - 2 5 6 33
Above 25 25 14 39 0 13 33 28 0
M E A N 21.9 15.9 30.1 5.1 15.2 21.2 21.5 11.7
• Of the CSs providing parking space, UP, Chhattisgarh MP and WB have wide parking spaces. • UP, Chattisgarh, MP and WB have parking space for around 30 trucks on an average
All (n=4773)
C’garh (n=75)
Delhi (n=29)
Goa (n=7)
Gujarat (n=382)
Haryana (n=170)
HP (n=13)
J & K (n=15)
1-5 20 13 38 57 26 35 23 33
6-10 24 17 28 43 27 36 31 27
11-15 11 7 17 - 13 9 15 7
16-20 13 9 - - 13 9 8 13
21-25 6 9 3 - 7 3 - -
Above 25 25 43 14 0 13 7 23 20
M E A N 21.9 31.0 15.1 5.3 15.7 11.4 30.3 18.1
CS’s that have parking space

© COPYRIGHT 2014 110
7.17 NUMBER OF TRUCKS PARKED (CONT’D)
All Figs in %
States
All (n=4773)
Jharkhand (n=17)
Karnataka (n=174)
Kerala (n=139)
MP (n=155)
Nagaland (n=1)
Orissa (n=36)
Pondicherry (n=1)
Punjab (n=373)
1-5 20 18 60 65 7 0 36 0 14
6-10 24 47 14 20 17 0 28 100 33
11-15 11 - 7 9 12 - 17 - 14
16-20 13 18 8 2 12 100 14 - 15
21-25 6 - 1 1 6 - 3 - 8
Above 25 25 18 8 1 44 0 3 0 17
M E A N 21.9 23.8 10.2 5.9 32.4 20.0 10.4 10.0 17.8
All (n=4773)
Rajasthan (n=98)
Sikkim (n=4)
TN (n=100)
Tripura (n=7)
Uttaranchal (n=10)
WB (n=450)
North East (n=33)
1-5 20 23 50 19 29 0 6 27
6-10 24 39 0 28 14 30 12 12
11-15 11 9 50 16 - 30 10 12
16-20 13 10 - 15 - 10 14 12
21-25 6 5 - 5 29 - 9 9
Above 25 25 13 0 17 29 30 48 27
M E A N 21.9 15.9 8.8 18.2 17.9 27.2 32.3 18.9
CS’s that have parking space

© COPYRIGHT 2014 111
Covered Uncovered Both
7.18 TYPE OF PARKING SPACE
All Figs in %
21
67
12 21
67
12 25
64
11 16
70
14 33
38
29
26
52
22
• Almost 2 out of every 3 Type H, P & M CS’s have uncovered parking spaces.
• Western zone has highest proportion of CS’s with uncovered parking spaces. • 28% CS’s in the East have both covered and uncovered parking spaces.
Zone wise
21
67
12 26
65
9 6
65 28
16
75
9 25
67
8
Covered Uncovered Both
All (n=4773)
Type H (n=4147)
Type P (n=499)
Type M (n=430)
Type Q (n=42)
Other Products
(n=23)
North (n=2061)
East (n=773)
West (n=973)
South (n=966)
All (n=4773)
CS’s that have parking space

© COPYRIGHT 2014 112
7.18 TYPE OF PARKING SPACE
All Figs in % CS’s that have parking space
States
• Across states, majority CS’s have uncovered parking spaces. Punjab has the highest - 45% - cold stores have covered parking spaces.
All (n=4773)
Maharashtra (n=429)
UP (n=1350)
A & N (n=8)
AP (n=544)
Assam (n=21)
Bihar (n=162)
Chandigarh (n=3)
Covered 21 13 23 13 24 24 14 -
Uncovered 67 80 74 63 67 52 57 100
Both 12 7 3 25 9 24 30 -
All (n=4773)
C’garh (n=75)
Delhi (n=29)
Goa (n=7)
Gujarat (n=382)
Haryana (n=170)
HP (n=13)
J & K (n=15)
Covered 21 7 28 14 24 19 23 7
Uncovered 67 87 41 86 61 69 54 80
Both 12 7 31 - 15 12 23 13
All (n=4773)
Jharkhand (n=17)
Karnataka (n=174)
Kerala (n=139)
MP (n=155)
Nagaland (n=1)
Orissa (n=36)
Pondicherry (n=1)
Punjab (n=373)
Covered 21 18 42 11 4 - 6 - 45
Uncovered 67 71 57 86 94 - 83 - 28
Both 12 12 1 3 3 100 11 100 27
All (n=4773)
Rajasthan (n=98)
Sikkim (n=4)
TN (n=100)
Tripura (n=7)
Uttaranchal (n=10)
WB (n=450)
North East (n=33)
Covered 21 13 - 19 - 90 3 15
Uncovered 67 80 75 58 86 10 63 61
Both 12 7 25 23 14 - 34 24

© COPYRIGHT 2014 113
54
33
14
74 17
10 35
48
17 61
22
17 45
40
15
54
33
14 50
25
25 44
43
14 33
41
27 74 13
12 33
17 50
7.19 TRANSPORTATION SERVICE AND SOURCE
All Figs in %
OWN OR OUTSOURCE REEFER TRUCKS
• Over two thirds of available trucks in the South and East Zone are owned. • In the Northern zone close to 50% trucks available are outsourced.
All (n=224)
Type H (n=117)
Type P (n=49)
Type M (n=90)
Type Q (n=6)
Other Products
(n=4)
• Only 224 CSs provided trucking service using reefer trucks • Out of the trucks available in the CSs, over 50% are owned. • Ownership proportion is high Type M CS’s – 74%
Zone wise
All (n=224)
North (n=46)
East (n=18)
West (n=88)
South (n=72)
Owned Outsourced Both
Owned Outsourced Both
CS’s that provide Reefer truck services

© COPYRIGHT 2014 114
7.19 TRANSPORTATION SERVICE AND SOURCE
All Figs in %
OWN OR OUTSOURCE REEFER TRUCKS
All (n=224)
Maharashtra (n=43)
UP (n=2)
A & N (n=-)
AP (n=12)
Assam (n=-)
Bihar (n=-)
Chandigarh (n=-)
Owned 54 44 100 - 50 - - -
Outsourced 33 37 - - 25 - - -
Both 14 19 - - 25 - - -
All (n=224)
C’garh (n=6)
Delhi (n=6)
Goa (n=-)
Gujarat (n=44)
Haryana (n=5)
HP (n=1)
J & K (n=2)
Owned 54 17 50 - 45 40 100 50
Outsourced 33 50 33 - 43 60 - 50
Both 14 33 17 - 11 - - -
All (n=224)
Jharkhand (n=-)
Karnataka (n=21)
Kerala (n=29)
MP (n=1)
Nagaland (n=-)
Orissa (n=5)
Pondicherry (n=-)
Punjab (n=26)
Owned 54 - 67 90 100 - 60 - 23
Outsourced 33 - 24 10 - - 20 - 58
Both 14 - 10 - - - 20 - 19
• Majority trucks in Gujarat & Punjab are outsourced. • Every alternate CS in Maharashtra own trucks. • Ownership percentage is highest in Kerala – 90% - among those providing reeefer truck facility
All (n=224)
Rajasthan (n=4)
Sikkim (n=-)
TN (n=10)
Tripura (n=-)
Uttaranchal (n=-)
WB (n=7)
North East (n=-)
Owned 54 25 - 70 - - 100 -
Outsourced 33 25 - 10 - - - -
Both 14 50 - 20 - - - -
CS’s that provide Reefer truck services

© COPYRIGHT 2014 115
7.19 TRANSPORTATION SERVICE AND SOURCE
All Figs in % CS’s that provide Reefer truck services
NUMBER OF REEFER TRUCKS OWNED
All (n=151)
Maharashtra (n=27)
UP (n=2)
A & N (n=-)
AP (n=9)
Assam (n=-)
Bihar (n=-)
Chandigarh (n=-)
Mean no. of Reefer trucks owned
5.5 6.7 1.5 - 3.0 - - -
All (n=151)
C’garh (n=3)
Delhi (n=4)
Goa (n=-)
Gujarat (n=25)
Haryana (n=2)
HP (n=1)
J & K (n=1)
Mean no. of Reefer trucks owned
5.5 2.0 3.3 - 9.3 3.0 1.0 5.0
All (n=151)
Jharkhand (n=-)
Karnataka (n=16)
Kerala (n=26)
MP (n=1)
Nagaland (n=-)
Orissa (n=4)
Pondicherry (n=-)
Punjab (n=11)
Mean no. of Reefer trucks owned
5.5 - 3.8 2.3 1.0 - 1.3 - 8.4
All (n=151)
Rajasthan (n=3)
Sikkim (n=-)
TN (n=9)
Tripura (n=-)
Uttaranchal (n=-)
WB (n=7)
North East (n=-)
Mean no. of Reefer trucks owned
5.5 1.0 - 9.9 - - 7.9 -
All (n=151)
Type H (n=67)
Type P (n=29)
Type M (n=78)
Type Q (n=5)
Type O (n=3)
Mean no. of Reefer trucks owned 5.5 5.7 5.9 5.3 12.0 3.0
All (n=151)
North (n=24)
East (n=14)
West (n=53)
South (n=60)
Mean no. of Reefer trucks owned 5.5 5.0 4.7 7.9 3.9

© COPYRIGHT 2014 116
7.20 TRANSPORTATION SERVICE AND SOURCE
All Figs in % All Respondents
ORDINARY TRANSPORT SERVICE PROVIDED
44
56
All (n=5003)
Type H (n=4333)
Type P (n=523)
Type M (n=452)
Type Q (n=44)
Other Products
(n=27)
• Only 21% provide ordinary trucking service. • Over 80% of Type H cold stores have no ordinary trucks available in the facility. • Every alternate Type M CS provide ordinary trucks for transport.
• Less number of CSs provide truck facility in North, East and South zones. • In West alone ordinary trucks are used by 50% of CS facilities
Zone wise
All (n=5003)
North (n=2142)
East (n=803)
West (n=1013)
South (n=1045)
21
79
16
84
Yes No
34
66
58 42
23
77
29
71
21
79
7
93
11
89
50
50
Yes No

© COPYRIGHT 2014 117
7.20 TRANSPORTATION SERVICE AND SOURCE
All Figs in % All Respondents
ORDINARY TRANSPORT SERVICE PROVIDED
All (n=5003)
Maharashtra (n=451)
UP (n=1371)
A & N (n=10)
AP (n=600)
Assam (n=22)
Bihar (n=169)
Chandigarh (n=3)
Yes 21 35 4 30 9 32 7 -
No 79 65 96 70 91 68 93 100
All (n=5003)
C’garh (n=76)
Delhi (n=35)
Goa (n=7)
Gujarat (n=399)
Haryana (n=185)
HP (n=14)
J & K (n=16)
Yes 21 12 14 57 82 11 36 25
No 79 88 86 43 18 89 64 75
All (n=5003)
Jharkhand (n=19)
Karnataka (n=188)
Kerala (n=143)
MP (n=156)
Nagaland (n=1)
Orissa (n=38)
Pondicherry (n=2)
Punjab (n=402)
Yes 21 - 57 64 6 100 37 50 7
No 79 100 43 36 94 - 63 50 93
• Over 80% of CS’s in Gujarat provide ordinary trucks for transportation of products.
All (n=5003)
Rajasthan (n=104)
Sikkim (n=5)
TN (n=102)
Tripura (n=9)
Uttaranchal (n=12)
WB (n=464)
North East (n=37)
Yes 21 19 40 51 - 8 9 27
No 79 81 60 49 100 92 91 73

© COPYRIGHT 2014 118
52
32
15 50
17
33
43
39
18 46
37
17
81
12 7
80 20
52
32
15 56
34
10
74 10
16
70 8
22 41
42
17
7.20 TRANSPORTATION SERVICE AND SOURCE
All Figs in %
OWN OR OUTSOURCE ORDINARY TRUCKS
• Over 80% of CSs (including ‘both’) in the North and East Zone own their own trucks. • In the Western zone close to 40% CSs outsource trucks for transportation
All (n=1040)
Type H (n=673)
Type P (n=178)
Type M (n=263)
Type Q (n=10)
Other Products
(n=12)
• Overall 1040 provided ordinary truck transportation. • Out of the trucks available in the CSs, over 84% (including ‘both’)own the asset base. • Ownership proportion is high in Type M CS’s – 89% (including ‘both’)
Zone wise
All (n=1040)
North (n=144)
East (n=87)
West (n=502)
South (n=307)
Owned Outsourced Both
Owned Outsourced Both
CS’s that provide transportation services

© COPYRIGHT 2014 119
7.20 TRANSPORTATION SERVICE AND SOURCE
All Figs in % CS’s that provide transportation services
OWN OR OUTSOURCE ORDINARY TRUCKS
All (n=1040)
Maharashtra (n=159)
UP (n=58)
A & N (n=3)
AP (n=52)
Assam (n=7)
Bihar (n=11)
Chandigarh (n=0)
Owned 52 58 69 - 60 57 82 -
Outsourced 32 33 9 33 25 - 9 -
Both 15 8 22 67 15 43 9 -
All (n=1040)
C’garh (n=9)
Delhi (n=5)
Goa (n=4)
Gujarat (n=329)
Haryana (n=21)
HP (n=5)
J & K (n=4)
Owned 52 78 60 75 30 76 100 25
Outsourced 32 11 - - 48 19 - 25
Both 15 11 40 25 22 5 - 50
All (n=1040)
Jharkhand (n=0)
Karnataka (n=107)
Kerala (n=92)
MP (n=10)
Nagaland (n=1)
Orissa (n=14)
Pondicherry (n=1)
Punjab (n=30)
Owned 52 - 24 88 100 - 43 - 80
Outsourced 32 - 75 10 - - 14 - 7
Both 15 - 1 2 - 100 43 100 13
• Majority of CSs in Gujarat and Karnataka outsource trucks. • Over 60% (including ‘both’) CS in Maharashtra provide own trucks for transportation. • Truck Ownership percentage is extremely high in Kerala – 88% among those providing trucking
service
All (n=1040)
Rajasthan (n=20)
Sikkim (n=2)
TN (n=52)
Tripura (n=0)
Uttaranchal (n=1)
WB (n=43)
North East (n=10)
Owned 52 80 50 67 - 100 79 50
Outsourced 32 15 - 2 - - 7 -
Both 15 5 50 31 - - 14 50

© COPYRIGHT 2014
CHAPTER 8
CATCHEMENT AREA NEAR FACILITY & PRODUCT TYPE
STORED
Page no 120 to 154

© COPYRIGHT 2014 121
8. CATCHMENT AREA NEAR FACILITY AND PRODUCT TYPE STORED
Farm gate cold storages which are most common in India. 3,414 cold storages stock raw potatoes. Likewise the storages stocking potatoes have the highest installed capacity. Close to 700 cold storages store spices. As compared to all the horticulture products, capacity utilization is highest among storages stocking spices.
When it comes to processed food stocking cold storages, butter is widely stocked. As compared to all the zones, cold storages based in the East are less likely to store butter and close to 50% of them store processed potatoes.
Seafood is stocked by over 70% of the Type M cold storages. Almost 90% of Type M cold storages in South stock sea food.
More than 75% of cold storages are located in states of Andhra Pradesh, Gujarat, UP, Punjab & West Bengal.

© COPYRIGHT 2014 122
8. CATCHMENT AREA AROUND THE FACILITY
68% of the CSs stock horticulture products and are categorized as Farm gates due to their location near producing locations
There are other Type H scold stores near mandis, perishable cargo centers, part of network of cold stores etc. Type H actually account for 86% of cold stores in the country
Analysis of capacity utilisation of products stocked shows that the CSs generally have enough clientele to stock the products. Overall average capacity utilisation is 75% which shows that the CS’s catchment area is sustainable
68 1
7
8
8 2 1 5
Farmgate
Pharma stand alone
Animal Husbandry Stand alone
Proccessed food stand alone
Dedicated to Mandi
PCC - Port based infrastructure
Part of Network of Cold Stores
Dedicated to other IndustrialFacility for own use

© COPYRIGHT 2014 123
Products stocked
by farm gate
Horticulture
No. of CSs
stocking
Total Installed
Capacity (Tons)
Mean of installed
storage capacity
(tons)
% of average
capacity used
Apple 496 15,86,212 3,198 71
Banana 309 3,46,513 1,121 63
Cabbage 67 2,44,948 3,656 68
Carrot 132 4,60,039 3,485 74
Cauliflower 54 2,27,311 4,209 70
Flowers 101 4,66,420 4,618 71
Grapes 451 11,55,295 2,562 72
Guava 60 2,06,150 3,436 68
Kiwi 76 1,95,564 2,573 70
Litchi 80 2,16,182 2,702 73
Mango 141 2,88,839 2,049 73
Onion 92 2,66,708 2,899 71
Oranges 332 12,24,637 3,689 70
Peas 104 2,87,771 2,767 76
Pineapple 54 1,51,794 2,811 66
Potato (raw) 2,690 1,45,39,420 5,405 77
Pomegranate 85 2,50,940 2,952 78
Spices 711 25,22,482 3,548 81
Pulses 323 12,44,154 3,852 76
Seeds 280 10,62,340 3,794 75
Others 239 8,74,836 3,731 80
Total 3,874 1,75,55,168 4,532 76
8. DETAILS OF HORTICULTURE/ AGRICULTURE BASED PRODUCTS – STORAGE CAPACITY AND CAPACITY UTILIZATION
• In every product category, be it apple, potatoes or other fruits and vegetables, the capacity utilization is around 70%. The overall average is 76%
• More than 2500 cold storages stock raw potatoes. The capacity utilization is 77% • Capacity utilization is the highest among cold storages stocking spices – 81%. • This analysis shows that the cold stores have enough business to sustain and grow
ALL UNIT IN MT

© COPYRIGHT 2014 124
Products stocked
by Processed
Food CS’s
No. of CSs
stocking
Total Installed
Capacity (Tons)
Mean of installed
storage capacity
(tons)
% of average
capacity used
Butter 133 3,62,690 2727 80
Cheese 80 2,34,404 2930 78
Chocolate 56 2,24,634 4011 74
Fruit Pulp 54 1,61,974 3000 68
Milk 116 1,64,147 1415 79
Potato Processed 119 6,08,760 5116 66
Ready to eat food 49 1,33,274 2720 71
Wine 3 25,102 8367 40
Others 154 3,34,842 2174 84
Total 423 13,54,527 3,202 71
8. DETAILS OF PROCESSED FOOD BASED PRODUCTS
• In processed food storage, the overall capacity utilization is at 71% • Butter is the most common processed food stored. • Installed capacity of CS stocking processed potatoes is over 6 Lakhs. The capacity utilization is
at 66%. • Capacity utilization is the highest among cold storages stocking milk and butter.
ALL UNIT IN MT
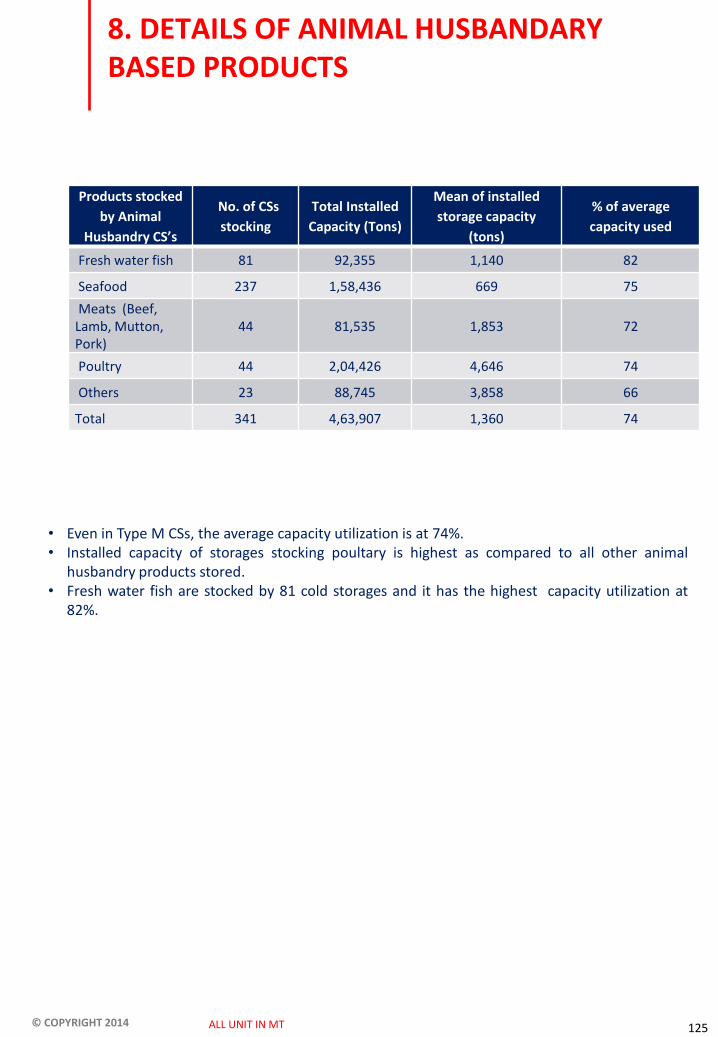
© COPYRIGHT 2014 125
Products stocked
by Animal
Husbandry CS’s
No. of CSs
stocking
Total Installed
Capacity (Tons)
Mean of installed
storage capacity
(tons)
% of average
capacity used
Fresh water fish 81 92,355 1,140 82
Seafood 237 1,58,436 669 75
Meats (Beef, Lamb, Mutton, Pork)
44 81,535 1,853 72
Poultry 44 2,04,426 4,646 74
Others 23 88,745 3,858 66
Total 341 4,63,907 1,360 74
8. DETAILS OF ANIMAL HUSBANDARY BASED PRODUCTS
• Even in Type M CSs, the average capacity utilization is at 74%. • Installed capacity of storages stocking poultary is highest as compared to all other animal
husbandry products stored. • Fresh water fish are stocked by 81 cold storages and it has the highest capacity utilization at
82%.
ALL UNIT IN MT

© COPYRIGHT 2014 126
Products stocked by
Pharmaceutical CS’s
No. of CSs
stocking
Total Installed
Capacity
Mean of installed
storage capacity
Mean of average
capacity used
Medicine 14 97,257 6,947 63
Vaccine 23 1,21,152 5,267 70
Active product ingredient
3 10,000 3,333 54
Others 3 10,447 3,482 80
Total 31 1,58,810 5,123 69
8. DETAILS OF PHARMACEUTICAL BASED PRODUCTS
• Pharma CSs – Type Q - have a capacity utilization of 69%. • Maximum number of Type Q cold storages store vaccines. It’s installed capacity is over 1 Lakh
MT.
ALL UNIT IN MT

© COPYRIGHT 2014 127
8.1 FUNCTIONALITY OF COLD STORAGE – PERCENTAGE DISTRIBUTION OF CSS
All Figs in % All Respondents
• 85% CS’s in HP and UP operate as Farmgate for horticultural products
States
All (n=5003)
Maharashtra (n=451)
UP (n=1371)
A & N (n=10)
AP (n=600)
Assam (n=22)
Bihar (n=169)
Chandigarh (n=3)
Farmgate - Horticulture 68 63 85 10 70 59 80 67
Proccessed food stand alone 8
21 4 - 8 5 14 33
Dedicated to Mandi 8 11 5 60 4 41 41 33
Animal Husbandry Stand alone 7
12 1 40 5 - 5 33
Dedicated to other Industrial Facility for own use 5
2 1 - 2 14 - -
Port based infrastructure 2 10 - - 1 9 - -
Part of Network of Cold Stores 1
3 - - 1 5 - -
Pharma stand alone 1 2 - - 0 - 1 -
Dedicated to Pack House - 1 - - 1 9 - -
All (n=5003)
C’garh (n=76)
Delhi (n=35)
Goa (n=7)
Gujarat (n=399)
Haryana (n=185)
HP (n=14)
J & K (n=16)
Farmgate - Horticulture 68 43 80 29 47 62 85 25
Proccessed food stand alone 8
21 26 43 8 4 14 6
Dedicated to Mandi 8 7 17 - 4 4 7 19
Animal Husbandry Stand alone 7
4 6 57 18 2 - -
Dedicated to other Industrial Facility for own use 5
5 9 - 16 1 7 -
Port based infrastructure 2 - - - 7 - - -
Part of Network of Cold Stores 1
5 6 - 1 1 7 -
Pharma stand alone 1 7 6 - 0 1 7 6
Dedicated to Pack House - 1 - - 1 - - -

© COPYRIGHT 2014 128
8.1 FUNCTIONALITY OF COLD STORAGE (CONT’D)
All Figs in % All Respondents
• Punjab and Rajasthan have vast majority of their CSs which are horticulture based. • Kerala has very high proportion of CS that are animal husbandry based.
States
All (n=5003)
Jharkhand (n=19)
Karnataka (n=188)
Kerala (n=143)
MP (n=156)
Nagaland (n=1)
Orissa (n=38)
Pondicherry (n=2)
Punjab (n=402)
Farmgate - Horticulture 68 37 53 6 54 100 50 72
Proccessed food stand alone
8 32 23 10 6 100 5 - 2
Dedicated to Mandi 8 32 7 1 1 - 18 - 4
Animal Husbandry Stand alone
7 5 5 74 1 - 24 - -
Dedicated to other Industrial Facility for own use
5 - 2 2 45 - 3 100 -
Port based infrastructure
2 - 1 3 - 5 - -
Part of Network of Cold Stores
1 - 3 7 1 - - - 1
Pharma stand alone 1 - 1 - 1 - 3 - -
Dedicated to Pack House
- - 1 2 - - 5 - -
All (n=5003)
Rajasthan (n=104)
Sikkim (n=5)
TN (n=102)
Tripura (n=9)
Uttaranchal (n=12)
WB (n=464)
North East (n=37)
Farmgate - Horticulture 68 67 60 55 44 75 76 57
Proccessed food stand alone
8 6 - 14 - 17 4 5
Dedicated to Mandi 8 30 - 4 44 - 14 35
Animal Husbandry Stand alone
7 3 - 5 - - 4 -
Dedicated to other Industrial Facility for own use
5 1 - 35 11 - 4 11
Port based infrastructure
2 - - 3 - - 0 8
Part of Network of Cold Stores
1 1 - 4 - - 3 3
Pharma stand alone 1 - - 3 - - 1 -
Dedicated to Pack House
- - - 1 - - 0 5

© COPYRIGHT 2014 129
8.2 TYPE OF HORTICULTURE / AGRICULTURE PRODUCTS STORED
All Figs in %
• Over two third of the Type H storages stock potatoes. • Of the 4333 Type H stores, 254 cold stores stock Type P, 97 stores stock Type M products and
37 stores stock Type Q products. The additional columns reveal what these cold stores stock in horticultural products
Potato (raw)
Spices
Apple
Grapes
Oranges
Banana
Pulses
Seeds
Mango
Carrot
Flowers
Peas
Onion
Pomegranate
Litchi
Kiwi
Cabbage
Guava
Pineapple
Cauliflower
Other
All (n=4333)
Type H (n=4333)
Type P (n=254)
Type M (n=97)
Type Q (n=37)
Other Products
(n=10)
69
19
14
12
9
9
9
8
4
4
3
3
3
2
2
2
2
2
2
2
7
CS’s that mentioned stocking Horticulture/ Agriculture products
69
19
14
12
9
9
9
8
4
4
3
3
3
2
2
2
2
2
2
2
7
56
38
58
43
47
19
25
29
20
24
20
18
19
13
15
14
11
10
11
13
11
59
28
54
42
41
19
23
28
16
33
26
22
26
9
15
11
14
18
13
14
16
51
59
59
57
46
19
46
43
32
30
41
35
22
16
24
24
27
19
22
16
5
60
60
90
60
70
40
40
40
40
20
20
30
40
20
20
30
20
20
20
20
0

© COPYRIGHT 2014 130
8.2 TYPE OF HORTICULTURE / AGRICULTURE PRODUCTS STORED
All Figs in %
Zone Wise
• Over 90% CS’s in North and East particularly stock potatoes. • In South Type H cold stores mainly store spices. • In West, in addition to potatoes, grapes are also stocked
CS’s that mentioned stocking Horticulture/ Agriculture products
69
19
14
12
9
9
9
8
4
4
3
3
3
2
2
2
2
2
2
2
7
90
8
11
5
7
4
4
5
2
1
1
2
1
1
1
1
1
1
1
1
2
89
11
17
12
14
2
5
8
4
7
9
2
2
1
2
1
3
2
2
2
7
51
19
20
36
11
12
12
12
10
11
6
7
8
8
7
7
4
6
4
4
13
6
58
13
8
8
26
23
12
6
3
2
3
2
3
2
2
3
1
3
2
12
All (n=4333)
North (n=2079)
East (n=757)
West (n=764)
South (n=733)
Potato (raw)
Spices
Apple
Grapes
Oranges
Banana
Pulses
Seeds
Mango
Carrot
Flowers
Peas
Onion
Pomegranate
Litchi
Kiwi
Cabbage
Guava
Pineapple
Cauliflower
Other

© COPYRIGHT 2014 131
8.2 TYPE OF HORTICULTURE / AGRICULTURE PRODUCTS STORED
All Figs in %
• UP and Bihar have close to 100% CS’s which stock potatoes. • Over 70% of the cold stores in Maharashtra stock grapes. • Over 60% stock spices in AP
States
All (n=4333)
Maharashtra (n=341)
UP (n=1352)
A & N (n=2)
AP (n=532)
Assam (n=20)
Bihar (n=153)
Chandigarh (n=3)
Potato (raw) 69 16 98 - 1 90 96 67
Spices 19 24 2 50 63 5 1 -
Apple 14 27 6 100 7 60 30 -
Grapes 12 70 4 100 2 - 24 -
Oranges 9 14 5 50 4 15 27 -
Banana 9 17 1 - 23 5 1 -
Pulses 9 17 0 - 20 - - -
Seeds 8 16 1 - 9 - 1 -
Mango 4 16 1 - 4 5 3 -
Carrot 4 11 1 100 1 - 5 -
Flowers 3 10 1 50 0 10 10 -
Peas 3 12 1 50 1 5 3 33
Onion 3 11 0 - 1 5 1 -
Pomegranate 2 16 0 50 1 - 2 -
Litchi 2 11 1 50 1 - 3 -
Kiwi 2 11 0 - 1 5 - -
Cabbage 2 7 0 100 0 - 1 -
Guava 2 12 - - 0 5 1 -
Pineapple 2 6 0 100 0 - 3 -
Cauliflower 2 7 0 100 0 - 2 -
Other 7 10 1 0 12 0 1 33
CS’s that mentioned stocking Horticulture/ Agriculture products

© COPYRIGHT 2014 132
8.2 TYPE OF HORTICULTURE / AGRICULTURE PRODUCTS STORED
All Figs in %
States
• Almost 3/4ths of the cold stores in Gujarat store potatoes. • Storages in Haryana mainly stock potatoes followed by apples. • Storages in HP and J&K mainly stock apples • Over 80% CS’s in Chhattisgarh store spices.
CS’s that mentioned stocking Horticulture/ Agriculture products
All (n=4333)
C’garh (n=71)
Delhi (n=29)
Goa (n=2)
Gujarat (n=273)
Haryana (n=183)
HP (n=12)
J & K (n=9)
Potato (raw) 69 51 14 50 75 63 42 22
Spices 19 83 45 - 15 22 8 33
Apple 14 17 55 100 12 34 58 67
Grapes 12 18 24 50 7 10 8 33
Oranges 9 17 31 50 8 20 17 56
Banana 9 4 21 50 7 16 17 22
Pulses 9 45 21 - 6 13 - 33
Seeds 8 52 21 - 5 14 - 22
Mango 4 11 14 50 5 4 - 11
Carrot 4 1 14 50 5 2 - 11
Flowers 3 11 7 - 2 1 - -
Peas 3 1 17 - 6 6 8 11
Onion 3 7 10 50 9 4 - -
Pomegranate 2 - 21 - 3 2 - -
Litchi 2 4 7 - 5 2 - 22
Kiwi 2 1 21 - 5 3 - 11
Cabbage 2 1 10 - 2 1 - -
Guava 2 4 10 - 2 2 - 11
Pineapple 2 - 10 - 3 1 - 11
Cauliflower 2 3 7 50 2 1 - -
Other 7 25 17 0 12 4 0 33

© COPYRIGHT 2014 133
8.2 TYPE OF HORTICULTURE / AGRICULTURE PRODUCTS STORED
All Figs in %
States
• Cold stores in Punjab, Orissa, Jharkhand and MP largely store potatoes. However when it comes to Karnataka Bananas followed by spices are the main Horticulture / Agriculture products stored.
CS’s that mentioned stocking Horticulture/ Agriculture products
All (n=4333)
Jharkhand (n=19)
Karnataka (n=124)
Kerala (n=10)
MP (n=148)
Nagaland (n=1)
Orissa (n=24)
Pondicherry (n=1)
Punjab (n=382)
Potato (raw) 69 95 16 40 87 100 75 - 97
Spices 19 5 35 40 15 - 38 - 2
Apple 14 42 23 30 16 100 38 100 8
Grapes 12 37 21 40 13 - 42 - 3
Oranges 9 42 11 40 10 100 46 - 3
Banana 9 - 44 30 7 - 13 - 3
Pulses 9 - 16 40 9 - 8 100 2
Seeds 8 5 22 30 14 100 13 - 2
Mango 4 - 9 40 3 100 25 100 2
Carrot 4 21 6 60 19 - 13 100 1
Flowers 3 21 2 20 1 - 21 100 1
Peas 3 5 2 40 - - 8 - 1
Onion 3 - 2 60 1 - 4 - 2
Pomegranate 2 5 10 10 - - 4 - 1
Litchi 2 - 2 20 1 - 4 - 1
Kiwi 2 - 2 20 1 100 4 - 0
Cabbage 2 - 5 40 2 - 25 100 1
Guava 2 - 3 20 1 - - - 1
Pineapple 2 5 5 50 - 100 4 100 1
Cauliflower 2 16 4 30 3 - 8 100 1
Other 7 42 8 0 22 0 13 0 1

© COPYRIGHT 2014 134
8.2 TYPE OF HORTICULTURE / AGRICULTURE PRODUCTS STORED
All Figs in %
States
• WB and Uttaranchal mainly store potatoes. • Cold stores in Rajasthan mainly store spices followed by pulses and seeds.
CS’s that mentioned stocking Horticulture/ Agriculture products
All (n=4333)
Rajasthan (n=97)
Sikkim (n=5)
TN (n=64)
Tripura (n=9)
Uttaranchal
(n=12)
WB (n=455)
North East (n=35)
Potato (raw) 69 39 20 28 89 83 94 80
Spices 19 64 - 59 11 25 2 6
Apple 14 16 - 39 - 67 9 37
Grapes 12 5 - 23 - 50 6 -
Oranges 9 15 - 27 - 58 6 11
Banana 9 6 - 19 - 8 2 3
Pulses 9 40 - 55 - - 1 -
Seeds 8 40 - 13 - 50 4 3
Mango 4 6 - 13 - 17 2 6
Carrot 4 2 - 8 - - 9 -
Flowers 3 1 40 13 - - 6 11
Peas 3 1 - 16 - - 2 3
Onion 3 1 - 3 - 8 1 3
Pomegranate 2 - - 3 - - 1 -
Litchi 2 1 - 9 - 8 2 -
Kiwi 2 2 - 8 - 8 1 6
Cabbage 2 1 - 8 - - 4 -
Guava 2 3 - 2 - 8 2 3
Pineapple 2 - - 6 - 8 2 3
Cauliflower 2 - - 3 - - 2 -
Other 7 4 40 22 0 0 4 6

© COPYRIGHT 2014 135
8.2 TYPE OF HORTICULTURE / AGRICULTURE PRODUCTS STORED
All Figs in %
Ownership Type
CS’s that mentioned stocking Horticulture/ Agriculture products
Proprietorship (n=1178)
Partnership (n=1508)
Company Public Ltd.
(n=134)
Company Private Ltd.
(n=1358)
Association Public (n=3)
Potato (raw) 62 76 64 69 67
Spices 16 17 20 24 -
Apple 14 12 34 14 67
Grapes 16 10 22 10 67
Oranges 9 8 17 10 33
Banana 16 7 14 3 -
Pulses 6 8 14 12 -
Seeds 6 7 19 10 -
Mango 5 3 14 3 -
Carrot 4 3 13 4 33
Flowers 2 3 12 3 33
Peas 2 3 10 3 33
Onion 2 3 7 2 33
Pomegranate 3 2 11 2 -
Litchi 2 2 11 3 -
Kiwi 2 2 14 2 -
Cabbage 2 2 8 1 -
Guava 1 2 13 2 33
Pineapple 2 2 6 1 33
Cauliflower 1 2 8 1 33
Other 7 5 5 7 -
• Potato is the major product stored across all type of CS irrespective of the ownership type.

© COPYRIGHT 2014 136
8.2 TYPE OF HORTICULTURE / AGRICULTURE PRODUCTS STORED
All Figs in % CS’s that mentioned stocking Horticulture/ Agriculture products
Association Private (n=10)
Cooperative (n=76)
Government (Co./Dept./PSU)
(n=45)
Not mentioned ownership type
(n=21)
Potato (raw) 30 68 51 43
Spices 50 4 13 10
Apple 10 8 29 14
Grapes 10 26 22 19
Oranges 10 7 16 10
Banana 10 7 16 19
Pulses 20 1 7 14
Seeds 20 1 7 10
Mango - 7 16 14
Carrot 10 4 16 10
Flowers - 4 20 10
Peas - - 4 5
Onion - 3 9 10
Pomegranate - 5 4 -
Litchi - - 4 5
Kiwi 10 - 4 5
Cabbage - 3 18 10
Guava - - 2 5
Pineapple - - 9 10
Cauliflower - 1 13 10
Other 30 3 16 29
Ownership Type
• Two thirds of the CS under co-operative ownership store raw potato. This is followed by grapes.
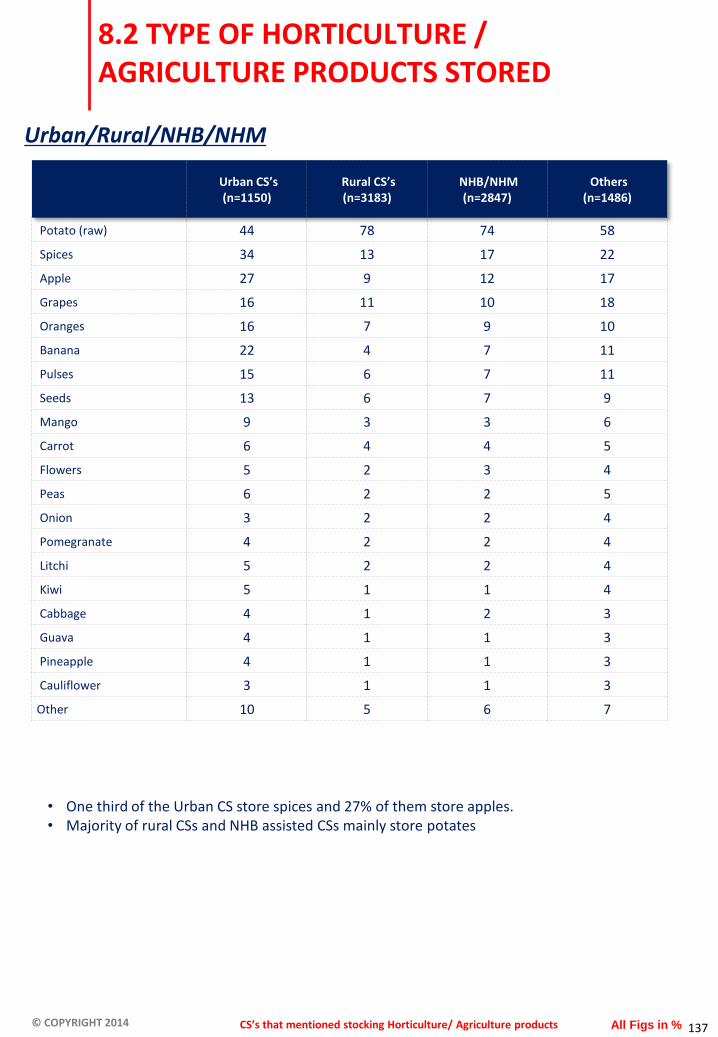
© COPYRIGHT 2014 137
8.2 TYPE OF HORTICULTURE / AGRICULTURE PRODUCTS STORED
All Figs in %
Urban/Rural/NHB/NHM
CS’s that mentioned stocking Horticulture/ Agriculture products
Urban CS’s (n=1150)
Rural CS’s (n=3183)
NHB/NHM (n=2847)
Others (n=1486)
Potato (raw) 44 78 74 58
Spices 34 13 17 22
Apple 27 9 12 17
Grapes 16 11 10 18
Oranges 16 7 9 10
Banana 22 4 7 11
Pulses 15 6 7 11
Seeds 13 6 7 9
Mango 9 3 3 6
Carrot 6 4 4 5
Flowers 5 2 3 4
Peas 6 2 2 5
Onion 3 2 2 4
Pomegranate 4 2 2 4
Litchi 5 2 2 4
Kiwi 5 1 1 4
Cabbage 4 1 2 3
Guava 4 1 1 3
Pineapple 4 1 1 3
Cauliflower 3 1 1 3
Other 10 5 6 7
• One third of the Urban CS store spices and 27% of them store apples. • Majority of rural CSs and NHB assisted CSs mainly store potates

© COPYRIGHT 2014 138
8.3 TYPE OF PROCESSED FOOD PRODUCTS STORED
All Figs in %
Butter
Milk
Potato Processed
Cheese
Fruit Pulp
Chocolate
Ready to eat / cook
Wine
Other
All (n=523)
Type H (n=254)
Type P (n=523)
Type M (n=46)
Type Q (n=24)
Other Products
(n=8)
32
28
27
19
13
13
12
1
37
63
25
38
38
25
38
0
0
13
37
13
35
24
17
17
13
1
35
32
28
27
19
13
13
12
1
37
59
20
30
52
17
39
35
0
33
75
29
38
79
38
67
33
8
33
Butter
Milk
Potato Processed
Cheese
Fruit Pulp
Chocolate
Ready to eat / cook
Wine
Other
All (n=523)
North (n=113)
East (n=81)
West (n=180)
South (n=149)
32
28
27
19
13
13
12
1
37
32
40
12
11
10
9
18
0
51
30
12
39
18
18
11
8
0
30
17
15
49
15
10
9
10
1
32
38
36
21
28
14
19
12
2
31
• 1 out of every 3 type P cold store stock butter. • Of the 523 cold stores stocking Type P products, 254 are stocking horticultural products, 46
stock Type M products and 24 stock Type Q products. These multi product stores’ stocking pattern of processed food is provided in the additional columns
• Type P cold stores in each of the zone largely store products which are distinct from one other. • Cold stores in North and East dominantly store processed potatoes, in West it is butter and
South it is Milk.
Zone wise
CS’s that mentioned stocking Processed Food products

© COPYRIGHT 2014 139
8.3 TYPE OF PROCESSED FOOD PRODUCTS STORED
All Figs in %
• Close to half CS’s in Maharashtra store butter. Whereas in Gujarat processed potatoes are the majorly stocked product.
States
All (n=523)
Maharashtra (n=122)
UP (n=56)
A & N (n=-)
AP (n=59)
Assam (n=2)
Bihar (n=25)
Chandigarh (n=1)
Butter 32 45 13 - 25 - 12 100
Milk 28 43 7 - 27 - - -
Potato Processed 27 16 43 - 7 100 88 100
Cheese 19 36 11 - 5 - 4 100
Fruit Pulp 13 17 13 - 10 50 4 -
Chocolate 13 26 4 - 2 - 4 100
Ready to eat / cook 12 15 7 - 10 - - -
Wine 1 2 - - - - - -
Other 37 30 29 0 61 0 0 100
All (n=523)
C’garh (n=18)
Delhi (n=10)
Goa (n=3)
Gujarat (n=43)
Haryana (n=8)
HP (n=3)
J & K (n=2)
Butter 32 11 70 - 23 25 67 -
Milk 28 17 10 - 21 13 67 50
Potato Processed 27 22 30 - 37 13 - 50
Cheese 19 6 50 - 12 13 33 -
Fruit Pulp 13 - 50 33 7 13 33 50
Chocolate 13 6 40 - 5 - 33 -
Ready to eat / cook 12 17 20 33 5 13 - 50
Wine 1 - - - - - - -
Other 37 72 30 33 28 75 33 50
CS’s that mentioned stocking Processed Food products

© COPYRIGHT 2014 140
8.3 TYPE OF PROCESSED FOOD PRODUCTS STORED
All Figs in %
States
• More than half CS’s in Karnataka and TN store milk.
All (n=523)
Jharkhand (n=7)
Karnataka (n=46)
Kerala (n=18)
MP (n=12)
Nagaland (n=1)
Orissa (n=2)
Pondicherry (n=1)
Punjab (n=16)
Butter 32 14 33 22 33 - 50 100 38
Milk 28 14 52 17 17 - 50 100 6
Potato Processed 27 71 9 28 17 - - - 50
Cheese 19 - 11 6 17 - 50 - 19
Fruit Pulp 13 14 11 6 - 100 - - 19
Chocolate 13 - 24 - - - 50 - 25
Ready to eat / cook 12 - 7 56 - - - - 6
Wine 1 - - - - - - - -
Other 37 14 65 22 50 100 100 0 25
All (n=523)
Rajasthan (n=15)
Sikkim (n=-)
TN (n=25)
Tripura (n=-)
Uttarancha
l (n=2)
WB (n=26)
North East (n=3)
Butter 32 47 - 52 - 100 27 -
Milk 28 27 - 60 - - 27 -
Potato Processed 27 40 - 20 - - 27 67
Cheese 19 13 - 32 - 50 35 -
Fruit Pulp 13 13 - 12 - - 15 67
Chocolate 13 - - 4 - - 15 -
Ready to eat / cook 12 - - 32 - - 19 -
Wine 1 - - - - - 4 -
Other 37 13 0 24 0 0 35 33
CS’s that mentioned stocking Processed Food products

© COPYRIGHT 2014 141
8.3 TYPE OF PROCESSED FOOD PRODUCTS STORED
All Figs in %
Urban CS’s (n=202)
Rural CS’s (n=321)
NHB/NHM (n=239)
Others (n=284)
Butter 38 27 27 36
Milk 31 27 18 37
Potato Processed 25 28 33 21
Cheese 19 19 18 20
Fruit Pulp 12 13 15 12
Chocolate 16 11 9 15
Ready to eat / cook 16 10 13 12
Wine 1 0 1 1
Other 39 35 35 38
Proprietorship
(n=111)
Partnership (n=126)
Company Public
Ltd. (n=37)
Company Private
Ltd. (n=157)
Association Public (n=1)
Association Private (n=2)
Cooperative
(n=53)
Govt. (Co./Dept.
/PSU) (n=30)
Not mentioned ownership
type (n=6)
Butter 30 18 46 31 100 - 47 50 50
Milk 19 14 22 20 100 - 85 83 -
Potato Processed
29 33 35 31 - - 2 - 50
Cheese 22 10 30 24 100 - 13 27 -
Fruit Pulp 17 13 14 15 100 - 2 7 -
Chocolate 12 9 22 15 100 - 15 7 -
Ready to eat / cook
13 14 19 13 100 - 2 10 17
Wine 1 1 3 1 - - - - -
Other 41 34 24 38 - 100 51 17 17
CS’s that mentioned stocking Processed Food products
Ownership Type/Urban/Rural/NHB/NHM
• Cold storages across different types of ownership majorly store Butter and Milk. However, majority of the CS in Partnership and Private Company ownership store processed Potatoes.

© COPYRIGHT 2014 142
8.3 TYPE OF PROCESSED FOOD PRODUCTS STORED (OTHERS PRODUCTS STORED)
All Figs in %
• When probed for other products stored in processed food, the respondents mentioned more items.
• Jaggery and Ice-cream are the main other type of processed food products that are stored in cold storages.
Ice-cream
Jaggery
Curd
Milk Products
Dry Fruits
Mango Pulp
Paneer
Frozen Food
Fruit juices
All (n=184)
Type H (n=87)
Type P (n=184 )
Type M (n=12)
Type Q (n=6)
Other Products
(n=1)
27
26
14
4
2
2
2
2
2
18
40
3
6
1
3
2
3
2
27
26
14
4
2
2
2
2
2
50
8
8
0
0
0
17
0
8
50
0
17
0
0
0
33
0
17
0
100
0
0
0
0
0
0
0
CS’s that mentioned stocking Processed Food products

© COPYRIGHT 2014 143
8.3 TYPE OF PROCESSED FOOD PRODUCTS STORED (OTHERS PRODUCTS STORED)
All Figs in %
Zone Wise
• Close to 50% CS’s in East store jaggery. • Around 30% of the cold stores in South stock ice-cream and/or curd. • CS’s in West dominantly store ice- cream.
CS’s that mentioned stocking Processed Food products
Ice-cream
Jaggery
Curd
Milk Products
Dry Fruits
Mango Pulp
Paneer
Frozen Food
Fruit juices
All (n=184)
North (n=33)
East (n=26)
West (n=51)
South (n=74)
27
26
14
4
2
2
2
2
2
12
42
3
9
3
0
0
3
3
8
50
4
8
0
0
0
0
4
41
10
4
6
6
4
4
2
2
30
20
28
0
0
3
3
3
0

© COPYRIGHT 2014 144
8.3 TYPE OF PROCESSED FOOD PRODUCTS STORED (OTHERS PRODUCTS STORED)
All Figs in %
• Low bases.
States
All (n=184)
Maharashtra (n=32)
UP (n=16)
A & N (n=-)
AP (n=34)
Assam (n=-)
Bihar (n=-)
Chandigarh (n=1)
Ice-cream 27 50 - - 26 - - 100
Jaggery 26 - 75 - 44 - - -
Curd 14 3 - - 9 - - -
Milk Products 4 6 6 - - - - -
Dry Fruits 2 6 - - - - - -
Mango Pulp 2 6 - - 3 - - -
Paneer 2 6 - - 3 - - -
Frozen Food 2 3 6 - - - - -
Fruit juices 2 3 - - - - - -
CS’s that mentioned stocking Processed Food products
All (n=184)
C’garh (n=13)
Delhi (n=3)
Goa (n=1)
Gujarat (n=12)
Haryana (n=5)
HP (n=1)
J & K (n=1)
Ice-cream 27 8 33 100 33 - - -
Jaggery 26 77 - - 42 40 - -
Curd 14 - - - 8 - - 100
Milk Products 4 8 - - 8 20 - -
Dry Fruits 2 - - - - 20 - -
Mango Pulp 2 - - - - - - -
Paneer 2 - - - - - - -
Frozen Food 2 - - - - - - -
Fruit juices 2 - - - - - 100 -

© COPYRIGHT 2014 145
8.3 TYPE OF PROCESSED FOOD PRODUCTS STORED (OTHERS PRODUCTS STORED)
All Figs in %
• Low bases.
States
All (n=184)
Jharkhand (n=1)
Karnataka (n=30)
Kerala (n=4)
MP (n=6)
Nagaland (n=1)
Orissa (n=2)
Pondicherry (n=-)
Punjab (n=4)
Ice-cream 27 - 33 25 - - - - 25
Jaggery 26 - - - - - 50 - -
Curd 14 - 53 - - - 50 - -
Milk Products 4 - - - - - - - 25
Dry Fruits 2 - - - 17 - - - -
Mango Pulp 2 - 3 - - - - - -
Paneer 2 - - - - - - - -
Frozen Food 2 - 7 - - - - - -
Fruit juices 2 100 - - - - - - -
All (n=184)
Rajasthan (n=2)
Sikkim (n=-)
TN (n=6)
Tripura (n=-)
Uttaranchal (n=-)
WB (n=9)
North East (n=-1)
Ice-cream 27 50 - 33 - - 11 -
Jaggery 26 - - - - - 22 -
Curd 14 - - 33 - - - -
Milk Products 4 - - - - - 11 -
Dry Fruits 2 - - - - - - -
Mango Pulp 2 - - - - - - -
Paneer 2 - - 17 - - - -
Frozen Food 2 - - - - - - -
Fruit juices 2 - - - - - - -
CS’s that mentioned stocking Processed Food products

© COPYRIGHT 2014 146
8.3 TYPE OF PROCESSED FOOD PRODUCTS STORED (OTHERS PRODUCTS STORED)
All Figs in %
Urban CS’s (n=76)
Rural CS’s (n=108)
NHB/NHM (n=83)
Others (n=101)
Ice-cream 37 19 17 35
Jaggery 11 36 36 17
Curd 26 5 4 22
Milk Products 4 5 7 2
Dry Fruits 3 2 2 2
Mango Pulp 1 3 2 2
Paneer - 4 1 3
Frozen Food 3 2 2 2
Fruit juices - 3 1 2
Proprietorship (n=43)
Partnership (n=42)
Company Public Ltd.
(n=6)
Company Private Ltd.
(n=59)
Association Private (n=2)
Cooperative (n=27)
Govt. (Co./Dept./
PSU) (n=4)
Not mentioned ownership
type (n=1)
Ice-cream 33 21 67 32 - 7 25 -
Jaggery 16 48 17 31 50 - - -
Curd 5 - 17 3 - 70 25 -
Milk Products
5 7 - - - 7 25 -
Dry Fruits - 7 - 2 - - - -
Mango Pulp - 2 - 5 - - - -
Paneer - - 33 2 - 4 - -
Frozen Food 5 2 - - - - - 100
Fruit juices 2 5 - - - - - -
CS’s that mentioned stocking Processed Food products
Ownership Type/Urban/Rural/NHB/NHM
• Among those CSs storing other products, over one third of the Urban CS store Ice- cream. Around the same proportion of Rural & NHB/NHM CS store Jaggery.

© COPYRIGHT 2014 147
8.4 TYPE OF ANIMAL HUSBANDRY FOOD STORED
All Figs in %
Seafood
Fresh water fish
Poultry
Meats (Beef, Lamb, Mutton, Pork)
Other
All (n=452)
Type H (n=97)
Type P (n=46)
Type M (n=452)
Type Q (n=12)
Other Products
(n=3)
71
24
14
11
6
100
67
33
67
0
20
18
55
24
25
39
28
59
35
7
71
24
14
11
6
50
50
58
50
8
Seafood
Fresh water fish
Poultry
Meats (Beef, Lamb, Mutton, Pork)
Other
All (n=452)
North (n=21)
East (n=57)
West (n=167)
South (n=207)
71
24
14
11
6
89
16
6
8
0
14
5
38
33
24
26
16
44
9
28
71
38
10
14
2
• Nearly 3/4ths of Type M CS’s store sea food. • Of the 452 stores stocking Type M products, 97 are storing horticultural products, 46 are
stocking type P products and 12 are stocking Type Q products. • What is being stocked by them in Type M product is given in additional columns
• Where in the CS’s of North and East poultry is the mainly stocked product, it West and South it is seafood.
Zone wise
CS’s that mentioned stocking Animal Husbandry products

© COPYRIGHT 2014 148
8.4 TYPE OF ANIMAL HUSBANDRY FOOD STORED
All Figs in %
• Over 85% of the CS’s in Gujarat and AP stock sea food. • Cold stores in Maharashtra mainly stock seafood closely followed by fresh water fish.
States
CS’s that mentioned stocking Animal Husbandry products
All (n=452)
Maharashtra (n=64)
UP (n=7)
A & N (n=9)
AP (n=34)
Assam (n=-)
Bihar (n=9)
Chandigarh (n=1)
Seafood 71 48 - - 85 - - 100
Fresh water fish 24 44 - 100 21 - - -
Poultry 14 22 43 - 9 - 56 -
Meats (Beef, Lamb, Mutton, Pork)
11 33 43 - 12 - - 100
Other 6 5 14 - 3 - 67 -
All (n=452)
C’garh (n=3)
Delhi (n=3)
Goa (n=4)
Gujarat (n=97)
Haryana (n=5)
HP (n=-)
J & K (n=-)
Seafood 71 - 33 25 89 - - -
Fresh water fish 24 - - 100 32 - - -
Poultry 14 67 33 25 - 40 - -
Meats (Beef, Lamb, Mutton, Pork)
11 - 100 25 1 - - -
Other 6 67 - - - 60 - -

© COPYRIGHT 2014 149
8.4 TYPE OF ANIMAL HUSBANDRY FOOD STORED
All Figs in %
• Over 90% of cold stores in Kerala and TN store seafood.
CS’s that mentioned stocking Animal Husbandry products
States
All (n=452)
Jharkhand (n=1)
Karnataka (n=14)
Kerala (n=123)
MP (n=2)
Nagaland (n=-)
Orissa (n=11)
Pondicherry
(n=-)
Punjab (n=1)
Seafood 71 - 57 98 - - 82 - -
Fresh water fish 24 - 36 6 - - 9 - -
Poultry 14 100 29 3 100 - 9 - -
Meats (Beef, Lamb, Mutton, Pork)
11 - 29 5 - - - - -
Other 6 - - - 50 - 9 - 100
All (n=452)
Rajasthan (n=3)
Sikkim (n=-)
TN (n=27)
Tripura (n=-)
Uttaranchal (n=-)
WB (n=33)
North East (n=-)
Seafood 71 25 - 100 - - 18 -
Fresh water fish 24 25 - 22 - - 24 -
Poultry 14 50 - 7 - - 48 -
Meats (Beef, Lamb, Mutton, Pork)
11 - - 7 - - 15 -
Other 6 - - - - - 21 -

© COPYRIGHT 2014 150
8.4 TYPE OF ANIMAL HUSBANDRY FOOD STORED
All Figs in % CS’s that mentioned stocking Animal Husbandry products
Urban CS’s (n=231)
Rural CS’s (n=221)
NHB/NHM (n=153)
Others (n=299)
Seafood 77 65 58 78
Fresh water fish 28 19 17 27
Poultry 8 20 24 9
Meats (Beef, Lamb, Mutton, Pork) 15 8 10 12
Other 5 7 10 4
Proprietorship (n=99)
Partnership (n=128)
Company Public
Ltd. (n=25)
Company Private
Ltd. (n=179)
Association Public (n=2)
Cooperative (n=4)
Govt. (Co./Dept.
/PSU) (n=12)
Not mentioned ownership
type (n=3)
Seafood 75 77 56 70 50 50 25 100
Fresh water fish 21 28 20 20 - 25 58 33
Poultry 17 8 12 16 - 50 8 67
Meats (Beef, Lamb, Mutton, Pork)
12 11 24 8 50 - 8 67
Other 5 7 - 6 - - 17 -
Ownership Type/Urban/Rural/NHB/NHM
• Over 77% of the CS under Partnership type store seafood. • 24% of the of CS in NHB/NHM store Poultry.

© COPYRIGHT 2014 151
8.5 TYPE OF PHARMACEUTICAL PRODUCT STORED
All Figs in %
All (n=44)
Type H (n=37)
Type P (n=24)
Type M (n=12)
Type Q (n=44)
Other Products
(n=4)
68
50
14
11
50
25
0
25
73
49
11
11
71
71
8
4
75
67
17
8
68
50
14
11
Vaccine
Medicine
Active product ingredient
Other1
All (n=44)
North (n=9)
East (n=10)
West (n=14)
South (n=11)
68
50
14
11
73
36
18
27
56
44
11
11
90
40
0
0
57
71
21
7
• 68% of Type Q CS’s store vaccines alongside medicines. • Of the 44 stocking pharma products, 37 are stocking Type H, 24 are stocking Type P and 12 are
stocking Type M products. Their practice of stocking pharma products is given in other columns
• Across zones, vaccine is stocked by majority followed by other medicines.
Zone wise
Vaccine
Medicine
Active product ingredient
Other1
CS’s that mentioned stocking Pharmaceutical products

© COPYRIGHT 2014 152
8.5 TYPE OF PHARMACEUTICAL PRODUCT STORED
All Figs in %
• Low bases.
States
CS’s that mentioned stocking Pharmaceutical products
All (n=44)
Maharashtra (n=11)
UP (n=2)
A & N (n=-)
AP (n=2)
Assam (n=-)
Bihar (n=1)
Chandigarh (n=-)
Vaccine 68 73 50 - 50 - 100 -
Medicine 50 82 50 - 50 - 100 -
Active product ingredient 14 9 - - 50 - - -
Other 11 - - - 50 - - -
All (n=44)
C’garh (n=5)
Delhi (n=3)
Goa (n=-)
Gujarat (n=1)
Haryana (n=1)
HP (n=1)
J & K (n=1)
Vaccine 68 100 33 - - 100 100 100
Medicine 50 - 33 - - 100 - -
Active product ingredient 14 - - - 100 - - -
Other 11 - 33 - - - - -

© COPYRIGHT 2014 153
8.5 TYPE OF PHARMACEUTICAL PRODUCT STORED
All Figs in %
• Low bases.
CS’s that mentioned stocking Pharmaceutical products
States
All (n=44)
Jharkhand (n=-)
Karnataka (n=1)
Kerala (n=2)
MP (n=2)
Nagaland (n=-)
Orissa (n=1)
Pondicherry (n=-)
Punjab (n=-)
Vaccine 68 - 100 50 - - 100 - -
Medicine 50 - - 50 50 - - - -
Active product ingredient
14 - 100 - 50 - - - -
Other 11 - - 50 50 - - - -
All (n=44)
Rajasthan (n=1)
Sikkim (n=-)
TN (n=6)
Tripura (n=-)
Uttaranchal (n=-)
WB (n=3)
North East (n=-)
Vaccine 68 - - 83 - - 67 -
Medicine 50 100 - 33 - - 100 -
Active product ingredient
14 100 - - - - - -
Other 11 - - 17 - - - -

© COPYRIGHT 2014 154
8.5 TYPE OF PHARMACEUTICAL PRODUCT STORED
All Figs in %
• Low bases.
CS’s that mentioned stocking Pharmaceutical products
Urban CS’s (n=25)
Rural CS’s (n=19)
NHB/NHM (n=20)
Others (n=24)
Vaccine 68 68 80 58
Medicine 48 53 40 58
Active product ingredient 12 16 20 8
Other 12 11 5 17
Proprietorship (n=99)
Partnership (n=128)
Company Public Ltd.
(n=25)
Company Private Ltd.
(n=179)
Association Public (n=2)
Cooperative (n=4)
Govt. (Co./Dept./P
SU) (n=12)
Vaccine 86 75 75 42 100 - 100
Medicine 14 50 63 58 100 - 67
Active product ingredient
14 8 - 25 - 100 -
Other 14 - 13 25 - - -
Ownership Type/Urban/Rural/NHB/NHM

© COPYRIGHT 2014
CHAPTER 9
SERVICE MODEL OF THE FACILITY
Page no 155 to 158

© COPYRIGHT 2014 156
9. SERVICE MODEL OF THE FACILITY
The survey indicates that North and East zone have a high proportion of cold stores which are open for pure rental purposes. Over a third of Western and Southern based storages are open for producer storage.
The survey is done among CSs who are leasing their CS for others use. As the above chart shows, the percentage adds to over 100%. Even if they are using the location for their own use, they are also leasing out part of their space for others to stock.
All (n=5003)
North (n=2142)
East (n=803)
West (n=1013)
South (n=1045)
75
27
13
3
47
38
20
12
88
16
6
1
91
19
9
1
66
43
24
1
Pure Lease Rental Model
Captive Use
Supply Chain Service
Mixed

© COPYRIGHT 2014 157 All Figs in % All Respondents
Pure Lease Rental Model
Captive Use
Supply Chain Service
Mixed
All (n=5003)
Type H (n=4333)
Type P (n=523)
Type M (n=452)
Type Q (n=44)
Other Products
(n=27)
75
27
13
3
78
59
22
0
82
21
12
3
63
44
22
3
28
70
16
1
82
55
25
2
All (n=5003)
North (n=2142)
East (n=803)
West (n=1013)
South (n=1045)
75
27
13
3
47
38
20
12
88
16
6
1
91
19
9
1
66
43
24
1
• Over 70% of the Type M cold stores are open for captive use. • Over 80% Type H storages are open for pure rental purposes.
• North and East zone have a high proportion of cold stores which are open for pure rental purposes.
• Over 1/3rd of Western and Southern based storages are open for producer storage.
Zone wise
Pure Lease Rental Model
Captive Use
Supply Chain Service
Mixed
9.1 SERVICE MODEL OF THE FACILITY

© COPYRIGHT 2014 158 All Figs in % All Respondents
States
• Over 90% storages in UP and Bihar are open for pure rental purposes. • 90% storages in Kerala are open for captive use.
All (n=5003)
Maharashtra (n=451)
UP (n=1371)
A & N (n=10)
AP (n=600)
Assam (n=22)
Bihar (n=169)
Chandigarh (n=3)
Pure Lease Rental Model 75 57 96 60 55 77 92 100
Captive Use 27 51 4 30 21 50 8 -
Supply Chain Service 13 21 2 10 26 14 12 -
Mixed 3 2 0 - 21 9 - -
All (n=5003)
C’garh (n=76)
Delhi (n=35)
Goa (n=7)
Gujarat (n=399)
Haryana (n=185)
HP (n=14)
J & K (n=16)
Pure Lease Rental Model 75 76 74 29 67 54 29 75
Captive Use 27 72 40 71 43 41 14 31
Supply Chain Service 13 22 17 14 33 6 57 13
Mixed 3 - 11 14 0 4 - -
All (n=5003)
Jharkhand (n=19)
Karnataka (n=188)
Kerala (n=143)
MP (n=156)
Nagaland (n=1)
Orissa (n=38)
Pondicherry (n=2)
Punjab (n=402)
Pure Lease Rental Model
75 95 43 8 89 100 63 50 78
Captive Use 27 26 64 90 21 - 50 - 48
Supply Chain Service 13 5 6 4 8 100 11 50 17
Mixed 3 - 1 3 1 - - - 1
All (n=5003)
Rajasthan (n=104)
Sikkim (n=5)
TN (n=102)
Tripura (n=9)
Uttaranchal (n=12)
WB (n=464)
North East (n=37)
Pure Lease Rental Model
75 91 60 58 78 100 96 76
Captive Use 27 2 60 24 33 - 10 46
Supply Chain Service 13 6 - 32 - - 5 11
Mixed 3 1 - 1 11 - 0 8
9.1 SERVICE MODEL OF THE FACILITY

© COPYRIGHT 2014
CHAPTER 10
OWNERSHIP AND MANAGEMENT STRUCTURE
Page no 159 to 162

© COPYRIGHT 2014 160
10.1 OWNERSHIP TYPE
All Figs in % All Respondents
Ownership Type
Partnership
Company (Private Ltd.)
Proprietorship
Company (Public Ltd.)
Cooperative
Government (Co./Dept./ PSU)
DKCS
All (n=5003)
Type H (n=4333)
Type P (n=523)
Type M (n=452)
Type Q (n=44)
Other Products
(n=27)
34
31
27
3
3
2
0
30
22
30
7
4
4
0
35
31
27
3
2
1
0
24
30
21
7
10
6
1
28
40
22
6
1
3
1
27
27
16
18
2
7
0
All (n=5003)
North (n=2142)
East (n=803)
West (n=1013)
South (n=1045)
34
31
27
3
3
2
0
25
33
32
3
3
3
1
43
26
28
3
0
0
0
23
46
18
3
6
3
1
32
29
26
5
4
2
0
• At an all India level, 1/3rd of the companies are private limited and other 1/3rd are companies owned on partnership basis.
• In all category of storage types, most of the companies belong to private sector only.
• Over 40% CS’s in the Northern zone are owned on partnership basis. • Close to half of the cold stores in East are private limited companies.
Zone wise
Partnership
Company (Private Ltd.)
Proprietorship
Company (Public Ltd.)
Cooperative
Government (Co./Dept./ PSU)
DKCS

© COPYRIGHT 2014 161
10.1 OWNERSHIP TYPE
All Figs in % All Respondents
States
All (n=5003)
Maharashtra (n=451)
UP (n=1371)
A & N (n=10)
AP (n=600)
Assam (n=22)
Bihar (n=169)
Chandigarh (n=3)
Partnership 34 22 42 - 26 14 20 67
Company (Private Ltd.) 31 26 32 20 39 36 47 33
Proprietorship 27 32 23 - 30 36 24 -
Company (Public Ltd.) 3 9 3 20 2 - 4 -
Cooperative 3 7 - - 1 5 2 -
Government (Co./Dept./ PSU)
2 3 0 60 1 5 - -
DKCS 0 1 - - 1 - 3 -
All (n=5003)
C’garh (n=76)
Delhi (n=35)
Goa (n=7)
Gujarat (n=399)
Haryana (n=185)
HP (n=14)
J & K (n=16)
Partnership 34 45 23 14 49 47 21 69
Company (Private Ltd.) 31 33 17 14 32 18 29 -
Proprietorship 27 17 43 71 15 32 21 25
Company (Public Ltd.) 3 - 11 - 2 2 7 -
Cooperative 3 3 - - 1 - - 6
Government (Co./Dept./ PSU)
2 - 6 - 1 1 21 -
DKCS 0 - - - - - - -
• Gujarat, Haryana, UP have more number of cold storages which are owned on partnership basis. • 31% storages in AP are private limited companies. This percentage is higher at 47% in Bihar.

© COPYRIGHT 2014 162 All Figs in % All Respondents
States
All (n=5003)
Jharkhand (n=19)
Karnataka (n=188)
Kerala (n=143)
MP (n=156)
Nagaland (n=1)
Orissa (n=38)
Pondicherry (n=2)
Punjab (n=402)
Partnership 34 32 20 36 20 - 18 - 51
Company (Private Ltd.) 31 11 5 29 30 - 16 - 8
Proprietorship 27 53 54 25 36 100 45 - 38
Company (Public Ltd.) 3 - 4 3 5 - 5 - 1
Cooperative 3 - 13 2 7 - 5 - 1
Government (Co./Dept./ PSU)
2 5 3 4 1 - 11 50 0
DKCS 0 - 1 1 - - - 50 0
• More than half of the CS’s in Karnataka owned on proprietorship basis. • More than 1 out of every 2 CS’s in WB are private limited company
All (n=5003)
Rajasthan (n=104)
Sikkim (n=5)
TN (n=102)
Tripura (n=9)
Uttaranchal (n=12)
WB (n=464)
North East (n=37)
Partnership 34 20 - 14 11 17 21 11
Company (Private Ltd.) 31 40 - 56 11 - 54 24
Proprietorship 27 26 40 19 22 50 11 35
Company (Public Ltd.) 3 9 - 3 - 33 3 -
Cooperative 3 3 - - - - 8 3
Government (Co./Dept./ PSU)
2 1 60 9 56 - 2 24
DKCS 0 - - - - - 1 -
10.1 OWNERSHIP TYPE
© COPYRIGHT 2014
CHAPTER 11
ACCESSIBILITY TO THE INFRASTRUCTURE BY VALUE
CHAIN STAKEHOLDERS
Page no 163 to 178

© COPYRIGHT 2014 164
11. ACCESSIBILITY TO THE INFRASTRUCTURE BY VALUE CHAIN STAKEHOLDERS
Highways - State wise analysis shows that over 50% West zone CSs are nearer state highways while in all the other zones, over 50% are near national highways. The average distance to highway is 4 KM for all CSs. The lowest distance of 2.5 KM was mentioned by Pharma type products CSs where as animal husbandry and processed food type reported the longest distance of 4.8 KM. While zone wise analysis shows that North zone has the shortest distance and East zone the longest distance to a highway.
Transport services as a cold-chain service were not provided by 79% of the cold storage units. Of the 21% that provided transportation, 48% had outsourced the transport assets. Thus transporters and logistics companies were lifting the goods of the CSs for distribution purposes using their own vehicle sources.
Railways - On an average 10.5 KM is the average distance of a cold store from the nearest railway station. Zone wise analysis shows that North reported lowest distance while South reported the longest distance to a railway station.
Airport - On an average, the distance to airport was 45.4 KM. This is lowest for Pharma type product cold stores. Zone wise analysis shows that West zone reported shortest distance, followed by South.
Sea Port – Many cold stores could not mention the distance to sea ports. Of those who mentioned, on an average the distance to sea port was 34.7 KM. Type Q cold storages report lower distances from sea port as compared to other product type storing cold storages. Cold storages in the East zone are the farthest from any of the sea ports.
21%
79%
Transport Services
Yes
No

© COPYRIGHT 2014 165
State Highway National Highway
11.1 NEAREST HIGHWAY
All Figs in % All Respondents
• Zone wise analysis shows that over 50% West zone CSs are nearer state highways while in all the other zones, over 50% are near national highways.
47
53
All (n=5003)
Type H (n=4333)
Type P (n=523)
Type M (n=452)
Type Q (n=44)
Other Products
(n=27)
• More CSs are nearer national highways than state highways • This is true of all product types stored except that of ‘other products’
Zone wise
All (n=5003)
North (n=2142)
East (n=803)
West (n=1013)
South (n=1045)
56
44
47
53
44
56
43
57
39
61
47
53
36
64
50
50
43
57
55
45
State Highway National Highway

© COPYRIGHT 2014 166
11.1 NEAREST HIGHWAY
All Figs in % All Respondents
States
All (n=5003)
Maharashrta (n=451)
UP (n=1371)
A & N (n=10)
AP (n=600)
Assam (n=22)
Bihar (n=169)
Chandigarh (n=3)
State Highway 47 62 50 90 39 41 43 67
National Highway 53 38 50 10 61 59 57 33
All (n=5003)
C’garh (n=76)
Delhi (n=35)
Goa (n=7)
Gujarat (n=399)
Haryana (n=185)
HP (n=14)
J & K (n=16)
State Highway 47 46 9 - 57 14 79 31
National Highway 53 54 91 100 43 86 21 69
All (n=5003)
Jharkhand (n=19)
Karnataka (n=188)
Kerala (n=143)
MP (n=156)
Nagaland (n=1)
Orissa (n=38)
Pondicherry (n=2)
Punjab (n=402)
State Highway 47 32 39 19 37 - 13 50 70
National Highway 53 68 61 81 63 100 87 50 30
• There are variation by state wise in proximity between state and national highway
All (n=5003)
Rajasthan (n=104)
Sikkim (n=5)
TN (n=102)
Tripura (n=9)
Uttaranchal
(n=12)
WB (n=464)
North East (n=37)
State Highway 47 47 80 29 44 67 45 46
National Highway 53 53 20 71 56 33 55 54

© COPYRIGHT 2014 167
11.2 DISTANCE FROM THE NEAREST HIGH WAY
All Figs in % All respondents
0-1
1-2
2-5
5-10
Above 10
DK/CS
48
15
19
15
4
0
62
10
12
7
8
0
53
17
14
7
9
0
46
16
17
10
9
2
59
18
14
5
5
0
60
11
13
7
9
0
53
13
14
7
11
1
64
10
12
7
6
0
60
8
9
9
14
0
57
14
15
7
7
0
• The average distance to highway is 4 kms for all CSs. The lowest distance of 2.5 kms was mentioned by Q type products CSs where as M type reported the longest distance of 4.8 kms
• Zone wise analysis shows that North zone had the shortest distance while East zone had the longest distance to highway
Zone wise
All (n=5003)
Type H (n=4333)
Type P (n=523)
Type M (n=452)
Type Q (n=44)
Other Products
(n=27)
All (n=5003)
North (n=2142)
East (n=803)
West (n=1013)
South (n=1045)
60
11
13
7
9
0
0-1
1-2
2-5
5-10
Above 10
DK/CS
Unit of measurement – Kilometers

© COPYRIGHT 2014 168
11.2 DISTANCE FROM THE NEAREST HIGH WAY
All Figs in % All respondents
States
• There is quite a variation in state wise analysis • The states that reported lower distances are Bihar, Chandigarh, Gujarat, Haryana, HP, MP,
Rajasthan, TN and Uttaranchal. • On the other hand the states that reported longer distances are Maharashtra, Assam, Delhi,
Karnataka, Orissa and Tripura.
Unit of measurement – Kilometers
All (n=5003)
Maharashtra (n=451)
UP (n=1371)
A & N (n=10)
AP (n=600)
Assam (n=22)
Bihar (n=169)
Chandigarh (n=3)
0-1 60 43 69 - 56 64 73 67
1-2 11 17 8 10 14 - 5 33
2-5 13 17 11 - 14 14 9 -
5-10 7 12 6 - 5 9 6 -
Above 10 9 12 6 - 12 14 6 -
DK/CS 0 - 1 90 0 - 1 -
M E A N 4.0 5.2 3.2 2.0 4.6 6.0 2.8 1.3
All (n=5003)
C’garh (n=76)
Delhi (n=35)
Goa (n=7)
Gujarat (n=399)
Haryana (n=185)
HP (n=14)
J & K (n=16)
0-1 60 61 14 43 65 54 93 63
1-2 11 22 29 14 14 20 7 6
2-5 13 9 29 43 15 21 - 13
5-10 7 4 20 - 3 5 - 13
Above 10 9 4 9 - 3 1 - 6
DK/CS 0 - - - - - - -
M E A N 4.0 3.7 5.4 2.4 2.4 2.1 1.1 3.0
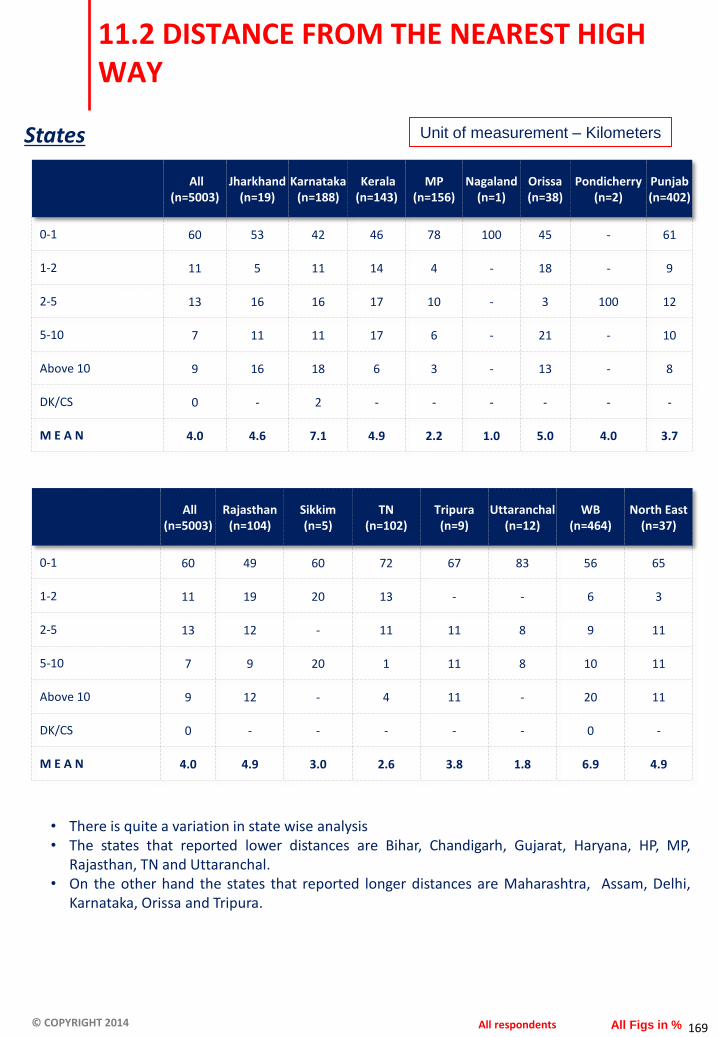
© COPYRIGHT 2014 169
All (n=5003)
Jharkhand (n=19)
Karnataka (n=188)
Kerala (n=143)
MP (n=156)
Nagaland (n=1)
Orissa (n=38)
Pondicherry (n=2)
Punjab (n=402)
0-1 60 53 42 46 78 100 45 - 61
1-2 11 5 11 14 4 - 18 - 9
2-5 13 16 16 17 10 - 3 100 12
5-10 7 11 11 17 6 - 21 - 10
Above 10 9 16 18 6 3 - 13 - 8
DK/CS 0 - 2 - - - - - -
M E A N 4.0 4.6 7.1 4.9 2.2 1.0 5.0 4.0 3.7
11.2 DISTANCE FROM THE NEAREST HIGH WAY
All Figs in % All respondents
States
• There is quite a variation in state wise analysis • The states that reported lower distances are Bihar, Chandigarh, Gujarat, Haryana, HP, MP,
Rajasthan, TN and Uttaranchal. • On the other hand the states that reported longer distances are Maharashtra, Assam, Delhi,
Karnataka, Orissa and Tripura.
Unit of measurement – Kilometers
All (n=5003)
Rajasthan (n=104)
Sikkim (n=5)
TN (n=102)
Tripura (n=9)
Uttaranchal (n=12)
WB (n=464)
North East (n=37)
0-1 60 49 60 72 67 83 56 65
1-2 11 19 20 13 - - 6 3
2-5 13 12 - 11 11 8 9 11
5-10 7 9 20 1 11 8 10 11
Above 10 9 12 - 4 11 - 20 11
DK/CS 0 - - - - - 0 -
M E A N 4.0 4.9 3.0 2.6 3.8 1.8 6.9 4.9
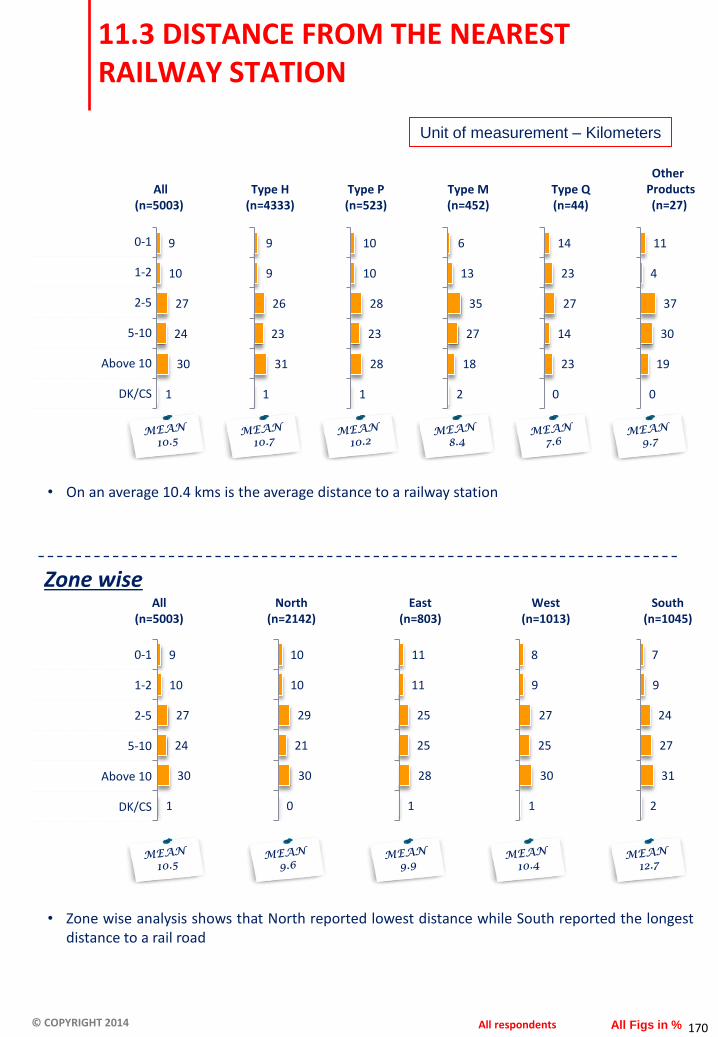
© COPYRIGHT 2014 170
11.3 DISTANCE FROM THE NEAREST RAILWAY STATION
All Figs in % All respondents
0-1
1-2
2-5
5-10
Above 10
DK/CS
11
4
37
30
19
0
9
9
26
23
31
1
10
10
28
23
28
1
6
13
35
27
18
2
14
23
27
14
23
0
9
10
27
24
30
1
7
9
24
27
31
2
10
10
29
21
30
0
11
11
25
25
28
1
8
9
27
25
30
1
• On an average 10.4 kms is the average distance to a railway station
• Zone wise analysis shows that North reported lowest distance while South reported the longest distance to a rail road
Zone wise
9
10
27
24
30
1
0-1
1-2
2-5
5-10
Above 10
DK/CS
Unit of measurement – Kilometers
All (n=5003)
Type H (n=4333)
Type P (n=523)
Type M (n=452)
Type Q (n=44)
Other Products
(n=27)
All (n=5003)
North (n=2142)
East (n=803)
West (n=1013)
South (n=1045)

© COPYRIGHT 2014 171
11.3 DISTANCE FROM THE NEAREST RAILWAY STATION
All Figs in % All respondents
States
• There is quite a variation in state wise analysis • The states that reported lower distances are Assam, Bihar, Chandigarh, Delhi, Gujarat, Haryana,
Kerala, MP, Punjab, Rajasthan and Uttaranchal. • On the other hand, the states that reported longer distances are Maharashtra, AP, Chhattisgarh,
HP, Jharkhand, Karnataka, Orissa and TN
Unit of measurement – Kilometers
All (n=5003)
Maharashtra (n=451)
UP (n=1371)
A & N (n=10)
AP (n=600)
Assam (n=22)
Bihar (n=169)
Chandigarh (n=3)
0-1 9 10 12 10 8 9 15 -
1-2 10 7 10 - 9 14 9 -
2-5 27 20 26 - 21 32 31 33
5-10 24 20 19 - 28 18 20 67
Above 10 30 42 33 - 33 27 24 -
DK/CS 1 2 0 90 1 - 1 -
M E A N 10.5 13.5 10.2 1.0 12.5 7.7 7.8 6.3
All (n=5003)
C’garh (n=76)
Delhi (n=35)
Goa (n=7)
Gujarat (n=399)
Haryana (n=185)
HP (n=14)
J & K (n=16)
0-1 9 1 9 14 5 5 7 25
1-2 10 9 46 - 11 6 7 13
2-5 27 26 40 - 35 44 21 13
5-10 24 37 3 57 26 22 14 31
Above 10 30 25 3 29 23 23 29 19
DK/CS 1 1 - - - - 21 -
M E A N 10.5 12.7 3.2 9.3 8.1 8.5 32.6 8.6

© COPYRIGHT 2014 172
11.3 DISTANCE FROM THE NEAREST RAILWAY STATION
All Figs in % All respondents
States Unit of measurement – Kilometers
All (n=5003)
Jharkhand (n=19)
Karnataka (n=188)
Kerala (n=143)
MP (n=156)
Nagaland (n=1)
Orissa (n=38)
Pondicherry (n=2)
Punjab (n=402)
0-1 9 5 6 4 9 - 8 - 7
1-2 10 16 11 10 6 - 5 50 11
2-5 27 - 27 36 31 - 21 - 27
5-10 24 37 16 38 39 100 32 50 26
Above 10 30 42 36 13 15 - 29 - 29
DK/CS 1 - 4 - - - 5 - -
M E A N 10.5 21.5 16.6 7.2 7.6 7.0 13.8 5.0 8.8
All (n=5003)
Rajasthan (n=104)
Sikkim (n=5)
TN (n=102)
Tripura (n=9)
Uttaranchal (n=12)
WB (n=464)
North East (n=37)
0-1 9 7 - 7 11 - 12 8
1-2 10 11 - 3 - - 12 8
2-5 27 38 - 19 22 67 24 24
5-10 24 29 - 23 22 25 24 19
Above 10 30 16 60 45 33 8 28 32
DK/CS 1 - 40 4 11 - - 8
M E A N 10.5 7.2 31.3 15.2 22.1 6.3 9.2 13.2

© COPYRIGHT 2014 173
11.4 DISTANCE FROM THE NEAREST AIRPORT
All Figs in % All respondents
0-1
1-2
2-5
5-10
Above 10
DK/CS
11
4
4
11
63
7
3
0
2
5
61
29
2
2
6
8
64
18
1
1
3
7
71
17
11
2
0
9
70
7
3
1
2
6
62
28
9
0
1
3
52
34
1
0
1
3
67
28
0
0
1
8
58
33
1
2
5
12
64
17
• On an average the distance to airport was 45.5 kms. This was lowest for Q type product CSs
• Zone wise analysis shows that West zone reported shortest distance, followed by South
Zone wise
3
1
2
6
62
28
0-1
1-2
2-5
5-10
Above 10
DK/CS
Unit of measurement – Kilometers
All (n=5003)
Type H (n=4333)
Type P (n=523)
Type M (n=452)
Type Q (n=44)
Other Products
(n=27)
All (n=5003)
North (n=2142)
East (n=803)
West (n=1013)
South (n=1045)
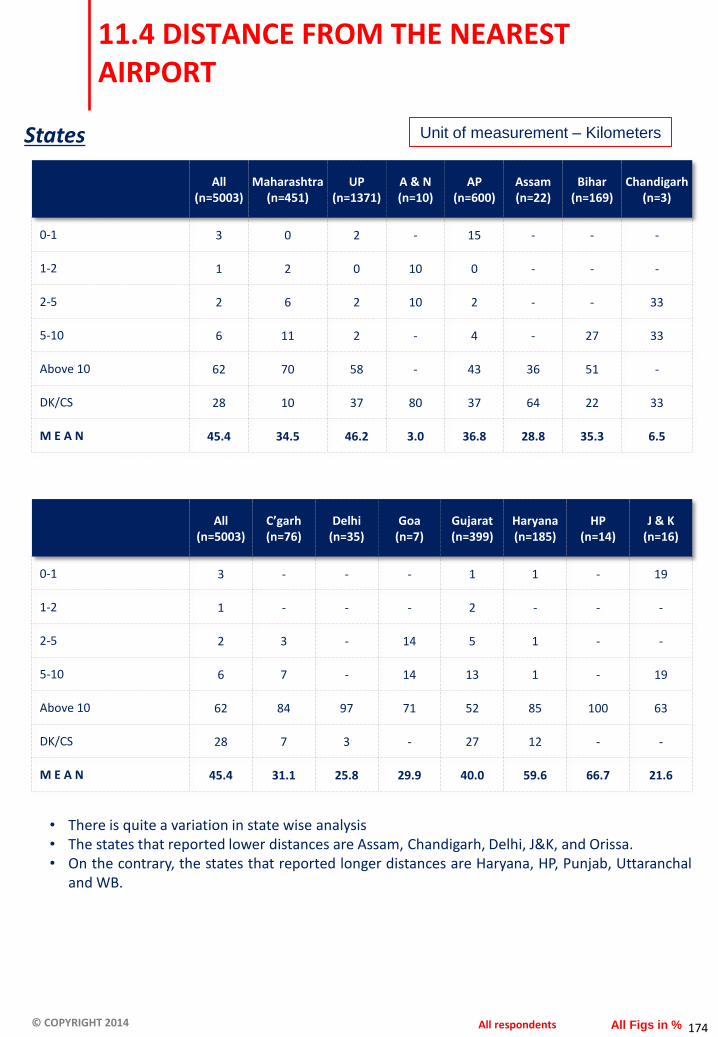
© COPYRIGHT 2014 174
11.4 DISTANCE FROM THE NEAREST AIRPORT
All Figs in % All respondents
States
• There is quite a variation in state wise analysis • The states that reported lower distances are Assam, Chandigarh, Delhi, J&K, and Orissa. • On the contrary, the states that reported longer distances are Haryana, HP, Punjab, Uttaranchal
and WB.
All (n=5003)
Maharashtra (n=451)
UP (n=1371)
A & N (n=10)
AP (n=600)
Assam (n=22)
Bihar (n=169)
Chandigarh (n=3)
0-1 3 0 2 - 15 - - -
1-2 1 2 0 10 0 - - -
2-5 2 6 2 10 2 - - 33
5-10 6 11 2 - 4 - 27 33
Above 10 62 70 58 - 43 36 51 -
DK/CS 28 10 37 80 37 64 22 33
M E A N 45.4 34.5 46.2 3.0 36.8 28.8 35.3 6.5
All (n=5003)
C’garh (n=76)
Delhi (n=35)
Goa (n=7)
Gujarat (n=399)
Haryana (n=185)
HP (n=14)
J & K (n=16)
0-1 3 - - - 1 1 - 19
1-2 1 - - - 2 - - -
2-5 2 3 - 14 5 1 - -
5-10 6 7 - 14 13 1 - 19
Above 10 62 84 97 71 52 85 100 63
DK/CS 28 7 3 - 27 12 - -
M E A N 45.4 31.1 25.8 29.9 40.0 59.6 66.7 21.6
Unit of measurement – Kilometers
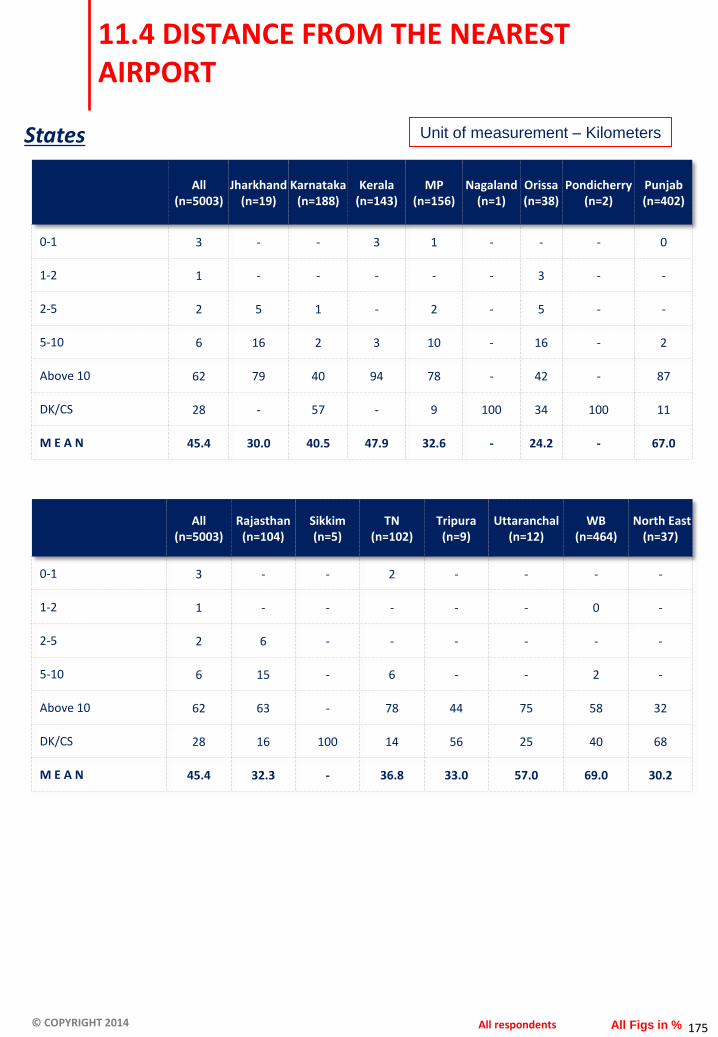
© COPYRIGHT 2014 175
11.4 DISTANCE FROM THE NEAREST AIRPORT
All Figs in % All respondents
States
All (n=5003)
Jharkhand (n=19)
Karnataka (n=188)
Kerala (n=143)
MP (n=156)
Nagaland (n=1)
Orissa (n=38)
Pondicherry
(n=2)
Punjab (n=402)
0-1 3 - - 3 1 - - - 0
1-2 1 - - - - - 3 - -
2-5 2 5 1 - 2 - 5 - -
5-10 6 16 2 3 10 - 16 - 2
Above 10 62 79 40 94 78 - 42 - 87
DK/CS 28 - 57 - 9 100 34 100 11
M E A N 45.4 30.0 40.5 47.9 32.6 - 24.2 - 67.0
All (n=5003)
Rajasthan (n=104)
Sikkim (n=5)
TN (n=102)
Tripura (n=9)
Uttaranchal (n=12)
WB (n=464)
North East (n=37)
0-1 3 - - 2 - - - -
1-2 1 - - - - - 0 -
2-5 2 6 - - - - - -
5-10 6 15 - 6 - - 2 -
Above 10 62 63 - 78 44 75 58 32
DK/CS 28 16 100 14 56 25 40 68
M E A N 45.4 32.3 - 36.8 33.0 57.0 69.0 30.2
Unit of measurement – Kilometers

© COPYRIGHT 2014 176
11.5 DISTANCE FROM THE NEAREST SEAPORT
All Figs in % All respondents
0-1
1-2
2-5
5-10
Above 10
DK/CS
7
0
4
4
44
41
3
0
0
3
18
76
3
0
2
3
33
58
4
2
5
9
49
32
2
0
2
7
50
39
• Many cold store respondents could not mention the distance to sea ports Hence this analysis is not valid.
• Of those who mentioned, the average distance to sea port is 34.7 kms. • This is lowest for Q type storage CSs at 26.6 kms.
• Zone wise analysis shows that the proximity to connectivity is lowest at an average of 20.1 kms for South zone and is the highest for East zone at 59.8 kms
Zone wise
All (n=5003)
Type H (n=4333)
Type P (n=523)
Type M (n=452)
Type Q (n=44)
Other Products
(n=27)
3
0
1
4
21
71
Unit of measurement – Kilometers
0-1
1-2
2-5
5-10
Above 10
DK/CS
12
1
2
4
25
56
0
0
0
6
4
90
0
0
0
1
46
52
2
0
1
2
33
61
All (n=5003)
North (n=2142)
East (n=803)
West (n=1013)
South (n=1045)
3
0
1
4
21
71

© COPYRIGHT 2014 177
11.5 DISTANCE FROM THE NEAREST SEAPORT
All Figs in % All respondents
States
• The average distance to sea port varies from state to state, depending on their location
All (n=5003)
Maharashtra (n=451)
UP (n=1371)
A & N (n=10)
AP (n=600)
Assam (n=22)
Bihar (n=169)
Chandigarh (n=3)
0-1 3 2 - 10 19 5 - -
1-2 0 - - 20 1 - - -
2-5 1 1 - 40 1 - - -
5-10 4 2 - 10 2 - - -
Above 10 21 47 1 - 14 27 53 -
DK/CS 71 48 99 20 63 68 47 100
M E A N 34.7 34.1 57.1 3.1 17.1 27.0 45.6 -
All (n=5003)
C’garh (n=76)
Delhi (n=35)
Goa (n=7)
Gujarat (n=399)
Haryana (n=185)
HP (n=14)
J & K (n=16)
0-1 3 - - - 3 5 - -
1-2 0 - - - 1 - - -
2-5 1 - - 14 2 - - -
5-10 4 - - 29 2 63 50 -
Above 10 21 76 6 57 22 6 - -
DK/CS 71 24 94 - 70 25 50 100
M E A N 34.7 54.9 28.5 26.3 38.2 14.1 9.0 -
Unit of measurement – Kilometers
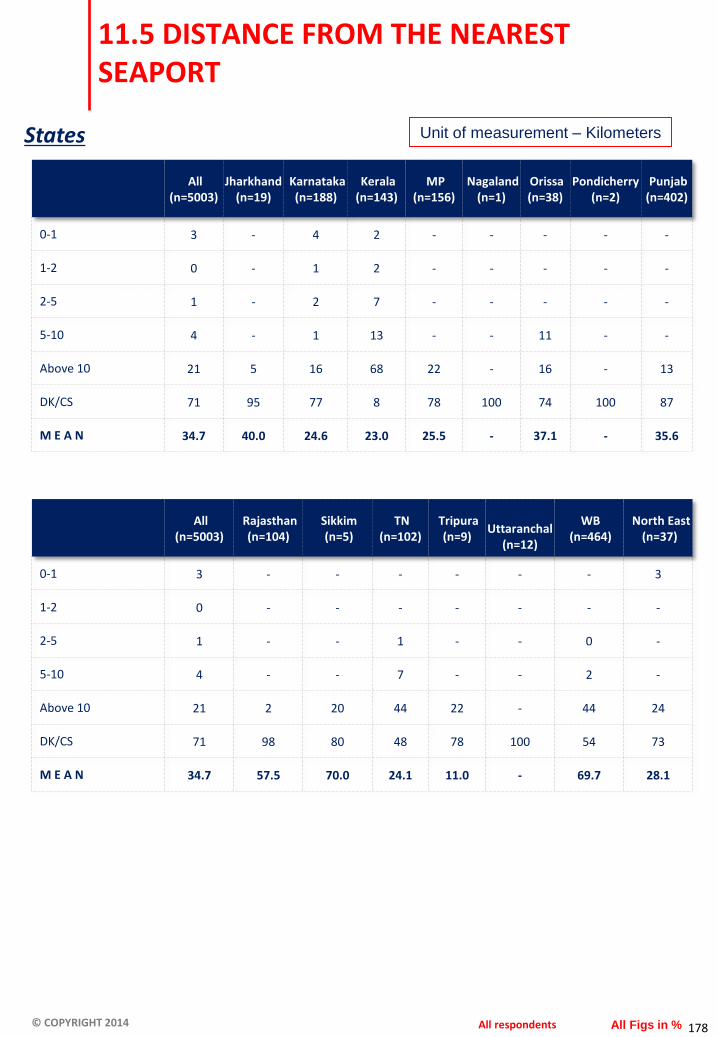
© COPYRIGHT 2014 178
11.5 DISTANCE FROM THE NEAREST SEAPORT
All Figs in % All respondents
States
All (n=5003)
Jharkhand (n=19)
Karnataka (n=188)
Kerala (n=143)
MP (n=156)
Nagaland (n=1)
Orissa (n=38)
Pondicherry (n=2)
Punjab (n=402)
0-1 3 - 4 2 - - - - -
1-2 0 - 1 2 - - - - -
2-5 1 - 2 7 - - - - -
5-10 4 - 1 13 - - 11 - -
Above 10 21 5 16 68 22 - 16 - 13
DK/CS 71 95 77 8 78 100 74 100 87
M E A N 34.7 40.0 24.6 23.0 25.5 - 37.1 - 35.6
All (n=5003)
Rajasthan (n=104)
Sikkim (n=5)
TN (n=102)
Tripura (n=9)
Uttaranchal
(n=12)
WB (n=464)
North East (n=37)
0-1 3 - - - - - - 3
1-2 0 - - - - - - -
2-5 1 - - 1 - - 0 -
5-10 4 - - 7 - - 2 -
Above 10 21 2 20 44 22 - 44 24
DK/CS 71 98 80 48 78 100 54 73
M E A N 34.7 57.5 70.0 24.1 11.0 - 69.7 28.1
Unit of measurement – Kilometers

© COPYRIGHT 2014
CHAPTER 12
BACKEND INFRASTRUTURE AVAILABILITY
Page no 179 to 184

© COPYRIGHT 2014 180
12. BACKEND INFRASTRUCTURE AVAILABILITY
All of the CSs had some auxiliary facilities in their establishment. 58% had an ante room which is necessary to keep out the heat, 45% each have sorting and grading facilities and pack houses, and 39% have pre coolers.
Age wise analysis shows the following:
Age wise analysis shows that in post 2009 period, the facilities relating to ante room, pre
coolers and ripening chambers have increased in incidence.
Auxiliary services
CS set up
Before 2009
CS set up
After 2009
Ante – room 57 61
Sorting/Grading 45 42
Pack houses 43 39
Pre-cooler 38 42
Blast freezer / IQF (Individually quick Freezer) 17 17
Ripening Chamber 11 21
Refrigerated Trucks / Reefer Trucks 4 5
Not mentioned 10 8
58
45
42
39
17
13 4 10
Ante - room
Sorting/Grading
Packaging
Pre-cooler
Blast freezer / IQF (Individuallyquick Freezer) Ripening Chamber
Refrigerated Trucks / ReeferTrucks No Response

© COPYRIGHT 2014 181
12.1 AVAILABILITY OF ALLIED FACILITIES
All Figs in % All Respondents
Ante - room
Sorting/Grading
Packaging
Pre-cooler
Blast freezer / IQF (Individually quick Freezer)
Ripening Chamber
Refrigerated Trucks / Reefer Trucks
No Response
All (n=5003)
Type H (n=4333)
Type P (n=523)
Type M (n=452)
Type Q (n=44)
Other Products
(n=27)
58
45
42
39
17
13
4
10
59
26
37
52
26
11
15
0
56
44
40
36
12
13
3
10
61
38
43
45
24
14
9
10
81
62
68
64
60
16
20
5
77
48
39
55
36
11
14
7
• Type H cold stores have facilities available mainly for ante room, sorting and grading facilities and pack houses.
• 81% of Type M storages consist of an ante –room. Type M CSs claim to have higher incidence of all facilities
• Every cold store have some facility or other in the cold chain service other than mere storage service.
• In the Eastern zone, maximum number of storages have infrastructure for pack houses, sorting and grading services
• Ante-rooms are more common in the Western zone storages.
Zone wise
Ante - room
Sorting/Grading
Packaging
Pre-cooler
Blast freezer / IQF (Individually quick Freezer)
Ripening Chamber
Refrigerated Trucks / Reefer Trucks
No Response
All (n=5003)
North (n=2142)
East (n=803)
West (n=1013)
South (n=1045)
58
45
42
39
17
13
4
10
62
32
35
40
22
21
7
11
58
44
36
35
13
9
2
9
43
59
59
41
12
7
2
9
67
48
51
44
24
19
9
11

© COPYRIGHT 2014 182
12.1 AVAILABILITY OF ALLIED FACILITIES
All Figs in % All Respondents
States
• Over 70% storages in Maharashtra, Haryana and Gujarat have facilities for Ante- room.
All (n=5003)
Maharashtra (n=451)
UP (n=1371)
A & N (n=10)
AP (n=600)
Assam (n=22)
Bihar (n=169)
Chandigarh (n=3)
Ante – room 58 72 64 100 61 27 55 67
Sorting/Grading 45 58 42 40 16 68 33 -
Pack Houses 42 66 36 40 20 73 44 -
Pre-cooler 39 59 42 10 32 36 46 -
Blast freezer / IQF (Individually quick Freezer)
17 24 15 30 14 18 15 -
Ripening Chamber 13 24 4 - 26 14 12 33
Refrigerated Trucks / Reefer Trucks
4 10 0 - 2 - - -
No Response 10 4 9 - 15 5 15 -
All (n=5003)
C’garh (n=76)
Delhi (n=35)
Goa (n=7)
Gujarat (n=399)
Haryana (n=185)
HP (n=14)
J & K (n=16)
Ante - room 58 78 60 71 70 69 64 50
Sorting/Grading 45 41 14 71 47 63 57 50
Pack Houses 42 33 14 43 40 51 57 50
Pre-cooler 39 47 20 57 34 30 57 31
Blast freezer / IQF (Individually quick Freezer)
17 13 11 43 28 15 36 6
Ripening Chamber 13 9 14 - 16 19 14 -
Refrigerated Trucks / Reefer Trucks
4 8 17 - 11 3 7 13
No Response 10 1 14 - 17 4 - 13

© COPYRIGHT 2014 183
12.1 AVAILABILITY OF ALLIED FACILITIES
All Figs in % All Respondents
States
• Over 75% storages in WB have facilities available for sorting/grading.
All (n=5003)
Jharkhand (n=19)
Karnataka (n=188)
Kerala (n=143)
MP (n=156)
Nagaland (n=1)
Orissa (n=38)
Pondicherry (n=2)
Punjab (n=402)
Ante – room 58 42 48 87 42 100 55 50 32
Sorting/Grading 45 16 44 74 23 - 29 100 51
Pack Houses 42 47 41 78 32 - 26 50 37
Pre-cooler 39 53 54 64 26 - 39 - 17
Blast freezer / IQF (Individually quick Freezer)
17 21 17 62 15 - 29 - 8
Ripening Chamber 13 5 20 10 14 - 3 - 18
Refrigerated Trucks / Reefer Trucks
4 - 11 20 1 - 13 - 6
No Response 10 5 5 1 13 - 16 - 6
All (n=5003)
Rajasthan (n=104)
Sikkim (n=5)
TN (n=102)
Tripura (n=9)
Uttaranchal (n=12)
WB (n=464)
North East (n=37)
Ante - room 58 57 - 53 22 67 34 24
Sorting/Grading 45 12 60 43 67 83 75 65
Pack Houses 42 13 100 49 56 67 70 70
Pre-cooler 39 15 20 33 44 50 38 35
Blast freezer / IQF (Individually quick Freezer)
17 9 - 21 - 33 9 11
Ripening Chamber 13 16 - 14 - 8 5 8
Refrigerated Trucks / Reefer Trucks
4 4 - 10 - - 2 -
No Response 10 19 - 15 - - 8 3

© COPYRIGHT 2014 184
12.1 AVAILABILITY OF ALLIED FACILITIES
All Figs in % All Respondents
Urban CS’s (n=1481)
Rural CS’s (n=3522)
NHB/NHM (n=3061)
Others (n=1942)
Ante – room 56 59 56 62
Sorting/Grading 39 47 45 45
Pack Houses 40 43 42 44
Pre-cooler 40 38 37 41
Blast freezer / IQF (Individually quick Freezer) 22 15 14 22
Ripening Chamber 21 10 12 15
Refrigerated Trucks / Reefer Trucks 7 3 3 7
No Response 10 10 10 9
Proprietorship
(n=1336)
Partnership (n=1677)
Company Public
Ltd. (n=174)
Company Private
Ltd. (n=1563)
Association Public (n=5)
Association Private (n=12)
Cooperative
(n=130)
Govt. (Co./Dept.
/PSU) (n=82)
Not mentioned ownership
type (n=24)
Ante - room 57 60 59 59 100 58 43 45 54
Sorting/Grading 44 47 42 43 60 8 49 39 33
Pack Houses 41 40 44 44 60 25 57 50 29
Pre-cooler 42 35 43 38 60 42 48 44 33
Blast freezer / IQF (Individually quick Freezer)
15 17 24 17 60 25 17 18 8
Ripening Chamber 19 13 18 8 - 17 10 13 13
Refrigerated Trucks / Reefer Trucks
4 4 7 5 20 8 5 9 8
No Response 8 9 6 12 - 17 9 6 17
Ownership Type/Urban/Rural/NHB/NHM
• Over 55% of CS across all ownership types have Ante -room facility.

© COPYRIGHT 2014
CHAPTER 13
TECHNOLOGY & EQUIPMENTS USED IN CS’S
Page no 185 to 245

© COPYRIGHT 2014 186
13. TECHNOLOGY USED
The technology in this sector varies across myriad components of the infrastructure in use. This study queried about the following components - type of cooling coils (open tube or fin tube), door release system, fire fighting system, refrigeration automation, sensors and air ventilation, type of refrigerant gas, leak detection, cargo handling and tools, etc.
One third of CS’s use open tube evaporators (Bunker coil system) in their CSs. This was observed mainly in Horticulture based CS. The usage of this system is minimal (16%) in Type M CSs.
19
63
19
All (n=5003)
Type H (n=4333)
Type P (n=523)
Type M (n=452)
Type Q (n=44)
Other Products
(n=27)
34
25 41
37
20 43
21
39 41
16
54 30
27
32 41
Bunker Coil Fin Coil DK/CS

© COPYRIGHT 2014 187
13. TECHNOLOGY USED
Usage of Bunker coil system is dropped post 2009.
The average number of chambers in a cold storage is around 3 per store.
50% of the chambers had one door and other 50% of the chambers have two doors.
12% cold stores reported using fillers (husk, glass wool, sand dust or unspecified) for their primary thermal insulation. The majority, about 71% of the cold stores were using add-on insulating boards in the form of EPS (expanded polystyrene) or thermocol slabs. The incidence of using pre-fabricated PUF panels was low with only 12% cold stores reporting the use of Poly Urethane Foam.
1/3rd of Type M CSs use fillers for insulation of their chambers.
Majority of CSs have chambers with thickness of 50mm or above. Almost 50% of these cold storages have chambers with 70mm or more thickness. The average thickness is reported to be 74mm.
Chambers using PUF panels for insulation purposes have maximum thickness of 84mm. The lowest thickness is for chambers using mix for insulation.
Type of Coil used After 2009
(n=1183)
Before 2009
(n=3691)
Bunker coil system 27 36
Fin coil system 39 21
DK / CS 34 43

© COPYRIGHT 2014 188
13. TECHNOLOGY USED
Type of Coil used Proprietorship
(n=1336)
Partnership
(n=1677)
Company
(Public Ltd.)
(n=174)
Company
(Private
Ltd.)
(n=1563)
Association
(Public)
(n=5)
Bunker coil system 34 35 32 36 -
Fin coil system 26 24 38 22 60
DK / CS 40 42 30 43 40
Type of Coil used
Association
(Private)
(n=12)
Cooperative
(n=130)
Government
(Co./Dept./
PSU)
(n=82)
Not classified
under any
Ownership
type
(n=24)
Bunker coil system 33 32 15 33
Fin coil system 25 26 51 38
DK / CS 42 42 34 29
Close to 1/3rd of the cooperative CS’s have bunker coil systems.
Fin coils are least found among privately owned companies – 22%.
Prevalence of bunker coil systems is the least among government owned CS’s.
Type of Coil used All
(n=5003) Urban
(n=1481) Rural
(n=3522) NHB
(n=3061) Others
(n=1942)
Bunker coil system 34 27 37 38 28
Fin coil system 25 34 21 21 32
DK / CS 41 39 42 42 40

© COPYRIGHT 2014 189
13. TECHNOLOGY USED
Across all cold storages it has been found that they have an average of 4.0 evaporators and 2.5 compressors. Type Q cold storages have above average evaporators as well as compressors i.e. 5.7 evaporators and almost 4 compressors.
In evaporators major manufacturers who have supplied are Frick India, Kirloskar, Akash, Super Freezer, Blue Star, Carrier, New Coil India etc. The mean age of evaporators is 9 years. Respondents are not able to mention the model name. They merely mention the year of installation – ‘2009 model’ ‘2005 model’
In terms of compressors, the manufacturers who have supplied equipment are Kirloskar, Frick India, Star Cooler, Meetelex, Super Freezer, Blue Star etc. The mean age of compressor in use is 10 years. Mean capacity of compressors is 116 KW
Respondents are not able to mention the type of compressors properly –centrifugal, reciprocal, screw type etc. They mention it as ammonia based or air and water cooled based. Ammonia based compressors are present in 70% of the CSs. However in the Eastern zone every alternate CS use air water cooled compressors.
Type of compressors %
Air and water cooled 23.19
Ammonia Based 69.66
Centrifugal 0.36
Reciprocating 1.62
Screw 1.36
Semi Hermetic 0.26
Not mentioned 3.55

© COPYRIGHT 2014 190
13. TECHNOLOGY USED
Type of compressors Proprietorship
(n=4313)
Partnership
(n=5779)
Company
(Public Ltd.)
(n=736)
Company
(Private
Ltd.)
(n=6172)
Association
(Public)
(n=27)
Air and water cooled 22 20 14 27 52
Ammonia Based 69 75 75 67 19
Centrifugal 1 0 1 0 -
Reciprocating 1 2 4 2 -
Screw 2 1 1 1 -
Semi Hermetic - 0 1 0 15
Not mentioned 5 2 4 3 15
Type of compressors
Association
(Private)
(n=39)
Cooperative
(n=467)
Government
(Co./Dept./
PSU)
(n=317)
Not
classified
under any
Ownership
type
(n=73)
Air and water cooled 21 30 29 33
Ammonia Based 69 51 53 56
Centrifugal - 1 - -
Reciprocating - 5 5 3
Screw - 8 3 5
Semi Hermetic 5 2 1 -
Not mentioned 5 4 9 3
Irrespective of the type of ownership, ammonia based compressors are most common in the cold storages.

© COPYRIGHT 2014 191
13. TECHNOLOGY USED
Type of compressors All
(n=17923) Urban
(n=5149) Rural
(n=12774) NHB
(n=11097) Others
(n=6826)
Air and water cooled 23 20 24 26 19
Ammonia Based 70 68 70 68 73
Centrifugal 0 1 0 0 1
Reciprocating 2 2 1 1 2
Screw 1 2 1 1 2
Semi Hermetic 0 0 0 0 0
Not mentioned 4 6 3 4 4
Ammonia based compressors are found in 70% of the rural cold storages.

© COPYRIGHT 2014 192
13. TECHNOLOGY USED
72% of the chambers are having chillness between 0-10 degree C, while frozen accounted for 8% and mild chill accounted for 4%.
Technology has penetrated in many areas of CS’s, but there are certain areas which still follow
the rudimentary way of doing things.
Emergency door release system
Over 60% (adding number mentioning ‘both’ to both the systems) had either emergency release system from inside, or/and emergency bell inside, while 13% did not have any system.
Emergency door release system %
Emergency Door Release from inside 26
Emergency Bell on inside 24
Both 37
None 13
4
72
8
16 Mild Chill >10C
Chill betn. 0 & 10C
Frozen below 0C
DK / CS

© COPYRIGHT 2014 193
13. TECHNOLOGY USED
Emergency Door Release System
Proprietorship
(n=1336)
Partnership
(n=1677)
Company (Public
Ltd.)
(n=174)
Company
(Private Ltd.)
(n=1563)
Association
(Public)
(n=5)
Emergency Door Release from inside
26 29 23 24 -
Emergency Bell on inside
25 25 17 20 20
Both 32 35 47 45 80
None 17 11 13 12 -
Emergency Door Release System`
Association
(Private)
(n=12)
Cooperative
(n=130)
Government
(Co./Dept./ PSU)
(n=82)
Not classified
under any
Ownership type
(n=24)
Emergency Door Release from inside
8 15 12 21
Emergency Bell on inside
42 41 41 38
Both 33 33 30 33
None 17 11 16 8
Over 70% (adding both to emergency bell inside) of the cold storages that are associations, cooperatives or government owed have an emergency bell on the inside.

© COPYRIGHT 2014 194
13. TECHNOLOGY USED
Emergency Door Release System
All (n=5003)
Urban (n=1481)
Rural (n=3522)
NHB (n=3061)
Others (n=1942)
Emergency Door Release from inside
26 18 29 28 23
Emergency Bell on inside
24 25 24 20 30
Both 37 45 34 38 36
None 13 12 13 14 12
Over 70% (adding both to emergency bell inside) of the cold storages that are in urban cold stores have an emergency bell on the inside compared to 58% in Rural cold stores.

© COPYRIGHT 2014 195
13. TECHNOLOGY USED
Fire fighting system Gas based extinguishers are the mainly used fire fighting and detection systems. CSs were
using more than one type of system to fight fire in their cold stores.
Fire Fighting System in use by Age of CS (%)
Only 16% of the cold stores use Smoke detectors as a fire alarm system. Many supplanted this with manual fire rounds though 53% did not rely on physical fire rounds as a process. Use of various types of fire extinguishing equipment was reported in most cold stores. Foam and gas based extinguishers were most common with sprinklers and fire hydrants and hoses.
Fire fighting system %
Gas Based/ Extinguishers 73
Manual rounds 46
Sand Box 47
Hose/Hydrant 19
Sprinklers 18
Smoke Detectors 16
Heat Sensors 13
Others 3

© COPYRIGHT 2014 196
13. TECHNOLOGY USED
Fire Fighting Systems
Proprietorship
(n=1336)
Partnership
(n=1677)
Company (Public
Ltd.)
(n=174)
Company
(Private Ltd.)
(n=1563)
Association
(Public)
(n=5)
Gas Based/
Extinguishers 66 74 79 78 80
Manual rounds 42 48 32 49 40
Sand Box 37 48 39 55 40
Hose/Hydrant 13 18 27 25 40
Sprinklers 16 17 29 19 40
Smoke Detectors 15 13 32 20 60
Heat Sensors 12 11 24 16 20
Others 4 3 2 3 -
Fire Fighting Systems
Association
(Private)
(n=12)
Cooperative
(n=130)
Government
(Co./Dept./ PSU)
(n=82)
Not classified
under any
Ownership type
(n=24)
Gas Based/
Extinguishers 42 72 57 71
Manual rounds 17 48 35 29
Sand Box 33 49 49 46
Hose/Hydrant 8 25 16 33
Sprinklers 17 15 16 13
Smoke Detectors 17 8 21 21
Heat Sensors - 13 21 8
Others - 2 11 4
Almost 80% of the cold storages be it public limited (companies) or private limited (companies) have gas based extinguishers as a fire fighting mechanism. In comparison among Govt. companies has only 57% have gas based extinguishers.
In cooperatives as well as government owned cold storages, 49% of them have sand boxes to guard against fire.

© COPYRIGHT 2014 197
13. TECHNOLOGY USED
Fire Fighting Systems
All (n=5003)
Urban (n=1481)
Rural (n=3522)
NHB (n=3061)
Others (n=1942)
Gas Based/
Extinguishers 73 64 77 78 66
Manual rounds 46 33 51 51 38
Sand Box 47 40 50 49 44
Hose/Hydrant 19 11 23 22 14
Sprinklers 18 19 17 16 21
Smoke Detectors 16 20 15 15 18
Heat Sensors 13 16 12 12 16
Others 3 4 3 3 4
Except smoke detectors and heat sensors, all other type s of fire fighting equipments are found in more percentage of rural CSs compared to urban CSs.
NHB assisted cold stores have better facilities for fire detection and fighting compared to othe CSs

© COPYRIGHT 2014 198
13. TECHNOLOGY USED
The majority of cold stores were primarily using ammonia as refrigerant gas. A small 0.23% confirmed that they were using CO2 gas as the primary refrigerant.
As refrigerant gas, 10% of the total cold stores used Freon based cooling systems especially by CS’s storing animal husbandry goods (meats, fish, poultry, etc.). Freon is used by a smaller CS’s more common in states like Assam, Chandigarh, Andaman, Kerala etc. Refrigerant gas R22 is the most commonly used Freon gas.
Item All CS's built
after 2009
CS's built
before 2009
Extinguishers/ Gas
Based 73 66 75
Smoke Detectors 16 16 17
Heat Sensors 13 11 14
Hose/Hydrant 19 13 21
Sprinklers 18 16 18
Sand Box 47 43 48
Manual rounds 46 45 46
Ammonia
Freon
Carbon Dioxide
Others
89
10
0
2

© COPYRIGHT 2014 199
13. TECHNOLOGY USED Capacity of Cold stores
Distribution of Cold Storages interviewed in states and their capacity
State Number of
CS’s % Share
of Number
Storage
capacity (million
metric
tons)
% Share of
Storage
capacity
Volumetric
capacity (million cubic
meters)
% share of
Vol. Capacity
Uttar Pradesh 1371 27.4 8.99 36.74 30.57 36.74
Andhra Pradesh 600 11.9 2.3 9.40 7.82 9.40
Maharashtra 451 9 0.77 3.15 2.62 3.15
West Bengal 464 9.3 5.16 21.09 17.54 21.09
Gujarat 399 8 1.52 6.21 5.17 6.21
Punjab 402 8 1.36 5.56 4.62 5.56
Karnataka 188 3.8 0.27 1.10 0.92 1.10
Bihar 169 3.4 0.9 3.68 3.06 3.68
Haryana 185 3.7 0.45 1.84 1.53 1.84
Madhya Pradesh 156 3.1 0.85 3.47 2.89 3.47
Kerala 143 2.9 0.22 0.90 0.75 0.90
Tamil Nadu 102 2 0.21 0.86 0.71 0.86
Rajasthan 104 2.1 0.36 1.47 1.22 1.47
Chhattisgarh 76 1.5 0.43 1.76 1.46 1.76
Orissa 38 0.8 0.12 0.49 0.41 0.49
Delhi 35 0.7 0.1 0.41 0.34 0.41
Jharkhand 19 0.4 0.08 0.33 0.27 0.33
Assam 22 0.3 0.17 0.69 0.58 0.69
Jammu and Kashmir 16
0.3 0.04 0.16 0.14 0.16
Himachal Pradesh 14 0.3 0.02 0.08 0.07 0.08
Uttaranchal 12 0.2 0.07 0.29 0.24 0.29
Andaman and Nicobar Islands 10
0.2 0 0.00 0.00 0.00
Goa 7 0.1 0.01 0.04 0.03 0.04
Tripura 9 0.2 0.04 0.16 0.14 0.16
Chandigarh 3 0.1 0.02 0.08 0.07 0.08
Sikkim 5 0.1 0.01 0.04 0.03 0.04
Pondicherry 2 - - - - -
Nagaland 1 - - - - -
Total 5003 24.47 83.20

© COPYRIGHT 2014 200
13. TECHNOLOGY USED
The state wise availability of cold stores can be highlighted in the first instance through the above table showing the distribution of operational cold storages. This table does not indicate the cold storages that refused to give interviews, that were temporarily closed, that were permanently closed or those that were built with no intention to be used by public as a service option (hotels, hospitals, personal use, etc)
More than 75% of cold storages are located in states of Andhra Pradesh, Gujarat, UP, Punjab & West Bengal. In terms of capacity Horticulture CSs account for 95% of total capacity and 89% of total numbers across India.
As compared to all the zones, Eastern zone has reported highest storage capacity.
Mean storage capacity per cold store (by state)
Mean storage capacity is highest in East zone, especially contributed by West Bengal
7610
6559
5778
3482
3384
2969
2401
2226
1196
11113
5699 7791 5330
4137 3095
5448
3706
1706 1168
3929 2068 1440 1544
275 10
In MT
North 5391
East 8543
West 3108
South 2850

© COPYRIGHT 2014 201
• 1/3rds of Type H cold storages use buker coil system.
• More than 40% of the CSs in the North and East use bunker coil system. • Around 37% of the cold stores in the Western and Southern zones use Fin systems, which is
more than double of the other two zones.
Zone wise
24
38 38
34
25 41
39
17 44
48
13
39
23
37 40
North (n=2142)
East (n=803)
West (n=1013)
South (n=1045)
All (n=5003)
13.1 USE OF BUNKER COIL SYSTEM
All Figs in % All Respondents
Bunker Coil Fin Coil DK/CS
CHAPTER 9: TECHNOLOGY & EQUIPMENTS USED
19
63
19
All (n=5003)
Type H (n=4333)
Type P (n=523)
Type M (n=452)
Type Q (n=44)
Other Products
(n=27)
34
25 41
37
20 43
21
39 41
16
54 30
27
32 41
Bunker Coil Fin Coil DK/CS

© COPYRIGHT 2014 202
States
• A very high proportion of use of bunker coil system is seen in UP, Chattisgarh Punjab and West
Bengal. • Higher proportion of CS’s in TN and Kerala use fin system.
All (n=5003)
Maharashrta (n=451)
UP (n=1371)
A & N (n=10)
AP (n=600)
Assam (n=22)
Bihar (n=169)
Chandigarh (n=3)
Bunker coil system 34 23 43 - 37 50 33 33
Fin Coil system 24 49 9 90 23 14 17 67
DK / CS 42 28 48 10 40 36 50 -
All (n=5003)
C’garh (n=76)
Delhi (n=35)
Goa (n=7)
Gujarat (n=399)
Haryana (n=185)
HP (n=14)
J & K (n=16)
Bunker coil system 34 51 11 - 18 17 7 -
Fin Coil system 24 24 40 43 37 42 50 50
DK / CS 42 25 49 57 46 42 43 50
All (n=5003)
Jharkhand (n=19)
Karnataka (n=188)
Kerala (n=143)
MP (n=156)
Nagaland (n=1)
Orissa (n=38)
Pondicherry (n=2)
Punjab (n=402)
Bunker coil system 34 42 7 7 38 - 11 - 46
Fin Coil system 24 21 49 70 4 - 29 100 27
DK / CS 42 37 44 23 57 100 61 - 28
All (n=5003)
Rajasthan (n=104)
Sikkim (n=3)
TN (n=102)
Tripura (n=9)
Uttaranchal (n=12)
WB (n=464)
North East (n=37)
Bunker coil system 34 32 20 5 33 17 57 41
Fin Coil system 24 19 60 56 33 17 7 24
DK / CS 42 49 20 39 33 67 36 35
13.1 USE OF BUNKER COIL SYSTEM
All Figs in % All Respondents

© COPYRIGHT 2014 203
13.1 USE OF BUNKER COIL SYSTEM
All Figs in %
34 27 36 39 28
41 48 41 49
23 20 24 24 25 24
25 39 21 17 34 13 13 33 9
37 45 35 38 41 36
41 34 43 44 38 46 39 26
42 40 35 41 38 34 40
All(n=5003)
On/After2009
(n=1183)
Before2009
(n=3691)
All(n=2142)
On/After2009
(n=391)
Before2009
(n=1654)
All(n=803)
On/After2009
(n=140)
Before2009
(n=656)
All(n=1013)
On/After2009
(n=242)
Before2009
(n=750)
All(n=1045)
On/After2009
(n=407)
Before2009
(n=631)
Bunker Coil Fin Coil DK/CS
ALL North East West South
37 28 39
21 19 22 16 19 15 27
14 31
19 33
15
20 36 15 39 48 36 54
59 52 32
43 26
63 50
65
43 36 45 41 33 43
30 22 33 41 43 43
19 17 20
All(n=4333)
On/After2009
(n=1034)
Before2009
(n=3187)
All(n=523)
On/After2009
(n=112)
Before2009
(n=400)
All(n=452)
On/After2009
(n=106)
Before2009
(n=335)
All(n=44)
On/After2009(n=7)
Before2009
(n=35)
All(n=27)
On/After2009(n=6)
Before2009
(n=20)
Bunker Coil Fin Coil DK/CS
Horticulture Processed
Food Animal
Husbandry Pharmaceuticals Any other products
• In all the zones especially in North and East zone, the proportion of CS that do not use bunker coil has risen post 2009.
• There is a drop in use of bunker coil in CS that store horticulture and pharma products.
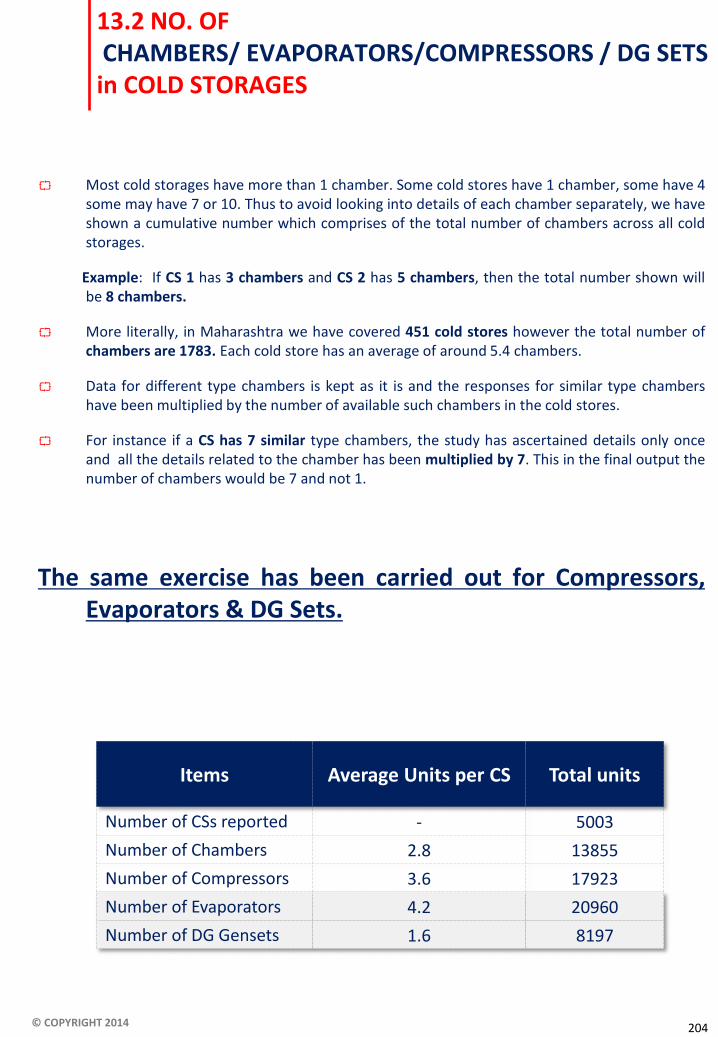
© COPYRIGHT 2014 204
Most cold storages have more than 1 chamber. Some cold stores have 1 chamber, some have 4 some may have 7 or 10. Thus to avoid looking into details of each chamber separately, we have shown a cumulative number which comprises of the total number of chambers across all cold storages.
Example: If CS 1 has 3 chambers and CS 2 has 5 chambers, then the total number shown will be 8 chambers.
More literally, in Maharashtra we have covered 451 cold stores however the total number of chambers are 1783. Each cold store has an average of around 5.4 chambers.
Data for different type chambers is kept as it is and the responses for similar type chambers have been multiplied by the number of available such chambers in the cold stores.
For instance if a CS has 7 similar type chambers, the study has ascertained details only once and all the details related to the chamber has been multiplied by 7. This in the final output the number of chambers would be 7 and not 1.
The same exercise has been carried out for Compressors, Evaporators & DG Sets.
13.2 NO. OF CHAMBERS/ EVAPORATORS/COMPRESSORS / DG SETS in COLD STORAGES
Items Average Units per CS Total units
Number of CSs reported - 5003
Number of Chambers 2.8 13855
Number of Compressors 3.6 17923
Number of Evaporators 4.2 20960
Number of DG Gensets 1.6 8197

© COPYRIGHT 2014 205
13.2 NO. CHAMBERS & AGE
All (n=13855)
Type H (n=12157)
Type P (n=1702)
Type M (n=1172)
Type Q (n=193)
Other Products (n=101)
Mean number of chambers per CS 3.1 3.0 4.3 2.7 5.3 6.0 Mean Age of chambers 11.8 11.7 12.5 11.5 14.4 15.4
All (n=13855)
North (n=5646)
East (n=2230)
West (n=3444)
South (n=2535)
Mean number of chambers per CS 3.1 2.5 3.0 4.0 3.1 Mean Age of chambers 11.8 13.2 14.5 11.2 8.3
All (n=13855)
Maharashrta (n=1783)
UP (n=3542)
A & N (n=17)
AP (n=1477)
Assam (n=72)
Bihar (n=454)
Chandigarh (n=9)
Mean number of chambers per CS 3.1 5.4 2.4 1.2 3.0 6.5 2.2 3.7
Mean Age of chambers 11.8 11.4 13.3 7.9 6.8 8.0 16.4 9.8
All (n=13855)
C’garh (n=213)
Delhi (n=131)
Goa (n=14)
Gujarat (n=1237)
Haryana (n=493)
HP (n=26)
J & K (n=43)
Mean number of chambers per CS
3.1 2.6 6.9 2.2 2.6 2.6 4.7 4.9
Mean Age of chambers 11.8 11.8 13.3 9.6 10.8 10.9 9.5 14.1
All (n=13855)
Jharkhand (n=82)
Karnataka (n=416)
Kerala (n=268)
MP (n=410)
Nagaland (n=2)
Orissa (n=85)
Pondicherry (n=6)
Punjab (n=1082)
Mean number of chambers per CS
3.1 6.6 3.3 2.4 2.3 1.0 6.5 7.7 2.2
Mean Age of chambers 11.8 11.6 11.7 10.6 11.8 6.0 12.0 6.7 14.6
All (n=13855)
Rajasthan (n=287)
Sikkim (n=12)
TN (n=351)
Tripura (n=30)
Uttaranchal (n=33)
WB (n=1280)
North East (n=116)
Mean number of chambers per CS
3.1 2.1 1.0 3.5 9.6 3.1 2.5 6.6
Mean Age of chambers 11.8 11.1 10.7 9.1 9.0 17.3 15.4 8.5
All Figs in % All Respondents

© COPYRIGHT 2014 206
13.3 NUMBER OF DOORS
All Figs in %
1
2
50
50
51
49
48
51
58
42
58
42
59
41
50
50
60
40
41
59
37
63
66
34
• It is observed that 50% of chambers had 1 door and another 50% had two doors.
• On an average there were 1.5 doors in chambers.
Zone wise
1
2
CS’s that mentioned Any Chamber
• East zone cold stores have more cold stores chambers with 2 doors compared to other zones
North (n=5646)
East (n=2230)
West (n=3444)
South (n=2535)
All (n=13855)
All (n=13855)
Type H (n=12157)
Type P (n=1702)
Type M (n=1172)
Type Q (n=193)
Other Products (n=101)

© COPYRIGHT 2014 207
13.3 NUMBER OF DOORS
All Figs in %
States
All (n=13855)
Maharashrta (n=1783)
UP (n=3542)
A & N (n=17)
AP (n=1477)
Assam (n=72)
Bihar (n=454)
Chandigarh (n=9)
1 50 68 28 100 48 47 41 56
2 50 32 72 - 52 53 59 44
M E A N 1.5 1.3 1.7 1.0 1.5 1.5 1.6 1.4
All (n=13855)
C’garh (n=213)
Delhi (n=131)
Goa (n=14)
Gujarat (n=1237)
Haryana (n=493)
HP (n=26)
J & K (n=43)
1 50 50 51 36 70 59 62 70
2 50 50 48 64 30 41 38 30
M E A N 1.5 1.5 1.5 1.6 1.3 1.4 1.4 1.3
• State wise analysis shows that average doors were more in UP, Bihar, Uttaranchal, and WB.
CS’s that mentioned Any Chamber

© COPYRIGHT 2014 208
13.3 NUMBER OF DOORS
All Figs in %
States
All (n=13855)
Jharkhand (n=82)
Karnataka (n=416)
Kerala (n=268)
MP (n=410)
Nagaland (n=2)
Orissa (n=85)
Pondicherry (n=6)
Punjab (n=1082)
1 50 73 72 78 44 50 52 83 73
2 50 27 28 22 55 50 48 17 27
M E A N 1.5 1.3 1.3 1.2 1.6 1.5 1.5 1.2 1.3
All (n=13855)
Rajasthan (n=287)
Sikkim (n=12)
TN (n=351)
Tripura (n=30)
Uttaranchal (n=33)
WB (n=1280)
North East (n=116)
1 50 47 100 82 65 6 28 59
2 50 53 - 18 35 94 72 41
M E A N 1.5 1.5 1.0 1.2 1.4 1.9 1.7 1.4
CS’s that mentioned Any Chamber

© COPYRIGHT 2014 209
13.4 CHAMBER INSULATION - TYPES
All Figs in %
• At all India level 71% of chambers have add-on panel insulation using thermacol/EPS/XPS. The trend is same by type of products stored.
• PUF sandwich panels and fillers are also used in 12% of chambers each.
Add-on slabs (Thermocol / EPS / XPS)
PUF Sandwich Panel
Fillers (Husk / Raw / Rock / Wool / Stardust)
MIX
DK / CS
71
12
12
1
1
73
10
14
1
1
70
21
6
1
1
61
33
3
0
2
70
24
5
0
1
64
14
8
3
11
All (n=13855)
Type H (n=12157)
Type P (n=1702)
Type M (n=1172)
Type Q (n=193)
Other Products (n=101)
CS’s that mentioned Any Chamber

© COPYRIGHT 2014 210
13.4 CHAMBER INSULATION - TYPES
All Figs in %
Zone Wise
• Zone wise analysis shows that East zone use more of add-on panel insulation compared to others.
• Though North also uses add-on panel in most cases, the usage of fillers for insulation is higher compared to other zones
71
12
12
1
1
63
4
27
1
1
88
4
6
1
0
73
23
2
0
1
72
24
0
0
2
Add-on slabs (Thermocol / EPS / XPS)
PUF Sandwich Panel
Fillers (Husk / Raw / Rock / Wool / Stardust)
MIX
DK / CS
All (n=13855)
North (n=5646)
East (n=2230)
West (n=3444)
South (n=2535)
CS’s that mentioned Any Chamber

© COPYRIGHT 2014 211
13.4 CHAMBER INSULATION - TYPES
All Figs in %
States
All (n=13855)
Maharashrta (n=1783)
UP (n=3542)
A & N (n=17)
AP (n=1477)
Assam (n=72)
Bihar (n=454)
Chandigarh (n=9)
Add-on slabs (Thermocol / EPS / XPS)
71 72 54 65 79 94 89 33
PUF Sandwich Panel 12 22 2 35 18 - 1 44
Fillers (Husk / Raw / Rock / Wool / Stardust)
12 2 37 - - 6 5 -
MIX 1 1 5 - 0 - 5 -
DK / CS 1 2 1 - 1 - - -
All (n=13855)
C’garh (n=213)
Delhi (n=131)
Goa (n=14)
Gujarat (n=1237)
Haryana (n=493)
HP (n=26)
J & K (n=43)
Add-on slabs (Thermocol / EPS / XPS)
71 91 56 21 72 62 92 47
PUF Sandwich Panel 12 3 30 79 26 12 8 35
Fillers (Husk / Raw / Rock / Wool / Stardust)
12 5 8 - 0 20 - 19
MIX 1 - 2 - 1 - - -
DK / CS 1 - - - 0 1 - -
• There is a quite variation across states. • UP, Haryana and HP, though add-on insulation is more prevalent, fillers are also used in a
considerable number of chambers. • In Chandigarh, Goa and J&K, PUF is the most used insulation • In AP and Chhattisgarh, mainly add-on insulation is used
CS’s that mentioned Any Chamber

© COPYRIGHT 2014 212
13.4 CHAMBER INSULATION - TYPES
All Figs in %
States
All (n=13855)
Jharkhand (n=82)
Karnataka (n=416)
Kerala (n=268)
MP (n=410)
Nagaland (n=2)
Orissa (n=85)
Pondicherry (n=6)
Punjab (n=1082)
Add-on slabs (Thermocol / EPS / XPS)
71 88 61 62 80 100 79 50 91
PUF Sandwich Panel 12 - 30 35 13 - 12 50 3
Fillers (Husk / Raw / Rock / Wool / Stardust)
12 1 0 0 5 - 5 - 4
MIX 1 2 1 2 1 - 2 - 1
DK / CS 1 - 6 0 0 - - - 1
All (n=13855)
Rajasthan (n=287)
Sikkim (n=12)
TN (n=351)
Tripura (n=30)
Uttaranchal (n=33)
WB (n=1280)
North East (n=116)
Add-on slabs (Thermocol / EPS / XPS)
71 77 33 62 73 85 88 83
PUF Sandwich Panel 12 9 - 34 - - 5 -
Fillers (Husk / Raw / Rock / Wool / Stardust)
12 10 42 2 27 6 7 15
MIX 1 - - 1 - 9 0 -
DK / CS 1 3 25 0 - - 0 3
• In Jharkhand, WB, Punjab and MP add-on panels are mainly used • In South – Kerala, Karnataka and TN, PUF is the second used insulation after add-on insulation
CS’s that mentioned Any Chamber

© COPYRIGHT 2014 213
All (n=13855)
Mild Chill >10C Frozen below 0C Chill betn. 0 & 10C DK/CS
13.5 TEMPERATURE ZONES FOR VARIOUS TYPES OF CHAMBER INSULATIONS
All Figs in %
4
72 8
16
9
40
23
29
3
74 7
16 1
94
1
4
2
87
11
Add on Panel (Thermocol/ EPS / XPS) (n=9804)
Fillers (Husk / Raw / Rock / Wool / Stardust)
(n=1728) MIX
(n=84)
PUF Sandwich Panel (n=1721)
• More than 85% of the CS using MIX & over 94% CS using Fillers has chilling between 0-10 C. • 23% of the CS using PUF panels are frozen chambers.
CS’s that mentioned Any Chamber

© COPYRIGHT 2014 214
13.6 CHAMBER INSULATION - THICKNESS
All Figs in %
• Insulation thickness is highest in the Type M cold storages • The modal value of thickness of insulation is 70-100 mm. • The thickness of insulation ranges from 1- 10 mm to 126-155 mm thickness. • Around 60% of all chambers had over 50 mm insulation.
1- 30 mm
30-50 mm
50-70 mm
70 - 100 mm
Above 100 mm
DK / CS
15
13
11
26
22
9
15
13
11
27
21
9
22
11
8
19
30
7
18
8
5
15
38
10
23
7
11
18
33
3
22
8
31
4
18
18
CS’s that mentioned Any Chamber
All (n=13855)
Type H (n=12157)
Type P (n=1702)
Type M (n=1172)
Type Q (n=193)
Other Products (n=101)
Mean 74.0 73.3 73.5 83.4 74.6 59.2

© COPYRIGHT 2014 215
13.6 CHAMBER INSULATION - THICKNESS
All Figs in %
Zone Wise
• Analysis by zone, reveals that 70% of chambers in West had over 50 mm thickness in insulation followed by South with 60% and East with 55%.
• In North this percentage drops to 53%.
15
13
11
26
22
9
14
14
11
19
23
11
20
16
9
28
18
7
12
10
10
35
26
6
20
10
13
27
20
8
1- 30 mm
30-50 mm
50-70 mm
70 - 100 mm
Above 100 mm
DK / CS
CS’s that mentioned Any Chamber
All (n=13855)
North (n=5646)
East (n=2230)
West (n=3444)
South (n=2535)
Mean 74.0 74.8 67.9 79.8 69.8

© COPYRIGHT 2014 216
13.6 CHAMBER INSULATION - THICKNESS
All Figs in %
States
All (n=13855)
Maharashrta (n=1783)
UP (n=3542)
A & N (n=17)
AP (n=1477)
Assam (n=72)
Bihar (n=454)
Chandigarh (n=9)
1- 30 mm 15 17 17 24 15 34 30 0
30-50 mm 13 13 18 12 10 13 14 78
50-70 mm 11 11 13 24 17 34 5 -
70 - 100 mm 26 32 14 24 24 11 22 -
Above 100 mm 22 18 18 12 25 0 17 22
DK / CS 9 6 9 6 7 9 9 -
Mean Thickness 74.0 69.9 66.0 57.6 74.9 40.5 61.7 61.6
All (n=13855)
C’garh (n=213)
Delhi (n=131)
Goa (n=14)
Gujarat (n=1237)
Haryana (n=493)
HP (n=26)
J & K (n=43)
1- 30 mm 15 12 3 7 3 9 0 26
30-50 mm 13 9 2 0 6 7 0 0
50-70 mm 11 2 2 21 7 8 4 2
70 - 100 mm 26 28 31 - 37 32 35 47
Above 100 mm 22 36 57 71 40 18 8 21
DK / CS 9 7 5 - 4 6 54 5
Mean Thickness 74.0 93.7 109.7 97.3 96.1 80.3 91.8 74.1
• There are variations across states on thickness of insulation. • Delhi, Uttaranchal, Goa and Gujarat had over 80% of chambers having over 50 mm insulation
compared to other states • Chandigarh had only 22% chambers which was having higher than 50 mm insulation. This is one
of the lower percentages after Sikkim (0%), Tripura(0%), Nagaland(0%) and Kerala (15%)
CS’s that mentioned Any Chamber

© COPYRIGHT 2014 217
13.6 CHAMBER INSULATION - THICKNESS
All Figs in % Those mentioned any chamber in Q15an1
States
All (n=13855)
Jharkhand (n=82)
Karnataka (n=416)
Kerala (n=268)
MP (n=410)
Nagaland (n=2)
Orissa (n=85)
Pondicherry (n=6)
Punjab (n=1082)
1- 30 mm 15 63 23 50 11 100 41 17 9
30-50 mm 13 5 17 5 11 0 14 0 8
50-70 mm 11 - 8 1 13 - - 83 8
70 - 100 mm 26 29 40 8 40 - 4 - 29
Above 100 mm 22 0 5 6 11 0 34 0 24
DK / CS 9 1 7 22 10 - 6 - 22
Mean Thickness 74.0 31.9 59.4 43.1 72.0 5.5 65.4 51.3 83.4
All (n=13855)
Rajasthan (n=287)
Sikkim (n=12)
TN (n=351)
Tripura (n=30)
Uttaranchal (n=33)
WB (n=1280)
North East (n=116)
1- 30 mm 15 9 63 17 54 0 9 53
30-50 mm 13 3 0 1 0 0 19 7
50-70 mm 11 1 - 9 - 21 14 14
70 - 100 mm 26 6 - 34 - 58 35 4
Above 100 mm 22 75 0 24 12 18 17 6
DK / CS 9 6 38 8 15 - 6 9
Mean Thickness 74.0 115.5 11.1 78.3 40.1 89.6 71.1 37.0

© COPYRIGHT 2014 218
13.7 THICKNESS BY THE VARIOUS CHAMBER INSULATION TYPES
All Figs in %
1- 30 mm
31-50 mm
51-70 mm
70 - 100 mm
Above 100 mm
Any other (specify) in mm
DK / CS
15
13
11
26
22
5
9
16
14
12
27
22
1
8
18
11
8
10
20
25
9
23
8
2
33
10
20
4
11
7
10
35
30
2
5
All (n=13855)
Add on Panel (Thermocol/
EPS / XPS) (n=9840)
Fillers (Husk / Raw / Rock /
Wool / Stardust) (n=1728)
MIX (n=84)
PUF Sandwich Panel
(n=1721)
• Two thirds of the PUF sandwich panels have more than 70mm thickness.
CS’s that mentioned Any Chamber
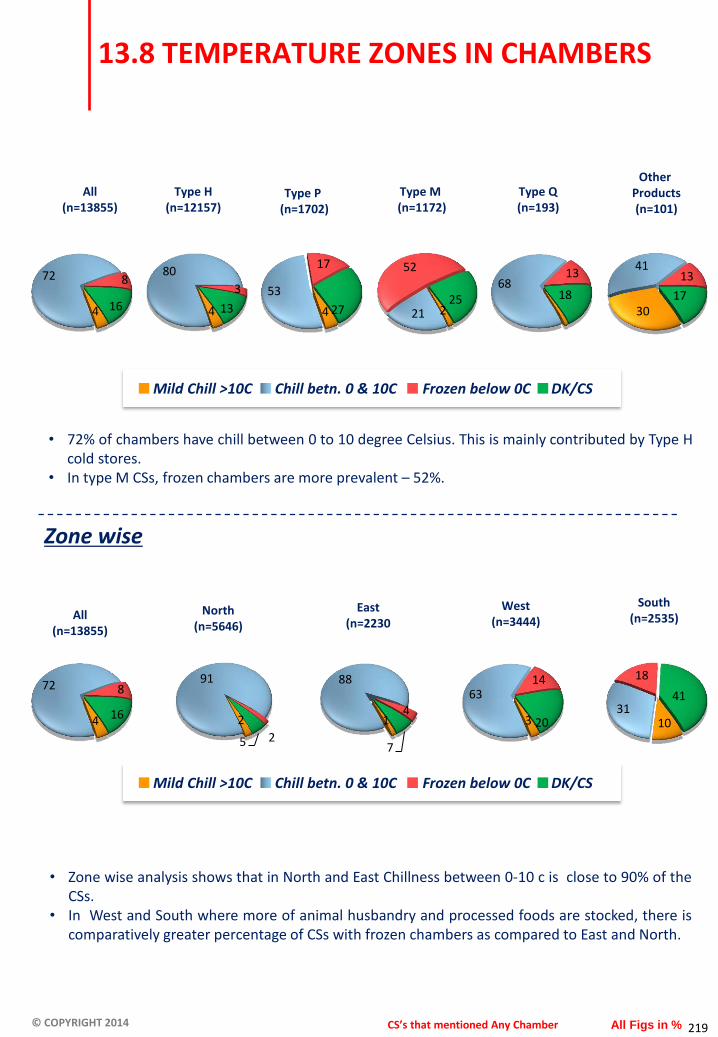
© COPYRIGHT 2014 219
Mild Chill >10C Frozen below 0C Chill betn. 0 & 10C DK/CS
13.8 TEMPERATURE ZONES IN CHAMBERS
All Figs in %
4
72 8
16
• 72% of chambers have chill between 0 to 10 degree Celsius. This is mainly contributed by Type H cold stores.
• In type M CSs, frozen chambers are more prevalent – 52%.
Zone wise
30
41 13
17 4
80
3
13 4
53
17
27 2 21
52
25 68
13
18
4
72 8
16 10
31
18
41
2
91
2 5
1
88
4
7
3
63 14
20
Mild Chill >10C Frozen below 0C Chill betn. 0 & 10C DK/CS
• Zone wise analysis shows that in North and East Chillness between 0-10 c is close to 90% of the CSs.
• In West and South where more of animal husbandry and processed foods are stocked, there is comparatively greater percentage of CSs with frozen chambers as compared to East and North.
CS’s that mentioned Any Chamber
All (n=13855)
Type H (n=12157)
Type P (n=1702)
Type M (n=1172)
Type Q (n=193)
Other Products (n=101)
All (n=13855)
North (n=5646)
East (n=2230
West (n=3444)
South (n=2535)

© COPYRIGHT 2014 220
13.8 TEMPERATURE ZONES IN CHAMBERS
All Figs in %
• In all states, chillness is reported between 0- 10 degree Celsius predominantly. • Frozen temperatures were reported higher in Goa, Kerala and Andaman and Nicobar.
States
All (n=13855)
Maharashrta (n=1783)
UP (n=3542)
A & N (n=17)
AP (n=1477)
Assam (n=72)
Bihar (n=454)
Chandigarh (n=9)
Mild Chill >10 0 C 4 3 1 24 12 - 2 -
Chill betn. 0 0 & 10 0C 72 57 97 12 29 83 88 67
Frozen below -18 0C 8 16 0 41 9 6 - 33
DK / CS 16 25 1 24 50 11 10 -
All (n=13855)
C’garh (n=213)
Delhi (n=131)
Goa (n=14)
Gujarat (n=1237)
Haryana (n=493)
HP (n=26)
J & K (n=43)
Mild Chill >10 0 C 4 4 18 - 2 9 - 2
Chill betn. 0 0 & 10 0C 72 70 36 14 63 71 65 40
Frozen below -18 0C 8 10 24 36 18 8 - -
DK / CS 16 17 22 50 16 13 35 58
All (n=13855)
Jharkhand (n=82)
Karnataka (n=416)
Kerala (n=268)
MP (n=410)
Nagaland (n=2)
Orissa (n=85)
Pondicherry (n=6)
Punjab (n=1082)
Mild Chill >10 0 C 4 - 13 - 4 - 1 - 1
Chill betn. 0 0 & 10 0C 72 100 35 15 85 100 47 100 96
Frozen below -18 0C 8 - 13 62 1 - 22 - 1
DK / CS 16 - 39 23 10 - 29 - 1
All (n=13855)
Rajasthan (n=287)
Sikkim (n=12)
TN (n=351)
Tripura (n=30)
Uttaranchal (n=33)
WB (n=1280)
North East (n=116)
Mild Chill >10 0 C 4 2 13 7 - 6 1 1
Chill betn. 0 0 & 10 0C 72 59 63 45 100 88 94 91
Frozen below -18 0C 8 5 - 26 - - 2 3
DK / CS 16 34 25 23 - 6 3 6
CS’s that mentioned Any Chamber
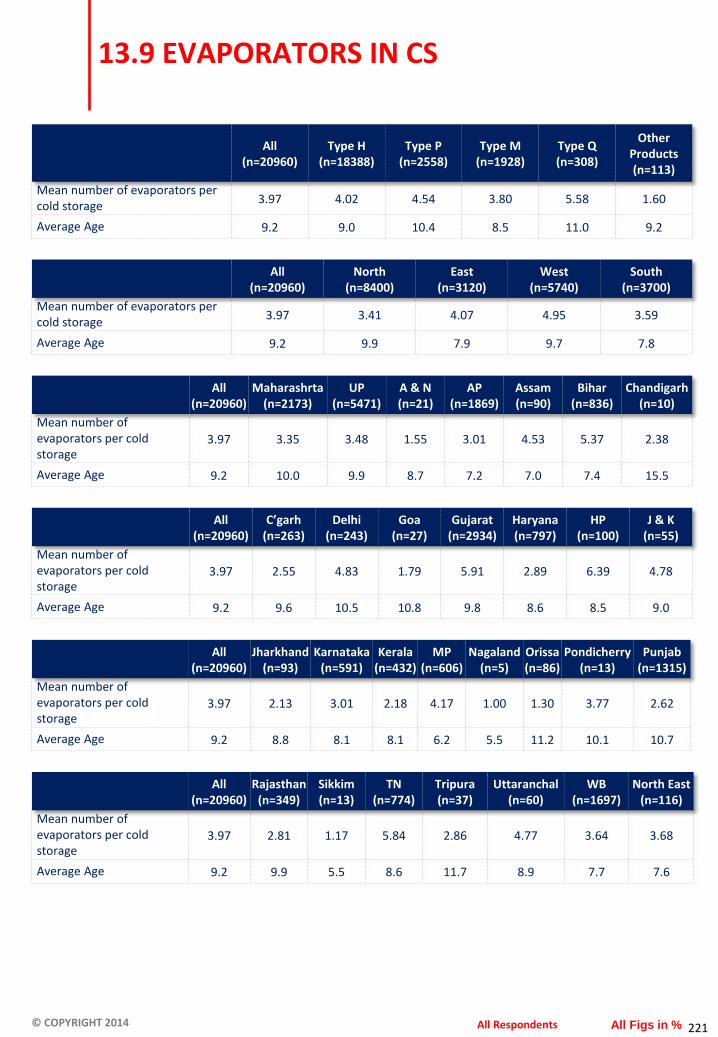
© COPYRIGHT 2014 221
13.9 EVAPORATORS IN CS
All (n=20960)
Type H (n=18388)
Type P (n=2558)
Type M (n=1928)
Type Q (n=308)
Other Products (n=113)
Mean number of evaporators per cold storage
3.97 4.02 4.54 3.80 5.58 1.60
Average Age 9.2 9.0 10.4 8.5 11.0 9.2
All (n=20960)
North (n=8400)
East (n=3120)
West (n=5740)
South (n=3700)
Mean number of evaporators per cold storage
3.97 3.41 4.07 4.95 3.59
Average Age 9.2 9.9 7.9 9.7 7.8
All (n=20960)
Maharashrta (n=2173)
UP (n=5471)
A & N (n=21)
AP (n=1869)
Assam (n=90)
Bihar (n=836)
Chandigarh (n=10)
Mean number of evaporators per cold storage
3.97 3.35 3.48 1.55 3.01 4.53 5.37 2.38
Average Age 9.2 10.0 9.9 8.7 7.2 7.0 7.4 15.5
All (n=20960)
C’garh (n=263)
Delhi (n=243)
Goa (n=27)
Gujarat (n=2934)
Haryana (n=797)
HP (n=100)
J & K (n=55)
Mean number of evaporators per cold storage
3.97 2.55 4.83 1.79 5.91 2.89 6.39 4.78
Average Age 9.2 9.6 10.5 10.8 9.8 8.6 8.5 9.0
All (n=20960)
Jharkhand (n=93)
Karnataka (n=591)
Kerala (n=432)
MP (n=606)
Nagaland (n=5)
Orissa (n=86)
Pondicherry (n=13)
Punjab (n=1315)
Mean number of evaporators per cold storage
3.97 2.13 3.01 2.18 4.17 1.00 1.30 3.77 2.62
Average Age 9.2 8.8 8.1 8.1 6.2 5.5 11.2 10.1 10.7
All (n=20960)
Rajasthan (n=349)
Sikkim (n=13)
TN (n=774)
Tripura (n=37)
Uttaranchal (n=60)
WB (n=1697)
North East (n=116)
Mean number of evaporators per cold storage
3.97 2.81 1.17 5.84 2.86 4.77 3.64 3.68
Average Age 9.2 9.9 5.5 8.6 11.7 8.9 7.7 7.6
All Figs in % All Respondents

© COPYRIGHT 2014 222
13.10 COMPRESSORS IN CS
All (n=17923)
Type H (n=15532)
Type P (n=2218)
Type M (n=1835)
Type Q (n=269)
Other Products (n=118)
Mean number of Compressors in CS’s
2.47 2.42 3 2.91 3.97 2.35
Average age 10.1 10.2 10.0 9.0 10.6 12.4
All (n=17923)
North (n=6900)
East (n=3651)
West (n=4039)
South (n=3243)
Mean number of Compressors in CS’s
2.47 2.19 3.14 2.31 2.49
Average age 10.1 10.2 11.8 10.2 8.0
All (n=17923)
Maharashrta (n=2045)
UP (n=4526)
A & N (n=22)
AP (n=1705)
Assam (n=86)
Bihar (n=574)
Chandigarh (n=9)
Mean number of Compressors in CS’s
2.47 2.29 2.25 1.64 2.26 1.32 2.28 2
Average age 10.1 10.2 10.4 8.5 7.9 8.3 11.3 12.2
All Figs in % All Respondents
All (n=17923)
C’garh (n=236)
Delhi (n=199)
Goa (n=30)
Gujarat (n=1455)
Haryana (n=653)
HP (n=60)
J & K (n=49)
Mean number of Compressors in CS’s
2.47 1.65 3.44 2.71 2.4 1.85 3.92 1.73
Average age 10.1 9.9 10.4 8.6 10.5 8.2 6.7 12.3
All (n=17923)
Jharkhand (n=90)
Karnataka (n=525)
Kerala (n=483)
MP (n=509)
Nagaland (n=5)
Orissa (n=94)
Pondicherry (n=12)
Punjab (n=1144)
Mean number of Compressors in CS’s
2.47 1.8 2.14 2.46 2.07 1 1.72 4.83 1.76
Average age 10.1 10.4 7.9 8.1 9.6 5.5 12.2 10.5 10.8
All (n=17923)
Rajasthan (n=312)
Sikkim (n=12)
TN (n=496)
Tripura (n=30)
Uttaranchal (n=38)
WB (n=2524)
North East (n=133)
Mean number of Compressors in CS’s
2.47 1.94 1 3.71 2.06 2.14 3.49 1.64
Average age 10.1 10.8 5.5 8.3 9.5 12.9 12.5 7.6
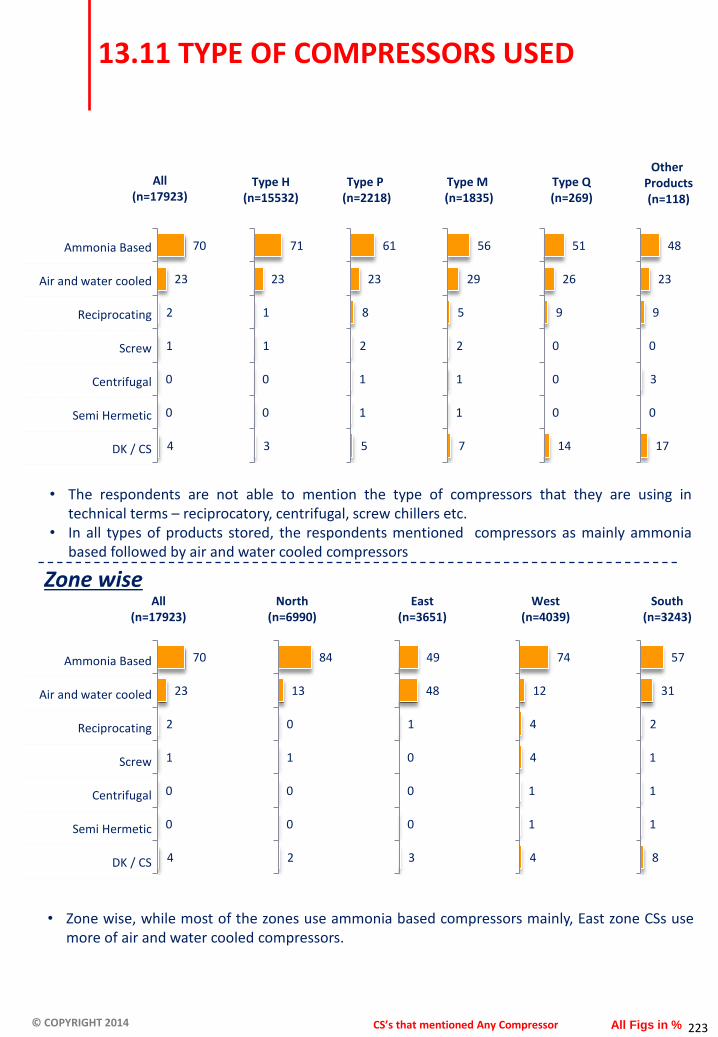
© COPYRIGHT 2014 223
13.11 TYPE OF COMPRESSORS USED
All Figs in %
Ammonia Based
Air and water cooled
Reciprocating
Screw
Centrifugal
Semi Hermetic
DK / CS
70
23
2
1
0
0
4
48
23
9
0
3
0
17
71
23
1
1
0
0
3
61
23
8
2
1
1
5
56
29
5
2
1
1
7
51
26
9
0
0
0
14
70
23
2
1
0
0
4
57
31
2
1
1
1
8
84
13
0
1
0
0
2
49
48
1
0
0
0
3
74
12
4
4
1
1
4
• The respondents are not able to mention the type of compressors that they are using in technical terms – reciprocatory, centrifugal, screw chillers etc.
• In all types of products stored, the respondents mentioned compressors as mainly ammonia based followed by air and water cooled compressors
• Zone wise, while most of the zones use ammonia based compressors mainly, East zone CSs use more of air and water cooled compressors.
Zone wise
Ammonia Based
Air and water cooled
Reciprocating
Screw
Centrifugal
Semi Hermetic
DK / CS
CS’s that mentioned Any Compressor
All (n=17923)
Type H (n=15532)
Type P (n=2218)
Type M (n=1835)
Type Q (n=269)
Other Products (n=118)
All (n=17923)
North (n=6990)
East (n=3651)
West (n=4039)
South (n=3243)

© COPYRIGHT 2014 224
13.11 TYPE OF COMPRESSORS USED
All Figs in %
States
• State wise analysis shows while most of the states mainly use ammonia based compressors, states like Sikkim, WB, Kerala and Karnataka use air and water cooled compressors
All (n=17923)
Maharashrta (n=2045)
UP (n=4526)
A & N (n=22)
AP (n=1705)
Assam (n=86)
Bihar (n=574)
Chandigarh (n=9)
Ammonia Based 70 58 84 - 74 62 94 100
Air and water cooled 23 19 15 - 15 35 5 -
Reciprocating 2 8 - - 1 - 0 -
Screw 1 8 - - 1 - - -
Centrifugal 0 1 - 9 1 - - -
Semi Hermetic 0 1 - 5 1 - - -
DK / CS 4 6 1 86 7 3 1 -
All (n=17923)
C’garh (n=236)
Delhi (n=199)
Goa (n=30)
Gujarat (n=1455)
Haryana (n=653)
HP (n=60)
J & K (n=49)
Ammonia Based 70 84 46 57 90 84 72 67
Air and water cooled 23 13 24 23 7 9 25 -
Reciprocating 2 2 8 3 1 - - 27
Screw 1 - - - 1 2 - 6
Centrifugal 0 - 1 13 1 - - -
Semi Hermetic 0 - - - 0 - 3 -
DK / CS 4 1 22 3 0 4 - -
CS’s that mentioned Any Compressor

© COPYRIGHT 2014 225
13.11 TYPE OF COMPRESSORS USED
All Figs in %
States
All (n=17923)
Rajasthan (n=312)
Sikkim (n=12)
TN (n=496)
Tripura (n=30)
Uttaranchal (n=38)
WB (n=2524)
North East (n=133)
Ammonia Based 70 86 33 50 87 100 32 66
Air and water cooled 23 7 58 32 13 - 64 31
Reciprocating 2 - - 7 - - 1 -
Screw 1 7 - 1 - - - -
Centrifugal 0 - - - - - - -
Semi Hermetic 0 - - 1 - - 0 -
DK / CS 4 - 8 9 - - 4 3
All (n=17923)
Jharkhand (n=90)
Karnataka (n=525)
Kerala (n=483)
MP (n=509)
Nagaland (n=5)
Orissa (n=94)
Pondicherry (n=12)
Punjab (n=1144)
Ammonia Based 70 74 36 30 93 100 89 42 91
Air and water cooled 23 26 51 66 2 - 9 - 7
Reciprocating 2 - 3 - 1 - - 17 0
Screw 1 - 2 - - - - - -
Centrifugal 0 - 0 - - - - - -
Semi Hermetic 0 - - 0 1 - - - 0
DK / CS 4 - 8 3 4 - 2 42 1
CS’s that mentioned Any Compressor

© COPYRIGHT 2014 226
24
27
35
14
26
24
37
13
13.12 SAFETY – EMERGENCY DOOR RELEASE AMONG ALL COLD STORES AND AMONG THOSE WHO HAVE AVAILED SUBSIDIES
All Figs in %
All (n=5003)
Emergency Door Release from inside Both
Emergency Bell on inside None
All Those who availed Subsidies (n=2079)
• Overall two thirds (adding ‘both’ to both the systems) use either emergency door system from inside or emergency bell system from inside.
• The situation is similar even among cold stores who have availed subsidies

© COPYRIGHT 2014 227
11 26
56
7
• Zone wise details vary with each zone • In North 70% have emergency door release system while only 48% have bell onside • In East 66% and 68% have emergency door and emergency bell respectively • In West, only 40% have emergency door release system while 74% have emergency bell • In South around 68% have emergency door release system and 71% have bell inside
26
24 37
13
• Around two thirds have either emergency door release system from inside or bell inside in all types of cold stores except Type M.
• In type M 89% cold stores have emergency bell inside while 50% have emergency door release system from inside
Emergency Door Release from inside Emergency Bell on inside None Both
Zone wise
North (n=2142)
East (n=803)
West (n=1013)
South (n=1045)
28
21 37
14 20
27
42
12 26
30 40
5 7
46
43
4
16 18
52
13 26
24 37
13
Emergency Door Release from inside Emergency Bell on inside None Both
38
17 32
13 13
47 27
14 20
22
46
11
All (n=5003)
All (n=5003)
Type H (n=4333)
Type P (n=523)
Type M (n=452)
Type Q (n=44)
Other Products
(n=27)
13.13 SAFETY – EMERGENCY DOOR RELEASE
All Figs in % All Respondents

© COPYRIGHT 2014 228
All (n=5003)
Maharashtra (n=451)
UP (n=1371)
A & N (n=10)
AP (n=600)
Assam (n=22)
Bihar (n=169)
Chandigarh (n=3)
Emergency Door Release from inside
26 7 48 - 13 23 15 -
Emergency Bell on inside 24 49 17 60 13 36 31 33
Both 37 37 19 30 58 36 38 33
None 13 6 16 10 16 5 15 33
All (n=5003)
C’garh (n=76)
Delhi (n=35)
Goa (n=7)
Gujarat (n=399)
Haryana (n=185)
HP (n=14)
J & K (n=16)
Emergency Door Release from inside
26 18 26 14 18 9 7 31
Emergency Bell on inside 24 20 29 57 50 4 29 44
Both 37 61 46 - 12 78 36 13
None 13 1 - 29 21 9 29 13
All (n=5003)
Jharkhand (n=19)
Karnataka (n=188)
Kerala (n=143)
MP (n=156)
Nagaland (n=1)
Orissa (n=38)
Pondicherry (n=2)
Punjab (n=402)
Emergency Door Release from inside
26 21 36 1 17 - 13 - 27
Emergency Bell on inside 24 68 10 52 29 100 29 50 22
Both 37 11 37 44 38 - 37 50 43
None 13 - 17 2 16 - 21 - 7
All (n=5003)
Rajasthan (n=104)
Sikkim (n=5)
TN (n=102)
Tripura (n=9)
Uttaranchal (n=12)
WB (n=464)
North East (n=37)
Emergency Door Release from inside
26 15 - 21 22 42 23 19
Emergency Bell on inside 24 4 - 17 67 8 15 41
Both 37 75 40 57 11 42 51 30
None 13 6 60 6 - 8 11 11
States
13.13 SAFETY – EMERGENCY DOOR RELEASE
All Figs in % All Respondents

© COPYRIGHT 2014 229
13.14 SAFETY: FIRE FIGHTING & DETECTION SYSTEM
All Figs in % All Respondents
Gas Based/Extinguishers
Sand Box
Manual rounds
Hose/Hydrant
Sprinklers
Smoke Detectors
Heat Sensors
Others
• Multiple systems are used by cold stores to detect fire. Gas based extinguishers are the mainly used fire fighting and detection systems. They are utilized in varied proportions across different types of cold stores.
• While different types of extinguishers are used to put down fire, only 16% have smoke detectors. Most CSs rely on manual rounds only to detect smoke/fire
Zone wise
• More than 80% of Eastern zone storages use gas based fire fighting systems for safety measures.
• More than 50% of the storages in North & East use manual rounds.
67
48
26
15
11
30
19
4
74
46
48
19
16
16
12
3
69
46
39
17
22
22
18
4
79
65
35
34
32
27
31
3
84
41
25
20
18
27
20
2
Gas Based/Extinguishers
Sand Box
Manual rounds
Hose/Hydrant
Sprinklers
Smoke Detectors
Heat Sensors
Others
73
47
46
19
17
16
13
3
64
45
47
10
17
20
15
6
77
44
54
16
21
13
10
3
84
68
54
52
6
13
13
1
64
38
22
10
20
22
18
3
All (n=5003)
Type H (n=4333)
Type P (n=523)
Type M (n=452)
Type Q (n=44)
Other Products
(n=27)
North (n=2142)
East (n=803)
West (n=1013)
South (n=1045)
All (n=5003)
73
47
46
19
18
16
13
3

© COPYRIGHT 2014 230 All Figs in % All Respondents
All (n=5003)
Maharashtra (n=451)
UP (n=1371)
A & N (n=10)
AP (n=600)
Assam (n=22)
Bihar (n=169)
Chandigarh (n=3)
Gas Based/Extinguishers 73 79 88 70 64 23 69 33
Sand Box 47 42 50 - 32 32 38 33
Manual rounds 46 14 66 - 41 18 19 67
Hose/Hydrant 19 16 19 - 2 - 6 -
Sprinklers 17 26 20 - 12 - 4 33
Smoke Detectors 16 31 12 - 22 32 14 33
Heat Sensors 13 22 11 - 9 27 11 -
Others 3 3 1 30 9 14 1 -
All (n=5003)
C’garh (n=76)
Delhi (n=35)
Goa (n=7)
Gujarat (n=399)
Haryana (n=185)
HP (n=14)
J & K (n=16)
Gas Based/Extinguishers 73 89 86 29 46 93 86 75
Sand Box 47 66 40 43 47 69 79 31
Manual rounds 46 46 29 43 25 23 71 38
Hose/Hydrant 19 28 14 14 7 8 14 19
Sprinklers 17 13 11 14 21 38 50 19
Smoke Detectors 16 3 6 29 14 5 7 6
Heat Sensors 13 3 9 - 17 6 7 13
Others 3 1 - 14 3 4 - -
States
13.14 SAFETY: FIRE FIGHTING & DETECTION SYSTEM
• Multiple systems are used in the CSs. Almost 2/3rds of the cold stores in UP use manual rounds for fire fighting and detection.
• Gas based extinguishing systems are used in UP, Bihar, Chhattisgarh, Haryana, HP, Jharkhand, MP, WB and Uttaranchal
• Sand based systems are used in Chhattisgarh, Haryana, HP, Kerala, Orissa, TN, Uttaranchal and WB

© COPYRIGHT 2014 231 All Figs in % All Respondents
States
All (n=5003)
Jharkhand (n=19)
Karnataka (n=188)
Kerala (n=143)
MP (n=156)
Nagaland (n=1)
Orissa (n=38)
Pondicherry (n=2)
Punjab (n=402)
Gas Based/Extinguishers 73 89 35 90 66 - 71 100 37
Sand Box 47 16 42 80 4 - 61 50 18
Manual rounds 46 11 55 45 37 100 11 100 36
Hose/Hydrant 19 16 1 57 2 - - 50 10
Sprinklers 17 5 9 43 1 - 11 50 10
Smoke Detectors 16 11 21 14 13 100 21 - 15
Heat Sensors 13 11 10 39 14 - 18 50 7
Others 3 - 2 2 1 - - - 10
All (n=5003)
Rajasthan (n=104)
Sikkim (n=5)
TN (n=102)
Tripura (n=9)
Uttaranchal (n=12)
WB (n=464)
North East (n=37)
Gas Based/Extinguishers 73 57 20 80 44 100 95 27
Sand Box 47 16 - 76 44 83 86 30
Manual rounds 46 39 40 70 44 58 75 30
Hose/Hydrant 19 6 - 11 22 17 83 5
Sprinklers 17 44 - 25 33 17 5 8
Smoke Detectors 16 38 20 20 - 8 13 24
Heat Sensors 13 16 40 25 - - 14 22
Others 3 6 20 1 11 - 1 14
13.14 SAFETY: FIRE FIGHTING & DETECTION SYSTEM

© COPYRIGHT 2014 232
13.14 SAFETY: FIRE FIGHTING & DETECTION SYSTEM – COMPARISON OF BEFORE AND AFTER 2009
All Figs in % All Respondents
All Type H Type P Type M Type Q Other Products
On/After 2009
(n=1183)
Before 2009
(n=3691)
On/After 2009
(n=1034)
Before 2009
(n=3187)
On/After 2009
(n=107)
Before 2009
(n=399)
On/After 2009
(n=106)
Before 2009
(n=339)
On/After 2009 (n=6)
Before 2009
(n=35)
On/After 2009 (n=6)
Before 2009
(n=20)
Gas Based/Extinguishers
66 75 67 75 62 71 76 79 83 86 67 70
Sand Box 43 48 42 46 44 47 69 64 83 31 50 45
Manual rounds 45 46 47 48 41 40 30 37 33 26 33 25
Hose/Hydrant 13 21 12 21 18 16 27 36 33 20 33 10
Sprinklers 16 18 15 16 19 23 33 32 17 14 17 10
Smoke Detectors 16 17 14 16 26 20 32 25 33 20 67 20
Heat Sensors 11 14 10 12 22 16 26 32 33 17 50 10
Others 4 3 4 3 2 5 1 4 - 3 - 5
74
46
48
19
16
16
12
3
69
46
39
17
22
22
18
4
79
65
35
34
32
27
31
3
84
41
25
20
18
27
20
2
All (n=5003)
Type H (n=4333)
Type P (n=523)
Type M (n=452)
Type Q (n=44)
Other Products
(n=27)
73
47
46
19
18
16
13
3
Gas Based/Extinguishers
Sand Box
Manual rounds
Hose/Hydrant
Sprinklers
Smoke Detectors
Heat Sensors
Others
67
48
26
15
11
30
19
4

© COPYRIGHT 2014 233
13.14 SAFETY: FIRE FIGHTING & DETECTION SYSTEM
All Figs in % All Respondents
All North East West South
On/After 2009
(n=1183)
Before 2009
(n=3691)
On/After 2009
(n=391)
Before 2009
(n=1654)
On/After 2009
(n=140)
Before 2009
(n=656)
On/After 2009
(n=245)
Before 2009
(n=750)
On/After 2009
(n=407)
Before 2009
(n=631)
Gas Based/Extinguishers
66 75 77 77 84 85 59 66 53 71
Sand Box 43 48 42 44 66 69 40 37 39 48
Manual rounds 45 46 48 56 49 55 21 22 56 41
Hose/Hydrant 13 21 13 15 44 54 6 11 8 12
Sprinklers 16 18 21 21 7 6 19 21 13 19
Smoke Detectors 16 17 16 12 12 14 17 23 16 23
Heat Sensors 11 14 12 10 11 13 16 19 8 19
Others 4 3 3 3 2 1 3 3 5 7
• Gas based and sand boxes are more prevalent in Eastern zone. • The proportion of storages with extinguishers have fallen by one fourth in the South in CSs
installed post 2009.
Gas Based/Extinguishers
Sand Box
Manual rounds
Hose/Hydrant
Sprinklers
Smoke Detectors
Heat Sensors
Others
73
47
46
19
18
16
13
3
64
45
47
10
17
20
15
6
77
44
54
16
21
13
10
3
84
68
54
52
6
13
13
1
64
38
22
10
20
22
18
3
North (n=2142)
East (n=803)
West (n=1013)
South (n=1045)
All (n=5003)

© COPYRIGHT 2014 234
13.15 REFRIGERANT GAS USED
All Figs in %
Ammonia
Freon
Carbon Dioxide
Others
All (n=17923)
Type H (n=15532)
Type P (n=2218)
Type M (n=1835)
Type Q (n=269)
Other Products (n=118)
89
10
0
2
All (n=17923)
North (n=6990)
East (n=3651)
West (n=4039)
South (n=3243)
• Out of 17923 compressors, Ammonia is the most commonly used – 89% - refrigerant gas across all type of cold stores.
• It should be noted that when we asked the type of compressors used, 70% CSs reported having ammonia based compressors. But when asked specifically about gas used, 89% have reported using ammonia
Zone wise
88
14
0
3
91
8
0
2
84
16
0
2
74
26
0
1
80
19
0
1
Ammonia
Freon
Carbon Dioxide
Others
89
10
0
2
66
27
0
7
98
3
0
0
96
4
0
0
85
15
0
1
• Ammonia is predominantly used in cold stores located in the Northern, Eastern and Western zones.
• In the Southern zone too ammonia gas is used, however 1/4th of them also use Freon.
CS’s that mentioned Any Compressor

© COPYRIGHT 2014 235
13.15 REFRIGERANT GAS USED
All Figs in %
States
All (n=17923)
Maharashrta (n=2045)
UP (n=4526)
A & N (n=22)
AP (n=1705)
Assam (n=86)
Bihar (n=574)
Chandigarh (n=9)
Ammonia 89 76 100 55 81 97 100 100
Freon 10 25 0 68 7 - - -
Carbon Dioxide - 1 0 - 0 - 0 -
Others 2 1 0 - 13 3 - -
All (n=17923)
C’garh (n=236)
Delhi (n=199)
Goa (n=30)
Gujarat (n=1455)
Haryana (n=653)
HP (n=60)
J & K (n=49)
Ammonia 89 95 79 77 93 91 72 100
Freon 10 5 35 23 7 9 28 -
Carbon Dioxide - 3 - - - - - -
Others 2 - - - - 1 - -
All (n=17923)
Jharkhand (n=90)
Karnataka (n=525)
Kerala (n=483)
MP (n=509)
Nagaland (n=5)
Orissa (n=94)
Pondicherry (n=12)
Punjab (n=1144)
Ammonia 89 100 47 38 100 100 98 42 100
Freon 10 - 51 62 - - 4 58 -
Carbon Dioxide - - 1 - - - - - 0
Others 2 - 2 1 - - - - 0
All (n=17923)
Rajasthan (n=312)
Sikkim (n=12)
TN (n=496)
Tripura (n=30)
Uttaranchal (n=38)
WB (n=2524)
North East (n=133)
Ammonia 89 92 - 64 100 100 95 92
Freon 10 7 63 35 - - 5 4
Carbon Dioxide - - 38 - - - 0 2
Others 2 0 - 1 - - 0 2
CS’s that mentioned Any Compressor

© COPYRIGHT 2014 236
13.16 TYPE OF FREON GAS USED
All Figs in % Those mentioned Freon in Q19b
R22
R404A
R12
R134a
R401A
R143
R407A
R408A
R406A
R414
All (n=1807)
Type H (n=1197)
Type P (n=359)
Type M (n=479)
Type Q (n=50)
Other Products
(n=16)
56
24
7
5
2
2
1
1
1
0
• Of the 1807 compressors where Freon gas is used, majority of Type P, M & Q storages use R404A type of Freon gas. However in Type H cold stores usage of R22 prevails by a sizeable number which is to be replaced as per directive. It is also found that R12 is still in vogue which should have been replaced by now.
• R22 is used relatively by a higher proportion of cold stores in the East, West and South. • 30% of CS’s in North use R22 and 23% of CS in East use R12
Zone wise
44
0
38
0
0
19
0
0
0
0
66
15
7
6
3
3
0
0
0
0
37
39
8
10
7
6
2
0
0
1
35
44
10
4
1
1
1
3
1
0
14
52
10
0
0
0
24
0
0
0
R22
R404A
R12
R134a
R401A
R143
R407A
R408A
R406A
R414
All (n=1807)
North (n=182)
East (n=141)
West (n=611)
South (n=873)
56
24
7
5
2
2
1
1
1
0
52
32
4
7
3
2
2
2
1
0
30
18
16
5
8
2
3
0
0
0
59
13
23
1
0
0
0
0
0
0
67
17
6
5
1
3
0
0
1
0

© COPYRIGHT 2014 237
13.16 TYPE OF FREON GAS USED
All Figs in % CS’s that use Freon gas for refrigeration
States
• 33% cold stores in Haryana use R404A. • In Maharashtra usage of R22 prevails in 73% of the CS’s.
All (n=1807)
Maharashrta (n=505)
UP (n=16)
A & N (n=15)
AP (n=114)
Assam (n=--)
Bihar (n=-)
Chandigarh (n=-)
R22 56 73 - 33 29 - - -
R404A 24 18 - 20 25 - - -
R12 7 5 75 40 9 - - -
R134a 5 4 - 13 9 - - -
R401A 2 0 - - 9 - - -
R143 2 3 - - 7 - - -
R407A 1 - - - 11 - - -
R408A 1 0 - - - - - -
R406A 1 0 - - - - - -
R414 0 0 - - - - - -
All (n=1807)
C’garh (n=12)
Delhi (n=69)
Goa (n=7)
Gujarat (n=98)
Haryana (n=57)
HP (n=17)
J & K (n=-)
R22 56 - 29 14 43 23 100 -
R404A 24 - 20 86 8 33 - -
R12 7 83 - - 7 23 - -
R134a 5 17 1 - 10 14 - -
R401A 3 - 22 - 2 - - -
R143 2 - 4 - 4 - - -
R407A 1 - 7 - - - - -
R408A 1 - - - - - - -
R406A 1 - - - 5 - - -
R414 0 - - - - - - -

© COPYRIGHT 2014 238
13.16 TYPE OF FREON GAS USED
All Figs in %
States
• Close to 2/3rds of the storages in Karnataka, WB and TN use R22 type of Freon gas. • More than 1 out of every 2 cold stores use R404A in Kerala.
All (n=1807)
Jharkhand (n=-)
Karnataka (n=267)
Kerala (n=298)
MP (n=1)
Nagaland (n=-)
Orissa (n=4)
Pondicherry (n=7)
Punjab (n=-)
R22 56 - 67 42 - - 75 100 -
R404A 24 - 25 50 - - - - -
R12 7 - 2 5 100 - 25 - -
R134a 5 - 7 4 - - - - -
R401A 3 - 5 - - - - - -
R143 2 - - - - - - - -
R407A 1 - 0 - - - - - -
R408A 1 - - - - - - - -
R406A 1 - - - - - - - -
R414 0 - - - - - - - -
All (n=1807)
Rajasthan (n=23)
Sikkim (n=5)
TN (n=172)
Tripura (n=-)
Uttaranchal (n=-)
WB (n=120)
North East (n=5)
R22 56 22 - 64 - - 67 -
R404A 24 - - 20 - - 16 -
R12 7 22 100 - - - 14 100
R134a 5 - - 8 - - - -
R401A 3 - - 1 - - - -
R143 2 - - 8 - - - -
R407A 1 - - 4 - - - -
R408A 1 - - 9 - - - -
R406A 1 - - 3 - - - -
R414 0 - - - - - - -
CS’s that use Freon gas for refrigeration

© COPYRIGHT 2014 239
13.17 AVERAGE STORAGE CAPACITY OF CS
All Figs in % All Respondents
• Chamber wise capacity was ascertained and total capacity of cold stores arrived at. • Average storage capacity of all CSs was at 5,003 tons. The storage capacity of type H CSs are the
largest at 5,492 tons. The average storage capacity of type M was the lowest at 1,818 tons.
12
6
5
7
7
14
31
18
10
3
4
7
7
16
35
18
20
7
5
6
7
13
20
21
23
24
14
7
4
4
6
18
14
0
14
9
2
16
23
23
19
19
4
15
0
7
22
15
All (n=5003)
Type H (n=4333)
Type P (n=523)
Type M (n=452)
Type Q (n=44)
Other Products
(n=27)
<=100
100-500
500.1-1000
1000.1-2000
2000.1-3000
3000.1-5000
Above 5000
No Response
Unit of measurement – Metric Tonnes

© COPYRIGHT 2014 240
13.17 AVERAGE STORAGE CAPACITY OF CS
All Figs in % All Respondents
7
3
5
8
7
15
39
16
3
4
3
7
6
17
48
12
21
10
6
8
8
11
18
18
20
9
5
4
6
13
15
28
Zone Wise
• CS capacity ranges between less than 10 tons to over 10000 tons • East zone boasts of higher average capacity of CSs followed by North zone. • 39% of North and 48% of East zone CSs have over 5000 tons capacity • South zone has lowest average capacity of 2850 tons. Nearly 34% of CSs have less than 1000
tons capacity.
<=100
100-500
500.1-1000
1000.1-2000
2000.1-3000
3000.1-5000
Above 5000
No Response
12
6
5
7
7
14
31
18
All (n=5003)
North (n=2142)
East (n=803)
West (n=1013)
South (n=1045)
Unit of measurement – Metric Tonnes

© COPYRIGHT 2014 241
13.17 AVERAGE STORAGE CAPACITY OF CS
All Figs in % All Respondents
10
5
5
8
8
17
31
16
21
8
5
5
5
10
30
16
7
6
4
6
6
12
41
17
40
20
0
0
20
0
20
0
OWNERSHIP TYPE
• CS capacity is maximum for private limited company’s – 6,177MT.
<=100
100-500
500.1-1000
1000.1-2000
2000.1-3000
3000.1-5000
Above 5000
No Response
17
5
5
8
7
13
23
22
Proprietorship (n=1336)
Partnership (n=1677)
Company Public Ltd.
(n=174)
Company Private Ltd.
(n=1563)
Association (n=5)
Unit of measurement – Metric Tonnes

© COPYRIGHT 2014 242
13.17 AVERAGE STORAGE CAPACITY OF CS
All Figs in % All Respondents
7
3
5
8
7
15
39
16
3
4
3
7
6
17
48
12
21
10
6
8
8
11
18
18
OWNERSHIP TYPE
• Government owned cold storages have reported the least storage capacity across various ownership types.
<=100
100-500
500.1-1000
1000.1-2000
2000.1-3000
3000.1-5000
Above 5000
No Response
12
6
5
7
7
14
31
18
Association Private (n=12)
Cooperative (n=130)
Government (n=82)
Not mentioned any ownership type
(n=24)
Unit of measurement – Metric Tonnes

© COPYRIGHT 2014 243
13.17 AVERAGE STORAGE CAPACITY OF CS
All Figs in % All Respondents
10
5
5
6
6
14
38
17
9
4
4
7
7
15
39
15
17
8
5
7
7
13
18
23
Urban/Rural/NHB/NHM
<=100
100-500
500.1-1000
1000.1-2000
2000.1-3000
3000.1-5000
Above 5000
No Response
19
7
5
9
9
14
16
21
Urban CS’s (n=1481)
Rural CS’s (n=3522)
NHB/NHM (n=3061)
Others (n=1942)
Unit of measurement – Metric Tonnes
• The mean storage capacity of rural CSs is much higher at 5656 tons compared to 3369 tons of urban CSs.
• Like wise, cold stores assisted by NHM and NHB have higher mean capacity of 5940 compared to 3355 tons of other Cs’s.

© COPYRIGHT 2014 244
13.17 AVERAGE STORAGE CAPACITY OF CS
All Figs in % All Respondents
States
All (n=5003)
Maharashrta (n=451)
UP (n=1371)
A & N (n=10)
AP (n=600)
Assam (n=22)
Bihar (n=169)
Chandigarh (n=3)
<=100 12 33 4 70 14 5 2 33
100-500 6 13 3 - 3 5 1 -
500.1-1000 5 7 5 20 2 5 3 -
1000.1-2000 7 10 4 - 4 5 9 -
2000.1-3000 7 7 4 - 5 14 15 33
3000.1-5000 14 3 12 - 19 23 25 -
Above 5000 31 5 54 - 22 45 44 33
No Response 18 23 12 10 32 - 1 -
MEAN 5003 1706 6559 275 3929 7791 5330 7610
MEDIAN 3996 200 6497 80 3961 4667 4977 1415
All (n=5003)
C’garh (n=76)
Delhi (n=35)
Goa (n=7)
Gujarat (n=399)
Haryana (n=185)
HP (n=14)
J & K (n=16)
<=100 12 7 3 14 16 17 36 6
100-500 6 - 3 29 10 2 - 6
500.1-1000 5 4 20 - 6 7 21 13
1000.1-2000 7 3 17 14 5 26 14 25
2000.1-3000 7 8 14 29 8 16 7 -
3000.1-5000 14 38 26 - 19 14 14 13
Above 5000 31 30 9 - 26 10 - 6
No Response 18 11 9 14 11 8 7 31
MEAN 5003 5699 2969 1168 3706 2401 1196 2226
MEDIAN 3996 4900 2400 440 2994 1821 645 1135
• In Maharashtra, Haryana and Goa, CSs average capacity are smaller while in UP, Assam, Bihar and Chhattisgarh the CSs’ average capacity is large
Unit of measurement – Metric Tonnes

© COPYRIGHT 2014 245
13.17 AVERAGE STORAGE CAPACITY OF CS
All Figs in % All Respondents
States
All (n=5003)
Jharkhand (n=19)
Karnataka (n=188)
Kerala (n=143)
MP (n=156)
Nagaland (n=1)
Orissa (n=38)
Pondicherry (n=2)
Punjab (n=402)
<=100 12 0 38 20 1 0 13 100 10
100-500 6 5 5 44 2 - 16 - 1
500.1-1000 5 5 6 15 3 - 3 - 1
1000.1-2000 7 11 4 2 6 - 8 - 10
2000.1-3000 7 11 8 3 9 - 3 - 12
3000.1-5000 14 32 3 1 17 - 18 - 24
Above 5000 31 11 8 4 40 - 16 - 10
No Response 18 26 28 11 21 100 24 - 32
MEAN 5003 4137 1440 1544 5448 - 3095 10 3384
MEDIAN 3996 3150 93 218 5010 - 1600 5 3033
All (n=5003)
Rajasthan (n=104)
Sikkim (n=5)
TN (n=102)
Tripura (n=9)
Uttaranchal (n=12)
WB (n=464)
North East (n=37)
<=100 11 20 20 22 0 8 2 5
100-500 5 7 - 9 11 - 4 5
500.1-1000 5 3 - 4 11 - 3 5
1000.1-2000 7 10 20 6 33 8 7 14
2000.1-3000 7 9 - 12 - - 2 8
3000.1-5000 14 24 - 12 22 17 9 19
Above 5000 32 19 - 7 22 42 58 32
No Response 18 9 60 29 - 25 15 11
MEAN 5003 3482 1008 2068 4512 5778 11113 6485
MEDIAN 3996 2720 15 1500 1833 5700 10300 4100
• WB CSs have the highest average storage capacity of 1,11,13 tons.
Unit of measurement – Metric Tonnes

© COPYRIGHT 2014
CHAPTER 14
MAINTENANCE PRACTICES
Page no 246 to 264

© COPYRIGHT 2014 247
14. AMC, PMC AND BREAKDOWN DETAILS
The survey found that 68% cold storages at an all India level do not subscribe to any annual maintenance contracts. However as compared to other states, more cold storages in Maharashtra, AP, Delhi and TN have subscribed to AMC’s. On the axis of product storage, two thirds of the Type H, P & M cold stores have not subscribed to AMC.
In rural areas marginally higher percentage have AMC contracts.
But between NHB assisted CSs and others there is no significant difference in having AMC contracts.
A good 44% of government owned cold storages subscribe to AMC. The proportion subscribing to AMC’s among other ownership types are comparatively much lower.
Subscribe to AMC ALL
(n=5003)
Proprietorship
(n=1336)
Partnership
(n=1677)
Company (Public
Ltd.)
(n=174)
Company
(Private Ltd.)
(n=1563)
Yes 32 31 33 32 32
No 68 69 67 68 68
Subscribe to AMC
Association
(Public)
(n=5)
Association
(Private)
(n=12)
Cooperative
(n=130)
Government
(Co./Dept./
PSU)
(n=82)
Not classified
under any
Ownership
type
(n=24)
Yes 80 42 29 44 25
No 20 58 71 56 75
Subscribe to AMC Urban CS’s
(n=1481)
Rural CS’s
(n=3522)
NHB/NHM
(n=3061)
Others
(n=1942)
Yes 29 33 33 31
No 71 67 67 69

© COPYRIGHT 2014 248
14. AMC, PMC AND BREAKDOWN DETAILS
Of 1438 CSs that are using AMCs, over 90% cold storages have subscribed to it for its refrigeration and plant equipment and 65% of them for diesel gensets.
AMCs for gensets in the Northern zone total to 77%. This number is comparatively much lower in other zones with the least in West.
Spare parts are maintained for both refrigeration unit as well as power units.
Almost 80% cold storages all over India stock spare parts for refrigeration. This is specially evident in the states of Haryana, Kerala, WB and TN. Cold storages in the Western zone are less likely to store any kind of spare parts as compared to the other zones. More than 90% cold storages in WB also store spare parts for power units.
Of those having AMCs(32%), over 90% of Type H cold stores have subscribed to AMC for refrigeration plant and equipments. Across other Type of storages too, subscription for the same purpose is high. Two thirds of Type H CS’s also have AMC contract for Diesel gensets too.
In all zones 87% to 96% of those having AMC have taken AMC fro refrigeration plants. In the Northern zone, higher proportions of cold storages have AMCs for diesel gensets compared to other zones.
79 71
34
Refrigeration Power unit Controllers & Sensors
Spare parts
90 91 86 88 88
100
65 66 58 60
47
9
Refrigerationplant &equipments Diesel Genset
All (n=1610)
Type H (n=1416)
Type P (n=171)
Type M (n=137)
Type Q (n=17)
Other products
(n=11)

© COPYRIGHT 2014 249
14. AMC, PMC AND BREAKDOWN DETAILS
53
47
Yes No
Periodic Maintenance Followed
Over 50% claim to do periodic maintenances. In Pharma CSs over two thirds claim to do periodic maintenance. In zone wise analysis, in East zone nearly 2/3rd claim to have periodic maintenance. However in the South this proportion drops down to 38%.
More percentage of CSs located in rural areas do regular periodic maintenance compared to CSs in urban areas. Like wise, NHB more percentage of NHB assisted CSs do regular periodic maintenance
Close to 60% of Public limited, cooperative and government owned cold storages do undertake periodic maintenances.
Periodic Maintenance
ALL
(n=5003)
Proprietorship
(n=1336)
Partnership
(n=1677)
Company (Public
Ltd.)
(n=174)
Company
(Private Ltd.)
(n=1563)
Yes 53 47 55 60 53
No 47 53 45 40 47
Periodic Maintenance
Association
(Public)
(n=5)
Association
(Private)
(n=12)
Cooperative
(n=130)
Government
(Co./Dept./
PSU)
(n=82)
Not classified
under any
Ownership
type
(n=24)
Yes 100 33 61 62 58
No - 67 39 38 42
Periodic Maintenance Urban CS’s
(n=1481)
Rural CS’s
(n=3522)
NHB/NHM
(n=3061)
Others
(n=1942)
Yes 46 55 54 51
No 54 45 46 49

© COPYRIGHT 2014 250
14. AMC, PMC AND BREAKDOWN DETAILS
Those who claim to do periodic maintenance, over 50% claimed to do maintenance for 1 or 2 days in a month with an average of 1.5. The frequency of periodic maintenances is higher in the Southern zone 1.7 (average), though percentage doing maintenance is low here
The number of emergency breakdown days reported was only 1.1 days in the previous year (average nationwide).
65% of the cold stores reported not having a single full day of loss of function with only 2% having more than 10 days of breakdown in the year. 7% had no response on the matter.
Type H cold storages have reported least average number of break down days. Type Q cold storages have reported more than 2 days where no work was done in the last 1 year.
The Northern zone has 75% cold storages that have mentioned having 0 break down days. More than 1 out of 3 cold storages in the South claim to have had 1-10 break down days.
65%
26%
2%
7%
Break down days (%) in a year
0 days
1-10 days
> 10 days
DKCS

© COPYRIGHT 2014 251
• Spare parts for refrigeration are stocked in more than 3/4ths of the cold stores irrespective of the product they store.
• Spare parts for power units are also kept in over 70% of all Type storages.
• Spare parts for refrigeration and power units are stored in more than 80% of cold stores in the Eastern zone.
• Spare parts for controllers and sensors are stocked more so in the South based cold storages. • Storage of any kind of spare parts is less among CSs of West zone compared to other zones
Zone wise
14.1 SPARE PARTS & INVENTORY USED
All Figs in % All Respondents
Refrigeration
Power unit
Controllers & Sensors
DKCS
All (n=5003)
Type H (n=4333)
Type P (n=523)
Type M (n=452)
Type Q (n=44)
Other Products
(n=27)
79
71
34
5
All (n=5003)
North (n=2142)
East (n=803)
West (n=1013)
South (n=1045)
74
41
22
11
79
71
34
5
76
70
36
3
85
72
40
6
75
59
30
2
Refrigeration
Power unit
Controllers & Sensors
DKCS
79
71
34
5
82
68
46
10
80
73
36
4
87
80
32
2
67
62
18
5

© COPYRIGHT 2014 252
14.1 SPARE PARTS & INVENTORY USED
All Figs in % All Respondents
All (n=5003)
Maharashrta (n=451)
UP (n=1371)
A & N (n=10)
AP (n=600)
Assam (n=22)
Bihar (n=169)
Chandigarh (n=3)
Refrigeration 79 77 79 70 77 32 73 67
Power unit 71 58 78 60 62 59 67 33
Controllers & Sensors 34 28 42 60 53 27 25 -
DKCS 5 8 2 10 15 9 2 33
All (n=5003)
C’garh (n=76)
Delhi (n=35)
Goa (n=7)
Gujarat (n=399)
Haryana (n=185)
HP (n=14)
J & K (n=16)
Refrigeration 79 84 69 57 64 91 86 94
Power unit 71 63 51 43 67 75 86 69
Controllers & Sensors 34 9 37 29 10 19 14 25
DKCS 5 3 23 - 4 7 14 -
All (n=5003)
Jharkhand (n=19)
Karnataka (n=188)
Kerala (n=143)
MP (n=156)
Nagaland (n=1)
Orissa (n=38)
Pondicherry (n=2)
Punjab (n=402)
Refrigeration 79 42 84 92 48 - 92 100 81
Power unit 71 63 66 85 66 100 29 50 67
Controllers & Sensors 34 16 20 47 8 - 21 50 32
DKCS 5 5 3 4 1 - - - 6
All (n=5003)
Rajasthan (n=104)
Sikkim (n=5)
TN (n=102)
Tripura (n=9)
Uttaranchal (n=12)
WB (n=464)
North East (n=37)
Refrigeration 79 68 60 90 78 100 96 46
Power unit 71 32 40 80 22 92 95 49
Controllers & Sensors 34 9 60 55 56 75 39 38
DKCS 5 14 - 2 11 - 1 8
• Over 90% CS’s in Haryana, TN, WB, Orissa and Kerala store spare parts for refrigeration.

© COPYRIGHT 2014 253 All Figs in % All Respondents
• Across zones, a majority of cold stores have no annual maintenance contract.
Annual Maintenance Contract
14.2 ANNUAL MAINTENANCE CONTRACT (FOR SPECIFIC AREAS)
41
59
All (n=5003)
Type H (n=4333)
Type P (n=523)
Type M (n=452)
Type Q (n=44)
Other Products
(n=27)
32
68
Yes No DK/CS
Yes No DK/CS
33
67
33
67
30
70
39
61
40
60
32
68
30
70
26
74
32
68
North (n=2142)
East (n=803)
West (n=1013)
South (n=1045)
All (n=5003)
• 2/3rds of the Type H, P & M cold stores have not subscribed to AMC.
Zone wise

© COPYRIGHT 2014 254 All Figs in % All Respondents
States- Annual Maintenance Contract
• In AP and Maharashtra, every nearly 50% cold storages have annual maintenance contract.
14.2 ANNUAL MAINTENANCE CONTRACT (FOR SPECIFIC AREAS)
All (n=5003)
Maharashrta (n=451)
UP (n=1371)
A & N (n=10)
AP (n=600)
Assam (n=22)
Bihar (n=169)
Chandigarh (n=3)
Yes 32 46 35 - 48 55 28 -
No 68 54 65 100 52 45 72 100
All (n=5003)
C’garh (n=76)
Delhi (n=35)
Goa (n=7)
Gujarat (n=399)
Haryana (n=185)
HP (n=14)
J & K (n=16)
Yes 32 20 49 29 23 32 50 13
No 68 80 51 71 77 68 50 88
All (n=5003)
Jharkhand (n=19)
Karnataka (n=188)
Kerala (n=143)
MP (n=156)
Nagaland (n=1)
Orissa (n=38)
Pondicherry (n=2)
Punjab (n=402)
Yes 32 16 15 41 17 - 37 50 16
No 68 84 85 59 83 100 63 50 84
All (n=5003)
Rajasthan (n=104)
Sikkim (n=5)
TN (n=102)
Tripura (n=9)
Uttaranchal (n=12)
WB (n=464)
North East (n=37)
Yes 32 28 20 43 56 - 24 49
No 68 72 80 57 44 100 76 51

© COPYRIGHT 2014 255 All Figs in % CS”s that have subscribed to AMC’s
“AMC SUBSCRIBED FOR WHAT”?
• In all zones among those having AMCs, 87% to 96% have maintenance for refrigeration plants • In North zone highest percentage of cold stores reported having AMC for gensets. West zone
had least percentage reporting AMC for gen sets
14.2 ANNUAL MAINTENANCE CONTRACT (FOR SPECIFIC AREAS)
90 91 86 88 88
100
65 66 58 60
47
9
Refrigerationplant &equipments
Diesel Genset
• Of those having AMCs – 1610 CSs - , over 90% of Type H cold stores have subscribed to AMC for refrigeration plant and equipments. Across other Type of storages too subscription for the same purpose is high.
• 2/3rds of Type H CS’s also have AMC contract for Diesel gensets too.
Zone wise
All (n=1610)
Type H (n=1416)
Type P (n=171)
Type M (n=137)
Type Q (n=17)
Other products
(n=11)
90 87 87 94 96
65 77 71
46 61 Refrigeration
plant &equipments
Diesel Genset
All (n=1610)
North (n=653)
East (n=208)
West (n=328)
South (n=421)

© COPYRIGHT 2014 256 All Figs in %
14.2 ANNUAL MAINTENANCE CONTRACT (FOR SPECIFIC AREAS)
All (n=1610)
Maharashrta (n=208)
UP (n=474)
A & N (n=-)
AP (n=290)
Assam (n=12)
Bihar (n=48)
Chandigarh (n=-)
Refrigeration plant & equipments
90 91 84 - 99 75 77 -
Diesel Genset 65 58 86 - 66 50 63 -
All (n=1610)
C’garh (n=15)
Delhi (n=17)
Goa (n=2)
Gujarat (n=91)
Haryana (n=60)
HP (n=7)
J & K (n=2)
Refrigeration plant & equipments
90 100 88 100 97 93 100 100
Diesel Genset 65 60 59 50 26 82 - -
All (n=1610)
Jharkhand (n=3)
Karnataka (n=28)
Kerala (n=58)
MP (n=27)
Nagaland (n=-)
Orissa (n=14)
Pondicherry (n=1)
Punjab (n=64)
Refrigeration plant & equipments
90 100 96 98 100 - 100 - 94
Diesel Genset 65 33 25 47 15 - 29 100 47
All (n=1610)
Rajasthan (n=29)
Sikkim (n=1)
TN (n=44)
Tripura (n=5)
Uttaranchal (n=-)
WB (n=110)
North East (n=18)
Refrigeration plant & equipments
90 86 100 75 80 - 88 78
Diesel Genset 65 17 100 68 60 - 85 56
CS”s that have subscribed to AMC’s

© COPYRIGHT 2014 257
26
74
14.3 AMC SERVICE PROVIDER (FOR ENTIRE CS)
All Figs in % All Respondents
• Across zones, dominant number of cold stores do not have an AMC service provider. • A relatively higher percentage of cold stores in South do have an AMC service provider – 42%.
33
67
• Across all type of cold stores, only 29% had AMC service provider
Zone wise
29
71
Yes No
29
71
29
71
36
64
42
58
29
71
26
74
19
81
28
72
All (n=5003)
Type H (n=4333)
Type P (n=523)
Type M (n=452)
Type Q (n=44)
Other Products
(n=27)
North (n=2142)
East (n=803)
West (n=1013)
South (n=1045)
All (n=5003)
Yes No

© COPYRIGHT 2014 258
14.3 AMC SERVICE PROVIDER (FOR ENTIRE CS)
All Figs in % All Respondents
States
• Every alternate cold store in AP have an AMC service provider. • Above 80% CS’s in Gujarat, MP, Chhattisgarh and Karnataka have no AMC service provider. In MP
this percentage shoots up to over 90%.
All (n=5003)
Maharashrta (n=451)
UP (n=1371)
A & N (n=10)
AP (n=600)
Assam (n=22)
Bihar (n=169)
Chandigarh (n=3)
Yes 29 43 31 - 51 32 20 -
No 71 57 69 100 49 68 80 100
All (n=5003)
C’garh (n=76)
Delhi (n=35)
Goa (n=7)
Gujarat (n=399)
Haryana (n=185)
HP (n=14)
J & K (n=16)
Yes 29 20 46 29 19 25 50 6
No 71 80 54 71 81 75 50 94
All (n=5003)
Jharkhand (n=19)
Karnataka (n=188)
Kerala (n=143)
MP (n=156)
Nagaland (n=1)
Orissa (n=38)
Pondicherry (n=2)
Punjab (n=402)
Yes 29 11 15 41 7 100 32 50 11
No 71 89 85 59 93 - 68 50 89
All (n=5003)
Rajasthan (n=104)
Sikkim (n=5)
TN (n=102)
Tripura (n=9)
Uttaranchal (n=12)
WB (n=464)
North East (n=37)
Yes 29 22 20 40 33 - 17 32
No 71 78 80 60 67 100 83 68

© COPYRIGHT 2014 259
14.4 PERIODIC MAINTENANCE FOLLOWED
All Figs in % All Respondents
Periodic Maintenance Followed
48
52
• 1 out of every 2 cold stores follow periodic maintenances. • 2/3rds of Type Q storages undergo periodic maintenances.
• In the Eastern zone, almost 2/3rds of the CS’s follow periodic maintenances. • Every alternate CS’s in Northern and Western zone have periodic maintenances. • Only over a third of cold stores reported having periodic maintenance in South zone
Zone wise
53
47
53
47
Yes No
56 44
58 42
64 36
38
62
53
47
53
47 66 34
58 42
Yes No
All (n=5003)
Type H (n=4333)
Type P (n=523)
Type M (n=452)
Type Q (n=44)
Other Products
(n=27)
North (n=2142)
East (n=803)
West (n=1013)
South (n=1045)
All (n=5003)

© COPYRIGHT 2014 260
14.4 PERIODIC MAINTENANCE FOLLOWED
All Figs in % All Respondents
States
• 86% CS’s in WB have periodic maintenances. • More than 2/3rds of the cold stores in Orissa and Bihar do not follow any periodic
maintenances.
All (n=5003)
Maharashrta (n=451)
UP (n=1371)
A & N (n=10)
AP (n=600)
Assam (n=22)
Bihar (n=169)
Chandigarh (n=3)
Yes 53 64 53 - 33 91 24 33
No 47 36 47 100 67 9 76 67
All (n=5003)
C’garh (n=76)
Delhi (n=35)
Goa (n=7)
Gujarat (n=399)
Haryana (n=185)
HP (n=14)
J & K (n=16)
Yes 53 51 66 71 53 77 64 25
No 47 49 34 29 47 23 36 75
All (n=5003)
Jharkhand (n=19)
Karnataka (n=188)
Kerala (n=143)
MP (n=156)
Nagaland (n=1)
Orissa (n=38)
Pondicherry (n=2)
Punjab (n=402)
Yes 53 47 32 50 52 100 26 50 40
No 47 53 68 50 48 - 74 50 60
All (n=5003)
Rajasthan (n=104)
Sikkim (n=5)
TN (n=102)
Tripura (n=9)
Uttaranchal (n=12)
WB (n=464)
North East (n=37)
Yes 53 57 40 64 100 50 86 86
No 47 43 60 36 - 50 14 14

© COPYRIGHT 2014 261
14.5 FREQUENCY OF PERIODIC MAINTENANCE IN A MONTH
All Figs in % CS’s that have periodic maintenances
1-2
3-4
DKCS
All (n=2640)
Type H (n=2281)
Type P (n=293)
Type M (n=260)
Type Q (n=28)
Other Products
(n=13)
57
6
38
77
8
15
56
5
38
52
5
43
63
7
29
61
11
29
All (n=2640)
North (n=1135)
East (n=527)
West (n=584)
South (n=394)
57
6
38
53
11
36
71
4
24
34
3
63
51
6
42
• Of 2640 CSs, having periodic maintenance, over 50% CS’s have 1-2 days for periodic maintenance in a month.
• Over 70% cold stores in the Northern zone have 1-2 days every month for maintenance purposes.
Zone wise
1-2
3-4
DKCS

© COPYRIGHT 2014 262
14.5 FREQUENCY OF PERIODIC MAINTENANCE IN A MONTH
All Figs in %
States
• Of the CSs having periodic maintenance, over 75% cold stores in Haryana have 1-2 days for maintenance purposes. So is the trend in Chhattisgarh.
• Rajasthan has over 85% storages which have 1-2 days for periodic maintenance purposes.
All (n=2640)
Maharashrta (n=288)
UP (n=732)
A & N (n=-)
AP (n=196)
Assam (n=20)
Bihar (n=40)
Chandigarh (n=1)
1-2 57 51 67 - 51 25 63 100
3-4 6 7 5 - 14 5 8 -
DKCS 38 41 28 - 35 70 30 -
Mean 1.5 1.6 1.5 - 1.9 2.0 1.6 1.0
All (n=2640)
C’garh (n=39)
Delhi (n=23)
Goa (n=5)
Gujarat (n=210)
Haryana (n=142)
HP (n=9)
J & K (n=4)
1-2 57 82 74 20 61 80 78 25
3-4 6 3 - - 4 4 - -
DKCS 38 15 26 80 34 16 22 75
Mean 1.5 1.5 1.5 1.0 1.4 1.3 1.1 2.0
All (n=2640)
Rajasthan (n=59)
Sikkim (n=2)
TN (n=65)
Tripura (n=9)
Uttaranchal (n=6)
WB (n=397)
North East (n=32)
1-2 57 85 50 66 11 67 24 22
3-4 6 2 - 9 - 17 3 3
DKCS 38 14 50 25 89 17 73 75
Mean 1.5 1.2 2.0 1.6 2.0 1.8 1.4 2.0
All (n=2640)
Jharkhand (n=9)
Karnataka (n=61)
Kerala (n=71)
MP (n=81)
Nagaland (n=1)
Orissa (n=10)
Pondicherry (n=1)
Punjab (n=159)
1-2 57 89 31 68 27 - 90 - 78
3-4 6 - 7 10 7 - - - 4
DKCS 38 11 62 23 65 100 10 100 18
Mean 1.5 1.3 1.7 1.4 1.7 - 1.1 - 1.4
CS’s that have periodic maintenances

© COPYRIGHT 2014 263
14.6 AVERAGE BREAKDOWN DAYS (IN LAST 1 YEAR)
All Figs in % All Respondents
0
1-10
Above 10
DKCS
65
26
2
7
37
37
15
11
68
24
1
7
55
37
3
5
49
45
2
4
45
39
5
11
65
26
2
7
61
35
3
1
75
10
1
14
72
24
2
2
42
53
2
3
• Type H cold stores have had minimal break downs with over 2/3rds of them having 0 break down days.
• 1 out of every 2 Type P cold storages have had no break downs. • The overall average is just 1.1 days • Zone wise analisis shows that the break down days are higher in West and South zones
compared to North and East zones
Zone wise
0
1-10
Above 10
DKCS
All (n=5003)
Type H (n=4333)
Type P (n=523)
Type M (n=452)
Type Q (n=44)
Other Products
(n=27)
North (n=2142)
East (n=803)
West (n=1013)
South (n=1045)
All (n=5003)

© COPYRIGHT 2014 264
14.6 AVERAGE BREAKDOWN DAYS (IN LAST 1 YEAR)
All Figs in % All Respondents
States
• In Gujarat, 76% of the cold stores have had 1-10 number of break down days. • 78% of the CS’s in UP and 88% in MP have had 0 break down days and are also the states with
least average number of 0.4 days in the last year. Rajasthan and Jharkhand also reported having just 0.5 days in a year of break down days
All (n=5003)
Maharashtra (n=451)
UP (n=1371)
A & N (n=10)
AP (n=600)
Assam (n=22)
Bihar (n=169)
Chandigarh (n=3)
0 65 44 78 70 62 59 69 67
1-10 26 47 6 0 35 36 27 33
Above 10 2 2 1 0 3 5 4 0
DKCS 7 6 16 30 - - - -
MEAN 1.1 1.9 0.4 - 1.6 1.2 1.8 0.7
All (n=5003)
C’garh (n=76)
Delhi (n=35)
Goa (n=7)
Gujarat (n=399)
Haryana (n=185)
HP (n=14)
J & K (n=16)
0 65 63 60 43 22 78 100 81
1-10 26 21 29 43 76 19 0 19
Above 10 2 4 0 14 3 1 0 0
DKCS 7 12 11 - 0 2 - -
MEAN 1.1 1.9 1.3 2.1 1.5 0.9 - 0.4
All (n=5003)
Jharkhand (n=19)
Karnataka (n=188)
Kerala (n=143)
MP (n=156)
Nagaland (n=1)
Orissa (n=38)
Pondicherry (n=2)
Punjab (n=402)
0 65 63 71 45 88 - 26 50 66
1-10 26 37 23 49 12 100 58 50 16
Above 10 2 0 5 1 1 0 16 0 0
DKCS 7 - 1 5 - - - - 18
MEAN 1.1 0.5 2.8 1.4 0.4 1.0 6.5 0.5 0.4
All (n=5003)
Rajasthan (n=104)
Sikkim (n=5)
TN (n=102)
Tripura (n=9)
Uttaranchal (n=12)
WB (n=464)
North East (n=37)
0 65 71 40 61 67 83 81 57
1-10 26 24 60 35 22 0 18 38
Above 10 2 0 0 2 11 8 0 5
DKCS 7 5 - 2 - 8 1 -
MEAN 1.1 0.5 0.6 1.0 1.4 1.8 0.3 1.2

© COPYRIGHT 2014
CHAPTER 15
CAPACITY UTILIZATION & PATTERNS
Page no 265 to 271

© COPYRIGHT 2014 266
15. CAPACITY UTILIZATION PATTERN OVER LAST 3 YEARS.
At an all India level the study indicates that there is 75% capacity utilization of cold storages. India has wide array of CS’s when looked at by its storage capacity. There are smaller CSs which can store less than 1,000 MT of produce and then there are mega CS’s which store 10,000 MT of capacity. States like WB, UP & Chandigarh boasts having extremely high storage capacity: average storage capacity is more than 6000 MT. Karnataka and Maharashtra, despite having higher number of cold storages, have average storage capacity of less than 2000 MT.
All India Storage capacity and utilization
5391
8543
3108
2850
75.0
77.5
70.8
75.6
North(n=2113)
East(n=803)
West (n=1027)
South(n=1038)
Average Storage Capacity (MT)
Capacity Utilization (% annum)

© COPYRIGHT 2014 267
15. TOTAL STORAGE CAPACITY ALONG WITH THE CAPACITY UTILIZATION OF THE CS’S
All Figs in % All Respondents
All (n=18858)
<= 50 (n=3971)
51-55 (n=106)
56-60 (n=1124)
61-65 (n=199)
66-70 (n=1654)
71-75 (n=834)
76-80 (n=2492)
81-85 (n=476)
86-90 (n=1632)
91-95 (n=596)
96-100 (n=5771)
0-10 5 6 - 5 3 8 5 6 3 6 3 5
10-50 4 5 7 6 2 3 2 3 1 2 3 4
50-100 3 3 8 3 2 2 3 2 2 4 1 3
100-500 6 5 4 6 5 4 3 6 6 6 7 7
500.1-1000 5 5 - 4 11 5 4 3 4 4 8 5
1000.1-2000 8 9 6 7 12 6 7 8 6 9 5 7
2000.1-3000 7 8 2 8 9 8 8 9 6 7 7 6
3000.1-5000 14 14 10 14 17 14 16 14 9 13 9 14
Above 5000 32 25 42 26 26 33 36 31 42 34 43 35
No Response 18 20 22 21 14 17 17 18 20 15 14 16
MEAN 5189 4338 9850 5817 5627 5162 5746 4859 6477 5108 6104 5429
MEDIAN 3996 2996 5598 3306 2388 3986 4524 3500 5450 3957 5000 4190
• It is observed that 43% of the CS with storage capacity of more than 5000MT have used 91-95% of their capacity.
Storage
capacity
MT
Capacity
Utilization
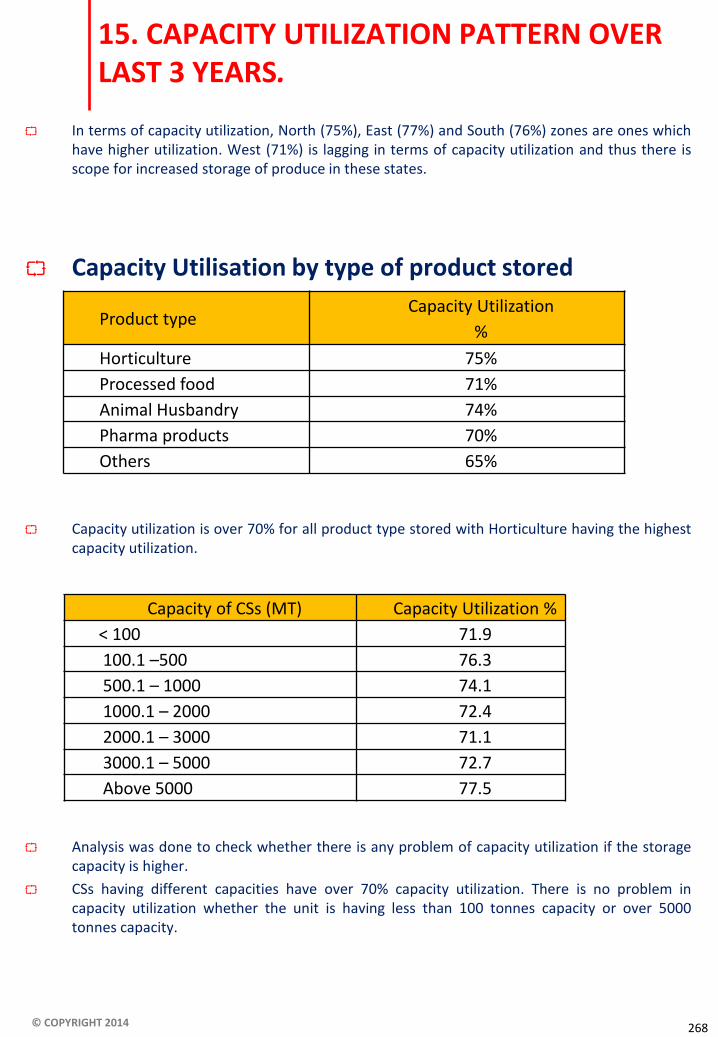
© COPYRIGHT 2014 268
15. CAPACITY UTILIZATION PATTERN OVER LAST 3 YEARS.
In terms of capacity utilization, North (75%), East (77%) and South (76%) zones are ones which have higher utilization. West (71%) is lagging in terms of capacity utilization and thus there is scope for increased storage of produce in these states.
Capacity Utilisation by type of product stored
Capacity utilization is over 70% for all product type stored with Horticulture having the highest
capacity utilization.
Analysis was done to check whether there is any problem of capacity utilization if the storage capacity is higher.
CSs having different capacities have over 70% capacity utilization. There is no problem in capacity utilization whether the unit is having less than 100 tonnes capacity or over 5000 tonnes capacity.
Product type Capacity Utilization
%
Horticulture 75%
Processed food 71%
Animal Husbandry 74%
Pharma products 70%
Others 65%
Capacity of CSs (MT) Capacity Utilization %
< 100 71.9
100.1 –500 76.3
500.1 – 1000 74.1
1000.1 – 2000 72.4
2000.1 – 3000 71.1
3000.1 – 5000 72.7
Above 5000 77.5

© COPYRIGHT 2014 269
15. TOTAL CAPACITY UTILIZATION OF THE PLANT ACROSS THREE YEARS
All Figs in % All Respondents
• The average capacity utilization is at around 75% for all CSs in all three years • Across all types of products stored also the capacity utilization ranges between 70 to 75% in
2012. Across the previous 2 years also the capacity utilization similar to 2012 • The average capacity utilisation is the highest in East zone • Capacity utilization in West is the lowest at 71%
Item Current Year
2012 Previous Year
2011 Previous Year
2010
ALL (n=5003) 75% 76% 75%
Horticulture /Agriculture (n=4333) 75% 76% 76%
Processed Food (n=523) 71% 70% 69%
Animal Husbandry (n=452) 74% 73% 71%
Pharmaceuticals (n=44) 70% 72% 70%
Other products (n=27) 65% 65% 61%
AVERAGE CAPACITY UTILIZATION
Item Current Year
2012 Previous Year
2011 Previous Year
2010
ALL (n=5003) 75% 76% 75%
North (n=2142) 75% 80% 80%
East (n=803) 78% 78% 76%
West (n=1013) 71% 72% 71%
South (n=1045) 76% 70% 67%
ZONE WISE

© COPYRIGHT 2014 270
15. TOTAL CAPACITY UTILIZATION OF THE PLANT ACROSS THREE YEARS
All Figs in % All Respondents
Item Current Year
2012 Previous Year
2011 Previous Year
2010
Urban CS’s (n=1481) 74 73 72
Rural CS’s (n=3522) 75 77 76
NHB/NHM (n=3061) 76 77 75
Others (n=1942) 73 74 74
AVERAGE CAPACITY UTILIZATION
Between urban and rural as well as between NHB assisted and other CSs, there is not a big difference in capacity utilization. All CSs have over 73% capacity utilization across years.
In terms of capacity utilization, the government related cold storages have shown a consistent growth over the last 3 years, though it still have one of the lower capacity utilisation compared to private sector companies.
Item Current Year
2012 Previous Year
2011 Previous Year
2010
Proprietorship (n=1336) 73 74 74
Partnership (n=1667) 73 75 74
Company Public Ltd. (n=174) 73 74 70
Company Private Ltd. (n=1563) 78 79 77
Association Public (n=5) 45 41 43
Association Private (n=12) 81 77 76
Cooperative (n=130) 78 80 81
Government (Co./Dept./PSU) 66 62 56
Not mentioned Ownership Type (n=24) 66 64 59

© COPYRIGHT 2014 271
15. TOTAL CAPACITY UTILIZATION OF THE PLANT
All Figs in % All Respondents
• Though overall capacity utilization is at 75%, it is lowest at Nagaland at 5% utilization. Tripura also has one of the lower capacity utilization at 55%.
• Other states that have lower capacity utilization are Andaman, Bihar, Gujarat, HP, J&K, Jharkhand, Sikkim and Uttaranchal, where capacity utilization is between 55% and 70%
Item Current Year
2012 Previous Year
2011 Previous Year
2010
ALL (n=5003) 75% 76% 75% Maharashtra (n=451) 74% 79% 78% UP (n=1371) 78% 83% 83% Andaman and Nicobar Islands (n=10) 70% 65% 50%
Andhra Pradesh (n=600) 77% 68% 64% Assam (n=22) 65% 64% 64% Bihar (n=169) 69% 69% 65% Chandigarh (n=3) 92% 92% 77% Chhattisgarh (n=76) 76% 73% 71% Delhi (n=35) 80% 84% 84% Goa (n=7) 90% 88% 84% Gujarat (n=399) 62% 62% 60% Haryana (n=185) 71% 76% 77% Himachal Pradesh (n=14) 69% 65% 72% Jammu and Kashmir (n=16) 62% 62% 57% Jharkhand (n=19) 65% 58% 60% Karnataka (n=188) 70% 69% 69% Kerala (n=143) 76% 74% 73% Madhya Pradesh (n=156) 83% 81% 78% Nagaland (n=1) 5% 4% 5%
Orissa (n=38) 69% 58% 60% Pondicherry (n=2) 80% 80% 80% Punjab (n=402) 68% 71% 72% Rajasthan (n=104) 78% 79% 78% Sikkim (n=5) 60% 61% 48%
Tamil Nadu (n=102) 77% 74% 70% Tripura (n=9) 55% 51% 53%
Uttaranchal (n=12) 56% 70% 66% West Bengal (n=464) 83% 85% 84%
STATE WISE

© COPYRIGHT 2014
CHAPTER 16
POWER SOURCE & ITS UTILIZATION
Page no 272 to 294

© COPYRIGHT 2014 273
16. POWER SOURCE, GENERATORS OR ALTERNATE SOURCE
On an average most CS’s get a sanctioned load in the range of 150 – 200 kVA. Gujarat, Kerala, and West Bengal are states which have been sanctioned more than 200 kVA of load which is higher than the national average of 168.9 kVA. Some bigger states like Karnataka and Rajasthan have extremely low sanctioned loads which may be an area of concern for the CS’s located there.
Yearly energy utilization
In 2012-13, the all India expense on energy is INR 18.99 Lakh (per cold store per year). Animal
husbandry and pharmaceutical based CS’s have a relatively higher expenditure on energy, and report existence of higher number of evaporator / compressor units in these facilities.
Item
Current
Year
2012-13
Previous
Year
2011-12
Previous
Year
2010-11
Average Capacity Utilization (%) 75% 76% 75%
Energy Cost per CS
(Rs per year) 18,99,129 16,70, 915 15,21,697
Grid Power
(Hours per day) 17 16 16
DG Fuel Consumed (Ltrs/annum) 16,472 17,671 18,002

© COPYRIGHT 2014 274
16. POWER SOURCE, GENERATORS OR ALTERNATESOURCE
States in East zone spend the most on the energy cost per year as their average expense is more than Rs 28 Lakhs per annum. Diesel powered generators are used across the country and the national average consumption of diesel per cold store is 16473 litres per year.
As existence of power and continuous supply of power is an absolute necessity, not a single CS was without a DG set. In fact many of them had more than 1 DG set
Due to lower availability of grid power in South Zone the penetration of DG sets is justifiably higher. The quantum of DG fuel used is highest in South
Average age of DG sets was 9 years. The average capacity of gen set was 143 kVA. The major manufacturers of DG sets in use were Kirloskar, Ashok Leyland, Cummins and Eicher
Adoption of Alternate sources of energy (like wind, solar, thermal power) is still very low where 95% of CS’s do not have a provision for the same.
No of DG sets
Item % of CS
1 DG set 48%
2 DG sets 35%
3 DG sets 10%
More than 3 DG sets 7%

© COPYRIGHT 2014 275
16.1 SANCTIONED LOAD
All Respondents
Sanctioned Load (KVA)
• East zone has the highest sanctioned load compared to South which has the lowest sanctioned load of electricity
1-50
51-100
101-150
151-200
201-250
251-300
300 KVA and above
DK/CS
12
27
19
17
9
3
11
2
4
33
15
4
15
0
26
4
12
27
20
19
9
3
9
1
12
33
13
12
9
3
14
3
11
20
14
9
9
5
27
6
5
43
18
9
0
7
14
5
12
27
19
17
9
3
11
2
33
20
24
4
5
2
9
3
4
26
19
30
12
3
5
1
10
23
14
12
11
7
24
0
9
37
16
9
9
4
15
2
• Average sanctioned load of electricity is at 168.38 KVA. • Type H product CSs have the lowest sanctioned load, while that of M type has the highest
sanctioned load. It was already observed that M type use lower temperature levels to store meat and fish products
Zone wise
1-50
51-100
101-150
151-200
201-250
251-300
300 KVA and above
DK/CS
All (n=5003)
Type H (n=4333)
Type P (n=523)
Type M (n=452)
Type Q (n=44)
Other Products
(n=27)
All (n=5003)
North (n=2142)
East (n=803)
West (n=1013)
South (n=1045)

© COPYRIGHT 2014 276
16.1 SANCTIONED LOAD
All Figs in % All Respondents
States
All (n=5003)
Maharashtra (n=451)
UP (n=1371)
A & N (n=10)
AP (n=600)
Assam (n=22)
Bihar (n=169)
Chandigarh (n=3)
1-50 12 11 1 10 41 5 29 -
51-100 27 54 13 70 23 18 27 67
101-150 19 8 21 10 26 23 19 33
151-200 17 6 39 - 3 14 15 -
201-250 9 2 16 - 2 14 7 -
251-300 3 2 4 10 1 9 1 -
300 KVA and above 11 14 5 0 3 18 2 0
DK/CS 2 3 1 - 2 - - -
MEAN 168.38 165.5 182.9 115.4 83.03 199.1 107.9 99.7
All (n=5003)
C’garh (n=76)
Delhi (n=35)
Goa (n=7)
Gujarat (n=399)
Haryana (n=185)
HP (n=14)
J & K (n=16)
1-50 12 1 9 14 7 20 29 6
51-100 27 71 37 43 22 35 36 25
101-150 19 16 11 - 17 14 7 19
151-200 17 4 9 - 12 16 7 31
201-250 9 1 14 - 17 6 - 6
251-300 3 1 9 - 7 2 - -
300 KVA and above 11 5 11 14 19 7 21 13
DK/CS 2 - - 29 1 1 - -
MEAN 168.38 120.4 168.8 157.4 206.04 132.5 172.9 168.4
• State wise analysis shows that sanctioned load is higher in Maharashtra, UP, Assam, Gujarat, J&K, Kerala, Nagaland, Orissa, TN, Uttaranchal and WB.
• Sanctioned load are less than 100 KVA in HP, AP, Chandigarh, Jharkhand, Karnataka and Sikkim

© COPYRIGHT 2014 277
16.1 SANCTIONED LOAD (Cont’d)
All Figs in % All Respondents
States
All (n=5003)
Rajasthan (n=104)
Sikkim (n=5)
TN (n=102)
Tripura (n=9)
Uttaranchal (n=12)
WB (n=464)
North East (n=37)
1-50 12 6 80 3 11 - 3 16
51-100 27 20 - 16 11 33 12 14
101-150 19 41 20 43 - 17 12 16
151-200 17 16 - 7 56 25 12 22
201-250 9 3 - 3 11 - 14 14
251-300 3 1 - 4 - - 11 5
300 KVA and above 11 5 0 24 11 25 36 14
DK/CS 2 8 - 1 - - 0 -
MEAN 168.38 151.93 40.4 224.8 202.1 205.8 287.8 179.51
All (n=5003)
Jharkhand (n=19)
Karnataka (n=188)
Kerala (n=143)
MP (n=156)
Nagaland (n=1)
Orissa (n=38)
Pondicherry (n=2)
Punjab (n=402)
1-50 12 26 50 3 6 - 16 - 3
51-100 27 63 15 12 26 - 34 - 68
101-150 19 11 12 17 40 - 8 50 11
151-200 17 - 4 10 12 - 8 - 10
201-250 9 - 10 11 7 100 5 - 3
251-300 3 - 1 5 2 - 5 - 1
300 KVA and above 11 0 7 29 7 0 24 50 3
DK/CS 2 - 2 12 - - - - 1
MEAN 168.38 71.3 106.8 267.3 150.4 240.0 185.9 362.5 118.7

© COPYRIGHT 2014 278
16.2 DG SET IN CS
All (n=5003)
Type H (n=4333)
Type P (n=523)
Type M (n=452)
Type Q (n=44)
Other Products
(n=27)
Mean number of DG set in CS’s 1.8 1.9 1.8 1.6 1.5 1.9
All (n=5003)
North (n=2142)
East (n=803)
West (n=1013)
South (n=1045)
Mean number of DG set in CS’s 1.8 2.0 2.5 1.2 1.7
All (n=5003)
Maharashtra (n=451)
UP (n=1371)
A & N (n=10)
AP (n=600)
Assam (n=22)
Bihar (n=169)
Chandigarh (n=3)
Mean number of DG set in CS’s 1.8 1.3 2.2 1.0 1.9 2.1 2.5 1.0
All Figs in % All Respondents
All (n=5003)
C’garh (n=76)
Delhi (n=35)
Goa (n=7)
Gujarat (n=399)
Haryana (n=185)
HP (n=14)
J & K (n=16)
Mean number of DG set in CS’s 1.8 1.1 1.5 1.1 1.2 1.7 1.4 1.3
All (n=5003)
Jharkhand (n=19)
Karnataka (n=188)
Kerala (n=143)
MP (n=156)
Nagaland (n=1)
Orissa (n=38)
Pondicherry (n=2)
Punjab (n=402)
Mean number of DG set in CS’s 1.8 2.0 1.3 1.4 1.2 1.0 1.3 1.0 1.4
All (n=5003)
Rajasthan (n=104)
Sikkim (n=5)
TN (n=102)
Tripura (n=9)
Uttaranchal (n=12)
WB (n=464)
North East (n=37)
Mean number of DG set in CS’s 1.8 2.4 1.0 1.5 1.7 1.7 2.8 1.8

© COPYRIGHT 2014 279
16.3 ENERGY USAGE & COST
All Figs in % All Respondents
• Average energy cost is at over Rs 19 lakhs overall. M type – Animal husbandry and Q type – Pharmaceuticals spend more on energy cost.
• Animal husbandry stores also consume more diesel in a year compared to others
Item Current Year
2012 Previous Year
2011 Previous Year
2010 Average Energy Cost (INR) for mean capacity all India
1899129 1670915 1521697
Grid Power (Hrs / day) 17 16 16
Diesel fuel(Liters) 16473 17671 18002
All (n=5003)
Item Current Year
2012 Previous Year
2011 Previous Year
2010 Average Energy Cost (INR) for mean capacity of segment
1877664 1629657 1475574
Grid Power (Hrs / day) 17 16 16
Diesel fuel(Liters) 14788 16378 16453
Item Current Year
2012 Previous Year
2011 Previous Year
2010 Average Energy Cost (INR) for mean capacity of segment
1730135 1538706 1432101
Grid Power (Hrs / day) 18 18 17
Diesel fuel(Liters) 15346 22261 18212
Horticulture / Agriculture (n=4308)
Processed Food (n=516)

© COPYRIGHT 2014 280
16.3 ENERGY USAGE & COST
All Figs in % All Respondents
Item Current Year
2012 Previous Year
2011 Previous Year
2010 Average Energy Cost (INR) for mean capacity of segment
2662269 2490079 2242319
Grid Power (Hrs / day) 19 19 19
Diesel fuel(Liters) 31279 30365 29195
Animal Husbandry (n=456)
Item Current Year
2012 Previous Year
2011 Previous Year
2010 Average Energy Cost (INR) for mean capacity of segment
2271436 2021987 2143071
Grid Power (Hrs / day) 20 20 20
Diesel fuel(Liters) 9915 9177 7027
Item Current Year
2012 Previous Year
2011 Previous Year
2010 Average Energy Cost (INR) for mean capacity of segment
1358462 869700 552903
Grid Power (Hrs / day) 18 17 17
Diesel fuel(Liters) 15972 12163 12462
Pharmaceuticals (n=43)
Other products (n=27)

© COPYRIGHT 2014 281
16.3 ENERGY USAGE & COST
All Figs in % All Respondents
• Average energy cost is the highest in East • The quantum of DG fuel used is highest in South.
Item Current Year
2012 Previous Year
2011 Previous Year
2010 Average Energy Cost (INR) for mean capacity all India
1899129 1670915 1521697
Grid Power (Hrs / day) 17 16 16 Diesel fuel(Liters) 16473 17671 18002
All (n=5003)
Item Current Year
2012 Previous Year
2011 Previous Year
2010 Average Energy Cost (INR) for mean capacity of zone
1819212 1668768 1497308
Grid Power (Hrs / day) 16 15 15 Diesel fuel(Liters) 16007 19423 20808
Item Current Year
2012 Previous Year
2011 Previous Year
2010 Average Energy Cost (INR) for mean capacity of zone
2836916 2251808 2013288
Grid Power (Hrs / day) 17 16 16 Diesel fuel(Liters) 19604 19227 18999
Item Current Year
2012 Previous Year
2011 Previous Year
2010 Average Energy Cost (INR) for mean capacity of zone
1689736 1609179 1501587
Grid Power (Hrs / day) 20 20 20 Diesel fuel(Liters) 5163 7743 4645
Item Current Year
2012 Previous Year
2011 Previous Year
2010 Average Energy Cost (INR) for mean capacity of zone
1585742 1306501 1226514
Grid Power (Hrs / day) 17 17 16 Diesel fuel(Liters) 24609 20911 22319
North (n=2142)
East (n=803)
West (n=1013)
South (n=1045)

© COPYRIGHT 2014 282
16.3 ENERGY USAGE & COST
All Figs in % All Respondents
.
Item Current Year
2012 Previous Year
2011 Previous Year
2010 Average Energy Cost (INR) for mean capacity all India
1899129 1670915 1521697
Grid Power (Hrs / day) 17 16 16 Diesel fuel(Liters) 16473 17671 18002
All (n=5003)
Item Current Year
2012 Previous Year
2011 Previous Year
2010 Average Energy Cost (INR) for mean capacity for state
1144101 1073438 1008017
Grid Power (Hrs / day) 19 19 19 Diesel fuel(Liters) 5969 8344 5104
Item Current Year
2012 Previous Year
2011 Previous Year
2010 Average Energy Cost (INR) for mean capacity for state
1979621 1803856 1647035
Grid Power (Hrs / day) 14 13 13 Diesel fuel(Liters) 21990 26611 28558
Item Current Year
2012 Previous Year
2011 Previous Year
2010 Average Energy Cost (INR) for mean capacity for state
691600 641000 580500
Grid Power (Hrs / day) 22 22 22 Diesel fuel(Liters) 2299 70845 2282
Item Current Year
2012 Previous Year
2011 Previous Year
2010 Average Energy Cost (INR) for mean capacity for state
1634493 1432927 1284111
Grid Power (Hrs / day) 17 16 15 Diesel fuel(Liters) 18326 14690 16475
Maharashrta (n=451)
UP (n=1371)
Andaman and Nicobar Islands (n=10)
Andhra Pradesh (n=600)

© COPYRIGHT 2014 283
16.3 ENERGY USAGE & COST
All Figs in % All Respondents
• The average energy cost for all India is at over Rs 19 lakhs • However there are a few states where the average energy cost is much higher – Delhi Rs 30
lakhs, TN Rs 22 lakhs, and WB Rs 37 lakhs. • In TN even the diesel consumption is higher more than 77000 liters while the all India average is
less than 17000 liters.
Item Current Year
2012 Previous Year
2011 Previous Year
2010 Average Energy Cost (INR) for mean capacity for state
1385411 1183766 1400119
Grid Power (Hrs / day) 14 13 12 Diesel fuel(Liters) 28919 30927 12254
Assam (n=22)
Item Current Year
2012 Previous Year
2011 Previous Year
2010 Average Energy Cost (INR) for mean capacity for state
1791129 1633469 1435570
Grid Power (Hrs / day) 10 9 8 Diesel fuel(Liters) 45907 44917 46336
Item Current Year
2012 Previous Year
2011 Previous Year
2010 Average Energy Cost (INR) for mean capacity for state
1366667 1133333 966667
Grid Power (Hrs / day) 19 20 20 Diesel fuel(Liters) 2333 2167 1833
Item Current Year
2012 Previous Year
2011 Previous Year
2010 Average Energy Cost (INR) for mean capacity for state
1096306 901858 852457
Grid Power (Hrs / day) 20 20 20 Diesel fuel(Liters) 4108 3017 3393
Item Current Year
2012 Previous Year
2011 Previous Year
2010 Average Energy Cost (INR) for mean capacity for state
3026606 2414383 2174732
Grid Power (Hrs / day) 21 20 20 Diesel fuel(Liters) 3759 4202 5261
Bihar (n=169)
Chandigarh (n=3)
Chhattisgarh (n=76)
Delhi (n=35)

© COPYRIGHT 2014 284
16.3 ENERGY USAGE & COST
All Figs in % All Respondents
Item Current Year
2012 Previous Year
2011 Previous Year
2010 Average Energy Cost (INR) for mean capacity for state
787143 2666857 1130014
Grid Power (Hrs / day) 17 17 17 Diesel fuel(Liters) 1637 1478 370
Goa (n=7)
Item Current Year
2012 Previous Year
2011 Previous Year
2010 Average Energy Cost (INR) for mean capacity for state
2161948 2016666 1931419
Grid Power (Hrs / day) 22 21 21 Diesel fuel(Liters) 4446 7875 3942
Item Current Year
2012 Previous Year
2011 Previous Year
2010 Average Energy Cost (INR) for mean capacity for state
1030986 704368 421225
Grid Power (Hrs / day) 16 15 13 Diesel fuel(Liters) 3433 5577 3966
Item Current Year
2012 Previous Year
2011 Previous Year
2010 Average Energy Cost (INR) for mean capacity for state
2132144 359263 325417
Grid Power (Hrs / day) 21 16 19 Diesel fuel(Liters) 14250 101 101
Item Current Year
2012 Previous Year
2011 Previous Year
2010 Average Energy Cost (INR) for mean capacity for state
947813 1270333 984286
Grid Power (Hrs / day) 17 16 14 Diesel fuel(Liters) 4575 7241 5505
Gujarat (n=399)
Haryana (n=185)
Himachal Pradesh (n=14)
Jammu and Kashmir (n=16)

© COPYRIGHT 2014 285
16.3 ENERGY USAGE & COST
All Figs in % All Respondents
Item Current Year
2012 Previous Year
2011 Previous Year
2010 Average Energy Cost (INR) for mean capacity for state
1404123 994570 975567
Grid Power (Hrs / day) 15 15 14 Diesel fuel(Liters) 60649 51885 51084
Jharkhand (n=19)
Item Current Year
2012 Previous Year
2011 Previous Year
2010 Average Energy Cost (INR) for mean capacity for state
550100 159609 408064
Grid Power (Hrs / day) 19 19 19 Diesel fuel(Liters) 14100 9096 10554
Item Current Year
2012 Previous Year
2011 Previous Year
2010 Average Energy Cost (INR) for mean capacity for state
2251105 1937378 1578767
Grid Power (Hrs / day) 17 17 17 Diesel fuel(Liters) 20326 17767 12617
Item Current Year
2012 Previous Year
2011 Previous Year
2010 Average Energy Cost (INR) for mean capacity for state
2110097 2102922 1870279
Grid Power (Hrs / day) 21 20 20 Diesel fuel(Liters) 3337 4097 4991
Item Current Year
2012 Previous Year
2011 Previous Year
2010 Average Energy Cost (INR) for mean capacity for state
25000 330000 420000
Grid Power (Hrs / day) 2 2 2 Diesel fuel(Liters) 1800 14000 11000
Karnataka (n=188)
Kerala (n=143)
Madhya Pradesh (n=156)
Nagaland (n=1)

© COPYRIGHT 2014 286
16.3 ENERGY USAGE & COST
All Figs in % All Respondents
Item Current Year
2012 Previous Year
2011 Previous Year
2010 Average Energy Cost (INR) for mean capacity for state
855529 828240 778085
Grid Power (Hrs / day) 19 17 17 Diesel fuel(Liters) 1424 1238 1192
Orissa (n=38)
Item Current Year
2012 Previous Year
2011 Previous Year
2010 Average Energy Cost (INR) for mean capacity for state
5400000 5100000 4825000
Grid Power (Hrs / day) 1 1 1 Diesel fuel(Liters) 12120 1120 1120
Item Current Year
2012 Previous Year
2011 Previous Year
2010 Average Energy Cost (INR) for mean capacity for state
1493288 1428837 1254800
Grid Power (Hrs / day) 21 21 21 Diesel fuel(Liters) 6979 5329 15318
Item Current Year
2012 Previous Year
2011 Previous Year
2010 Average Energy Cost (INR) for mean capacity for state
111500 93250 75500
Grid Power (Hrs / day) 13 12 8 Diesel fuel(Liters) 850 1475 2500
Item Current Year
2012 Previous Year
2011 Previous Year
2010 Average Energy Cost (INR) for mean capacity for state
2265717 1829358 1958413
Grid Power (Hrs / day) 14 15 16 Diesel fuel(Liters) 77285 69159 86647
Pondicherry (n=2)
Rajasthan (n=104)
Sikkim (n=5)
Tamil Nadu (n=102)
Item Current Year
2012 Previous Year
2011 Previous Year
2010 Average Energy Cost (INR) for mean capacity for state
1649196 1713796 1549663
Grid Power (Hrs / day) 19 19 19 Diesel fuel(Liters) 3354 4460 3405
Punjab (n=402)

© COPYRIGHT 2014 287
16.3 ENERGY USAGE & COST
All Figs in % All Respondents
Item Current Year
2012 Previous Year
2011 Previous Year
2010 Average Energy Cost (INR) for mean capacity for state
1250445 917502 876876
Grid Power (Hrs / day) 16 14 14
Diesel fuel(Liters) 21841 9739 10295
Tripura (n=9)
Item Current Year
2012 Previous Year
2011 Previous Year
2010 Average Energy Cost (INR) for mean capacity for state
1672745 1516683 1441683
Grid Power (Hrs / day) 16 15 15
Diesel fuel(Liters) 6880 5753 5400
Item Current Year
2012 Previous Year
2011 Previous Year
2010 Average Energy Cost (INR) for mean capacity for state
3751428 2867272 2521161
Grid Power (Hrs / day) 19 18 18
Diesel fuel(Liters) 11618 11960 11843
Uttaranchal (n=12)
West Bengal (n=464)
Item Current Year
2012 Previous Year
2011 Previous Year
2010 Average Energy Cost (INR) for mean capacity for state
1166247 954205 1083012
Grid Power (Hrs / day) 14 13 12
Diesel fuel(Liters) 24596 23260 11364
North East (n=37)

© COPYRIGHT 2014 288
16.4 GRID POWER QUALITY
All Figs in % All Respondents
• The usable power quality is reported better in East and South compared to North and West zones
56
44
52
43
5
• Only 52% get usable – satisfactory power to run their CSs. • Highly irregular power supply is also reported to some extent for all type of storage CSs
Usable (Satisfactory) Voltage Fluctuating Highly Irregular
Zone wise
51
44
5 52
45
2 52
41
7
64 33
2
63 34
3 52
43
5 41
53
6 52
44
5
67 27
5
Usable (Satisfactory) Voltage Fluctuating Highly Irregular
All (n=5003)
Type H (n=4333)
Type P (n=523)
Type M (n=452)
Type Q (n=44)
Other Products
(n=27)
North (n=2142)
East (n=803)
West (n=1013)
South (n=1045)
All (n=5003)

© COPYRIGHT 2014 289
16.4 GRID POWER QUALITY
All Figs in % All Respondents
States
All (n=5003)
Maharashtra (n=451)
UP (n=1371)
A & N (n=10)
AP (n=600)
Assam (n=22)
Bihar (n=169)
Chandigarh (n=3)
Usable (Satisfactory) 52 60 29 20 70 32 47 100
Voltage Fluctuating 43 38 62 50 27 45 45 -
Highly Irregular 5 2 8 30 3 23 8 -
All (n=5003)
C’garh (n=76)
Delhi (n=35)
Goa (n=7)
Gujarat (n=399)
Haryana (n=185)
HP (n=14)
J & K (n=16)
Usable (Satisfactory) 52 76 71 57 45 76 86 19
Voltage Fluctuating 43 13 29 14 47 23 14 81
Highly Irregular 5 11 - 29 8 2 - -
All (n=5003)
Jharkhand (n=19)
Karnataka (n=188)
Kerala (n=143)
MP (n=156)
Nagaland (n=1)
Orissa (n=38)
Pondicherry (n=2)
Punjab (n=402)
Usable (Satisfactory) 52 53 30 73 44 100 42 100 55
Voltage Fluctuating 43 47 69 27 55 - 34 - 42
Highly Irregular 5 - 1 - 1 - 24 - 3
All (n=5003)
Rajasthan (n=104)
Sikkim (n=5)
TN (n=102)
Tripura (n=9)
Uttaranchal (n=12)
WB (n=464)
North East (n=37)
Usable (Satisfactory) 52 69 60 65 89 25 77 51
Voltage Fluctuating 43 29 40 24 11 75 21 35
Highly Irregular 5 2 - 12 - - 2 14
• Though no difference was found in type wise or zone wise analysis, state wise analysis shows wide variation.
• Voltage fluctuation was reported in UP, Assam, Gujarat, J&K, Karnataka, Sikkim and Uttaranchal. • Irregular supply was reported in Andaman, TN and Orissa

© COPYRIGHT 2014 290
16.5. AVAILABILITY OF ALTERNATE POWER SOURCE
All Figs in % All Respondents
19
85
• Most of the CSs do not have alternate power option. • The incidence of alternative power option is higher for type M storage units
Zone wise
5
95
4
96
Yes No
6
94
8
93
7
93
4
96
5
95
5
95
6
94
4
96
Yes No
• Zone wise analysis also shows that most of the CSs do not have alternative power option
All (n=5003)
Type H (n=4333)
Type P (n=523)
Type M (n=452)
Type Q (n=44)
Other Products
(n=27)
North (n=2142)
East (n=803)
West (n=1013)
South (n=1045)
All (n=5003)

© COPYRIGHT 2014 291
16.5 AVAILABILITY OF ALTERNATE POWER SOURCE
All Figs in % All Respondents
States
• State wise analysis shows that to some extent, alternative power options are available in Chandigarh, TN and Punjab where at least over 10% of CSs have alternate power source
All (n=5003)
Maharashtra (n=451)
UP (n=1371)
A & N (n=10)
AP (n=600)
Assam (n=22)
Bihar (n=169)
Chandigarh (n=3)
Yes 5 5 2 - 2 0 5 33
No 95 96 98 100 98 100 95 67
All (n=5003)
C’garh (n=76)
Delhi (n=35)
Goa (n=7)
Gujarat (n=399)
Haryana (n=185)
HP (n=14)
J & K (n=16)
Yes 5 4 3 0 5 0 0 6
No 95 96 97 100 95 100 100 94
All (n=5003)
Jharkhand (n=19)
Karnataka (n=188)
Kerala (n=143)
MP (n=156)
Nagaland (n=1)
Orissa (n=38)
Pondicherry (n=2)
Punjab (n=402)
Yes 5 21 7 5 1 - 8 0 20
No 95 79 94 95 99 100 92 100 80
All (n=5003)
Rajasthan (n=104)
Sikkim (n=5)
TN (n=102)
Tripura (n=9)
Uttaranchal (n=12)
WB (n=464)
North East (n=37)
Yes 5 2 60 12 - - 1 8
No 95 98 40 88 100 100 99 92

© COPYRIGHT 2014 292
16.6 ALTERNATE POWER SOURCE
All Figs in % All Respondents
Wind
Solar Thermal
Biomass Gasifier
Solar Photo Voltaic
Other
None
2
1
1
1
1
95
0
7
4
7
0
85
2
1
0
1
0
96
1
2
1
2
1
94
1
1
3
2
1
93
2
0
0
5
0
93
2
1
1
1
1
95
1
2
1
1
1
96
2
1
0
1
0
95
3
1
0
1
1
94
0
0
2
1
1
96
• Most of the CSs do not have alternate source of power option
• There is no difference in zone wise analysis
Zone wise
Wind
Solar Thermal
Biomass Gasifier
Solar Photo Voltaic
Other
None
All (n=5003)
Type H (n=4333)
Type P (n=523)
Type M (n=452)
Type Q (n=44)
Other Products
(n=27)
All (n=5003)
North (n=2142)
East (n=803)
West (n=1013)
South (n=1045)

© COPYRIGHT 2014 293
16.6 ALTERNATE POWER SOURCE
All Figs in % All Respondents
States
All (n=5003)
Maharashtra (n=451)
UP (n=1371)
A & N (n=10)
AP (n=600)
Assam (n=22)
Bihar (n=169)
Chandigarh (n=3)
Wind 2 1 0 - - - 0 33
Solar Thermal 1 0 0 - 1 - 2 -
Biomass Gasifier 1 1 0 - 1 - 1 -
Solar Photo Voltaic 1 1 1 - 1 - 1 -
Other 1 2 0 - - - 1 -
None 95 96 98 100 98 100 95 67
All (n=5003)
C’garh (n=76)
Delhi (n=35)
Goa (n=7)
Gujarat (n=399)
Haryana (n=185)
HP (n=14)
J & K (n=16)
Wind 2 - - - - - - -
Solar Thermal 1 1 - - 0 - - -
Biomass Gasifier 1 - - - 3 - - -
Solar Photo Voltaic 1 3 - - 1 - - -
Other 1 - 3 - 0 - - 6
None 95 96 97 100 95 100 100 94
• State wise analysis shows that there are a few states where alternative power option is available.
• Punjab, Sikkim and Chandigarh reports having wind energy.

© COPYRIGHT 2014 294
16.6 ALTERNATE POWER SOURCE
All Figs in % All Respondents
States
All (n=5003)
Rajasthan (n=104)
Sikkim (n=5)
TN (n=102)
Tripura (n=9)
Uttaranchal (n=12)
WB (n=464)
North East (n=37)
Wind 2 - 40 5 - - 0 5
Solar Thermal 1 - 20 3 - - 0 3
Biomass Gasifier 1 1 - 1 - - - -
Solar Photo Voltaic 1 - - 3 - - 0 -
Other 1 1 - - - - 0 -
None 95 98 40 88 100 100 99 92
All (n=5003)
Jharkhand (n=19)
Karnataka (n=188)
Kerala (n=143)
MP (n=156)
Nagaland (n=1)
Orissa (n=38)
Pondicherry (n=2)
Punjab (n=402)
Wind 2 5 1 - 1 - - - 11
Solar Thermal 1 5 3 1 - - - - 6
Biomass Gasifier 1 - 1 1 - - 3 - 1
Solar Photo Voltaic 1 11 1 1 - - - - 1
Other 1 - 2 2 - - 5 - 1
None 95 79 94 95 99 100 92 100 80

© COPYRIGHT 2014
CHAPTER 17
AUTOMATION IN MATERIAL HANDLING
Page no 295 to 318

© COPYRIGHT 2014 296
17. AUTOMATION USED IN CARGO HANDLING AND REMOTE MONITORING OF CS’s
Cargo Handling and Automation tools
Hand pallet lifters & Conveyor belts for unloading / loading are the 2 are prominent
automation tools used.
Only 8% of the cold stores (350 facilities) reported having mechanised forklifts for handling loads. Almost 6% had cargo lifts installed for multi-level movement.
Specifically 23% of Type Q cold storages utilize data loggers and cargo lifts. Usage of these automation tools among other product type cold storages is comparatively lower.
Mechanization in the North based cold storages is not as much since 27% of them still rely on manual workers and laborers.
Conveyor Belt for loading unloading
Hand Pallet Lifters
Manual / worker / Labour
Humidity Sensors and Controls
Data Loggers (fixed or portable)
Fork Lift for Pallet handling (electric or diesel)
Warehouse Management Software
Cargo Lift (for multi level stores)
Bar-code / RFID tags and readers
No Response
24
22
18
10
8
8
6
6
4
21
0
44
22
7
22
11
7
15
0
15
25
20
18
10
7
7
6
6
3
23
22
34
17
13
21
19
5
6
12
11
22
34
17
13
21
19
5
7
12
11
16
23
14
9
23
20
18
23
5
16
All (n=5003)
Type H (n=4333)
Type P (n=523)
Type M (n=452)
Type Q (n=44)
Other Products
(n=27)

© COPYRIGHT 2014 297
17. AUTOMATION USED IN CARGO HANDLING AND REMOTE MONITORING OF CS’s
Technology has penetrated in many areas of CS’s, but there are certain areas which still follow the rudimentary way of doing things. Air ventilation is an area that still has great scope of improvement with only 21% having Automatic ventilation. Similarly use of automation in refrigeration too is limited with manual cut-offs and cut-ins across India.
Timely Air ventilation becomes an important activity in the CS’s. Automatic ventilation system is adopted in 1 out of every 5 CS’s (21%). Automated ventilation is adopted most in 42% of cold stores storing Animal Husbandry products. Overall in 35% of CSs in the West zone and 30% of those in the South zone have automated ventilation systems.
More than 90% cold storages in the North and East make use of manual air replenishment systems. This is primarily witnessed in the states of UP and WB.
21%
83%
Automated Ventilation
AutomaticVentilation system
Manual (Dooropened regularly)

© COPYRIGHT 2014 298
17. AUTOMATION USED IN CARGO HANDLING AND REMOTE MONITORING OF CS’s
Automated Ventilation – Ageing Matrix
It is observed that automation in ventilation is higher amongst CS’s which were built after 2009.
Automated Ventilation – Ownership Type
1 out of 3 government cold storages have automatic ventilation system, which is as good as public limited companies
Automated Ventilation
ALL
(n=5003)
Proprietorship
(n=1336)
Partnership
(n=1677)
Company (Public
Ltd.)
(n=174)
Company
(Private Ltd.)
(n=1563)
Automatic
Ventilation system 21 21 18 36 21
Manual Air
Replenishment 83 81 87 68 84
Automated Ventilation
Association
(Public)
(n=5)
Association
(Private)
(n=12)
Cooperative
(n=130)
Government
(Co./Dept./
PSU)
(n=82)
Not classified
under any
Ownership
type
(n=24)
Automatic
Ventilation system 40 17 28 34 29
Manual Air
Replenishment 60 92 75 68 75
CS built before
2009
CS built After
2009
Automatic Ventilation system 19% 28%
Manual Air Replenishment
(Door opened regularly) 85% 77%
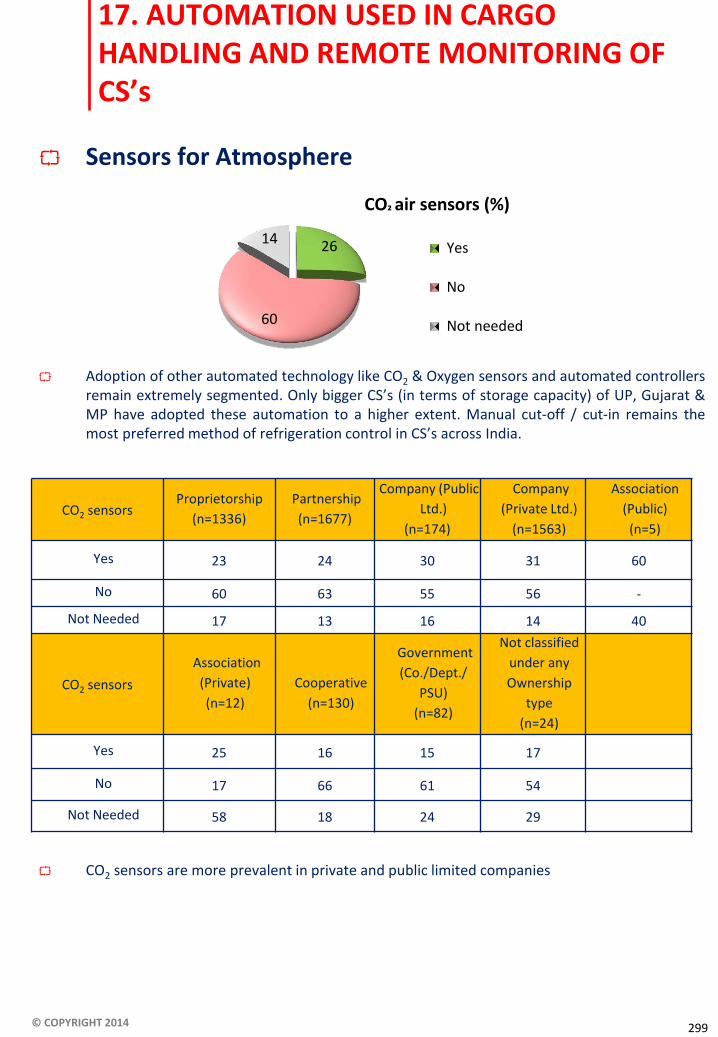
© COPYRIGHT 2014 299
17. AUTOMATION USED IN CARGO HANDLING AND REMOTE MONITORING OF CS’s
Sensors for Atmosphere
Adoption of other automated technology like CO2 & Oxygen sensors and automated controllers remain extremely segmented. Only bigger CS’s (in terms of storage capacity) of UP, Gujarat & MP have adopted these automation to a higher extent. Manual cut-off / cut-in remains the most preferred method of refrigeration control in CS’s across India.
CO2 sensors are more prevalent in private and public limited companies
26
60
14
CO² air sensors (%)
Yes
No
Not needed
CO2 sensors Proprietorship
(n=1336)
Partnership
(n=1677)
Company (Public
Ltd.)
(n=174)
Company
(Private Ltd.)
(n=1563)
Association
(Public)
(n=5)
Yes 23 24 30 31 60
No 60 63 55 56 -
Not Needed 17 13 16 14 40
CO2 sensors
Association
(Private)
(n=12)
Cooperative
(n=130)
Government
(Co./Dept./
PSU)
(n=82)
Not classified
under any
Ownership
type
(n=24)
Yes 25 16 15 17
No 17 66 61 54
Not Needed 58 18 24 29

© COPYRIGHT 2014 300
17. AUTOMATION USED IN CARGO HANDLING AND REMOTE MONITORING OF CS’s
At an all India level, we see that 60% cold storages do not have sensors to measure the proportion of CO2, O2 and humidity in the atmosphere. 1 out of 4 Type H and Type M cold storages make use of such sensors.
In both North and West zones, close to 30% cold storages have automatic sensors fitted in the facility.
The number of cold storages using CO2 sensors are higher among those built after 2009.
CS built before
2009
CS built after
2009
In use 25% 28%
Not in use 61% 57%
Reported not needed 14% 15%

© COPYRIGHT 2014 301
17. AUTOMATION USED IN CARGO HANDLING AND REMOTE MONITORING OF CS’s
Automated Ventilation – Ownership Type
Automatic ventilation system is found in more percentage of urban CSs compared to rural CSs.
Like wise more no. of non NHB assisted CSs had automatic ventilation systems
Sensors for Atmosphere – Ownership Type
More percentage of rural CSs and NHB assisted CSs have CO2 sensors.
Automated Ventilation
Urban CS’s
(n=1481)
Rural CS’s
(n=3522)
NHB/NHM
(n=3061)
Others
(n=1942)
Automatic
Ventilation system 29 17 15 29
Manual Air
Replenishment 74 87 88 75
CO2 Censors Urban CS’s
(n=1481)
Rural CS’s
(n=3522)
NHB/NHM
(n=3061)
Others
(n=1942)
Yes 21 28 28 23
No 61 59 59 60
Not Needed 19 13 13 17

© COPYRIGHT 2014 302
17. AUTOMATION USED IN CARGO HANDLING AND REMOTE MONITORING OF CS’s
Only 23% of CSs had automation for drives. Of those who had, 46% had variable frequency
drives, 39% had programme logic control and 32% had energy recovery wheels. In the Western zone usage of ERW’s is higher than in other zones. Over 55% of Type M and East based cold storages have variable frequency drives.
Automation for drives is more prevalent in cold storages built after 2009.
In monitoring gas leakage only 18% had automatic system to detect gas leakage while the rest had only manual checking by technicians. In the Western zone more so in the states of Maharashtra and Gujarat 1/3rd storages detect gas leakages with help of machines.
CS built before
2009
CS built after
2009
VFD (Variable frequency drive) 43% 54%
ERW (Energy recovery wheel 31% 32%
PLC (Program logic control) 36% 45%
46
39
32
Automation in drives
VFD PLC ERW

© COPYRIGHT 2014 303
17. AUTOMATION USED IN CARGO HANDLING AND REMOTE MONITORING OF CS’s
Automation in Cargo Handling
Proprietorship
(n=356)
Partnership
(n=341)
Company (Public
Ltd.)
(n=59)
Company
(Private Ltd.)
(n=309)
Association
(Public)
(n=3)
VFD (Variable frequency drive)
46 44 42 49 67
ERW (Energy recovery wheel)
31 40 34 26 -
PLC (Program logic control)
41 35 44 36 33
Automation in Cargo Handling
Association
(Private)
(n=3)
Cooperative
(n=42)
Government
(Co./Dept./ PSU)
(n=32)
Not classified
under any
Ownership type
(n=7)
VFD (Variable frequency drive)
33 43 44 29
ERW (Energy recovery wheel)
- 24 19 14
PLC (Program logic control)
67 62 41 57
Automation in Cargo Handling
Urban CS’s
(n=398)
Rural CS’s
(n=754)
NHB/NHM
(n=570)
Others
(n=582)
VFD (Variable frequency drive)
60 38 42 49
ERW (Energy recovery wheel)
28 33 35 29
PLC (Program logic control)
35 41 37 41
Variable frequency drives are more prevalent among urban CSs. When analyzing the data by ownership, variable frequency drives used more in CSs owned by
public limited companies and government companies At the same time energy recovery wheel is used in a fewer installations in govt. owned CSs

© COPYRIGHT 2014 304
17.1 CARGO HANDLING & AUTOMATION TOOLS
All Figs in % All Respondents
Conveyor Belt for loading unloading
Hand Pallet Lifters
Manual / worker / Labour
Humidity Sensors and Controls
Data Loggers (fixed or portable)
Fork Lift for Pallet handling (electric or diesel)
Warehouse Management Software
Cargo Lift (for multi level stores)
Bar-code / RFID tags and readers
No Response
24
22
18
10
8
8
6
6
4
21
• 1/3rd of the Type M cold stores use hand pallet lifters for cargo handling. • Close to 1/4th Type H, P & M cold stores also use belts for loading and unloading purposes.
Zone wise
• Almost half of the cold stores in the Eastern Zone utilize belts for loading and unloading. • In the West and South, 31% CS’s use hand pallet lifters for cargo handling.
0
44
22
7
22
11
7
15
0
15
25
20
18
10
7
7
6
6
3
23
23
29
11
13
12
13
10
9
6
14
22
34
17
13
21
19
5
6
12
11
16
23
14
9
23
20
18
23
5
16
14
31
12
18
15
13
7
7
6
17
18
15
27
4
5
3
6
2
1
30
47
15
15
14
5
9
4
8
2
14
29
31
8
12
10
12
7
12
8
11
All (n=5003)
Type H (n=4333)
Type P (n=523)
Type M (n=452)
Type Q (n=44)
Other Products
(n=27)
North (n=2142)
East (n=803)
West (n=1013)
South (n=1045)
Conveyor Belt for loading unloading
Hand Pallet Lifters
Manual / worker / Labour
Humidity Sensors and Controls
Data Loggers (fixed or portable)
Fork Lift for Pallet handling (electric or diesel)
Warehouse Management Software
Cargo Lift (for multi level stores)
Bar-code / RFID tags and readers
No Response
24
22
18
10
8
8
6
6
4
21
All (n=5003)

© COPYRIGHT 2014 305
States
17.1 CARGO HANDLING & AUTOMATION TOOLS
All Figs in % All Respondents
All (n=5003)
Maharashtra (n=451)
UP (n=1371)
A & N (n=10)
AP (n=600)
Assam (n=22)
Bihar (n=169)
Chandigarh (n=3)
Conveyor Belt for loading unloading
24 43 20 - 14 27 17 -
Hand Pallet Lifters 22 36 18 10 22 32 32 33
Manual / worker / Labour 18 9 19 90 10 5 1 33
Humidity Sensors and Controls
10 18 5 10 22 23 16 -
Data Loggers (fixed or portable)
8 11 7 - 14 9 6 -
Fork Lift for Pallet handling (electric or diesel)
8 17 3 - 9 5 4 -
Warehouse Management Software
6 8 7 - 8 - 7 -
Cargo Lift (for multi level stores)
6 16 1 - 7 5 5 33
Bar-code / RFID tags and readers
4 11 1 - 5 - 1 -
No Response 21 3 31 - 23 14 18 -
All (n=5003)
C’garh (n=76)
Delhi (n=35)
Goa (n=7)
Gujarat (n=399)
Haryana (n=185)
HP (n=14)
J & K (n=16)
Conveyor Belt for loading unloading
24 18 9 29 23 2 - 25
Hand Pallet Lifters 22 7 11 29 29 5 7 38
Manual / worker / Labour 18 18 31 29 9 51 21 25
Humidity Sensors and Controls
10 8 6 - 6 1 14 6
Data Loggers (fixed or portable)
8 8 6 - 11 1 7 6
Fork Lift for Pallet handling (electric or diesel)
8 7 - - 9 4 7 6
Warehouse Management Software
6 1 14 - 5 3 - 6
Cargo Lift (for multi level stores)
6 20 3 - 4 2 29 6
Bar-code / RFID tags and readers
4 7 9 14 7 2 7 6
No Response 21 25 29 14 18 39 29 6
• 30% cold stores in Gujarat and Bihar make use of hand pallet lifters. • A little over 40% storages in Maharashtra use conveyor belt for loading unloading cargo.

© COPYRIGHT 2014 306
17.1 CARGO HANDLING & AUTOMATION TOOLS
All Figs in % All Respondents
States
All (n=5003)
Jharkhand (n=19)
Karnataka (n=188)
Kerala (n=143)
MP (n=156)
Nagaland (n=1)
Orissa (n=38)
Pondicherry (n=2)
Punjab (n=402)
Conveyor Belt for loading unloading
24 21 18 10 6 - 11 - 15
Hand Pallet Lifters 22 47 61 29 22 100 24 50 8
Manual / worker / Labour 18 5 3 29 1 - 11 - 50
Humidity Sensors and Controls
10 - 3 9 9 - 8 100 2
Data Loggers (fixed or portable)
8 5 6 23 6 - 5 50 1
Fork Lift for Pallet handling (electric or diesel)
8 11 11 22 8 - 5 50 2
Warehouse Management Software
6 - 5 4 6 - - 50 2
Cargo Lift (for multi level stores)
6 - 5 5 24 - 3 - 1
Bar-code / RFID tags and readers
4 - 5 4 3 - 3 - 1
No Response 21 11 5 12 17 - 45 - 25
• 60% of cold stores in Karnataka make use of hand pallet lifters. • Nearly 70% storages in WB use belts for loading and unloading.
All (n=5003)
Rajasthan (n=104)
Sikkim (n=5)
TN (n=102)
Tripura (n=9)
Uttaranchal (n=12)
WB (n=464)
North East (n=37)
Conveyor Belt for loading unloading
24 37 - 17 11 8 69 19
Hand Pallet Lifters 22 18 40 37 22 - 7 32
Manual / worker / Labour 18 2 - 10 33 33 20 11
Humidity Sensors and Controls
10 7 60 32 33 - 15 30
Data Loggers (fixed or portable)
8 4 - 25 - - 5 5
Fork Lift for Pallet handling (electric or diesel)
8 10 - 27 - - 12 3
Warehouse Management Software
6 9 - 8 - 8 5 -
Cargo Lift (for multi level stores)
6 5 - 17 - - 8 3
Bar-code / RFID tags and readers
4 - 20 13 - - 2 3
No Response 21 22 - 11 - 58 9 8

© COPYRIGHT 2014 307
17.1 CARGO HANDLING & AUTOMATION TOOLS – COMPARISON BEFORE AND AFTER 2009
All Figs in % All Respondents
All Type H Type P Type M Type Q Other Products
On/After 2009
(n=1183)
Before 2009
(n=3691)
On/After 2009
(n=1034)
Before 2009
(n=3187)
On/After 2009
(n=112)
Before 2009
(n=400)
On/After 2009
(n=106)
Before 2009
(n=335)
On/After 2009 (n=7)
Before 2009
(n=35)
On/After 2009 (n=6)
Before 2009
(n=20)
Conveyor Belt for loading unloading
21 26 22 26 21 23 19 24 43 11 - -
Hand Pallet Lifters
25 21 22 19 40 25 41 30 43 14 50 40
Manual / worker / Labour
15 18 16 18 1 14 15 18 - 17 - 30
Humidity Sensors and Controls
11 10 12 10 11 14 12 13 14 9 33 -
Data Loggers 9 8 7 7 13 13 20 22 14 26 50 15
Fork Lift for Pallet handling
10 7 9 7 21 11 26 16 14 17 17 10
Warehouse Management Software
6 6 6 6 11 10 6 5 29 17 17 5
Cargo Lift 6 6 6 6 5 10 8 6 29 23 17 15
Bar-code / RFID tags and readers
4 4 3 3 6 6 11 12 - - - -
No Response 22 20 24 22 14 14 10 12 14 17 17 15
All (n=5003)
Type H (n=4333)
Type P (n=523)
Type M (n=452)
Type Q (n=44)
Other Products
(n=27)
• Across time periods, usage of hand pallet lifters have increased for all type of CSs
Conveyor Belt for loading unloading
Hand Pallet Lifters
Manual / worker / Labour
Humidity Sensors and Controls
Data Loggers (fixed or portable)
Fork Lift for Pallet handling (electric or diesel)
Warehouse Management Software
Cargo Lift (for multi level stores)
Bar-code / RFID tags and readers
No Response
24
22
18
10
8
8
6
6
4
21
0
44
22
7
22
11
7
15
0
15
25
20
18
10
7
7
6
6
3
23
23
29
11
13
12
13
10
9
6
14
22
34
17
13
21
19
5
6
12
11
16
23
14
9
23
20
18
23
5
16

© COPYRIGHT 2014 308
17.1 CARGO HANDLING & AUTOMATION TOOLS – COMPARISON BASIS OWNERSHIP TYPE
All Figs in % All Respondents
All (n=5003)
Proprietorship (n=1336)
Partnership (n=1677)
Company Pub. Ltd. (n=174)
Association (n=5)
• Almost 25% of the government owned cold storages still rely on laborers for cargo handling purposes.
• Conveyor belts are found in 1/3rd of the public limited cold storages.
Conveyor Belt for loading unloading
Hand Pallet Lifters
Manual / worker / Labour
Humidity Sensors and Controls
Data Loggers (fixed or portable)
Fork Lift for Pallet handling (electric or diesel)
Warehouse Management Software
Cargo Lift (for multi level stores)
Bar-code / RFID tags and readers
No Response
24
22
18
10
8
8
6
6
4
21
40
20
20
0
40
20
0
20
20
0
21
22
21
11
6
6
3
5
3
23
21
18
21
8
7
6
6
4
3
24
34
25
12
13
13
14
11
13
8
13
30
24
12
11
10
9
8
8
4
18
Association Pvt.
(n=12)
Cooperative (n=130)
Government (Co./Dept./PSU)
(n=82)
Not Mentioned any ownership type
(n=24)
Conveyor Belt for loading unloading
Hand Pallet Lifters
Manual / worker / Labour
Humidity Sensors and Controls
Data Loggers (fixed or portable)
Fork Lift for Pallet handling (electric or diesel)
Warehouse Management Software
Cargo Lift (for multi level stores)
Bar-code / RFID tags and readers
No Response
8
25
0
17
8
17
17
0
0
17
25
27
18
10
8
8
2
9
5
13
17
23
24
21
7
17
4
6
11
15
29
21
13
21
8
17
0
21
8
21
Company Pvt. Ltd. (n=1563)

© COPYRIGHT 2014 309
26
78
21
83
• Over 90% cold stores in North and East use a manual air replenishment system. • Close to 1/3rd storages in West and South have automated ventilation system.
• Over 75% Type H & Q cold stores have manual air replenishment systems. • Automatic ventilation systems are comparatively fewer in number, however over 40% of Type M
storages have such systems installed.
Automatic Ventilation system Manual Air Replenishment (Door opened regularly) Not needed
18
86
28
74
42
63
25
75
30
71
21
83
Automatic Ventilation system Manual Air Replenishment (Door opened regularly) Not needed
13
92
10
93
35
71
Zone wise
17.2 AIR VENTILATION
All Figs in % All Respondents
All (n=5003)
Type H (n=4333)
Type P (n=523)
Type M (n=452)
Type Q (n=44)
Other Products
(n=27)
North (n=2142)
East (n=803)
West (n=1013)
South (n=1045)
All (n=5003)

© COPYRIGHT 2014 310
States
• More than 65% of the CS’s in Karnataka and over 50% in Kerala have automatic ventilation systems. Most of the cold stores in other states have manual air replenishment systems.
All (n=5003)
Maharashtra (n=451)
UP (n=1371)
A & N (n=10)
AP (n=600)
Assam (n=22)
Bihar (n=169)
Chandigarh (n=3)
Automatic Ventilation system
21 45 11 80 13 18 12 67
Manual Air Replenishment (Door opened regularly)
83 58 95 20 87 86 88 33
All (n=5003)
C’garh (n=76)
Delhi (n=35)
Goa (n=7)
Gujarat (n=399)
Haryana (n=185)
HP (n=14)
J & K (n=16)
Automatic Ventilation system
21 12 17 43 31 12 50 19
Manual Air Replenishment (Door opened regularly)
83 88 86 57 80 89 50 81
All (n=5003)
Jharkhand (n=19)
Karnataka (n=188)
Kerala (n=143)
MP (n=156)
Nagaland (n=1)
Orissa (n=38)
Pondicherry (n=2)
Punjab (n=402)
Automatic Ventilation system
21 11 67 52 16 - 24 50 14
Manual Air Replenishment (Door opened regularly)
83 89 36 48 85 100 76 50 89
All (n=5003)
Rajasthan (n=104)
Sikkim (n=5)
TN (n=102)
Tripura (n=9)
Uttaranchal (n=12)
WB (n=464)
North East (n=37)
Automatic Ventilation system
21 30 40 27 11 17 7 19
Manual Air Replenishment (Door opened regularly)
83 70 60 75 100 83 97 86
17.2 AIR VENTILATION
All Figs in % All Respondents

© COPYRIGHT 2014 311
11
63
26
• Across all type of storages, no instruments are used to measure CO2 and oxygen levels in over 60% of CSs
• Over 60% cold stores in the North, East and West do not use instruments to measure content of CO2 and oxygen.
• In South, the percentage having the facility is less than 20%, which is much less compared to other zones. In fact 30% say that the system is not required
Zone wise
26
60
15
Yes No Not needed
27
60
13 28
55
17 16
60
25
14
52 34
17
53
30
26
60
14 29
62
9 24
63
13 29
61
11
North (n=2113)
East (n=803)
West (n=1027)
South (n=1038)
All (n=4981)
Yes No Not needed
All (n=5003)
Type H (n=4333)
Type P (n=523)
Type M (n=452)
Type Q (n=44)
Other Products
(n=27)
17.3 SENSORS FOR ATMOSPHERE PARAMETERS
All Figs in % All Respondents

© COPYRIGHT 2014 312
States
• 1 out of every 2 cold stores in MP use sensors to measure atmosphere parameters. • 33% CS’s in Gujarat and UP also use such instruments. • In other states most of the CS’s do not use such sensors.
All (n=5003)
Maharashrta (n=451)
UP (n=1371)
A & N (n=10)
AP (n=600)
Assam (n=22)
Bihar (n=169)
Chandigarh (n=3)
Yes 26 16 32 20 19 50 17 33
No 60 68 60 50 58 50 78 67
Not needed 14 16 8 30 24 - 5 -
All (n=5003)
C’garh (n=76)
Delhi (n=35)
Goa (n=7)
Gujarat (n=399)
Haryana (n=185)
HP (n=14)
J & K (n=16)
Yes 26 14 14 14 34 15 43 25
No 60 28 80 71 59 63 29 56
Not needed 14 58 6 14 7 22 29 19
All (n=5003)
Jharkhand (n=19)
Karnataka (n=188)
Kerala (n=143)
MP (n=156)
Nagaland (n=1)
Orissa (n=38)
Pondicherry (n=2)
Punjab (n=402)
Yes 26 11 23 10 54 - 21 - 25
No 60 79 40 39 43 100 66 100 64
Not needed 14 11 37 50 3 - 13 - 11
All (n=5003)
Rajasthan (n=104)
Sikkim (n=5)
TN (n=102)
Tripura (n=9)
Uttaranchal (n=12)
WB (n=464)
North East (n=37)
Yes 26 39 20 9 - 17 28 32
No 60 58 20 67 78 83 63 54
Not needed 14 3 60 25 22 - 9 14
17.3 SENSORS FOR ATMOSPHERE PARAMETERS
All Figs in % All Respondents

© COPYRIGHT 2014 313
30
52
19 18
77
5
• Across zones, utilization of manual systems in refrigeration ventilation is in a high proportion. • Use of automatic controllers are higher in West and South zones.
• Majority of all type of CS’s use manual cut off and cut in systems. • 1/3rd of Type M cold stores have automatic controllers.
Automatic Controllers Manual Cut-off and Cut-In Both
Zone wise
North (n=2142)
East (n=803)
West (n=1013)
South (n=1045)
All (n=5003)
15
80
5 28
66
6 35
56
8 25
59
16
27
67
5 18
77
5
Automatic Controllers Manual Cut-off and Cut-In Both
13
81
6 9
88
3 26
70
5
All (n=5003)
Type H (n=4333)
Type P (n=523)
Type M (n=452)
Type Q (n=44)
Other Products
(n=27)
17.4 USE OF AUTOMATION IN REFRIGERATION VENTILATION
All Figs in %
Use of Automation in Refrigeration
All Respondents

© COPYRIGHT 2014 314
• More percentage of cold stores in Maharashtra, Karnataka and Kerala have automated systems whereas in other states the manual system prevails.
All (n=5003)
Maharashrta (n=451)
UP (n=1371)
A & N (n=10)
AP (n=600)
Assam (n=22)
Bihar (n=169)
Chandigarh (n=3)
Automatic Controllers 18 46 11 80 14 14 12 67
Manual Cut-off and Cut-In 77 45 81 10 83 82 82 -
Both 5 8 8 10 3 5 6 33
All (n=5003)
C’garh (n=76)
Delhi (n=35)
Goa (n=7)
Gujarat (n=399)
Haryana (n=185)
HP (n=14)
J & K (n=16)
Automatic Controllers 18 13 34 57 10 12 57 19
Manual Cut-off and Cut-In 77 86 60 43 89 84 43 81
Both 5 1 6 - 2 4 - -
All (n=5003)
Jharkhand (n=19)
Karnataka (n=188)
Kerala (n=143)
MP (n=156)
Nagaland (n=1)
Orissa (n=38)
Pondicherry (n=2)
Punjab (n=402)
Automatic Controllers 18 5 45 56 8 - 32 100 11
Manual Cut-off and Cut-In 77 89 41 40 92 100 68 - 87
Both 5 5 14 4 1 - - - 1
All (n=5003)
Rajasthan (n=104)
Sikkim (n=5)
TN (n=102)
Tripura (n=9)
Uttaranchal (n=12)
WB (n=464)
North East (n=37)
Automatic Controllers 18 26 40 27 - 17 5 14
Manual Cut-off and Cut-In 77 72 60 69 100 75 93 84
Both 5 2 - 4 - 8 2 3
States - Use of Automation in Refrigeration
17.4 USE OF AUTOMATION IN REFRIGERATION VENTILATION
All Figs in % All Respondents

© COPYRIGHT 2014 315
VFD (Variable frequency drive)
PLC (Program logic control)
ERW (Energy recovery wheel
All (n=1152)
Type H (n=869)
Type P (n=179)
Type M (n=197)
Type Q (n=18)
Other Products
(n=13)
46
39
32
All (n=1152)
North (n=408)
East (n=93)
West (n=308)
South (n=343)
• Only 1152 cold stores – 23% use VFD, PLC and ERWs. • Among those using these, close to 2/3rds of Type M cold stores have variable frequency drives.
• Almost every alternate Type P CS’s use VFDs and/or ERWs.
• Every alternate cold store in North use PLC. • Usage of ERWs comparatively higher in the Northern zone cold stores – 50% • Over 55% of CS’s in the East and South use variable frequency drives.
Zone wise
54
15
31
43
37
37
46
50
24
56
40
13
44
44
22
VFD (Variable frequency drive)
PLC (Program logic control)
ERW (Energy recovery wheel
46
39
32
56
39
27
40
26
50
59
28
30
38
58
13
17.4 USE OF AUTOMATION IN REFRIGERATION – DRIVES AND LOGIC CONTROLS
All Figs in % CS’s that have automatic controllers
Type of Automation

© COPYRIGHT 2014 316
• Over 60% of cold stores in UP and Karnataka use energy recovery wheels. • 2 out of 3 storages in Maharashtra use program logic control. • VFDs are used in majority cold stores in Kerala.
All (n=1152)
Maharashrta (n=246)
UP (n=266)
A & N (n=9)
AP (n=104)
Assam (n=4)
Bihar (n=30)
Chandigarh (n=3)
VFD (Variable frequency drive)
46 34 22 67 43 100 33 67
PLC (Program logic control) 39 63 24 - 44 - 33 33
ERW (Energy recovery wheel)
32 12 67 33 18 - 33 -
All (n=1152)
C’garh (n=11)
Delhi (n=14)
Goa (n=4)
Gujarat (n=45)
Haryana (n=30)
HP (n=8)
J & K (n=3)
VFD (Variable frequency drive)
46 55 57 75 53 56 80 100
PLC (Program logic control) 39 55 29 25 45 42 23 67
ERW (Energy recovery wheel
32 36 29 - 13 13 7 33
All (n=1152)
Jharkhand (n=2)
Karnataka (n=110)
Kerala (n=86)
MP (n=13)
Nagaland (n=-)
Orissa (n=12)
Pondicherry (n=2)
Punjab (n=52)
VFD (Variable frequency drive)
46 100 68 64 46 - 75 - 67
PLC (Program logic control) 39 - 35 35 38 - 17 100 44
ERW (Energy recovery wheel
32 - 60 1 38 - 8 - 27
All (n=1152)
Rajasthan (n=29)
Sikkim (n=2)
TN (n=32)
Tripura (n=-)
Uttaranchal (n=3)
WB (n=32)
North East (n=6)
VFD (Variable frequency drive)
46 90 100 38 - 33 69 100
PLC (Program logic control) 39 3 - 50 - 67 25 -
ERW (Energy recovery wheel
32 10 - 13 - - 41 -
17.4 USE OF AUTOMATION IN REFRIGERATION
All Figs in %
States - Type of Automation
CS’s that have automatic controllers

© COPYRIGHT 2014 317
18 17 24 25 23
30
86 87 80 80 77 78
AutomaticSystem
Manual bytechnician
17.5 MONITORING GAS LEAKAGE
All Figs in % All Respondents
• Across all type of cold stores, gas leakage is extensively detected manually by technicians.
• Close to 1/3rd of the cold stores in the Western zone utilize automatic systems to detect gas leakage.
• In other zones, majority cold storages employ technicians who manually detect leakage.
Zone wise
All (n=5003)
Type H (n=4333)
Type P (n=523)
Type M (n=452)
Type Q (n=44)
Other products
(n=27)
18 14 10
33
19
86 91 93
70
83
AutomaticSystem
Manual bytechnician
All (n=5003)
North (n=2142)
East (n=803)
West (n=1013)
South (n=1045)

© COPYRIGHT 2014 318
17.5 MONITORING GAS LEAKAGE
All Figs in % All Respondents
States
• More than 40% cold storages in Orissa have automatic systems to detect gas leakage.
All (n=5003)
Maharashrta (n=451)
UP (n=1371)
A & N (n=10)
AP (n=600)
Assam (n=22)
Bihar (n=169)
Chandigarh (n=3)
Automatic System 18 35 12 - 20 9 14 33
Manual by technician 86 69 95 100 81 91 90 67
All (n=5003)
C’garh (n=76)
Delhi (n=35)
Goa (n=7)
Gujarat (n=399)
Haryana (n=185)
HP (n=14)
J & K (n=16)
Automatic System 18 5 40 43 37 16 14 19
Manual by technician 86 95 63 57 65 88 86 88
All (n=5003)
Jharkhand (n=19)
Karnataka (n=188)
Kerala (n=143)
MP (n=156)
Nagaland (n=1)
Orissa (n=38)
Pondicherry (n=2)
Punjab (n=402)
Automatic System 18 32 21 17 17 - 45 - 12
Manual by technician 86 79 86 85 89 100 61 100 91
All (n=5003)
Rajasthan (n=104)
Sikkim (n=5)
TN (n=102)
Tripura (n=9)
Uttaranchal (n=12)
WB (n=464)
North East (n=37)
Automatic System 18 32 20 16 11 33 6 11
Manual by technician 86 68 80 88 100 83 96 92

© COPYRIGHT 2014
CHAPTER 18
BUSINESS PROCESS & DOCUMENTATION
Page no 319 to 340

© COPYRIGHT 2014 320
18. BUSINESS PROCESS AND DOCUMENTATION -HACCP, ISO FSSA ETC..
A meagre 17% of Cold storages have quality certifications like HACCP, ISO or FSSA.
65% of type M CSs has certification. This is highest among all types of products stored. In contrast, Type H has the lowest certification which is driving the overall scores.
Talking about zones, North and East both have less than 10% of their cold storages with certifications
There is higher incidences of CS’s having certification in the state of Maharashtra, Kerala and Tamil Nadu.
FSSA certification is obtained by 42% of the cold storages. HACCP falls second in the line. Type M has mainly HACCP certifications. More than half of Type P cold storages are ISO certified.
FSSA certification is acquired by more than 55% of cold stores in Maharashtra.
Most of the CSs have acquired these certificates in the last 10 years with 50% of them getting it in the last 1 year.
Despite lower penetration of quality certifications, the future intentions of having a certification is reported by among 53% of the CS’s. However more than half of North and South zone cold storages are still reluctant to get certification.
The most sought after certificate is for ISO certificate, followed by FSSA certificate. In the North, FSSA tops the intended certification list.
37
37
26
17
69
14 10
75
14 34
53
13 65
27
7 34
50
16
All (n=5003)
Type H (n=4333)
Type P (n=523)
Type M (n=452)
Type Q (n=44)
Other Products
(n=27)
Yes No DK/CS
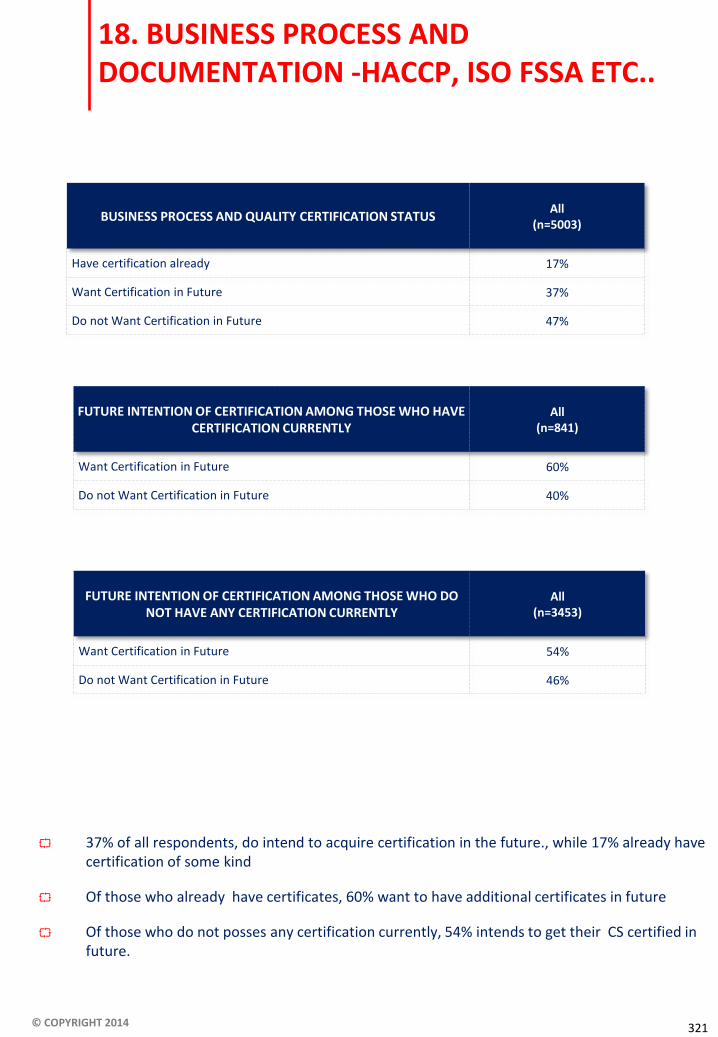
© COPYRIGHT 2014 321
18. BUSINESS PROCESS AND DOCUMENTATION -HACCP, ISO FSSA ETC..
37% of all respondents, do intend to acquire certification in the future., while 17% already have certification of some kind
Of those who already have certificates, 60% want to have additional certificates in future
Of those who do not posses any certification currently, 54% intends to get their CS certified in future.
BUSINESS PROCESS AND QUALITY CERTIFICATION STATUS All
(n=5003)
Have certification already 17%
Want Certification in Future 37%
Do not Want Certification in Future 47%
FUTURE INTENTION OF CERTIFICATION AMONG THOSE WHO HAVE CERTIFICATION CURRENTLY
All (n=841)
Want Certification in Future 60%
Do not Want Certification in Future 40%
FUTURE INTENTION OF CERTIFICATION AMONG THOSE WHO DO NOT HAVE ANY CERTIFICATION CURRENTLY
All (n=3453)
Want Certification in Future 54%
Do not Want Certification in Future 46%

© COPYRIGHT 2014 322
18.1 QUALITY / BUSINESS PROCESS USED (ISO OR HACCP, FSSA, WDRA)
All Figs in % All Respondents
• Overall only 17% have reported having quality certification of any kind. • 65% Type M cold stores have certification for the facility. • In contrast only 10% of Type H stores have quality certification
• 3 out of 4 storages in the North and East have no certification in place. • 1/3rd storages in the West have certificates for the facility. And 1/4th reported having
certification in South.
Zone wise
Yes No DK/CS
Yes No DK/CS
27
64
10 6
76
19 9
78
13 36
54
10
North (n=2142)
East (n=803)
West (n=1013)
South (n=1045)
37
37
26
17
69
14 10
75
14 34
53
13 65
27
7 34
50
16
All (n=5003)
Type H (n=4333)
Type P (n=523)
Type M (n=452)
Type Q (n=44)
Other Products
(n=27)
17
69
14
All (n=5003)

© COPYRIGHT 2014 323
18.1 QUALITY / BUSINESS PROCESS USED (ISO OR HACCP, FSSA, WDRA)
All Figs in % All Respondents
All (n=5003)
Maharashrta (n=451)
UP (n=1371)
A & N (n=10)
AP (n=600)
Assam (n=22)
Bihar (n=169)
Chandigarh (n=3)
Yes 17 51 3 - 13 23 4 33
No 69 39 78 60 82 68 86 67
Do not know 14 9 19 40 6 9 11 -
All (n=5003)
C’garh (n=76)
Delhi (n=35)
Goa (n=7)
Gujarat (n=399)
Haryana (n=185)
HP (n=14)
J & K (n=16)
Yes 17 17 17 43 30 6 7 19
No 69 55 71 43 58 75 71 81
Do not know 14 28 11 14 12 19 21 -
All (n=5003)
Jharkhand (n=19)
Karnataka (n=188)
Kerala (n=143)
MP (n=156)
Nagaland (n=1)
Orissa (n=38)
Pondicherry (n=2)
Punjab (n=402)
Yes 17 - 20 87 10 100 32 50 12
No 69 79 52 11 82 - 39 50 66
Do not know 14 21 28 1 8 - 29 - 22
• More than 85% cold stores in Kerala have certifications. • MP, Rajasthan, WB, Bihar and AP have more than 80% storages which have no certifications.
All (n=5003)
Rajasthan (n=104)
Sikkim (n=5)
TN (n=102)
Tripura (n=9)
Uttaranchal (n=12)
WB (n=464)
North East (n=37)
Yes 17 10 20 40 - 25 7 19
No 69 81 80 51 67 75 83 68
Do not know 14 10 - 9 33 - 10 14

© COPYRIGHT 2014 324
18.1 QUALITY / BUSINESS PROCESS USED (ISO OR HACCP, FSSA, WDRA)
All Figs in % All Respondents
All (n=5003)
Proprietorship
(n=1336)
Partnership
(n=1677)
Company
(Public Ltd.)
(n=174)
Company
(Private Ltd.)
(n=1563)
Yes 17 15 14 34 17
No 69 68 72 55 72
Do not know 14 17 15 10 11
Association
(Public)
(n=5)
Association
(Private)
(n=12)
Cooperative
(n=130)
Government
(Co./Dept./
PSU)
(n=82)
Not classified
under any
Ownership
type
(n=24)
Yes 60 17 40 34 13
No 40 75 42 50 75
Do not know - 8 18 16 13
• 40% of the cooperatives and 34% of government owned and public limited companies have a quality certification.
• Close to 14% - 15% storages owned on proprietorship or partnership basis have a quality certification.
Urban CS’s
(n=398)
Rural CS’s
(n=754)
NHB/NHM
(n=570)
Others
(n=582)
Yes 23 14 10 27
No 66 70 76 58
Do not know 11 15 14 15

© COPYRIGHT 2014 325
18.2 CERTIFICATION OR ACCREDITATION
All Figs in % CS’s that mentioned having certification
FSSA (Food Safety Standard Association of India )
HACCP
ISO
WDRA (Warehousing Development and
Regulatory Authority)
Others Specify
42
37
35
4
20
30
40
50
10
10
43
18
33
6
25
53
25
56
5
10
36
74
27
1
17
27
33
60
7
0
All (n=841)
North (n=123)
East (n=69)
West (n=368)
South (n=281)
42
37
35
4
20
32
15
29
12
27
38
22
32
1
25
52
32
33
3
23
• Of the stores reported having certification – 841 CSs, more than half Type P cold storages have FSSA and ISO certification.
• 3/4ths of Type M storages have HACCP certification.
• In the Western zone over 50% storages have FSSA certification. Similar proportion in the South have HACCP certification.
• ISO certification is held in zones by around a third of the cold stores
Zone wise
All (n=841)
Type H (n=449)
Type P (n=177)
Type M (n=295)
Type Q (n=15)
Other Products
(n=10)
FSSA (Food Safety Standard Association of India )
HACCP
ISO
WDRA (Warehousing Development and
Regulatory Authority)
Others Specify
35
58
41
3
11

© COPYRIGHT 2014 326
18.2 CERTIFICATION OR ACCREDITATION
All Figs in %
States
• Over 60% storages in Chhattisgarh, Delhi have FSSA certification. • Like wise over 60% in Delhi have HACCP certification & over 60% in Rajasthan and Karnataka
have ISO certification
All (n=841)
Maharashrta (n=231)
UP (n=41)
A & N (n=-)
AP (n=76)
Assam (n=5)
Bihar (n=6)
Chandigarh (n=1)
FSSA (Food Safety Standard Association of India )
42 57 32 - 28 - 50 -
HACCP 37 28 7 - 36 20 17 -
ISO 35 33 17 - 75 60 50 -
WDRA (Warehousing Development and Regulatory Authority)
4 4 10 - 5 - - -
Others Specify 20 27 34 - 11 20 - 100
All (n=841)
C’garh (n=13)
Delhi (n=6)
Goa (n=3)
Gujarat (n=119)
Haryana (n=11)
HP (n=1)
J & K (n=3)
FSSA (Food Safety Standard Association of India )
42 62 67 - 43 27 100 33
HACCP 37 23 67 33 41 27 100 -
ISO 35 31 33 33 30 27 100 67
WDRA (Warehousing Development and Regulatory Authority)
4 - - - 1 9 - -
Others Specify 20 8 17 67 16 36 - -
CS’s that mentioned having certification

© COPYRIGHT 2014 327
18.2 CERTIFICATION OR ACCREDITATION
All Figs in %
States
• 86% cold stores in Kerala have HACCP certification.
All (n=841)
Jharkhand (n=-)
Karnataka (n=38)
Kerala (n=125)
MP (n=15)
Nagaland (n=1)
Orissa (n=12)
Pondicherry (n=1)
Punjab (n=47)
FSSA (Food Safety Standard Association of India )
42 - 32 36 47 100 50 100 23
HACCP 37 - 18 86 20 - 58 - 13
ISO 35 - 71 18 40 100 17 - 30
WDRA (Warehousing Development and Regulatory Authority)
4 - 3 1 7 - - - 21
Others Specify 20 - 8 14 7 - 17 - 23
All (n=841)
Rajasthan (n=10)
Sikkim (n=1)
TN (n=41)
Tripura (n=-)
Uttaranchal (n=3)
WB (n=31)
North East (n=7)
FSSA (Food Safety Standard Association of India )
42 40 - 46 - 67 26 14
HACCP 37 10 100 54 - - 6 29
ISO 35 70 - 20 - - 29 57
WDRA (Warehousing Development and Regulatory Authority)
4 - - 7 - - 3 -
Others Specify 20 10 - 7 - 33 42 14
CS’s that mentioned having certification

© COPYRIGHT 2014 328
18.2 CERTIFICATION OR ACCREDITATION
All Figs in % All Respondents
Urban CS’s (n=336)
Rural CS’s
(n=505)
NHB/NHM
(n=313)
Others
(n=528)
FSSA (Food Safety Standard Association of India )
43 42 41 43
HACCP 42 34 31 41
ISO 39 32 34 35
WDRA (Warehousing Development and Regulatory Authority)
14 24 23 18
Others Specify 4 5 4 5
• Almost similar proportion of urban and rural cold storages have FSSA certification (42 – 43%). • HACCP certification is available with 42% of urban cold storages as against 34% of rural cold
storages.

© COPYRIGHT 2014 329
18.2 CERTIFICATION OR ACCREDITATION
All Figs in % All Respondents
All (n=841)
Proprietorship
(n=197)
Partnership
(n=232)
Company
(Public Ltd.)
(n=60)
Company
(Private Ltd.)
(n=264)
FSSA (Food Safety Standard Association of India )
42 35 49 37 41
HACCP 37 33 38 43 44
ISO 35 23 26 63 38
WDRA (Warehousing Development and Regulatory Authority)
4 8 4 7 2
Others Specify 20 26 17 8 19
Association
(Public)
(n=3)
Association
(Private)
(n=2)
Cooperative
(n=52)
Government
(Co./Dept./
PSU)
(n=28)
Not classified
under any
Ownership
type
(n=3)
FSSA (Food Safety Standard Association of India )
- 100 48 46 33
HACCP 33 50 15 21 67
ISO 67 50 54 57 33
WDRA (Warehousing Development and Regulatory Authority)
- - 4 4 -
Others Specify 33 - 31 7 100
Ownership Type
• 49% cold storages run on partnership basis have a FSSA certification.

© COPYRIGHT 2014 330
18.3 YEAR OF ACQUIRING CERTIFICATION
All Figs in %
• Majority reported taking certification in all type of stores in the last 1 year. • Type Q cold stores on an average acquired certification before 6.6 years, which is comparatively
the oldest. • Type H storages have acquired certification before 5.6 years on an average.
Less than 1 yr (2012 to 2013)
2 to 5yrs (2009 to 2011)
6 to 10yrs (2004 to 2008)
11 to 15yrs (1999 to 2003)
16 to 20yrs (1994 to 1998)
21 to 25yrs (1993 to 1989)
26 to 30yrs (1984 to 1988)
More than 30 yrs
DK/CS
50
9
13
7
4
2
1
2
12
49
9
12
7
4
2
1
3
14
58
8
6
7
0
2
0
2
16
51
9
17
7
6
2
1
1
6
33
13
20
0
0
13
0
0
20
50
10
10
20
0
0
0
0
10
All (n=841)
Type H (n=449)
Type P (n=177)
Type M (n=295)
Type Q (n=15)
Other Products
(n=10)
CS’s that mentioned having certification

© COPYRIGHT 2014 331
18.3 YEAR OF ACQUIRING CERTIFICATION
All Figs in %
• Comparing the zones, Northern based cold stores were the one who acquired certification the earliest – 6.7 years back.
37
8
9
8
6
2
1
3
27
51
12
14
4
0
1
3
4
10
59
9
10
4
3
2
0
2
10
46
7
19
11
6
3
1
1
7
Zone Wise
North (n=123)
East (n=69)
West (n=368)
South (n=281)
All (n=841)
Less than 1 yr (2012 to 2013)
2 to 5yrs (2009 to 2011)
6 to 10yrs (2004 to 2008)
11 to 15yrs (1999 to 2003)
16 to 20yrs (1994 to 1998)
21 to 25yrs (1993 to 1989)
26 to 30yrs (1984 to 1988)
More than 30 yrs
DK/CS
50
9
13
7
4
2
1
2
12
CS’s that mentioned having certification

© COPYRIGHT 2014 332
18.3 YEAR OF ACQUIRING CERTIFICATION
All Figs in %
States
All (n=841)
Maharashrta (n=231)
UP (n=41)
A & N (n=-)
AP (n=76)
Assam (n=5)
Bihar (n=6)
Chandigarh (n=1)
Less than 1 yr (2012 to 2013)
50 61 29 - 39 20 50 -
2 to 5yrs (2009 to 2011) 9 6 12 - 12 20 - -
6 to 10yrs (2004 to 2008) 13 10 5 - 18 - - -
11 to 15yrs (1999 to 2003) 7 5 12 - 11 - - -
16 to 20yrs (1994 to 1998) 4 3 7 - 4 - - -
21 to 25yrs (1993 to 1989) 2 2 2 - 1 - - -
26 to 30yrs (1984 to 1988) 1 - - - 1 - - -
More than 30 yrs 2 2 2 - 1 20 33 -
DK/CS 12 11 29 - 12 40 17 100
M E A N(in yrs) 5.3 4.1 7.4 0.0 6.0 12.0 13.1 -
All (n=841)
C’garh (n=13)
Delhi (n=6)
Goa (n=3)
Gujarat (n=119)
Haryana (n=11)
HP (n=1)
J & K (n=3)
Less than 1 yr (2012 to 2013)
50 77 33 - 58 36 100 67
2 to 5yrs (2009 to 2011) 9 - 17 33 14 - - -
6 to 10yrs (2004 to 2008) 13 8 17 33 8 9 - 33
11 to 15yrs (1999 to 2003) 7 - - - 3 9 - -
16 to 20yrs (1994 to 1998) 4 - - 33 2 18 - -
21 to 25yrs (1993 to 1989) 2 8 - - 3 9 - -
26 to 30yrs (1984 to 1988) 1 8 - - - - - -
More than 30 yrs 2 - - - 2 - - -
DK/CS 12 - 33 - 9 18 - -
M E A N(in yrs) 5.3 4.9 3.1 9.8 3.9 9.1 0.5 3.0
CS’s that mentioned having certification

© COPYRIGHT 2014 333
18.3 YEAR OF ACQUIRING CERTIFICATION
All Figs in %
States
• Cold storages in Karnataka acquired certification over 7.6 years back, followed by Punjab 7.4 years back.
All (n=841)
Jharkhand (n=-)
Karnataka (n=38)
Kerala (n=125)
MP (n=15)
Nagaland (n=1)
Orissa (n=12)
Pondicherry (n=1)
Punjab (n=47)
Less than 1 yr (2012 to 2013)
50 - 37 49 47 100 50 100 36
2 to 5yrs (2009 to 2011) 9 - 8 4 7 - 8 - 6
6 to 10yrs (2004 to 2008) 13 - 13 22 13 - 17 - 11
11 to 15yrs (1999 to 2003) 7 - 21 8 7 - 17 - 4
16 to 20yrs (1994 to 1998) 4 - 3 8 7 - - - 4
21 to 25yrs (1993 to 1989) 2 - 5 3 - - - - -
26 to 30yrs (1984 to 1988) 1 - - - - - - - 2
More than 30 yrs 2 - 3 2 7 - - - 6
DK/CS 12 - 11 5 13 - 8 - 30
M E A N(in yrs) 5.3 - 7.6 6.1 6.6 0.5 4.4 0.5 7.4
All (n=841)
Rajasthan (n=10)
Sikkim (n=1)
TN (n=41)
Tripura (n=-)
Uttaranchal (n=3)
WB (n=31)
North East (n=7)
Less than 1 yr (2012 to 2013)
50 50 - 54 - 67 45 29
2 to 5yrs (2009 to 2011) 9 10 100 7 - - 16 29
6 to 10yrs (2004 to 2008) 13 10 - 15 - - 23 -
11 to 15yrs (1999 to 2003) 7 20 - 10 - - 3 -
16 to 20yrs (1994 to 1998) 4 - - 5 - - - -
21 to 25yrs (1993 to 1989) 2 - - 2 - - - -
26 to 30yrs (1984 to 1988) 1 - - 2 - - 3 -
More than 30 yrs 2 - - - - - - 14
DK/CS 12 10 - 5 - 33 10 29
M E A N(in yrs) 5.3 4.4 3.5 5.4 - 0.5 4.3 8.0
CS’s that mentioned having certification

© COPYRIGHT 2014 334
18.4 YEAR OF ACQUIRING CERTIFICATION FOR THE VARIOUS ACCREDITATIONS
All Figs in % All Respondents
Less than 1 yr (2012 to 2013)
2 to 5yrs (2009 to 2011)
6 to 10yrs (2004 to 2008)
11 to 15yrs (1999 to 2003)
16 to 20yrs (1994 to 1998)
21 to 25yrs (1993 to 1989)
26 to 30yrs (1984 to 1988)
More than 30 yrs
DK/CS
All (n=841)
ISO (n=293)
HACCP (n=313)
FSSA (n=353)
WDRA (n=37)
Other Specify (n=167)
50
9
13
7
4
2
1
2
12
32
14
16
8
6
3
1
2
19
43
10
16
10
2
3
1
3
12
50
9
17
6
7
2
1
1
6
92
0
0
0
0
0
0
0
8
38
3
14
8
11
0
0
3
24
• 92% of the CS have received FSSA certification in the year 2012-2013. This must have been post FSSA act has been passed.

© COPYRIGHT 2014 335
18.5 FUTURE INTENTION TO GET CERTIFICATION
All Figs in % All Respondents
67 33
• Though only 17% had any kind of certification, 54% now intend to get a certificate for quality business process.
• In Type P & Q storages the proportion of them intending for certification in the future are over 60%.
• Almost 2/3rds storages in the East and West intend to acquire certification.
Zone wise
53
47
53
47
Require Certification in Future Do Not Require Certification in Future
63 37 61
39 70 30
50
50
53
47
46
54 69 31 62
38
All (n=5003)
Type H (n=4333)
Type P (n=523)
Type M (n=452)
Type Q (n=44)
Other Products
(n=27)
All (n=5003)
North (n=2142)
East (n=803)
West (n=1013)
South (n=1045)
Require Certification in Future Do Not Require Certification in Future

© COPYRIGHT 2014 336
18.5 FUTURE CERTIFICATION INTENT
All Figs in % All Respondents
States
All (n=5003)
Maharashrta (n=451)
UP (n=1371)
A & N (n=10)
AP (n=600)
Assam (n=22)
Bihar (n=169)
Chandigarh (n=3)
Require Certification in Future
53 71 50 90 38 86 56 100
Do Not Require Certification in Future
47 29 50 10 62 14 44 -
All (n=5003)
C’garh (n=76)
Delhi (n=35)
Goa (n=7)
Gujarat (n=399)
Haryana (n=185)
HP (n=14)
J & K (n=16)
Require Certification in Future
53 78 40 - 54 24 21 69
Do Not Require Certification in Future
47 22 60 100 46 76 79 31
All (n=5003)
Jharkhand (n=19)
Karnataka (n=188)
Kerala (n=143)
MP (n=156)
Nagaland (n=1)
Orissa (n=38)
Pondicherry (n=2)
Punjab (n=402)
Require Certification in Future
53 58 80 54 58 100 71 50 39
Do Not Require Certification in Future
47 42 20 46 42 - 29 50 61
• 80% storages in Karnataka intend to get certification in the near future.
All (n=5003)
Rajasthan (n=104)
Sikkim (n=5)
TN (n=102)
Tripura (n=9)
Uttaranchal (n=12)
WB (n=464)
North East (n=37)
Require Certification in Future
53 51 100 56 78 33 71 86
Do Not Require Certification in Future
47 49 - 44 22 67 29 14
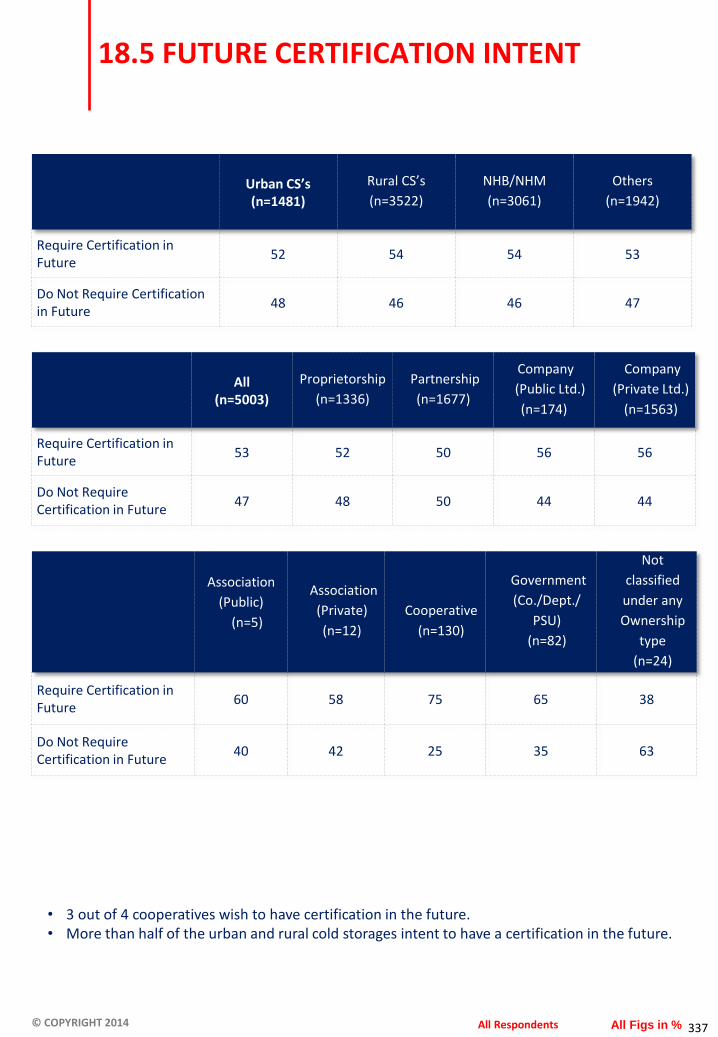
© COPYRIGHT 2014 337
18.5 FUTURE CERTIFICATION INTENT
All Figs in % All Respondents
All (n=5003)
Proprietorship
(n=1336)
Partnership
(n=1677)
Company
(Public Ltd.)
(n=174)
Company
(Private Ltd.)
(n=1563)
Require Certification in Future
53 52 50 56 56
Do Not Require Certification in Future
47 48 50 44 44
Association
(Public)
(n=5)
Association
(Private)
(n=12)
Cooperative
(n=130)
Government
(Co./Dept./
PSU)
(n=82)
Not
classified
under any
Ownership
type
(n=24)
Require Certification in Future
60 58 75 65 38
Do Not Require Certification in Future
40 42 25 35 63
• 3 out of 4 cooperatives wish to have certification in the future. • More than half of the urban and rural cold storages intent to have a certification in the future.
Urban CS’s (n=1481)
Rural CS’s
(n=3522)
NHB/NHM
(n=3061)
Others
(n=1942)
Require Certification in Future
52 54 54 53
Do Not Require Certification in Future
48 46 46 47

© COPYRIGHT 2014 338
18.6 TYPE OF CERTIFICATE INTENDING TO ACQUIRE
All Figs in % CS’s that intend to have certification in the future
ISO
FSSA (Food Safety Standard Association of India )
WDRA (Warehousing Development and
Regulatory Authority)
HACCP
Other
None of the above
All (n=2675)
Type H (n=2282)
Type P (n=327)
Type M (n=274)
Type Q (n=31)
Other Products
(n=18)
53
35
15
15
2
10
44
33
33
11
0
17
53
36
17
14
2
10
50
33
17
19
4
11
57
30
8
20
8
10
65
23
13
16
0
3
All (n=2675)
North (n=975)
East (n=553)
West (n=625)
South (n=522)
53
35
15
15
2
10
67
30
10
17
4
8
40
42
14
9
1
14
56
39
26
13
3
7
58
25
12
24
2
8
• Overall 53% want to acquire ISO certification. • 53 % Type H cold stores intend to acquire ISO certification and 1/3rd of them to get FSSA
certified. This trend is also witnessed in Type P and M storages.
• Almost 70% Southern based storages wish for an ISO certificate. • Around 40% storages in the North and East intend to get FSSA certification.
Zone wise
ISO
FSSA (Food Safety Standard Association of India )
WDRA (Warehousing Development and
Regulatory Authority)
HACCP
Other
None of the above

© COPYRIGHT 2014 339
18.6 TYPE OF CERTIFICATE INTENDING TO ACQUIRE
All Figs in %
• 3 out of 4 storages in AP want to get an ISO certificate.
• More than 40% storages in UP & Chhattisgarh wish to get FSSA certified.
All (n=2675)
Maharashrta (n=320)
UP (n=687)
A & N (n=9)
AP (n=227)
Assam (n=19)
Bihar (n=94)
Chandigarh (n=3)
ISO 53 58 38 - 73 42 41 67
FSSA (Food Safety Standard Association of India )
35 21 45 33 14 37 36 33
WDRA (Warehousing Development and Regulatory Authority)
15 16 17 - 8 37 18 -
HACCP 15 29 9 11 6 16 6 -
Other 2 2 1 56 0 5 - -
None of the above 10 8 14 11 10 - 13 -
All (n=2675)
C’garh (n=59)
Delhi (n=14)
Goa (n=-)
Gujarat (n=215)
Haryana (n=45)
HP (n=3)
J & K (n=11)
ISO 53 39 50 - 58 33 100 45
FSSA (Food Safety Standard Association of India )
35 47 43 - 35 40 - 18
WDRA (Warehousing Development and Regulatory Authority)
15 22 7 - 1 7 - -
HACCP 15 5 21 - 24 22 - 27
Other 2 2 - - 3 2 - -
None of the above 10 5 29 - 6 11 - 9
States
CS’s that intend to have certification in the future

© COPYRIGHT 2014 340
18.6 TYPE OF CERTIFICATE INTENDING TO ACQUIRE
All Figs in %
All (n=2675)
Jharkhand (n=11)
Karnataka (n=151)
Kerala (n=77)
MP (n=90)
Nagaland (n=1)
Orissa (n=27)
Pondicherry (n=1)
Punjab (n=155)
ISO 53 73 74 47 58 - 59 100 35
FSSA (Food Safety Standard Association of India )
35 - 57 27 14 - 44 - 40
WDRA (Warehousing Development and Regulatory Authority)
15 18 15 8 26 100 30 - 9
HACCP 15 9 36 12 6 - 15 - 5
Other 2 - 1 19 3 - 4 - 1
None of the above 10 - 5 13 11 - 4 - 14
• Karnataka has 75% storages which intend to get ISO certification. There are also over 50% storages here which wish to get FSSA certificates.
All (n=2675)
Rajasthan (n=53)
Sikkim (n=5)
TN (n=57)
Tripura (n=7)
Uttaranchal (n=4)
WB (n=330)
North East (n=32)
ISO 53 70 60 65 71 50 63 50
FSSA (Food Safety Standard Association of India )
35 17 - 28 - - 41 22
WDRA (Warehousing Development and Regulatory Authority)
15 8 20 5 - - 28 28
HACCP 15 2 40 16 71 - 15 31
Other 2 - - - 29 25 3 9
None of the above 10 13 - 4 - 25 6 -
States
CS’s that intend to have certification in the future

© COPYRIGHT 2014
CHAPTER 19
SUBSIDIES & ASSISTANCE
Page no 341 to 366

© COPYRIGHT 2014 342
19. SUBSIDY SCHEMES UTILIZED
42% of Cold storages in India have reported using government subsidy or grant for their capital investment. The remaining 58% of cold stores reported capital investment independent of subsidy support.
1 out of 2 cold storages in the West have availed government subsidies.
Only 35% of government cold storages have utilized a subsidy scheme. More than 40% of cooperatives, partnership and public limited company type of cold storages have utilized subsidy schemes.
33
67
42
58
43
57
37
63
41
59
Yes No
39
61
All (n=5003)
Type H (n=4333)
Type P (n=523)
Type M (n=452)
Type Q (n=44)
Other Products
(n=27)
Subsidy Scheme Utilized Proprietorship
(n=1336)
Partnership
(n=1677)
Company (Public
Ltd.)
(n=174)
Company
(Private Ltd.)
(n=1563)
Yes 35 44 42 45
No 65 56 58 55
Subsidy Scheme Utilized
Association
(Public)
(n=5)
Association
(Private)
(n=12)
Cooperative
(n=130)
Government
(Co./Dept./
PSU)
(n=82)
Not classified
under any
Ownership
type
(n=24)
Yes 40 33 42 35 17
No 60 67 58 65 83

© COPYRIGHT 2014 343
19. SUBSIDY SCHEMES UTILIZED
From those who used subsidies, the assistance was utilised for new capacity expansion, technology up-gradation and modernisation.
As many as 40% of Type H and M cold storages have also used subsidies for training their managers.
47 45
23
9 6 2 1
Type of upgrade (%)
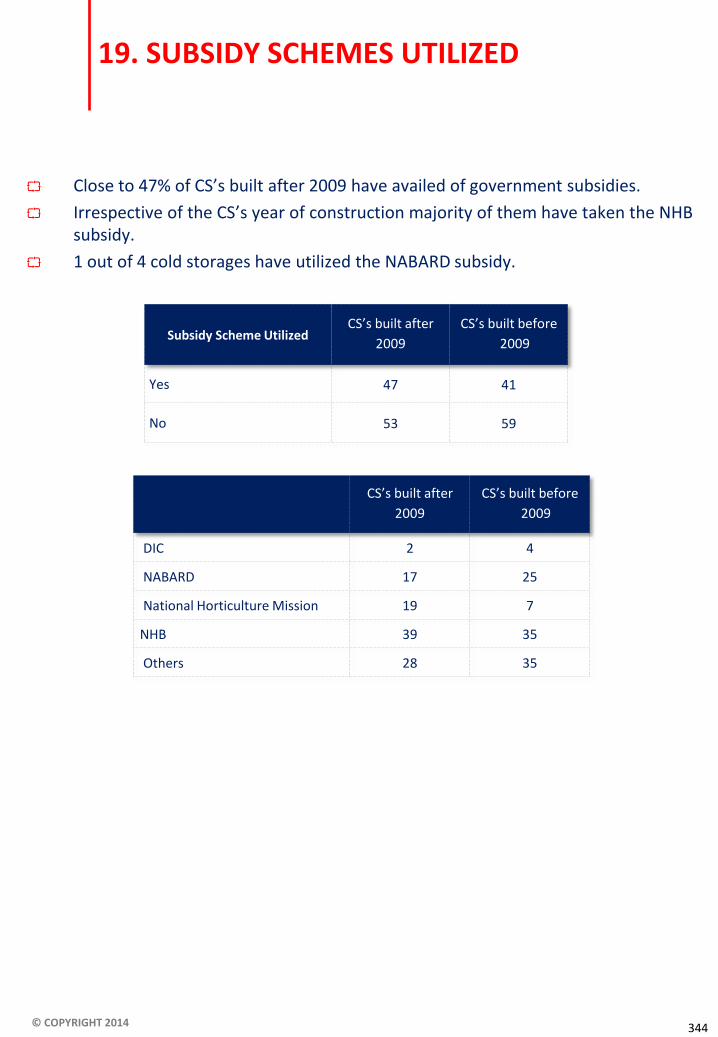
© COPYRIGHT 2014 344
19. SUBSIDY SCHEMES UTILIZED
Subsidy Scheme Utilized CS’s built after
2009
CS’s built before
2009
Yes 47 41
No 53 59
CS’s built after
2009
CS’s built before
2009
DIC 2 4
NABARD 17 25
National Horticulture Mission 19 7
NHB 39 35
Others 28 35
Close to 47% of CS’s built after 2009 have availed of government subsidies.
Irrespective of the CS’s year of construction majority of them have taken the NHB subsidy.
1 out of 4 cold storages have utilized the NABARD subsidy.

© COPYRIGHT 2014 345
19. SUBSIDY SCHEMES UTILIZED
Of all the cold stores that upgraded their facility, 59% reported capacity expansion, with a combined majority of 80% of these who resorted to modernisation through automation, refrigeration and insulation upgrades. 31% undertook the task to modernise other aspects of operations at their facility.
A high demand for technology induction and modernization is indicated through this survey.
Other government assistance utilised was in the form of manpower training. Despite having the second largest number of cold storages, West Bengal reported among the lowest incident with 87% claimed they had not availed of any government subsidy.
When we analyze the data by NHB database vs. others, 43% of NHB CSs confirm taking subsidy. Even of this the percentage is higher at 56% among CSs installed post 2009 compared to 39% among CSs installed before 2009
Almost 27% of the cold stores have undergone major overhaul, modernisation or expansion. Of these, 77% have undertaken this exercise within the past 10 years.
Of those taking subsidy among NHB database, more percentage have taken subidy for training
in financial management.
Of all CSs 3 out of 4 cold storages have expressed interest in availing subsidy in the future. This is the trend across all zones except North.
More percentage – 85% - of CSs of NHB database have shown interest in taking subsidy in future compared to others – 75%
27
73
Modernisation or Expansion (%)
Yes
No
30 27
21
10 6
3 2 2
Years since last Upgrade (%)

© COPYRIGHT 2014 346
19. SUBSIDY SCHEMES UTILIZED
Type of upgrade made in the CS% (multiple responses)
All Cold stores
After
2009
Before
2009
Capacity expansion 53 60 Modernisation 33 34 Insulation changed 18 24 Cooling system changed 26 29 Automation installed 16 30 Auxiliary equipment like Sorting & Grading,
Ripening chambers etc 17 16
Others 6 4 Not specified 4 2

© COPYRIGHT 2014 347
19. SUBSIDY SCHEMES UTILIZED
Type of upgrade made in the CS% (multiple responses)
Urban CS’s
(n=368)
Rural CS
(n=972)
NHB/NHM
(n=849)
Others
(n=491)
Capacity expansion 54 61 58 61
Modernisation 35 30 30 34
Insulation changed 25 23 23 24
Cooling system
changed 30 27 26 31
Automation installed 32 28 29 28
Auxiliary equipment like
Sorting & Grading, Ripening
chambers etc 16 18 18 18
Others 3 5 4 4
Not specified 4 2 3 2
Capacity expansion is the main use of subsidies for both urban and rural CSs as well as NHB assisted CSs and other CSs
A third of urban CSs have utilized the subsidy for modernization as well

© COPYRIGHT 2014 348
19. SUBSIDY SCHEMES UTILIZED
Type of upgrade made in the CS% (multiple responses)
Proprietorship
(n=297)
Partnership
(n=407)
Company (Public
Ltd.)
(n=53)
Company
(Private Ltd.)
(n=487)
Capacity expansion 55 58 55 63
Modernisation 31 30 34 32
Insulation changed 17 19 23 28
Cooling system
changed 23 23 23 32
Automation installed 25 23 26 35
Auxiliary equipment like
Sorting & Grading, Ripening
chambers etc 17 17 15 19
Others 4 4 2 5
Not specified 4 2 4 1
Association
(Public)
(n=4)
Association
(Private)
(n=3)
Cooperative
(n=58)
Government
(Co./Dept./
PSU)
(n=24)
Not
classified
under any
Ownership
type
(n=7)
Capacity expansion 100 - 60 50 57
Modernisation 50 - 36 42 43
Insulation changed 75 67 34 42 14
Cooling system
changed 50 33 40 63 29
Automation
installed 50 - 34 46 14
Auxiliary equipment
like Sorting & Grading,
Ripening chambers etc 50 - 10 46 14
Others - 33 3 - -
Not specified - - 5 - -
Ownership Type

© COPYRIGHT 2014 349
19.1 AVAILED GOVERNMENT SUBSIDY OR ASSISTANCE
All Figs in % All Respondents
• Only 42% of the CSs have taken subsidy for setting up CSs
• Zone wise analysis shows that over 55% of West zone CSs have availed of subsidies while in East zone only 27% have availed of subsidies
Zone wise
Yes No
Yes No
37
63
43
57
27
73
55
45
North (n=2142)
East (n=803)
West (n=1013)
South (n=1045)
42
58
All (n=5003)
33
67
42
58
43
57
37
63
41
59
Yes No
39
61
All (n=5003)
Type H (n=4333)
Type P (n=523)
Type M (n=452)
Type Q (n=44)
Other Products
(n=27)

© COPYRIGHT 2014 350
19.1 AVAILED GOVERNMENT SUBSIDY OR ASSISTANCE
All Figs in % All Respondents
States
All (n=5003)
Maharashrta (n=451)
UP (n=1371)
A & N (n=10)
AP (n=600)
Assam (n=22)
Bihar (n=169)
Chandigarh (n=3)
Yes 42 53 47 10 38 36 42 33
No 58 47 53 90 62 64 58 67
All (n=5003)
C’garh (n=76)
Delhi (n=35)
Goa (n=7)
Gujarat (n=399)
Haryana (n=185)
HP (n=14)
J & K (n=16)
Yes 42 51 6 29 65 21 50 50
No 58 49 94 71 35 79 50 50
All (n=5003)
Jharkhand (n=19)
Karnataka (n=188)
Kerala (n=143)
MP (n=156)
Nagaland (n=1)
Orissa (n=38)
Pondicherry (n=2)
Punjab (n=402)
Yes 42 53 23 30 38 - 68 50 37
No 58 47 77 70 62 100 32 50 63
• There is wide variation in state wise analysis. • The incidence of taking subsidies is higher in Maharashtra, Chhattisgarh, Gujarat, Jharkhand,
Orissa and TN
All (n=5003)
Rajasthan (n=104)
Sikkim (n=3)
TN (n=100)
Tripura (n=7)
Uttaranchal (n=12)
WB (n=435)
North East (n=37)
Yes 42 52 20 70 22 33 13 30
No 58 48 80 30 78 67 87 70

© COPYRIGHT 2014 351
19.2 NUMBER OF TIMES SUBSIDY AVAILED
All Figs in % CS’s that have availed subsidy
1
2
Above 2
67
11
22
85
6
3
84
7
4
89
6
1
82
12
6
85
7
3
84
9
4
82
5
4
81
9
1
93
6
1
• On an average at overall level subsidies have been taken 1.2 times by CSs
• Zone wise analysis shows that West zone more CSs have taken subsidies and East zone has taken the less number of CSs have taken subsidies. We have noted earlier that there are more CSs in East zone than in West zone
Zone wise All
(n=2079) North
(n=916) East
(n=219) West
(n=557) South
(n=387)
85
7
3
All (n=2079)
Type H (n=1850)
Type P (n=194)
Type M (n=184)
Type Q (n=17)
Other Products
(n=9)
1
2
Above 2

© COPYRIGHT 2014 352
19.2 NUMBER OF TIMES SUBSIDY AVAILED
All Figs in %
All (n=2079)
Maharashrta (n=237)
UP (n=651)
A & N (n=1)
AP (n=227)
Assam (n=8)
Bihar (n=71)
Chandigarh (n=1)
1 85 90 82 100 85 75 83 100
2 7 8 5 - 9 25 14 -
Above 2 3 1 4 - 4 - 3 -
MEAN 1.2 1.1 1.2 1.0 1.2 1.3 1.2 1.0
All (n=2079)
C’garh (n=39)
Delhi (n=2)
Goa (n=2)
Gujarat (n=258)
Haryana (n=39)
HP (n=7)
J & K (n=8)
1 85 87 50 - 96 72 100 75
2 7 13 50 100 3 - - -
Above 2 3 - - - 1 0 - 25
MEAN 1.2 1.1 1.5 2.0 1.1 1.0 1.0 2.0
• The average number of Karnataka cold stores is higher in number of subsidies taken compared to other states.
All (n=2079)
Jharkhand (n=10)
Karnataka (n=44)
Kerala (n=43)
MP (n=60)
Nagaland (n=-)
Orissa (n=26)
Pondicherry (n=1)
Punjab (n=150)
1 85 70 64 88 95 - 100 100 84
2 7 - 16 2 5 - - - 9
Above 2 3 - 16 - - - - - 3
MEAN 1.2 1.0 1.8 1.0 1.1 - 1.0 1.0 1.2
All (n=2079)
Rajasthan (n=54)
Sikkim (n=1)
TN (n=71)
Tripura (n=2)
Uttaranchal (n=4)
WB (n=62)
North East (n=11)
1 85 85 100 87 50 100 71 73
2 7 2 - 6 - - 5 18
Above 2 3 0 0 3 0 0 3 -
MEAN 1.2 1.0 1.0 1.1 1.0 1.0 1.2 1.2
CS’s that have availed subsidy

© COPYRIGHT 2014 353
19.3 UTILIZATION OF GOVERNMENT SUBSIDIES AND ASSISTANCE
All Figs in %
Capacity Build
Training to Managers
Technology upgradation / Modernization
Training to operators
Marketing Support
Reefer trucks
Auxiliary equipments (S &G, Packaging, Ripening
chambers etc)
All (n=2079)
Type H (n=1850)
Type P (n=194)
Type M (n=184)
Type Q (n=17)
Other Products
(n=9)
47
45
23
9
6
2
1
46
46
22
8
5
1
1
59
36
25
14
5
2
2
45
38
26
16
11
5
7
18
41
41
18
12
0
12
44
11
56
11
0
0
11
• The purpose of taking subsidy related to cold storage is mainly for capacity expansion, training, and technology up gradation
CS’s that have availed subsidy

© COPYRIGHT 2014 354
19.3 UTILIZATION OF GOVERNMENT SUBSIDIES AND ASSISTANCE
All Figs in %
North (n=916)
East (n=219)
West (n=557)
53
38
23
3
5
1
1
34
44
26
7
6
0
0
54
46
27
21
5
1
2
South (n=387)
28
59
15
7
11
4
1
Zone Wise
Capacity Build
Training to Managers
Technology upgradation / Modernization
Training to operators
Marketing Support
Reefer trucks
Auxiliary equipments (S &G, Packaging, Ripening
chambers etc)
All (n=2079)
47
45
23
9
6
2
1
• The subsidies were taken to expand capacities, to get training on financial management and for technology up gradation.
CS’s that have availed subsidy

© COPYRIGHT 2014 355
19.3 UTILIZATION OF GOVERNMENT SUBSIDIES AND ASSISTANCE
All Figs in %
States
• Maharashtra UP, Bihar, Chandigarh, Gujarat, Haryana have taken subsidies for capacity expansion.
• UP, AP Assam, Bihar, Chhattisgarh, Gujarat have taken subsidy for training • Maharashtra and Delhi have taken subsidy for up gradation of technology.
All (n=2079)
Maharashrta (n=237)
UP (n=651)
A & N (n=1)
AP (n=227)
Assam (n=8)
Bihar (n=71)
Chandigarh (n=1)
Capacity Build 47 50 52 - 16 13 48 100
Training to Managers 45 35 44 100 70 88 34 -
Technology upgradation / Modernization
23 40 18 100 9 25 14 -
Training to operators 9 10 3 100 2 - 10 -
Marketing Support 6 5 6 100 11 25 10 -
Reefer trucks 2 0 1 100 1 - - -
Auxiliary equipments (S &G, Packaging, Ripening chambers etc)
1 1 1 100 1 - - -
All (n=2079)
C’garh (n=39)
Delhi (n=2)
Goa (n=2)
Gujarat (n=258)
Haryana (n=39)
HP (n=7)
J & K (n=8)
Capacity Build 47 26 - 50 63 56 71 13
Training to Managers 45 72 - 100 52 8 43 88
Technology upgradation / Modernization
23 31 100 - 16 33 - -
Training to operators 9 - - - 35 3 - -
Marketing Support 6 - - - 4 3 - -
Reefer trucks 2 - - - 1 - - -
Auxiliary equipments (S &G, Packaging, Ripening chambers etc)
1 - - - 3 - - -
CS’s that have availed subsidy

© COPYRIGHT 2014 356
19.3 UTILIZATION OF GOVERNMENT SUBSIDIES AND ASSISTANCE
All Figs in %
States
All (n=2079)
Jharkhand (n=10)
Karnataka (n=44)
Kerala (n=43)
MP (n=60)
Nagaland (n=-)
Orissa (n=26)
Pondicherry (n=1)
Punjab (n=150)
Capacity Build 47 40 36 40 28 - 15 100 57
Training to Managers 45 10 34 33 58 - 65 - 16
Technology upgradation / Modernization
23 40 20 21 20 - 31 - 49
Training to operators 9 - 25 7 2 - - - 6
Marketing Support 6 - 5 21 5 - 4 - 6
Reefer trucks 2 - 7 - - - - - 3
Auxiliary equipments (S &G, Packaging, Ripening chambers etc)
1 - - 2 3 - - - 1
All (n=2079)
Rajasthan (n=54)
Sikkim (n=1)
TN (n=71)
Tripura (n=2)
Uttaranchal (n=4)
WB (n=62)
North East (n=11)
Capacity Build 47 63 100 54 - 50 34 18
Training to Managers 45 35 - 56 50 25 31 73
Technology upgradation / Modernization
23 9 - 24 - 75 32 18
Training to operators 9 - - 13 - - 15 -
Marketing Support 6 - - 10 50 - 5 27
Reefer trucks 2 - - 13 - - 2 -
Auxiliary equipments (S &G, Packaging, Ripening chambers etc)
1 - - 1 - - - -
• Jharkhand, Karnataka, Kerala, Punjab, Rajasthan, TN and Uttaranchal have taken subsidies for capacity expansion.
• Kerala, MP, Orissa, Rajasthan, TN and WB have taken subsidy for training • Jharkhand and Punjab have also taken subsidy for up gradation of technology.
CS’s that have availed subsidy

© COPYRIGHT 2014 357
19.3 UTILIZATION OF GOVERNMENT SUBSIDIES AND ASSISTANCE
All Figs in %
Urban CS’s
(n=511)
Rural CS
(n=1568)
NHB/NHM
(n=1324)
Others
(n=755)
Capacity Build 44 48 46 47
Training to Managers 38 47 45 44
Technology upgradation / Modernization 23 23 21 25
Training to operators 12 8 6 15
Marketing Support 9 5 6 6
Reefer trucks 2 1 2 2
Auxiliary equipments (S &G, Packaging, Ripening chambers etc) 2 1 1 2
• In all – urban rural or NHB/non NHB CSs - cold storages, subsidies have mainly been availed to built the capacity as well as train the managers.
CS’s that have availed subsidy

© COPYRIGHT 2014 358
19.3 UTILIZATION OF GOVERNMENT SUBSIDIES AND ASSISTANCE
All Figs in %
Ownership Type
Proprietorship
(n=468)
Partnership
(n=735)
Company
(Public Ltd.)
(n=73)
Company
(Private Ltd.)
(n=709)
Association
(Public)
(n=2)
Capacity Build 46 49 55 45 -
Training to Managers 41 43 23 51 50
Technology upgradation / Modernization 26 22 33 18 50
Training to operators 6 9 11 10 -
Marketing Support 9 5 5 5 50
Reefer trucks 2 1 3 2 -
Auxiliary equipments (S &G, Packaging, Ripening chambers etc)
1 1 3 1 50
Association
(Private)
(n=4)
Cooperative
(n=55)
Government
(Co./Dept./
PSU)
(n=29)
Not classified
under any
Ownership
type
(n=4)
Capacity Build - 45 45 25
Training to Managers 25 27 48 75
Technology upgradation / Modernization 75 51 28 -
Training to operators - 9 14 25
Marketing Support 50 5 7 25
Reefer trucks - - 3 -
Auxiliary equipments (S &G, Packaging, Ripening chambers etc) - 2 - -
• In government run cold storages, subsidies have mainly been availed to built the capacity as well as train the managers.
CS’s that have availed subsidy

© COPYRIGHT 2014 359
19.4 SOURCE OF GOVERNMENT SUBSIDIES AND ASSISTANCE
All Figs in %
• At an overall level, more than 1 out 3 cold storages have availed for a NHB subsidy. • Number of cold storages availing NHB subsidies are higher in the northern zone.
All (n=2079)
Type H (n=1850)
Type P (n=194)
Type H (n=184)
Type P (n=17)
Other Products
(n=9)
DIC 4 3 6 8 12 11
NABARD 23 24 21 5 29 -
National Horticulture Mission 10 11 5 1 - 22
NHB 36 39 36 21 29 11
Others 34 29 37 71 35 67
All (n=2079)
North (n=916)
East (n=219)
West (n=557)
South (n=387)
DIC 4 1 7 7 3
NABARD 23 26 19 15 28
National Horticulture Mission 10 12 7 8 12
NHB 36 40 33 33 33
Others 34 27 38 44 32
CS’s that have availed subsidy

© COPYRIGHT 2014 360
19.4 SOURCE OF GOVERNMENT SUBSIDIES AND ASSISTANCE
All Figs in %
States
• Maharashtra UP, Bihar, Gujarat, Haryana have mainly taken subsidies from NHB. • Almost 35% of cold storages in Andhra Pradesh have a NABARD scheme.
All (n=2079)
Maharashrta (n=237)
UP (n=651)
A & N (n=1)
AP (n=227)
Assam (n=8)
Bihar (n=71)
Chandigarh (n=1)
DIC 4 11 0 100 0 - 4 -
NABARD 23 17 33 - 35 13 23 100
National Horticulture Mission
10 5 10 - 16 13 10 -
NHB 36 33 37 - 39 - 45 -
Others 34 44 25 - 17 - 25 -
All (n=2079)
C’garh (n=39)
Delhi (n=2)
Goa (n=2)
Gujarat (n=258)
Haryana (n=39)
HP (n=7)
J & K (n=8)
DIC 4 18 - - 5 5 14 25
NABARD 23 33 - - 7 3 14 -
National Horticulture Mission
10 5 - - 9 5 - 13
NHB 36 41 - - 33 49 -
Others 34 13 - 100 49 41 14 13
CS’s that have availed subsidy

© COPYRIGHT 2014 361
19.4 SOURCE OF GOVERNMENT SUBSIDIES AND ASSISTANCE
All Figs in %
States
All (n=2079)
Jharkhand (n=10)
Karnataka (n=44)
Kerala (n=43)
MP (n=60)
Nagaland (n=-)
Orissa (n=26)
Pondicherry (n=1)
Punjab (n=150)
DIC 4 - 9 2 - - 12 - 1
NABARD 23 40 18 9 38 - 12 - 5
National Horticulture Mission
10 - 23 - 13 - 15 - 23
NHB 36 - 45 7 - - - - 47
Others 34 60 32 93 22 - 54 - 28
All (n=2079)
Rajasthan (n=54)
Sikkim (n=1)
TN (n=71)
Tripura (n=2)
Uttaranchal (n=4)
WB (n=62)
North East (n=11)
DIC 4 - - 6 - 25 5 -
NABARD 23 24 - 24 50 25 5 18
National Horticulture Mission
10 9 - 1 - - 3 9
NHB 36 35 - 24 - - 24 -
Others 34 33 100 46 - 25 65 9
• Karnataka and Punjab
CS’s that have availed subsidy

© COPYRIGHT 2014 362
19.4 SOURCE OF GOVERNMENT SUBSIDIES AND ASSISTANCE
All Figs in %
Urban CS’s
(n=511)
Rural CS
(n=1568)
NHB/NHM
(n=1324)
Others
(n=755)
DIC 5 3 3 5
NABARD 20 23 26 16
National Horticulture Mission 10 10 12 7
NHB 32 37 40 29
Others 39 32 25 48
• In all – urban rural or NHB/non NHB CSs – predominantly have availed of NHB subsidies. • Comparatively, higher proportion of NHB CS’s have availed of their subsidies – 40%
CS’s that have availed subsidy

© COPYRIGHT 2014 363
19.4 SOURCE OF GOVERNMENT SUBSIDIES AND ASSISTANCE
All Figs in %
Ownership Type
Proprietorship
(n=468)
Partnership
(n=735)
Company
(Public Ltd.)
(n=73)
Company
(Private Ltd.)
(n=709)
Association
(Public)
(n=2)
DIC 4 4 1 3 -
NABARD 17 19 23 31 -
National Horticulture Mission 12 13 3 8 -
NHB 31 39 34 36 -
Others 39 30 45 30 100
Association
(Private)
(n=4)
Cooperative
(n=55)
Government
(Co./Dept./
PSU)
(n=29)
Not classified
under any
Ownership
type
(n=4)
DIC - 4 - -
NABARD 25 11 17 50
National Horticulture Mission 25 - 17 -
NHB 25 38 21 50
Others 25 56 52 -
CS’s that have availed subsidy
• More than 30% of private companies (CS’s) have used the nabard subsidy.

© COPYRIGHT 2014 364
19.5 INTEREST IN AVAILING SUBSIDY IN FUTURE
All Figs in % All Respondents
81
19
• Overall 75% of the CSs would like to avail subsidy in future. • The trend is same across all types of cold stores
• Zone wise analysis shows that the inclination to avail a subsidy is lower in North zone compared to other zones
Zone wise
75 25
76 24
72 28
74 26
68 32
85
15
75 25 63 37
87
13
81
19
All (n=5003)
Type H (n=4333)
Type P (n=523)
Type M (n=452)
Type Q (n=44)
Other Products
(n=27)
All (n=5003)
North (n=2142)
East (n=803)
West (n=1013)
South (n=1045)
Require More Subsidies Do Not Require More Subsidies
Require More Subsidies Do Not Require More Subsidies

© COPYRIGHT 2014 365
19.5 INTEREST IN AVAILING SUBSIDY IN FUTURE
All Figs in % All Respondents
States
All (n=5003)
Maharashrta (n=451)
UP (n=1371)
A & N (n=10)
AP (n=600)
Assam (n=22)
Bihar (n=169)
Chandigarh (n=3)
Require More Subsidies 75 79 67 80 86 91 72 33
Do Not Require More Subsidy’s
25 21 33 20 14 9 28 67
All (n=5003)
C’garh (n=76)
Delhi (n=35)
Goa (n=7)
Gujarat (n=399)
Haryana (n=185)
HP (n=14)
J & K (n=16)
Require More Subsidies 75 78 63 29 87 49 79 94
Do Not Require More Subsidy’s
25 22 37 71 13 51 21 6
All (n=5003)
Jharkhand (n=19)
Karnataka (n=188)
Kerala (n=143)
MP (n=156)
Nagaland (n=1)
Orissa (n=38)
Pondicherry (n=2)
Punjab (n=402)
Require More Subsidies 75 58 85 73 72 100 97 100 54
Do Not Require More Subsidy’s
25 42 15 27 28 - 3 - 46
• State wise, non inclination for availing subsidy is high in Chandigarh, Haryana, Jharkhand, Punjab and Uttaranchal
All (n=5003)
Rajasthan (n=104)
Sikkim (n=5)
TN (n=102)
Tripura (n=9)
Uttaranchal (n=12)
WB (n=464)
North East (n=37)
Require More Subsidies 75 66 100 93 78 42 93 89
Do Not Require More Subsidy’s
25 34 - 7 22 58 7 11

© COPYRIGHT 2014 366
19.5 INTEREST IN AVAILING SUBSIDY IN FUTURE
All Figs in % All Respondents
Proprietorship
(n=1336)
Partnership
(n=1677)
Company
(Public Ltd.)
(n=174)
Company
(Private Ltd.)
(n=1563)
Association
(Public)
(n=5)
Require More Subsidies 70 74 70 81 80
Do Not Require More Subsidy’s 30 26 30 19 20
Association
(Private)
(n=12)
Cooperative
(n=130)
Government
(Co./Dept./
PSU)
(n=82)
Not classified
under any
Ownership
type
(n=24)
Require More Subsidies 92 79 70 54
Do Not Require More Subsidy’s 8 21 30 46
• 81% of the cold storages that are private companies want to avail more subsidies in the future. • There are almost 30% government owned cold storages which refuse to avail any subsidies in
the future.
Urban (n=1481)
Rural (n=3522)
NHB (n=3061)
Others (n=1942)
Require More Subsidies 77 74 77 72
Do Not Require More Subsidy’s 23 26 23 28

© COPYRIGHT 2014
CHAPTER 20
EMPLOYMENT OF MANAGERIAL, SUPERVISORY,
TECHNICAL STAFF AND LABOUR
Page no 367 to 383

© COPYRIGHT 2014 368
20. HUMAN RESOURCES DETAILS
It was apparent in the technology section of this report that dependency of the Indian CS’s is very high on manual labor. Right from ventilation, evaporation, safety measure to reefer technology, manpower plays a crucial role.
All India average of number of permanent employees in a cold storage is 20.7. This figure increases when it comes to CS’s which store Animal husbandry and Processed foods. Horticulture based CS’s have a modest 13.7 employees per CS.
Qualification level of all Employees in the Cold storage
Out of these 20.7 (average score) employees in each CS, 1 is a post graduate, 3 are graduates
and the remaining are either 10th pass, diploma holders or unskilled people. Animal Husbandry based CS’s have a higher number of employees who are graduates or post graduates.
1.3
2.7
7.0
1.4
3.9
1.3
PostGraduate
Graduate SSC/HSc TechnicalDilpoma
Less thanSSC
Unskilled
Education Level

© COPYRIGHT 2014 369
20. HUMAN RESOURCES DETAILS
The average number of employees higher in urban CSs and non assisted CSs.
These type of CSs also have better educated – graduate and post graduate staff - compared to rural and NHB assisted CSs
Urban (n=1481)
Rural (n=3522)
NHB (n=3061)
Others (n=1942)
Total Number of EMPLOYEES 25.7 18.2 14.2 30.2
POST GRADUATES 1.5 1.2 0.9 1.8
GRADUATES 3.3 2.5 2.2 3.6
SSC/HSC 6.7 7.1 6.0 8.6
TECHINICAL / DIPLOMA 1.7 1.2 1.0 2.0
SSC 4.7 3.6 2.7 5.9
ILLITERATE 1.7 1.1 0.8 2.1

© COPYRIGHT 2014 370
20. HUMAN RESOURCES DETAILS
The average number of employees are maximum among the government owned cold storages – 48.2.
Proprietorship
(n=1336)
Partnership
(n=1677)
Company
(Public Ltd.)
(n=174)
Company
(Private Ltd.)
(n=1563)
Association
(Public)
(n=5)
Total Number of EMPLOYEES 17.9 15.4 37.2 23.5 80.4
POST GRADUATES 1.1 1.1 2.5 1.4 3.6
GRADUATES 2.1 2.1 5.8 3.2 10.6
SSC/HSC 6.4 6.0 11.6 7.6 23.4
TECHINICAL / DIPLOMA 0.8 0.9 3.1 1.7 4.6
SSC 4.2 3.1 5.9 3.9 23.6
ILLITERATE 1.5 1.0 3.1 1.0 17.5
Association
(Private)
(n=12)
Cooperative
(n=130)
Government
(Co./Dept./
PSU)
(n=82)
Not classified
under any
Ownership
type
(n=24)
Total Number of EMPLOYEES 22.7 31.5 48.2 15.6
POST GRADUATES 2.5 2.4 2.3 1.6
GRADUATES 4.9 5.5 7.2 2.8
SSC/HSC 7.7 8.7 10.5 4.5
TECHINICAL / DIPLOMA 3.8 4.1 4.4 1.6
SSC 6.0 6.7 4.4 7.9
ILLITERATE 2.3 2.3 1.9 0.8

© COPYRIGHT 2014 371
20. HUMAN RESOURCES DETAILS
Thus the CS’s have a mix of employees with varied education background but 75% of them either with a diploma or 10th standard & less. Thus, employability is more directed towards on job skills in these CS’s.
Cold stores were unable to give any definitive response to number of contractual employees, but the general consensus understood was that unskilled labour is hired depending on work load and seasonality. The numbers can vary from 20 to 300 per cold store.
Cold Stores must have refrigeration engineers or technicians. All India, a mean of 2.5 reefer technicians per cold storage facility is reported. There is a surge in these numbers for CS’s storing processed foods and animal husbandry products. An average of 3.0 reefer technicians have formal training - ITI / Diploma holders.
In terms of training, over 71% of employees have not attended a training program in the last one year. Out of those who did, most of them have attended the company funded / organized training program.
There is very high sensitization of employees towards skill up-gradation and 76% of the cold stores reported that they intend to join training programs if organized by the government.

© COPYRIGHT 2014 372
20.1 NUMBER OF EMPLOYEES ON ROLL
All Respondents
Post graduates
1.3
Graduates
2.7
SSC / HSC
7.0
Technical/ Diploma
1.4
Less than SSC
3.9
Unskilled
1.3
ALL (n=5003)
Total Number of employees
20.4
• On an average, 20.7 persons were employed in each cold storage • On an average there were at least 1 post graduate, over 2 graduate, 7 plus school educated, 1
plus diploma holders and another 4 who have done schooling to some extent.
All Figs in Absolute

© COPYRIGHT 2014 373
20.1 NUMBER OF EMPLOYEES ON ROLL
• Overall cold stores employed 20.6 employees on an average per store • Type M stores – animal husbandry stores had the maximum number per store, followed by
Type P, Type Q and Type H in that order • Drilling down to level of education like post graduates, graduates etc., also shows the same
trend where average employment at all levels is higher in Type M followed by Type P, type Q and Type H in that order
All Respondents
Type of Product Stored
All (n=5003)
Type H (n=4333)
Type P (n=523)
Type M (n=452)
Type Q (n=44)
other products
(n=27)
Total Number of employees
Estimated Number of Employees
102111 59145 15868 32205 1109 949
Mean 20.4 13.7 30.3 71.3 25.2 35.2
POST GRADUATES
Estimated Number of Employees
6454 3900 1308 1700 101 105
Mean 1.3 0.9 2.5 3.8 2.3 3.9
GRADUATES
Estimated Number of Employees
13708 8666 2448 3485 129 122
Mean 2.7 2.0 4.7 7.7 2.9 4.5
SSC/HSC
Estimated Number of Employees
34871 24611 4273 8276 338 359
Mean 7.0 5.7 8.2 18.3 7.7 13.3
TECHINICAL / DIPLOMA
Estimated Number of Employees
6854 3683 1511 2066 89 78
Mean 1.4 0.9 2.9 4.6 2.0 2.9
Less than SSC
Estimated Number of Employees
19512 12349 2850 5438 143 244
Mean 3.9 2.9 5.5 12.0 3.3 9.0
Unskilled Workers
Estimated Number of Employees
6404 4116 957 1627 41 139
Mean 1.3 1.0 1.8 3.6 0.9 5.1
All Figs in Absolutes

© COPYRIGHT 2014 374
20.1 NUMBER OF EMPLOYEES ON ROLL
All Respondents
Zone wise
Type of Product Stored
All (n=5003)
North (n=2142)
East (n=803)
West (n=1013)
South (n=1045)
Total Number of employees
Estimated Number of Employees
102111 20992 10905 42333 27902
Mean 20.4 9.8 13.6 41.8 26.7
POST GRADUATES
Estimated Number of Employees
6454 1949 369 2543 1578
Mean 1.3 0.9 0.5 2.5 1.5
GRADUATES
Estimated Number of Employees
13708 3427 1855 4467 3908
Mean 2.7 1.6 2.3 4.4 3.7
SSC/HSC
Estimated Number of Employees
34871 10410 5260 11629 7629
Mean 7.0 4.9 6.6 11.5 7.3
TECHINICAL / DIPLOMA
Estimated Number of Employees
6854 1178 747 2026 2801
Mean 1.4 0.6 0.9 2.0 2.7
Less than SSC
Estimated Number of Employees
19512 4241 1863 8793 4723
Mean 3.9 2.0 2.3 8.7 4.5
Unskilled Workers
Estimated Number of Employees
6404 771 402 3515 1797
Mean 1.3 0.4 0.5 3.5 1.7
All Figs in Absolutes
• Cold storages in the Western zone employ the highest number of workers with an average of 43.2, followed by South, East and North
• The average number of employees with a technical diploma in the South are higher than that in the other zones.
• Western zone has an average of 2.4 employees working in cold stores who are unskilled.

© COPYRIGHT 2014 375
20.1 NUMBER OF EMPLOYEES ON ROLL
All Respondents
States
All (n=5003)
Maharashrta (n=451)
UP (n=1371)
A & N (n=10)
AP (n=600)
Assam (n=22)
Bihar (n=169)
Chandigarh (n=3)
Total Number of employees
Estimated Number of Employees
102111 23862 15012 201 10584 283 1751 23
Mean 20.4 52.9 11.0 20.1 17.6 12.9 10.4 7.7
POST GRADUATES
Estimated Number of Employees
6454 1736 1549 - 636 21 78 4
Mean 1.3 3.9 1.1 - 1.1 1.0 0.5 1.3
GRADUATES
Estimated Number of Employees
13708 2688 2495 9 1920 34 250 9
Mean 2.7 6.0 1.8 0.9 3.2 1.6 1.5 3.0
SSC/HSC
Estimated Number of Employees
34871 7180 7952 46 3156 104 901 7
Mean 7.0 15.9 5.8 4.6 5.3 4.7 5.3 2.3
TECHINICAL / DIPLOMA
Estimated Number of Employees
6854 1294 713 14 1236 41 64 1
Mean 1.4 2.9 0.5 1.4 2.1 1.9 0.4 0.3
Less than SSC
Estimated Number of Employees
19512 4984 2673 31 1548 43 441 -
Mean 3.9 11.1 2.0 3.1 2.6 2.0 2.6 -
Unskilled Workers
Estimated Number of Employees
6404 2260 521 9 1182 65 39 2
Mean 1.3 5.0 0.4 0.9 2.0 3.0 0.2 0.7
All Figs in Absolutes
• State wise analysis shows that average employment in Maharashtra, Gujarat, Delhi, Kerala and TN is higher compared to other states.
• On the other hand, Chandigarh, Chhattisgarh, HP, Haryana, MP, Punjab, Rajasthan, Tripura and Uttaranchal deploy less than 10 employees in their cold stores on an average.

© COPYRIGHT 2014 376
20.1 NUMBER OF EMPLOYEES ON ROLL
All Respondents
States
All (n=5003)
C’garh (n=76)
Delhi (n=35)
Goa (n=7)
Gujarat (n=399)
Haryana (n=185)
HP (n=14)
J & K (n=16)
Total Number of employees
Estimated Number of Employees
102111 706 1186 436 16942 1162 155 248
Mean 20.4 9.3 33.9 62.3 42.5 6.3 11.1 15.5
POST GRADUATES
Estimated Number of Employees
6454 53 29 6 694 80 25 31
Mean 1.3 0.7 0.8 0.9 1.7 0.4 1.8 1.9
GRADUATES
Estimated Number of Employees
13708 125 178 59 1532 241 51 50
Mean 2.7 1.6 5.1 8.4 3.8 1.3 3.6 3.1
SSC/HSC
Estimated Number of Employees
34871 335 276 157 3822 686 45 72
Mean 7.0 4.4 7.9 22.4 9.6 3.7 3.2 4.5
TECHINICAL / DIPLOMA
Estimated Number of Employees
6854 34 51 12 658 80 49 18
Mean 1.4 0.5 1.5 1.7 1.7 0.4 3.5 1.1
Less than SSC
Estimated Number of Employees
19512 173 196 114 3559 337 22 64
Mean 3.9 2.3 5.6 16.3 8.9 1.8 1.6 4.0
Unskilled Workers
Estimated Number of Employees
6404 11 17 5 1273 41 - 28
Mean 1.3 0.2 0.5 0.7 3.2 0.2 - 1.8
All Figs in Absolutes

© COPYRIGHT 2014 377
20.1 NUMBER OF EMPLOYEES ON ROLL
All Respondents
States
All (n=5003)
Jharkhand (n=19)
Karnataka (n=188)
Kerala (n=143)
MP (n=156)
Nagaland (n=1)
Orissa (n=38)
Pondicherry (n=2)
Punjab (n=402)
Total Number of employees
Estimated Number of Employees
102111 210 4194 6615 1092 10 727 478 2255
Mean 20.4 11.1 22.3 46.3 7.0 10.0 19.1 239.0 5.6
POST GRADUATES
Estimated Number of Employees
6454 3 197 482 120 - 77 18 149
Mean 1.3 0.2 1.1 3.4 0.8 - 2.0 9.0 0.4
GRADUATES
Estimated Number of Employees
13708 20 564 898 198 1 76 60 237
Mean 2.7 1.1 3.0 6.3 1.3 1.0 2.0 30.0 0.6
SSC/HSC
Estimated Number of Employees
34871 70 985 2696 526 2 290 40 985
Mean 7.0 3.7 5.2 18.9 3.4 2.0 7.6 20.0 2.5
TECHINICAL / DIPLOMA
Estimated Number of Employees
6854 5 432 576 73 1 51 54 145
Mean 1.4 0.3 2.3 4.0 0.5 1.0 1.3 27.0 0.4
Less than SSC
Estimated Number of Employees
19512 96 914 1360 207 - 261 72 764
Mean 3.9 5.1 4.9 9.5 1.3 - 6.9 36.0 1.9
Unskilled Workers
Estimated Number of Employees
6404 3 494 14 27 4 26 - 117
Mean 1.3 0.2 2.6 0.1 0.2 4.0 0.7 - 0.3
All Figs in Absolute

© COPYRIGHT 2014 378
20.1 NUMBER OF EMPLOYEES ON ROLL
All Respondents
States
All (n=5003)
Rajasthan (n=104)
Sikkim (n=5)
TN (n=102)
Tripura (n=9)
Uttaranchal (n=12)
WB (n=464)
North East (n=37)
Total Number of employees
Estimated Number of Employees
102111 861 37 5889 85 90 7099 415
Mean 20.4 8.3 7.4 57.7 9.4 7.5 15.3 11.2
POST GRADUATES
Estimated Number of Employees
6454 70 1 245 8 16 130 30
Mean 1.3 0.7 0.2 2.4 0.9 1.3 0.3 0.8
GRADUATES
Estimated Number of Employees
13708 164 2 464 15 13 1332 52
Mean 2.7 1.6 0.4 4.6 1.7 1.1 2.9 1.4
SSC/HSC
Estimated Number of Employees
34871 356 28 778 48 27 3485 182
Mean 7.0 3.4 5.6 7.6 5.3 2.3 7.5 4.9
TECHINICAL / DIPLOMA
Estimated Number of Employees
6854 103 1 497 13 4 529 56
Mean 1.4 1.0 0.2 4.9 1.4 0.3 1.1 1.5
Less than SSC
Estimated Number of Employees
19512 164 6 925 11 22 831 60
Mean 3.9 1.6 1.2 9.1 1.2 1.8 1.8 1.6
Unskilled Workers
Estimated Number of Employees
6404 35 1 78 - 10 246 70
Mean 1.3 0.3 0.2 0.8 - 0.8 0.5 1.9
All Figs in Absolute

© COPYRIGHT 2014 379
20.2 NUMBER OF REEFER TECHNICIANS ON ROLL
All Figs in %
• Close to 1/3rd storages in Delhi and Bihar have employed no reefer technicians. • Majority of other states have 1-5 reefer technicians. • Across states, WB has the highest number of average reefer technicians employed in its cold
stores. • In Karnataka there are 45% cold stores which have employed not a single reefer technician.
All Respondents
States
All (n=5003)
Maharashrta (n=451)
UP (n=1371)
A & N (n=10)
AP (n=600)
Assam (n=22)
Bihar (n=169)
Chandigarh (n=3)
1 22 44 19 40 9 36 12 -
2 21 20 9 20 42 36 7 -
3 17 8 27 10 14 14 22 -
4 9 5 20 - 4 - 14 33
5 4 3 7 - 1 - 4 -
More than 5 10 4 6 - 5 - 9 -
DKCS 1 2 1 - 1 - - -
M E A N 2.5 1.9 2.8 1.1 2.1 1.5 2.3 1.3
All (n=5003)
C’garh (n=76)
Delhi (n=35)
Goa (n=7)
Gujarat (n=399)
Haryana (n=185)
HP (n=14)
J & K (n=16)
1 22 9 26 43 47 17 14 25
2 21 33 11 14 29 43 43 13
3 17 32 9 14 4 29 - 19
4 9 5 6 - 2 2 7 6
5 4 3 6 - 2 1 7 13
More than 5 10 1 9 - 3 3 29 19
DKCS 1 7 - - 1 - - -
M E A N 2.5 2.3 2.0 1.1 1.6 2.2 4.0 3.1

© COPYRIGHT 2014 380
20.2 NUMBER OF REEFER TECHNICIANS ON ROLL
All Figs in %
• Close to 1/3rd storages in Delhi and Bihar have employed no reefer technicians. • Majority of other states have 1-5 reefer technicians. • Across states, WB has the highest number of average reefer technicians employed in its cold
stores. • In Karnataka there are 45% cold stores which have employed not a single reefer technician.
All Respondents
States
All (n=5003)
Jharkhand (n=19)
Karnataka (n=188)
Kerala (n=143)
MP (n=156)
Nagaland (n=1)
Orissa (n=38)
Pondicherry (n=2)
Punjab (n=402)
1 22 21 23 10 15 100 32 - 29
2 21 11 13 28 24 - 18 - 36
3 17 21 8 8 26 - 26 - 11
4 9 5 3 13 6 - 5 50 1
5 4 - 3 6 1 - 3 - -
More than 5 10 - 4 22 1 - 5 - 1
DKCS 1 - 1 3 - - - 50 1
M E A N 2.5 1.3 1.4 3.7 1.8 1.0 2.2 4.0 1.5
All (n=5003)
Rajasthan (n=104)
Sikkim (n=5)
TN (n=102)
Tripura (n=9)
Uttaranchal (n=12)
WB (n=464)
North East (n=37)
1 22 27 - 20 33 58 5 32
2 21 26 20 19 33 8 5 32
3 17 10 - 15 11 17 9 11
4 9 2 20 10 22 - 11 8
5 4 2 - 6 - - 5 -
More than 5 10 3 - 17 - - 59 -
DKCS 1 - - 3 - - - -
M E A N 2.5 1.6 1.2 3.8 2.2 1.3 5.4 1.6

© COPYRIGHT 2014 381
20.3 NUMBER OF REEFER TECHNICIANS ON ROLL WITH ITI/DIPLOMA
All Figs in %
• Over 95% cold stores in Maharashtra, AP and Gujarat have 1-10 reefer technicians with ITI/diploma.
• Karnataka and Kerala have around 90% storages which have 1-10 reefer technician employees with ITI/diploma.
States
All (n=1607)
Maharashrta (n=280)
UP (n=285)
A & N (n=7)
AP (n=279)
Assam (n=13)
Bihar (n=19)
Chandigarh (n=1)
1-10 85 97 54 100 94 100 89 100
11-20 2 1 - - 4 - 5 -
More than 20 1 - 2 - 2 - - -
DK/CS 12 2 44 - - - 5 -
M E A N 3.3 2.1 3.7 1.3 3.7 1.5 2.1 1.0
All (n=1607)
C’garh (n=14)
Delhi (n=15)
Goa (n=3)
Gujarat (n=202)
Haryana (n=37)
HP (n=10)
J & K (n=5)
1-10 85 93 93 100 98 65 60 100
11-20 2 - - - 2 - - -
More than 20 1 - - - - 14 - -
DK/CS 12 7 7 - - 22 40 -
M E A N 3.3 2.3 3.4 1.7 2.1 21.1 2.0 4.2
All (n=1607)
Jharkhand (n=3)
Karnataka (n=84)
Kerala (n=115)
MP (n=32)
Nagaland (n=1)
Orissa (n=15)
Pondicherry (n=2)
Punjab (n=43)
1-10 85 - 96 95 81 100 100 50 40
11-20 2 - 2 3 - - - - -
More than 20 1 - - 2 3 - - 50 -
DK/CS 12 100 1 1 16 - - - 60
M E A N 3.3 - 2.4 4.3 2.3 1.0 1.6 19.5 2.2
All (n=1607)
Rajasthan (n=23)
Sikkim (n=1)
TN (n=79)
Tripura (n=5)
Uttaranchal (n=1)
WB (n=33)
North East (n=20)
1-10 85 78 100 86 100 - 100 100
11-20 2 - - 11 - - - -
More than 20 1 - - 3 - - - -
DK/CS 12 22 - - - 100 - -
M E A N 3.3 1.3 4.0 4.9 1.6 - 1.7 1.7
Technicians who have acquired ITI/Diploma

© COPYRIGHT 2014 382
20.4 TRAINING PROGRAMS ATTENDED – PREVIOUS 1 YEAR
All Figs in %
• Over 90% cold stores in Haryana, Bihar and MP haven't sent their employees for any of the training programs.
Of the cold stores in different states, who sent their employees to training programs, • 1/5th of the storages in AP have sent their employees for the private training modules. • 2/3rd of such Kerala based storages have sent their employees for government training as well. • 26% storages in WB have sent their workers for government training programs in the last 1
year.
All Respondents
States
All (n=5003)
Maharashrta (n=451)
UP (n=1371)
A & N (n=10)
AP (n=600)
Assam (n=22)
Bihar (n=169)
Chandigarh (n=3)
Training program attended 23 40 6 10 39 41 4 -
Training program not attended
77 60 94 90 61 59 96 100
All (n=5003)
C’garh (n=76)
Delhi (n=35)
Goa (n=7)
Gujarat (n=399)
Haryana (n=185)
HP (n=14)
J & K (n=16)
Training program attended 23 7 9 29 29 10 36 19
Training program not attended
77 93 91 71 71 90 64 81
All (n=5003)
Jharkhand (n=19)
Karnataka (n=188)
Kerala (n=143)
MP (n=156)
Nagaland (n=1)
Orissa (n=38)
Pondicherry (n=2)
Punjab (n=402)
Training program attended
23 - 30 77 10 - 21 50 6
Training program not attended
77 100 70 23 90 100 79 50 94
All (n=5003)
Rajasthan (n=104)
Sikkim (n=5)
TN (n=102)
Tripura (n=9)
Uttaranchal (n=12)
WB (n=464)
North East (n=37)
Training program attended
23 13 40 38 33 - 43 38
Training program not attended
77 87 60 62 67 100 57 62

© COPYRIGHT 2014 383
20.5 INTEREST IN GOVERNMENT TRAINING PROGRAM
All Figs in % All Respondents
States
• Across all states majority of cold storages are willing to attend training programs organized by the government in the future.
All (n=5003)
Maharashrta (n=451)
UP (n=1371)
A & N (n=10)
AP (n=600)
Assam (n=22)
Bihar (n=169)
Chandigarh (n=3)
Yes 76 86 77 90 59 86 88 100
No 24 14 23 10 41 14 12 -
All (n=5003)
C’garh (n=76)
Delhi (n=35)
Goa (n=7)
Gujarat (n=399)
Haryana (n=185)
HP (n=14)
J & K (n=16)
Yes 76 87 66 71 87 77 86 94
No 24 13 34 29 13 23 14 6
All (n=5003)
Jharkhand (n=19)
Karnataka (n=188)
Kerala (n=143)
MP (n=156)
Nagaland (n=1)
Orissa (n=38)
Pondicherry (n=2)
Punjab (n=402)
Yes 76 84 77 91 83 100 87 100 65
No 24 16 23 9 17 - 13 - 35
All (n=5003)
Rajasthan (n=104)
Sikkim (n=5)
TN (n=102)
Tripura (n=9)
Uttaranchal (n=12)
WB (n=464)
North East (n=37)
Yes 76 71 100 93 78 50 67 86
No 24 29 - 7 22 50 33 14

© COPYRIGHT 2014
AFFILIATION DETAILS

© COPYRIGHT 2014 385
AFFILIATION OR MEMBER OF
All Figs in % All Respondents
States
• More than 3/4ths of the storages in UP are affiliated to Cold Storage Association. Quiet similar proportions in Chhattisgarh, Delhi and Gujarat are also members of the mentioned association.
• In AP and Haryana too there over 50% storages which are members of Cold Storage Association.
All (n=5003)
Maharashrta (n=451)
UP (n=1371)
A & N (n=10)
AP (n=600)
Assam (n=22)
Bihar (n=169)
Chandigarh (n=3)
Cold Storage Association 55 31 79 - 54 36 31 33
Farmer Producer Organization
3 4 1 - 1 5 1 -
Society or Cooperative 2 6 - - 1 5 3 -
Part of APMC (Mandi) 1 6 - - - 5 2 -
NCCD (National Centre for Cold-chain Development)
1 2 - - 0 - - -
None 33 44 20 70 42 50 60 33
Export Associations Like MPEDA, APEDA
6 16 - 30 3 5 3 33
All (n=5003)
C’garh (n=76)
Delhi (n=35)
Goa (n=7)
Gujarat (n=399)
Haryana (n=185)
HP (n=14)
J & K (n=16)
Cold Storage Association 55 70 74 - 73 56 - 19
Farmer Producer Organization
3 4 - - 1 - - 6
Society or Cooperative 2 3 3 - 2 1 - 6
Part of APMC (Mandi) 1 26 3 - 1 - - -
NCCD (National Centre for Cold-chain Development)
1 - 6 - - - - -
None 33 13 17 86 15 43 100 69
Export Associations Like MPEDA, APEDA
6 12 3 14 9 1 - -

© COPYRIGHT 2014 386
AFFILIATION OR MEMBER OF
All Figs in % All Respondents
States
• 81% cold stores in Rajasthan and 75% in WB are members of Cold Storage Association. • 71% CS’s in Karnataka are not affiliated to any association.
All (n=5003)
Jharkhand (n=19)
Karnataka (n=188)
Kerala (n=143)
MP (n=156)
Nagaland (n=1)
Orissa (n=38)
Pondicherry (n=2)
Punjab (n=402)
Cold Storage Association 55 26 10 2 64 - 34 - 13
Farmer Producer Organization
3 11 6 1 1 - - - 23
Society or Cooperative 2 - 14 1 3 - 13 - 1
Part of APMC (Mandi) 1 - 3 - - 100 3 - 1
NCCD (National Centre for Cold-chain Development)
1 5 1 - - - - - -
None 33 53 71 27 29 - 34 100 62
Export Associations Like MPEDA, APEDA
6 5 1 70 4 - 16 - 2
All (n=5003)
Rajasthan (n=104)
Sikkim (n=5)
TN (n=102)
Tripura (n=9)
Uttaranchal (n=12)
WB (n=464)
North East (n=37)
Cold Storage Association 55 81 - 44 22 - 75 27
Farmer Producer Organization
3 - - 3 - - 1 3
Society or Cooperative 2 2 40 2 - - 5 8
Part of APMC (Mandi) 1 - - - - - 0 5
NCCD (National Centre for Cold-chain Development)
1 1 - 1 - - 2 -
None 33 15 60 33 78 67 17 57
Export Associations Like MPEDA, APEDA
6 1 - 19 - 33 2 3

© COPYRIGHT 2014
ANNEXURE

© COPYRIGHT 2014 388
ALL INDIA SUMMARY STATUS
Cold Storage All India
Maharashtra
Mean Storage Capacity in MT
Mean Cooling capacity (in KW)
1706.1
534.4
UP
6558.7
291.0
MP 5447.6
83.7
AP
Karnataka 274.6
20.2
Assam
Bihar
Chandigarh
Chhattisgarh
Delhi
Goa
Gujarat
Haryana
HP
J & K
3929
113.0
7790.9
465.5
5329.7
245.4
7610.0
12.0
5698.6
169.4
1168.3
78.2
3706
409.6
2401
159.0
1195.8
98.9
2226.3
48.7
Jharkhand
4136.8
129.1
1439.6
125.9
1544.3
68.8
Nagaland
-
-
Orissa
3094.8
136.2
Punjab
3384.5
114.3
Rajasthan
3482
173.0
Sikkim
1007.5
-
Tamil nadu
2068.3
144.4
Tripura
4511.8
116.9
Uttaranchal
5777.6
171.8
West Bengal
11113.2
293.7
2969.1
130.5
Pondicherry 10.0 26.7

© COPYRIGHT 2014 389
ALL INDIA SUMMARY
• This survey indicates that total usable capacity of cold stores in All India is 26.85 Million MT.
India Cold Storage Details
Number of Operating Cold Stores 5367
Storage Capacity in Million Metric Tonnes 26.85
Capacity Utilization percentage 75%
Total Man power (on rolls) 109540
Cold Stores reporting continued interest for skill development 76%
Average Age of Cold Stores 15 years
Temperature Zone in cold storage
Mild Chill (Greater than 10 °C) 4%
Chill (0 to 10 °C) 72%
Frozen (Less than -18°C) 8%
DK / CS 16%
Product type stored in the cold storage
Type H (Horticulture / Agriculture) 87%
Type P (Processed Food) 10%
Type M (Animal Husbandry) 9%
Type Q (Pharmaceutical) 1%
Type O (Other products) 1%

© COPYRIGHT 2014 390
STATE – ANDAMAN& NICOBAR
• This survey indicates that total usable capacity of cold stores in Andaman is 3020 MT.
State Cold Storage Details
Number of Operating Cold Stores 11
Storage Capacity in Metric Tonnes 3020
Capacity Utilization percentage 70%
Total Man power (on rolls) 221
Cold Stores reporting continued interest for skill development 90%
Average Age of Cold Stores 17Yyears
Temperature Zone in cold storage
Mild Chill (Greater than 10 °C) 24%
Chill (0 to 10 °C) 12%
Frozen (Less than -18°C) 41%
DK / CS 24%
Product type stored in the cold storage
Type H (Horticulture / Agriculture) 20%
Type P (Processed Food) -
Type M (Animal Husbandry) 90%
Type Q (Pharmaceutical) -
Type O (Other products) -

© COPYRIGHT 2014 391
STATE – ANDHRA PRADESH
• This survey indicates that total usable capacity of cold stores in Andhra Pradesh is 25,33,966 MT.
State Cold Storage Details
Number of Operating Cold Stores 645
Storage Capacity in Metric Tonnes 2533966
Capacity Utilization percentage 77%
Total Man power (on rolls) 11378
Cold Stores reporting continued interest for skill development 59%
Average Age of Cold Stores 8 years
Temperature Zone in cold storage
Mild Chill (Greater than 10 °C) 12%
Chill (0 to 10 °C) 29%
Frozen (Less than -18°C) 9%
DK / CS 51%
Product type stored in the cold storage
Type H (Horticulture / Agriculture) 89%
Type P (Processed Food) 10%
Type M (Animal Husbandry) 6%
Type Q (Pharmaceutical) 0%
Type O (Other products) 1%

© COPYRIGHT 2014 392
STATE – ASSAM
• This survey indicates that total usable capacity of cold stores in Assam is 186984 MT.
State Cold Storage Details
Number of Operating Cold Stores 24
Storage Capacity in Metric Tonnes 186984
Capacity Utilization percentage 65%
Total Man power (on rolls) 310
Cold Stores reporting continued interest for skill development 86%
Average Age of Cold Stores 9 years
Temperature Zone in cold storage
Mild Chill (Greater than 10 °C) -
Chill (0 to 10 °C) 89%
Frozen (Less than -18°C) 4%
DK / CS 7%
Product type stored in the cold storage
Type H (Horticulture / Agriculture) 91%
Type P (Processed Food) 9%
Type M (Animal Husbandry) -
Type Q (Pharmaceutical) -
Type O (Other products) -

© COPYRIGHT 2014 393
STATE – BIHAR
• This survey indicates that total usable capacity of cold stores in Bihar 9,06,054 MT.
State Cold Storage Details
Number of Operating Cold Stores 170
Storage Capacity in Metric Tonnes 906054
Capacity Utilization percentage 69%
Total Man power (on rolls) 1761
Cold Stores reporting continued interest for skill development 88%
Average Age of Cold Stores 17years
Temperature Zone in cold storage
Mild Chill (Greater than 10 °C) 2%
Chill (0 to 10 °C) 88%
Frozen (Less than -18°C) -
DK / CS 10%
Product type stored in the cold storage
Type H (Horticulture / Agriculture) 91%
Type P (Processed Food) 15%
Type M (Animal Husbandry) 5%
Type Q (Pharmaceutical) 1%
Type O (Other products) -

© COPYRIGHT 2014 394
STATE – CHANDIGARH
• This survey indicates that total usable capacity of cold stores in Chandigarh 38050 MT.
State Cold Storage Details
Number of Operating Cold Stores 5
Storage Capacity in Metric Tonnes 38050
Capacity Utilization percentage 92%
Total Man power (on rolls) 38
Cold Stores reporting continued interest for skill development 100%
Average Age of Cold Stores 18years
Temperature Zone in cold storage
Mild Chill (Greater than 10 °C) -
Chill (0 to 10 °C) 67%
Frozen (Less than -18°C) 33%
DK / CS -
Product type stored in the cold storage
Type H (Horticulture / Agriculture) 100%
Type P (Processed Food) 33%
Type M (Animal Husbandry) 33%
Type Q (Pharmaceutical) -
Type O (Other products) -

© COPYRIGHT 2014 395
STATE – CHHATTISGARH
• This survey indicates that total usable capacity of cold stores in Chhattisgarh 4,67,288 MT.
State Cold Storage Details
Number of Operating Cold Stores 82
Storage Capacity in Metric Tonnes 467288
Capacity Utilization percentage 76%
Total Man power (on rolls) 762
Cold Stores reporting continued interest for skill development 87%
Average Age of Cold Stores 14years
Temperature Zone in cold storage
Mild Chill (Greater than 10 °C) 5%
Chill (0 to 10 °C) 70%
Frozen (Less than -18°C) 9%
DK / CS 15%
Product type stored in the cold storage
Type H (Horticulture / Agriculture) 93%
Type P (Processed Food) 24%
Type M (Animal Husbandry) 4%
Type Q (Pharmaceutical) 7%
Type O (Other products) 1%

© COPYRIGHT 2014 396
STATE – DELHI
• This survey indicates that total usable capacity of cold stores in Delhi 1,33,611 MT.
State Cold Storage Details
Number of Operating Cold Stores 45
Storage Capacity in Metric Tonnes 133611
Capacity Utilization percentage 80%
Total Man power (on rolls) 1525
Cold Stores reporting continued interest for skill development 66%
Average Age of Cold Stores 27years
Temperature Zone in cold storage
Mild Chill (Greater than 10 °C) 18%
Chill (0 to 10 °C) 36%
Frozen (Less than -18°C) 24%
DK / CS 22%
Product type stored in the cold storage
Type H (Horticulture / Agriculture) 83%
Type P (Processed Food) 29%
Type M (Animal Husbandry) 9%
Type Q (Pharmaceutical) 9%
Type O (Other products) -

© COPYRIGHT 2014 397
STATE – GOA
• This survey indicates that total usable capacity of cold stores in Goa 18693.
State Cold Storage Details
Number of Operating Cold Stores 16
Storage Capacity in Metric Tonnes 18693
Capacity Utilization percentage 90%
Total Man power (on rolls) 997
Cold Stores reporting continued interest for skill development 71%
Average Age of Cold Stores 15years
Temperature Zone in cold storage
Mild Chill (Greater than 10 °C) -
Chill (0 to 10 °C) 14%
Frozen (Less than -18°C) 36%
DK / CS 50%
Product type stored in the cold storage
Type H (Horticulture / Agriculture) 29%
Type P (Processed Food) 43%
Type M (Animal Husbandry) 57%
Type Q (Pharmaceutical) -
Type O (Other products) -

© COPYRIGHT 2014 398
STATE – GUJARAT
• This survey indicates that total usable capacity of cold stores in Gujarat 16,00,906 MT.
State Cold Storage Details
Number of Operating Cold Stores 432
Storage Capacity in Metric Tonnes 1600906
Capacity Utilization percentage 62%
Total Man power (on rolls) 18343
Cold Stores reporting continued interest for skill development 87%
Average Age of Cold Stores 12y ears
Temperature Zone in cold storage
Mild Chill (Greater than 10 °C) 2%
Chill (0 to 10 °C) 64%
Frozen (Less than -18°C) 18%
DK / CS 16%
Product type stored in the cold storage
Type H (Horticulture / Agriculture) 68%
Type P (Processed Food) 10%
Type M (Animal Husbandry) 25%
Type Q (Pharmaceutical) 0%
Type O (Other products) 0%

© COPYRIGHT 2014 399
STATE – HARYANA
• This survey indicates that total usable capacity of cold stores in Haryana 4,94,538 MT.
State Cold Storage Details
Number of Operating Cold Stores 206
Storage Capacity in Metric Tonnes 494538
Capacity Utilization percentage 71%
Total Man power (on rolls) 1294
Cold Stores reporting continued interest for skill development 77%
Average Age of Cold Stores 18 years
Temperature Zone in cold storage
Mild Chill (Greater than 10 °C) 10%
Chill (0 to 10 °C) 68%
Frozen (Less than -18°C) 8%
DK / CS 14%
Product type stored in the cold storage
Type H (Horticulture / Agriculture) 99%
Type P (Processed Food) 4%
Type M (Animal Husbandry) 2%
Type Q (Pharmaceutical) 1%
Type O (Other products) -
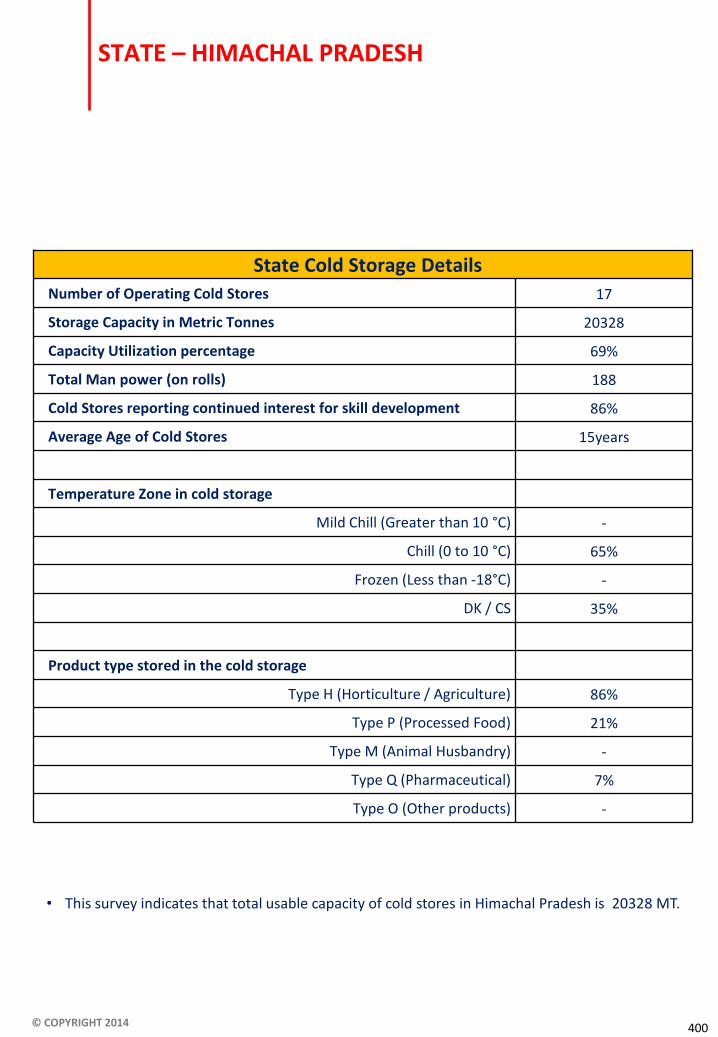
© COPYRIGHT 2014 400
STATE – HIMACHAL PRADESH
• This survey indicates that total usable capacity of cold stores in Himachal Pradesh is 20328 MT.
State Cold Storage Details
Number of Operating Cold Stores 17
Storage Capacity in Metric Tonnes 20328
Capacity Utilization percentage 69%
Total Man power (on rolls) 188
Cold Stores reporting continued interest for skill development 86%
Average Age of Cold Stores 15years
Temperature Zone in cold storage
Mild Chill (Greater than 10 °C) -
Chill (0 to 10 °C) 65%
Frozen (Less than -18°C) -
DK / CS 35%
Product type stored in the cold storage
Type H (Horticulture / Agriculture) 86%
Type P (Processed Food) 21%
Type M (Animal Husbandry) -
Type Q (Pharmaceutical) 7%
Type O (Other products) -

© COPYRIGHT 2014 401
STATE – JAMMU & KASHMIR
• This survey indicates that total usable capacity of cold stores in Jammu & Kashmir is 40,073 MT.
State Cold Storage Details
Number of Operating Cold Stores 18
Storage Capacity in Metric Tonnes 40073
Capacity Utilization percentage 62%
Total Man power (on rolls) 279
Cold Stores reporting continued interest for skill development 94%
Average Age of Cold Stores 23years
Temperature Zone in cold storage
Mild Chill (Greater than 10 °C) 2%
Chill (0 to 10 °C) 40%
Frozen (Less than -18°C) -
DK / CS 58%
Product type stored in the cold storage
Type H (Horticulture / Agriculture) 56%
Type P (Processed Food) 13%
Type M (Animal Husbandry) -
Type Q (Pharmaceutical) 6%
Type O (Other products) 6%

© COPYRIGHT 2014 402
STATE – JHARKHAND
• This survey indicates that total usable capacity of cold stores in Jharkhand is 82,736 MT.
State Cold Storage Details
Number of Operating Cold Stores 20
Storage Capacity in Metric Tonnes 82736
Capacity Utilization percentage 65%
Total Man power (on rolls) 221
Cold Stores reporting continued interest for skill development 84%
Average Age of Cold Stores 18years
Temperature Zone in cold storage
Mild Chill (Greater than 10 °C) -
Chill (0 to 10 °C) 100%
Frozen (Less than -18°C) -
DK / CS -
Product type stored in the cold storage
Type H (Horticulture / Agriculture) 100%
Type P (Processed Food) 37%
Type M (Animal Husbandry) 5%
Type Q (Pharmaceutical) -
Type O (Other products) -

© COPYRIGHT 2014 403
STATE – KARNATAKA
• This survey indicates that total usable capacity of cold stores in Karnataka is 2,95,114 MT.
State Cold Storage Details
Number of Operating Cold Stores 205
Storage Capacity in Metric Tonnes 295114
Capacity Utilization percentage 70%
Total Man power (on rolls) 4574
Cold Stores reporting continued interest for skill development 77%
Average Age of Cold Stores 9years
Temperature Zone in cold storage
Mild Chill (Greater than 10 °C) 13%
Chill (0 to 10 °C) 35%
Frozen (Less than -18°C) 13%
DK / CS 39%
Product type stored in the cold storage
Type H (Horticulture / Agriculture) 66%
Type P (Processed Food) 24%
Type M (Animal Husbandry) 7%
Type Q (Pharmaceutical) 1%
Type O (Other products) 2%

© COPYRIGHT 2014 404
STATE – KERALA
• This survey indicates that total usable capacity of cold stores in Kerala is 243996 MT.
State Cold Storage Details
Number of Operating Cold Stores 158
Storage Capacity in Metric Tonnes 243996
Capacity Utilization percentage 76%
Total Man power (on rolls) 7309
Cold Stores reporting continued interest for skill development 91%
Average Age of Cold Stores 15years
Temperature Zone in cold storage
Mild Chill (Greater than 10 °C) -
Chill (0 to 10 °C) 13%
Frozen (Less than -18°C) 68%
DK / CS 18%
Product type stored in the cold storage
Type H (Horticulture / Agriculture) 7%
Type P (Processed Food) 13%
Type M (Animal Husbandry) 86%
Type Q (Pharmaceutical) 1%
Type O (Other products) 2%

© COPYRIGHT 2014 405
STATE – MADHYA PRADESH
• This survey indicates that total usable capacity of cold stores in Madhya Pradesh is 8,93411MT.
State Cold Storage Details
Number of Operating Cold Stores 164
Storage Capacity in Metric Tonnes 893411
Capacity Utilization percentage 83%
Total Man power (on rolls) 1148
Cold Stores reporting continued interest for skill development 83%
Average Age of Cold Stores 17years
Temperature Zone in cold storage
Mild Chill (Greater than 10 °C) 4%
Chill (0 to 10 °C) 85%
Frozen (Less than -18°C) 1%
DK / CS 10%
Product type stored in the cold storage
Type H (Horticulture / Agriculture) 95%
Type P (Processed Food) 8%
Type M (Animal Husbandry) 1%
Type Q (Pharmaceutical) 1%
Type O (Other products) -

© COPYRIGHT 2014 406
STATE – MAHARASHTRA
• This survey indicates that total usable capacity of cold stores in Maharashtra is 907645 MT.
State Cold Storage Details
Number of Operating Cold Stores 532
Storage Capacity in Metric Tonnes 907645
Capacity Utilization percentage 74%
Total Man power (on rolls) 28148
Cold Stores reporting continued interest for skill development 86%
Average Age of Cold Stores 14years
Temperature Zone in cold storage
Mild Chill (Greater than 10 °C) 3%
Chill (0 to 10 °C) 58%
Frozen (Less than -18°C) 15%
DK / CS 25%
Product type stored in the cold storage
Type H (Horticulture / Agriculture) 76%
Type P (Processed Food) 27%
Type M (Animal Husbandry) 14%
Type Q (Pharmaceutical) 2%
Type O (Other products) 1%

© COPYRIGHT 2014 407
STATE – ORISSA
• This survey indicates that total usable capacity of cold stores in Orissa is 1,39,264 MT.
State Cold Storage Details
Number of Operating Cold Stores 45
Storage Capacity in Metric Tonnes 139264
Capacity Utilization percentage 69%
Total Man power (on rolls) 861
Cold Stores reporting continued interest for skill development 87%
Average Age of Cold Stores 16years
Temperature Zone in cold storage
Mild Chill (Greater than 10 °C) 1%
Chill (0 to 10 °C) 47%
Frozen (Less than -18°C) 22%
DK / CS 29%
Product type stored in the cold storage
Type H (Horticulture / Agriculture) 63%
Type P (Processed Food) 5%
Type M (Animal Husbandry) 29%
Type Q (Pharmaceutical) 3%
Type O (Other products) 11%

© COPYRIGHT 2014 408
STATE – PONDICHERRY
• This survey indicates that total usable capacity of cold stores in Pondicherry is 90 MT.
State Cold Storage Details
Number of Operating Cold Stores 9
Storage Capacity in Metric Tonnes 90
Capacity Utilization percentage 80%
Total Man power (on rolls) 2151
Cold Stores reporting continued interest for skill development 100%
Average Age of Cold Stores 25years
Temperature Zone in cold storage
Mild Chill (Greater than 10 °C) -
Chill (0 to 10 °C) 100%
Frozen (Less than -18°C) -
DK / CS -
Product type stored in the cold storage
Type H (Horticulture / Agriculture) 50%
Type P (Processed Food) 50%
Type M (Animal Husbandry) -
Type Q (Pharmaceutical) -
Type O (Other products) -

© COPYRIGHT 2014 409
STATE – PUNJAB
• This survey indicates that total usable capacity of cold stores in Punjab is 14,38,404 MT.
State Cold Storage Details
Number of Operating Cold Stores 425
Storage Capacity in Metric Tonnes 1438404
Capacity Utilization percentage 68%
Total Man power (on rolls) 2384
Cold Stores reporting continued interest for skill development 65%
Average Age of Cold Stores 17years
Temperature Zone in cold storage
Mild Chill (Greater than 10 °C) 1%
Chill (0 to 10 °C) 96%
Frozen (Less than -18°C) 1%
DK / CS 1%
Product type stored in the cold storage
Type H (Horticulture / Agriculture) 95%
Type P (Processed Food) 4%
Type M (Animal Husbandry) -
Type Q (Pharmaceutical) -
Type O (Other products) 1%

© COPYRIGHT 2014 410
STATE – UTTARANCHAL
• This survey indicates that total usable capacity of cold stores in Uttaranchal is 80886MT.
State Cold Storage Details
Number of Operating Cold Stores 14
Storage Capacity in Metric Tonnes 80886
Capacity Utilization percentage 56
Total Man power (on rolls) 105
Cold Stores reporting continued interest for skill development 50
Average Age of Cold Stores 17
Temperature Zone in cold storage
Mild Chill (Greater than 10 °C) 6%
Chill (0 to 10 °C) 88%
Frozen (Less than -18°C) -
DK / CS 6%
Product type stored in the cold storage
Type H (Horticulture / Agriculture) 100%
Type P (Processed Food) 17%
Type M (Animal Husbandry) -
Type Q (Pharmaceutical)
Type O (Other products) -

© COPYRIGHT 2014 411
STATE – UTTAR PRADESH
• This survey indicates that total usable capacity of cold stores in Uttar Pradesh is 90,83,758 MT.
State Cold Storage Details
Number of Operating Cold Stores 1385
Storage Capacity in Metric Tonnes 9083758
Capacity Utilization percentage 78%
Total Man power (on rolls) 15166
Cold Stores reporting continued interest for skill development 77%
Average Age of Cold Stores 16
Temperature Zone in cold storage
Mild Chill (Greater than 10 °C) 1%
Chill (0 to 10 °C) 97%
Frozen (Less than -18°C) 0
DK / CS 1%
Product type stored in the cold storage
Type H (Horticulture / Agriculture) 99%
Type P (Processed Food) 4%
Type M (Animal Husbandry) 1%
Type Q (Pharmaceutical) 0
Type O (Other products) -

© COPYRIGHT 2014 412
STATE – WEST BENGAL
• This survey indicates that total usable capacity of cold stores in West Bengal is 5534394 MT.
State Cold Storage Details
Number of Operating Cold Stores 498
Storage Capacity in Metric Tonnes 5534394
Capacity Utilization percentage 83%
Total Man power (on rolls) 7619
Cold Stores reporting continued interest for skill development 67%
Average Age of Cold Stores 20
Temperature Zone in cold storage
Mild Chill (Greater than 10 °C) 1%
Chill (0 to 10 °C) 94%
Frozen (Less than -18°C) 3%
DK / CS 3%
Product type stored in the cold storage
Type H (Horticulture / Agriculture) 98%
Type P (Processed Food) 6%
Type M (Animal Husbandry) 7%
Type Q (Pharmaceutical) 1%
Type O (Other products) -

© COPYRIGHT 2014 413
• This survey indicates that total usable capacity of cold stores in Tamil Nadu is 237857 MT.
State Cold Storage Details
Number of Operating Cold Stores 115
Storage Capacity in Metric Tonnes 237857
Capacity Utilization percentage 77%
Total Man power (on rolls) 6640
Cold Stores reporting continued interest for skill development 93%
Average Age of Cold Stores 13
Temperature Zone in cold storage
Mild Chill (Greater than 10 °C) 7%
Chill (0 to 10 °C) 44%
Frozen (Less than -18°C) 26%
DK / CS 23%
Product type stored in the cold storage
Type H (Horticulture / Agriculture) 63%
Type P (Processed Food) 25%
Type M (Animal Husbandry) 26%
Type Q (Pharmaceutical) 6%
Type O (Other products) -
STATE – TAMIL NADU
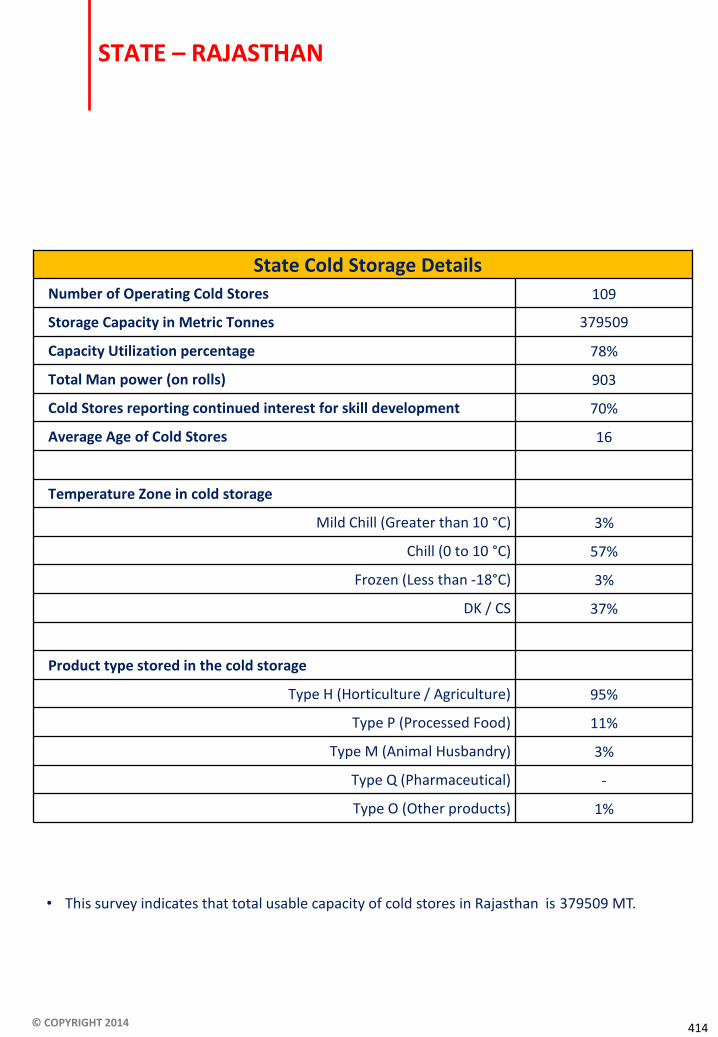
© COPYRIGHT 2014 414
• This survey indicates that total usable capacity of cold stores in Rajasthan is 379509 MT.
State Cold Storage Details
Number of Operating Cold Stores 109
Storage Capacity in Metric Tonnes 379509
Capacity Utilization percentage 78%
Total Man power (on rolls) 903
Cold Stores reporting continued interest for skill development 70%
Average Age of Cold Stores 16
Temperature Zone in cold storage
Mild Chill (Greater than 10 °C) 3%
Chill (0 to 10 °C) 57%
Frozen (Less than -18°C) 3%
DK / CS 37%
Product type stored in the cold storage
Type H (Horticulture / Agriculture) 95%
Type P (Processed Food) 11%
Type M (Animal Husbandry) 3%
Type Q (Pharmaceutical) -
Type O (Other products) 1%
STATE – RAJASTHAN

© COPYRIGHT 2014 415
• This survey indicates that total usable capacity of cold stores in other NE states is MT.
State Cold Storage Details
Number of Operating Cold Stores 17
Storage Capacity in Metric Tonnes 65869
Capacity Utilization percentage 53%
Total Man power (on rolls) 80
Cold Stores reporting continued interest for skill development 87%
Average Age of Cold Stores 11
Temperature Zone in cold storage
Mild Chill (Greater than 10 °C) 2%
Chill (0 to 10 °C) 93%
Frozen (Less than -18°C) -
DK / CS 5%
Product type stored in the cold storage
Type H (Horticulture / Agriculture) 100%
Type P (Processed Food) 7%
Type M (Animal Husbandry) -
Type Q (Pharmaceutical) -
Type O (Other products) -
STATE – OTHER NORTH EASTERN STATES

© COPYRIGHT 2014 416
6 DEFINITIONS & DESCRIPTIONS
Item Description
AMC Annual Maintenance Contract. System where the vendor / supplier agree
to maintain the equipments installed by periodic checkups & replace
parts whenever needed. Can be signed with many vendors for different
equipments
APMC Agricultural Produce Market Committee Act. Except for 7 states, all
others have APMC to regulate sales and levy taxes on agri-produce.
Automatic
Controller
Automatic control is the application of control theory for regulation of
operating machines without direct human intervention. These controllers
are linked to sensors to regulate energy usage and running hours
depending on various trigger points (temperature, CO², Humidity,
product stored, etc).
Alternate Power
sources
Biomass Solar
PhotoVoltaic Solar Thermal Wind Energy
Used by the facility over and above grid & DG set power
o Biogas, also known as ‘Gobar gas’ o Biomass, agri-waste fueled electric turbines, boilers. o Capture the Sun’s energy thru PV cells & generate electricity o Capture the Sun’s energy into heat absorbing medium. Captured heat
is applied directly or used to produce power. o Harness the energy of wind thru windmills & produce power
Bar code/Coding An optical machine-readable representation of data, showing data about
the object to which it attaches. Can be used for traceability
Bins stacking
system
Plastic / wooden bins to store the produce. These are stackable (one on
top of other). No half floors for storage are thereby needed.
Blast Freezer A special freezer room in which very cold air circulated by blowers is used
for rapid freezing of produce like fish, meat, ice cream (< -18 °C
products). In fresh farm produce, this is called pre-cooler(for chilled, mild
chilled range).

© COPYRIGHT 2014 417
6 DEFINITIONS & DESCRIPTIONS
Item Description
BTU British Thermal Unit, a unit to measure energy. BTU is often used as
measure of power (as BTU/h) in heating and air conditioning industries
(12000BTU/h = 1 ton cooling = 3.517 kilowatts)
Bunker Coil
(open tube)
Open Pipes (single or layered) are used as the prime medium of heat
exchange – these are metal surface tubes with no additional fins. Usually
suspended from ceiling with normal ceiling fans and occupy entire top
floor of cooling chamber.
CA Store Controlled Atmosphere cold store – a special category cold store where
the chambers are sealed airtight & oxygen level controlled at very low
level. Besides cooling, special CA equipment is also installed. Used in
India mainly for long term storage of Apples.

© COPYRIGHT 2014 418
6 DEFINITIONS & DESCRIPTIONS
Item Description
Compressors The heart or "pump" within an air conditioning system. Various types are
used to compress refrigerant gas. The onsite engineer shall advise you on
what type of compressors are in use.
Reciprocating, Rotary, Screw, Centrifugal(mechanical compression of
gases and depend on electricity as motive power).
Absorption type: very rare and creates compression like pressure by
heating the refrigerant gas or other chemical process. Depends on solar
thermal or other heating source for energy.
Cargo Material
Handling
equipments
Conveyor belt FLT / CBT Hand Pallet Cargo lift / VRC Chain Lift
EquipmenWesternts used for easy handling, loading / unloading &
moving of various items
o Long moving belt carrying items on top of them. o Fork Lift or Counter Balance Truck (Diesel or Battery powered)
o Closed loop lift with repeating platforms usually used to move bagged cargo to upper floors.
Direct Expansion
System
Wherein the compressed refrigeration undergoes volume expansion
through an orifice or expansion valve, creating a cooling effect. Eg-
deodorant aerosol spray. Is used in all domestic air conditioners, fridges,
etc.

© COPYRIGHT 2014 419
6 DEFINITIONS & DESCRIPTIONS
Item Description
Data Logger Portable instruments used to record temperature and humidity duringthe
transport & storage period.
DG Set Diesel Generating set for alternate power. Capacity measured in KVA or
KW, each cold store must have at least one.
Evaporator Indoor Unit where cooling process or heat exchange takes place.
Fire Detection &
Fighting System
Smoke detectors
Heat sensors Hose / Hydrant Extinguishers Sprinkler Gas based Sand box /
bucket
Devices for detection of smoke & heat
Pic. of a smoke detector
Heat Recovery Used in ventilation systems to recover energy from vented air.
kVA Kilo Volt Ampere used to measure source power like for DG sets or grid
power (kVA x power Factor = kW)
kW Kilo Watt to measure electrical load (100KVA = 80 KW, output is 80% of
electric input)
Indoor Unit
Evaporator types
Open tube Finned tube Plate Diffuser
The indoor cooling unit (usually suspended from ceiling or wall) where
the cooling effect takes place, usually installed with inbuilt fans. Modern
systems are tubes with fins (like in home AC), older types are open tube
(bunker coil type). For cooling fluids like milk a cold plate is used as
primary heat exchange. Diffuser types use ducts to throw cool air across
floors.
NCCD National Centre for Cold chain Development. A Govt. of India
organization under the Ministry of Agriculture. Incorporated by sanction
of cabinet in Feb 2012 as a think tank for cold-chain.
Pack House A working area for accumulating, sorting, washing, grading of agricultural
produce. Can have a staging cold room with pre-coolers.

© COPYRIGHT 2014 420
6 DEFINITIONS & DESCRIPTIONS
Item Description
PEB Pre-Engineered Building. Metal frame with pre-fab paneled walls.
PUF Panel Poly Urethane Foam Panel; for insulation of modern cold rooms.
Pre-Cooler A special chamber where the warm fresh produce (fruits, vegetables,
items above 0 °C) is rapidly cooled down (within hours) to prepare for
transport or storage (Blast freezer for frozen items). Usual cooling ranges
are 4, 7, 10, 15 °C.
RCC Reinforced Cement Concrete, used to segregate floors in old stores.
Refrigerant Gas
Ammonia Freon CO2
A gas that produces cooling (heat absorbing)effect while expanding or
vaporizing. Different types of gas used in compression based technology.
Ammonia is most common in industrial refrigeration. Freon (CFC) is
common primarily in domestic refrigeration. Record type of refrigerant in
use as informed by engineer.
Ripening Chamber A chamber or room in which unripened / green fruits are ripened in a
controlled process. Mostly used for green bananas, mangoes, papaya.
RFID Radio-frequency identification (RFID) -a technology that uses radio waves
to transfer data from an electronic tag, called RFID tag / label, attached to
an object, through a reader for the purpose of identifying and tracking
the object.
Racking system A storage system made of metal and designed to over-stack boxes or
pallets of cargo. This allows for vertical space utilization and hence
improved capacity utilization. Goods are placed on each shelf space
(rack). Usually such stores are single floor but very tall.
Steel mezzanine
platform
A half floor (not made of concrete) on which people can walk. Unlike
metal racking which is a like a large shelf or rack system.

© COPYRIGHT 2014 421
6 DEFINITIONS & DESCRIPTIONS
Item Description
Secondary Cooling
system
Where the primary expansion based cooling is used to cool a second
medium (usually brine water or air), which in turn is circulated to give
cooling effect in the target area.
In normal home AC’s you witness primary cooling system as the primary
evaporator (or cooling unit) is inside the space to be cooled indoor unit.
But in large hotels and shopping malls, the primary cooling unit is outside,
where it first is used to cool the air. This cold air is blown through AC
ducts to individual rooms or the target areas – this is example of
secondary cooling system. In commercial refrigeration systems, high
density fluid (brine water) is first cooled and this is circulated through
pipes inside the chamber to perform the cooling in the chambers
(secondary cooling).
Sorting / Grading Sorting and grading for fresh agri produce. Can be done manually or by
using specialized equipment& technology (conveyor belts, optical
graders, size matching, etc).
Sensors /
Instruments
Temperature Humidity CO2
Special sensing instruments to automatically check the room
temperature, moisture level and carbon dioxide level in the air. Is used by
many modern cold storages.
Ventilation Fresh produce needs oxygen to survive. Vents to refresh air are provided,
these can be manual or automated (automatic controller)
Wooden mezzanine
platform
Half height floor, similar as steel mezzanine except that wood planks are
used to make each floor instead of steel.
• Above is indicative information on the type of technology aspects in cold stores and in relation to the scope and limitations of this baseline survey.

© COPYRIGHT 2014 422
ACKNOWLEDGEMENTS
We sincerely thank representatives of all cold storage facilities, the companies, industry associations, independent bodies and advisors, who provided their inputs, on the basis of which this report has been prepared. While some cold storage owners were reticent to participate in this information gathering exercise, the enthusiasm and participation of many others was very invigorating.
Our sincere thanks go to Shri Anup K. Thakur (Special Secretary, DAC), Shri Sanjeev Chopra (Joint Secretary, DAC) and Shri R. K. Tiwari (Managing Director, NHB) for motivating the team and constant support for this first ever primary baseline study. The task was enormous, the timelines minimal and the result was possible due to the backing provided by these senior officers.
The final outcome of this project required coordination and assistance from many people. We express our sincere gratitude to Dr. R.K Sharma for his time and communication in supporting this study. His keen enthusiasm and guidance helped us reach this milestone.
We express deepest thanks to Mr. Pawanexh Kohli and Mr. Sugato Chandra for knowledge sharing and taking part in insightful discussions and providing advice and training basis which the project and report was designed and executed.

© COPYRIGHT 2014 423
GOODS STORED BY EACH COLD STORAGE TYPE
List of Type H (Horticulture / Agriculture) goods stored:
Sr. No. Type H (Horticulture /
Agriculture)goods stored
1 Potato (raw)
2 Spices
3 Apple
4 Grapes
5 Oranges
6 Banana
7 Pulses
8 Seeds
9 Carrot
10 Mango
11 Flowers
12 Onion
13 Peas
14 Litchi
15 Pomegranate
16 Kiwi
17 Cabbage
18 Pineapple
19 Guava
20 Cauliflower
21 Chillies
22 Tamarind
23 Kirana products
24 Dry Fruits
25 Garlic
26 Turmeric
27 Dates (fruit)
28 Mahua (fruit)
29 Amchur (fruit)

© COPYRIGHT 2014 424
GOODS STORED BY EACH COLD STORAGE TYPE
List of Type P (Processed foods) goods stored:
Sr. No. Type P (Processed food)
goods stored
1 Butter
2 Potato Processed
3 Milk
4 Cheese
5 Fruit Pulp
6 Chocolate
7 Ready to eat / cook
8 Wine
9 Jaggery
10 Ice-cream
11 Curd
12 Milk Products
13 Mango Pulp
14 Fruit Juice
15 Paneer
16 Milk based sweets
List of Type M (Animal Husbandry) goods stored:
Sr. No. Type M (Animal Husbandry)
goods stored
1 Seafood
2 Fresh water fish
3 Poultry
4 Meats (Beef, Lamb, Mutton, Pork)
5 Eggs
6 Shrimp

© COPYRIGHT 2014 425
GOODS STORED BY EACH COLD STORAGE TYPE
List of Type Q (Pharmaceutical) goods stored:
Sr. No. Type Q (Pharmaceutical)
goods stored
1 Vaccine
2 Medicine
3 Active product ingredients
4 Ayurvedic produce
List of Type O (other) goods stored:
Sr. No. Type O (Other) goods stored
1 Cell Batteries
2 Chemicals
3 X-Ray films

© COPYRIGHT 2014
THANK YOU