All about Evolution Change and Innovation - AnnualReports ...
202
All about Evolution Change and Innovation Shinhan Financial Group Annual Report 2015
-
Upload
khangminh22 -
Category
Documents
-
view
2 -
download
0
Transcript of All about Evolution Change and Innovation - AnnualReports ...

All about Evolution Change and InnovationShinhan Financial GroupAnnual Report
2015

-4
-2
0
2
4
6
8
10
0.000000
9.166667
18.333333
27.500000
36.666667
45.833333
55.000000
6
9
12
15
202632384450566268
-4
-2
0
2
4
6
8
10
0.000000
9.166667
18.333333
27.500000
36.666667
45.833333
55.000000
6
9
12
15
202632384450566268
Stock Information
Total
Common Stock Redeemable Preferred Stock474,199,587
485,299,587
11,100,000
Number of Shares Issued As of December 31, 2015
Market Capitalization (Year End)
Share Price
Year End
High
Low
Weighting in the KOSPI (Year End)
Average Daily Trading Volume
Dividend Per Share
Total Dividend Paid
Foreign Share Ownership
2015
₩ 18.8 trillion
₩ 39,550
₩ 46,650
₩ 39,000
1.5%
1.0 million shares
₩ 1,200
₩ 569 billion
67.1%
2014
₩ 21.1 trillion
₩ 44,450
₩ 53,400
₩ 42,000
1.8%
0.9 million shares
₩ 950
₩ 450 billion
67.6%
Stock Performance (Common Stock)
Name of Shareholder
National Pension Service
BNP Paribas
SFG Emplyee Stock Ownership Association
Citibank, N.A. (ADR Dept.)
The Government of Singapore
Saudi Arabian Monetary Agency
Abu Dhabi Investment Authority
Lazard Funds Inc.
Mizuho
National Westminster Bank Asiapacific
Samsung Asset Management
Peoples Bank of China
Others
Total
Number of Shares Owned
43,881,041
25,356,276
21,273,373
13,675,125
11,530,462
7,378,282
6,542,334
6,440,002
5,955,000
5,133,262
4,951,044
4,830,951
317,252,435
474,199,587
Ownership %
9.25%
5.35%
4.49%
2.88%
2.43%
1.56%
1.38%
1.36%
1.26%
1.08%
1.04%
1.02%
66.90%
100.00%
Shareholders Holding Ownership of More than 1% (Common Stock)
- Dividend Payout Ratio▒ Dividend Per Share
Dividend (KRW,%)
2011 2012 2013 2014 2015
1,200
950
650700750
11.514.3
16.2
21.624.0
2015
2014
Foreign
Domestic
Share Ownership (%)

Financial Highlights
Financial Highlights
For the Year (KRW billion)
Operating Income Before Provisioning
Net Income
As of Year End (KRW trillion)
Total Assets
Total Liabilities
Total Equity
2015
4,010.6
2,367.2
370.5
338.7
31.8
2014
3,604.8
2,081.1
338.0
307.5
30.5
Chg %
11.3%
13.7%
9.6%
10.2%
4.2%
Key Financial Ratio
ROA
ROE
Group Net Interest Margin
Cost to Income Ratio
NPL(Substandard and below loans) Ratio
NPL Coverage Ratio
Group BIS Ratio
Group Common Equity Tier1 Ratio
BPS (KRW)
EPS (KRW)
2015
0.69%
8.05%
2.00%
52.7%
0.87%
191%
13.39%
10.77%
61,146
4,789
2014
0.68%
7.46%
2.27%
55.3%
1.15%
168%
13.05%
10.40%
58,076
4,195
Chg %
0.01%p
0.59%p
-0.27%p
-2.6%p
-0.28%p
23%p
0.34%p
0.37%p
5.3%
14.2%
Credit Ratings
Shinhan Bank Long Term
Short Term
Shinhan Card Long Term
Short Term
S&P
A
A-1
A-
A-2
Moody’s
Aa3
P-1
-
-
Fitch
A
F1
A-
F2
Net Income (KRW billion)
2,081.11,898.6
2,367.2
201520142013
338.0311.3
370.5
201520142013
Total Assets (KRW trillion)
0.680.69
0.66
201520142013
ROA (%)
7.467.15
8.05
201520142013
ROE (%)

Contents
SFG Overview012 Key Performance Indicators014 Chairman's Message 018 BOD and Management020 Group Mission 024 Group Vision & Strategy 026 Corporate Governance028 Risk Management 030 Sustainability Management 034 Ethical Management036 Organization 037 Business Portfolio
Review of Operations040 Synergy042 Digital Banking044 Global Business 046 Retail Banking 048 Corporate Banking 050 Wealth Management 052 Investment Banking 054 Credit Card 056 Brokerage 058 Life Insurance 060 Asset Management
Financial Section 064 Management’s Discussion and Analysis081 Independent Auditors’ Report082 Consolidated Financial Statements088 Notes to Financial Statements
Global Networks
Investor Information
Fina
ncia
l Hig
hlig
hts
here

As we move forward, Shinhan Financial Group will embrace the new and pursue innovation to sustain growth in the face of change.
Our mid-term strategic goal is to solidify our presence as the leading financial group in Korea and strengthen our footing in the global markets.
Our efforts toward this goal will commence in 2016 with the implementation of three key initiatives: spearheading advances in digital finance, exploring new growth opportunities in the global markets and reinforcing our risk management system.
Guided by the Group mission of Compassionate Finance, Shinhan upholds a culture of creativity where innovative ideas transpire into action in order to grow together with all of our stakeholders.

InnovationLeading the future of finance through creative innovationThe financial environment is ever changing and customers’ expectations are rising. Shinhan promotes creative innovation to seek new ways to enhance customers’ value and lead the future of finance in the digital era.

GlobalizationPushing the limits and raising the bar in finance We are extending our influence to the global arena and finding solutions with clients worldwide. With distinctive global business strategies, Shinhan is expanding the financial sphere and reaching out to a bigger market.

ConsistencyConsistency is the key to gaining trust and prudent risk management is vital in times of rapid change and high uncertainty. Shinhan delivers stable performance with a consistent growth strategy and advanced risk management.
Spearheading advances in finance by looking ahead

SustainabilityInspiring and sharing hope through finance We are increasing engagement with customers and sharing hope with the wider community to grow hand in hand with society. Compassionate Finance embodies Shinhan’s commitment to realizing a better tomorrow through finance.

- Credit Cost Ratio ▒ Credit Cost
Credit CostThe Group’s credit cost remained stable as a result of our focus on quality loan growth and preemptive risk management.
(KRW billion)
925.7
1,322.4 1,184.2
949.9 1,037.4
2011 2012 2013 2014 2015
0.47% 0.43%
0.67%
0.43%
0.59%
- Group (Shinhan Bank + Shinhan Card) - Shinhan Bank
2011 2012 2013 2014 2015
2.67
2.00
2.502.272.31
1.76
2.221.99
1.741.50
- NPL Ratio
2011 2012 2013 2014 2015
1.25
0.87
1.341.15
1.26
3,100.0
2,320.31,898.6
2,081.12,367.2
2011 2012 2013 2014 2015
Key Performance Indicators
Net IncomeShinhan Financial Group has pushed forward its consistent long-term strategies for sustainable growth since its inception. As a re-sult, the Group realized KRW 2.37 trillion in net income for 2015, registering the highest net profit in the industry for the eighth straight year.
Net Interest MarginAlthough Group’s net interest margin kept contracting mainly due to the BOK’s consecutive base rate cuts, the Group maintained sta-ble interest income on the back of its persistent loan growth efforts accompanied by increased low-cost funding.
Total AssetsThe Group’s total assets have been on the steady rise, reflective of the Group’s sustainable growth strategies and balanced growth in major subsidiaries.
(KRW trillion)
370.5
2,367
Asset Quality The NPL ratios have continued to improve through the industry-leading asset quality management.
Shinhan Financial Group Annual Report 2015 012
Group 2.00%
Shinhan Bank1.50%
(KRW billion)
(%)

111,644 111,684105,973
103,472100,057
2011 2012 2013 2014 2015
99 93102
123141
2011 2012 2013 2014 2015
3.5%
6.7%
4.5%
6.2%5.9%
2011 2012 2013 2014 2015
820
2,573
4,2044,475
6,774
8,608
10,027
1,984
▒ No. of Customers Enrolled in Smart Phone Banking
▒ No. of Customers Enrolled in Shinhan App. Card
- BIS Ratio - Tier1 Ratio - Common Tier1 Ratio
2011 2012 2013 2014 2015
11.41
13.3912.46 13.0513.43
11.29
8.859.51
11.15 11.41
10.7710.4010.03
Dividend Shinhan Financial Group has implemented a proactive and flexible capital policy as part of its continued endeavor to enhance share-holder value. The Group’s payout ratio, which has been rising since 2011, reached a record high 24% for the year 2015.
Global BusinessShinhan Financial Group has been seeking future growth opportu-nities through a strategic business expansion into the global mar-ket with a special focus on Asia. In order to maintain the growth momentum, our banking and non-banking subsidiaries has jointly entered into the target markets actively pursuing synergy creation.
Digital Banking Shinhan Financial Group has been proactively offering its custom-ers convenient and safe financial services through its mobile plat-form in order to address their rising expectations and provide dif-ferentiated customer experiences.
Greenhouse Gas EmissionsShinhan Financial Group has continued to reduce its greenhouse gas emissions by controlling indoor temperatures and improving air-conditioning facilities.
Capital Adequacy The Group’s common equity tier 1 ratio marked a competitive level of 10.77% as of the end of 2015 on the back of stable net income flows and sound asset growth.
Payout ratio 24%
Dividend per share1,200 KRW
- Net Income Contribution by Global Business
▒ Net Income of Global Business
SFG Overview 013Key Performance Indicators
(%)
(Persons in thousand)
(USD million)
(tCO2eq)

Dear shareholders,
The global economy was shrouded in uncertainty last year amid the challenges posed by slowing growth in China, interest rate hike in the US, and sharp decline in raw material prices.
The outlook was also cloudy in Korea as exports continued to decrease and eco-nomic growth was further undermined by sagging consumption.
Even in this demanding environment, Shinhan Financial Group was able to deliver outstanding results through healthy asset growth and effective risk management based on our balanced business portfolio.
Consistent performance despite internal and external challenges
Our banking units fulfilled their role as the main pillar of the Group, posting KRW 1.50 trillion in net income despite margin contraction amid falling interest rates.
The non-banking subsidiaries contributed 42% of the Group’s total income led by stable earnings from Shinhan Card as well as improved results from Shinhan Invest-ment Corp. and Shinhan Life Insurance.
For 2015, the Group delivered net income of KRW 2.37 trillion. Shinhan Financial Group far outpaced domestic competitors in overall performance and we further solidified our leadership as Korea’s top financial group.
As a result of ongoing efforts to practice Compassionate Finance, Shinhan Finan-cial Group was ranked 18th on the list of the Global 100 Most Sustainable Corpora-tions by The World Economic Forum. This represents the highest rank any Korean company has ever achieved on this prestigious list. Shinhan also earned worldwide recognition as Korea’s leading banking brand by ranking in 44th place in the global banking brands survey by the UK’s The Banker.
Our differentiated achievements in the face of a challenging environment would not have been possible without the consistent trust and support from our shareholders.
As a token of our sincere appreciation, Shinhan Financial Group has constantly raised the dividend payout ratio for the past four consecutive years. In 2015, the payout ratio rose to 24%, a sizeable jump from the 21.6% of the previous year. Consequently, the dividend yield ratio stood at around 3%.
Chairman’s Message
Shinhan Financial Group Annual Report 2015 014

In this demanding environment, Shinhan Financial Group was able to deliver outstanding results through
healthy asset growth and effective risk management based on our balanced business portfolio.
SFG Overview 015Chairman’s Message

I would like to take advantage of this opportunity to thank you once again. Shinhan Financial Group will continue with efforts to enhance shareholders’ value through more flexible capital management.
Change, innovation and evolution
With the world evolving at an ever faster pace, the financial sector is also experienc-ing an evolutionary process of its own.
The aging society, coupled with persistent low growth and low interest rate trends, has given rise to unprecedented financial needs among our customers.
Rapid developments in information and communication technologies (ICT) and the move towards deregulation are expected to bring about tremendous changes to the financial market landscape.
We believe these changes will mark the advent of a new era.
As we move forward, Shinhan Financial Group will embrace the new and pursue innovation to sustain growth in the face of change.
Our mid-term strategic goal is to solidify our presence as the leading financial group in Korea and strengthen our footing in the global markets. Our efforts toward this goal will commence in 2016 with the implementation of the following three key initiatives.
First, we will spearhead advances in digital finance by developing secure and con-venient services and solutions to keep pace with the digital society.
Second, we will look beyond Korea and explore new growth opportunities in the global markets, with a particular focus on Asia.
Lastly, we will reinforce our risk management system in preparation for the low growth era and possible external shocks, so that we are positioned to withstand major shifts and turmoil in the financial markets.
Based on our strong corporate culture, we will continue to evolve and embrace innovation and change in order to grow together with our customers, shareholders and the society.
Shinhan Financial Group Annual Report 2015 016

Han DongwooChairman & CEO of Shinhan Financial Group
Dear respected customers and shareholders,
Shinhan Financial Group has sustained growth over the past three decades, un-fazed by the many crises and challenges we have encountered. I believe our unique corporate culture was the driving force of growth throughout the years.
Based on our strong corporate culture, we will continue to evolve and embrace in-novation and change in order to grow together with our customers, shareholders and the society.
We ask for your continued support and encouragement and extend our sincere wishes for the health and happiness of you and your family.
Thank you.
SFG Overview 017Chairman’s Message

Executive Director
Han DongwooDate of Birth : November 10, 1948Current Position : Chairman & CEO, Shinhan Financial GroupEducation : LL.B., College of Law, Seoul National UniversityMain Work Experience :2011~Current. Chairman & CEO, Shinhan Financial Group 2007~2009. Vice Chairman, Shinhan Life Insurance2002~2007. Chief Executive Officer, Shinhan Life Insurance1999~2002. Deputy President, Shinhan Bank
Non-Executive Directors
Cho Yong-byoungDate of Birth : June 30, 1957Current Position : President & CEO, Shinhan BankEducation : LL.B., College of Law, Korea UniversityMain Work Experience :2015~Current. President & CEO, Shinhan Bank 2013~2015. Chief Executive Officer, Shinhan BNP Paribas Asset Management2011~2013. Deputy President, Shinhan Bank2009~2011. Executive Vice President, Shinhan Bank
Namkoong HoonDate of Birth : June 26, 1947Current Position : Former) Chairman, Korea Life Insurance AssociationEducation : M.A. in Public Administration, University of Wisconsin at MadisonMain Work Experience :2011~2016. Chairman of the Board of Directors, Shinhan Financial Group 2009~2011. Outside Director, Korea Real Asset Management Company 2005~2014. Outside Director, Samsung Electro-Magnetics Co., Ltd. 2005~2008. Chairman, Korea Life Insurance Association
Outside Directors
Ko Boo-inDate of Birth : December 25, 1941Current Position : CEO, Sansei Co., Ltd.Education : B.A. in Meiji UniversityMain Work Experience :2005~Current. CEO, Sansei Co., Ltd. 2009~2010. Outside Director, Shinhan Financial Group2005~2009. Outside Director, Jeju Bank2002. Director, JEJU International Convention Center
Park CheulDate of Birth : April 27, 1946Current Position : Former) Chairman & CEO, Leading Investment & Securities Co., Ltd.Education : M.A. in Economics, New York UniversityMain Work Experience :2006~2013. Chairman & CEO, Leading Investment & Securities Co., Ltd.2004. Member of the Committee, National Economy Advisory Council2003~2006. Outside Director, Korea Development Bank2000~2003. Senior Deputy Governor, Bank of Korea
Lee ManwooDate of Birth : November 22, 1954Current Position : Professor, Korea University Business SchoolEducation : Ph.D. in Business Administration from University of GeorgiaMain Work Experience :1988~Current. Professor, Korea University Business School2007~2008. Chairman, Korean Accounting Association2006~2007. Chairman, Korean Academic Society of Taxation2001~2007. Committee Member of Securities Listing, Korea Exchange
Lee Sang-kyungDate of Birth : September 20, 1945Current Position : Representative Attorney, Law Firm Lee Sang KyungEducation : LL.B., College of Law, Chung-Ang UniversityMain Work Experience :2014~Current. Representative Attorney, Law Firm Lee Sang Kyung2010~2013. Representative Attorney, Law Firm Wonjon2009~2010. Lawyer, DW Partners Law Firm2005~2009. Lawyer, Law Firm Leewoo2004~2005. Chief Judge, Constitutional Court of Korea
The Board of Directors of Shinhan Financial Group is currently composed of 12 directors: 1 executive director, 2 non-executive directors and 9 outside directors. The Chairman of the Board is Mr. Park Cheul, who was appointed by the Board of Directors among the 9 outside directors on March 24, 2016.
Management of the company includes current Chairman & CEO of the Group, Mr. Han Dongwoo, 3 deputy presidents and 2 executive vice presidents.
Board of Directors andManagement
Shinhan Financial Group Annual Report 2015 018

Outside Directors (Continued)
Lee Sung-ryangDate of Birth : August 30, 1955Current Position : Professor, School of Economics, Dongguk UniversityEducation : Ph.D. in Economics, Columbia UniversityMain Work Experience :2007~Current. Professor, School of Economics, Dongguk University 2015~Current. Director, Research Institute of Social Science, Dongguk University 2013~2015. Dean, School of Economics, Dongguk University 2002~2004. Head of Graduate Department of Public Administration,
Dongguk University 1997~2006. Professor, School of International Studies, Dongguk University
Lee Jung-ilDate of Birth : August 28, 1952Current Position : CEO, Hirakawa Shoji Co., Ltd.Education : B.A. in Political Science & Economics, Meiji UniversityMain Work Experience :2011~2013. Outside Director, Shinhan Financial Group 2006. Board Member, Korean Residents’ Union in Japan 1995. Vice Chairman, Korea Chamber of Commerce and Industry in Japan 1985. CEO, Hirakawa Shoji Co., Ltd.
Lee Heun-yaDate of Birth : September 10, 1959Current Position : Executive Director, Korea Chamber of Commerce and
Industry in JapanEducation : B.A. in Osaka University of ArtsMain Work Experience :2014~Current. Executive Director, Korea Chamber of Commerce and
Industry in Japan 1983~2005. CEO, Marushin Co., Ltd.
Yuki HirakawaDate of Birth : October 21, 1960Current Position : CEO, Level River Co., Ltd.Education : B.A. in Spanish, Osaka UniversityMain Work Experience :2013~Current. CEO, Level River Co., Ltd.1994~2012. CEO, Hirakawa Industry Co., Ltd.
Philippe AvrilDate of Birth : April 27, 1960Current Position : CEO & Representative Director
BNP Paribas Securities(Japan) Ltd.Education : M.A. in Economics, Universite de Paris DauphineMain Work Experience :2011~Current. CEO & Representative Director
BNP Paribas Securities(Japan) Ltd.2012~Current. Chief Country Officer BNP Paribas, Tokyo Branch
Deputy Presidents
Kim Hyung-jinDate of Birth : August 7, 1958Current Position : Deputy President, Shinhan Financial GroupEducation : Executive Education, Wharton School Advanced Management Program, Seoul National University B.Sc. in Economics, Young-nam University Main Work Experience :2013~Current. Deputy President, Shinhan Financial Group 2010~2013. CEO, Shinhan Data System 2009~2010. Deputy President, Shinhan Bank
Lim Young-jinDate of Birth : November 2, 1960Current Position : Deputy President, Shinhan Financial GroupEducation : B.A. in Business Administration, Korea UniversityMain Work Experience :2016~Current. Deputy President, Shinhan Financial Group 2013~2016. Deputy President & Head of Wealth Management Group, Shinhan Bank 2011~2013. Executive Vice President, Shinhan Bank
Yim Bo-hyukDate of Birth : March 11, 1961Current Position : Deputy President, Shinhan Financial GroupEducation : B.A. in Business Administration, Korea UniversityMain Work Experience :2016~Current. Deputy President, Shinhan Financial Group 2014~2016. Executive Vice President, Shinhan Financial Group 2011~2014. Managing Director & Head of Risk Management Team,
Shinhan Financial Group
Executive Vice Presidents
Lee Chang-gooDate of Birth : January 14, 1961Current Position : Executive Vice President, Shinhan Financial GroupEducation : B.A. in Accounting, Hanyang UniversityMain Work Experience :2016~Current. Executive Vice President, Shinhan Financial Group
Executive Vice President & Head of Wealth Management Group, Shinhan Bank
2014~2016. Head of Wealth Management Division, Shinhan Bank 2012~2014. General Manager of Seongsu-dong Branch, Shinhan Bank
Woo Young-woong Date of Birth : March 5, 1960 Current Position : Executive Vice President, Shinhan Financial GroupEducation : M.A. in International Business, Waseda UniversityMain Work Experience :2016~Current. Executive Vice President, Shinhan Financial Group
Executive Vice President & Head of Corporate & Investment Banking Group, Shinhan Bank
2015~2016. Head of Investment Banking Division, Shinhan Bank 2014~2015. Head of Corporate Banking Division, Shinhan Bank
SFG Overview 019Board of Directors and Management

Our mission, “Compassionate Finance, Your Companion for the Future,” is meaningful in that it seeks harmonious coexistence of society members through the formation of a virtuous cycle where corporate value and customer/society value are positively correlated. Shinhan has been keen on internalizing Compassionate Finance in our organizational culture. We strived to establish fundamental and specific principles at the workplace so that each and every member of company can achieve Compassionate Finance in daily duties. With these efforts, we would like to provide our cus-tomers with a completely different customer experience at every point of contact.
Group Mission
Group MissionShinhan Financial Group’s mission, “Compassionate Finance, Your Companion for the Future,” epit-omizes the founding spirit of Shinhan—making a better world through the power of finance.
“Compassionate Finance” starts with putting the interest of our customers at the center of our daily operations. As a financial firm, the core of our business is to help customers achieve their goals by providing appropriate financial products, services, and asset management that are suitable with the current of times. Financial products and services as well as the method of asset management are tools that may vary according to changes in the times and the environment. It means we have to move away from traditional ways of doing our business and adopt different ways and creative meth-ods that meet today’s new environment. We call this “Creative Finance.”
We believe Creative Finance can bring about a virtuous cycle of shared prosperity between and among Shinhan, its customers, and society.
When we provide our customers with optimal financial services in a timely manner and increase re-turn on investment through Creative Finance, the value of our customer will grow and in turn we will also be able to share the profits. As more customers want to do business with Shinhan, our corporate value will grow alongside.
In addition to expanded customer value, a well-served function of finance—the efficient allocation of financial resources—will also increase the overall value of the society. This is what we call “Virtuous Cycle of Shared Prosperity” in which customers, society and Shinhan can all grow together.
Shinhan Financial Group Annual Report 2015 020
Compassionate Finance, Your Companion for the Future
Promote a virtuous cycle of shared prosperity with creative financial services
Methodology
The Core of Financial Business• Help customers reach their goals with timely
financial products and services• Enhance the value of our customers’ assets
Creative FinanceInnovate the way we deliver products and
services and manage our customers’ assets in changing markets
‘Through the Power of Finance’Ultimate Goal
Virtuous Cycle of Shared ProsperityGrow value for customers, businesses and
society leading to shared prosperity
‘Building a Better World’
Shinhan’sValues
Value for ourCustomers
Value forSociety

Shinhan Way The “Shinhan Way” is the value system and guiding principle for all Shinhan employees in their thoughts and actions. The Shinhan Way consists of a mission, a vision, and core values.
03.Core ValueCustomer Respect Change Excellence Ownership
02.VisionWorld Class
Financial Group
A Better World through the Power of Finance01.Mission
“Shinhan Way” is the value system and guiding principle for all Shinhan employees’ thoughts and actions.
Shinhan Way
porate client management system in order to offer long-term loyal cli-ents with preferential benefits
• Reflecting results of personal missions, leader coaching and best prac-tices in employee/corporate performance evaluation
Key Initiatives of Creative Finance• Developing customer-oriented innovative products and services - Opened 5 Shinhan Creative Finance Plaza in order to address IB ser-
vice needs of small and medium sized corporate customers - Applying Big Data analysis such as Code 9 * to the Group’s market-
ing activities and other business operations and establishing analysis systems for unstructured data
- Industry’s first to introduce insurance products that allow prepayment of annuities on the collateral of death benefits
• Improving return on investment for clients’ assets - Constructing a platform for providing IB-structured products - Expanding creative product lineups (global ARS, EMA, Etna DLB, for-
eign currency deposits in trust, and low-barrier ELS**)
* Introduced in 2014, “Code 9” is a customer insight model that enables marketing tools tailored to individual customers’ spending habits based on big data analysis.
** ARS: absolute return swap; EMA: expert managed account; DLB: derivative-linked bonds; ELS: equity-linked bonds
Our efforts to increase participation in Compassionate Finance Encouraging Participation by Rewarding Best Practices• Individual employees planning and putting into action personal missions• Executives’ comprehensive support - Review and feedback on the progress of personal missions, on-site
visits on “Mission Day,” and special lectures by executives• Rewarding best practices - Periodic rewards through personal mission best practice contests - Company-wide sharing of best practices through corporate broad-
casts, video clips, portals, case studies, and newsletters
Policy and System Upgrade• Developing evaluation criteria and policies to measure the performance
better reflecting Compassionate Finance - (Group-wide) Review of key performance indicators of the branches in
reflection of Compassionate Finance - (Shinhan Bank, Shinhan Investment Corp.) Reflecting customers’ prof-
itability and quality of following-up customer services in performance evaluation
- (Shinhan Bank) Adopting a corporate success program and new cor-
021Group MissionSFG overview

Compassionate Finance in ActionAs a corporate citizen, we are currently operating various programs that contribute to our society. This includes strengthening systems to protect the rights of financial consumers, supporting middle income households, and financing SMEs.
Shinhan Bank
• Start-up Training for Small Entrepreneurs Through business alliances with small enterprise support institutions, Shin-
han Bank provides a bank-wide training program on start-ups to anyone who is considering starting a business. In 2015, a total of 2,743 prospective SOHO founders completed the training.
2,743 trainees
• New Hope Seed Loan In 2015, Shinhan Bank extended a total of KRW 369 billion through a mi-
crofinancing program jointly launched with other banks in Korea. The pro-gram aimed to expand financial inclusion for the financially underprivileged.
KRW 369 billion
• Preferential Fee Rates for Low-income Families In 2015, the bank offered fee reductions for those currently receiving finan-
cial support or workers subsidies from the government up to 81,602 cases.
81,602 cases
• Supporting Business Success & SME Restructuring Committed to the mutual benefit of the bank and corporate clients, Shin-
han Bank supports companies with competitive technology and business prospects but may be facing a temporary liquidity crunch by extending additional credits, postponing maturity, and offering interest rate cuts.
Corporate Success Program worth KRW 414.4 billion in 311 cases SME Restructuring Support program worth KRW 369 billion in 727 cases
• Loans to Technology-Driven Startups Seeing the growth potential and greater chances of job creation in fostering
creative SME startups in their burgeoning stages, Shinhan Bank extended loans in 2015 worth KRW 1,345.6 billion, particularly to SME startups with advanced technologies in their early stages of business.
KRW 1,345.6 billion
Shinhan Card
• Redemption of Arrears Using Reward Points Shinhan Card expanded the rights of financial consumers through process
innovation. This change allowed credit card holders who were in arrears (in small amounts) to use their reward points to pay their credit card bills, sav-ing them from delinquency.
No. of users who used rewards points: 138,000 users (worth KRW 10.7 billion)
• ‘All - That Shopping Mall’ Earmarked for SMEs/SOHOs Shinhan Card operates an online shopping mall called All-That Shopping
Mall, that provides an opportunity for SMEs and small businesses with high quality products yet weak marketing capabilities and distribution channels. For the understaffed SMEs, the company supports them in building up their markets with the help of the Small & Medium Business Distribution Center (SBDC).
No. of companies on the site: 15 suppliers, 6 SMEs, and more than 50 companies under the umbrella of the SBDC
Annual sales of SMEs and small businesses on the site: KRW 2.5 billion
• Industry-first Introduction of Custom Package FDS Service The custom package fraud detection system (FDS) service helps its credit
card users remain unharmed by any theft, loss, or counterfeit damages. Using this service, cardholders can preset the conditions of their credit card usage such as countries, stay durations, transaction forms, and amounts, so that they can use their credit card with enhanced convenience and se-curity.
No. of registered members: 130,000 users No. of eligible cards: 160,000 cards (available since March 2015)
• Separate Consulting and Credit Screening for the Financially Underserved Shinhan Card operates a separate counseling and credit screening teams
dedicated to silver generation customers. This organization ensures that senior customers are not neglected and have access to various benefits provided by the company. In addition, a new online chat service is available for customers with hearing difficulties to assist them in the credit screening process as part of the company’s commitment to financial inclusion.
No. of consulting/screening calls: 58,000 calls per month
Group Mission
Shinhan Financial Group Annual Report 2015 022

• Payment of Uncollected Insurance Payments Shinhan Life Insurance has mounted a campaign to pay out uncollected
insurance payments. In 2015, a total of KRW 58.6 billion (103,155 cases) was paid out.
KRW 58.6 billion in 103,155 cases
• Preferential Premium Rates for the Underprivileged Shinhan Life Insurance has a preferential premium rating scheme exclusive
to low-income families, those with disabled family members, and families with more than three children. A total of 29,028 policies benefited from this preferential premium in 2015.
29,028 cases In 2016, Shinhan Financial Group will dedicate itself to embodying Com-passionate Finance in its corporate culture and creating greater customer experiences.
While making constant efforts toward enhanced investment return for both customer and Group assets, we will continue developing innovative prod-ucts and services in digital banking, expanding CIB services for SMEs, and introducing creative products and services to deliver differentiated value to customers.
All these efforts will be directed to materializing the Group Mission: Com-passionate Finance.
We firmly believe that our persistent pursuit of Compassionate Finance is integral in achieving sustainable growth and becoming a world leader in the 21th century financial markets.
Shinhan Investment Corp.
• Compassionate Finance Camp for Teens Launched in 2012, this educational donation program for teenagers is the
signature CSR program at Shinhan Investment Corp. 1,139 students participated in a total of 38 camps in 2015
• SME Financing through the P-CBO Shinhan Investment Corp. assists SMEs that face difficulties in funding by
underwriting the issuance of a P-CBO* with a guarantee from the Korea Technology Credit Guarantee Fund (KIBO). The company administered KIBO’s P-CBO issuance on three occasions in 2015 (the year’s first, fifth and sixth issuance).
Funding volume: KRW 755.2 billion (no. of beneficiary SMEs: 101)
* P-CBO: A primary-collateralized bond obligation is an asset-backed security issued based on numerous privately placed bonds.
Shinhan Life Insurance
• Shinhan Happy Silver Finance Classes This is Shinhan Life Insurance’s CSR program to train retirees with a
financial background as financial lecturers, who then provide senior citizens and senior caregivers with lectures on retirement planning, wealth management, and the avoidance of financial scams. In 2015, a total of 12,378 people completed 308 lectures.
12,378 trainees in 308 lectures
• Follow-up Service Shinhan Life Insurance offers a follow-up service for customers whose
insurance representatives have changed. Provided that the policyholders have allowed consent, the new representative visits them in person to provide five key services* upon request. In 2015, 285,838 customers received the service.
* Five Key Services : Readdressing the coverage of products with policies in force, checking the eligibility of insurance claims, updating customer information, offering a guide on designating beneficiaries, and including babies soon to be born in the coverage as well as coverage reviews
285,838 policyholders
023Group MissionSFG overview

2007Phase 02
2001Phase 01
2010Phase 03
2015Phase 04
Group Vision & Strategy
Shinhan Financial Group Annual Report 2015 024
Since the inception of the financial holding company in 2001, Shinhan Fi-nancial Group has strived to become a leading world-class financial group in Korea, consistently pursuing balanced growth between banking and non-banking subsidiaries. Its differentiated business models have allowed the group to stay ahead of its peers based on the core competencies and systems.
In order to realize our long-term vision of becoming a world-class financial group, we have recently adopted a mid-term strategic goal of (i) solidifying our position as a leading financial group in Korea and (ii) establishing the foundation for success in the Asian market. Our efforts toward this goal already commenced in 2016.
Shinhan Financial Group Mid-term Strategic Goal and 2016 key strategic priorities
Mid-term Strategic GoalFollowing the global financial crisis that began in the second half of 2008, a new set of challenges for financial service providers has emerged in the form of a “new normal” in the business environment with the following general trends: (i) demographic changes due to declining birth rates and increasingly aging population (ii) prolonged periods of low growth and low interest rates (iii) rapid innovation in the financial industry as a result of advancements in information and communication technology (ICT) and digital finance technologies, and (iv) amplifying effects of challenges and opportunities globally. Constant changes in the global markets demand that financial service providers consistently develop new financial trends, ensure customer satisfaction by offering competitive products and ser-
2016-2018 New Transition
2002-2007 Growth Phase
•�Launching financial holding company structure •�Achieving scale of economy and diversification
through M&As(bank, credit card, brokerage, asset management, and life insurance)
2008-2010 Crisis Management
•��Overcoming�the�global�financial�crisis•�Innovating�the�group-wide�business�management�system
2011-2015 Solidifying Financial Brand Leadership
•�Announcing the Group mission, “Compassionate Finance: Your Companion for the Future”
•�Establishing CIB/WM business models•�Positioning itself as Korea’s top financial brand
by achieving the highest profits in the industry for 8 consecutive years
~2001 Competency Building
•Organic Growth•Establishment of Shinhan Bank

vices in the continued low-interest rate environment, maintain a sound infrastructure that can withstand external shocks, and enhance social re-sponsibility and accountability.
In recognition of these trends in our business environment and in order to realize our long-term vision of becoming a world-class financial group, we have recently adopted a mid-term goal of (i) solidifying our position as a leading financial group in Korea and (ii) establishing the foundation for suc-cess in the Asian market. We aim to become Korea’s number one financial brand and, at the same time, achieve meaningful growth in overseas mar-kets by expanding into regions with high growth potential.
2016 Group Business PlansWe set our 2016 business plans in line with our mid-term strategic goal. Our key strategic priorities currently include the following:
Lead value creation through creative innovation. By generating new ideas that drive global trends, we will strive for a synergy that increases value for both our customers and the Group. In particular, we plan to implement innovative approaches in emerging business sectors such as digital finance, retirement planning and real estate portfolio management, so that we can increase the value of our customers’ assets and develop new drivers of growth for the future.
Secure new opportunities for growth with global operations. We will continue to expand into global high growth markets to procure a strong source of growth. To pursue meaningful advancement and move be-yond a simple survey of opportunities, we plan to explore various new market entry strategies while establishing a firm presence in local markets.
Implement integration and build “One Shinhan” system by reforming the Group’s operating system.We will reform our operating system to (i) provide our customers with a single portal that integrates multiple business lines and (ii) continue developing in-tegrated financial products and services. Through such strategies, we intend to enhance the group’s operational efficiency and proactively accommodate customers’ needs regarding total financial service packages.
Optimize risk management preemptively in preparation for low economic growth and external shock.In order to attain sustainable growth in an environment where risk factors are amplified and the threat of financial crises lingers, we plan to take precautionary measures to eliminate negative external factors before they arise. Moreover, we will strengthen our capacity to provide differentiated risk management and exer-cise our best effort to handle customer data with prudence.
Enforce strategic cost-savings.Due to the deterioration of structural profitability, companies in the financial sector must improve their cost structure to survive. We plan to recalibrate our current business portfolio with investments in emerging business sectors and will continue to increase operational efficiency in areas such as business channels, processes and marketing.
Establish a strong organizational culture based on the “Shinhan Way.”We will further upgrade our policies and operating system according to our mission of “Compassionate Finance, Your Companion for the Future.” We aim to further invigorate the group’s creative and proactive culture while nur-turing a new generation of leaders based on the “Shinhan Way.”
025Group Vision & StrategySFG overview
2016 Six Key Strategic Priorities Mid-term Strategic Goal
“ Solidifying our position as a leading financial
group in Korea and establishing the foundation
for success in the Asian market”
06. Establish a strong organizational culture based on the “Shinhan Way”
01. Lead value creation through creative innovation
02. Secure new opportunities for growth with global operations
05. Enforce strategic cost-savings
03. Implement integration and build “One Shinhan” system by reforming the Group’s operating system.
04. Optimize risk management preemptively in preparation for low economic growth and external shock

Corporate Governance
2009 2010 2011 2012 2013 2014 2015
Strong A A A+ A+ A+ A+
Shinhan Financial Group Annual Report 2015 026
Transparent, sound and effective corporate governance not only protects interests of stakeholders including shareholders and financial consumers but also contributes to the sustainable growth of the company. As such, Shinhan Financial Group has dedicated its persistent efforts to improve corporate governance of the Group.
First of all, Shinhan has fully publicized all corporate governance-related work processes, standards, procedures and results in a transparent and effective manner. In promotion of sound corporate governance, the Group honors the independence and expertise in the composition and opera-tion of the board of directors in full compliance with all related laws and regulations, including the Korean Commercial Act and the Financial Hold-ing Companies Act. The articles of incorporation, corporate governance bylaws, and BOD regulations all meet the recommendations made by the Financial Corporate Governance Code of the Financial Services Commis-sion and the Corporate Governance Code of the Korea Corporate Govern-ance Service.
Most importantly, Shinhan Financial Group upholds diversity and comple-mentarity of skills in the composition of its BOD so that the board is able to assess problems from a broader point of view and is more likely to take into account the best interest of all stakeholders. As a result, the BOD of the Group is comprised of members with expertise in diverse professions and backgrounds. The BOD members are mostly from one of the five areas as recommended by the Financial Corporate Governance Code: finance, economy, business administration, accounting, and law.
Composition of the BOD and Sub-CommitteesOur board of directors, which currently consists of one executive director, two non-executive directors and nine outside directors, has the ultimate responsibility for the management of our affairs. It appoints and dismisses the CEO of the group, develops and approves the Group’s business plans and other major business management issues. Another important duty is monitoring the top management of the Group.
Shinhan Financial Group’s Corporate Governance Grades by the Korean Corporate Governance Service (CGS)
Currently 75% or our board members are independent. The independence of the BOD was further enhanced by separating the chairperson of the BOD and the CEO of the Group and appointing the chairperson among outside directors. In addition, separate sessions by outside directors are being held to enhance the effectiveness in monitoring the general opera-tion of the group.
The sub-committees of the BOD allow individual directors to be fully in-volved with various BOD activities. Each committee is specifically de-signed to represent the interests of stakeholders, shareholders in particu-lar, as well as keeping the business operations of executive management in check and providing constructive alternatives to practices and prob-lems. To assist with their fiduciary duties as board members, a BOD secre-tariat providing transparent information on corporate management and an explanation of the BOD’s agenda has been put in place.
Sub-committees of the BOD
Board Steering CommitteeThe Board Steering Committee is responsible for ensuring the efficient op-eration of the board and the facilitation of the BOD’s functions. The com-mittee’s responsibilities also include reviewing and assessing the board’s structure and the effectiveness of that structure in fulfilling the board’s fi-duciary responsibilities.
Risk Management CommitteeThe Risk Management Committee oversees and makes determinations on all issues relating to our comprehensive risk management function. In order to ensure our stable financial condition and to maximize our profits, the committee monitors our overall risk exposure and reviews our compli-ance with risk policies and risk limits. In addition, the committee reviews risk and control strategies and policies, evaluates whether each risk is at an adequate level, reviews risk-based capital allocations, and reviews the plans and evaluation of internal control.

Corporate Governance & CEO Recommendation CommitteeThis committee is responsible for overall corporate governance matters of the company. It deliberates on matters related to corporate governance of the company, such as the code of conduct and code of ethics, size of the Board of Directors, and matters necessary for improvements to the com-pany’s corporate governance structure.
The committee is also responsible for developing, operating and reviewing the company’s management succession plan, including setting CEO quali-fication criteria, evaluating the CEO candidate pool, and recommending CEO candidates.
The chair of this committee is elected from outside director members. The participation and voting rights of the incumbent CEO is limited if he or she is included in the CEO candidate pool.
CSR CommitteeThe CSR Committee is responsible for setting directions for the Group on major economic, environmental, and social issues in relation to CSR (Cor-porate Social Responsibility). It also reviews and issues CSR related poli-cies and guidelines. Furthermore, the committee reports on the Group’s CSR Report, sustainability evaluation results, as well as the status on sus-tainable management.
Audit CommitteeThe Audit Committee oversees our financial reporting and approves the appointment of and interaction with our independent auditors and our internal audit-related officers. The committee also reviews our financial information, audit examinations, key financial statement issues, and the administration of our financial affairs by the Board of Directors. In connec-tion with the general meetings of stockholders, the committee examines the agenda for, and financial statements and other reports to be submitted by, the Board of Directors for each general meeting of stockholders.
Compensation CommitteeThe Compensation Committee reviews and approves management’s evaluation and compensation program with fiduciary duties to ensure that compensation schemes are appropriately interrelated with the Group’s fi-nancial condition and risk status.
Outside Director Recommendation CommitteeMembers of this committee are appointed by our Board of Directors only to the extent necessary to recommend and nominate candidates for our outside director positions and related matters. Committee meetings are called by the chairman of this committee, who must be an outside director.
Audit Committee Member Recommendation CommitteeMembers of this committee are appointed by our Board of Directors only to the extent necessary to recommend and nominate candidates for our Audit Committee and related matters. The committee is entirely consisted of outside directors of the Group.
027Corporate GovernanceSFG overview
Committees of Board of Directors
Board Steering Committee
Han DongwooNamkoong HoonLee Sang-kyungLee Sung-ryang Yuki Hirakawa
Audit Committee
Lee ManwooLee Sang-kyungLee Sung-ryang
Risk Management Committee
Namkoong HoonPark CheulLee Heun-yaPhillippe Avril
Compensation Committee
Park CheulLee Sang-kyungLee Sung-ryang Lee Jung-il
Outside Director Recommendation Committee Han DongwooLee Sung-ryang Lee ManwooLee Jung-ilLee Heun-ya
Corporate Governance & CEO Recommendation Committee Han DongwooNamkoong HoonLee Sang-kyungKo Boo-inPark CheulPhilippe AvrilYuki Hirakawa
Audit Committee Member Recommendation Committee
All Outside Directors
CSR Committee
Han DongwooNamkoong HoonKo Boo-inLee ManwooYuki Hirakawa

Risk Management
Shinhan Financial Group Annual Report 2015 028
Shinhan Financial Group’s Risk Management Philosophy
“ With a sense of responsibility, all employees shall maintain the balance between risk and return in all business practices in order to achieve the sustainable growth of the Group. ”
Shinhan Financial Group has its own risk philosophy as an underlying princi-ple for all employees.
Guided by this basic philosophy, we have in place a semi-matrix risk manage-ment organization policy that effectively coordinates both Group-wide inte-grated management and subsidiary-level independent management of risks.
In the first half of 2015, the Group’s credit cost temporarily increased main-ly due to one-off provisions arising from the restructuring of large corpora-tions. Decreasing write-back of loan loss provision was another reason. The credit cost, however, started to stabilize during the second half of the year thanks to the Group’s preemptive risk management practices.
In preparation for expanded volatility throughout global markets in 2016, as well as expected interest rate hikes in the U.S. and potential financial crises in emerging markets, Shinhan Financial Group will continue to come up with preemptive measures for more effective management of foresee-able risks.
Differentiated Group Risk Management Tools
1.Group Risk Philosophy and Principles Shinhan has established a Group-wide risk philosophy and seven risk management principles as guidelines for its daily risk management prac-tices at front offices.
2.Group-wide comprehensive risk monitoring systemShinhan Financial Group runs a comprehensive system for monitoring macroeconomic indicators (key risk metrics of the Group) and an up-to-date risk position of the Group to timely identify potential risks and key issues concerning it. Identified potential risks and key issues go through risk impact analysis for developing preemptive countermeasures at the Group level.
3.Group-wide Risk Expert Network (REN)Shinhan has organized a Group-wide network consisting of risk experts who spearhead risk management corporate culture and train risk officers through Group-wide training courses and workshops in consideration of business areas and risk types. These people contribute their work experi-
ence and profound knowledge in risks by type to upgrading overall risk management capabilities Group-wide.
4.Group-wide Corporate Credit Assessment SystemStarting in 2015, Shinhan adopted a Group-wide corporate credit assess-ment system, allowing for an integrated approach when it comes to the credit rating of a single corporate borrower. This system has not only al-lowed preemptive management of credit risks but also enhanced the qual-ity of the Group’s credit portfolio. In addition, it is expected to further im-prove the Group’s BIS ratio when the Financial Supervisory Service (FSS) approve our system for an internal ratings-based approach (IRB) in the near future.
Risk Management OrganizationShinhan’s risk management organization consists of the Group Risk Man-agement Committee, the Group Risk Management Council, the Group Chief Risk Officer (Group CRO), the Group Risk Management Team, and relevant risk committees and risk teams at the subsidiary level.
Group Risk Management CommitteeThe Group Risk Management Committee is the highest decision-making body concerning the Group’s risk issues. Consisting of three outside di-rectors from the Group’s board, the committee establishes the Group’s overall risk management policies and strategies and resolves the following agenda items:
1. Establish basic risk management policies in line with management strategies2. Set reasonable risk limits for the entire group and each of our subsidiaries3. Approve the appropriate investment limits and/or maximum loss limits4. Enact and amend risk management regulations and the Group Risk
Management Council rules5. Make decisions concerning the FSS’s approval of the Group’s internal
ratings-based approach on-retail and retail credit assessment systems 6. Decide other risk management-related issues the board of directors or
the Group Risk Management Committee sees fit to discuss
Group Risk Management CouncilComprised of the Group Chief Risk Officer, Group Risk Management Team head, and Chief Risk Officers of our major subsidiaries, the Group Risk Management Council provides a forum for risk management executives from each subsidiary to discuss the group-wide risk management guide-lines and strategies. It also approves action plans to implement policies established by the Group Risk Management Committee. The council is re-sponsible for the following agenda items:

The Group Risk Management Team provides support and assistance to the Group CRO in carrying out his or her responsibilities.
Each of our subsidiaries has its own risk management committee and risk management team. In accordance with the group risk management poli-cies and strategies, the risk management committee at the subsidiary level establishes its own risk management policies and strategies in more de-tail and implements them. The risk management team of each subsidiary monitors, assesses, manages and controls the overall risk of its operations and reports all major risk-related issues to the Group Risk Management Team at the holding company level, which then reports to the Group Chief Risk Officer.
1. Set the risk appetite for the Group and its subsidiaries2. Establish and adjust risk limits for the Group and its subsidiaries3. Operate risk assessment system for the Group and its subsidiaries4. Coordinate Group-wide risk management practices5. Manage risks related to funding subsidiaries6. Review other risk-related issues as requested by the Group
Management Board
Group Chief Risk Officer (CRO)The Group Chief Risk Officer assists the Group Risk Management Commit-tee in implementing the risk policies and strategies as well as ensuring con-sistency in the risk management system of our subsidiaries. Furthermore, the CRO evaluates the Chief Risk Officer of each subsidiary in addition to monitoring the risk management practices of each subsidiary.
(%)
029Risk ManagementSFG overview
Holding Company Level Subsidiary Level
Coordination
Reporting
Delegation
Monitoring
Group Risk Management Committee(Three outside directors from the Group)• Establishing Group-wide risk management policies • Setting Group-level risk limits
Group Risk Management Council(Group’s CROs, Group Risk Management Team head, and CROs of major subsidiaries)• Discussing overall Group-wide risk issues• Implementing Group-wide risk management policies
Group CRO• Supervising Group-wide risk management practices/
Evaluating CROs of subsidiaries
Group Risk Management Team • Taking charge of working-level risk practices
Each subsidiary’s Risk Management Committee• Establishing risk management policies for each subsidiary• Setting risk limits for each subsidiary
Risk Policy Committee/ALM Committee• Risk management and loan policy management• Establishing and managing risk limits in more detail by type
Subsidiary CROs• Supervising risk management at each subsidiary
Risk management team of each subsidiary• Taking charge of working-level risk management practices
at each subsidiary
Risk management system at each subsidiary• Monitoring and measuring risks by type
Shinhan Financial Group Asset Quality
2011 2012 2013 2014 2015Precautionary & Below Loans Ratio 2.46 2.89 2.43 2.14 1.66NPL Ratio 1.25 1.34 1.26 1.15 0.87Delinquency Ratio-Shinhan Bank 0.60 0.61 0.39 0.31 0.33Delinquency Ratio-Shinhan Card 2.01 2.35 1.80 1.89 1.44NPL Coverage Ratio 166 170 163 168 191

Sustainability Management
Shinhan Financial Group Annual Report 2015 030
Under its mission, “Compassionate Finance, Your Companion for the Future,” Shinhan Financial Group is pursuing sustainability management to create a virtuous circle of enhancing customer, corporate, and social values, and thus making a better world through the power of finance. Shinhan has developed nine socially responsible management strategies regarding the economy, society and the environment, and by implementing these strategies, we will further bolster our unique competitive advantage and provide greater value to customers and society.
Establishment of CSR Committee Shinhan Financial Group has established Corporate Social Responsibility (CSR) Committee in order to proactively respond to stakeholder demands, fulfill its social responsibilities as a corporate citizen, and realize the mis-sion of the Group, ‘Compassionate Finance’ in a proactive and systemic manner. CSR Committee is one of sub-committees of the BOD and it is the top decision-making body in matters related to group-wide CSR is-sues. The committee sets the direction of Group’s CSR activities, decides on enactment and amendment of relevant regulations and examines the implementation of decisions.
Participation in Global Initiatives Shinhan Financial Group has complied with global standard of sustain-ability management by joining global initiatives. Shinhan Bank and Shinhan BNP Paribas Asset Management are signatories to the carbon disclosure project (CDP). In addition, Shinhan Bank, as a UN Global Compact member, complies with the ten core principles in the areas including human rights, labor, the environment and anti-corruption. The Bank is also a member of the United Nations Environment Programme-Finance Initiative (UNEP-FI), a UN-directed environmental initiative. Finally, the Bank has pledged its support for the UN Commission in Human rights’ Universal Declaration of Human Rights and compliance of the guidelines to its best ability.
Materiality TestShinhan Financial Group conducts its annual materiality test in accordance with the GRI G4 Guidelines in the following four steps—analysis of the CSR environment, development of issue pool, prioritization of the issues, and selection/reporting on key issues. In 2015, through internal and exter-nal environment analyses, we identified 30 sustainability issues and pared them to 10 core issues taking into account of stakeholder interests and expectations and the impact of the issues on business activity. Among the finalized 10 are customer satisfaction improvement and prevention of
financial frauds; and activities and progress related to the 10 issues are reported on a separate sustainability report and the Group website.
CSR Stategies1. Creating Customer Value Through Customer-oriented Management and Information Protection Shinhan Financial Group has been promoting consumer rights, eradicat-ing sources of customer complaints, and taking swift actions of remedy in response to damages so that we can earn financial consumer trust and improve our competitiveness. We also came up with consumer rights pro-tection rules, conducted customer satisfaction surveys and reflected the results in the performance evaluation of the management and branch of-fices. In addition, we operated programs rewarding outstanding customer suggestions and customer panel programs to make their voices mirrored in business activities. On the other hand, we adopted an employee role-play system to ensure product sales practices in compliance with the Stand-ards of Investment Recommendation and provided a Happy Call service to expand complete product sales. With these efforts, we have earned coveted industry recognitions, including, the Customer-Centric Manage-ment certification from the Fair Trade Commission, and first-place honors in the annual Korea Customer Satisfaction Index survey (KCSI), the Korea Service Quality Index (KS-SQI), Korea Service Grand Prix and Global Cus-tomer Satisfaction Index (GCSI).
Customer information management has emerged as a key issue that can greatly affect the business performance and brand image of financial ser-vice providers. Having acquired the ISO27001 and ISMS certifications, Shinhan Financial Group has set up its own information protection compli-ance standards for complying with customer privacy protection laws and regulations. The Group has limited employee access to customer informa-tion, conducted on-site inspection of the customer information protection practices of all departments and branch offices, and reflected the results on the evaluation. In addition, the Group has been thoroughly preparing itself for possible security risks such as consumer information leakages, hackings and DDos attacks by conducting regular trainings and establish-ing group-wide security control system.
2. Enhancing credibility by strengthening ethical management As a global financial corporation, the Group sees the ethical reputation as its core property. In order to be a trustworthy corporation for the custom-ers, shareholders, and the local community, Shinhan Financial Group has been keen on enhancing its ethical management. It adopted a group-wide code of ethics, an employee code of conduct, and rules of ethics for each subsidiary.

Creating customer value through customer-oriented management and informa-
tion protection
Enhancing credibility through
strengthening ethical management
Implementing risk management that considers social
and environmental factors
Developing human resources
and creating a great workplace
culture
Contributing to the development
of local communities
through social contribution
activities
Expanding
underserved people
Pursuing shared growth with suppliers and supporting their CSR activities
Developing green products/services
Using resources
environmental impacts
Economy Environment
Society
Corporate Customers
Shinhan Investment’s RM
+Shinhan Bank’s RM
ONE-PORTALFINANCIAL SOLUTION
Shinhan Bank’s CIB Division
SHINHAN CIB
Shinh
an Investment Corp.’s IB Group
Creating customer value through customer-oriented management and informa-
tion protection
Enhancing credibility through
strengthening ethical management
Implementing risk management that considers social
and environmental factors
Developing human resources
and creating a great workplace
culture Contributing to the development
of local communities
through social contribution
activities
Expanding financial inclusion for the financially underserved people
Pursuing shared growth with suppliers and supporting their CSR activities
Developing green products/services
Using resources efficiently and reducing environmental impacts
Economy Environment
Society
pacts can be examined whenever new products are launched or manage-ment criteria are reviewed for change. Accordingly, the new risk review checklist includes examinations of the adverse influence of new products, new businesses, or alliance partners on the environment and the society.
Additionally, CSR has been included as one of the non-financial criteria in the evaluation of corporate borrowers’ credit ratings; history of environ-ment-related complaints, job creation performance, and other CSR activi-ties are evaluated as part of the screening process involving corporate loan applications.
Moreover, before carrying out a large-sized project financing, we first re-view the environmental and social impact of the project. When it comes to domestic SOC projects, we provide fund only when the project complete environmental impact assessments by the Ministry of Environment or oth-
Every year, all Shinhan employees pledge their compliance with the Group’s Code of Ethics and Employee Code of Conduct. All of overseas Shinhan employees have to fully abide by the Foreign Corrupt Practices Act (FCPA). To comply with the Fair Trade act, all inter-subsidiary transac-tions are reviewed on a quarterly basis, and exchanges of gifts in any form are strictly banned among all employees.
In accordance with stricter regulations against market manipulations, all Group affiliates have adopted internal guidelines, conducted employee education, and carried out on-site inspections in order to prevent such unfair trades as use of classified information.
3. Implementing Risk Management that Considers Social and Environmental Factors Risk review rules have been revised so that social and environmental im-
031Sustainability ManagementSFG overview
Shinhan Financial Group 9 CSR Strategies

er relevant government authorities. Such assessments are prerequisite to project financing and we have stipulated it in all of our loan agreements. As for overseas SOC projects, we execute funding only after a thorough and in-depth examination. In addition to the local authorities’ approval, we also examine the projects’ potential impact on the local communities and the environment through consultation with environmental consulting agencies.
4. Developing human resources and creating a great workplace culture In 2015, Shinhan Financial Group established group-wide employee train-ing programs named Shinhan Management School and Shinhan Global Business School in order to provide its employees with a vision for self-advancement through long-term human resource development. Shinhan Management School aims at raising strategic leaders by offering core busi-ness and financial courses including business planning, marketing, per-sonnel management and risk management. On the other hand, Shinhan Global Business School focuses on cultivating global talents. It is a degree course for Master of Science in global management linked to Hong Kong University of Science and Technology.
5. Contributing to the development of local communities through social contributionsSince its foundation, Shinhan Financial Group has been fully aware of the importance of corporate social contribution and continued to expand its volunteer activities and contribution programs. Taking full advantage of its expertise in finance, the Group is conducting social contributions in a sys-
temic manner with a focus on the three key areas of welfare (co-prosperi-ty), culture (consensus) and environment (co-existence). The result of these social contributions are reflected in the CEO evaluation of each subsidiary for an efficient promotion of social contributions on a group-wide basis and the proliferation of the social contribution culture.
6. Promoting the financial inclusion of the financially underserved Shinhan Financial Group is carrying out diverse activities to support financ-ing for low income customers and small and medium-sized companies (SMEs). In 2015, Shinhan Bank extended KRW 369 billion through ‘New Hope Spore Loan,’ an industry-wide loan product specialized for low-in-come customers or for those who have difficulty in receiving loans from banks due to their low credit rating. The amount is the largest among all Korean banks in 2015 and the balance of loans extended since 2010 is also the industry’s largest at KRW 1,622.8 billion. The bank provided other microfinance programs such as New Hope Dream Loan, Korea Easy Loan, New Hope Savings Installment, and Household Debt Healing. In recogni-tion of these efforts, the Financial Supervisory Service designated Shinhan Bank as the ‘Best Bank in Micro-financing’ for the past three years in a row. In addition, the Bank has supported SMEs, from the start-up to growth and maturity stages. For the SMEs with competitive technology, Shinhan Bank provided loans up to KRW 5.5 trillion through Technology Credit Bureau (TCB). The cumulative balance of TCB loans stood at KRW 10.2 trillion as of the end of 2015.
Sustainability Management
Shinhan Financial Group Annual Report 2015 032

Improving Energy Efficiency of Buildings
Reduced energy consumption by converting to LED lighting in Shinhan Bank’s head office building, other main buildings and branch offices (a total of 13,281 LED lights).
2,376
Operation of Eco-Friendly Data Center
Equipped with solar power generators, LED lightings, BEMS (building energy management system) and ice thermal storage system 2,193
Reduction of Vehicle Use Through Video Conferences
Video conferences extensively used for regular meetings between Shinhan Bank’s regional hub offices and branches to reduce transportation emis-sions
1,562
033Sustainability ManagementSFG overview
Estimated Annual GHG Reduction (tCO2eq)
Organization (Index)
Results Grades Scores
RobecoSAM (DJSI)
Included in the DJSI World Index for the past three consecutive years
88
Korea Corporate Governance Service (KRX SRI)
Grand Prix winner at the Corporate Governance Awards
A+
CDP Member of the Carbon Management Honors Club for the last two years
100A
Global 100 One of the Global 100 Most Sustainable Corporations by the World Economic Forum for the past four years in a raw
68.80%
Green House Gas Reduction
7. Pursuing shared growth with suppliers and supporting their CSR activities We believe that stable growth of our suppliers is an essential basis for the growth and competitiveness of our own business. In that regard, Shinhan Financial Group complies with the basic principles of mutual growth in co-operation with its suppliers and partners. The Group strives to prevent any types of discrimination against partner companies arising due to reasons unrelated to business operation. Shinhan listens to its suppliers through regular meetings and satisfaction surveys to reflect their opinions in its daily operation policies.
Furthermore, the Group has adopted ‘Shinhan Financial Group Partner Companies Code of Conduct’ to enable its partners to live up to its CSR philosophy and principles. To ensure that suppliers fully understand and put into action the Code of Conduct, the Group encourages them to carry out self-evaluations on the implementation of the Code. We also keeps tracks of our major suppliers’ CSR practices in the areas of human rights, workplace safety & health, the environment, and business ethics. Based on their feedbacks, we provide various supports designed to help them pursue sustainability management.
8. Developing environment-friendly products and servicesShinhan Financial Group continues introducing a variety of financial prod-ucts designed to encourage customers to develop an eco-friendly lifestyle and to promote eco-friendly business. Concerned over depleting fossil fuels and exacerbating environmental pollution problems, Shinhan Bank and Shinhan Investment Corp. support the construction of power plants that use various renewable energies including wind power, biomass, solar power and fuel cells. The funding is executed in the forms of corporate loans, project financing, and equity investment through a PEF. These ef-forts contribute to the reduced use of fossil fuels and the expansion of green energy power stations, which in turn help reduce environmental im-pact at the national level.
9. Using resources efficiently and reducing environmental impactsAs a signatory to the UNEP-FI, Shinhan Bank in 2012 became the first Korean bank to obtain the ISO 5001 certification as part of its effort to help reduce the greenhouse gas. The bank has also strived to minimize its envi-ronmental impact by operating its data center in an energy-efficient build-ing and managing environmental indicators through an integrated green management system. In addition, the bank has set yearly GHG reduction goals up to 2020 and reports performance results and action plans to the government on an annual basis.
Global Sustainability Management EvaluationFor its outstanding CSR activities and programs, Shinhan Financial Group has achieved high recognitions from major CSR evaluations at home and abroad.

Practicing transparent and clear management, Shinhan Financial Group seeks to secure customer trust and grow into a leading global financial group that enjoys unwavering trust from customers, shareholders and other stakeholders. Identifying ethical reputation as a key ingredient in business success, the Group sets higher standards on ethical management every year in its endeavor toward becoming Korea’s leading ethical financial group.
At Shinhan Financial Group, ethical management is governed by compliance officers. In step with the revision of Korea’s Financial Holding Companies Act in February 2010, the compliance officer of the holding company was appointed to oversee the Group’s ethical business practices. The compliance officer is responsible for supervising internal controls and ethical management.
Establishment and Enforcement of the Code of EthicsIn June 2011, we established a Group Code of Ethics to apply our ethical management philosophy in a coherent and consistent manner by upgrading the ‘SFG Employee code of Ethics on Finance’ adopted in July 2005. In order to reinforce the execution of ethical practice, we also adopted ‘Employee Code of Conduct’ in 2012.
In addition, each subsidiary of the Group put in place its own ethical stand-ards, which present ethical virtues and values for employees to advocate as a corporate citizen and participants in the finance industry. The standards also provide employees with specific guidelines to follow in their daily jobs.
The Group Ethical Management CoP has been in effect since August 2010 to ensure the integrity of subsidiaries’ codes of ethics and enhance ethical awareness among employees. Those responsible for ethical management at each subsidiary participate in the program.
In June of 2014, SFG established its Declaration of Human Rights based on the basic principles of human rights and human respect. The details are in line with UN’s Commission on Human Rights’ Universal Declaration of Human Rights and Guiding Principles for Corporations and Human Rights.
Programs for Practicing Ethical Management In practicing ethical management, the Group conducts various programs in compliance with its management philosophy and each subsidiary’s code of ethics. We continue to improve the program in accordance with changes de-veloping in the business environment.
Every year the Group identifies elements that require special emphasis among its ethical standards; and has all employees of its subsidiaries pledge their compliance to the select elements at the beginning of each year. The an-nual pledge has served as an opportunity for all Group employees to confirm their commitment to ethical conducts.
At Shinhan Bank, as a means to strengthen ethical awareness, employees are asked to make a compulsory pledge to comply with the code of conduct. Further, to prevent unfair trade practices such as improper use of undisclosed information, we conduct audits on related employees of transactions of finan-cial investment products (12 audits in total, 16 departments in 2015). We also provide compliance self-examinations to all employees using our intranet platform on a monthly basis. In addition, to abide by the fair trade act and prevent unfair trade practices, we have implemented and are operating a fair trade self-compliance program. Shinhan Bank provided two fair trade related trainings to HQ employees (79 employees throughout 2015).
Shinhan Card requires its employees to sign a compliance pledge upon join-ing the company. Further, the company established ‘Our commitment to and 4 principles for complete sales’ and required all employees to commit to this as a means to prevent damage to customers due to incomplete sales. In or-der to eradicate illegal credit card sales practices, we executed ‘Appropriate Sales Practices Pledge’, and every year all employees must participate in a compliance self-examination process. In addition, Shinhan Card is regularly checking to see whether HQ departments are executing the fair trade self-compliance program once every six months.
Shinhan Life Insurance has been improving its ethical management practices since 2013 when it adopted ethical management as one of the five manage-ment principles of the CEO. Since 2014, the Company has included internal controls management results when evaluating the top management’s perfor-mance in order to raise the awareness about ethical management.
Shinhan Financial Group created a ‘Group Internal Transactions Guideline’ and a related manual to prevent illegal transactions between subsidiary com-panies. Based on this, all subsidiary companies are inspected on the appro-priateness of their internal transactions and are required to report the results. As such, we are constantly working to improve the transparency and fairness of our Group’s management.
In November 2012, we established Code of Behavior for Partners of SFG to promote mutual growth with partners, and asked partner companies to apply this to their daily business. In 2013, we set up “VOC from partners” mecha-nism in our homepage to receive their complaints and suggestions. As such, we are making every effort to support the sustainable growth of partners and lay the foundation for contributing to local communities and the environment.
Ethical Management
Shinhan Financial Group Annual Report 2015 034

035Ethical ManagementSFG overview
practices. In addition, newly joined employees, PB directors and employ-ees responsible for auditing are provided with classroom training.
Shinhan Card provides annual online training session to all employees to raise awareness of legal compliance and to prevent financial accidents. In 2015, a total of 3,885 employees completed the course. In addition, em-ployees are also required to perform self-compliance checks once a year.
Shinhan Investment Corp. conducts an annual compliance awareness sur-vey to gauge employees’ general level of understanding of ethics and legal compliance. We also provide annual ethical compliance training sessions to employees. At retail branch offices, we try to raise the awareness on compliance by providing education on the changes in finance-related laws and regulations, main compliance monitoring tasks, and incident preven-tion. Finally, every year we designate a compliance officer for each sales branch and HQ department as a means to promote self-training activities and strengthen control.
Shinhan Life Insurance conducts ethics and compliance training during collective employee training sessions as well as those for newly hired plan-ners (22 sessions for employees and 39 sessions for planners conducted in 2015). In 2015, the Company was awarded by the Financial Supervisory Service for its outstanding ethical management practices, which were in-troduced in the FSS’s ‘Handbook of Best Practices’ for the year.
Going forward, Shinhan Financial Group will continue to practice ethical management and fulfill its responsibilities as a responsible corporate citizen.
Leading a More Transparent Financial Culture The group is prepared to detect any possible financial accidents in advance with our Financial Irregularities Reporting System, through which customers can report breaches of law and/or irregularities of employees. Also, we have Whistleblower Reporting System in place through which employees can re-port internal violations of the law, company rules or code of ethics.
SFG provides online/offline training programs to elevate employee aware-ness on issues such as a transparent promotion culture, proper stock transactions, healthy investment practices and the prevention of bribery during holiday seasons. We are working to make ethical practices a natural part of Shinhan’s culture. In particular, since the second half of 2012, we have been sending a notice to all Group employees preventing the send-ing/receiving of gifts between employees during major holidays.
Ethical Management TrainingConstant ethical and legal compliance training is provided to all employees in order to strengthen the ethical standards and legal compliance in all business activities. All employees are required to participate in rank-specif-ic training, or take an online training session at least once a year.
Since 2011, SFG has supported all Group subsidiaries via a joint group-wide ethical and legal compliance online education. This allows all Group companies to easily understand and execute Group’s philosophies and basic values of ethical management.
Shinhan Bank has made the third week of every month Compliance Educa-tion Week (“ABC Week”). During this period, the bank conducts training on the latest ethical and legal issues by circulating “Compliance Letter” which covers recent financial incidents, financial acts and regulations and best

Organization
Shinhan Financial Group Annual Report 2015 036
General Meeting ofShareholders
Board of Directors
Chairman & CEO
Corporate Governance and CEO Recommendation Committee
Board SteeringCommittee
Audit Committee
Risk ManagementCommittee
Compensation Committee
Outside DirectorRecommendationCommittee
Audit Committee MemberRecommendationCommittee
CSR Committee
Subsidiary ManagementCommittee
Group ExecutiveCommittee
Strategic Planning Team Public Relations Team
Information &CommunicationTechnology Planning Team
Human Resource Team
Synergy ManagementTeam
Global Business StrategyTeam
Digital Strategy Team Future StrategyResearch Institute
Audit Team Compliance Officer
Finance Management Team Compliance Team
Risk Management Team CSR Team
Risk Model ValidationTeam
Corporate CultureDevelopment Team
Investor Relations Team Board of DirectorsSecretariat
Management SupportTeam
Wealth ManagementPlanning Office
Corporate & Investment Banking Business Depatment

SHINHAN BANK 100%
SHINHAN-STONEBRIDGEPETRO PRIVATE EQUITY FUND 5) 0.6%
SHINHAN CARD 100%
SHINHAN PRIVATEEQUITY FUND 2nd 3) 2.2%
SHINHAN INVESTMENT CORP. 100%
SHINHAN NPS PRIVATEEQUITY FUND 1st 2) 5%
SHINHAN LIFE INSURANCE 100%
SHINHAN BNP PARIBASASSET MANAGEMENT 65%
PT BANK METRO ExPRESS 97.76%
BANCO SHINHAN DE MExICO 100%
SHINHAN CAPITAL 100%
SHINHAN PRAxISK-GROWTH GLOBAL PRIVATE EQUITY FUND 7) 14.1%
SHINHAN BNP PARIBAS ASSET MANAGEMENT (HONG KONG) LTD. 100%
SHINHAN BANK KAZAKHSTAN 100%
SHINHAN ASIA LTD. 100%
JEJU BANK 68.9% SHINHAN KHMER BANK 6) 90%
PT CENTRATAMA NASIONAL BANK 75%
SHINHAN SAVINGS BANK 100%
SHINHAN SECURITIES VIETNAM LTD. 100%
SHINHAN INVESTMENTASIA LTD. 100%
SHINHAN INVESTMENTAMERICA INC. 100%
SHINHAN BANK EUROPE 100%
SHINHAN DATA SYSTEM 100%
SHINHAN MARITIMEPRIVATE EQUITY FUND 1st 7.1%
SHINHAN BANK CANADA 100%
SHINHAN AITAS 99.8%
SHINHAN BANK AMERICA 100%
SHINHAN CREDIT INFORMATION 100%
KOFC SHINHANFRONTIER CHAMP2010-4 PEF 4)
SHINHAN INVESTMENT CORP. 8.5%SHINHAN CAPITAL 6.5%
SHINHAN BANK VIETNAM 100%
SHINHAN PRIVATE EQUITY 100%
LLP MFO SHINHAN FINANCE 100%
PT SHINHAN INDO FINANCE 50% SHINHAN BANK CHINA 100%
SHC MANAGEMENT 1) 100%
SHINHAN BANK JAPAN 100%
Business Portfolio
037Organization / Business PortfolioSFG overview
SHINHAN FINANCIAL GROUP
1) Currently in liquidation proceedings2) We and our subsidiaries currently own 36.7% in the aggregate.3) We and our subsidiaries currently own 32.6% in the aggregate.4) We and our subsidiaries currently own 34.6% in the aggregate.5) We and our subsidiaries currently own 1.8% in the aggregate.6) We and our subsidiaries currently own 93.3% in the aggregate7) We and our subsidiaries currently own 18.9% in the aggregate

Review of Operations
040 Synergy
042 Digital Banking
044 Global Business
046 Retail Banking
048 Corporate Banking
050 Wealth Management
052 Investment Banking
054 Credit Card
056 Brokerage
058 Life Insurance
060 Asset Management
Shinhan Financial Group has pushed forward consistent long-term strategies for sustainable growth since its inception. In 2015, Shinhan surpassed the KRW 2 trillion mark for the second year in a row and registered the highest net profit in the industry for the eighth straight year.
The feat was the result of a well-balanced business portfolio of banking and non-banking subsidiaries and the synergies from their seamless collaboration underpinned by the Group’s far-sighted growth strategies.
Our efforts will continue to enhance customer value through advanced risk management and group-wide synergies for mutual growth of both Shinhan and its customers.


Shinhan Financial Group Annual Report 2015 040
Synergy
Shinhan Financial Group has directed its synergy activities toward disman-tling business barriers among its different operations, creating synergies through creative convergence of the subsidiaries’ competencies and de-livering differentiated value to our customers. Specifically, the Group has built an efficient business portfolio that consists of a stable banking busi-ness and highly competitive non-banking businesses including credit card, securities, insurance and asset management. Based on our diversified portfolio, the Group offers various products, services, and comprehensive financial solutions and thus creates greater synergies than our competitors.
Our synergy activities not only constitute of cross-selling on various finan-cial products of subsidiaries, but also includes joint marketing, customer re-ferrals and up selling activities. We also strive to maximize customer value by offering hybrid products jointly created by the banking, card, brokerage and insurance affiliates. Toward that end, we have introduced Tops Club as the group’s main customer loyalty program in order to provide systematic cus-tomer management at the group level. In addition, through hybrid branches, we offer customers portfolios optimized to their financial goals.
Drawing on its extensive customer base and subsidiaries’ superior sales competencies, Shinhan Financial Group has since its foundation pursued as its core synergy strategy the channeling of its group-wide competencies into maximizing customer value.
2015 Performance ResultsIn line with its synergy strategic direction of ‘One customer, one company’, the Group has selected and pushed forward the following four key tasks.
First, expand the customer base by cross-sellingThe number of the Group’s active customers grew by 338,000 from 2014 to reach 18.3 million in 2015. Of these, the number of active customers who have conducted business with at least two or more subsidiaries of the Group has increased over 400,000 to reach 6.9 million at the end of the year. The Group conducted joint marketing by segmenting the target customer group by nursery market, faculties, public organizations, and re-tirement market. We also focused on developing hybrid products as the key task in expanding the customer base through cross-selling. In a bid to secure prospective customers, we have developed a credit card exclu-sively for university students in a strategic alliance with the Korea Student Aid Foundation (KOSAF). In preparation for the Account Switching System, we launched a loyalty package service with enhanced customer benefits jointly developed by subsidiaries through collaboration.
To address the growing retirement market, the Group has strengthened the joint marketing of subsidiary products: the Shinhan Card’s ‘Future Planning Card’ developed based on a big data analysis of needs of the older gener-
2013 2014 2015
17,27417,963
2011 2012 2013 2014 2015
21
26 2528
49
18,301
18Persons in millionSFG serves 18 million, more than one-third of the population
Number of Active Customers
Hybrid Branches
Active Customers & Proportion of Cross-selling Customers (Unit: Persons in thousand)
Shinhan Financial Group continues to enhance customer value by maximizing synergy creation based on its diversified business portfolio.
34.7%36.1%
37.7%

ations; and Shinhan Life Insurance’s ‘Shinhan Future Plan Life Coverage’ which helps customers plan their post-retirement lives.
Second, diversify contents and increase channel collaborationWe upgraded our signature loyalty program, ‘Shinhan Tops Club’ for bet-ter customer services. We also expanded the application of credit card marketing platforms such as ‘All That Service’ and ‘Sally Bank’, to other subsidiaries’ services. We have developed various CMA-based hybrid products, increased overseas market alliances, and expanded the use of credit card reward points within the Group.
Third, develop more synergiesIn pursuit of additional synergies, we increased the corporate lending of the saving bank subsidiary, and strengthened the investment product line-up of Jeju Bank through collaboration with Shinhan Bank. To spur syner-gies from corporate sector, we pursued more opportunities for cross-sell-ing to corporate clients and developed additional synergies in the global and IB business areas. We also facilitated the sharing of synergy sales knowhow to cultivate a synergy culture, and upgraded ‘Synergy Plaza’, the Group’s synergy platform to invigorate communication among sub-sidiary employees. Through ‘Shinhan Creative Finance Plaza’, a hybrid CIB branch launched in April 2015, we expanded the IB product lineup for SMEs and offered total solutions to diverse funding needs of corporations.
Fourth, strategic cost saving from the synergy-based pointUnder the revised Financial Holding Companies Act, sharing of customer information among subsidiaries is banned. This change has hampered joint marketing within the Group and increased the marketing expenses of each subsidiary. To address this issue, we have focused on reducing costs from the synergy-based perspective throughout the year to and fi-nally come up with some alternatives; We have obtained consent on co-marketing from 7.63 million customers, and subsequently constructed a new information sharing process with strengthened data security systems.
Business Plans for 2016In 2016, we are planning to leverage our group synergies to our maximum capacity in order to prepare ourselves for the new business environment such as expansion of account switching, individual savings account (ISA) and “robo-advisors. We also would like to take full advantage of the re-cent revision of regulations governing access to depersonalized informa-tion and other revisions adopted to foster the growth of financial holding companies. Specifically, under the synergy strategy banner of 'One Cus-tomer, One Shinhan', we will take the lead in emerging financial trends of digitalization and carry out the following four strategies:
First, bolster new market responses We will develop new markets by embracing the account switching and ISA schemes. In preparation for account switching, we will keep promoting a royalty product package of savings, credit card and loan for preferred customers. We will extend preferential fees/interest rates to the immedi-ate family members of preferred customers and conduct group-wide joint marketing to minimize customer attrition and gain new customers. In par-ticular, we will offer differentiated customer benefits through the group-wide integrated rewarding program developed under the ‘One Shinhan’ concept. Furthermore, to strengthen the Group’s retirement business competencies, we will channel group-wide synergies into developing and promoting retirement products and improve employee competencies in the retirement business as well.
Second, implement the ‘One-Shinhan’ strategyThe One-Shinhan strategy aims to offer unified (One-Shinhan) financial solutions to ‘One Customer’ based on the Group’s resources and compe-tencies. The solutions include integrated customer management, hybrid products, joint marketing, hybrid branch services. As part of the strategy, we will set up a mobile-based group-wide integrated marketing platform to provide upgraded, industry-leading financial services tailored to cus-tomer needs through traditional and non-traditional channels.
Third, develop more synergies Our efforts to develop more synergies will be carried into 2016 as well. We will achieve strategic cost savings by bolstering the Group’s competi-tiveness through inter-subsidiary job-sharing and business consignment and by enhancing efficiencies in channel sharing among subsidiaries. We will also fine-tune the interactive collaboration between Shinhan Bank and Shinhan Investment through activating ‘Creative Finance Plaza’, and spur the joint development of loan products between the two subsidiaries. Fur-thermore, we will enhance collaboration among subsidiaries expanding overseas in line with the Group’s global strategies, strengthen support for overseas channels, and thus develop more synergies overseas.
Fourth, establish ‘One-Shinhan’ CultureLastly, we will establish a corporate culture embodying the ‘One Shinhan’ concept by improving the synergy-based merit system developed to moti-vate employees toward synergy creation. We will also facilitate the sharing of outstanding synergy development cases.
Going forward, we will continue to pursue synergy creation among sub-sidiaries, the founding purpose of the holding company, and do our best to maximize values for our customers.
041SynergyReview of Operations

Shinhan Financial Group Annual Report 2015 042
Digital Banking
Digital banking, once considered as a secondary channel, has quickly emerged as one of the key factors determining the quality of financial ser-vices in step with the growing use of smartphones and rising expectations for differentiated financial services. The advent of new technology on the mobile platform, coupled with the easing of regulations intended to pro-mote fintech business, is expected to further accelerate the speed of the change with a stronger impact.
2015 Performance ResultsHaving anticipated this trend early on, Shinhan Financial Group has long prepared to take the lead in the digital banking. On top of offering tradi-tional financial services via the Internet and a mobile platform, the Group is constantly seeking new opportunities through establishing strategic alli-ances with ICT businesses and incubating fintech startups. As a result, the Group’s digital banking customer base has been expanding over the years. As of the end of 2015, the number of the Group’s smartphone banking cus-tomers stood at 10 million, with app-based credit card users at 4.2 million.
Business Plans for 2016In 2016, under the banner of “One Customer, One Shinhan, and One-Stop Mobile Service,” Shinhan Financial Group plans to provide customers with convenient and useful digital banking services through execution of the following four tasks.
First, establishing ‘One Shinhan’ Digital EcosystemTo establish a distinctive financial ecosystem, the Group will enhance the competiveness of its mobile platform by connecting main services, con-tents, and information of each subsidiary. With this, the customers will con-sider these services as an integrated financial service provided by “One Shinhan.”
Second, expanding the role of finance through strategic partnership.As the name suggests, digital banking inherently requires a strategic part-nership with ICT business. We will continue our efforts to connect ICT firms’ knowhow in the area of platforms with our financial competencies and thus add more customer values.
2013
2013
2014
2014
2015
2015
6,774
49.6
8,608
55.3
10,027
59.2
59.2% 59.2% of our total transactions are conducted through indirect channels.
Transactions through Internet & Mobile Channels
Proportion of Transactions conducted through Internet & Mobile (Unit: %)
No. of Customers Enrolled in Digital Banking Service (Unit: Persons in thousand)
Shinhan Financial Group is strengthening its digital competitiveness with two initiatives: enhancing internal digital capacities and cooperating with non-financial ICT companies. With these efforts, the Group aims to develop a new digital ecosystem and increase customer value.

043Digital BankingReview of Operations
Third, supporting fintech startups through ‘Shinhan Future’s Lab.’Shinhan Future’s Lab (SFL) is a collaboration program developed to pro-vide financial and practical support for Korean fintech startups and en-hance the Group’s technological competitiveness through strategic alli-ance with leaders of new technology.
The main functions of the SFL includes:- Convergence of finance and fintech technology - Mentoring services by internal and external experts from ICT, funding,
legal affairs and venture capital- Material technical supports including office space and ICT testbeds
Lastly, establishing a Group-wide enabler to reinforce digital finance competenciesSuccessful execution of our digital finance strategies takes a group-wide resource channeling. Accordingly, we will prioritize the digital strategies of subsidiaries and establish a group-wide framework for implementing the key tasks. At the same time, group resources, such as organizational sup-port and capital, will be redistributed and channeled toward fortifying the Group’s digital finance competencies.
Shinhan Financial Group will stay focused on completing its digital finance structure that delivers via the mobile platform a variety of services when-ever customer needs.
Shinhan Future’s Lab
Application > >
>
>
Technology Assessment Fostering & Incubation
Demo DaySupporting Global Alliance

Shinhan Financial Group Annual Report 2015 044
Global Business
151 SFG has built up an extensive global network, comprised of 151 networks in 19 countries
Global Networks
No. of Countries with Presence
No. of Networks
Shinhan Bank 19 140
Shinhan Card 2 5
Shinhan Investment Corp. 4 4
Shinhan Life Insurance 1 1
Shinhan BNPP AM 1 1
Group Total 19 151
Shinhan Financial Group’s Global Networks
Shinhan Financial Group sees abundant potential for sustainable growth in the markets worldwide. By capitalizing on global opportunities, we will generate a virtuous cycle of shared prosperity, enhance customer and shareholder values, and spread the Group mission of Compassionate Finance.
Over the past 30 years, Shinhan Financial Group has steadily pursued global expansion with a strategic focus on ‘localization’, ‘ prioritize & fo-cus’, and ‘securing strongholds.’ As a result, we have built up an extensive global network, comprised of 151 networks in 19 countries by the end of 2015 and recently the growth of global business has been accelerating.
At the beginning, our focus was on international financial hubs, where eas-ier and sturdy market entrance was possible; and then, based on accumu-lated experience and know-how, we have begun expanding into emerging markets in Asia. Over the recent 5 years, from 2010 to 2015, the loan as-sets of global operations showed 43 % increase and their contributions to the Group’s net income have tripled from 2 % to 6.7 %.
2015 Performance ResultsIn 2015, Shinhan Financial Group pursued three key initiatives in line with its strategic direction of “localization of operations and diversification for expansion methods”.
First, we stepped up our localization efforts.During the year, we made new attempts to enhance the localization on a group-wide basis. Overseas local operations were empowered to make important decisions on their business, while the headquarters set up ‘Global Lending Support Team’ as a communication channel between the headquarters and local networks concerning global corporations operat-ing in the respective local markets.
Secondly, we continued developing new business models.For several years Shinhan Financial Group has been working to iden-tify new growth opportunities in promising markets. The business model, which had previously focused only on Korean companies, has been up-graded to include local companies. For instance, Shinhan Bank became the first Korean bank to offer through its Vietnam subsidiary payroll ac-counts and employee credit loan products for local employees of Korean corporations in Vietnam, one of our strategic markets. These represent our first steps toward successful localization and new sources of revenue. We also recently selected the Philippines as a target market, for we see unlim-ited growth potential, with its population numbering 100 million. In Novem-ber 2015, Shinhan Bank successfully opened a branch in Manila, the first of its kind by a Korean financial institution since 1994.
Lastly, we diversified our methodology for global expansion.Taking full advantage of our balanced business portfolio, we are diversify-ing our global expansion methodologies. Non-bank subsidiaries are ac-

companying Shinhan Bank’s overseas expansions, bolstering the Group’s non-banking business portfolio in the global market.
In 2015, Shinhan subsidiaries generated synergies in global markets as well. Shinhan Card established a subsidiary in Kazakhstan and began its operation in July. In Vietnam, Shinhan Life Insurance opened a representa-tive office in June and Shinhan Investment Corp. acquired a local securi-ties firm in July. As a result, now we can provide comprehensive financial services and products for Vietnam customers with operations ranging from banking to credit card, brokerage and life insurance. In step with Shinhan Bank’s acquisition of BME and CNB, local banks in Indonesia, Shinhan Card entered the market through joint venture with Salim, a local conglomerate, in December and Shinhan Investment is also planning its own market entry.
Business Plans for 2016In 2016, Shinhan Financial Group plans on developing a group-wide global co-marketing platform by diversifying contents and offering quality services. To that end, we have developed the four strategies as follows.
First, diversifying entry strategiesIf we focused on organic growth for the global expansion in the past, we will be concentrating next 3 years on M&A and equity investment oppor-tunities in global markets. To supplement our relative weakness in number of networks compared to local financial firms, we are also planning to enter the business of operating non-face-to-face channels reaching many parts of the global market. By diversifying our market entry strategies in the regions with high growth potential, we will continue to expand our long-term growth base.
Second, increasing profits from overseas operationsWe will continue to bolster collaboration among subsidiaries in step with their growing joint market entries overseas. We will also expand the pro-portion of non-interest incomes by growing non-banking operations and secure new income sources by developing new business models opti-mized to local market conditions.
Thirdly, upgrading the operational structure.The growing overseas network of the bank and increasing joint entry with non-banking subsidiaries has given rise to the need for an efficient collab-oration in the respective local markets. Accordingly, we will explore better ways for subsidiaries to collaborate with one another in the local markets and construct an efficient operational framework by extending support to their local operations at the group level.
Lastly, improving localization initiatives.Localization is essential to sustainable global expansion: namely, em-powering local talents, local customers-focused marketing, and localized operations. While upgrading products and services to meet the needs of local customers, we will continue to realign the work process with local needs and enhance our competitiveness in the respective markets.
045Global BusinessReview of Operations
Global Business Overview
2011 2012 2013 2014 2015
Global assets 13,506 15,334 16,011 17,223 18,318
Global profit 99 93 102 123 141
Contribution to Group net income (%)
3.5 4.5 5.9 6.2 6.7
No. of networks 66 69 71 75 151
No. of countries with presence
14 14 15 16 19
No. of employees sent from headquarters
180 187 188 184 212
No. of locally hired employees
1,261 1,417 1,617 1,799 2,963
(USD million)

Shinhan Financial Group Annual Report 2015 046
Retail Banking
The retail banking organization consists of 3 groups and 9 departments. Retail Banking Group is in charge of retail channel, WM Group serving high net-worth customers, and Institutions Group attending to the needs of gov-ernmental agencies and public institutions. In addition, there are 27 regional headquarters, each managing and supporting branch operations. In 2015, we streamlined the branch network reducing the number by 28 to 540 (723 counting financial centers) for better productivity. As of the year-end, the total number of employees in the retail banking sector stands at 8,531.
2015 Performance ResultsDespite the challenging business environment marked by a protracted economic slump and successive base rate cuts, Shinhan Financial Group achieved superior performance in all of its retail operations on the strengths of its outstanding sales competencies.
First, we achieved the honor of being the No. 1 bank in profitability by increasing quality assets and enhanced risk management. In household lending, we pursued market segmentation and boosted the sales of high-margin loan products including Hannuri n-Nanum Loan which targets so-cial workers. We took full advantage of a recovering housing market to grow mortgage lending. On the other hand, an increase in credit card set-tlement accounts and a steady inflow of funds from public entities helped boost our low-cost deposits
Second, we expanded the customer base and diversified income sources by increasing non-interest incomes. The number of active customers, a customer segment crucial to sustainable growth, grew to 9.25 million, up 489,000 from 2014, nearing a symbolic 10 million milestone. Sales of non-interest income products grew including installment mutual funds, credit cards, and bancassurance, all contributing to diversify the revenue struc-ture. The number of installment mutual fund accounts, in particular, dou-bled over the previous year to 415,000, contributing to a stable stream of non-interest revenue in the long run. The revenue structure was further buttressed by a healthy increase in credit card accounts, with the number of new credit cards totaling 293,000 in 2015.
Third, in the pursuit of the Group’s mission, “Compassionate Finance: Your Companion for the Future,” we made meaningful achievements in the ar-eas of customer satisfaction and microfinance. Throughout the year, we have continued to provide the customized products for low-income cus-tomers such as New Hope Seed Loan. In recognition of such efforts, the Financial Supervisory Service in 2015 named us the Best Bank in Microfi-nance, for the third year in a row. Moreover, Shinhan Bank was ranked first in all five major customer satisfaction surveys, conducted by renowned
2013
2013
2014
2014
2015
2015
8,308
53
8,769
62
9,258
74
1stBest Bank
Low-Cost Deposits(Unit: KRW in trillions)
Active Customers(Unit: Persons in thousand)
The Financial Supervisory Service in 2015 named Shinhan Bank the Best Bank in Microfinance, for the third year in row.
Under the slogan “Through Candid Communication, Retail on the Go,” we focused on our core strengths and delivered outstanding results in terms of growth, profitability, asset quality, and customer satisfaction, all worthy of the No.1 bank in Korea.

industry watchers such as the Korea Standard Association, Korea Produc-tivity Center, and Korea Management Association.
Business Plans for 2016 Our goal in retail banking for 2016 is to better cope with adverse market conditions and become a leading retail group by drawing on the growth momentum we gained in 2015. With the strategic objective of “exception-al, leading retail,” we have selected five strategic tasks to pursue this year.
First, we will expand the customer base with special focus on primary customers. In 2016, we will increase the number of active customers by 750,000 surpassing the 10 million mark. To that end, we will further im-prove sales efficiencies by channeling marketing tools and resources to-ward reaching target customer segments such as office workers, women, and individual business owners. By drawing on the Group’s competitive-ness in customer relationship management and product development, we also will strive to outpace our competitors in account switching and promoting individual savings accounts (ISA). Through these efforts, we will continue to consolidate our market leadership and attract new customers. At the same time, we will find new customers through sign-up for credit card payment settlement services, and extensively use cross-selling as a tool to induce customers to make us their primary bank.
Secondly, we will optimize the revenue structure of retail banking. We will continue to grow household and corporate loans with a focus on high quality assets and improve the net interest margin by increasing core de-posits. In order to increase non-interest incomes, we will explore all op-tions available to spur the sales of mutual fund, bancassurance, credit card and F/X operations.
Thirdly, we will speed up our globalization, platform, and segmentation (GPS) initiatives. As for globalization, we will share best retail banking prac-tices with our overseas subsidiaries, while constructing a new platform that will enable us to secure more customers through cross-industry alliance. At the same time, we will continue segmenting existing markets in a pursuit of niche markets, while upgrading such specialized markets as childcare mar-ket, school faculties, social workers, and vocational high schools.
Fourth, we will pursue community-based collaboration with a new dis-trict scheme. To bolster collaboration among the retail banking, corpo-rate banking, WM, and CIB operations, we have adopted a new district scheme, in which retail and corporate banking branches in a same district can generate additional synergies through collaboration. This will not only contribute to improve efficiencies in the channel operations but also in-
crease the alliances’ market share within the regional markets, which will contribute to improve the bank’s overall performance.
Lastly, we will build a great workplace, a first step of our new start toward excellence. We are building a workplace where employees work feel mo-tivated to improve their competencies and produce outstanding results in a consistent manner.
Based on these strategies, our retain banking will be able to achieve an-other excellent year in 2016.
Mortgage Loan (Unit: KRW in trillions)
047Retail BankingReview of Operations
- Growth Rate▒ Mortgage Loan
52.1
2015
47.6
2014
44.3
2013
9.5%
-3.1%
7.5%

Shinhan Bank A Bank B Bank C
No. of borrowers 11,371 8,380 6,107 5,578
Value Amount 5,497 4,667 4,253 3,470
Shinhan Financial Group Annual Report 2015 048
Corporate Banking
Corporate Banking Group oversees the large and SME banking operations of Shinhan Bank through its organizational network of four headquarter departments, six regional headquarters, and 190 branch offices. Maintain-ing competitive advantages in core corporate banking services, including international trade and foreign exchange, we strive to differentiate our-selves through introducing innovative financial services and products such as technology finance, hybrid products fused of investment and loan, and specialized IB services developed for mid-tier and SME clients. Further-more, our 504 relationship managers (RMs) specializing in corporate bank-ing are working diligently to offer financial solutions optimized to changing needs of our corporate clients.
2015 Performance ResultsIn the face of difficult business environment with sustained low interest rates and low growth, we adopted as a strategic objective, ‘Creative ter-ritory expansion, great leap in corporate finance’ and implemented three core tasks: ‘strengthening core business (strong corporate finance),’ ‘effi-cient business practice (smart corporate finance), ’and ‘differentiate future competitiveness (prepared corporate finance).’ As a result, we delivered outstanding results in all of our operations in terms of growth, profitability and asset quality.
Strengthening core business (strong corporate finance)As part of our strategy of growing quality assets, we focused on balanced growth in core markets comprising audited mid-cap, audited small cap, and blue chip unaudited small cap companies. In 2015, we extended our lead in mid-cap and audited small cap market and further penetrated into the unaudited blue chip markets, in which we had a meaningful progress in 2014. As a result, we increased SME lending by KRW 3.9 trillion over the year. We also improved the competiveness of our loan products and services by structuring them based on the lifecycle of our corporate cus-tomers. As a result, the number of SME borrowers with more than KRW 100 million outstanding loans grew by 3,979, another industry-best figure of the year. Meanwhile, we maintained our unrivaled market leadership in the retirement pension market for six consecutive years.
Efficient business practice (smart corporate finance)In 2015, we sought to improve sales efficiencies in order to achieve sus-tainable growth. In response to the explosive growth of ‘smart finance’, we enhanced our non-face-to-face channel competitiveness and optimized corporate banking channels, by overhauling the corporate internet banking system. Furthermore, we carried out, in close consultation with regional di-visions and branch heads, a series of marketing campaigns, each tailored to the characteristics of its respective market. In addition, we efficiently
2013 2014 2015
9,048 11,192
13,372
1st Ranked first in the retirement pension market for six consecutive years in terms of assets under management.
Retirement Pension Accounts of Shinhan Bank
Retirement Pension(AUM)(Unit: KRW in billions)
Performance Results in Technology Financing
(KRW billions)
As a pioneer of corporate banking, we serve our corporate clients with diverse financial services and solutions tailored to their specific needs.

Leading future business (prepared corporate finance)Lastly, we will continue to pursue our competitive advantages in future growth markets. To foster future market leaders, we will further upgrade human resource programs. In particular, we will reinforce core competen-cies of employees and upgrade ‘RM Master program’, the most advanced of our training sessions dedicated to cultivating corporate finance special-ists. Finally, we will continue to enhance our expertise in tech-financing and relationship-based financing in order to secure sustainable growth engines in corporate finance.
In 2016, we will do our utmost to extend our lead in the corporate banking through change and innovation.
SME Loans (Unit: KRW in trillions)
049Corporate BankingReview of Operations
- Growth Rate▒ SME Loan
67.3
2015
59.9
2014
55.1
2013
12.4%
7.3%8.8%
managed margin spread in order to defend interest incomes and diversi-fied profit sources to boosting non-interest incomes.
Differentiate future competitiveness (prepared corporate finance)We also focused on maintaining out commanding lead in growing future markets. In TCB-based lending, we ranked No.1 in terms of number of borrowers and valuations by providing customized financial solutions to technology-intensive SMEs.
Business Plans for 2016 In response the ever-intensifying competition in corporate banking and other uncertainties hanging low on the business environment, we have adopted as a strategic objective for 2016, ‘Territory expansion Value-Up, Solidifying the No. 1 brand image in corporate banking’; and identified the following as strategic tasks to accomplish this year: ‘Improving the profit-ability of core businesses (strong corporate finance)’, ‘Reinforcing smart business practices (efficient corporate finance)’, and ‘Leading future busi-ness (prepared corporate finance).’
Improving the profitability of core businesses (strong corporate finance)For another successful year, we plan to focus on growing profitable assets in our core SME lending markets. In addition, we will expand our customer base on a sustainable basis by making full use of state-backed funds and enhancing long-term customer relationship management. At the same time, we will continue to solidify our market position in F/X and foreign investment by tapping into our global cross-selling network.
Reinforcing smart business practices (efficient corporate finance)We will further improve sales efficiencies in order to achieve sustainable growth. We will seek out new business opportunities by expanding alli-ances with the SMBA, KOTRA, and other government agencies. We will offer optimal financial services for startups and cutting-edge tech compa-nies taking the funding opportunities presented by the Technology Com-mercialization Management System (TCMS) and Korea Credit Guarantee Fund. By increasing non-interest incomes and core deposits, we will also continue to diversify the profit structure and thus enhance the stability of the profit base.

Shinhan Financial Group Annual Report 2015 050
Wealth Management
In 2012, Shinhan Financial Group launched PWM Center, a co-location branch model offering the products and services of both Shinhan Bank and Shinhan Investment Corp. Two new PWM Centers were added in 2015, bringing the number of PWM centers to 27 by the end the year. In addition, we opened 16 new PWM lounges to extend PB services to those with KRW 100 million and more. Previously PB services had been reserved exclusively for high net-worth individuals with more than KRW 300 million in AUM. A total of 671 employees provide their clients with top-tier wealth management solutions by leveraging the force of the two industry leaders fusing their strengths toward creating the highest possible customer value.
2015 Performance ResultsIn 2015, we stayed focused on retaining its unrivaled leadership in the WM market by proactively responding to market developments.
Customer-oriented asset management practicesIn 2015 we laid the foundation for improving investment returns by adopt-ing company-wide ‘Principles of Customer-Oriented Asset Management Practices.’ We put in place an industry-leading asset management sys-tem to manage customers’ investment returns more effectively. We also included customers’ return rates in the criteria by which we evaluate the performance of PWM Centers and PB team heads.
Delivering unrivaled results across major indicatorsIn 2015, the Group’s PWM division realized an asset growth of KRW 3.1 trillion and posted KRW 189.6 billion in profit (combining the pre-expense operating profit of Shinhan Bank PWM and net operating income of Shin-han Investment PWM). In securing high-net-worth customers, we achieved the industry’s best performance in terms of annualized average growth. (Shinhan Bank ranked No. 1 in the growth of HNW customers with AUM more than KRW 1 billion, Shinhan Investment Corp. also at the top in the growth of those with AUM more than KRW 100 million). In a bid to become the first mover and gain an edge over the competition in retirement plan-ning, We expanded the Future Plan Center program to cover the entire re-tail branch network. We established 784 Future Plan Centers and opened a total of 1.79 million future planning accounts.
Enhancing brand value with accolades and recognitionsIn recognition of our outstanding asset management performance, do-mestic and international industry watchers in 2015 presented awards and accolades acknowledging Shinhan as Korea’s top PB brand. The Banker, in particular, singled out Shinhan as ‘The Best Domestic Private Bank in Korea’, for the second year in a row while The Asset praised us as ‘Best Private Bank in Korea.’
2013
2013
2014
2014
2015
2015
6,522
7,150
7,263
11,664
8,485
13,330
1st Ranked 1st in the PB category of the Korea Standard Premium Brand Index (eight years in a row, jointlyorganized by the Korea Standards Association, Choseon Ilbo, and Seoul National University)
Private Banking Brand
No. of Clients with more than KRW 100 million in AUM Shinhan Investment Corp.
No. of Clients with more than KRW 1 billion in AUM Shinhan Bank
Based on co-location of Shinhan Bank and Shinhan Investment Corp., Shinhan PWM offers integrated wealth management services through the IPS (Investment Products and Services) department. With our differentiated wealth management model of tailored financial solutions, we create the highest value for our customers.

Business Plans for 2016In 2016, Shinhan PWM will double its efforts to improve the qual-ity of wealth management services by leveraging the Group’s unrivaled strengths in developing optimal financial solutions. To that end, we have defined as the mid-to long-term goal ‘Only the Best WM, the Customers’ Choice’ and identified the following strategic tasks.
Creating customer value through active asset managementWe will introduce a new management scheme that facilitates the man-agement of customers’ investment return. Namely, we will overhaul the existing performance evaluation system, which has focused on the branch performance results, to take into account of performances related to cus-tomer investment returns. While developing innovative products, we also will reinforce our after-sales care on all products we sell.
Strengthening Leadership in WM market targeting HNW customersNext, we will continue to expand the PWM Lounge program which tar-gets customers with KRW 100 million or more in AUM. At the same time, by upgrading the retail channel’s asset management competencies, we will seek to strengthen our role in the WM market dedicated to the HNW customers.
Developing a WM business model subject to sustainable growthWe will establish an integrated asset management model that brings into one service point all products and services of Shinhan Bank, Shinhan In-vestment Corp. and Shinhan Life Insurance.
Exploring new markets through global WM operationsWe will pursue WM business opportunities in the Asian markets where Shinhan Bank has established a presence. We will also seek strategic al-liance with international financial groups to gain a foothold in the global WM market.
Completing digital asset management platformTo keep up with the rapidly evolving market environment, we will develop mobile-based WM channels. While adopting standardized asset manage-ment tools for developing investment solutions, we will gradually integrate the non-face-to-face channel platforms of each subsidiary into a mobile-based One Shinhan system.
Reinforcing differentiated competencies in retirement businessWhile offering retirement solutions that can cover more HNW customer needs, we will expand our consulting services covering taxation and real estate and continue to develop the platform for non-financial services. Also, by reinforcing the training of our retirement planners, we will offer financial services that mirror the excellence Shinhan pursues.
In 2016, competition in the WM market is expected to intensify on the as-cendance of Internet banks, the continuance of financial deregulation, and the endurance of uncertainties gripping global markets. Bracing ourselves for such a harsh environment, we will stay focused on growing into Only Best WM of Customers’ Choice by persistently implementing our new mid-to long-term strategies based on our experiences and competencies we have built up over the years.
051Wealth ManagementReview of Operations
2015 Awards & Recognitions
Organization Prize Remark
International
The Asian Banker Best Private Banking Korea First
The Asset Triple A Investment Awards 2015 – WM/PB WM (four consecutive years), PB (first)
The Banker Best Domestic Private Bank in Korea Two years in a row
Korea
Korea Standard Association KS-PBI (Premium Brand Index) – PB category Eight consecutive years
Korea Management AssociationTHE PROUD Korea Luxury Index – PB category Five consecutive years
THE PROUD Best Customer Value – retirement planning category (Shinhan Future Plan) First
JoongAng Daily Best of the Best Awards – PB category First

Shinhan Financial Group Annual Report 2015 052
Investment Banking
Established in 2012, Shinhan CIB has been successful in providing op-timal IB solutions for its corporate customers by successfully combining the strength of the Shinhan Bank’s CIB division and Shinhan Investment Corp.’s IB division.
2015 Performance ResultsIn 2015, Shinhan CIB achieved significant growth from the previous year, in terms of both size and quality. Collaboration volume and cases increased by 9% and 6 %, respectively, with the proportion of collaboration in the non-bond issuance areas expanding from 35% to 54% in volume, and from 34% to 46% in cases. This is a clear indication that collaboration between the two companies is moving beyond bond issuances into other areas. In 2015, the CIB unit carried out a total of 140 collaboration deals worth KRW 6.06 trillion.
Based on such stronger cooperative ties, Shinhan CIB channeled its re-sources into being competitive in the DCM (debt capital market), expand-ing its alternative investment operations, and constructing a new platform for leading the IB market catering to SMEs.
Maintaining competitive edge in DCMIn 2015, Shinhan Bank topped all commercial banks, for three consecutive years, in the loan syndication market for its successful arrangement of the mega M&A financing involving Halla Visteon Climate Control and Home-plus. Shinhan Investment, however, was demoted by one notch in each of the debenture/ ABS lead manager league tables due to its profit-focus growth policy. As for the equity capital market, the CIB unit successfully ar-ranged major deals such as Lotte Insurance’s rights offering and SK D&D’s IPO, thereby shoring up its track records in the market.
Expanding alternative investmentIn 2015, we established a number of mutual funds in a bid to reinforce our competitiveness in the alternative investment market. In particular, we created a KRW 106 billion fund to finance SMEs and MEs’ global expan-sions, leaping toward our goal of becoming one of the top 3 private equity house in the brokerage sector. We also established two funds totaling KRW 140 billion that invest in fin-tech businesses and SMEs with prospective technologies and growth potential. We also created a fund that invests in refinancing of infrastructure projects to reinforce our competitiveness in the alternative investment market.
Constructing a new platform for leading the IB market catering to SMEs.Lastly, Shinhan CIB opened its eyes early on to the growth potential of the IB market developed for SMEs and MEs. In 2015, we launched an innova-tive investment banking-service platform called Creative Finance Plaza: It
Profit Contribution by Business Line
1st Shinhan Bank topped all commercial banks, for three consecutive years, in the loan syndication market for its successful arrangement of the mega M&A financing
Loan Syndication
Profit Contribution by Business LineShinhan Investment Corp.'s IB Division
▒ Project Finance ▒ DCM/ECM ▒ Structured Finance ▒ M&A▒ Investment Banking ▒ Hong Kong IB ▒ Syndication
Shinhan Bank's CIB Division
▒ Investment Banking ▒ Project Finance ▒ Structured Finance ▒ Real Estate Finance
Shinhan’s CIB offers total corporate and investment banking solutions based on collaboration of Shinhan Bank and Shinhan Investment Corp.
27%
14%
18%
42%
2%
35%
22%
21%
9%
7%4%

taps into Shinhan Bank’s SME/ME client base and offer Shinhan Invest-ment’s advanced capital market solutions. By the year-end, five Creative Finance Plazas were in operation, with three located in the Seoul metro-politan area and two in regional cities. Each Plaza is run by relationship managers from Shinhan Bank and Shinhan Investment, serving corporate clients with total CIB solutions optimized to their individual needs.
Shinhan’s CIB unit has continued to extend its collaboration reach and strengthen its role as the IB solution provider within the Shinhan Financial Group. More details of its collaboration plans are described in the table below.
Business Plans for 2016 In 2016, Shinhan CIB will continue to explore diverse options of solidifying the long-term growth basis and securing sustainable growth.
First, to maximize synergies, we will integrate the planning/strategy-build-ing units of Shinhan Bank and Shinhan Investment, improve consistency in CIB strategies, and upgrade sales support systems, including evalua-tion, personnel management and education.
Second, through collaboration with Shinhan BNP Paribas Asset Manage-ment, we will continue creating funds through which we can lead the mar-ket such as the Senior Loan Fund and Solar Fund.
Third, we will spur overseas investment in various areas and expand the global business platform.
Fourth, we will further stabilize the system and expand the network of the Creative Finance Plaza to secure a vantage point in the IB market devel-oped for SMEs and MEs.
Lastly, we will strive to further enhance Shinhan Investment’s competitive-ness in the non-bond issuance areas.
In dealing with protracted uncertainties in the business environment, Shin-han CIB will proactively respond to market changes and continue evolving toward a brighter future.
053Corporate & Investment Banking Review of Operations
Shinhan Financial Group CIB Model
Shinhan Investment’s RM
+Shinhan Bank’s RM
Creating customer value through customer-oriented management and informa-
tion protection
Enhancing credibility through
strengthening ethical management
Implementing risk management that considers social
and environmental factors
Developing human resources
and creating a great workplace
culture
Contributing to the development
of local communities
through social contribution
activities
Expanding
underserved people
Pursuing shared growth with suppliers and supporting their CSR activities
Developing green products/services
Using resources
environmental impacts
Economy Environment
Society
Corporate Customers
Shinhan Investment’s RM
+Shinhan Bank’s RM
ONE-PORTALFINANCIAL SOLUTION
Shinhan Bank’s CIB Division
SHINHAN CIB
Shinh
an Investment Corp.’s IB Group
Creating customer value through customer-oriented management and informa-
tion protection
Enhancing credibility through
strengthening ethical management
Implementing risk management that considers social
and environmental factors
Developing human resources
and creating a great workplace
culture
Contributing to the development
of local communities
through social contribution
activities
Expanding
underserved people
Pursuing shared growth with suppliers and supporting their CSR activities
Developing green products/services
Using resources
environmental impacts
Economy Environment
Society
Corporate Customers
Shinhan Investment’s RM
+Shinhan Bank’s RM
ONE-PORTALFINANCIAL SOLUTION
Shinhan Bank’s CIB Division
SHINHAN CIB
Shinh
an Investment Corp.’s IB Group
Corporate Customers

Shinhan Financial Group Annual Report 2015 054
Credit Card
2015 Performance ResultsIn 2015 the domestic card industry saw threats and opportunities arising in tandem, the former from the foray of non-financial companies into the payment market, and the latter from the deregulation of ancillary services for credit card issuers. Against this backdrop, Shinhan Card proactively responded to new threats and opportunities with creative strategies. The strategies we devised and implemented in the year are titled ‘First Mover’ and ‘Fast Follower.’ By executing the strategies with vigor and foresight, we succeeded not only in taking the lead in the new markets emerged in the year, but also in sharpening our competitive edge in areas we had been fast catching up.
The ‘First Mover’ strategy was devised to seize on the opportunities pre-sented by market developments over the last few years. We expanded our market dominance in mobile card business and reaped tangible results from global operations. In particular, our performance in the app-based mobile credit card market, we had pioneered in 2013, showed a notable growth: the number of active members grew to four million by the end of 2015, with its cumulative transaction volume of KRW 3.8 trillion, far sur-passing that of the runner-up. In addition, we formed diverse service alli-ances to promote mobile credit card usage, thereby laying the foundation for transforming the app-based credit card into a service platform capable of offering a wide range of customer benefits.
The year 2015 also witnessed the birth of Shinhan Card’s global expansion plan. In July, Shinhan Card opened a subsidiary in Kazakhstan for the first time in the history of Korean credit card business. We also laid a foothold in the Southeast Asian market in December by launching a joint venture with Salim in Indonesia, a market with huge growth potential. We now fo-cus on training regional experts well-versed in the languages and cultures of the countries, as part of the effort to bring our localization strategy to a success.
We also made solid progress in the areas where we were fast catching up, implanting the ‘Fast Follower’ strategy through quick responses and prompt remedial actions. Our debit card business is a good example. In 2015, we increased the market share of debit card business by 1.3%p to 18.9%. To reinforce the installment finance operations, we also entered long-term rental car business and got the new business on track in a short time.
As a result of these strategic moves, we achieved a 7.9 percent year-on-year growth in transaction volume, with retail credit card sales surpassing KRW 100 trillion. The business efficiency efforts also led to a significant improvement in profitability, with the net income amounting to KRW 694.8 billion, up 9.4 percent from the previous year.
2013
2013
2014
2014
2015
2015
93,794
658.1
100,163
635.2
108,036
694.8
22.5% No. 1 market share in Korea (retail credit purchase volume)
Market Share
Net IncomeShinhan Card(Unit: KRW in billions)
Transaction Volume (Retail credit sales + debit sales)(Unit: KRW in billions)
Despite sagging domestic consumption, Shinhan Card delivered remarkable performance by proactively responding to challenges with effective marketing strategies. While dominating the credit card business, we also made significant progress in the cultivation of future growth engines.

On the strength of these exceptional performance results, Shinhan Card took the 1st place in terms of brand competitiveness among all Korean fi-nancial firms in the ‘2015 Korea 100 Brand Evaluation’ by the Brand Stock. The number of our Facebook followers surpassed 700,000 in 2015—a first in the Korean financial industry.
Business Plans for 2016 In 2016, the business environment is widely forecasted to undergo drastic changes: recent emergence of fin-tech is leading to a market shakeup and risk factors are piling up both at home and abroad. To remain competitive in this rapidly changing market, we should respond to the changes both promptly and effectively. Sharing the view, Shinhan Card has developed its strategic tasks for 2016 with the basic concept of ‘Fast Response’ and came up with an ‘on-demand’ organizational framework that facilitates instant response to market developments. The followings are six strate-gic tasks we have identified for this year: solidifying the leadership in the mobile trend; diversifying new business models; putting global expansion at full throttle; bolstering the credit card customer base; expanding the effects of strategic cost reductions; and establishing a strong corporate culture based on the Shinhan Way.
First of all, we will further cement our leadership in the mobile payment market as part of the initiative to secure future growth engines. On the back of the continuing growth in the mobile card customer base, we will upgrade the service contents of the app-card and enhance its competi-tiveness as a new platform. While developing new business models at home, we will actively explore opportunities abroad to enter new mar-kets based on the experience and know-how we have cumulated over the years.
At the same time, we will continue sharpening our competitive edge in the traditional business domain. For a start, we will focus on solidifying our credit card customer base, for they not only constitute the source of current revenue streams, but buttress our future growth as well. In particu-lar, we will make strenuous efforts toward increasing the number of card members in their twenties and thirties. In order to establish a platform for sustainable growth, we will further improve operational efficiencies in the management of channels, personnel and processes, while strategically deploying resources.
In 2016, the credit card industry, reeling from the recent drop in merchant fees, will feel more pressured to improve profitability than ever before. Ac-cordingly, we will bypass competing for volume growth and go straight for higher management efficiencies, drawing upon the market control of the top player. Through these endeavors, we will practice our mission, Com-passionate Finance, to our utmost and further solidify the trust-based re-lationships we have developed together with our customers and markets.
Shinhan App-Card
055Credit CardReview of Operations
3.82.0
0.3
Creating customer value through customer-oriented management and informa-
tion protection
Enhancing credibility through
strengthening ethical management
Implementing risk management that considers social
and environmental factors
Developing human resources
and creating a great workplace
culture
Contributing to the development
of local communities
through social contribution
activities
Expanding
underserved people
Pursuing shared growth with suppliers and supporting their CSR activities
Developing green products/services
Using resources
environmental impacts
Economy Environment
Society
Corporate Customers
Shinhan Investment’s RM
+Shinhan Bank’s RM
ONE-PORTALFINANCIAL SOLUTION
Shinhan Bank’s CIB Division
SHINHAN CIB
Shinh
an Investment Corp.’s IB Group
● Transaction Volume (KRW in trillions)
▒ App-Card Holders (Persons in thousand)
201520142013
4,000
2,500
800

Shinhan Financial Group Annual Report 2015 056
Brokerage
As of the end of 2015, Shinhan Investment Corp. had a network of 108 domestic sales offices and five overseas sales entities. Leveraging this ex-tensive network, we win over new customers and generate differentiated profit across all our operations.
2015 Performance ResultsOur 2015 strategic objective was to become one of the top 3 in all of our operations. To this end, we developed for each area a detailed strategy fo-cusing on the followings: increasing customer returns by reinforcing com-prehensive asset management sales capabilities; revamping retirement pension business models and increasing returns on retirement pension assets; optimizing business efficiencies through innovation of operating systems; maintaining the market leadership in wholesale and building a comprehensive service system for corporate clients; providing creative solutions to corporate clients and expanding investment banking; and launching market-leading products by leveraging overseas assets and di-versifying investments. In addition to the performance-focused strategies, we strived to build a customer-oriented corporate culture by carrying out the Group’s mission of Compassionate Finance.
As a result, Shinhan Investment Corp. generated a net income of KRW 215.5 billion, up 82.2 % from the previous year.
Retail BusinessIn 2015, retail client assets under management (including PWM) grew by KRW 9.9 trillion from 2014 to reach KRW 57 trillion, with net operating profit advancing KRW 117.4 billion year on year to KRW 362.7 billion. This can be attributed to the stable profit structure we have built by focusing on the diver-sification of profit sources through enhancing asset management business. Meanwhile, our brokerage business saw its market share improve across all segments, shoring up the foundation for sustainable growth.
Wholesale BusinessThe wholesale business continued reinforcing its marketing competencies against a fierce competition, rising to higher rank in all segments. Its profit and market share on oversees equity both topped the industry, while the balance of financial products sold to customers also increased, by KRW 10.3 trillion to KRW 34.9 trillion through collaboration between the sales & trading and IB sectors. Corporate equity sales also rose in terms of both profits and market share, maintaining its No.1 rank for the three consecu-tive years.
2013
2013
2014
2014
2015
2015
75.4
118.2
31.6
43.1
56.1
215.5
82.2%Shinhan Investment Corp. generated a net income of KRW 215.5 billion, up 82.2 % from the previous year
Net Income Growth
Net Income Shinhan Investment Corp.(Unit : KRW in billions)
Financial Product Assets (Unit: KRW in trillions)
Shinhan Investment Corp. offers innovative financial solutions based on its industry-leading competencies in research, asset management, risk management, and overseas sales.

IBThe IB Division is reinforcing its competencies through the cooperation with Shinhan Bank’s CIB division by leveraging on the group-wide col-laboration model, Shinhan CIB. In 2015, the IB Division of Shinhan Invest-ment generated KRW 65.3 billion in profits, up KRW 16.2 billion from 2014. It ranked second in the ABS and fifth in the debenture categories of the DCM league table.
Sales & TradingDespite volatile market trends and slowing growth in the Chinese market, the Sales & Trading sector earned KRW 130.7 billion in profit through the diversification of investment strategies and asset portfolios. With the aim of achieving a stable investment yield, we are proactively diversifying the investment asset composition by investing in offshore assets and acquir-ing licenses, while developing scenario-based investment schemes based on stricter risk management practices.
Business Plans for 2016For 2016, we have defined as our strategic goal ‘Innovation for customers, challenging the top.’
To that end, we have devised two strategic directions as follows: build basic infrastructure and competencies required for growing into a leading financial investment company; and establish a customer-oriented corpo-rate culture concentrating on Compassionate Finance. In line with these, we plan to implement the following nine key tasks.
Innovate the comprehensive asset management sales platformWe will enhance channel operation efficiencies with focus on customer needs. The marketing approach will be transformed from conventional product-based selling to portfolio-based marketing such as the Expert Managed Account (EMA). For the brokerage business, we will improve
the customers’ investment return by partnering with prominent advisory agencies. For corporate clients, we will set up a consulting team to spur corporate client targeting. In human resource development, we will focus on building up employee competencies as a way to improve customer returns. To foster future leaders, we will implement new human resource development programs.
Upgrade development/operational competencies for distribution of products within the GroupWe will establish seamless collaboration among product development, sales and after-sale care channels. Before launching new products, we will analyze their suitability through risk assessment, customer sampling, and market-sensing.
Expanding the base for trusts/pension assets through improvement of returnsWe will develop a number of asset-based new products that can be cus-tomized to each customer segment’s needs, develop computerized sys-tems for trusts, and establish infrastructure for marketing activities. As for retirement pension, our future growth driver, we will improve the work process in accordance with regulatory changes and focus on attracting new customers.
Lay the foundation for new business in global/private funds/real estateWe will step up the glocalization strategy by expanding global markets and collaborating with subsidiaries. While constructing infrastructure for Prime Brokerage Service, private equity fund, and other new businesses, we will also develop a real estate investment advisory business.
Upgrade the system for managing customer investment returns We will enhance customer returns through a timely rebalancing based on the industry-top research competencies. We will upgrade the system for managing customer investment returns and implement an after-sale care based on crisis management scenarios by product.
Upgrade risk management systemsRisk management system will be bolstered in preparation for various ex-ternal factors. We will build a risk management system dedicated to cus-tomer assets, while improving the review and risk management process in proportion to asset size growth. Additionally, we will strengthen risk management competencies concerning over-the-counter derivatives and global operations with high growth potential.
057BrokerageReview of Operations
Research Ranking
2012 2013 2014 2015By Maeil Business News
1H 1st 1st1st 1st
2H 1st 1stBy Korea Economic Daily
1H 5th 2nd 1st 1st2H 1st 1st 1st 1st

Shinhan Financial Group Annual Report 2015 058
Life Insurance
Shinhan Life Insurance provides quality insurance products through its diversified channels. Our products cover life insurance, third-party insur-ance, and individual/ retirement pension plans. Among our sales channels are financial consultants (FCs), customer-base marketing (CBM), agency marketing (AM), bancassurance, and self-enrolling programs (Internet). Our investment division generates stable investment income by offering various loan products (loans to insurance customers, secured and unse-cured loans) and investing in securities (equities, fixed income and deriva-tives). We also maintain business stability through thorough risk manage-ment and persistent efficiency improvement.
2015 Performance ResultsIn 2015, we renewed our resolves to overcome business challenges by adopting a new vision and defining a mid-term strategic goal: ‘Industry standard maximizing the intrinsic value of insurance’ as the vision and ‘2018 Top-tier Shinhan’ as the mid-term goal. The new vision embodies our will to set the industry standard by solidifying our insurance business respectable and sound enough to withstand such challenges as the 2nd phase of IFRS4. The mid-term goal expresses our determination to grow into a company that practices “compassionate finance” and earns respect from our stakeholders for values we create for them. In addition, with the full intention to embark on a new beginning with value management, we set our 2015 strategic objective as ‘2015 Beginning of Change, Change to Value’ and carried out three core tasks in the following manners.
Maximizing Corporate ValueTo establish value management practices conducive to solid growth, we concentrated on expanding profitable protection-type product sales and modified evaluation systems with focus on our future value. On the other hand, we overhauled our operating systems by clarifying the roles and re-sponsibilities of different distribution channels and implemented differenti-ated strategies for each channel. We also fine-tuned guidelines on product profitability, strengthened monitoring functions, and constructed highly profitable product portfolios in order to improve mortality profit. In pursuit of new growth drivers, we opened a representative office in Hanoi, through which we conducted market research and explored partnership opportuni-ties with local insurers.
Maximizing Customer ValueIn 2015, we have developed new insurance products that meet the grow-ing needs of our customers. In response to accelerated aging of popula-tion, we introduced a distinctive whole life insurance product which pre-pays the death benefit to customers in the form of annuities subject to customers’ choice. We also provided a third generation cancer insurance
2013
2013
2014
2014
2015
2015
75.580.7
19,37921,940
24,545
100.2
24.2%Shinhan Life Insurance generated a net income of KRW 100.2 billion, up 24.2 % from the previous year
Net Income Growth
Net IncomeShinhan Life Insurance (Unit: KRW in billions)
Total Assets (Unit: KRW in billions)
Shinhan Life Insurance offers a variety of advanced insurance products and financial services through the extensive network of Shinhan Financial Group. In our daily operation, we practice ‘compassionate insurance’ based on our commitment to protecting customer interests from all calamities possible.

product that, for an affordable monthly premium, offers customers more benefits to help cover actual living expenses. This new product not only improved the risk coverage of customers but also helped FCs enhance their productivity by increasing sales of protection-type products. We also adopted advanced ALM systems, gradually reducing capital volatility in preparation for the Phase 2 of IFRS2. In recognition of our sound risk man-agement and stable asset management practices, we won a grand prize in the insurance category at the Korea Fund Asset Management Awards, for the second year in a row.
Maximizing Community ValueIn protecting consumer rights, we instituted ‘quality management’ in the entire process of business activities of Shinhan Life Insurance. To realize growth based on transparent sales and quality management, we strove to minimize customer complaints and maintain a high persistence rate. To reinforce competitiveness of our sales channels, we launched a company-wide campaign promoting ethical sales practices and focused on enhanc-ing productivity and profitability.
We also sought to enhance the sales force’s competencies by sharing product education know-how and implementing specialized training pro-grams for consultants. In order to improve the policy persistence rate, we developed and introduced the industry’s first system that estimates persistence rates based on analysis of policy data. As such, we focused on promoting complete sales practices, offering better benefits, and mini-mizing policy cancelations.
Business Plans for 2016In 2016, the business climate is expected to remain harsh with delayed recovery of profitability stemming from reverse margin. On the other hand, industry deregulation will be implemented on a full scale further intensify-ing the competition. Against this backdrop, Shinhan Life has identified as the strategic objective for 2016, ‘ACTION 2016 for Spreading Value Management.’ The strategic objective reflects our commitment to diffuse value management throughout our operations based on our power to take actions. The word “ACTION” is a compilation of ‘act’, ‘I’, and ‘on, embodying the message that value creation starts from each individual employee’ practices.
The followings are 3 core tasks we identified for this year: 1) improving policy persistency and protection coverage, 2) enhancing business ef-ficiencies for higher productivity, and 3) solidifying the growth platform through securing future competencies.
First, in order to improve persistency and protection coverage, we will increase sales of profitable protection-type products, enhance marketing efficiencies, and promote complete sales practices by reinforcing the con-sumer rights protection process.
Secondly, to enhance business efficiencies, we will reinforce distribution channel competencies and improve the work process. In preparation for the IFRS4 Phase 2, we will develop a company-wide responsive strategy focusing on profit-oriented sustainable growth.
Lastly, to solidify the growth platform, we will continue to cultivate our corporate culture, while focusing on long-term human resource develop-ment and pursuing digital finance and global business to secure a future growth platform.
059Life InsuranceReview of Operations
Shinhan Life Insurance obtained the highest (AAA) rating in the Insurance Financial Strength Rating (IFSR)
for eight consecutive years
Creating customer value through customer-oriented management and informa-
tion protection
Enhancing credibility through
strengthening ethical management
Implementing risk management that considers social
and environmental factors
Developing human resources
and creating a great workplace
culture
Contributing to the development
of local communities
through social contribution
activities
Expanding
underserved people
Pursuing shared growth with suppliers and supporting their CSR activities
Developing green products/services
Using resources
environmental impacts
Economy Environment
Society
Corporate Customers
Shinhan Investment’s RM
+Shinhan Bank’s RM
ONE-PORTALFINANCIAL SOLUTION
Shinhan Bank’s CIB Division
SHINHAN CIB
Shinh
an Investment Corp.’s IB Group

Shinhan Financial Group Annual Report 2015 060
Asset Management
Shinhan BNP Paribas Asset Management is a joint venture between Shinhan Financial Group (65 percent) and BNP Paribas Group (35 percent). Its busi-ness philosophy is to become a long-term partner that places customers first by providing a variety of investment solutions with reliable specialties.
Based on this business philosophy, we provide various domestic and overseas investment solutions in the areas of traditional equity and fixed income, as well as structured (derivatives, ELF, and more) and alternative investment (real estate, mezzanine, and infrastructure). By improving our long-term investment performance in a consistent manner, we have strived to earn unwavering trust from our customers.
As of December 2015, Shinhan BNP Paribas Asset Management has an AUM of KRW 41.5 trillion (based on NAV), the fifth largest among 97 asset management companies in Korea.
2015 Performance ResultsIn the first half of 2015, the domestic stock markets remained stagnant amid a protracted low-interest and low-growth environment, compelling domestic investors to look overseas for more appealing investment oppor-tunities. By the end of the year, however, increasing volatility in emerging markets turned their attention back to safer investment. On the other hand, growing social concerns over an aging population and decreasing market interest rates increased market demands for more profitable retirement pension products and mid-risk, medium-return investment opportunities.
Over the past year, Shinhan BNP Paribas Asset Management concentrat-ed on providing investment solutions tailored to customer needs respond-ing to the rapidly changing capital market environment. Seeing early on the fast-growing interest in investment opportunity in China, we launched the industry’s first mutual fund investing in the mainland Chinese market, thereby laying the foundation for securing leadership in the market with tremendous growth potential. For the retirement pension market, we intro-duced an asset allocation product catering to mid-risk medium-return in-vestment needs, growing it into the No. 1 asset allocation fund in the mar-ket. In domestic equity investment, we reinforced our bottom-up research competencies to form investment strategies addressing market changes in a timely manner. We also continued developing innovative structured products and maintained our market leadership in that field.
These accomplishments earned us several recognitions and awards at home and abroad: 2015 Korea’s Most Outstanding Asset Manager at The Asset Triple A Investor and Fund Management Awards by The Asset maga-zine for the sixth year in a row; Innovative Fund of the Year at the 2015 Ko-rea Funds Awards by Money Today; and The Best Mid-risk Medium-Return Fund at the 2015 Market Leaders Awards by E-Today.
2013 2014 2015
36.8
39.3
41.5
5th Shinhan BNP Paribas Asset Management has an AUM of KRW 41.5 trillion (based on NAV), the fifth largest among 97 asset management companies in Korea.
Asset Management Ranking
Assets under Management (based on NAV) (Unit: KRW in trillions)
Demand for excess returns is increasing amid growing volatility of the global markets, sustained low interest rate trend and aging of society. Shinhan BNP Paribas Asset Management has developed diverse investment solutions to address these issues, each customized to specific customer needs based on investment principles that have proved sound year after year.
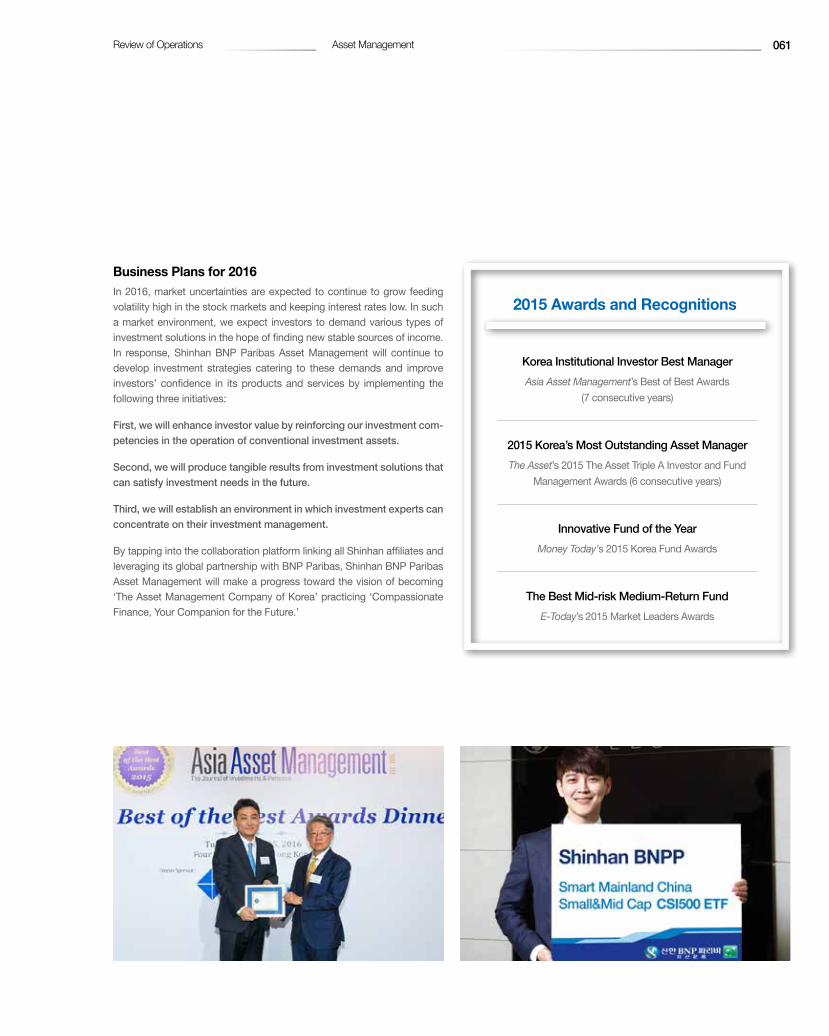
Business Plans for 2016In 2016, market uncertainties are expected to continue to grow feeding volatility high in the stock markets and keeping interest rates low. In such a market environment, we expect investors to demand various types of investment solutions in the hope of finding new stable sources of income. In response, Shinhan BNP Paribas Asset Management will continue to develop investment strategies catering to these demands and improve investors’ confidence in its products and services by implementing the following three initiatives:
First, we will enhance investor value by reinforcing our investment com-petencies in the operation of conventional investment assets.
Second, we will produce tangible results from investment solutions that can satisfy investment needs in the future.
Third, we will establish an environment in which investment experts can concentrate on their investment management.
By tapping into the collaboration platform linking all Shinhan affiliates and leveraging its global partnership with BNP Paribas, Shinhan BNP Paribas Asset Management will make a progress toward the vision of becoming ‘The Asset Management Company of Korea’ practicing ‘Compassionate Finance, Your Companion for the Future.’
061Asset ManagementReview of Operations
2015 Awards and Recognitions
Korea Institutional Investor Best ManagerAsia Asset Management’s Best of Best Awards
(7 consecutive years)
2015 Korea’s Most Outstanding Asset ManagerThe Asset’s 2015 The Asset Triple A Investor and Fund
Management Awards (6 consecutive years)
Innovative Fund of the YearMoney Today’s 2015 Korea Fund Awards
The Best Mid-risk Medium-Return Fund E-Today’s 2015 Market Leaders Awards

Financial SectionShinhan Financial Group recorded KRW 2,367.2 billion of consolidated net income (attributable to controlling interest) in 2015. This marked a 13.7 percent increase over the previous year’s KRW 2,081.1 billion. Not only was this the second year in a row Shinhan Financial Group surpassed the KRW 2 trillion threshold, but it was the eighth consecutive year it had outperformed its competitors.
This solid performance can be attributed to our consistent strategies for sustainable growth with a long-term view. Moreover, the group’s banking and non-banking units together created a favorable outcome through complementary and synergic operations.
064 Management’s Discussion and Analysis
081 Independent Auditors’ Report
082 Consolidated Financial Statements
088 Notes to Financial Statements


I. 2015 Review
In 2015, the global economy continued to undergo divergent paths of growth. The growth rate for China’s gross domestic product for 2015 decreased to a quarter-century low of 6.9% despite various measures undertaken by the Chinese government to offset the effects of the sluggish economic growth, including cutting interest rates and adjusting the reserve requirements for its banks. Japan and Europe continued their expansionary monetary policies and are expected to maintain the current policy stance in the near term. The U.S. experienced improvement in the labor market and expressed con-fidence that inflation will be in line with the target rate over the medium term. In response to such signs of improvement, in December 2015, the U.S. Fed-eral Reserve raised its benchmark interest rate by 0.25%p and announced its intention to gradually increase the rate in the future depending on the economic situation.
In the first half of 2015, the Korean economy experienced a slower-than-ex-pected recovery due to delayed global economic recovery and a decrease in domestic consumption, resulting in part from the spread of the Middle East Respiratory Syndrome (MERS). However, downward pressure on the growth rate was slightly restrained in the second half of 2015 due to active stimula-tion efforts from the government, ranging from the Bank of Korea’s move to cut the basic interest rate to a historic low level to the Ministry of Strategy and Finance’s implementation of a supplementary fiscal budget.
In 2016, we consider the following as potential risks to the Korean economy: (i) sustained recessionary current account surplus resulting from diminish-ing imports; (ii) increasing proportion of temporary employment; (iii) steadily increasing household debt; (iv) China’s slowing growth; and (v) the Korean economy’s vulnerability to depreciation of the Japanese yen. Also, the gov-ernment’s recently announced initiatives to restructure distressed business-es may contribute to mid- and long-term growth, but is anticipated to restrict economic recovery in the short term.
As for interest rate movements, since 2009, Korea, like many other countries, has experienced a low interest rate despite some marginal fluctuations, in part due to the government’s policy to stimulate the economy through active rate-lowering measures. For 2015, in an effort to support Korea’s economy in light of the recent slowdown in Korea’s growth and uncertain global eco-nomic prospects, the Bank of Korea reduced the base interest rate to 1.75% in March and further reduced such rate to the historic low of 1.50% in June, which has since remained unchanged. In light of the mixed signals on the economic outlook, the Bank of Korea’s policy path of interest rates in 2016 and for the foreseeable future remains uncertain.
In 2015, the KRW/USD exchange rate showed high volatility amid Korea’s massive current account surplus and financial instability in emerging markets following the rate hikes in the U.S. The Korean won to U.S. dollar exchange rate, which had been around KRW 1,100 to the dollar in the first half of 2015, surged to over KRW 1,200 in the latter half of the year as external uncertain-
ties triggered an FX flight among many foreign investors. In 2016, we expect volatility in the exchange rate, particularly in the KRW/USD exchange rate, to continue with the uncertainty in timing and speed of additional U.S. rate hikes and other domestic/overseas economic slowdown factors to surface.
Shinhan Financial Group recorded KRW 2,367.2 billion of consolidated net income (attributable to controlling interest) in 2015. This marked a 13.7% increase over the previous year’s KRW 2,081.1 billion. Not only was this the second year in a row Shinhan Financial Group surpassed the KRW 2 trillion threshold, but it was the eighth consecutive year it had outperformed its competitors.
This solid performance can be attributed to our consistent strategies for sus-tainable growth with a long-term view. Moreover, the group’s banking and non-banking units together created a favorable outcome through comple-mentary and synergic operations.
Shinhan Bank, the Group’s flagship company, posted a net income of KRW 1,489.7 billion, up 2.4% from the previous year. This stable income perfor-mance was primarily due to the bank’s constant efforts to expand household and corporate loan assets throughout the year, which turned out to be effec-tive in offsetting the impact of the unavoidable drop in interest income follow-ing a contraction of net interest margin (NIM).
Shinhan Card achieved 9.4% year-on-year growth in net income in 2015, which reached KRW 694.8 billion. In the face of an economic slowdown, this considerable growth is largely attributed to the company’s aggressive mar-keting campaigns, which were backed by big data analysis and the result-ant growth in credit card sales, followed by expanded commission income. Other notable factors included lower funding costs due to falling market rates and decreased credit costs as a result of consistent risk management.
Shinhan Investment Corp. enjoyed 82.2% year-on-year growth in its net income for 2015, which amounted to KRW 215.5 billion. Spearheaded by the surging daily average trading volume on the Korean stock market, the company’s brokerage commission income grew more than 50%. Increased financial product sales also shored up commission income from financial product sales.
Shinhan Life Insurance’s net income for 2015 stood at KRW 100.2 billion, up 24.2% over the previous year. The sustained low interest rate trend took away any gains on the interest margin, but the company did manage to sus-tain growth by selling more profitable protection-type insurance products that generated stable income from the underwriting margin.
With the recovery in profitability of Shinhan Card, Shinhan Investment Corp., and Shinhan Life Insurance, the non-banking subsidiaries combined net in-come reached KRW 1,087.5 billion in 2015, contributing 42% of the Group’s total net income (after consideration of percentage of shareholding and be-fore consolidation adjustment).
Management’s Discussion and Analysis
Shinhan Financial Group Annual Report 2015 064

Group Pre-provision Income & Net Income (Unit: KRW billion)
II. Summary of the Reported Income Statement
1. Shinhan Financial Group
In 2015, the Group’s consolidated net income (attributable to controlling in-terest) amounted to KRW 2,367.2 billion, up 13.7% from 2014.
This remarkable achievement, which came amid a turbulent business en-vironment with persistent low growth and low interest rates trends, can be credited to the following: the balanced growth in the Group’s loan portfolio throughout the year and stabilized net interest margin (NIM) toward the end of the year, both of which worked favorably with the Group’s interest income performance; a diversified business portfolio that allowed for balanced in-come contribution between the banking and non-banking subsidiaries; effec-tive control of SG&A expenses through constant cost reduction efforts across the Group; and stable credit costs based on preemptive and consistent risk management practices.
Specifically, Shinhan Financial Group’s interest income remained stable due to the Group’s timely loan growth policy. While the Group’s NIM (Shinhan Bank and Shinhan Card) contracted by 27 basis points year on year, its total loans grew 8.5% over the same period. As a result, the Group’s interest in-come stopped at a slight 1.4% drop.
In addition, Shinhan Financial Group’s balanced business portfolio between the banking and non-banking sectors stood out among all 2015 perfor-mance results. Non-banking subsidiaries demonstrated significant growth in their income. Consequently, the Group’s non-interest income also grew by 40.3% compared to the previous year.
In 2015, the Group’s selling, general & administrative (SG&A) expenses edged up a mere 0.3% from the previous year. This was the result of its three-year-long cost-saving efforts for higher efficiency in its channel and human resource management. Even with increased temporary expenses arising
from its early retirement program at each subsidiary, the Group successfully stabilized its SG&A expenses through a mid- to long-term strategic approach to bring about fundamental improvements to its high-cost structure.
Even with the one-off credit costs incurred for some large corp. borrowers that went through business restructuring in the first half of 2015, the loan loss provision stabilized toward the end of the year due to preemptive efforts, such as continued expansion of quality loan assets, stronger risk manage-ment practices, and thorough monitoring of borrowers in high-risk sectors. As a result, the Group’s credit cost increased by only 9.2%, with the credit cost ratio remaining the same as the previous year at 0.43%.
SFG Condensed Income Statements (Unit: KRW billion)
2015 2014 Chg. (Amt.) Chg. (%)Total Operating Income 8,485.7 8,067.6 418.1 5.2%
Interest Income 6,692.9 6,789.8 -96.9 -1.4% Non-interest Income 1,792.7 1,277.8 514.9 40.3%
SG&A Expenses 4,475.1 4,462.9 12.2 0.3%Pre-provision Operating Income
4,010.6 3,604.8 405.8 11.3%
Non-operating Income 167.4 212.8 -45.4 -21.3%Pre-Provision Income 4,178.0 3,817.5 360.5 9.4%Loan Loss Provision 1,037.4 949.9 87.5 9.2%Pre-tax Income 3,140.6 2,867.6 273.0 9.5%Income Tax Expenses 694.6 668.0 26.6 4.0%Consolidated Net Income 2,367.2 2,081.1 286.1 13.7%
Looking at net income by subsidiary, steady growth in the bank’s loan as-sets outweighed dropping interest income despite the margin contraction. Moreover, growing commission income and gains on securities added to non-interest income, while the year-on-year decrease in SG&A expenses resulted from years of cost-saving initiatives. Consequently, net income at the banking subsidiaries improved by 2.6% over the previous year. The non-banking sector also enjoyed 17.7% year-on-year growth, driven by the im-proved profitability of Shinhan Card, Shinhan Investment Corp., and Shinhan Life Insurance.
3,817.54,178.0
2014 2015
2,367.22,081.1
▒ Pre-provision Income▒ Net Income
Financial Section 065Management’s Discussion and Analysis

Management’s Discussion and Analysis
Shinhan Financial Group Annual Report 2015 066
- Net Income Contribution by Non-bank Subsidiaries
▒ Non-Bank Total Net Income
1,087.5
923.7
20152014
42.0%
38.7%
▒ Shinhan Bank + Jeju Bank ▒ Shinhan Card▒ Shinhan Investment Corp. ▒ Shinhan Life Insurance▒ Shinhan Capital & Others - - - Non-Bank Subsidiaries
0
1000
2000
3000
4000
5000
0
200
400
600
800
1000
1200
30
40
50
0.000000
916.666667
1833.333333
2750.000000
3666.666667
4583.333333
5500.000000
5000
6000
1.3
1.6
1.9
0.5
1.0
1.5
2.0
2.5
3.0
100
150
200
1.0
1.5
2.0
2.5
40
49
58
0.000000
0.166667
0.333333
0.500000
0.666667
0.833333
1.000000
0
200
400
600
800
1000
0.0
4.2
8.4
12.6
16.8
21.0
0
90
180
270
360
450
0
4700
9400
14100
18800
23500
30
54
78
102
126
150
10.000000
16.666667
23.333333
30.000000
0
50
100
150
200
250
0
50
100
150
200
250
100135170205240275310345380
0
50
100
150
200
2014 2015
- Shinhan Bank+Shinhan Card (Cumulative)- Shinhan Bank+Shinhan Card (Quarterly)
1Q14 2Q14 3Q14 4Q14 1Q15 2Q15 3Q15 4Q15
2.32%
2.32%
2.32%
2.31%
2.31%
2.29%
2.27%
2.17%
2.11%
2.11%2.05%
1.99%
2.02%
1.97%
2.00%
1.96%
Subsidiaries’ Income (Unit: KRW billion)
2015 2014 Chg. (Amt.) Chg. (%)Bank (a) 1,503.0 1,464.8 38.2 2.6%
Shinhan Bank 1,489.7 1,455.2 34.5 2.4%Jeju Bank 13.4 9.5 3.9 40.0%
Non-Bank (b) 1,087.5 923.7 163.8 17.7%Shinhan Card 694.8 635.2 59.6 9.4%Shinhan Investment Corp. 215.5 118.2 97.3 82.2%Shinhan Life Insurance 100.2 80.7 19.5 24.2%Shinhan BNPP AM 15.4 18.3 -2.9 -16.1%Shinhan Capital 46.1 51.9 -5.8 -11.3%Shinhan Savings Bank 8.0 11.1 -3.1 -28.0%Shinhan Data System 1.0 2.6 -1.6 -60.5%Shinhan AITAS 6.4 4.0 2.4 60.9%Shinhan Credit Information 0.7 1.1 -0.4 -31.5%
Shinhan PE -0.6 0.6 -1.2 n.a.Total (a + b) 2,590.5 2,388.5 202.0 8.5%Consolidated Net Income1) 2,367.2 2,081.1 286.1 13.7%
1) Net income attributable to controlling interest
Net Income Contribution by Non-bank Subsidiaries (Unit: KRW billion)
Net Income Contribution by Subsidiary
Group Net Interest Margin
2. Shinhan Bank
1) OverviewShinhan Bank saw its net income for 2015 increase by 2.4% over the previ-ous year, reaching KRW 1,489.7 billion. The bank maintained the industry’s highest level of profitability for a fifth year in a row thanks to increased profits from its overseas subsidiaries and its own effective cost management efforts in the face of falling interest income. Preemptive and comprehensive risk management helped the bank to retain the cleanest book among its peers in terms of asset quality.
Furthermore, Shinhan Bank introduced a new business model offering en-hanced customer convenience. The Digital Kiosk is an unmanned digital

- Shinhan Bank NIM (Cumulative)- Shinhan Bank NIM (Quarterly)
1Q14 2Q14 3Q14 4Q14 1Q15 2Q15 3Q15 4Q15
1.77%
1.77%
1.77%
1.77%
1.77%
1.76%
1.74%
1.67% 1.58%
1.58%
1.54%
1.50%
1.52%
1.48%
1.50%
1.46%
▒ Interest Income ▒ Non-interest Income
4,164.7
946.1
2015
4,367.1
804.5
2014
5,110.85,171.7
Financial Section 067Management’s Discussion and Analysis
bank window with a biometric authentication function that allows users to open an account without visiting the branch office. Sunny Bank serves the same function as Shinhan Bank’s mobile platform.
What is more, the bank was able to maintain its No. 1 position in the retire-ment pension market for the sixth consecutive year in terms of AUM. In line with its Compassionate Finance initiative, Shinhan Bank boasts the high-est balance in tech credit bureau (TCB) loans (a creative/technology finance product) among all Korean commercial banks. This resulted in Shinhan Bank topping the government’s innovation index for a second year in a row. Its balance in New Hope Seed Loans extended to low-income/low-credit cus-tomers was also greater than its competitors. Thus, it was no surprise when Shinhan Bank was singled out in 2015 as the Best Bank in Microfinance by Korea’s Financial Supervisory Service for the third year in a row.
With growing concerns over possible deflation in the global economy in 2016, the Korean economy is also expected to face sagging exports and domestic consumption. However, Shinhan Bank’s top-quality competitive-ness in all business areas will allow the bank to attain sustainable growth should there be any volatility.
Condensed Income Statements for Shinhan Bank (Unit: KRW billion)
2015 2014 Chg. (Amt.) Chg. (%)Total Operating Income 5,110.8 5,171.7 -60.9 -1.2%
Interest Income 4,164.7 4,367.1 -202.4 -4.6%Non-interest Income 946.1 804.5 141.6 17.6%
SG&A Expenses 2,785.4 2,918.0 -132.6 -4.5%Pre-provision Operating Income
2,325.4 2,253.6 71.8 3.2%
Non-operating Income 141.3 38.4 102.9 268.1%Pre-provision Income 2,466.7 2,292.0 174.7 7.6%Loan Loss Provision 591.6 456.2 135.4 29.7%Pre-tax Income 1,875.1 1,835.8 39.3 2.1%Income Tax Expenses 385.1 380.1 5.0 1.3%Consolidated Net Income 1,489.7 1,455.2 34.5 2.4%
2) Interest Income & NIMIn 2015, Shinhan Bank’s interest income dropped 4.6% from the previous year, falling to KRW 4,164.7 billion.
While Shinhan Bank’s NIM for 2015 declined 24 basis points over the past year, the bank expanded its loan assets for both households and corporate borrowers each quarter in 2015, resulting in 10.5% growth in Korean won-denominated loan assets. These efforts eventually helped buffer Shinhan Bank’s income contraction, leading to a stable interest income performance.
Growth in highly profitable SME loans was a particular boost, while expand-ed low-cost funding helped reduce interest expenses.
Going forward, Shinhan Bank will continue to improve its interest income through stable NIM performance, sound growth of profitable loan assets and the expansion of low-cost deposits.
Interest Income & Non-interest Income for Shinhan Bank (Unit: KRW billion)
Net Interest Margin for Shinhan Bank
3) Non-interest IncomeShinhan Bank’s non-interest income for 2015 stood at KRW 946.1 billion, up 17.6% from the previous year.
Fee and commission incomes increased by 6.3% as a result of expanded loan assets and increased trust product sales, while higher dividend in-come and reduced impairment losses helped gains on securities improve by 18.5%, resulting in a rise in the overall non-interest income year on year.

Management’s Discussion and Analysis
2010 2011 2012 2013 2014 2015
- SFG - SHB
42.8%44.8%
52.7%
47.4%
52.3%
55.3%
44.0%45.6%
48.3%
52.4%
56.4%54.5%
467
12382
111
854
72
425
13696
166
886
62
406
123
144
123
836
41
389
11287
118
749
42443
11590106
803
50
20152011 2012 2013 2014
Shinhan Financial Group Annual Report 2015 068
▒ Mutual Funds ▒ Bancassurance ▒ FX ▒ Trusts ▒ Others
Non-interest Income for Shinhan Bank (Unit: KRW billion)
2015 2014 Chg. (Amt.) Chg. (%)Non-interest Income 946.1 804.5 141.6 17.6% Fees & Commissions 853.9 802.9 51.0 6.3% Securities Related & FX
Trading/Derivatives609.3 514.2 95.1 18.5%
(Gains on Sales of AFS Securities)
422.3 428.0 -5.7 -1.3%
(Impairment Loss on AFS Securities)
-206.6 -220.3 13.7 n.a.
Others -517.0 -512.6 -4.4 n.a. (Contribution Expenses) -267.5 -244.9 -22.6 n.a. (Insurance Fees on
Deposits)-249.0 -240.5 -8.5 n.a.
Fees & Commissions for Shinhan Bank (Unit: KRW billion)
2015 2014 Chg. (Amt.) Chg. (%)Fees & Commissions 853.9 802.9 51.0 6.3%
Fund Fee Income 110.7 105.9 4.8 4.5% Bancassurance Fee Income
81.9 89.8 -7.9 -8.8%
FX Fee Income 122.9 114.5 8.4 7.3% Trust Fee Income 71.5 49.7 21.8 43.8% Others 466.8 443.0 23.8 5.4%
Fees & Commissions (Unit: KRW billion)
4) SG&A ExpensesShinhan Bank saw its selling, general & administrative (SG&A) expenses de-crease by 4.5% between 2014 and 2015, to KRW 2,785.4 billion.
The decrease can be ascribed to the bank’s continued cost-saving ini-tiatives, lower expenses associated with the early retirement program, and lower spending on performance-based pay and other remunerations. By efficiently managing SG&A expenses, Shinhan Group and Shinhan Bank achieved cost-to-income ratios of 52.7% and 54.5%, respectively, in 2015.
SG&A Expenses for Shinhan Bank (Unit: KRW billion)
2015 2014 Chg. (Amt.) Chg. (%)SG&A Expenses 2,785.4 2,918.0 -132.6 -4.5%
Salary & Employee Benefits
1,659.6 1,734.9 -75.3 -4.3%
Early Retirement Program Expenses
59.5 106.2 -46.7 -43.9%
Depreciation & Amortization 165.4 202.9 -37.5 -18.5%Other Expenses 960.4 980.1 -19.7 -2.0% Advertising Expenses 58.0 59.1 -1.1 -1.9% Taxes and Dues 78.3 82.2 -3.9 -4.8%
Cost-Income Ratios for Shinhan Financial Group & Shinhan Bank
5) Credit CostsShinhan Bank’s credit costs for 2015 rose by 29.7% from 2014 to reach KRW 591.6 billion.

Financial Section 069Management’s Discussion and Analysis
0.77%
0.41%0.29%
0.50%0.43%
0.25%
2010 2011 2012 2013 2014 2015
This growth was driven by the increase in one-off provisions for business re-structuring programs in the first half of 2015. A decrease in the write-back of the loan loss provision was another reason for the higher provisioning. In the second half of the year, however, credit costs of Shinhan Bank stabilized to the ordinary level. Consequently, the bank’s annual credit cost ratio remained at a healthy 0.29%.
Credit Cost Ratio for Shinhan Bank
3. Shinhan Card
1) OverviewProlonged uncertainties abounded in the global economy throughout 2015. The resultant trend in lower growth—and only accentuated by the MERS scare in Korea—further dampened already sagging domestic consumption. Even in these challenging economic conditions, Shinhan Card delivered re-markable outcomes in 2015.
Shinhan Card’s 2015 net income was KRW 694.8 billion, up 9.4% from 2014. This strong performance was primarily due to the active expansion of profit-able assets, business innovation for higher efficiency, and effective risk man-agement.
In 2015, Shinhan Card maintained its unparalleled leadership position, claim-ing a 22.5% share of Korea’s credit card market (personal credit sales trans-actions). The company also raised its market share in the debit card business by 1.3%p to 18.4% in 2015 by pursuing niche markets, almost catching the No. 2 company in the industry along the way. This allowed Shinhan Card to secure a solid market share in all its business areas.
In 2015, the company’s focus was on keeping up with the rapid changes going on with mobile platform technologies and increasing strategic invest-ments in new markets for future growth.
The transaction volume of app-based mobile credit card usage that Shinhan
Card launched in 2013 has soared at an exceptional speed since then. As of 2015, the number of app-card holders had surpassed four million. In order to meet the diversifying needs of customers, the company is considering cross-industry partnerships so as to upgrade the app-based credit card sys-tem into a platform that offers a variety of services.
2015 was a starting point of full-fledged globalization efforts. In July of the same year, Shinhan Card became the first Korean credit card company to open a local subsidiary in Kazakhstan. In December, it also set up a joint venture with the Salim Group, a local financial company in Indonesia. This represents just two initiatives in the company’s global expansion plans to go beyond the Korean credit card market.
In order to take advantage of new business opportunities, aided by a favora-ble regulatory environment that encourages investments in new products and services, Shinhan Card conducted numerous trials to diversify its profit model. The company started a long-term car-rental business and other new businesses that make use of its core competencies in big data, mobile tech-nology and its deep customer base.
2) Income Statement Analysis
Condensed Income Statements for Shinhan Card (Unit: KRW billion)
2015 2014 Chg. (Amt.) Chg. (%)Operating Revenue 4,742.2 4,600.3 141.9 3.1%
Credit Card Business 3,841.2 3,783.0 58.2 1.5%Installment Finance 93.9 87.8 6.1 6.9%Lease financing 37.7 36.6 1.1 2.9%Others 769.4 692.8 76.6 11.1% (Derivatives & FX) 173.0 129.4 43.6 33.7%
Interest Expenses 446.4 492.6 -46.2 -9.4%SG&A Expenses 763.3 709.1 54.3 7.7%Commissions & Other Expenses
2,321.5 2,157.2 164.4 7.6%
(Derivatives & FX) 143.8 107.3 36.5 34.0%Pre-Provision Income 1,211.0 1,241.5 -30.5 -2.5%Provision for Credit Losses 332.9 419.5 -86.5 -20.6%Earnings before Income Tax 878.1 822.0 56.1 6.8%Income Tax 183.3 186.9 -3.6 -1.9%Net Income 694.8 635.2 59.6 9.4%
In 2015, Shinhan Card’s net income stood at KRW 694.8 billion, up 9.4% from the previous year, mainly driven by increased merchant fee income and improved credit costs.

215.5
101.7118.2
20152011 2012 2013 2014
63.975.4
Management’s Discussion and Analysis
Shinhan Financial Group Annual Report 2015 070
Operating revenue improved by 3.1% from 2014 primarily due to an increase in merchant fees and installment finance fees as a result of an expanded transaction volume and gains on sales of AFS securities. Shinhan Card’s total transaction volume amounted to KRW 148.4 trillion in 2015, up 5.1% from the previous year’s total of KRW 141.3 trillion.
Interest expenses for 2015 were down 9.4% thanks to issuance of lower-interest rate debentures and ABS.
SG&A expenses increased by 7.7% mainly due to the resumption of market-ing activities. In the previous year, credit card marketing was not active in the industry because of scandals involving the personal information leakage of a large number of customers from other major credit card issuers in Korea.
Despite a reduction in the recovery of written-off receivables, provision for credit losses fell by 20.6% from 2014 mainly due to improved asset qual-ity indicators such as the two-month delinquency roll rate. Recovery from written-off receivables declined to KRW 201.8 billion due to the aging and a decreased balance of receivables following the sale of KRW 1.4 trillion to the Public Happiness Fund in 2013. As of the end of 2015, the balance of written-off receivables was KRW 3.4 trillion. We can still expect a decent level of recovery going forward, given that on average KRW 500 billion of new receivables are written off every year.
4. Shinhan Investment Corp.
1) OverviewIn 2015, rising expectations associated with global liquidity expansion, con-cerns over rate hikes in the U.S., and the sluggish growth of China’s econo-my increased volatility of Korea’s stock markets, with the KOSPI fluctuating between 1,800 and 2,180 points. Expanded volatility allowed the average daily trading volume to swell from KRW 6.7 trillion in 2014 to KRW 9.7 trillion in 2015.
Shinhan Investment Corp. steadfastly put Compassionate Finance into prac-tice throughout 2015 with the clear goal of achieving the industry’s highest level of competitiveness. As a result, net income of the company increased 82.2% year-on-year to reach KRW 215.5 billion, with its operating income standing at KRW 260.7 billion, up 96.2% over the previous year.
In addition, the expanded daily trading volume in the Korean stock market boosted the company’s brokerage commission income by 48.1% year on year, while the continued low interest rate trend fueled the sale of financial products, which led to an increase of 29.5% in the company’s fee income from financial product sales. At the same time, falling market rates buoyed Shinhan Investment Corp.’s income from proprietary trading, including gains on the disposal of fixed income securities. As a result, net trading gains jumped 44.3% in 2015. Additionally, the growth in loans and the resultant increase in interest income raised other operating income by 31.3%.
In 2015, SG&A expenses rose by 22.6% mainly due to an increase in adver-tisement expenses as well as an increase in performance-related bonuses as a result of the strong performance of the company’s trading teams.
Net Income of Shinhan Investment Corp. (Unit: KRW billion)
Condensed Income Statements for Shinhan Investment Corp. (Unit: KRW billion)
2015 2014 Chg. (Amt.) Chg. (%)Operating Revenue 870.2 601.5 268.7 44.7%
Commissions Received 450.2 304.0 146.2 48.1%Net Trading Gains 324.7 224.9 99.7 44.3%Other Operating Income 95.3 72.6 22.7 31.3%
Operating Expenses 609.5 468.7 140.8 30.0%SG&A Expenses 488.5 398.6 89.9 22.6%Commission Expenses 118.8 67.6 51.1 75.6%Loan Loss Provision 2.2 2.4 -0.2 -9.5%
Operating Income 260.7 132.9 127.9 96.2%Net Income 215.5 118.2 97.2 82.2%
Commissions Received for Shinhan Investment Corp. (Unit: KRW billion)
2015 2014 Chg. (Amt.) Chg. (%)Commissions Received 450.2 304.0 146.2 48.1%
Brokerage Commissions 286.1 186.7 99.5 53.3%Financial Product Fees 105.0 81.1 23.9 29.5% IB-related Commissions1) 38.7 27.8 10.9 39.1%Other Commissions 20.3 8.4 11.9 142.2%
1) Including fees and commissions from underwriting, IPOs, M&A consulting, and project financing advisory services

Financial Section 071Management’s Discussion and Analysis
100.2
237.0
80.7
20152011 2012 2013 2014
213.7
75.5
SG&A Expenses for Shinhan Investment Corp. (Unit: KRW billion)
2015 2014 Chg. (Amt.) Chg. (%)SG&A Expenses 488.5 398.6 89.9 22.6% Salaries 318.7 263.5 55.2 21.0% Other General Expenses 159.3 125.2 34.2 27.3% Depreciation 10.5 9.9 0.5 5.4%
2) Trading Volume & Market ShareAlthough the equities business enjoyed an increase in trading volume in 2015, the company’s market share declined slightly. Trading volume of stocks expanded by 35% from the previous year, reaching KRW 284 trillion, while market share dropped by 0.5%p to 5.9%.
The trading volume of futures fell by 27%, to KRW 520 trillion, representing a 2.2%p drop in market share. On the other hand, the trading volume of op-tions jumped 50% over the previous year, to KRW 27 trillion, with its market share rising by 2.3%p.
Trading Volume of Shinhan Investment Corp. (Unit: KRW trillion)
2015 2014 Chg. (Amt.) Chg. (%)Stocks 284 211 73 35%Futures 520 712 -192 -27%Options 27 18 9 50%
Market Share of Shinhan Investment Corp.
2015 2014 Chg. (%p)Stocks 5.9% 6.4% -0.5%pFutures 5.7% 7.9% -2.2%pOptions 7.3% 5.0% 2.3%p
5. Shinhan Life Insurance
Facing a paradigm change in the insurance business with the scheduled implementation of IFRS4 Phase 2 in 2020 and in meeting the prolonged low-growth, low-gain trends, Shinhan Life Insurance has set its vision as a
‘Industry standard maximizing the intrinsic value of insurance.’ In line with this, the company set its mid- to long-term strategic goal at attaining market recognition while procuring a stable source of revenue in the long term by improving the competitiveness of its life insurance program.
In 2015, Shinhan Life Insurance focused on implementing value-oriented management throughout the year. As a result, net income of the company reached KRW 100.2 billion, up 24.2% from the previous year despite nega-tive hurdles such as the additional accrual per IBNR reserve.
Net insurance operating results improved by 10.9% from the previous year in 2015. This was mainly due to the growth in premiums written, which buffered insurance payment increases that were the result of a greater number of poli-cies in effect than in 2014. Net investment gains inched up by 2.3% thanks to an increase in interest and dividend income with growing investment size. The provision of policy reserve increased 8.4% year on year due to the ex-panded number of polices in effect.
By the end of 2015, the company’s premiums written stood at KRW 4.8 trillion (including variable life insurance), while its monthly initial premium amounted to KRW 73 billion.
In 2016, Shinhan Life Insurance will continue improving its net results from insurance operations by increasing protection type insurance sales and its far-sighted strategic asset allocation to overcome the reverse interest margin that has arisen under the current trend of lower interest rates. Additionally, Shinhan Life Insurance will continue its profit-oriented, creative investment practices while reinforcing the company’s asset-liability management.
Net Income of Shinhan Life Insurance (Unit: KRW billion)

Management’s Discussion and Analysis
Shinhan Financial Group Annual Report 2015 072
20152011 2012 2013 2014
10.5
5.4
0.12.8
1.8
8.6
4.9
0.1
3.0
1.5
8.4
4.2
0.12.1
0.9
7.1
3.6
0.21.0
1.5
6.2
3.00.10.6
0.9
10.813.4
15.718.0
20.5
2011 2012 2013 2014 2015
- Operating Assets ▒ Cash & Deposts▒ Fixed Income ▒ Loans▒ Equities ▒ Others
Condensed Income Statements for Shinhan Life Insurance (Unit: KRW billion)
2015 2014 Chg. (Amt.) Chg. (%) Net Insurance Operating Results
1,584.9 1,429.6 155.3 10.9%
Premiums Written 4,422.4 4,200.3 222.1 5.3% Claims Paid(△) 1,946.7 1,890.2 56.5 3.0% Reinsurance Operating Results
-1.1 -0.9 -0.2 n.a.
Operating Expenses(△) 889.8 879.6 10.2 1.2% Net Investment Gains 771.7 754.1 17.6 2.3% Others Net Results 53.6 28.8 24.8 86.1% Total Operating Net Results 2,410.1 2,212.5 197.6 8.9% Provision of Policy Reserve(△)
2,277.5 2,100.5 177.0 8.4%
Net Income Before Taxes 132.6 112.1 20.5 18.3% Net Income 100.2 80.7 19.5 24.2%
Operating Assets of Shinhan Life Insurance (Unit: KRW trillion)
Operating Assets Breakdown for Shinhan Life Insurance (Unit: KRW billion)
2015.12 2014.12 Chg. (Amt.) Chg. (%)Operating Assets 20,545.0 18,011.4 2,533.6 14.1%
Cash & Deposits 1,831.6 1,485.7 345.9 23.3%Fixed Income 10,505.2 8,558.9 1,946.3 22.7%Loans 5,372.1 4,919.4 452.7 9.2%Equities 80.7 94.7 -14.0 -14.7%Others 2,755.4 2,952.8 -197.4 -6.7%
III. Balance Sheet & Asset Quality Review
1. Shinhan Financial Group
1) Total AssetsAt the end of 2015, Shinhan Financial Group’s total assets on a consolidated basis amounted to KRW 370.5 trillion, up 9.6%, or KRW 32.5 trillion, from the previous year. This can be attributed to the sound asset growth of its major subsidiaries.
Shinhan Bank’s constant loan asset growth added KRW 38.9 trillion, or 13.9%, to the bank’s total assets, while Shinhan Card’s increased credit card loan assets and Shinhan Life Insurance’s investment asset growth also added KRW 4.3 trillion, a 3.5% increase, to the total assets held by all non-bank subsidiaries.
By asset type, the Group’s loan assets expanded by KRW 24.8 trillion, or 11.2%. Furthermore, available-for-sale and hold-to-maturity securities in-creased by KRW 2.5 trillion (8.1%) and KRW 2.8 trillion (21.1%), respectively, to reach KRW 34.0 trillion and KRW 16.2 trillion, respectively, in 2015.
Asset Breakdown by Subsidiaries (Unit: KRW billion)
2015.12 2014.12 Chg. (Amt.) Chg. (%)Bank 318,112.9 279,232.2 38,880.7 13.9%
Shinhan Bank 313,648.3 275,756.6 37,891.7 13.7%Jeju Bank 4,464.6 3,475.7 988.9 28.5%
Non-Bank 128,969.0 124,654.0 4,315.0 3.5%Shinhan Card 23,347.7 22,259.5 1,088.2 4.9%Shinhan Investment Corp. 37,792.3 39,039.8 -1,247.5 -3.2%Shinhan Life Insurance 24,544.6 21,939.7 2,604.9 11.9%Shinhan BNPP AM 37,973.3 35,601.0 2,372.3 6.7%Shinhan Capital 4,076.6 3,939.5 137.1 3.5%Shinhan Savings Bank 795.1 804.0 -8.9 -1.1%Shinhan Data System 26.7 25.8 0.9 3.3%Shinhan AITAS 42.8 37.7 5.1 13.6%Shinhan Credit Information 23.9 23.0 0.9 3.7%Shinhan PE 119.0 461.3 -342.3 -74.2%Others 227.1 522.6 -295.5 -56.6%
Total1) 450,438.5 406,655.6 43,782.9 10.8%Consolidated Total Assets 370,539.6 338,021.8 32,517.8 9.6%
1) Shinhan Investment Corp.’s trust A/C and Shinhan BNPP AM’s AUM (including dis-cretionary assets) are included in this figure.
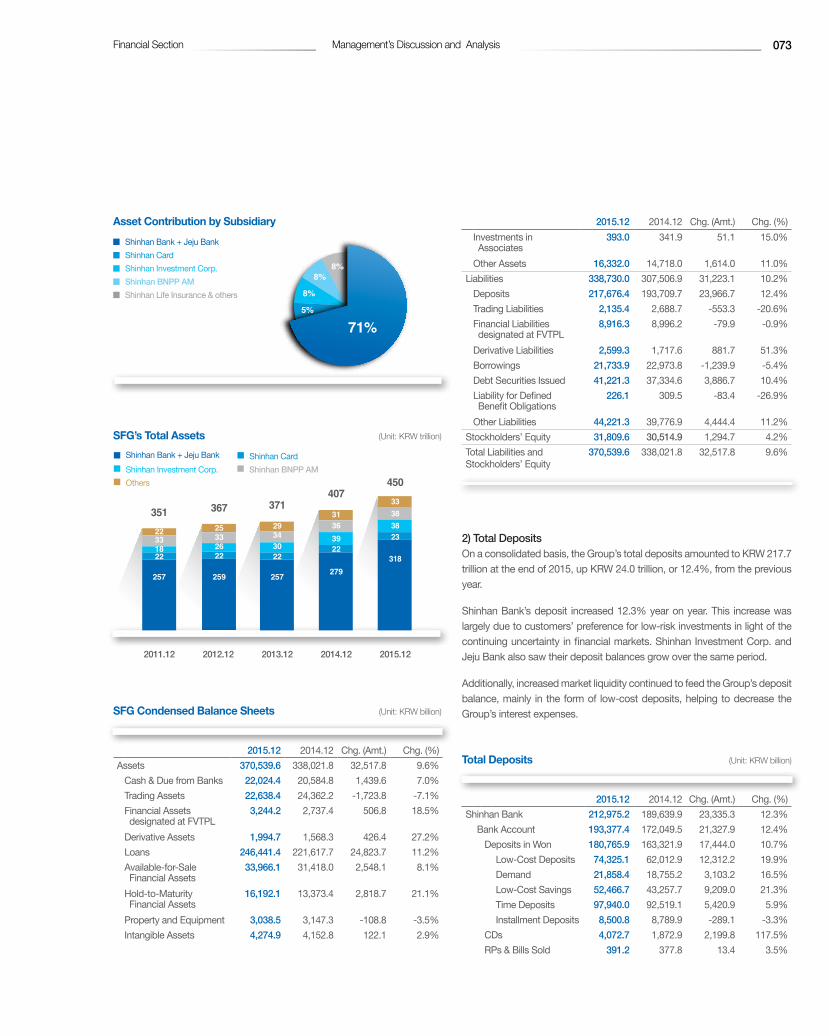
0
1000
2000
3000
4000
5000
0
200
400
600
800
1000
1200
30
40
50
0.000000
916.666667
1833.333333
2750.000000
3666.666667
4583.333333
5500.000000
5000
6000
1.3
1.6
1.9
0.5
1.0
1.5
2.0
2.5
3.0
100
150
200
1.0
1.5
2.0
2.5
40
49
58
0.000000
0.166667
0.333333
0.500000
0.666667
0.833333
1.000000
0
200
400
600
800
1000
0.0
4.2
8.4
12.6
16.8
21.0
0
90
180
270
360
450
0
4700
9400
14100
18800
23500
30
54
78
102
126
150
10.000000
16.666667
23.333333
30.000000
0
50
100
150
200
250
0
50
100
150
200
250
100135170205240275310345380
0
50
100
150
200
▒ Shinhan Bank + Jeju Bank ▒ Shinhan Card▒ Shinhan Investment Corp.▒ Shinhan BNPP AM▒ Shinhan Life Insurance & others
259
22263325
367
242
22163523
318
23383833
450
257
22183322
351
257
22303429
371
279
22393631
407
▒ Shinhan Bank + Jeju Bank ▒ Shinhan Card▒ Shinhan Investment Corp. ▒ Shinhan BNPP AM▒ Others
2011.12 2012.12 2013.12 2014.12 2015.12
Financial Section 073Management’s Discussion and Analysis
Asset Contribution by Subsidiary
SFG’s Total Assets (Unit: KRW trillion)
SFG Condensed Balance Sheets (Unit: KRW billion)
2015.12 2014.12 Chg. (Amt.) Chg. (%)Assets 370,539.6 338,021.8 32,517.8 9.6%
Cash & Due from Banks 22,024.4 20,584.8 1,439.6 7.0%Trading Assets 22,638.4 24,362.2 -1,723.8 -7.1%Financial Assets designated at FVTPL
3,244.2 2,737.4 506.8 18.5%
Derivative Assets 1,994.7 1,568.3 426.4 27.2%Loans 246,441.4 221,617.7 24,823.7 11.2%Available-for-Sale Financial Assets
33,966.1 31,418.0 2,548.1 8.1%
Hold-to-Maturity Financial Assets
16,192.1 13,373.4 2,818.7 21.1%
Property and Equipment 3,038.5 3,147.3 -108.8 -3.5%Intangible Assets 4,274.9 4,152.8 122.1 2.9%
2015.12 2014.12 Chg. (Amt.) Chg. (%)Investments in Associates
393.0 341.9 51.1 15.0%
Other Assets 16,332.0 14,718.0 1,614.0 11.0%Liabilities 338,730.0 307,506.9 31,223.1 10.2%
Deposits 217,676.4 193,709.7 23,966.7 12.4%Trading Liabilities 2,135.4 2,688.7 -553.3 -20.6%Financial Liabilities designated at FVTPL
8,916.3 8,996.2 -79.9 -0.9%
Derivative Liabilities 2,599.3 1,717.6 881.7 51.3%Borrowings 21,733.9 22,973.8 -1,239.9 -5.4%Debt Securities Issued 41,221.3 37,334.6 3,886.7 10.4%Liability for Defined Benefit Obligations
226.1 309.5 -83.4 -26.9%
Other Liabilities 44,221.3 39,776.9 4,444.4 11.2%Stockholders’ Equity 31,809.6 30,514.9 1,294.7 4.2%Total Liabilities and Stockholders’ Equity
370,539.6 338,021.8 32,517.8 9.6%
2) Total DepositsOn a consolidated basis, the Group’s total deposits amounted to KRW 217.7 trillion at the end of 2015, up KRW 24.0 trillion, or 12.4%, from the previous year.
Shinhan Bank’s deposit increased 12.3% year on year. This increase was largely due to customers’ preference for low-risk investments in light of the continuing uncertainty in financial markets. Shinhan Investment Corp. and Jeju Bank also saw their deposit balances grow over the same period.
Additionally, increased market liquidity continued to feed the Group’s deposit balance, mainly in the form of low-cost deposits, helping to decrease the Group’s interest expenses.
Total Deposits (Unit: KRW billion)
2015.12 2014.12 Chg. (Amt.) Chg. (%)Shinhan Bank 212,975.2 189,639.9 23,335.3 12.3%
Bank Account 193,377.4 172,049.5 21,327.9 12.4%Deposits in Won 180,765.9 163,321.9 17,444.0 10.7%
Low-Cost Deposits 74,325.1 62,012.9 12,312.2 19.9%Demand 21,858.4 18,755.2 3,103.2 16.5%Low-Cost Savings 52,466.7 43,257.7 9,209.0 21.3%Time Deposits 97,940.0 92,519.1 5,420.9 5.9%Installment Deposits 8,500.8 8,789.9 -289.1 -3.3%
CDs 4,072.7 1,872.9 2,199.8 117.5%RPs & Bills Sold 391.2 377.8 13.4 3.5%

Management’s Discussion and Analysis
Shinhan Financial Group Annual Report 2015 074
- Precautionary & Below Ratio - NPL Ratio
2010.12 2011.12 2012.12 2013.12 2014.12 2015.12
2.46
1.64
2.89
2.14
2.90
2.43
1.461.261.25
1.341.15
0.87
2015.12 2014.12 Chg. (Amt.) Chg. (%)Deposits in FC 8,147.8 6,476.9 1,670.9 25.8%
Trust Accounts 24,092.9 19,590.7 4,502.2 23.0%Merchant A/C and Other Consolidated Entities
-4,495.2 -2,000.3 -2,494.9 124.7%
Shinhan Investment Corp. 1,197.2 1,091.7 105.5 9.7%Jeju Bank 3,836.9 2,915.0 921.9 31.6%Shinhan Savings Bank 661.0 666.8 -5.8 -0.9%(-) Intra-Group Transactions -993.9 -603.6 -390.3 n.a.Total 217,676.4 193,709.7 23,966.7 12.4%
3) Total LoansIn 2015, the group’s total loans on a consolidated basis grew by KRW 24.8 trillion, or 11.2%, from the previous year to reach KRW 246.4 trillion.
Shinhan Bank, Shinhan Card, Shinhan Investment Corp., Shinhan Life Insur-ance and Jeju Bank each grew their loan balance by KRW 21.3 trillion, KRW 0.8 trillion, KRW 1.1 trillion, KRW 0.5 trillion and KRW 0.8 trillion, respectively.
Shinhan Bank’s loan expansion was driven by the balanced growth in both retail and corporate loans. Shinhan Card’s loan balance also went up as credit purchase transactions and auto financing both increased. Shinhan Investment Corp. saw its IB-related loan assets increase over the previous year, while Shinhan Life Insurance experienced a loan balance growth, as a result of increased corporate loans and policy loans.
Total Loans (Unit: KRW billion)
2015.12 2014.12 Chg. (Amt.) Chg. (%)Shinhan Bank 209,651.5 188,325.5 21,326.0 11.3%
Bank Account 199,077.6 179,606.3 19,471.3 10.8%Trust Account 454.3 433.7 20.6 4.8%Others 10,119.6 8,285.5 1,834.1 22.1%
Shinhan Card 21,322.7 20,550.1 772.6 3.8%Shinhan Investment Corp. 2,533.7 1,475.7 1,058.0 71.7%Shinhan Life Insurance 5,372.1 4,919.4 452.7 9.2%Shinhan Capital 3,467.9 3,515.5 -47.6 -1.4%Jeju Bank 3,543.7 2,723.9 819.8 30.1%Shinhan Savings Bank 696.5 589.0 107.5 18.3%Other Subsidiaries 89.9 79.2 10.7 13.5%(-) Intra-Group Transactions -230.1 -560.5 330.4 n.a.Total 246,447.8 221,617.7 24,830.1 11.2%
4) Asset QualityAt the end of 2015, Shinhan Financial Group posted an NPL ratio of 0.87%, down by 0.28%p from 2014—the Group’s lowest level since 2009. This de-cline can be attributed largely to sound asset growth and a decline in bad debt amount. Not only did substandard and below loans fall in 2015, but pre-cautionary loans also shrank by KRW 352.6 billion, while delinquency ratio performance leveled off across the Group’s subsidiaries.
The Group’s NPL coverage ratio rose by 23%p from the year before, to 191%, the highest in the industry, effectively providing sufficient coverage for any potential adverse changes in the future.
SFG Asset Quality (Unit: KRW billion)
2015.12 2014.12 Chg. (Amt.) Chg. (%)Total1) 238,775.7 220,089.7 18,686.0 8.5%
Normal 234,863.7 215,378.5 19,485.2 9.0%Precautionary 1,834.6 2,187.2 -352.6 -16.1%Substandard 954.0 1,133.9 -179.9 -15.9%Doubtful 591.0 372.8 218.2 58.5%Estimated Loss 532.5 1,017.2 -484.7 -47.6%
Substandard & Below Ratio 0.87% 1.15% - -0.28%pAllowances + Reserves2) 3,969.5 4,241.4 -271.9 -6.4%Coverage Ratio 191% 168% - 23%p
1) The sum of Shinhan Bank, Jeju Bank, Shinhan Card, Shinhan Investment Corp., Shinhan Life Insurance, Shinhan Capital, and Shinhan Savings Bank
2) The sum of IFRS-based LLA and reserves for credit losses, excluding those for contingent acceptances & guarantees and unused credit lines
SFG Precautionary & Below Ratio / NPL Ratio (Unit: %)

2011.12 2012.12 2013.12 2014.12 2015.12
9.0% 8.8%
3.7%2.0%
13.9%1)
10.5%
139 144 147160
177
- Growth Rate (YTD) ▒ Loan in KRW
0
1000
2000
3000
4000
5000
0
200
400
600
800
1000
1200
30
40
50
0.000000
916.666667
1833.333333
2750.000000
3666.666667
4583.333333
5500.000000
5000
6000
1.3
1.6
1.9
0.5
1.0
1.5
2.0
2.5
3.0
100
150
200
1.0
1.5
2.0
2.5
40
49
58
0.000000
0.166667
0.333333
0.500000
0.666667
0.833333
1.000000
0
200
400
600
800
1000
0.0
4.2
8.4
12.6
16.8
21.0
0
90
180
270
360
450
0
4700
9400
14100
18800
23500
30
54
78
102
126
150
10.000000
16.666667
23.333333
30.000000
0
50
100
150
200
250
0
50
100
150
200
250
100135170205240275310345380
0
50
100
150
200
▒ Retail ▒ SMEs▒ Large Corp.
Financial Section 075Management’s Discussion and Analysis
2010.12 2011.12 2012.12 2013.12 2014.12 2015.12
142
163166 170 168
191
- Corporate - Total Loans - Retail
5.91.0
10.6
0.88.3 8.9
-1.0
3.9 2.97.2 7.0 9.4
12.1
4.3
5.02.0
9.03.7
8.8 10.5
1.5
2009.12 2011.12 2012.12 2013.12 2014.12 2015.122010.12
SFG NPL Coverage Ratio (Unit: %)
2. Shinhan Bank
1) LoansAt the end of 2015, Shinhan Bank’s loan assets in Korean won amounted to KRW 176.8 trillion, up KRW 16.8 trillion (10.5%) from the previous year.
In 2015, the bank focused its targeted marketing activities to proprietary business owners and small- and medium-size enterprises that are not re-quired to be audited by outside accounting firms. As a result, corporate loans increased by KRW 7.3 trillion, or 8.9%, compared to 2014.
Retail loans grew by KRW 9.5 trillion, or 12.1% year on year, as a result of the growth in prime credit loans and increased mortgage loans following deregulation in Korea’s housing market.
Specifically, retail lending achieved very high growth despite the bank’s KRW 5.4 trillion in securitization. This can be explained by the continued rise in demand for loans.
Shinhan Bank Loans (Unit: KRW billion)
2015.12 2014.12 Chg. (Amt.) Chg. (%)Loan in KRW 176,810.0 160,024.9 16,785.1 10.5%
Retail 88,084.8 78,577.4 9,507.4 12.1%Mortgage 52,054.2 47,556.3 4,497.9 9.5%Others1) 36,030.6 31,021.0 5,009.6 16.1%
Corporate 88,725.2 81,447.5 7,277.7 8.9%SME 67,336.3 59,889.4 7,446.9 12.4% SOHO 34,223.0 30,469.4 3,753.6 12.3%Large Corporate etc. 21,388.9 21,558.1 -169.2 -0.8%
Loan in FX 8,114.4 6,955.9 1,158.5 16.7%
1) Including unsecured personal loans, commercial mortgage loans, and jeonse loans etc.
Loan Composition at Shinhan Bank
Loan Growth at Shinhan Bank (Unit: KRW trillion)
1) Including securitized loans
Shinhan Bank Loan Growth Rate by Sector (Unit: %)

Management’s Discussion and Analysis
- NPL Ratio▒ NPL Coverage Ratio
173149 154
171166
136
1.31
1.09 1.081.16
0.80
1.03
2011.12 2012.12 2013.12 2014.12 2015.122010.12
2010.12 2011.12 2012.12 2013.12 2014.12 2015.12
0.54 0.460.37
0.510.33 0.28
0.861.04
0.55
0.89
0.530.41
0.30 0.390.23
0.53
0.24 0.19
0.480.60
0.31
0.61
0.39 0.33
- Total Delinquency - SME(+SOHO) - SOHO - Retail
Shinhan Financial Group Annual Report 2015 076
2) Asset QualityShinhan Bank’s NPL (substandard & below) ratio stood at KRW 0.80% in 2015, down 0.23%p from the previous year. This marks the bank’s lowest figure since 2010 and serves as clear evidence of its excellent risk manage-ment capabilities. The delinquency ratio remained at a record-low 0.33%, with the NPL coverage ratio standing at a sound 173%. The substandard and below loan amount declined by KRW 307.5 billion from the year before, and the precautionary loan amount also fell KRW 326.6 billion over the same period.
Asset Quality of Shinhan Bank (Unit: KRW billion)
2015.12 2014.12 Chg. (Amt.) Chg. (%)Total 202,003.2 185,966.1 16,037.1 8.6%
Normal 199,533.8 182,862.6 16,671.2 9.1%Precautionary 854.6 1,181.2 -326.6 -27.6%Substandard 849.9 995.3 -145.4 -14.6%Doubtful 452.5 215.2 237.3 110.2%Estimated Loss 312.4 711.8 -399.4 -56.1%
Substandard & Below Ratio 0.80% 1.03% - -0.23%pAllowances + Reserves1) 2,789.8 2,963.3 -173.5 -5.9%Coverage Ratio 173% 154% - 19%p
1) The sum of IFRS-based LLA and reserves for credit losses, excluding those for contingent acceptances & guarantees and unused credit lines
NPL Ratio & NPL Coverage Ratio at Shinhan Bank (Unit: %)
Delinquency Ratio at Shinhan Bank (Unit: %)
Note) One month overdue
3. Shinhan Card
1) Debit/Credit Card HoldersIn 2015, the number of Shinhan Card’s active credit card holders declined to 12.1million from 12.5 million of the previous year. This figure was affected by new regulations in 2013 mandating the automatic delisting of dormant credit cards. Nevertheless, the company successfully retained the largest customer base in Korea’s credit card business in 2015.
Effective Cardholders & Merchants of Shinhan Card (Unit: thousand)
2015.12 2014.12 Chg. (Amt.) Chg. (%)Effective Cardholders 12,051.8 12,467.6 -415.8 -3.3%Merchants 2,513.4 2,491.0 22.4 0.9%
2) Operating Assets Shinhan Card’s credit purchase declined by 0.2% from the previous year due to the company’s profit-oriented policy by reducing new issuance of low-profit corporate credit cards. Cash advances declined by 7.8% year on year as a result of the market size contraction, while credit card loans improved by 13.0% thanks to the company’s active marketing.
Assets from installment and lease financing enjoyed a year-on-year surge, fueled by expanding market demand for lease financing with the start of the company’s long-term car-rental business.

▒ Credit sales ▒ Cash advances ▒ Credit card loans▒ Installment financing ▒ Re-aged loans
11,092
3,185
3,374
1,929192
11,353
2,051
4,823
2,862234
10,915
3,219
3,268
1,847211
11,552
2,767
3,288
2,212208
10,954
2,368
4,036
2,043225
11,374
2,223
4,237
2,479237
19,772 21,32319,460 20,027 19,626 20,550
2011.12 2012.12 2013.12 2014.12 2015.122010.12
Financial Section 077Management’s Discussion and Analysis
- Total Transaction ▒ Lump-Sum ▒ Installment Purchases▒ Cash Advances ▒ Credit Card Loans▒ Others
20152011 2012 2013 2014
102.7(23.3)
21.4
15.37.2
96.7(19.4)
20.0
16.56.4
90.2(15.4)
19.8
18.2
6.6
85.5(13.3)
21.3
20.6
5.5
85.0(12.5)
20.9
22.7
5.9
135.5 134.1 135.8141.3
148.4
Note) Figures in parentheses represent debit card transaction volume
- NPL Ratio▒ NPL Coverage Ratio
2011.12 2012.12 2013.12 2014.12 2015.122010.12
1.62 1.722.15
1.531.24
1.67
359323
300
254234234
Operating Assets Portfolio for Shinhan Card (Unit: KRW billion)
2015.12 2014.12 Chg. (Amt.) Chg. (%)Operating Assets 21,322.7 20,550.1 772.6 3.8%
Credit Purchases 11,353.0 11,374.1 -21.1 -0.2%Cash Advances 2,050.6 2,223.3 -172.7 -7.8%Credit Card Loans 5,056.6 4,473.5 583.1 13.0%
Re-aged Loans 233.7 236.6 -2.9 -1.2%Installment Financing 1,864.6 1,599.0 265.6 16.6%Lease Financing 997.9 880.3 117.6 13.4%
Shinhan Card Operating Assets Breakdown by Products (Unit: KRW billion)
Transaction Volume of Shinhan Card (Unit : KRW trillion)
3) Asset QualityDespite the continued expansion in household debt, Shinhan Card’s one-month and over delinquency ratio dropped from 1.89% of the previous year to 1.44% by the end of 2015. The substandard & below ratio also inched down by 0.42%p to 1.24%, with an NPL coverage ratio of 359%, or 59%p higher than that of 2014. Write-offs of non-performing loans amounted to KRW 501.2 billion, down by KRW 6.9 billion from the previous year’s KRW 508.1 billion.
Asset Quality of Shinhan Card (Unit: KRW billion)
2015.12 2014.12 Chg. (Amt.) Chg. (%)Total 21,322.7 20,550.1 772.6 3.8%
Normal 20,332.5 19,475.1 857.4 4.4%Precautionary 724.8 732.1 -7.3 -1.0%Substandard - - - -Doubtful 79.0 82.0 -3.0 -3.7%Estimated Loss 186.5 261.0 -74.5 -28.5%
Substandard & Below Ratio 1.24% 1.67% - -0.43%pAllowances + Reserves1) 953.4 1,029.9 -76.5 -7.4%Coverage Ratio 359% 300% - 59%p
1) The sum of IFRS-based LLA and reserves for credit losses, excluding those for contingent acceptances & guarantees and unused credit lines
NPL Ratio & NPL Coverage Ratio of Shinhan Card (Unit: %)

2010.12 2011.12 2012.12 2013.12 2014.12 2015.12
1.80 1.80
2.01 2.351.89
1.44
Management’s Discussion and Analysis
Shinhan Financial Group Annual Report 2015 078
Delinquency Ratio of Shinhan Card (Unit: %)
Note) One month overdue from total credit
4. Shinhan Investment Corp.
At the end of 2015, Shinhan Investment Corp.’s total assets stood at KRW 24.3 trillion. Securities amounted to KRW 16.2 trillion, accounting for 66.6% of total assets, followed by cash and deposits, which totaled KRW 3.6 trillion, or 14.7% of total assets.
Total assets contracted by 6.1% from the previous year, mainly as a result of the 15.3% year-on-year decrease in securities. This was mainly due to the introduction of the new leverage ratio requirement for financial investment companies in 2015. On the other hand, with loan assets, the growth of IB-related loans and credit lending resulted in a 71.7% year-on-year increase.
Liabilities stood at KRW 21.8 trillion, down 7.6% from 2014. The main reason for the decline was the decrease in bond assets that came about from the aforementioned regulations, shrinking the RP balance from KRW 6.5 trillion in 2014 to KRW 4.9 trillion by the end of 2015.
Total shareholders’ equity rose by 8.4%, to KRW 2.5 trillion, thanks to net income growth.
Condensed Balance Sheets of Shinhan Investment Corp.(Unit: KRW billion)
2015.12 2014.12 Chg. (Amt.) Chg. (%)Total Assets 24,337 25,928 -1,591 -6.1%
Cash and Deposits 3,576 3,361 215 6.4%Securities 16,216 19,137 -2,921 -15.3%
(Trading securities) 14,118 16,410 -2,292 -14.0%Derivatives 268 227 41 18.3%Loans 2,534 1,476 1,058 71.7%
(Brokers’ loans) 1,259 957 302 31.6%Tangible fixed assets 119 126 -7 -5.3%
2015.12 2014.12 Chg. (Amt.) Chg. (%)Other Assets 1,625 1,603 22 1.4%
Total Liabilities 21,812 23,598 -1,786 -7.6%Deposits 1,197 1,100 97 8.8%
(Customers’ deposits) 1,189 1,092 97 8.9%Borrowings 18,182 20,798 -2,616 -12.6%
(Call money) 375 866 -491 -56.7%(Borrowings) 872 927 -55 -5.9% (Bonds sold under repurchase agreements)
6,109 7,340 -1,231 -16.8%
(Derivatives-combined securities sold)
8,818 8,992 -174 -1.9%
Other Liabilities 2,433 1,700 733 43.1%Total Stockholders’ equity 2,526 2,330 196 8.4%Total Liabilities & Stockholders’ Equity
24,337 25,928 -1,591 -6.1%
IV. Funding
1. Shinhan Bank
Shinhan Bank’s Korean won-denominated deposits amounted to KRW 180.8 trillion at the end of 2015, up KRW 17.4 trillion (10.7%) from the previous year.
The substantial increase of the deposits, especially low-cost ones, is largely due to customers’ growing preference for low-risk investments in light of the continuing uncertainty in financial markets and abundant market liquid-ity resulting from the sustained low interest rate environment. Alongside the bank’s efforts to attract new payroll accounts and credit card bill settlement accounts, inflows of liquidity capital from institutional and corporate clients helped low-cost deposits rise from the previous year by KRW 12.3 trillion, or 19.9%, to reach KRW 74.3 trillion in 2015.
Shinhan Bank’s loan-to-deposit ratio stood at 98.8%, remaining at a stable level against the regulated ratio of 100%.
Deposits and Debentures at Shinhan Bank (Unit: KRW billion)
2015.12 2014.12 Chg. (Amt.) Chg. (%)Total Deposits 180,765.9 163,321.9 17,444.0 10.7%
Low-Cost Deposits 74,325.1 62,012.9 12,312.2 19.9%Demand 21,858.4 18,755.2 3,103.2 16.5%Savings 52,466.7 43,257.7 9,209.0 21.3%
Time Savings 106,440.8 101,309.0 5,131.8 5.1%Time Deposits 97,940.0 92,519.1 5,420.9 5.9%Accumulative 8,500.8 8,789.9 -289.1 -3.3%
Certificate of Deposits 4,072.7 1,872.9 2,199.8 117.5%Debentures 15,989.1 12,566.4 3,422.7 27.2%

▒ Debentures ▒ ABS▒ CPs ▒ Others
-4
-2
0
2
4
6
8
10
0.000000
9.166667
18.333333
27.500000
36.666667
45.833333
55.000000
6
9
12
15
202632384450566268
2014 2015
-4
-2
0
2
4
6
8
10
0.000000
9.166667
18.333333
27.500000
36.666667
45.833333
55.000000
6
9
12
15
202632384450566268
- Growth Rate (YTD)▒ Low-Cost Deposits
74
5362
4746
4.0% 2.9%
11.9%
19.9%17.7%
2011.12 2012.12 2013.12 2014.12 2015.12
98.8%
97.2%98.5%
98.9%98.0% 98.0%
2011.12 2012.12 2013.12 2014.12 2015.122010.12
Financial Section 079Management’s Discussion and Analysis
-4
-2
0
2
4
6
8
10
0.000000
9.166667
18.333333
27.500000
36.666667
45.833333
55.000000
6
9
12
15
202632384450566268
▒ Time Savings▒ Low-Cost Deposits ▒ CDs▒ Debentures
-4
-2
0
2
4
6
8
10
0.000000
9.166667
18.333333
27.500000
36.666667
45.833333
55.000000
6
9
12
15
202632384450566268
▒ Less than 1 year ▒ 1-2 yrs▒ More than 2 years
2014 2015
-4
-2
0
2
4
6
8
10
0.000000
9.166667
18.333333
27.500000
36.666667
45.833333
55.000000
6
9
12
15
202632384450566268
Funding Composition of Shinhan Bank
Low-Cost Deposits at Shinhan Bank (Unit: KRW trillion)
Loan-to-Deposit Ratio at Shinhan Bank
2. Shinhan Card
Shinhan Card obtains funding from a variety of sources, including corporate debentures, asset-backed securitizations and commercial papers. By the
end of 2015, total funding stood at KRW 13.3 trillion, a 6.4% increase from KRW 12.5 trillion in 2014.
In 2015, Shinhan Card maintained its funding stability with its corporate de-bentures accounting for 73% of total funding due to favorable market condi-tions and ample market liquidity.
Total Funding of Shinhan Card (Unit: KRW billion)
2015.12 2014.12 Chg. (Amt.) Chg. (%)Total Funding 13,325.2 12,528.6 796.6 6.4%
Debentures 9,779.8 9,360.0 419.8 4.5%ABS 1,992.3 1,978.6 13.7 0.7%CPs 770.0 440.0 330.0 75.0%Others 783.2 750.0 33.2 4.4%
Funding Composition of Shinhan Card
Debt Maturity Profile of Shinhan Card

V. Capital Management
1. Shinhan Financial Group
The Group’s BIS ratio was 13.4% at the end of 2015, up 0.4%p from the pre-vious year. Its common equity tier 1 (CET 1) ratio improved 0.4%p from 2014 to reach a stable 10.8% in 2015. While continued asset growth throughout the year also escalated the size of risk-weighted assets, the increased eq-uity capital, which was led by a rise in retained earnings, helped improve the Group’s capital ratio over the previous year. Currently, Shinhan Financial Group fully satisfies all capital adequacy requirements set forth under Korean laws and regulations, maintaining the capital ratios in excess of the required minimum levels.
Group BIS Ratio (Unit : KRW billion)
2015.12 2014.12 Chg. (Amt.) Chg. (%)Risk-Weighted Assets 203,274.5 198,832.9 4,441.6 2.2%Capital 27,216.4 25,938.0 1,278.4 4.9%
CET 1 21,882.8 20,679.0 1,203.8 5.8%Tier 1 23,194.2 22,174.4 1,019.8 4.6%
BIS Ratio 13.4% 13.0% - 0.4%pCET 1 Ratio 10.8% 10.4% - 0.4%pTier 1 Ratio 11.4% 11.2% - 0.2%p
Group BIS Ratio (Unit: %)
2. Shinhan Bank
As of the end of 2015, Shinhan Bank’s BIS ratio was 14.8%, down 0.6%p from 2014, while the CET 1 ratio declined 0.5%p to a stable level of 12.0%.Even though retained earnings improved with stable profitability, the relative-
ly higher growth in risk-weighted assets as a result of steady asset growth led to a slight drop in capital ratios.
Shinhan Bank BIS Ratio (Unit : KRW billion)
2015.12 2014.12 Chg. (Amt.) Chg. (%)Risk-Weighted Assets 144,843.7 135,714.8 9,128.9 6.7%Capital 21,370.1 20,947.4 422.7 2.0%
CET 1 17,324.0 16,999.5 324.5 1.9%Tier 1 18,129.7 18,101.8 27.9 0.2%
BIS Ratio 14.8% 15.4% - -0.6%pCET 1 Ratio 12.0% 12.5% - -0.5%pTier 1 Ratio 12.5% 13.3% - -0.8%p
Shinhan Bank BIS Ratio (Unit: %)
3. Shinhan Card
As of December 2015, Shinhan Card held KRW 6.4 trillion in adjusted equity capital, with its capital adequacy ratio (CAR) standing at 28.9%. The com-pany has been maintaining its CAR above the 20% level since 2007.
Shinhan Card Capital Adequacy Ratio (Unit: %)
Management’s Discussion and Analysis
- BIS Ratio - Tier 1 - CET 1
2010.12 2011.12 2012.12 2013.12 2014.12 2015.12
10.0 10.4 10.8
8.3 8.9 9.5
11.3 11.2 11.4
12.411.4
12.513.4 13.0 13.4
- BIS Ratio - Tier 1 - CET 1
2010.12 2011.12 2012.12 2013.12 2014.12 2015.12
12.5 12.5 12.0
12.5 12.4 12.613.9 13.3
12.5
15.6 15.3 15.8 16.3 15.4 14.8
Shinhan Financial Group Annual Report 2015 080
2010.12 2011.12 2012.12 2013.12 2014.12 2015.12
25.2 24.8
27.4
30.429.7
28.9

KPMG Samjong Accounting Corp.10th Floor, Gangnam Finance Center, 152, Teheran-ro,Gangnam-gu, 135-984 Seoul, Republic of KoreaTel 82 2112 0100 / Fax 82 2112 0101www.kr.kpmg.com
Financial Section 081Independent Auditor’s Report
Independent Auditors’ ReportBased on a report originally issued in Korean
The Board of Directors and Stockholders Shinhan Financial Group Co., Ltd.:
We have audited the accompanying consolidated financial statements of Shinhan Financial Group Co., Ltd. and its subsidiaries (collectively the “Group”), which comprise the consolidated statements of financial position as at December 31, 2015 and 2014, the consolidated statements of comprehensive in-come, changes in equity and cash flows for the years then ended, and notes, comprising a summary of significant accounting policies and other explanatory information.
Management’s Responsibility for the Consolidated Financial StatementsManagement is responsible for the preparation and fair presentation of these consolidated financial statements in accordance with Korean International Finan-cial Reporting Standards, and for such internal control as management determines is necessary to enable the preparation of consolidated financial statements that are free from material misstatement, whether due to fraud or error.
Auditors’ ResponsibilityOur responsibility is to express an opinion on these consolidated financial statements based on our audits. We conducted our audits in accordance with Korean Standards on Auditing. Those standards require that we comply with ethical requirements and plan and perform the audit to obtain reasonable as-surance about whether the consolidated financial statements are free from material misstatement.
An audit involves performing procedures to obtain audit evidence about the amounts and disclosures in the consolidated financial statements. The proce-dures selected depend on our judgment, including the assessment of the risks of material misstatement of the consolidated financial statements, whether due to fraud or error. In making those risk assessments, we consider internal control relevant to the entity’s preparation and fair presentation of the consolidated financial statements in order to design audit procedures that are appropriate in the circumstances, but not for the purpose of expressing an opinion on the effectiveness of the entity’s internal control. An audit also includes evaluating the appropriateness of accounting policies used and the reasonableness of accounting estimates made by management, as well as evaluating the overall presentation of the consolidated financial statements.
We believe that the audit evidence we have obtained is sufficient and appropriate to provide a basis for our audit opinion.
OpinionIn our opinion, the consolidated financial statements present fairly, in all material respects, the consolidated financial position of the Group as at December 31, 2015 and 2014 and of its consolidated financial performance and its consolidated cash flows for the years then ended in accordance with Korean International Financial Reporting Standards.
Other mattersThe procedures and practices utilized in the Republic of Korea to audit such consolidated financial statements may differ from those generally accepted and applied in other countries.
KPMG Samjong Accounting Corp.Seoul, KoreaMarch 9, 2016
This report is effective as of March 9, 2016, the audit report date. Certain subsequent events or circumstances, which may occur between the audit report date and the time of reading this report, could have a material impact on the accompanying consolidated financial statements and notes thereto. Accordingly, the readers of the audit report should understand that the above audit report has not been updated to reflect the impact of such subsequent events or circumstances, if any.

Notes 2015 2014Assets
Cash and due from banks 4,8,20 ₩ 22,024,404 20,584,838Trading assets 4,9,20 22,638,449 24,362,176Financial assets designated at fair value through profit or loss 4,10,20 3,244,166 2,737,375Derivative assets 4,11 1,994,714 1,568,307Loans 4,12,20 246,441,361 221,617,689Available-for-sale financial assets 4,13,20 33,966,071 31,418,014Held-to-maturity financial assets 4,13,20 16,192,060 13,373,384Property and equipment 14,20 3,038,477 3,147,255Intangible assets 15 4,274,896 4,152,843Investments in associates 16 393,006 341,876Current tax receivable 9,740 10,643Deferred tax assets 42 163,944 228,356Investment property 17 208,717 267,529Other assets 4,18,20 15,945,927 14,202,627Assets held for sale 3,690 8,892
Total assets ₩ 370,539,622 338,021,804
LiabilitiesDeposits 4,21 ₩ 217,676,428 193,709,738Trading liabilities 4,22 2,135,390 2,688,734Financial liabilities designated at fair value through profit or loss 4,23 8,916,332 8,996,181Derivative liabilities 4,11 2,599,288 1,717,555Borrowings 4,24 21,733,865 22,973,767Debt securities issued 4,25 41,221,284 37,334,612Liabilities for defined benefit obligations 26 226,130 309,457Provisions 27 698,788 694,165Current tax payable 142,014 256,993Deferred tax liabilities 42 11,193 9,549Liabilities under insurance contracts 28 20,058,284 17,776,280Other liabilities 4,29 23,310,990 21,039,865
Total liabilities 338,729,986 307,506,896
Equity 30Capital stock 2,645,053 2,645,053Hybrid bonds 736,898 537,443Capital surplus 9,887,335 9,887,335Capital adjustments (423,536) (393,405)Accumulated other comprehensive income 304,771 637,894Retained earnings 17,689,134 15,869,779Total equity attributable to equity holders of Shinhan Financial Group Co.,Ltd. 30,839,655 29,184,099Non-controlling interests 969,981 1,330,809
Total equity 31,809,636 30,514,908Total liabilities and equity ₩ 370,539,622 338,021,804
(In millions of won)
See accompanying notes to the consolidated financial statements.
Shinhan Financial Group Annual Report 2015 082
Consolidated Statements of Financial PositionAs of December 31, 2015 and 2014

(In millions of won, except earnings per share)
See accompanying notes to the consolidated financial statements.
Financial Section 083Consolidated Financial Statements
Consolidated Statements of Comprehensive IncomeFor the years ended December 31, 2015 and 2014
Notes 2015 2014Interest income ₩ 11,129,704 12,060,507Interest expense (4,436,771) (5,270,707)
Net interest income 32 6,692,933 6,789,800Fees and commission income 3,896,529 3,560,500Fees and commission expense (2,275,550) (2,091,342)
Net fees and commission income 33 1,620,979 1,469,158Insurance income 4,447,828 4,221,120Insurance expenses (4,879,989) (4,634,320)
Net insurance loss 28 (432,161) (413,200)Dividend income 34 308,277 175,798Net trading income (expenses) 35 (344,098) 262,492Net foreign currency transaction gain 78,236 223,718Net gain (loss) on financial instruments designated at fair value through profit or loss 36 459,765 (360,972)Net gain on disposal of available-for-sale financial assets 13 772,474 680,931Impairment losses on financial assets 37 (1,264,053) (1,174,379)General and administrative expenses 38 (4,475,068) (4,462,883)Other operating expenses, net 40 (444,143) (535,653)
Operating income 2,973,141 2,654,810Equity method income 16 20,971 30,580Other non-operating income, net 41 146,465 182,186
Profit before income taxes 3,140,577 2,867,576Income tax expense 42 694,619 667,965
Profit for the year 2,445,958 2,199,611
Other comprehensive income (loss) for the year, net of income taxItems that are or may be reclassified to profit or loss: Foreign currency translation adjustments for foreign operations (6,469) (12,868) Net change in unrealized fair value of available-for-sale financial assets (265,990) 135,908 Equity in other comprehensive income of associates 11,624 6,255 Net change in unrealized fair value of cash flow hedges 2,932 (16,378) Other comprehensive income (loss) of separate account 3,092 5,820
(254,811) 118,737Items that will never be reclassified to profit or loss: Remeasurements of the defined benefit liability (81,813) (154,416) Total other comprehensive loss, net of income tax 30 (336,624) (35,679)
Total comprehensive income for the year 2,109,334 2,163,932Profit for the year attributable to:
Equity holders of Shinhan Financial Group Co., Ltd. 30,43 2,367,171 2,081,110Non-controlling interest 78,787 118,501
2,445,958 2,199,611Total comprehensive income attributable to:
Equity holders of Shinhan Financial Group Co., Ltd. 2,034,048 2,046,037Non-controlling interest 75,286 117,895
2,109,334 2,163,932Earnings per share: 30,43
Basic and diluted earnings per share in won ₩ 4,789 4,195
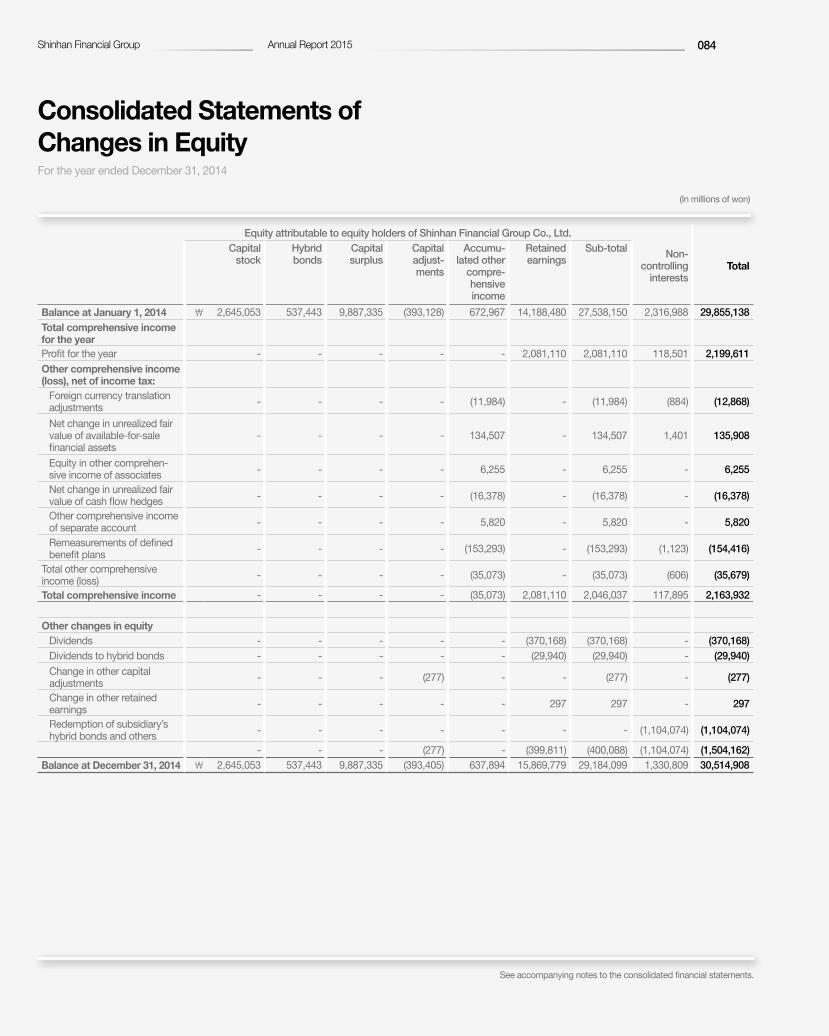
Shinhan Financial Group Annual Report 2015 084
Consolidated Statements of Changes in Equity For the year ended December 31, 2014
Equity attributable to equity holders of Shinhan Financial Group Co., Ltd.
Non- controlling
interestsTotal
Capital stock
Hybrid bonds
Capital surplus
Capital adjust-ments
Accumu-lated other
compre-hensive income
Retained earnings
Sub-total
Balance at January 1, 2014 ₩ 2,645,053 537,443 9,887,335 (393,128) 672,967 14,188,480 27,538,150 2,316,988 29,855,138Total comprehensive income for the yearProfit for the year - - - - - 2,081,110 2,081,110 118,501 2,199,611Other comprehensive income (loss), net of income tax:
Foreign currency translation adjustments - - - - (11,984) - (11,984) (884) (12,868)
Net change in unrealized fair value of available-for-sale financial assets
- - - - 134,507 - 134,507 1,401 135,908
Equity in other comprehen-sive income of associates - - - - 6,255 - 6,255 - 6,255
Net change in unrealized fair value of cash flow hedges - - - - (16,378) - (16,378) - (16,378)
Other comprehensive income of separate account - - - - 5,820 - 5,820 - 5,820
Remeasurements of defined benefit plans - - - - (153,293) - (153,293) (1,123) (154,416)
Total other comprehensive income (loss) - - - - (35,073) - (35,073) (606) (35,679)
Total comprehensive income - - - - (35,073) 2,081,110 2,046,037 117,895 2,163,932
Other changes in equityDividends - - - - - (370,168) (370,168) - (370,168)Dividends to hybrid bonds - - - - - (29,940) (29,940) - (29,940) Change in other capital adjustments - - - (277) - - (277) - (277)
Change in other retained earnings - - - - - 297 297 - 297
Redemption of subsidiary’s hybrid bonds and others - - - - - - - (1,104,074) (1,104,074)
- - - (277) - (399,811) (400,088) (1,104,074) (1,504,162)Balance at December 31, 2014 ₩ 2,645,053 537,443 9,887,335 (393,405) 637,894 15,869,779 29,184,099 1,330,809 30,514,908
(In millions of won)
See accompanying notes to the consolidated financial statements.

Financial Section 085Consolidated Financial Statements
Equity attributable to equity holders of Shinhan Financial Group Co., Ltd.
Non- controlling
interestsTotal
Capital stock
Hybrid bonds
Capital surplus
Capital adjust-ments
Accumu-lated other
compre-hensive income
Retained earnings
Sub-total
Balance at January 1, 2015 ₩ 2,645,053 537,443 9,887,335 (393,405) 637,894 15,869,779 29,184,099 1,330,809 30,514,908Total comprehensive income for the yearProfit for the year - - - - - 2,367,171 2,367,171 78,787 2,445,958Other comprehensive income (loss), net of income tax:
Foreign currency translation adjustments - - - - (5,630) - (5,630) (839) (6,469)
Net change in unrealized fair value of available-for-sale financial assets
- - - - (265,910) - (265,910) (80) (265,990)
Equity in other comprehen-sive income of associates - - - - 11,624 - 11,624 - 11,624
Net change in unrealized fair value of cash flow hedges - - - - 2,932 - 2,932 - 2,932
Other comprehensive income of separate account - - - - 3,092 - 3,092 - 3,092
Remeasurements of defined benefit plans - - - - (79,231) - (79,231) (2,582) (81,813)
Total other comprehensive income (loss) (333,123) - (333,123) (3,501) (336,624)
Total comprehensive income (333,123) 2,367,171 2,034,048 75,286 2,109,334
Other changes in equityDividends - - - - - (512,428) (512,428) - (512,428)Dividends to hybrid bonds - - - - - (34,488) (34,488) - (34,488) Change in other capital adjustments - 199,455 - - - - 199,455 - 199,455
Change in other retained earnings - - - (30,131) - (900) (31,031) - (31,031)
Redemption of subsidiary’s hybrid bonds and others - - - - - - - (436,114) (436,114)
- 199,455 - (30,131) - (547,816) (378,492) (436,114) (814,606)Balance at December 31, 2015 ₩ 2,645,053 736,898 9,887,335 (423,536) 304,771 17,689,134 30,839,655 969,981 31,809,636
(In millions of won)
See accompanying notes to the consolidated financial statements.

Shinhan Financial Group Annual Report 2015 086
Consolidated Statements of Cash FlowsFor the years ended December 31, 2015 and 2014
Notes 2015 2014Cash flows from operating activitiesProfit before income taxes ₩ 3,140,577 2,867,576Adjustments for:
Interest income 32 (11,129,704) (12,060,507)Interest expense 32 4,436,771 5,270,707Dividend income 34 (308,277) (175,798)Net fees and commission expense 168,313 166,204Net insurance loss 2,714,061 2,583,739Net trading loss 35 751,811 151,525Net foreign currency translation loss 163,417 31,356Net loss (gain) on financial instruments designated at fair value through profit or loss 36 (748,959) 117,137Net gain on disposal of available-for-sale financial assets 13 (772,474) (680,931)Provision for credit losses 37 1,021,711 944,429Impairment losses on other financial assets 37 242,342 229,951Employee costs 185,222 143,330Depreciation and amortization 38 278,882 312,966Other operating income (623,639) (213,139)Equity method income, net 16 (20,971) (30,580)Other non-operating income, net (18,463) (117,933)
(3,659,957) (3,327,544)
Changes in assets and liabilities:Due from banks (1,926,814) (4,542,186)Trading assets and liabilities 1,583,631 (4,711,789)Financial instruments designated at fair value through profit or loss 210,582 3,593,303Derivative instruments (382,276) (261,032)Loans (24,731,045) (16,978,229)Other assets (3,562,267) (2,012,074)Deposits 23,246,539 14,994,221Liabilities for defined benefit obligations 26 (347,926) (141,614)Provisions 27 (71,272) (128,531)Other liabilities 3,578,899 3,079,941
(2,401,949) (7,107,990)
Income taxes paid (640,393) (667,784)Interest received 10,921,869 11,732,050Interest paid (4,700,685) (5,789,333)Dividends received 310,852 212,381
Net cash provided by (used in) operating activities ₩ 2,970,314 (2,080,644)
(In millions of won)
See accompanying notes to the consolidated financial statements.

Financial Section 087Consolidated Financial Statements
Notes 2015 2014Cash flows from investing activities
Proceeds from disposal of available-for-sale financial assets ₩ 31,592,380 32,886,606Acquisition of available-for-sale financial assets (33,755,811) (30,227,793)Proceeds from redemption of held-to-maturity financial assets 2,414,031 2,667,782Acquisition of held-to-maturity financial assets (5,150,329) (4,959,391)Proceeds from disposal of property and equipment 14,41 8,760 32,377Acquisition of property and equipment 14 (124,844) (182,130)Proceeds from disposal of intangible assets 15,41 5,463 10,275Acquisition of intangible assets 15 (132,636) (62,984)Proceeds from disposal of investments in associates 35,396 77,592Acquisition of investments in associates (30,927) (61,289)Proceeds from disposal of investment property 17,41 16,171 676,496Acquisition of investment property 17 (10,296) (1,037)Proceeds from disposal of assets held for sale 88,235 232,365Net increase in other assets (22,173) (128,080) Proceeds from settlement of hedging derivative financial instruments for available-for-sale financial assets 5,000 -
Payment for settlement of hedging derivative financial instruments for available-for-sale financial assets (63,847) -
Business combination, net of cash used 45 (163,172) -Net cash provided by (used in) investing activities (5,288,599) 960,789
Cash flows from financing activitiesIssuance of hybrid bonds 199,455 -Net increase (decrease) in borrowings (1,557,883) 2,597,817Proceeds from debt securities issued 16,512,720 10,262,773Repayments of debt securities issued (12,867,244) (10,619,073)Net decrease in other liabilities (7,258) (28,842)Dividends paid (546,160) (399,791) Proceeds from settlement of hedging derivative financial instruments for debt securities issued 23,270 -
Payment for settlement of hedging derivative financial instruments for debt securities issued (17,342) (20,980)
Redemption of subsidiary’s hybrid bonds and others (426,808) (1,105,051)Net cash provided by financing activities 1,312,750 686,853
Effect of exchange rate fluctuations on cash and cash equivalents held 8,375 16,237Decrease in cash and cash equivalents (997,160) (416,765)Cash and cash equivalents at beginning of period 45 5,604,411 6,021,176Cash and cash equivalents at end of period 45 ₩ 4,607,251 5,604,411
(in millions of Korean Won)
See accompanying notes to the consolidated financial statements.

Shinhan Financial Group Annual Report 2015 088
Notes to the Consolidated Financial StatementsDecember 31, 2015 and 2014
1. Reporting entity Shinhan Financial Group Co., Ltd., the controlling company, and its subsidiaries included in consolidation (collectively the “Group”) are summarized as
follows:
(a) Controlling company Shinhan Financial Group Co., Ltd. (the “Shinhan Financial Group”) was incorporated on September 1, 2001. Shinhan Financial Group’s shares has been
listed on the Korea Exchange since September 10, 2001 and Shinhan Financial Group’s American Depository Shares were listed on the New York Stock Exchange since September 16, 2003.
(b) Ownership of Shinhan Financial Group and its major consolidated subsidiaries as of December 31, 2015 and 2014 are as follows:
Investor Investee (*1) Location Date of financial information
Ownership (%)2015 2014
Shinhan Financial Group Co., Ltd. Shinhan Bank Co., Ltd. Korea December 31 100.0 100.0
〃 Shinhan Card Co., Ltd. 〃 〃 100.0 100.0〃 Shinhan Investment Corp. 〃 〃 100.0 100.0〃 Shinhan Life Insurance Co., Ltd. 〃 〃 100.0 100.0〃 Shinhan Capital Co., Ltd. 〃 〃 100.0 100.0〃 Jeju Bank 〃 〃 68.9 68.9〃 Shinhan Credit Information Co., Ltd. 〃 〃 100.0 100.0〃 Shinhan Private Equity Inc. 〃 〃 100.0 100.0〃 Shinhan BNP Paribas Asset Management Co., Ltd. 〃 〃 65.0 65.0〃 SHC Management Co., Ltd. 〃 〃 100.0 100.0〃 Shinhan Data System 〃 〃 100.0 100.0〃 Shinhan Savings Bank 〃 〃 100.0 100.0〃 Shinhan AITAS Co., Ltd. 〃 〃 99.8 99.8
Shinhan Bank Co., Ltd. Shinhan Asia Limited Hong Kong 〃 99.9 99.9〃 Shinhan Bank America USA 〃 100.0 100.0〃 Shinhan Bank Europe GmbH Germany 〃 100.0 100.0〃 Shinhan Khmer Bank PLC (*2) Cambodia 〃 90.0 90.0〃 Shinhan Bank Kazakhstan Limited Kazakhstan 〃 100.0 100.0〃 Shinhan Bank Canada Canada 〃 100.0 100.0〃 Shinhan Bank (China) Limited China 〃 100.0 100.0〃 Shinhan Bank Japan Japan 〃 100.0 100.0〃 Shinhan Bank Vietnam Ltd. Vietnam 〃 100.0 100.0〃 Banco Shinhan de Mexico Mexico 〃 100.0 -〃 PT Bank Metro Express Indonesia 〃 97.76 -〃 PT Centratama Nasional Bank 〃 〃 75.0 -
Shinhan Card Co., Ltd. LLP MFO Shinhan Finance Kazakhstan 〃 100.0 100.0〃 PT. Shinhan Indo Finance Indonesia 〃 50.0 -
Shinhan Investment Corp. Shinhan Investment Corp. USA Inc. USA 〃 100.0 100.0〃 Shinhan Investment Corp. Asia Ltd. Hong Kong 〃 100.0 100.0〃 Nam An Securities Co., Ltd. Vietnam 〃 100.0 -
Shinhan Private Equity Inc. HKC&T Co., Ltd. Korea September 30 100.0 100.0Shinhan BNP Paribas Asset Management Co., Ltd.
Shinhan BNP Paribas Asset Management (Hong Kong) Limited Hong Kong December 31 100.0 100.0
(*1) Subsidiaries such as trust, beneficiary certificate, corporate restructuring fund and private equity fund which are not actually operating their own business are excluded. (*2) Shinhan Savings Bank’s interest of 3.3% in Shinhan Khmer Bank is not included.

Financial Section 089Notes to Financial Statements
(c) Consolidated structured entities Consolidated structured entities are as follows:
Category Consolidated structured entities
Description
Trust19 trusts managed by Shinhan Bank including development trust
A trust is consolidated when the Group as a trustee is exposed to variable returns, for example, if principle or interest amounts of the entrusted properties falls below guaran-teed amount, the Group should compensate it; and the Group has the ability to affect those returns.
Asset-Backed Securitization
MPC Yulchon Green I and 37 others
An entity for asset backed securitization is consolidated when the Group has the ability to dispose assets or change the conditions of the assets, is exposed to variable returns and has the ability to affect the variable returns providing credit enhancement and pur-chases of subordinated securities.
Structured Financing SHPE Holdings One Co., Ltd. and 3 others
An entity established for structured financing relating to real estate, shipping, or merg-ers and acquisitions is consolidated, when the Group has granted credit to the entity, has sole decision-making authority of these entities due to the entities default, and is exposed to, or has rights to related variable returns.
Investment FundKoFC Shinhan Frontier Champ 2010-4 PEF and 43 others
An investment fund is consolidated, when the Group manages or invests assets of the investment funds on behalf of other investors, or has the ability to dismiss the manager of the investment funds, and is exposed to, or has rights to, the variable returns.
(*) The Group provides credit enhancement for the consolidated structured entities providing ABCP purchase commitment amounting to ₩1,214,305 million for the purpose of credit enhancement of the structure entities.
2. Basis of preparation
(a) Statement of compliance The consolidated financial statements have been prepared in accordance with Korean International Financial Reporting Standards (“K-IFRS”), as pre-
scribed in The Act on External Audit of Stock Companies in the Republic of Korea.
The consolidated financial statements were authorized for issue by the Board of Directors on February 4, 2016, which will be submitted for approval to the coming shareholders’ meeting.
(b) Basis of measurement The consolidated financial statements have been prepared on the historical cost basis except for the following material items in the statement of finan-
cial position.
- derivative financial instruments are measured at fair value - financial instruments at fair value through profit or loss are measured at fair value - available-for-sale financial assets are measured at fair value - liabilities for cash-settled share-based payment arrangements are measured at fair value - financial liabilities designated as hedged items in a fair value hedge accounting of which changes in fair value attributable to the hedged risk are rec-
ognized in profit or loss - liabilities for defined benefit plans that are recognized at the net of the total present value of defined benefit obligations less the fair value of plan assets
(c) Functional and presentation currency The financial statements of the parent and each subsidiary are prepared in functional currency of the respective operation. These consolidated financial
statements are presented in Korean won, which is the Parent Company’s functional currency and the currency of the primary economic environment in which the Group operates.

Shinhan Financial Group Annual Report 2015 090
Notes to the Consolidated Financial StatementsDecember 31, 2015 and 2014
(d) Use of estimates and judgments The preparation of the consolidated financial statements in conformity with K-IFRS requires management to make judgments, estimates and assump-
tions that affect the application of accounting policies and the reported amounts of assets, liabilities, income and expenses. Actual results may differ from these estimates.
Estimates and underlying assumptions are evaluated on an ongoing basis. Revisions to accounting estimates are recognized in the period in which the estimates are revised and in any future years affected.
(e) Changes in accounting policies Except for the changes below, the Group has consistently applied the accounting policies set out in Note 3 to all periods presented in these consoli-
dated financial statements.
The Group has adopted the following amendments to standards and new interpretation with a date of initial application of January 1, 2015.
i) K-IFRS No. 1108, ‘Operating Segments’ The Group has applied the amendments to K-IFRS No. 1108, ‘Operating Segments’ since January 1, 2015. The amendment requires the disclosure of
judgements made by management in applying the aggregation criteria. The disclosures include a brief description of the operating segments that have been aggregated and the economic indicators that have been assessed in determining whether the operating segments share the similar economic characteristics. In addition, this amendment clarifies that a reconciliation of the total of the reportable segments’ assets to the entity’s total assets is required only when the information is regularly provided to the entity’s chief operating decision maker. The impact of the amendments on the Group’s consolidated financial statements is not significant.
ii) K-IFRS No. 1102, ‘Share-based Payment’ The Group has applied the amendments to K-IFRS No. 1102, ‘Share-based Payment’ since January 1, 2015. The amendment clarifies the definition of
‘vesting condition’ by separately defining ‘performance condition’ and ‘service condition’. The impact of the amendments on the Group’s consolidated financial statements is not significant.
iii) K-IFRS No. 1103, ‘Business Combinations’ The Group has applied the amendments to K-IFRS No. 1103, ‘Business Combinations’ since January 1, 2015. The amendment clarifies the classifica-
tion and measurement of contingent consideration in a business combination. When a contingent consideration is a financial instrument, its classifica-tion as a liability or equity shall be determined in accordance with K-IFRS No. 1032 and the contingent consideration that is classified as an asset or a liability shall be subsequently measured at fair value of which the changes recognised in profit or loss. In addition, this amendments clarifies that the standard does not apply to the accounting for all types of joint arrangements. The impact of the amendments on the Group’s consolidated financial statements is not significant.
iv) K-IFRS No. 1113, ‘Fair Value Measurement’ The Group has applied the amendments to K-IFRS No. 1113, ‘Fair Value Measurement’ since January 1, 2015. The amendment allows entities to
measure short-term receivables and payables that have no stated interest rate at their invoiced amounts without discounting, given the discount is immaterial. In addition, this amendment clarifies that the portfolio exception can be applies to contracts in the scope of K-IFRS No. 1039, even though the contracts do not meet the definition of a financial asset or financial liability. The impact of the amendments on the Group’s consolidated financial statements is not significant.
v) K-IFRS No. 1024, ‘Related Party Disclosures’ The Group has applied the amendments to K-IFRS No. 1024, ‘Related Party Disclosures’ since January 1, 2015. The definition of a ‘related party’ is
extended to include a management entity that provides key management personnel services to the reporting entity, either directly or through a group entity. The reporting entity is required to separately disclose the expense amount recognised for the key management personnel services. The impact of the amendments on the Group’s consolidated financial statements is not significant.
vi) K-IFRS No. 1019, ‘Employee Benefits’ The Group has applied the amendments to K-IFRS No. 1019, ‘Employee Benefits’ since January 1, 2015. The amendments introduce a practical expe-
dient to accounting for defined benefit plan, when employees or third parties pay contributions if certain criteria are met. A company is permitted (but not required) to recognize those contributions as a reduction of the service cost in the period in which the related service is rendered. Service-linked

Financial Section 091Notes to Financial Statements
contributions from employees or third parties should be reflected in determining the net current service cost and the defined benefit obligation, and should be attributed to the periods of service using the same method as used for calculating the gross benefits or on a straight line basis. The impact of the amendments on the Group’s consolidated financial statements is not significant.
3. Significant accounting policies The significant accounting policies applied by the Group in preparation of its consolidated financial statements are included below. The accounting policies
set out below have been applied consistently to all periods presented in these consolidated financial statements except for the changes in accounting policies as explained in Note 2 (e).
(a) Operating segments An operating segment is a component of the Group that engages in business activities from which it may earn revenues and incur expenses, including
revenues and expenses that relate to transactions with any of the Group’s other components. All operating segments’ operating results are reviewed regularly by the Group’s CEO to make decisions about resources to be allocated to the segment and assess its performance, and for which discrete financial information is available.
Segment results that are reported to the CEO include items directly attributable to a segment as well as those that can be allocated on a reasonable basis. The Group has reportable segments which consist of banking, credit card, securities, life insurance, and others.
(b) Basis of consolidation i) Subsidiaries Subsidiaries are entities controlled by the Group. The Group controls an entity when it is exposed to, or has rights to, variable returns from its involve-
ment with the entity and has the ability to affect those returns through its power over the entity. The financial statements of subsidiaries are included in the consolidated financial statements from the date on which control commences until the date on which control ceases.
If a member of the Group uses accounting policies other than those adopted in the consolidated financial statements for the same transactions and events in similar circumstances, appropriate adjustments are made to its financial statements in preparing the consolidated financial statements.
ii) Structured entity The Group establishes or invests in various structured entities. A structured entity is an entity designed so that its activities are not governed by way of
voting rights. When assessing control of a structured entity, the Group considers factors such as the purpose and the design of the investee; its practical ability to direct the relevant activities of the investee; the nature of its relationship with the investee; and the size of its exposure to the variability of re-turns of the investee. The Group does not recognize any non-controlling interests in the consolidated statements of financial position since the Group’s interests in these entities are recognized as liabilities of the Group.
iii) Intra-group transactions Intra-group balances and transactions, and any unrealized income and expenses arising from intra-group transactions, are eliminated in preparing the
consolidated financial statements. Intra-group losses are recognized as expense if intra-group losses indicate an impairment that requires recognition in the consolidated financial statements.
iv) Non-controlling interests Non-controlling interests in a subsidiary are accounted for separately from the parent’s ownership interests in a subsidiary. Each component of net profit
or loss and other comprehensive income is attributed to the owners of the parent and non-controlling interest holders, even when the allocation reduces the non-controlling interest balance below zero.
(c) Business combinations i) Business combinations A business combination is accounted for by applying the acquisition method, unless it is a combination involving entities or businesses under common
control.
Each identifiable asset and liability is measured at its acquisition-date fair value except for below:

Shinhan Financial Group Annual Report 2015 092
Notes to the Consolidated Financial StatementsDecember 31, 2015 and 2014
- Leases and insurance contracts are required to be classified on the basis of the contractual terms and other factors - Only those contingent liabilities assumed in a business combination that are a present obligation and can be measured reliably are recognized - Deferred tax assets or liabilities are recognized and measured in accordance with K-IFRS No.1012 Income Taxes - Employee benefit arrangements are recognized and measured in accordance with K-IFRS No.1019 Employee Benefits - Indemnification assets are recognized and measured on the same basis as the indemnified liability or asset - Reacquired rights are measured on the basis of the remaining contractual terms of the related contract - Liabilities or equity instruments related to share-based payment transactions are measured in accordance with the method in K-IFRS No.1102 Share-
based Payment - Assets held for sale are measured at fair value less costs to sell in accordance with K-IFRS No.1105 Non-current Assets Held for Sale
As of the acquisition date, non-controlling interests in the acquiree are measured as the non-controlling interests’ proportionate share of the acquiree’s identifiable net assets.
The consideration transferred in a business combination is measured at fair value, which is calculated as the sum of the acquisition-date fair values of the assets transferred by the acquirer, the liabilities incurred by the acquirer to former owners of the acquiree and the equity interests issued by the ac-quirer. However, any portion of the acquirer’s share-based payment awards exchanged for awards held by the acquiree’s employees that are included in consideration transferred in the business combination shall be measured in accordance with the method described above rather than at fair value.
Acquisition-related costs are costs the acquirer incurs to effect a business combination. Those costs include finder’s fees; advisory, legal, accounting, valuation and other professional or consulting fees; general administrative costs, including the costs of maintaining an internal acquisitions depart-ment; and costs of registering and issuing debt and equity securities. Acquisition-related costs, other than those associated with the issue of debt or equity securities, are expensed in the periods in which the costs are incurred and the services are received. The costs to issue debt or equity securities are recognized in accordance with K-IFRS No.1032 Financial Instruments: Presentation and K-IFRS No.1039 Financial Instruments: Recognition and Measurement.
ii) Goodwill The Group measures goodwill at the acquisition date as:
- the fair value of the consideration transferred; plus - the recognized amount of any non-controlling interests in the acquiree; plus - if the business combination is achieved in stages, the fair value of the pre-existing equity interest in the acquiree; less - the net recognized amount (generally fair value) of the identifiable assets acquired and liabilities assumed.
When the excess is negative, bargain purchase gain is recognized immediately in profit or loss.
When the Group additionally acquires non-controlling interest, the Group does not recognize goodwill since the transaction is regarded as equity trans-action.
(d) Investments in associates and joint ventures An associate is an entity in which the Group has significant influence, but not control, over the entity’s financial and operating policies. Significant influ-
ence is presumed to exist when the Group holds between 20 and 50 percent of the voting power of another entity or when another entity is classified as a subsidiary by the Banking Act since the Group holds more than 15% of the voting power of another entity.
A joint venture is a joint arrangement whereby the parties that have joint control of the arrangement have rights to the net assets of the arrangement.
Joint control is the contractually agreed sharing of control of an arrangement, which exists only when decisions about the relevant activities require the unanimous consent of the parties sharing control.
The investment in an associate and a joint venture is initially recognized at cost, and the carrying amount is increased or decreased to recognize the Group’s share of the profit or loss and changes in equity of the associate and the joint venture after the date of acquisition. Intra-group balances and transactions, and any unrealized income and expenses arising from intra-group transactions, are eliminated in preparing the consolidated financial statements. Intra-group losses are recognized as expense if intra-group losses indicate an impairment that requires recognition in the consolidated financial statements.
Financial Section 093Notes to Financial Statements
If an associate or a joint venture uses accounting policies different from those of the Group for like transactions and events in similar circumstances, appropriate adjustments are made to its financial statements in applying the equity method.
When the Group’s share of losses exceeds its interest in an equity accounted investee, the carrying amount of that interest, including any long-term investments, is reduced to nil and the recognition of further losses is discontinued except to the extent that the Group has an obligation or has to make payments on behalf of the investee for further losses.
(e) Cash and cash equivalents Cash and cash equivalents comprise cash balances and demand deposits with maturities of three months or less from the acquisition date that are
subject to an insignificant risk of changes in their fair value, and are used by the Group in the management of its short-term commitments.
(f) Non-derivative financial assets The Group recognizes and measures non-derivative financial assets by the following four categories: financial assets at fair value through profit or loss,
held-to-maturity investments, loans and receivables and available-for-sale financial assets. The Group recognizes financial assets in the consolidated statement of financial position when the Group becomes a party to the contractual provisions of the instrument.
Upon initial recognition, non-derivative financial assets are measured at their fair value plus, in the case of a financial asset not at fair value through profit or loss, transaction costs that are directly attributable to the asset’s acquisition or issuance.
i) Financial assets at fair value through profit or loss A financial asset is classified as at fair value through profit or loss if it is held for trading or is designated at fair value through profit or loss. Upon initial
recognition, transaction costs are recognized in profit or loss when incurred. Financial assets at fair value through profit or loss are measured at fair value, and changes therein are recognized in profit or loss.
A financial asset other than a financial asset held for trading may be designated as at FVTPL upon initial recognition if:
- such designation eliminates or significantly reduces a recognition or measurement inconsistency that would otherwise arise; or - the financial asset forms part of a group of financial assets or financial liabilities or both, which is managed and its performance is evaluated on a fair
value basis, in accordance with the Group’s documented risk management or investment strategy, and information about the grouping is provided internally on that basis; or
- it forms part of a contract containing one or more embedded derivatives that would be required to be separated from the host contract.
ii) Held-to-maturity financial assets A non-derivative financial asset with a fixed or determinable payment and fixed maturity, for which the Group has the positive intention and ability to
hold to maturity, are classified as held-to-maturity investments. Subsequent to initial recognition, held-to-maturity investments are measured at amor-tized cost using the effective interest method.
iii) Loans and receivables Loans and receivables are financial assets with fixed or determinable payments that are not quoted in an active market. Subsequent to initial recogni-
tion, loans and receivables are measured at amortized cost using the effective interest method.
iv) Available-for-sale financial assets Available-for-sale financial assets are those non-derivative financial assets that are designated as available-for-sale or are not classified as financial
assets at fair value through profit or loss, held-to-maturity investments or loans and receivables. Subsequent to initial recognition, they are measured at fair value, which changes in fair value, net of any tax effect, recorded in other comprehensive income in equity. Investments in equity instruments that do not have a quoted market price in an active market and whose fair value cannot be reliably measured and derivatives that are linked to and must be settled by delivery of such unquoted equity instruments are measured at cost.
v) De-recognition of financial assets The Group derecognizes a financial asset when the contractual rights to the cash flows from the asset expire, or it transfers the rights to receive the
contractual cash flows on the financial asset in a transaction in which substantially all the risks and rewards of ownership of the financial asset are transferred. Any interest in transferred financial assets that is created or retained by the Group is recognized as a separate asset or liability.

Shinhan Financial Group Annual Report 2015 094
Notes to the Consolidated Financial StatementsDecember 31, 2015 and 2014
If the Group retains substantially all the risks and rewards of ownership of the transferred financial assets, the Group continues to recognize the trans-ferred financial assets and recognizes financial liabilities for the consideration received.
vi) Offsetting between financial assets and financial liabilities Financial assets and financial liabilities are offset and the net amount is presented in the consolidated statement of financial position only when the
Group currently has a legally enforceable right to offset the recognized amounts, and there is the intention to settle on a net basis or to realize the asset and settle the liability simultaneously.
(g) Derivative financial instruments including hedge accounting Derivatives are initially recognized at fair value. Subsequent to initial recognition, derivatives are measured at fair value, and changes therein are ac-
counted for as described below.
i) Hedge accounting The Group holds forward exchange contracts, interest rate swaps, currency swaps and other derivative contracts to manage interest rate risk and for-
eign exchange risk. The Group designated derivatives as hedging instruments to hedge the risk of changes in the fair value of assets, liabilities or firm commitments (a fair value hedge) and foreign currency risk of highly probable forecasted transactions or firm commitments (a cash flow hedge).
On initial designation of the hedge, the Group formally documents the relationship between the hedging instrument(s) and hedged item(s), including the risk management objectives and strategy in undertaking the hedge transaction, together with the methods that will be used to assess the effectiveness of the hedging relationship.
• Fair value hedge – Changes in the fair value of a derivative hedging instrument designated as a fair value hedge are recognized in profit or loss. The gain or loss from remeasuring the hedging instrument at fair value for a derivative hedging instrument and the gain or loss on the hedged item attribut-able to the hedged risk are recognized in profit or loss in the same line item of the consolidated statement of comprehensive income. The Group dis-continues fair value hedge accounting if the hedging instrument expires or is sold, terminated or exercised, or if the hedge no longer meets the criteria for hedge accounting. Any adjustment arising from gain or loss on the hedged item attributable to the hedged risk is amortized to profit or loss from the date the hedge accounting is discontinued.
• Cash flow hedge – When a derivative is designated to hedge the variability in cash flows attributable to a particular risk associated with a recognized asset or liability or a highly probable forecasted transaction that could affect profit or loss, the effective portion of changes in the fair value of the deriva-tive is recognized in other comprehensive income, net of tax, and presented in the hedging reserve in equity. Any ineffective portion of changes in the fair value of the derivative is recognized immediately in profit or loss. If the hedging instrument no longer meets the criteria for hedge accounting, expires or is sold, terminated, exercised, or the designation is revoked, then hedge accounting is discontinued prospectively. The cumulative gain or loss on the hedging instrument that has been recognized in other comprehensive income is reclassified to profit or loss in the periods during which the forecasted transaction occurs. If the forecasted transaction is no longer expected to occur, then the balance in other comprehensive income is recognized im-mediately in profit or loss.
• Hedge of net investment – Foreign currency differences arising on the retranslation of a financial liability designated as a hedge of a net investment in a foreign operation are recognized in other comprehensive income to the extent that the hedge is effective. To the extent that the hedge is ineffective, such differences are recognized in profit or loss. When the hedged part of a net investment is disposed of, the relevant amount in the accumulated other comprehensive income is transferred to profit or loss as part of the profit or loss on disposal in accordance with K-IFRS No.1021, ‘The Effects of Changes in Foreign Exchange Rates’.
ii) Separable embedded derivatives Embedded derivatives are separated from the host contract and accounted for separately only if the following criteria has been met: (a) the economic
characteristics and risks of the embedded derivative are not closely related to those of the host contract; (b) a separate instrument with the same terms as the embedded derivative would meet the definition of a derivative; and (c) the hybrid instrument is not measured at fair value with changes in fair value recognized in profit or loss. Changes in the fair value of separable embedded derivatives are recognized immediately in profit or loss.
iii) Other derivative financial instruments Changes in the fair value of other derivative financial instrument not designated as a hedging instrument are recognized immediately in profit or loss.

Financial Section 095Notes to Financial Statements
vi) Unobservable valuation differences at initial recognition Any difference between the fair value of over the counter derivatives at initial recognition and the amount that would be determined at that date using a
valuation technique in a situation in which the valuation is dependent on unobservable parameters is not recognized in profit or loss but is recognized on a straight-line basis over the life of the instrument or immediately when the fair value becomes observable.
(h) Impairment of financial assets A financial asset not carried at fair value through profit or loss is assessed at each reporting date to determine whether there is objective evidence that
it is impaired. A financial asset is impaired if objective evidence indicates that a loss event has occurred after the initial recognition of the asset, and that the loss event had a negative effect on the estimated future cash flows of that asset that can be estimated reliably. However, losses expected as a result of future events, regardless of likelihood, are not recognized.
In addition, for an investment in an equity security, a significant or prolonged decline in its fair value below its cost is objective evidence of impairment.
If financial assets have objective evidence that they are impaired, impairment losses should be measured and recognized.
Objective evidence that a financial asset or group of assets is impaired includes observable data that comes to the attention of the holder of the asset about the following loss events:
- significant financial difficulty of the issuer or obligor - a b reach of contract, such as a default or delinquency in interest or principal payments; - the lender, for economic or legal reasons relating to the borrower’s financial difficulty, granting to the borrower a concession that the lender would not
otherwise consider - it becoming probable that the borrower will enter bankruptcy or other financial reorganization - the disappearance of an active market for that financial asset because of financial difficulties - observable data indicating that there is a measurable decrease in the estimated future cash flows from a group of financial assets since the initial
recognition of those assets, although the decrease cannot yet be identified with the individual financial assets in the group. i) Loans and receivables The Group first assesses whether objective evidence of impairment exists individually for loans and receivables that are individually significant, and
individually or collectively for financial assets that are not individually significant. If the Group determines that no objective evidence of impairment exists for an individually assessed financial asset, whether significant or not, it includes the asset in a group of financial assets with similar credit risk characteristics and collectively assesses them for impairment. Assets that are individually assessed for impairment and for which an impairment loss is or continues to be recognized are not included in a collective assessment of impairment.
If there is objective evidence that an impairment loss on loans and receivables has been incurred, the amount of the loss is measured as the difference between the asset’s carrying amount and the present value of estimated future cash flows (excluding future credit losses that have not been incurred) discounted at the financial asset’s original effective interest rate (i.e., the effective interest rate computed at initial recognition).
If the interest rate of a loan or receivable is a floating rate, the discount rate used to evaluate impairment loss is the current effective interest rate defined in the loan agreement. The present value of estimated future cash flows of secured financial assets is calculated by including cash flows from collateral after deducting costs to acquire and sell the collateral.
In assessing collective impairment, the Group rates and classifies financial assets, based on credit risk assessment or credit rating assessment process that takes into account asset type, industry, regional location, collateral type, delinquency and other relative factors.
Future cash flow of financial assets applicable to collective impairment assessment is estimated by using statistical modeling of historical trends of the probability of default, timing of recoveries and the amount of loss incurred, adjusted for management’s judgment as to whether current economic and credit conditions are such that the impairment losses are likely to be greater or less than suggested by historical modeling. In adjusting the future cash flow by historical modeling, the result has to be in line with changes and trends of observable data. Methodologies and assumptions used to estimate future cash flow are evaluated on a regular basis in order to reduce any discrepancy between impairment loss estimation and actual loss.

Shinhan Financial Group Annual Report 2015 096
Notes to the Consolidated Financial StatementsDecember 31, 2015 and 2014
Impairment losses are recognized in profit or loss and reflected in an allowance account against loans and receivables. When a subsequent event causes the amount of impairment loss to decrease, and the decrease can be related objectively to an event occurring after the impairment was recog-nized, the decrease in impairment loss is reversed through profit or loss of the year.
ii) Available-for-sale financial assets When a decline in the fair value of an available-for-sale financial asset has been recognized in other comprehensive income and there is objective evi-
dence that the asset is impaired, the cumulative loss that had been recognized in other comprehensive income is reclassified from equity to profit or loss as a reclassification adjustment even though the financial asset has not been derecognized. Impairment losses recognized in profit or loss for an investment in an equity instrument classified as available-for-sale are not reversed through profit or loss. If, in a subsequent period, the fair value of a debt instrument classified as available-for-sale increases and the increase can be objectively related to an event occurring after the impairment loss is recognized in profit or loss, the impairment loss is reversed, with the amount of the reversal recognized in profit or loss.
iii) Held-to-maturity financial assets An impairment loss in respect of held-to-maturity financial assets measured at amortized cost is calculated as the difference between its carrying
amount and the present value of the estimated future cash flows discounted at the asset’s original effective interest rate and is recognized in profit or loss. Interest on the impaired asset continues to be recognized through the unwinding of the discount. When a subsequent event causes the amount of impairment loss to decrease, the decrease in impairment loss is reversed through profit or loss.
(i) Property and equipment Property and equipment are initially measured at cost and after initial recognition, are carried at cost less accumulated depreciation and accumulated
impairment losses. The cost of property and equipment includes expenditures arising directly from the construction or acquisition of the asset, any costs directly attributable to bringing the asset to the location and condition necessary for it to be capable of operating in the manner intended by management and the initial estimate of the costs of dismantling and removing the item and restoring the site on which it is located.
Items of property and equipment are measured at cost less accumulated depreciation and accumulated impairment losses.
The cost of replacing a part of an item of property or equipment is recognized in the carrying amount of the item if it is probable that the future economic benefits embodied within the part will flow to the Group and its cost can be measured reliably. The carrying amount of the replaced cost is derecog-nized. The cost of the day to day servicing of property and equipment are recognized in profit or loss as incurred.
Property and equipment are depreciated on a straight-line basis over the estimated useful lives, which most closely reflect the expected pattern of consumption of the future economic benefits embodied in the asset. Leased assets under finance lease are depreciated over the shorter of the lease term and their useful lives.
The estimated useful lives for the current and comparative years are as follows:
Descriptions Depreciation method Useful livesBuildings Straight-line 40 yearsOther properties Straight-line 4~5 years
Depreciation methods, useful lives and residual value are reassessed at each fiscal year-end and any adjustment is accounted for as a change in ac-counting estimate.
(j) Intangible assets Intangible assets are measured initially at cost and, subsequently, are carried at cost less accumulated amortization and accumulated impairment
losses.
Amortization of intangible assets except for goodwill is calculated on a straight-line basis over the estimated useful lives of intangible assets from the date that they are available for use. The residual value of intangible assets is zero. However, as there are no foreseeable limits to the periods over which club memberships are expected to be available for use, this intangible asset is determined as having indefinite useful lives and not amortized.

Financial Section 097Notes to Financial Statements
Descriptions Useful livesSoftware, capitalized development cost 5 yearsOther intangible assets 5 years or contract periods
Amortization periods and the amortization methods for intangible assets with finite useful lives are reviewed at the end of each reporting period. The useful lives of intangible assets that are not being amortized are reviewed at the end of each reporting period to determine whether events and circum-stances continue to support indefinite useful life assessments for those assets. Changes are accounted for as changes in accounting estimates.
i) Research and development Expenditures on research activities, undertaken with the prospect of gaining new technical knowledge and understanding, are recognized in profit or
loss as incurred. Development expenditures are capitalized only if development costs can be measured reliably, the product or process is technically and commercially feasible, future economic benefits are probable, and the Group intends to and has sufficient resources to complete development and to use or sell the asset. Other development expenditures are recognized in profit or loss as incurred.
ii) Subsequent expenditures Subsequent expenditures are capitalized only when they increase the future economic benefits embodied in the specific asset to which it relates. All
other expenditures, including expenditures on internally generated goodwill and brands, are recognized in profit or loss as incurred.
(k) Investment property Property held for the purpose of earning rentals or benefiting from capital appreciation is classified as investment property. Investment property is
measured initially at its cost. Transaction costs are included in the initial measurement. Subsequently, investment property is carried at depreciated cost less any accumulated impairment losses.
The estimated useful lives for the current and comparative years are as follows:
Descriptions Depreciation method Useful livesBuildings Straight-line 40 years
(l) Leased assets
i) Classification of a lease The Group classifies and accounts for leases as either a finance or operating lease, depending on the terms. Leases where the lessee assumes sub-
stantially all of the risks and rewards of ownership are classified as finance leases. All other leases are classified as operating leases.
ii) Lessee Under a finance lease, the lessee recognizes the leased asset and a liability for future lease payments. Upon initial recognition the leased asset is meas-
ured at an amount equal to the lower of its fair value and the present value of the minimum lease payments. Subsequent to initial recognition, the asset is accounted for in accordance with the accounting policy applicable to that asset.
Under an operating lease, the lessee recognizes the lease payments as expense over the lease term and does not recognize the leased asset in its statement of financial position.
iii) Lessor Under a finance lease, the lessor recognizes a finance lease receivable. Over the lease term the lessor accrues interest income on the net investment.
The receipts under the lease are allocated between reducing the net investment and recognizing finance income, so as to produce a constant rate of return on the net investment.
Under an operating lease, the lessor recognizes the lease payments as income over the lease term and the leased asset in its statement of financial position.

Shinhan Financial Group Annual Report 2015 098
Notes to the Consolidated Financial StatementsDecember 31, 2015 and 2014
(m) Assets held for sale Non-current assets, or disposal groups comprising assets and liabilities, that are expected to be recovered primarily through sale rather than through
continuing use, are classified as held for sale. In order to be classified as held for sale, the asset (or disposal group) must be available for immediate sale in its present condition and its sale must be highly probable. The assets or disposal group that are classified as non-current assets held for sale are measured at the lower of their carrying amount and fair value less cost to sell.
The Group recognizes an impairment loss for any initial or subsequent write-down of an asset (or disposal group) to fair value less costs to sell, and a gain for any subsequent increase in fair value less costs to sell, up to the cumulative impairment loss previously recognized in accordance with K-IFRS No. 1036 Impairment of Assets.
An asset that is classified as held for sale or part of a disposal group classified as held for sale is not depreciated (or amortized). (n) Impairment of non-financial assets The carrying amounts of the Group’s non-financial assets, other than assets arising from employee benefits, deferred tax assets and assets held for
sale, are reviewed at the end of the reporting period to determine whether there is any indication of impairment. If any such indication exists, then the asset’s recoverable amount is estimated. Goodwill and intangible assets that have indefinite useful lives or that are not yet available for use, irrespective of whether there is any indication of impairment, are tested for impairment annually by comparing their recoverable amount to their carrying amount.
The Group estimates the recoverable amount of an individual asset. If it is impossible to measure the individual recoverable amount of an asset, then the Group estimates the recoverable amount of cash-generating unit (“CGU”). A CGU is the smallest identifiable group of assets that generates cash inflows that are largely independent of the cash inflows from other assets or groups of assets. The recoverable amount of an asset or CGU is the greater of its value in use and its fair value less costs to sell. The value in use is estimated by applying a pre-tax discount rate that reflect current market as-sessments of the time value of money and the risks specific to the asset or CGU for which estimated future cash flows have not been adjusted, to the estimated future cash flows expected to be generated by the asset or CGU.
An impairment loss is recognized if the carrying amount of an asset or a CGU exceeds its recoverable amount. Impairment losses are recognized in profit or loss.
Goodwill acquired in a business combination is allocated to each CGU that is expected to benefit from the synergies arising from the goodwill acquired. Any impairment identified at the CGU level will first reduce the carrying value of goodwill and then be used to reduce the carrying amount of the other assets in the CGU on a pro rata basis. Except for impairment losses in respect of goodwill which are never reversed, an impairment loss is reversed if there has been a change in the estimates used to determine the recoverable amount. An impairment loss is reversed only to the extent that the asset’s carrying amount does not exceed the carrying amount that would have been determined, net of depreciation or amortization, if no impairment loss had been recognized.
(o) Non-derivative financial liabilities The Group classifies non-derivative financial liabilities into financial liabilities at fair value through profit or loss or other financial liabilities in accordance
with the substance of the contractual arrangement and the definitions of financial liabilities. The Group recognizes financial liabilities in the consolidated statement of financial position when the Group becomes a party to the contractual provisions of the financial liability.
i) Financial liabilities at fair value through profit or loss Financial liabilities at fair value through profit or loss include financial liabilities held for trading or designated as such upon initial recognition. Subse-
quent to initial recognition, financial liabilities at fair value through profit or loss are measured at fair value, and changes therein are recognized in profit or loss. Upon initial recognition, transaction costs that are directly attributable to the acquisition are recognized in profit or loss as incurred.
The criteria for designation of financial liabilities at FVTPL upon initial recognition are the same as those of financial assets at FVTPL.
ii) Other financial liabilities Non-derivative financial liabilities other than financial liabilities at fair value through profit or loss are classified as other financial liabilities. At the date of
initial recognition, other financial liabilities are measured at fair value minus transaction costs that are directly attributable to the acquisition. Subsequent to initial recognition, other financial liabilities are measured at amortized cost using the effective interest method.

Financial Section 099Notes to Financial Statements
The Group derecognizes a financial liability from the consolidated statement of financial position when it is extinguished (i.e. when the obligation speci-fied in the contract is discharged, cancelled or expires).
(p) Foreign currency
i) Foreign currency transactions Transactions in foreign currencies are translated to the respective functional currencies of Group entities at exchange rates at the dates of the transac-
tions. Monetary assets and liabilities denominated in foreign currencies at the reporting date are retranslated to the functional currency at the exchange rate at that date. The foreign currency gain or loss on monetary items is the difference between amortized cost in the functional currency at the begin-ning of the period, adjusted for effective interest and payments during the period, and the amortized cost in foreign currency translated at the exchange rate at the end of the reporting period. Non-monetary assets and liabilities denominated in foreign currencies that are measured at fair value are retrans-lated to the functional currency at the exchange rate at the date that the fair value is determined.
Foreign currency differences arising on translation are recognized in profit or loss, except for differences arising on the translation of available-for-sale equity instruments, a financial liability designated as a hedge of the net investment in a foreign operation (see iii) below), or in a qualifying cash flow hedge, which are recognized in other comprehensive income. Non-monetary items that are measured in terms of historical cost in a foreign currency are translated using the exchange rate at the date of the transaction.
ii) Foreign operations If the presentation currency of the Group is different from a foreign operation’s functional currency, the financial statements of the foreign operation are
translated into the presentation currency using the following methods: The assets and liabilities of foreign operations, whose functional currency is not the currency of a hyperinflationary economy, are translated to presenta-
tion currency at exchange rates at the reporting date. The income and expenses of foreign operations are translated to functional currency at exchange rates at the dates of the transactions. Foreign currency differences are recognized in other comprehensive income.
Any goodwill arising on the acquisition of a foreign operation and any fair value adjustments to the carrying amounts of assets and liabilities arising on the acquisition of that foreign operation is treated as assets and liabilities of the foreign operation. Thus they are expressed in the functional currency of the foreign operation and translated at the closing rate.
When a foreign operation is disposed of, the relevant amount in the translation is transferred to profit or loss as part of the profit or loss on disposal. In any other partial disposal of a foreign operation, the relevant proportion is reclassified to profit or loss.
Foreign exchange gains or losses arising from a monetary item receivable from or payable to a foreign operation, the settlement of which is neither planned nor likely to occur in the foreseeable future and which in substance is considered to form part of the net investment in the foreign operation, are recognized in other comprehensive income in the translation reserve.
iii) Net investment in a foreign operation If the settlement of a monetary item receivable from or payable to a foreign operation is neither planned nor likely to occur in the foreseeable future,
then foreign currency difference arising on the item which in substance is considered to form part of the net investment in the foreign operation, are recognized in the other comprehensive income and shall be reclassified to profit or loss on disposal of the investment.
(q) Equity
i) Capital stock Ordinary shares are classified as equity. Incremental costs directly attributable to the issuance of ordinary shares and share options are recognized as
a deduction from equity, net of any tax effects.
Preference share capital is classified as equity if it is non-redeemable, or redeemable only at the Group’s option, and any dividends are discretionary. Dividends thereon are recognized as distributions within equity upon approval by the Group’s shareholders.
Preference share capital is classified as a liability if it is redeemable on a specific date or at the option of the shareholders, or if dividend payments are not discretionary. Dividends thereon are recognized as interest expense in profit or loss as accrued.

Shinhan Financial Group Annual Report 2015 100
Notes to the Consolidated Financial StatementsDecember 31, 2015 and 2014
ii) Hybrid bonds The Group classifies issued financial instruments, or their component parts, as a financial liability or an equity instrument depending on the substance of
the contractual arrangement of such financial instruments. Hybrid bonds where the Group has an unconditional right to avoid delivering cash or another financial asset to settle a contractual obligation are classified as equity instruments and presented in equity.
iii) Capital adjustments Changes in ownership interests in a subsidiary that do not result in a loss of control, such as the subsequent purchase or sale by a parent of a subsidi-
ary’s equity instruments, are accounted for as equity transactions in capital adjustments.
(r) Employee benefits
i) Short-term employee benefits Short-term employee benefits are employee benefits that are due to be settled within 12 months after the end of the period in which the employees
render the related service. When an employee has rendered service to the Group during an accounting period, the Group recognizes the undiscounted amount of short-term employee benefits expected to be paid in exchange for that service.
ii) Other long-term employee benefits Other long-term employee benefits include employee benefits that are settled beyond 12 months after the end of the period in which the employees
render the related service, and are calculated at the present value of the amount of future benefit that employees have earned in return for their service in the current and prior periods, less the fair value of any related assets. The present value is determined by discounting the expected future cash flows using the interest rate of corporate bonds that have maturity dates approximating the terms of the Group’s obligations and that are denominated in the same currency in which the benefits are expected to be paid. Any actuarial gains and losses are recognized in profit or loss in the period in which they arise.
iii) Retirement benefits: defined contribution plans When an employee has rendered service to the Group during a period, the Group recognizes the contribution payable to a defined contribution plan
in exchange for that service as a liability (accrued expense), after deducting any contribution already paid. If the contribution already paid exceeds the contribution due for service before the end of the reporting period, the Group recognizes that excess as an asset (prepaid expense) to the extent that the prepayment will lead to a reduction in future payments or a cash refund.
iv) Retirement benefits: defined benefit plans A defined benefit plan is a post-employment benefit plan other than a defined contribution plan. The Group’s net obligation in respect of defined benefit
plans is calculated by estimating the amount of future benefit that employees have earned in return for their service in the current and prior periods; that benefit is discounted to determine its present value. The fair value of plan assets is deducted. The calculation is performed annually by an independent actuary using the projected unit credit method.
Remeasurements of the net defined benefit liability, which comprise actuarial gains and losses, the return on plan assets (excluding interest) and the
effect of the asset ceiling (if any, excluding interest), are recognized immediately in other comprehensive income. The Group determines the net interest expense (income) on the net defined benefit liability (asset) for the period by applying the discount rate used to measure the defined benefit obligation at the beginning of the annual period to the then-net defined benefit liability (asset), taking into account any changes in the net defined benefit liability (asset) during the period as a result of contributions and benefit payments. Net interest expense and other expenses related to defined benefit plans are recognized in personnel expenses in profit or loss.
The discount rate is the yield at the reporting date on high-quality corporate bonds that have maturity dates approximating the terms of the Group’s obligations and that are denominated in the same currency in which the benefits are expected to be paid. The Group recognizes service cost and net interest on the net defined benefit liability (asset) in profit or loss and remeasurement of the net defined benefit liability (asset) in other comprehensive income.
When the benefits of a plan are changed or when a plan is curtailed, the resulting change in benefit that relates to past service or the gain or loss on
curtailment is recognized immediately in profit or loss. The Group recognizes gains and losses on the settlement of a defined benefit plan when the settlement occurs.

Financial Section 101Notes to Financial Statements
v) Termination benefits Termination benefits are recognized as an expense when the Group is committed demonstrably, without realistic possibility of withdrawal, to a formal
detailed plan to either terminate employment before the normal retirement date, or to provide termination benefits as a result of an offer made to encour-age voluntary redundancy. Termination benefits for voluntary redundancies are recognized as an expense if the Group has made an offer of voluntary redundancy, it is probable that the offer will be accepted, and the number of acceptances can be estimated reliably. If benefits are payable more than 12 months after the reporting period, then they are discounted to their present value.
(s) Share-based payment transactions The grant date fair value of share-based payment awards granted to employees is recognized as an employee expense, with a corresponding increase
in equity, over the period that the employees unconditionally become entitled to the awards. The amount recognized as an expense is adjusted to reflect the number of awards for which the related service and non-market vesting conditions are expected to be met, such that the amount ultimately recognized as an expense is based on the number of awards that do meet the related service and non-market performance conditions at the vesting date. For share-based payment awards with non-vesting conditions, the grant date fair value of the share-based payment is measured to reflect such conditions and there is no true-up for differences between expected and actual outcomes.
The fair value of the amount payable to employees in respect of share appreciation rights, which are settled in cash, is recognized as an expense with a corresponding increase in liabilities, over the period that the employees unconditionally become entitled to payment. The liability is remeasured at each reporting date and at settlement date. Any changes in the fair value of the liability are recognized as personnel expense in profit or loss.
(t) Provisions A provision is recognized if, as a result of a past event, the Group has a present legal or constructive obligation that can be estimated reliably, and it is
probable that an outflow of economic benefits will be required to settle the obligation.
The risks and uncertainties that inevitably surround many events and circumstances are taken into account in reaching the best estimate of a provision. Where the effect of the time value of money is material, provisions are determined at the present value of the expected future cash flows.
Provisions are reviewed at the end of each reporting period and adjusted to reflect the current best estimate. If it is no longer probable that an outflow of resources embodying economic benefits will be required to settle the obligation, the provision is reversed.
Provision shall be used only for expenditures for which the provision was originally recognized.
(u) Financial guarantee contract A financial guarantee contract is a contract that requires the issuer (the Group) to make specified payments to reimburse the holder for a loss it incurs
because a specified debtor fails to make payments when due in accordance with the original or modified terms of a debt instrument.
Financial guarantee contracts are initially measured at their fair values and, if not designated as at fair value through profit or loss, are subsequently measured at the higher of:
- The amount determined in accordance with K-IFRS No.1037 Provisions, Contingent Liabilities and Contingent Assets and - The initial amount recognized, less, when appropriate, cumulative amortization recognized in accordance with K-IFRS No.1018. Revenue
(v) Insurance contracts Insurance contracts are defined as “a contract under which one party (the insurer) accepts significant insurance risk from another party by agreeing to
compensate the policyholder if a specified uncertain future event adversely affects the policyholder”. A contract that qualifies as an insurance contract remains an insurance contract until all rights and obligations are extinguished or expire. Such a contract that does not contain significant insurance risk is classified as an investment contract and is within the scope of K-IFRS No.1039, Financial Instruments, Recognition and Measurement to the extent that it gives rise to a financial asset or financial liability, except if the investment contract contains a Discretionary Participation Features (“DPF”). If the contract has a DPF, the contract is subject to K-IFRS No.1104, Insurance Contracts.
i) Reserves for insurance contracts The Group accounts for insurance contracts based on the Insurance Business Law and other related Insurance Supervisory Regulation. These insur-
ance contracts are calculated based on insurance terms, premium and policy reserves approved by the Financial Supervisory Commission, as follows:

Shinhan Financial Group Annual Report 2015 102
Notes to the Consolidated Financial StatementsDecember 31, 2015 and 2014
• Premium reserve - Premium reserve is a liability to prepare for the future claims on the valid contracts. Premium reserve is calculated by deducting discounted net premium from the discounted claims expected to be paid in the future period.
• Unearned premium reserve - Unearned premium reserve represents the portion of premiums written which is applicable to the unexpired portion of policies in force.
• Guarantee reserve - At the end of reporting period, the Group is required to make reserve on the outstanding insurance contracts to guarantee a certain level of benefit payments for the amount equal to the average amount of net losses of the worst 30% of cases forecasted by scenarios or the standard reserve amount, as defined by Financial Supervisory Service, by insurance type and the lowest insured amount, whichever is greater.
• Reserve for outstanding claims - Reserve for outstanding claims is an estimate of loss for insured events that have occurred prior to the date of the statement of financial position but for which a fixed value cannot be determined, which includes the following:
- Estimated amount: The expenses to be incurred in the course of settlement of the insured event, such as lawsuit or arbitration (if partial amount is settled, the remainder is recognized)
- Reserve for ineffective contracts: Reserve for ineffective contracts due to default in premium payment (Partial amount of surrender value) - Unpaid claims: The amount of claims, surrender value and dividend to be paid is determined but not paid yet - IBNR (Incurred But Not Reported): Estimated amount using a statistical method considering the company’s experience rate
• Reserve for participating policyholder’s dividend - In accordance with regulations and policy terms, reserves for participating policyholder’s dividend are provided for dividend to be paid to the policyholders and comprise the current reserve for policyholder’s dividend and the future reserve for policy-holder’s dividend. The current reserve for policyholder’s dividend is the fixed payable dividend amount declared but not paid at the end of the reporting period and the future reserve for policyholder’s dividend is the calculated policyholder’s dividend amount factoring in estimated policy termination rates for the valid insurance policy as at the end of the reporting period.
ii) Policyholders’ equity adjustment At year end, unrealized holding gains and losses on available-for-sale securities are allocated to policyholders’ equity adjustment by the ratio of the
average policy reserve of the participating and non-participating contracts or the ratio of the investment source at the new acquisition year based on the date of acquisition.
iii) Liability adequacy test (the “LAT”) Liability adequacy tests are performed by the Group in order to ensure the adequacy of the contract liabilities, net of related deferred acquisition costs
and deferred policyholders’ participation liability or asset.
iv) Reinsurance contracts According to K-IFRS 1104, “Insurance Contracts”, the Group does not offset:
1) reinsurance assets against the related insurance liabilities; or 2) income or expense from reinsurance contracts against the expense or income from the related insurance contracts.
If reinsurance assets are determined to be impaired, impairment loss is recognized in the profit and loss for the current period.
v) Deferred acquisition costs (the “DAC”) Policy acquisition costs, which include commissions, certain direct and incremental underwriting and agency expenses associated with acquiring insur-
ance policies, are deferred and amortized using the straight-line method over the contract year, up to seven years. Actual acquisition costs incurred in excess of estimated acquisition costs are expensed.
(w) Financial income and expense
i) Interest Interest income and expense are recognized in profit or loss using the effective interest method. The effective interest rate is the rate that exactly dis-
counts the estimated future cash payments and receipts through the expected life of the financial asset or liability (or, where appropriate, a shorter year)

Financial Section 103Notes to Financial Statements
to the carrying amount of the financial asset or liability. When calculating the effective interest rate, the Group estimates future cash flows considering all contractual terms of the financial instrument, but not future credit losses.
The calculation of the effective interest rate includes all fees and points paid or received that are an integral part of the effective interest rate. Transaction costs include incremental costs that are directly attributable to the acquisition or issue of a financial asset or liability.
Once an impairment loss has been recognized on a loan, although the accrual of interest in accordance with the contractual terms of the instrument is discontinued, interest income is recognized at the rate of interest that was used to discount estimated future cash flows for the purpose of measuring the impairment loss.
ii) Fees and commission Fees and commission income and expense that are integral to the effective interest rate on a financial asset or liability are included in the measurement
of the effective interest rate.
Fees and commission income, including account servicing fees, investment management fees, sales commission, placement fees and syndication fees, are recognized as the related services are performed. When a loan commitment is not expected to result in the draw-down of a loan, the related loan commitment fees are recognized on a straight-line basis over the commitment period.
Fees and commission expense relate mainly to transaction and service fees, which are expensed as the services are received.
iii) Dividends Dividend income is recognized when the right to receive income is established.
(x) Customer loyalty program For customer loyalty programmes, the fair value of the consideration received or receivable in respect of the initial sale is allocated between award
credits (“points”) and other components of the fee and commission income. The Group provides awards, in the form of price discounts and by offering a variety of gifts. The fair value allocated to the points is estimated by reference to the fair value of the monetary and/or non-monetary benefits for which they could be redeemed. The fair value of the benefits is estimated taking into account the expected redemption rate and the timing of such expected redemptions. Such amount is deferred and recognized as unearned revenue. Unearned revenue is recognized only when the points are redeemed and the Group has fulfilled its obligations to provide the benefits. The amount of revenue recognized in those circumstances is based on the number of points that have been redeemed in exchange for benefits, relative to the total number of points that are expected to be redeemed.
A provision for onerous contracts is recognized when the expected benefits to be derived by the Group from customer loyalty programmes are lower than the unavoidable cost of meeting its obligations under the programmes.
(y) Income tax Income tax expense comprises current and deferred tax. Current tax and deferred tax are recognized in profit or loss except to the extent that it relates
to a business combination, or items recognized directly in equity or in other comprehensive income.
i) Current tax Current tax is the expected tax payable or receivable on the taxable profit or loss for the year, using tax rates enacted or substantively enacted at the
end of the reporting period and any adjustment to tax payable in respect of previous years. The taxable profit is different from the accounting profit for the period since the taxable profit is calculated excluding the temporary differences, which will be taxable or deductible in determining taxable profit (tax loss) of future periods, and non-taxable or non-deductible items from the accounting profit.
ii) Deferred tax Deferred tax is recognized, using the asset-liability method, in respect of temporary differences between the carrying amounts of assets and liabilities
for financial reporting purposes and the amounts used for taxation purposes. A deferred tax liability is recognized for all taxable temporary differences. A deferred tax asset is recognized for all deductible temporary differences to the extent that it is probable that taxable profit will be available against which they can be utilized. However, deferred tax is not recognized for the following temporary differences: taxable temporary differences arising on the initial recognition of goodwill, or the initial recognition of assets or liabilities in a transaction that is not a business combination and that affects neither accounting profit or loss nor taxable income.

Shinhan Financial Group Annual Report 2015 104
Notes to the Consolidated Financial StatementsDecember 31, 2015 and 2014
The Group files its national income tax return with the Korean tax authorities under the consolidated corporate tax system, which allows it to make na-tional income tax payments based on the combined profits or losses of the Controlling Company and its wholly owned domestic subsidiaries. Deferred taxes are measured based on the future tax benefits expected to be realized in consideration of the expected combined profits or losses of eligible companies in accordance with the consolidated corporate tax system. Consolidated corporate tax amounts, once determined, are allocated to each of the subsidiaries and are used as a basis for the income taxes to be recorded in their separate financial statements.
The Group recognizes a deferred tax liability for all taxable temporary differences associated with investments in subsidiaries, associates, and interests in joint ventures, except to the extent that the Group is able to control the timing of the reversal of the temporary difference and it is probable that the temporary difference will not reverse in the foreseeable future. The Group recognizes a deferred tax asset for all deductible temporary differences arising from investments in subsidiaries and associates, to the extent that it is probable that the temporary difference will reverse in the foreseeable future and taxable profit will be available against which the temporary difference can be utilized.
The carrying amount of a deferred tax asset is reviewed at the end of each reporting period and reduces the carrying amount to the extent that it is no longer probable that sufficient taxable profit will be available to allow the benefit of part or all of that deferred tax asset to be utilized.
Deferred tax assets and liabilities are measured at the tax rates that are expected to apply to the period when the asset is realized or the liability is set-tled, based on tax rates (and tax laws) that have been enacted or substantively enacted by the end of the reporting period. The measurement of deferred tax liabilities and deferred tax assets reflects the tax consequences that would follow from the manner in which the Group expects, at the end of the reporting period to recover or settle the carrying amount of its assets and liabilities.
Deferred tax assets and liabilities are offset only if the Group has a legally enforceable right to set off current tax assets against current tax liabilities, and the deferred tax assets and the deferred tax liabilities relate to income taxes levied by the same taxation authority on either: the same taxable entity; or different taxable entities which intend either to settle current tax liabilities and assets on a net basis, or to realise the assets and settle the liabilities simultaneously, in each future period in which significant amounts of deferred tax liabilities or assets are expected to be settled or recovered.
(z) Accounting for trust accounts The Group accounts for trust accounts separately from its group accounts under the Financial Investment Services and Capital Markets Act and thus
the trust accounts are not included in the consolidated financial statements except Guaranteed Fixed Rate Money Trusts controlled by the Group, based on an evaluation of the substance of its relationship with the Group and the SPE’s risks and rewards. Funds transferred between Group account and trust accounts are recognized as borrowings from trust accounts in other liabilities with fees for managing the accounts recognized as non-interest income by the Group.
(aa) Earnings per share The Group presents basic and diluted earnings per share (EPS) data for its ordinary shares. Basic EPS is calculated by dividing the profit or loss attribut-
able to ordinary shareholders of the Group by the weighted average number of ordinary shares outstanding during the period, adjusted for own shares held. Diluted EPS is determined by adjusting the profit or loss attributable to ordinary shareholders and the weighted average number of ordinary shares outstanding, adjusted for own shares held, for the effects of all dilutive potential ordinary shares, which comprise convertible notes and share options granted to employees.
(ab) New standards and interpretations not yet adopted The following new standards, interpretations and amendments to existing standards have been published and are mandatory for the Group for annual
periods beginning after January 1, 2015, and the Group has not early adopted them.
Management is in the process of evaluating the impact of the amendments on the Group’s consolidated financial statements, if any.
i) K-IFRS No. 1109, ‘Financial Instruments’ K-IFRS 1109, published in December 2015, replaces the existing guidance in K-IFRS No. 1039, Financial Instruments: Recognition and Measure-
ment. K-IFRS 1109 includes revised guidance on the classification and measurement of financial instruments, a new expected credit loss model for calculating impairment on financial assets, and new general hedge accounting requirements. It also carries forward the guidance on recognition and derecognition of financial instruments from K-IFRS No. 1039. K-IFRS 1109 is effective for annual periods beginning on or after January 1, 2018, with early adoption permitted.

Financial Section 105Notes to Financial Statements
ii) K-IFRS No. 1115, ‘Revenue from Contracts with Customers’ K-IFRS 1115, published in January 2016, establishes a comprehensive framework for determining whether, how much and when revenue is recognized.
It replaces existing revenue recognition guidance, including K-IFRS No. 1018, Revenue, K-IFRS No. 1011, Construction Contracts and K-IFRS No. 2113, Customer Loyalty Programmes. K-IFRS 1115 is effective for annual reporting periods beginning on or after January 1, 2018, with early adoption permitted.
Other published new standards, interpretations and amendments to existing standards mandatory for the Group for annual periods beginning after January 1, 2015 which have not been early adopted, are not expected to have a significant impact on the Group’s consolidated financial statements.
4. Financial risk management (a) Overview As a financial services provider, the Group is exposed to various risks relating to lending, credit card, insurance, securities investment, trading and leas-
ing businesses, its deposit taking and borrowing activities in addition to the operating environment.
The principal risks to which the Group is exp osed are credit risk, market risk, interest rate risk, liquidity risk and operational risk. These risks are recognized, measured and reported in accordance with risk management guidelines established at the controlling company level and implemented at the subsidiary level through a carefully stratified checks-and-balances system.
i) Risk management principles The Group risk management is guided by the following core principles:
- identifying and managing all inherent risks; - standardizing risk management process and methodology; - ensuring supervision and control of risk management independent of business activities; - continuously assessing risk preference; - preventing risk concentration; - operating a precise and comprehensive risk management system including statistical models; and - balancing profitability and risk management through risk-adjusted profit management.
ii) Risk management organization The Group risk management system is organized along the following hierarchy: from the top and at the controlling company level, the Group Risk Man-
agement Committee, the Group Risk Management Council, the Chief Risk Officer and the Group Risk Management Team, and at the subsidiary level, the Risk Management Committees and the Risk Management Team of the relevant subsidiary. The Group Risk Management Committee, which is under the supervision of the controlling company’s board of directors, sets the basic group wide risk management policies and strategies. The controlling company’s Chief Risk Officer reports to the Group Risk Management Committee, and the Group Risk Management Council, whose members consist of the controlling company’s Chief Risk Officer and the risk management team heads of each of subsidiaries, coordinates the risk management policies and strategies at the group level as well as at the subsidiary level among each of subsidiaries. Each of subsidiaries also has a separate Risk Manage-ment Committee, Risk Management Working Committee and Risk Management Team, whose tasks are to implement the group wide risk management policies and strategies at the subsidiary level as well as to set risk management policies and strategies specific to such subsidiary in line with the group wide guidelines. The Group also has the Group Risk Management Team, which supports the controlling company’s Chief Risk Officer in his or her risk management and supervisory role.
In order to maintain the group wide risk at an appropriate level, the Group use a hierarchical risk limit system under which the Group Risk Management
Committee assigns reasonable risk limits for the entire group and each subsidiary, and the Risk Management Committee and the Management Council of each subsidiary manage the subsidiary-specific risks by establishing and managing risk limits in more detail by type of risk and type of product for each department and division within such subsidiary.
The Group Risk Management Committee consists of directors of the controlling company. The Group Risk Management Committee convenes at least once every quarter and may also convene on an ad hoc basis as needed. Specifically, the Group Risk Management Committee does the following: (i) establish the overall risk management policies consistent with management strategies, (ii) set reasonable risk limits for the entire group and each of

Shinhan Financial Group Annual Report 2015 106
Notes to the Consolidated Financial StatementsDecember 31, 2015 and 2014
subsidiaries, (iii) approve appropriate investment limits or allowed loss limits, (iv) enact and amends risk management regulations, and (v) decide other risk management-related issues the Board of Directors or the Group Risk Management Committee sees fit to discuss. The results of the Group Risk Management Committee meetings are reported to the Board of Directors of the controlling company. The Group Risk Management Committee makes decisions through affirmative votes by a majority of the committee members.
The Group Risk Management Council is comprised of the controlling company’s chief risk officer, head of risk management team, and risk officers from each subsidiary. The Group Risk Management Council holds meetings for risk management executives from each subsidiary to discuss the Group’s group wide risk management guidelines and strategy in order to maintain consistency in the group wide risk policies and strategies.
iii) Risk management framework The Group takes the following steps to implement the foregoing risk management principles:
• Risk capital management – Risk capital refers to capital necessary to compensate for losses in case of a potential risk being realized, and risk capital management refers to the process of asset management based on considerations of risk exposure and risk appetite among total assets so that the Group can maintain an appropriate level of risk capital. As part of the Group’s risk capital management, the Group has adopted and maintains various risk planning processes and reflect such risk planning in the Group’s business and financial planning. The Group also has adopted and maintains a risk limit management system to ensure that risks in the Group’s business do not exceed prescribed limits.
• Risk monitoring – The Group proactively, preemptively and periodically review risks that may impact our overall operations, including through a multidimensional risk monitoring system. Currently, each of subsidiaries is required to report to the controlling company any factors that could have a material impact on the group-wide risk management, and the controlling company reports to the Group’s chief risk officer and other members of the Group’s senior management the results of risk monitoring on a weekly, monthly and on an ad hoc basis as needed. In addition, the Group perform preemptive risk management through a “risk dashboard system” under which the Group closely monitor any increase in asset size, risk levels and sensitivity to external factors with respect to the major asset portfolios of each of subsidiaries, and to the extent such monitoring yields any warning signals, the Group promptly analyze the causes and, if necessary, formulate and implement actions in response to these warning signals.
• Risk review – Prior to entering any new business, offering any new products or changing any major policies, the Group reviews relevant risk factors based on a prescribed risk management checklist and, in the case of changes for which assessment of risk factors is difficult, supports reasonable decision-making in order to avoid taking any unduly risky action. The risk management departments of all subsidiaries are required to review all new businesses, products and services prior to their launch and closely monitor the development of any related risks following their launch, and in the case of any action that involves more than one subsidiary, the relevant risk management departments are required to consult with the risk management team at the controlling company level prior to making any independent risk reviews.
• Risk management – The Group maintain a group wide risk management system to detect the signals of any risk crisis and, in the event of a crisis ac-tually happening, to respond on a timely, efficient and flexible basis so as to ensure the Group’s survival as a going concern. Each subsidiary maintains crisis planning for three levels of contingencies, namely, “alert”, “imminent crisis” and “crisis”, determination of which is made based on quantitative and qualitative monitoring and consequence analysis, and upon the happening of any such contingency, is required to respond according to a prescribed contingency plan. At the controlling company level, the Group maintains and installs crisis detection and response system which is applied consistently group wide, and upon the happening of any contingency at two or more subsidiary level, the Group directly takes charge of the situation so that the Group manages it on a concerted group wide basis.
(b) Credit risk
i) Credit risk management Credit risk is the risk of financial loss to the Group if a customer or counterparty to a financial instrument fails to meet its contractual obligations, and
arises principally from the Group’s receivables from customers and investment securities. The Group’s credit risk management encompasses all areas of credit that may result in potential economic loss, including not just transactions that are recorded on balance sheets, but also off-balance-sheet transactions such as guarantees, loan commitments and derivatives transactions.
• Credit Risk Management of Shinhan Bank Major policies for Shinhan Bank’s credit risk management, including Shinhan Bank’s overall credit risk management plan and credit policy guidelines,
are determined by the Risk Policy Committee of Shinhan Bank, the executive decision-making body for management of credit risk. The Risk Policy Committee is headed by the Chief Risk Officer, and also comprises of the Chief Credit Officer, the heads of each business unit and the head of the

Financial Section 107Notes to Financial Statements
Risk Management Department. In order to separate the loan approval functions from credit policy decision-making, Shinhan Bank has a Credit Review Committee that performs credit review evaluations, which focus on improving the asset quality and profitability from the loans being made, and oper-ates separately from the Risk Policy Committee.
Shinhan Bank complies with credit risk management procedures pursuant to internal guidelines and regulations and continually monitors and improves these guidelines and regulations. Its credit risk management procedures include:
- credit evaluation and approval; - credit review and monitoring; and - credit risk assessment and control
Each of Shinhan Bank’s borrowers is assigned a credit rating, which is based on a comprehensive internal credit evaluation system that considers a variety of criteria. For retail borrowers, the credit rating takes into account the borrower’s past dealings with Shinhan Bank and external credit rating information, among others. For corporate borrowers, the credit rating takes into account financial indicators as well as non-financial indicators such as industry risk, operational risk and management risk, among others. The credit rating, once assigned, serves as the fundamental instrument in Shinhan Bank’s credit risk management, and is applied in a wide range of credit risk management processes, including credit approval, credit limit management, loan pricing and computation of allowance for loan losses. Shinhan Bank has separate credit evaluation systems for retail customers, SOHO customers and corporate customers, which are further segmented and refined to meet Basel Ⅲ requirements.
Loans are generally approved after evaluations and approvals by the manager at the branch level as well as the committee of the applicable business
unit at Shinhan Bank. The approval limit for retail loans is made based on Shinhan Bank’s automated credit scoring system. In the case of large corpo-rate loans, approval limits are also reviewed and approved by a Credit Officer at the headquarter level. Depending on the size and the importance of the loan, the approval process is further reviewed by the Credit Officer Committee or the Master Credit Officer Committee. If the loan is considered, further evaluation is made by the Credit Review Committee, which is Shinhan Bank’s highest decision-making body in relation to credit approval.
Pursuant to the foregoing credit review and monitoring procedures and in order to promptly prevent deterioration of loan qualities, Shinhan Bank clas-sifies potentially problematic borrowers into (i) borrowers that show early warning signals, (ii) borrowers that require close monitoring and (iii) normal borrowers, and treats them differentially accordingly.
In order to maintain portfolio-level credit risk at an appropriate level, Shinhan Bank manages its loans using value-at-risk (“VaR”) limits for the entire bank as well as for each of its business units. In order to prevent concentration of risk in a particular borrower or borrower class, Shinhan Bank also manages credit risk by borrower, industry, country and other detailed categories.
•Credit Risk Management of Shinhan Card Major policies for Shinhan Card’s credit risk management are determined by Shinhan Card’s Risk Management Council and Shinhan Card’s Risk Man-
agement Committee is responsible for approving them. Shinhan Card’s Risk Management Council is headed by the Chief Risk Officer, and also com-prises of the heads of each business unit, supporting unit and relevant department at Shinhan Card. In order to separate credit policy decision-making from credit evaluation functions, Shinhan Card also has a Risk Management Committee, which evaluates applications for corporate loans exceeding a certain amount and other loans deemed important. Shinhan Card uses an automated credit scoring system to approve credit card applications or credit card authorizations. The credit scoring system is divided into two sub-systems: the application scoring system and the behavior scoring system. The behavior scoring system is based largely on the credit history, and the application scoring system is based largely on personal information of the applicant. For credit card applicants with whom the Group has an existing relationship, Shinhan Card’s credit scoring system considers internally gath-ered information such as repayment ability, total assets, the length of the existing relationship and the applicant’s contribution to profitability. The credit scoring system also automatically conducts credit checks on all credit card applicants.
If a credit score awarded to an applicant is above a minimum threshold, the application is approved unless overridden based on other considerations such as delinquencies with other credit card companies.
Shinhan Card continually monitors all accountholders and accounts using a behavior scoring system. The behavior scoring system predicts a card-holder’s payment pattern by evaluating the cardholder’s credit history, card usage and amounts, payment status and other relevant data. The behavior score is recalculated each month and is used to manage the accounts and approval of additional loans and other products to the cardholder. Shinhan Card also uses the scoring system to monitor its overall risk exposure and to modify its credit risk management strategy.

Shinhan Financial Group Annual Report 2015 108
Notes to the Consolidated Financial StatementsDecember 31, 2015 and 2014 (In millions of won)
ii) Maximum exposure to credit risk The Group’s maximum exposure to credit risk without taking account of any collateral held or other credit enhancements as of December 31, 2015 and
2014 are as follows:
2015 2014 Due from banks and loans (*1)(*3):
Banks ₩ 14,486,162 13,663,318Retail 107,030,770 94,282,270Government 16,701,241 12,195,758Corporations 110,468,717 102,160,212Card receivable 17,821,341 17,378,179
266,508,231 239,679,737Trading assets 19,595,405 21,500,955Financial assets designated at FVTPL (*4) 2,329,018 1,946,200AFS financial assets (*5) 29,037,640 26,855,662HTM financial assets (*6) 16,192,060 13,373,384Derivative assets 1,994,714 1,568,307Other financial assets (*1)(*2) 11,878,420 10,151,338Financial guarantee contracts 3,679,486 3,090,873Loan commitments and other credit liabilities 76,965,151 74,295,365
₩ 428,180,125 392,461,821
(*1) The maximum exposure amounts for due from banks, loans and other financial assets are measured as net of allowances. (*2) Comprise account receivables, accrued income, guarantee deposits, domestic exchange settlement debit and suspense payments, etc. (*3) Due from banks and loans were classified as similar credit risk group when calculating the BIS ratio under new Basel Capital Accord (Basel Ⅲ). (*4) FVTPL : fair value through profit or loss (*5) AFS : available-for-sale (*6) HTM : held-to-maturity
iii) Due from banks and loans by past due or impairment - Due from banks and loans as of December 31, 2015 and 2014 are as follows:
2015Banks Retail Government Corporations Card Total
Neither past due nor impaired ₩ 14,511,673 106,691,153 16,704,356 110,388,809 17,677,433 265,973,424Past due but not impaired - 404,121 - 156,337 403,413 963,871Impaired - 264,754 - 1,221,700 415,731 1,902,185
14,511,673 107,360,028 16,704,356 111,766,846 18,496,577 268,839,480Less : allowance (25,511) (329,258) (3,115) (1,298,129) (675,236) (2,331,249)
₩ 14,486,162 107,030,770 16,701,241 110,468,717 17,821,341 266,508,231
2014Banks Retail Government Corporations Card Total
Neither past due nor impaired ₩ 13,693,746 93,848,005 12,203,568 101,988,278 17,111,952 238,845,549Past due but not impaired - 455,948 181 278,262 497,147 1,231,538Impaired - 286,414 - 1,349,849 490,925 2,127,188
13,693,746 94,590,367 12,203,749 103,616,389 18,100,024 242,204,275Less : allowance (30,428) (308,097) (7,991) (1,456,177) (721,845) (2,524,538)
₩ 13,663,318 94,282,270 12,195,758 102,160,212 17,378,179 239,679,737

Financial Section 109Notes to Financial Statements
- Credit quality of due from banks and loans that are neither past due nor impaired as of December 31, 2015 and 2014 are as follows:
2015Banks Retail Government Corporations Card Total
Grade 1 (*1) ₩ 14,511,673 100,677,960 16,704,356 72,501,523 15,133,363 219,528,875Grade 2 (*1) - 6,013,193 - 37,887,286 2,544,070 46,444,549
14,511,673 106,691,153 16,704,356 110,388,809 17,677,433 265,973,424Less : allowance (25,511) (178,313) (3,115) (734,136) (356,815) (1,297,890)
₩ 14,486,162 106,512,840 16,701,241 109,654,673 17,320,618 264,675,534Mitigation of credit risk due to collateral (*2) ₩ 124,306 69,399,485 - 57,477,691 5,045 127,006,527
2014Banks Retail Government Corporations Card Total
Grade 1 (*1) ₩ 13,693,746 88,338,903 12,201,919 62,614,102 14,750,893 191,599,563Grade 2 (*1) - 5,509,102 1,649 39,374,176 2,361,059 47,245,986
13,693,746 93,848,005 12,203,568 101,988,278 17,111,952 238,845,549Less : allowance (30,428) (161,189) (7,984) (864,854) (340,544) (1,404,999)
₩ 13,663,318 93,686,816 12,195,584 101,123,424 16,771,408 237,440,550Mitigation of credit risk due to collateral (*2) ₩ 59,826 63,402,563 398 51,326,493 4,970 114,794,250
(*1) Credit quality of due from banks and loans was classified based on the internal credit rating as follows:
Type of Borrower Grade 1 Grade 2
Banks and governments (*)OECD sovereign credit rating of 6 or above (as applied to the nationality of the banks and governments)
OECD sovereign credit rating of below 6 (as applied to the nationality of the banks and governments)
RetailPool of retail loans with probability of default of less than 2.25%
Pool of retail loans with probability of default of 2.25% or more
CorporationsInternal credit rating of BBB+ or above Internal credit rating of below BBB+
(Probability of default for loans with internal credit rating of BBB is 2.25%)
Credit cards
For individual card holders, score of 7 or higher in Shinhan Card’s internal behavior scoring system
For individual card holders, score of below 7 in Shinhan Card’s internal behavior scoring system
For corporate cardholders, same as corporate loans
For corporate cardholders, same as corporate loans
(*) In the case of loans to banks and governments that are neither past due nor impaired, Shinhan Bank classified loans with a sovereign rating of 6 or above as Grade 1 and those with a sovereign rating of below 6 as Grade 2. Under the guidelines set forth by the Financial Supervisory Commission of Korea, all major commercial banks in Korea, including Shinhan Bank, follow the standardized approach under Basel III for purposes of computing Bank of International Settlement (BIS) ratios for risk clas-sifications of loans to banks and governments. Under this standardized approach under Basel III, risk classification for loans to banks and governments are determined on the basis of sovereign credit ratings, and not internal credit ratings assigned by the lending bank that are specific to the individual banks and governments. More specifically, this approach involves classifying loans to banks and governments in a given jurisdiction as either Grade 1 or Grade 2 based on the sovereign credit ratings for the government of such jurisdiction as determined by the Organization for Economic Co-operation and Development (“OECD”). As for our subsidiaries other than Shinhan Bank, risk classification of loans to banks and governments is made based on their respective internal credit ratings as these subsidiaries are not subject to the aforesaid guidelines of the Financial Supervisory Commission relating to Basel III risk classification.
(*2) The Group holds collateral against due from banks and loans to customers in the form of mortgage interests over property, other registered securities over assets, and guarantees. Estimates of quantification of the extent to which collateral mitigate credit risk are based on the fair value of collateral.

Shinhan Financial Group Annual Report 2015 110
Notes to the Consolidated Financial StatementsDecember 31, 2015 and 2014 (In millions of won)
- Aging analyses of due from banks and loans that are past due but not impaired as of December 31, 2015 and 2014 are as follows:
2015Banks Retail Government Corporations Card Total
Less than 30 days ₩ - 311,602 - 108,683 342,708 762,99331~60 days - 52,331 - 24,139 43,158 119,62861~90 days - 25,967 - 10,551 17,329 53,847More than 90 days - 14,221 - 12,964 218 27,403
- 404,121 - 156,337 403,413 963,871Less : allowance - (32,876) - (9,884) (60,757) (103,517)
₩ - 371,245 - 146,453 342,656 860,354Mitigation of credit risk due to collateral (*) ₩ - 258,827 - 54,985 8 313,820
2014Banks Retail Government Corporations Card Total
Less than 30 days ₩ - 353,523 80 157,029 429,972 940,60431~60 days - 66,576 101 31,839 44,603 143,11961~90 days - 28,868 - 50,745 22,445 102,058More than 90 days - 6,981 - 38,649 127 45,757
- 455,948 181 278,262 497,147 1,231,538Less : allowance - (31,590) (8) (32,996) (72,581) (137,175)
₩ - 424,358 173 245,266 424,566 1,094,363Mitigation of credit risk due to collateral (*) ₩ - 307,234 11 98,941 25 406,211
- Due from banks and loans that are impaired as of December 31, 2015 and 2014 are as follows:
2015Banks Retail Government Corporations Card Total
Impaired ₩ - 264,754 - 1,221,700 415,731 1,902,185Less : allowance - (118,069) - (554,109) (257,664) (929,842)
₩ - 146,685 - 667,591 158,067 972,343Mitigation of credit risk due to collateral (*) ₩ - 109,869 - 399,142 7 509,018
2014Banks Retail Government Corporations Card Total
Impaired ₩ - 286,414 - 1,349,849 490,925 2,127,188Less : allowance - (115,318) - (558,327) (308,720) (982,365)
₩ - 171,096 - 791,522 182,205 1,144,823Mitigation of credit risk due to collateral (*) ₩ - 137,039 - 488,535 2 625,576
(*) The Group holds collateral against due from banks and loans to customers in the form of mortgage interests over property, other registered securities over assets, and guarantees. Estimates of quantification of the extent to which collateral mitigate credit risk are based on the fair value of collateral.

Financial Section 111Notes to Financial Statements
iv) Credit rating - Credit ratings of debt securities as of December 31, 2015 and 2014 are as follows:
2015Trading assets
Financial assets designated at FVTPL (*)
Available–for- sale financial
assets
Held-to-maturity financial assets
Total
AAA ₩ 6,972,123 143,888 18,885,297 13,046,394 39,047,702AA- to AA+ 5,144,783 676,975 4,004,980 2,342,271 12,169,009A- to A+ 4,745,915 1,269,073 3,923,203 576,568 10,514,759BBB- to BBB+ 917,401 239,082 941,149 35,160 2,132,792Lower than BBB- 83,410 - 419,080 68,672 571,162Unrated 1,582,553 - 863,931 122,995 2,569,479
₩ 19,446,185 2,329,018 29,037,640 16,192,060 67,004,903
2014Trading assets
Financial assets designated at FVTPL (*)
Available–for- sale financial
assets
Held-to-maturity financial assets
Total
AAA ₩ 7,068,449 59,945 14,584,701 9,879,920 31,593,015AA- to AA+ 6,639,473 262,439 4,797,373 3,040,388 14,739,673A- to A+ 6,195,826 1,433,469 4,705,307 350,244 12,684,846BBB- to BBB+ 926,701 190,347 1,647,993 19 2,765,060Lower than BBB- 242,057 - 441,338 33,306 716,701Unrated 203,893 - 678,950 69,507 952,350
₩ 21,276,399 1,946,200 26,855,662 13,373,384 63,451,645
(*) FVTPL : fair value through profit or loss
- The credit quality of securities (debt securities) according to the credit ratings by external rating agencies is as follows:
Internal credit ratings KIS (*1) KR (*2) S&P Fitch Moody’sAAA - - AAA AAA AaaAA- to AA+ AAA AAA AA- to AA+ AA- to AA+ Aa3 to Aa1A- to A+ AA- to AA+ AA- to AA+ A- to A+ A- to A+ A3 to A1BBB- to BBB+ BBB- to A BBB- to A BBB- to BBB+ BBB- to BBB+ Baa3 to Baa1Lower than BBB- Lower than BBB- Lower than BBB- Lower than BBB- Lower than BBB- Lower than Baa3Unrated Unrated Unrated Unrated Unrated Unrated
(*1) KIS : Korea Investors Service (*2) KR : Korea Ratings
- Credit status of debt securities as of December 31, 2015 and 2014 are as follows:
2015 2014Neither past due nor impaired ₩ 67,003,272 63,444,233Impaired 1,631 7,412
₩ 67,004,903 63,451,645

Shinhan Financial Group Annual Report 2015 112
Notes to the Consolidated Financial StatementsDecember 31, 2015 and 2014 (In millions of won)
- Assets acquired through foreclosures amounting to ₩1,185 million and W2,585 million are classified as assets held for sale (non-business purpose property) as of December 31, 2015 and 2014, respectively.
v) Concentration by geographic location An analysis of concentration by geographic location for financial instrument, net of allowance, as of December 31, 2015 and 2014 are as follows:
2015Korea USA Japan Vietnam China Other Total
Due from banks and loans:
Banks ₩ 6,735,520 1,541,760 348,956 340,933 3,929,087 1,589,906 14,486,162Retail 104,878,555 292,437 1,313,156 117,797 98,679 330,146 107,030,770Government 15,108,925 294,332 550,439 67,251 438,214 242,080 16,701,241Corporations 99,243,181 1,548,932 1,724,085 1,399,971 2,438,980 4,113,568 110,468,717Card 17,790,098 6,997 2,247 7,819 6,423 7,757 17,821,341
243,756,279 3,684,458 3,938,883 1,933,771 6,911,383 6,283,457 266,508,231Trading assets 19,337,295 8,413 1,054 - 87,110 161,533 19,595,405Financial assets designated at FVTPL (*1) 2,247,189 - - - 36,396 45,433 2,329,018
AFS financial assets (*2) 27,586,155 619,084 89,433 418,865 46,545 277,558 29,037,640HTM financial assets (*3) 15,789,289 148,073 26,770 73,226 148,258 6,444 16,192,060
₩ 308,716,207 4,460,028 4,056,140 2,425,862 7,229,692 6,774,425 333,662,354
2014Korea USA Japan Vietnam China Other Total
Due from banks and loans:
Banks ₩ 6,605,378 1,585,332 367,795 345,781 2,654,699 2,104,333 13,663,318Retail 92,855,198 264,564 784,086 56,376 45,115 276,931 94,282,270Government 11,321,880 115,845 73,475 80,516 540,175 63,867 12,195,758Corporations 92,121,984 1,339,264 1,480,651 1,294,133 2,665,519 3,258,661 102,160,212Card 17,349,245 6,597 2,401 8,394 4,503 7,039 17,378,179
220,253,685 3,311,602 2,708,408 1,785,200 5,910,011 5,710,831 239,679,737Trading assets 21,153,829 7,450 - - 114,897 224,779 21,500,955Financial assets designated at FVTPL (*1) 1,912,084 - - - 34,116 - 1,946,200
AFS financial assets (*2) 25,839,853 397,158 37,005 416,632 29,669 135,345 26,855,662HTM financial assets (*3) 13,178,520 83,560 23,137 22,031 54,860 11,276 13,373,384
₩ 282,337,971 3,799,770 2,768,550 2,223,863 6,143,553 6,082,231 303,355,938
(*1) FVTPL : fair value through profit or loss (*2) AFS : available-for-sale (*3) HTM : held-to-maturity

Financial Section 113Notes to Financial Statements
vi) Concentration by industry sector An analysis of concentration by industry sector of due from banks and loans, net of allowance, as of December 31, 2015 and 2014 are as follows:
2015Finance and
insuranceManu-
facturingRetail and wholesale
Real estate and service
Other Retail customers
Total
Due from banks and loans:
Banks ₩ 11,865,178 - - 67,609 2,553,375 - 14,486,162Retail - - - - - 107,030,770 107,030,770Government 15,625,885 - - - 1,075,356 - 16,701,241Corporations 4,235,517 38,918,439 14,744,780 19,716,006 32,853,975 - 110,468,717Card 43,583 171,851 122,112 31,666 337,817 17,114,312 17,821,341
31,770,163 39,090,290 14,866,892 19,815,281 36,820,523 124,145,082 266,508,231Trading assets 13,066,258 722,383 661,426 457,132 4,688,206 - 19,595,405Financial assets desig-nated at FVTPL (*1) 1,823,687 109,677 67,973 - 327,681 - 2,329,018
AFS financial assets (*2) 20,656,569 999,752 161,597 413,683 6,806,039 - 29,037,640HTM financial assets (*3) 4,630,157 66,283 - 614,439 10,881,181 - 16,192,060
₩ 71,946,834 40,988,385 15,757,888 21,300,535 59,523,630 124,145,082 333,662,354
2014Finance and
insuranceManu-
facturingRetail and wholesale
Real estate and service
Other Retail customers
Total
Due from banks and loans:
Banks ₩ 11,724,753 2,246 - 187,727 1,748,592 - 13,663,318Retail - - - - - 94,282,270 94,282,270Government 11,285,787 - 182 43 909,746 - 12,195,758Corporations 4,102,383 35,954,237 13,807,545 18,358,983 29,937,064 - 102,160,212Card 44,351 158,901 123,175 29,767 494,580 16,527,405 17,378,179
27,157,274 36,115,384 13,930,902 18,576,520 33,089,982 110,809,675 239,679,737Trading assets 14,834,973 908,646 599,989 923,759 4,233,588 - 21,500,955Financial assets desig-nated at FVTPL (*1) 1,498,097 92,494 106,890 30,124 218,595 - 1,946,200
AFS financial assets (*2) 18,375,517 1,365,458 163,342 819,355 6,131,990 - 26,855,662HTM financial assets (*3) 3,448,775 50,370 - 593,894 9,280,345 - 13,373,384
₩ 65,314,636 38,532,352 14,801,123 20,943,652 52,954,500 110,809,675 303,355,938 (*1) FVTPL : fair value through profit or loss (*2) AFS : available-for-sale (*3) HTM : held-to-maturity

Shinhan Financial Group Annual Report 2015 114
Notes to the Consolidated Financial StatementsDecember 31, 2015 and 2014 (In millions of won)
(c) Market risk Market risk from trading positions is the risk that changes in market prices, such as foreign exchange rates, interest rates and equity prices will affect
the Group’s income or the value of its holdings of financial instruments.
Interest rate risk from non- trading positions is the risk of loss resulting from interest rate fluctuations that adversely affect the financial condition and results of operations of the Group and affects the earnings and the economic value of net assets of the Group.
Foreign exchange risk arises from the Group’s assets and liabilities which are denominated in currencies other than the Won.
The Group’s market risks arise primarily from Shinhan Bank, and to a lesser extent, Shinhan Investment, which incurs market risk relating to its trading activities.
Shinhan Bank’s Risk Policy Committee acts as the executive decision making body in relation to market risks setting the risk management policies and risk limits and controlling market risks arising from trading and non-trading activities. In addition, Shinhan Bank’s Risk Management Department comprehensively manages market risks on an independent basis from Shinhan Bank’s operating departments, and functions as the middle office of Shinhan Bank.
Shinhan Investment’s Risk Management Working Committee is the executive decision-making body for managing market risks related to Shinhan Investment, and determines, among other things, Shinhan Investment’s overall market risk management policies and strategies, and assesses and ap-proves trading activities and limits. In addition, Shinhan Investment’s Risk Management Department manages various market risk limits and monitors operating conditions on an independent basis from Shinhan Investment’s operating departments.
i) Market risk management from trading positions Trading activities are to realize short-term trading profits in debt and stock markets and foreign exchange markets based on short-term forecast of
changes in market situation and profits from arbitrage transactions in derivatives such as swap, forward, futures and option transactions. The Group manages market risk related to its trading positions using VaR, market value-based tool.
Shinhan Bank currently uses the ten-day 99% confidence level-based VaR for purposes of calculating the regulatory capital used in reporting to the Financial Supervisory Service and uses the more conservative ten-day 99.9% confidence level-based VaR for purposes of calculating its “economic” capital used for internal management purposes, which is a concept used in determining the amount of Shinhan Bank’s requisite capital in light of the market risk. In addition, Shinhan Bank also uses the one-day 99% confidence level-based VaR on a supplemental basis for purposes of setting and managing risk limits specific to each desk or team in its operating units as well as for back-testing purposes. Shinhan Bank manages VaR measure-ments and limits on a daily basis based on an automatic interfacing of its trading positions into its market risk measurement system. In addition, Shinhan Bank establishes pre-set loss, sensitivity, investment and stress limits for its trading departments and desks and monitors such limits daily.
Shinhan Investment currently uses the ten-day 99.9% confidence level-based historical VaR for purposes of calculating its “economic” capital used for internal management purposes. When computing the VaR, Shinhan Investment does not assume any particular probability distribution and calculates it through a simulation of the “full valuation” method based on changes of market variables such as stock prices, interest rates, and foreign exchange rates in the past one year. In addition, Shinhan Investment applies this VaR as a risk limit for the entire company as well as individual departments and products, and the adequacy of such VaR is reviewed by way of daily back-testing.
In order to streamline such differences and use a consistent VaR among operating subsidiaries, the Group has adopted starting in 2013 a unified group-wide market risk measurement methodology, which uses the ten-day 99.9% confidence level for calculating the VaR.
An analysis of the Group’s requisite capital in light of the market risk for trading positions as of and for the years ended December 31, 2015 and 2014 based on the standard guidelines for risk management promulgated by the Financial Supervisory Service, was as follows:

Financial Section 115Notes to Financial Statements
2015Average Maximum Minimum December 31
Interest rate ₩ 305,563 328,357 281,223 328,357 Stock price 174,365 213,507 132,172 132,172 Foreign exchange 125,048 141,887 110,512 141,159 Option volatility 7,820 16,811 3,747 4,561
₩ 612,796 700,562 527,654 606,249
2014Average Maximum Minimum December 31
Interest rate ₩ 256,051 293,708 214,823 292,081Stock price 130,879 161,505 85,819 159,049Foreign exchange 121,334 145,703 104,065 114,101Option volatility 7,857 9,843 5,577 5,577
₩ 516,121 610,759 410,284 570,808
Insurance company, Shinhan Life Insurance, was excluded when the Group estimated the market risk, because insurance company was not included in the Group’s subsidiaries for the consolidated BIS capital ratio.
An analysis of market risk for trading positions of the major subsidiaries as of and for the years ended December 31, 2015 and 2014 are as follows:
i-1) Shinhan Bank The analyses of the ten-day 99.9% confidence level-based VaR for managing market risk for trading positions of Shinhan Bank as of and for the years
ended December 31, 2015 and 2014 are as follows:
2015Average Maximum Minimum December 31
Interest rate ₩ 37,341 43,746 33,849 35,976Stock price 8,258 9,049 6,995 7,056Foreign exchange (*) 45,102 54,459 36,549 44,475Option volatility 355 550 262 262Commodity 5 21 - 3Portfolio diversification (35,789) (45,895) (25,953) (30,699)
₩ 55,272 61,930 51,702 57,073
2014Average Maximum Minimum December 31
Interest rate ₩ 17,302 25,863 8,721 13,414Stock price 4,333 7,362 2,493 3,442Foreign exchange (*) 43,872 54,355 34,928 49,372Option volatility 161 259 66 66Portfolio diversification (18,668) (32,344) (5,246) (13,268)
₩ 47,000 55,495 40,962 53,026
(*) Both trading and non-trading accounts are included since Shinhan Bank manages foreign exchange risk on a total position basis.

Shinhan Financial Group Annual Report 2015 116
Notes to the Consolidated Financial StatementsDecember 31, 2015 and 2014 (In millions of won)
i-2) Shinhan Card The analyses of Shinhan Card’s requisite capital in light of the market risk for trading positions as of and for the years ended December 31, 2015 and
2014, based on the standard guidelines for risk management promulgated by the Financial Supervisory Service, are as follows:
2015Average Maximum Minimum December 31
Interest rate ₩ 1,685 3,011 650 650Foreign exchange 38,214 42,208 33,759 33,759
₩ 39,899 45,219 34,409 34,409
2014Average Maximum Minimum December 31
Interest rate ₩ 754 1,300 400 1,150Foreign exchange 40,309 46,846 33,832 39,849
₩ 41,063 48,146 34,232 40,999
(*) Shinhan Card fully hedges all the cash flows from foreign currency liabilities by swap transactions and is narrowly exposed to foreign exchange risk relating to foreign currency equity securities held for non-trading purposes.
i-3) Shinhan Investment The analyses of the ten-day 99.9% confidence level-based VaR for managing market risk for trading positions of Shinhan Investment as of and for the
years ended December 31, 2015 and 2014 are as follows:
2015Average Maximum Minimum December 31
Interest rate ₩ 6,879 16,542 2,707 7,274Stock price 19,397 64,650 10,213 19,047Foreign exchange 5,680 10,881 2,845 7,489Option volatility 2,634 5,207 175 4,396Portfolio diversification (11,714) (32,096) (4,062) (8,460)
₩ 22,876 65,184 11,878 29,746
2014Average Maximum Minimum December 31
Interest rate ₩ 8,999 30,064 3,514 6,069Stock price 7,531 14,677 3,389 14,438Foreign exchange 3,688 17,353 646 5,227Option volatility 1,917 7,042 224 711Portfolio diversification (7,730) (38,169) (1,399) (8,967)
₩ 14,405 30,967 6,374 17,478

Financial Section 117Notes to Financial Statements
i-4) Shinhan Life Insurance The analyses of the ten-day 99.9% confidence level-based VaR for managing market risk for trading positions of Shinhan Life Insurance as of and for
years ended December 31, 2015 and 2014 are as follows:
2015Average Maximum Minimum December 31
Interest rate ₩ 585 817 298 303Stock price 275 1,190 - -Foreign exchange 1,308 2,337 511 1,780Option volatility 541 1,868 108 138
₩ 2,709 6,212 917 2,221
2014Average Maximum Minimum December 31
Interest rate ₩ 997 4,850 223 354Stock price 5 111 - -Foreign exchange 301 664 19 392Option volatility 3,136 7,289 1,058 1,332
₩ 4,439 12,914 1,300 2,078
ii) Interest rate risk management from non-trading positions Principal market risk from non-trading activities of the Group is interest rate risk, which affects the Group’s earnings and the economic value of the
Group’s net assets:
• Earnings: interest rate fluctuations have an effect on the Group’s net interest income by affecting its interest-sensitive operating income and expenses and EaR (Earnings at Risk) is a commonly used risk management technique.
• Economic value of net assets: interest rate fluctuations influence the Group’s net worth by affecting the present value of cash flows from the assets, liabilities and other transactions of the Group and VaR is a commonly used risk management technique.
Interest rate VaR represents the maximum anticipated loss in a net present value calculation, whereas interest rate EaR represents the maximum antici-pated loss in a net earnings calculation for the immediately following one-year period, in each case, as a result of negative movements in interest rates.
Accordingly, the Group measures and manages interest rate risk for non-trading activities by taking into account effects of interest rate changes on both its income and net asset value.
The principal objectives of Shinhan Bank’s interest rate risk management are to generate stable net interest income and to protect Shinhan Bank’s net
asset value against interest rate fluctuations. Through its asset and liability management system, Shinhan Bank measures and manages its interest rate risk based on various analytical measures such as interest rate gap, duration gap and net present value and net interest income simulations, and moni-tors on a monthly basis its interest rate VaR limits, interest rate earnings at risk (“EaR”) limits and interest rate gap ratio limits. Shinhan Bank measures its interest rate VaR and interest rate EaR based on a simulated estimation of the maximum decrease in net asset value and net interest income in a one-year period based on various scenario analyses of historical interest rates.
Shinhan Card and Shinhan Life Insurance also monitors and manages its interest rate risk limits for all its interest-bearing assets and liabilities (including off-balance sheet items) in terms of impact on its earnings and net asset value from changes in interest rates. The interest rate VaR analysis used by Shinhan Card and Shinhan Life Insurance principally focuses on the maximum impact on its net asset value from adverse movement in interest rates.

Shinhan Financial Group Annual Report 2015 118
Notes to the Consolidated Financial StatementsDecember 31, 2015 and 2014 (In millions of won)
Non-trading positions for interest rate VaR and EaR as of December 31, 2015 and 2014 are as follows:
ii-1) Shinhan Bank
2015 2014VaR ₩ 202,029 179,367EaR 185,254 313,619
ii-2) Shinhan Card
2015 2014VaR ₩ 88,825 89,909EaR 12,663 23,458
ii-3) Shinhan Investment
2015 2014VaR ₩ 9,846 5,106EaR 85,881 119,812
ii-4) Shinhan Life Insurance
2015 2014VaR ₩ 206,432 201,940EaR 5,947 4,525
(*1) The interest rate VaR represents the maximum anticipated loss in a net asset value in one year under confidence level of 99.9% and is measured by the internal model. (*2) The interest rate EaR was calculated by the Financial Supervisory Service regulations based on the “middle of time band” and interest shocks by 200 basis points for
each time bucket as recommended under the Basel Accord.
iii) Foreign exchange risk Foreign exchange risk arises because of the Group’s net foreign currency open position, which is the difference between its foreign currency assets and
liabilities, including derivatives.
The Group manages foreign exchange risk on an overall position basis, including its overseas branches, by covering all of its foreign exchange spot and forward positions in both trading and non-trading accounts.
The Risk Policy Committee oversees Shinhan Bank’s foreign exchange exposure for both trading and non-trading activities by establishing limits for the net foreign currency open position, loss limits and VaR limits.
The management of Shinhan Bank’s foreign exchange position is centralized at the FX & Derivatives Department. Dealers in the FX & Derivatives De-partment manage Shinhan Bank’s overall position within the set limits through spot trading, forward contracts, currency options, futures and swaps and foreign exchange swaps.

Financial Section 119Notes to Financial Statements
Foreign currency denominated assets and liabilities as of December 31, 2015 and 2014 are as follows:
2015USD JPY EUR CNY Other Total
Assets:Cash and due from banks ₩ 3,255,745 1,146,612 137,912 1,854,220 875,451 7,269,940Trading assets 376,477 6,102 52,440 27,330 172,335 634,684 Financial assets designated at FVTPL (*1) 335,474 - - - - 335,474
Derivative assets 77,075 8,110 2,596 3,989 330 92,100Loans 15,053,386 4,460,483 1,150,044 2,881,059 3,012,725 26,557,697AFS financial assets (*2) 1,961,730 65,075 16,979 5,441 594,535 2,643,760HTM financial assets (*3) 124,651 143,529 - 148,258 83,892 500,330Other financial assets 2,338,372 268,558 126,115 654,260 185,008 3,572,313
₩ 23,522,910 6,098,469 1,486,086 5,574,557 4,924,276 41,606,298
Liabilities:Deposits ₩ 8,526,888 5,300,848 451,613 3,544,013 2,554,630 20,377,992Trading liabilities 317 - - - 453,605 453,922 Financial liabilities designated at FVTPL (*1) 368,633 4,530 1,142 - - 374,305
Derivative liabilities 60,636 658 260 2,260 209 64,023Borrowings 6,043,186 179,412 390,562 717,309 366,803 7,697,272Debt securities issued 5,581,146 291,603 153,664 216,660 144,381 6,387,454Other financial liabilities 2,465,314 211,698 337,612 827,811 314,892 4,157,327
₩ 23,046,120 5,988,749 1,334,853 5,308,053 3,834,520 39,512,295
Net assets (liabilities) ₩ 476,790 109,720 151,233 266,504 1,089,756 2,094,003Off-balance derivative exposure 266,359 24,438 (121,245) 69,342 (408,120) (169,226)
Net position ₩ 743,149 134,158 29,988 335,846 681,636 1,924,777 (*1) FVTPL : fair value through profit or loss (*2) AFS : available-for-sale (*3) HTM : held-to-maturity
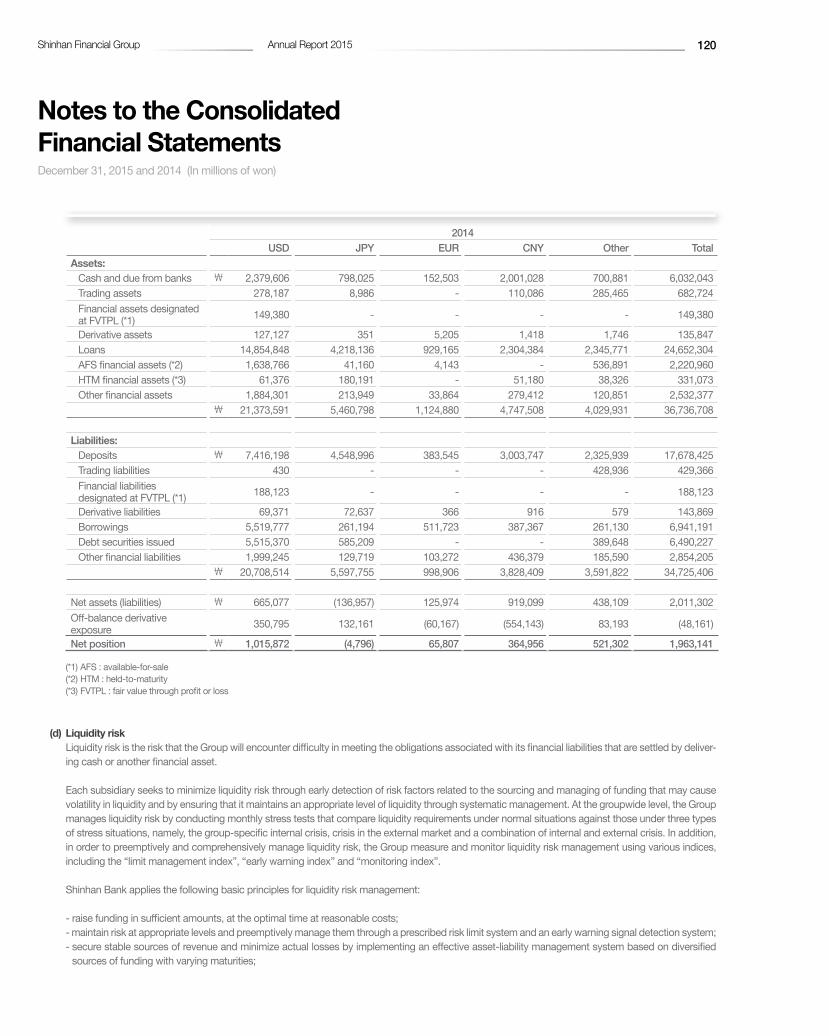
Shinhan Financial Group Annual Report 2015 120
Notes to the Consolidated Financial StatementsDecember 31, 2015 and 2014 (In millions of won)
2014USD JPY EUR CNY Other Total
Assets:Cash and due from banks ₩ 2,379,606 798,025 152,503 2,001,028 700,881 6,032,043Trading assets 278,187 8,986 - 110,086 285,465 682,724 Financial assets designated at FVTPL (*1) 149,380 - - - - 149,380
Derivative assets 127,127 351 5,205 1,418 1,746 135,847Loans 14,854,848 4,218,136 929,165 2,304,384 2,345,771 24,652,304AFS financial assets (*2) 1,638,766 41,160 4,143 - 536,891 2,220,960HTM financial assets (*3) 61,376 180,191 - 51,180 38,326 331,073Other financial assets 1,884,301 213,949 33,864 279,412 120,851 2,532,377
₩ 21,373,591 5,460,798 1,124,880 4,747,508 4,029,931 36,736,708
Liabilities:Deposits ₩ 7,416,198 4,548,996 383,545 3,003,747 2,325,939 17,678,425Trading liabilities 430 - - - 428,936 429,366 Financial liabilities designated at FVTPL (*1) 188,123 - - - - 188,123
Derivative liabilities 69,371 72,637 366 916 579 143,869Borrowings 5,519,777 261,194 511,723 387,367 261,130 6,941,191Debt securities issued 5,515,370 585,209 - - 389,648 6,490,227Other financial liabilities 1,999,245 129,719 103,272 436,379 185,590 2,854,205
₩ 20,708,514 5,597,755 998,906 3,828,409 3,591,822 34,725,406
Net assets (liabilities) ₩ 665,077 (136,957) 125,974 919,099 438,109 2,011,302Off-balance derivative exposure 350,795 132,161 (60,167) (554,143) 83,193 (48,161)
Net position ₩ 1,015,872 (4,796) 65,807 364,956 521,302 1,963,141
(*1) AFS : available-for-sale (*2) HTM : held-to-maturity (*3) FVTPL : fair value through profit or loss
(d) Liquidity risk Liquidity risk is the risk that the Group will encounter difficulty in meeting the obligations associated with its financial liabilities that are settled by deliver-
ing cash or another financial asset.
Each subsidiary seeks to minimize liquidity risk through early detection of risk factors related to the sourcing and managing of funding that may cause volatility in liquidity and by ensuring that it maintains an appropriate level of liquidity through systematic management. At the groupwide level, the Group manages liquidity risk by conducting monthly stress tests that compare liquidity requirements under normal situations against those under three types of stress situations, namely, the group-specific internal crisis, crisis in the external market and a combination of internal and external crisis. In addition, in order to preemptively and comprehensively manage liquidity risk, the Group measure and monitor liquidity risk management using various indices, including the “limit management index”, “early warning index” and “monitoring index”.
Shinhan Bank applies the following basic principles for liquidity risk management:
- raise funding in sufficient amounts, at the optimal time at reasonable costs; - maintain risk at appropriate levels and preemptively manage them through a prescribed risk limit system and an early warning signal detection system; - secure stable sources of revenue and minimize actual losses by implementing an effective asset-liability management system based on diversified
sources of funding with varying maturities;

Financial Section 121Notes to Financial Statements
- monitor and manage daily and intra-daily liquidity positions and risk exposures for timely payment and settlement of financial obligations due under both normal and crisis situations;
- conduct periodic contingency analysis in anticipation of any potential liquidity crisis and establish and implement emergency plans in case of a crisis actually happening; and
- consider liquidity-related costs, benefits of and risks in determining the pricing of the Group’s products and services, employee performance evalua-tions and approval of launching of new products and services.
As for any potential liquidity shortage at or near the end of each month, Shinhan Card maintains liquidity at a level sufficient to withstand credit short-age for three months. In addition, Shinhan Card manages liquidity risk by defining and managing various indicators of liquidity risk, such as the actual liquidity gap ratio (in relation to the different maturities for assets as compared to liabilities), the liquidity buffer ratio, the maturity repayment ratio, the ratio of actual funding compared to budgeted funding and the ratio of asset-backed securities to total borrowings, at different risk levels of “caution”, “unstable” and “at risk”, and the Group also has contingency plans in place in case of any emergency or crisis.
Contractual maturities for financial instruments including cash flows of principal and interest and off balance as of December 31, 2015 and 2014 are as follows:
2015Less than
1 month1~3 months 3~6 months 6 months
~1 year1~5 years More than
5 yearsTotal
Non-derivative financial instruments:Assets:
Cash and due from banks ₩ 16,843,128 1,641,876 1,530,110 2,050,819 29,843 23,073 22,118,849Trading assets (*3) 22,501,571 24,397 30,194 73,262 20,028 6,593 22,656,045 Financial assets designated at fair value through profit or loss 2,369,896 51,860 4,688 97,645 619,170 101,074 3,244,333
Loans 29,674,971 30,614,739 37,138,646 55,209,656 66,445,746 54,084,5500 273,168,308 Available-for-sale financial assets (*3) 29,415,328 1,091,745 12,623 1,173,011 398,156 1,904,249 33,995,112
Held-to-maturity financial assets 78,916 236,378 565,038 1,085,581 9,518,678 9,582,297 21,066,888
Other financial assets 8,057,613 24,202 21,106 290,955 3,502,493 90,587 11,986,956₩ 108,941,423 33,685,197 39,302,405 59,980,929 80,534,114 65,792,423 388,236,491
Liabilities:Deposits (*2) ₩ 108,029,850 21,996,113 26,252,328 51,392,270 13,511,745 3,415,583 224,597,889Trading liabilities 2,135,390 - - - - - 2,135,390 Financial liabilities designated at fair value through profit or loss 151,597 368,648 335,632 1,586,608 5,496,762 977,743 8,916,990
Borrowings 10,799,071 2,321,249 1,410,898 2,392,047 4,425,261 682,720 22,031,246Debt securities issued 805,212 2,582,626 3,036,650 8,292,380 25,620,414 4,096,669 44,433,951Other financial liabilities 18,623,136 (7,698) 303,104 196,771 321,174 55,163 19,491,650
₩ 140,544,256 27,260,938 31,338,612 63,860,076 49,375,356 9,227,878 321,607,116Off balance (*4):
Finance guarantee contracts ₩ 3,679,486 - - - - - 3,679,486 Loan commitments and other 76,965,151 - - - - - 76,965,151
₩ 80,644,637 - - - - - 80,644,637
Derivatives:Cash inflows ₩ 2,040,644 493,895 375,267 1,127,109 1,835,195 42,160 5,914,270Cash outflows (2,601,358) (329,658) (354,063) (1,075,864) (1,645,263) (30,270) (6,036,476)
₩ (560,714) 164,237 21,204 51,245 189,932 11,890 (122,206)

Shinhan Financial Group Annual Report 2015 122
Notes to the Consolidated Financial StatementsDecember 31, 2015 and 2014 (In millions of won)
2014Less than
1 month1~3 months 3~6 months 6 months
~1 year1~5 years More than
5 yearsTotal
Non-derivative financial instruments:Assets:
Cash and due from banks ₩ 16,293,055 1,202,567 1,294,502 1,824,756 35,664 47,375 20,697,919Trading assets (*3) 24,206,873 7,380 - 37,479 36,498 81,519 24,369,749 Financial assets designated at fair value through profit or loss 1,894,062 32,715 116,973 26,051 564,132 103,596 2,737,529
Loans 28,612,094 29,867,481 34,979,379 51,517,129 55,500,327 49,283,162 249,759,572 Available-for-sale financial assets (*3) 26,174,710 1,955,624 30,042 1,002,739 26,551 2,229,016 31,418,682
Held-to-maturity financial assets 205,544 636,188 394,655 1,265,085 7,646,864 7,471,576 17,619,912Other financial assets 6,337,858 21,269 20,151 327,983 3,382,771 190,599 10,280,631
₩103,724,196 33,723,224 36,835,702 56,001,222 67,192,807 59,406,843 356,883,994Liabilities:
Deposits (*2) ₩ 92,720,125 22,382,996 27,514,353 42,443,826 11,473,918 3,708,829 200,244,047Trading liabilities 2,688,734 - - - - - 2,688,734 Financial liabilities designated at fair value through profit or loss 149,918 220,932 287,058 820,256 6,672,700 845,656 8,996,520
Borrowings 13,112,645 1,991,313 1,751,068 1,791,657 3,737,094 846,679 23,230,456Debt securities issued 846,643 1,909,290 4,171,870 7,515,358 23,271,423 3,201,822 40,916,406Other financial liabilities 16,634,144 45,750 15,921 172,690 471,352 108,993 17,448,850
₩126,152,209 26,550,281 33,740,270 52,743,787 45,626,487 8,711,979 293,525,013Off balance (*4):
Finance guarantee contracts ₩ 3,090,873 - - - - - 3,090,873Loan commitments and other 74,295,365 - - - - - 74,295,365
₩ 77,386,238 - - - - - 77,386,238
Derivatives:Cash inflows ₩ 1,530,627 339,105 197,109 1,036,878 1,845,455 50,797 4,999,971Cash outflows (1,614,763) (104,502) (153,737) (1,009,806) (1,925,721) (433,058) (5,241,587)
₩ (84,136) 234,603 43,372 27,072 (80,266) (382,261) (241,616)
(*1) These amounts include cash flows of principal and interest on financial liabilities. (*2) Demand deposits amounting to ₩83,639,042 million and ₩68,949,585 million as of December 31, 2015 and 2014 are included in the ‘Less than 1 month’ category,
respectively. (*3) Available-for-sale financial assets and trading assets which are not restricted for sale and measured at market prices were included in the ‘Less than 1 month’ category;
and the other available-for-sale financial assets and trading assets are classified by the earliest maturities available for sale. (*4) Financial guarantees such as financial guarantee contracts and loan commitments and others provided by the Group are classified based on the earliest date at which
the Group should fulfill the obligation under the guarantee when the counterparty requests payment.
(e) Measurement of fair value The fair values of financial instruments being traded in an active market are determined by the published market prices of each period end. The pub-
lished market prices of financial instruments being held by the Group are based on the trading agencies’ notifications. If the market for a financial instru-ment is not active, such as OTC (Over The Counter market) derivatives, fair value is determined either by using a valuation technique or independent third-party valuation service.

Financial Section 123Notes to Financial Statements
The Group uses various valuation techniques and is setting rational assumptions based on the present market situations. Such valuation techniques may include using recent arm’s length market transactions between knowledgeable, willing parties, if available, reference to the current fair value of another instrument that is substantially the same, discounted cash flow analysis and option pricing models.
The Group classifies and discloses fair value of financial instruments into the following three-level hierarchy:
• Level 1: Financial instruments measured at quoted prices from active markets are classified as fair value level 1. • Level 2: Financial instruments measured using valuation techniques where all significant inputs are observable market data are classified as level 2. •Level 3: Financial instruments measured using valuation techniques where one or more significant inputs are not based on observable market data
are classified as level 3. i) Financial instruments measured at fair value - The fair value hierarchy of financial assets presented at their fair values in the statements of financial position as of December 31, 2015 and 2014 are
as follows:
2015Level 1 Level 2 Level 3 Total
Financial assetsTrading assets:
Debt securities ₩ 5,496,812 13,789,920 159,454 19,446,186Equity securities 1,168,610 1,832,283 42,149 3,043,042Gold deposits 149,221 - - 149,221
Financial assets designated at fair value through profit or loss:Debt securities and others 133,652 1,868,749 326,618 2,329,019Equity securities 6,045 784,596 124,506 915,147
Derivative assets:Trading 4,881 1,695,320 113,160 1,813,361Hedging - 153,455 27,898 181,353
Available-for-sale financial assets:Debt securities 9,265,153 19,582,353 190,134 29,037,640Equity securities 1,545,321 594,186 2,788,924 4,928,431
₩ 17,769,695 40,300,862 3,772,843 61,843,400Financial liabilities:Trading liabilities:
Securities sold ₩ 1,681,785 - - 1,681,785Gold deposits 453,605 - - 453,605
Financial liabilities designated at fair value through profit or loss:Deposits - 10,542 2,967 13,509Securities sold 86,532 - - 86,532Derivatives-combined securities - 2,374,637 6,441,654 8,816,291
Derivative liabilities:Trading 9,122 1,653,121 752,927 2,415,170Hedging - 92,146 91,972 184,118
₩ 2,231,044 4,130,446 7,289,520 13,651,010

Shinhan Financial Group Annual Report 2015 124
Notes to the Consolidated Financial StatementsDecember 31, 2015 and 2014 (In millions of won)
2014Level 1 Level 2 Level 3 Total
Financial assetsTrading assets:
Debt securities ₩ 5,553,244 15,567,883 155,271 21,276,398Equity securities 1,191,394 1,659,309 10,519 2,861,222Gold deposits 224,556 - - 224,556
Financial assets designated at fair value through profit or loss:Debt securities and others 59,945 1,469,473 416,782 1,946,200Equity securities 17,955 630,537 142,683 791,175
Derivative assets:Trading 4,640 1,247,402 159,126 1,411,168Hedging - 95,706 61,433 157,139
Available-for-sale financial assets:Debt securities 7,371,643 19,468,619 15,400 26,855,662Equity securities 1,647,908 346,331 2,568,113 4,562,352
₩ 16,071,285 40,485,260 3,529,327 60,085,872Financial liabilities:Trading liabilities:
Securities sold ₩ 2,259,798 - - 2,259,798Gold deposits 428,936 - - 428,936
Financial liabilities designated at fair value through profit or loss:Deposits - 3,054 3.085 6,139Securities sold 417 - - 417Derivatives-combined securities 154 2,004,122 6,985,349 8,989,625
Derivative liabilities:Trading 5,317 1,360,839 230,244 1,596,400Hedging - 92,392 28,763 121,155
₩ 2,694,622 3,460,407 7,247,441 13,402,470

Financial Section 125Notes to Financial Statements
- There was no transfer between level 1 and level 2 for the years ended December 31, 2015 and 2014. - Changes in carrying values of financial instruments classified as Level 3 for the years ended December 31, 2015 and 2014 are as follows:
2015Trading assets Financial assets
designated at FVTPL (*3)
Available-for-sale financial
assets
Derivative assets and
liabilities, net
Financial liabili-ties designated
at FVTPL (*)Beginning balance ₩ 165,790 559,465 2,583,513 (38,448) (6,988,434)Recognized in total comprehensive income for the year:
Recognized in profit (loss) for the year (*1) 4,426 (70,335) 61,988 (594,773) 469,274Recognized in other comprehensive income (loss) for the year - - (32,170) (163) -
4,426 (70,335) 29,818 (594,936) 469,274Purchase 278,477 354,258 903,357 15,932 (179)Issue - - - - (7,662,427)Settlement (247,090) (392,264) (462,617) (86,327) 7,737,145Transfer in (*2) - - 23,511 - -Transfer out (*2) - - (98,524) (62) -Ending balance ₩ 201,603 451,124 2,979,058 (703,841) (6,444,621)
2014Trading assets Financial assets
designated at FVTPL (*3)
Available-for-sale financial
assets
Derivative assets and
liabilities, net
Financial liabili-ties designated
at FVTPL (*)Beginning balance ₩ 35,345 894,706 2,134,276 (305,107) (4,529,091)Recognized in total comprehensive incomefor the year:
Recognized in profit (loss) for the year (*1) 7,519 (124,819) (114,991) 348,608 (356,036)Recognized in other comprehensive income (loss) for the year - - 133,010 (798) -
7,519 (124,819) 18,019 347,810 (356,036)Purchase 412,363 323,824 603,113 30,864 -Issue - - - - (3,538)Settlement (289,437) (534,246) (203,674) (111,963) (2,099,769)Transfer in (*2) - - 35,336 - -Transfer out (*2) - - (3,557) (52) -Ending balance ₩ 165,790 559,465 2,583,513 (38,448) (6,988,434)
(*1) Recognized profit or loss of the changes in carrying value of financial instruments classified as Level 3 for the years ended December 31, 2015 and 2014, are included in the accounts of the statements of comprehensive income, of which the amounts and the related accounts are as follows:
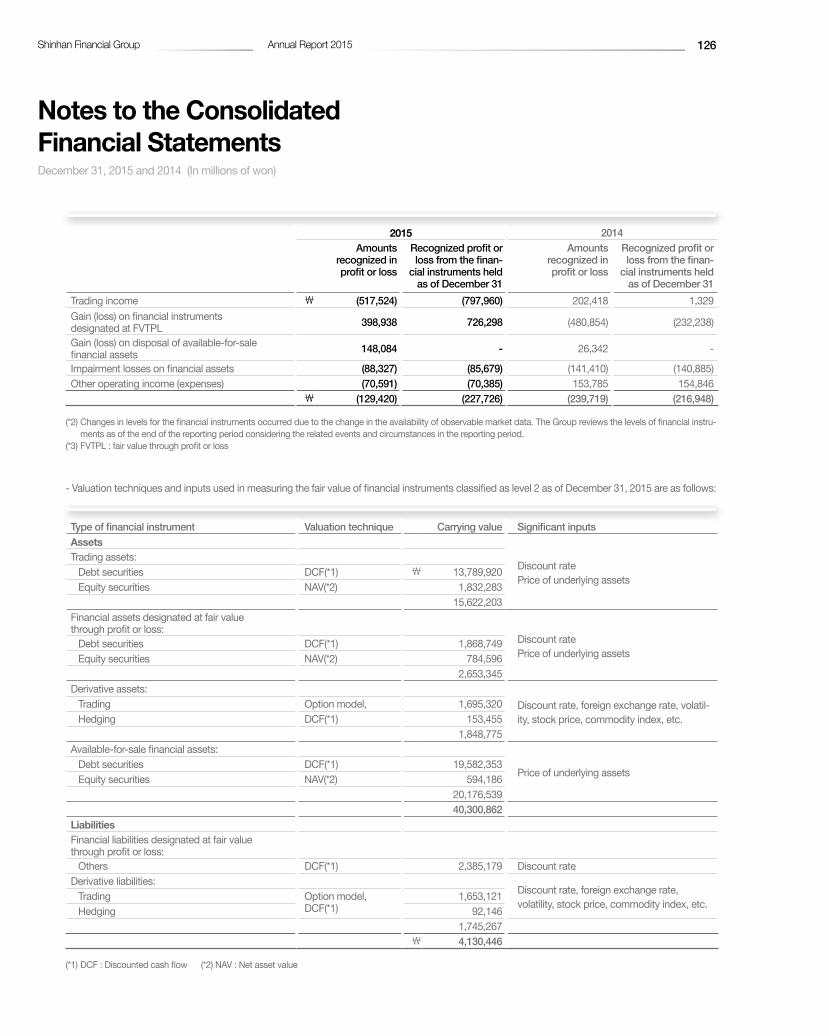
Shinhan Financial Group Annual Report 2015 126
Notes to the Consolidated Financial StatementsDecember 31, 2015 and 2014 (In millions of won)
2015 2014Amounts
recognized in profit or loss
Recognized profit or loss from the finan-
cial instruments held as of December 31
Amounts recognized in profit or loss
Recognized profit or loss from the finan-
cial instruments held as of December 31
Trading income ₩ (517,524) (797,960) 202,418 1,329Gain (loss) on financial instruments designated at FVTPL 398,938 726,298 (480,854) (232,238)
Gain (loss) on disposal of available-for-sale financial assets 148,084 - 26,342 -
Impairment losses on financial assets (88,327) (85,679) (141,410) (140,885)Other operating income (expenses) (70,591) (70,385) 153,785 154,846
₩ (129,420) (227,726) (239,719) (216,948) (*2) Changes in levels for the financial instruments occurred due to the change in the availability of observable market data. The Group reviews the levels of financial instru-
ments as of the end of the reporting period considering the related events and circumstances in the reporting period. (*3) FVTPL : fair value through profit or loss
- Valuation techniques and inputs used in measuring the fair value of financial instruments classified as level 2 as of December 31, 2015 are as follows:
Type of financial instrument Valuation technique Carrying value Significant inputsAssets
Discount ratePrice of underlying assets
Trading assets:Debt securities DCF(*1) ₩ 13,789,920Equity securities NAV(*2) 1,832,283
15,622,203Financial assets designated at fair value through profit or loss:
Discount ratePrice of underlying assets
Debt securities DCF(*1) 1,868,749Equity securities NAV(*2) 784,596
2,653,345Derivative assets:
Discount rate, foreign exchange rate, volatil-ity, stock price, commodity index, etc.
Trading Option model, 1,695,320Hedging DCF(*1) 153,455
1,848,775Available-for-sale financial assets:
Price of underlying assetsDebt securities DCF(*1) 19,582,353Equity securities NAV(*2) 594,186
20,176,53940,300,862
LiabilitiesFinancial liabilities designated at fair value through profit or loss:
Others DCF(*1) 2,385,179 Discount rateDerivative liabilities:
Discount rate, foreign exchange rate, volatility, stock price, commodity index, etc.
Trading Option model,DCF(*1)
1,653,121Hedging 92,146
1,745,267₩ 4,130,446
(*1) DCF : Discounted cash flow (*2) NAV : Net asset value

Financial Section 127Notes to Financial Statements
- Valuation techniques and significant inputs, but not observable, used in measuring the fair value of financial instruments classified as level 3 as of December 31, 2015 are as follows:
Type of financial instrument Valuation technique Carrying value (*4) Significant unobservable inputs RangeFinancial assetsTrading assets:
Debt securities DCF(*1) ₩ 159,454 The volatility of the underlying asset, correlations
0.44%~23.73%77.95%
Financial assets designated at fair value through profit or loss:
Debt securities and other securities DCF(*1) 451,124 The volatility of the underlying asset, correlations
5.06%~80.39%(7.44)%~53.5%
Derivative assets:
Equity and foreign exchange related Option model(*2) 74,613 The volatility of the underlying asset, correlations
3.74%~43.50%(44.72%)~53.5%
Interest rates related Option model(*2) 55,189The volatility of the underlying asset, regression coefficient, correlations
0.40%~16.6%0.02%~2.05%
0%~100%
Credit and commodity related Option model(*2) 11,256 The volatility of the underlying asset, correlations
1.41%~47.48%(8.26%)~90.25%
141,058Available-for-sale financial assets:
Debt securities NAV(*3) 190,134 Discount rate, growth rate 0.84%~21.65%0%~3.5%Equity securities DCF(*1) 2,788,924
2,979,058₩ 3,730,694
(*1) DCF : discounted cash flow (*2) Option model that the Group uses in derivative valuation includes Black-Scholes model, Hull-White model, Monte Carlo simulation, etc. (*3) NAV : net asset value (*4) Valuation techniques and inputs are not disclosed when the carrying amount is a reasonable approximation of fair value.
Type of financial instrument Valuation technique Carrying value (*2) Significant unobservable inputs RangeFinancial liabilitiesFinancial liabilities designated at fair value through profit or loss:
Equity related Option model(*1) ₩ 6,444,621 The volatility of the underlying asset, correlations
22.20%~28.48%15.43%~52.70%
Derivative liabilities:
Equity and foreign exchange related Option model(*1) 590,208 The volatility of the underlying asset, correlations
3.74%~79.81%(3.84)%~73.25%0.16%~32.94%
Interest rates related Option model(*1) 109,709 The volatility of the underlying asset, regression coefficient, correlations
0.02%~2.04%0%~100%
Credit and commodity related Option model(*1) 144,982 The volatility of the underlying asset, correlations
7.09~47.48%23.90%~100%
844,899₩ 7,289,520
(*1) Option model that the Group uses in derivative valuation includes Black-Scholes model, Hull-White model, Monte Carlo simulation, etc. (*2) Valuation techniques and inputs are not disclosed when the carrying amount is a reasonable approximation of fair value.

Shinhan Financial Group Annual Report 2015 128
Notes to the Consolidated Financial StatementsDecember 31, 2015 and 2014 (In millions of won)
- Sensitivity analysis for fair value measurements in Level 3
Although the Group believes that its estimates of fair value are appropriate, the use of different methodologies or assumptions could lead to different measurements of fair value.
For level 3 fair value measurement, changing one or more of the unobservable inputs used to reasonably possible alternative assumptions would have the following effects on profit or loss, or other comprehensive income as of December 31, 2015 and 2014.
2015Favorable changes Unfavorable changes
Financial assets:Effects on profit or loss for the period (*1):
Trading assets 64 (45)Financial assets designated at fair value through profit or loss 2,837 (4,416)Derivative assets 7,592 (11,254)
10,493 (15,715)Effects on other comprehensive income for the period:
Available-for-sale financial assets (*2) 90,343 (30,856)100,836 (46,571)
Financial liabilities:Effects on profit or loss for the period (*1):
Financial liabilities designated at fair value through profit or loss 64,089 (79,575)Derivative liabilities 87,885 (62,248)
151,974 (141,823)
2014Favorable changes Unfavorable changes
Financial assets:Effects on profit or loss for the period (*1):
Financial assets designated at fair value through profit or loss ₩ 2,691 (2,761)Derivative assets 25,759 (33,508)
28,450 (36,269)Effects on other comprehensive income for the period:
Available-for-sale financial assets (*2) 195,171 (69,090)₩ 223,621 (105,359)
Financial liabilities:Effects on profit or loss for the period (*1):
Financial liabilities designated at fair value through profit or loss ₩ 82,347 (81,191)Derivative liabilities 74,637 (76,587)
₩ 156,984 (157,778)
(*1) Fair value changes are calculated by increasing or decreasing the volatility of the underlying asset (-10~10%) or correlations (-10~10%). (*2) Fair value changes are calculated by increasing or decreasing discount rate (-1~1%) or growth rate (0~1%).

Financial Section 129Notes to Financial Statements
ii) Financial instruments measured at amortized cost - The method of measuring the fair value of financial instruments measured at amortized cost is as follows:
Type Measurement methods of fair valueCash and due from banks The carrying amount and the fair value for cash are identical and most of deposits are floating interest
rate deposits or next day deposits of a short-term instrument. For this reason, the carrying value ap-proximates fair value.
Loans The fair value of the loans is measured by discounting the expected cash flow at the market interest rate and credit risk, etc.
Held-to-maturity financial assets The fair value of held-to-maturity financial assets is determined by applying the lesser of two quoted bond prices provided by two bond pricing agencies as of the latest trading date
Deposits and borrowings The carrying amount and the fair value for demand deposits, cash management account deposits, call money as short-term instrument are identical. The fair value of others is measured by discounting the contractual cash flow at the market interest rate that takes into account the residual risk.
Debt securities issued The fair value of deposits and borrowings is based on the published price quotations in an active market. In case there is no data for an active market price, it is measured by discounting the contractual cash flow at the market interest rate that takes into account the residual risk.
- The carrying value and the fair value of financial instruments measured at amortized cost as of December 31, 2015 and 2014 are as follows:
2015 2014Carrying value Fair value Carrying value Fair value
Assets:Loans ₩ 246,441,361 249,182,868 221,617,689 223,965,124Held-to-maturity financial assets 16,192,060 17,489,238 13,373,384 14,231,320Other financial assets 11,878,420 11,907,777 10,151,338 10,204,666
₩ 274,511,841 278,579,883 245,142,411 248,401,110Liabilities:
Deposits ₩ 217,676,428 217,907,829 193,709,738 194,057,580Borrowings 21,733,865 21,799,206 22,973,767 23,097,742Debt securities issued 41,221,284 41,878,643 37,334,612 38,270,720Other financial liabilities 19,535,670 19,508,155 17,485,236 17,432,936
₩ 300,167,247 301,093,833 271,503,353 272,858,978

Shinhan Financial Group Annual Report 2015 130
Notes to the Consolidated Financial StatementsDecember 31, 2015 and 2014 (In millions of won)
- The fair value hierarchy of financial assets and liabilities which are not measured at their fair values in the statements of financial position as of Decem-ber 31, 2015 and 2014 are as follows:
2015Level 1 Level 2 Level 3 Total
Assets:Loans ₩ 27,038 1,577,960 247,577,870 249,182,868Held-to-maturity financial assets 6,360,572 11,128,666 - 17,489,238Other financial assets 25,165 7,669,816 4,212,796 11,907,777
₩ 6,412,775 20,376,442 251,790,666 278,579,883Liabilities:
Deposits ₩ 2,102,888 85,012,736 130,792,205 217,907,829Borrowings 5,499,951 273,026 16,026,229 21,799,206Debt securities issued in won - 27,375,939 14,502,704 41,878,643Other financial liabilities 25,803 7,488,938 11,993,414 19,508,155
₩ 7,628,642 120,150,639 173,314,552 301,093,833
2014Level 1 Level 2 Level 3 Total
Assets:Loans ₩ 29,569 2,959,108 220,976,447 223,965,124Held-to-maturity financial assets 5,135,924 9,095,396 - 14,231,320Other financial assets 16,544 5,841,425 4,346,697 10,204,666
₩ 5,182,037 17,895,929 225,323,144 248,401,110Liabilities:
Deposits ₩ 1,697,313 70,025,042 122,335,225 194,057,580Borrowings 7,542,900 1,793,101 13,761,741 23,097,742Debt securities issued in won - 23,667,234 14,603,486 38,270,720Other financial liabilities 17,520 5,189,079 12,226,337 17,432,936
₩ 9,257,733 100,674,456 162,926,789 272,858,978

Financial Section 131Notes to Financial Statements
- For financial instruments not measured at fair value in the statement of financial position but for which the fair value is disclosed, information on valu-ation technique and inputs used in measuring fair value of financial instruments classified as level 2 or level 3 at December 31, 2015 and 2014 are as follows:
2015Fair value (*2) Valuation
techniqueInputs
Financial instruments classified as level 2 :Assets
Loans ₩ 1,577,960 DCF(*1) Discount rate, credit spread, prepayment rate
Held-to-maturity financial assets 11,128,666 DCF(*1) Discount rateOther financial assets 7,669,816 DCF(*1) Discount rate
20,376,442Liabilities
Deposits 85,012,736 DCF(*1) Discount rateBorrowings 273,026 DCF(*1) Discount rateDebt securities issued 27,375,939 DCF(*1) Discount rateOther financial liabilities 7,488,938 DCF(*1) Discount rate
₩ 120,150,639Financial instruments classified as level 3 :Assets
Loans ₩ 247,577,870 DCF(*1) Discount rate, credit spread,prepayment rate
Other financial assets 4,212,796 DCF(*1) Discount rate251,790,666
LiabilitiesDeposits 130,792,205 DCF(*1) Discount rate Borrowings 16,026,229 DCF(*1) Discount rate
Debt securities issued 14,502,704 DCF(*1)Discount rate,
regression coefficient,correlation coefficient
Other financial liabilities 11,993,414 DCF(*1) Discount rate₩ 173,314,552
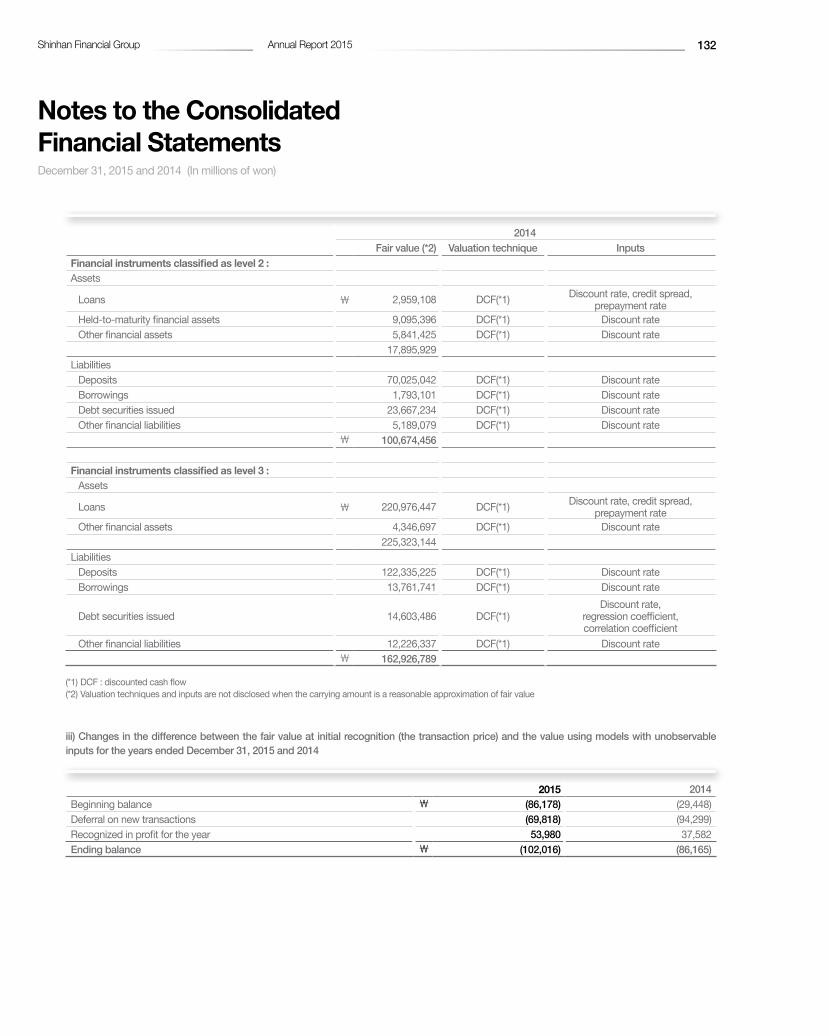
Notes to the Consolidated Financial StatementsDecember 31, 2015 and 2014 (In millions of won)
2014Fair value (*2) Valuation technique Inputs
Financial instruments classified as level 2 :Assets
Loans ₩ 2,959,108 DCF(*1) Discount rate, credit spread,prepayment rate
Held-to-maturity financial assets 9,095,396 DCF(*1) Discount rateOther financial assets 5,841,425 DCF(*1) Discount rate
17,895,929Liabilities
Deposits 70,025,042 DCF(*1) Discount rateBorrowings 1,793,101 DCF(*1) Discount rateDebt securities issued 23,667,234 DCF(*1) Discount rateOther financial liabilities 5,189,079 DCF(*1) Discount rate
₩ 100,674,456
Financial instruments classified as level 3 :Assets
Loans ₩ 220,976,447 DCF(*1) Discount rate, credit spread,prepayment rate
Other financial assets 4,346,697 DCF(*1) Discount rate225,323,144
LiabilitiesDeposits 122,335,225 DCF(*1) Discount rate Borrowings 13,761,741 DCF(*1) Discount rate
Debt securities issued 14,603,486 DCF(*1)Discount rate,
regression coefficient,correlation coefficient
Other financial liabilities 12,226,337 DCF(*1) Discount rate₩ 162,926,789
(*1) DCF : discounted cash flow (*2) Valuation techniques and inputs are not disclosed when the carrying amount is a reasonable approximation of fair value
iii) Changes in the difference between the fair value at initial recognition (the transaction price) and the value using models with unobservable inputs for the years ended December 31, 2015 and 2014
2015 2014Beginning balance ₩ (86,178) (29,448)Deferral on new transactions (69,818) (94,299)Recognized in profit for the year 53,980 37,582 Ending balance ₩ (102,016) (86,165)
Shinhan Financial Group Annual Report 2015 132

(f) Classification by categories of financial instruments Financial assets and liabilities are measured at fair value or amortized cost. The financial instruments measured at fair value or amortized cost are
measured in accordance with the Group’s valuation methodologies, which are described in Note 4.(e) Measurement of fair value.
The carrying amounts of each category of financial assets and financial liabilities as of December 31, 2015 and 2014 are as follows:
2015Trading assets
FVTPL assets (*1)
AFS (*2) HTM (*3) Loans and receivable
Derivatives held for hedging
Total
Assets:Cash and due from banks ₩ - - - - 22,024,404 - 22,024,404Trading assets 22,638,449 - - - - - 22,638,449 Financial assets designated at FVTPL (*1) - 3,244,166 - - - - 3,244,166
Derivatives 1,813,361 - - - - 181,353 1,994,714Loans - - - - 246,441,361 - 246,441,361AFS financial assets (*2) - - 33,966,071 - - - 33,966,071HTM financial assets (*3) - - - 16,192,060 - - 16,192,060Other - - - - 11,878,420 - 11,878,420
₩ 24,451,810 3,244,166 33,966,071 16,192,060 280,344,185 181,353 358,379,645
2015Trading
liabilitiesFVTPL
liabilities (*1)Financial liabilities
measured at amortized cost
Derivatives held for hedging
Total
Liabilities:Deposits ₩ - - 217,676,428 - 217,676,428Trading liabilities 2,135,390 - - - 2,135,390 Financial liabilities designated at FVTPL (*1) - 8,916,332 - - 8,916,332
Derivatives 2,415,170 - - 184,118 2,599,288Borrowings - - 21,733,865 - 21,733,865Debt securities issued - - 41,221,284 - 41,221,284Other - - 19,535,670 - 19,535,670
₩ 4,550,560 8,916,332 300,167,247 184,118 313,818,257
(*1) FVTPL : fair value through profit of loss (*2) AFS : available-for-sale (*3) HTM : held-to-maturity
Financial Section 133Notes to Financial Statements

Notes to the Consolidated Financial StatementsDecember 31, 2015 and 2014 (In millions of won)
2014Trading assets
FVTPL assets (*1)
AFS (*2) HTM (*3) Loans and receivable
Derivatives held for hedging
Total
Assets:Cash and due from banks ₩ - - - - 20,584,838 - 20,584,838Trading assets 24,362,176 - - - - - 24,362,176 Financial assets designated at FVTPL (*1) - 2,737,375 - - - - 2,737,375
Derivatives 1,411,168 - - - - 157,139 1,568,307Loans - - - - 221,617,689 - 221,617,689AFS financial assets (*2) - - 31,418,014 - - - 31,418,014HTM financial assets (*3) - - - 13,373,384 - - 13,373,384Other - - - - 10,151,338 - 10,151,338
₩ 25,773,344 2,737,375 31,418,014 13,373,384 252,353,865 157,139 325,813,121
2014Trading liabilities FVTPL liabilities
(*1)Financial liabilities
measured at amortized cost
Derivatives held for hedging
Total
Liabilities:Deposits ₩ - - 193,709,738 - 193,709,738Trading liabilities 2,688,734 - - - 2,688,734 Financial liabilities designated at FVTPL (*1) - 8,996,181 - - 8,996,181
Derivatives 1,596,400 - - 121,155 1,717,555Borrowings - - 22,973,767 - 22,973,767Debt securities issued - - 37,334,612 - 37,334,612Other - - 17,485,236 - 17,485,236
₩ 4,285,134 8,996,181 271,503,353 121,155 284,905,823
(*1) FVTPL : fair value through profit of loss (*2) AFS : available-for-sale (*3) HTM : held-to-maturity
(g) Transfer of financial instruments i) Transfers that do not qualify for derecognition - Bonds sold under repurchase agreements as of December 31, 2015 and 2014 are as follows:
2015 2014Transferred asset:
Financial assets at fair value through profit or loss ₩ 5,605,287 6,929,219 Available-for-sale financial assets 1,050,002 972,344 Held-to-maturity financial assets 497,786 375,396 Loans 270,100 158,673
Associated liabilities: Bonds sold under repurchase agreements ₩ 6,617,251 7,707,954
Shinhan Financial Group Annual Report 2015 134

- Securities loaned as of December 31, 2015 and 2014 are as follows:
2015 2014 Borrowers
Government bonds ₩ 36,786 491,931 Korea Securities Finance Corp., Mitsui Sumitomo and others
Financial institutions bonds 130,019 140,239 Korea Securities Finance Corp.Corporate bonds - 1,831 Mirae Asset Securities Co.,Ltd.
₩ 166,805 634,001
ii) Financial instruments qualified for derecognition and continued involvement There was no financial instruments which qualify for derecognition and in which the Group has continuing involvements as of December 31, 2015, and
2014. (h) Offsetting financial assets and financial liabilities Financial assets and liabilities subject to offsetting, enforceable master netting arrangements and similar agreements as of December 31, 2015 and
2014 are as follows:
2015Gross amounts
of recognized financial assets/
liabilities
Gross amounts of recognized
financial liabilities set off
in the statement of financial
position
Net amounts of financial assets
presented in the statement
of financial position
Related amounts not set off in the statement of financial position
Net amount
Financial instruments
Cash collateral received
Assets:Derivatives(*1) ₩ 1,903,714 - 1,903,714 6,977,154 10,361 2,285,289Other financial instruments(*1) 8,497,835 1,128,745 7,369,090 Bonds purchased under repur-chase agreements(*2) 12,957,346 - 12,957,346 12,431,670 - 525,676
Securities loaned(*2) 166,805 - 166,805 159,807 - 6,998 Domestic exchange settlement debit(*3) 27,408,941 25,036,860 2,372,081 18,939 - 2,353,142
Receivables from disposal of securities(*4) 2,117 523 1,594 - - 1,594
Insurance receivables 2,379 - 2,379 1,492 - 88750,939,137 26,166,128 24,773,009 19,589,062 10,361 5,173,586
Liabilities:Derivatives(*1) 2,715,265 - 2,715,265 7,009,512 - 1,000,226Other financial instruments(*1) 6,423,218 1,128,745 5,294,473 Bonds purchased under repur-chase agreements(*2) 6,617,251 - 6,617,251 6,617,251 - -
Securities borrowed(*2) 1,768,317 - 1,768,317 1,768,317 - - Domestic exchange settlement pending(*3) 27,245,592 25,036,860 2,208,732 2,165,161 - 43,571
Payable from purchase of securities(*4) 575 523 52 47 - 5
Insurance payables 1,492 - 1,492 1,492 - -₩ 44,771,710 26,166,128 18,605,582 17,561,780 - 1,043,802
Financial Section 135Notes to Financial Statements

Notes to the Consolidated Financial StatementsDecember 31, 2015 and 2014 (In millions of won)
2014Gross amounts
of recognized financial assets/
liabilities
Gross amounts of recognized
financial liabilities set off
in the statement of financial
position
Net amounts of financial assets
presented in the statement
of financial position
Related amounts not set off in the statement of financial position
Net amount
Financial instruments
Cash collateral received
Assets:Derivatives(*1) ₩ 1,513,338 - 1,513,338 5,006,936 25,044 920,259Other financial instruments(*1) 5,280,560 841,659 4,438,901 Bonds purchased under repur-chase agreements(*2) 11,071,542 - 11,071,542 10,510,942 - 560,600
Securities loaned(*2) 634,001 - 634,001 487,090 - 146,911 Domestic exchange settlement debit(*3) 24,624,335 22,524,299 2,100,036 3,561 - 2,096,475
Receivables from disposal of securities(*4) 4,648 316 4,332 4,332 - -
Insurance receivables 1,775 - 1,775 1,198 - 57743,130,199 23,366,274 19,763,925 16,014,059 25,044 3,742,822
Liabilities:Derivatives(*1) 1,845,449 - 1,845,449 4,978,480 - 711,744Other financial instruments(*1) 4,686,434 841,659 3,844,775 Bonds purchased under repur-chase agreements(*2) 7,707,954 - 7,707,954 7,707,954 - -
Securities borrowed(*2) 2,253,329 - 2,253,329 2,253,329 - - Domestic exchange settlement pending(*3) 24,010,268 22,524,299 1,485,969 1,449,106 - 36,863
Payable from purchase of securities(*4) 551 315 236 236 - -
Insurance payables 1,198 - 1,198 1,198 - -₩ 40,505,183 23,366,273 17,138,910 16,390,303 - 748,607
(*1) The Group has certain derivative transactions subject to the ISDA (International Swaps and Derivatives Association) agreement. According to the ISDA agreement, when credit events (e.g. default) of counterparties occur, all derivative agreements are terminated and set off.
(*2) Resale and repurchase agreement, securities borrowing and lending agreement are also similar to ISDA agreement with respect to enforceable netting agreements. (*3) The Group has legally enforceable right to set off and settles financial assets and liabilities on a net basis. Therefore, domestic exchanges settlement receivables (paya-
bles) are recorded on a net basis in the consolidated statements of financial position. (*4) Receivables and payables related to settlement of purchase and disposition of enlisted securities are offset and the net amount is presented in the consolidated state-
ment of financial position because the Group currently has a legally enforceable right to set off the recognized amounts and intends to settle on a net basis.
(i) Capital risk management The controlling company, controlling banks or other financial institutions conducting banking business as prescribed in the Financial Holding Company
Act, is required to maintain a minimum consolidated equity capital ratio of 8.0%. “Consolidated equity capital ratio” is defined as the ratio of equity capital as a percentage of risk-weighted assets on a consolidated basis, determined
in accordance with the Financial Services Commission requirements that have been formulated based on Bank of International Settlement standards. “Equity capital”, as applicable to bank holding companies, is defined as the sum of Common Equity Tier 1 capital (including common stock, share premium resulting from the issue of instruments included common equity Tier 1, retained earnings, etc.), Additional Tier 1 capital (with the minimum set of criteria for an instrument issued by the Group to meet, ie ‘perpetual’) and Tier 2 capital (to provide loss absorption on a gone-concern basis) less any deductible items (including goodwill, income tax assets, etc.), each as defined under the Regulation on the Supervision of Financial Holding Companies. “Risk-weighted assets” is defined as the sum of credit risk-weighted assets and market risk-weighted assets.
The capital adequacy ratio of the Group as of December 31, 2015 and 2014 are as follows:
Shinhan Financial Group Annual Report 2015 136

2015 2014Capital (A) ₩ 27,216,448 25,937,968Risk-weighted assets (B) 203,274,542 198,832,860BIS ratio (A/B) 13.39% 13.05%
As of December 31, 2015 and 2014, the Group met the regulatory capital ratio above 8%.
Shinhan Life Insurance measures and manages RBC (risk based capital) ratio according to the Regulation on Supervision of Insurance Business to maintain required capital for the solvency margin.
As of December 31, 2015 and 2014, the Group’s BIS capital ratio and Shinhan Life Insurance’s RBC ratio exceed the regulatory minimum ratios.
5. Significant estimate and judgment The preparation of consolidated financial statements requires the application of certain critical accounting and assumptions relative to the future. Manage-
ment’s estimate of the outcome may differ from an actual outcome if managements’ estimate and assumption based on its best judgment at the reporting date are different from an actual environment. The change in an accounting estimate is recognized prospectively in profit or loss in the year of the change, if the change affects that year only, or the year of the change and future years, if the change affects both.
(a) Goodwill The Group assesses annually whether any objective evidence of impairment on goodwill exists in accordance with the accounting policy as described
in note 3. The recoverable amount of an asset or cash-generating unit is the greater of its value in use and its fair value less costs to sell. Value in use is measured based on estimates.
(b) Income taxes The Group is subject to tax law from various countries. Within the normal business process, there are various types of transaction and different account-
ing method that may add uncertainties to the decision of the final income taxes. The Group has recognized current and deferred tax that reflect tax consequences that would follow from the manner in which the entity expects, at the end of the reporting year, to recover or settle the carrying amount of its assets and liabilities. However, actual income tax in the future may not be identical to the recognized deferred tax assets and liabilities, and this difference can affect current and deferred tax at the year when the final tax effect is conformed.
(c) Fair value of financial instruments The fair values of financial instruments which are not actively traded in the market are determined by using valuation techniques. The Group determines
valuation method and assumptions based on significant market conditions at the end of each reporting year. Diverse valuation techniques are used to determine the fair value of financial instruments, from general market accepted valuation model internally developed valuation model that incorporates various types of assumptions and variables.
(d) Allowances for loan losses, guarantees and unused loan commitments The Group determines and recognizes allowances for losses on loans through impairment testing and recognizes provision for guarantees and unused
loan commitments. The accuracy of provisions of credit losses is determined by the methodology and assumptions used for estimating expected cash flows of the borrower for allowances on individual loans and collectively assessing allowances for groups of loans, guarantees and unused loan com-mitments.
(e) Defined benefit obligation The present value of defined benefit obligation that is measured by actuarial valuation method uses various assumptions which can change according
to various elements. The rate used to discount post-employment benefit obligations is determined by reference to market yields at the end of the re-porting year on high quality corporate bonds. The currency and term of the corporate bonds are consistent with the currency and estimated term of the post-employment benefit obligations. Actuarial gains and losses including experience adjustments and the effects of changes in actuarial assumptions are recognized in other comprehensive income or loss. Other significant assumptions related to defined benefit obligation are based on current market situation.
Financial Section 137Notes to Financial Statements

Notes to the Consolidated Financial StatementsDecember 31, 2015 and 2014 (In millions of won)
(f) Impairment of available-for-sale equity investments When there is a significant or prolonged decline in the fair value of an investment in an equity instrument below its original cost, there is objective evi-
dence that available-for-sale equity investments are impaired. Accordingly, the Group considers the decline in the fair value of more than 30% against the original cost as “significant decline” and the status when the market price for marketable equity is less than the carrying amounts of instruments for six consecutive months as a “prolonged decline”.
(g) Hedging relationship The hedging instruments are expected to be “highly effective” in offsetting the changes in the fair value or cash flows of the respective hedged items
during the period. For a cash flow hedge of a forecasted transaction, the transaction should be highly probable to occur and should present an expo-sure to variations in cash flows that could ultimately affect reported net income.
6. Investment in subsidiaries
(a) Summarized financial information of the subsidiaries i) Condensed financial position for the controlling company and the Group’s subsidiaries as of December 31, 2015 and 2014 are as follows:
2015 2014Total assets Total liabilities Total equity Total assets Total liabilities Total equity
Shinhan Financial Group (Separate) ₩ 27,675,487 6,894,501 20,780,986 27,094,548 6,859,429 20,235,119
Shinhan Bank 285,007,437 264,168,084 20,839,353 255,646,329 235,169,429 20,476,900Shinhan Card Co., Ltd. 23,347,702 17,127,969 6,219,733 22,259,514 16,127,087 6,132,427Shinhan Investment Corp. 24,337,413 21,811,577 2,525,836 25,928,292 23,598,201 2,330,091Shinhan Life Insurance Co., Ltd. 24,544,624 22,963,260 1,581,364 21,939,682 20,463,749 1,475,933
Shinhan Capital Co., Ltd. 4,076,553 3,458,433 618,120 3,939,493 3,369,060 570,433Jeju Bank 4,464,601 4,146,580 318,021 3,475,694 3,170,213 305,481Shinhan Credit Information Co., Ltd. 23,889 8,632 15,257 23,040 8,420 14,620
Shinhan Private Equity 119,042 108,030 11,012 461,342 371,448 89,894Shinhan BNP Paribas AMC 170,164 15,356 154,808 188,886 32,429 156,457SHC Management Co., Ltd. 8,411 615 7,796 8,938 1,358 7,580Shinhan Data System 26,669 16,404 10,265 25,826 16,461 9,365Shinhan Savings Bank 795,144 675,435 119,709 804,035 689,550 114,485Shinhan Aitas Co., Ltd. 42,794 4,965 37,829 37,657 6,242 31,415
(*1) Condensed financial information of the subsidiaries is based on the consolidated financial information, if applicable. (*2) Subsidiaries such as trust, beneficiary certificate, corporate restructuring fund and private equity fund which are not actually operating their own business are excluded.
Shinhan Financial Group Annual Report 2015 138

ii) Condensed comprehensive income statement for the controlling company and the Group’s subsidiaries for years ended December 31, 2015 and 2014 were as follows:
2015 2014Operating
incomeNet income Total com-
prehensive income
Operating income
Net income Total com-prehensive
incomeShinhan Financial Group (separate) ₩ 1,201,949 893,041 893,328 1,061,540 662,623 660,754
Shinhan Bank 14,656,853 1,489,988 1,197,961 13,987,650 1,455,653 1,396,780Shinhan Card Co., Ltd. 4,740,139 694,774 629,164 4,596,758 635,151 547,666Shinhan Investment Corp. 4,734,162 215,454 225,342 3,295,109 118,235 104,390Shinhan Life Insurance Co., Ltd. 5,460,671 100,221 115,083 5,134,910 80,672 186,493
Shinhan Capital Co., Ltd. 380,867 46,081 52,754 328,077 51,945 55,591Jeju Bank 167,479 19,397 14,665 168,593 13,856 15,608Shinhan Credit Information Co., Ltd. 27,279 723 610 28,145 1,055 891
Shinhan Private Equity 373,577 6,401 6,602 332,861 8,327 7,579Shinhan BNP Paribas AMC 83,718 23,653 23,721 89,019 28,195 28,228SHC Management Co., Ltd. 287 215 215 558 482 482Shinhan Data System 73,096 1,046 871 69,136 2,647 1,188Shinhan Savings Bank 60,927 8,017 8,816 72,075 11,140 14,758Shinhan Aitas Co., Ltd. 32,949 6,415 6,415 28,515 3,988 3,988
(*1) Condensed financial information of the subsidiaries is based on the consolidated financial information, if applicable. (*2) Subsidiaries such as trust, beneficiary certificate, corporate restructuring fund and private equity fund which are not actually operating their own business are excluded.
(b) Change in subsidiaries i) The subsidiaries that were newly included in consolidation during the year ended December 31, 2015 are as follows:
Company DescriptionBanco Shinhan de Mexico Newly established subsidiaryPT Bank Metro Express AcquisitionPT Centratama Nasional Bank AcquisitionNam An Securities Co. Ltd. AcquisitionPT. Shinhan Indo Finance Acquisition
ii) The subsidiary that was newly included in consolidation during the year ended December 31, 2014 is as follows:
Company DescriptionLLP MFO Shinhan Finance Newly established subsidiary
Subsidiaries such as trust, beneficiary certificate, corporate restructuring fund and private equity fund which are not actually operating their own busi-ness are excluded.
Financial Section 139Notes to Financial Statements

Notes to the Consolidated Financial StatementsDecember 31, 2015 and 2014 (In millions of won)
7. Operating segments
(a) Segment information The general descriptions by operating segments as of December 31, 2015 are as follows:
Segment DescriptionBanking (*) Banking and related businessCredit card Credit card business Securities Securities trading, underwriting and brokerage servicesLife insurance Life insurance and related businessOthers Leasing, assets management and other businesses
(*) The Group previously disclosed the Banking segment by subdividing into four segments, which are Retail Baking, Corporate Banking, International Banking and Other Banking. Due to the substantial changes in internal organization of the Group’s Banking segments including the increasing trends of identification among retail branches and corporate branches along with expansion of hybrid branches, the Group’s internal reporting documents for the Group’s Chief Operating Decision Maker does not present the previous four segments under Banking segment any more. As such, the Group determined to re-define its four pre-existing operating segments within the Banking segments as one single Banking segment, and disclosed it accordingly.
(b) The following tables provide information of income and expense for each operating segment for the years ended December 31, 2015 and 2014.
2015Banking Credit card Securities Life insurance Others Consolidation
adjustmentTotal
Net interest income (loss) ₩ 4,246,146 1,350,968 444,271 675,760 (32,274) 8,062 6,692,933Net fees and commission income (loss) 866,597 255,966 266,529 32,232 194,530 5,125 1,620,979
Other income (expense), net (3,353,601) (748,996) (448,840) (576,370) (195,323) (17,641) (5,340,771)Operating income 1,759,142 857,938 261,960 131,622 (33,067) (4,454) 2,973,141Equity method income (loss) 13,399 - 1,478 (277) 5,601 770 20,971Income tax expense (benefit) 390,547 183,297 62,668 32,356 28,519 (2,768) 694,619Profit (loss) for the period ₩ 1,509,385 694,774 215,454 100,221 (59,454) (14,422) 2,445,958Controlling interest ₩ 1,509,051 694,774 215,454 100,221 (66,492) (85,837) 2,367,171Non-controlling interests 334 - - - 7,038 71,415 78,787
2014Banking Credit card Securities Life insurance Others Consolidation
adjustmentTotal
Net interest income (loss) ₩ 4,446,554 1,372,965 386,071 651,109 (70,296) 3,397 6,789,800Net fees and commission income (loss) 815,839 256,809 197,747 27,365 185,859 (14,461) 1,469,158
Other income (expense), net (3,447,434) (836,871) (450,806) (560,331) (194,159) (114,547) (5,604,148)Operating income 1,814,959 792,903 133,012 118,143 (78,596) (125,611) 2,654,810Equity method income 11,808 - 10,943 5 6,266 1,558 30,580Income tax expense (benefit) 384,089 186,886 39,035 31,395 24,407 2,153 667,965Profit (loss) for the period ₩ 1,469,510 635,151 118,235 80,672 (14,594) (89,363) 2,199,611Controlling interest ₩ 1,469,080 635,151 118,235 80,672 (22,325) (199,703) 2,081,110Non-controlling interests 430 - - - 7,731 110,340 118,501
Shinhan Financial Group Annual Report 2015 140

(c) The following tables provide information of net interest income of each operating segment for the years ended December 31, 2015 and 2014.
2015Banking Credit card Securities Life insurance Others Consolidation
adjustmentTotal
Net interest income from:External customers ₩ 4,253,559 1,390,469 450,019 674,708 (75,822) - 6,692,933Internal transactions (7,413) (39,501) (5,748) 1,052 43,548 8,062 -
₩ 4,246,146 1,350,968 444,271 675,760 (32,274) 8,062 6,692,933
2014Banking Credit card Securities Life insurance Others Consolidation
adjustmentTotal
Net interest income from:External customers ₩ 4,453,340 1,408,923 393,529 648,313 (114,305) - 6,789,800Internal transactions (6,786) (35,958) (7,458) 2,796 44,009 3,397 -
₩ 4,446,554 1,372,965 386,071 651,109 (70,296) 3,397 6,789,800
(d) Financial information of geographical area The following table provides information of income from external consumers by geographical area for the years ended December 31, 2015 and 2014.
2015 2014Domestic ₩ 2,727,862 2,489,006 Overseas 245,279 165,804
₩ 2,973,141 2,654,810
The following table provides information of non-current assets by geographical area as of December 31, 2015 and 2014.
2015 2014Domestic ₩ 7,397,788 7,513,214 Overseas 124,302 54,413
₩ 7,522,090 7,567,627
(*) Non-current assets comprise property and equipment, intangible assets, investment properties.
Financial Section 141Notes to Financial Statements

Notes to the Consolidated Financial StatementsDecember 31, 2015 and 2014 (In millions of won)
8. Cash and due from banks
(a) Cash and due from banks as of December 31, 2015 and 2014 are as follows:
2015 2014Cash and cash equivalents ₩ 1,957,535 2,522,791Deposits in won:
Reserve deposits 7,876,559 5,755,317Time deposits 2,354,186 2,644,390Certificate of deposits 29,801 -Other 2,981,241 4,019,905
13,241,787 12,419,612Deposits in foreign currency:
Deposits 3,217,974 2,540,592 Time deposits 3,058,776 2,577,682 Other 561,165 547,836
6,837,915 5,666,110
Allowance for credit losses (12,833) (23,675)₩ 22,024,404 20,584,838
(b) Restricted due from banks as of December 31, 2015 and 2014 are as follows:
2015 2014Deposits denominated in won:
Reserve deposits ₩ 7,876,559 5,755,317 Other (*) 3,108,270 3,842,219
10,984,829 9,597,536 Deposits denominated in foreign currency 1,854,514 666,620
₩ 12,839,343 10,264,156
(*) Pursuant to the Regulation on Financial Investment Business, the Group is required to deposit certain portions of customers’ deposits with the Korean Securities Finance Corporation (“KSFC”) or banks to ensure repayment of customer deposits and the deposits may not be pledged as collateral.
Shinhan Financial Group Annual Report 2015 142

9. Trading assets Trading assets as of December 31, 2015 and 2014 are as follows:
2015 2014Debt securities:
Governments ₩ 3,259,925 2,045,124Financial institutions 6,776,284 8,302,174Corporations 4,128,561 5,769,659Commercial Papers 3,524,629 3,790,597CMA(*) 1,572,270 1,197,304Others 184,517 171,540
19,446,186 21,276,398Equity securities:
Stocks 890,901 1,011,012Beneficiary certificates 2,102,134 1,812,208Others 50,008 38,002
3,043,043 2,861,222Other
Gold deposits 149,220 224,556₩ 22,638,449 24,362,176
(*) CMA: Cash management account deposits
10. Financial asset designated at fair value through profit or loss Financial assets designated at fair value through profit or loss as of December 31, 2015 and 2014 are as follows:
2015 2014 Reason for designation
Debt securities ₩ 1,879,521 1,419,343 Evaluation and management on a fair value basis, accounting mismatch
Equity securities (*) 915,147 791,175Evaluation and management on a fair value basis, accounting mismatch
Others 449,498 526,857 Combined instrument₩ 3,244,166 2,737,375
(*) Restricted reserve for claims of customers’ deposits (trusts) as of December 31, 2015 and 2014 are ₩784,596 million and ₩630,537 million, respectively.
Financial Section 143Notes to Financial Statements
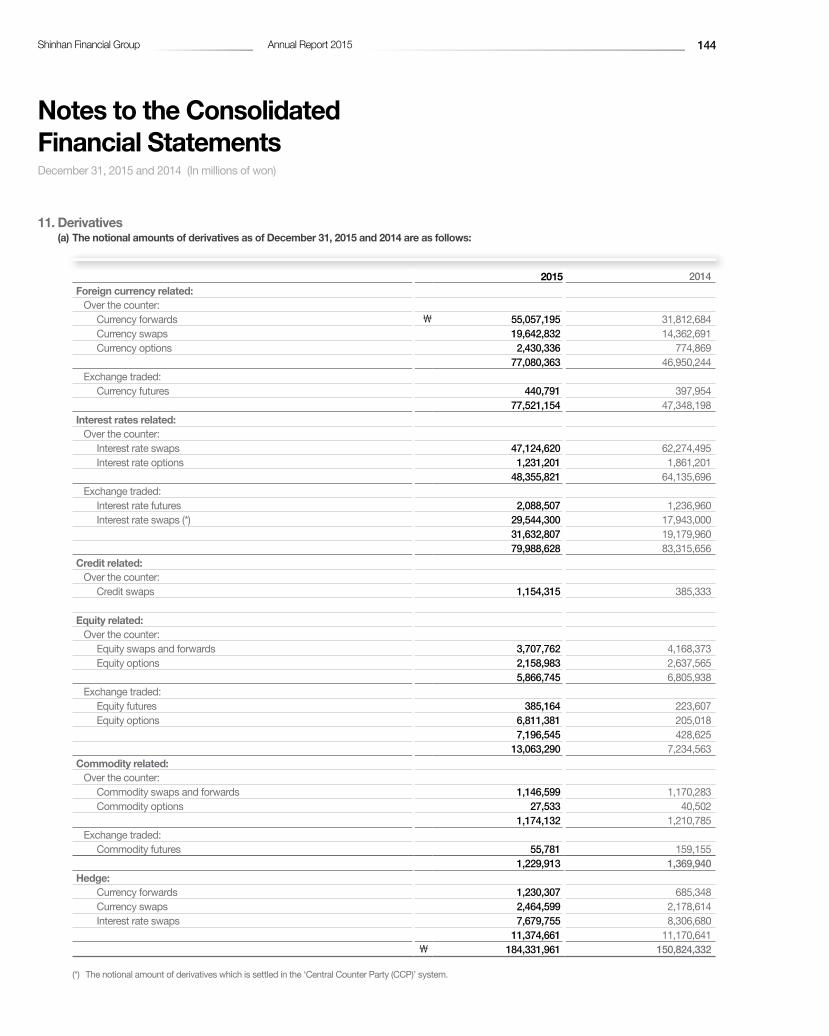
Notes to the Consolidated Financial StatementsDecember 31, 2015 and 2014 (In millions of won)
11. Derivatives (a) The notional amounts of derivatives as of December 31, 2015 and 2014 are as follows:
2015 2014 Foreign currency related:
Over the counter: Currency forwards ₩ 55,057,195 31,812,684 Currency swaps 19,642,832 14,362,691 Currency options 2,430,336 774,869
77,080,363 46,950,244Exchange traded: Currency futures 440,791 397,954
77,521,154 47,348,198Interest rates related:
Over the counter: Interest rate swaps 47,124,620 62,274,495 Interest rate options 1,231,201 1,861,201
48,355,821 64,135,696Exchange traded: Interest rate futures 2,088,507 1,236,960 Interest rate swaps (*) 29,544,300 17,943,000
31,632,807 19,179,96079,988,628 83,315,656
Credit related:Over the counter: Credit swaps 1,154,315 385,333
Equity related:Over the counter: Equity swaps and forwards 3,707,762 4,168,373 Equity options 2,158,983 2,637,565
5,866,745 6,805,938Exchange traded: Equity futures 385,164 223,607 Equity options 6,811,381 205,018
7,196,545 428,62513,063,290 7,234,563
Commodity related:Over the counter: Commodity swaps and forwards 1,146,599 1,170,283 Commodity options 27,533 40,502 1,174,132 1,210,785Exchange traded: Commodity futures 55,781 159,155
1,229,913 1,369,940Hedge:
Currency forwards 1,230,307 685,348 Currency swaps 2,464,599 2,178,614 Interest rate swaps 7,679,755 8,306,680
11,374,661 11,170,641₩ 184,331,961 150,824,332
(*) The notional amount of derivatives which is settled in the ‘Central Counter Party (CCP)’ system.
Shinhan Financial Group Annual Report 2015 144

(b) Fair values of derivative instruments as of December 31, 2015 and 2014 are as follows:
2015 2014Assets Liabilities Assets Liabilities
Foreign currency related:Over the counter: Currency forwards ₩ 806,785 607,632 440,089 509,555 Currency swaps 395,474 534,958 247,236 272,584 Currency options 18,030 10,652 4,440 5,048
1,220,289 1,153,242 691,765 787,187Exchange traded: Currency futures - - 175 -
1,220,289 1,153,242 691,940 787,187Interest rates related:
Over the counter: Interest rate swaps 474,447 471,488 564,432 509,140 Interest rate options 10,479 11,932 10,147 16,614
484,926 483,420 574,579 525,754Exchange traded: Interest rate futures 192 27 213 45
485,118 483,447 574,792 525,799Credit related:
Over the counter: Credit swaps 14,568 20,466 1,640 15,484
Equity related:Over the counter: Equity swap and forwards 17,806 518,812 59,440 (17,352) Equity options 60,184 75,643 64,626 145,608
77,990 594,455 124,066 128,256Exchange traded: Equity futures 18 905 201 258 Equity options 4,299 7,977 2,540 104
4,317 8,882 2,741 36282,307 603,337 126,807 128,618
Commodity related:Over the counter: Commodity swaps and forwards 10,164 154,465 12,663 134,400 Commodity options 543 - 1,814 3 10,707 154,465 14,477 134,403Exchange traded: Commodity futures 372 213 1,512 4,909
11,079 154,678 15,989 139,312Hedge:
Currency forwards 4,925 34,631 1,127 19,712 Currency swaps 123,706 23,094 38,997 50,788 Interest rate swaps 52,722 126,393 117,015 50,655
181,353 184,118 157,139 121,155₩ 1,994,714 2,599,288 1,568,307 1,717,555
Financial Section 145Notes to Financial Statements

Notes to the Consolidated Financial StatementsDecember 31, 2015 and 2014 (In millions of won)
(c) Gain or loss on valuation of derivatives for the years ended December 31, 2015 and 2014 are as follows:
2015 2014 Foreign currency related
Over the counter Currency forwards ₩ 142,086 (71,396) Currency swaps (132,226) (74,327) Currency options 10,540 582
20,400 (145,141)Exchange traded Currency futures (272) 176
20,128 (144,965)Interest rates related
Over the counter Interest rate swaps (65,444) (35,782) Interest rate options (185) (668)
(65,629) (36,450)Exchange traded Interest rate futures 144 168
(65,485) (36,282)Credit related
Over the counter Credit swaps 748 (11,216)
Equity relatedOver the counter Equity swap and forwards (653,231) 62,852 Equity options 5,470 (1,925)
(647,761) 60,927Exchange traded Equity futures 613 2,748 Equity options (2,218) 477
(1,605) 3,225(649,366) 64,152
Commodity relatedOver the counter Commodity swaps and forwards (106,976) (112,485) Commodity options (457) (196) (107,433) (112,681)Exchange traded Commodity futures (2,582) (5,527)
(110,015) (118,208)Hedge
Currency forwards (27,339) (13,470) Currency swaps 97,576 58,444 Interest rate swaps (120,396) 148,048
(50,159) 193,022₩ (854,149) (53,497)
Shinhan Financial Group Annual Report 2015 146

(d) Gain or loss on fair value hedges for the years ended December 31, 2015 and 2014 are as follows:
2015 2014Hedged item ₩ 211,951 (133,761)Hedging instruments (206,925) 145,560
₩ 5,026 11,799
(e) Hedge of net investment in foreign operations Hedge accounting is applied for a portion of net investments in foreign operations. Foreign currency translation adjustments for foreign operation by
each hedging instrument for the years ended December 31, 2015 and 2014 are as follows:
2015 2014Borrowings in foreign currency ₩ (17,492) (2,066)Debt securities issued in foreign currency (14,005) 22,820 Currency forwards (2,368) (5,133)
₩ (33,865) 15,621
12. Loans
(a) Loans as of December 31, 2015 and 2014 are as follows:
2015 2014Household loans ₩ 96,017,634 84,929,702Corporate loans 127,026,825 113,989,749Public and other 2,194,277 2,135,127Loans to banks 4,653,229 4,683,996Card receivables 18,537,001 18,140,810
248,428,966 223,879,384Discount (26,806) (37,458)Deferred loan origination costs and fees 357,617 276,627
248,759,777 224,118,553Allowance for credit losses (2,318,416) (2,500,864)
₩ 246,441,361 221,617,689
Financial Section 147Notes to Financial Statements

Notes to the Consolidated Financial StatementsDecember 31, 2015 and 2014 (In millions of won)
(b) Changes in the allowance for credit losses for the years ended December 31, 2015 and 2014 are as follows:
2015Loans Other (*2) Total
Household Corporate Credit Card Other SubtotalBeginning balance ₩ 247,337 1,509,062 721,848 22,618 2,500,865 118,353 2,619,218Provision for (reversal of) allowance 122,009 602,141 300,363 (2,802) 1,021,711 - 1,021,711
Write-offs (122,796) (701,970) (488,660) (66) (1,313,492) (18,850) (1,332,342)Effect of discounting (*1) (253) (30,499) 2,482 - (28,270) - (28,270)Allowance related to loans sold (4,447) (57,985) (34,157) (1,911) (98,500) - (98,500)Recoveries 26,527 88,944 171,253 85 286,809 4,013 290,822Others (*3) (1,613) (51,204) 2,110 - (50,707) (23,677) (74,384)Ending balance ₩ 266,764 1,358,489 675,239 17,924 2,318,416 79,839 2,398,255
2014Loans Other (*2) Total
Household Corporate Credit Card Other SubtotalBeginning balance ₩ 223,528 1,589,990 647,818 15,115 2,476,451 98,617 2,575,068Provision for (reversal of) allowance 163,470 346,803 387,499 (3,050) 894,722 49,706 944,428
Write-offs (150,381) (459,018) (497,538) (206) (1,107,143) (33,742) (1,140,885)Effect of discounting (*1) (220) (41,700) (354) - (42,274) - (42,274)Allowance related to loans sold (5,252) (30,291) (2,255) (4) (37,802) - (37,802)Recoveries 18,883 178,970 181,882 10,763 390,498 4,216 394,714Others (*3) (2,691) (75,692) 4,796 - (73,587) (444) (74,031)Ending balance ₩ 247,337 1,509,062 721,848 22,618 2,500,865 118,353 2,619,218
(*1) Interest income from impaired financial assets (*2) Included allowance for due from banks and other assets (*3) Other changes were due to debt restructuring, debt-equity swap, and foreign exchange rate, etc.
(c) Changes in deferred loan origination costs and fees for the years ended December 31, 2015 and 2014 are as follows:
2015 2014Beginning balance ₩ 276,627 251,249 Loan originations 223,768 179,784 Amortization (142,778) (154,406)Ending balance ₩ 357,617 276,627
Shinhan Financial Group Annual Report 2015 148

13. Available-for-sale financial assets and held-to-maturity financial assets
(a) Available-for-sale financial assets and held-to-maturity financial assets as of December 31, 2015 and 2014 are as follows:
2015 2014 Available-for-sale financial assets:Debt securities :
Government bonds ₩ 4,281,803 4,007,317 Financial institution bonds 15,594,417 11,922,184 Corporate bonds and others 9,161,420 10,926,161
29,037,640 26,855,662Equity securities (*1):
Stocks 2,113,724 2,416,482 Equity investments 623,465 614,566 Beneficiary certificates 2,118,743 1,427,387 Others 72,499 103,917
4,928,431 4,562,35233,966,071 31,418,014
Held-to-maturity financial assets:Debt securities:
Government bonds 9,528,795 7,794,704 Financial institutions bonds 1,263,688 1,573,869 Corporate bonds 5,399,577 4,004,811
16,192,060 13,373,384₩ 50,158,131 44,791,398
(*1) Equity securities with no quoted market prices in active markets and for which the fair value cannot be measured reliably are recorded at cost were ₩123,670 million and ₩110,425 million as of December 31, 2015 and 2014, respectively.
(b) Gain or loss on sale of available-for-sale financial assets for the years ended December 31, 2015 and 2014 were as follows:
2015 2014Gain on disposal of available-for-sale financial assets ₩ 827,968 721,736 Loss on disposal of available-for-sale financial assets (55,494) (40,805)
₩ 772,474 680,931
Financial Section 149Notes to Financial Statements

Notes to the Consolidated Financial StatementsDecember 31, 2015 and 2014 (In millions of won)
14. Property and equipment, net
(a) Property and equipment as of December 31, 2015 and 2014 are as follows:
2015Acquisition cost Accumulated
depreciationAccumulated
impairment lossesCarrying amount
Land ₩ 1,780,970 - - 1,780,970Buildings 1,114,844 (190,543) - 924,301Other 1,924,400 (1,591,194) - 333,206
₩ 4,820,214 (1,781,737) - 3,038,477
2014Acquisition cost Accumulated
depreciationAccumulated
impairment lossesCarrying amount
Land ₩ 1,789,410 - - 1,789,410 Buildings 1,115,070 (162,346) - 952,724 Other 2,012,103 (1,606,982) - 405,121
₩ 4,916,583 (1,769,328) - 3,147,255
(b) Changes in property and equipment for the years ended December 31, 2015 and 2014 are as follows:
2015Land Buildings Other Total
Beginning balance ₩ 1,789,410 952,724 405,121 3,147,255Acquisitions (*1) 5,631 26,266 138,453 170,350Disposals (934) (1,016) (6,077) (8,027)Depreciation - (35,910) (158,018) (193,928)Amounts transferred from (to) investment property 2,526 596 - 3,122
Effects of foreign currency movements (15,663) (18,359) (46,273) (80,295)Ending balance ₩ 1,780,970 924,301 333,206 3,038,477
(*1) ₩ 3,255 million of buildings increased by transfers from construction-in-progress. (*2) Comprise land and buildings, etc.
2014Land Buildings Other Total
Beginning balance ₩ 1,798,444 975,554 440,305 3,214,303Acquisitions (*1) 590 28,061 156,625 185,276Disposals (101) (2,656) (24,260) (27,017)Depreciation - (35,060) (165,751) (200,811)Amounts transferred to investment property (12,432) (14,319) - (26,751)Amounts transferred from assets held for sale (*2) 2,891 305 - 3,196Others - - 378 378Effects of foreign currency movements 18 839 (2,176) (1,319)Ending balance ₩ 1,789,410 952,724 405,121 3,147,255
(*1) W4,054 million of buildings increased by transfers from construction-in-progress. (*2) Comprise land and buildings, etc.
Shinhan Financial Group Annual Report 2015 150

(c) Insured assets as of December 31, 2015 are as follows:
Type of insurance Assets insured Amount covered Insurance companyComprehensive insurance for financial institution
Cash and cash equivalent(Including ATM) ₩ 22,700
Samsung Fire & Marine Insurance Co.,Ltd. and 9 other entities
Package insuranceGeneral asset risk
1,244,704 Samsung Fire & Marine Insurance Co.,Ltd. and 5 other entities
Fire insuranceFurniture and fixtures
18,524 Hyundai Marine & Fire Insurance Co.,Ltd. and 2 other entities
Directors’ and officers’insurance Directors’ and officers’ liabilities 50,000 MERITZ Fire & Marine Insurance Co.,Ltd.Employee accident insurance Employees 17,700 Dongbu Fire & Marine Insurance Co.,Ltd.
OthersCash, Securities, Fidelity guarantee, and liability insurance 82,380
Seoul Guarantee Insurance Co.,Ltd. And Dongbu Fire & Marine Insurance Co.,Ltd.
₩ 1,436,008
15. Intangible assets, net
(a) Intangible assets as of December 31, 2015 and 2014 are as follows:
2015 2014Goodwill ₩ 3,881,345 3,824,646 Software 93,914 70,708 Development cost 66,843 61,665 Other 232,794 195,824
₩ 4,274,896 4,152,843
(b) Changes in intangible assets for the years ended December 31, 2015 and 2014 are as follows:
2015Goodwill Software Develop-
ment costOther Total
Beginning balance ₩ 3,824,646 70,708 61,665 195,824 4,152,843Acquisitions - 59,727 37,022 95,041 191,790Business combination 59,106 127 1,517 42 60,792Disposals - (1) - (8,640) (8,641)Impairment (*1) - - - (2,143) (2,143)Amortization (*2) - (34,851) (32,773) (46,990) (114,614)Effects of foreign currency movements (2,407) (1,796) (588) (340) (5,131)Ending balance ₩ 3,881,345 93,914 66,843 232,794 4,274,896
Financial Section 151Notes to Financial Statements

Notes to the Consolidated Financial StatementsDecember 31, 2015 and 2014 (In millions of won)
2014Goodwill Software Develop-
ment costOther Total
Beginning balance ₩ 3,835,141 74,622 87,168 229,447 4,226,378Acquisitions - 23,099 9,404 29,717 62,220Disposals - - - (10,960) (10,960)Impairment (*1) (10,493) - - (1,965) (12,458)Amortization (*2) - (27,480) (34,784) (49,891) (112,155)Effects of foreign currency movements (2) 467 29 (531) (37)Others - - (152) 7 (145)Ending balance ₩ 3,824,646 70,708 61,665 195,824 4,152,843
(*1) The Group recognized impairment losses from golf and condo memberships with indefinite useful lives by comparing recoverable amounts with carrying amounts. (*2) The Group recognized amortization of intangible asset in general and administrative expenses and net other operating expense.
(c) Goodwill i) Goodwill allocated in the Group’s CGUs as of December 31, 2015 and 2014
2015 2014Banking (*) ₩ 879,564 824,526Credit card 2,688,238 2,685,389Securities 1,218 -Life insurance 275,371 275,370Others 36,954 39,361
₩ 3,881,345 3,824,646
(*) Due to structural changes in the Group’s Banking segments and relevant changes in reporting structure submitted to the Group CODM, the Group determined to re-define its four pre-existing operating segments (Retail Banking, Corporate Banking, International Banking, and Other Banking) within the Banking segments as one single Banking segment, and also determined to re-define the group of CGUs at Shinhan Bank as one single group of CGUs. As such, goodwill impairment test was performed based on the level of re-defined group of CGUs as of December 31, 2015.
ii) Changes in goodwill for the years ended December 31, 2015 and 2014
2015 2014Beginning balance ₩ 3,824,646 3,835,141Acquisitions through business combinations 59,106 -Disposal (2,407) -Impairment loss(*) - (10,493)Other - (2)Ending balance ₩ 3,881,345 3,824,646
(*) The impairment loss during the year ended December 31, 2014 was recognized in ‘Others CGU’.
iii) Goodwill impairment test The recoverable amounts of each CGU were evaluated based on their respective value in use.
Shinhan Financial Group Annual Report 2015 152

- Explanation on evaluation method The income approach was applied when evaluating the recoverable amounts based on value in use, considering the characteristics of each unit or group of CGU.
- Projection period When evaluating the value in use, 5.5 year of cash flow estimates – July 31, 2014 through December 31, 2019 – was used in projection and the value thereafter was reflected as terminal value. In case of Shinhan Life Insurance, only the 30 years of future cash flows were applied since the present value of the future cash flows thereafter is not significant.
- Discount rates and terminal growth rates The required rates of return expected by shareholders were applied to the discount rates by calculating the cost of capital which comprises a risk-free interest rate, a market risk premium and systemic risk (beta factor). Expected terminal growth rate is on the basis of inflation rates.
Discount rates and terminal growth rates applied to each CGU are as follows:
Discount rates Terminal growth rateBanking 9.82% 2.16%Credit card 8.39% 2.16%Securities 14.12% 0.00%Life insurance 10.00% 0.00%Others 9.82% 2.16%
iv) Key assumptions Key assumptions used in the discounted cash flow calculations of CGUs (other than Shinhan Life Insurance) are as follows:
2015 2016 2017 2018 2019 and thereafterCPI growth 0.5% 0.7% 2.2% 2.4% 2.7%Real retail sales growth 0.9% 4.4% 4.0% 3.4% 2.3%Real GDP growth 2.3% 3.5% 3.6% 3.3% 3.2%
Key assumptions used in the discounted cash flow calculations of Shinhan Life Insurance are as follows:
Key assumptionsRate of return on investment 4.22%Risk-based capital ratio 250.93%
v) Total recoverable amount and total carrying value of CGUs to which goodwill has been allocated
AmountTotal recoverable amount ₩ 38,664,548Total carrying value 35,103,579
₩ 3,560,969
Financial Section 153Notes to Financial Statements

Notes to the Consolidated Financial StatementsDecember 31, 2015 and 2014 (In millions of won)
16. Investments in associates
(a) Investments in associates as of December 31, 2015 and 2014 are as follows:
Investees Country Reporting date Ownership (%)2015 2014
BNP Paribas Cardif Life Insurance (*1),(*3) Korea September 30 14.99 14.99Aju Capital Co., Ltd. (*1),(*2) 〃 〃 12.85 12.85UAMCO., Ltd. (*2) 〃 December 31 17.50 17.50Pohang TechnoPark 2PFV (*2) 〃 〃 14.90 14.90Daewontos Co., Ltd. (*1),(*6) 〃 September 30 36.33 36.33Inhee Co., Ltd. (*1),(*2),(*6) 〃 〃 15.36 15.36DAEGY Electrical Construction Co.,Ltd.(*1)(*6) 〃 〃 27.45 27.45Kukdong Engineering & Construction Co., LTD. (*1)(*2)(*6) 〃 〃 14.30 14.30YEONWOONG SYSTEM (*1)(*6) 〃 〃 21.77 -DOODOO LOGITECH (*1)(*6) 〃 〃 27.96 -Neoplux Technology Valuation Investment Fund (*1) 〃 〃 33.33 -EQP Global Energy Infrastructure Private Equity Fund (*1) 〃 〃 22.64 -JAEYOUNG SOLUTEC CO.,LTD. (*1)(*8) 〃 〃 11.90 -Partners 4th Growth Investment Fund (*7) 〃 October 31 25.00 -PSA 1st Fintech Private Equity Fund (*7) 〃 December 31 20.00 -SHC-IMM New Growth Fund (*5) 〃 〃 64.52 64.52QCP New Technology Fund 20th 〃 〃 47.17 47.17Miraeasset 3rd Investment Fund 〃 〃 - 50.00STI New Growth Engine Investment Fund 〃 〃 50.00 50.00Shinhan K2 Secondary Fund (*4) 〃 〃 10.75 10.75TS2013-6 M&A Investment Fund 〃 〃 25.00 25.00KDB Daewoo Ruby PEF 〃 〃 - 20.00Dream High Fund (*5) 〃 〃 54.55 54.55Haejin Shipping Co., Ltd. Hong Kong 〃 24.00 24.00SHC-EN Fund Korea 〃 43.48 43.48SP New Technology Business investment FundⅠ 〃 〃 23.26 23.26Albatross Growth Fund 〃 〃 36.36 36.36Asia Pacific No.39 Ship Investment Co., Ltd. 〃 〃 50.00 -Midas Dong-A Snowball Venture Fund (*5) 〃 〃 53.33 -IBKS-Shinhan Creative Economy New Technology Fund (*4) 〃 〃 5.00 -SH Rental Service 〃 〃 20.00 -SM New Technology Business Investment FundⅠ 〃 〃 36.36AJU-SHC WIN-WIN COMPANY FUND 4 〃 〃 21.98 -APC Fund Cayman Islands 〃 25.18 25.18BNH-CJ Bio Healthcare Fund Korea 〃 26.67 25.00Korea Investment Gong-pyeong Office Real Estate Investment Trust 2nd
〃 〃 50.00 50.00
Arkone Asia Access Offshore Feeder Fund Limited Cayman Islands 〃 - 23.64Shinhan Praxis K-Growth Global Private Equity Fund (*4) Korea 〃 18.87 -BNPParibas Cardif General Insurance (*1)(*2) 〃 September 30 10.00 10.00SHBNPP Private Korea Equity Long-Short Professional Feeder 〃 December 31 29.24 -Shinhan-Stonebridge Petro PEF (*4) 〃 〃 1.82 1.82
Shinhan Financial Group Annual Report 2015 154

(*1) Financial statements as of September 30, 2015 were used for the equity method since the Group could not have the financial statements as of December 31, 2015. Significant trades and events occurred within the period were properly reflected.
(*2) The Group applies the equity method accounting as the Group has a significant influence on the financial and operating policies of the investee through electing inves-tees’ board members and presenting in decision making bodies of the investee.
(*3) The Group can have a significant influence on the investees through important business transactions. (*4) As a managing partner, the Group can have a significant influence over the investees. (*5) As a limited partner, the Group does not have ability to participate in policy-making processes to obtain economic benefit from the investees that would allow the Group
to control the entity. (*6) The shares of the investees were acquired by debt-equity swap. The Group reclassified available-for-sale financial assets to investments in associates as the reorgani-
zation procedures were completed and now the Group can normally exercise its voting rights to the investees. (*7) Financial statements at the point of establishment were used for the equity method. (*8) Although the ownership interests in JAEYOUNG SOLUTEC CO., LTD. were less than 15%, the Group used the equity method as the Group has significant influence
on the entity’s financial and operating policy decisions.
(b) Changes in investments in associates for the years ended December 31, 2015 and 2014 were as follows:
Investees 2015Beginning
balanceInvestment
and dividendEquity
method income (loss)
Change in other com-prehensive
income
Impairment loss
Ending balance
BNP Paribas Cardif Life Insurance ₩ 56,776 - (3,253) 3,757 - 57,280Aju Capital Co., Ltd. (*1) 30,426 (1,849) 6,280 (413) - 34,444UAMCO., Ltd. 114,238 - 11,632 (48) - 125,822Pohang TechnoPark 2PFV 1,977 - (1) - - 1,976Daewontos Co., Ltd. (*3) - - - - - -Inhee Co., Ltd. 531 - (277) - - 254DAEGY Electrical Construction.,LTD. 44 - 105 - - 149Kukdong Engineering & Construction CO.,LTD. 7,158 - (1,556) 3,422 (9,024) -YEONWOONG SYSTEM - - 106 - - 106DOODOO LOGITECH - - 384 - - 384Neoplux Technology Valuation Investment Fund - 2,000 (7) - - 1,993EQP Global Energy Infrastructure Private Equity Fund - 174 (174) - - -
JAEYOUNG SOLUTEC CO.,LTD. (*2) - 6,238 - - - 6,238Partners 4th Growth Investment Fund - 1,800 - - - 1,800PSA 1st Fintech Private Equity Fund - 2,000 - - - 2,000BANK METRO EXPRESS - (207) 207 - - -SHC-IMM New Growth Fund 8,948 (7,328) 1,555 - - 3,175QCP New Technology Fund 20th 270 (121) (147) - - 2Miraeasset 3rd Investment Fund 4,022 (4,468) 1,154 (708) - -STI New Growth Engine Investment Fund 2,458 - (28) 333 - 2,763Shinhan K2 Secondary Fund 3,006 (1,954) 1,147 377 - 2,576TS2013-6 M&A Investment Fund 1,581 (174) (213) 922 - 2,116KDB Daewoo Ruby PEF 7,704 (8,177) 473 - - -Dream High FundⅢ 2,963 (2,283) 995 (119) - 1,556Haejin Shipping Co., Ltd. 1,035 - 107 86 - 1,228SHC-EN Fund 3,992 - 320 - - 4,312SP New Technology Business investment FundⅠ
1,999 - (25) - - 1,974
Albatross Growth Fund 1,200 - (14) 2,155 - 3,341
Financial Section 155Notes to Financial Statements

Notes to the Consolidated Financial StatementsDecember 31, 2015 and 2014 (In millions of won)
Investees 2015Beginning
balanceInvestment
and dividendEquity
method income (loss)
Change in other com-prehensive
income
Impairment loss
Ending balance
Asia Pacific No.39 Ship Investment Co., Ltd. - 5,355 332 (602) - 5,085Midas Dong-A Snowball Venture Fund - 1,200 2 - - 1,202IBKS-Shinhan Creative Economy New Technology Fund - 150 (2) - - 148
SH Rental Service - 100 (39) - - 61SM New Technology Business Investment FundⅠ
- 1,962 (31) - - 1,931
AJU-SHC WIN-WIN COMPANY FUND 4 - 2,000 - - - 2,000APC Fund 35,139 (571) (6,199) 5,346 - 33,715BNH-CJ Bio Healthcare Fund 5,072 (826) 4,849 - - 9,095Korea Investment Gong-pyeong Office Real Estate Investment Trust 2nd 28,000 (1,895) 1,905 - - 28,010
Arkone Asia Access Offshore Feeder Fund Limited 5,013 (5,566) 919 (366) - -
Shinhan Praxis K-Growth Global Private Equity Fund - 8,780 (166) - - 8,614
BNP Paribas Cardif General Insurance 1,295 728 (277) (7) - 1,739SHBNPP Private Korea Equity Long-Short Professional Feeder - 27,984 92 - - 28,076
Shinhan-Stonebridge Petro PEF 17,029 (4) 816 - - 17,841₩ 341,876 25,048 20,971 14,135 (9,024) 393,006
(*1) The market values of investments are ₩ 47,550 million as of December 31, 2015 based on the quoted market price. (*2) The market values of investments are ₩ 10,409 million as of December 31, 2015 based on the quoted market price. (*3) The Group has stopped recognizing its equity method income or loss due to the investees’ cumulative loss.
Shinhan Financial Group Annual Report 2015 156

Investees 2014Beginning
balanceInvestment
and dividendEquity meth-
od income (loss)
Change in other com-prehensive
income
Transfer out Ending balance
BNP Paribas Cardif Life Insurance ₩ 51,250 (84) 1,216 4,394 - 56,776Aju Capital Co., Ltd. (*1) 28,223 (1,105) 3,438 (130) - 30,426UAMCO., Ltd. 139,271 (35,043) 10,066 (56) - 114,238Pohang TechnoPark 2PFV 2,847 - (870) - - 1,977Daewontos Co., Ltd. (*2) - - - - - -Inhee Co., Ltd. 361 - 170 - - 531DAEGY Electrical Construction.,LTD. - - 41 3 - 44Kukdong Engineering & Construction CO.,LTD. - 9,092 (1,990) 56 - 7,158Shinhan Corporate Restructuring Fund 5th (*3) - - - - - -SHC-IMM New Growth Fund 9,149 - (201) - - 8,948QCP New Technology Fund 20 th 249 - 21 - - 270Miraeasset 3rd Investment Fund 5,736 (3,540) 1,916 (90) - 4,022STI New growth engine Investment Fund 2,509 - (51) - - 2,458Aju 4th Investment Fund 1,580 (1,261) (319) - - -Medici 2nd Investment Fund 3,172 (3,838) 666 - - -AJU-SHC WIN-WIN Company Fund 3 5,256 (7,211) 1,955 - - -Shinhan K2 Secondary Fund 3,362 (623) 207 60 - 3,006KDB Daewoo Securities Platinum PEF 6,563 (6,542) (21) - - -FAMILY FOOD CO., LTD. 4,671 (4,211) - (460) - -TS-6 M&A Investment Fund 3,911 (1,952) 543 (921) - 1,581KDB Daewoo Ruby PEF - 6,918 786 - - 7,704Dream High Fund Ⅲ - 3,000 (37) - - 2,963PT Clemont Finance Indonesia 5,580 - (405) 1,568 (6,743) -Haejin Shipping Co. Ltd. 1,015 - (10) 30 - 1,035SHC-EN Fund - 4,000 (8) - - 3,992SP New Technology Business investment FundⅠ
- 2,000 (1) - - 1,999
Albatross Growth Fund - 1,200 - - - 1,200APC Fund 22,734 94 10,382 1,929 - 35,139Truston Falcon Asia US Feeder Fund 10,841 (11,222) 279 102 - -Innopolis-CJ Bio Healthcare Fund 3,969 - 1,103 - - 5,072Korea investment gong-pyeong office real estate investment trust 2nd - 26,540 1,460 - - 28,000
Arkone Asia Access Offshore Feeder Fund Limited - 5,141 (493) 365 - 5,013
BNPParibas Cardif General Insurance - 1,290 5 - - 1,295Shinhan-stonebridge Petro PEF 16,318 (21) 732 - - 17,029
₩ 328,567 (17,378) 30,580 6,850 (6,743) 341,876
(*1) The market values of investments are ₩ 47,624 million as of December 31, 2014 based on the quoted market price. (*2) The Group has stopped recognizing its equity method income or loss due to the investees’ cumulative loss. (*3) The Group has recognized impairment loss on the investments during the year ended December 31, 2013 and the fund was liquidated during the year ended December
31, 2014.
Financial Section 157Notes to Financial Statements

Notes to the Consolidated Financial StatementsDecember 31, 2015 and 2014 (In millions of won)
(c) Condensed statement of financial position information of associates as of December 31, 2015 and 2014 are as follows:
Investees 2015 2014Asset Liability Asset Liability
BNP Paribas Cardif Life Insurance ₩ 4,128,588 3,745,119 3,890,674 3,510,712Aju Capital Co., Ltd. 6,906,603 6,155,236 6,428,736 5,714,874UAMCO., Ltd. 4,068,354 3,331,647 4,357,490 3,688,589Pohang TechnoPark 2PFV 14,664 1,401 14,668 1,401Daewontos Co., Ltd. 1,952 3,420 6,139 7,344Inhee Co., Ltd. 11,237 9,582 16,284 12,826DAEGY Electrical Construction Co.,Ltd. 1,051 508 1,278 1,119Kukdong Engineering & Construction Co., LTD. 278,497 233,376 368,308 337,159YEONWOONG SYSTEM 1,040 554 - -DOODOO LOGITECH 1,418 44 - -Neoplux Technology Valuation Investment Fund 6,000 22 - -EQP Global Energy Infrastructure Private Equity Fund 2 467 - -JAEYOUNG SOLUTEC CO.,LTD. 161,439 126,297 - -Partners 4th Growth Investment Fund 7,200 - - -PSA 1st Fintech Private Equity Fund 10,000 - - -SHC-IMM New Growth Fund 5,156 235 14,190 321QCP New Technology Fund 20th 5 - 572 -Miraeasset 3rd Investment Fund - - 8,215 172STI New Growth Engine Investment Fund 5,646 120 4,916 -Shinhan K2 Secondary Fund 24,332 366 27,998 7TS2013-6 M&A Investment Fund 8,542 76 6,406 76KDB Daewoo Ruby PEF - - 40,525 2,004Dream High Fund Ⅲ 2,854 - 5,432 -PT Clemont Finance Indonesia - - 43,972 27,832Haejin Shipping Co., Ltd. 5,106 (6) 4,523 211SHC-EN Fund 9,918 2 9,183 2SP New Technology Business investment FundⅠ 8,505 21 8,600 6Albatross Growth Fund 9,202 15 3,301 -Asia Pacific No.39 Ship Investment Co., Ltd. 10,225 54 - -Midas Dong-A Snowball Venture Fund 2,255 - - -IBKS-Shinhan Creative Economy New Technology Fund 2,963 - - -SH Rental Service 1,280 977 - -SM New Technology Business Investment FundⅠ 5,314 2 - -Shinhan 2014-1 New Technology Business Investment Fund - - - -AJU-SHC WIN-WIN COMPANY FUND 4 9,102 - - -APC Fund 134,025 138 139,732 197BNH-CJ Bio Healthcare Fund 34,104 - 20,294 2Korea Investment Gong-pyeong Office Real Estate Investment Trust 2nd 56,022 1 56,022 22
Arkone Asia Access Offshore Feeder Fund Limited - - 67,403 46,195Shinhan Praxis K-Growth Global Private Equity Fund 46,000 347 - -BNPParibas Cardif General Insurance 31,213 13,817 33,341 20,392SHBNPP Private Korea Equity Long-Short Professional Feeder (*) 98,123 3,384 - -Shinhan-Stonebridge Petro PEF 979,838 807 935,256 807
₩ 17,087,775 13,628,029 16,513,458 13,372,270
Shinhan Financial Group Annual Report 2015 158

Condensed statement of comprehensive income information for years ended December 31, 2015 and 2014 were as follows:
Investees 2015Operating
revenueNet profit
(loss)Other
comprehensive income (loss)
Total comprehensive
income (loss)BNP Paribas Cardif Life Insurance ₩ 481,472 (21,533) 25,039 3,506Aju Capital Co., Ltd. 844,216 48,870 (3,191) 45,679UAMCO., Ltd. 452,759 66,455 (276) 66,179Pohang TechnoPark 2PFV - (4) - (4)Daewontos Co., Ltd. 3,357 (263) - (263)Inhee Co., Ltd. 3,921 (1,803) - (1,803)DAEGY Electrical Construction Co.,Ltd. 65 385 - 385Kukdong Engineering & Construction Co., LTD. 269,079 (10,881) (3,072) (13,953)YEONWOONG SYSTEM 59 12 - 12DOODOO LOGITECH 65 (42) - (42)Neoplux Technology Valuation Investment Fund - (22) - (22)EQP Global Energy Infrastructure Private Equity Fund - (767) - (767)JAEYOUNG SOLUTEC CO.,LTD. - - - -Partners 4th Growth Investment Fund - - - -PSA 1st Fintech Private Equity Fund - - - -SHC-IMM New Growth Fund 2,899 2,655 - 2,655QCP New Technology Fund 20th - (312) - (312)Miraeasset 3rd Investment Fund 5,753 2,376 (1,417) 959STI New Growth Engine Investment Fund - (58) 667 609Shinhan K2 Secondary Fund 11,376 10,658 3,510 14,168TS2013-6 M&A Investment Fund 89 (234) 3,688 3,454KDB Daewoo Ruby PEF 3,259 2,395 - 2,395Dream High Fund Ⅲ 1,945 1,825 (218) 1,607Haejin Shipping Co., Ltd. 13 445 - 445SHC-EN Fund 858 735 - 735SP New Technology Business investment FundⅠ - (110) - (110)Albatross Growth Fund 25 (38) 5,925 5,887Asia Pacific No.39 Ship Investment Co., Ltd. 1,264 663 - 663Midas Dong-A Snowball Venture Fund 66 5 - 5IBKS-Shinhan Creative Economy New Technology Fund 2 (37) - (37)SH Rental Service 297 21 - 21SM New Technology Business Investment FundⅠ 19 (85) - (85)Shinhan 2014-1 New Technology Business Investment Fund - (91) (2,039) (2,130)AJU-SHC WIN-WIN COMPANY FUND 4 4 1 - 1APC Fund - (24,604) 12,968 (11,636)BNH-CJ Bio Healthcare Fund 18,531 18,313 - 18,313Korea Investment Gong-pyeong Office Real Estate Investment Trust 2nd 3,885 3,800 - 3,800
Shinhan Praxis K-Growth Global Private Equity Fund - (880) - (880)BNPParibas Cardif General Insurance 10,148 (10,481) - (10,481)SHBNPP Private Korea Equity Long-Short Professional Feeder (*) 24,657 2,967 - 2,967Shinhan-Stonebridge Petro PEF 48,138 44,797 - 44,797
₩ 2,188,221 135,133 41,584 176,717
Financial Section 159Notes to Financial Statements

Notes to the Consolidated Financial StatementsDecember 31, 2015 and 2014 (In millions of won)
Investees 2014Operating
revenueNet profit (loss) Other
comprehensive income (loss)
Total comprehensive
income (loss)Cardif Life Insurance ₩ 483,911 5,852 29,293 35,145Aju Capital Co., Ltd. 781,957 26,756 (1,016) 25,740Pohang TechnoPark 2PFV - (5,839) - (5,839)Daewontos Co., Ltd. 10,954 (2) - (2)Shinhan Corporate Restructuring Fund 5th 90 82 - 82PT Clemont Finance Indonesia 1,362 87 - 87Haejin Shipping Co. Ltd. 74 (41) - (41)APC Fund 13,756 40,426 - 40,426SHC-IMM New Growth Fund 102 (155) - (155)QCP New Technology Fund 20 th 51 45 - 45UAMCO., Ltd. 548,990 57,519 (319) 57,200Miraeasset 3rd Investment Fund 4,532 3,832 (182) 3,650Medici 2nd Investment Fund 3,000 1,218 - 1,218STI New growth engine Investment Fund - (110) - (110)AJU-SHC WIN-WIN Company Fund 3 2,278 2,787 - 2,787Shinhan K2 Secondary Fund 3,545 1,935 562 2,497Aju 4th Investment Fund 143 (1,061) - (1,061)KDB Daewoo Securities Platinum PEF - (111) - (111)Shinhan-stonebridge Petro PEF 43,454 40,118 - 40,118TS2013-6 M&A Investment Fund 56 (694) (3,688) (4,382)Inhee Co., Ltd. 5,041 1,105 - 1,105Innopolis-CJ Bio Healthcare Fund 4,414 4,414 - 4,414KDB Daewoo Ruby PEF 4,422 3,929 - 3,929Dream High Fund Ⅲ 6 (68) - (68)Korea investment gong-pyeong office real estate investment trust 2nd 2,821 2,821 - 2,821
DAEGY Electrical Construction.,LTD 286 148 - 148Kukdong Engineering & Construction CO.,LTD 57,654 (13,917) 347 (13,570)Arkone Asia Access Offshore Feeder Fund Limited (1,349) (2,087) - (2,087)BNPParibas Cardif General Insurance 4,021 (8,103) 183 (7,920)SHC-EN Fund - (19) - (19)SP New Technology Business investment FundⅠ - (6) - (6)Albatross Growth Fund 1 1 - 1
₩ 1,975,572 160,862 25,180 186,042
Shinhan Financial Group Annual Report 2015 160

(d) Reconciliation of the associates’ financial information to the carrying value of the Group’s investments in the associates as of December 31, 2015 and 2014 are as follow:
Investees 2015Net assets (a) Ownership
(%) (b)Interests in
the net assets (a)*(b)
Intra-group transactions
Other Carrying Value
BNP Paribas Cardif Life Insurance ₩ 383,468 14.99 57,520 (240) - 57,280Aju Capital Co., Ltd. (*1) 700,147 12.85 89,969 - (55,525) 34,444UAMCO., Ltd. (*2) 718,983 17.50 125,822 - - 125,822Pohang TechnoPark 2PFV 13,264 14.90 1,976 - - 1,976Daewontos Co., Ltd. (*3) (1,469) 36.33 (534) - 534 -Inhee Co., Ltd. 1,655 15.36 254 - - 254DAEGY Electrical Construction Co.,Ltd. 544 27.45 149 - - 149Kukdong Engineering & Construction Co., LTD. (*4) 46,376 14.30 6,630 - (6,630) -
YEONWOONG SYSTEM 486 21.77 106 - - 106DOODOO LOGITECH 1,374 27.96 384 - - 384Neoplux Technology Valuation Investment Fund 5,978 33.33 1,993 - - 1,993EQP Global Energy Infrastructure Private Equity Fund (*5) (464) 22.64 (105) - 105 -
JAEYOUNG SOLUTEC CO.,LTD. (*6) 34,193 11.90 4,069 - 2,169 6,238Partners 4th Growth Investment Fund 7,200 25.00 1,800 - - 1,800PSA 1st Fintech Private Equity Fund 10,000 20.00 2,000 - - 2,000SHC-IMM New Growth Fund 4,921 64.52 3,175 - - 3,175QCP New Technology Fund 20th 5 47.17 2 - - 2STI New Growth Engine Investment Fund 5,526 50.00 2,763 - - 2,763Shinhan K2 Secondary Fund 23,966 10.75 2,576 - - 2,576TS2013-6 M&A Investment Fund 8,466 25.00 2,116 - - 2,116Dream High Fund Ⅲ 2,854 54.55 1,556 - - 1,556Haejin Shipping Co., Ltd. 5,112 24.00 1,228 - - 1,228SHC-EN Fund 9,916 43.48 4,312 - - 4,312SP New Technology Business investment FundⅠ 8,484 23.26 1,974 - - 1,974Albatross Growth Fund 9,187 36.36 3,341 - - 3,341Asia Pacific No.39 Ship Investment Co., Ltd. 10,171 50.00 5,085 - - 5,085Midas Dong-A Snowball Venture Fund 2,255 53.33 1,202 - - 1,202IBKS-Shinhan Creative Economy New Technology Fund 2,963 5.00 148 - - 148
SH Rental Service 303 20.00 61 - - 61SM New Technology Business Investment FundⅠ 5,312 36.36 1,931 - - 1,931AJU-SHC WIN-WIN COMPANY FUND 4 9,100 21.98 2,000 - - 2,000APC Fund 133,887 25.18 33,715 - - 33,715BNH-CJ Bio Healthcare Fund 34,104 26.67 9,095 - - 9,095Korea Investment Gong-pyeong Office Real Estate Investment Trust 2nd 56,021 50.00 28,010 - - 28,010
Shinhan Praxis K-Growth Global Private Equity Fund 45,653 18.87 8,614 - - 8,614
BNPParibas Cardif General Insurance 17,396 10.00 1,739 - - 1,739SHBNPP Private Korea Equity Long-Short Professional Feeder 94,739 29.24 28,076 - - 28,076
Shinhan-Stonebridge Petro PEF 979,031 1.82 17,841 - - 17,841₩ 3,391,107 452,593 (240) (59,347) 393,006
Financial Section 161Notes to Financial Statements

Notes to the Consolidated Financial StatementsDecember 31, 2015 and 2014 (In millions of won)
(*1) Net assets do not include non-controlling interests and other adjustments represent the cumulative impairment loss and unequal dividends from investee. (*2) Net assets do not include non-controlling interests. (*3) Other adjustments represent the unrecognized equity method losses because the Group has stopped recognizing its equity method losses due to the investees’ cu-
mulative loss. The unrecognized equity method losses for the year ended December 31, 2015 and the cumulative unrecognized equity method losses as of December 31, 2015 are ₩ 96 million and ₩ 534 million, respectively.
(*4) Other adjustments represent an impairment loss, ₩ 9,024 million and the difference between the cost of the investment and the Group’s interests in the net carrying value of the investee’s assets and liabilities at the investment date, ₩ 2,394 million.
(*5) Other adjustments represent the unrecognized equity method losses because the Group has stopped recognizing its equity method losses due to the investees’ cu-mulative loss. The unrecognized equity method losses for the year ended December 31, 2015 and the cumulative unrecognized equity method losses as of December 31, 2015 are ₩ 105 million and ₩ 105 million, respectively.
(*6) Recorded at the acquisition cost.
2014Investees Net assets (a) Ownership
(%) (b)Interests in
the net assets (a)*(b)
Intragroup transactions
Other Carrying value
Cardif Life Insurance ₩ 379,962 14.99 56,991 (215) - 56,776Aju Capital Co., Ltd. (*1) 668,171 12.85 85,860 - (55,434) 30,426Pohang TechnoPark 2PFV 13,268 14.90 1,977 - - 1,977Daewontos Co., Ltd. (*3) (1,205) 36.33 (438) - 438 -Haejin Shipping Co. Ltd. 4,312 24.00 1,035 - - 1,035APC Fund 139,535 25.18 35,139 - - 35,139SHC-IMM New Growth Fund 13,869 64.52 8,948 - - 8,948QCP New Technology Fund 20 th 572 47.17 270 - - 270UAMCO., Ltd. (*2) 652,801 17.50 114,238 - - 114,238Miraeasset 3rd Investment Fund 8,043 50.00 4,021 - - 4,021STI New growth engine Investment Fund 4,916 50.00 2,458 - - 2,458Shinhan K2 Secondary Fund 27,991 10.75 3,006 - - 3,006Shinhan-stonebridge Petro PEF 934,449 1.82 17,029 - - 17,029TS2013-6 M&A Investment Fund 6,330 25.00 1,581 - - 1,581Inhee Co., Ltd. 3,458 15.36 531 - - 531Innopolis-CJ Bio Healthcare Fund 20,292 25.00 5,072 - - 5,072KDB Daewoo Ruby PEF 38,521 20.00 7,704 - - 7,704Dream High Fund Ⅲ 5,432 54.55 2,963 - - 2,963Korea investment gong-pyeong office real estate investment trust 2nd 56,000 50.00 28,000 - - 28,000
DAEGY Electrical Construction.,LTD 159 27.48 44 - - 44Kukdong Engineering & Construction CO.,LTD (*4) 33,318 14.30 4,763 - 2,395 7,158Arkone Asia Access Offshore Feeder Fund Limited 21,208 23.64 5,014 - - 5,014
BNPParibas Cardif General Insurance 12,949 10.00 1,295 - - 1,295SHC-EN Fund 9,181 43.48 3,992 - - 3,992SP New Technology Business investment Fund Ⅰ 8,594 23.25 1,999 - - 1,999Albatross Growth Fund 3,301 36.36 1,200 - - 1,200
₩ 3,065,427 394,692 (215) (52,601) 341,876
(*1) Net assets do not include non-controlling interests and other adjustments represent the cumulative impairment loss and unequal dividends from investee. (*2) Net assets do not include non-controlling interests. (*3) Other adjustments represent the unrecognized equity method losses because the Group has stopped recognizing its equity method losses due to the investees’ cu-
mulative loss. The unrecognized equity method loss for year ended December 31, 2014 and the cumulative unrecognized equity method loss as of December 31, 2014 are ₩ 1 million and ₩ 438 million, respectively.
(*4) Other adjustments represent the difference between the cost of the investment and the Group’s interests in the net carrying value of the investee’s assets and liabilities at the investment date.
Shinhan Financial Group Annual Report 2015 162

17. Investment properties, net
(a) Investment properties as of December 31, 2015 and 2014 are as follows:
2015 2014Acquisition cost ₩ 266,893 317,775 Accumulated depreciation (58,176) (50,246)Book value ₩ 208,717 267,529
(b) Changes in investment properties for the years ended December 31, 2015 and 2014 are as follows:
2015 2014Beginning balance ₩ 267,529 690,257Acquisitions 10,336 1,037Disposals (53,347) (438,566)Depreciation (13,117) (13,795)Amounts transferred from (to) property and equipment (3,122) 26,751Amounts transferred from (to) assets held for sale (*) - 1,841Foreign currency adjustment 438 4Ending balance ₩ 208,717 267,529
(*) Comprise land and buildings, etc.
(c) Income and expenses on investment property for the years ended December 31, 2015 and 2014 were as follows:
2015 2014Rental income ₩ 30,876 60,684 Direct operating expenses for investment properties that generated rental income 9,434 14,902
(d) The fair value of investment property as of December 31, 2015 and 2014 is as follows:
2015 2014Land and buildings(*) ₩ 1,016,736 1,016,009
(*) Fair value of investment properties is estimated based on the recent market transactions and certain significant unobservable inputs. Accordingly, fair value of invest-ment properties is classified as level 3.
Financial Section 163Notes to Financial Statements

Notes to the Consolidated Financial StatementsDecember 31, 2015 and 2014 (In millions of won)
18. Other assets, net Other assets as of December 31, 2015 and 2014 are as follows:
2015 2014Accounts receivable ₩ 7,034,582 5,468,811 Domestic exchange settlement debit 2,391,014 2,127,545 Guarantee deposits 1,214,199 1,307,700 Present value discount (47,326) (62,993)Accrued income 1,250,507 1,291,305 Prepaid expense 132,153 127,913 Suspense payments 54,865 74,304 Sundry assets 55,369 153,040 Separate account assets 2,473,528 2,356,530 Advance payments 325,933 288,107 Unamortized deferred acquisition cost 1,042,788 1,060,325 Other 85,321 104,717 Allowances for impairment (67,006) (94,677)
₩ 15,945,927 14,202,627
19. Leases
(a) Finance lease receivables of the Group as lessor as of December 31, 2015 and 2014 are as follows:
2015Gross
investmentUnearned
finance incomePresent value of minimum lease
payment
Unguaranteed residual value
Not later than 1 year ₩ 774,939 127,756 647,183 - 1 ~ 5 years 1,294,374 79,795 1,214,579 - Later than 5 years 13,728 28 13,700 -
₩ 2,083,041 207,579 1,875,462 -
2014Gross investment Unearned
finance incomePresent value of minimum lease
payment
Unguaranteed residual value
Not later than 1 year ₩ 736,050 114,368 621,682 -1 ~ 5 years 1,270,400 71,644 1,198,756 -Later than 5 years 24,449 552 23,897 -
₩ 2,030,899 186,564 1,844,335 -
Shinhan Financial Group Annual Report 2015 164

(b) The scheduled maturities of minimum lease payments of the Group as lessor as of December 31, 2015 and 2014 are as follows:
Operating leases
Minimum lease payment2015 2014
Not later than 1 year ₩ 13,066 8,496 1 ~ 5 years 12,201 17,239
₩ 25,267 25,735
(c) Future minimum lease payments under non-cancellable operating lease of the Group as lessee as of December 31, 2015 and 2014 are as follows:
Minimum lease payment2015 2014
Not later than 1 year ₩ 199,139 128,2961 ~ 5 years 232,718 174,293Later than 5 years 3,873 5,310
₩ 435,730 307,899
20. Pledged assets
(a) Assets pledged as collateral as of December 31, 2015 and 2014 are as follows:
2015 2014Loans ₩ 364,971 132,373Securities
Trading assets 6,969,235 10,320,812Financial assets designated at fair value through profit or loss 211,411 2,006,430Available-for-sale financial assets 1,615,430 5,219,661Held-to-maturity financial assets 6,061,673 636,399
14,857,749 18,183,302Deposits 779,549 456,432Real estate 10,330 11,691Other assets 116,359 137,707
₩ 16,128,958 18,921,505
(*) The carrying amounts of asset pledged that the pledgees have the right to sell or repledge regardless of the Group’s default as of December 31, 2015 and 2014 are ₩ 7,545,051 million and ₩ 8,323,372 million, respectively.
Financial Section 165Notes to Financial Statements

Notes to the Consolidated Financial StatementsDecember 31, 2015 and 2014 (In millions of won)
(b) The fair value of collateral held that the Group has the right to sell or repledge regardless of pledger’s default as of December 31, 2015 and 2014 are as follows:
2015Collateral held Collateral sold or repledged
Securities ₩ 12,104,793 -Others 270,100 -
2014Collateral held Collateral sold or repledged
Securities ₩ 10,203,339 -Others 58,600 -
21. Deposits Deposits as of December 31, 2015 and 2014 are as follows:
2015 2014Demand deposits ₩ 83,639,042 68,949,585Time deposits 122,918,419 116,521,457Negotiable certificates of deposits 4,579,112 2,179,573Note discount deposits 3,018,551 3,241,082CMA (*) 2,280,816 1,682,610Others 1,240,488 1,135,431
₩ 217,676,428 193,709,738
(*) CMA: Cash management account deposits
22. Trading liabilities Trading liabilities as of December 31, 2015 and 2014 are as follows:
2015 2014Securities sold:Equity ₩ 631,514 592,667Debt 977,545 1,453,931Others 72,726 213,200
1,681,785 2,259,798Gold deposits 453,605 428,936
₩ 2,135,390 2,688,734
Shinhan Financial Group Annual Report 2015 166

23. Financial liabilities designated at fair value through profit or loss Financial liabilities designated at fair value through profit or loss as of December 31, 2015 and 2014 are as follows:
2015 2014 Reason for designationDeposits ₩ 13,509 6,139 Combined instrument Equity-linked securities sold 6,721,344 6,671,481 Combined instrumentDerivatives-combined securities sold 2,094,947 2,318,144 Combined instrumentSecurities sold 86,532 417 Evaluation and management on a fair value basis
₩ 8,916,332 8,996,181
24. Borrowings
(a) Borrowings as of December 31, 2015 and 2014 are as follows:
2015Interest rate (%) Amount
Borrowings in wonBorrowings from Bank of Korea 0.50~0.75 ₩ 2,001,467Others 0.00~4.35 5,760,512
7,761,979Borrowings in foreign currency
Overdraft due to banks 0.00~0.76 180,640Borrowings from banks 0.10~7.95 4,342,989Others 0.47~1.18 2,088,665
6,612,294Call money 0.32~7.00 643,414Bills sold 0.75~2.00 24,803Bonds sold under repurchase agreements 0.69~3.49 6,621,251Due to Bank of Korea in foreign currency 0.10 71,809Bond issuance costs (1,685)
₩ 21,733,865
2014Interest rate (%) Amount
Borrowings in wonBorrowings from Bank of Korea 0.50~1.00 ₩ 1,401,054Others 0.00~5.05 5,118,274
6,519,328Borrowings in foreign currency
Overdraft due to banks 0.55~0.67 337,197Borrowings from banks 0.28~8.85 2,783,837Others 0.25~0.79 2,869,681
5,990,715Call money 0.10~9.00 2,649,036Bills sold 1.40~2.50 31,059Bonds sold under repurchase agreements 0.50~5.82 7,707,954Due to Bank of Korea in foreign currency 0.10 77,180Bond issuance costs (1,505)
₩ 22,973,767
Financial Section 167Notes to Financial Statements

Notes to the Consolidated Financial StatementsDecember 31, 2015 and 2014 (In millions of won)
25. Debt securities issued Debt securities issued as of December 31, 2015 and 2014 are as follows:
2015Interest rate (%) Amount
Debt securities issued in won:Debt securities issued 0.00~8.00 ₩ 31,019,830Subordinated debt securities issued 2.72~5.10 3,940,808Loss on fair value hedges (52,579)Bond issuance cost (55,288)
34,852,771Debt securities issued in foreign currencies:
Debt securities issued 0.32~4.38 6,361,471Loss on fair value hedges 25,983Bond issuance cost (18,941)
6,368,513₩ 41,221,284
2014Interest rate (%) Amount
Debt securities issued in won:Debt securities issued 0.00~8.91 ₩ 27,567,890 Subordinated debt securities issued 3.41~5.10 3,321,239 Gain on fair value hedges 34,277 Bond issuance cost (56,050)
30,867,356 Debt securities issued in foreign currencies:
Debt securities issued 0.32~4.50 6,443,377 Loss on fair value hedges 46,850 Bond issuance cost (22,971)
6,467,256 ₩ 37,334,612
26. Employee benefits (a) Defined benefit plan assets and liabilities Defined benefit plan assets and liabilities as of December 31, 2015 and 2014 are as follows:
2015 2014Present value of defined benefit obligations ₩ 1,567,898 1,346,881 Fair value of plan assets (1,341,768) (1,037,424)Recognized liabilities for defined benefit obligations ₩ 226,130 309,457
Shinhan Financial Group Annual Report 2015 168
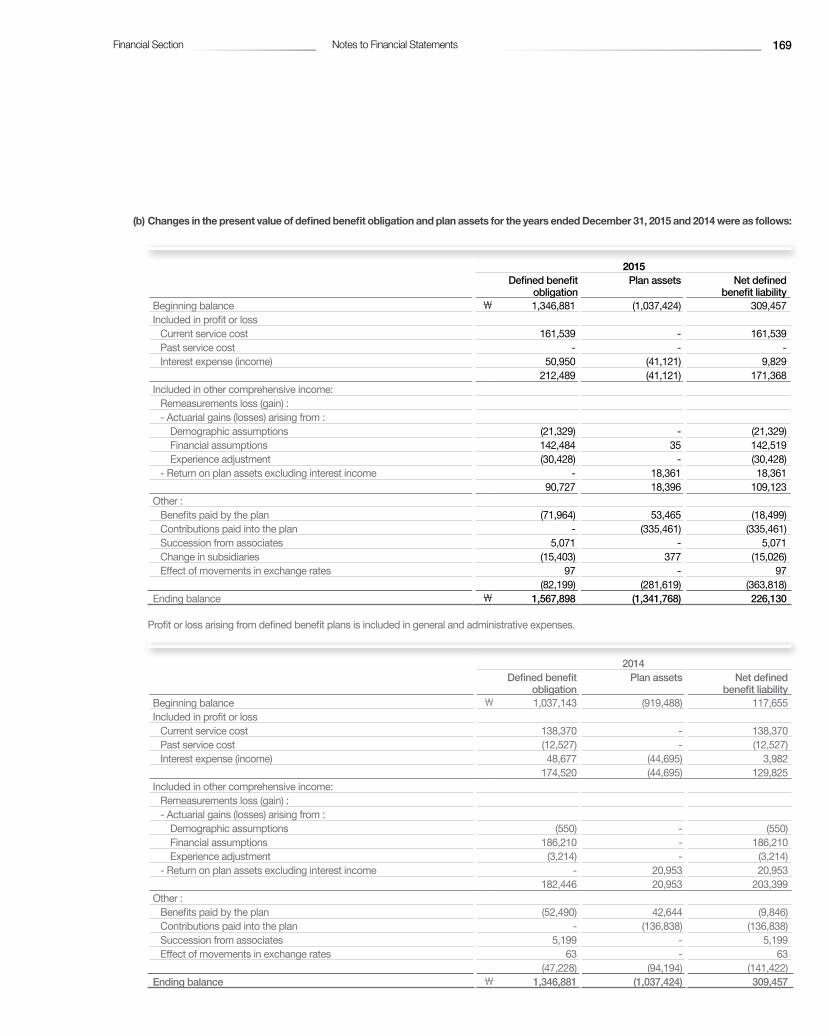
(b) Changes in the present value of defined benefit obligation and plan assets for the years ended December 31, 2015 and 2014 were as follows:
2015Defined benefit
obligation Plan assets Net defined
benefit liabilityBeginning balance ₩ 1,346,881 (1,037,424) 309,457Included in profit or loss
Current service cost 161,539 - 161,539Past service cost - - -Interest expense (income) 50,950 (41,121) 9,829
212,489 (41,121) 171,368Included in other comprehensive income:
Remeasurements loss (gain) : - Actuarial gains (losses) arising from :
Demographic assumptions (21,329) - (21,329)Financial assumptions 142,484 35 142,519Experience adjustment (30,428) - (30,428)
- Return on plan assets excluding interest income - 18,361 18,36190,727 18,396 109,123
Other : Benefits paid by the plan (71,964) 53,465 (18,499)Contributions paid into the plan - (335,461) (335,461)Succession from associates 5,071 - 5,071Change in subsidiaries (15,403) 377 (15,026)Effect of movements in exchange rates 97 - 97
(82,199) (281,619) (363,818)Ending balance ₩ 1,567,898 (1,341,768) 226,130
Profit or loss arising from defined benefit plans is included in general and administrative expenses.
2014Defined benefit
obligation Plan assets Net defined
benefit liabilityBeginning balance ₩ 1,037,143 (919,488) 117,655Included in profit or loss
Current service cost 138,370 - 138,370Past service cost (12,527) - (12,527)Interest expense (income) 48,677 (44,695) 3,982
174,520 (44,695) 129,825Included in other comprehensive income:
Remeasurements loss (gain) : - Actuarial gains (losses) arising from :
Demographic assumptions (550) - (550)Financial assumptions 186,210 - 186,210Experience adjustment (3,214) - (3,214)
- Return on plan assets excluding interest income - 20,953 20,953182,446 20,953 203,399
Other : Benefits paid by the plan (52,490) 42,644 (9,846)Contributions paid into the plan - (136,838) (136,838)Succession from associates 5,199 - 5,199Effect of movements in exchange rates 63 - 63
(47,228) (94,194) (141,422)Ending balance ₩ 1,346,881 (1,037,424) 309,457
Financial Section 169Notes to Financial Statements

Notes to the Consolidated Financial StatementsDecember 31, 2015 and 2014 (In millions of won)
Profit or loss arising from defined benefit plans is included in general and administrative expenses. (c) The composition of plan assets as of December 31, 2015 and 2014 are as follows:
2015 2014Plan assets comprise:
Equity securities ₩ 92,316 52,872 Debt securities 15,823 747 Due from banks 1,184,300 982,841Other 49,329 964
₩ 1,341,768 1,037,424
(d) Actuarial assumptions as of December 31, 2015 and 2014 are as follows:
2015 2014 DescriptionDiscount rate 2.77%~3.53% 3.04%~4.02% AA corporate bond yieldsFuture salary increase rate 2.68%~4.13% + Upgrade rate 2.54%~4.45% + Upgrade rate Average for 5 yearsWeighted-average duration 8.16 year~ 16.51 year 7.68 year~ 16.33 year
(e) Sensitivity analysis Reasonably possible changes as of December 31, 2015 to one of the relevant actuarial assumptions, holding other assumptions constant, would have
affected the defined benefit obligation by the amounts shown below.
Defined benefit obligationIncrease Decrease
Discount rate (1%p movement) ₩ 1,402,761 1,760,221Future salary increase rate (1%p movement) 1,759,114 1,400,558
27. Provisions
(a) Provisions as of December 31, 2015 and 2014 are as follows:
2015 2014Asset retirement obligations ₩ 48,434 44,181 Expected loss related to litigation 25,945 33,377 Unused credit commitments 434,941 402,877 Bonus card points program 27,649 33,113 Financial guarantee contracts issued 81,374 107,209 Others 80,445 73,408
₩ 698,788 694,165
Shinhan Financial Group Annual Report 2015 170

(b) Changes in provisions for the years ended December 31, 2015 and 2014 were as follows:
2015Asset
retirementLitigation Unused
creditCard point
(*2)Guarantee Other Total
Beginning balance ₩ 44,181 33,377 402,877 33,113 107,209 73,408 694,165Provision (reversal) 1,671 (4,474) 31,476 43,975 (32,700) 24,149 64,097Provision used (1,215) (3,686) - (49,439) - (16,625) (70,533)Foreign exchange translation - 728 588 - 2,552 270 4,138Others (*1) 3,797 - - - 4,313 (757) 6,921Ending balance ₩ 48,434 25,945 434,941 27,649 81,374 80,445 698,788
2014Asset
retirementLitigation Unused
creditCard point
(*2)Guarantee Other Total
Beginning balance ₩ 41,730 106,202 411,171 29,104 92,980 69,096 750,283Provision (reversal) 408 (23,458) (9,592) 42,095 10,365 29,439 49,257Provision used (2,576) (49,807) - (48,928) - (25,900) (127,211)Foreign exchange translation - 440 1,298 - 11,603 773 14,114Others (*1) 4,619 - - 10,842 (7,739) - 7,722Ending balance ₩ 44,181 33,377 402,877 33,113 107,209 73,408 694,165
(*1) Others include the effects of decrease in discount and changes in discount rate. (*2) Provisions for card point were classified as fees and commission expense.
(c) Asset retirement obligation liabilities represent the estimated cost to restore the existing leased properties which is discounted to the pre-sent value using the appropriate discount rate at the end of the reporting period. Disbursements of such costs are expected to incur at the end of lease contract. Such costs are reasonably estimated using the average lease year and the average restoration expenses. The aver-age lease year is calculated based on the past ten-year historical data of the expired leases. The average restoration expense is calculated based on the actual costs incurred for the past three years using the three-year average inflation rate.
(d) Allowance for guarantees and acceptances as of December 31, 2015 and 2014 are as follows:
2015 2014Guarantees and acceptances outstanding ₩ 10,110,330 10,796,896 Contingent guarantees and acceptances 3,036,301 4,335,333 ABS and ABCP purchase commitments 2,668,370 2,143,308 Endorsed bill 29,549 51,043
₩ 15,844,550 17,326,580 Allowance for loss on guarantees and acceptances ₩ 81,374 107,209 Ratio % 0.51 0.62
28. Liability under insurance contracts
(a) Insurance liabilities as of December 31, 2015 and 2014 are as follows:
2015 2014 Policy reserve ₩ 20,041,489 17,763,576Policyholder’s equity adjustment 16,795 12,704
₩ 20,058,284 17,776,280
Financial Section 171Notes to Financial Statements

Notes to the Consolidated Financial StatementsDecember 31, 2015 and 2014 (In millions of won)
(b) Policy reserve as of December 31, 2015 and 2014 are as follows:
2015 2014 Interest rate linked ₩ 13,541,770 11,832,073Fixed interest rate 6,499,719 5,931,503
₩ 20,041,489 17,763,576
(c) The details of policy reserves as of December 31, 2015 and 2014 are as follows:
2015Individual insurance Group insurance
Pure endowment
Death Endowment Subtotal Pure protection
Savings Subtotal Total
Premium reserve ₩ 4,228,561 8,346,382 6,439,851 19,014,794 37,088 294 37,382 19,052,176Guarantee reserve 11,212 30,927 167 42,306 - - - 42,306Unearned premium reserve 3 454 - 457 531 - 531 988
Reserve for outstanding claims 65,059 666,320 149,891 881,270 28,644 - 28,644 909,914
Interest rate difference guarantee reserve
2,046 168 14 2,228 - - - 2,228
Mortality gains reserve 6,658 5,372 243 12,273 4 - 4 12,277
Interest gains reserve 16,340 271 22 16,633 - - - 16,633
Long term duration dividend reserve 60 10 2 72 - - - 72
Reserve for policyholder’s profit dividend
2,898 - - 2,898 - - - 2,898
Reserve for losses on dividend insurance contract
1,997 - - 1,997 - - - 1,997
₩ 4,334,834 9,049,904 6,590,190 19,974,928 66,267 294 66,561 20,041,489
Shinhan Financial Group Annual Report 2015 172

2014Individual insurance Group insurance
Pure endowment
Death Endowment Subtotal Pure protection
Savings Subtotal Total
Premium reserve ₩ 3,657,740 7,338,766 5,793,465 16,789,971 36,939 286 37,225 16,827,196Guarantee reserve 10,601 20,965 179 31,745 - - - 31,745Unearned premium reserve 3 544 - 547 1,228 - 1,228 1,775
Reserve for outstanding claims 62,489 629,976 143,756 836,221 29,929 - 29,929 866,150
Interest rate difference guarantee reserve
2,214 176 16 2,406 - - - 2,406
Mortality gains reserve 7,072 5,639 294 13,005 6 - 6 13,011
Interest gains reserve 15,101 276 25 15,402 - - - 15,402
Long term duration dividend reserve 65 11 2 78 - - - 78
Reserve for policyholder’s profit dividend
3,666 - - 3,666 - - - 3,666
Reserve for losses on dividend insurance contract
2,147 - - 2,147 - - - 2,147
₩ 3,761,098 7,996,353 5,937,737 17,695,188 68,102 286 68,388 17,763,576
(d) Reinsurance credit risk as of December 31, 2015 and 2014 are as follows:
2015Reinsurance assets Reinsurance account receivable
AA- to AA+ ₩ 852 1,630A- to A+ 533 749
₩ 1,385 2,379
2014Reinsurance assets Reinsurance account receivable
AA- to AA+ ₩ 270 661A- to A+ 750 1,114
₩ 1,020 1,775
Financial Section 173Notes to Financial Statements

Notes to the Consolidated Financial StatementsDecember 31, 2015 and 2014 (In millions of won)
(e) Income or expenses on insurance for the years ended December 31, 2015 and 2014 are as follows:
2015 2014 Insurance income
Premium income ₩ 4,421,381 4,199,227Reinsurance income 4,239 3,595Separate account income 22,208 18,298
4,447,828 4,221,120Insurance expenses
Claims paid 1,946,669 (1,890,213) Reinsurance premium expenses 5,306 (4,485) Provision for policy reserves 2,277,549 (2,100,459) Separate account expenses 22,207 (18,298) Discount charge 458 (394)Acquisition costs 596,124 (514,997) Collection expenses 14,139 (13,251) Deferred acquisition costs (418,975) 370,925Amortization of deferred acquisition costs 436,512 (463,148)
4,879,989 (4,634,320)
Net loss on insurance ₩ (432,161) (413,200)
(f) Maturity of premium reserve as of December 31, 2015 and 2014 are as follows:
2015Less than
1 year 1 ~ 3 years 3 ~ 7 years 7 ~ 10 years 10 ~ 20 years More than
20 yearsTotal
Fixed interest rate ₩ 14,258 89,356 458,102 598,282 1,157,664 3,590,347 5,908,009 Interest rate linked 44,685 75,385 1,550,233 572,951 1,123,881 9,777,032 13,144,167 Ending balance ₩ 58,943 164,741 2,008,335 1,171,233 2,281,545 13,367,379 19,052,176
2014Less than
1 year 1 ~ 3 years 3 ~ 7 years 7 ~ 10 years 10 ~ 20 years More than
20 yearsTotal
Fixed interest rate ₩ 21,789 41,189 430,313 493,853 1,149,626 3,225,055 5,361,825Interest rate linked 83,211 92,768 1,062,364 839,953 978,613 8,408,462 11,465,371Ending balance ₩ 105,000 133,957 1,492,677 1,333,806 2,128,239 11,633,517 16,827,196
(g) Liability adequacy test, LAT Liability adequacy tests were performed on the premium reserve, unearned premium reserve and guarantee reserve for the contracts held at Decem-
ber 31, 2015 and 2014. The premium reserve considered the amount net level premium reserve less, where appropriate, deferred acquisition cost in accordance with the article 6-3 of Regulation on Supervision of Insurance Business Act.
The assumptions of the current estimation used to assessment and their basis for calculation was as follows:
Shinhan Financial Group Annual Report 2015 174

Assumptions2015 2014 Measurement basis
Discount rate 2.55% ~ 6.88% 3.41% ~ 21.03% Future rate of return on invested asset based on the rate scenario suggested by FSS
Mortality rate 7% ~ 202% 5% ~ 310% Rate of premium paid on risk premi-um based on experience-based rate by classes of sales channel, product and transition period of last 5 years
Operating expense rate Acquisition cost- The first time : 90% ~ 818%- From the second time :
0% ~ 258%Maintenance expense (each case) : 1,325won ~ 4,500wonCollection expenses (on gross premium) : 137won ~454won
Acquisition cost- The first time : 90% ~ 818%- From the second time :
0% ~ 258%Maintenance expense (each case) : 1,325won ~ 6,634wonCollection expenses (on gross premium) : 0won ~431won
Operating expense rate on gross premium or expense per contract based on experience-based rate of last 1 year
Surrender ratio 1.17% ~ 63.16% 0% ~ 62.7% Surrender ratio by classes of sales channel, product and transition period of last 5 years
The result of liability adequacy test as of December 31, 2015 and 2014 are as follows:
2015Provisions
for testLAT base Premium loss
(surplus)Participating
Fixed interest ₩ 601,588 1,468,506 866,918Variable interest 745,094 808,354 63,260
1,346,682 2,276,860 930,178Non- Participating
Fixed interest 5,017,317 4,389,627 (627,690)Variable interest 11,615,842 9,600,136 (2,015,706)
16,633,159 13,989,763 (2,643,396)Option and guarantee 42,306 122,042 79,736
₩ 18,022,147 16,388,665 (1,633,482)
2014Provisions
for testLAT base Premium loss
(surplus)Participating
Fixed interest ₩ 592,415 1,150,996 558,581Variable interest 696,080 726,853 30,773
1,288,495 1,877,849 589,354Non- Participating
Fixed interest 4,451,910 3,991,966 (459,944)Variable interest 12,369,639 10,620,204 (1,749,435)
16,821,549 14,612,170 (2,209,378)Option and guarantee 31,747 98,400 66,653
₩ 18,141,791 16,588,419 (1,553,372)
Financial Section 175Notes to Financial Statements

Notes to the Consolidated Financial StatementsDecember 31, 2015 and 2014 (In millions of won)
Sensitivity analysis as of December 31, 2015 and 2014 are as follows:
LAT fluctuation2015 2014
Discount rate increased by 0.5% ₩ (901,208) (1,028,258)Discount rate decreased by 0.5% 1,343,624 1,202,286Operating expense increased by 10% 249,095 241,465Mortality rate increased by 10% 541,400 495,624Mortality rate increased by 5% 277,282 248,801Surrender ratio increased by 10% 125,240 151,132
(*) As a result of sensitivity analysis above, there are no effects on income and capital, because the increase of LAT does not exceed LAT surplus.
29. Other liabilities Other liabilities as of December 31, 2015 and 2014 are as follows:
2015 2014Accounts payable ₩ 8,535,444 6,762,516 Accrued expenses 2,821,615 3,216,009 Dividend payable 19,572 24,524 Advance receipts 168,550 62,326 Unearned income (*) 351,313 354,822 Withholding value-added tax and other taxes 478,483 490,556 Securities deposit received 721,936 733,023 Foreign exchange remittances pending 209,086 228,017 Domestic exchange remittances pending 2,227,750 1,524,019 Borrowing from trust account 2,972,023 2,020,712 Due to agencies 542,014 648,430 Deposits for subscription 86,111 88,010 Separate account liabilities 2,567,196 2,411,454 Sundry liabilities 1,480,086 2,398,937 Other 150,629 100,978 Present value discount account (20,818) (24,468)
₩ 23,310,990 21,039,865
(*) Changes in deferred (unearned) point income for the years ended December 31, 2015 and 2014 are as follows:
2015 2014Beginning balance ₩ 168,488 140,436Deferred income 284,164 262,383Recognized income (271,056) (234,331)Ending balance ₩ 181,596 168,488
Shinhan Financial Group Annual Report 2015 176

30. Equity
(a) Equity as of December 31, 2015 and 2014 are as follows:
2015 2014Capital stock: ₩
Common stock 2,370,998 2,370,998 Preferred stock 274,055 274,055
2,645,053 2,645,053
Hybrid bond 736,898 537,443
Capital surplus:Share premium 9,494,769 9,494,769 Others 392,566 392,566
9,887,335 9,887,335
Capital adjustments (423,536) (393,405)
Accumulated other comprehensive income, net of tax:Valuation gain (loss) on available-for-sale financial assets 826,712 1,092,622Equity in other comprehensive income of associates 18,569 6,945Foreign currency translation adjustments for foreign operations (163,737) (158,107)Net loss from cash flow hedges (12,202) (15,134)Other comprehensive income of separate account 8,795 5,703Actuarial gains (losses) (373,366) (294,135)
304,771 637,894
Retained earnings (*1) 17,689,134 15,869,779
Non-controlling interest (*2) 969,981 1,330,809₩ 31,809,636 30,514,908
(*1) Restriction on appropriation of retained earnings is as follows: 1) Legal reserve of W1,756,387 million and ₩1,690,125 million for the years ended December 31, 2015 and 2014, respectively. 2) Regulatory reserve for loan loss of ₩ 8,479 million and ₩ 7,621 million for the years ended December 31, 2015 and 2014, respectively. 3) Retained earnings restricted for dividend at subsidiaries level pursuant to law and regulations amounts to ₩ 4,628,814 million for the years ended December 31,
2015. (*2) The hybrid bonds of ₩ 801,298 million and ₩ 1,100,250 million issued by Shinhan Bank were attributed to non-controlling interests as of December 31, 2015 and
2014, respectively. Dividends to those hybrid bonds of ₩ 57,158 million and ₩ 96,293 million were attributed to non-controlling interests for years ended December 31, 2015 and 2014, respectively.
(b) Capital stock i) Capital stock of the Group as of December 31, 2015 and 2014 are as follows:
Number of authorized shares 1,000,000,000Par value per share in won ₩ 5,000Number of issued common stocks outstanding 474,199,587Number of issued preferred stocks outstanding 11,100,000
Financial Section 177Notes to Financial Statements

Notes to the Consolidated Financial StatementsDecember 31, 2015 and 2014 (In millions of won)
The capital stock does not match the total amount of the par value for preferred stock issued ₩ 55,500 million as of December 31, 2015 because redeemable preferred stock (43,711,000 shares) has been repaid by retirement of stock method.
ii) Preferred stocks issued by the Group as of December 31, 2015 are as follows:
Number of shares Predetermined dividend rate (%) (*1) Redeemable periodRedeemable preferred stock:
Series 12 (*2) 11,100,000 5.58% April 21, 2016 - April 21, 2031
(*1) Based on initial issuance price (*2) The Group maintains the right to redeem Series 12 redeemable preferred stock in part or in its entirety during the redeemable period at par value (reflecting contract
dividend rate). If the preferred shares are not redeemed by the end of the redeemable period, those rights will lapse.
(c) Hybrid bond Hybrid bond classified as other equity as of December 31, 2015 and 2014 are as follows:
Issue date Maturity date Interest rate (%) 2015 2014October 24, 2011 October 24, 2041 5.80 ₩ 238,582 238,582May 22, 2012 May 22, 2042 5.34 298,861 298,861June 25, 2015 June 25, 2045 4.38 199,455 -
₩ 736,898 537,443
The above hybrid bonds can be repaid at par value early after 5 years from date of issuance, and the Group has an unconditional right to extend the maturity under the same condition. In addition, if no dividend is to be paid for common shares, the agreed interest is also not paid.
(d) Capital adjustments Changes in capital adjustments for the years ended December 31, 2015 and 2014 are as follows:
2015 2014Beginning balance ₩ (393,405) (393,128)Other transactions with owners (30,131) (277)Ending balance ₩ (423,536) (393,405)
Shinhan Financial Group Annual Report 2015 178

(e) Accumulated other comprehensive income i) Changes in accumulated other comprehensive income for the years ended December 31, 2015 and 2014 are as follows:
2015Items that are or may be reclassified to profit or loss Items that
will never be reclassified to
profit or lossUnrealized
gain (loss) on available-for-sale financial
assets
Equity in other comprehen-
sive income of associates
Foreign currency
translation adjustments
for foreign operations
Net loss from cash
flow hedges
Other comprehen-
sive income of separate account
Remeasure-ments of
the defined benefit plans
Total
Beginning balance ₩ 1,092,622 6,945 (158,107) (15,134) 5,703 (294,135) 637,894Change due to fair value 197,959 14,559 - - 4,079 - 216,597 Reclassification:
Change due to impair-ment or disposal (574,018) (423) - - - - (574,441)
Effect of hedge accounting - - - (126,428) - - (126,428)
Hedging (864) - (33,864) 130,296 - - 95,568Effects from exchange rate fluctuations 30,796 - 27,850 - - - 58,614
Remeasurements of the defined benefit plans - - - - - (107,598) (107,716)
Deferred income taxes 80,137 (2,512) (455) (936) (987) 25,785 101,182Non-controlling interests 80 - 839 - - 2,582 3,501
Ending balance ₩ 826,712 18,569 (163,737) (12,202) 8,795 (373,366) 304,771
2014Items that are or may be reclassified to profit or loss Items that
will never be reclassified to
profit or lossUnrealized
gain (loss) on available-for-sale financial
assets
Equity in other comprehen-
sive income of associates
Foreign currency
translation adjustments
for foreign operations
Net loss from cash
flow hedges
Other comprehen-
sive income of separate account
Remeasure-ments of
the defined benefit plans
Total
Beginning balance ₩ 958,115 690 (146,123) 1,244 (117) (140,842) 672,967
Change due to fair value 629,374 6,849 - - 7,678 - 643,901
Reclassification: Change due to impair-ment or disposal (479,184) - - - - - (479,184)
Effect of hedge accounting - - - (96,405) - - (96,405)
Hedging 2,181 - 15,622 74,798 - - 92,601Effects from exchange rate fluctuations 21,468 - (30,376) - - - (8,908)
Remeasurements of the defined benefit plans - - - - - (203,300) (203,300)
Deferred income taxes (37,931) (594) 1,886 5,229 (1,858) 48,884 15,616Non-controlling Interests (1,401) - 884 - - 1,123 606Ending balance ₩ 1,092,622 6,945 (158,107) (15,134) 5,703 (294,135) 637,894
Financial Section 179Notes to Financial Statements

Notes to the Consolidated Financial StatementsDecember 31, 2015 and 2014 (In millions of won)
(f) Appropriation of retained earnings Statements of appropriation of retained earnings for the years ended December 31, 2015 and 2014 are as follows:
2015 2014Unappropriated retained earnings:
Balance at beginning of year ₩ 5,285,274 5,232,139Dividend to hybrid bonds (34,488) (29,940)Net income 893,041 662,623
6,143,827 5,864,822Reversal of regulatory reserve for loan losses - -
6,143,827 5,864,822
Appropriation of retained earnings:Legal reserve 89,304 66,262Regulatory reserve for loan losses 665 858Dividends Dividends on common stocks paid 569,040 450,490 Dividends on preferred stocks paid 61,938 61,938
720,947 579,548
Unappropriated retained earnings to be carried over to subsequent year ₩ 5,422,880 5,285,274
Date of appropriation: March 24, 2016 March 25, 2015
(*) These statements of appropriation of retained earnings were based on the separate financial statements of the parent company.
(g) Regulatory reserve for loan loss In accordance with Regulations for the Supervision of Financial Institutions, the Group reserves the difference between allowance for credit losses by
K-IFRS and by Regulations for the Supervision of Financial Institutions at the account of regulatory reserve for loan losses.
i) Changes in regulatory reserve for loan losses including non-controlling interests for the years ended December 31, 2015 and 2014 were as follows:
2015 2014Beginning balance ₩ 2,235,402 2,236,131Planned regulatory reserve for (reversal of) loan losses (42,767) (729)Ending balance ₩ 2,192,635 2,235,402
ii) Profit attributable to equity holders of Shinhan Financial Group and earnings per share after factoring in regulatory reserve for loan losses for the years ended December 31, 2015 and 2014 are as follows:
2015 2014
Profit attributable to equity holders of Shinhan Financial Group ₩ 2,367,171 2,081,110 Provision for regulatory reserve for loan losses 46,053 1,241 Profit attributable to equity holders of Shinhan Financial Group after adjusted for regulatory reserve ₩ 2,413,224 2,082,351
Basic and diluted earnings per share after adjusted for regulatory reserve in won 4,886 4,198
Shinhan Financial Group Annual Report 2015 180

31. Dividends
(a) Details of dividends recognized as distributions to common stockholders for the years ended December 31, 2015 and 2014 are as follows:
2015 2014Total number of shares issued and outstanding ₩ 474,199,587 474,199,587 Par value per share in won 5,000 5,000 Dividend per share in won 1,200 950 Dividends ₩ 569,040 450,490 Dividend rate per share % 24.0 19.0
(b) Details of dividends recognized as distributions to preferred stockholders for the years ended December 31, 2015 and 2014 are as follows:
2015Total shares outstanding
Dividend per share in won
Total dividend
Issue price per share in won
Dividend rate per issue price
Convertible redeemable preferred stock series 12 11,100,000 5,580 ₩ 61,938 100,000 5.58%
2014Total shares outstanding
Dividend per share in won
Total dividend
Issue price per share in won
Dividend rate per issue price
Convertible redeemable preferred stock series 12 11,100,000 5,580 ₩ 61,938 100,000 5.58%
(c) Dividend for hybrid bond was calculated as follows for years ended December 31, 2015 and 2014.
2015 2014Amount of hybrid bond ₩ 740,000 540,000Interest rate % 4.38~5.80 5.34~5.80Dividend ₩ 34,488 29,939
(d) There is no unrecognized dividend on cumulative preferred stocks as of December 31, 2015 and 2014.
Financial Section 181Notes to Financial Statements

Notes to the Consolidated Financial StatementsDecember 31, 2015 and 2014 (In millions of won)
32. Net interest income Net interest income for the years ended December 31, 2015 and 2014 are as follows:
2015 2014 Interest income:
Cash and due from banks ₩ 225,554 236,919Trading assets 510,764 583,234Financial assets designated at fair value through profit or loss 48,264 36,894Available-for-sale financial assets 665,561 825,790Held-to-maturity financial assets 539,190 521,683Loans 9,024,682 9,713,860Others 115,689 142,127
11,129,704 12,060,507Interest expense:
Deposits (2,861,027) (3,449,480)Borrowings (325,564) (443,668)Debt securities issued (1,183,758) (1,301,872)Others (66,422) (75,687)
(4,436,771) (5,270,707)Net interest income ₩ 6,692,933 6,789,800
33. Net fees and commission income Net fees and commission income for the years ended December 31, 2015 and 2014 are as follows:
2015 2014Fees and commission income:
Credit placement fees ₩ 74,769 63,462 Commission received as electronic charge receipt 136,991 135,472 Brokerage fees 410,682 320,700 Commission received as agency 167,137 190,759 Investment banking fees 79,840 50,158 Commission received in foreign exchange activities 162,989 143,365 Asset management fees 86,144 60,635 Credit card fees 2,351,140 2,200,964 Others 426,837 394,985
3,896,529 3,560,500 Fees and commission expense:
Credit-related fee (43,337) (32,757)Credit card fees (1,848,510) (1,725,712)Others (383,703) (332,873)
(2,275,550) (2,091,342)Net fees and commission income ₩ 1,620,979 1,469,158
Shinhan Financial Group Annual Report 2015 182

34. Dividend income Dividend income for the years ended December 31, 2015 and 2014 are as follows:
2015 2014 Trading assets ₩ 68,607 13,585 Available-for-sale financial assets 239,670 162,213
₩ 308,277 175,798
35. Net trading income (loss) Net trading income (loss) for the years ended December 31, 2015 and 2014 are as follows:
2015 2014 Trading assets
Gain (loss) on valuation of debt securities ₩ (6,451) 58,143 Gain (loss) on sale of debt securities 55,810 44,699 Gain on valuation of equity securities 19,355 33,007 Gain on sale of equity securities 125,552 46,636 Loss on valuation of other trading assets (5,238) (1,623)
189,028 180,862Trading liabilities
Gain (loss) on valuation of securities sold 20,146 31,095 Gain (loss) on disposition of securities sold (84,642) 15,280 Gain on valuation of other trading liabilities 24,366 (17,781)Gain on disposition of other trading liabilities 1,805 1,296
(38,325) 29,890Derivatives
Gain (loss) on valuation of derivatives (803,990) (246,519)Gain on transaction of derivatives 309,189 298,259
(494,801) 51,740 ₩ (344,098) 262,492
Financial Section 183Notes to Financial Statements

Notes to the Consolidated Financial StatementsDecember 31, 2015 and 2014 (In millions of won)
36. Net gain (loss) on financial instruments designated at fair value through profit or loss Net gain (loss) on financial instruments designated at fair value through profit or loss for the years ended December 31, 2015 and 2014 are as follows:
2015 2014Financial assets designated at fair value through profit or loss:
Other securities Gain on valuation ₩ 14,707 22,147Debt securities Gain (loss) on valuation (19,786) 27,458 Gain on sale and redemption 14,651 19,770
(5,135) 47,228 Equity securities Dividend income 112 850 Gain (loss) on valuation (24,509) 5,684 Gain on sale 46,200 2,451
21,803 8,985 Financial liabilities designated at fair value through profit or loss:
Other securities Gain on valuation 95 32 Gain (loss) on disposal and redemption (111) 3
(16) 35 Borrowings Gain (loss) on valuation 778,451 (171,537) Loss on disposal and redemption (350,045) (267,830)
428,406 (439,367)₩ 459,765 (360,972)
37. Net impairment loss on financial assets Net impairment loss on financial assets for the years ended December 31, 2015 and 2014 are as follows:
2015 2014Impairment losses on:
Loans ₩ (1,021,711) (894,722)Available-for-sale financial assets (254,883) (243,895)Other financial assets - (49,706)
(1,276,594) (1,188,323)Reversal of impairment losses on:
Available-for-sale financial assets 12,541 13,944₩ (1,264,053) (1,174,379)
Shinhan Financial Group Annual Report 2015 184

38. General and administrative expenses General and administrative expenses for the years ended December 31, 2015 and 2014 are as follows:
2015 2014Employee benefits:Salaries ₩ 2,478,136 2,475,184Severance benefits:Defined contribution 20,203 18,608 Defined benefit 165,706 125,552 Termination benefits 105,031 120,308
2,769,076 2,739,652
Rent 350,718 353,879Entertainment 33,339 33,248Depreciation 193,927 200,811Amortization 75,060 112,155Taxes and dues 195,729 197,433Advertising 255,656 229,643Research 13,442 11,871Others 588,121 584,191
₩ 4,475,068 4,462,883
39. Share-based payments
(a) Stock options granted as of December 31, 2015 are as follows:
4th grant(*1)(*2) 5th grant(*1)(*2) 6th grant(*1)(*2) 7th grant(*1)(*2)Grant date March 30, 2005 March 21, 2006 March 20, 2007 March 19, 2008Exercise price in won ₩ 28,006 ₩ 38,829 ₩ 54,560 ₩ 49,053Number of shares granted 2,695,200 3,296,200 1,301,050 808,700
Contractual exercise periodWithin four years after three years from grant date
Within four years after three years from grant date
Within four years after three years from grant date
Within four years after three years from grant date
Changes in number of shares granted:Balance at January 1, 2015 102,389 108,356 58,764 493,079Exercised - - - 447,451Balance at December 31, 2015 102,389 108,356 58,764 45,628
Fair value per share ₩ 11,544 ₩ 721 - -
(*1) The equity instruments granted are fully vested as of December 31, 2015. The weighted average exercise price for 315,137 stock options outstanding at December 31, 2015 is ₩ 39,726.
(*2) As of December 31, 2015, the exercise of the remaining stock options (4th, 5th, 6th and 7th grant) was temporarily suspended.
Financial Section 185Notes to Financial Statements

Notes to the Consolidated Financial StatementsDecember 31, 2015 and 2014 (In millions of won)
(b) Performance shares granted as of December 31, 2015 are as follows:
Expired Not expiredType Cash-settled share-based paymentPerformance conditions Increase rate of the stock price and achievement of target ROEOperating period (*1) 4 or 5 yearsEstimated number of shares vested at December 31, 2015 187,637 953,410
Fair value per share in won ₩ 45,926, ₩ 47,376 and ₩ 40,889 (*2) ₩ 39,550
(*1) Four-year period is applied from the beginning of the year that the grant date belongs while five-year period for the shares with deferred payment. (*2) ₩ 45,926 of fair value per unit is applied for the shares that are vested at December 31, 2013, ₩ 47,376 for the shares that are vested at December 31, 2014 and ₩
40,889 for the shares that are vested at December 31, 2015, respectively.
The amount of cash payment for the Group’s cash-settled share-based payment arrangements with performance conditions is determined at the fourth anniversary date from the grant date based on the share price which is an arithmetic mean of weighted average share prices of the past two-months, past one-month and past one-week. As such the fair value of number of shares expired is estimated using the arithmetic mean of weighted average share prices at the day after expiration date and the fair value of number of shares non-expired is estimated using the closing share price at the end of reporting year.
(c) Share-based compensation costs for the years ended December 31, 2015 and 2014 are as follows:
2015Employees of Total
The controlling company The subsidiariesStock options granted :
4th ₩ (44) (458) (502)5th (31) (500) (531)6th - - -7th (4) (15) (19)
Performance shares 1,599 13,878 15,477₩ 1,520 12,905 14,425
2014Employees of Total
The controlling company The subsidiariesStock options granted :
4th ₩ (26) (266) (292)5th (18) (291) (309)6th (1) (4) (5)7th (216) (876) (1,092)
Performance shares 2,264 12,939 15,203₩ 2,003 11,502 13,505
Shinhan Financial Group Annual Report 2015 186

(d) Accrued expenses and the intrinsic value as of December 31, 2015 and 2014 are as follows:
2015Employees of Total
The controlling company The subsidiariesStock options granted :
4th ₩ 103 1,079 1,1825th 5 73 786th - - -7th - - -
Performance shares 5,539 39,927 45,466₩ 5,647 41,079 46,726
The intrinsic value of share-based payments is ₩ 46,726 million as of December 31, 2015. For calculating, the quoted market price ₩ 39,550 per share was used for stock options and the fair value was considered as intrinsic value for performance shares, respectively.
2014Employees of Total
The controlling company The subsidiariesStock options granted :
4th ₩ 147 1,537 1,6845th 36 573 6096th - - -7th 4 15 19
Performance shares 6,327 33,584 39,911₩ 6,514 35,709 42,223
The intrinsic value of share-based payments is ₩ 42,024 million as of December 31, 2014. For calculating, the quoted market price ₩ 44,450 per share was used for stock options and the fair value was considered as intrinsic value for performance shares, respectively.
Financial Section 187Notes to Financial Statements

Notes to the Consolidated Financial StatementsDecember 31, 2015 and 2014 (In millions of won)
40. Net other operating expense Other operating income and other operating expense for the years ended December 31, 2015 and 2014 are as follows:
2015 2014Other operating income
Gain on sale of assets: Loans ₩ 180,306 72,061Others: Gain on hedge activity 356,090 422,637 Reversal of allowance for acceptances and guarantee 33,526 2,262 Gain on trust account 5,027 5,374 Gain on other allowance 6,988 37,567 Others 392,548 376,861
794,179 844,701 974,485 916,762
Other operating expenseLoss on sale of assets: Loans (10,759) (1,249)Others: Loss on hedge activity (297,066) (338,818) Contribution (274,685) (250,159) Loss on allowance for acceptances and guarantee (825) (12,867) Loss on other allowance (55,425) (32,477) Depreciation of operating lease assets (9,895) (9,058) Others (769,973) (807,787)
(1,407,869) (1,451,166) (1,418,628) (1,452,415)
Net other operating expenses ₩ (444,143) (535,653)
Shinhan Financial Group Annual Report 2015 188

41. Net other non-operating income Other non-operating income and other non-operating expense for the years ended December 31, 2015 and 2014 are as follows:
2015 2014Other non-operating income
Gain on sale of assets: Property and equipment ₩ 2,379 1,229 Investment property 5,586 123,723 Lease assets 328 1,203 Others 433 405
8,726 126,560 Gain on sale of Investments in associates 95,485 -Others: Rental income on investment property 30,876 60,684 Reversal of impairment losses on intangible asset 982 - Gain from assets contributed 714 259 Others 100,877 97,127
133,449 158,070 237,660 284,630
Other non-operating expenseLoss on sale of assets: Property and equipment (1,496) (3,558) Investment property (55) (5,168) Lease assets (2,714) (2,108) Others (69) (42)
(4,334) (10,876) Loss on sale of investments in associates (2,012) (1,076)Impairment loss on investments in associates (9,024) -
(11,036) (1,076)Others: Donations (24,830) (18,828) Depreciation of investment properties (13,117) (13,795) Impaired loss on intangible assets (3,125) (12,458) Write-off of intangible assets (960) (1,572) Collecting of written-off expenses (8,088) (4,718) Others (25,705) (39,121)
(75,825) (90,492)(91,195) (102,444)
Net other non-operating income ₩ 146,465 182,186
42. Income tax expense (a) Income tax expense for the years ended December 31, 2015 and 2014 are as follows:
2015 2014Current income tax expense ₩ 556,558 689,216Adjustment for prior periods (31,101) (1,772)Temporary differences 67,928 (37,003)Income tax recognized in other comprehensive income 101,234 17,524Income tax expenses ₩ 694,619 667,965
Financial Section 189Notes to Financial Statements

Notes to the Consolidated Financial StatementsDecember 31, 2015 and 2014 (In millions of won)
(b) Income tax expense (benefit) is calculated by multiplying net income before tax with the tax rate for the years ended December 31, 2015 and 2014 are as follows:
2015 2014 Income before income taxes ₩ 3,140,578 2,867,576
Income taxes at statutory tax rates ₩ 758,345 692,384Adjustments :
Non-taxable income (16,421) (31,865)Non-deductible expense 7,862 21,874Tax credit (557) (639)Other (42,869) (12,017)
Refund due to adjustments of prior year tax returns (11,741) (1,772)Income tax expense ₩ 694,619 667,965Effective tax rate % 22.12 23.29
(c) Deferred tax expenses by origination and reversal of deferred assets and liabilities and temporary differences for the years ended December
31, 2015 and 2014 are as follows:
2015 Beginning balance Profit or loss Other comprehensive
incomeEnding balance
Unearned income ₩ (135,815) (2,726) - (138,541)Account receivable (16,186) 2,983 - (13,203)Trading assets (49,125) (10,107) - (59,232)Available-for-sale 42,673 (31,883) 80,114 90,904 Investment in subsidiaries 18,277 (12,744) (2,512) 3,021 Valuation and depreciation of property and equipment (146,176) (3,014) - (149,190)
Derivative asset (liability) 8,172 183,598 (936) 190,834 Deposits 29,208 (13,796) - 15,412 Accrued expenses 111,436 (16,158) - 95,278 Defined benefit obligation 279,207 47,005 23,835 350,047 Plan assets (237,208) (72,425) 1,178 (308,455)Other provisions 206,498 (3,138) - 203,360 Allowance for acceptances and guarantees 25,914 (5,840) - 20,074 Allowance related to asset revaluation (44,810) (2,178) - (46,988)Allowance for expensing depreciation (634) 56 - (578)Deemed dividend 1,334 248 - 1,582 Accrued contributions 13,308 (2,047) - 11,261 Financial instruments designated at fair value through profit of loss 42,023 (201,862) - (159,839)
Allowances 59,732 15,783 - 75,515 Fictitious dividend 5,375 (274) - 5,101 Liability under insurance contracts 7,683 2,555 - 10,238 Other (2,079) (41,327) (445) (43,851)
₩ 218,807 (167,291) 101,234 152,750
(*) Deferred tax assets from overseas subsidiaries were decreased by ₩ 1,455 million due to foreign exchange rate movements.
Shinhan Financial Group Annual Report 2015 190

2014 Beginning balance Profit or loss Other comprehensive
incomeEnding balance
Unearned income ₩ (150,138) 14,323 - (135,815)Account receivable (1,898) (14,288) - (16,186)Trading assets (18,770) (30,355) - (49,125)Available-for-sale 229,579 (148,975) (37,931) 42,673Investment in subsidiaries (6,557) 25,428 (594) 18,277Valuation and depreciation of property and equipment
(145,687) (489) - (146,176)
Derivative asset (liability) 19,289 (16,346) 5,229 8,172Deposits 25,690 3,518 - 29,208Accrued expenses 72,321 39,115 - 111,436Defined benefit obligation 205,116 26,346 47,745 279,207Plan assets (194,466) (43,841) 1,099 (237,208)Other provisions 232,391 (25,893) - 206,498Allowance for acceptances and guarantees 22,497 3,417 - 25,914Allowance related to asset revaluation (44,789) (21) - (44,810)Allowance for expensing depreciation (690) 56 - (634)Deemed dividend 1,334 - - 1,334Accrued contributions 12,236 1,072 - 13,308Financial instruments designated at fair value through profit of loss
(28,879) 70,902 - 42,023
Allowances 36,305 23,427 - 59,732Fictitious dividend 6,511 (1,136) - 5,375Liability under insurance contracts 5,765 1,918 - 7,683Other (95,375) 91,320 1,976 (2,079)
₩ 181,785 19,498 17,524 218,807
(*) Deferred tax assets from overseas subsidiaries were decreased by ₩ 19 million due to foreign exchange rate movements.
(d) Deferred tax assets and liabilities that were directly charged or credited to equity for the years ended December 31, 2015 and 2014 are as follows:
January 1, 2015 Changes December 31, 2015OCI (*2) Tax effect OCI (*2) Tax effect OCI (*2) Tax effect
Valuation gain (loss) on available-for-sale financial assets ₩ 1,436,480 (343,858) (346,024) 80,114 1,090,456 (263,744)
Foreign currency translation adjustments for foreign operations (135,080) (23,027) (5,185) (445) (140,265) (23,472)
Gain (loss) on cash flow hedge (19,966) 4,832 3,868 (936) (16,098) 3,896 Equity in other comprehensive income of associates 6,610 335 14,136 (2,512) 20,746 (2,177)
The accumulated other comprehensive income in separate account (*1) 7,524 (1,821) 4,079 (987) 11,603 (2,808)
Remeasurements of the defined benefit liability (387,947) 93,812 (104,244) 25,013 (492,191) 118,825
Income tax charged or credited directly to equity ₩ 907,621 (269,727) (433,370) 100,247 474,251 (169,480)
Financial Section 191Notes to Financial Statements

Notes to the Consolidated Financial StatementsDecember 31, 2015 and 2014 (In millions of won)
January 1, 2014 Changes December 31, 2014OCI (*2) Tax effect OCI (*2) Tax effect OCI (*2) Tax effect
Valuation gain (loss) on available-for-sale financial assets ₩ 1,264,042 (305,927) 172,438 (37,931) 1,436,480 (343,858)
Foreign currency translation adjustments for foreign operations (121,120) (25,003) (13,960) 1,976 (135,080) (23,027)
Gain (loss) on cash flow hedge 1,641 (397) (21,607) 5,229 (19,966) 4,832Equity in other comprehensive income of associates (239) 929 6,849 (594) 6,610 335
The accumulated other comprehensive income in separate account (*1) (154) 36 7,678 (1,857) 7,524 (1,821)
Remeasurements of the defined benefit liability (185,810) 44,968 (202,137) 48,844 (387,947) 93,812
Income tax charged or credited directly to equity ₩ 958,360 (285,394) (50,739) 15,667 907,621 (269,727)
(*1) Deferred tax effects, which are originated from the accumulated other comprehensive income in separate account, were included in the other assets of separate
account’s financial statement. (*2) OCI : other comprehensive income
(e) The amount of deductible temporary differences, unused tax losses, and unused tax credits that are not recognized as deferred tax assets as of December 31, 2015 and 2014 are as follows:
2015 2014Tax loss carry forward (*) ₩ 99,449 99,449
(*) At the end of reporting date, the expected extinctive date of tax loss carry forward and tax credits carry forward that are not recognized as deferred tax assets are as follows:
1 year or less 1-2 years 2-3 years More than 3 yearsTax loss carry forward ₩ - - - 99,449
(f) The amount of temporary difference regarding investment in subsidiaries that are not recognized as deferred tax liabilities as of December 31, 2015 and 2014 are as follows:
2015 2014Investment in associates ₩ (16,298) (11,532)
(g) The Group set off a deferred tax asset against a deferred tax liability of the same taxable entity if, and only if, they relate to income taxes levied by the same taxation authority and the entity has a legally enforceable right to set off current tax assets against current tax liabilities. Deferred tax assets and liabilities presented on a gross basis prior to any offsetting as of December 31, 2015 and 2014 are as follows:
2015 2014Deferred tax assets ₩ 261,255 280,599Deferred tax liabilities (108,505) (61,792)
Shinhan Financial Group Annual Report 2015 192

43. Earnings per share Basic and diluted earnings per share for the years ended December 31, 2015 and 2014 are as follows:
2015 2014Profit attributable to equity holders of Shinhan Financial Group ₩ 2,367,171 2,081,110Less:
Dividends on preferred stock 61,938 61,938 Hybrid bond 34,488 29,940
96,426 91,878 Net profit available for common stock 2,270,745 1,989,232 Weighted average number of common shares outstanding 474,199,587 474,199,587Basic and diluted earnings per share in won ₩ 4,789 4,195
44. Commitments and contingencies
(a) Guarantees, acceptances and credit commitments as of December 31, 2015 and 2014 are as follows:
2015 2014Guarantees
Guarantee outstanding ₩ 10,110,330 10,796,896Contingent guarantees 3,036,301 4,335,333
13,146,631 15,132,229Commitments to extend credit
Loan commitments in won 53,677,696 52,723,778Loan commitments in foreign currency 21,765,110 20,195,691ABS and ABCP commitments(*) 2,668,370 2,143,308Others 1,314,743 1,226,604
79,425,919 76,289,381Endorsed bills
Secured endorsed bills 29,549 51,043Unsecured endorsed bills 7,542,862 10,914,587
7,572,411 10,965,630Loans sold with recourse 2,099 2,099
₩ 100,147,060 102,389,339
(*) The Group consolidates a structured entity when it is exposed, or has rights, to variable returns from its involvement with the investee and has the ability to most sig-nificantly affect those returns through its power over the structured entity based on the terms in the agreement relating to the establishment of the structured entity. As the Group’s interests in the structured entities are presented as liabilities in the consolidated statement of financial position of the Group, the Group does not recognize non-controlling interests for the consolidated structured entities. The Group provides ABCP purchase agreement amounting to ₩ 492,195 million to the structured entities described above.
Financial Section 193Notes to Financial Statements

Notes to the Consolidated Financial StatementsDecember 31, 2015 and 2014 (In millions of won)
(b) Legal contingencies The Group’s pending lawsuits as a defendant for the years ended December 31, 2015 are as follows.
Case Number of claim Descriptions Claim amountBilling of Goods 1 The plaintiff filed claims against the Group for payment of goods that were based on
a forged guarantee of payment. The first appeal was ruled against the Group, and therefore, the Group has paid the claim amount. The Group is in progress with its second appeal.
43,761
Compensation for a loss
1 The plaintiff has filed a lawsuit against the Group claiming that the Group should compensate for a loss of the damaged right of management insisting the Group had purchased the shares of Shinho Paper Co., Ltd. while being aware that the sale had been executed against the will of the members of Aram Corporate Restructuring Association. The first and second court decided partially in favor of the plaintiff, and therefore, the Group has paid the claim amount. The Group is in progress with its third appeal.
47,200
Lehman Brothers Special Financing Inc(LBSF)
1 A plaintiff, Lehman Brothers has claimed that the CDO investment that had been returned to the Group after bankruptcy should be returned to the Lehman Brothers and also claimed. It was contrary to US bankruptcy law. The Group is currently in its first trial.
12,000
Void Contract and Return of Unjust Enrichment
1 Claims to void or cancel currency futures option. The Group is in progress with its second and third appeal, and recognizes provisions for the expected loss.
68,875
VAN Fee Fixing 4 Agency of VAN filed claims against VAN and the credit card company. The agency filed a lawsuit against VAN and the Group claiming for losses due to fee fixing. 4 cases were all for the same claim, and therefore, there were partial losses for VAN and the Group. All cases are currently pending in their third appeal.
13,456
Others 219 Compensation for a loss claim, etc. 332,644227 517,936
As of December 31, 2015, the Group recorded ₩ 25,945 million as provisions and ₩ 1,656 million as liabilities under insurance contracts with respect to these lawsuits.
45. Statement of cash flows
(a) Cash and cash equivalents in the consolidated statements of cash flows as of December 31, 2015 and 2014 are as follows:
2015 2014Cash and due from banks ₩ 22,037,236 20,608,513Due from financial institutions with a maturity over three months from date of acquisition (4,590,643) (4,739,947)
Restricted due from banks (12,839,342) (10,264,156)₩ 4,607,251 5,604,410
(b) Significant non-cash activities for the years ended December 31, 2015 and 2014 are as follows:
2015 2014Debt-equity swap ₩ 34,218 57,335Transfers from construction-in-progress to property and equipment 3,255 4,054Transfers between property and equipment and investment property 3,122 26,751Transfers from property and equipment to assets held for sale - 3,196Transfers from investment property to assets held for sale - 1,841
Shinhan Financial Group Annual Report 2015 194

(c) For the year ended December 31, 2015, the cash out flows related to the investments in Nam An Securities Co., Ltd., PT Bank Metro Express, PT Centratama Nasional Bank and PT. Shinhan Indo Finance amounted to ₩ 163,172 million.
46. Related parties Intra-group balances, and income and expenses arising from intra-group transactions are eliminated in preparing the consolidated financial statements.
(a) Significant balances with the related parties as of December 31, 2015 and 2014 are as follows:
Related party Account 2015 2014Investments in associates:
Aju Capital Co., Ltd. Trading assets ₩ 99,953 49,980〃 Loans 160,000 200,000〃 Credit card loans 2,165 2,011〃 Allowances (479) (624)〃 Deposits 1,061 1,184〃 Provisions 55 78UAMCO., Ltd. Loans 23,100 -〃 Credit card loans 42 43〃 Allowances (32) (1)〃 Deposits 410 28,801〃 Provisions 46 50Pohang TechnoPark2PFV Deposits 14,662 14,666BNP Paribas Cardif Life Insurance Other assets 118 115〃 Credit card loans 108 119〃 Allowances (1) (1)〃 Accrued expenses 153 -〃 Deposits 644 194〃 Provisions 1 1BNPParibas Cardif General Insurance Credit card loans 28 26〃 Allowances (1) (1)〃 Deposits 12 7 Korea Investment Gong-pyeong Office Real Estate Invest-ment Trust 2nd Other liabilities 55 76
Kukdong Engineering & Construction CO.,LTD Credit card loans 11 17〃 Allowances (1) (1)〃 Deposits 5,388 6,986〃 Provisions 15 -Dream High Fund Ⅲ Deposits 4 301SH Rental Service Deposits 219 -SM New Technology Business Investment Fund I Accounts receivable 55 -Midas Dong-A Snowball Venture Fund Deposits 303 -IBKS-Shinhan Creative Economy New Technology Fund Deposits 1,463 -SP New Technology Business investment FundⅠ Accounts receivable 19 5〃 Deposits 283 -EQP Global Energy Infrastructure Private Equity Fund Deposits 3 -Shinhan Praxis K-Growth Global Private Equity Fund Other assets 174 -JAEYOUNG SOLUTEC CO.,LTD. Loans 15,276 -〃 Credit card loans 40 -〃 Allowances (160) -
Financial Section 195Notes to Financial Statements

Notes to the Consolidated Financial StatementsDecember 31, 2015 and 2014 (In millions of won)
Related party Account 2015 2014〃 Deposits 15,261 -〃 Provisions 15 -Partners 4th Growth Investment Fund Deposits 2,704 -SHBNPP Private Korea Equity Long-Short Professional Feeder Other assets 163 -
Key management personnel and their immediate relatives: Loans 3,415 4,642 Assets ₩ 303,993 256,330 Liabilities 42,757 52,344
(b) Significant transactions with the related parties for the years ended December 31, 2015 and 2014 are as follows:
Related party Account 2015 2014Investments in associates
Aju Capital co., Ltd Interest income ₩ 6,440 5,638〃 Fees and commission income 291 487〃 Other operating income 23 202〃 Reversal of credit losses 148 -〃 Interest expense (1) (1)〃 Fees and commission expense (694) (1,693)〃 Provision for credit losses (2) (340)UAMCO., Ltd Interest income 4 40〃 Fees and commission income 9 7〃 Other operating income 4 -〃 Reversal of credit losses - 1〃 Interest expense - (1)〃 Provision for credit losses (32) -Pohang TechnoPark2PFV Interest expense (15) (15)BNP Paribas Cardif Life Insurance Fees and commission income 1,994 1,731〃 Provision for credit losses (1) -〃 Non-operating expense (847) -〃 Other operating expense (7) (4)Kukdong Engineering & Construction CO.,LTD Interest income 26 -〃 Fees and commission income 16 15〃 Reversal of credit losses 1 -〃 Interest expense (35) (40)〃 Fees and commission expense (3) (4)〃 Other operating expenses (15) -〃 Provision for credit losses - (1)BNPParibas Cardif General Insurance Fees and commission income 10 9〃 Provision for credit losses (1) -〃 Reversal of credit losses - 1Shinhan K2 Secondary Fund Fees and commission income 116 465Dream High Fund Ⅲ Interest expense (5) (6)Midas Dong-A Snowball Venture Fund Fees and commission income 30 -〃 Interest expense (3) -SHC-EN Fund Fees and commission income 54 8
Shinhan Financial Group Annual Report 2015 196

Related party Account 2015 2014SP New Technology Business investment FundⅠ Fees and commission income 79 5IBKS-Shinhan Creative Economy New Technology Fund Fees and commission income 39 -〃 Interest expense (2) -SH Rental Service Interest expense (1) -SM New Technology Business Investment Fund I Fees and commission income 96 -JAEYOUNG SOLUTEC CO.,LTD. Interest income 616 -〃 Fees and commission income 1 -〃 Interest expense (47) -〃 Provision for credit losses (160) -〃 Other operating expense (15) -Korea Investment Gong-pyeong Office Real Estate Investment Trust 2nd Fees and commission income 21 21
Shinhan Praxis K-Growth Global Private Equity Fund Fees and commission income 391 -Partners 4th Growth Investment Fund Interest expense (6) - SHBNPP Private Korea Equity Long-Short Professional Feeder Fees and commission income 506 -
Key mana gement personnel and their immediate relativesInterest income 119 170
₩ 9,142 6,624
(c) Key management personnel compensation Key management personnel compensation for the years ended December 31, 2015 and 2014 are as follows:
2015 2014Short-term employee benefits ₩ 18,462 18,711Severance benefits 393 422Share-based payment transactions 6,318 6,541
₩ 25,173 25,674
(d) The guarantees provided between the related parties as of December 31, 2015 and 2014 were as follows:
Guarantor Guaranteed Parties Amount of guarantees Account2015 2014
Shinhan Bank Aju Capital Co., Ltd. ₩ 50,000 50,000 Unused credit line〃 - 50,000 Security underwriting commitmentBNP Paribas Cardif Life Insurance 10,000 10,000 Unused credit lineUAMCO., Ltd. 89,100 112,200 Unused credit line〃 89,950 179,900 Security underwriting commitmentKukdong Engineering & Construction Co., LTD. 1,574 - Performance guaranteesNeoplux Technology Valuation Investment Fund 18,000 - Security underwriting commitment
JAEYOUNG SOLUTEC CO.,LTD. 600 - Unused credit〃 469 - Import letter of credit
₩ 259,693 402,100
Financial Section 197Notes to Financial Statements

Notes to the Consolidated Financial StatementsDecember 31, 2015 and 2014 (In millions of won)
(e) Details of collaterals provided by the related parties as of December 31, 2015 and 2014 were as follows:
Provided to Provided by Pledged assets 2015 2014Shinhan Bank Aju Capital Co., Ltd. Beneficiary certificate ₩ 160,000 -
BNP Paribas Cardif Life Insurance Government bonds 13,676 12,770JAEYOUNG SOLUTEC CO.,LTD. Properties 20,814 -〃 Guarantee insurance policy 7,214 -
₩ 201,704 12,770
47. Information of trust business
(a) Significant balances with trust business as of December 31, 2015 and 2014 are as follows:
2015 2014Borrowings from trust account ₩ 2,972,023 2,020,712Accrued fees on trust accounts 21,515 16,227Accrued interest expense 998 526
(b) Transactions with trust business for the years ended December 31, 2015 and 2014 are as follows:
2015 2014Trust management fees ₩ 71,753 49,877Fees on early withdrawal 1 -Interest on borrowings from trust account 44,986 44,899
48. Interests in unconsolidated structured entities
(a) The nature and extent of interests in unconsolidated structured entities The Group is involved in assets-backed securitization, structured financing, beneficiary certificates and other structured entities and characteristics of
these structured entities are as follows:
Shinhan Financial Group Annual Report 2015 198

DescriptionAssets-backed securitization
Securitization vehicles are established to buy assets from originators and issue asset-backed securities in order to facilitate the originators’ funding activities and enhance their financial soundness. The Group is involved in the securitization vehicles by purchasing (or committing to purchase) the asset-backed securities issued and/or providing other forms of credit enhance-ment.
The Group does not consolidate a securitization vehicle if (i) the Group is unable to make or approve decisions as to the modi-fication of the terms and conditions of the securities issued by such vehicle or disposal of such vehicles’ assets, (ii) (even if the Group is so able) if the Group does not have the exclusive or primary power to do so, or (iii) if the Group does not have expo-sure, or right, to a significant amount of variable returns from such entity due to the purchase (or commitment to purchase) of asset-backed securities so issued or subordinated obligations or by providing other forms of credit support.
Structured financing
Structured entities for project financing are established to raise funds and invest in a specific project such as M&A (mergers and acquisitions), BTL (build-transfer-lease), shipping finance, etc. The Group is involved in the structured entities by originat-ing loans, investing in equity, or providing credit enhancement.
Investment fund Investment fund means an investment trust, a PEF (private equity fund) or a partnership which invests in a group of assets such as stocks or bonds by issuing a type of beneficiary certificates to raise funds from the general public, and distributes its income and capital gains to their investors. The Group manages assets by investing in shares of investment fund or playing a role of an operator or a GP (general partner) of investment fund, on behalf of other investors.
The size of unconsolidated structured entities as of December 31, 2015 and 2014 are as follows:
2015 2014Total assets:
Asset-backed securitization ₩ 83,587,652 33,603,260 Structured financing 55,864,638 52,342,495 Investment fund 34,418,872 29,096,759
₩ 173,871,162 115,042,514
(b) Nature of risks i) The carrying amounts of the assets and liabilities relating to its interests in unconsolidated structured entities as of December 31, 2015 and
2014 are as follows:
2015Assets-backed
securitization Structured
financingInvestment
fundTotal
Assets:Loans ₩ 302,074 5,683,497 38,013 6,023,584Trading assets 1,793,038 44,733 - 1,837,771Derivative assets 16,722 - - 16,722Available-for-sale financial assets 2,541,137 442,646 2,356,212 5,339,995Held-to-maturity financial assets 2,496,659 - - 2,496,659Other assets 560 2,984 207 3,751
7,150,190 6,173,860 2,394,432 15,718,482Liabilities:
Derivative liabilities 8 - - 8Other 134 214 322 670
₩ 142 214 322 670
Financial Section 199Notes to Financial Statements

Notes to the Consolidated Financial StatementsDecember 31, 2015 and 2014 (In millions of won)
2014Assets-backed
securitization Structured
financingInvestment
fundTotal
Assets:Loans ₩ 383,011 4,658,388 613,089 5,654,488Trading assets 573,919 48,877 10,950 633,746Derivative assets 42 - - 42Available-for-sale financial assets 575,360 253,740 2,085,276 2,914,376Held-to-maturity financial assets 154,103 - - 154,103Other assets 555 - 15,038 15,593
1,686,900 4,961,005 2,724,353 9,372,348Liabilities:
Other 1,200 - 658 1,858₩ 1,200 - 658 1,858
ii) Exposure to risk relating to its interests in unconsolidated structured entities as of December 31, 2015 and 2014 are as follows:
2015Assets-backed
securitization Structured
financingInvestment
fundTotal
Assets held ₩ 7,150,190 6,173,860 2,394,432 15,718,482ABS and ABCP commitments 1,093,171 121,134 74,328 1,288,633Loan commitments 1,589,389 475,091 13,500 2,077,980Guarantees 65,000 43,240 - 108,240
₩ 9,897,750 6,813,325 2,482,260 19,193,335
2014Assets-backed
securitization Structured
financingInvestment
fundTotal
Assets held ₩ 1,686,991 4,961,049 2,724,352 9,372,392ABS and ABCP commitments 325,195 167,000 103,702 595,897Loan commitments 1,631,113 229,540 26,454 1,887,107Guarantees - 28,888 - 28,888
₩ 3,643,299 5,386,477 2,854,508 11,884,284
49. Business Combinations
(a) General information On August 14, 2015, the Group acquired 40% of voting shares of PT Bank Metro Express (“BME”), a local bank located in Indonesia. Subsequently, on
November 30, 2015, the Group acquired additional 50% of voting shares of BME, and also participated in the increase of the paid-in capital of BME, which made the Group’s total shareholding of BME up to 97.76%. In addition, on December 18, 2015, the Group acquired 75% of voting shares of PT Centratama Nasional Bank (“CNB”), another local bank also located in Indonesia, and obtained the control of CNB.
On December 1, 2015, the Group obtained control of Swadharma Indotama Finance, a finance company located in Indonesia, by acquiring 50% + 1 of the shares and changed the company’s name to Shinhan Indo Finance. In addition, on July 16, 2015, the Group obtained control of Nam An Securities Co., Ltd. in Vietnam by acquiring 100% of its shares.
Shinhan Financial Group Annual Report 2015 200

(b) The fair value of assets and liabilities The fair value of assets acquired and liabilities assumed by acquisition of BME, CNB, Shinhan Indo Finance and Nam An Securities as of acquisition
dates were as follows:
BME(*1, 2) CNB(*3) Shinhan Indo Finance Nam An SecuritiesAsset:
Cash and due from banks ₩ 35,509 23,577 602 3,258Loans and receivables 136,086 51,443 67,982 -Property and equipment 4,176 3,815 2,629 1Other assets 3,195 782 108 90
178,966 79,617 71,321 3,349Liabilities:
Deposits 84,253 66,179 - 56Borrowings - - 54,757 -Provisions 1,523 837 225 4Other liabilities 773 520 837 9
86,549 67,536 55,819 69The fair value of the identifiable assets acquired and liabilities assumed ₩ 92,417 12,081 15,502 3,280
(*1) Loans were measured as carrying amount since the difference between fair value and carrying amount was not significant. (*2) Identifiable intangible assets represent the estimated amount of cost savings of deposits which were discounted to the present value. (*3) The Group utilized the CNB’s financial statements since the accounting treatments for a business combination has not been completed by the end of the reporting
period.
(c) Goodwill Goodwill arising from the acquisitions has been recognized as follows:
BME CNB Shinhan Indo Finance Nam An SecuritiesConsideration transferred (Cash) ₩ 98,391 30,782 10,600 4,498Fair value of previously held equity interest 25,273 - - -
123,664 30,782 10,600 4,498Fair value of identifiable net assets (92,417) (12,081) (15,502) (3,280)Non-controlling interest(*) 2,070 3,020 7,751 -Goodwill ₩ 33,317 21,721 2,849 1,218
(*) Non-controlling interests were measured in proportionate interest in the recognized amount of the fair value of identifiable net assets.
(d) Acquisition-related costs The Group incurred acquisition-related costs of W2,638 million on legal fees and due diligence costs. These costs were included in the administrative
expenses.
Financial Section 201Notes to Financial Statements

Global Networks
Shinhan Financial Group Annual Report 2015 202
SHINHAN BANK JAPAN 5th Fl., The Mita Bellju Bldg, 108-0014 5-36-7 Shiba, Minato-ku, Tokyo, JapanTEL. 81-3-6403-0505
SHINHAN BANK (CHINA) LTD. 12nd FL. Zhongyu Plaza No6. Worker’s stadium Road N., Chaoyang District, Beijing 100027, China TEL. 86-10-8529-0088
SHINHAN BANK VIETNAM LTD. Ground Floor, Mezzanine, 2nd and 3rd floor, Empress Tower, 138–142 Hai Ba Trung, Dakao Ward, District 1, Ho Chi Minh City, Vietnam TEL. 84-8-3829-1581
SHINHAN BANK AMERICA 330 5th Avenue 4th Floor New York, NY 10001, USA TEL. 1-646-843-7300
SHINHAN BANK CANADA 5140 Yonge Street Suite 2300 Toronto, Ontario, M2N6Z4, CanadaTEL. 1-416-250-3500
SHINHAN BANK EUROPE GmbH Neue Mainzer Strasse 75, 60311 Frankfurt am Main, Germany TEL. 49-69-975-7130
SHINHAN KHMER BANK No.277, Norodom Blvd, Sangkat Tonle Bassac, Khan Chamkarmorn, PhnomPenh, Cambodia TEL. 855-23-727-380
SHINHAN BANK KAZAKHSTAN 123/7 Dostyk Ave.Medeu District, Almaty, Republic of Kazakhstan TEL. 7-727-385-9600
PT BANK METRO ExPRESS Jl. Hayam Wuruk No. 19 – 20 Jakarta, Indonesia TEL. 62-21-231-1888
PT CENTRATAMA NASIONAL BANKJl. Kedungdoro No.32 Surabaya, IndonesiaTEL. 62-31-531-9001
SHINHAN ASIA LTD. Units 7704, International Commerce Centre, 1 Austin Road West, Kowloon,Hong Kong TEL. 852-3717-0700
BANCO SHINHAN DE MExICO Av. Paseo de la Reforma 250, Reforma Capital Torre B Cuauhtemoc, Juarez, 06600, Mexico D.F. , MexicoTEL. 52-55-5525-7787
MUMBAI BRANCH 5th Floor, Wockhardt Towers, C2, G Block, Bandra Kurla Complex, Bandra, Mumbai, India TEL. 91-22-6199-2200
NEW DELHI BRANCH 3rd Floor, D-6, PartⅡ South Extension, New Delhi, India TEL. 91-11-4500-4800
KANCHEEPURAM BRANCH Survey No:69/4A1 B No.101A, Bangalore Highway Road, Thandalam Village, Kancheepuram, Tamildadu, India TEL. 91-41-2714-3500
PUNE BRANCH Ground Floor, Red Building, plot No.2, Galaxy Society, Boat club Road, Pune,Maharashtra, India TEL. 91-020-3086-4800
HONG KONG BRANCH Unit 7703, International Commerce Centre, 1 Austin Road West, Kowloon, Hong Kong TEL. 852-2867-0100
LONDON BRANCH 6th Floor, 77 Gracechurch Street, London, EC3V 0AS, UK TEL. 44-207-600-0606
NEW YORK BRANCH 600 3rd Avenue 17th Floor New York, NY 10016, USA TEL. 1-212-371-8000
SINGAPORE BRANCH 1 George St. #15-03, Singapore TEL. 65-6536-1144
MANILA BRANCH 21st Floor, RCBC Savings Bank Corporate Center, 26th & 25th Street, Bonifacio South, Bonifacio Global City, Taguig City, Manila, Philippines TEL. 63-2-405-6300
DUBAI BRANCH S1204, Emirates Financial Tower, DIFC, P.O. Box 507001, Dubail, UAE TEL. 971-4-551-2820
SHINHAN BANK MYANMAR REPRESENTATIVE OFFICE No. 48, Ward 10, Kabar Aye Pagoda Road, Mayangone Township, Yangon, Myanmar TEL. 95-94-2531-4799
SHINHAN BANK MExICO REPRESENTATIVE OFFICE Bosque de Radiatas No. 26 piso 7 Col. Bosque de las Lomas C.P. 05120 Mexico D.F., MexicoTEL. 52-55-5525-7787
SHINHAN BANK UZBEKISTAN REPRESENTATIVE OFFICE Neworld bldg. 3rd fl., Oybek st. 22 Tashkent, UzbekistanTEL. 998-71-150-1184
LLP MFO SHINHAN FINANCE Office 2/3, 2nd floor, 48 Auezov street, Almaty, Kazakhstan TEL. 7-727-352-85-62
PT SHINHAN INDO FINANCE Wisma Indomobil I LT.10 Jl. MT. Haryono Kav.8 Jakarta Indonesia TEL. 62-21-857-9095
SHINHAN INVESTMENT AMERICA INC. 1325 6th Ave. Suite 702, New York, USA TEL. 1-212-397-4000
SHINHAN INVESTMENT ASIA LTD. Units 7705A, International Commerce Center,1 Austin Road West, Kowloon, Hong Kong TEL. 852-3713-5301
SHINHAN SECURITIES VIETNAM CO., LTD. 22nd Floor, Centec Tower, 72-74 Nguyen Thi Minh Khai Street, District 3, Ho Chi Minh City, Vietnam TEL. 84-8-6299-8000
SHINHAN INVESTMENT CORP. SHANGHAI REPRESENTATIVE OFFICERoom104, Huaneng Union Mansion No.958, Lujiazui Ring Road, Pudong, Shanghai, China TEL. 86-212-397-4000
SHINHAN INVESTMENT CORP. HOCHIMINH REPRESENTATIVE OFFICE17th Floor, Centec Tower, 72-74 Nguyen Thi Minh Khai, District 3, Ho Chi Minh City, Vietnam TEL. 84-8-3824-6445
SHINHAN LIFE INSURANCE HANOI REPRESENTATIVE OFFICE Unit 1105, 11th Floor, East Tower, Lotte Center Hanoi, 54 Lieu Giai, Cong Vi Ward, Ba Dinh District, Hanoi, VietnamTEL. 84-4-3766-2000
SHINHAN BNP PARIBAS ASSET MANAGEMENT (HONG KONG) LTD.Suite 902, Two Exchange Square, 8 Connaught Place, Central, Hong Kong TEL. 852-2525-9093
SHINHAN BANK SHINHAN INvESTMENT CORP.
SHINHAN CARD SHINHAN LIFE INSURANCE
SHINHAN BNP PARIBAS ASSET MANAGEMENT

Forward-Looking Statements
Shinhan Financial Group’s 2015 Annual Reportmay contain forward-looking statements toprovide value-added account of Shinhan FinancialGroup’s businesses and results of operations.These forward-looking statements reflect ourcurrent views with respect to future events andperformance, and are generally identified bythe use of forward-looking terminology, such as“expect”, “plan”, “intend”, and similar expressions.You are cautioned not to place undue reliance inthese forward-looking statements, which reflectmanagement’s current analysis of future events.We undertake no obligation to publicly update orrevise any forward-looking statements, whetheras a result of new information, future events, orotherwise.
InquiriesIR TeamShinhan Financial Group20, Sejong-daero 9-gil, Jung-gu, Seoul 04513, KoreaTel : 82-2-6360-3000, Fax : 82-2-6360-3098www.shinhangroup.com
Investor Information

20, Sejong-daero 9-gil, Jung-gu, Seoul 04513, KoreaTel : 82-2-6360-3000, Fax : 82-2-6360-3098www.shinhangroup.com