Farmland Partners Inc. 2016 Annual Report - AnnualReports ...
133
20MAR201516580285 2016 ANNUAL REPORT TO STOCKHOLDERS
-
Upload
khangminh22 -
Category
Documents
-
view
2 -
download
0
Transcript of Farmland Partners Inc. 2016 Annual Report - AnnualReports ...

20MAR201516580285
2016 ANNUAL REPORT TO STOCKHOLDERS

22MAR201718560707
Dear Fellow Stockholders,
2016 was another year defined by the rapid growth and further diversification of our portfolio. Weentered into two truly unique transactions: the first being a $197 million row crop transaction nearParis, Illinois (what we believe was the largest row crop farmland acquisition in the United States), andthe second being an all-stock acquisition of American Farmland Company, which had a portfolio withan appraisal value of approximately $269 million as of December 31, 2015(1). Both of thesetransactions were transformative. The Paris, Illinois acquisition helped us achieve a scale in row cropsthat is allowing us to realize significant efficiencies and achieve our goal of being a low-cost manager offarmland. The American Farmland Company merger enabled us to diversify our portfolio in a singletransaction by acquiring high-quality specialty crop properties across the United States. In addition, wehave continued to acquire farmland in smaller, accretive transactions. Our transactions over the lastyear have allowed us to increase the portfolio-wide capitalization rate while further diversifying ourportfolio both geographically and by crop type.
Our Vision
Our goal is to create a portfolio of farmland that is correlated with the production value of agriculturein the United States on a dollar-weighted basis while becoming the lowest cost manager of farmland.We believe that the scale and diversification we achieved in 2016 position us to be the leading publiccompany providing investors a way to participate in the long term global food demand story in the faceof land scarcity. Once we achieved that scale, the integration of the American Farmland Companyportfolio earlier this year allowed us to reach what we believe is a balanced allocation of assets, withapproximately 75% of our portfolio value currently in row crops and 25% in permanent and specialtycrops. Our current holdings across the United States are illustrated in the graphic below.
> 5,000 Acres
2,000 – 4,999 Acres
1,000 – 1,999 Acres
< 500 Acres
Gross Acres
FPIHeadquarters
500 – 999 Acres
We will continue to build a portfolio that we believe will provide a steady rental stream from farmlandthat appreciates in value over time as a result of the imbalance between increasing global food demand(driven by global population increases, growth in GDP per capita and changing consumption patterns)and increasing scarcity of land suitable for farming. With 18 employees managing nearly $1.0 billion offarmland assets, and only a few incremental employees needed to more than double the size of ourportfolio, we believe we have become the most cost efficient vehicle to invest in US farmland.
(1) Based on appraisal values as of December 31, 2015, excluding Hawk Creek appraisal value andincluding Sun Dial acquisition at cost.

22MAR201715184156
22MAR201715183792
Continued Growth Story
Since our initial public offering in April 2014, our portfolio has expanded from just over 7,300 acres toapproximately 152,000 acres as of March 22, 2017. We have expanded geographically, from two statesin the Corn Belt and Colorado at the time of our initial public offering to 17 states in multiple regionstoday, including the Corn Belt, the West Coast, the Plains, the Delta and the Southeast. Our portfolionow includes farms that grow over 26 major crop types and leases with over 100 tenants.
46,638
74,420
115,489
152,603
30
41
95
116
0
20
40
60
80
100
120
140
160
0
20,000
40,000
60,000
80,000
100,000
120,000
140,000
160,000
2014 2015 2016 3/22/2017
Acres Tenants
The scale we have achieved has been reflected in our financial performance, with large increases inrevenue and AFFO per share on an annual basis.(2)
$4,218
$13,756
$31,001
$0.12
$0.31
$0.58
$0.00
$0.15
$0.30
$0.45
$0.60
$0
$10,000
$20,000
$30,000
$40,000
2014 2015 2016
Revenue AFFO per Share
American Farmland Company Merger
Last fall we announced the merger with American Farmland Company, which we closed in earlyFebruary 2017. The majority of properties we integrated into our portfolio as part of this transactionare permanent crop farms that diversify our portfolio from a geographic and crop type perspectivewhile increasing the overall returns from our leases. Because we have focused on building ourmanagement team and infrastructure to internally manage all crop types across the country, we wereable to terminate the farmland management contracts American Farmland Company previously had inplace with third-party providers while retaining only one employee from American FarmlandCompany’s management team, Robert Cowan. Mr. Cowan is now serving as our President and hasextensive experience in production agriculture, including annual and permanent specialty crops.
Land Values
Land values were, on a nationwide basis, flat to modestly declining last year. Each year, the USDAreleases its Land Values Summary, which shows the percentage change in farmland real estate value ona state by state basis. Based on the Land Values 2016 Summary, farmland real estate values declinedonly 0.3% nationwide from 2015 to 2016. While certain row crop regions saw modest declines in values,other regions, namely the West Coast, Delta, and certain Southeastern states, saw increases in value.
We rely on the USDA Land Values Summary as the main source to evaluate changes in our portfoliovalue. The summary, which is released every summer, is the most comprehensive analysis of land valuesnationwide, as it incorporates data from agricultural producers operating in thousands of land segments
(2) For a reconciliation of AFFO per share to net income per share, please see our Annual Report onForm 10-K included as part of this Annual Report.

20MAR201517113603
across the country. We believe the USDA’s segment-oriented data is the right tool to determine changesin our longer-term holdings.
Strong, Secure Rental Revenue Stream
Our properties are 100% occupied and have had defaults on less than 1.0% of our expected rentalpayments. Additionally, we had a same-property rental increase of 2.8% from 2015 to 2016. Similar toour view on land values, we believe that profitability of farmers with large, scalable operations — whichis typical of our tenant base — remains fundamentally sound. Since there is 0% vacancy in farmland,farmers are always reluctant to cede any acreage from their operations. As such, our tenants are willingto consistently pay market rental rates that are attractive to us rather than give up a portion of theiroperations.
Importantly, the vast majority of our leases are cash leases, with less than 20% of expected rentalpayments consisting of participating rents. While we collect the majority of our rents through set cashpayments within the first three months of the year, we have two additional backstops for remainingpayments later in the year: first lien security interest in the crop grown and federal crop insuranceprograms.
Outlook
Our management team remains committed to growing the portfolio. Our pipeline constantly presentsopportunities that will further diversify the portfolio while increasing long term returns to shareholders.We are committed to raising capital in the public equity markets only when we can deploy that capitalin accretive transactions and when we are trading at levels at or near fair value.
On behalf of all of us at Farmland Partners Inc., we thank you for your continued interest in ourbusiness.
Sincerely,
Paul PittmanChairman and Chief Executive Officer

UNITED STATES SECURITIES AND EXCHANGE COMMISSION
Washington, D.C. 20549
FORM 10-K (Mark One)
ANNUAL REPORT PURSUANT TO SECTION 13 OR 15(d) OF THE SECURITIES EXCHANGE ACT OF 1934
For the fiscal year ended December 31, 2016
or
TRANSITION REPORT PURSUANT TO SECTION 13 OR 15(d) OF THE SECURITIES EXCHANGE ACT OF 1934
For the transition period from to
Commission file number 001-36405 ___________________________________________
FARMLAND PARTNERS INC. (Exact Name of Registrant as Specified in Its Charter) ___________________________________________
Maryland 46-3769850
(State or Other Jurisdiction of Incorporation or Organization)
(IRS Employer Identification No.)
4600 South Syracuse Street, Suite 1450 Denver, Colorado 80237
(Address of Principal Executive Offices) (Zip Code)
Registrant’s Telephone Number, Including Area Code (720) 452-3100 Securities registered pursuant to Section 12(b) of the Act:
Title of Each Class Name Of Each Exchange On Which Registered Common Stock, $0.01 par value per share New York Stock Exchange
Securities registered pursuant to Section 12(g) of the Act: None
Indicate by check mark if the registrant is a well-known seasoned issuer, as defined in Rule 405 of the Securities Act. Yes No
Indicate by check mark if the registrant is not required to file reports pursuant to Section 13 or 15(d) of the Act. Yes No
Indicate by check mark whether the registrant (1) has filed all reports required to be filed by Section 13 or 15(d) of the Securities Exchange Act of 1934 during the preceding 12 months (or for such shorter period that the registrant was required to file such reports), and (2) has been subject to such filing requirements for the past 90 days. Yes No
Indicate by check mark whether the registrant has submitted electronically and posted on its corporate web site, if any, every Interactive Data File required to be submitted and posted pursuant to Rule 405 of Regulation S-T (§ 232.405 of this chapter) during the preceding 12 months (or for such shorter period that the registrant was required to submit and post such files). Yes No
Indicate by check mark if disclosure of delinquent filers pursuant to Item 405 of Regulation S-K (§ 229.405) is not contained herein, and will not be contained, to the best of registrant’s knowledge, in definitive proxy or information statements incorporated by reference in Part III of this Form 10-K or any amendment to this Form 10-K.
Indicate by check mark whether the registrant is a large accelerated filer, an accelerated filer, a non-accelerated filer, or a smaller reporting company. See the definitions of “large accelerated filer,” “accelerated filer” and “smaller reporting company” in Rule 12b-2 of the Exchange Act. (Check one):
Large accelerated filer Accelerated filer Non-accelerated filer (Do not check if a smaller reporting company)
Smaller reporting company
Indicate by check mark whether the registrant is a shell company (as defined in Rule 12b-2 of the Act). Yes No
As of June 30, 2016, the last business day of the registrant’s most recently completed second fiscal quarter, the aggregate market value of the registrant’s common stock held by non-affiliates of the registrant was approximately $149,522,937, based on the closing sales price of $11.32 per share as reported on the New York Stock Exchange. (For purposes of this calculation all of the registrant’s directors and executive officers are deemed affiliates of the registrant.)
As of February 21, 2017 the registrant had 32,221,380 shares of common stock outstanding for an aggregate market value of $352,179,683 ($420,120,859 on a fully diluted basis, including 6,216,027 common units of limited partnership interest in the registrant’s operating partnership) based on the closing sales price of $10.93.
Documents Incorporated by Reference Portions of the registrant’s Definitive Proxy Statement relating to its 2016 Annual Meeting of Stockholders are incorporated by reference into Part III of this report. The
registrant expects to file its Definitive Proxy Statement with the Securities and Exchange Commission within 120 days after December 31, 2016.

2
FARMLAND PARTNERS INC.
FORM 10-K FOR THE FISCAL YEAR ENDED DECEMBER 31, 2016
TABLE OF CONTENTS
PART I Item 1 Business 4Item 1A Risk Factors 15Item 1B Unresolved Staff Comments 37Item 2 Properties 37Item 3 Legal Proceedings 37Item 4 Mine Safety Disclosures 38PART II Item 5 Market For Registrant’s Common Equity, Related Stockholder Matters and Issuer Purchases
of Equity Securities 38
Item 6 Selected Financial Data 41Item 7 Management’s Discussion and Analysis of Financial Condition and Results of Operations 42Item 7A Quantitative and Qualitative Disclosures About Market Risk 70Item 8 Financial Statements and Supplementary Data 70Item 9 Changes and Disagreements with Accountants on Accounting and Financial Disclosure 70Item 9A Controls and Procedures 70Item 9B Other Information 71PART III Item 10 Directors, Executive Officers and Corporate Governance 71Item 11 Executive Compensation 71Item 12 Security Ownership of Certain Beneficial Owners and Management and Related Stockholder
Matters
71Item 13 Certain Relationships and Related Transactions, and Director Independence 71Item 14 Principal Accountant Fees and Services 71PART IV Item 15 Exhibits and Financial Statement Schedules 72Item 16 Form 10-K Summary 72Signatures 77

3
SPECIAL NOTE REGARDING FORWARD-LOOKING STATEMENTS We make statements in this Annual Report on Form 10-K that are forward-looking statements within the meaning of
the Private Securities Litigation Reform Act of 1995 (set forth in Section 27A of the Securities Act of 1933, as amended (the “Securities Act”), and Section 21E of the Securities Exchange Act of 1934, as amended (the “Exchange Act”)). These forward-looking statements include, without limitation, statements concerning projections, predictions, expectations, estimates, or forecasts as to our business, financial and operational results, future economic performance, crop yields and prices and future rental rates for our properties, as well as statements of management’s goals and objectives and other similar expressions concerning matters that are not historical facts. When we use the words “may,” “should,” “could,” “would,” “predicts,” “potential,” “continue,” “expects,” “anticipates,” “future,” “intends,” “plans,” “believes,” “estimates” or similar expressions or their negatives, as well as statements in future tense, we intend to identify forward-looking statements. Although we believe that the expectations reflected in such forward-looking statements are based upon reasonable assumptions, beliefs and expectations, such forward-looking statements are not predictions of future events or guarantees of future performance and our actual results could differ materially from those set forth in the forward-looking statements. Some factors that might cause such a difference include the following: general volatility of the capital markets and the market price of our common stock, changes in our business strategy, availability, terms and deployment of capital, our ability to refinance existing indebtedness at or prior to maturity on favorable terms, or at all, availability of qualified personnel, changes in our industry, interest rates or the general economy, the degree and nature of our competition, our ability to identify new acquisitions and close on pending acquisitions, and the other factors described in the risk factors included in Item 1A herein and in other documents that we file from time to time with the Securities and Exchange Commission (the “SEC”). Given these uncertainties, undue reliance should not be placed on such statements. We assume no obligation to update forward-looking statements to reflect actual results, changes in assumptions, or changes in other factors affecting forward-looking information, except to the extent required by law.

4
PART I Item 1. Business Our Company
References to “we,” “our,” “us” and “our company” refer to Farmland Partners Inc., a Maryland corporation, together with our consolidated subsidiaries, including Farmland Partners Operating Partnership, L.P., a Delaware limited partnership (the “Operating Partnership”), of which we are the sole member of the sole general partner.
We are the largest public farmland real estate investment trust in the nation, spanning more than 147,000 acres across 17 states. Our company is currently diversified across 100 tenant farmers who grow more than 26 major commercial crops. As of the date of this Annual Report, approximately 75% of the acres in our portfolio are used to grow primary crops, such as corn, soybeans, wheat, rice and cotton, and approximately 25% of the acres in our portfolio are used to grow specialty crops, such as almond, citrus, blueberries, vegetables and edible beans. In addition, under the FPI Loan Program, we make loans to third-party farmers (both tenant and non-tenant) to provide partial financing for working capital requirements and operational farming activities, farming infrastructure projects, and for other farming and agricultural real estate related purposes.
On February 2, 2017, we closed the previously announced merger with American Farmland Company (“AFCO”) in
a stock-for-stock transaction (the “AFCO Mergers”). For more information regarding the AFCO Mergers, see “—AFCO Mergers” below and footnote 11 to our consolidated financial statements.
All of our assets are held by, and our operations are primarily conducted through, the Operating Partnership and its
wholly owned subsidiaries. As of the date of this Annual Report we own 83.8% of the Class A common units of limited partnership interest in the Operating Partnership (“OP units”) and none of the Series A preferred units of limited partnership interest in the Operating Partnership (“Preferred units”). Unlike holders of our common stock, holders of OP units and Preferred units do not have voting rights or the power to direct our affairs. See Note 9 to our consolidated financial statements for additional information regarding the Preferred units.
As of the date of this Annual Report, we own approximately 142,223 total acres. We intend to continue to acquire additional farmland to increase scale in and further diversify our portfolio by geography and crop type. During 2016, we continued our geographic diversification into two additional new states and had acquisitions under contract that closed after December 31, 2016 in two additional states. In 2016, we had lease options on four of our farms for solar and wind production on our farmland. We also may acquire, and make loans secured by mortgages on, properties related to farming, such as grain storage facilities, grain elevators, feedlots, processing plants and distribution centers, as well as livestock farms or ranches. In addition, during 2016, we engaged directly in farming through FPI Agribusiness Inc., our taxable REIT subsidiary (the “TRS” or “FPI Agribusiness”), whereby we operate a small number of acres (approximately 2,605 acres during 2016) relying on custom farming contracts with local farm operators.
Our principal source of revenue is rent from tenants that conduct farming operations on our farmland. The majority
of our leases that are in place as of the date of this Annual Report have fixed annual rental payments. Some of our leases have variable rents based on the revenue generated by our farm-operator tenants. We believe that this mix of fixed and variable rents will help insulate us from the variability of farming operations and reduce our credit-risk exposure to farm-operator tenants, while making us an attractive landlord in certain regions where variable leases are customary. However, we may be exposed to tenant credit risk and farming operation risks, particularly with respect to leases that do not require advance payment of at least 50% of the annual rent, leases for which the rent is based on a percentage of a tenant's farming revenues and leases with terms greater than one year.
We elected and qualified to be taxed as a real estate investment trust (“REIT”) for U.S. federal income tax purposes
commencing with our short taxable year ended December 31, 2014.

5
Full Year 2016 and Recent Highlights During 2016:
Net income increased 255% from 2015 for a total of $6.0 million as compared to 2015 net income of $1.7 million
Operating revenues increased 125% from 2015 for a total of $31.0 million as compared to 2015 operating revenues of $13.8 million
Net operating income increased 126% from 2015 for a total of $28.6 million as compared to 2015 net operating income of $12.7 million
Adjusted Funds from Operations (“AFFO”) increased 172% from 2015 for a total of $11.0 million as compared to 2015 AFFO of $4.1 million
Contractual rents for the same-property portfolio increased 2.8%, or $0.3 million, as compared to 2015 We announced the inclusion of the Company’s common stock to the Russell 3000 Index, Russell 2000
Index, and Russell Global Index We announced the merger with American Farmland Company (“AFCO”) in a stock-for-stock transaction
To date in 2017, the Company has closed on $317.4 million of farm acquisitions totaling 26,734 acres.
For a definition of AFFO and a reconciliation of net income to AFFO, see “Item 7. Management’s Discussion and Analysis of Financial Condition and Results of Operations – Non-GAAP Financial Measures.” AFCO Mergers On February 2, 2017, we completed the previously announced merger with AFCO at which time one of the Company’s wholly owned subsidiaries was merged with and into American Farmland Company L.P. (“AFCO OP”) with AFCO OP surviving as a wholly owned subsidiary of the Operating Partnership (the “Partnership Merger”), and AFCO merged with and into another one of our wholly owned subsidiaries with such wholly owned subsidiary surviving. At the effective time of the Company Merger, each share of common stock of AFCO, par value $0.01 per share (“AFCO Common Stock”), issued and outstanding immediately prior to the effective time of the Company Merger (other than any shares of AFCO Common Stock owned by any wholly owned subsidiary of AFCO or by us or the Operating Partnership or any wholly owned subsidiary of us or the Operating Partnership), was automatically converted into the right to receive, subject to certain adjustments, 0.7417 shares of our common stock (the “Company Merger Consideration”). In addition, in connection with the Company Merger, each outstanding AFCO restricted stock unit that had become fully earned and vested in accordance with its terms was, at the effective time of the Company Merger, converted into the right to receive the Company Merger Consideration. We issued 14,763,604 shares of our common stock as consideration in the Company Merger and 17,373 shares of our common stock in respect of fully earned and vested AFCO restricted stock units. At the effective time of the Partnership Merger, each common unit of limited partnership interest in AFCO OP issued and outstanding immediately prior to the effective time of the Partnership Merger, was converted automatically into the right to receive, subject to certain adjustments, 0.7417 OP units. We issued 218,525 OP units as consideration in the Partnership Merger. We believe that following the AFCO Mergers, our portfolio gives investors exposure to the increasing global food demand trend in the face of growing scarcity of high quality farmland and will reflect the approximate breakdown of U.S. agricultural output between primary crops and animal protein (whose production relies principally on primary crops as feed), on one hand, and specialty crops, on the other. We are now the largest public farmland REIT in the nation with a portfolio comprised of approximately 142,223 acres across 16 states, along both Coasts, the Midwest, the Plains, the Southeast and the Delta.

6
Our Competitive Strengths
We believe the following competitive strengths distinguish us from many of our competitors:
High-Quality Portfolio of Farmland. As of the date of this Annual Report, we own approximately 142,223 acres in core agricultural markets that we believe are characterized by high demand for and limited available supply of farmland. Crops produced on our farms address the vast majority of the spectrum of worldwide demand for food, feed, fuel and fiber.
Management Team with Extensive Experience in Agricultural Real Estate. Our management team has
extensive experience as owners of agricultural real estate and operators of farming businesses. We believe our deep understanding of agribusiness fundamentals and insight into factors affecting the value of farmland gives us a competitive advantage over many institutional owners and acquirers of farmland in, among other activities, structuring acquisitions and securing high-quality tenants.
Expansive Relationships in the Agricultural Sector. Our management team’s extensive experience as
owners of agricultural real estate and operators of farming businesses has helped us build expansive and strong relationships across a broad network of businesses and individuals in the agricultural sector, including family and corporate farms, real estate brokers, lenders, auction houses and suppliers of agricultural goods. We believe that these relationships provide us with valuable market intelligence related to agriculture fundamentals and provide us access to acquisition opportunities, many of which may not be available to our competitors.
Early-Mover Advantage as a Leading Owner of Farmland. Ownership of U.S. farmland historically has
been, and continues to be, extremely fragmented, with the vast majority of farmland being owned by families and individuals. According to the USDA, as of 2012, approximately 87% of farms in the United States were owned by families, and the average age of principal farm operators in the United States was 58 years old. We are one of the first public companies focused on owning and acquiring farmland in the United States. We believe our flexible capital structure, together with our ability as a public company to access the capital markets, will allow us to secure an early-mover advantage to become a large-scale, national owner of high-quality farmland.
Strong Alignment of Interests. As of the date of this Annual Report, our executive officers and our directors
collectively own approximately 6.5% of the equity interests in our company on a fully diluted basis, which we believe aligns their interests with those of our stockholders.
Our Business and Growth Strategies Our principal business objective is to provide attractive stockholder returns through a combination of: (1) quarterly
cash distributions to our stockholders; (2) sustainable long-term growth in cash flows from increased rents, which we hope to pass on to stockholders in the form of increased distributions; (3) additional cash flows derived from increased rents in connection with farm improvements (such as irrigation and drainage) and non-farming income streams (such as wind and solar leases); and (4) potential long-term appreciation in the value of our properties due in part to increasing farmland scarcity in the face of growing global food demand. Our primary strategy to achieve our business objective is to invest in, own and lease a portfolio of farmland and properties related to farming operations. Key components of our strategy include the following:
Focus on Current Rental Income Generation and Long-Term Appreciation. We own and intend to acquire
farmland that we believe offers attractive risk-adjusted returns through a combination of stable rental income generation and value appreciation. We expect to continue to lease our farmland to experienced and successful third-party farm operators, including sellers who desire to continue farming the land after we acquire it. We expect our farmland leases to generate stable near-term cash flows and increasing rental income over the long term. In certain circumstances, we look for alternative uses for our farms (such as solar and wind leases) when we believe it will create greater value for our stockholders. We intend to hold our properties for investment with a view to long-term appreciation, which we believe will result in attractive risk-adjusted

7
returns to our stockholders. However, if we believe it to be in the best interests of our stockholders, we may elect to sell one or more of our properties from time to time in a manner consistent with our investment objectives and our intention to continue to qualify as a REIT.
Continue Our Disciplined Farmland Acquisition Strategy Based on Agriculture Fundamentals. We intend to continue to acquire high-quality farmland that we believe is positioned to take advantage of global food supply and demand trends. We expect to acquire and hold farmland in geographic areas with clear production advantages and that historically have had a stable population of experienced and successful farm operators. We believe that we benefit from our management’s and staff’s extensive experience as owners and operators of agricultural real estate in identifying acquisition opportunities that satisfy our investment criteria and underwriting standards. Our acquisition strategy includes the following key components:
Target Farms of Varying Sizes—We seek to acquire farms of varying sizes. We believe that our
personnel and infrastructure allow us to perform due diligence on smaller farms quickly and efficiently, which provides us with an advantage over competitors that we believe do not have the investment focus or flexibility to pursue acquisitions of smaller farms. In addition, we believe small individual and family farmland buyers often are not as well capitalized as we are and may be unable to compete with us for acquisition opportunities of larger farms comprised of 1,500 or more tillable acres.
Acquire Farmland from Undercapitalized Owners—While we do not believe there is widespread financial distress among farmland owners, we do believe that, to a limited extent, undercapitalization, overleverage and unforeseen circumstances at some individual and family farms will provide opportunities for us to acquire high-quality farmland at attractive prices, potentially in purchase-leaseback transactions. We believe our management’s and staff’s knowledge of agribusiness fundamentals and broad network of relationships allow us to pursue acquisition opportunities from undercapitalized or unsuccessful sellers in markets where we believe we can find experienced and successful farm operators (including, in some cases, the existing owners) to lease the farmland from us at competitive rates and where we believe market fundamentals support future value appreciation potential.
Use OP Units as Acquisition Currency—We believe there are a large number of farm operators and
farm families that own farmland that has substantially appreciated in value. As a result, we believe that many farm-owning families have estate planning needs and a desire to defer current income taxes, and that our ability to offer OP units as acquisition currency provides us with a strategic advantage over other potential farm buyers and possibly induce these prospective sellers to sell their farms earlier than they otherwise would in cash-only transactions. Since our inception, we have completed several farm acquisitions, including two of our largest acquisitions to date, using OP units as partial consideration.
Utilize Our Real Estate Management Platform to Achieve Economies of Scale. We believe that the
overhead costs associated with the business of owning and leasing farmland are less than those required by other property types, such as office, multifamily and retail, due to the limited asset management, capital expenditure and tenant improvement requirements for farmland and a near-zero vacancy rate for quality farmland in quality markets. In addition, the terms of the leases with our tenants generally provide that we are responsible for major maintenance, insurance and taxes (which are generally reimbursed to us by our tenants), while our tenants are responsible for minor maintenance, water usage and all of the additional input costs related to the farming operations on the property, such as seed, fertilizer, labor and fuel. As a result, we believe that our existing systems and personnel are capable of supporting a significant increase in the size of our portfolio without a proportional increase in administrative or management costs. We also believe that, once we achieve scale in our portfolio, we will be able to realize significant cost savings and greater operational efficiency.
Leverage Our Infrastructure to Expand into the Lending Business. We believe that our existing systems
and personnel are well suited to source, diligence, close and manage loans under the FPI Loan Program at little or no additional costs. We believe that the business of making loans secured by mortgages on farmland

8
is highly complementary to and synergistic with our core business of investing in farmland. We generally find potential borrowers during the process of sourcing farm acquisitions. We conduct due diligence on loan collateral the same way we conduct due diligence on potential farm acquisitions, and we screen potential borrowers the same way we screen potential tenants. The FPI Loan Program also gives us an increased visibility in the marketplace, thereby benefiting our core farmland investing business.
Maintain Diversification of our Portfolio by Geography, Crop Type and Tenant. Since our initial public
offering, we have significantly increased the diversification of our portfolio by geography, crop type and tenant. We believe our portfolio now provides investors with broad diversification that closely mirrors aggregate U.S. production. We expect to maintain an approximate portfolio composition of 75% primary crops and 25% specialty crops as we continue to expand our holdings. As we acquire properties we will seek further exposure to core farming regions and commercial crops.
Leverage Economies of Scale in Our Tenants’ Combined Farming Operations. Farm operators typically
do not have a scale that gives them bargaining power with many of their suppliers. Conversely, suppliers to farm operators incur significant marketing costs in reaching out to a highly fragmented customer base. We intend to create value for our farm-operator tenants as well as for some of their suppliers by aggregating our tenants’ purchases of certain inputs – such as seed, fertilizer and equipment – and offering such aggregated purchases from selected suppliers on discounted terms. We believe that, by performing this role as an aggregator, we will be able to retain some of the value created for the ultimate benefit of our stockholders.
Our ability to effectively implement our business and growth strategies is subject to numerous risks and uncertainties,
including those set forth under "Risk Factors—Risks Related to Our Business and Properties."
Investment Focus
We seek to invest in farmland that will give our stockholders exposure to a well-diversified portfolio of high-quality U.S. farmland, while offering an attractive risk-adjusted combination of stable rental income generation and value appreciation. Our principal investment focus is on farmland located in agricultural markets throughout North America; however, we may seek to acquire farmland outside of North America in the future. We also may acquire properties related to farming, such as grain storage facilities, grain elevators, feedlots, cold storage facilities, processing plants and distribution centers, as well as livestock farms or ranches. In addition, under the FPI Loan Program, we may provide mortgage loans secured by farmland and properties related to farming.
Crop Categories Primary vs Specialty Crops
Farm crops generally can be divided into two principal categories: primary crops and specialty crops. Primary crops include, among others, corn, soybeans, wheat, rice and cotton. Specialty crops can be again divided into two categories: annual specialty crops (generally vegetables) and permanent specialty crops (fruits and nuts grown on trees, bushes or vines). Over the long term, we expect that our farmland portfolio will continue to be comprised of approximately 75% primary crop farmland and 25% specialty crop farmland, which we believe will give investors exposure to the increasing global food demand trend in the face of growing scarcity of high quality farmland and will reflect the approximate composition of U.S. agricultural output between primary crops and animal protein (whose production relies principally on primary crops as feed), on one hand, and specialty crops, on the other.
Annual and Permanent Crops
Our portfolio includes farms that produce both annual and permanent crops. Annual crops are planted every year whereas permanent crops, such as trees, bushes and vines, are planted and bear crops over multiple years. We believe exposure to both annual and permanent crops is an attractive strategy and offers diversification benefits to our portfolio. Annual and permanent crops typically serve different end-markets and generally have uncorrelated pricing.

9
U.S. Farmland Property
We believe that the United States offers farmland investors exposure to financial benefits driven by the fundamentals of agricultural production and farmland appreciation without many of the risks that come with farmland investments in many other countries. In the United States, the farmland market is relatively liquid and there is virtually no land title risk. Moreover, the United States has the largest, lowest-cost grain transportation infrastructure in the world, leaving more margin to the grain producer and landowner. Lastly, we believe that in most major U.S. agricultural markets, multiple quality farm-operator tenants compete for farmland lease opportunities.
We may consider investing in farmland in other countries that, like the United States, offer virtually no land title risk,
a sophisticated farm-operator tenant environment and attractive rental rates, such as Canada, Australia or New Zealand. Leased Properties
Farming land for crops carries significant operating risk, although it can be mitigated through crop insurance and other risk management tools. If a crop fails or the land does not produce the anticipated amount of crops, the farm operator may experience an economic loss. We believe that through leasing farmland, rather than farming it ourselves, we will mitigate this risk significantly. We expect to continue to lease a majority of our properties on a fixed-rent basis that does not depend on the success of the tenant's farming operations. Moreover, a majority of the leases in our portfolio provide that at least 50% (and often 100%) of the annual rent is due and payable in advance of each spring planting season, and we expect that a majority of the fixed-rent leases we enter into in the future will have a similar requirement, which reduces our credit-risk exposure in the event of operational issues with the farm-operator tenant. However, to the extent we enter into leases that do not require advance payment of 100% of the annual rent or have terms greater than one year, we may be subject to tenant credit risk and more susceptible to the risks associated with declines in the profitability of tenants’ farming operations, and we take such risk into consideration when evaluating the potential return on a farm. We may use variable-rent leases, which depend in part on crop yields and prices, in regions where such arrangements are prevalent or when we expect that such arrangements will be more profitable to us on a risk-adjusted basis. We also may utilize hybrid lease arrangements that require a modest rent payment at lease inception and an additional rent payment based on a percentage of the revenue from the tenant's harvest for that year.
We expect to continue to lease the majority of our primary crop farmland and other farming related properties under leases that require the tenant to either pay or reimburse us for substantially all of the property’s operating expenses, including maintenance, water usage and insurance, as well as all of the input costs related to the farming operations, such as seed, fertilizer, labor and fuel. Consistent with industry practices, we expect that we will generally be responsible for the maintenance of plantings and associated improvements on our permanent crop farmland while our tenants will be responsible for all operating costs. Several of our leases provide for the reimbursement by the tenant of the property’s real estate taxes that we pay in connection with the farms they rent from us. The rental payments we receive from the farm operators will be the primary source of any distributions that we make to our stockholders.
We expect that over time rental income will increase. Most farmland in the areas where we own or intend to acquire
land is leased under short-term leases (typically five years or less), and we plan to lease our property under short-term leases. By entering into short-term leases, we believe we will be in a position to increase our rental rates when the leases expire and are renewed or the land is re-leased, if prevailing rental rates have increased. However, we can provide no assurances that we will be able to increase our rental rates, or even maintain them at the same level, when the leases are renewed or the land is re-leased.
We believe quality farmland has a near-zero vacancy rate, and we believe that high-quality farmland in an area with a competitive tenant environment is generally leased and farmed each year. For leases that provide that a substantial portion of rental payments for a crop year are due in advance of the spring planting season, in the event of a tenant's failure to pay rent when due, we will seek to terminate the lease and rent the property to another tenant that could then plant and harvest a crop that year. As a result, we believe there is a reduced risk of vacancy on our properties when compared to most other types of commercial properties, such as office buildings or retail properties.
10
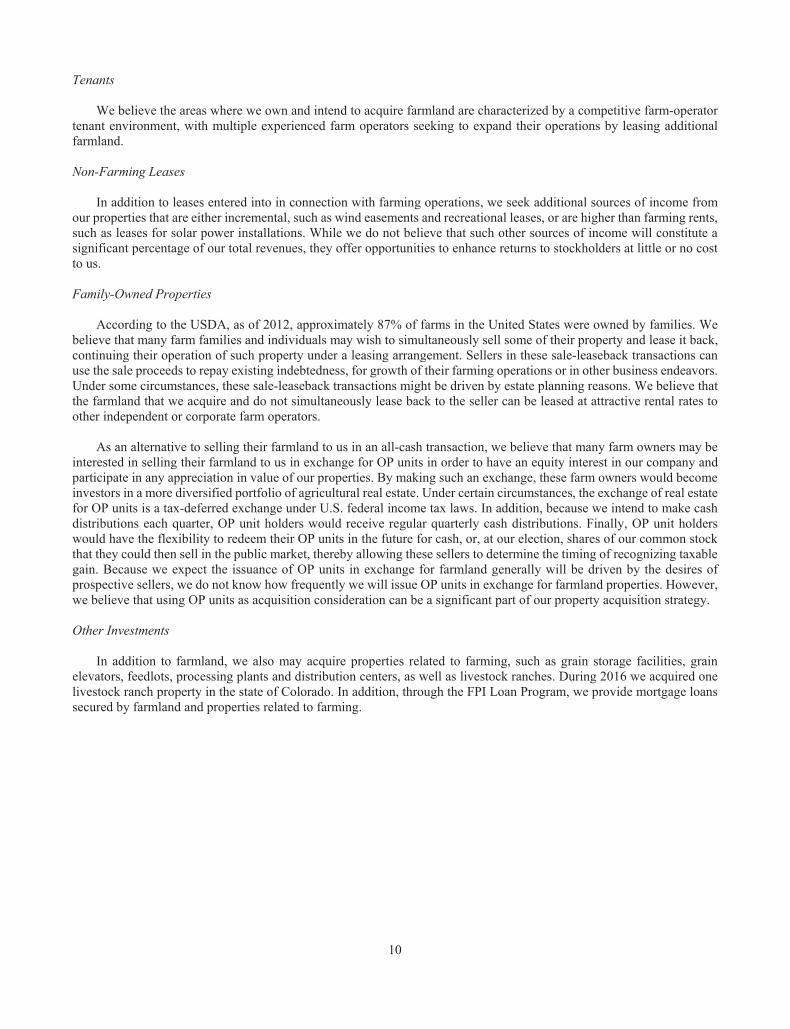
Tenants
We believe the areas where we own and intend to acquire farmland are characterized by a competitive farm-operator tenant environment, with multiple experienced farm operators seeking to expand their operations by leasing additional farmland.
Non-Farming Leases
In addition to leases entered into in connection with farming operations, we seek additional sources of income from our properties that are either incremental, such as wind easements and recreational leases, or are higher than farming rents, such as leases for solar power installations. While we do not believe that such other sources of income will constitute a significant percentage of our total revenues, they offer opportunities to enhance returns to stockholders at little or no cost to us. Family-Owned Properties
According to the USDA, as of 2012, approximately 87% of farms in the United States were owned by families. We believe that many farm families and individuals may wish to simultaneously sell some of their property and lease it back, continuing their operation of such property under a leasing arrangement. Sellers in these sale-leaseback transactions can use the sale proceeds to repay existing indebtedness, for growth of their farming operations or in other business endeavors. Under some circumstances, these sale-leaseback transactions might be driven by estate planning reasons. We believe that the farmland that we acquire and do not simultaneously lease back to the seller can be leased at attractive rental rates to other independent or corporate farm operators.
As an alternative to selling their farmland to us in an all-cash transaction, we believe that many farm owners may be interested in selling their farmland to us in exchange for OP units in order to have an equity interest in our company and participate in any appreciation in value of our properties. By making such an exchange, these farm owners would become investors in a more diversified portfolio of agricultural real estate. Under certain circumstances, the exchange of real estate for OP units is a tax-deferred exchange under U.S. federal income tax laws. In addition, because we intend to make cash distributions each quarter, OP unit holders would receive regular quarterly cash distributions. Finally, OP unit holders would have the flexibility to redeem their OP units in the future for cash, or, at our election, shares of our common stock that they could then sell in the public market, thereby allowing these sellers to determine the timing of recognizing taxable gain. Because we expect the issuance of OP units in exchange for farmland generally will be driven by the desires of prospective sellers, we do not know how frequently we will issue OP units in exchange for farmland properties. However, we believe that using OP units as acquisition consideration can be a significant part of our property acquisition strategy. Other Investments
In addition to farmland, we also may acquire properties related to farming, such as grain storage facilities, grain elevators, feedlots, processing plants and distribution centers, as well as livestock ranches. During 2016 we acquired one livestock ranch property in the state of Colorado. In addition, through the FPI Loan Program, we provide mortgage loans secured by farmland and properties related to farming.

11
Underwriting Criteria and Due Diligence Process Selecting the Property
We seek to acquire high quality farmland that offers an attractive risk-adjusted balance of current returns and appreciation potential. We believe our management team’s deep understanding of agribusiness fundamentals and insight into factors affecting the value of farmland allow us to identify properties consistent with our investment criteria. We believe the following factors are important in the selection of farmland:
Soil Quality—Soil quality is a fundamental determinant of farmland productivity and therefore of its value. In
considering farmland for purchase, we take soil quality into consideration to determine whether the farmland is attractively priced. In general, we focus on farmland with average or better-than-average soil.
Water Availability—Appropriate water availability is an essential input to farming and key consideration in determining the productivity and value of farmland. We seek to acquire farmland where water availability through precipitation and irrigation meets the agronomic needs of the crops expected to be grown. As part of our acquisition due diligence process, we evaluate properties for water availability and any associated ground or surface water rights. Where appropriate, we may also invest in irrigation infrastructure to improve the productivity of properties we own. Occasionally we may acquire farmland at prices that more than compensate us for any potential reduction in water availability, which, in the future may result in a shift to different crops or production systems.
Robust and Competitive Tenant Environment—We focus primarily on farmland located in areas characterized by
a robust and competitive tenant environment, with a relatively large population of experienced farm operators as potential tenants.
Market Access—Due to the higher costs of road transportation, the location of primary crop farmland relative to
points of demand (e.g., grain elevators, feedlots and ethanol plants) or access to low-cost transportation (e.g., river ports and rail loading facilities) determines the premium or discount in farm-gate commodity prices compared to the general market prices (also known as “basis”), and therefore is one of the factors that impacts its value. We focus on acquiring primary crop farmland in areas with substantial farming infrastructure and low transportation costs, including markets with access to river and rail transportation.
Climate—Crops have particular climatic growing requirements. As such, we seek to acquire properties in regions
with climates conducive to the expected crops. We believe that diversification within and across core farming regions and crop types provides significant annual and long-term risk mitigation to our investors.
We perform a due diligence review with respect to each potential property acquisition. The due diligence investigation
includes both property-specific factors (e.g., soil types and fertility, water availability and rights, topographical characteristics and property taxes) and location-specific factors (e.g., climate, tenant availability and quality, and market access). As part of our due diligence process, we also perform a valuation of each target property and estimate expected lease rates.
Selecting Tenants
We intend to continue to focus primarily on farm properties located in areas with a robust and competitive environment of experienced tenants. In general, the tenant selection process focuses primarily on candidates' experience and reputation based upon background and reference checks of potential tenants, as well as their willingness and ability to pay competitive rental rates. We consider similar factors in analyzing sale-leaseback transactions. In geographic areas where we already own one or more properties, we may give our existing local tenants priority consideration, especially in exchange for sourcing a property acquisition opportunity. We often mitigate tenant credit risk by requiring a significant portion of a year's rent in advance of each spring planting season whenever possible, by requiring a tenant to adopt crop insurance, and/or by securing agricultural or statutory liens on growing crops. In addition, we monitor our existing tenants by periodically conducting site visits of the farms and meeting with the tenants to discuss their farming operations and the

12
condition of the farms. However, in some circumstances, we may be exposed to tenant credit risk and may be subject to farming operation risks, such as adverse weather conditions and declines in commodity prices, particularly with respect to leases that do not require advance payment of 100% of the annual rent, variable-rent leases for which the rent is based on a percentage of a tenant's farming revenues and leases with terms greater than one year. See "Risk Factors—Risks Related to Our Business and Properties.” We do not intend to continuously monitor and evaluate tenant credit quality and may be subject to risks associated with our tenants' financial condition and liquidity position. FPI Loan Program
We believe that our existing systems and personnel are well suited to source, diligence, close and manage loans under the FPI Loan Program at little or no additional cost to us. We believe that the business of making loans secured by mortgages on farmland is highly complementary to, and synergistic with, our core business of investing in farmland. We generally find potential borrowers during the process of sourcing farm acquisitions. We conduct due diligence on loan collateral the same way we conduct due diligence on potential farm acquisitions, and we screen potential borrowers the same way we screen potential tenants. The FPI Loan Program offering gives us an increased visibility in the marketplace, thereby benefiting our core farmland investing business. Seasonality
Because the leases for many of the properties in our portfolio require significant payments in advance of the spring planting season, we receive a significant portion of our cash rental payments in the first calendar quarter of each year, although we recognize rental revenue from these leases on a pro rata basis over the non-cancellable term of the lease in accordance with GAAP. The highly seasonal nature of the agriculture industry causes seasonality in our business to some extent. Our financial performance should be evaluated on an annual basis, which eliminates quarterly performance variability due to crop share revenues, lease periods not matching fiscal years, and other similar factors that may cause our quarterly results to vary during the course of the year.
Our Properties
As of the date of this Annual Report, we own approximately 142,223 total acres of farmland. See “Managements’ Discussion and Analysis of Financial Condition and Results of Operations” for more information about our portfolio. The distribution of farms by regions is as follows:
Region Total Acres Corn Belt 45,571 Delta + South 27,435 High Plains 27,590 Southeast 35,332 West Coast 6,295 142,223
Corn Belt includes farm located in Illinois, Michigan, eastern Nebraska. Delta + South includes farms located in
Arkansas, Louisiana, and Mississippi. High Plains includes farms located in Colorado, Kansas, western Nebraska, and Texas. Southeast includes farms located in Florida, Georgia, North Carolina, South Carolina, and Virginia. West Coast includes farms located in California.

13
As of the date of this Annual Report, our portfolio has the following rents or rent estimates for 2017 by lease type or status:
($ in thousands) Lease Type or Status - as of the date of this Annual Report 2017 Rent % Leases in place with third parties
Fixed rent (1) $ 26,807 67.9 % Variable rent (2) 7,647 19.4 %
Leases being negotiated (3) 5,043 12.7 % $ 39,497 100.0 % Leases on farms that are currently under contract(4) 432 Crop sale variable revenue(5) 701 $ 40,630
(1) Includes the fixed rent portion of leases providing for fixed and variable rent components. (2) Management estimate based on farms’ historical productivity and regional crop price projections. We can provide no assurance that crop yields
and prices will reach expected levels or that we will obtain the rents we anticipate. (3) Management estimate based on the current status of lease negotiations and the current leasing market environment for each farm. We can provide
no assurance that the rents we obtain will reflect the current status of our lease negotiations or the current leasing market environment for each farm.
(4) The Company has seven properties under contract. We can provide no assurance that these properties will close or that the rents we obtain will reach expected levels or that we will obtain the rents we anticipate.
(5) As part of the AFCO acquisition, certain properties are currently in the final stage of development. During the final stage of development the harvested crop will generate income for the Company.
Tax Status
We elected and qualified to be taxed as a REIT for U.S. federal income tax purposes commencing with our short taxable year ended December 31, 2014. Our qualification as a REIT will depend upon our ability to meet, on a continuing basis, through actual investment and operating results, various complex requirements under the Internal Revenue Code of 1986, as amended (the “Code”), relating to, among other things, the sources of our gross income, the composition and values of our assets, our distribution levels and the diversity of ownership of our capital stock. We believe that we are organized in conformity with the requirements for qualification as a REIT under the Code and that our intended manner of operation will enable us to meet the requirements for qualification and taxation as a REIT for U.S. federal income tax purposes.
As a REIT, we generally will not be subject to U.S. federal income tax on our taxable income that we distribute to our
stockholders. Under the Code, REITs are subject to numerous organizational and operational requirements, including a requirement that they distribute on an annual basis at least 90% of their REIT taxable income, determined without regard to the deduction for dividends paid and excluding any net capital gains. If we fail to qualify for taxation as a REIT in any taxable year and do not qualify for certain statutory relief provisions, our income for that year will be subject to tax at regular corporate rates, and we would be disqualified from taxation as a REIT for the four taxable years following the year during which we ceased to qualify as a REIT. Even if we qualify as a REIT for U.S. federal income tax purposes, we may still be subject to state and local taxes on our income and assets and to U.S. federal income and excise taxes on our undistributed income. Additionally, any income earned by FPI Agribusiness Inc., our taxable REIT subsidiary, and any other taxable REIT subsidiaries (“TRSs”) that we form or acquire in the future will be fully subject to U.S. federal, state and local corporate income tax. Insurance
Under the terms and conditions of the leases on our current properties, tenants are generally required, at their expense, to obtain and keep in full force during the term of the lease, liability and property damage insurance policies and to name us an additional insured party. These policies include liability coverage for bodily injury and property damage arising out of the ownership, use, occupancy or maintenance of the properties and all of their appurtenant areas. In addition to our tenants' insurance policies under which we will be an additional insured party, we also maintain comprehensive liability and casualty insurance covering all of our properties under a blanket insurance policy, which provides coverage to the extent there is insufficient coverage under our tenants' policies.

14
Regulation Farming Regulation
The farmland that we own and intend to acquire is used for growing crops and is subject to the laws, ordinances and regulations of state, local and federal governments, including laws, ordinances and regulations involving land use and usage, water rights, treatment methods, disturbance, the environment and eminent domain.
Farmland is principally subject to environmental and agricultural laws, ordinances and regulations. Each
governmental jurisdiction has its own distinct laws, ordinances and regulations governing the use of farmland. Many such laws, ordinances and regulations seek to regulate water usage and water runoff because water can be in limited supply, as is the case where certain of the properties in our portfolio are located.
All of the farms in our portfolio have sources of water, including expected precipitation, wells and/or surface water,
that currently provide sufficient amounts of water necessary for the current farming operations at each location. However, should the need arise for additional water from wells and/or surface water sources, such permits and approvals may be difficult to obtain in areas with limited supply of available water. We believe that as of the date of this Annual Report our farms are in compliance with applicable state, county and federal environmental and agricultural regulations.
In addition to the regulation of water usage and water runoff, state, local and federal governments also seek to regulate
the type, quantity and method of use of chemicals and materials for growing crops, including fertilizers, pesticides and nutrient rich materials. Such regulations could include restricting or preventing the use of such chemicals and materials near residential housing or near water sources. Further, some regulations have strictly forbidden or significantly limited the use of certain chemicals and materials.
As an owner of farmland, we may be liable or responsible for the actions or inactions of our tenants with respect to
these laws, regulations and ordinances. Real Estate Industry Regulation
Generally, the ownership and operation of real properties is subject to various laws, ordinances and regulations, including regulations relating to zoning, land use, water rights, wastewater, storm water runoff and lien sale rights and procedures. These laws, ordinances or regulations, such as the Comprehensive Environmental Response and Compensation Liability Act (“CERCLA”) and its state analogs, or any changes to any such laws, ordinances or regulations, could result in or increase the potential liability for environmental conditions or circumstances existing, or created by tenants or others, on our properties. Laws related to upkeep, safety and taxation requirements may result in significant unanticipated expenditures, loss of our properties or other impairments to operations, any of which would adversely affect our cash flows from operating activities.
Environmental Matters
As an owner of real estate, we will be subject to various federal, state and local environmental laws, regulations and
ordinances and also could be liable to third parties resulting from environmental contamination or noncompliance at our properties. Environmental laws often impose liability without regard to whether the owner or operator knew of or was responsible for the presence of the contaminants. The costs of any required investigation or cleanup of these substances could be substantial. The liability is generally not limited under such laws and could exceed the property’s value and the aggregate assets of the liable party. The presence of contamination or the failure to remediate contamination at our properties also may expose us to third-party liability for personal injury or property damage or adversely affect our ability to lease the real property or to borrow using the real estate as collateral. These and other risks related to environmental matters are described in more detail in “Item 1A. Risk Factors.”

15
Competition
Competition to our efforts to acquire farmland can come from many different entities. Individual farmers are the most active buyers of farmland. Institutional investors, investment funds, other farmland REITs, individual investors and others also compete for farmland acreage. Investment firms that we might compete directly against could include agricultural investment firms such as Westchester Agriculture Asset Management (a TIAA company), Hancock Agricultural Investment Group, Ceres Partners, Gladstone Land Corp, and UBS Agrivest, LLC. These firms engage in the acquisition, asset management, valuation and disposition of farmland properties.
Employees
At February 23, 2017, we had 18 employees. None of our employees is a member of a labor union. Corporate Information
Our executive offices are located at 4600 South Syracuse Street, Suite 1450, Denver, Colorado 80237. Our telephone number at our executive offices is (720) 452-3100 and our corporate website is www.farmlandpartners.com. The information on, or accessible through, our website is not incorporated into and does not constitute a part of this Annual Report on Form 10-K or any other report or document we file with or furnish to the SEC. Available Information
We file our Annual Report on Form 10-K, Quarterly Reports on Form 10-Q, Current Reports on Form 8-K, and all amendments to those reports with the SEC. You may obtain copies of these documents by visiting the SEC’s Public Reference Room at 100 F Street, N.E., Washington, D.C. 20549, by calling the SEC at 1-800-SEC-0330 or by accessing the SEC’s website at www.sec.gov. In addition, as soon as reasonably practicable after such materials are furnished to the SEC, we make copies of these documents available to the public free of charge through our website or by contacting our Secretary at the address set forth above under “—Corporate Information.”
Our Corporate Governance Guidelines, Code of Business Conduct and Ethics, and the charters of our audit committee,
compensation committee and nominating and corporate governance committee are all available in the Governance Documents section of the Corporate Information section of our website. Financial Information
For required financial information related to our operations, please refer to our consolidated financial statements, including the notes thereto, included within this Annual Report on Form 10-K.
Item 1A. Risk Factors
Set forth below are the risks that we believe are material to our stockholders. You should carefully consider the
following risks in evaluating our Company and our business. The occurrence of any of the following risks could materially adversely impact our financial condition, results of operations, cash flow, the market price of shares of our common stock and our ability to, among other things, satisfy our debt service obligations and to make distributions to our stockholders, which in turn could cause our stockholders to lose all or a part of their investment. Some statements in this report including statements in the following risk factors constitute forward-looking statements. Please refer to the section entitled “Special Note Regarding Forward-Looking Statements” at the beginning of this Annual Report on Form 10-K.

16
Risks Related to Our Business and Properties Our business is dependent in part upon the profitability of our tenants' farming operations, and a sustained downturn in the profitability of their farming operations could have a material adverse effect on the amount of rent we can collect and, consequently, our cash flow and ability to make distributions to our stockholders.
We depend on our tenants to operate the farms we own in a manner that generates revenues sufficient to allow them to meet their obligations to us, including their obligations to pay rent and real estate taxes, maintain certain insurance coverage and maintain the properties generally. The ability of our tenants to fulfill their obligations under our leases depends, in part, upon the overall profitability of their farming operations, which could be adversely impacted by, among other things, adverse weather conditions, crop prices, crop disease, pests, and unfavorable or uncertain political, economic, business or regulatory conditions. We are susceptible to any decline in the profitability of our tenants' farming operations for our variable-rent leases, pursuant to which the amount of rent depends on crop yields and prices realized by our tenants, as well as for our leases with terms longer than one year. In addition, many farms are dependent on a limited number of key individuals whose injury or death may affect the successful operation of the farm. We can provide no assurances that, if a tenant defaults on its obligations to us under a lease, we will be able to lease or re-lease that farm on economically favorable terms in a timely manner, or at all. In addition, we may experience delays in enforcing our rights as landlord and may incur substantial costs in protecting our investment.
As a result, any downturn in the profitability of the farming operations of our tenants or a downturn in the farming
industry as a whole could have a material adverse effect on our financial condition, results of operations, cash flow and ability to make distributions to our stockholders.
We have a substantial amount of indebtedness outstanding and near-term maturities, which may expose us to the risk of default under our debt obligations, restrict our operations and our ability to grow our business and revenues and restrict our ability to pay distributions to our stockholders.
As of December 31, 2016 and as of February 23, 2017, we had approximately $309.9 million and $420.5 million, respectively, of outstanding indebtedness, all of which is secured by mortgages on our farms. We intend to incur additional debt in connection with future acquisitions or for other purposes and, if necessary, we may borrow funds to make distributions to our stockholders in order to qualify and maintain our qualification as a REIT for U.S. federal income tax purposes. We have approximately $81.2 million of indebtedness maturing in 2017, including $20.7 million maturing on September 5, 2017, $5.5 million maturing on October 23, 2017, $10.7 million maturing on November 24, 2017, $13.4 million maturing on December 18, 2017 and $30.9 million maturing on December 22, 2017. To the extent that we do not have sufficient funds to repay our debt at maturity, it may be necessary to refinance the debt through new debt or equity financings, which may not be available on acceptable terms or at all and which could be dilutive to our stockholders. If we are unable to refinance our debt on acceptable terms or at all, we may be forced to dispose of farms at inopportune times or on disadvantageous terms, which could result in losses. In addition, our debt agreements include customary events of default, the occurrence of any of which, after any applicable cure period, would permit the lenders to, among other things, accelerate payment of all amounts outstanding under the loans and to exercise their remedies with respect to the collateral, including foreclosure and sale of the agricultural real estate securing the loans. Certain of our debt agreements also contain cross-default provisions that give the lender the right, in certain circumstances, to declare a default if we are in default under other loans. If any one of these events were to occur, our financial condition, results of operations, cash flow and ability to pay distributions to our stockholders could be materially and adversely affected.
Approximately 75% of our portfolio is comprised of properties used to grow primary crops such as corn, soybeans, wheat, rice and cotton, which subjects us to risks associated with primary row crops.
Approximately 75% of our portfolio is comprised of properties used to grow primary crops, such as corn, soybeans, wheat, rice and cotton. As a result, any development or situation that adversely affects the value of properties generally or the prices of corn, soybeans, wheat, rice or cotton could have a more significant adverse impact on us than if our portfolio had less exposure to primary crops, which could materially and adversely impact our financial condition, results of operations and ability to make distributions to our stockholders.
17
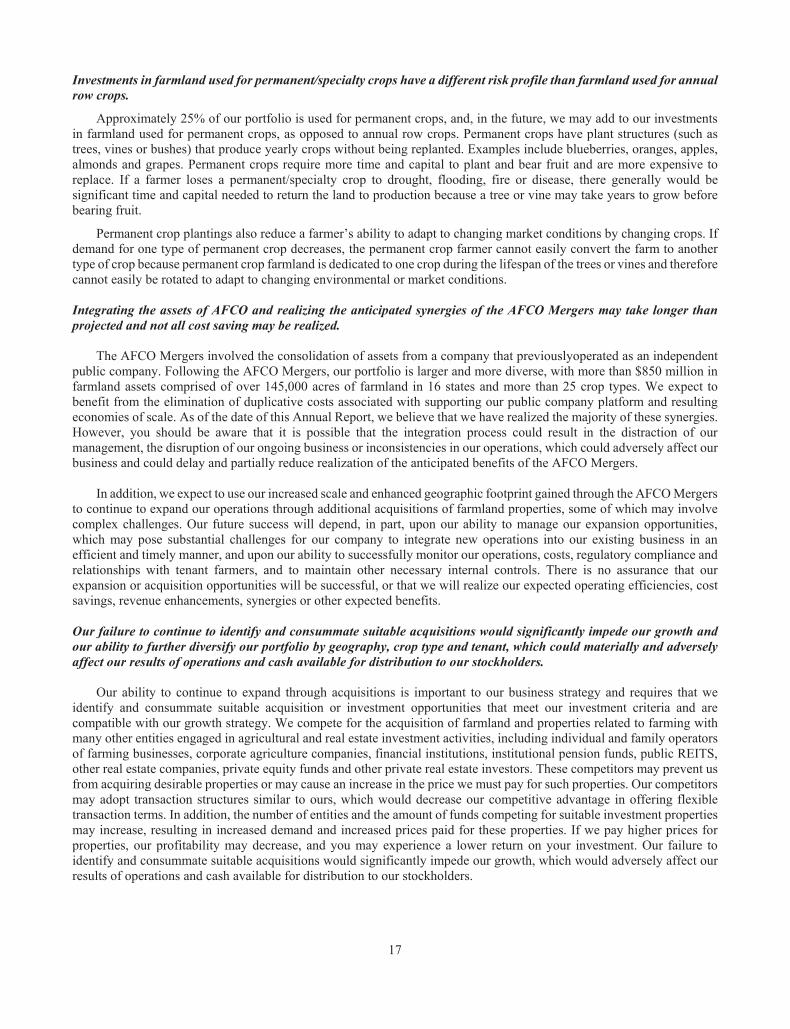
Investments in farmland used for permanent/specialty crops have a different risk profile than farmland used for annual row crops.
Approximately 25% of our portfolio is used for permanent crops, and, in the future, we may add to our investments in farmland used for permanent crops, as opposed to annual row crops. Permanent crops have plant structures (such as trees, vines or bushes) that produce yearly crops without being replanted. Examples include blueberries, oranges, apples, almonds and grapes. Permanent crops require more time and capital to plant and bear fruit and are more expensive to replace. If a farmer loses a permanent/specialty crop to drought, flooding, fire or disease, there generally would be significant time and capital needed to return the land to production because a tree or vine may take years to grow before bearing fruit.
Permanent crop plantings also reduce a farmer’s ability to adapt to changing market conditions by changing crops. If demand for one type of permanent crop decreases, the permanent crop farmer cannot easily convert the farm to another type of crop because permanent crop farmland is dedicated to one crop during the lifespan of the trees or vines and therefore cannot easily be rotated to adapt to changing environmental or market conditions. Integrating the assets of AFCO and realizing the anticipated synergies of the AFCO Mergers may take longer than projected and not all cost saving may be realized.
The AFCO Mergers involved the consolidation of assets from a company that previouslyoperated as an independent
public company. Following the AFCO Mergers, our portfolio is larger and more diverse, with more than $850 million in farmland assets comprised of over 145,000 acres of farmland in 16 states and more than 25 crop types. We expect to benefit from the elimination of duplicative costs associated with supporting our public company platform and resulting economies of scale. As of the date of this Annual Report, we believe that we have realized the majority of these synergies. However, you should be aware that it is possible that the integration process could result in the distraction of our management, the disruption of our ongoing business or inconsistencies in our operations, which could adversely affect our business and could delay and partially reduce realization of the anticipated benefits of the AFCO Mergers.
In addition, we expect to use our increased scale and enhanced geographic footprint gained through the AFCO Mergers
to continue to expand our operations through additional acquisitions of farmland properties, some of which may involve complex challenges. Our future success will depend, in part, upon our ability to manage our expansion opportunities, which may pose substantial challenges for our company to integrate new operations into our existing business in an efficient and timely manner, and upon our ability to successfully monitor our operations, costs, regulatory compliance and relationships with tenant farmers, and to maintain other necessary internal controls. There is no assurance that our expansion or acquisition opportunities will be successful, or that we will realize our expected operating efficiencies, cost savings, revenue enhancements, synergies or other expected benefits.
Our failure to continue to identify and consummate suitable acquisitions would significantly impede our growth and our ability to further diversify our portfolio by geography, crop type and tenant, which could materially and adversely affect our results of operations and cash available for distribution to our stockholders.
Our ability to continue to expand through acquisitions is important to our business strategy and requires that we identify and consummate suitable acquisition or investment opportunities that meet our investment criteria and are compatible with our growth strategy. We compete for the acquisition of farmland and properties related to farming with many other entities engaged in agricultural and real estate investment activities, including individual and family operators of farming businesses, corporate agriculture companies, financial institutions, institutional pension funds, public REITS, other real estate companies, private equity funds and other private real estate investors. These competitors may prevent us from acquiring desirable properties or may cause an increase in the price we must pay for such properties. Our competitors may adopt transaction structures similar to ours, which would decrease our competitive advantage in offering flexible transaction terms. In addition, the number of entities and the amount of funds competing for suitable investment properties may increase, resulting in increased demand and increased prices paid for these properties. If we pay higher prices for properties, our profitability may decrease, and you may experience a lower return on your investment. Our failure to identify and consummate suitable acquisitions would significantly impede our growth, which would adversely affect our results of operations and cash available for distribution to our stockholders.

18
Failure to succeed in new markets may have adverse consequences.
We intend to continue to acquire properties across the U.S. and may from time to time evaluate potential international acquisitions. When we acquire properties located in new geographic areas in the U.S. or internationally, or properties primarily devoted to a crop or industry with which we are less familiar (such as certain specialty crops, energy production, dairy farms or hog farms), we may face risks associated with a lack of market knowledge or understanding of the local market, including the availability and identity of quality tenants, forging new business relationships in the area, developing an understanding of a crop or industry unfamiliar to us, and unfamiliarity with local or crop-specific government requirements and procedures. Furthermore, the negotiation of a potential expansion into new markets or industries may divert management time and other resources. As a result, we may have difficulties executing our business strategy in these new markets, which could have a negative impact on our results of operations and ability to make distributions to our stockholders. We do not intend to continuously monitor and evaluate tenant credit quality and our financial performance may be subject to risks associated with our tenants' financial condition and liquidity position.
Certain of our leases do not require the full payment of rent in cash in advance of the planting season, which subjects us to credit risk exposure to our farm-operator tenants and the risks associated with farming operations, such as weather, commodity price fluctuations and other factors. We also are exposed to these risks with respect to leases for which the rent is based on a percentage of a tenant's farming revenues and leases with terms greater than one year. Because we do not intend to monitor and evaluate the credit risk exposure related to farm-operator tenants on an ongoing basis, we are subject to the risk that our tenants, particularly those that may depend on debt and leverage to finance their operations, could be susceptible to bankruptcy in the event that their cash flows are insufficient to satisfy their financial obligations, including meeting their obligations to us under their leases. As a result, we may not become aware of a tenant's financial distress until the tenant fails to make payments to us when due, which may significantly reduce the amount of time we have to evict the tenant and re-lease the farmland to a new tenant before the start of the spring planting season, and in the event of a tenant bankruptcy we may not be able to terminate the lease. If we are unable to re-lease the farmland on a timely basis, it could have a material adverse effect on our revenues.
Some state laws prohibit or restrict the ownership of agricultural land by business entities, which could impede the growth of our portfolio and our ability to diversify geographically.
Certain states, including Iowa, North Dakota, South Dakota, Minnesota, Oklahoma, Wisconsin, Missouri and Kansas, in which a substantial amount of primary crop farmland is located, have laws that prohibit or restrict to varying degrees the ownership of agricultural land by corporations or business entities like us. As of December 31, 2016, we owned 1,804 acres of farmland in Kansas, and our ownership of those farms may be challenged under Kansas law, in which case we may be required to sell those farms at an unfavorable time and on unfavorable terms. Additional states may, in the future, pass similar or more restrictive laws, and we may not be legally permitted, or it may become overly burdensome or expensive, to acquire properties in these states, which could impede the growth of our portfolio and our ability to diversify geographically in states that might otherwise have attractive investment opportunities.
Our short-term leases, albeit an industry standard, make us more susceptible to any decreases in prevailing market rental rates than would be the case if we entered into longer-term leases, which could have a material adverse effect on our results of operations and ability to make distributions to our stockholders.
Most of our leases with tenants engaged in farming operations have terms ranging from one to five years, which is customary in the farming industry. We expect that most of the leases we enter into in the future will have one to five-year terms. As a result, we will be required to frequently re-lease our properties upon the expiration of our leases, which will make us more susceptible to declines in market rental rates than we would be if we were to enter into longer term leases. As a result, any decreases in the prevailing market rental rates in the geographic areas in which we own properties could have a material adverse effect on our results of operations and ability to make distributions to our stockholders.

19
We may be unable to collect balances due on our leases from any tenants in financial distress or bankruptcy, which could adversely affect our financial condition, results of operations and cash flow.
We are subject to tenant credit risk. Our tenants, particularly those that may depend on debt and leverage, could be susceptible to defaults under their leases or bankruptcy in the event that their cash flows are insufficient to satisfy their financial obligations.Certain of our tenants have defaulted on their lease payments, and we have been forced to pursue alternative arrangements with those tenants in order to be paid amounts due under the leases. In the future, we may be forced to enter into similar alternative arrangements or pursue litigation in order to collect payments from tenants who are unable make their lease payments as they come due. We can provide no assurances that we will be able to collect the full amount due under a particular lease if we are forced pursue alternative payment arrangements or litigation with any of our tenants.
If a bankrupt tenant rejects a lease with us, any claim we might have for breach of the lease, excluding a claim against
collateral securing the lease, would be treated as a general unsecured claim. In the event of a tenant's default under its lease or its rejection of the lease in bankruptcy proceedings, we may be unable to locate a replacement tenant in a timely manner or on comparable or better terms. As a result, our financial condition, results of operations and ability to make distributions to our stockholders could be adversely affected. Illiquidity of real estate investments could significantly impede our ability to respond to adverse changes in the performance of our properties and harm our financial condition.
The real estate investments made, and to be made, by us may be difficult to sell quickly. As a result, our ability to promptly sell one or more properties in our portfolio in response to changing economic, financial and investment conditions may be limited. Return of capital and realization of gains, if any, from an investment generally will occur upon disposition or refinancing of the underlying property. We may be unable to realize our investment objectives by sale, other disposition or refinancing at attractive prices within any given period of time or may otherwise be unable to complete any exit strategy. In particular, weakness in or even the lack of an established market for a property, changes in the financial condition or prospects of prospective purchasers, changes in national or international economic conditions and changes in laws, regulations or fiscal policies of jurisdictions in which the property is located, in each case may limit our ability to dispose of a property. Moreover, our ability to dispose of certain of our properties within a specific time period is subject to certain limitations imposed by our tax protection agreement.
In addition, the Code imposes restrictions on a REIT's ability to dispose of properties that are not applicable to other
types of real estate companies. In particular, the tax laws applicable to REITs effectively require that we hold our properties for investment, rather than primarily for sale in the ordinary course of business, which may cause us to forego or defer sales of properties that otherwise would be in our best interests. Moreover, if we acquire properties from C corporations (i.e., corporations generally subject to full corporate-level tax) in certain non-taxable transactions, as was the case with our acquisition of the Hudye Farm in 2014, built-in gain recognized on the non-taxable disposition of such properties within 10 years of our acquisition will be subject to tax at the highest applicable U.S. federal corporate income tax rate. Therefore, we may not be able to vary our portfolio in response to economic or other conditions promptly or on favorable terms. The period during which a REIT is subject to tax in respect of built-in gains recognized on property acquired form a C corporation is currently uncertain.
On June 7, 2016, the U.S. Treasury Department issued temporary Regulations which temporarily extended the period during which a REIT is subject to tax in respect of built-in gains recognized on property acquired from a C corporation from five years to ten years. This extension only applied to assets with built-in gains acquired on or after August 8, 2016 and was set to expire on June 7, 2019. On January 18, 2017, the U.S. Treasury Department issued final Regulations to shorten the ten-year period back to a five-year period for assets with built-in gains acquired on or after February 17, 2017, and to permit taxpayers to apply the five-year period for assets with built-in gains acquired on or after August 8, 2016 and on or before February 17, 2017. Pursuant to these final Regulations, if we acquire any asset from a C corporation, or a corporation that generally is subject to full corporate level tax, in a merger or other transaction in which we acquire a basis in the asset that is determined by reference either to the C corporation’s basis in the asset or

20
to another asset, we will pay tax at the highest U.S. federal corporate income tax rate applicable if we recognize gain on the sale or disposition of the asset during the five-year period after we acquire the asset. However, on January 20, 2017, White House Chief of Staff Reince Preibus issued a Memorandum for the Heads of Executive Departments and Agencies (the “Regulatory Freeze Memorandum”), effective January 18, 2017, ordering agencies to temporarily postpone for 60 days the effective date of certain regulations; the effect of the Regulatory Freeze Memorandum, if any, on the final Regulations described above remains unclear. Our farms are subject to adverse weather conditions, seasonal variability, crop disease and other contaminants, which may affect our tenants' ability to pay rent and thereby have an adverse effect on our results of operations, financial condition, and our ability to make distributions to stockholders.
Crops are vulnerable to adverse weather conditions, including windstorms, tornados, floods, drought and temperature extremes, which are common but difficult to predict. Unfavorable growing conditions can reduce both crop yield and quality. Seasonal factors, including supply and consumer demand, may also have an effect on the value of crops grown by our tenants. In extreme cases, entire harvests may be lost in some geographic areas.
In addition, crops are vulnerable to disease and pests. Damages to tenants' crops may vary in severity and effect,
depending on the stage of production at the time of infection or infestation, the type of treatment applied and climatic conditions. The costs to control these infestations vary depending on the severity of the damage and the extent of the plantings affected. These infestations can increase the costs and decrease the revenues of our tenants. Tenants may also incur losses from product recalls, fines or litigation due to other contaminants that may cause food borne illness. It is difficult to predict the occurrence or severity of such product recalls, fines or litigation as well as their impact upon our tenants.
We are particularly susceptible to adverse weather conditions (such as windstorms, tornados, floods, drought, hail
and temperature extremes), transportation conditions (including navigation of the Mississippi River), crop disease, pests and other adverse growing conditions in Illinois, Colorado, North Carolina, South Carolina Arkansas and Louisiana, where the majority of the acres in our portfolio are located.
While many of our leases are on a fixed-rent basis that does not change based on the success of the farming operations, we also utilize variable-rent leases pursuant to which the amount of the rent depends on crop yields and prices in regions where such arrangements are prevalent. Adverse weather conditions, seasonal variability, crop disease, pests and contaminants could adversely affect the value of production on properties. This could impact our variable rent proceeds and our tenants' ability to continue to meet their obligations to us. This could have a material adverse effect on the value of our properties, our results of operations, financial condition, and our ability to make distributions to our stockholders.
The market prices of the crops that our tenants may produce on our agricultural properties have exhibited periods of volatility, which may affect our tenants' ability to pay rent and thereby have an adverse effect on our results of operations and our ability to make distributions to stockholders.
The value of a crop is affected by many factors that can differ on a yearly basis. The unpredictability of weather and crop yields in the major crop production regions worldwide creates a significant risk of price volatility, which may either increase or decrease the value of the crops that our tenants produce each year. Other material factors adding to the volatility of crop prices are changes in government regulations and policy, fluctuations in global prosperity, fluctuations in foreign trade and export markets, and eruptions of military conflicts or civil unrest. Although rental payments under the majority of our leases typically are not based on the quality or profitability of our tenants' harvests, any of these factors could adversely affect our tenants' ability to meet their obligations to us and our ability to lease or re-lease properties on favorable terms, or at all, which could have a material adverse effect on the value of our properties, our results of operations and our ability to make distributions to our stockholders.

21
Adverse changes in government policies related to farming could affect the prices of crops and the profitability of farming operations, which could materially and adversely affect the value of our properties and our results of operations.
There are a number of government programs that directly or indirectly affect the profitability of farm operators. These include marketing, export, renewable fuel and insurance policies and programs. Significant changes to or the elimination of programs and policies could adversely affect crop prices and the profitability of farming operations, which could materially and adversely impact the value of our farms and our ability to lease them on favorable terms, or at all, which would have a material adverse effect on our results of operations.
If the U.S. Federal Reserve or other central banks embark on a substantial tightening of monetary policy in the future that causes real interest rates to rise substantially, it may cause land prices to decline if the rise in real interest rates is not accompanied by rises in the general levels of inflation.
A substantial tightening of monetary policy by the U.S. Federal Reserve or other central banks would increase credit costs (through the resulting increase in interest rates) and decrease credit availability. This could hurt farm operators because higher real interest rates (which is defined as nominal interest rates minus the inflation rate) make it more difficult for farm operators to qualify for loans and increase their borrowing costs. Higher interest rates also tend to decrease U.S. and world economic growth, thus decreasing the demand for agricultural commodities.
All of these consequences could reduce farm income. If increases in real interest rates are not accompanied by higher
levels of farm income and rents, this could lead to declines in agricultural land values and a reduction in our profitability, either of which would have a material adverse effect on our business or results of operations, financial condition, and ability to make distributions to our stockholders.
The loss of key management personnel, particularly Paul A. Pittman and Luca Fabbri, could have a material adverse effect on our ability to implement our business strategy and to achieve our investment objectives.
Our future success depends to a significant extent on the continued service and coordination of our senior management team, which is comprised of Paul A. Pittman, our Executive Chairman and Chief Executive Officer and Luca Fabbri, our Chief Financial Officer. We can provide no assurances that any of our key personnel will continue their employment with us. The loss of services of Messrs. Pittman, Fabbri and Cowan could have a material adverse effect on our ability to implement our business strategy and to achieve our investment objectives.
Joint venture investments could be adversely affected by our lack of sole decision-making authority, our reliance on co-venturers’ financial condition and disputes between us and our co-venturers.
In the future, we may co-invest with third parties through partnerships, joint ventures or other entities, acquiring
noncontrolling interests in or sharing responsibility for developing properties and managing the affairs of a property, partnership, joint venture or other entity. With respect to any such arrangement or any similar arrangement that we may enter into in the future, we may not be in a position to exercise sole decision-making authority regarding the property, partnership, joint venture or other entity. Investments in partnerships, joint ventures or other entities may, under certain circumstances, involve risks not present where a third party is not involved, including the possibility that partners or co-venturers might become bankrupt or fail to fund their share of required capital contributions. Partners or co-venturers may have economic or other business interests or goals which are inconsistent with our business interests or goals and may be in a position to take actions contrary to our policies or objectives, and they may have competing interests in our markets that could create conflicts of interest. Such investments may also have the potential risk of impasses on decisions, such as a sale or financing, because neither we nor the partner(s) or co-venturer(s) would have full control over the partnership or joint venture. In addition, a sale or transfer by us to a third party of our interests in the joint venture may be subject to consent rights or rights of first refusal, in favor of our joint venture partners, which would in each case restrict our ability to dispose of our interest in the joint venture. Where we are a limited partner or non-managing member in any partnership or limited liability company, if such entity takes or expects to take actions that could jeopardize our status as a REIT or require us to pay tax, we may be forced to dispose of our interest in such entity. Disputes between us and partners or co-venturers may result in litigation or arbitration that would increase our expenses and prevent our officers and directors

22
from focusing their time and effort on our business. Consequently, actions by or disputes with partners or co-venturers might result in subjecting properties owned by the partnership or joint venture to additional risk. In addition, we may in certain circumstances be liable for the actions of our third-party partners or co-venturers. Our joint ventures may be subject to debt and, during periods of volatile credit markets, the refinancing of such debt may require equity capital calls. We will continue to incur costs as a result of becoming a public company, and such costs may increase if and when we cease to be an “emerging growth company.”
As a public company, we expect to continue to incur significant legal, accounting, insurance and other expenses that
we did not incur as a private company, including costs associated with public company reporting requirements. The expenses incurred by public companies generally for reporting and corporate governance purposes have been increasing. We expect compliance with these public reporting requirements and associated rules and regulations to increase expenses, particularly after we are no longer an emerging growth company, although we are currently unable to estimate these costs with any degree of certainty. We could be an emerging growth company for up to five years after our initial public offering, although circumstances could cause us to lose that status earlier such as if the Company breaches the $700 million market cap threshold prior to June 30, 2018, which could result in our incurring additional costs applicable to public companies that are not emerging growth companies. If we fail to maintain effective internal control over financial reporting, we may not be able to accurately report our financial results, which may adversely affect investor confidence in our company and, as a result, the value of our common stock.
Our management is responsible for establishing and maintaining adequate internal control over financial reporting. After we are no longer an emerging growth company under the JOBS Act, Section 404 of the Sarbanes-Oxley Act requires our auditors to deliver an attestation report on the effectiveness of our internal control over financial reporting in conjunction with their opinion on our audited financial statements. Substantial work on our part is required to implement appropriate processes, document the system of internal control over key processes, assess their design, remediate any deficiencies identified and test their operation. This process is expected to be both costly and challenging. We cannot give any assurances that material weaknesses will not be identified in the future in connection with our compliance with the provisions of Section 404 of the Sarbanes-Oxley Act. The existence of any material weakness would preclude a conclusion by management and our independent auditors that we maintained effective internal control over financial reporting. Our management may be required to devote significant time and expense to remediate any material weaknesses that may be discovered and may not be able to remediate any material weakness in a timely manner. The existence of any material weakness in our internal control over financial reporting could also result in errors in our financial statements that could require us to restate our financial statements, cause us to fail to meet our reporting obligations and cause investors to lose confidence in our reported financial information, all of which could lead to a decline in the per-share trading price of our common stock
We depend on external sources of capital that are outside of our control and may not be available to us on commercially reasonable terms or at all, which could limit our ability to, among other things, acquire additional properties, meet our capital and operating needs or make the cash distributions to our stockholders necessary to maintain our qualification as a REIT.
In order to maintain our qualification as a REIT, we are required under the Code to, among other things, distribute annually at least 90% of our REIT taxable income, determined without regard to the dividends paid deduction and excluding any net capital gain. In addition, we will be subject to income tax at regular corporate rates to the extent that we distribute less than 100% of our REIT taxable income, including any net capital gains. Because of these distribution requirements, we may not be able to fund future capital needs, including acquisition opportunities and principal and interest payments on any outstanding debt, from operating cash flow. Consequently, we rely on third-party sources to fund our capital needs. We may not be able to obtain such financing on favorable terms, in the time period we desire, or at all. Any debt we incur will increase our leverage, expose us to the risk of default and may impose operating restrictions on us, and any additional equity we raise (including the issuance of OP units) could be dilutive to existing stockholders. Our access to third-party sources of capital depends, in part, on:
general market conditions;

23
the market's view of the quality of our assets; the market's perception of our growth potential; our debt levels; our current and expected future earnings; our cash flow and cash distributions; and the market price per share of our common stock.
If we cannot obtain capital from third-party sources, we may not be able to acquire properties when strategic opportunities exist, meet the capital and operating needs of our existing properties, satisfy our debt service obligations or make the cash distributions to our stockholders necessary to qualify and maintain our qualification as a REIT.
Under the FPI Loan Program, we provide loans to third-party farmers, which exposes us to risks associated with being a lender, including the risk that borrowers default on their obligations to us, which could adversely affect our results of operations and financial condition. Under the FPI Loan Program, which was announced in August 2015, we make loans to third-party farmers (both tenant and non-tenant) to provide partial financing for working capital requirements and operational farming activities, farming infrastructure projects, and for other farming and agricultural real estate related purposes. The loans are collateralized by farm real estate. As of the date of this Annual Report, we have made two senior secured first-lien mortgage loans to farmers totaling $2,980,000, with $2,780,000 outstanding at December 31, 2016, under the FPI Loan Program, and we intend to make similar loans in the future. Payments on such loans depend on the profitable operation or management of the farmland or farmland-related property securing the loan. The success of the farmland or farm-related property may be affected by many factors outside the control of the borrower, including adverse weather conditions that prevent the planting of a crop or limit crop yields, declines in market prices for agricultural products (both domestically and internationally) and the impact of government regulations (including changes in price supports, subsidies and environmental regulations). In addition, many farms are dependent on a limited number of key individuals whose injury or death may significantly affect the successful operation of the farm. If the cash flow from a farming operation is diminished, the borrower's ability to repay the loan may be impaired. If a borrower defaults under a mortgage loan for which we are the lender, we may attempt to foreclose on the collateral securing the loan, including by acquiring title to the subject property, to protect our investment. In response, the defaulting borrower may contest our enforcement of foreclosure or other available remedies, seek bankruptcy protection against our exercise of enforcement or other available remedies, or bring claims against us for lender liability. If a defaulting borrower seeks bankruptcy protection, the automatic stay provisions of the U.S. Bankruptcy Code would preclude us from enforcing foreclosure or other available remedies against the borrower unless relief is first obtained from the court with jurisdiction over the bankruptcy case. In addition, we may be subject to intercreditor agreements that delay, impact, govern or limit our ability to foreclose on a lien securing a loan or otherwise delay or limit our pursuit of our rights and remedies. Any such delay or limit on our ability to pursue our rights or remedies could adversely affect our business, results of operations and ability to make distributions to our stockholders. In the event of a foreclosure, we may assume direct ownership of the underlying farm. Even if we successfully foreclose on the collateral securing our mortgage loans, foreclosure-related costs, high loan-to-value ratios or declines in property values could prevent us from realizing the full amount of our mortgage loans, and we could be required to record a valuation allowance for such losses. We may be subject to litigation or threatened litigation, which may divert management time and attention, require us to pay damages and expenses or restrict the operation of our business.
We may be subject to litigation or threatened litigation, including claims relating to the actions of our tenants and otherwise in the ordinary course of business. In particular, we are subject to the risk of complaints by our tenants involving premises liability claims and alleged violations of landlord-tenant laws, which may give rise to litigation or governmental investigations, as well as claims and litigation relating to real estate rights or uses of our properties. Some of these claims may result in significant defense costs and potentially significant judgments against us, some of which are not, or cannot be, insured against. Additionally, whether or not any dispute actually proceeds to litigation, we may be required to devote significant management time and attention to its successful resolution (through litigation, settlement or otherwise), which would detract from our management's ability to focus on our business. Any such resolution could involve the payment of damages or expenses by us, which may be significant, or involve our agreement with terms that restrict the operation of

24
our business. We generally intend to vigorously defend ourselves; however, we cannot be certain of the ultimate outcomes of those claims that may arise in the future. Resolution of these types of matters against us may result in our having to pay significant fines, judgments, or settlements, which, if uninsured, or if the fines, judgments, and settlements exceed insured levels, could adversely impact our earnings and cash flows, thereby having an adverse effect on our financial condition, results of operations, cash flows and our ability to pay distributions on, and the per share trading price of, our common stock. Certain litigation or the resolution of certain litigation may affect the availability or cost of some of our insurance coverage and could expose us to increased risks that would be uninsured, and/or adversely impact our ability to attract officers and directors, which could adversely impact our results of operations, cash flows and our ability to pay distributions on, and the value of, our common stock.
In connection with the announcement of the entry into the AFCO Merger Agreement, a lawsuit was filed, alleging, among other things, that the AFCO directors breached their duties in connection with the evaluation of the AFCO Mergers and that the Company aided and abetted those breaches of duties.
On October 26, 2016, a purported class action lawsuit was filed in the Circuit Court for Baltimore County, Maryland against the directors of AFCO, AFCO, certain affiliates of AFCO and the Company under the caption Parshall v. American Farmland Company et. al., Case No. 24C16005745. The complaint alleges that the AFCO directors breached their duties to AFCO in connection with the evaluation and approval of the proposed merger with the Company. In addition, the complaint alleges, among other things, that the Company aided and abetted those breaches of duties. The initial complaint sought equitable relief, including a potential injunction against the AFCO Mergers, but the plaintiffs did not seek further proceedings and the merger has closed. We believe the allegations in the complaint are without merit and intend to defend against those allegations. By virtue of our acquisition of AFCO, we succeeded to any liabilities of AFCO.
We cannot assure you as to the outcome of this pending litigation, or any similar future lawsuits, including costs
associated with defending these claims, any other liabilities that may be incurred in connection with the litigation or settlement of these claims, or any effect on our operations.
Liability for uninsured or underinsured losses could adversely affect our financial condition and cash flow.
Our properties may be damaged by adverse weather conditions and natural disasters, such as earthquakes, floods and tornados. Our insurance may not be adequate to cover all damages or losses from these events, or we may view it as not economically prudent to purchase insurance for certain types of losses. Should an uninsured loss occur, we could lose our capital investment or anticipated profits and cash flows from one or more properties. If any such loss is insured, we may be required to pay a significant deductible on any claim for recovery of such a loss prior to our insurer being obligated to reimburse us for the loss, or the amount of the loss may exceed our coverage for the loss, which could have an adverse effect on our cash flow.
Potential liability for environmental matters could adversely affect our financial condition.
We are subject to the risk of liabilities under federal, state and local environmental laws applicable to agricultural properties, including those related to wetlands, groundwater and water runoff. Some of these laws could subject us to:
responsibility and liability for the cost of removal or remediation of hazardous substances released on our
properties, generally without regard to our knowledge of or responsibility for the presence of the contaminants;
liability for the costs of investigation, removal or remediation of hazardous substances or chemical releases at disposal facilities for persons who arrange for the disposal or treatment of these substances; and
potential liability for claims by third parties for damages resulting from environmental contaminants.
Environmental site assessments were not conducted on all the farms in our portfolio and we do not expect to conduct environment site assessments on all farms we acquire in the future. Our costs of investigation, remediation or removal of hazardous substances may be substantial. In addition, the presence of hazardous substances on one of our properties, or

25
the failure to properly remediate a contaminated property, could adversely affect our ability to sell or lease the property or to borrow using the property as collateral. We may be subject to common law claims by third parties based on damages and costs resulting from environmental contamination emanating from the property. Additionally, we could become subject to new, stricter environmental regulations, which could diminish the utility of our properties and have a material adverse impact on our results of operations.
We may be required to permit the owners of the mineral rights on our properties to enter and occupy parts of the properties for the purposes of drilling and operating oil or gas wells, which could adversely impact the rental value of our properties.
Although we own the surface rights to our farms and expect to own the surface rights to properties that we acquire, other persons may own the rights to any minerals, such as oil and natural gas, that may be located under the surfaces of these properties. For example, in connection with our acquisition of the Hudye Farm, we granted the seller 50% of the mineral rights related to the farm. Currently there is no mineral development on the farms in our portfolio, but we can provide no assurances that third parties will not assert claims for mineral rights on the farms in our portfolio or that farmland that we acquire in the future will not be subject to third-party mineral rights. To the extent that third parties have mineral rights on farmland that we currently own or acquire in the future, we expect that we would be required to permit third parties to enter our properties for the purpose of drilling and operating oil or gas wells on the premises. We will also be required to set aside a reasonable portion of the surface area of our properties to accommodate these oil and gas operations. The devotion of a portion of our properties to these oil and gas operations would reduce the amount of the surface available for farming or farm-related uses. Such activities might also disrupt the productivity of the farmland or property related to farming or increase the risk of environmental liabilities, any of which could adversely impact the rents that we receive from leasing these properties. Increases in mortgage rates or unavailability of mortgage debt may make it difficult for us to finance or refinance our debt, which could have a material adverse effect on our financial condition, results of operations, growth prospects and our ability to make distributions to stockholders.
If mortgage debt is unavailable to us at reasonable rates or at all, we may not be able to finance the purchase of additional properties or refinance existing debt when it becomes due. If interest rates are higher when we refinance our debt, our income and cash flow could be reduced, which would reduce cash available for distribution to our stockholders and may hinder our ability to raise more capital by issuing more stock or by borrowing more money. In addition, to the extent we are unable to refinance our debt when it becomes due, we will have fewer debt guarantee opportunities available to offer under our tax protection agreement, which could trigger an obligation to indemnify certain parties under the tax protection agreement.
Mortgage debt obligations expose us to the possibility of foreclosure, which could result in the loss of our investment in a property or group of properties subject to mortgage debt.
As of December 31, 2016 and February 23, 2017, we had approximately $309.9 million and $420.5 million, respectively, of outstanding mortgage indebtedness. We intend to finance future property acquisitions, in part, with mortgage indebtedness. Mortgage and other secured debt obligations increase our risk of property losses because defaults on indebtedness secured by properties may result in foreclosure actions initiated by lenders and ultimately our loss of the property securing any loans for which we are in default. Any foreclosure on a mortgaged property or group of properties could adversely affect the overall value of our portfolio of properties. For tax purposes, a foreclosure on any of our properties that is subject to a nonrecourse mortgage loan would be treated as a sale of the property for a purchase price equal to the outstanding balance of the debt secured by the mortgage. If the outstanding balance of the debt secured by the mortgage exceeds our tax basis in the property, we would recognize taxable income on foreclosure, but would not receive any cash proceeds, which could hinder our ability to meet the REIT distribution requirements imposed by the Code. Foreclosures could also trigger our tax indemnification obligations under the terms of our tax protection agreement with respect to the sales of certain properties.

26
Our debt financing agreements restrict our ability to engage in certain business activities, including our ability to incur additional indebtedness, make capital expenditures and make certain investments.
Our existing debt financing agreements contain, and other debt financing agreements we may enter into in the future may contain, customary negative covenants and other financial and operating covenants that, among other things:
restrict our ability to incur additional indebtedness; restrict our ability to incur additional liens; restrict our ability to make certain investments (including certain capital expenditures); restrict our ability to merge with another company; restrict our ability to sell or dispose of assets; restrict our ability to make distributions to stockholders; and require us to satisfy minimum financial coverage ratios, minimum tangible net worth requirements and
maximum leverage ratios. Risks Related to Our Organizational Structure We may be subject to unknown or contingent liabilities related to acquired properties and properties that we may acquire in the future, which could have a material adverse effect on us. Properties that we have acquired, including the properties we acquired in the AFCO Mergers, and properties that we may acquire in the future, may be subject to unknown or contingent liabilities for which we may have no recourse, or only limited recourse, against the sellers. In general, the representations and warranties provided under the transaction agreements related to the purchase of properties that we acquire may not survive the completion of the transactions. Furthermore, indemnification under such agreements may be limited and subject to various materiality thresholds, a significant deductible or an aggregate cap on losses. As a result, there is no guarantee that we will recover any amounts with respect to losses due to breaches by the sellers of their representations and warranties. In addition, the total amount of costs and expenses that may be incurred with respect to liabilities associated with these properties may exceed our expectations, and we may experience other unanticipated adverse effects, all of which may materially and adversely affect us. Conflicts of interest may exist or could arise in the future between the interests of our stockholders and the interests of holders of units in our operating partnership, which may impede business decisions that could benefit our stockholders.
Although holders of our OP units do not have voting rights or the power to direct the Company's affairs, there could be potential conflicts, conflicts of interest may exist or could arise in the future as a result of the relationships between us and our affiliates, on the one hand, and our operating partnership or any partner thereof. As of the date of this Annual Report, Mr. Pittman owned 3.9% of the OP units in our operating partnership.
Our directors and officers have duties to our company under Maryland law in connection with their management of our company. At the same time, our wholly owned subsidiary, Farmland Partners OP GP, LLC, as the general partner of our operating partnership, has fiduciary duties and obligations to our operating partnership and its limited partners under Delaware law and the partnership agreement in connection with the management of our operating partnership. The general partner's fiduciary duties and obligations as the general partner of our operating partnership may come into conflict with the duties of our directors and officers to our company. These conflicts of interest could lead to decisions that are not in the best interests of the Company and its stockholders.
Unless otherwise provided for in a partnership agreement, Delaware law generally requires a general partner of a
Delaware limited partnership to adhere to fiduciary duty standards under which it owes its limited partners the highest duties of good faith, fairness and loyalty and which generally prohibit such general partner from taking any action or engaging in any transaction as to which it has a conflict of interest. The partnership agreement provides that, in the event of a conflict between the interests of the limited partners of our operating partnership, on the one hand, and the separate interests of our stockholders, on the other hand, the general partner, in its capacity as the general partner of our operating partnership, shall act in the interests of our stockholders and is under no obligation to consider the separate interests of the

27
limited partners of our operating partnership in deciding whether to cause our operating partnership to take or not to take any actions. The partnership agreement further provides that any decisions or actions not taken by the general partner in accordance with the partnership agreement will not violate any duties, including the duty of loyalty, that the general partner, in its capacity as the general partner of our operating partnership, owes to our operating partnership and its partners.
Additionally, the partnership agreement provides that the general partner will not be liable to our operating partnership or any partner for monetary damages for losses sustained, liabilities incurred or benefits not derived by our operating partnership or any limited partner unless the general partner acted in bad faith and the act or omission was material to the matter giving rise to the loss, liability or benefit not derived. Our operating partnership must indemnify the general partner, us, our directors and officers, officers of our operating partnership and others designated by the general partner from and against any and all claims that relate to the operations of our operating partnership, unless (1) an act or omission of the indemnified person was material to the matter giving rise to the action and either was committed in bad faith or was the result of active and deliberate dishonesty, (2) the indemnified person actually received an improper personal benefit in money, property or services or (3) in the case of a criminal proceeding, the indemnified person had reasonable cause to believe that the act or omission was unlawful. Our operating partnership must also pay or reimburse the reasonable expenses of any such person upon its receipt of a written affirmation of the person's good faith belief that the standard of conduct necessary for indemnification has been met and a written undertaking to repay any amounts paid or advanced if it is ultimately determined that the person did not meet the standard of conduct for indemnification. Our operating partnership will not indemnify or advance funds to any person with respect to any action initiated by the person seeking indemnification without our approval (except for any proceeding brought to enforce such person's right to indemnification under the partnership agreement) or if the person is found to be liable to our operating partnership on any portion of any claim in the action. No reported decision of a Delaware appellate court has interpreted provisions similar to the provisions of the partnership agreement that modify and reduce our fiduciary duties or obligations as the sole member of the general partner or reduce or eliminate our liability for money damages to our operating partnership and its partners, and we have not obtained an opinion of counsel as to the enforceability of the provisions set forth in the partnership agreement that purport to modify or reduce the fiduciary duties that would be in effect were it not for the partnership agreement. Our charter contains certain provisions restricting the ownership and transfer of our stock that may delay, defer or prevent a change of control transaction that might involve a premium price for our common stock or that our stockholders otherwise believe to be in their best interests.
Our charter contains certain ownership limits with respect to our stock. Our charter, among other restrictions, prohibits the beneficial or constructive ownership by any person of more than 9.8% in value or number of shares, whichever is more restrictive, of the outstanding shares of any class or series of our stock, excluding any shares that are not treated as outstanding for U.S. federal income tax purposes. Our Board of Directors, in its sole and absolute discretion, may exempt a person, prospectively or retroactively, from this ownership limit if certain conditions are satisfied. This ownership limit as well as other restrictions on ownership and transfer of our stock in our charter may:
discourage a tender offer or other transactions or a change in management or of control that might involve
a premium price for our common stock or that our stockholders otherwise believe to be in their best interests; and
result in the transfer of shares acquired in excess of the restrictions to a trust for the benefit of a charitable
beneficiary and, as a result, the forfeiture by the acquirer of certain of the benefits of owning the additional shares.
We could increase the number of authorized shares of stock, classify and reclassify unissued stock and issue stock without stockholder approval, which may delay, defer or prevent a transaction that our stockholders believe to be in their best interests.
Our Board of Directors, without stockholder approval, has the power under our charter to amend our charter to increase or decrease the aggregate number of shares of stock or the number of shares of stock of any class or series that we are authorized to issue. In addition, under our charter, our Board of Directors, without stockholder approval, has the power to authorize us to issue authorized but unissued shares of our common stock or preferred stock and to classify or reclassify

28
any unissued shares of our common stock or preferred stock into one or more classes or series of stock and set the preference, conversion or other rights, voting powers, restrictions, limitations as to dividends and other distributions, qualifications or terms or conditions of redemption for such newly classified or reclassified shares. As a result, we may issue series or classes of common stock or preferred stock with preferences, dividends, powers and rights, voting or otherwise, that are senior to, or otherwise conflict with, the rights of holders of our common stock. Although our Board of Directors has no such intention at the present time, it could establish a class or series of preferred stock that could, depending on the terms of such series, delay, defer or prevent a transaction or a change of control that might involve a premium price for our common stock or that our stockholders otherwise believe to be in their best interests. Certain provisions of Maryland law could inhibit changes in control, which may discourage third parties from conducting a tender offer or seeking other change of control transactions that could involve a premium price for our common stock or that our stockholders otherwise believe to be in their best interests.
Certain provisions of the Maryland General Corporation Law, or the MGCL, may have the effect of inhibiting a third party from making a proposal to acquire us or of impeding a change of control under certain circumstances that otherwise could provide the holders of shares of our common stock with the opportunity to realize a premium over the then-prevailing market price of such shares, including:
"business combination" provisions that, subject to limitations, prohibit certain business combinations between us and an "interested stockholder" (defined generally as any person who beneficially owns 10% or more of the voting power of our outstanding voting stock or any affiliate or associate of ours who, at any time within the two-year period immediately prior to the date in question, was the beneficial owner of 10% or more of the voting power of our then outstanding stock) or an affiliate thereof for five years after the most recent date on which the stockholder becomes an interested stockholder and thereafter impose fair price and/or supermajority voting requirements on these combinations; and
"control share" provisions that provide that "control shares" of our company (defined as shares which,
when aggregated with other shares controlled by the stockholder, except solely by virtue of a revocable proxy, entitle the stockholder to exercise one of three increasing ranges of voting power in electing directors) acquired in a "control share acquisition" (defined as the direct or indirect acquisition of ownership or control of issued and outstanding "control shares") have no voting rights with respect to their control shares except to the extent approved by our stockholders by the affirmative vote of at least two-thirds of all the votes entitled to be cast on the matter, excluding all interested shares.
By resolution of our Board of Directors, we have opted out of the business combination provisions of the MGCL and
provided that any business combination between us and any other person is exempt from the business combination provisions of the MGCL, provided that the business combination is first approved by our Board of Directors (including a majority of directors who are not affiliates or associates of such persons). In addition, pursuant to a provision in our bylaws, we have opted out of the control share provisions of the MGCL. However, our Board of Directors may by resolution elect to opt in to the business combination provisions of the MGCL and we may, by amendment to our bylaws, opt in to the control share provisions of the MGCL in the future.
Additionally, certain provisions of the MGCL permit our Board of Directors, without stockholder approval and
regardless of what is currently provided in our charter or our bylaws, to implement takeover defenses, some of which (for example, a classified board) we do not currently employ. These provisions may have the effect of inhibiting a third party from making an acquisition proposal for our company or of delaying, deferring, or preventing a change in control of our company under circumstances that otherwise could provide the holders of our common stock with the opportunity to realize a premium over the then-current market price. Our charter contains a provision whereby we elect to be subject to the provisions of Title 3, Subtitle 8 of the MGCL relating to the filling of vacancies on our Board of Directors.
Our charter, our bylaws and Maryland law also contain other provisions, including the provisions of our charter on
removal of directors and the advance notice provisions of our bylaws, that may delay, defer, or prevent a transaction or a change of control that might involve a premium price for our common stock or otherwise be in the best interest of our stockholders.

29
Certain provisions in the partnership agreement may delay or prevent unsolicited acquisitions of us.
Provisions in the partnership agreement may delay, or make more difficult, unsolicited acquisitions of us or changes of our control. These provisions could discourage third parties from making proposals involving an unsolicited acquisition of us or change of our control, although some of our stockholders might consider such proposals, if made, desirable. These provisions include, among others:
redemption rights; a requirement that the general partner may not be removed as the general partner of our operating
partnership without our consent; transfer restrictions on OP units; our ability, as general partner, in some cases, to amend the partnership agreement and to cause our
operating partnership to issue units with terms that could delay, defer or prevent a merger or other change of control of us or our operating partnership without the consent of the limited partners; and
the right of the limited partners to consent to direct or indirect transfers of the general partnership interest,
including as a result of a merger or a sale of all or substantially all of our assets, in the event that such transfer requires approval by our common stockholders.
Our tax protection agreement could limit our ability to sell or otherwise dispose of certain properties.
In connection with the formation transactions related to our initial public offering, our operating partnership entered into a tax protection agreement that provides that if we dispose of any interest in the protected initial properties in a taxable transaction prior to the fifth (with respect to certain properties) or seventh (with respect to certain other properties) anniversary of the completion of the formation transactions, subject to certain exceptions and unless such obligation terminates sooner under the agreement, we will indemnify Pittman Hough Farms for its tax liabilities attributable to the built-in gain that exists with respect to such property interests as of the time of our initial public offering, and the tax liabilities incurred as a result of such tax protection payment. We also have agreed to use our best efforts to continue to comply with such obligations with respect to those properties subject to the seven-year protection period after the expiration of such period (unless such obligation otherwise was terminated under the agreement). In addition, we may enter into similar tax protection agreements in the future if we issue OP units in connection with the acquisition of properties. Therefore, although it may be in our stockholders' best interests that we sell one of these properties, it may be economically prohibitive for us to do so because of these obligations. Furthermore, for the protected initial properties that have an initial seven-year tax protection period, our best efforts obligation to Pittman Hough Farms significantly limits our ability to dispose of those properties after the initial seven-year tax protection period without payment of the tax indemnification amount to Pittman Hough Farms.
Our Board of Directors may change our strategies, policies and procedures without stockholder approval.
Our investment, financing, leverage and distribution policies, and our policies with respect to all other activities, including growth, capitalization and operations, are determined exclusively by our Board of Directors, and may be amended or revised at any time by our Board of Directors without notice to or a vote of our stockholders. This could result in us conducting operational matters, making investments or pursuing different business or growth strategies than those contemplated in this Annual Report. Further, our charter and bylaws do not limit the amount or percentage of indebtedness, funded or otherwise, that we may incur. Our Board of Directors may alter or eliminate our current policy on borrowing at any time without stockholder approval. If this policy changed, we could become more highly leveraged which could result in an increase in our debt service. Higher leverage also increases the risk of default on our obligations. In addition, a change in our investment policies, including the manner in which we allocate our resources across our portfolio or the types of assets in which we seek to invest, may increase our exposure to interest rate risk, real estate market fluctuations

30
and liquidity risk. Changes to our policies with regards to the foregoing could materially adversely affect our financial condition, results of operations and cash flow.
Our rights and the rights of our stockholders to take action against our directors and officers are limited, which could limit your recourse in the event that we take certain actions which are not in our stockholders' best interests.
Maryland law provides that a director or officer has no liability in that capacity if he or she performs his or her duties in good faith, in a manner that he or she reasonably believes to be in our best interests and with the care that an ordinarily prudent person in a like position would use under similar circumstances. Under the MGCL, directors are presumed to have acted with this standard of care. As permitted by Maryland law, our charter eliminates the liability of our directors and officers to us and our stockholders for money damages, except for liability resulting from:
actual receipt of an improper benefit or profit in money, property or services; or active and deliberate dishonesty by the director or officer that was established by a final judgment as being
material to the cause of action adjudicated.
Our charter and bylaws obligate us to indemnify each present and former director or officer, to the maximum extent permitted by Maryland law, in the defense of any proceeding to which he or she is made, or threatened to be made, a party by reason of his or her service to us. In addition, we may be obligated to advance the defense costs incurred by our directors and officers. We also have entered into indemnification agreements with our officers and directors granting them express indemnification rights. As a result, we and our stockholders may have more limited rights against our directors and officers than might otherwise exist absent the current provisions in our charter, bylaws and indemnification agreements or that might exist for other public companies. Our charter contains provisions that make removal of our directors difficult, which could make it difficult for our stockholders to effect changes to our management.
Our charter contains provisions that make removal of our directors difficult, which could make it difficult for our stockholders to effect changes to our senior management and may prevent a change in control of our company that is in the best interests of our stockholders. Our charter provides that a director may only be removed for cause upon the affirmative vote of holders of two-thirds of all the votes entitled to be cast generally in the election of directors. Vacancies may be filled only by a majority of the remaining directors in office, even if less than a quorum. These requirements make it more difficult to change our senior management by removing and replacing directors and may prevent a change in control of our company that is in the best interests of our stockholders. Our operating partnership may issue additional OP units or one or more classes of preferred units to third parties without the consent of our stockholders, which would reduce our ownership percentage in our operating partnership and could have a dilutive effect on the amount of distributions made to us by our operating partnership and, therefore, the amount of distributions we can make to our stockholders.
As of the date of this Annual Report, we owned approximately 83.8% of the outstanding OP units in our operating partnership (on a fully diluted basis). Since our initial public offering, we have issued a total of 7,161,572 OP units and a total of 117,000 preferred units as consideration in connection with our acquisition of properties, and we may issue additional OP units and preferred units of one or more classes in connection with our acquisition of properties, as compensation or otherwise. Such issuances would reduce our ownership percentage in our operating partnership and could affect the amount of distributions made to us by our operating partnership and, therefore, the amount of distributions we can make to our stockholders. Our common stockholders do not have any voting rights with respect to any such issuances or other partnership level activities of our operating partnership.

31
U.S. Federal Income Tax Risks Failure to maintain qualification as a REIT for U.S. federal income tax purposes would subject us to U.S. federal income tax on our taxable income at regular corporate rates, which would substantially reduce our ability to make distributions to our stockholders.
We elected to be taxed as a REIT for U.S. federal income tax purposes beginning with our short taxable year ended December 31, 2014. To maintain qualification as a REIT, we must meet various requirements set forth in the Code concerning, among other things, the ownership of our outstanding stock, the nature of our assets, the sources of our income and the amount of our distributions. The REIT qualification requirements are extremely complex, and interpretations of the U.S. federal income tax laws governing qualification as a REIT are limited. We believe that our current organization and method of operation will enable us to continue to qualify, as a REIT. However, at any time, new laws, interpretations or court decisions may change the U.S. federal tax laws relating to, or the U.S. federal income tax consequences of, qualification as a REIT. It is possible that future economic, market, legal, tax or other considerations may cause our Board of Directors to determine that it is not in our best interest to qualify as a REIT and to revoke our REIT election, which it may do without stockholder approval.
If we fail to qualify as a REIT for any taxable year, we will be subject to U.S. federal income tax on our taxable
income at regular corporate rates. In addition, we generally would be disqualified from treatment as a REIT for the four taxable years following the year in which we lost our REIT status. Losing our REIT status would reduce our net earnings available for investment or distribution because of the additional tax liability. In addition, distributions would no longer qualify for the dividends paid deduction, and we would no longer be required to make distributions. If this occurs, we might be required to borrow funds or liquidate some investments in order to pay the applicable tax.
As a result of all these factors, our failure to qualify as a REIT could impair our ability to expand our business and
raise capital, and would substantially reduce our ability to make distributions to our stockholders.
To qualify as a REIT and to avoid the payment of U.S. federal income and excise taxes, we may be forced to borrow funds, use proceeds from the issuance of securities, pay taxable dividends of our stock or debt securities or sell assets to make distributions, which may result in our distributing amounts that may otherwise be used for our operations.
To obtain the favorable tax treatment accorded to REITs, we normally are required each year to distribute to our stockholders at least 90% of our REIT taxable income, determined without regard to the deduction for dividends paid and by excluding net capital gains. We will be subject to U.S. federal income tax on our undistributed taxable income and net capital gain and to a 4% nondeductible excise tax on any amount by which distributions we pay with respect to any calendar year are less than the sum of (1) 85% of our ordinary income, (2) 95% of our capital gain net income and (3) 100% of our undistributed income from prior years. These requirements could cause us to distribute amounts that otherwise would be spent on acquisitions of properties and it is possible that we might be required to borrow funds, use proceeds from the issuance of securities, pay taxable dividends of our stock or debt securities or sell assets in order to distribute enough of our taxable income to maintain our qualification as a REIT and to avoid the payment of U.S. federal income and excise taxes.
Future sales of properties may result in penalty taxes or may be made through TRSs, each of which would diminish the return to you.
It is possible that one or more sales of our properties may be "prohibited transactions" under provisions of the Code. If we are deemed to have engaged in a "prohibited transaction" (i.e., we sell a property held by us primarily for sale in the ordinary course of our trade or business), all income that we derive from such sale would be subject to a 100% tax. The Code sets forth a safe harbor for REITs that wish to sell property without risking the imposition of the 100% tax. A principal requirement of the safe harbor is that the REIT must hold the applicable property for not less than two years prior to its sale for the production of rental income. It is entirely possible that a future sale of one or more of our properties will not fall within the prohibited transaction safe harbor.

32
If we acquire a property that we anticipate will not fall within the safe harbor from the 100% penalty tax upon disposition, we may acquire such property through a TRS in order to avoid the possibility that the sale of such property will be a prohibited transaction and subject to the 100% penalty tax. If we already own such a property directly or indirectly through an entity other than a TRS, we may contribute the property to a TRS. Though a sale of such property by a TRS likely would mitigate the risk of incurring a 100% penalty tax, the TRS itself would be subject to regular corporate income tax at the U.S. federal level, and potentially at the state and local levels, on the gain recognized on the sale of the property as well as any income earned while the property is operated by the TRS. Such tax would diminish the amount of proceeds from the sale of such property ultimately distributable to our stockholders. Our ability to use TRSs in the foregoing manner is subject to limitation. Among other things, the value of our securities in TRSs may not exceed 25% (20% for taxable years beginning after December 31, 2017) of the value of our assets and dividends from our TRSs, when aggregated with all other non-real estate income with respect to any one year, generally may not exceed 25% of our gross income with respect to such year. No assurances can be provided that we would be able to successfully avoid the 100% penalty tax through the use of TRSs.
In addition, if we acquire any asset from a C corporation (i.e., a corporation generally subject to full corporate-level
tax) in a merger or other transaction in which we acquire a basis in the asset determined by reference either to the C corporation's basis in the asset or to another asset, we will pay tax, at the highest U.S. federal corporate income tax rate, on any built-in gain recognized on a taxable disposition of the asset during the 5-year period after its acquisition. As a result of the manner in which we acquired the Hudye Farm, a subsequent taxable disposition by us of any such assets generally would be subject to the foregoing built-in gain rules.
In certain circumstances, we may be subject to U.S. federal and state income taxes as a REIT, which would reduce our cash available for distribution to our stockholders.
Even if we qualify as a REIT, we may be subject to U.S. federal income taxes or state taxes. As discussed above, net income from a "prohibited transaction" will be subject to a 100% penalty tax and built-in gain recognized on the taxable disposition of assets acquired from C corporations in certain non-taxable transactions will be subject to tax at the highest applicable U.S. federal corporate income tax rate. To the extent we satisfy the distribution requirements applicable to REITs, but distribute less than 100% or our taxable income, we will be subject to U.S. federal income tax at regular corporate rates on our undistributed income. We may not be able to make sufficient distributions to avoid excise taxes applicable to REITs. We may also decide to retain capital gains we earn from the sale or other disposition of our properties and pay income tax directly on such income. In that event, our stockholders would be treated as if they earned that income and paid the tax on it directly. However, our stockholders that are tax-exempt, such as charities or qualified pension plans, would have no benefit from their deemed payment of such tax liability. We may also be subject to state and local taxes on our income or property, either directly or at the level of the companies through which we indirectly own our assets. Any U.S. federal or state taxes we pay will reduce our cash available for distribution to our stockholders.
The ability of our Board of Directors to revoke or otherwise terminate our REIT qualification without stockholder approval may cause adverse consequences to our stockholders.
Our charter provides that our Board of Directors may revoke or otherwise terminate our REIT election, without the approval of our stockholders, if it determines that it is no longer in our best interest to continue to qualify as a REIT. If we cease to qualify as a REIT, we would become subject to U.S. federal income tax on our taxable income at regular corporate rates and would no longer be required to distribute most of our taxable income to our stockholders, which may have adverse consequences on our total return to our stockholders.
If our operating partnership were classified as a "publicly traded partnership" taxable as a corporation for U.S. federal income tax purposes, we would fail to qualify as a REIT and would suffer other adverse tax consequences.
We intend for our operating partnership to be treated as a "partnership" for U.S. federal income tax purposes. If the IRS were to successfully assert our operating partnership was “publicly traded,” our operating partnership could be taxable as a corporation if less than 90% of its gross income consisted of certain qualifying passive income. In such event, we likely would fail to qualify as a REIT for U.S. federal income tax purposes, and the resulting corporate income tax burden

33
would reduce the amount of distributions that our operating partnership could make to us. This would substantially reduce the cash available to pay distributions to our stockholders. Complying with the REIT requirements may cause us to forego otherwise attractive opportunities or sell properties earlier than we wish.
To maintain our qualification as a REIT for U.S. federal income tax purposes, we must continually satisfy tests concerning, among other things, the sources of our income, the nature and diversification of our assets, the amounts we distribute to our stockholders and the ownership of shares of our stock. We may be required to make distributions to our stockholders at disadvantageous times or when we do not have funds readily available for distribution, or we may be required to forego or liquidate otherwise attractive investments in order to comply with the REIT tests. Thus, compliance with the REIT requirements may hinder our ability to operate solely on the basis of maximizing profits.
You may be restricted from acquiring or transferring certain amounts of our common stock.
Certain provisions of the Code and the stock ownership limits in our charter may inhibit market activity in our capital stock and restrict our business combination opportunities. In order to maintain our qualification as a REIT, five or fewer individuals, as defined in the Code, may not own, beneficially or constructively, more than 50% in value of our issued and outstanding stock at any time during the last half of a taxable year. Attribution rules in the Code determine if any individual or entity beneficially or constructively owns our capital stock under this requirement. Additionally, at least 100 persons must beneficially own our capital stock during at least 335 days of a taxable year. To help insure that we meet these tests, our charter restricts the acquisition and ownership of shares of our stock.
Our charter, with certain exceptions, authorizes our Board of Directors to take such actions as are necessary and
desirable to preserve our qualification as a REIT. Unless exempted by our Board of Directors, our charter prohibits any person from beneficially or constructively owning more than 9.8% in value or number of shares, whichever is more restrictive, of the outstanding shares of any class or series of our capital stock. Our Board of Directors may not grant an exemption from these restrictions to any proposed transferee whose ownership in excess of such ownership limit would result in our failing to qualify as a REIT. Dividends paid by REITs generally do not qualify for the favorable tax rates available for some dividends.
The maximum U.S. federal income tax rate applicable to qualified dividend income paid to U.S. stockholders that are individuals, trusts and estates currently is 20%. Dividends paid by REITs generally are not eligible for such maximum tax rate. Although the favorable tax rates applicable to qualified dividend income do not adversely affect the taxation of REITs or dividends paid by REITs, such favorable tax rates could cause investors who are individuals, trusts and estates to perceive investments in REITs to be relatively less attractive than investments in the stocks of non-REIT corporations that pay dividends, which could adversely affect the value of the shares of REITs, including our common stock.

34
Changes to the U.S. federal income tax laws, including the enactment of certain proposed tax reform measures, could have an adverse impact on our business and financial results.
Numerous changes to the U.S. federal income tax laws are proposed regularly. Moreover, legislative and regulatory changes may be more likely in the 115th Congress because the Presidency and such Congress will be controlled by the same political party and significant reform of the Code has been described publicly as a legislative priority. Additionally, the REIT rules are constantly under review by persons involved in the legislative process and by the IRS and the U.S. Treasury Department, which may result in revisions to regulations and interpretations in addition to statutory changes. If enacted, certain such changes could have an adverse impact on our business and financial results. For example, certain proposals set forth in Trump administration and House Republican tax plans could reduce the relative competitive advantage of operating as a REIT unless accompanied by responsive changes to the REIT rules. These proposals include: the lowering of income tax rates on individuals and corporations, which could ease the burden of double taxation on corporate dividends and make the single level of taxation on REIT distributions relatively less attractive; allowing the expensing of capital expenditures, which could have a similar impact and also could result in the bunching of taxable income and required distributions for REITs; and further limiting or eliminating the deductibility of interest expense, which could disrupt the real estate market and could increase the amount of REIT taxable income that must be distributed as dividends to shareholders.
We cannot predict whether, when or to what extent new U.S. federal tax laws, regulations, interpretations or rulings will be issued, nor is the long-term impact of proposed tax reforms on the real estate investment industry or REITs clear. Prospective investors are urged to consult their tax advisors regarding the effect of potential changes to the U.S. federal tax laws on an investment in our shares. Legislative or regulatory action with respect to taxes could adversely affect the returns to our stockholders.
In recent years, numerous legislative, judicial and administrative changes have been made in the provisions of the U.S. federal income tax laws applicable to investments similar to an investment in our common stock. Additional changes to the tax laws are likely to continue to occur, and we cannot assure you that any such changes will not adversely affect the taxation of a stockholder. Any such changes could have an adverse effect on an investment in our stock or on the market value or the resale potential of our assets. You are urged to consult with your own tax advisor with respect to the impact of recent legislation on your investment in our stock and the status of legislative, regulatory or administrative developments and proposals and their potential effect on an investment in shares of our common stock. Risks Related to the Market for Our Common Stock We may be unable to make distributions at expected levels, which could result in a decrease in the market price of our common stock.
We intend to continue to pay regular quarterly distributions to our stockholders. All distributions will be made at the discretion of our Board of Directors and will be based upon, among other factors, our historical and projected results of operations, financial condition, cash flows and liquidity, maintenance of our REIT qualification and other tax considerations, capital expenditure and other expense obligations, debt covenants, contractual prohibitions or other limitations and applicable law and such other matters as our Board of Directors may deem relevant from time to time. If sufficient cash is not available for distribution from our operations, we may have to fund distributions from working capital, borrow to provide funds for such distributions, or reduce the amount of such distributions. To the extent we borrow to fund distributions, our future interest costs would increase, thereby reducing our earnings and cash available for distribution from what they otherwise would have been. If cash available for distribution generated by our assets is less than our current estimate, or if such cash available for distribution decreases in future periods from expected levels, our inability to make the expected distributions could result in a decrease in the market price of our common stock.

35
We are an "emerging growth company," and we cannot be certain if the reduced disclosure requirements applicable to emerging growth companies will make shares of our common stock less attractive to investors.
In April 2012, President Obama signed into law the JOBS Act. The JOBS Act contains provisions that, among other things, relax certain reporting requirements for "emerging growth companies," including certain requirements relating to accounting standards and compensation disclosure. We are classified as an emerging growth company. For as long as we are an emerging growth company, which may be until December 31, 2019, we may take advantage of exemptions from various reporting and other requirements that are applicable to other public companies that are not emerging growth companies, including the requirements to:
provide an auditor's attestation report on management's assessment of the effectiveness of our system of
internal control over financial reporting pursuant to Section 404 of the Sarbanes-Oxley Act; comply with any new or revised financial accounting standards applicable to public companies until such
standards are also applicable to private companies; comply with any new requirements adopted by the Public Company Accounting Oversight Board, or the
PCAOB, requiring mandatory audit firm rotation or a supplement to the auditor's report in which the auditor would be required to provide additional information about the audit and the financial statements of the issuer;
comply with any new audit rules adopted by the PCAOB after April 5, 2012, unless the SEC determines
otherwise; provide certain disclosure regarding executive compensation required of larger public companies; or hold stockholder advisory votes on executive compensation.
Although the JOBS Act allows us to take advantage of the exemption from complying with any new or revised financial accounting standards applicable to public companies until such standards are also applicable to private companies, we have irrevocably elected not to take advantage of the extension of time to comply with new or revised financial accounting standards under Section 102(b) of the JOBS Act.
We cannot predict if investors will find shares of our common stock less attractive because we will not be subject to
the same reporting and other requirements as other public companies. If some investors find shares of our common stock less attractive as a result, there may be a less active trading market for our common stock, and the per share trading price of our common stock could decline and may be more volatile.
The market price and trading volume of our common stock may be highly volatile and low, respectively.
The stock markets, including the New York Stock Exchange (the “NYSE”), on which our common stock is listed, historically have experienced significant price and volume fluctuations. As a result, the market price of our common stock is likely to be similarly volatile, and investors in our common stock may experience a decrease in the value of their shares, including decreases unrelated to our operating performance or prospects. The price of our common stock could be subject to wide fluctuations in response to a number of factors, including those listed in this "Risk Factors" section of this Annual Report and others such as:
actual or anticipated variations in our quarterly results of operations or dividends; changes in our funds from operations or earnings estimates; changes in government regulations or policies affecting our business or the farming business; publication of research reports about us or the real estate or farming industries;

36
sustained decreases in agricultural commodity and crop prices; increases in market interest rates that lead purchasers of our common stock to demand a higher yield; changes in market valuations of similar companies; adverse market reaction to any additional debt we incur in the future; additions or departures of key management personnel; actions by institutional stockholders; speculation in the press or investment community; the realization of any of the other risk factors presented in this Annual Report; the extent of investor interest in our securities; the general reputation of REITs and the attractiveness of our equity securities in comparison to other equity
securities, including securities issued by other real estate-based companies; our underlying asset value; investor confidence in the stock and bond markets generally; changes in tax laws; future equity issuances; failure to meet earnings estimates; failure to meet and maintain REIT qualifications and requirements; low trading volume of our stock; and general market and economic conditions.
In the past, securities class action litigation has often been instituted against companies following periods of volatility
in the price of their common stock. This type of litigation could result in substantial costs and divert our management's attention and resources, which could have a material adverse effect on us, including our financial condition, results of operations, cash flow and the per share trading price of our common stock.
The number of shares of our common stock available for future issuance or sale may have adverse effects on the market price of our common stock.
As of December 31, 2016, approximately 17.4 million shares of our common stock were outstanding. In addition, as of the date of this Annual Report, other than the OP units held by us, approximately 6.2 million OP units in our operating partnership were outstanding, 3,013,216 of which currently may be tendered for redemption by the holders, for cash, or at our option, for shares of our common stock, on a one-for-one basis. We have registered the issuance of 3,013,126 of the shares issuable upon redemption of OP units, and we intend to register the issuance of additional shares that may be issued upon redemption of OP units so that such shares will be freely tradable under the securities laws.

37
We cannot predict whether future issuances or sales of shares of our common stock or the availability of shares for resale in the open market will decrease the per share trading price per share of our common stock. The per share trading price of our common stock may decline significantly when we register the shares of our common stock issuable upon redemption of outstanding OP units.
Future offerings of debt, which would be senior to our common stock upon liquidation, preferred equity securities, which may be senior to our common stock for purposes of dividend distributions or upon liquidation, and OP units in connection with future acquisitions may materially adversely affect us, including the per share trading price of our common stock.
In the future, we may attempt to increase our capital resources by making additional offerings of debt or equity securities (or causing our operating partnership to issue debt securities), including medium-term notes, senior or subordinated notes and classes or series of preferred stock. Upon liquidation, holders of our debt securities and shares of preferred stock and lenders with respect to other borrowings will be entitled to receive payments prior to distributions to the holders of our common stock. Additionally, any convertible or exchangeable securities that we issue in the future may have rights, preferences and privileges more favorable than those of our common stock and may result in dilution to owners of our common stock. Holders of our common stock are not entitled to preemptive rights or other protections against dilution. Our preferred stock, if issued, could have a preference on liquidating distributions or a preference on dividend payments that could limit our ability to pay dividends to the holders of our common stock. Because our decision to issue securities in any future offering will depend on market conditions and other factors beyond our control, we cannot predict or estimate the amount, timing or nature of our future offerings. Thus, our stockholders bear the risk that our future offerings could reduce the per share trading price of our common stock and dilute their interest in us. In addition, the issuance of OP units in connection with future acquisitions and the redemption of such OP units for common stock may be dilutive to our stockholders and could have an adverse effect on the per share trading price of our common stock. An increase in market interest rates may have an adverse effect on the market price of our common stock.
One of the factors that investors may consider in deciding whether to buy or sell our common stock is our distribution yield, which is our distribution rate as a percentage of our share price, relative to market interest rates. If market interest rates increase, prospective investors may desire a higher distribution yield on our common stock or may seek securities paying higher dividends or interest. The market price of our common stock likely will be based primarily on the earnings that we derive from rental income with respect to our properties and our related distributions to stockholders, and not from the underlying appraised value of the properties themselves. As a result, interest rate fluctuations and capital market conditions are likely to affect the market price of our common stock, and such effects could be significant. For instance, if interest rates rise without an increase in our distribution rate, the market price of our common stock could decrease because potential investors may require a higher distribution yield on our common stock as market rates on interest-bearing securities, such as bonds, rise.
Item 1B. Unresolved Staff Comments
None.
Item 2. Properties
The information set forth under the caption “Our Properties” in Item 1 of this Annual Report on Form 10-K is incorporated by reference herein.
Item 3. Legal Proceedings
The nature of our business exposes our properties, us and the Operating Partnership to the risk of claims and litigation in the normal course of business.

38
On October 26, 2016, a purported class action lawsuit was filed in the Circuit Court for Baltimore County, Maryland against the directors of AFCO, AFCO, certain affiliates of AFCO and the Company under the caption Parshall v. American Farmland Company et. al., Case No. 24C16005745. The complaint alleges that the AFCO directors breached their duties to AFCO in connection with the evaluation and approval of the proposed merger with the Company. In addition, the complaint alleges, among other things, that the Company aided and abetted those breaches of duties. The initial complaint sought equitable relief, including a potential injunction against the AFCO Mergers, but the plaintiffs did not seek further proceedings and the merger has closed. We believe the allegations in the complaint are without merit and intend to defend against those allegations. By virtue of our acquisition of AFCO, we succeeded to any liabilities of AFCO. Item 4. Mine Safety Disclosures
Not Applicable.
PART II
Item 5. Market For Registrant’s Common Equity, Related Stockholder Matters and Issuer Purchases of Equity Securities
Market Information
Our common stock trades on the NYSE under the symbol “FPI.” Below is a summary of the high and low prices of our common stock for each quarterly period since April 10, 2014, the date our common stock began trading on the NYSE MKT, and the cash distributions per share declared by us with respect to each period. Our common stock ceased trading on the NYSE MKT on September 4, 2015 and began trading on the NYSE on September 8, 2015.
High Low
Distributions Declared
January 1, 2016 – March 31, 2016 $ 11.22 $ 9.54 $ 0.13 April 1, 2016 – June 30, 2016 $ 11.64 $ 10.55 $ 0.13 July 1, 2016 – September 30, 2016 $ 11.98 $ 10.36 $ 0.13 October 1, 2016 – December 31, 2016 $ 11.97 $ 10.00 $ 0.13 January 1, 2015 – March 31, 2015 $ 11.98 $ 10.25 $ 0.12 April 1, 2015 – June 30, 2015 $ 12.50 $ 10.82 $ 0.13 July 1, 2015 – September 30, 2015 $ 12.55 $ 9.76 $ 0.13 October 1, 2015 – December 31, 2015 $ 11.40 $ 10.01 $ 0.13 April 10, 2014 – June 30, 2014(1) $ 14.00 $ 12.20 $ 0.11 July 1, 2014 – September 30, 2014 $ 13.63 $ 10.56 $ 0.11 October 1, 2014 – December 31, 2014 $ 11.40 $ 9.48 $ 0.12
(1) We completed an initial public offering of shares of our common stock on April 10, 2014. On December 31, 2016 and February 21, 2017, the closing price of our common stock as reported on the NYSE was $11.16 and $10.93, respectively.

39
Stock Performance Graph
The following graph compares the total stockholder return of our common stock (assuming reinvestment of dividends) against the cumulative returns of the Standard & Poor’s Corporation Composite 500 Index and the SNL Financial REIT Index, or the SNLUS REITs for the period from April 16, 2014, the date of the initial listing of our common stock on the NYSE MKT to December 31, 2016. Our common stock began trading on the NYSE on September 8, 2015.
75
100
125
150
04/10/14 06/30/14 12/31/14 06/30/15 12/31/15 06/30/16 12/31/16
Ind
ex
Va
lue
Total Return Performance
Farmland Partners Inc.
S&P 500
SNL US REIT Equity
SNL U.S. REITs < $250M Implied Cap
Period Ending Index 04/10/14 06/30/14 12/31/14 06/30/15 12/31/15 06/30/16 12/31/16Farmland Partners Inc. 100.00 94.36 76.54 89.31 84.37 89.11 89.84 S&P 500 100.00 107.41 113.98 115.38 115.56 119.99 129.38 SNL US REIT Equity 100.00 106.72 117.39 111.12 120.63 137.29 131.34 SNL US REITs < $250M Implied Cap 100.00 104.63 106.55 113.97 101.09 127.78 131.74
Distribution Information
Since our initial quarter as a publicly traded REIT, we have made regular quarterly distributions to our stockholders. We intend to continue to declare quarterly distributions. However, we cannot provide any assurance as to the amount or timing of future distributions.
Our ability to make distributions in the future will depend upon our actual results of operations and earnings, economic conditions and other factors that could differ materially from our current expectations. Our actual results of operations will be affected by a number of factors, including the revenue we receive from our properties, our operating expenses, interest expense, the ability of our tenants to meet their obligations and unanticipated expenditures. For more information regarding risk factors that could materially adversely affect our actual results of operations, see "Risk Factors." Any future distributions will be authorized by our Board of Directors in its sole discretion out of funds legally available therefor and will be dependent upon a number of factors, including restrictions under applicable law, the capital requirements of our company and the distribution requirements necessary to qualify and maintain our qualification as a REIT. We may be required to fund distributions from working capital or borrow to provide funds for such distributions, or we may choose to make a portion of the required distributions in the form of a taxable stock dividend to preserve our cash balance or reduce our distribution.

40
In order to maintain qualification as a REIT, we must distribute to our stockholders, on an annual basis, at least 90% of our REIT taxable income, determined without regard to the deduction for dividends paid and excluding net capital gains. In addition, we will be subject to U.S. federal income tax at regular corporate rates to the extent that we distribute less than 100% of our net taxable income (including net capital gains) and will be subject to a 4% nondeductible excise tax on the amount by which our distributions in any calendar year are less than a minimum amount specified under applicable U.S. federal income tax laws. We intend to distribute our net income to our stockholders in a manner intended to satisfy the REIT 90% distribution requirement and to avoid any U.S. federal income tax liability on our income and the 4% nondeductible excise tax. We anticipate that our estimated cash available for distribution will exceed the annual distribution requirements applicable to REITs. However, under some circumstances, we may be required to use cash reserves, incur debt or liquidate assets at rates or times that we regard as unfavorable or make a taxable distribution of our shares in order to satisfy the REIT 90% distribution requirement and to avoid U.S. federal income tax and the 4% nondeductible excise tax.
We anticipate that, from time to time, our distributions will exceed our then current and accumulated earnings and profits for the relevant taxable year, as determined for U.S. federal income tax purposes, due to non-cash expenses such as certain stock-based compensation and depreciation and amortization. Therefore, a portion of our distributions may represent a return of capital for U.S. federal income tax purposes. The extent to which our distributions exceed our current and accumulated earnings and profits may vary substantially from year to year. To the extent a distribution is treated as a return of capital for U.S. federal income tax purposes, it will reduce a stockholder's adjusted tax basis in the holder's shares and, to the extent it exceeds the holder's adjusted tax basis, will be treated as gain resulting from a sale or exchange of such shares. As a result, the gain (or loss) recognized on a sale of that common stock or upon our liquidation would be increased (or decreased) accordingly.
Stockholder Information
As of February 23, 2017, there were approximately 61 holders of record of our common stock. However, because many shares of our common stock are held by brokers and other institutions on behalf of stockholders, we believe there are substantially more beneficial holders of our common stock than record holders. As of February 23, 2017, there were approximately 27 holders (other than our company and management) of our OP units. Our OP units are redeemable for cash or, at our election, for shares of our common stock, on a one-for-one basis. As of February 23, 2017, there were six holders of our Preferred Units.
Issuer Purchases of Equity Securities
Share Repurchase Program
On October 29, 2014, our Board of Directors approved a program to repurchase up to $10 million in shares of our common stock. Repurchases under this program may be made from time to time, in amounts and prices as the Company deems appropriate. Repurchases may be made in open market or privately negotiated transactions in compliance with Rule 10b-18 under the Exchange Act, subject to market conditions, applicable legal requirements, trading restrictions under our insider trading policy, and other relevant factors. This share repurchase program does not obligate us to acquire any particular amount of common stock, and it may be modified or suspended at any time at the Company’s discretion. We expect to fund repurchases under the program using cash on its balance sheet. As of December 31, 2016, we had repurchased 2,130 shares at an average price per share of $9.81 for a total cost of $20,932, including fees. The following table represents the activity from the fourth quarter of 2016 under the repurchase program:
Total Number Approximate of Shares Dollar Value of Purchased as Shares that May Part of Yet Be Publically Purchased Average Announced Under the Share Total Shares Price Paid Plans or Repurchase
($ in thousands) Purchased per Share Programs Program October 1, 2016 - October 31, 2016 — $ — — $ 9,979 November 1, 2016 - November 30, 2016 — — — 9,979 December 1, 2016 - December 31, 2016 — — — 9,979
Total — $ — — $ 9,979

41
Item 6. Selected Financial Data
The following selected financial data as of and for the years ended December 31, 2016, 2015, 2014, 2013 and 2012 is derived from our audited consolidated financial statements. The data should be read in conjunction with, and is qualified in its entirety by reference to, our consolidated financial statements and notes thereto, included elsewhere in this Annual Report, and “Management’s Discussion and Analysis of Financial Condition and Results of Operations,” included in Item 7 of this Annual Report.
All periods presented in the table below prior to April 16, 2014, the date of our initial public offering, reflect the operations of our Predecessor. The historical combined financial data for our Predecessor is not necessarily indicative of our results of operations, cash flows or financial position following the completion of our initial public offering.
As of and for the years ended December 31, ($ in thousands) 2016 2015 2014 2013 2012 Operating Data Total operating revenues $ 31,001 $ 13,756 $ 4,218 $ 2,350 $ 2,123 Net income (loss) $ 5,999 $ 1,689 $ (671) $ 34 $ 586 Per Share Data Basic and diluted net income (loss) available to common stockholders $ 0.09 $ 0.08 $ (0.15) $ — $ — Distributions declared per common share $ 0.5100 $ 0.4985 $ 0.3260 $ — $ — Basic weighted average common shares outstanding 13,204 9,619 4,265 — — Diluted weighted average common shares outstanding 13,204 9,629 4,265 — — Supplemental Data EBITDA(1) $ 17,523 $ 7,208 $ 1,030 $ 1,525 $ 1,873 Adjusted EBITDA(1) $ 21,624 $ 8,678 $ 2,089 $ 1,525 $ 1,887 FFO(1) $ 7,553 $ 2,582 $ (342) $ 183 $ 711 AFFO(1) $ 11,011 $ 4,052 $ 717 $ 183 $ 725 Balance Sheet Data Total assets $ 655,529 $ 344,954 $ 200,658 $ 39,536 $ 36,898 Total liabilities $ 320,020 $ 196,726 $ 117,132 $ 44,259 $ 36,564 Redeemable non-controlling interest in operating partnership, common units $ — $ 9,694 $ — $ — $ — Redeemable non-controlling interest in operating partnership, preferred units $ 119,915 $ — $ — $ — $ — Total equity (deficit) $ 215,594 $ 138,534 $ 83,526 $ (4,723) $ 334
(1) For definitions and reconciliations of net income to earnings before interest, taxes, depreciation and amortization, or EBITDA, Adjusted EBITDA,
funds from operations, or FFO, and Adjusted FFO, or AFFO, as well as a statement disclosing the reasons why our management believes that EBITDA, Adjusted EBITDA, FFO and AFFO provide useful information to investors and, to the extent material any additional purposes for which our management uses such measures, see “Management’s Discussion and Analysis of Financial Condition and Results of Operations – Non-GAAP Financial Measures.”

42
Item 7. Management’s Discussion and Analysis of Financial Condition and Results of Operations
The following analysis of our financial condition and results of operations should be read in conjunction with our financial statements and the notes thereto contained elsewhere in this Annual Report on Form 10-K. Overview and Background
We are an internally managed real estate company that owns and seeks to acquire high-quality farmland located in agricultural markets throughout North America. As of the date of this Annual Report, we own farms with an aggregate of approximately 142,223 acres in Alabama, Arkansas, California, Colorado, Florida, Georgia, Illinois, Kansas, Louisiana, Michigan, Mississippi, Nebraska, North Carolina, South Carolina, Texas, and Virginia. As of the date of this Annual Report, approximately 75% of the acres in our portfolio are used to grow primary crops, such as corn, soybeans, wheat, rice and cotton, and approximately 25% of the acres in our portfolio produce specialty crops, such as blueberries, vegetables, citrus, nuts and edible beans. We believe our portfolio gives investors exposure to the increasing global food demand trend in the face of growing scarcity of high quality farmland and will reflect the approximate breakdown of U.S. agricultural output between primary crops and animal protein (whose production relies principally on primary crops as feed), on one hand, and specialty crops, on the other.
In addition, in August 2015, we announced the launch of the FPI Loan Program, an agricultural lending product aimed
at farmers, as a complement to our primary business of acquiring and owning farmland and leasing it to farmers. Under the FPI Loan Program, we make loans to third-party farmers (both tenant and non-tenant) to provide partial financing for working capital requirements and operational farming activities, farming infrastructure projects, and for other farming and agricultural real estate related purposes.
We were incorporated in Maryland on September 27, 2013, and we are the sole member of the sole general partner of
the Operating Partnership, which is a Delaware limited partnership that was formed on September 27, 2013. All of our assets are held by, and our operations are primarily conducted through, the Operating Partnership and its wholly owned subsidiaries. As of the date of this Annual Report we own 83.8% of the OP units and none of the Preferred units. See Note 9 to our consolidated financial statements for additional information regarding the Preferred units.
As of December 31, 2016, we owned 75.1% of the OP units in the Operating Partnership.
We elected and qualified to be taxed as a REIT for U.S. federal income tax purposes commencing with our short
taxable year ended December 31, 2014.

43
Recent Developments Merger with American Farmland Company
We acquired the properties listed in the table below in connection with the AFCO Mergers which closed on February
2, 2017, and, as a result, our portfolio now consists of approximately 75% row crop farmland and 25% specialty crop farmland by value.
State Total Approximate Acres Arkansas 1,445 California 430 California 478 California 786 California 854 California 1,247 California 265 California 623 California 244 California 91 California 610 California 239 California 243 California 185 Florida 2,694 Florida 625 Florida 1,637 Georgia / Alabama 1,840 Illinois 1,652 Illinois 434 Illinois 1,195 17,817
In connection with the AFCO Mergers we issued 14,763,604 shares of our common stock as consideration in the
Company Merger, 17,373 shares of our common stock in respect of fully earned and vested AFCO restricted stock units, and 218,525 OP units in connection with the Partnership Merger at a share price of $11.41 per share on the date of the merger for a total consideration of $171.1 million. The allocation of the purchase price for the farms acquired is preliminary and may change during the measurement period, which may be up to one year from the acquisition date, if the Company obtains new information regarding the assets acquired or liabilities assumed at the acquisition date.

44
2016 Completed Acquisitions
During 2016, we completed 24 acquisitions as set forth in the table below. The 2016 acquisitions expanded our presence to two new states, bringing our total presence to fourteen states as of December 31, 2016.
Total Date Approximate Purchase
State Acquired Acres Price Georgia 1/12/2016 608 $ 1,202 Michigan 1/21/2016 265 1,630 Texas 1/27/2016 2,056 6,117 Illinois 2/26/2016 40 371 Illinois 3/2/2016 22,129 197,145 Georgia 3/11/2016 208 624 Illinois 3/24/2016 80 667 Louisiana 3/31/2016 7,400 31,764 Mississippi 4/4/2016 624 2,307 Georgia 4/6/2016 213 577 Georgia 4/6/2016 274 958 South Carolina 5/12/2016 330 1,528 Texas 5/17/2016 640 1,800 Illinois 6/27/2016 77 697 Colorado 6/29/2016 1,261 1,760 Illinois 6/30/2016 203 1,905 Georgia 7/20/2016 266 862 Colorado 7/27/2016 142 5,524 Kansas 7/27/2016 158 325 Florida 8/31/2016 2,426 9,497 Georgia 9/16/2016 445 1,402 Illinois 9/29/2016 7 120 Illinois 11/2/2016 95 563 Arkansas 12/21/2016 1,122 4,066
41,069 $ 273,411
(1) This acquisition closed on March 2, 2016. The purchase price of the property was comprised of (a) $50.0 million in cash, (b) an aggregate
of 2,608,695 OP units valued at $11.50 per OP unit and (c) 117,000 Preferred units. See “Note 9 – Stockholders’ Equity and Non-controlling Interests”.
(2) The acquisition closed on December 21, 2016. The purchase price of the property was comprised of approximately $3.3 million in cash and an aggregate of 69,691 OP units valued at $10.95 per OP unit.

45
Acquisitions Completed to date in 2017 As of the date of this Annual Report, we have completed acquisitions of the following properties in 2017 other than the properties acquired in the AFCO Mergers:
($ in thousands)
State Date Acquired
Total Approximate Acres Purchase Price
Illinois(1) 1/12/2017 321 $ 3,360 Illinois 2/14/2017 8,452 54,263 South Carolina 2/21/2017 144 529 8,917 $ 58,152
(1) The consideration consisted entirely of OP units.
As described above, on February 2, 2017, we successfully completed the merger with AFCO, which resulted in us
acquiring 21 permanent and row crop farms in 2017. Properties under Contract
As of the date of this Annual Report, the following farms are under contract:
($ in thousands)
State Date Under Contract
Total Approximate Acres Purchase Price
Michigan(1) 1/17/2017 1,726 $ 10,000 Kansas 1/30/2017 155 500 South Carolina 1/31/2017 300 1,200 Georgia 2/7/2017 614 1,900 South Carolina 2/7/2017 644 1,478 South Dakota 2/12/2017 1,690 6,760 Colorado(1) 2/17/2017 1,083 5,450 6,212 $ 27,288
(1) The consideration consists of a combination of cash and OP units.
These acquisitions are expected to close in the first half of 2017, subject to the satisfaction of certain customary closing
conditions. There can be no assurance that these conditions will be satisfied or that the pending acquisitions will be consummated on the terms described herein, or at all. Follow-on Equity Offering
On December 5, 2016, we completed an underwritten public offering of 3,100,000 shares of common stock at a price per share of $11.25 and generated aggregate net proceeds to the Company of approximately $32.9 million, after deducting the underwriting discount and commissions and expenses payable by the Company.
At-the-Market Equity Offering Program
On September 15, 2015, we filed a prospectus supplement under which we may sell shares of common stock having an aggregate gross sales price of up to $25,000,000 through an “at-the-market” equity offering program (the “ATM Program”). The offering is made pursuant to a shelf registration statement on Form S-3 that was declared effective by the SEC on May 14, 2015. As of December 31, 2016, 994,908 shares had been issued under the program for aggregate net proceeds of $11.1 million at a weighted average price per share of $11.17.
Financing Activity
On December 21, 2016, a wholly owned subsidiary of the Operating Partnership entered into a loan agreement with The Prudential Insurance Company of America (“Prudential”) which provides for a loan of approximately $6.6 million to

46
the Company with a maturity date of July 1, 2019 (the “Prudential Note”). Interest on the Prudential Note is payable in cash semi-annually and accrues at a fixed rate of 3.20% per annum. Proceeds from the Prudential Note were used to acquire additional properties and for general corporate purposes.
On January 12, 2017, five wholly owned subsidiaries of the Operating Partnership, entered into a loan agreement (the
“Fifth MetLife Loan Agreement”) with Metropolitan Life Insurance Company (“Metlife”) which provides for a loan of approximately $8.4 million to the Company with a maturity date of January 12, 2027 (“Term Loan 5”). Interest on Term Loan 5 is payable in cash semi-annually and accrues at a 3.26% per annum fixed rate, this may be adjusted by MetLife on each of Janaury 12, 2020, January 12, 2023 and January 12, 2026 at the option of the Lender to a rate that is consistent with similar loans. Proceeds from Term Loan 5 were used to acquire additional properties and for general corporate purposes.
In connection with the Term Loan 5, on January 12, 2017, the Company and the Operating Partnership each entered into a separate guaranty (the “Term Loan 5 Guaranties”) whereby the Company and the Operating Partnership jointly and severally agreed to unconditionally guarantee all of the borrowers’ obligations under the Fifth MetLife Loan Agreement.
As part of the AFCO Mergers, by virtue of AFCO OP becoming a subsidiary of the Company and the Operating Partnership, the Company and the Operating Partnership acquired four senior secured credit facilities in the aggregate amount of $90 million (the “Existing Rutledge Loans”) by and between AFCO OP and Rutledge Investment Company (“Rutledge”). On February 3, 2017, AFCO OP entered into the Second Amendment to the Existing Rutledge Credit Facilities and the Company and the Operating Partnership each entered into guaranty agreements pursuant to which they will unconditionally guarantee the obligations of AFCO OP the Existing Rutledge Loan Agreements. In addition, on February 3, 2017, AFCO OP entered into a fifth loan agreement with Rutledge (the “Fifth Rutledge Loan Agreement” and, together with the Existing Rutledge Loan Agreements, the “Rutledge Loan Agreements”) with respect to a senior secured credit facility in the aggregate amount of $30 million. See “—Liquidity and Capital Resources—Consolidated Indebtedness—Rutledge Credit Facilities.”
On February 14, 2017, five wholly owned subsidiaries of the Operating Partnership, entered into a loan agreement
(the “Sixth MetLife Loan Agreement”) with Metropolitan Life Insurance Company (“Metlife”) which provides for a loan of approximately $27.2 million to the Company with a maturity date of February 14, 2027 (“Term Loan 6”). Interest on Term Loan 6 is payable in cash semi-annually and accrues at a 3.21% per annum fixed rate, this may be adjusted by MetLife on each of February 14, 2020, February 14, 2023 and February 14, 2026 at the option of the Lender to a rate that is consistent with similar loans. Proceeds from Term Loan 6 were used to acquire additional properties.
In connection with the Term Loan 6, on February 14, 2017, the Company and the Operating Partnership each entered into a separate guaranty (the “Term Loan 6 Guaranties”) whereby the Company and the Operating Partnership jointly and severally agreed to unconditionally guarantee all of the borrowers’ obligations under the Sixth MetLife Loan Agreement. Termination of Leases
The Company entered into two separate sale and partial leaseback transactions in North Carolina, South Carolina, and Virginia in December 2014 and June 2015. These leases were due to expire on December 31, 2016, December 31, 2017 and December 31, 2019. The tenant and the Company agreed to terminate the leases effective as of December 31, 2016. As part of the termination settlement, the tenant agreed to pay an additional rent amount related to 2016 of $2.8 million. In addition, the Company fully recognized as 2016 revenue certain rent payments, totaling $3.7 million, of which the majority was made by the tenant in June 2015, that the Company had not yet recognized under its revenue recognition policy. Sub-Advisory Agreement Upon consummation of the AFCO Mergers, by virtue of AFCO being merged with and into one of the Company’s wholly-owned subsidiaries and AFCO OP becoming a wholly-owned subsidiary of the Company, the Company acquired the Amended and Restated Sub-Advisory Agreement, dated as of October 23, 2015 (the “Sub-Advisory Agreement”), by and among AFCO, American Farmland Advisors, AFCO OP and Prudential Capital Mortgage Company (the “Sub-

47
Advisor”). On February 18, 2017, Farmland Partners Inc. (the “Company”) entered into a Termination Agreement (the “Termination Agreement”) with the Sub-Advisor pursuant to which the Company and Prudential agreed to terminate the Sub-Advisory Agreement and certain related property management agreements (together with the Sub-Advisory Agreement, the “Prudential Agreements”).
The Termination Agreement provides that, as of March 31, 2017, Prudential will no longer provide services to the Company under the Prudential Agreements. The Company has agreed to pay Prudential $1.6 million in cash, which is equal to the fee that would be owed to Prudential for services through the quarter ended March 31, 2017 and a termination fee of approximately $160,000. Factors That May Influence Future Results of Operations and Farmland Values
The principal factors affecting our operating results and the value of our farmland include global demand for food relative to the global supply of food, farmland fundamentals and economic conditions in the markets in which we own farmland, and our ability to increase or maintain rental revenues while controlling expenses. Although farmland prices may show a decline from time to time, we believe that any reduction in U.S. farmland values overall is likely to be short-lived as global demand for food and agricultural commodities typically exceeds global supply. In addition, although prices for many crops experienced significant declines in 2014 and 2015, we do not believe that such declines represent a trend that will continue over the long term. Rather, we believe that long-term growth trends in global population and GDP per capita will result in increased prices for primary crops over time. Demand
We expect that global demand for food, driven primarily by significant increases in the global population and GDP per capita, will continue to be the key driver of farmland values. We further expect that global demand for most crops will continue to grow to keep pace with global population growth, which we anticipate will lead to either higher prices and/or higher yields and, therefore, higher rental rates on our farmland, as well as sustained growth in farmland values over the long-term. We also believe that growth in global GDP per capita, particularly in developing nations, will contribute significantly to increasing demand for primary crops. As global GDP per capita increases, the composition of daily caloric intake is expected to shift away from the direct consumption of primary crops toward animal-based proteins, which is expected to result in increased demand for primary crops as feed for livestock. According to the United Nations’ Food and Agriculture Organization (“UN FAO”), these factors are expected to require more than one billion additional tons of global annual grain production by 2050, a 45.5% increase from 2005-2007 levels and more than two times the 475 million tons of grain produced in the United States in 2014. Furthermore, we believe that, as GDP per capita grows, a significant portion of additional household income is allocated to food and that once individuals increase consumption of, and spending on, higher quality food, they will strongly resist returning to their former dietary habits, resulting in greater inelasticity in the demand for food. As a result, we believe that, as global demand for food increases, rental rates on our farmland and the value of our farmland will increase over the long-term. Global demand for corn and soybeans as inputs in the production of biofuels such as ethanol and soy diesel also could impact the prices of corn and soybeans, which, in the long-term, could impact our rental revenues and our results of operations. However, the success of our business strategy is not dependent on growth in demand for biofuels and we do not believe that demand for corn and soybeans as inputs in the production of biofuels will materially impact our results of operations or the value of our farmland, primarily because we believe that growth in global population and GDP per capita will be more significant drivers of global demand for primary crops over the long-term. Supply
Global supply of agricultural commodities is driven by two primary factors, the number of tillable acres available for crop production and the productivity of the acres being farmed. Although the amount of global cropland in use has gradually increased over time, growth has plateaued over the last 20 years. Cropland area continues to increase in developing countries, but after accounting for expected continuing cropland loss, the UN FAO projects only 171 million acres will be added from 2005-2007 to 2050, a 4.3% increase. In comparison, world population is expected to grow over the same period to 9.7 billion, a nearly 40% increase. While we expect growth in the global supply of arable land, we also expect that landowners will only put that land into production if increases in commodity prices and the value of farmland

48
cause landowners to benefit economically from using the land for farming rather than alternative uses. We also believe that decreases in the amount of arable land in the United States and globally as a result of increasing urbanization will partially offset the impact of additional supply of farmland. The global supply of food is also impacted by the productivity per acre of tillable land. Historically, productivity gains (measured by average crop yields) have been driven by advances in seed technology, farm equipment, irrigation techniques and chemical fertilizers and pesticides. Furthermore, we expect the increasing shortage of water in many irrigated growing regions in the United States and other growing regions around the globe, often as a result of new water restrictions imposed by laws or regulations, to lead to decreased productivity growth on many acres and, in some cases, cause yields to decline on those acres. Conditions in Our Existing Markets
Our portfolio spans numerous farmland markets and crop types, which provides us broad diversification across conditions in these markets. Across all regions, farmland acquisitions continue to be dominated by buyers who are existing farm owners and operators; institutional and investor acquirors remain a small fraction of the industry. We generally see firm demand for high quality properties across all regions and crop types.
With regard to leasing dynamics, we believe quality farmland in the United States has a near-zero vacancy rate as a
result of the supply and demand fundamentals discussed above. Our view is that rental rates for farmland are a function of farmland operators’ view of the long-term profitability of farmland, and that many farm operators will compete for farmland even during periods of decreased profitability due to the scarcity of farmland available to rent. In particular, we believe that due to the relatively high fixed costs associated with farming operations (including equipment, labor and knowledge), many farm operators in some circumstances will rent additional acres of farmland when it becomes available in order to allocate their fixed costs over additional acres. Furthermore, because it is generally customary in the industry to provide the existing tenant with the opportunity to re-lease the land at the end of each lease term, we believe that many farm operators will rent additional land that becomes available in order to control the ability to farm that land in future periods. As a result, in our experience, many farm operators will aggressively pursue rental opportunities in their operable geographic area, even when the farmer anticipates lower current returns or short-term losses.
In our primary row crop farmland, we see flat to modestly lower rent rates in connection with 2017 lease renewals.
This is consistent with, on the one hand, headwinds in primary crop markets and, on the other, tenant demand for leasing high quality farmland. In 2016, we had a higher portion than in 2015 of our fixed cash leases providing for payment of 50% of a year’s rent after harvest rather than substantially all of the lease paid prior to harvest, as compared to 2016. This structure better matches operator cash flows. Given per acre revenue on our primary crop farmland and crop insurance levels, we do not expect that this structure materially changes tenant credit risk. Due to the short term nature of most of our primary crop leases, we believe that a recovery of crop prices and farm profitability will be reflected relatively rapidly in our revenues via increases in rent rates. Across specialty crops, operator profitability generally remains healthy. Participating lease structures are common in many specialty crops and base lease rates are consistent with 2016. Lease Expirations
Farm leases are often short-term in nature. As of December 31, 2016 our portfolio had the following lease expirations as a percentage of approximate acres leased and annualized minimum cash rents:
% of % of ($ in thousands) Approximate Approximate Annual Annual Year Ending December 31, Acres Acres Cash Rents Cash Rents 2017 14,608 24.1 % $ 3,091 25.9 % 2018 31,372 51.7 % 4,967 41.7 % 2019 9,722 16.0 % 2,515 21.1 % 2020 2,244 3.7 % 630 5.3 % 2021 — — % — — % 2022 and beyond 2,691 4.5 % 718 6.0 % 60,637 100.0 % $ 11,921 100.0 %

49
We have or are currently negotiating leases on 50,721 acres and have 3,978 acres which have lease payments based solely on a percentage of farming revenues or crops, which are not included in the table above. We expect that rents for primary crop farmland will experience a modest decline in 2017, partially counterbalanced throughout our portfolio by rent increases deriving from farm improvements, such as irrigation, drainage and grain storage, that were or will be put in service for the 2017 crop year. We expect that rents for specialty crop farmland will be flat to modestly increasing. Rental Revenues
Our revenues are primarily generated from renting farmland to operators of farming businesses. Our leases have terms ranging from one to ten years. Although the majority of our leases do not provide the tenant with a contractual right to renew the lease upon its expiration, we believe it is customary to provide the existing tenant with the opportunity to renew the lease, subject to any increase in the rental rate that we may establish. If the tenant elects not to renew the lease at the end of the lease term, the land will be offered to a new tenant.
The leases for the majority of the properties in our portfolio provide that tenants must pay us at least 50% (and often 100%) of the annual rent in advance of each spring planting season. As a result, we collect a significant portion of total annual rents in the first calendar quarter of each year. We believe our use of leases pursuant to which at least 50% of the annual rent is payable in advance of each spring planting season mitigates the tenant credit risk associated with the variability of farming operations that could be adversely impacted by poor crop yields, weather conditions, mismanagement, undercapitalization or other factors affecting our tenants. Prior to acquiring farmland property, we take into consideration the competitiveness of the local farm-operator tenant environment in order to enhance our ability to quickly replace a tenant that is unwilling to renew a lease or is unable to pay a rent payment when it is due. Some of our leases provide for a reimbursement of the property taxes we pay. We expect that, going forward, a progressively smaller percentage of our leases will provide for such a reimbursement. Expenses
Substantially all of our farm leases are structured in such a way that we are responsible for major maintenance, certain insurance and taxes (which are sometimes reimbursed to us by our tenants), while our tenant is responsible for minor maintenance, water usage and all of the additional input costs related to farming operations on the property, such as seed, fertilizer, labor and fuel. We expect that substantially all of the leases for farmland we acquire in the future will continue to be structured in a manner consistent with substantially all of our existing leases. As the owner of the land, we generally only bear costs related to major capital improvements permanently attached to the property, such as irrigation systems, drainage tile, grain storage facilities, permanent plantings or other physical structures customary for farms. In cases where capital expenditures are necessary, we typically seek to offset, over a period of multiple years, the costs of such capital expenditures by increasing rental rates. We also incur the costs associated with maintaining liability and casualty insurance.
We incur costs associated with running a public company, including, among others, costs associated with employing our personnel and compliance costs. We incur costs associated with due diligence and acquisitions, including, among others, travel expenses, consulting fees, and legal and accounting fees. We also incur costs associated with managing our farmland. The management of our farmland, generally, is not labor or capital intensive because farmland generally has minimal physical structures that require routine inspection and maintenance, and our leases, generally, are structured to require the tenant to pay many of the costs associated with the property. Furthermore, we believe that our platform is scalable, and we do not expect the expenses associated with managing our portfolio of farmland to increase significantly as the number of farm properties we own increases over time. Rather, we expect that as we continue to add additional farmland to our portfolio, we will be able to achieve economies of scale, which will enable us to reduce our operating costs per acre.
Crop Prices
Our exposure to short-term crop price declines is limited as most of our leases do not factor in per bushel prices and instead are set on a rental rate per acre basis. This approach is common throughout agriculture for several reasons. This approach recognizes that the value of leased land to a tenant is more closely linked to the total revenue produced on the property which is driven by crop yield and crop price. This approach simplifies the administrative requirements for the

50
landlord and the tenant significantly. This approach supports the tenants’ desire to maintain access to their leased farms which are in short supply, a concept expanded upon below, by providing the landlord consistent rents. Crop price exposure is also limited because tenants also benefit from the fundamental revenue hedging that occurs when large crops mitigate the lower crop prices triggered by their large crop. Similarly, smaller crops have a tendency to increase the crop prices triggered and help increase revenue even when confronted by a smaller crop. Further risk mitigation is available to tenants, and indirectly to us, via crop insurance and hedging programs implemented by tenants. Our TRS takes advantage of this risk mitigation programs and strategies also.
We believe quality farmland in the United States has a near-zero vacancy rate as a result of the supply and demand fundamentals. Our view is that rental rates for farmland are a function of farmland operators’ view of the long-term profitability of farmland, and that many farm operators will compete for farmland even during periods of decreased profitability due to the scarcity of farmland available to rent. In particular, we believe that due to the relatively high fixed costs associated with farming operations (including equipment, labor and knowledge), many farm operators in some circumstances will rent additional acres of farmland when it becomes available in order to allocate their fixed costs over additional acres. Furthermore, because it is generally customary in the industry to provide the existing tenant with the opportunity to re-lease the land at the end of each lease term, we believe that many farm operators will rent additional land that becomes available in order to control the ability to farm that land in future periods. As a result, in our experience, many farm operators will aggressively pursue rental opportunities in their operable geography, even when the farmer anticipates lower current returns or short-term losses.
The value of a crop is affected by many factors that can differ on a yearly basis. Weather conditions and crop disease in major crop production regions worldwide creates a significant risk of price volatility, which may either increase or decrease the value of the crops that our tenants produce each year. Other material factors adding to the volatility of crop prices are changes in government regulations and policy, fluctuations in global prosperity, fluctuations in foreign trade and export markets, and eruptions of military conflicts or civil unrest. Prices for many primary crops, particularly corn, experienced meaningful declines in 2014 and 2015. We do not believe such declines represent a trend over the long term. Rather, we believe those declines represented a combination of correction to historical norms (adjusted for inflation) and high yields induced by farmer planting decisions and unusually favorable weather patterns. We expect that continued long-term growth trends in global population and GDP per capita will result in increased prices for primary crops over time. We expect pricing across specialty crops to generally remains firm relative to 2016 as U.S. and global consumer demand remains strong and supply is broadly balanced to demand. Although annual rental payments under the majority of our leases are not based expressly on the quality or profitability of our tenants' harvests, any of these factors could adversely affect our tenants' ability to meet their obligations to us and our ability to lease or re-lease properties on favorable terms.
Interest Rates
We expect that future changes in interest rates will impact our overall operating performance by, among other things, increasing our borrowing costs. While we may seek to manage our exposure to future changes in rates through interest rate swap agreements or interest rate caps, portions of our overall outstanding debt will likely remain at floating rates. In addition, a sustained material increase in interest rates may cause farmland prices to decline if the rise in real interest rates (which is defined as nominal interest rates minus the inflation rate) is not accompanied by rises in the general levels of inflation. However, our business model anticipates that the value of our farmland will increase, as it has in the past, at a rate that is equal to or greater than the rate of inflation, which may in part offset the impact of rising interest rates on the value of our farmland, but there can be no guarantee that this appreciation will occur to the extent that we anticipate or at all.
Critical Accounting Policies and Estimates
The preparation of financial statements in conformity with GAAP requires management to make estimates and assumptions that affect the reported amount of assets and liabilities and disclosure of contingent assets and liabilities at the date of our financial statements and the reported amounts of revenues and expenses during the reporting period. Actual amounts may differ significantly from these estimates and assumptions. We have provided a summary of our significant accounting policies in the notes to the historical consolidated financial statements included elsewhere in this filing. We have set forth below those accounting policies that we believe require material subjective or complex judgments and have

51
the most significant impact on our financial condition and results of operations. We evaluate our estimates, assumptions and judgments on an ongoing basis, based on information that is then available to us, our experience and various matters that we believe are reasonable and appropriate for consideration under the circumstances. Real Estate Acquisitions
We account for all acquisitions in accordance with the business combinations standard. When we acquire farmland that was previously operated as a rental property, we evaluate whether a lease is in place or a crop is being produced at the time of closing of the acquisition. If a lease is in place or a crop is being produced at the time of acquisition, we account for the transaction as a business combination and charge the costs associated with the acquisition to acquisition and due diligence costs on the Consolidated Statement of Operations as incurred. Otherwise, acquisitions with no lease in place or crops being produced at the time of acquisition are accounted for as asset acquisitions with the transaction costs incurred capitalized to the assets acquired. When we acquire farmland in a sale-lease back transaction with newly originated leases entered into with the seller, we account for the transaction as an asset acquisition and capitalize the transaction costs incurred in connection with the acquisition.
Upon acquisition of real estate, we allocate the purchase price of the real estate based upon the fair value of the assets and liabilities acquired, which historically have consisted of land, drainage improvements, irrigation improvements, groundwater, permanent plantings (bushes, shrubs, vines, perennials) and grain facilities and may also consist of intangible assets including in-place leases, above market and below market leases and tenant relationships. We allocate the purchase price to the fair value of the tangible assets of acquired real estate by valuing the land as if it were unimproved. We value improvements, including permanent plantings and grain facilities, at replacement cost as new adjusted for depreciation.
Our estimates of land value are made using a comparable sales analysis. Factors considered by us in our analysis of
land value include soil types and water availability and the sales prices of comparable farms. Our estimates of groundwater value are made using historical information obtained regarding the applicable aquifer. Factors considered by us in our analysis of groundwater value are related to the location of the aquifer and whether or not the aquifer is a depletable resource or a replenishing resource. If the aquifer is a replenishing resource, no value is allocated to the groundwater. We include an estimate of property taxes in the purchase price allocation of acquisitions to account for the expected liability that was assumed.
When above or below market leases are acquired, we value the intangible assets based on the present value of the
difference between prevailing market rates and the in-place rates measured over a period equal to the remaining term of the lease for above market leases and the initial term plus the term of any below market fixed rate renewal options for below market leases that are considered bargain renewal options. The above market lease values will be amortized as a reduction of rental income over the remaining term of the respective leases. The fair value of acquired below market leases, included in deferred revenue on the accompanying consolidated balance sheets, is amortized as an increase of rental income on a straight-line basis over the remaining non-cancelable terms of the respective leases, plus the terms of any below market fixed rate renewal options that are considered bargain renewal options of the respective leases.
The purchase price is allocated to in-place lease values and tenant relationships, if they are acquired, based on our
evaluation of the specific characteristics of each tenant’s lease and our overall relationship with the tenant. The value of in-place lease intangibles and tenant relationships will be included as components of deferred leasing intangibles, and will be amortized over the remaining lease term (and expected renewal periods of the respective leases for tenant relationships) as amortization expense. If a tenant terminates its lease prior to its stated expiration, any unamortized amounts relating to that lease, including (i) above and below market leases, (ii) in-place lease values, and (iii) tenant relationships, would be recorded to revenue or expense as appropriate. We capitalize acquisition costs and due diligence costs if the asset is expected to qualify as an asset acquisition. If the asset acquisition is abandoned, the capitalized asset acquisition costs will be expensed to acquisition and due diligence costs in the period of abandonment. If we subsequently determine a previously expected asset acquisition is deemed a business combination, the previously capitalized costs are expensed.
Total consideration for acquisitions may include a combination of cash and equity securities. When equity securities
are issued, we determine the fair value of the equity securities issued based on the number of shares of common stock and

52
OP units issued multiplied by the stock price on the date of closing in the case of common stock and OP units, and on liquidation preference in the case of Preferred units.
Using information available at the time of acquisition, we allocate the total consideration to tangible assets and
liabilities and identified intangible assets and liabilities. We may adjust the preliminary purchase price allocations after obtaining more information about asset valuations and liabilities assumed.
Real Estate
Our real estate consists of land, groundwater and improvements made to the land consisting of grain facilities, irrigation improvements, other assets and drainage improvements. We record real estate at cost and capitalize improvements and replacements when they extend the useful life or improve the efficiency of the asset. We expense costs of repairs and maintenance as such costs are incurred. We begin depreciating assets when the asset is ready for its intended use. We compute depreciation and depletion for assets classified as improvements using the straight-line method over the estimated useful life of 10-40 years for grain facilities, 2-40 years for irrigation improvements, 27-65 for drainage improvements, 3-50 years for groundwater, 13-23 years for permanent plantings, and 5-40 years for other assets acquired. We periodically evaluate the estimated useful lives for groundwater based on current state water regulations and depletion levels of the aquifers.
When a sale occurs, we recognize the associated gain when all consideration has been transferred, the sale has closed,
and there is no material continuing involvement. If a sale is expected to generate a loss, we first assess it through the impairment evaluation process. See ‘‘—Impairment of Real Estate Assets’’ below. Impairment of Real Estate Assets
We evaluate our tangible and identifiable intangible real estate assets for impairment indicators whenever events such as declines in a property’s operating performance, deteriorating market conditions, or environmental or legal concerns bring recoverability of the carrying value of one or more assets into question. If such events are present, we project the total undiscounted cash flows of the asset, including proceeds from disposition, and compare it to the net book value of the asset. If this evaluation indicates that the carrying value may not be recoverable, an impairment loss is recorded in earnings equal to the amount by which the carrying value exceeds the fair value of the asset. There have been no impairments recognized on real estate assets in the accompanying financial statements. Inventory of our TRS
The costs of growing crop are accumulated until the time of harvest at the lower of cost or market value and are
included in inventory in our consolidated financial statements. Costs are allocated to growing crops based on a percentage of the total costs of production and total operating costs that are attributable to the portion of the crops that remain in inventory at the end of the year. Growing crop consists primarily of land preparation, cultivation, irrigation and fertilization costs incurred by FPI Agribusiness. Growing crop inventory is charged to cost of products sold when the related crop is harvested and sold.
Harvested crop inventory includes costs accumulated during both the growing and harvesting phases and is stated at
the lower of those costs or the estimated net realizable value, which is the market price, based upon the nearest market in the geographic region, less any cost of disposition. Cost of disposition includes broker’s commissions, freight and other marketing costs.
Other inventory, such as fertilizer and pesticides, is valued at the lower of cost or market.
Revenue Recognition
Rental income includes rents that each tenant pays in accordance with the terms of its lease. Minimum rents pursuant to leases are recognized as revenue on a straight-line basis over the lease term, including renewal options in the case of bargain renewal options. Deferred revenue includes the cumulative difference between the rental revenue recorded on a

53
straight-line basis and the cash rent received from tenants in accordance with the lease terms. Acquired below market leases are included in deferred revenue on the accompanying consolidated balance sheets, which are amortized into rental income over the life of the respective leases, plus the terms of the below market renewal options, if any.
Leases in place as of December 31, 2016 had terms ranging from one to ten years. As of December 31, 2016, the Company had three leases with rent escalations. The majority of the Company’s leases provide for a fixed annual or semi-annual cash rent payment. Tenant leases on acquired farms generally require the tenant to pay the Company rent for the entire initial year regardless of the date of acquisition, if the acquisition is closed prior to, or shortly after, planting of crops. If the acquisition is closed later in the year, the Company typically receives a partial rent payment or no rent payment at all.
Certain of the Company’s leases provide for a rent payment determined as a percentage of the gross farm proceeds or
a percentage of harvested crops. As of December 31, 2016, a majority of such leases provided for a rent payment determined as a percentage of the gross farm proceeds. Revenue under leases providing for a payment equal to a percentage of the harvested crop or a percentage of the gross farm proceeds are recorded at the guaranteed crop insurance minimums and recognized ratably over the lease term during the crop year. Upon notification from the grain facility that grain has been delivered in the Company’s name, a future contract for delivery of the harvest has been finalized or when the tenant has notified the Company of the total amount of gross farm proceeds, revenue is recognized.
Certain of the Company’s leases provide for minimum cash rent plus a bonus based on gross farm proceeds. Revenue under this type of lease is recognized on a straight-line basis over the lease term based on the minimum cash rent. Bonus rent is recognized upon notification from the tenant of the gross farm proceeds for the year.
Tenant reimbursements include reimbursements for real estate taxes that each tenant pays in accordance with the
terms of its lease. When leases require that the tenant reimburse the Company for property taxes paid by the Company, the reimbursement is reflected as tenant reimbursement revenue on the statements of operations, as earned, and the related property tax as property operating expense, as incurred. When a lease requires that the tenant pay the taxing authority directly, the Company does not incur this cost. If and when it becomes probable that a tenant will not be able to bear the property-related costs, the Company will accrue the estimated expense.
The Company records revenue from the sale of harvested crops when the harvested crop has been contracted to be
delivered to a grain facility and title has transferred. Harvested crops delivered under marketing contracts are recorded using the fixed price of the marketing contract at the time of delivery to a grain facility. Harvested crops delivered without a marketing contract are recorded using the market price at the date the harvested crop is delivered to the grain facility and title has transferred.
The Company recognizes interest income on notes receivable on an accrual basis over the life of the note. Direct origination costs are netted against loan origination fees and are amortized over the life of the note using the straight-line method, which approximates the effective interest method, as an adjustment to interest income which is included in operating revenues as a component of other revenue in the Company’s Consolidated Statements of Operations for the years ended December 31, 2016 and 2015. Income Taxes As a REIT, for income tax purposes we are permitted to deduct dividends paid to our stockholders, thereby eliminating the U.S. federal taxation of income represented by such distributions at the Company level, provided certain requirements are met. REITs are subject to a number of organizational and operational requirements. If we fail to qualify as a REIT in any taxable year, we will be subject to U.S. federal income tax (including any applicable alternative minimum tax) on our taxable income at regular corporate tax rates.
The Operating Partnership leases certain of its farms to the TRS, which is subject to federal and state income taxes. We account for income taxes using the asset and liability method under which deferred tax assets and liabilities are recognized for temporary differences between the financial reporting basis of assets and liabilities and their respective income tax basis and for operating loss, capital loss and tax credit carryforwards based on enacted income tax rates

54
expected to be in effect when such amounts are realized or settled. However, deferred tax assets are recognized only to the extent that it is more likely than not they will be realized on consideration of available evidence, including future reversals of existing taxable temporary differences, future projected taxable income and tax planning strategies. There was $31,996 in taxable income from the TRS for the year ended December 31, 2016, and no taxable income at December 31, 2015 and 2014. We perform an annual review for any uncertain tax positions and, if necessary, will record future tax consequences of uncertain tax positions in the financial statements. An uncertain tax position is defined as a position taken or expected to be taken in a tax return that is not based on clear and unambiguous tax law and which is reflected in measuring current or deferred income tax assets and liabilities for interim or annual periods. At December 31, 2016, we did not identify any uncertain tax positions. When we acquire a property in a business combination, we evaluate such acquisition for any related deferred tax assets or liabilities and determine if a deferred tax asset or liability should be recorded in conjunction with the purchase price allocation. If a built-in gain is acquired, we evaluate the required holding period (generally 5-10 years) and determine if we have the ability and intent to hold the underlying assets for the necessary holding period. If we have the ability to hold the underlying assets for the required holding period, no deferred tax liability will be recorded with respect to the built-in gain. New or Revised Accounting Standards
For a summary of the new or revised accounting standards please refer to “Note 1 – Organization and Significant Accounting Policies” within the notes to the combined consolidated financial statements included in this Annual Report on Form 10-K. Results of Operations Comparison of the year ended December 31, 2016 to the year ended December 31, 2015
For the year ended December 31, ($ in thousands) 2016 2015 $ Change % Change OPERATING REVENUES:
Rental income $ 29,668 $ 13,548 $ 16,120 119.0 % Tenant reimbursements 263 135 128 94.8 % Other revenue 1,070 73 997 1,365.8 %
Total operating revenues 31,001 13,756 17,245 125.4 % OPERATING EXPENSES:
Depreciation and depletion 1,554 893 661 74.0 % Property operating expenses 2,379 1,104 1,275 115.5 % Acquisition and due diligence costs 2,521 260 2,261 869.6 % General and administrative expenses 7,023 4,192 2,831 67.5 % Legal and accounting 1,447 1,090 357 32.8 % Other operating expenses 445 — 445 NM
Total operating expenses 15,369 7,539 7,830 103.9 % OPERATING INCOME 15,632 6,217 9,415 151.4 % OTHER (INCOME) EXPENSE:
Other income (337) (98) (239) 243.9 % Interest expense 9,959 4,616 5,343 115.7 %
Total other expense 9,622 4,518 5,104 113.0 %
Net income before income tax expense 6,010 1,699 4,311 253.7 % Income tax expense 11 10 1 10.0 % NET INCOME $ 5,999 $ 1,689 $ 4,310 255.2 %
NM = Not Meaningful

55
Our rental income for 2016 was impacted by the 26 acquisitions that took place in 2015, primarily in the fourth quarter,
in addition to the 24 acquisitions that took place throughout 2016. To highlight the effect of changes due to acquisitions, we have separately discussed the rental income for the same-property portfolio, which includes only properties owned and operated for the entirety of both periods presented.
Total rental income under leases for the same-property portfolio increased to $9.1 million for the year ended December
31, 2016, from $8.9 million for the year ended December 31, 2015, as a result of average annual rent for the same-property portfolio increasing year over year to $209 per acre in 2016 from $203 in 2015.
Total rental income increased $16.1 million, or 119.0%, for the year ended December 31, 2016 as compared to the
prior year. This increase was the result of the 50 acquisitions completed over the last two years and payments received in connection with the the early termination of certain leases in December 2016. As part of the termination, the Company recognized $3.7 million due to cash received under the contract greater than rental income previously recognized and $2.8 million in early termination fees. For the year ended December 31, 2016, the average annual cash rent for the entire portfolio increased to $224 per acre from $215 per acre in 2015.
Leases in place in 2015 that provide for tenant payment of property taxes required the tenant to reimburse us for the
tax amount we paid in 2016 for the 2015 taxable year. Due to changes in terms of lease renewals and certain outstanding leases, tenant reimbursements increased $0.1 million, or 94.8%, in 2016, as compared to 2015.
Other revenue increased $1.0 million for the year ended December 31, 2016, as compared to the year ended December
31, 2015. The income recognized in 2016 consisted of $0.8 million realized on crop sales from our TRS’s farming operation, in addition to $0.2 million earned on interest and amortization of net loan fees, primarily from loans outstanding under the FPI Loan Program. The TRS was formed in March 2015 with the sales recognized in the first quarter of 2016 representing the first revenues generated by the entity. The FPI Loan Program was launched in August 2015 and has mortgage notes receivable totaling $2.8 million as of December 31, 2016.
Depreciation and depletion expense increased $0.7 million, or 74.0%, for the year ended December 31, 2016, as
compared to the year ended December 31, 2015. The increase is the result of acquiring or constructing $14 million in depreciable assets throughout 2016.
Property operating expenses increased $1.3 million or 115.5%, for the year ended December 31, 2016, as compared
to the year ended December 31, 2015, of which $0.8 million is attributable to an increase in property taxes and $0.2 million to an increase in property insurance primarily as a result of property acquisitions. The increase also included a $0.3 million increase in a variety of other property operating costs such as repairs and maintenance, state and franchise taxes and other miscellaneous items.
Acquisition and due diligence costs totaled $2.5 million for the year ended December 31, 2016 as compared to $0.3
million recognized in the year ended December 31, 2015. Acquisition and due diligence costs recognized in the year ended December 31, 2016 consisted of $2.4 million of costs related to the AFCO Mergers, with the remainder related to other acquisitions.
General and administrative expenses increased $2.8 million, or 67.5%, for the year ended December 31, 2016, as
compared to the year ended December 31, 2015. The increase in general and administrative expenses was primarily attributable to increased costs related to the continued growth of our portfolio. During the year ended December 31, 2016, employee compensation expenses increased $2.3 million, as compared with the same period in 2015, due to an increase in the number of employees from 12 at the end of 2015 to 15 at the end of 2016. Included in compensation costs is $0.1 million for the new employee benefits program, which was not in place as of December 31, 2015. During 2016, our public company costs increased $0.3 million due to increased investor relations, regulatory and compliance activity, and conference attendance. We also had a $0.2 million increase in travel and office rent expense in the year ended December 31, 2016 as compared to the prior year.

56
Legal and accounting expenses increased $0.4 million, or 32.8%, for the year ended December 31, 2016, as compared to 2015. Costs associated with general corporate matters and the growth of our portfolio, including costs related to the AFCO Mergers, contributed to the increase in legal and accounting expenses.
Other operating expenses totaled $0.4 million during the year ended December 31, 2016, compared to no other
operating expenses recognized in 2015, related to the cost of sales realized on crop sales from our TRS’s farming operations.
Other income, which is comprised primarily of income recognized on the sale of easements and rights-of-way,
increased by $0.2 million, or 243.9%, for the year ended December 31, 2016, as compared to 2015. Interest expense increased by $5.3 million or 115.7%, for the year ended December 31, 2016, as compared to the year
ended December 31, 2015. We recognized additional interest expense of approximately $2.4 million during 2016 related to interest and amortization of deferred loan fees associated with the $53.0 million Bridge Loan (as defined below under “Liquidity and Capital Resources”), as all costs related to the Bridge Loan were both incurred and amortized during 2016. The increase in interest expense is due, in large part, to interest on the Bridge Loan of $2.3 million, which we do not expect to continue as we do not expect to enter into similar short term financing arrangements in the future. Interest expense increased approximately $3.1 million as the result of an increase in our outstanding borrowings during 2016, which were $309.9 million as of December 31, 2016 and $187.2 million for the comparative period in 2015. These increases were partially offset by the amortization of deferred financing fees and discounts/premiums on debt which increased $0.1 million during 2016. Comparison of the year ended December 31, 2015 to the year ended December 31, 2014
For the Years Ended December 31, ($ in thousands) 2015 2014 $ Change % Change OPERATING REVENUES:
Rental income $ 13,548 $ 3,970 $ 9,578 241.3 % Tenant reimbursements 135 248 (113) (45.6)% Other revenue 73 — 73 NM
Total operating revenues 13,756 4,218 9,538 226.1 % OPERATING EXPENSES:
Depreciation and depletion 893 329 564 171.4 % Property operating expenses 1,104 249 855 343.4 % Acquisition and due diligence costs 260 193 67 34.7 % General and administrative expenses 4,192 2,275 1,917 84.3 % Legal and accounting 1,090 615 475 77.2 %
Total operating expenses 7,539 3,661 3,878 105.9 % OPERATING INCOME 6,217 557 5,660 1,016.2 % OTHER (INCOME) EXPENSE:
Other income (98) (144) 46 (31.9)% Interest expense 4,616 1,372 3,244 236.4 %
Total other expense 4,518 1,228 3,290 267.9 %
Net income before income tax expense 1,699 (671) 2,370 (353.2)% Income tax expense 10 — 10 NM NET INCOME (LOSS) $ 1,689 $ (671) $ 2,370 353.2 %
NM = Not Meaningful
Our rental income for 2015 was impacted by the 29 acquisitions that took place in 2014, primarily in the fourth quarter,
in addition to the 26 acquisitions that took place throughout 2015. To highlight the effect of changes due to acquisitions, we have separately discussed the rental income for the same-property portfolio, which includes only properties owned and operated for the entirety of both periods presented.

57
Total rental income increased $9.6 million, or 241.3%, for the year ended December 31, 2015 as compared to the prior year. This increase was primarily the result of the 55 acquisitions completed over the last two years. For the year ended December 31, 2015, the average annual cash rent for the entire portfolio increased to $209 per acre from $179 per acre in 2014. This increase was the result of diversification of our portfolio to new markets.
Cash rental income for the same-property portfolio remained consistent at $2.6 million for the year ended December
31, 2015, from $2.6 million for 2014, as a result of average annual rent for the same-property portfolio decreasing to $357 per acre in 2015 from $360 per acre in 2014. This decrease was primarily attributable to lower crop share rent in 2015.
Leases in place in 2014 that provide for tenant payment of property taxes required the tenant to reimburse us for the
tax amount we paid in 2015 for the 2014 taxable year. Due to changes in terms of lease renewals, as well as of certain outstanding leases, tenant reimbursements decreased $0.1 million, or 45.6%, in 2015, as compared to 2014.
Other revenues totaled $0.1 million during the year ended December 31, 2015, compared to no other revenues
recognized in 2014. The other revenues recognized during 2015 were generated on interest and amortization of net loan fees, primarily from the FPI Loan Program, launched in August 2015.
Depreciation and depletion expense increased $0.6 million, or 171.4%, for the year ended December 31, 2015, as
compared to the year ended December 31, 2014. The increase is the result of acquiring $7.5 million in depreciable assets in the last quarter of 2014, $7.0 million in depreciable assets throughout 2015 and investing $5.6 million in property improvements on acquired property during 2015.
Property operating expenses increased $0.9 million, or 343.4%, for the 2015 year, as compared to the prior year, of
which $0.2 million is attributable to properties acquired during 2015. The remaining increase in property operating expenses is primarily related to increases in property insurance of $0.1 million, property taxes of $0.2 million, state franchise taxes of $0.1 million, and repairs of $0.1 million. Also increasing during the year were travel costs related to property visits on newly acquired properties of $0.1 million and $0.1 million of expenses for legal costs related to tenant issues.
General and administrative expenses increased $1.9 million, or 84.3%, for the year ended December 31, 2015, as
compared to the year ended December 31, 2014. The increase in general and administrative expenses was largely the result of increased costs related to being a public company and our continued growth. We only incurred the costs of being a public company during the period following our IPO in 2014, while we incurred such costs for the entire year in 2015. During 2015, our public company costs increased $0.3 million due to increased investor relations, board, regulatory and compliance activity, stock-based compensation expense increased $0.2 million, conference attendance and travel expenses increased $0.3 million, consulting fees increased $0.2 million, and other corporate costs increased $0.02 million, due to increased rent and general office expenses related to increased headcount, as compared with the same period in 2014. Also contributing to the general and administrative increase during the year ended December 31, 2015 were employee compensation expenses, which increased $1.1 million as compared with the same period in 2014 as we did not have any employees prior to the IPO and have since increased our staffing to 13 employees and added a formal bonus program in the third quarter of 2014. These increases were offset by a decrease of $0.2 million in professional fees which were incurred during the year ended December 31, 2014, on behalf of the Company by Pittman Hough Farms prior to the completion of the IPO.
Legal and accounting expenses increased $0.5 million, or 77.2%, for the year ended December 31, 2015, as compared
to 2014, primarily as a result of being a public company for a full year with the Company going public in April 2014. Also contributing to the increase in legal and accounting expenses were general corporate matters and the growth of our portfolio.
Other income decreased by $0.05 million, or 31.9%, for the year ended December 31, 2015 compared to 2014. During
both periods other income was recognized on the sale of easements and right-of-way. Interest expense increased by $3.2 million or 236.4%, for the year ended December 31, 2015, as compared to the year
ended December 31, 2014, as a result of an increase in our average outstanding borrowings, which were $159.2 million

58
during the year December 31, 2015 and $44.4 million for 2014. Our weighted average cost of borrowings during the year ended December 31, 2015 and 2014 was 2.80% and 2.76%, respectively. We also recognized additional interest expense of $0.2 million and $0.1 million during the year ended December 31, 2015 and 2014, respectively, related to the amortization of deferred loan fees. These increases were partially offset by the amortization of a premium on our debt of $0.1 million during the year ended December 31, 2015.
Liquidity and Capital Resources
Overview
Liquidity is a measure of our ability to meet potential cash requirements, including ongoing commitments to repay
any outstanding borrowings, fund and maintain our assets and operations, make distributions to our stockholders and to OP unitholders, and other general business needs.
Our short-term liquidity requirements consist primarily of funds necessary to acquire additional farmland and make
other investments consistent with our investment strategy, make principal and interest payments on outstanding borrowings, make distributions necessary to qualify for taxation as a REIT and fund our operations. Our sources of funds primarily will be cash on hand, operating cash flows and borrowings from prospective lenders.
During 2017, $81.2 million of our borrowings will mature. Any cash that we use to satisfy our outstanding debt
obligations will reduce the amounts available to acquire additional farms, which could adversely affect our growth prospects. The Company has $45.0 million and $3.1 million in capacity available under the Rutledge and Farm Credit of Central Florida facilities. Within twelve months of this Annual Report, $81.2 million of our borrowings will mature. We anticipate refinancing the debt due to mature in 2017 with the same or similar financial institutions and we are currently in discussions with existing lenders to do so. However, we can provide no assurances that we will be able to refinance the debt on similar terms or at all and thus alternative sources of capital may be necessary. To date, no such capital sources have been identified. As of December 31, 2016, we had $309.9 million of debt, which may expose us to the risk of default under our debt obligations, restrict our operations and our ability to grow our business and revenues and restrict our ability to pay distributions to our stockholders. We plan to refinance these loans in 2017.
In connection with the AFCO Mergers, at the effective time of the Company Merger, each share of AFCO Common
Stock issued and outstanding immediately prior to the effective time of the Company Merger (other than any shares of AFCO Common Stock owned by any wholly owned subsidiary of AFCO or by us or the Operating Partnership or any wholly owned subsidiary of us or the Operating Partnership), automatically converted into the right to receive, subject to certain adjustments, 0.7417 shares of our common stock. In addition, in connection with the Company Merger, each outstanding AFCO restricted stock unit that had become fully earned and vested in accordance with its terms, at the effective time of the Company Merger, was converted into the right to receive 0.7417 shares of our common stock. At the effective time of the Partnership Merger, each common unit of limited partnership interest in AFCO OP issued and outstanding immediately prior to the effective time of the Partnership Merger, was converted automatically into the right to receive, subject to certain adjustments, 0.7417 OP units. We issued 14,763,604 shares of our common stock as consideration in the Company Merger and 17,373 shares of our common stock in respect of fully earned and vested AFCO restricted stock units. We issued 218,525 OP units in connection with the Partnership Merger.
In addition to utilizing current and any future available borrowings, we entered into equity distribution agreements on
September 15, 2015 in connection with the ATM Program, under which the Company has issued and sold from time to time, through the sales agents, shares of our common stock having an aggregate gross sales price of up to $25 million. Through December 31, 2016 the Company has generated $11.1 million in net cash proceeds under the ATM Program is intended to provide cost-effective financing alternatives in the capital markets and we intend to use the net proceeds from the ATM Program, if any, for future farmland acquisitions in accordance with our investment strategy and for general corporate purposes, which may also include originating loans to farmers under our loan program. We only intend to utilize the ATM Program if the market price of our common stock reaches levels which are deemed appropriate by our Board of Directors.

59
Our long-term liquidity needs consist primarily of funds necessary to acquire additional farmland, make other investments and certain long-term capital expenditures, make principal and interest payments on outstanding borrowings, and make distributions necessary to qualify for taxation as a REIT. We expect to meet our long-term liquidity requirements through various sources of capital, including future equity issuances (including issuances of OP units), net cash provided by operations, long-term mortgage indebtedness and other secured and unsecured borrowings.
Our ability to incur additional debt will depend on a number of factors, including our degree of leverage, the value of
our unencumbered assets, compliance with the covenants under our existing debt agreements, borrowing restrictions that may be imposed by lenders and the conditions of debt markets. Our ability to access the equity capital markets will depend on a number of factors as well, including general market conditions for REITs and market perceptions about our company. Consolidated Indebtedness First Midwest Bank Indebtedness
In connection with our initial public offering and the related formation transactions, on April 16, 2014, the Operating Partnership, as borrower, and First Midwest Bank, as lender, entered into the FMW Loan Agreement, which provided for loans in the initial aggregate principal amount of approximately $30,780,000. In April 2016 we fully repaid our debt under this loan. Farmer Mac Facility
We are party to the Amended and Restated Bond Purchase Agreement, dated as of March 1, 2015 and amended on June 2, 2015 and August 3, 2015 (the “Bond Purchase Agreement”) with Federal Agricultural Mortgage Corporation (“Farmer Mac”) and Farmer Mac Mortgage Securities Corporation, a wholly owned subsidiary of Farmer Mac, as bond purchaser (the “Purchaser”), regarding a secured bond purchase facility (the “Farmer Mac Facility”) that has a maximum borrowing capacity of $165 million. Pursuant to the Bond Purchase Agreement, the Operating Partnership may, from time to time, issue one or more bonds to the Purchaser that will be secured by pools of mortgage loans, which will, in turn, be secured by first liens on agricultural real estate owned by us. The mortgage loans may have effective loan-to-value ratios of up to 60%, after giving effect to the overcollateralization obligations described below. Prepayment of each bond issuance is not permitted unless otherwise agreed upon by all parties to the Bond Purchase Agreement.
The Operating Partnership’s ability to borrow under the Farmer Mac Facility is subject to our ongoing compliance
with a number of customary affirmative and negative covenants, as well as financial covenants, including: a maximum leverage ratio of not more than 60%; a minimum fixed charge coverage ratio of 1.5 to 1.00; and a minimum tangible net worth. On August 3, 2015, we amended the Bond Purchase Agreement in order to calculate the fixed charge coverage ratio using our Adjusted EBITDA (as defined in the Bond Purchase Agreement) rather than our EBITDA (as defined in the Bond Purchase Agreement). We were in compliance with all applicable covenants under the Farmer Mac Facility at December 31, 2016.
In connection with the Bond Purchase Agreement, on March 1, 2015, we and the Operating Partnership also entered
into a pledge and security agreement (as amended and restated, the “Pledge Agreement”) in favor of the Purchaser and Farmer Mac, pursuant to which we and the Operating Partnership agreed to pledge, as collateral for the Farmer Mac Facility, all of their respective right, title and interest in (i) mortgage loans with a value at least equal to 100% of the aggregate principal amount of the outstanding bond held by the Purchaser and (ii) such additional collateral as necessary to have total collateral with a value at least equal to 110% of the outstanding notes held by the Purchaser. In addition, we agreed to guarantee the full performance of the Operating Partnership’s duties and obligations under the Pledge Agreement.
The Bond Purchase Agreement and the Pledge Agreement include customary events of default, the occurrence of any
of which, after any applicable cure period, would permit the Purchaser and Farmer Mac to, among other things, accelerate payment of all amounts outstanding under the Farmer Mac Facility and to exercise its remedies with respect to the pledged collateral, including foreclosure and sale of the agricultural real estate underlying the pledged mortgage loans. As of December 31, 2016, we had $155.5 million outstanding under the Farmer Mac Facility.

60
Bridge Loan
On February 29, 2016, two wholly owned subsidiaries of the Operating Partnership (together, the “Bridge Borrower”) entered into a term loan agreement (the “Bridge Loan Agreement”) with MSD FPI Partners, LLC, an affiliate of MSD Partners, L.P. (the “Bridge Lender”), that provided for a loan of $53.0 million (the “Bridge Loan”), the proceeds of which were used primarily to fund the cash portion of the consideration for the acquisition of the Forsythe farms, which was completed on March 2, 2016. During the year ended December 31, 2016, the Company accrued and paid debt issuance costs on the Bridge Loan totaling $173,907 and interest totaling $2,271,867, of which $2,120,000, or 4.0%, of the Bridge Loan's principal amount was considered additional interest paid as discount on issuance. The Bridge Loan was paid in full, including accrued interest, and without prepayment penalty, on March 29, 2016 using proceeds from the MetLife Term Loans, as described below.
MetLife Term Loans
On March 29, 2016, five wholly owned subsidiaries of the Operating Partnership entered into the loan agreement (the “First MetLife Loan Agreement” and together with the Second MetLife Loan Agreement, the Fifth MetLife Loan Agreement and the Sixth MetLife Loan Agreement, the “MetLife Loan Agreements”), which provides a total of $127 million of term loans, comprised of (i) a $90 million term loan (“Term Loan 1”), (ii) a $16.0 million term loan (“Term Loan 2”) and (iii) a $21.0 million term loan (“Term Loan 3” and, together with Term Loan 1 and Term Loan 2, the “Initial MetLife Term Loans” and, together with Term Loan 4 (as defined in the subsequent paragraph), the “MetLife Term Loans). The proceeds of the MetLife Term Loans were used to repay existing debt (including amounts outstanding under the existing Bridge Loan agreement) to acquire additional properties and for general corporate purposes. Each initial Metlife Term Loan matures on March 29, 2026 and is secured by first lien mortgages on certain of our properties.
On June 29, 2016, five wholly owned subsidiaries of the Operating Partnership entered into a loan agreement (the
“Second MetLife Loan Agreement”) with Metropolitan Life Insurance Company (“MetLife”), which provides for a loan of approximately $15.7 million (the “Term Loan 4”) to the Company with a maturity date of June 29, 2026. Interest on Term Loan 4 is payable in cash semi-annually and accrues at a floating rate that will be adjusted quarterly to a rate per annum equal to the greater of (a) the three-month LIBOR plus an initial floating rate spread of 1.750%, which may be adjusted by MetLife on each of September 29, December 29, March 29 and June 29 of each year to an interest rate equal to the greater of (a) the three month LIBOR plus the floating rate spread or (b) 2.00% per annum. The Loan initially bears interest at a rate of 2.39% per annum until September 29, 2016. On September 29, 2016 the rate increased to 2.59% per annum. Proceeds from Term Loan 4 were used to acquire additional properties and for general corporate purposes.
Interest on Term Loan 1 is payable in cash semi-annually and accrues at a floating rate that will be adjusted quarterly to a rate per annum equal to the greater of (a) the three-month LIBOR plus an initial floating rate spread of 1.750%, which may be adjusted by MetLife on each of March 29, 2019, March 29, 2022 and March 29, 2025 to an interest rate consistent with interest rates quoted by MetLife for substantially similar loans secured by real estate substantially similar to the Company’s properties securing Term Loan 1 or (b) 2.000% per annum. Term Loan 1 bore interest at a rate of 2.40% per annum until September 29, 2016. On September 29, 2016 the rate increased to 2.59%. Subject to certain conditions, we may at any time during the term of Term Loan 1 elect to have all or any portion of the unpaid balance of Term Loan 1 bear interest at a fixed rate that is initially established by the lender in its sole discretion that may be adjusted from time to time to an interest rate consistent with interest rates quoted by MetLife for substantially similar loans secured by real estate substantially similar to the Company’s properties securing Term Loan 1. On any floating rate adjustment date, we may prepay any portion of Term Loan 1 that is not subject to a fixed rate without penalty.
Interest on Term Loan 2 and Term Loan 3 is payable in cash semi-annually and accrues at an initial rate of 2.66% per annum, which may be adjusted by MetLife on each of March 29, 2019, March 29, 2022 and March 29, 2025 to an interest rate consistent with interest rates quoted by MetLife for substantially similar loans secured by real estate substantially similar to our properties securing Term Loan 2 and Term Loan 3.
Subject to certain conditions, amounts outstanding under Term Loan 2 and Term Loan 3, as well as any amounts
outstanding under Term Loan 1 that are subject to a fixed interest rate, may be prepaid without penalty up to 20% of the

61
original principal amounts of such loans per year or in connection with any rate adjustments. Any other prepayments under the Term Loans generally are subject to a minimum prepayment premium of 1.00%.
In connection with the Initial MetLife Term Loans, on March 29, 2016, the Company and the Operating Partnership each entered into a separate guaranty (the “Initial MetLife Guaranties”) whereby the Company and the Operating Partnership jointly and severally agreed to unconditionally guarantee all of the borrowers’ obligations under the First MetLife Loan Agreement.
In connection with the Term Loan 4, on June 29, 2016, the Company and the Operating Partnership each entered into a separate guaranty (the “Term Loan 4 Guaranties”) whereby the Company and the Operating Partnership jointly and severally agreed to unconditionally guarantee all of the borrowers’ obligations under the Second MetLife Loan Agreement.
On January 12, 2017, five wholly owned subsidiaries of the Operating Partnership, entered into the Fifth MetLife Loan Agreement with MetLife which provides for Term Loan 5, a loan of approximately $8.4 million to the Company with a maturity date of January 12, 2027. Interest on Term Loan 5 is payable in cash semi-annually and accrues at a 3.26 % per annum fixed, this may be adjusted by MetLife on each of Janaury 12, 2020, January 12, 2023 and January 12, 2026 at the option of the Lender to a rate that is consistent with similar loans. Proceeds from Term Loan 5 were used to acquire additional properties and for general corporate purposes.
In connection with the Term Loan 5, on January 12, 2017, the Company and the Operating Partnership each entered
the Term Loan 5 Guaranties whereby the Company and the Operating Partnership jointly and severally agreed to unconditionally guarantee all of the borrowers’ obligations under the Fifth MetLife Loan Agreement.
On February 14, 2017, a wholly owned subsidiary of the Operating Partnership, entered into a loan agreement (the
“Sixth MetLife Loan Agreement”) with Metropolitan Life Insurance Company (“Metlife”) which provides for a loan of approximately $27.2 million to the Company with a maturity date of February 14, 2027 (“Term Loan 6”). Interest on Term Loan 6 is payable in cash semi-annually and accrues at a 3.21% per annum fixed rate, this may be adjusted by MetLife on each of February 14, 2020, February 14, 2023 and February 14, 2026 at the option of the Lender to a rate that is consistent with similar loans. Proceeds from Term Loan 6 were used to acquire additional properties.
In connection with the Term Loan 6, on February 14, 2017, the Company and the Operating Partnership each entered
into a separate guaranty (the “Term Loan 6 Guaranties”) whereby the Company and the Operating Partnership jointly and severally agreed to unconditionally guarantee all of the borrowers’ obligations under the Sixth MetLife Loan Agreement.
Each of the MetLife Loan Agreements contains a number of customary affirmative and negative covenants, including
the requirement to maintain loan to value ratio of no greater than 60%. The MetLife Guaranties also contain a number of customary affirmative and negative covenants.
Each of the MetLife Loan Agreements includes certain customary events of default, including a cross-default provision related to other outstanding indebtedness of the borrowers, the Company and the Operating Partnership, the occurrence of which, after any applicable cure period, would permit MetLife, among other things, to accelerate payment of all amounts outstanding under the MetLife Term Loans and to exercise its remedies with respect to the pledged collateral, including foreclosure and sale of the Company’s properties that secure the MetLife Term Loans. As of December 31, 2016 there was $142.7 million outstanding under the MetLife Term Loans and we were in compliance with all covenants under the MetLife Loan Agreements.
Farm Credit of Central Florida Mortgage Note
On August 31, 2016, a wholly owned subsidiary of the Operating Partnership entered into a loan agreement (the “Farm Credit Mortgage Note”) with Farm Credit of Central Florida (“Farm Credit”) which provides for a loan of approximately $8.2 million to the Company with a maturity date of September 1, 2023. As of December 31, 2016 approximately $5.1 million had been drawn down under the Farm Credit Mortgage Note. Interest on the Farm Credit Mortgage Note is payable in cash quarterly and accrues at a floating rate that will be adjusted monthly to a rate per annum equal to the one-month LIBOR plus 2.6875% provided that the interest rate shall be subject to adjustment on the first day of September

62
2016, and on the first day of each month thereafter. Proceeds from the Farm Credit Mortgage Note are to be used for the acquisition and development of additional farms.
The Farm Credit Mortgage Note contains a number of customary affirmative and negative covenants, as well as a
covenant requiring us to maintain a debt service coverage ratio of 1.25 to 1.00 beginning on December 31, 2019. As of December 31, 2016 there was $5.1 million outstanding under the Farm Credit Mortgage Note. As of December
31, 2016, we were in compliance with all covenants under the Farm Credit Mortgage Note Agreements.
Prudential Loans On December 21, 2016, a wholly owned subsidiary of the Operating Partnership entered into a loan agreement with
Prudential which provides for the Prudential Note, a loan of approximately $6.6 million to the Company with a maturity date of July 1, 2019. Interest on the Prudential Note is payable in cash semi-annually and accrues at a fixed rate of 3.20% per annum. Proceeds from the Prudential Note were used for the acquisition of additional land.
The Prudential loan requires the Company to maintain a loan to value no greater than 60%. The covenant commences
from the anniversary of the loan, being December 21, 2017. As of December 31, 2016 there was $6.6 million outstanding under the Prudential Note.
Rutledge Credit Facilities
As part of the AFCO Mergers, by virtue of AFCO OP becoming a subsidiary of the Company, the Company acquired the Existing Rutledge Loans, which are further described below:
1. Loan Agreement, dated as of December 5, 2013, with respect to a $25 million senior secured credit facility bearing interest at a rate of LIBOR plus 1.3%. The loan agreement requires AFCO OP to make quarterly interest payments on April 1, July 1, October 1 and January 1 of each calendar year. Additionally, the loan agreement requires AFCO OP to pay a quarterly non-usage fee equal to 0.25% of the committed loan amount minus the average outstanding principal balance of the loan amount over the prior three-month period.
2. Loan Agreement, dated as of January 14, 2015, with respect to a $25 million senior secured credit facility bearing interest at a rate of LIBOR plus 1.3%. The loan agreement requires AFCO OP to make quarterly interest payments on April 1, July 1, October 1 and January 1 of each calendar year. Additionally, the loan agreement requires AFCO OP to pay a quarterly non-usage fee equal to 0.25% of the committed loan amount minus the average outstanding principal balance of the loan amount over the prior three-month period.
3. Loan Agreement, dated as of August 18, 2015, with respect to a $25 million senior secured credit facility bearing interest at a rate of LIBOR plus 1.3%. The loan agreement requires AFCO OP to make quarterly interest payments on April 1, July 1, October 1 and January 1 of each calendar year. Additionally, the loan agreement requires AFCO OP to pay a quarterly non-usage fee equal to 0.25% of the committed loan amount minus the average outstanding principal balance of the loan amount over the prior three-month period.
4. Loan Agreement, dated as of December 22, 2015, with respect to a $15 million senior secured credit facility bearing interest at a rate of LIBOR plus 1.3%. The loan agreement requires AFCO OP to make quarterly interest payments on April 1, July 1, October 1 and January 1 of each calendar year. Additionally, the loan agreement requires AFCO OP to pay a quarterly non-usage fee equal to 0.25% of the committed loan amount minus the average outstanding principal balance over the loan amount of the prior three-month period.
On February 3, 2017, AFCO OP, in its capacity as a wholly owned subsidiary of the Company and the Operating Partnership, entered into the Rutledge Amendment and the Company and the Operating Partnership each entered into separate guarantees (the “Existing Rutledge Guarantees”) pursuant to which they unconditionally guarantee the obligations of AFCO OP under the Existing Rutledge Loan Agreements. Pursuant to the Rutledge Amendment, among other things, the maturity dates for each of the Existing Rutledge Loan Agreements were extended to January 1, 2022 and the Company and the Operating Partnership were required to execute the Existing Loan Guarantees.

63
In addition, on February 3, 2017, AFCO OP entered into the Fifth Rutledge Loan Agreement in respect to a senior secured credit facility in the aggregate amount of $30 million, with a maturity date of January 1, 2022 and an interest rate of LIBOR plus 1.3%. The Fifth Rutledge Loan Agreement requires AFCO OP to make quarterly interest payments. Additionally, the Fifth Rutledge Loan Agreement requires AFCO OP to pay a quarterly non-usage fee equal to 0.25% of the committed loan amount minus the average outstanding principal balance of the loan amount during the prior three-month period. On February 2, 2017 the Company and the Operating Partnership each entered into separate guarantees (the “Fifth Loan Guarantees” and together with the Existing Loan Guarantees, the “Guarantees”) whereby they are required to unconditionally guarantee AFCO OP’s obligations under the Fifth Rutledge Loan Agreement. Proceeds from Fifth Rutledge Loan will be used to acquire additional properties and for general corporate purposes.
As of the date of this Annual Report, there is an aggregate amount of $75 million outstanding under Rutledge Loan Agreements.
Sources and Uses of Cash
The following table summarizes our cash flows for the years ended December 31, 2016, 2015 and 2014:
For the year ended December 31, ($ in thousands) 2016 2015 2014 Net cash provided by operating activities $ 5,041 $ 7,695 $ 1,783 Net cash used in investing activities $ (137,396) $ (119,690) $ (126,296)Net cash provided by financing activities $ 156,007 $ 101,773 $ 158,231
Comparison of the year ended December 31, 2016 to the year ended December 31, 2015
As of December 31, 2016, we had $47.2 million of cash and cash equivalents compared to $23.5 million at December 31, 2015.
Cash Flows from Operating Activities
Net cash provided by operating activities decreased $2.7 million, primarily as a result of the following:
Receipt of $22.7 million in cash rents for the twelve months ended December 31, 2016, as compared to receiving $16.4 million in cash rents in the same period of 2015;
Increase of $0.9 million in employee compensation paid; An increase in cash paid for interest of $4.8 million for the twelve months ended December 31, 2016 as
compared to the same period of 2015; and An increase in working capital of $3.3 million.
Cash Flows from Investing Activities
Net cash used for investing activities increased $17.7 million primarily as a result of the following:
Completing 24 acquisitions in 2016 for aggregate cash consideration of $131.8 million, as compared to $109.3 million in aggregate cash consideration for 26 acquisitions in 2015;
Investment of $5.7 million for real estate improvements during the year ended December 31, 2016, as compared to $7.6 million in 2015 receipt of $0.05 million in principal from note receivable during the year ended December 31, 2016, as compared to $0 million in 2015; and
Funding of $2.8 million in notes receivable, which was offset by $0.02 million of net origination fees received for the twelve months ended December 31, 2015.

64
Cash Flows from Financing Activities
Net cash provided by financing activities increased $54.2 million primarily as a result of the following:
Borrowings from mortgage notes payable of $207.4 million during the twelve months ended December 31, 2016, as compared to borrowings of $82.5 million in the twelve months ended December 31, 2015;
Debt prepayments of $0 on the First Midwest bank debt during 2016, as compared to $3.1 million in 2015; Other contractual debt payments of $84.8 million made in 2016, compared to $6.1 million in contractual debt
payments made during 2015; Proceeds from an equity offering of $33.3 million during 2016, compared to total proceeds of $35.1 million
from an equity offering during 2015; Receipt of $11.1 million under the ATM Program as compared to no receipts under the ATM program in the
corresponding period ended December 31, 2015 Aggregate dividend and distribution payments of $9.5 million to common stockholders and OP unitholders
made in 2016, compared to aggregate dividends payments and net distributions to members of $5.9 million during 2015; and
Payments of $0.4 million in offering costs made during 2016, as compared to $0.8 million in payments during 2015;
Payments of $1.1 million in financing fees made during 2016, as compared to $0.2 million in payments during 2015; and
Receipt of $0.3 million of refund related to certain of our mortgage notes payable during 2015
Comparison of the year ended December 31, 2015 to the year ended December 31, 2014 As of December 31, 2015, we had $23.5 million of cash and cash equivalents compared to $33.7 million at December
31, 2014.
Cash Flows from Operating Activities
Net cash provided by operating activities increased $5.9 million, primarily as a result of the following:
Receipt of $16.4 million in cash rents for the twelve months ended December 31, 2015, as compared to receiving $5.3 million in cash rents in the same period of 2014;
Increase of $0.9 million in employee compensation paid; Increase of $0.6 million in property taxes; Additional operating costs of $0.7 million directly related to being a public company for a full year in 2015;
and An increase in cash paid for interest of $2.9 million due to an increase in average outstanding indebtedness
of approximately $115.5 million, year-to-year. Cash Flows from Investing Activities
Net cash used for investing activities decreased $6.6 million primarily as a result of the following:
Completing 26 acquisitions in 2015 for aggregate cash consideration of $109.3 million, as compared to $126.3 million in aggregate cash consideration for 29 acquisitions in 2014;
Investment of $7.6 million for real estate improvements during the year ended December 31, 2015, as compared to $0.05 million in 2014; and
Funding of $2.8 million in notes receivable, which was offset by $0.02 million of net origination fees received in 2015.
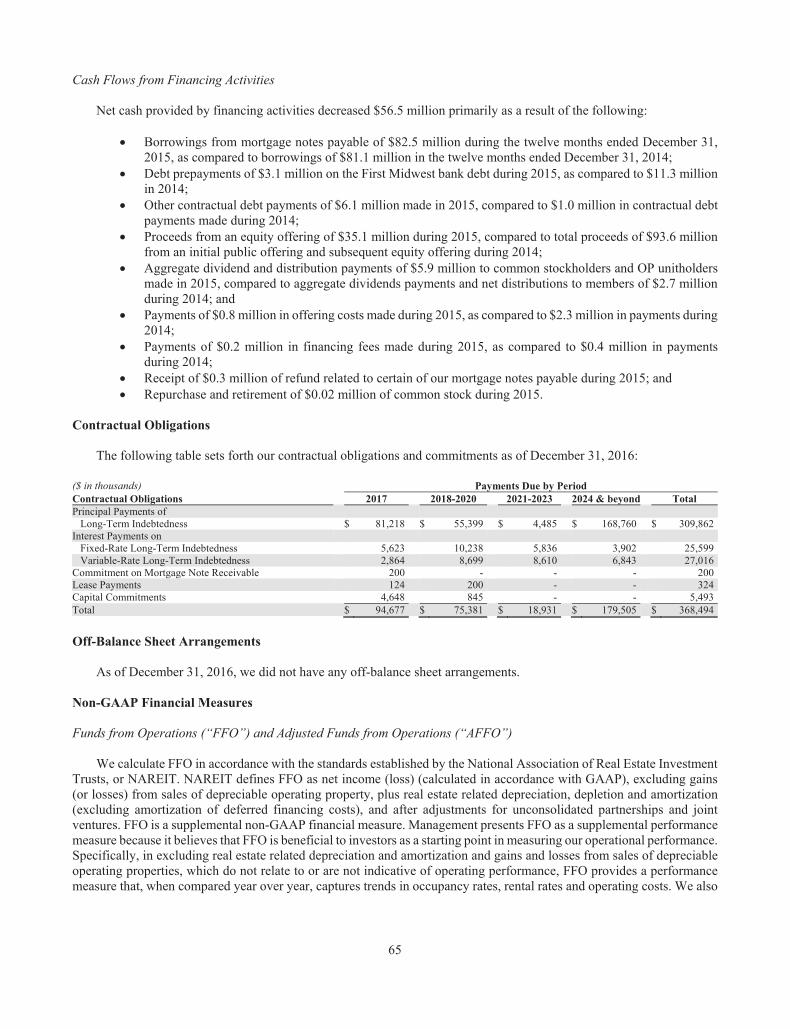
65
Cash Flows from Financing Activities
Net cash provided by financing activities decreased $56.5 million primarily as a result of the following:
Borrowings from mortgage notes payable of $82.5 million during the twelve months ended December 31, 2015, as compared to borrowings of $81.1 million in the twelve months ended December 31, 2014;
Debt prepayments of $3.1 million on the First Midwest bank debt during 2015, as compared to $11.3 million in 2014;
Other contractual debt payments of $6.1 million made in 2015, compared to $1.0 million in contractual debt payments made during 2014;
Proceeds from an equity offering of $35.1 million during 2015, compared to total proceeds of $93.6 million from an initial public offering and subsequent equity offering during 2014;
Aggregate dividend and distribution payments of $5.9 million to common stockholders and OP unitholders made in 2015, compared to aggregate dividends payments and net distributions to members of $2.7 million during 2014; and
Payments of $0.8 million in offering costs made during 2015, as compared to $2.3 million in payments during 2014;
Payments of $0.2 million in financing fees made during 2015, as compared to $0.4 million in payments during 2014;
Receipt of $0.3 million of refund related to certain of our mortgage notes payable during 2015; and Repurchase and retirement of $0.02 million of common stock during 2015.
Contractual Obligations
The following table sets forth our contractual obligations and commitments as of December 31, 2016:
($ in thousands) Payments Due by Period Contractual Obligations 2017 2018-2020 2021-2023 2024 & beyond Total Principal Payments of
Long-Term Indebtedness $ 81,218 $ 55,399 $ 4,485 $ 168,760 $ 309,862 Interest Payments on
Fixed-Rate Long-Term Indebtedness 5,623 10,238 5,836 3,902 25,599 Variable-Rate Long-Term Indebtedness 2,864 8,699 8,610 6,843 27,016
Commitment on Mortgage Note Receivable 200 - - - 200 Lease Payments 124 200 - - 324 Capital Commitments 4,648 845 - - 5,493 Total $ 94,677 $ 75,381 $ 18,931 $ 179,505 $ 368,494
Off-Balance Sheet Arrangements
As of December 31, 2016, we did not have any off-balance sheet arrangements. Non-GAAP Financial Measures Funds from Operations (“FFO”) and Adjusted Funds from Operations (“AFFO”)
We calculate FFO in accordance with the standards established by the National Association of Real Estate Investment Trusts, or NAREIT. NAREIT defines FFO as net income (loss) (calculated in accordance with GAAP), excluding gains (or losses) from sales of depreciable operating property, plus real estate related depreciation, depletion and amortization (excluding amortization of deferred financing costs), and after adjustments for unconsolidated partnerships and joint ventures. FFO is a supplemental non-GAAP financial measure. Management presents FFO as a supplemental performance measure because it believes that FFO is beneficial to investors as a starting point in measuring our operational performance. Specifically, in excluding real estate related depreciation and amortization and gains and losses from sales of depreciable operating properties, which do not relate to or are not indicative of operating performance, FFO provides a performance measure that, when compared year over year, captures trends in occupancy rates, rental rates and operating costs. We also

66
believe that, as a widely recognized measure of the performance of REITs, FFO will be used by investors as a basis to compare our operating performance with that of other REITs.
However, because FFO excludes depreciation and amortization and captures neither the changes in the value of our properties that result from use or market conditions nor the level of capital expenditures necessary to maintain the operating performance of improvements on our properties, all of which have real economic effects and could materially impact our results from operations, the utility of FFO as a measure of our performance is limited. In addition, other equity REITs may not calculate FFO in accordance with the NAREIT definition as we do, and, accordingly, our FFO may not be comparable to such other REITs’ FFO. Accordingly, FFO should be considered only as a supplement to net income as a measure of our performance. FFO should not be used as a measure of our liquidity, nor is it indicative of funds available to fund our cash needs, including our ability to pay dividends or service indebtedness. FFO also should not be used as a supplement to or substitute for cash flow from operating activities computed in accordance with GAAP.
We do not, however, believe that FFO is the only measure of the sustainability of our operating performance. Changes in GAAP accounting and reporting rules that were put in effect after the establishment of NAREIT’s definition of FFO in 1999 result in the inclusion of a number of items in FFO that do not correlate with the sustainability of our operating performance. Therefore, in addition to FFO, we present AFFO and AFFO per share, fully diluted, both of which are non-GAAP measures. Management considers AFFO a useful supplemental performance metric for investors as it is more indicative of the Company’s operational performance than FFO. AFFO is not intended to represent cash flow or liquidity for the period, and is only intended to provide an additional measure of our operating performance. Even AFFO, however, does not properly capture the timing of cash receipts, especially in connection with full-year rent payments under lease agreements entered into in connection with newly acquired farms. Management considers AFFO per share, fully diluted to be a supplemental metric to GAAP earnings per share. AFFO per share, fully diluted provides additional insight into how our operating performance could be allocated to potential shares outstanding at a specific point in time. Management believes that AFFO is a widely recognized measure of the operations of REITs, and presenting AFFO will enable investors to assess our performance in comparison to other REITs. However, other REITs may use different methodologies for calculating AFFO and AFFO per share, fully diluted and, accordingly, our AFFO and AFFO per share, fully diluted may not always be comparable to AFFO and AFFO per share amounts calculated by other REITs. AFFO and AFFO per share, fully diluted should not be considered as an alternative to net income (loss) or earnings per share (determined in accordance with GAAP) as an indication of financial performance, or as an alternative to net income (loss) earnings per share (determined in accordance with GAAP) as a measure of our liquidity, nor are they indicative of funds available to fund our cash needs, including our ability to make distributions.
AFFO is calculated by adjusting FFO to exclude or include the income and expenses that we believe are not reflective of the sustainability of our ongoing operating performance, as further explained below:
Real estate related acquisition and due diligence costs. Acquisition (including audit fees associated with these acquisitions) and due diligence costs are incurred for investment purposes and therefore, do not correlate with the ongoing operations of our portfolio. We believe that excluding these costs from AFFO provides useful supplemental information reflective of the realized economic impact of our leases, which is useful in assessing the sustainability of our operating performance. Acquisition and due diligence costs totaled $2.5 million, $0.3 million and $0.2 million for the years December 31, 2016, 2015 and 2014, respectively. Real estate related acquisition and due diligence costs for the year ended December 31, 2016 included $2.3 million in interest and loan fees associated with the short-term Bridge Loan and the Forsythe acquisition and as the interest and fees are a non-recurring item they have been excluded from the AFFO calculation. Included in the $2.3 million of interest and loan fees is only a portion of the interest, approximately $2.1 million, or 4% of the Bridge Loan's principal amount, which was considered additional interest paid as discount on issuance. A portion of the audit fees we incur are directly related to acquisitions, which varies with the number and complexity of the acquisitions we evaluate and complete in a given period. As such, these costs do not correlate with the ongoing operations of our portfolio. Total acquisition related audit fees excluded from AFFO totaled $0.3 million, $0.2 million and $0.2 million for the years ended December 31, 2016, 2015 and 2014, respectively. We believe that excluding these costs from AFFO provides useful supplemental information reflective of the realized economic impact of our current acquisition strategy, which is useful in assessing the sustainability of our operating performance. These

67
exclusions also improves comparability of our results over each reporting period and of our company with other real estate operators.
Stock based compensation. Stock based compensation is a non-cash expense and therefore, does not correlate
with the ongoing operations. We believe that excluding these costs from AFFO improves comparability of our results over each reporting period and of our company with other real estate operators.
Indirect offering costs. Indirect offering costs are fees for services incurred by the Company to grow and
maintain an active institutional investor presence. As we continue to acquire more farms, our ability to access capital through the equity markets will remain a critical component of our growth strategy. As of September 30, 2015, we began excluding indirect offering costs from AFFO as we believe it improves comparability of our results over each reporting period and of our company with other real estate operators. Prior to this date the company did not incur indirect offering costs.
Distributions on Preferred units. Dividends on Preferred units, which are convertible into OP units on or
after March 2, 2026, have a fixed and certain impact on our cash flow, thus they are subtracted from FFO. We believe this improves comparability of our company with other real estate operators.
Common shares fully diluted. In accordance with GAAP, common shares used to calculate earnings per
share are presented on a weighted average basis. Common shares on a fully diluted basis includes shares of common stock, OP units, redeemable OP units and unvested restricted stock outstanding at the end of the period on a share equivalent basis, because all shares are participating securities and thus share in the performance of the Company. The conversion of Preferred units is excluded from the calculation of common shares fully diluted as they are not participating securities, thus don’t share in the performance of the Company and their impact on shares outstanding is uncertain.
In prior periods, our calculation of AFFO also adjusted FFO to reflect the difference between the pro rata contractual
cash revenue for each crop year spread equally over the quarterly periods of ownership (without regard to the date of acquisition within the quarter) and the rent recognized on a straight-line basis in accordance with GAAP. In prior filings with the SEC, we referred to this adjustment as “crop-year revenue adjustment.” For the years ended December 31, 2015 and 2014, the crop-year revenue adjustment was $1.8 million and $0.6 million, respectively. In accordance with recently released interpretation from the SEC regarding the presentation of non-GAAP financial measures, we no longer include the crop-year revenue adjustment in our calculation of AFFO.

68
The following table sets forth a reconciliation of Net income (loss) to FFO, AFFO and net income available to common
stockholders per share to AFFO per share, fully diluted, the most directly comparable GAAP equivalents, respectively, for the periods indicated below (unaudited):
For the year ended December 31, ($ in thousands) 2016 2015 2014 Net income (loss) $ 5,999 $ 1,689 $ (671)Depreciation and depletion 1,554 893 329
FFO 7,553 2,582 (342) Stock based compensation 1,224 942 681 Indirect equity offering costs 88 34 — Real estate related acquisition and due diligence costs 5,061 494 378 Distributions on preferred units (2,915) — —
AFFO $ 11,011 $ 4,052 $ 717 AFFO per diluted weighted average share data: AFFO weighted average common shares 19,107 13,060 5,797 Net income (loss) available to common stockholders $ 0.09 $ 0.08 (0.15)Income available to redeemable non-controlling interest and non-controlling interest in operating partnership 0.24 0.05 0.03 Depreciation and depletion 0.08 0.07 0.06 Stock based compensation 0.06 0.07 0.12 Indirect equity offering costs — — — Real estate related acquisition and due diligence costs 0.26 0.04 0.06 Distributions on preferred units (0.15) — —
AFFO per diluted weighted average share $ 0.58 $ 0.31 0.12
The following table sets forth a reconciliation of AFFO share information to basic weighted average common shares
outstanding, the most directly comparable GAAP equivalent, for the periods indicated below (unaudited):
For the year ended December 31, ($ in thousands) 2016 2015 2014 Basic weighted average shares outstanding 13,204 9,619 4,265 Weighted average OP units on an as if converted basis 5,362 2,763 1,380 Weighted average unvested restricted stock 188 165 152 Weighted average redeemable non-controlling interest 353 513 —
AFFO weighted average common shares 19,107 13,060 5,797
As of December 31, 2016 and 2015 we had 23,043,318 and 16,155,971 shares of common stock and OP units
outstanding on a fully diluted basis, respectively. EBITDA and Adjusted EBITDA
Earnings before interest, taxes, depreciation and amortization (“EBITDA”) is a key financial measure used to evaluate
our operating performance but should not be construed as an alternative to operating income, cash flows from operating activities or net income, in each case as determined in accordance with GAAP. EBITDA is not a measure defined in accordance with GAAP. We believe that EBITDA is a standard performance measure commonly reported and widely used by analysts and investors in our industry. However, while EBITDA is a performance measure widely used across several industries, we do not believe that it correctly captures our business operating performance because it includes non-cash expenses and recurring adjustments that are necessary to better understand our business operating performance. Therefore, in addition to EBITDA, our management uses adjusted EBITDA (“Adjusted EBITDA”), a non-GAAP measure.
We further adjust EBITDA for certain additional items such as stock based compensation, indirect offering costs, real
estate acquisition related audit fees and real estate related acquisition and due diligence costs (for a full discussion of these adjustments see AFFO adjustments discussed above) that we consider necessary to understand our operating performance. As of September 30, 2015, we began excluding indirect offering costs from EBITDA as we believe it improves

69
comparability of our results over each reporting period and of our company with other real estate operators. Prior to this date the Company had not incurred any indirect offering costs. We believe that Adjusted EBITDA provides useful supplemental information to investors regarding our ongoing operating performance that, when considered with net income and EBITDA, is beneficial to an investor’s understanding of our operating performance.
EBITDA and Adjusted EBITDA have limitations as analytical tools, and you should not consider them in isolation,
or as a substitute for analysis of our results as reported under GAAP. Some of these limitations are:
EBITDA and Adjusted EBITDA do not reflect our cash expenditures, or future requirements, for capital expenditures or contractual commitments;
EBITDA and Adjusted EBITDA do not reflect changes in, or cash requirements for, our working capital needs;
EBITDA and Adjusted EBITDA do not reflect the interest expense, or the cash requirements necessary to service interest or principal payments, on our debt;
Although depreciation and amortization are non-cash charges, the assets being depreciated and amortized will often have to be replaced in the future, and EBITDA and Adjusted EBITDA do not reflect any cash requirements for these replacements; and
Other companies in our industry may calculate EBITDA and Adjusted EBITDA differently than we do, limiting the usefulness as a comparative measure.
Because of these limitations, EBITDA and Adjusted EBITDA should not be considered as a measure of discretionary
cash available to us to invest in the growth of our business. We compensate for these limitations by relying primarily on our GAAP results of operations and using EBITDA and Adjusted EBITDA only as a supplemental measure of our performance.
The following table sets forth a reconciliation of our net income (loss) to our EBITDA and Adjusted EBITDA for the periods indicated below (unaudited):
For the year ended December 31, ($ in thousands) 2016 2015 2014 Net income (loss) $ 5,999 $ 1,689 $ (671)Interest expense 9,959 4,616 1,372 Income tax expense 11 10 — Depreciation and depletion 1,554 893 329
EBITDA $ 17,523 $ 7,208 $ 1,030 Stock based compensation 1,224 942 681 Indirect equity offering costs 88 34 — Real estate related acquisition and due diligence costs 2,789 494 378
Adjusted EBITDA $ 21,624 $ 8,678 $ 2,089
Inflation
All of the leases for the farmland in our portfolio have one- to five-year terms, with the exception of two that have ten-year terms, pursuant to which each tenant is responsible for substantially all of the operating expenses related to the property, including taxes, maintenance, water usage and insurance. As a result, we believe that the effect on us of inflationary increases in operating expenses may be offset in part by the operating expenses that are passed through to our tenants and by contractual rent increases because our leases will be renegotiated every one to five years. We do not believe that inflation has had a material impact on our historical financial position or results of operations. Seasonality
Because the leases for a many of the properties in our portfolio require significant payments in advance of the spring planting season, we receive a significant portion of our cash rental payments in the first calendar quarter of each year, although we recognize rental revenue from these leases on a pro rata basis over the non-cancellable term of the lease in accordance with GAAP.

70
Item 7A. Quantitative and Qualitative Disclosures About Market Risk
Market risk includes risks that arise from changes in interest rates, foreign currency exchange rates, commodity prices, equity prices and other market changes that affect market-sensitive instruments. In pursuing our business strategies, the primary market risk to which we are exposed is interest rate risk. Our primary interest rate exposure will be the daily LIBOR. We may use fixed interest rate financing to manage our exposure to fluctuations in interest rates. On a limited basis, we also may use derivative financial instruments to manage interest rate risk. We will not use such derivatives for trading or other speculative purposes.
At December 31, 2016, $110.8 million, or 36%, of our debt had variable interest rates. Assuming no increase in the level of our variable rate debt, if interest rates increased by 1.0%, or 100 basis points, our cash flow would decrease by approximately $1.1 million per year. At December 31, 2016, LIBOR was approximately 62 basis points. Assuming no increase in the level of our variable rate debt, if LIBOR were reduced to 0 basis points, our cash flow would increase approximately $0.7 million per year. Item 8. Financial Statements and Supplementary Data
Our consolidated financial statements and supplementary data are included as a separate section of this Annual Report on Form 10-K commencing on page F-1 and are incorporated herein by reference. Item 9. Changes and Disagreements with Accountants on Accounting and Financial Disclosure
None. Item 9A. Controls and Procedures Evaluation of Disclosure Controls and Procedures
We have established disclosure controls and procedures as defined in Rule 13a-15(e) and 15d-15(e) under the Exchange Act, that are designed to ensure that information required to be disclosed by us in the reports that we file or submit under the Exchange Act is recorded, processed, summarized and reported, within the time periods specified in the SEC’s rules and forms, and is accumulated and communicated to management, including our Chief Executive Officer and Chief Financial Officer, as appropriate, to allow for timely decisions regarding disclosure. In designing and evaluating the disclosure controls and procedures, management recognizes that any controls and procedures, no matter how well designed and operated, can provide only reasonable assurance of achieving the desired control objectives, and management is required to apply its judgment in evaluating the cost-benefit relationship of possible controls and procedures. Accordingly, even effective disclosure controls and procedures can only provide reasonable assurance of achieving their control objectives.
We have evaluated, under the supervision and with the participation of management, including our Chief Executive Officer and Chief Financial Officer, the effectiveness of our disclosure controls and procedures. Based upon this evaluation, our Chief Executive Officer and Chief Financial Officer concluded that our disclosure controls and procedures were effective at a reasonable level of assurance as of the end of the period covered by this report. Limitations on the Effectiveness of Controls
Because of its inherent limitations, internal control over financial reporting may not prevent or detect misstatements. Also, projections of any evaluation of effectiveness to future periods are subject to the risk that controls may become inadequate because of changes in conditions or that the degree of compliance with the policies or procedures may deteriorate.

71
Management’s Annual Report on Internal Controls over Financial Reporting
The Company’s management is responsible for establishing and maintaining adequate internal control over financial reporting, as such term is defined in Rules 13a-15(f) and 15d-15(f) of the Exchange Act. Under the supervision and with the participation of our management, including our Chief Executive Officer and Chief Financial Officer, we conducted an evaluation of the effectiveness of our internal control over financial reporting as of December 31, 2016 based on the 2013 framework in Internal Control-Integrated Framework issued by the Committee of Sponsoring Organizations of the Treadway Commission (COSO). Based on that evaluation, the Company’s management concluded that our internal control over financial reporting was effective as of December 31, 2016.
Attestation Report of Independent Registered Public Accounting Firm
Not applicable.
Changes in Internal Controls over Financial Reporting There were no changes in the Company’s internal control over financial reporting during the quarter ended December
31, 2016 that have materially affected, or are reasonably likely to materially affect, the Company’s internal control over financial reporting.
Item 9B. Other Information
None.
PART III
Item 10. Directors, Executive Officers and Corporate Governance
This information is incorporated by reference from the Company’s Proxy Statement with respect to the 2017 Annual Meeting of Stockholders to be filed with the SEC no later than April 28, 2017.
Item 11. Executive Compensation
This information is incorporated by reference from the Company’s Proxy Statement with respect to the 2017 Annual Meeting of Stockholders to be filed with the SEC no later than April 28, 2017. Item 12. Security Ownership of Certain Beneficial Owners and Management and Related Stockholder Matters
This information is incorporated by reference from the Company’s Proxy Statement with respect to the 2017 Annual Meeting of Stockholders to be filed with the SEC no later than April 28, 2017. Item 13. Certain Relationships and Related Transactions, and Director Independence
This information is incorporated by reference from the Company’s Proxy Statement with respect to the 2017 Annual Meeting of Stockholders to be filed with the SEC no later than April 28, 2017. Item 14. Principal Accountant Fees and Services
This information is incorporated by reference from the Company’s Proxy Statement with respect to the 2017 Annual Meeting of Stockholders to be filed with the SEC no later than April 28, 2017.

72
PART IV Item 15. Exhibits and Financial Statement Schedules
The following is a list of documents filed as a part of this report: (1) Financial Statements
Included herein at pages F-1 through F-40. (2) Financial Statement Schedules
The following financial statement schedule is included herein at pages F-39 through F-44: Schedule III—Combined Real Estate and Accumulated Depreciation All other schedules for which provision is made in Regulation S-X are either not required to be included herein under
the related instructions, are inapplicable or the related information is included in the footnotes to the applicable financial statement and, therefore, have been omitted.
(3) Exhibits
The exhibits required to be filed by Item 601 of Regulation S-K are listed in the Exhibit Index on pages 82, 83 and
84 of this report, which is incorporated by reference herein. Item 16. Form 10-K Summary The Company has elected to not include a summary.

73
Exhibit Index
Exhibit No. Description of Exhibit
2.1
Agreement and Plan of Merger, dated as of September 12, 2016, by and among Farmland Partners Inc. Farmland Partners Operating Partnership, LP, Farmland Partners OP GP LLC, FPI Heartland LLC, FPI Heartland Operating Partnership, LP, FPI Heartland GP LLC, American Farmland Company and American Farmland Company L.P. (Incorporated by reference to Exhibit 2.1 to the Company’s Current Report on Form 8-K, filed on September 12, 2016)
3.1
Articles of Amendment and Restatement. (Incorporated by reference to Exhibit 3.1 to the Company’s Registration Statement on Form S-11/A, filed on March 24, 2014)
3.2 Amended and Restated Bylaws. (Incorporated by reference to Exhibit 3.2 to the Company’s Registration Statement on Form S-11/A, filed on March 24, 2014)
4.1 Form of common stock certificate (Incorporated by reference to Exhibit 4.1 to the Company’s Registration Statement on Form S-11/A, filed on March 11, 2014)
10.1
Second Amended and Restated Agreement of Limited Partnership of Farmland Partners Operating Partnership, LP, dated April 16, 2014. (Incorporated by reference to Exhibit 10.1 to the Company’s Current Report on Form 8-K, filed on April 16, 2014)
10.2†
Farmland Partners Inc. Amended and Restated 2014 Equity Incentive Plan. (Incorporated by reference to Exhibit 10.2 to the Company’s Registration Statement on Form S-8, filed on May 5, 2015)
10.3†
Form of Restricted Stock Award Agreement. (Incorporated by reference to Exhibit 10.3 to the Company’s Registration Statement on Form S-11/A, filed on March 11, 2014)
10.4† Form of Restricted Stock Award Agreement for Directors. (Incorporated by reference to Exhibit 10.4 to the Company’s Registration Statement on Form S-11/A, filed on March 11, 2014)
10.5† Employment Agreement, dated April 16, 2014, by and among Farmland Partners Inc., Farmland PartnersOperating Partnership, LP and Paul A. Pittman. (Incorporated by reference to Exhibit 10.2 to theCompany’s Current Report on Form 8-K, filed on April 16, 2014)
10.6† Employment Agreement, dated April 16, 2014, by and among Farmland Partners Inc., Farmland PartnersOperating Partnership, LP and Luca Fabbri. (Incorporated by reference to Exhibit 10.3 to the Company’sCurrent Report on Form 8-K, filed on April 16, 2014)
10.7† Consulting Agreement, dated April 16, 2014, by and between Farmland Partners Inc. and Jesse J. Hough.(Incorporated by reference to Exhibit 10.4 to the Company’s Current Report on Form 8-K, filed on April 16, 2014)
10.8 Shared Services Agreement, dated April 16, 2014, by and among Farmland Partners Inc., FarmlandPartners Operating Partnership, LP and American Agriculture Corporation. (Incorporated by reference to Exhibit 10.5 to the Company’s Current Report on Form 8-K, filed on April 16, 2014)
10.9*
Indemnification Agreement by and between Farmland Partners Inc. and each of its directors and officerslisted on Schedule A thereto.
10.10 Tax Protection Agreement, dated April 16, 2014, by and among Farmland Partners Inc., FarmlandPartners Operating Partnership, LP, and Pittman Hough Farms LLC. (Incorporated by reference toExhibit 10.7 to the Company’s Current Report on Form 8-K, filed on April 16, 2014)
10.11 Representation, Warranty and Indemnity Agreement by and among Farmland Partners Inc., FarmlandPartners Operating Partnership, LP, Paul A. Pittman and Jesse J. Hough. (Incorporated by reference toExhibit 10.12 to the Company’s Registration Statement on Form S-11/A, filed on March 24, 2014)
10.12 Merger Agreement by and among Farmland Partners Inc., Farmland Partners Operating Partnership, LP,Pittman Hough Farms LLC and FP Land LLC. (Incorporated by reference to Exhibit 10.13 to the Company’s Registration Statement on Form S-11/A, filed on March 24, 2014)
10.13 Right of First Offer Agreement by and between Farmland Partners Operating Partnership, LP and PittmanHough Farms LLC. (Incorporated by reference to Exhibit 10.14 to the Company’s Registration Statementon Form S-11/A, filed on March 24, 2014)
10.14 Right of First Offer Agreement by and between Farmland Partners Operating Partnership, LP and PaulA. Pittman. (Incorporated by reference to Exhibit 10.15 to the Company’s Registration Statement onForm S-11/A, filed on March 24, 2014)

74
10.15 Form of Lease Agreement by and between Farmland Partners Inc. and Astoria Farms / Hough Farms.(Incorporated by reference to Exhibit 10.16 to the Company’s Registration Statement on Form S-11/A, filed on March 24, 2014)
10.16 Registration Rights Agreement, dated April 16, 2014, by and between Farmland Partners Inc. and PittmanHough Farms LLC. (Incorporated by reference to Exhibit 10.8 to the Company’s Current Report on Form8-K, filed on April 16, 2014)
10.17 Amended and Restated Business Loan Agreement, dated April 16, 2014, by and between FarmlandPartners Operating Partnership, LP and First Midwest Bank. (Incorporated by reference to Exhibit 10.9to the Company’s Current Report on Form 8-K, filed on April 16, 2014)
10.18 Contract to Buy and Sell Real Estate, dated April 16, 2014, by and between Farmland Partners Inc. and Darren Erker and Jessica Erker. (Incorporated by reference to Exhibit 10.18 to the Company’sRegistration Statement on Form S-11/A filed on July 22, 2014)
10.19
Contract Amendment Agreement, dated May 7, 2014, by and between Farmland Partners Inc. and Darren Erker and Jessica Erker. (Incorporated by reference to Exhibit 10.19 to the Company’s RegistrationStatement on Form S-11/A filed on July 22, 2014)
10.20 Stock Purchase Agreement, dated May 29, 2014, by and between Farmland Partners, Inc. and BenedictHudye and Gregory Hudye. (Incorporated by reference to Exhibit 10.20 to the Company’s RegistrationStatement on Form S-11/A filed on July 22, 2014)
10.21 Amendment to Stock Purchase Agreement, dated June 11, 2014, by and between Farmland Partners, Inc.and Benedict Hudye and Gregory Hudye. (Incorporated by reference to Exhibit 10.21 to the Company’sRegistration Statement on Form S-11/A filed on July 22, 2014)
10.22 Bond Purchase Agreement, dated as of August 22, 2014, by and among Farmland Partners Inc., FarmlandPartners Operating Partnership, LP, Farmer Mac Mortgage Securities Corporation and Federal Agricultural Mortgage Corporation. (Incorporated by Reference to Exhibit 10.1 to the Company’sCurrent Report on Form 8-K filed on August 28, 2014)
10.23 Amended and Restated Pledge and Security Agreement, dated as of March 1, 2015, by and amongFarmland Partners Inc., Farmland Partners Operating Partnership, LP, Farmer Mac Mortgage SecuritiesCorporation and Federal Agricultural Mortgage Corporation. (Incorporated by Reference to Exhibit 10.2to the Company’s Current Report on Form 8-K filed on June 5, 2015)
10.24 Amended and Restated Bond Purchase Agreement, dated as of March 1, 2015, by and among FarmlandPartners Inc., Farmland Partners Operating Partnership, LP, Farmer Mac Mortgage SecuritiesCorporation and Federal Agricultural Mortgage Corporation. (Incorporated by Reference to Exhibit 10.1to the Company’s Current Report on Form 8-K filed on June 5, 2015)
10.25 Amendment No. 1 to the Amended and Restated Bond Purchase Agreement, dated as of June 2, 2015,by and among Farmland Partners Inc., Farmland Partners Operating Partnership, LP, Farmer MacMortgage Securities Corporation and Federal Agricultural Mortgage Corporation. (Incorporated byReference to Exhibit 10.3 to the Company’s Current Report on Form 8-K filed on June 5, 2015)
10.26* Amendment No. 2 to the Amended and Restated Bond Purchase Agreement, dated as of August 3, 2015.10.27 Real Estate Purchase Agreement by and among James C. Justice Companies, Inc., Ten Mile Bay, LLC
and FPI Colorado LLC, a wholly owned subsidiary of the Operating Partnership, dated as of November13, 2014. (Incorporated by reference to Exhibit 10.26 to the Company’s 2014 Annual Report on form10-K filed on March 3, 2015)
10.28 Amendment to Real Estate Purchase Agreement by and among James C. Justice Companies, Inc., Ten Mile Bay, LLC and FPI Colorado LLC, a wholly owned subsidiary of the Operating Partnership, datedas of December 18, 2014. (Incorporated by reference to Exhibit 10.27 to the Company’s 2014 AnnualReport on form 10-K filed on March 3, 2015)
10.29 Real Estate Purchase Agreement by and among Vendome Farming Corp and FPI Colorado LLC, a whollyowned subsidiary of the Operating Partnership, dated as of September 19, 2014. (Incorporated byreference to Exhibit 10.28 to the Company’s 2014 Annual Report on form 10-K filed on March 3, 2015)
10.30 First Amendment, dated February 24, 2015, to the Amended and Restated Business Loan Agreement,dated April 16, 2014, by and between Farmland Partners Operating Partnership, LP and First MidwestBank. (Incorporated by reference to Exhibit 10.1 to the Company’s Current Report on Form 8-K filed on March 2, 2015)
10.31 Real Estate Purchase Agreement, dated March 23, 2015, by and among Farmland Partners Inc., FarmlandPartners Operating Partnership, LP and a subsidiary thereto, James C. Justice Companies, Inc., JusticeFarms of North Carolina, LLC and Alabama Carbon LLC. (Incorporated by reference to Exhibit 10.2 tothe Company’s Quarterly Report on Form 10-Q filed on May 8, 2015)
75
10.32 First Amendment to Real Estate Purchase Agreement, dated April 24, 2015, by and among FarmlandPartners Inc., Farmland Partners Operating Partnership, LP and a subsidiary thereto, James C. JusticeCompanies, Inc., Justice Farms of North Carolina, LLC, Alabama Carbon LLC and James C. Justice III. (Incorporated by reference to Exhibit 10.3 to the Company’s Quarterly Report on Form 10-Q filed on May 8, 2015)
10.33†
First Amendment, dated April 16, 2015, to the Consulting Agreement, dated April 16, 2014, by andbetween Farmland Partners Inc. and Jesse J. Hough. (Incorporated by reference to Exhibit 10.4 to theCompany’s Quarterly Report on Form 10-Q filed on May 8, 2015)
10.34 Second Amendment, dated June 30, 2015, to the Consulting Agreement dated April 16, 2014, by andbetween Farmland Partners Inc. and Jesse J. Hough. (Incorporated by reference to Exhibit 10.5 to theCompany’s Quarterly Report on Form 10-Q filed on August 11, 2015)
10.35 Contribution Agreement, dated as of November 9, 2015, by and among Farmland Partners Inc., Farmland Partners Operating Partnership, LP, FPI Illinois I LLC, and FPI Illinois II, LLC and Forsythe FamilyFarms, Inc., Gerald R. Forsythe, Forsythe-Fournier Farms, LLC, Forsythe-Fawcett Farms, LLC, Forsythe-Bernadette Farms, LLC, Forsythe Land Company, Forsythe Family Farms, L.P., ForsytheFamily Farms II, L.P., and Forsythe-Breslow Farms, LLC. (Incorporated by reference to Exhibit 10.1 tothe Company’s Current Report on Form 8-K filed on November 11, 2015)
10.36 Amendment No.1 to the Second Amended and Restated Agreement of Limited Partnership of FarmlandPartners Operating Partnership, LP (Incorporated by reference to Exhibit 10.1 to the Company’s CurrentReport on Form 8-K filed on March 3, 2016)
10.37 Security Holder’s Agreement, dated as of March 2, 2016, by and among Forsythe Family Farms, Inc., Gerald R. Forsythe, Forsythe-Fournier Farms, LLC, Forsythe-Fawcett Farms, LLC, Forsythe-Bernadette Farms, LLC, Forsythe Land Company, Forsythe Family Farms, L.P., Forsythe Family Farms II, L.P., and Forsythe-Breslow Farms, LLC and Farmland Partners Inc. (Incorporated by reference to Exhibit 10.2 tothe Company’s Current Report on Form 8-K filed on March 3, 2016)
10.38 Amendment No. 1 to the Contribution Agreement, dated February 22, 2016, by and among Farmland Partners Inc., Farmland Partners Operating Partnership, LP, FPI Illinois I LLC, and FPI Illinois II, LLCand Forsythe Family Farms, Inc., Gerald R. Forsythe, Forsythe-Fournier Farms, LLC, Forsythe-Fawcett Farms, LLC, Forsythe-Bernadette Farms, LLC, Forsythe Land Company, Forsythe Family Farms, L.P.,Forsythe Family Farms II, L.P., and Forsythe-Breslow Farms, LLC. (Incorporated by reference to Exhibit10.3 to the Company’s Quarterly Report on Form 10-Q filed on May 10, 2016)
10.39 Term Loan Agreement, dated as of February 29, 2016, between FPI Illinois I LLC, FPI Illinois II LLC,and MSD FPI Partners, LLC (Incorporated by reference to Exhibit 10.4 to the Company’s QuarterlyReport on Form 10-Q filed on May 10, 2016)
10.40 Guaranty, dated as of February 29, 2016, by Farmland Partners Inc. and Farmland Partners OperatingPartnership LP in favor of MSD FPI Partners, LLC. (Incorporated by reference to Exhibit 10.5 to theCompany’s Quarterly Report on Form 10-Q filed on May 10, 2016)
10.41 Third Amendment to the Amended and Restated Business Loan Agreement, dated March 6, 2016,, byand between Farmland Partners Operating Partnership, LP and First Midwest Bank. (Incorporated byreference to Exhibit 10.6 to the Company’s Quarterly Report on Form 10-Q filed on May 10, 2016)
10.42 Loan Agreement, dated as of March 29, 2016, between FPI Illinois I LLC, FPI Illinois II LLC,Cottonwood Valley Land LLC, PH Farms LLC and FPI Properties LLC and Metropolitan Life InsuranceCompany. (Incorporated by reference to Exhibit 10.7 to the Company’s Quarterly Report on Form 10-Q filed on May 10, 2016)
10.43 Guaranty, dated as of March 29, 2016, by Farmland Partners Operating Partnership, LP in favor ofMetropolitan Life Insurance Company. (Incorporated by reference to Exhibit 10.8 to the Company’sQuarterly Report on Form 10-Q filed on May 10, 2016)
10.44 Employment Agreement, dated as of November 15, 2016, by and among Farmland Partners Inc.,Farmland Partners Operating Partnership, LP and Robert L. Cowan. (Incorporated by reference to Exhibit10.1 to the Company’s Current Report on Form 8-K filed on November 18, 2016)
10.45 Registration Rights Agreement, dated as of February 2, 2017, by and between Farmland Partneres Inc.and each of the holders named therein. (Incorporated by reference to Exhibit 10.1 to the Company’sCurrent Report on Form 8-K filed on February 3, 2017)
10.46 Amended and Restated Sub-Advisory Agreement, by and among American Farmland Company,American Farmland Company L.P., American Farmland Advisor LLC and Prudential Mortgage CapitalCompany, LLC. (Incorporated by reference to Exhibit 10.7 to American Farmland Company’sRegistration Statement on Form S-11 (File No. 333-205260) filed on June 26, 2015)

76
10.47 Loan Agreement, dated as of December 5, 2013, by and between American Farmland Company L.P. andRutledge Investment Company. (Incorporated by reference to Exhibit 10.28 to American FarmlandCompany’s Annual Report on Form 10-K filed on March 30, 2016)
10.48 Loan Agreement, dated as of January 14, 2015, by and between American Farmland Company L.P. andRutledge Investment Company. (Incorporated by reference to Exhibit 10.29 to American FarmlandCompany’s Annual Report on Form 10-K filed on March 30, 2016)
10.49 Loan Agreement, dated as of August 18, 2015, by and between American Farmland Company L.P. andRutledge Investment Company. (Incorporated by reference to Exhibit 10.30 to American FarmlandCompany’s Annual Report on Form 10-K filed on March 30, 2016)
10.50 Loan Agreement, dated as of December 22, 2015, by and between American Farmland Company L.P.and Rutledge Investment Company. (Incorporated by reference to Exhibit 10.1 to American FarmlandCompany’s Current Report on Form 8-K filed on December 29, 2015)
10.51 Amendment to Loan Agreements, dated as of December 22, 2015, by and between American FarmlandCompany L.P. and Rutledge Investment Company. (Incorporated by reference to Exhibit 10.2 toAmerican Farmland Company’s Current Report on Form 8-K filed on December 29, 2015)
10.52 Second Amendment to Loan Agreements, dated as of February 3, 2017, by and between AmericanFarmland Company L.P. and Rutledge Investment Company. (Incorporated by reference to Exhibit 10.8to the Company’s Current Report on Form 8-K filed on February 3, 2017)
10.53 Guaranty, dated as of February 3, 2017, by and between Farmland Partners Inc. and Ruledge InvestmentCompany. (Incorporated by reference to Exhibit 10.9 to the Company’s Current Report on Form 8-K filed on February 3, 2017)
10.54 Guaranty, dated as of February 3, 2017, by and between Farmland Partners Operating Partnership, LPand Rutledge Investment Company. (Incorporated by reference to Exhibit 10.10 to the Company’sCurrent Report on Form 8-K filed on February 3, 2017)
10.55 Loan Agreement, dated as of February 3, 2017, by and between American Farmland Company L.P andRutledge Investment Company. (Incorporated by reference to Exhibit 10.11 to the Company’s CurrentReport on Form 8-K filed on February 3, 2017)
10.56 Guaranty, dated as of February 3, 2017, by and between Farmland Partners Inc. and Rutledge InvestmentCompany. (Incorporated by reference to Exhibit 10.12 to the Company’s Current Report on Form 8-K filed on February 3, 2017)
10.57 Guaranty, dated as of February 3, 2017, by and between Farmland Partners Operating Partnership, LPand Rutledge Investment Company. (Incorporated by reference to Exhibit 10.13 to the Company’sCurrent Report on Form 8-K filed on February 3, 2017)
21.1* List of subsidiaries. 23.1* Consent of PricewaterhouseCoopers, LLP. 31.1* Certification of Chief Executive Officer pursuant to Rule 13a-14(a)/15d-14(a) of the Securities Exchange
Act of 1934, as amended, as adopted pursuant to Section 302 of the Sarbanes-Oxley Act of 2002. 31.2* Certification of Chief Financial Officer pursuant to Rule 13a-14(a)/15d-14(a) of the Securities Exchange
Act of 1934, as amended, as adopted pursuant to Section 302 of the Sarbanes-Oxley Act of 2002. 32.1* Certification of Chief Executive Officer and Chief Financial Officer pursuant to 18 U.S.C. 1350, as
adopted pursuant to Section 906 of the Sarbanes-Oxley Act of 2002. 101.INS XBRL Instance Document*
101.SCH XBRL Taxonomy Extension Schema* 101.CAL XBRL Taxonomy Extension Calculation Linkbase* 101.DEF XBRL Taxonomy Extension Definition Linkbase* 101.LAB XBRL Taxonomy Extension Label Linkbase* 101.PRE XBRL Taxonomy Extension Presentation Linkbase*
* Filed herewith ** The Company has omitted certain schedules and exhibits pursuant to Item 601(b)(2) of Regulation S-K and agrees to furnish supplementally to the SEC a copy of any omitted schedule or exhibit upon request by the SEC. † Management contract or compensatory plan or arrangement.

77
SIGNATURES
Pursuant to the requirements of Section 13 or 15(d) of the Securities Exchange Act of 1934, the registrant has duly caused this report to be signed on its behalf by the undersigned, thereunto duly authorized.
Date: February 23, 2017 FARMLAND PARTNERS INC.
By: /s/ Paul A. Pittman Paul A. Pittman President and Chief Executive Officer Pursuant to the requirements of the Securities Exchange Act of 1934, this report has been signed below by the following persons on behalf of the registrant and in the capacities and on the dates indicated.
Signature Title Date
/s/ Paul A. Pittman Executive Chairman, President and Chief Executive Officer (principal executive officer) February 23, 2017 Paul A. Pittman
/s/ Luca Fabbri Chief Financial Officer (principal financial officer and principal accounting officer) February 23, 2017
Luca Fabbri
/s/ Jay Bartels Director February 23, 2017 Jay Bartels
/s/ D. Dixon Boardman Director February 23, 2017
D. Dixon Boardman
/s/ John C. Conrad Director February 23, 2017 John C. Conrad
/s/ Chris A. Downey Director February 23, 2017
Chris A. Downey
/s/ Thomas S.T. Gimbel Director February 23, 2017 Thomas S.T. Gimbel
/s/ Joseph W. Glauber Director February 23, 2017
Joseph W. Glauber
/s/ Darell D. Sarff Director February 23, 2017 Darell D. Sarff

Farmland Partners Inc.
FORM 10-K FOR THE YEAR ENDED December 31, 2016
TABLE OF CONTENTS
Page Item 8. Financial Statements. Consolidated Financial Statements Report of Independent Registered Public Accounting Firm F-1 Balance Sheets as of December 31, 2016 and 2015 F-2 Statements of Operations for the years ended December 31, 2016, 2015 and 2014 F-3 Statements of Equity for the years ended December 31, 2016, 2015 and 2014 F-4 Statements of Cash Flows for the years ended December 31, 2016, 2015 and 2014 F-5 Notes to Consolidated Financial Statements F-7 Schedule III – Real Estate and Accumulated Depreciation F-43
Note: All other schedules have been omitted because the required information is not present or not present in amounts sufficient to require submission of the schedule, or because the information required is included in the financial statements or notes thereto.

F-1
Report of Independent Registered Public Accounting Firm To the Board of Directors and Stockholders of Farmland Partners Inc.: In our opinion, the consolidated financial statements listed in the accompanying index present fairly, in all material respects, the financial position of Farmland Partners Inc. and its subsidiaries as of December 31, 2016 and 2015, and the results of their operations and their cash flows for each of the three years in the period ended December 31, 2016 in conformity with accounting principles generally accepted in the United States of America. In addition, in our opinion, the financial statement schedule listed in the accompanying index presents fairly, in all material respects, the information set forth therein when read in conjunction with the related consolidated financial statements. These financial statements and financial statement schedule are the responsibility of the Company’s management. Our responsibility is to express an opinion on these financial statements and financial statement schedule based on our audits. We conducted our audits of these financial statements in accordance with the standards of the Public Company Accounting Oversight Board (United States). Those standards require that we plan and perform the audit to obtain reasonable assurance about whether the financial statements are free of material misstatement. An audit includes examining, on a test basis, evidence supporting the amounts and disclosures in the financial statements, assessing the accounting principles used and significant estimates made by management, and evaluating the overall financial statement presentation. We believe that our audits provide a reasonable basis for our opinion. /s/ PricewaterhouseCoopers LLP Denver, Colorado February 23, 2017
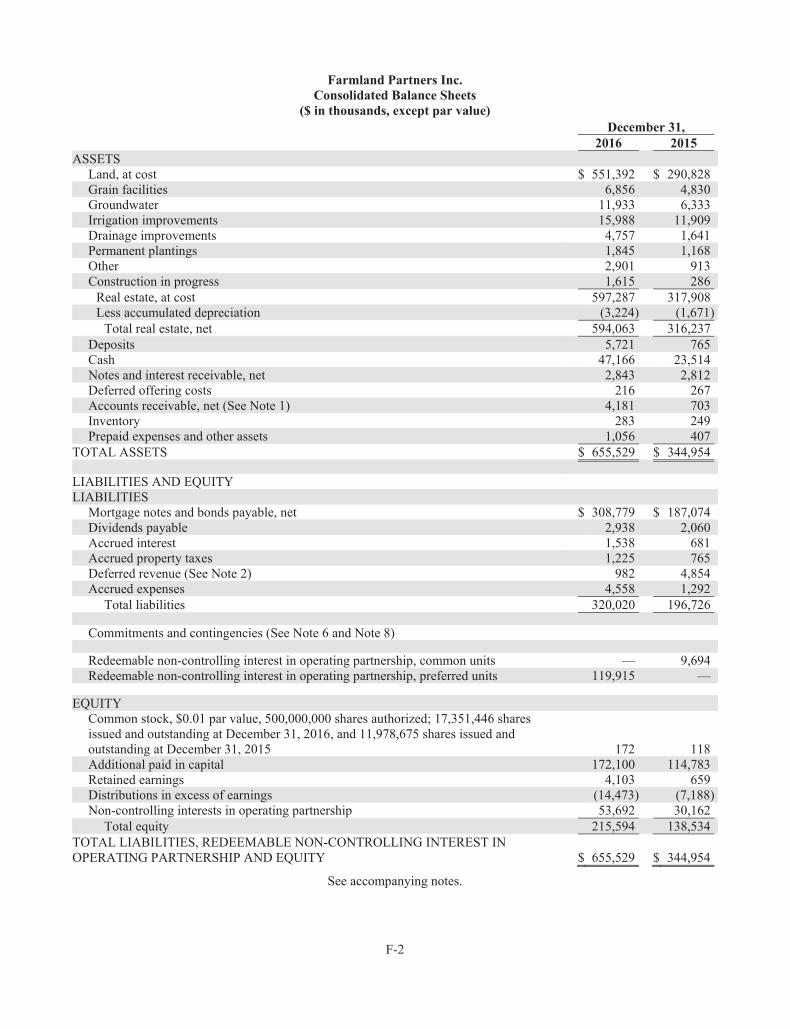
F-2
Farmland Partners Inc. Consolidated Balance Sheets
($ in thousands, except par value)
December 31, 2016 2015 ASSETS
Land, at cost $ 551,392 $ 290,828 Grain facilities 6,856 4,830 Groundwater 11,933 6,333 Irrigation improvements 15,988 11,909 Drainage improvements 4,757 1,641 Permanent plantings 1,845 1,168 Other 2,901 913 Construction in progress 1,615 286
Real estate, at cost 597,287 317,908 Less accumulated depreciation (3,224) (1,671)
Total real estate, net 594,063 316,237 Deposits 5,721 765 Cash 47,166 23,514 Notes and interest receivable, net 2,843 2,812 Deferred offering costs 216 267 Accounts receivable, net (See Note 1) 4,181 703 Inventory 283 249 Prepaid expenses and other assets 1,056 407
TOTAL ASSETS $ 655,529 $ 344,954
LIABILITIES AND EQUITY LIABILITIES
Mortgage notes and bonds payable, net $ 308,779 $ 187,074 Dividends payable 2,938 2,060 Accrued interest 1,538 681 Accrued property taxes 1,225 765 Deferred revenue (See Note 2) 982 4,854 Accrued expenses 4,558 1,292
Total liabilities 320,020 196,726
Commitments and contingencies (See Note 6 and Note 8)
Redeemable non-controlling interest in operating partnership, common units — 9,694 Redeemable non-controlling interest in operating partnership, preferred units 119,915 —
EQUITY Common stock, $0.01 par value, 500,000,000 shares authorized; 17,351,446 shares issued and outstanding at December 31, 2016, and 11,978,675 shares issued and outstanding at December 31, 2015 172 118 Additional paid in capital 172,100 114,783 Retained earnings 4,103 659 Distributions in excess of earnings (14,473) (7,188) Non-controlling interests in operating partnership 53,692 30,162
Total equity 215,594 138,534 TOTAL LIABILITIES, REDEEMABLE NON-CONTROLLING INTEREST IN OPERATING PARTNERSHIP AND EQUITY $ 655,529 $ 344,954
See accompanying notes.

F-3
Farmland Partners Inc. Consolidated Statements of Operations
(in thousands, except per share amounts)
For the Years Ended December 31, 2016 2015 2014 OPERATING REVENUES
Rental income $ 29,668 $ 13,548 $ 3,970 Tenant reimbursements 263 135 248 Other revenue 1,070 73 —
Total operating revenues 31,001 13,756 4,218
OPERATING EXPENSES Depreciation and depletion 1,554 893 329 Property operating expenses 2,379 1,104 249 Acquisition and due diligence costs 2,521 260 193 General and administrative expenses 7,023 4,192 2,275 Legal and accounting 1,447 1,090 615 Other operating expenses 445 — —
Total operating expenses 15,369 7,539 3,661 OPERATING INCOME 15,632 6,217 557
OTHER (INCOME) EXPENSE: Other income (337) (98) (144)Interest expense 9,959 4,616 1,372
Total other expense 9,622 4,518 1,228
Net income (loss) before income tax expense 6,010 1,699 (671)
Income tax expense 11 10 —
NET INCOME (LOSS) 5,999 1,689 (671)
Net (income) loss attributable to non-controlling interest in operating partnership (1,761) (360) 103 Net loss (income) attributable to redeemable non-controlling interest in operating partnership 64 (102) —
Net income (loss) attributable to the Company $ 4,302 $ 1,227 $ (568)
Nonforfeitable distributions allocated to unvested restricted shares (96) (80) (70)Distributions on redeemable non-controlling interests in operating partnership, common units (113) (338) — Distributions on redeemable non-controlling interests in operating partnership, preferred units (2,915) — —
Net income (loss) available to common stockholders of Farmland Partners Inc. $ 1,178 $ 809 $ (638)
Basic and diluted per common share data: Basic net income (loss) available to common stockholders $ 0.09 $ 0.08 (0.15)Diluted net income (loss) available to common stockholders $ 0.09 $ 0.08 (0.15)Basic weighted average common shares outstanding 13,204 9,619 4,265 Diluted weighted average common shares outstanding 13,204 9,629 4,265
See accompanying notes.
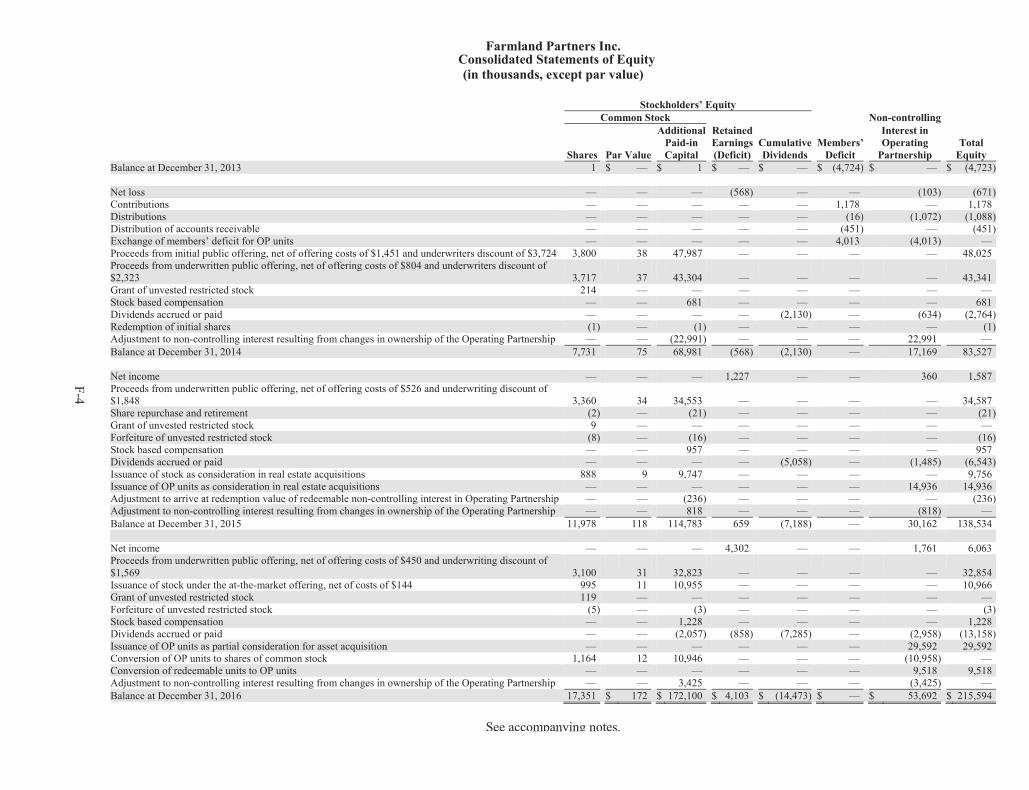
F-4
Farmland Partners Inc. Consolidated Statements of Equity (in thousands, except par value)
Stockholders’ EquityCommon Stock Non-controlling
Additional Retained Interest in Paid-in Earnings Cumulative Members’ Operating Total
Shares Par Value Capital (Deficit) Dividends Deficit Partnership Equity Balance at December 31, 2013 1
$ —
$ 1
$ —
$ —
$ (4,724)
$ —
$ (4,723)
Net loss — — — (568)
— — (103)
(671)Contributions — — — — — 1,178
—
1,178
Distributions — — — — — (16)
(1,072)
(1,088)Distribution of accounts receivable — — — — — (451)
—
(451)
Exchange of members’ deficit for OP units
— — — — — 4,013 (4,013)
— Proceeds from initial public offering, net of offering costs of $1,451 and underwriters discount of $3,724
3,800 38 47,987 — — — — 48,025
Proceeds from underwritten public offering, net of offering costs of $804 and underwriters discount of $2,323 3,717 37 43,304 — — — — 43,341 Grant of unvested restricted stock 214 — — — — — — — Stock based compensation — — 681 — —
— —
681
Dividends accrued or paid — — — — (2,130)
— (634)
(2,764)Redemption of initial shares (1)
— (1)
— — — — (1)
Adjustment to non-controlling interest resulting from changes in ownership of the Operating Partnership —
— (22,991)
— — — 22,991 — Balance at December 31, 2014 7,731 75 68,981 (568)
(2,130)
— 17,169 83,527
Net income — — — 1,227 — — 360 1,587 Proceeds from underwritten public offering, net of offering costs of $526 and underwriting discount of $1,848 3,360 34 34,553
— — — — 34,587
Share repurchase and retirement (2)
— (21)
— — — — (21)Grant of unvested restricted stock 9
— —
— — — — —
Forfeiture of unvested restricted stock (8) — (16)
— — — — (16)Stock based compensation — — 957 — —
— —
957
Dividends accrued or paid — — — — (5,058)
— (1,485)
(6,543)Issuance of stock as consideration in real estate acquisitions 888 9 9,747 — — — — 9,756 Issuance of OP units as consideration in real estate acquisitions — — —
— — — 14,936 14,936
Adjustment to arrive at redemption value of redeemable non-controlling interest in Operating Partnership — — (236)
— — — —
(236)Adjustment to non-controlling interest resulting from changes in ownership of the Operating Partnership — — 818 — — — (818)
—
Balance at December 31, 2015 11,978 118 114,783 659 (7,188)
— 30,162 138,534
Net income — — — 4,302 — — 1,761 6,063 Proceeds from underwritten public offering, net of offering costs of $450 and underwriting discount of $1,569 3,100 31 32,823 — — — — 32,854 Issuance of stock under the at-the-market offering, net of costs of $144 995 11 10,955 — — — — 10,966 Grant of unvested restricted stock 119 — — — — — — — Forfeiture of unvested restricted stock (5) — (3) — — — — (3)Stock based compensation — — 1,228
—
—
— —
1,228
Dividends accrued or paid — — (2,057)
(858)
(7,285)
— (2,958)
(13,158)Issuance of OP units as partial consideration for asset acquisition — — — — — — 29,592
29,592
Conversion of OP units to shares of common stock 1,164 12 10,946 — — — (10,958)
— Conversion of redeemable units to OP units — — — — — — 9,518
9,518
Adjustment to non-controlling interest resulting from changes in ownership of the Operating Partnership — — 3,425 — — — (3,425)
— Balance at December 31, 2016 17,351
$ 172
$ 172,100
$ 4,103
$ (14,473)
$ —
$ 53,692
$ 215,594
See accompanying notes.

F-5
Farmland Partners Inc. Consolidated Statements of Cash Flows
(in thousands)
For the Years Ended December 31, 2016 2015 2014
CASH FLOWS FROM OPERATING ACTIVITIES Net income (loss) $ 5,999 $ 1,689 $ (671)
Adjustments to reconcile net income (loss) to net cash provided by operating activities: Depreciation and depletion 1,554 893 329 Amortization of discounts/premiums on debt 236 155 138 Amortization of net origination fees related to notes receivable (3) (12) — Amortization of below market leases (72) (187) — Stock based compensation 1,224 942 681 Loss on disposition of assets — 2 7
Changes in operating assets and liabilities: Increase in accounts receivable (3,478) (77) (459)(Increase) decrease in interest receivable (79) 8 —Increase in other assets (306) (41) (82)Increase in inventory (34) (249) —Increase in accrued interest payable 856 443 160 Increase in accrued expenses 2,598 208 102 (Decrease) increase in deferred revenue (3,829) 3,446 1,365 Increase in accrued property taxes 375 475 213
Net cash provided by operating activities 5,041 7,695 1,783
CASH FLOWS FROM INVESTING ACTIVITIES Real estate acquisitions (131,776) (109,309) (126,250)Real estate improvements (5,670) (7,574) (46)Principal receipts on notes receivable 50 — — Issuance of notes receivable — (2,830) — Origination fees on notes receivable — 50 — Payment of direct costs related to note receivable — (27) —
Net cash used in investing activities (137,396) (119,690) (126,296)
CASH FLOWS FROM FINANCING ACTIVITIES Borrowings from mortgage notes payable 207,387 82,475 81,100 Repayments on mortgage notes payable (84,750) (9,128) (12,311)Proceeds from initial public offering — — 49,476 Proceeds from underwritten public offering 33,276 35,112 44,145 Proceeds from ATM offering 11,110 — — Common stock repurchased — (21) —Payment of offering costs (423) (781) (2,255)Payment of debt issuance costs (1,116) (239) (370)Redemption of common stock — — (1)Dividends on common stock (6,600) (4,428) (1,642)Refund of outstanding debt — 300 — Contributions from member — — 1,178 Distributions to member — — (17)Distributions to non-controlling interest in operating partnership (2,877) (1,517) (1,072)
Net cash provided by financing activities 156,007 101,773 158,231
NET INCREASE (DECREASE) IN CASH 23,652 (10,222) 33,718 CASH, BEGINNING OF PERIOD 23,514 33,736 18 CASH, END OF PERIOD $ 47,166 $ 23,514 $ 33,736
Cash paid during period for interest $ 8,865 $ 4,020 $ 1,071 Cash paid during period for taxes $ — $ 10 $ —

F-6
Farmland Partners Inc. Consolidated Statements of Cash Flows (continued)
(in thousands)
For the Years Ended December 31, 2016 2015 2014 SUPPLEMENTAL NON-CASH INVESTING AND FINANCING TRANSACTIONS:
Transfer of deferred offering costs to equity, offset by deferred costs included in accrued expenses related to offering $ — $ — $ 699 Distributions payable, common stock $ 2,212 $ 2,060 $ 1,123 Distributions payable, common units $ 726 $ — $ — Preferred distributions accrued $ 2,915 $ — $ — Deferred offering costs amortized through equity in the period $ 565 $ — $ — Distribution of accounts receivable to Pittman Hough Farms $ — $ — $ (451)Seller carry notes $ — $ — $ 2,024 Additions to real estate improvements included in accrued expenses $ 956 $ 429 $ — Issuance of equity and contributions from redeemable non-controlling interests and non-controlling interest in operating partnership in conjunction with acquisitions $ 146,592 $ 34,388 $ — Below market lease acquisitions $ 29 $ 230 $ — Other assets acquired in business combination $ — $ 110 $ — Accounts receivable acquired in acquisitions $ — $ 107 $ 48 Property tax liability assumed in acquisitions $ 86 $ 48 $ 28 Deferred financing costs included in accrued expenses $ 54 $ 3 $ — Offering costs included in accrued expenses $ 90 $ — $ —
See accompanying notes.

Farmland Partners Inc. Notes to Consolidated Financial Statements
F-7
Note 1–Organization and Significant Accounting Policies Organization
Farmland Partners Inc., collectively with its subsidiaries (the “Company”), is an internally managed real estate company that owns and seeks to acquire high-quality farmland located in agricultural markets throughout North America. The Company was incorporated in Maryland on September 27, 2013. The Company is the sole member of the general partner of Farmland Partners Operating Partnership, LP (the “Operating Partnership”), which was formed in Delaware on September 27, 2013. As of December 31, 2016, the Company owned a portfolio of approximately 115,489 acres which are consolidated in these financial statements. All of the Company’s assets are held by, and its operations are primarily conducted through, the Operating Partnership and the wholly owned subsidiaries of the Operating Partnership. As of December 31, 2016, the Company owned a 75.1% interest in the Operating Partnership (see “Note 9—Stockholders’ Equity and Non-controlling Interests” for additional discussion regarding Class A common units of limited partnership interest in the Operating Partnership (“OP units”) and Series A preferred units of limited partnership interest in the Operating Partnership (“Preferred units”)). Unlike holders of our common stock, holders of OP units and Preferred units do not have voting rights or the power to direct our affairs.
The Company and the Operating Partnership commenced operations upon completion of the underwritten initial
public offering of shares of the Company’s common stock (the “IPO”) on April 16, 2014 (see “Note 9—Stockholders’ Equity and Non-controlling Interests”). Concurrently with the completion of the IPO, the Company’s predecessor, FP Land LLC, a Delaware limited liability company (“FP Land”), merged with and into the Operating Partnership, with the Operating Partnership surviving (the “FP Land Merger”). As a result of the FP Land Merger, the Operating Partnership succeeded to the business and operations of FP Land, including FP Land’s 100% fee simple interest in a portfolio of 38 farms and three grain storage facilities (the “Contributed Properties”).
The Company elected to be taxed as a real estate investment trust, (“REIT”), under Sections 856 through 860 of the
Internal Revenue Code of 1986, as amended, (the “Code”), commencing with its short taxable year ended December 31, 2014.
On March 16, 2015, the Company formed FPI Agribusiness Inc., a wholly owned subsidiary (the “TRS” or “FPI
Agribusiness”), as a taxable REIT subsidiary (“TRS”). The TRS was formed to provide volume purchasing services to the Company’s tenants and also to operate a small scale custom farming business. As of December 31, 2016, the TRS performs these custom farming operations on 2,605 acres of farmland owned by the Company and located in Nebraska, Illinois and Mississippi.
All references to numbers of acres within this report are unaudited.
AFCO Mergers
On February 2, 2017, the Company completed the previously announced merger with American Farmland Company (“AFCO”) at which time one of the Company’s wholly owned subsidiaries was merged with and into American Farmland Company L.P. (“AFCO OP”) with AFCO OP surviving as a wholly owned subsidiary of the Operating Partnership (the “Partnership Merger”), and AFCO merged with and into another one of our wholly owned subsidiaries with such wholly owned subsidiary surviving (the “Company Merger” and together with the Partnership Merger, the “AFCO Mergers”).
At the effective time of the Company Merger, each share of common stock of AFCO, par value $0.01 per share (“AFCO Common Stock”), issued and outstanding immediately prior to the effective time of the Company Merger (other than any shares of AFCO Common Stock owned by any wholly owned subsidiary of AFCO or by the Company or the Operating Partnership or any wholly owned subsidiary of the Company or the Operating Partnership), was automatically converted into the right to receive, subject to certain adjustments, 0.7417 shares of the Company’s common stock (the “Company Merger Consideration”). In addition, in connection with the Company Merger, each outstanding AFCO

Farmland Partners Inc. Notes to Consolidated Financial Statements (Continued)
F-8
restricted stock unit that had become fully earned and vested in accordance with its terms was, at the effective time of the Company Merger, converted into the right to receive the Company Merger Consideration. The Company issued 14,763,604 shares of our common stock as consideration in the Company Merger, 17,373 shares of our common stock in respect of fully earned and vested AFCO restricted stock units, and 218,525 OP units in connection with the Partnership Merger at a share price of $11.41 per share on the date of the merger for a total consideration of $171.1 million. Principles of Combination and Consolidation
The accompanying consolidated financial statements are presented on the accrual basis of accounting in accordance with accounting principles generally accepted in the United States of America ("GAAP") and include the accounts of the Company and the Operating Partnership. All significant intercompany balances and transactions have been eliminated in consolidation.
The Company’s financial condition as of December 31, 2016 and 2015, and the results of operations for the years ended December 31, 2016 and 2015, reflect the financial condition and results of operations of the Company. Due to the timing of the IPO and the formation transactions, the results of operations for the year ended December 31, 2014 reflect the results of operations of FP Land (our predecessor) combined with the Company for the period prior to April 16, 2014, and the Company’s consolidated results for the period from April 16, 2014 through December 31, 2014. Use of Estimates
The preparation of financial statements in accordance with GAAP requires management to make estimates and assumptions that affect the reported amounts of assets and liabilities and disclosure of contingent assets and liabilities at the date of the financial statements and the reported amounts of revenues and expenses during the reporting period. Actual results could materially differ from those estimates. Real Estate Acquisitions
The Company accounts for all acquisitions in accordance with the business combinations standard. When the Company acquires farmland that was previously operated as a rental property, the Company evaluates whether a lease is in place or a crop is being produced at the time of closing of the acquisition. If a lease is in place or a crop is being produced, the Company accounts for the transaction as a business combination and charges the costs associated with the acquisition to acquisition and due diligence costs on the Consolidated Statement of Operations, as incurred. Otherwise, acquisitions with no lease in place or crops being produced at the time of acquisition are accounted for as an asset acquisitions with the transaction costs incurred capitalized to the assets acquired. When the Company acquires farmland in a sale-lease back transaction, the Company accounts for the transaction as an asset acquisition.
Upon acquisition of real estate, the Company allocates the purchase price of the real estate based upon the fair value
of the assets and liabilities acquired, which historically have consisted of land, drainage improvements, irrigation improvements, groundwater, permanent plantings (bushes, shrubs, vines, and perennial crops), and grain facilities, and may also consist of intangible assets including in-place leases, above market and below market leases, and tenant relationships. The Company allocates the purchase price to the fair value of the tangible assets of acquired real estate by valuing the land as if it were unimproved. The Company values improvements, including permanent plantings and grain facilities, at replacement cost as new, adjusted for depreciation.
Management’s estimates of land value are made using a comparable sales analysis. Factors considered by management
in its analysis of land value include soil types and water availability and the sales prices of comparable farms. Management’s estimates of groundwater value are made using historical information obtained regarding the applicable aquifer. Factors considered by management in its analysis of groundwater value are related to the location of the aquifer and whether or not the aquifer is a depletable resource or a replenishing resource. If the aquifer is a replenishing resource,

Farmland Partners Inc. Notes to Consolidated Financial Statements (Continued)
F-9
no value is allocated to the groundwater. The Company includes an estimate of property taxes in the purchase price allocation of acquisitions to account for the expected liability that was assumed.
When above or below market leases are acquired, the Company values the intangible assets based on the present value
of the difference between prevailing market rates and the in-place rates measured over a period equal to the remaining term of the lease for above market leases and the initial term plus the term of any below market fixed rate renewal options for below market leases that are considered bargain renewal options. The above market lease values are amortized as a reduction of rental income over the remaining term of the respective leases. The fair value of acquired below market leases, included in deferred revenue on the accompanying consolidated balance sheets, is amortized as an increase to rental income on a straight-line basis over the remaining non-cancelable terms of the respective leases, plus the terms of any below market fixed rate renewal options that are considered bargain renewal options of the respective leases. As of December 31, 2016, the aggregate gross amount of below market leases was $258,347 with amortization for 2016 and the total accumulated amortization amounting to $71,835 and $258,347, respectively. As of December 31, 2015, the aggregate gross amount of below market leases was $229,597 with amortization for 2015 and the total accumulated amortization amounting to $186,512. As of December 31, 2016, all below market leases had been fully amortized. There were no below market leases or related amortization recorded during the year ended December 31, 2014, and no above market leases in the years ended December 31, 2016, 2015 and 2014.
As of December 31, 2016 and 2015, the Company did not have any in-place lease or tenant relationship intangibles. The purchase price is allocated to in-place lease values and tenant relationships, if they are acquired, based on the Company’s evaluation of the specific characteristics of each tenant’s lease, availability of replacement tenants, probability of lease renewal, estimated down time, and its overall relationship with the tenant. The value of in-place lease intangibles and tenant relationships will be included as an intangible asset and will be amortized over the remaining lease term (including expected renewal periods of the respective leases for tenant relationships) as amortization expense. If a tenant terminates its lease prior to its stated expiration, any unamortized amounts relating to that lease, including (i) above and below market leases, (ii) in-place lease values, and (iii) tenant relationships, would be recorded to revenue or expense as appropriate.
The Company capitalizes acquisition costs and due diligence costs if the asset is expected to qualify as an asset
acquisition. If the asset acquisition is abandoned, the capitalized asset acquisition costs will be expensed to acquisition and due diligence costs in the period of abandonment.
Total consideration for acquisitions may include a combination of cash and equity securities. When equity securities are issued, we determine the fair value of the equity securities issued based on the number of shares of common stock and OP units issued multiplied by the stock price on the date of closing in the case of common stock and OP units and by liquidation preference in the case of preferred units.
Using information available at the time of acquisition, the Company allocates the total consideration to tangible assets
and liabilities and identified intangible assets and liabilities. During the measurement period, which may be up to one year from the acquisition date, the Company may adjust the preliminary purchase price allocations after obtaining more information about assets acquired and liabilities assumed at the date of acquisition.
Real Estate
The Company’s real estate consists of land, groundwater and improvements made to the land consisting of permanent plantings, grain facilities, irrigation improvements, drainage improvements and other improvements. The Company records real estate at cost and capitalizes improvements and replacements when they extend the useful life or improve the efficiency of the asset. Construction in progress includes the costs to build new grain storage facilities and install new pivots and wells on newly acquired farms. The Company begins depreciating assets when the asset is ready for its intended use.

Farmland Partners Inc. Notes to Consolidated Financial Statements (Continued)
F-10
The Company expenses costs of repairs and maintenance at the time such costs are incurred. The Company computes depreciation and depletion for assets classified as improvements using the straight-line method over their estimated useful lives as follows:
Years Grain facilities 10 - 40 Irrigation improvements 2 - 40 Drainage improvements 27 - 65 Groundwater 3 - 50 Permanent plantings 13 - 23 Other 5 - 40
The Company periodically evaluates the estimated useful lives for groundwater based on current state water
regulations and depletion levels of the aquifers. When a sale occurs, the Company recognizes the associated gain when all consideration has been transferred, the sale
has closed and there is no material continuing involvement. If a sale is expected to generate a loss, the Company first assesses it through the impairment evaluation process—see ‘‘Impairment of Real Estate Assets’’ below. Impairment of Real Estate Assets
The Company evaluates its tangible and identifiable intangible real estate assets for impairment indicators whenever events such as declines in a property’s operating performance, deteriorating market conditions or environmental or legal concerns bring recoverability of the carrying value of one or more assets into question. If such events are present, the Company projects the total undiscounted cash flows of the asset, including proceeds from disposition, and compares them to the net book value of the asset. If this evaluation indicates that the carrying value may not be recoverable, an impairment loss is recorded in earnings equal to the amount by which the carrying value exceeds the fair value of the asset. There have been no impairments recognized on real estate assets in the accompanying financial statements.
Cash
The Company’s cash at December 31, 2016 and 2015 was held in the custody of one and two financial institutions, respectively, and the Company’s balance at any given financial institution may at times exceed federally insurable limits. The Company monitors balances with individual financial institutions to mitigate risks relating to balances exceeding such limits. Debt Issuance Costs
Costs incurred by the Company or its predecessor in obtaining debt are deducted from the face amount of mortgage notes and bonds payable. During the year ended December 31, 2016, $1,185,747 in costs were incurred in connection with the Bridge Loan, Term Loans 1-4, Farm Credit Mortgage Note, Prudential Note (as defined in “Note 7—Mortgage Notes and Bonds Payable”). During the year ended December 31, 2015, $241,211 in costs were incurred in conjunction with the issuance of five bonds under the Farmer Mac Facility. During the year ended December 31, 2014, $135,340 and $234,188 in costs were capitalized in conjunction with the modification of the First Midwest Bank debt on April 16, 2014 and the issuance of five bonds under the Farmer Mac Facility, respectively. Debt issuance costs are amortized using the straight-line method, which approximates the effective interest method, over the terms of the related indebtedness. Any unamortized amounts upon early repayment of mortgage notes payable are written off in the period in which repayment occurs. Fully amortized deferred financing fees are removed from the books upon maturity or repayment of the underlying debt. The Company recorded amortization expense of $356,606, $212,834, and $138,369 for the years ended December 31, 2016, 2015 and 2014, respectively. The Company wrote off $6,209, $12,300 and $26,929 of debt issuance costs to interest expense in conjunction with the early repayment of debt during the year ended December 31, 2016, 2015 and

Farmland Partners Inc. Notes to Consolidated Financial Statements (Continued)
F-11
2014, respectively. Accumulated amortization of deferred financing fees was $673,089 and $310,274 as of December 31, 2016 and 2015, respectively. Notes and Interest Receivable
Notes receivable are stated at their unpaid principal balance and include unamortized direct origination costs, prepaid interest and accrued interest through the reporting date, less any allowance for losses and unearned borrower paid points. Management determines the appropriate classification of debt securities at the time of issuance and reevaluates such designation as of each statement of financial position date. As of December 31, 2016, the Company had issued two notes under the FPI Loan Program and have designated each of the notes receivable as held-to-maturity based on the Company’s positive intent and ability to hold the security until maturity. Held-to-maturity securities are stated at amortized cost, adjusted for amortization of premiums and accretion of discounts to maturity computed under the straight-line method, which approximates the effective interest method. Such amortization, including interest, is included in other revenue within our consolidated statements of operations. See “Note 6—Notes Receivable.”
Allowance for Notes and Interest Receivable A note is placed on non-accrual status when management determines, after considering economic and business conditions and collection efforts, that the note is impaired or collection of interest is doubtful. The accrual of interest on the instrument ceases when there is concern that principal or interest due according to the note agreement will not be collected. Any payment received on such non-accrual notes are recorded as interest income when the payment is received. The note is reclassified as accrual-basis once interest and principal payments become current. The Company periodically reviews the value of the underlying collateral of farm real estate for the note receivable and evaluates whether the value of the collateral continues to provide adequate security for the note. Should the value of the underlying collateral become less than the outstanding principal and interest, the Company will determine whether an allowance is necessary. Any uncollectible interest previously accrued is also charged off. As of December 31, 2016, we believe the value of the underlying collateral for each of the notes to be sufficient and in excess of the respective outstanding principal and accrued interest. There were no notes receivable that were past due at December 31, 2016.
Deferred Offering Costs Deferred offering costs include incremental direct costs incurred by the Company in conjunction with proposed or actual offerings of securities. At the completion of the offering, the deferred offering costs are charged ratably as a reduction of the gross proceeds of equity as stock is issued. If an offering is abandoned, the previously deferred offering costs will be charged to operations in the period in which the abandonment occurs. The Company incurred $594,680 and $792,942 in offering costs during the years ended December 31, 2016 and 2015, respectively. As of December 31, 2016 and 2015, the Company had $216,027 and $267,253, respectively, in deferred offering costs related to regulatory, legal, accounting and professional service costs associated with proposed or actual offerings of securities. Accounts Receivable Accounts receivable are presented at face value, net of the allowance for doubtful accounts. The allowance for doubtful accounts is established through provisions charged against income and is maintained at a level believed adequate by management to absorb estimated bad debts based on historical experience and current economic conditions. The allowance for doubtful accounts was $378,186 and $78,186 as of December 31, 2016 and 2015, respectively, which are recorded as a reduction to rental revenue on the Consolidated Statement of Operations. Inventory
The costs of growing crop are accumulated until the time of harvest at the lower of cost or market value and are

Farmland Partners Inc. Notes to Consolidated Financial Statements (Continued)
F-12
included in inventory in our consolidated balance sheets. Costs are allocated to growing crops based on a percentage of the total costs of production and total operating costs that are attributable to the portion of the crops that remain in inventory at the end of the year. Growing crop consists primarily of land preparation, cultivation, irrigation and fertilization costs incurred by FPI Agribusiness. Growing crop inventory is charged to cost of products sold when the related crop is harvested and sold.
Harvested crop inventory includes costs accumulated both during the growing and harvesting phases and are stated at
the lower of those costs or the estimated net realizable value, which is the market price, based upon the nearest market in the geographic region, less any cost of disposition. Cost of disposition includes broker’s commissions, freight and other marketing costs.
Other inventory, such as fertilizer and pesticides, is valued at the lower of cost or market.
Inventory consisted of the following:
December 31, ($ in thousands) 2016 2015 Harvested crop $ 283 $ 243 Growing crop — — Fertilizer and pesticides — 6 $ 283 $ 249
Revenue Recognition
Rental income includes rents that each tenant pays in accordance with the terms of its lease. Minimum rents pursuant to leases are recognized as revenue on a straight-line basis over the lease term, including renewal options in the case of bargain renewal options. Deferred revenue includes the cumulative difference between the rental revenue recorded on a straight-line basis and the cash rent received from tenants in accordance with the lease terms. Acquired below market leases are included in deferred revenue on the accompanying consolidated balance sheets, which are amortized into rental income over the life of the respective leases, plus the terms of the below market renewal options, if any.
Leases in place as of December 31, 2016 had terms ranging from one to ten years. As of December 31, 2016, the Company had three leases with rent escalations. The majority of the Company’s leases provide for a fixed annual or semi-annual cash rent payment. Tenant leases on acquired farms generally require the tenant to pay the Company rent for the entire initial year regardless of the date of acquisition, if the acquisition is closed prior to, or shortly after, planting of crops. If the acquisition is closed later in the year, the Company typically receives a partial rent payment or no rent payment at all.
Certain of the Company’s leases provide for a rent payment determined as a percentage of the gross farm proceeds or
a percentage of harvested crops. As of December 31, 2016, a majority of such leases provided for a rent payment determined as a percentage of the gross farm proceeds. Revenue under leases providing for a payment equal to a percentage of the harvested crop or a percentage of the gross farm proceeds are recorded at the guaranteed crop insurance minimums and recognized ratably over the lease term during the crop year. Upon notification from the grain facility that grain has been delivered in the Company’s name, a future contract for delivery of the harvest has been finalized or when the tenant has notified the Company of the total amount of gross farm proceeds, revenue is recognized.
Certain of the Company’s leases provide for minimum cash rent plus a bonus based on gross farm proceeds. Revenue under this type of lease is recognized on a straight-line basis over the lease term based on the minimum cash rent. Bonus rent is recognized upon notification from the tenant of the gross farm proceeds for the year.
Tenant reimbursements include reimbursements for real estate taxes that each tenant pays in accordance with the
terms of its lease. When leases require that the tenant reimburse the Company for property taxes paid by the Company,

Farmland Partners Inc. Notes to Consolidated Financial Statements (Continued)
F-13
the reimbursement is reflected as tenant reimbursement revenue on the statements of operations, as earned, and the related property tax as property operating expense, as incurred. When a lease requires that the tenant pay the taxing authority directly, the Company does not incur this cost. If and when it becomes probable that a tenant will not be able to bear the property-related costs, the Company will accrue the estimated expense.
The Company records revenue from the sale of harvested crops when the harvested crop has been contracted to be
delivered to a grain facility and title has transferred. Harvested crops delivered under marketing contracts are recorded using the fixed price of the marketing contract at the time of delivery to a grain facility. Harvested crops delivered without a marketing contract are recorded using the market price at the date the harvested crop is delivered to the grain facility and title has transferred.
The Company recognizes interest income on notes receivable on an accrual basis over the life of the note. Direct origination costs are netted against loan origination fees and are amortized over the life of the note using the straight-line method, which approximates the effective interest method, as an adjustment to interest income which is included in operating revenues as a component of other revenue in the Company’s Consolidated Statements of Operations for the years ended December 31, 2016 and 2015.
Income Taxes
As a REIT, the Company is permitted to deduct dividends, for income tax purposes, paid to its stockholders, thereby
eliminating the U.S. federal taxation of income represented by such distributions at the Company level, provided certain requirements are met. REITs are subject to a number of organizational and operational requirements. If the Company fails to qualify as a REIT in any taxable year, the Company will be subject to U.S. federal income tax (including any applicable alternative minimum tax) on its taxable income at regular corporate tax rates. The Company recorded income tax expense totaling $11,199 for the year ended December 31, 2016, with $9,951 in income tax expense for the year ended December 31, 2015 and no income tax expense for the year ended December 31, 2014.
The Operating Partnership leases certain of its farms to the TRS, which is subject to federal and state income taxes. The TRS accounts for income taxes using the asset and liability method under which deferred tax assets and liabilities are recognized for temporary differences between the financial reporting basis of assets and liabilities and their respective income tax basis and for operating loss, capital loss and tax credit carryforwards based on enacted income tax rates expected to be in effect when such amounts are realized or settled. However, deferred tax assets are recognized only to the extent that it is more likely than not they will be realized on consideration of available evidence, including future reversals of existing taxable temporary differences, future projected taxable income and tax planning strategies. There was $0.03 million in taxable income from the TRS for the year ended December 31, 2016, and at December 31, 2016, the Company did not have any deferred tax assets or liabilities. There was no taxable income from the TRS for the year ended December 31, 2015, and at December 31, 2015, the Company did not have any deferred tax assets or liabilities.
The Company performs an annual review for any uncertain tax positions and, if necessary, will record future tax
consequences of uncertain tax positions in the financial statements. An uncertain tax position is defined as a position taken or expected to be taken in a tax return that is not based on clear and unambiguous tax law and which is reflected in measuring current or deferred income tax assets and liabilities for interim or annual periods. At December 31, 2016, the Company did not identify any uncertain tax positions. The Company did not identify any uncertain tax positions related to the 2015 and 2014 open tax years.
When the Company acquires a property in a business combination, the Company evaluates such acquisition for any
related deferred tax assets or liabilities and determines if a deferred tax asset or liability should be recorded in conjunction with the purchase price allocation. If a built-in gain is acquired, the Company evaluates the required holding period (generally 5 - 10 years) and determines if it has the ability and intent to hold the underlying assets for the necessary holding period. If the Company has the ability to hold the underlying assets for the required holding period, no deferred tax liability is recorded with respect to the built-in gain.

Farmland Partners Inc. Notes to Consolidated Financial Statements (Continued)
F-14
Derivatives and Hedge Accounting The Company enters into marketing contracts to sell commodities. Derivatives and hedge accounting guidance requires a company to evaluate these contracts to determine whether the contracts are derivatives. Certain contracts that meet the definition of a derivative may be exempt from derivative accounting if designated as normal purchase or normal sales. The Company evaluates all contracts at inception to determine if they are derivatives and if they meet the normal purchase and normal sale designation requirements. All contracts entered into during the year ended December 31, 2016 and 2015 met the criteria to be exempt from derivative accounting and have been designated as normal purchase and sales exceptions for hedge accounting. Segment Reporting
The Company’s chief operating decision maker does not evaluate performance on a farm-specific or transactional basis and does not distinguish the Company’s principal business or group its operations on a geographical basis for purposes of measuring performance. Accordingly, the Company believes it has a single operating segment for reporting purposes in accordance with GAAP. Earnings Per Share
Basic earnings per share is calculated by dividing net income (loss) available to common stockholders by the weighted-average number of shares of common stock outstanding during the period, excluding the weighted average number of unvested restricted shares (“participating securities” as defined in “Note 9—Stockholders’ Equity and non-controlling Interests”). Diluted earnings per share is calculated by dividing net income (loss) available to common stockholders by the weighted-average number of shares of common stock outstanding during the period, plus other potentially dilutive securities such as stock grants or shares that would be issued in the event that OP units are redeemed for shares of common stock of the Company. No adjustment is made for shares that are anti-dilutive during a period. Non-controlling Interests
The Company’s non-controlling interests are interests in the Operating Partnership not owned by the Company. The
Company evaluates whether non-controlling interests are subject to redemption features outside of its control. The Company classifies non-controlling interests that are contingently redeemable solely for cash (unless stockholder approval is obtained to redeem for shares of common stock) one year after issuance or deemed probable to eventually become redeemable and which have redemption features outside of its control, as redeemable non-controlling interests in the mezzanine section of the consolidated balance sheets. The amounts reported for non-controlling interests on the Company’s consolidated statements of operations represent the portion of income or losses not attributable to the Company.

Farmland Partners Inc. Notes to Consolidated Financial Statements (Continued)
F-15
Stock Based Compensation From time to time, the Company may award non-vested shares under the Company’s Amended and Restated 2014 Equity Incentive Plan (the “Plan”) as compensation to officers, employees, non-employee directors and non-employee consultants (see “Note 9—Stockholders’ Equity and Non-controlling Interests”). The shares issued to officers, employees, and non-employee directors vest over a period of time as determined by the Board of Directors at the date of grant. The Company recognizes compensation expense for non-vested shares granted to officers, employees and directors on a straight-line basis over the requisite service period based upon the fair market value of the shares on the date of grant, as adjusted for forfeitures. The Company recognizes expense related to non-vested shares granted to non-employee consultants over the period that services are received. The change in fair value of the shares to be issued upon vesting is remeasured at each reporting period and is recorded in general and administrative expenses on the consolidated statements of operations. As a result of changes in the fair value of the unvested shares, the Company recorded increases in stock based compensation of $2,990, $12,596 and $40,723 for the years ended December 31, 2016, 2015 and 2014, respectively. New or Revised Accounting Standards
In May 2014, the FASB issued ASU No. 2014-09, Revenue from Contracts with Customers: Topic 606 (“ASU 2014-09”). ASU 2014-09 amends the guidance for revenue recognition to replace numerous, industry-specific requirements and converges areas under this topic with those of the International Financial Reporting Standards. ASU 2014-09 implements a five-step process for customer contract revenue recognition that focuses on transfer of control, as opposed to transfer of risk and rewards. The amendment also requires enhanced disclosures regarding the nature, amount, timing and uncertainty of revenues and cash flows from contracts with customers. Other major provisions include the capitalization and amortization of certain contract costs, ensuring the time value of money is considered in the transaction price, and allowing estimates of variable consideration to be recognized before contingencies are resolved in certain circumstances. While the Company is still completing its assessment of the impact of this guidance, it does not believe that it will have a material impact on the financial statements as the majority of the Company’s contracts with customers relate to leases that fall within the scope of ASC 842. Other contract types undergoing evaluation are considered ancillary to the Company’s operations and financial statements. The amendments in this ASU are effective for annual and interim reporting periods beginning after December 15, 2017, and early adoption is permitted, but no earlier than the original effective date for public companies. Entities can transition to the standard either retrospectively for each reporting period presented at the time of adoption or as a cumulative-effect adjustment as of the date of adoption. The Company has not yet determined which method of adoption will be used.
In August 2014, the FASB issued ASU No. 2014-15, Disclosure of Uncertainties about an Entity's Ability to Continue
as a Going Concern ("ASU 2014-15"), which requires management to evaluate whether there are conditions or events that raise substantial doubt about the entity's ability to continue as a going concern, and to provide certain disclosures when it is probable that the entity will be unable to meet its obligations as they become due within one year after the date that the financial statements are issued. ASU 2014-15 is effective for the annual period ended December 31, 2016 and for annual periods and interim periods thereafter with early adoption permitted. The adoption of ASU 2014-15 does not have a material impact on our consolidated financial statements.
In February 2015, the FASB issued ASU No. 2015-02, Consolidation (Topic 810): Amendments to the Consolidation
Analysis (“ASU 2015-02”), which amends or supersedes the scope and consolidation guidance under existing GAAP. The new standard changes the way a reporting entity evaluates whether (a) limited partnerships and similar entities should be consolidated, (b) fees paid to decision makers or service providers are variable interests in a variable interest entity (“VIE”), and (c) variable interests in a VIE held by related parties require the reporting entity to consolidate the VIE. ASU 2015-02 also eliminates the VIE consolidation model based on majority exposure to variability that applied to certain investment companies and similar entities. ASU 2015-02 is effective for annual and interim reporting periods beginning after December 15, 2015, with early adoption permitted. On January 1, 2016, the Company adopted ASU 2015-02. The guidance does not amend the existing disclosure requirements for variable interest entities (“VIEs”) or voting interest model entities. The guidance, however, modified the requirements to qualify under the voting interest model. Under the

Farmland Partners Inc. Notes to Consolidated Financial Statements (Continued)
F-16
revised guidance, the Operating Partnership will be a variable interest entity of the Company. As the Operating Partnership is already consolidated in the balance sheets of the Company, the identification of this entity as a variable interest entity has no impact on the combined consolidated financial statements.
In April 2015, the FASB issued ASU No. 2015-03, Simplifying the Presentation of Debt Issuance Costs (“ASU 2015-
03”). ASU 2015-03 requires the presentation of debt issuance costs in the balance sheet as a deduction from the carrying amount of the related debt liability instead of a deferred charge asset. ASU 2015-03 is effective for annual periods beginning after December 15, 2015, but early adoption is permitted. The Company elected to early adopt the provisions of ASU 2015-03. The Company had unamortized deferred financing fees of $1,193,052 and $380,970 as of December 31, 2016 and December 31, 2015, respectively. These costs have been classified as a reduction of mortgage notes and bonds payable, net. All periods presented have been retroactively adjusted.
In July 2015, the FASB issued ASU No. 2015-11, Inventory (Topic 330). The amendments require that an entity
should measure inventory at the lower of cost and net realizable value. Net realizable value is the estimated sales price in the ordinary course of business, less reasonably predictable costs of completion, disposal, and transportation. The amendments are effective for fiscal years beginning after December 15, 2016, including interim periods within those fiscal years. The amendments should be applied prospectively with earlier application permitted as of the beginning of an interim or annual reporting period. The Company does not expect the adoption of this guidance to have any impact on its financial position, results of operations or cash flows.
In September 2015, the FASB issued ASU No. 2015-16, Simplifying the Accounting for Measurement-Period Adjustment (“ASU 2015-16”) pertaining to entities that have reported provisional amounts for items in a business combination for which the accounting is incomplete by the end of the reporting period in which the combination occurs and during the measurement period have an adjustment to provisional amounts recognized. The guidance requires that an acquirer recognize adjustments to provisional amounts that are identified during the measurement period in the reporting period in which the adjustment amounts are determined. Any adjustments should be calculated as if the accounting had been completed at the acquisition date. ASU 2015-16 is effective for annual and interim periods beginning after December 15, 2015, with early adoption permitted. The Company adopted the guidance effective for the quarterly period ended December 31, 2015. The Company has several business combinations which are still within the measurement period and could result in future adjustments.
In February 2016, the FASB issued ASU 2016-02, Leases (Topic 842) (“ASU 2016-02”), which sets out the principles
for the recognition, measurement, presentation and disclosure of leases for both parties to a contract (i.e. lessees and lessors). The new standard requires lessees to apply a dual approach, classifying leases as either finance or operating leases based on the principle of whether or not the lease is effectively a financed purchase by the lessee. This classification will determine whether lease expense is recognized based on an effective interest method or on a straight line basis over the term of the lease, respectively. A lessee is also required to record a right-of-use asset and a lease liability for all leases with a term of greater than 12 months regardless of their classification. Leases with a term of 12 months or less will be accounted for similar to existing guidance for operating leases today. The new standard requires lessors to account for leases using an approach that is substantially equivalent to existing guidance for sales-type leases, direct financing leases and operating leases. While the Company is still completing its assessment of the impact of this guidance, the following is anticipated to reflect the primary effects of this guidance on the accounting and reporting: (i) for leases in which the Company is the lessee, the Company does not expect the guidance to have a material impact as there is only one operating lease for office space in which the Company is the lessee and that lease is not significant to the consolidated financial statements; (ii) for leases in which the Company is the lessor, the Company does not expect there to be a material impact as the majority of the Company’s leases do not contain a non-lease component. While the Company is expecting there to be other ancillary impacts for leases in which the Company is the lessor, they are not expected to be material to the consolidated financial statements. Lastly, under the new guidance, there are certain circumstances in which buyer-lessors in sale and leaseback transactions could potentially result in recording the transaction as a financial receivable if such transaction fails sale and leaseback criteria, which the Company is still evaluating. The standard is effective on January 1,

Farmland Partners Inc. Notes to Consolidated Financial Statements (Continued)
F-17
2019, with modified retrospective restatement for each reporting period presented at the time of adoption. Early adoption is permitted. The Company has not yet determined whether this guidance will be early adopted.
In August 2016, the FASB issued ASU No. 2016-15, Statement of Cash Flows (Topic 230): Classification of Certain Cash Receipts and Cash Payments, (“ASU 2016-15”). ASU 2016-15 is intended to reduce diversity in practice across all industries. The amendments in this update provide guidance on the following eight specific cash flow issues: 1) Debt Prepayment or Debt Extinguishment Costs; 2) Settlement of Zero-Coupon Debt Instruments or Other Debt Instruments with Coupon Interest Rates That Are Insignificant in Relation to the Effective Interest Rate of the Borrowing; 3) Contingent Consideration Payments Made after a Business Combination; 4) Proceeds from the Settlement of Insurance Claims; 5) Proceeds from the Settlement of Corporate-Owned Life Insurance Policies, including Bank-Owned Life Insurance Policies; 6) Distributions Received from Equity Method Investees; 7) Beneficial Interests in Securitization Transactions; and 8) Separately Identifiable Cash Flows and Application of the Predominance Principle. ASU 2016-15 is effective for fiscal years beginning after December 15, 2017, including interim periods within those fiscal years. Early adoption is permitted. The Company is currently evaluating the requirements of ASU 2016-15 and has not yet determined its impact on the Company’s consolidated financial statements.
In January 2017, the FASB issued ASU No. 2017-01, Business Combination (Topic 805): Clarifying the definition of
a business, (“ASU 2017-01”). ASU 2017-01 is intended to clarify the definition of a business with the objective of adding guidance to assist entities with evaluating whether transactions should be accounted for as acquisitions (or disposals) of businesses. The Company has determined that with the adoption of this guidance some acquisitions that were deemed business combinations will be deemed asset acquisitions and costs associated with these asset acquisitions will be capitalized to the acquisition at the time of the Company completing the acquisition accounting. ASU 2017-01 is effective for fiscal years beginning after December 15, 2017, including interim periods within those fiscal years. Early adoption is permitted. The Company’s initial evaluation indicates that we expect the vast majority of our acquisitions to be deemed asset acquisitions under the new guidance.
Note 2—Revenue Recognition
For the majority of its leases, the Company receives at least 50% of the annual lease payment from tenants either during the first quarter of the year or at the time of acquisition of the related farm, with the remaining 50% of the lease payment due in the second half of the year. As such, the rental income received is recorded on a straight-line basis over the lease term. The lease term generally includes periods when a tenant: (1) may not terminate its lease obligation early; (2) may terminate its lease obligation early in exchange for a fee or penalty that the Company considers material enough such that termination would not be probable; (3) possesses renewal rights and the tenant’s failure to exercise such rights imposes a penalty on the tenant material enough such that renewal appears reasonably assured; or (4) possesses bargain renewal options for such periods. Payments received in advance are included in deferred revenue until they are earned. As of December 31, 2016 and 2015, the Company had $981,669, and $4,853,837, respectively, in deferred revenue. Unamortized below market leases as of December 31, 2016 and 2015, respectively, were $0 and $43,085 and are included in deferred revenue.
The following represents a summary of the rental income recognized during the three years ended December 31, 2016:
Rental Income Recognized For the year ended December 31, ($ in thousands) 2016 2015 2014 Leases in effect at the beginning of the year $ 2,609 $ 7,258 $ 2,634 Leases entered into or amended during the year 27,059 6,290 1,336 $ 29,668 $ 13,548 $ 3,970

Farmland Partners Inc. Notes to Consolidated Financial Statements (Continued)
F-18
Future minimum lease payments from tenants under all non-cancelable leases in place as of December 31, 2016, including lease advances, when contractually due, but excluding tenant reimbursement of expenses and lease payments based on a percentage of farming revenues, for each of the next five years as of December 31, 2016 are as follows:
($ in thousands) Future Rental Year Ending December 31, Payments 2017 $ 12,311 2018 8,868 2019 3,937 2020 1,334 2021 719 2022 and beyond 2,498 $ 29,667
Since lease renewal periods are exercisable at the option of the lessee, the preceding table presents future minimum
lease payments due during the initial lease term only. Note 3—Concentration Risk Credit Risk
For the years ended December 31, 2016, 2015 and 2014, the Company had certain tenant concentrations as presented in the table below. If a significant tenant, representing a tenant concentration, fails to make rental payments to the Company or elects to terminate its leases, and the land cannot be re-leased on satisfactory terms, there would be a material adverse effect on the Company’s financial performance and the Company’s ability to continue operations. Rental income received is recorded on a straight-line basis over the applicable lease term. The following is a summary of our significant tenants:
Rental Income Recognized For the year ended December 31, ($ in thousands) 2016 2015 2014 Tenant A(1)
$ 11,988 40.4 % $ 3,509 25.9 % $ — — %
(1) The Company entered into two separate sale and partial leaseback transactions with Tenant A and affiliates in December 2014 and June 2015.
The leases were due to expire on December 31, 2016, December 31, 2017 and December 31, 2019. Tenant A and the Company agreed to terminate the leases effective as of December 31, 2016. As part of the termination settlement, Tenant A agreed to pay an additional rent amount related to 2016 of $2.8 million. In addition, the Company fully recognized as 2016 revenue certain rent payments, totaling $3.7 million, made by Tenant A in June 2015, that the Company had not yet recognized under its revenue recognition policy.

Farmland Partners Inc. Notes to Consolidated Financial Statements (Continued)
F-19
Geographic Risk
The following table summarizes the percentage of approximate total acres owned as of December 31, 2016, 2015 and 2014 and straight line rental income recorded by the Company for the years then ended by location of the farm:
Approximate % of Total Acres Rental Income As of December 31, For the year ended December 31, Location of Farm 2016 2015 2014 2016 2015 2014 Arkansas 10.0 % 14.0 % 17.4 % 4.5 % 10.1 % 4.5 % Colorado 18.8 % 27.3 % 38.9 % 9.3 % 18.7 % 26.8 % Florida 2.1 % — % — % 0.6 % — % — % Georgia 2.9 % 1.8 % — % 1.8 % 0.3 % — % Illinois 24.8 % 8.1 % 12.4 % 25.4 % 16.9 % 56.6 % Kansas 1.6 % 2.2 % 1.4 % 0.4 % 0.2 % — % Louisiana 8.1 % 2.7 % 4.2 % 1.4 % 4.9 % 4.1 % Michigan 0.4 % 0.2 % — % 0.4 % 1.5 % — % Mississippi 4.3 % 5.8 % 4.2 % 2.2 % 6.0 % 0.6 % North Carolina 9.6 % 14.9 % — % 39.1 % 16.2 % — % Nebraska 5.1 % 7.9 % 6.8 % 5.2 % 10.1 % 7.4 % South Carolina 8.9 % 13.4 % 14.7 % 8.3 % 15.1 % — % Texas 2.3 % — % — % 1.4 % — % — % Virginia 1.1 % 1.7 % — % — % — % — % 100.0 % 100.0 % 100.0 % 100.0 % 100.0 % 100.0 %
Note 4—Related Party Transactions
See “Note 5—Real Estate” for related party acquisition of the Illinois farm on June 30, 2015.
Effective as of December 31, 2015, Mr. Pittman neither owns any direct or indirect interest in, nor has control of, Astoria Farms and Hough Farms. As of December 31, 2016 and 2015, 6% and 11%, respectively, of the acres in the Company’s farm portfolio were rented to and operated by Astoria Farms or Hough Farms, both of which were related parties until December 31, 2015. Astoria Farms is a partnership in which Pittman Hough Farms LLC (“Pittman Hough Farms”), which was previously 75% owned by Mr. Pittman, had a 33.34% interest. The balance of Astoria Farms was held by limited partnerships in which Mr. Pittman was previously the general partner. Hough Farms is a partnership in which Pittman Hough Farms previously had a 25% interest. The aggregate rent recognized by the Company for these entities for the years ended December 31, 2016, 2015 and 2014 was $2,464,905, $2,720,757 and $2,474,839, respectively. As of December 31, 2016 and 2015, the Company did not have any accounts receivable from these entities.
For the years ended December 31, 2016, 2015 and 2014, Pittman Hough Farms incurred $0, $0 and $219,597, respectively, in professional fees on behalf of the Company. These fees were reimbursed by the Company. As of December 31, 2016 and 2015, the Company had no outstanding payables to Pittman Hough Farms.
Effective as of December 31, 2015, Mr. Pittman does not own any interest in American Agriculture.American Agriculture Corporation (‘‘American Agriculture’’) is a Colorado corporation that was 75% owned by Mr. Pittman and 25% owned by Jesse J. Hough, who provides consulting services to the Company. On April 16, 2014, the Company entered into a shared services agreement with American Agriculture pursuant to which the Company paid American Agriculture an annual fee of $175,000 in equal quarterly installments in exchange for administrative and accounting services. The agreement was terminated effective December 31, 2014, by mutual agreement of both parties. The Company incurred $123,958 in fees related to the shared services agreement during the year ended December 31, 2014, which are included in general and administrative expenses in the consolidated statements of operations.
The Company reimbursed American Agriculture $0 and $21,259, respectively, for general and administrative
expenses during the year ended December 31, 2016 and 2015, which are included in general and administrative expenses in the consolidated statements of operations. As of December 31, 2016 the Company had outstanding receivables from

Farmland Partners Inc. Notes to Consolidated Financial Statements (Continued)
F-20
American Agriculture of $48,728, while at December 31, 2015, the Company had outstanding receivable to American Agriculture of $5,574, included in accrued expenses in the consolidated balance sheets.
On July 21, 2015, the Company entered into a lease agreement with American Agriculture Aviation LLC (“American Ag Aviation”) for the use of a private plane. American Ag Aviation is a Colorado limited liability company that is owned 100% by Mr. Pittman. During the years ended December 31, 2016 and 2015, the Company incurred costs of $169,708 and $103,090, respectively, from American Ag Aviation for use of the aircraft in accordance with the lease agreement. These costs were recognized based on the nature of the associated use of the aircraft, as follows: (i) general and administrative - expensed as general and administrative expenses within the Company’s consolidated statements of operations; (ii) land acquisition (accounted for as an asset acquisition) - allocated to the acquired real estate assets within the Company’s consolidated balance sheets; and (iii) land acquisition (accounted for as a business combination) - expensed as acquisition and due diligence costs within the Company’s consolidated statements of operations.
On April 1, 2015, the TRS and Hough Farms entered into a custom farming arrangement, pursuant to which Hough
Farms performs custom farming on 563 acres. During the year ended December 31, 2015, the Company incurred $51,303 in custom farming costs, which are included in inventory in the combined consolidated balance sheets. As of December 31, 2015, the Company owed Hough Farms $11,946 for fungicide application related costs, which are included in accrued expenses in the combined consolidated balance sheet.
On March 21, 2014 and April 16, 2014, the Company and FP Land entered into reimbursement agreements with Pittman Hough Farms to reimburse Pittman Hough Farms for costs incurred to complete the IPO and the FP Land Merger. The amount of the costs that were reimbursed was reduced by interest expense of $78,603 related to outstanding debt at the time of the FP Land Merger, which was accrued by FP Land as of December 31, 2013. The aggregate net reimbursable amount under the agreements was $1,361,321. On June 9, 2014, the Company and the Operating Partnership entered into an additional reimbursement agreement with Pittman Hough Farms for $51,537 in professional fees incurred prior to the IPO.

Farmland Partners Inc. Notes to Consolidated Financial Statements (Continued)
F-21
Note 5—Real Estate
As of December 31, 2016, the Company owned approximately 115,489 acres, as well as eight grain storage facilities.
During year ended December 31, 2016, the Company acquired the following farms:
($ in thousands) Total Date Approximate Purchase Acquisition
State Acquired Acres Price Costs Type of Acquisition Georgia 1/12/2016 608 $ 1,202 $ 2 Asset Acquisition Michigan 1/21/2016 265 1,630 — Business Combination Texas 1/27/2016 2,056 6,117 1 Asset Acquisition Illinois 2/26/2016 40 371 — Asset Acquisition Illinois(1) 3/2/2016 22,129 197,145 1,321 Asset Acquisition Georgia 3/11/2016 208 624 3 Asset Acquisition Illinois 3/24/2016 80 667 — Asset Acquisition Louisiana 3/31/2016 7,400 31,764 14 Asset Acquisition Mississippi 4/4/2016 624 2,307 — Business Combination Georgia 4/6/2016 213 577 2 Asset Acquisition Georgia 4/6/2016 274 958 3 Asset Acquisition South Carolina 5/12/2016 330 1,528 3 Asset Acquisition Texas 5/17/2016 640 1,800 — Business Combination Illinois 6/27/2016 77 697 — Business Combination Colorado 6/29/2016 1,261 1,760 — Business Combination Illinois 6/30/2016 203 1,905 — Asset Acquisition Georgia 7/20/2016 266 862 — Business Combination Colorado 7/27/2016 142 5,524 24 Asset Acquisition Kansas 7/27/2016 158 325 — Asset Acquisition Florida 8/31/2016 2,426 9,497 21 Asset Acquisition Georgia 9/16/2016 445 1,402 — Asset Acquisition Illinois 9/29/2016 7 120 — Asset Acquisition Illinois 11/2/2016 95 563 — Asset Acquisition Arkansas(2) 12/21/2016 1,122 4,066 32 Asset Acquisition 41,069 $ 273,411 $ 1,426
(1) This acquisition closed on March 2, 2016. The purchase price of the property was comprised of (a) $50.0 million in cash, (b) an aggregate of
2,608,695 OP units at $11.50 per OP unit and (c) 117,000 Preferred units. See “Note 9 – Stockholders’ Equity and Non-controlling Interests.” (2) This acquisition closed on December 21, 2016. The purchase price of the property was comprised of (a) $3.3 million in cash and (b) an aggregate
of 69,961 OP units at $10.95 per OP unit.

Farmland Partners Inc. Notes to Consolidated Financial Statements (Continued)
F-22
During the year ended December 31, 2015, the Company acquired the following farms:
($ in thousands) Total Date Approximate Purchase Acquisition
State Acquired Acres Price Costs Type of Acquisition Mississippi 1/14/2015 850 $ 3,512 $ 6 Asset acquisition Colorado 2/18/2015 997 2,080 1 Business combination Nebraska 2/24/2015 73 606 1 Asset acquisition Nebraska 2/24/2015 123 861 2 Asset acquisition Colorado(1) 3/13/2015 315 2,026 — Asset acquisition South Carolina 3/13/2015 502 2,303 4 Asset acquisition Nebraska(2) 4/10/2015 1,117 9,022 20 Business combination Nebraska(3) 4/10/2015 1,160 8,981 20 Business combination Colorado 4/10/2015 160 950 — Business combination Colorado 4/17/2015 322 2,000 — Asset acquisition Arkansas 4/30/2015 934 3,025 12 Business combination Mississippi 5/14/2015 359 1,469 2 Asset acquisition Illinois 5/29/2015 110 762 2 Asset acquisition North Carolina, South Carolina, & Virginia(4) 6/2/2015 14,935 80,914 199 Asset acquisition Illinois(5) 6/30/2015 58 690 2 Business combination Arkansas 7/2/2015 1,383 6,168 21 Asset acquisition Mississippi 7/10/2015 1,130 5,576 22 Asset acquisition Michigan 9/15/2015 181 2,557 14 Asset acquisition Nebraska 10/1/2015 160 1,288 2 Business combination Georgia 10/9/2015 1,069 3,676 5 Business combination Kansas & Colorado 12/4/2015 1,217 1,915 — Asset acquisition Illinois 12/15/2015 78 815 3 Asset acquisition Georgia 12/17/2015 116 528 2 Asset acquisition Georgia 12/17/2015 182 661 2 Asset acquisition Nebraska 12/15/2015 80 733 6 Asset acquisition Colorado 12/30/2015 171 236 1 Asset acquisition 27,782 $ 143,354 $ 349
(1) On March 13, 2015, the Company issued 63,581 shares of common stock (with a fair value of $712,743 as of the date of closing) as partial
consideration for this farm acquisition. (2) On April 10, 2015, the Company issued 118,634 OP units (with a fair value of $1,372,595 as of the date of closing) as partial consideration for the
acquisition of these Nebraska farms. (3) On April 10, 2015, the Company issued 119,953 OP units (with a fair value of $1,387,856 as of the date of closing) as partial consideration for the
acquisition of these Nebraska farms. (4) On June 2, 2015, the Company issued 824,398 shares of common stock and 1,993,709 OP units, of which 883,724 are redeemable for cash, or at
the Company’s option shares of common stock on a one for one basis up to a maximum of 1,109,985 shares (with an aggregate fair value of $30,914,634, as of the date of closing) as partial consideration for the acquisition of these farms. See “Note 9—Stockholders Equity and Non-controlling Interests”.
(5) On June 30, 2015, the Company acquired this property from Mr. Pittman. In connection with the acquisition, the Company assumed a two year lease with Astoria Farms with annual rents of $18,749.

Farmland Partners Inc. Notes to Consolidated Financial Statements (Continued)
F-23
The preliminary allocation of purchase price for the farms acquired during the year ended December 31, 2016 is as follows:
($ in thousands) Land Groundwater Irrigation
Improvements
Permanent Plantings &
Other Timber Accounts
Receivable
Below Market Leases
Accrued Property
Taxes Total Georgia $ 795 $ — $ 65 $ — $ 342 $ — $ — $ — $ 1,202 Michigan 779 — 88 763 — — — — 1,630 Texas 4,188 1,434 495 — — — — — 6,117 Illinois 371 — — — — — — — 371 Illinois 195,590 — 1,277 357 — — — (79) 197,145 Georgia 482 — 142 — — — — — 624 Illinois 667 — — — — — — — 667 Louisiana 30,584 — 557 623 — — — — 31,764 Mississippi 2,321 — 15 — — — (29) — 2,307 Georgia 469 — 108 — — — — — 577 Georgia 756 — 202 — — — — — 958 South Carolina 1,303 — 225 — — — — — 1,528 Texas 925 634 241 — — — — — 1,800 Illinois 667 — 30 — — — — — 697 Colorado 1,760 — — — — — — — 1,760 Illinois 1,905 — — — — — — — 1,905 Georgia 718 — 144 — — — — — 862 Colorado 792 3,491 (1) 22 1,219 — — — — 5,524 Kansas 235 41 49 — — — — — 325 Florida 9,295 — — 202 — — — — 9,497 Georgia 1,330 — 72 — — — — — 1,402 Illinois 34 — — 86 — — — — 120 Illinois 563 — — — — — — — 563 Arkansas 4,035 — 37 — — — — (6) 4,066 $ 260,564 $ 5,600 $ 3,769 $ 3,250 $ 342 $ - $ (29) $ (85) $ 273,411
(1) Within groundwater, the Company acquired $3.5 million in water rights and shares in water districts. The Company determined these assets to be
non-depreciable.
The allocation of the purchase price for the farms acquired (that were deemed business combinations) during the year
ended December 31, 2016 is preliminary and may change during the measurement period, which may be up to one year from the acquisition date, if the Company obtains new information regarding the assets acquired or liabilities assumed at the acquisition date.

Farmland Partners Inc. Notes to Consolidated Financial Statements (Continued)
F-24
The allocation of purchase price for the farms acquired during the year ended December 31, 2015 are as follows:
($ in thousands) Land Groundwater Irrigation
Improvements
Permanent Plantings &
Other Timber Accounts
Receivable
Below Market Leases
Accrued Property
Taxes Total Mississippi $ 3,471 $ — $ 41 $ — $ — $ — $ — $ — $ 3,512 Colorado 1,995 — 80 5 — — — — 2,080 Nebraska 607 — — — — — — (1) 606 Nebraska 862 — — — — — — (1) 861 Colorado 1,365 626 37 — — — — (2) 2,026 South Carolina 1,959 — 276 68 — — — — 2,303 Nebraska 8,757 — 339 — — 37 (89) (22) 9,022 Nebraska 8,872 — 236 — — 30 (141) (16) 8,981 Colorado 809 107 34 — — — — — 950 Colorado 1,301 595 104 — — — — — 2,000 Arkansas 2,808 — 184 — — 30 — 3 3,025 Mississippi 1,437 — 33 — — — — (1) 1,469 Illinois 762 — — — — — — — 762 (5) 80,681 — 96 94 54 — — (11) 80,914 Illinois 681 — — — — 9 — — 690 Arkansas 5,924 — 244 — — — — — 6,168 Mississippi 5,338 — 77 161 — — — — 5,576 Michigan 904 — 286 1,367 — — — — 2,557 Nebraska 1,232 — 56 — — — — — 1,288 Georgia 3,306 — 368 — — — — 2 3,676 Kansas & Colorado 1,915 — — — — — — — 1,915 Illinois 815 — — — — — — — 815 Georgia 475 — 53 — — — — — 528 Georgia 555 — 106 — — — — — 661 Nebraska 711 — 22 — — — — — 733 Colorado 236 — — — — — — — 236 $ 137,778 $ 1,328 $ 2,672 $ 1,695 $ 54 $ 106 $ (230) $ (49) $ 143,354
During the year ended December 31, 2016, the Company accounted for the acquisitions of the farms acquired on
February 18, April 10, April 30, October 1 and October 9 as a business combination. However, as historical results for the farms were not available the Company has not included unaudited pro forma financial information reflecting the pro forma results as if the farm had been acquired on January 1, 2015.
The unaudited pro forma information presented below does not purport to represent what the actual results of operations of the Company would have been had the business combinations outlined above occurred as of the beginning of the periods presented, nor does it purport to predict the results of operations of future periods.

Farmland Partners Inc. Notes to Consolidated Financial Statements (Continued)
F-25
The unaudited pro forma information is presented below as if the real estate acquired in business combinations during the year ended December 31, 2015 had been acquired on January 1, 2014. The following table does not include pro forma financial information for the farms acquired on February 18, April 10, April 30 and October 1, as historical results for the farms were not available. The unaudited pro forma financial information is presented below as if the farms acquired on June 12 and September 24 during the year ended December 31, 2014 had been acquired on January 1, 2013.
For the year ended December 31, ($ in thousands) 2015 2014 Pro forma Total operating revenues $ 13,917 $ 6,060 Net income (loss) $ 1,856 $ 997 Earnings per share basic and diluted Income (loss) per basic share attributable to common stockholders $ 0.10 $ 0.18 Income (loss) per diluted share attributable to common stockholders $ 0.10 $ 0.18 Weighted-average number of common shares - basic 9,619 4,265 Weighted-average number of common shares - diluted 9,629 4,386
Following the completion of the AFCO Mergers, properties in each of the locations listed in the table below became part of the Company’s portfolio.
State Total Approximate Acres Arkansas 1,445 California 430 California 478 California 786 California 854 California 1,247 California 265 California 623 California 244 California 91 California 610 California 239 California 243 California 185 Florida 2,694 Florida 625 Florida 1,637 Georgia / Alabama 1,840 Illinois 1,652 Illinois 434 Illinois 1,195 17,817

Farmland Partners Inc. Notes to Consolidated Financial Statements (Continued)
F-26
Note 6—Notes Receivable
In August 2015, the Company introduced an agricultural lending product aimed at farmers as a complement to the Company's business of acquiring and owning farmland and leasing it to farmers (the “FPI Loan Program”). Under the FPI Loan Program, the Company makes loans to third-party farmers (both tenant and non-tenant) to provide financing for working capital requirements and operational farming activities, farming infrastructure projects, and for other farming and agricultural real estate related projects. These loans are collateralized by farm real estate and are typically in principal amounts of $500,000 or more at fixed interest rates with maturities of up to three years. The Company expects the borrower to repay the loans in accordance with the applicable loan agreements based on farming operations and access to other forms of capital, as permitted. Notes receivable are stated at their unpaid principal balance, and include unamortized direct origination costs and accrued interest through the reporting date, less any allowance for losses and unearned borrower paid points.
As of December 31, 2016 and 2015, the Company held the following notes receivable:
($ in thousands) Principal Outstanding as of Loan Payment Terms December 31, 2016 December 31, 2015 Maturity Mortgage Note(1) Principal & interest due at maturity $ 1,800 $ 1,800 1/15/2017(4)
Mortgage Note
Year 1 interest paid at note issuance, with remaining principal & interest due at maturity 980 980 10/30/2017
Term Note(2) Principal & interest due at maturity - 50 2/2/2016 Total outstanding principal 2,780 2,830 Points paid, net of direct issuance costs (4) (10) Interest receivable (net prepaid interest)(3) 67 (8) Total notes and interest receivable $ 2,843 $ 2,812
(1) In January 2016 the maturity date of the note was extended from January 15, 2016 to January 15, 2017 with the year 1 interest received at the
time of the extension and principal and remaining interest due at maturity. The company has a commitment to fund an additional $200,000 under this mortgage, subject to meeting certain requirements by the borrower.
(2) The note, including all outstanding interest, was paid in full in January 2016. (3) Includes prepaid interest of $0, net of $67,600 of accrued interest receivable at December 31, 2016 and prepaid interest of $60,025, net of
$52,244 of accrued interest receivable at December 31, 2015. (4) The Company is in the process of negotiating an extension on this note.
The collateral for the mortgage notes receivable consists of real estate and improvements present on such real estate.
For income tax purposes the aggregate cost of the investment of the mortgage notes is the carrying amount per the table above. Fair Value
FASB ASC 820-10 establishes a three-level hierarchy for disclosure of fair value measurements. The valuation hierarchy is based upon the transparency of inputs to the valuation of an asset or liability as of the measurement date. The three levels are defined as follows:
Level 1—Inputs to the valuation methodology are quoted prices for identical assets or liabilities in active markets.
Level 2—Inputs to the valuation methodology include quoted prices for similar assets and liabilities in active
markets and inputs that are observable or can be substantially corroborated for the asset or liability, either directly or indirectly.
Level 3—Inputs to the valuation methodology are unobservable, supported by little or no market activity and are significant to the fair value measurement.
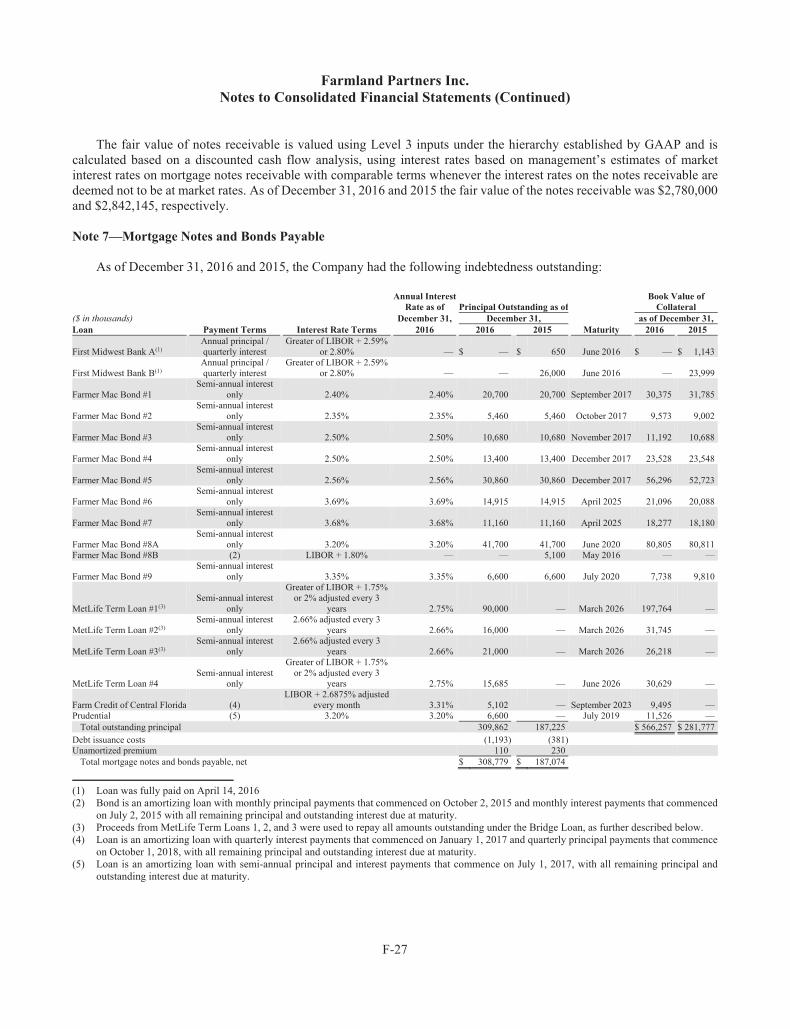
Farmland Partners Inc. Notes to Consolidated Financial Statements (Continued)
F-27
The fair value of notes receivable is valued using Level 3 inputs under the hierarchy established by GAAP and is
calculated based on a discounted cash flow analysis, using interest rates based on management’s estimates of market interest rates on mortgage notes receivable with comparable terms whenever the interest rates on the notes receivable are deemed not to be at market rates. As of December 31, 2016 and 2015 the fair value of the notes receivable was $2,780,000 and $2,842,145, respectively. Note 7—Mortgage Notes and Bonds Payable
As of December 31, 2016 and 2015, the Company had the following indebtedness outstanding:
Annual Interest
Book Value of
Rate as of Principal Outstanding as of
Collateral
($ in thousands)
December 31,
December 31,
as of December 31, Loan
Payment Terms
Interest Rate Terms
2016
2016
2015
Maturity
2016
2015
First Midwest Bank A(1)
Annual principal / quarterly interest
Greater of LIBOR + 2.59% or 2.80%
—
$ —
$ 650
June 2016
$ —
$ 1,143
First Midwest Bank B(1)
Annual principal / quarterly interest
Greater of LIBOR + 2.59% or 2.80%
—
—
26,000
June 2016
—
23,999
Farmer Mac Bond #1
Semi-annual interest only
2.40%
2.40%
20,700
20,700
September 2017
30,375
31,785
Farmer Mac Bond #2
Semi-annual interest only
2.35%
2.35%
5,460
5,460
October 2017
9,573
9,002
Farmer Mac Bond #3
Semi-annual interest only
2.50%
2.50%
10,680
10,680
November 2017
11,192
10,688
Farmer Mac Bond #4
Semi-annual interest only
2.50%
2.50%
13,400
13,400
December 2017
23,528
23,548
Farmer Mac Bond #5
Semi-annual interest only
2.56%
2.56%
30,860
30,860
December 2017
56,296
52,723
Farmer Mac Bond #6
Semi-annual interest only
3.69%
3.69%
14,915
14,915
April 2025
21,096
20,088
Farmer Mac Bond #7
Semi-annual interest only
3.68%
3.68%
11,160
11,160
April 2025
18,277
18,180
Farmer Mac Bond #8A
Semi-annual interest only
3.20%
3.20%
41,700
41,700
June 2020
80,805
80,811
Farmer Mac Bond #8B
(2)
LIBOR + 1.80%
—
—
5,100
May 2016
—
—
Farmer Mac Bond #9
Semi-annual interest only
3.35%
3.35%
6,600
6,600
July 2020
7,738
9,810
MetLife Term Loan #1(3)
Semi-annual interest only
Greater of LIBOR + 1.75% or 2% adjusted every 3
years
2.75%
90,000
—
March 2026
197,764
—
MetLife Term Loan #2(3)
Semi-annual interest only
2.66% adjusted every 3 years
2.66%
16,000
—
March 2026
31,745
—
MetLife Term Loan #3(3)
Semi-annual interest only
2.66% adjusted every 3 years
2.66%
21,000
—
March 2026
26,218
—
MetLife Term Loan #4
Semi-annual interest only
Greater of LIBOR + 1.75% or 2% adjusted every 3
years
2.75%
15,685
—
June 2026
30,629
—
Farm Credit of Central Florida
(4)
LIBOR + 2.6875% adjusted every month
3.31%
5,102
—
September 2023
9,495
—
Prudential
(5)
3.20%
3.20%
6,600
—
July 2019
11,526
— Total outstanding principal
309,862
187,225
$ 566,257
$ 281,777
Debt issuance costs
(1,193)
(381)
Unamortized premium
110
230
Total mortgage notes and bonds payable, net $ 308,779
$ 187,074
(1) Loan was fully paid on April 14, 2016 (2) Bond is an amortizing loan with monthly principal payments that commenced on October 2, 2015 and monthly interest payments that commenced
on July 2, 2015 with all remaining principal and outstanding interest due at maturity. (3) Proceeds from MetLife Term Loans 1, 2, and 3 were used to repay all amounts outstanding under the Bridge Loan, as further described below. (4) Loan is an amortizing loan with quarterly interest payments that commenced on January 1, 2017 and quarterly principal payments that commence
on October 1, 2018, with all remaining principal and outstanding interest due at maturity. (5) Loan is an amortizing loan with semi-annual principal and interest payments that commence on July 1, 2017, with all remaining principal and
outstanding interest due at maturity.

Farmland Partners Inc. Notes to Consolidated Financial Statements (Continued)
F-28
First Midwest Bank Indebtedness
On April 16, 2014, the Operating Partnership, as borrower, and First Midwest Bank, as lender, entered into the Amended and Restated Business Loan Agreement, which was subsequently amended on February 24, 2015, July 24, 2015 and March 6, 2016. Using proceeds from the MetLife Term Loans, as described below, this indebtedness was paid in full, including accrued interest, on April 14, 2016. Farmer Mac Facility
The Company and the Operating Partnership are parties to the Amended and Restated Bond Purchase Agreement, dated as of March 1, 2015 and amended as of June 2, 2015 and August 3, 2015 (the “Bond Purchase Agreement”), with Federal Agricultural Mortgage Corporation (“Farmer Mac”) and Farmer Mac Mortgage Securities Corporation, a wholly owned subsidiary of Farmer Mac, as bond purchaser (the “Purchaser”), regarding a secured note purchase facility (the “Farmer Mac Facility”) that has a maximum borrowing capacity of $165.0 million. Pursuant to the Bond Purchase Agreement, the Operating Partnership may, from time to time, issue one or more bonds to the Purchaser that will be secured by pools of mortgage loans, which will, in turn, be secured by first liens on agricultural real estate owned by the Company. The mortgage loans may have effective loan-to-value ratios of up to 60%, after giving effect to the overcollateralization obligations described below. Prepayment of each bond issuance is not permitted unless otherwise agreed upon by all parties to the Bond Purchase Agreement.
As of December 31, 2016 and December 31, 2015, the Operating Partnership had approximately $155.5 million and
approximately $160.6 million outstanding, respectively, under the Farmer Mac Facility. The Farmer Mac facility is subject to the Company’s ongoing compliance with a number of customary affirmative and negative covenants, as well as financial covenants, including: a maximum leverage ratio of not more than 60%; a minimum fixed charge coverage ratio of 1.50 to 1.00; and a minimum tangible net worth of $96,268,417. The Company was in compliance with all applicable covenants at December 31, 2016.
In connection with the Bond Purchase Agreement, on March 1, 2015, the Company and the Operating Partnership also entered into an amended and restated pledge and security agreement (the “Pledge Agreement”) in favor of the Purchaser and Farmer Mac, pursuant to which the Company and the Operating Partnership agreed to pledge, as collateral for the Farmer Mac Facility, all of their respective right, title and interest in (i) mortgage loans with a value at least equal to 100% of the aggregate principal amount of the outstanding bond held by the Purchaser and (ii) such additional collateral as necessary to have total collateral with a value at least equal to 110% of the outstanding notes held by the Purchaser. In addition, the Company agreed to guarantee the full performance of the Operating Partnership’s duties and obligations under the Pledge Agreement.
The Bond Purchase Agreement and the Pledge Agreement include customary events of default, the occurrence of any of which, after any applicable cure period, would permit the Purchaser and Farmer Mac to, among other things, accelerate payment of all amounts outstanding under the Farmer Mac Facility and to exercise its remedies with respect to the pledged collateral, including foreclosure and sale of the agricultural real estate underlying the pledged mortgage loans.
On June 2, 2015, Farmer Mac issued a refund under the bonds issued during 2014 of $300,000. The refund is being
accounted for as a debt premium and is being amortized against interest expense using the straight-line method over the remaining terms of the underlying bonds issued in 2014.
Bridge Loan
On February 29, 2016, two wholly owned subsidiaries of the Operating Partnership (together, the “Bridge Borrower”) entered into a term loan agreement (the “Bridge Loan Agreement”) with MSD FPI Partners, LLC, an affiliate of MSD Partners, L.P. (the “Bridge Lender”), that provided for a loan of $53.0 million (the “Bridge Loan”), the proceeds of which were used primarily to fund the cash portion of the consideration for the acquisition of the Forsythe farms, which was

Farmland Partners Inc. Notes to Consolidated Financial Statements (Continued)
F-29
completed on March 2, 2016. During the year ended December 31, 2016, the Company accrued and paid debt issuance costs on the Bridge Loan totaling $173,907 and interest totaling $2,271,867, of which $2,120,000, or 4.0%, of the Bridge Loan's principal amount was considered additional interest paid as discount on issuance. The Bridge Loan was paid in full, including accrued interest, and without prepayment penalty, on March 29, 2016 using proceeds from the MetLife Term Loans, as described below. MetLife Term Loans
On March 29, 2016, five wholly owned subsidiaries of the Operating Partnership entered into a loan agreement (the “First MetLife Loan Agreement”) and, together with the Second MetLife Loan Agreement, the “Metlife Loan Agreements”) with MetLife, which provides for a total of $127.0 million of term loans, comprised of (i) a $90.0 million term loan (“Term Loan 1”), (ii) a $16.0 million term loan (“Term Loan 2”) and (iii) a $21.0 million term loan (“Term Loan 3” and, together with Term Loan 1 and Term Loan 2, the “Initial MetLife Term Loans” and, together with Term Loan 4, the “Metlife Term Loans”). The proceeds of the Initial MetLife Term Loans were used to repay existing debt (including amounts outstanding under the Bridge Loan), to acquire additional properties and for general corporate purposes. Each Initial MetLife Term Loan matures on March 29, 2026 and is collateralized by first lien mortgages on certain of the Company’s properties.
On June 29, 2016, five wholly owned subsidiaries of the Operating Partnership, entered into a loan agreement (the
“Second MetLife Loan Agreement”) with Metropolitan Life Insurance Company (“Metlife”) which provides for a loan of approximately $15.7 million to the Company with a maturity date of June 29, 2026 (“Term Loan 4”). Interest on Term Loan 4 is payable in cash semi-annually and accrues at a floating rate that will be adjusted quarterly to a rate per annum equal to the greater of (a) the three-month LIBOR plus an initial floating rate spread of 1.750%, which may be adjusted by MetLife on each of September 29, December 29, March 29 and June 29 of each year to an interest equal to the greater of (a) the three month LIBOR plus the floating rate spread or (b) 2.00% per annum. Term Loan 4 initially bears interest at a rate of 2.39% per annum until September 29, 2016, and on September 29, 2016 the rate changed to 2.60% per annum. Proceeds from Term Loan 4 were used to acquire additional properties and for general corporate purposes.
Interest on Term Loan 1 is payable in cash semi-annually and accrues at a floating rate that will be adjusted quarterly to a rate per annum equal to the greater of (a) the three-month LIBOR plus an initial floating rate spread of 1.750%, which may be adjusted by MetLife on each of March 29, 2019, March 29, 2022 and March 29, 2025 to an interest rate consistent with interest rates quoted by MetLife for substantially similar loans secured by real estate substantially similar to the Company’s properties securing Term Loan 1 or (b) 2.000% per annum. Term Loan 1 bore interest at a rate of 2.40% per annum until September 29, 2016, and on September 29, 2016 the rate changed to 2.60% per annum. Subject to certain conditions, the Company may at any time during the term of Term Loan 1 elect to have all or any portion of the unpaid balance of Term Loan 1 bear interest at a fixed rate that is initially established by the lender in its sole discretion that may be adjusted from time to time to an interest rate consistent with interest rates quoted by MetLife for substantially similar loans secured by real estate substantially similar to the Company’s properties securing Term Loan 1. On any floating rate adjustment date, the Company may prepay any portion of Term Loan 1 that is not subject to a fixed rate without penalty.
Interest on Term Loan 2 and Term Loan 3 is payable in cash semi-annually and accrues at an initial rate of 2.66% per annum, which may be adjusted by MetLife on each of March 29, 2019, March 29, 2022 and March 29, 2025 to an interest rate consistent with interest rates quoted by MetLife for substantially similar loans secured by real estate substantially similar to the Company’s properties securing Term Loan 2 and Term Loan 3.
Subject to certain conditions, amounts outstanding under Term Loan 2 and Term Loan 3, as well as any amounts
outstanding under Term Loan 1 that are subject to a fixed interest rate, may be prepaid without penalty up to 20% of the original principal amounts of such loans per year or in connection with any rate adjustments. Any other prepayments under the Initial MetLife Term Loans generally are subject to a minimum prepayment premium of 1.00%.

Farmland Partners Inc. Notes to Consolidated Financial Statements (Continued)
F-30
In connection with the Initial MetLife Term Loans, on March 29, 2016, the Company and the Operating Partnership each entered into a separate guaranty (the “Initial MetLife Guaranties”) whereby the Company and the Operating Partnership jointly and severally agreed to unconditionally guarantee all of the borrowers’ obligations under the First MetLife Loan Agreement.
In connection with the Term Loan 4, on June 29, 2016, the Company and the Operating Partnership each entered into a separate guaranty (the “Term Loan 4 Guaranties” and, together with the Initial MetLife Guaranties, the “MetLife Guaranties”) whereby the Company and the Operating Partnership jointly and severally agreed to unconditionally guarantee all of the borrowers’ obligations under the Second MetLife Loan Agreement.
Each of the MetLife Loan Agreements contains a number of customary affirmative and negative covenants, including the requirement to maintain a loan to value ratio of no greater than 60%. The MetLife Guarantie(s) also contain a number of customary affirmative and negative covenants. The Company was in compliance with all covenants at December 31, 2016.
Each of the MetLife Loan Agreements includes certain customary events of default, including a cross-default provision related to other outstanding indebtedness of the borrowers, the Company and the Operating Partnership, the occurrence of which, after any applicable cure period, would permit MetLife, among other things, to accelerate payment of all amounts outstanding under the MetLife Term Loans and to exercise its remedies with respect to the pledged collateral, including foreclosure and sale of the Company’s properties that secure the MetLife Term Loans. Farm Credit of Central Florida Mortgage Note
On August 31, 2016, a wholly owned subsidiary of the Operating Partnership entered into a loan agreement (the “Farm Credit Mortgage Note”) with Farm Credit of Central Florida (“Farm Credit”) which provides for a loan of approximately $8.2 million to the Company with a maturity date of September 1, 2023. As of December 31, 2016 approximately $5.1 million had been drawn down under this facility. Interest on Farm Credit Mortgage Note is payable in cash quarterly and accrues at a floating rate that will be adjusted monthly to a rate per annum equal to the one-month LIBOR plus 2.6875% provided that the interest rate shall be subject to adjustment on the first day of September 2016, and on the first day of each month thereafter. Principal is payable quarterly commencing on October 1, 2018, with all remaining principal and outstanding interest due at maturity. Proceeds from Farm Credit Mortgage Note are to be used for the acquisition and development of additional land.
The Farm Credit Mortgage Note contains a number of customary affirmative and negative covenants, as well as a
covenant requiring the Company to maintain a debt service coverage ratio of 1.25 to 1.00 beginning on December 31, 2019. Prudential Loans
On December 21, 2016, a wholly owned subsidiary of the Operating Partnership entered into a loan agreement with The Prudential Insurance Company of America (“Prudential”) which provides for a loan of approximately $6.6 million to the Company with a maturity date of July 1, 2019 (the “Prudential Note”). Interest on the Prudential Note is payable in cash semi-annually and accrues at a fixed rate of 3.20% per annum. Proceeds from Prudential Note were used for the acquisition of additional land.
The Prudential Loan requires the Compay to maintain a loan to value no greater than 60%. The covenant commences
from the anniversary of the loan, being December 21, 2017.

Farmland Partners Inc. Notes to Consolidated Financial Statements (Continued)
F-31
Aggregate Maturities
As of December 31, 2016, aggregate maturities of long-term debt for the succeeding years are as follows:
($ in thousands) Year Ending December 31, Future Maturities 2017 $ 81,218 2018 306 2019 6,518 2020 48,575 2021 275 Thereafter 172,970 $ 309,862
Fair Value
The fair value of the mortgage notes payable is valued using Level 3 inputs under the hierarchy established by GAAP and is calculated based on a discounted cash flow analysis, using interest rates based on management’s estimates of market interest rates on long-term debt with comparable terms whenever the interest rates on the mortgage notes payable are deemed not to be at market rates. As of December 31, 2016 and 2015, the fair value of the mortgage notes payable was $300,105,547 and $185,171,599, respectively. During 2017, $81.2 million of our borrowings will mature. The Company anticipates refinancing the debt due to mature in 2017 with the same or similar financial institutions and we are currently in discussions with an existing lender to do so. However, we can provide no assurances that we will be able to refinance the debt on similar terms or at all and thus alternative sources of capital may be necessary. To date, no such capital sources have been identified.
Note 8—Commitments and Contingencies
The Company is not currently subject to any known material contingencies arising from its business operations, nor to any material known or threatened litigation.
In April 2015, the Company entered into a lease agreement for office space. The lease expires July 31, 2019. The lease commenced June 1, 2015 and had an initial monthly payment of $10,032 which increased to $10,200 in June 2016 with annual increases thereafter. As of December 31, 2016, future minimum lease payments are as follows:
($ in thousands) Future RentalYear Ending December 31, Payments 2017 $ 124 2018 126 2019 74 $ 324
A sale of any of the Contributed Properties that would not provide continued tax deferral to Pittman Hough Farms is
contractually restricted until the fifth (with respect to certain properties) or seventh (with respect to certain other properties) anniversary of the completion of the formation transactions, on April 16, 2014. Furthermore, if any such sale or defeasance is foreseeable, the Company is required to notify Pittman Hough Farms and to cooperate with it in considering strategies to defer or mitigate the recognition of gain under the Code by any of the equity interest holders of the recipient of the OP units.

Farmland Partners Inc. Notes to Consolidated Financial Statements (Continued)
F-32
On August 31, 2016, the Company entered into a lease agreement in which the Company agreed to convert the Ironwood Farm from its current condition to the maximum number of acres of center-pivot irrigated farmland. As of December 31, 2016, future capital commitments associated with the conversion are as follows:
($ in thousands) Future CapitalYear Ending December 31, Commitments 2017 $ 4,648 2018 845 $ 5,493
As of December 31, 2016 the Company had the following properties under contract (other than the AFCO properties).
The two Illinois farms and the South Carolina farm acquisitions closed on January 13, 2017, February 14, 2017 and February 21, 2017, respectively.
Total ($ in thousands) Approximate State Acres Purchase Price Illinois(1) 321 $ 3,360 Illinois 8,452 54,263 South Carolina 144 529
8,917 $ 58,152
(1) The consideration consisted entirely of OP units.
See “Note 11—Subsequent Events” for properties put under contract subsequent to December 31, 2016.
Note 9—Stockholders’ Equity and Non-controlling Interests
Under the Company's articles of incorporation, the total number of shares initially authorized for issuance was 1,000 shares of common stock, $0.01 par value per share. On December 5, 2013, the Company issued 1,000 shares of common stock to its sole stockholder at $1.00 per share in connection with the initial capitalization of the Company. The shares were repurchased by the Company on April 18, 2014 for $1.00 per share.
On March 24, 2014, the Company amended and restated its articles of incorporation to authorize the issuance of up
to 500.0 million shares of common stock. Upon completion of the IPO, on April 16, 2014, the Company had 500.0 million shares of common stock authorized, 3.8 million shares of common stock issued and outstanding, including 0.2 million unvested restricted shares of common stock.
On April 16, 2014, the Company completed the IPO and the FP Land Merger. The IPO resulted in the sale of 3.8
million shares of common stock at a price per share of $14.00 and generated gross proceeds of $53.2 million. The aggregate net proceeds to the Company, after deducting the underwriting discount and commissions and expenses payable by the Company, were approximately $48.0 million. The Company contributed the net proceeds from the IPO to the Operating Partnership in exchange for OP units. The Operating Partnership used the net proceeds from the IPO as follows: (i) approximately $12.0 million to repay outstanding indebtedness, of which $0.8 million had been advanced by Pittman Hough Farms and was reimbursed to Pittman Hough Farms with a portion of the net proceeds from the IPO; and (ii) approximately $0.1 million (exclusive of the $0.8 million that was reimbursed for amounts advanced by Pittman Hough Farms to repay certain indebtedness) to reimburse Pittman Hough Farms for amounts advanced or incurred in connection with the IPO and related formation transactions. The Operating Partnership used the remaining net proceeds for general corporate purposes, including working capital and acquisitions.
On July 30, 2014, the Company completed an underwritten public offering of 3.7 million shares of common stock at a price per share of $12.50 and generated gross proceeds of approximately $46.5 million. The aggregate net proceeds to the Company, after deducting the underwriting discount and commissions and expenses payable by the Company, were

Farmland Partners Inc. Notes to Consolidated Financial Statements (Continued)
F-33
approximately $43.3 million. The Company contributed the net proceeds to the Operating Partnership in exchange for OP units.
On July 21, 2015, the Company completed an underwritten public offering, pursuant to which the Company sold 3.0 million shares of common stock, and upon the underwriter’s partial exercise of their option to purchase additional shares, issued an additional 360,000 shares at a price per share of $11.00 and generated gross proceeds of $37.0 million. The aggregate net proceeds to the Company, after deducting the underwriting discount and commissions and expenses payable by the Company, were $34.6 million.
On September 15, 2015, the Company entered into equity distribution agreements and filed a prospectus supplement under which it may sell shares of common stock having an aggregate gross sales price of up to $25.0 million through an “at-the-market” equity offering program. The offering is being made pursuant to a shelf registration statement on Form S-3 that was declared effective by the Securities and Exchange Commission on May 14, 2015. As of December 31, 2016 1.0 million shares had been issued under the program for a net consideration of $11.0 million.
On November 30, 2016, the Company agreed to sell 3.1 million shares of its common stock at a $0.01 par value per
share, at a public offering price of $11.25 per share and generated gross proceeds of $33.3 million. The aggregate net proceeds to the Company, after deducting fees payable by the Company, were $32.9 million. Pursuant to the terms of the Underwriting Agreement, the Company granted the Underwriters a 30-day option to purchase up to an additional 0.5 million shares of common stock, which was not exercised. The common stock was offered and sold pursuant to a prospectus supplement, dated November 30, 2016, and a base prospectus, dated May 14, 2015 relating to the Company’s effective shelf registration statement on Form S-3.
As of December 31, 2016 and 2015, the Company had 23.0 million and 16.2 million, respectively, fully diluted outstanding shares, including OP units and restricted shares of common stock. Non-controlling Interest in Operating Partnership
The Company consolidates its Operating Partnership, a majority-owned partnership. As of December 31, 2016, the Company owned 75.1% of the outstanding OP units and the remaining 24.9% of the OP units are included in non-controlling interest in Operating Partnership on the consolidated balance sheets.
On or after 12 months after becoming a holder of Class A common OP units, each limited partner, other than the Company, has the right, subject to the terms and conditions set forth in the partnership agreement of the Operating Partnership, to tender for redemption all or a portion of such units in exchange for a cash amount equal to the number of tendered units multiplied by the fair market value of a share of the Company’s common stock (determined in accordance with, and subject to adjustment under, the terms of the partnership agreement of the Operating Partnership), unless the terms of such units or a separate agreement entered into between the Operating Partnership and the holder of such units provide that they do not have a right of redemption or provide for a shorter or longer period before such holder may exercise such right of redemption or impose conditions on the exercise of such right of redemption. On or before the close of business on the tenth business day after the Company receives a notice of redemption, the Company may, as the parent of the general partner, in its sole and absolute discretion, but subject to the restrictions on the ownership of common stock imposed under the Company’s charter and the transfer restrictions and other limitations thereof, elect to acquire some or all of the tendered units in exchange for cash or shares of the Company’s common stock, based on an exchange ratio of one share of common stock for each OP unit (subject to anti-dilution adjustments provided in the partnership agreement). As of December 31, 2016, there were 3.0 million outstanding OP units eligible to be tendered for redemption.
If the Company gives the limited partners notice of its intention to make an extraordinary distribution of cash or property to its stockholders or effect a merger, a sale of all or substantially all of its assets, or any other similar extraordinary transaction, each limited partner may exercise its right to tender its OP units for redemption, regardless of the length of time such limited partner has held its OP units.

Farmland Partners Inc. Notes to Consolidated Financial Statements (Continued)
F-34
Regardless of the rights described above, the Operating Partnership will not have an obligation to issue cash to a
unitholder upon a redemption request if the Company elects to redeem the OP units for shares of common stock. When a an OP unit is redeemed, non-controlling interest in the Operating Partnership is reduced and stockholders’ equity is increased.
The Operating Partnership intends to make distributions on each OP unit in the same amount as those paid on each share of the Company’s common stock, with the distributions on the OP units held by the Company being utilized to make distributions to the Company’s common stockholders.
Pursuant to the consolidation accounting standard with respect to the accounting and reporting for non-controlling interest changes and changes in ownership interest of a subsidiary, changes in parent’s ownership interest when the parent retains controlling interest in the subsidiary should be accounted for as equity transactions. The carrying amount of the non-controlling interest shall be adjusted to reflect the change in its ownership interest in the subsidiary, with the offset to equity attributable to the parent. As a result of equity transactions including and subsequent to the IPO, changes in the ownership percentages between the Company’s stockholders’ equity and non-controlling interest in the Operating Partnership occurred during the three years ended December 31, 2016. To reflect these changes, adjustments were made to increase / (decrease) the non-controlling interest in the Operating Partnership by $3.4 million, $0.8 million, and ($23.0) million during the years ended December 31, 2016, 2015 and 2014 respectively, with the corresponding offsets to additional paid-in capital.
Redeemable Non-controlling Interest in Operating Partnership, Class A Common Units
On June 2, 2015, the Company issued 2.0 million OP units in conjunction with an asset acquisition. Beginning on June 2, 2016, the OP units became eligible to be tendered for redemption for cash, or at the Company’s option, for shares of common stock on a one for one basis. In connection with its annual meeting of stockholders held on May 25, 2016, the Company obtained stockholder approval to issue shares of its common stock upon the redemption of 0.9 million of the OP units (the “Excess Units”). Prior to such stockholder approval, the Company would have been required to redeem the Excess Units for cash. As the tender for redemption of the Excess Units for shares of common stock was outside of the control of the Company until May 25, 2016, these units were accounted for as mezzanine equity on the consolidated balance sheets as of December 31, 2015. After the redemption became within the control of the Company these excess units formed part of the non-controlling interests in the Operating Partnership. The Company elected to accrete the change in redemption value of the Excess Units subsequent to issuance and during the respective 12-month holding period, after which point the units were marked to redemption value at each reporting period.
Redeemable Non-controlling Interests in Operating Partnership, Preferred Units
On March 2, 2016, the sole general partner of the Operating Partnership entered into Amendment No. 1 (the “Amendment”) to the Partnership Agreement in order to provide for the issuance, and the designation of the terms and conditions, of the Preferred units. Under the Amendment, among other things, each Preferred unit has a $1,000 liquidation preference and is entitled to receive cumulative preferential cash distributions at a rate of 3.00% per annum of the $1,000 liquidation preference, which is payable annually in arrears on January 15 of each year or the next succeeding business day. The cash distributions are accrued ratably over the year and credited to redeemable non-controlling interest in operating partnership, preferred units on the balance sheet with the offset recorded to additional paid-in capital. On March 2, 2016, 0.1 million Preferred units were issued as partial consideration in the Forsythe farm acquisition (See “Note 5—Real Estate”). Upon any voluntary or involuntary liquidation or dissolution, the Preferred units are entitled to a priority distribution ahead of OP units in an amount equal to the liquidation preference plus an amount equal to all distributions accumulated and unpaid to the date of such cash distribution. Total liquidation value of such preferred units as of December 31, 2016 was $119.9 million including accrued distributions.

Farmland Partners Inc. Notes to Consolidated Financial Statements (Continued)
F-35
On or after March 2, 2026, the tenth anniversary of the closing of the Forsythe acquisition (the “Conversion Right Date”), holders of the Preferred units have the right to convert each Preferred unit into a number of OP units equal to (i) the $1,000 liquidation preference plus all accrued and unpaid distributions, divided by (ii) the volume-weighted average price per share of the Company’s common stock for the 20 trading days immediately preceding the applicable conversion date. All OP units received upon conversion may be immediately tendered for redemption for cash or, at the Company’s option, for shares of common stock on a one-for-one basis, subject to the terms and conditions set forth in the Partnership Agreement. Prior to the Conversion Right Date, the Preferred units may not be tendered for redemption by the Holder.
On or after March 2, 2021, the fifth anniversary of the closing of the Forsythe acquisition, but prior to the Conversion
Right Date, the Operating Partnership has the right to redeem some or all of the Preferred units, at any time and from time to time, for cash in an amount per unit equal to the $1,000 liquidation preference plus all accrued and unpaid distributions.
In the event of a Termination Transaction (as defined in the Partnership Agreement) prior to conversion, holders of the Preferred units generally have the right to receive the same consideration as holders of OP units and common stock, on an as-converted basis.
Holders of the Preferred units have no voting rights except with respect to (i) the issuance of partnership units of the
Operating Partnership senior to the Preferred units as to the right to receive distributions and upon liquidation, dissolution or winding up of the Operating Partnership, (ii) the issuance of additional Preferred units and (iii) amendments to the Partnership Agreement that materially and adversely affect the rights or benefits of the holders of the Preferred units.
The Preferred units will convert into a variable number of Common Shares and the Company does not control whether
it will have enough shares authorized to issue shares at the time of conversion. Therefore, the Preferred Units are accounted for as mezzanine equity on the consolidated balance sheet.
The following table summarizes the changes in our redeemable non-controlling interest in the Operating Partnership for the years ended December 31, 2016 and 2015:
Common Preferred
($ in thousands)
Redeemable OP Units
Redeemable Non-
controlling Interests
Redeemable OP Units
Redeemable Non-
controlling Interests
Balance at December 31, 2014 — $ — — $ — Issuance of redeemable OP units as partial consideration for real estate acquisition 884 9,694 — — Net income attributable to non-controlling interest — 102 — — Accrued distributions to non-controlling interest — (338) — — Adjustment to arrive at fair value of redeemable non-controlling interest — 236 — — Balance at December 31, 2015 884 $ 9,694 — $ — Issuance of redeemable OP units as partial consideration for real estate acquisition — — 117 117,000 Net income attributable to non-controlling interest — (64) — — Accrued distributions to non-controlling interest — (113) — 2,915 Conversion of OP units to common stock (884) (9,517) — — Balance at December 31, 2016 — $ — 117 $ 119,915

Farmland Partners Inc. Notes to Consolidated Financial Statements (Continued)
F-36
Distributions The Company’s Board of Directors declared and paid the following distributions to common stockholders and holders
of OP units for the years ended December 31, 2016, 2015 and 2014:
Fiscal Year Declaration Date Record Date Payment Date
Distributions per Common Share/OP unit
2016 March 8, 2016 April 1, 2016 April 15, 2016 $ 0.1275 May 9, 2016 July 1, 2016 July 15, 2016 0.1275 August 3, 2016 September 30, 2016 October 14, 2016 0.1275 November 3, 2016 January 2, 2017 January 13, 2017 0.1275 $ 0.5100 2015 February 25, 2015 April 1, 2015 April 15, 2015 $ 0.1160 June 2, 2015 July 1, 2015 July 15, 2015 0.1275 August 12, 2015 October 1, 2015 October 15, 2015 0.1275 November 20, 2015 January 4, 2016 January 15, 2016 0.1275 $ 0.4985 2014 May 14, 2014 July 1, 2014 July 15, 2014 $ 0.1050 August 5, 2014 October 1, 2014 October 15, 2014 0.1050 November 20, 2014 January 2, 2015 January 15, 2015 0.1160 $ 0.3260
Additionally, in connection with the 3.00% cumulative preferential distribution on the Preferred units, the Company
has accrued $2.9 million in distributions payable as of December 31, 2016 which was paid on January 17, 2016. The distributions are payable annually in arrears on January 15 of each year.
In general, common stock cash dividends declared by the Company will be considered ordinary income to
stockholders for income tax purposes. From time to time, a portion of the Company’s dividends may be characterized as capital gains or return of capital. During the year ended December 31, 2016, 100% of the income distributed in the form of dividends was characterized as ordinary income.
Stock Repurchase Plan
On October 29, 2014, the Company announced that the Board of Directors approved a program to repurchase up to $10.0 million in shares of the Company’s common stock. Repurchases under this program may be made from time to time, in amounts and prices as the Company deems appropriate. Repurchases may be made in open market or privately negotiated transactions in compliance with Rule 10b-18 under the Securities Exchange Act of 1934, as amended, subject to market conditions, applicable legal requirements, trading restrictions under the Company’s insider trading policy and other relevant factors. This stock repurchase plan does not obligate the Company to acquire any particular amount of common stock, and it may be modified or suspended at any time at the Company's discretion. The Company expects to fund repurchases under the program using cash on hand. During the year ended 2015, the Company had repurchased 2,130 shares at an average price per share of $9.81 for a total cost of $20,932, including fees. Equity Incentive Plan
On May 5, 2015, the Company’s stockholders approved the Amended and Restated 2014 Equity Incentive Plan (as
amended and restated, the “Plan”), which increased the aggregate number of shares of the Company’s common stock reserved for issuance under the Plan to 0.6 million shares. As of December 31, 2016, there were 0.3 million of shares available for future grants under the Plan.

Farmland Partners Inc. Notes to Consolidated Financial Statements (Continued)
F-37
The Company may issue equity-based awards to officers, employees, independent contractors and other eligible
persons under the Plan. The 2014 Plan provides for the grant of stock options, share awards (including restricted stock and restricted stock units), stock appreciation rights, dividend equivalent rights, performance awards, annual incentive cash awards and other equity based awards, including LTIP units, which are convertible on a one-for-one basis into OP units. The 2014 Plan provides for a maximum of 0.2 million shares of common stock for issuance. The terms of each grant are determined by the Compensation Committee of the Board of Directors.
From time to time, the Company may award non-vested shares under the Plan as compensation to officers, employees,
non-employee directors and non-employee contractors. The shares vest over a period of time as determined by the Compensation Committee of the Board of Directors at the date of grant. The Company recognizes compensation expense for awards issued to officers, employees and non-employee directors for non-vested shares on a straight-line basis over the vesting period based upon the fair market value of the shares on the date of issuance, adjusted for forfeitures. The Company recognizes compensation expense for awards issued to non-employee consultants in the same period and in the same manner as if the Company paid cash for the underlying services.
During 2016 the Company granted 0.1 million restricted shares of common stock, with an aggregate grant date fair value of $1.3 million, to employees and directors. The restricted shares vest ratably over a three or five-year vesting period, subject to continued service. During 2015 the Company granted 0.01 million restricted shares of common stock, with an aggregate grant date fair value of $0.1 million, to employees and newly appointed directors. The restricted shares vest ratably over a three vesting period, subject to continued service. During 2014 the Company granted 0.2 million restricted shares of common stock, with an aggregate grant date fair value of $3.0 million, to employees and directors. The restricted shares vest ratably over a three vesting period, subject to continued service.
Concurrently with the completion of the IPO, on April 16, 2014, the Company granted an aggregate of 214,283
restricted shares of common stock, having an aggregate grant date fair value of $3,000,000 (calculated as the number of shares granted multiplied by the stock price on date of grant), to the Company’s non-independent directors (Paul Pittman, Luca Fabbri, the Company’s Chief Financial Officer) and Jesse J. Hough (the Company’s consultant). Each of the restricted stock grants vests ratably over a three-year vesting period, subject to continued service with the Company.
The restricted shares granted to Mr. Hough are recognized as expense over the period that services are received. The change in fair value of the shares to be issued upon vesting is remeasured at each reporting period and is recorded in general and administrative expenses on the combined consolidated statement of operations
During 2016, 5,032 restricted shares of common stock were forfeited by independent directors and employees. The
Company had recorded $4,167 in stock based compensation and paid $815 in dividends with respect to such restricted shares. In connection with the forfeiture of restricted shares, the Company reversed $3,352 in previously recorded compensation expense, net of the dividends paid. During 2015, 8,312 restricted shares of common stock were forfeited by independent directors and employees. The Company had recorded $18,231 in stock based compensation and paid $2,541 in dividends with respect to such restricted shares. In connection with the forfeiture of restricted shares, the Company reversed $15,690 in previously recorded compensation expense, net of the dividends paid. There were no forfeitures for the year ended December 31, 2014.

Farmland Partners Inc. Notes to Consolidated Financial Statements (Continued)
F-38
A summary of the non-vested restricted shares as of December 31, 2016 and 2015 is as follows:
Weighted Number of Average Grant Shares Date Fair Value Unvested at January 1, 2014 — $ — Granted 214 14.00 Vested — — Forfeited — — Unvested at December 31, 2014 214 14.00 Granted 9 10.83 Vested (70) 14.00 Forfeited (8) 12.63 Unvested at December 31, 2015 145 13.87 Granted 119 10.78 Vested (70) 13.96 Forfeited (5) 11.09 Unvested at December 31, 2016 189 $ 11.98
For the years ended December 31, 2016, 2015 and 2014, the Company recognized $1.2 million, $0.9 million and $0.7
million, respectively, of stock-based compensation expense related to these restricted stock awards. As of December 31, 2016, 2015 and 2014, there was $1.2 million, $1.2 million and $2.1 million, respectively, of total unrecognized compensation costs related to non-vested stock awards which are expected to be recognized over weighted-average periods of 1.9 years. Earnings per Share
The computation of basic and diluted earnings (loss) per share is as follows:
For the year ended December 31, ($ in thousands)
2016
2015
2014
Numerator:
Net income (loss) attributable to Farmland Partners Inc.
$ 4,302
$ 1,227
$ (568)
Less: Nonforfeitable distributions allocated to unvested restricted shares
(96)
(80)
(70)Less: Distributions on redeemable non-controlling interersts in operating partnership
(113)
(338)
—
Less: Distributions on redeemable non-controlling interests in operating partnership, preferred
(2,915)
—
— Net (loss) income attributable to common stockholders
$ 1,178
$ 809
$ (638)
Denominator:
Weighted-average number of common shares - basic
13,204
9,619
4,265
Conversion of preferred units(1)
—
—
— Unvested restricted shares(1)
—
10
—
Weighted-average number of common shares - diluted
13,204
9,629
4,265
Income (loss) per share attributable to common stockholders - basic
$ 0.09
$ 0.08
$ (0.15)
Income (loss) per share attributable to common stockholders - diluted $ 0.09
$ 0.08
$ (0.15)
(1) Anti-dilutive for the year ended December 31, 2016.
The limited partners’ outstanding OP units (which may be redeemed for shares of common stock) and Excess Units
have been excluded from the diluted earnings per share calculation as there would be no effect on the amounts since the limited partners’ share of income would also be added back to net income. Any anti-dilutive shares have been excluded from the diluted earnings per share calculation. Unvested share-based payment awards that contain non-forfeitable rights to dividends or dividend equivalents (whether paid or unpaid) are participating securities and shall be included in the computation of earnings per share pursuant to the two-class method. Accordingly, distributed and undistributed earnings

Farmland Partners Inc. Notes to Consolidated Financial Statements (Continued)
F-39
attributable to unvested restricted shares (participating securities) have been excluded, as applicable, from net income or loss attributable to common stockholders utilized in the basic and diluted earnings per share calculations. Net income or loss figures are presented net of non-controlling interests in the earnings per share calculations. The weighted average number of OP units held by the non-controlling interest was 5.4 million and 2.8 million for the years ended December 31, 2016 and 2015, respectively. The weighted average number of Excess Units held by the non-controlling interest was 0.4 million for the year ended December 31, 2016. There were 0.5 million Excess Units outstanding during the year ended December 31, 2015.
For the year ended December 31, 2016, diluted weighted average common shares do not include the impact of 0.2 million shares of unvested compensation-related shares because the effect of these items on diluted earnings per share would be anti-dilutive. There were no anti-dilutive shares for the year ended December 31, 2015.
The following equity awards and units are outstanding as of December 31, 2016, 2015 and 2014, respectively.
(in thousands) December 31, 2016 December 31, 2015 December 31, 2014 Shares 17,163 11,834 7,517 OP Units 5,692 3,294 1,945 Redeemable OP Units — 884 — Unvested Restricted Stock Awards 188 145 214 23,043 16,157 9,676
Note 10—Quarterly Financial Information (unaudited)
The following table reflects the quarterly results of operations for the years ended December 31, 2016 and 2015.
Quarter Ended ($ in thousands) March 31, 2016 June 30, 2016 September 30, 2016 December 31, 2016Operating revenues $ 4,692 $ 6,031 $ 6,946 $ 13,332 Operating expenses 2,796 2,797 4,756 5,020 Other expenses 3,826 1,917 1,993 1,886 Net (loss) income before income tax (1,930) 1,317 197 6,426 Income tax expense — — 97 (86)Net (loss) income $ (1,930) $ 1,317 $ 100 $ 6,512 Net (loss) available to common stockholders of Farmland Partners Inc. $ (1,780) $ (38) $ (841) $ 3,837 Basic net (loss) per share available to common stockholders(1) $ (0.15) $ — $ (0.06) $ 0.26 Diluted net (loss) per share available to common stockholders(1) $ (0.15) $ — $ (0.06) $ 0.18 Basic weighted average common shares outstanding 11,834 12,452 13,683 14,817 Diluted weighted average common shares outstanding 11,834 12,452 13,683 25,494
(1) The basic and diluted net (loss) income for the quarters do not equal full year results due to issuance of common stock throughout the year and rounding.
Quarter Ended ($ in thousands) March 31, 2015 June 30, 2015 September 30, 2015 December 31, 2015Operating revenues $ 2,103 $ 2,884 $ 4,170 $ 4,599 Operating expenses 1,527 1,670 2,015 2,327 Other expenses 773 1,069 1,293 1,383 Net (loss) income before income tax (197) 145 862 889 State income tax expense — — 4 6 Net (loss) income $ (197) $ 145 $ 858 $ 883 Net (loss) income available to common stockholders of Farmland Partners Inc. $ (181) $ (24) $ 492 $ 522

Farmland Partners Inc. Notes to Consolidated Financial Statements (Continued)
F-40
Note 11—Subsequent Events
We have evaluated subsequent events and transactions for potential recognition or disclosure in the financial statements through February 23, 2017, the day the financial statements were issued.
See “Note 8—Commitments and Contingencies” for real estate acquisitions that occurred subsequent to December 31, 2016. MetLife Loans
On January 12, 2017, five wholly owned subsidiaries of the Operating Partnership, entered into a loan agreement (the “Fifth MetLife Loan Agreement”) with Metlife which provides for a loan of approximately $8.4 million to the Company with a maturity date of January 12, 2027 (“Term Loan 5”). Interest on Term Loan 5 is payable in cash semi-annually and accrues at a 3.26 % per annum fixed, this may be adjusted by MetLife on each of Janaury 12, 2020, January 12, 2023 and January 12, 2026 at the option of the Lender to a rate that is consistent with similar loans. Proceeds from Term Loan 5 were used to acquire additional properties and for general corporate purposes.
In connection with the Term Loan 5, on January 12, 2017, the Company and the Operating Partnership each entered
separate guarantees whereby the Company and the Operating Partnership jointly and severally agreed to unconditionally guarantee all of the borrowers’ obligations under the Fifth MetLife Loan Agreement.
On February 14, 2017, a wholly owned subsidiary of the Operating Partnership, entered into a loan agreement (the “Sixth MetLife Loan Agreement”) with Metlife which provides for a loan of approximately $27.2 million to the Company with a maturity date of February 14, 2027 (“Term Loan 6”). Interest on Term Loan 6 is payable in cash semi-annually and accrues at a 3.21% per annum fixed rate, this may be adjusted by MetLife on each of February 14, 2020, February 14, 2023 and February 14, 2026 at the option of the Lender to a rate that is consistent with similar loans. Proceeds from Term Loan 6 were used to acquire additional properties.
In connection with the Term Loan 6, on February 14, 2017, the Company and the Operating Partnership each entered
into separate guarantees whereby the Company and the Operating Partnership jointly and severally agreed to unconditionally guarantee all of the borrowers’ obligations under the Sixth MetLife Loan Agreement. Rutledge Credit Facilities
Upon closing of the AFCO Mergers, by virtue of AFCO OP becoming a subsidiary of the Company, the Company acquired AFCO’s outstanding indebtedness under four loan agreements (the “Existing Rutledge Loan Agreements”) between AFCO OP and Rutledge Investment Company (“Rutledge”), which are further described below:
1. Loan Agreement, dated as of December 5, 2013, with respect to a $25,000,000 senior secured credit facility bearing interest at an annual rate of LIBOR plus 1.3%. The loan agreement requires AFCO OP to make quarterly interest payments on April 1, July 1, October 1 and January 1 of each calendar year. Additionally, the loan agreement requires AFCO OP to pay a quarterly non-usage fee equal to 0.25% of the committed loan amount minus the average outstanding principal balance of the loan amount over the prior three-month period.
2. Loan Agreement, dated as of January 14, 2015, with respect to a $25,000,000 senior secured credit facility bearing interest at an annual rate of LIBOR plus 1.3%. The loan agreement requires AFCO OP to make quarterly interest payments on April 1, July 1, October 1 and January 1 of each calendar year. Additionally, the loan agreement requires AFCO OP to pay a quarterly non-usage fee equal to 0.25% of the committed loan amount minus the average outstanding principal balance of the loan amount over the prior three-month period.
3. Loan Agreement, dated as of August 18, 2015, with respect to a $25,000,000 senior secured credit facility bearing interest at an annual rate of LIBOR plus 1.3%. The loan agreement requires AFCO OP to make quarterly interest

Farmland Partners Inc. Notes to Consolidated Financial Statements (Continued)
F-41
payments on April 1, July 1, October 1 and January 1 of each calendar year. Additionally, the loan agreement requires AFCO OP to pay a quarterly non-usage fee equal to 0.25% of the committed loan amount minus the average outstanding principal balance of the loan amount over the prior three-month period.
4. Loan Agreement, dated as of December 22, 2015, with respect to a $15,000,000 senior secured credit facility bearing interest at an annual rate of LIBOR plus 1.3%. The loan agreement requires AFCO OP to make quarterly interest payments on April 1, July 1, October 1 and January 1 of each calendar year. Additionally, the loan agreement requires AFCO OP to pay a quarterly non-usage fee equal to 0.25% of the committed loan amount minus the average outstanding principal balance over the loan amount of the prior three-month period.
In connection with the completion of the Mergers, on February 3, 2017, AFCO OP, in its capacity as a wholly owned subsidiary of the Company and the Operating Partnership, and Rutledge entered into the Second Amendment (the “Amendment”) to the Existing Rutledge Loan Agreements. Pursuant to the Amendment, among other things, the maturity dates for each of the Existing Rutledge Loan Agreements were extended to January 1, 2022 and the aggregate loan value under the Existing Rutledge Loan Agreements may not exceed 50% of the appraised value of the collateralized properties. Certain former AFCO properties acquired by the Company in the Mergers serve as collateral under the Existing Rutledge Loan Agreements.
On February 3, 2017, the Company and the Operating Partnership each entered into guaranty agreements (the “Existing Loan Guarantees”) pursuant to which they will unconditionally guarantee the obligations of AFCO OP under the Existing Loan Agreements.
In addition, in connection with the completion of the Mergers, on February 3, 2017, AFCO OP entered into a fifth loan agreement with Rutledge Investment Company (the “Fifth Rutledge Loan Agreement” and together with the Existing Rutledge Loan Agreements, as amended, the “Rutledge Loan Agreements”), with respect to a senior secured credit facility in the aggregate amount of $30,000,000, with a maturity date of January 1, 2022 and an annual interest rate of LIBOR plus 1.3%. The Fifth Rutledge Loan Agreement requires AFCO OP to make quarterly interest payments. Additionally, the Fifth Rutledge Loan Agreement contains certain customary affirmative and negative covenants, including (i) AFCO OP must pay a quarterly non-usage fee equal to 0.25% of the committed loan amount minus the average outstanding principal balance of the loan amount during the prior three-month period, (ii) AFCO OP must maintain a leverage ratio of 60% or less and (iii) the aggregate amounts outstanding under all of the Rutledge Loans may not exceed 50% of the aggregate appraised value of the properties serving as collateral under the Rutledge Loan Agreements.
On February 3, the Company and the Operating Partnership each entered into separate guarantees (the “Fifth Loan Guarantees” and together with the Existing Loan Guarantees, the “Guarantees”) whereby they are required to unconditionally guarantee AFCO OP’s obligations under the Fifth Rutledge Loan Agreement.
Sub-Advisory Agreement
Upon consummation of the AFCO Mergers, by virtue of AFCO being merged with and into one of the Company’s wholly-owned subsidiaries and AFCO OP becoming a wholly-owned subsidiary of the Company, the Company acquired the Amended and Restated Sub-Advisory Agreement, dated as of October 23, 2015 (the “Sub-Advisory Agreement”), by and among AFCO, American Farmland Advisors, AFCO OP and Prudential Capital Mortgage Company (the “Sub-Advisor”). On February 18, 2017, Farmland Partners Inc. (the “Company”) entered into a Termination Agreement (the “Termination Agreement”) with the Sub-Advisor pursuant to which the Company and Prudential agreed to terminate the Sub-Advisory Agreement and certain related property management agreements (together with the Sub-Advisory Agreement, the “Prudential Agreements”).
The Termination Agreement provides that, as of March 31, 2017, Prudential will no longer provide services to the Company under the Prudential Agreements. The Company has agreed to pay Prudential $1.6 million in cash, which is equal to the fee that would be owed to Prudential for services through the quarter ended March 31, 2017 and a termination fee of approximately $160,000.

Farmland Partners Inc. Notes to Consolidated Financial Statements (Continued)
F-42
Subsequent to December 31, 2016, the Company entered into purchase agreements with unrelated third parties to acquire the following farms:
Total($ in thousands) Approximate Purchase State Acres Price Michigan(1) 1,726 $ 10,000 Kansas 155 500South Carolina 300 1,200 Georgia 614 1,900South Carolina 644 1,478 South Dakota 1,690 6,760Colorado(1) 1,083 5,450
6,212 $ 27,288
(1) The exchange consideration consists partly of Class A common units of the operating partnership.
On January 12, 2017, February 14, 2017 and February 21, 2017, the Company completed the two Illinois farms andSouth Carolina farm acquisitions, respectively. The Michigan, Kansas, South Carolina, Georgia, South Carolina, South Dakota, and Colorado acquisitions are expected to close during the first half of 2017, subject to the satisfaction of certain customary closing conditions. There can be no assurance that these conditions will be satisfied or that the pending acquisitions will be consummated on the terms described herein, or at all. These acquisitions are expected to be accounted for as asset acquisitions.
On February 2, 2017 the Company successfully completed the AFCO Mergers. The transaction will be accounted for as a business combination. The company has yet to complete the acquisition accounting thus disclosures in relation to ASC 805 are currently not able to be disclosed.
On February 22, 2017 our Board of Directors declared a cash dividend of $0.1275 per share of common stock. The dividend is payable to the Company’s stockholders of record as of April 1, 2017, and is expected to be paid on April 15, 2017.

F-43
Farmland Partners Inc. Schedule III – Real Estate and Accumulated Depreciation
December 31, 2016 ($ In Thousands)
Initial Cost to Company Cost Capitalized Subsequent to
Acquisition Gross Amount at Which
Carried at Close of Period Life on Which
Description Encumbrances Land Improvements Total Improvements Land
Improvements Land Improvements Total Accumulated Depreciation
Date of Construction Date Acquired
Depreciation in Latest Income Statements is
Computed North Carolina (h) 41,906 - 41,906 - - 41,906 - 41,906 - 2015 65 Louisiana (k) 30,584 1,180 31,764 - - 30,584 1,180 31,764 46 2016 65 South Carolina (e) 12,057 1,474 13,531 - - 12,057 1,474 13,531 124 2014 65 Colorado (a) 10,716 70 10,786 - - 10,716 70 10,786 5 2014 65 Illinois (j) 9,689 420 10,109 - - 9,689 420 10,109 19 2016 65 Florida (n) 9,295 202 9,497 - - 9,295 202 9,497 2 2016 65 South Carolina (h) 8,633 133 8,766 - - 8,633 133 8,766 9 2015 50 Virginia (h) 7,277 - 7,277 - - 7,277 - 7,277 - 2015 50 North Carolina (h) 7,239 - 7,239 - - 7,239 - 7,239 - 2015 50 Arkansas (d) 6,914 287 7,201 - - 6,914 287 7,201 26 2014 50 South Carolina (e) 4,679 25 4,704 2,356 103 4,782 2,381 7,163 86 2015, 2016 2014 25 Mississippi (d) 6,654 133 6,787 3 - 6,654 136 6,790 11 2014 25 Texas (o) 4,188 1,929 6,117 323 - 4,188 2,252 6,440 95 2016 2016 - Arkansas (m) 5,924 244 6,168 - - 5,924 244 6,168 19 2015 - Illinois (j) 6,086 - 6,086 - - 6,086 - 6,086 - 2016 30 North Carolina (h) 5,750 - 5,750 - - 5,750 - 5,750 - 2015 21 Mississippi (m) 5,338 238 5,576 - - 5,338 238 5,576 24 2015 - Illinois (j) 5,453 105 5,558 - - 5,453 105 5,558 4 2016 - Colorado 792 4,731 5,523 - - 792 4,731 5,523 40 2016 - Illinois (j) 5,493 - 5,493 - - 5,493 - 5,493 - 2016 - Arkansas (e) 5,247 238 5,485 7 - 5,247 245 5,492 29 2014 - Louisiana (b) 5,100 52 5,152 152 - 5,100 204 5,304 29 2015, 2016 2014 24 Illinois (j) 4,920 4 4,924 - - 4,920 4 4,924 - 2016 16 Arkansas (d) 4,536 50 4,586 - - 4,536 50 4,586 3 2014 - Illinois (j) 4,522 4 4,526 - - 4,522 4 4,526 - 2016 - Illinois (j) 4,350 - 4,350 - - 4,350 - 4,350 - 2016 50 Louisiana (b) 3,781 87 3,868 449 - 3,781 536 4,317 19 2016 2014 50 North Carolina (h) 4,242 - 4,242 - - 4,242 - 4,242 - 2015 50 Arkansas 4,035 38 4,073 - - 4,035 38 4,073 - 2016 50 South Carolina (e) 2,235 - 2,235 1,551 244 2,479 1,551 4,030 54 2015, 2016 2014 - Colorado (e) 3,566 359 3,925 4 - 3,566 363 3,929 35 2014 25 North Carolina (h) 3,864 - 3,864 - - 3,864 - 3,864 - 2015 20 Illinois (j) 3,821 - 3,821 - - 3,821 - 3,821 - 2016 - Georgia (m) 3,306 368 3,674 - - 3,306 368 3,674 20 2015 25 Arkansas (f) 3,264 165 3,429 118 45 3,309 283 3,592 20 2016 2014 - Illinois (j) 3,541 - 3,541 - - 3,541 - 3,541 - 2016 - Mississippi (f) 3,471 41 3,512 24 - 3,471 65 3,536 4 2015 25 Illinois (j) 3,500 28 3,528 - - 3,500 28 3,528 2 2016 - Illinois (l) 2,981 - 2,981 507 - 2,981 507 3,488 142 2009 2007 & 2010 12 Illinois (j) 3,470 - 3,470 - - 3,470 - 3,470 - 2016 14 Arkansas (e) 3,277 145 3,422 14 6 3,283 159 3,442 17 2014 12 Illinois (l) 1,290 - 1,290 2,054 - 1,290 2,054 3,344 215 2011 & 2015 2007 14 Illinois (j) 2,997 68 3,065 234 - 2,997 302 3,299 11 2016 2016 - Nebraska (c) 1,881 55 1,936 1,342 - 1,881 1,397 3,278 225 2012 & 2015 2012 - Illinois (j) 3,277 - 3,277 - - 3,277 - 3,277 - 2016 11 Illinois (j) 3,232 - 3,232 - - 3,232 - 3,232 - 2016 11 Illinois (j) 3,212 - 3,212 - - 3,212 - 3,212 - 2016 8 Illinois (j) 3,186 - 3,186 - - 3,186 - 3,186 - 2016 - Colorado (a) 3,099 - 3,099 - - 3,099 - 3,099 - 2014 - Illinois (j) 3,058 - 3,058 - - 3,058 - 3,058 - 2016 14 Arkansas (i) 2,808 184 2,992 39 - 2,808 223 3,031 21 2015 39 Illinois (j) 3,030 - 3,030 - - 3,030 - 3,030 - 2016 - Illinois (j) 2,882 42 2,924 - - 2,882 42 2,924 3 2016 9 Illinois (j) 2,847 42 2,889 - - 2,847 42 2,889 2 2016 - South Carolina (f) 1,959 344 2,303 538 - 1,959 882 2,841 37 2015 2015 28

Initial Cost to Company Cost Capitalized Subsequent to
Acquisition Gross Amount at Which
Carried at Close of Period Life on Which
Description Encumbrances Land Improvements Total Improvements Land
Improvements Land Improvements Total Accumulated Depreciation
Date of Construction Date Acquired
Depreciation in Latest Income Statements is
Computed Nebraska (g) 2,601 114 2,715 76 - 2,601 190 2,791 8 2016 2015 10 Illinois (j) 2,718 - 2,718 - - 2,718 - 2,718 - 2016 14 Arkansas (d) 2,645 40 2,685 - - 2,645 40 2,685 9 2014 18 Illinois (j) 2,682 - 2,682 - - 2,682 - 2,682 - 2016 40 Nebraska (g) 2,539 78 2,617 55 - 2,539 133 2,672 10 2015 28 South Carolina (e) 2,199 138 2,337 277 55 2,254 415 2,669 21 2014 27 Illinois (l) 2,573 - 2,573 - - 2,573 - 2,573 - 2010 27 Michigan (m) 904 1,654 2,558 - - 904 1,654 2,558 94 2015 - Illinois (j) 2,542 - 2,542 - - 2,542 - 2,542 - 2016 26 Colorado (f) 1,995 84 2,079 455 - 1,995 539 2,534 21 2016 2015 28 Nebraska (i) 693 1,785 2,478 7 - 693 1,792 2,485 110 2014 37 Nebraska (g) 2,280 44 2,324 119 - 2,280 163 2,443 7 2016 2015 25 Nebraska (g) 2,316 126 2,442 - - 2,316 126 2,442 9 2015 38 Colorado (a) 2,366 68 2,434 2 - 2,366 70 2,436 33 2014 26 Illinois (j) 2,423 - 2,423 - - 2,423 - 2,423 - 2016 31 Illinois (j) 2,402 - 2,402 - - 2,402 - 2,402 - 2016 31 Mississippi (o) 2,321 15 2,336 - - 2,321 15 2,336 1 2016 34 Colorado (a) 2,328 - 2,328 - - 2,328 - 2,328 - 2014 47 Arkansas (d) 2,316 - 2,316 - - 2,316 - 2,316 - 2014 19 South Carolina (e) 1,803 158 1,961 290 23 1,826 448 2,274 26 2014 20 Illinois (j) 2,103 105 2,208 - - 2,103 105 2,208 3 2016 34 Colorado (f) 1,365 663 2,028 101 - 1,365 764 2,129 37 2015 20 Arkansas (e) 2,014 96 2,110 7 - 2,014 103 2,117 11 2014 46 Illinois (j) 2,100 - 2,100 - - 2,100 - 2,100 - 2016 - Illinois (j) 2,075 - 2,075 - - 2,075 - 2,075 - 2016 27 Colorado (i) 1,301 699 2,000 36 - 1,301 735 2,036 29 2015 35 Colorado (a) 1,817 210 2,027 1 - 1,817 211 2,028 47 2014 35 Illinois (j) 2,015 - 2,015 - - 2,015 - 2,015 - 2016 33 Illinois (j) 1,675 4 1,679 335 - 1,675 339 2,014 9 2016 2016 35 South Carolina (e) 1,568 - 1,568 367 64 1,632 367 1,999 18 2014 34 Illinois (j) 1,996 - 1,996 - - 1,996 - 1,996 - 2016 34 Illinois (j) 1,972 - 1,972 - - 1,972 - 1,972 - 2016 27 Illinois (j) 1,956 - 1,956 - - 1,956 - 1,956 - 2016 31 Illinois (j) 1,945 - 1,945 - - 1,945 - 1,945 - 2016 19 Kansas (m) 1,915 - 1,915 - - 1,915 - 1,915 - 2015 - Illinois 1,905 - 1,905 - - 1,905 - 1,905 - 2016 - Colorado (e) 1,079 812 1,891 - - 1,079 812 1,891 37 2014 45 Illinois (j) 1,891 - 1,891 - - 1,891 - 1,891 - 2016 38 Illinois (j) 1,859 - 1,859 - - 1,859 - 1,859 - 2016 21 Illinois (j) 1,853 - 1,853 - - 1,853 - 1,853 - 2016 15 Illinois (l) 1,700 - 1,700 122 - 1,700 122 1,822 17 2012 29 Texas (o) 925 875 1,800 - - 925 875 1,800 27 2016 20 North Carolina (h) 1,770 - 1,770 - - 1,770 - 1,770 - 2015 28 Illinois (j) 1,769 - 1,769 - - 1,769 - 1,769 - 2016 6 South Carolina (e) 1,078 - 1,078 552 138 1,216 552 1,768 26 2014 6 Colorado 1,760 - 1,760 - - 1,760 - 1,760 - 2016 24 Illinois (l) 1,750 - 1,750 - - 1,750 - 1,750 - 2009 32 Illinois (j) 1,731 - 1,731 - - 1,731 - 1,731 - 2016 29 Illinois (j) 1,643 88 1,731 - - 1,643 88 1,731 3 2016 14 Nebraska (e) 1,610 32 1,642 81 - 1,610 113 1,723 8 2014 31 Illinois (j) 1,718 - 1,718 - - 1,718 - 1,718 - 2016 46 Illinois (j) 1,614 94 1,708 - - 1,614 94 1,708 3 2016 19 Nebraska (e) 1,639 46 1,685 10 - 1,639 56 1,695 4 2014 29 Illinois (j) 1,693 - 1,693 - - 1,693 - 1,693 - 2016 - Colorado (a) 1,305 376 1,681 10 - 1,305 386 1,691 91 2014 23 Michigan (m) 779 851 1,630 - - 779 851 1,630 62 2016 - Illinois (j) 1,620 - 1,620 - - 1,620 - 1,620 - 2016 - Illinois (c) 1,500 - 1,500 108 - 1,500 108 1,608 - 2008 - Illinois (j) 1,603 - 1,603 - - 1,603 - 1,603 - 2016 - Illinois (j) 1,590 - 1,590 - - 1,590 - 1,590 - 2016 - Nebraska (f) 1,244 69 1,313 269 - 1,244 338 1,582 14 2015 2014 - Nebraska (c) 1,539 1,539 33 - 1,539 33 1,572 1 2012 -
F-44

F-45
Initial Cost to Company Cost Capitalized Subsequent to
Acquisition Gross Amount at Which
Carried at Close of Period Life on Which
Description Encumbrances Land Improvements Total Improvements Land
Improvements Land Improvements Total Accumulated Depreciation
Date of Construction Date Acquired
Depreciation in Latest Income Statements is
Computed Colorado (a) 1,353 184 1,537 - - 1,353 184 1,537 58 2014 - South Carolina (o) 1,303 225 1,528 - - 1,303 225 1,528 6 2016 20 Illinois (j) 1,523 - 1,523 - - 1,523 - 1,523 - 2016 15 Illinois (l) 1,423 60 1,483 30 - 1,423 90 1,513 54 2007 24 Illinois (j) 1,481 - 1,481 - - 1,481 - 1,481 - 2016 35 Mississippi (i) 1,437 33 1,470 - - 1,437 33 1,470 2 2015 26 Illinois (j) 1,439 - 1,439 - - 1,439 - 1,439 - 2016 - Illinois (j) 1,435 - 1,435 - - 1,435 - 1,435 - 2016 - Georgia 1,330 72 1,402 - - 1,330 72 1,402 1 2016 - Colorado (a) 1,381 - 1,381 - - 1,381 - 1,381 - 2014 21 Nebraska (g) 1,346 34 1,380 - - 1,346 34 1,380 2 2015 31 Nebraska (g) 1,314 65 1,379 - - 1,314 65 1,379 5 2015 27 Illinois (j) 1,320 - 1,320 - - 1,320 - 1,320 - 2016 - Nebraska (g) 1,279 23 1,302 - - 1,279 23 1,302 4 2015 29 Illinois (l) 1,003 - 1,003 289 - 1,003 289 1,292 45 2008 19 Nebraska (m) 1,232 56 1,288 - - 1,232 56 1,288 2 2015 27 Nebraska (g) 1,242 37 1,279 - - 1,242 37 1,279 3 2015 - Illinois (j) 1,259 - 1,259 - - 1,259 - 1,259 - 2016 - Illinois (f) 1,120 - 1,120 138 - 1,120 138 1,258 3 2008 - Illinois (j) 1,256 - 1,256 - - 1,256 - 1,256 - 2016 22 Illinois (j) 1,254 - 1,254 - - 1,254 - 1,254 - 2016 - Colorado (a) 1,030 170 1,200 31 - 1,030 201 1,231 67 2014 - Illinois (j) 1,229 - 1,229 - - 1,229 - 1,229 - 2016 - Illinois (j) 1,219 - 1,219 - - 1,219 - 1,219 - 2016 - Kansas (a) 1,029 178 1,207 - - 1,029 178 1,207 46 2014 - Illinois (c) 1,147 - 1,147 59 - 1,147 59 1,206 1 2013 - Nebraska (f) 1,100 28 1,128 73 - 1,100 101 1,201 8 2014 - Nebraska (g) 1,077 33 1,110 74 - 1,077 107 1,184 5 2016 2015 - Illinois (j) 1,171 - 1,171 - - 1,171 - 1,171 - 2016 - Illinois (j) 1,126 44 1,170 - - 1,126 44 1,170 1 2016 - Illinois (j) 1,130 35 1,165 - - 1,130 35 1,165 2 2016 - Nebraska (l) 1,109 40 1,149 - - 1,109 40 1,149 8 2012 - Nebraska (g) 1,136 11 1,147 - - 1,136 11 1,147 3 2015 - Illinois (j) 1,115 28 1,143 - - 1,115 28 1,143 1 2016 - Colorado (e) 747 393 1,140 - - 747 393 1,140 24 2014 22 Illinois (j) 1,119 - 1,119 - - 1,119 - 1,119 - 2016 - Illinois (j) 1,063 27 1,090 17 - 1,063 44 1,107 2 2016 2016 - Colorado (e) 773 323 1,096 - - 773 323 1,096 24 2014 - Colorado (a) 579 513 1,092 2 - 579 515 1,094 123 2014 - Illinois (j) 1,083 - 1,083 - - 1,083 - 1,083 - 2016 - Illinois (j) 1,080 - 1,080 - - 1,080 - 1,080 - 2016 - Illinois (j) 1,075 - 1,075 - - 1,075 - 1,075 - 2016 22 Illinois (c) 801 97 898 172 - 801 269 1,070 20 2004, 2006, 2016 - Nebraska (m) 848 197 1,045 22 - 848 219 1,067 21 2014 22 Illinois (j) 1,058 - 1,058 - - 1,058 - 1,058 - 2016 - Nebraska (e) 994 20 1,014 41 - 994 61 1,055 5 2014 - Colorado (e) 554 443 997 58 - 554 501 1,055 25 2014 22 Colorado (i) 809 141 950 64 - 809 205 1,014 12 2015 - Illinois (j) 1,005 - 1,005 - - 1,005 - 1,005 - 2016 - Colorado (l) 819 94 913 91 - 819 185 1,004 33 2010 22 Illinois (j) 995 - 995 - - 995 - 995 - 2016 22 Illinois (l) 991 - 991 - - 991 - 991 - 2012 22 Illinois (j) 950 40 990 - - 950 40 990 1 2016 - Illinois (j) 989 - 989 - - 989 - 989 - 2016 22 Illinois (j) 980 - 980 - - 980 - 980 - 2016 - Illinois (l) 923 53 976 - - 923 53 976 2 2011 - Illinois (j) 975 - 975 - - 975 - 975 - 2016 22 Illinois (j) 972 - 972 - - 972 - 972 - 2016 22 Illinois (j) 968 - 968 - - 968 - 968 - 2016 - Georgia (o) 756 202 958 - - 756 202 958 4 2016 - Illinois (j) 939 - 939 - - 939 - 939 - 2016 - Illinois (c) 902 34 936 - - 902 34 936 16 2008 -

Initial Cost to Company Cost Capitalized Subsequent to
Acquisition Gross Amount at Which
Carried at Close of Period Life on Which
Description Encumbrances Land Improvements Total Improvements Land
Improvements Land Improvements Total Accumulated Depreciation
Date of Construction Date Acquired
Depreciation in Latest Income Statements is
Computed Illinois (j) 800 130 930 - - 800 130 930 3 2016 22 Illinois (j) 855 55 910 - - 855 55 910 2 2016 - Illinois (j) 845 63 908 - - 845 63 908 3 2016 22 Illinois (j) 879 - 879 - - 879 - 879 - 2016 - Colorado (a) 481 373 854 15 - 481 388 869 92 2014 - Illinois (j) 864 - 864 - - 864 - 864 - 2016 22 Nebraska (f) 862 - 862 - - 862 - 862 - 2015 - Georgia 718 144 862 - - 718 144 862 3 2016 22 Georgia (m) 795 65 860 - - 795 65 860 3 2016 - Illinois (j) 857 - 857 - - 857 - 857 - 2016 22 Illinois (j) 854 - 854 - - 854 - 854 - 2016 - Illinois (l) 668 - 668 178 - 668 178 846 31 2007 - Illinois (j) 844 - 844 - - 844 - 844 - 2016 - Illinois (m) 762 - 762 75 - 762 75 837 3 2015 22 Nebraska (c) 742 - 742 94 - 742 94 836 14 2012 - Illinois (j) 823 - 823 - - 823 - 823 - 2016 - Illinois (j) 774 47 821 - - 774 47 821 2 2016 - Illinois (m) 815 - 815 - - 815 - 815 - 2015 - Illinois (f) 700 110 810 - - 700 110 810 24 2004 22 Colorado (a) 803 - 803 - - 803 - 803 - 2014 - Illinois (l) $ 644 $ 93 $ 737 $ 61 $ - $ 644 $ 154 $ 798 $ 22 2000 - Illinois (j) 775 - 775 - - 775 - 775 - 2016 - Nebraska (e) 702 72 774 - - 702 72 774 4 2014 - Illinois (j) 671 96 767 - - 671 96 767 3 2016 - Illinois (j) 762 - 762 - - 762 - 762 - 2016 - Illinois (j) 746 - 746 - - 746 - 746 - 2016 - Illinois (j) 744 - 744 - - 744 - 744 - 2016 - Kansas (a) 737 - 737 - - 737 - 737 - 2014 - Nebraska (m) 711 22 733 - - 711 22 733 1 2015 - Illinois (j) 732 - 732 - - 732 - 732 - 2016 - Illinois (j) 729 - 729 - - 729 - 729 - 2016 - Illinois (j) 727 - 727 - - 727 - 727 - 2016 - Illinois (l) 725 - 725 - - 725 - 725 - 2010 - Illinois (j) 708 - 708 - - 708 - 708 - 2016 - Illinois 667 30 697 - - 667 30 697 1 2016 - Illinois (l) 693 - 693 - - 693 - 693 - 2008 - Illinois (l) 684 - 684 - - 684 - 684 - 2007 - Illinois (m) 681 - 681 - - 681 - 681 - 2015 - Illinois (j) 630 - 630 43 - 630 43 673 1 2016 2016 - Illinois (m) 667 - 667 - - 667 - 667 - 2016 - Georgia (m) 555 106 661 - - 555 106 661 4 2015 - Illinois (l) 448 100 548 110 - 448 210 658 25 2003 - Illinois (j) 612 38 650 - - 612 38 650 1 2016 22 Georgia (m) 482 142 624 - - 482 142 624 4 2016 - Illinois (j) 617 - 617 - - 617 - 617 - 2016 - Illinois (l) 610 - 610 - - 610 - 610 - 2012 - Nebraska (f) 607 - 607 - - 607 - 607 - 2015 22 Nebraska (f) 561 - 561 - 41 602 - 602 - 2014 - Illinois (j) 601 - 601 - - 601 - 601 - 2016 - Colorado (a) 374 201 575 2 - 374 203 577 49 2014 - Georgia (o) 469 108 577 - - 469 108 577 2 2016 22 Illinois (j) 576 - 576 - - 576 - 576 - 2016 - Illinois (c) 527 37 564 - - 527 37 564 4 2011 22 Illinois 563 - 563 - - 563 - 563 - 2016 - Illinois (j) 552 - 552 - - 552 - 552 - 2016 - Illinois (j) 536 - 536 - - 536 - 536 - 2016 - Illinois (j) 534 - 534 - - 534 - 534 - 2016 22 Georgia (m) 475 53 528 - - 475 53 528 3 2015 - Illinois (j) 499 22 521 - - 499 22 521 1 2016 - Nebraska (g) 500 10 510 - - 500 10 510 3 2015 - Illinois (j) 507 - - 507 - 507 - 2016 - Illinois (j) 505
507 505 - - 505 - 505 - 2016 -
F- 46

Initial Cost to Company Cost Capitalized Subsequent to
Acquisition Gross Amount at Which
Carried at Close of Period Life on Which
Description Encumbrances Land Improvements Total Improvements Land
Improvements Land Improvements Total Accumulated Depreciation
Date of Construction Date Acquired
Depreciation in Latest Income Statements is
Computed Illinois (j) 487 - 487 - - 487 - 487 - 2016 - Illinois (l) 442 38 480 - - 442 38 480 13 2009 - Illinois (j) 466 - 466 - - 466 - 466 - 2016 - Illinois (j) 447 - 447 - - 447 - 447 - 2016 - Illinois (j) 442 - 442 - - 442 - 442 - 2016 - Illinois (j) 421 - 421 - - 421 - 421 - 2016 - Colorado (a) 419 - 419 - - 419 - 419 - 2014 - Illinois (l) 290 38 328 81 - 290 119 409 12 2006 - Illinois (f) 398 - 398 - - 398 - 398 - 2008 - Illinois (m) 371 - 371 - - 371 - 371 - 2016 - Illinois (j) 370 - 370 - - 370 - 370 - 2016 - Illinois (j) 362 - 362 - - 362 - 362 - 2016 - Illinois (j) 360 - 360 - - 360 - 360 - 2016 - Illinois (j) 359 - 359 - - 359 - 359 - 2016 - Illinois (l) 322 36 358 - - 322 36 358 8 2006 22 Illinois (j) 353 - 353 - - 353 - 353 - 2016 22 Nebraska (e) 342 4 346 - - 342 4 346 - 2014 - Illinois (c) 321 24 345 - - 321 24 345 2 2011 - Illinois (l) 271 73 344 - - 271 73 344 16 2001 - Kansas 235 90 325 - - 235 90 325 2 2016 - Illinois (j) 320 - 320 - - 320 - 320 - 2016 - Illinois (j) 317 - 317 - - 317 - 317 - 2016 - Illinois (j) 296 - 296 - - 296 - 296 - 2016 30 Illinois (j) 291 - 291 - - 291 - 291 - 2016 - Illinois (j) 286 - 286 - - 286 - 286 - 2016 29 Illinois (j) 282 - 282 - - 282 - 282 - 2016 10 Illinois (j) 254 - 254 - - 254 - 254 - 2016 36 Illinois (l) 252 - 252 - - 252 - 252 - 2012 36 Illinois (l) 203 44 247 - - 203 44 247 4 2006 33 Illinois (j) 240 - 240 - - 240 - 240 - 2016 25 Colorado (m) 236 - 236 - - 236 - 236 - 2015 24 Illinois (j) 233 - 233 - - 233 - 233 - 2016 - Illinois (l) 200 16 216 - - 200 16 216 - 2011 - Illinois (j) 216 - 216 - - 216 - 216 - 2016 25 Illinois (j) 179 - 179 - - 179 - 179 - 2016 16 Illinois (j) 170 - 170 - - 170 - 170 - 2016 17 Illinois (c) 102 59 161 - - 102 59 161 13 2003 40 Illinois (j) 157 - 157 - - 157 - 157 - 2016 18 Illinois (j) 153 - 153 - - 153 - 153 - 2016 7 Illinois 34 86 120 - - 34 86 120 4 2016 - Colorado (m) - - - - - - - - - 2015 30 First Midwest Bank Note - Farmer Mac Bond #1 $ 20,700 Farmer Mac Bond #2 $ 5,460 Farmer Mac Bond #3 $ 10,680 Farmer Mac Bond #4 $ 13,400 Farmer Mac Bond #5 $ 30,860 Farmer Mac Bond #6 $ 14,915 Farmer Mac Bond #7 $ 11,160 Farmer Mac Bond #8A $ 41,700 Farmer Mac Bond #8B $ - Farmer Mac Bond #9 $ 6,600 Met Life Bond #1 $ 90,000 Met Life Bond #2 $ 16,000 Met Life Bond #3 $ 21,000 Met Life Bond #4 $ 15,685 Farm Credit Bond $ 5,102 Prudential Bond $ 6,600 Totals $ 309,862 $ 550,664 $ 29,367 $ 580,031 $ 14,848 $ 719 $ 551,383 $ 44,215 $ 595,598 $ 3,215
(a) Farm is part of a collateral pool for the $20,700 Farmer Mac Bond #1.
(b) Farm is part of a collateral pool for the $5,460 Farmer Mac Bond #2.
F-47

(c) Farm is part of a collateral pool for the $10,680 Farmer Mac Bond #3.
(d) Farm is part of a collateral pool for the $13,400 Farmer Mac Bond #4.
(e) Farm is part of a collateral pool for the $30,860 Farmer Mac Bond #5.
(f) Farm is part of a collateral pool for the $14,915 Farmer Mac Bond #6.
(g) Farm is part of a collateral pool for the $11,160 Farmer Mac Bond #7.
(h) Farm is part of a collateral pool for the $41,700 Farmer Mac Bond #8A.
(i) Farm is part of a collateral pool for the $6,600 Farmer Mac Bond #9.
(j) Farm is part of a collateral pool for the $90,000 Met Life Bond #1.
(k) Farm is part of a collateral pool for the $16,000 Met Life Bond #2.
(l) Farm is part of a collateral pool for the $21,000 Met Life Bond #3.
(m) Farm is part of a collateral pool for the $15,685 Met Life Bond #4.
(n) Farm is part of a collateral pool for the $5,102 Farm Credit of Central Florida Bond.
(o) Farm is part of a collateral pool for the $6,600 Prudential Loan.
(p) The aggregate basis for U.S. federal income tax purposes is $534,459
F-48

Farmland Partners Inc. Schedule III – Real Estate and Accumulated Depreciation
Reconciliation of “Real Estate and Accumulated Depreciation” (In Thousands)
Years ended December 31, 2016 2015 2014
Real Estate: Balance at beginning of year $ 317,589 $ 166,493 $ 38,806 Additions during period
Additions through construction of improvements 4,866 7,722 46 Disposition of improvements (40) (6) (9)Non cash acquisitions - - - Acquisitions through business combinations 273,183 143,380 127,650
Balance at end of year $ 595,598 $ 317,589 $ 166,493
Accumulated Depreciation: Balance at beginning of year $ 1,668 $ 777 $ 450
Disposition of improvements (8) (1) (2)Additions charged to costs and expenses 1,555 892 329
Balance at end of year $ 3,215 $ 1,668 $ 777
Real Estate balance per schedule $ 595,598 $ 317,589Construction in progress 1,615 286 Other non-real estate 74 33
Balance per consolidated balance sheet $ 597,287 $ 317,908
Accumulated depreciation per schedule $ 3,215 $ 1,668 Other non-real estate 9 3
Balance per consolidated balance sheet $ 3,224 $ 1,671
F-49

20MAR201516581200
BOARD OF DIRECTORS ANNUAL REPORT ON FORM 10-KPaul A. Pittman Farmland Partner’s Annual Report onExecutive Chairman and CEO, Form 10-K for the year ended December 31,Farmland Partners Inc. 2016 is included in this Annual Report to
Stockholders. The exhibits accompanying theJay B. Bartels *Form 10-K are filed with the U.S. SecuritiesCEO and President, Trendmojo, Inc.and Exchange Commission and can beand President, Bonsai Development Corp.accessed in the EDGAR database at the SEC’sD. Dixon Boardman * website, www.sec.gov, or through our website,
Founder and Chief Executive Officer,www.farmlandpartners.com, in the ‘‘SEC
Optima Fund Management LLC Filings’’ section. We will provide these items toJohn C. Conrad * stockholders upon request. Requests for anyPrincipal, JB Consumer Products such exhibits should be made to:Group, LLC
Farmland Partners Inc.Chris A. Downey * * 4600 S. Syracuse StreetPrincipal, Stirling Development Suite 1450Thomas S. T. Gimbel * Denver, CO 80237Executive Managing Director Attn: Luca Fabbriand Chief Portfolio Risk Officer,
FORWARD-LOOKING STATEMENTSOptima Fund Management LLC
Dr. Joseph W. Glauber * This Annual Report includes forward-lookingFormer Chief Economist, U.S. statements that involve risks and uncertainties,Department of Agriculture including those relating to our future success
and growth prospects. Please see ourDarell D. Sarff *accompanying Annual Report on Form 10-KFarm owner and operatorincluded in this Annual Report to Stockholders
* independent director for a discussion of risk factors that could** lead independent director negatively affect these expectations.OFFICERS ANNUAL MEETING OF STOCKHOLDERSPaul A. Pittman
Stockholders of Farmland Partners Inc. areExecutive Chairman and CEOcordially invited to attend the 2017 Annual
Luca Fabbri Meeting of Stockholders, which will be held atCFO and Treasurer our offices, located at 4600 S. Syracuse Street,
Suite 1450 Denver, Colorado 80237, on May 3,Robert L. Cowan2017, at 8:00 a.m. Mountain Time.President
Erica Borenstein LEGAL COUNSELSecretary and General Counsel
Morrison & Foerster LLPCORPORATE OFFICES Washington, DCFarmland Partners Inc. INDEPENDENT AUDITORS4600 S. Syracuse StreetSuite 1450 PricewaterhouseCoopers LLPDenver, CO 80237 Denver, COP: (720) 452-3100
TRANSFER AGENT AND REGISTRAREXCHANGE LISTING American Stock Transfer & Trust CompanyNYSE Trading Symbol: FPI Brooklyn, NY
P: (800) 937-5449Email: [email protected]: www.amstock.com

20MAR201516580285