Perfluorinated contaminants in fur seal pups and penguin eggs from South Shetland, Antarctica

Alkaline Digestion and Solid Phase Extraction Method for PerfluorinatedCompounds in Mussels and Oysters from South China and Japan
M. K. So,1 S. Taniyasu,2 P. K. S. Lam,1* G. J. Zheng,1 J. P. Giesy,1,3 N. Yamashita2
1 Centre for Coastal Pollution and Conservation, Department of Biology and Chemistry, City University of Hong Kong, Tat Chee Avenue, Kowloon,Hong Kong SAR, Peoples Republic of China2 National Institute of Advanced Industrial Science and Technology (AIST), 16-1 Onogawa, Tsukuba, Ibaraki 305-859, Japan3 Department of Zoology, National Food Safety and Toxicology Center, Center for Integrative Toxicology, Michigan State University, East Lansing,Michigan 48824, USA
Received: 10 March 2005 /Accepted: 8 May 2005
Abstract. Perfluorinated compounds (PFCs), such as per-fluorooctane sulfonate (PFOS), have been identified in thecoastal waters of China and Japan. An alkaline digestionmethod, coupled with solid-phase extraction (SPE), and high-performance liquid chromatography interfaced with high-res-olution electrospray tandem mass spectrometry was developedto determine PFCs in mussel and oyster samples from coastalwaters of south China and Japan. These techniques producedadequate recoveries and reporting limits with small quantitiesof PFCs. Concentrations of individual PFCs in mussels andoysters from south China and Japan ranged from 113.6 to586.0 pg/g, wet weight (ww) for PFOS, 63.1 to 511.6 pg/g, wwfor perfluorohexane sulfonate, 9.3 to 30.1 pg/g, ww for per-fluorobutane sulfonate and 37.8 to 2957.0 pg/g, ww for per-fluorooctane sulfonamide. The quantification of perfluorinatedcarboxylates was compromised by interferences from carb-oxylates in the procedural blanks. Perfluoroundecanoate andperfluorononanoate had relatively great blank interferences,which resulted in relatively poor limits of quantification forthese compounds. Some PFCs were only identified in a limitednumber of samples: perfluorododecanoate in samples fromTokyo Bay, Japan (195.9 pg/g, ww); and perfluorodecanoate inFuzhou, China (131.7 pg/g, ww) and Tokyo Bay (118.6 pg/g,ww). The greatest concentrations of perfluorooctanoate, per-fluoroheptanoate, and perfluorohexanoate were observed insamples from Tokyo Bay and Bei Hai, south China.
The extensive application of perfluorinated compounds (PFCs)in many commercial products has led to the widespreadoccurrence of PFCs in the environment, and PFCs are foundglobally in tissues of many wildlife species, and in bloodserum of both occupationally and non-occupationally exposedpeople (Hoff 2003; Kannan et al. 2001; Kuklenyik et al. 2004;
Olsen et al. 1999, 2003; Van de Vijver et al. 2003, 2004). Thewidespread occurrence and potential toxicities of some PFCs,have led to their production being voluntarily phased out in2001 (Martin et al. 2004a).
Among the PFCs, perfluorooctane sulfonate (PFOS), per-fluorooctanoate (PFOA), perfluorooctane sulfonamide (PFO-SA), perfluorohexane sulfonate (PFHS), and perfluorobutanesulfonate (PFBS) have received the most attention (Tomy et al.2004). PFOS has been found in almost every wildlife speciesin which it has been measured. Although PFOS and PFOAhave been measured most frequently, long-chained perfluoro-carboxylates (PFCAs), with carbon numbers ranging from 9 to15, have been found in ng/g, wet weight (ww) concentrationsin liver samples of various species from the Canadian Arctic.In mink liver, the mean perfluorononanoate (PFNA) (16 ng/g,ww) concentration was greater than that of PFOS (8.7 ng/g,ww) (Martin et al. 2004b). Longer-chained PFCAs [the seriesfrom perfluorohexanoate (PFHxA) to 14-carbon version ofPFOA (perfluorotetradecanoate, PFTA)] have also been ob-served in the fish liver tissues collected from Etobicoke Creek,Toronto, Canada, where an accidental release of fire-fightingfoam occurred (Moody et al. 2002). The possibility of bioac-cumulation and bioconcentration of long-chained perflu-oroalkyl carboxylates and sulfonates (Martin et al. 2003a,2003b) emphasizes the necessity of monitoring and evaluatingthe toxicological effects of these compounds in the marineenvironment.
In order to monitor these PFCs, a reliable method withacceptable precision and accuracy is needed. Many previousstudies utilized ion-pairing methods for extracting PFCs inblood, liver, and tissue samples. Those methods, however,gave poor recoveries for some of the analytes (Martin et al.2004a). A new automated solid-phase extraction and mea-surement method for PFCs in serum and milk achievedacceptable recoveries for most analytes, except perfluoro-pentanoate (PFPeA) and perfluorododecanoate (PFDoDA), ofwhich the recoveries were poor (22% and 33% in serum,respectively) (Kuklenyik et al. 2004). Most of the publishedsample preparation methods do not involve any special*Correspondence to: P. K. S. Lam; email: [email protected]
Arch. Environ. Contam. Toxicol. 50, 240–248 (2006)DOI: 10.1007/s00244-005-7058-x
cleanup procedures, which results in interferences duringinstrumental analysis (Martin et al. 2004a). Solid-phaseextraction (SPE) shows promise as a reliable and relativelysimple cleanup technique, especially for biological samples(Kuklenyik et al. 2004; Martin et al. 2004a). The aim of thisstudy was to develop a practical method for measuring a broadrange of PFCs in biological matrices.
With rapid industrialization and development in the pastdecade, the coastal waters of south China and Hong Kong havebeen increasingly influenced by pollutant exposures from awide range of industrial and domestic sources (So et al. 2004).Previous studies of these coastal waters have primarily focusedon traditional persistent organic pollutants including PCBs,DDTs, PAHs, and other OC pesticides (Fu et al. 2003; Mai etal. 2002; Yang et al. 1997). A recent study revealed thatconcentrations of PFCs, mainly PFOS and PFOA, in thecoastal waters of south China and Hong Kong were similar tothose found in the coastal marine environment of Japan andsouth Korea (So et al. 2004). Ranges of concentrations ofPFOS in Hong Kong, and the Pearl River Delta, China, were0.09–3.1 and 0.02–12 ng/L, respectively, whereas those forPFOA were 0.73–5.5 and 0.24–16 ng/L, respectively (So et al.2004). Although all the concentrations were less than thosethat would be expected to cause adverse effects to aquaticorganisms or their predators, the presence of PFCs in coastalwaters suggests their widespread distribution and potentialreleases from adjacent industrialized areas in Hong Kong andsouth China. Further monitoring and identification of sourcesof PFCs are necessary for a more comprehensive risk assess-ment.
Materials and Methods
Chemicals and Standards
External standards, a mixture of perfluorinated compounds (PFCmix)containing PFOS, PFHS, PFBS, PFOSA, PFDoDA, perfluorounde-canoate (PFUnDA), perfluorodecanoate (PFDA), PFNA, PFOA, per-fluoroheptanoate (PFHpA) and PFHxA, at 100 ng/mL were suppliedby the National Institute of Advanced Industrial Science and Tech-nology (AIST), Tsukuba, Japan. Methanol (high-performance liquidchromatography (HPLC) grade), distilled water (HPLC grade),potassium hydroxide (KOH, 85%), and ammonium acetate werepurchased from Wako Pure Chemical Industries, Ltd (Osaka, Japan).Nylon mesh filters (12 lm, 13 mm i.d.) were purchased from Iwaki(Tokyo, Japan). All solvents and reagents were used as received.
Sample Collection
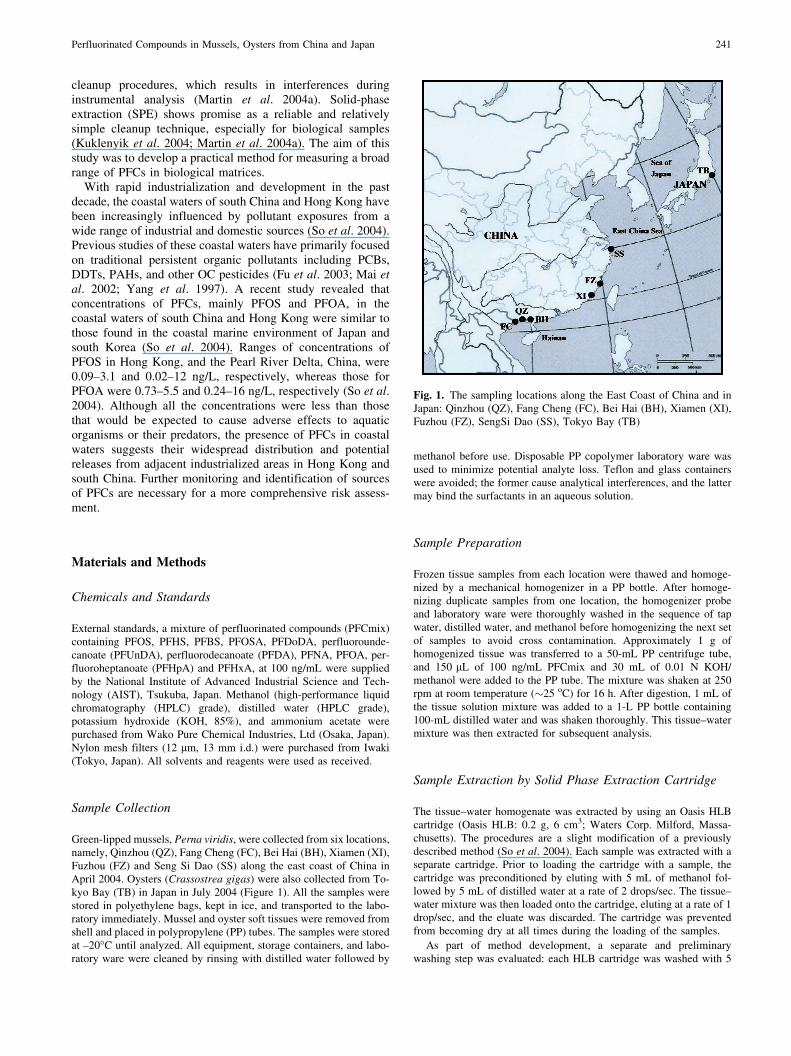
Green-lipped mussels, Perna viridis, were collected from six locations,namely, Qinzhou (QZ), Fang Cheng (FC), Bei Hai (BH), Xiamen (XI),Fuzhou (FZ) and Seng Si Dao (SS) along the east coast of China inApril 2004. Oysters (Crassostrea gigas) were also collected from To-kyo Bay (TB) in Japan in July 2004 (Figure 1). All the samples werestored in polyethylene bags, kept in ice, and transported to the labo-ratory immediately. Mussel and oyster soft tissues were removed fromshell and placed in polypropylene (PP) tubes. The samples were storedat –20�C until analyzed. All equipment, storage containers, and labo-ratory ware were cleaned by rinsing with distilled water followed by
methanol before use. Disposable PP copolymer laboratory ware wasused to minimize potential analyte loss. Teflon and glass containerswere avoided; the former cause analytical interferences, and the lattermay bind the surfactants in an aqueous solution.
Sample Preparation
Frozen tissue samples from each location were thawed and homoge-nized by a mechanical homogenizer in a PP bottle. After homoge-nizing duplicate samples from one location, the homogenizer probeand laboratory ware were thoroughly washed in the sequence of tapwater, distilled water, and methanol before homogenizing the next setof samples to avoid cross contamination. Approximately 1 g ofhomogenized tissue was transferred to a 50-mL PP centrifuge tube,and 150 lL of 100 ng/mL PFCmix and 30 mL of 0.01 N KOH/methanol were added to the PP tube. The mixture was shaken at 250rpm at room temperature (�25 oC) for 16 h. After digestion, 1 mL ofthe tissue solution mixture was added to a 1-L PP bottle containing100-mL distilled water and was shaken thoroughly. This tissue–watermixture was then extracted for subsequent analysis.
Sample Extraction by Solid Phase Extraction Cartridge
The tissue–water homogenate was extracted by using an Oasis HLBcartridge (Oasis HLB: 0.2 g, 6 cm3; Waters Corp. Milford, Massa-chusetts). The procedures are a slight modification of a previouslydescribed method (So et al. 2004). Each sample was extracted with aseparate cartridge. Prior to loading the cartridge with a sample, thecartridge was preconditioned by eluting with 5 mL of methanol fol-lowed by 5 mL of distilled water at a rate of 2 drops/sec. The tissue–water mixture was then loaded onto the cartridge, eluting at a rate of 1drop/sec, and the eluate was discarded. The cartridge was preventedfrom becoming dry at all times during the loading of the samples.
As part of method development, a separate and preliminarywashing step was evaluated: each HLB cartridge was washed with 5
Fig. 1. The sampling locations along the East Coast of China and inJapan: Qinzhou (QZ), Fang Cheng (FC), Bei Hai (BH), Xiamen (XI),Fuzhou (FZ), SengSi Dao (SS), Tokyo Bay (TB)
Perfluorinated Compounds in Mussels, Oysters from China and Japan 241
mL of 40% methanol in water at a rate of 1 drop/sec, and the eluatewas collected in a 15-mL PP centrifuge tube (Fraction 1). Followingthis step, the cartridge was allowed to run dry and the remaining waterwas completely removed from the cartridge by using a PP syringe. Asecond fraction (Fraction 2) was eluted with 10 mL of 100% methanolat a rate of 1 drop/sec. The eluates in Fraction 1 and Fraction 2 werethen reduced to 3 mL and 1 mL, respectively, under a gentle stream ofhigh-purity nitrogen gas. After volume reduction, the eluates werepassed through separate 0.1 lm 13 mm nylon mesh filters (whichwere pre-washed with 2 · 0.5 mL methanol), and then transferred intothe corresponding 15-mL PP centrifuge tube. Any eluates that re-mained in the nylon filter were washed through the filter with 0.5 mLof 100% methanol. The final volume of the eluate was reduced byhigh-purity nitrogen gas to 3 mL for Fraction 1 and 0.5 mL forFraction 2. One hundred microliters of eluate was transferred to a PPvial for instrumental analysis.
Instrumental Analysis
Concentrations of PFCs in tissue samples were analyzed using HPLCwith high-resolution, electrospray tandem mass spectrometry (HPLC-MS/MS). Separation of analytes was performed by an Agilent HP1100liquid chromatograph (Agilent, Palo Alto, California) interfaced witha Micromass Quattro II mass spectrometer (Waters Corp., Milford,Massachusetts) operated in electrospray negative mode. A 10-lLaliquot of extract was injected onto a Keystone Betasil C18 column(2.1 mm i.d. · 50-mm length, 5 lm) with 2 mM ammonium acetateand methanol as the mobile phases starting at 10% methanol at a flowrate of 300 lL/min. The gradient was increased to 100% methanol at10 min before reverting to the original conditions at 12 min. Thedesolvation gas flow and temperature were kept at 750 L/h and 400�C.The collision energies, cone voltages, and MS/MS parameters for theinstrument were optimized individually for each analyte and aresummarized (Table 1).
Data Analysis
Acquisition analysis for all of the samples, blanks, and QC materialswere performed using MassLynx software of the Micromass Quattro IIsystem (Waters Corp., Milford, MA). Each ion of interest in the chro-matogram was automatically selected and integrated. Concentrations oftarget analytes were quantified by using calibration curves constructedusing external standards of six different concentrations (2, 10, 50, 200,1000, and 20,000 ng/L). Apart from a few outliers, the standard cali-bration curve showed strong linearity (correlation coefficients >0.99).
Prior to sample quantification, the instrument was tuned to obtainthe maximum peak resolution and the greatest mass accuracy. Mul-
tiple reaction monitoring (MRM) mode, having a higher sensitivity,was used in the present study for quantification. In MRM mode, adaughter ion, usually the one with the greatest intensity, producedfrom a selected parent ion was monitored and quantified.
Results and Discussion
Optimization of Alkaline Digestion
Due of the specific protein-binding properties of PFCs,biological matrix interference reduces the sensitivity of theanalytical technique. Therefore, it is necessary to remove theproteins to release PFCs for increased sensitivity. Alkalinedigestion of lipids and proteins before extraction was sug-gested to achieve an accurate and reliable measurement ofPFCs in biological samples. Current sample preparationmethods do not include a cleanup step to remove thesematrix interferences (Martin et al. 2004a). To evaluate theeffect of alkaline digestion on target analytes, 10 lL of 100ng/mL PFCmix was added to 1 mL of different concentra-tions of KOH in water (0.01, 0.1, 0.3, 0.5, 1, and 2 N) ormethanol (0.01, 0.1, and 0.3 N). The percentage recoveriesfor all the target analytes under different KOH concentra-tions are summarized in Table 2. In general, all alkaline/water mixtures gave poor recoveries for PFDoDA andPFUnA and other PFCs, and were judged unacceptable forthe alkaline digestion protocol. The alkaline/methanol solu-tion (0.01 N KOH/methanol) was found to have the mostconsistent recoveries for all PFCs (>70%). For many PFCs,greater KOH concentrations reduced recovery rates. Theduration for the alkaline digestion process was also tested byshaking approximately 1 g of homogenized mussel tissuesample with 30 mL 0.01 N KOH/methanol solution. Smallparticles were still observed after shaking for 2 and 6 h.Consequently, the samples were digested overnight (10 h) toensure complete digestion of the fat and proteins in thehomogenized tissue.
Quality Assurance and Control
Blank Analysis
The occurrence of relatively great concentrations of somePFCs in blanks is a persistent problem in the analyses of these
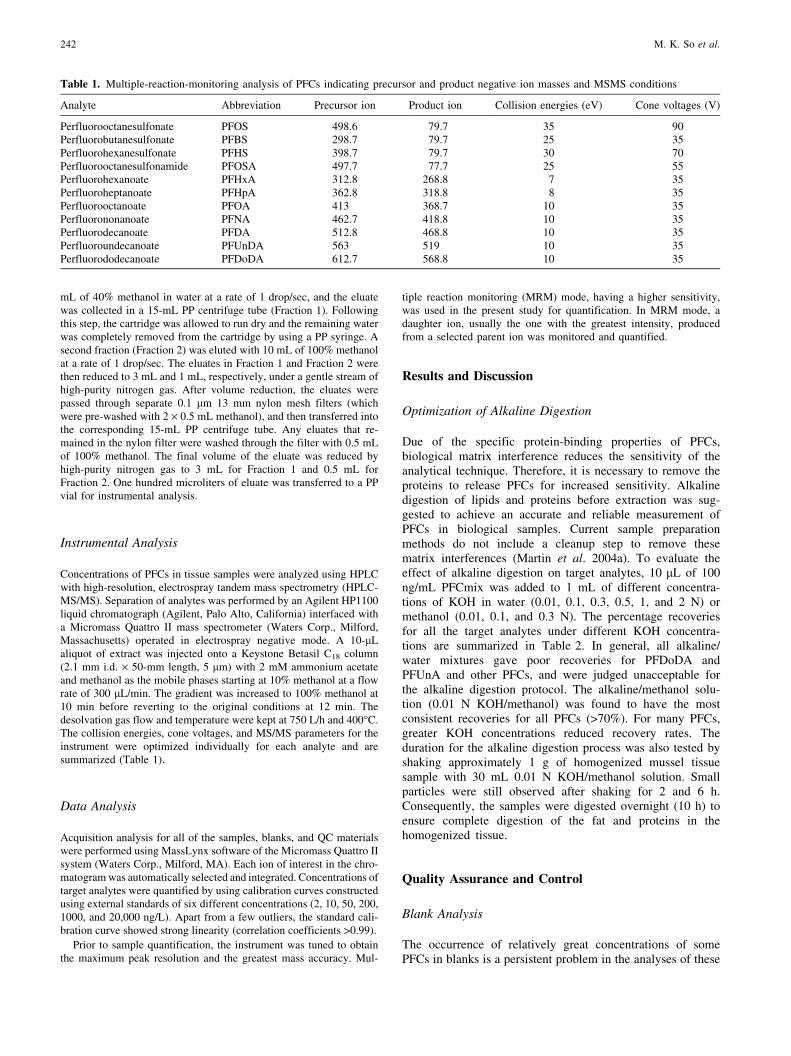
Table 1. Multiple-reaction-monitoring analysis of PFCs indicating precursor and product negative ion masses and MSMS conditions
Analyte Abbreviation Precursor ion Product ion Collision energies (eV) Cone voltages (V)
Perfluorooctanesulfonate PFOS 498.6 79.7 35 90Perfluorobutanesulfonate PFBS 298.7 79.7 25 35Perfluorohexanesulfonate PFHS 398.7 79.7 30 70Perfluorooctanesulfonamide PFOSA 497.7 77.7 25 55Perfluorohexanoate PFHxA 312.8 268.8 7 35Perfluoroheptanoate PFHpA 362.8 318.8 8 35Perfluorooctanoate PFOA 413 368.7 10 35Perfluorononanoate PFNA 462.7 418.8 10 35Perfluorodecanoate PFDA 512.8 468.8 10 35Perfluoroundecanoate PFUnDA 563 519 10 35Perfluorododecanoate PFDoDA 612.7 568.8 10 35
242 M. K. So et al.
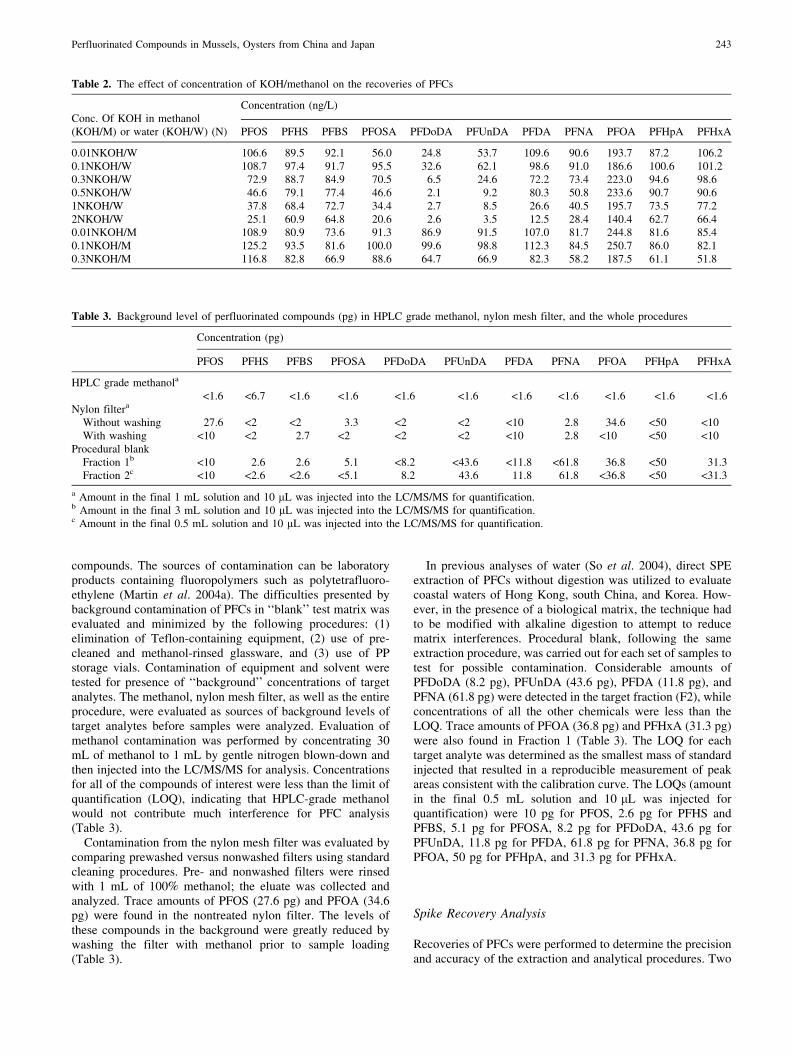
compounds. The sources of contamination can be laboratoryproducts containing fluoropolymers such as polytetrafluoro-ethylene (Martin et al. 2004a). The difficulties presented bybackground contamination of PFCs in ‘‘blank’’ test matrix wasevaluated and minimized by the following procedures: (1)elimination of Teflon-containing equipment, (2) use of pre-cleaned and methanol-rinsed glassware, and (3) use of PPstorage vials. Contamination of equipment and solvent weretested for presence of ‘‘background’’ concentrations of targetanalytes. The methanol, nylon mesh filter, as well as the entireprocedure, were evaluated as sources of background levels oftarget analytes before samples were analyzed. Evaluation ofmethanol contamination was performed by concentrating 30mL of methanol to 1 mL by gentle nitrogen blown-down andthen injected into the LC/MS/MS for analysis. Concentrationsfor all of the compounds of interest were less than the limit ofquantification (LOQ), indicating that HPLC-grade methanolwould not contribute much interference for PFC analysis(Table 3).
Contamination from the nylon mesh filter was evaluated bycomparing prewashed versus nonwashed filters using standardcleaning procedures. Pre- and nonwashed filters were rinsedwith 1 mL of 100% methanol; the eluate was collected andanalyzed. Trace amounts of PFOS (27.6 pg) and PFOA (34.6pg) were found in the nontreated nylon filter. The levels ofthese compounds in the background were greatly reduced bywashing the filter with methanol prior to sample loading(Table 3).
In previous analyses of water (So et al. 2004), direct SPEextraction of PFCs without digestion was utilized to evaluatecoastal waters of Hong Kong, south China, and Korea. How-ever, in the presence of a biological matrix, the technique hadto be modified with alkaline digestion to attempt to reducematrix interferences. Procedural blank, following the sameextraction procedure, was carried out for each set of samples totest for possible contamination. Considerable amounts ofPFDoDA (8.2 pg), PFUnDA (43.6 pg), PFDA (11.8 pg), andPFNA (61.8 pg) were detected in the target fraction (F2), whileconcentrations of all the other chemicals were less than theLOQ. Trace amounts of PFOA (36.8 pg) and PFHxA (31.3 pg)were also found in Fraction 1 (Table 3). The LOQ for eachtarget analyte was determined as the smallest mass of standardinjected that resulted in a reproducible measurement of peakareas consistent with the calibration curve. The LOQs (amountin the final 0.5 mL solution and 10 lL was injected forquantification) were 10 pg for PFOS, 2.6 pg for PFHS andPFBS, 5.1 pg for PFOSA, 8.2 pg for PFDoDA, 43.6 pg forPFUnDA, 11.8 pg for PFDA, 61.8 pg for PFNA, 36.8 pg forPFOA, 50 pg for PFHpA, and 31.3 pg for PFHxA.
Spike Recovery Analysis
Recoveries of PFCs were performed to determine the precisionand accuracy of the extraction and analytical procedures. Two
Table 2. The effect of concentration of KOH/methanol on the recoveries of PFCs
Conc. Of KOH in methanolConcentration (ng/L)
(KOH/M) or water (KOH/W) (N) PFOS PFHS PFBS PFOSA PFDoDA PFUnDA PFDA PFNA PFOA PFHpA PFHxA
0.01NKOH/W 106.6 89.5 92.1 56.0 24.8 53.7 109.6 90.6 193.7 87.2 106.20.1NKOH/W 108.7 97.4 91.7 95.5 32.6 62.1 98.6 91.0 186.6 100.6 101.20.3NKOH/W 72.9 88.7 84.9 70.5 6.5 24.6 72.2 73.4 223.0 94.6 98.60.5NKOH/W 46.6 79.1 77.4 46.6 2.1 9.2 80.3 50.8 233.6 90.7 90.61NKOH/W 37.8 68.4 72.7 34.4 2.7 8.5 26.6 40.5 195.7 73.5 77.22NKOH/W 25.1 60.9 64.8 20.6 2.6 3.5 12.5 28.4 140.4 62.7 66.40.01NKOH/M 108.9 80.9 73.6 91.3 86.9 91.5 107.0 81.7 244.8 81.6 85.40.1NKOH/M 125.2 93.5 81.6 100.0 99.6 98.8 112.3 84.5 250.7 86.0 82.10.3NKOH/M 116.8 82.8 66.9 88.6 64.7 66.9 82.3 58.2 187.5 61.1 51.8
Table 3. Background level of perfluorinated compounds (pg) in HPLC grade methanol, nylon mesh filter, and the whole procedures
Concentration (pg)
PFOS PFHS PFBS PFOSA PFDoDA PFUnDA PFDA PFNA PFOA PFHpA PFHxA
HPLC grade methanola
<1.6 <6.7 <1.6 <1.6 <1.6 <1.6 <1.6 <1.6 <1.6 <1.6 <1.6Nylon filtera
Without washing 27.6 <2 <2 3.3 <2 <2 <10 2.8 34.6 <50 <10With washing <10 <2 2.7 <2 <2 <2 <10 2.8 <10 <50 <10
Procedural blankFraction 1b <10 2.6 2.6 5.1 <8.2 <43.6 <11.8 <61.8 36.8 <50 31.3Fraction 2c <10 <2.6 <2.6 <5.1 8.2 43.6 11.8 61.8 <36.8 <50 <31.3
a Amount in the final 1 mL solution and 10 lL was injected into the LC/MS/MS for quantification.b Amount in the final 3 mL solution and 10 lL was injected into the LC/MS/MS for quantification.c Amount in the final 0.5 mL solution and 10 lL was injected into the LC/MS/MS for quantification.
Perfluorinated Compounds in Mussels, Oysters from China and Japan 243
separate spike recovery evaluations are reported, which eval-uate (1) the alkaline digestion effect and (2) the biologicalmatrix effect.
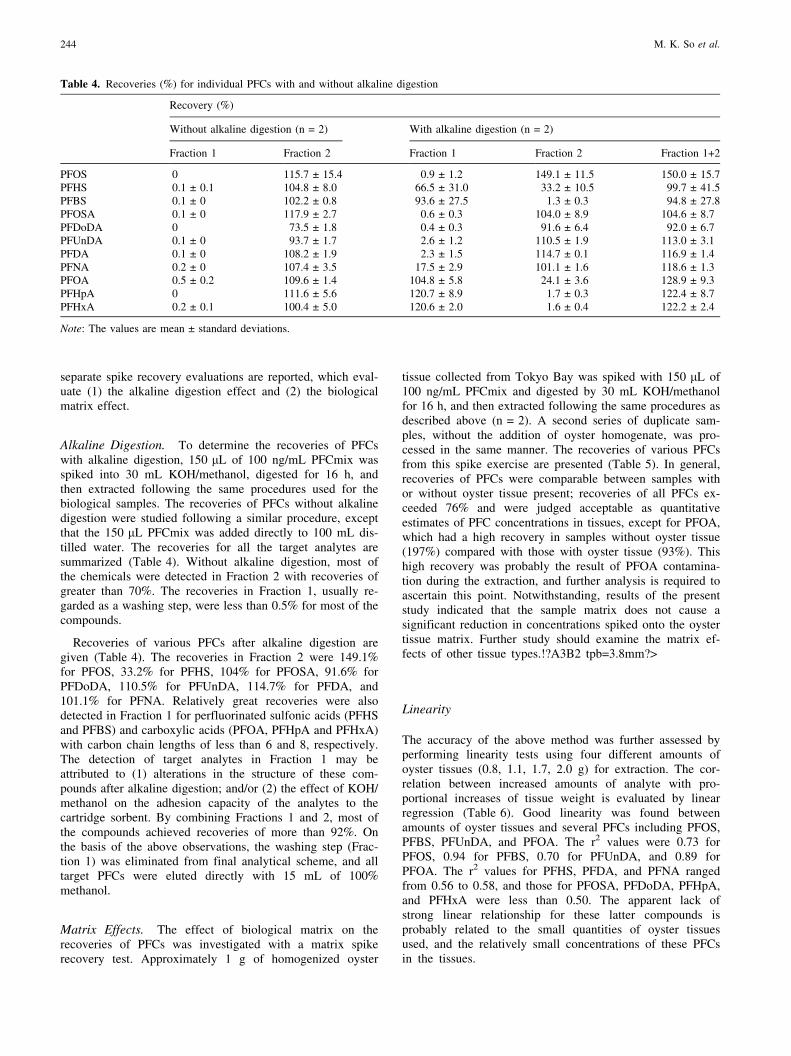
Alkaline Digestion. To determine the recoveries of PFCswith alkaline digestion, 150 lL of 100 ng/mL PFCmix wasspiked into 30 mL KOH/methanol, digested for 16 h, andthen extracted following the same procedures used for thebiological samples. The recoveries of PFCs without alkalinedigestion were studied following a similar procedure, exceptthat the 150 lL PFCmix was added directly to 100 mL dis-tilled water. The recoveries for all the target analytes aresummarized (Table 4). Without alkaline digestion, most ofthe chemicals were detected in Fraction 2 with recoveries ofgreater than 70%. The recoveries in Fraction 1, usually re-garded as a washing step, were less than 0.5% for most of thecompounds.
Recoveries of various PFCs after alkaline digestion aregiven (Table 4). The recoveries in Fraction 2 were 149.1%for PFOS, 33.2% for PFHS, 104% for PFOSA, 91.6% forPFDoDA, 110.5% for PFUnDA, 114.7% for PFDA, and101.1% for PFNA. Relatively great recoveries were alsodetected in Fraction 1 for perfluorinated sulfonic acids (PFHSand PFBS) and carboxylic acids (PFOA, PFHpA and PFHxA)with carbon chain lengths of less than 6 and 8, respectively.The detection of target analytes in Fraction 1 may beattributed to (1) alterations in the structure of these com-pounds after alkaline digestion; and/or (2) the effect of KOH/methanol on the adhesion capacity of the analytes to thecartridge sorbent. By combining Fractions 1 and 2, most ofthe compounds achieved recoveries of more than 92%. Onthe basis of the above observations, the washing step (Frac-tion 1) was eliminated from final analytical scheme, and alltarget PFCs were eluted directly with 15 mL of 100%methanol.
Matrix Effects. The effect of biological matrix on therecoveries of PFCs was investigated with a matrix spikerecovery test. Approximately 1 g of homogenized oyster
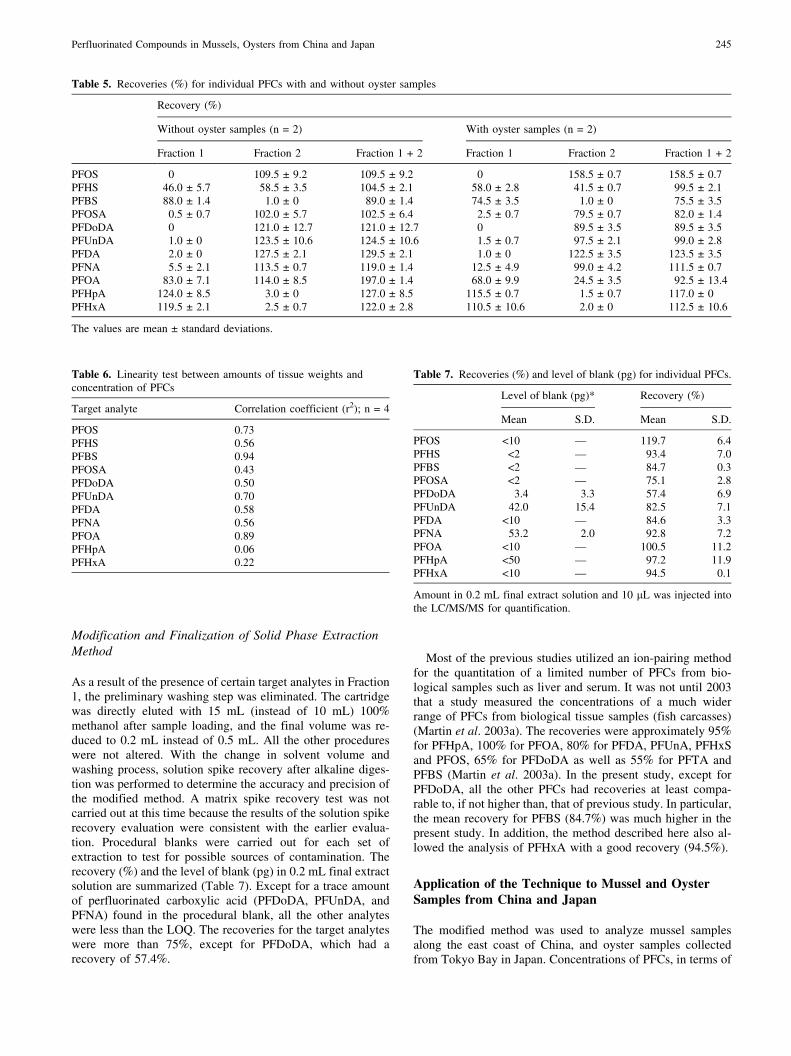
tissue collected from Tokyo Bay was spiked with 150 lL of100 ng/mL PFCmix and digested by 30 mL KOH/methanolfor 16 h, and then extracted following the same procedures asdescribed above (n = 2). A second series of duplicate sam-ples, without the addition of oyster homogenate, was pro-cessed in the same manner. The recoveries of various PFCsfrom this spike exercise are presented (Table 5). In general,recoveries of PFCs were comparable between samples withor without oyster tissue present; recoveries of all PFCs ex-ceeded 76% and were judged acceptable as quantitativeestimates of PFC concentrations in tissues, except for PFOA,which had a high recovery in samples without oyster tissue(197%) compared with those with oyster tissue (93%). Thishigh recovery was probably the result of PFOA contamina-tion during the extraction, and further analysis is required toascertain this point. Notwithstanding, results of the presentstudy indicated that the sample matrix does not cause asignificant reduction in concentrations spiked onto the oystertissue matrix. Further study should examine the matrix ef-fects of other tissue types.!?A3B2 tpb=3.8mm?>
Linearity
The accuracy of the above method was further assessed byperforming linearity tests using four different amounts ofoyster tissues (0.8, 1.1, 1.7, 2.0 g) for extraction. The cor-relation between increased amounts of analyte with pro-portional increases of tissue weight is evaluated by linearregression (Table 6). Good linearity was found betweenamounts of oyster tissues and several PFCs including PFOS,PFBS, PFUnDA, and PFOA. The r2 values were 0.73 forPFOS, 0.94 for PFBS, 0.70 for PFUnDA, and 0.89 forPFOA. The r2 values for PFHS, PFDA, and PFNA rangedfrom 0.56 to 0.58, and those for PFOSA, PFDoDA, PFHpA,and PFHxA were less than 0.50. The apparent lack ofstrong linear relationship for these latter compounds isprobably related to the small quantities of oyster tissuesused, and the relatively small concentrations of these PFCsin the tissues.
Table 4. Recoveries (%) for individual PFCs with and without alkaline digestion
Recovery (%)
Without alkaline digestion (n = 2) With alkaline digestion (n = 2)
Fraction 1 Fraction 2 Fraction 1 Fraction 2 Fraction 1+2
PFOS 0 115.7 € 15.4 0.9 € 1.2 149.1 € 11.5 150.0 € 15.7PFHS 0.1 € 0.1 104.8 € 8.0 66.5 € 31.0 33.2 € 10.5 99.7 € 41.5PFBS 0.1 € 0 102.2 € 0.8 93.6 € 27.5 1.3 € 0.3 94.8 € 27.8PFOSA 0.1 € 0 117.9 € 2.7 0.6 € 0.3 104.0 € 8.9 104.6 € 8.7PFDoDA 0 73.5 € 1.8 0.4 € 0.3 91.6 € 6.4 92.0 € 6.7PFUnDA 0.1 € 0 93.7 € 1.7 2.6 € 1.2 110.5 € 1.9 113.0 € 3.1PFDA 0.1 € 0 108.2 € 1.9 2.3 € 1.5 114.7 € 0.1 116.9 € 1.4PFNA 0.2 € 0 107.4 € 3.5 17.5 € 2.9 101.1 € 1.6 118.6 € 1.3PFOA 0.5 € 0.2 109.6 € 1.4 104.8 € 5.8 24.1 € 3.6 128.9 € 9.3PFHpA 0 111.6 € 5.6 120.7 € 8.9 1.7 € 0.3 122.4 € 8.7PFHxA 0.2 € 0.1 100.4 € 5.0 120.6 € 2.0 1.6 € 0.4 122.2 € 2.4
Note: The values are mean € standard deviations.
244 M. K. So et al.
Modification and Finalization of Solid Phase ExtractionMethod
As a result of the presence of certain target analytes in Fraction1, the preliminary washing step was eliminated. The cartridgewas directly eluted with 15 mL (instead of 10 mL) 100%methanol after sample loading, and the final volume was re-duced to 0.2 mL instead of 0.5 mL. All the other procedureswere not altered. With the change in solvent volume andwashing process, solution spike recovery after alkaline diges-tion was performed to determine the accuracy and precision ofthe modified method. A matrix spike recovery test was notcarried out at this time because the results of the solution spikerecovery evaluation were consistent with the earlier evalua-tion. Procedural blanks were carried out for each set ofextraction to test for possible sources of contamination. Therecovery (%) and the level of blank (pg) in 0.2 mL final extractsolution are summarized (Table 7). Except for a trace amountof perfluorinated carboxylic acid (PFDoDA, PFUnDA, andPFNA) found in the procedural blank, all the other analyteswere less than the LOQ. The recoveries for the target analyteswere more than 75%, except for PFDoDA, which had arecovery of 57.4%.
Most of the previous studies utilized an ion-pairing methodfor the quantitation of a limited number of PFCs from bio-logical samples such as liver and serum. It was not until 2003that a study measured the concentrations of a much widerrange of PFCs from biological tissue samples (fish carcasses)(Martin et al. 2003a). The recoveries were approximately 95%for PFHpA, 100% for PFOA, 80% for PFDA, PFUnA, PFHxSand PFOS, 65% for PFDoDA as well as 55% for PFTA andPFBS (Martin et al. 2003a). In the present study, except forPFDoDA, all the other PFCs had recoveries at least compa-rable to, if not higher than, that of previous study. In particular,the mean recovery for PFBS (84.7%) was much higher in thepresent study. In addition, the method described here also al-lowed the analysis of PFHxA with a good recovery (94.5%).
Application of the Technique to Mussel and OysterSamples from China and Japan
The modified method was used to analyze mussel samplesalong the east coast of China, and oyster samples collectedfrom Tokyo Bay in Japan. Concentrations of PFCs, in terms of
Table 5. Recoveries (%) for individual PFCs with and without oyster samples
Recovery (%)
Without oyster samples (n = 2) With oyster samples (n = 2)
Fraction 1 Fraction 2 Fraction 1 + 2 Fraction 1 Fraction 2 Fraction 1 + 2
PFOS 0 109.5 € 9.2 109.5 € 9.2 0 158.5 € 0.7 158.5 € 0.7PFHS 46.0 € 5.7 58.5 € 3.5 104.5 € 2.1 58.0 € 2.8 41.5 € 0.7 99.5 € 2.1PFBS 88.0 € 1.4 1.0 € 0 89.0 € 1.4 74.5 € 3.5 1.0 € 0 75.5 € 3.5PFOSA 0.5 € 0.7 102.0 € 5.7 102.5 € 6.4 2.5 € 0.7 79.5 € 0.7 82.0 € 1.4PFDoDA 0 121.0 € 12.7 121.0 € 12.7 0 89.5 € 3.5 89.5 € 3.5PFUnDA 1.0 € 0 123.5 € 10.6 124.5 € 10.6 1.5 € 0.7 97.5 € 2.1 99.0 € 2.8PFDA 2.0 € 0 127.5 € 2.1 129.5 € 2.1 1.0 € 0 122.5 € 3.5 123.5 € 3.5PFNA 5.5 € 2.1 113.5 € 0.7 119.0 € 1.4 12.5 € 4.9 99.0 € 4.2 111.5 € 0.7PFOA 83.0 € 7.1 114.0 € 8.5 197.0 € 1.4 68.0 € 9.9 24.5 € 3.5 92.5 € 13.4PFHpA 124.0 € 8.5 3.0 € 0 127.0 € 8.5 115.5 € 0.7 1.5 € 0.7 117.0 € 0PFHxA 119.5 € 2.1 2.5 € 0.7 122.0 € 2.8 110.5 € 10.6 2.0 € 0 112.5 € 10.6
The values are mean € standard deviations.
Table 6. Linearity test between amounts of tissue weights andconcentration of PFCs
Target analyte Correlation coefficient (r2); n = 4
PFOS 0.73PFHS 0.56PFBS 0.94PFOSA 0.43PFDoDA 0.50PFUnDA 0.70PFDA 0.58PFNA 0.56PFOA 0.89PFHpA 0.06PFHxA 0.22
Table 7. Recoveries (%) and level of blank (pg) for individual PFCs.
Level of blank (pg)* Recovery (%)
Mean S.D. Mean S.D.
PFOS <10 — 119.7 6.4PFHS <2 — 93.4 7.0PFBS <2 — 84.7 0.3PFOSA <2 — 75.1 2.8PFDoDA 3.4 3.3 57.4 6.9PFUnDA 42.0 15.4 82.5 7.1PFDA <10 — 84.6 3.3PFNA 53.2 2.0 92.8 7.2PFOA <10 — 100.5 11.2PFHpA <50 — 97.2 11.9PFHxA <10 — 94.5 0.1
Amount in 0.2 mL final extract solution and 10 lL was injected intothe LC/MS/MS for quantification.
Perfluorinated Compounds in Mussels, Oysters from China and Japan 245
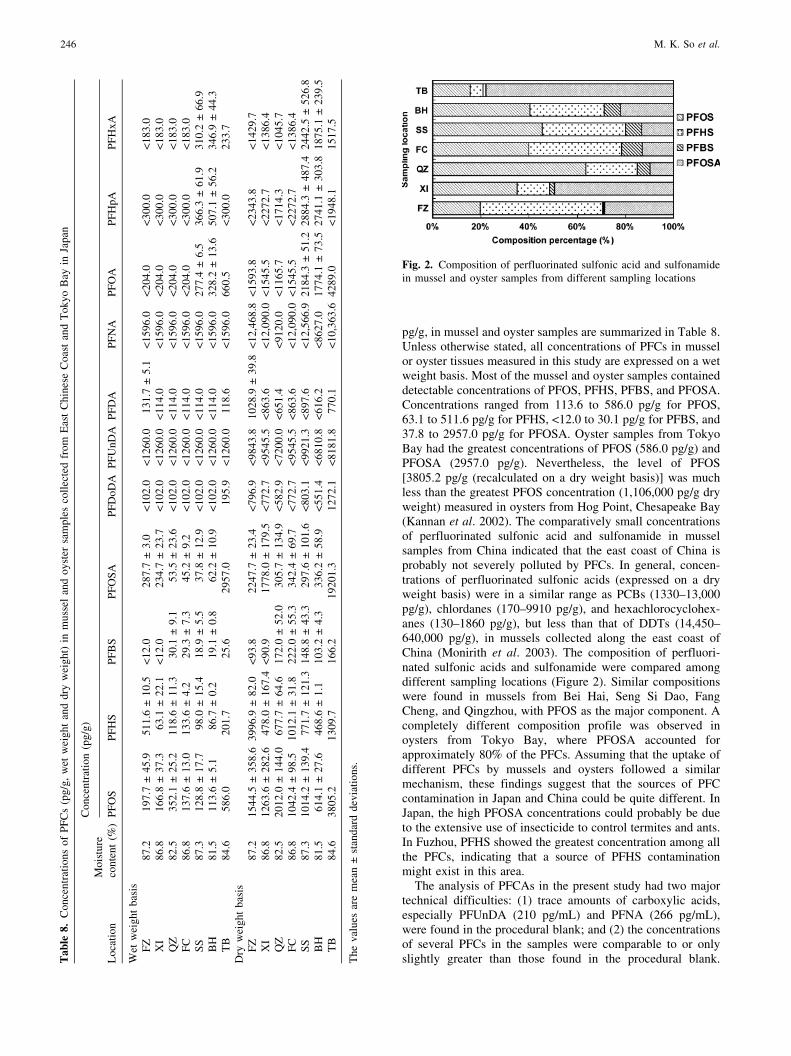
pg/g, in mussel and oyster samples are summarized in Table 8.Unless otherwise stated, all concentrations of PFCs in musselor oyster tissues measured in this study are expressed on a wetweight basis. Most of the mussel and oyster samples containeddetectable concentrations of PFOS, PFHS, PFBS, and PFOSA.Concentrations ranged from 113.6 to 586.0 pg/g for PFOS,63.1 to 511.6 pg/g for PFHS, <12.0 to 30.1 pg/g for PFBS, and37.8 to 2957.0 pg/g for PFOSA. Oyster samples from TokyoBay had the greatest concentrations of PFOS (586.0 pg/g) andPFOSA (2957.0 pg/g). Nevertheless, the level of PFOS[3805.2 pg/g (recalculated on a dry weight basis)] was muchless than the greatest PFOS concentration (1,106,000 pg/g dryweight) measured in oysters from Hog Point, Chesapeake Bay(Kannan et al. 2002). The comparatively small concentrationsof perfluorinated sulfonic acid and sulfonamide in musselsamples from China indicated that the east coast of China isprobably not severely polluted by PFCs. In general, concen-trations of perfluorinated sulfonic acids (expressed on a dryweight basis) were in a similar range as PCBs (1330–13,000pg/g), chlordanes (170–9910 pg/g), and hexachlorocyclohex-anes (130–1860 pg/g), but less than that of DDTs (14,450–640,000 pg/g), in mussels collected along the east coast ofChina (Monirith et al. 2003). The composition of perfluori-nated sulfonic acids and sulfonamide were compared amongdifferent sampling locations (Figure 2). Similar compositionswere found in mussels from Bei Hai, Seng Si Dao, FangCheng, and Qingzhou, with PFOS as the major component. Acompletely different composition profile was observed inoysters from Tokyo Bay, where PFOSA accounted forapproximately 80% of the PFCs. Assuming that the uptake ofdifferent PFCs by mussels and oysters followed a similarmechanism, these findings suggest that the sources of PFCcontamination in Japan and China could be quite different. InJapan, the high PFOSA concentrations could probably be dueto the extensive use of insecticide to control termites and ants.In Fuzhou, PFHS showed the greatest concentration among allthe PFCs, indicating that a source of PFHS contaminationmight exist in this area.
The analysis of PFCAs in the present study had two majortechnical difficulties: (1) trace amounts of carboxylic acids,especially PFUnDA (210 pg/mL) and PFNA (266 pg/mL),were found in the procedural blank; and (2) the concentrationsof several PFCs in the samples were comparable to or onlyslightly greater than those found in the procedural blank.T
able8.
Con
cent
ration
sof
PFCs
(pg/
g,w
etw
eigh
tan
ddr
yw
eigh
t)in
mus
selan
doy
ster
sam
ples
collec
ted
from
Eas
tChi
nese
Coa
stan
dTok
yoBay
inJa
pan
Moi
stur
eCon
cent
ration
(pg/
g)
Loc
atio
nco
nten
t(%
)PFO
SPFH
SPFBS
PFO
SA
PFD
oDA
PFU
nDA
PFD
APFN
APFO
APFH
pAPFH
xA
Wet
wei
ghtba
sis
FZ
87.2
197.
7€
45.9
511.
6€
10.5
<12
.028
7.7
€3.
0<10
2.0
<12
60.0
131.
7€
5.1
<15
96.0
<20
4.0
<30
0.0
<18
3.0
XI
86.8
166.
8€
37.3
63.1
€22
.1<12
.023
4.7
€23
.7<10
2.0
<12
60.0
<11
4.0
<15
96.0
<20
4.0
<30
0.0
<18
3.0
QZ
82.5
352.
1€
25.2
118.
6€
11.3
30.1
€9.
153
.5€
23.6
<10
2.0
<12
60.0
<11
4.0
<15
96.0
<20
4.0
<30
0.0
<18
3.0
FC
86.8
137.
6€
13.0
133.
6€
4.2
29.3
€7.
345
.2€
9.2
<10
2.0
<12
60.0
<11
4.0
<15
96.0
<20
4.0
<30
0.0
<18
3.0
SS
87.3
128.
8€
17.7
98.0
€15
.418
.9€
5.5
37.8
€12
.9<10
2.0
<12
60.0
<11
4.0
<15
96.0
277.
4€
6.5
366.
3€
61.9
310.
2€
66.9
BH
81.5
113.
6€
5.1
86.7
€0.
219
.1€
0.8
62.2
€10
.9<10
2.0
<12
60.0
<11
4.0
<15
96.0
328.
2€
13.6
507.
1€
56.2
346.
9€
44.3
TB
84.6
586.
020
1.7
25.6
2957
.019
5.9
<12
60.0
118.
6<15
96.0
660.
5<30
0.0
233.
7D
ryw
eigh
tba
sis
FZ
87.2
1544
.5€
358.
639
96.9
€82
.0<93
.822
47.7
€23
.4<79
6.9
<98
43.8
1028
.9€
39.8
<12
,468
.8<15
93.8
<23
43.8
<14
29.7
XI
86.8
1263
.6€
282.
647
8.0
€16
7.4
<90
.917
78.0
€17
9.5
<77
2.7
<95
45.5
<86
3.6
<12
,090
.0<15
45.5
<22
72.7
<13
86.4
QZ
82.5
2012
.0€
144.
067
7.7
€64
.617
2.0
€52
.030
5.7
€13
4.9
<58
2.9
<72
00.0
<65
1.4
<91
20.0
<11
65.7
<17
14.3
<10
45.7
FC
86.8
1042
.4€
98.5
1012
.1€
31.8
222.
0€
55.3
342.
4€
69.7
<77
2.7
<95
45.5
<86
3.6
<12
,090
.0<15
45.5
<22
72.7
<13
86.4
SS
87.3
1014
.2€
139.
477
1.7
€12
1.3
148.
8€
43.3
297.
6€
101.
6<80
3.1
<99
21.3
<89
7.6
<12
,566
.921
84.3
€51
.228
84.3
€48
7.4
2442
.5€
526.
8BH
81.5
614.
1€
27.6
468.
6€
1.1
103.
2€
4.3
336.
2€
58.9
<55
1.4
<68
10.8
<61
6.2
<86
27.0
1774
.1€
73.5
2741
.1€
303.
818
75.1
€23
9.5
TB
84.6
3805
.213
09.7
166.
219
201.
312
72.1
<81
81.8
770.
1<10
,363
.642
89.0
<19
48.1
1517
.5
The
valu
esar
em
ean
€stan
dard
devi
atio
ns.
Fig. 2. Composition of perfluorinated sulfonic acid and sulfonamidein mussel and oyster samples from different sampling locations
246 M. K. So et al.

Concentrations of PFUnDA and PFNA in all the samples wereless than the LOQ. PFDoDA was only detected in oysters fromTokyo Bay (195.9 pg/g), whereas PFDA was detected insamples from Fuzhou (131.7 pg/g) and Tokyo Bay (118.6 pg/g). The greatest concentrations of PFOA were found in sam-ples from Tokyo Bay, whereas the greatest concentrations ofPFHpA and PFHxA were found in samples from Bei Hai. Thetotal concentrations of perfluorinated carboxylic and sulfoniccompounds in mussels and oysters from individual samplinglocations were compared (Figure 3). Total concentrations ofsulfonic compounds were higher than carboxylic compoundsin samples from Fuzhou and Tokyo Bay and vice versa forthose from Seng Si Dao and Bei Hai. This pattern indicatesthat sulfonyl-containing compounds were or are commonlyused in areas near Fuzhou and Tokyo Bay.
Although a bioconcentration study of PFCs on rainbowtrout demonstrated that the bioconcentration potential ofPFCs increased with increasing perfluoroalkyl chain length(Martin et al. 2003a), such a pattern was not observed forperfluorinated carboxylates in the present study. Except forthe Fuzhou mussels, samples from other locations showedgreater concentrations of longer-chained perfluorinated sul-fonates. The reason for the absence of such a pattern forcarboxylates is not known, but could be due to differentorganisms and different environments that were investigatedin the respective studies.
Summary
Alkaline digestion, coupled with Oasis HLB solid-phaseextraction, were developed and evaluated for a range oflong-chained and short-chained PFCs from biota samples.This rapid and relatively simple extraction method per-formed as well as other published methods for tissue anal-ysis of PFCs. Acceptable recoveries were achieved for mostof the target analytes, but trace amounts of certain PFCs inthe procedural blank restricted the applicability of thismethod to samples containing relatively high concentrationswith respect to those compounds. Further work will be re-quired to minimize the blank level by improving the solidphase extraction procedure.
Acknowledgment. This study was supported by the Area of Excel-lence Scheme under the University Grants Committee of the Hong
Kong Special Administration Region, China (Project No. AoE/P-04/2004), and a RGC-CERG (cityU1401/05M).
References
Fu J, Mai B, Sheng G, Zhang G, Wang X, Peng P, Xiao X, Ran R,Cheng F, Peng X, Wang Z, Tang UW (2003) Persistent organicpollutants in environment of the Pearl River Delta, China: Anoverview. Chemosphere 52:1411–1422
Hoff PT, Van de Vijver K, Van Dongen W, Esmans EL, Blust R, DeCoen WM (2003) Perfluorooctane sulfonic acid in bib (Tris-opterus luscus) and plaice (Pleuronectes platessa) from theWestern Scheldt and the Belgian North Sea: Distribution andbiochemical effects. Environ Toxicol Chem 22:608–614
Kannan K, Koistinen J, Beckmen K, Evans T, Gorzelany JF, HansenKJ, Jones PD, Helle E, Nyman M, Giesy JP (2001) Accumulationof perfluorooctane sulfonate in marine mammals. Environ SciTechnol 35:1593–1598
Kannan K, Hansen KJ, Wade TL, Giesy JP (2002) Perfluorooctanesulfonate in oysters, Crassostrea virginica, from the Gulf ofMexico and the Chesapeake Bay, USA. Arch Environ ContamToxicol 42:313–318
Kuklenyik Z, Reich JA, Tully JS, Needham LL, Calafat AM (2004)Automated solid-phase extraction and measurement of perfluo-rinated organic acids and amides in human serum and milk.Environ Sci Technol 38:3698–3704
Mai BX, Fu JM, Sheng GY, Kang YH, Lin Z, Zhang G, Min YS, ZengEY (2002) Chlorinated and polycyclic aromatic hydrocarbons inriverine and estuarine sediments from Pearl River Delta, China.Environ Pollut 117:457–474
Martin JW, Mabury SA, Solomon KR, Muir DCG (2003a) Dietaryaccumulation of perfluorinated acids in juvenile rainbow trout(Oncorhynchus mykiss). Environ Toxicol Chem 22:189–195
Martin JW, Mabury SA, Solomon KR, Muir DCG (2003b) Biocon-centration and tissue distribution of perfluorinated acids in rainbowtrout (Oncorhynchus mykiss). Environ Toxicol Chem 22:196–204
Martin JW, Kannan K, Berger U, Voogt PD, Field J, Franklin J, GiesyJP, Harner T, Muir DCG, Scott B, Kaiser M, JTrnberg U, JonesKC, Mabury SA, Schroeder H, Simcik M, Sottani C, Bavel BV,KTrrman A, Lindstrçm G, Leeuwen SV (2004a) Analyticalchallenges hamper perfluoroalkyl research. Environ Sci Technol248A–255A
Martin JW, Smithwick MM, Braune BM, Hoekstra PF, Muir DCG,Mabury SA (2004b) Identification of long-chain perfluorinatedacids in biota from the Canadian Arctic. Environ Sci Technol38:373–380
Monirith I, Ueno D, Takahashi S, Nakata H, Sudaryanto A, Subra-manian A, Karuppiah S, Ismail A, Muchtar M, Zheng J, Rich-ardson BJ, Prudente M, Hue ND, Tana TS, Tkalin AV, Tanabe S
Fig. 3. The comparison of total concentration of perfluori-nated carboxylic and sulfonic compounds in mussel and oystersamples from individual sampling location
Perfluorinated Compounds in Mussels, Oysters from China and Japan 247
(2003) Asia-Pacific mussel watch: monitoring contamination ofpersistent organochlorine compounds in coastal waters of Asiancountries. Mar Pollut Bull 46:281–300
Moody CA, Martin JW, Kwan WC, Muir DCG, Mabury SA (2002)Monitoring perfluorinated surfactants in biota and surface watersamples following an accidental release of fire-fighting foam intoEtobicoke Creek. Environ Sci Technol 36:545–551
Olsen GW, Burris JM, Mandel JH, Zobel LR (1999) Serum perfluo-rooctane sulfonate and hepatic and lipid clinical chemistry tests influorochemical production employees. J Occup Environ Med41:799–806
Olsen GW, Hansen KJ, Stevenson LA, Burris JM, Mandel JH (2003)Human donor liver and serum concentrations of perfluorooc-tanesulfonate and other perfluorochemicals. Environ Sci Technol37:888–891
So MK, Taniyasu S, Yamashita N, Giesy JP, Zheng J, Fang Z, Im SH,Lam PKS (2004) Perfluorinated compounds in coastal waters ofHong Kong, South China and Korea. Environ Sci Technol38:4056–4063
Tomy GT, Tittlemier SA, Palace VP, Budakowski WR, BraekeveltE, Brinkworth L, Friesen K (2004) Biotransformation of N-ethyl perfluorooctanesulfonamide by rainbow trout (On-chorhynchus mykiss) liver microsomes. Environ Sci Technol 38:758–762
Van de Vijver KI, Hoff PT, Van Dongen W, Esmans EL, Blust R,De Coen WM (2003) Exposure patterns of perfluorooctanesulfonate in aquatic invertebrates from the Western Scheldtestuary and the Southern North Sea. Environ Toxicol Chem 22:2037–2041
Van de Vijver KI, Hoff PT, Das K, Van Dongen W, Esmans EL,Siebert U, Bouquegneau JM, Blust R, De Coen WM (2004)Baseline study of perfluorochemicals in harbour porpoises(Phocoena phocoena) from Northern Europe. Mar Pollut Bull48:992–997
Yang YH, Sheng GY, Fu JM, Min YS (1997) Organochlorinatedcompounds in waters of the Pearl River Delta region. EnvironMonit Assess 44:569–575
248 M. K. So et al.
Copyright © 2022 FDOKUMEN