Proteomic discovery of biomarkers of metal contamination in Sydney Rock oysters ( Saccostrea...
11
Aquatic Toxicology 109 (2012) 202–212 Contents lists available at SciVerse ScienceDirect Aquatic Toxicology j ourna l ho me p ag e: www.elsevier.com/l ocate/aquatox Proteomic discovery of biomarkers of metal contamination in Sydney Rock oysters (Saccostrea glomerata) Emma L. Thompson a,b,∗ , Daisy A. Taylor a,b , Sham V. Nair c , Gavin Birch d , Paul A. Haynes e , David A. Raftos a,b a Department of Biological Sciences, Macquarie University, NSW 2109, Australia b Sydney Institute of Marine Science, Chowder Bay, NSW 2088, Australia c Department of Biological Sciences, Macquarie University, NSW 2109, Australia d Department of Geochemistry, University of Sydney, NSW 2006, Australia e Department of Chemistry and Biomolecular Sciences, Macquarie University, NSW 2109, Australia a r t i c l e i n f o Article history: Received 26 July 2011 Received in revised form 22 September 2011 Accepted 27 September 2011 Keywords: Metal contamination Molecular biomarkers Saccostrea glomerata Sydney Rock oysters Proteomics Two-dimensional electrophoresis a b s t r a c t In the current study we examined the effects of metal contamination on the protein complement of Sydney Rock oysters. Saccostrea glomerata were exposed for 4 days to three environmentally relevant concentrations (100 g/l, 50 g/l and 5 g/l) of cadmium, copper, lead and zinc. Protein abundances in oyster haemolymph from metal-exposed oysters were compared to those from non-exposed con- trols using two-dimensional electrophoresis to display differentially expressed proteins. Differentially expressed proteins were subsequently identified using tandem mass spectrometry (LC–MS/MS), to assign their putative biological functions. Unique sets of differentially expressed proteins were affected by each metal, in addition to proteins that were affected by more than one metal. The proteins identified included some that are commonly associated with environmental monitoring, such as HSP 70, and other novel proteins not previously considered as candidates for molecular biomonitoring. The most common biological functions of proteins were associated with stress response, cytoskeletal activity and protein synthesis. © 2011 Elsevier B.V. All rights reserved. 1. Introduction Metal contamination from anthropogenic sources poses a sig- nificant threat to the biological sustainability of coastal waterways around the world (Li et al., 2000). A variety of potentially toxic metals enter coastal waterways via urban and industrial processes. These include copper (Cu) from electrical products and agricul- tural fertilizers; zinc (Zn) from car tyres and pharmaceuticals; and cadmium (Cd) from household batteries (Birch and Taylor, 1999; Snowdon and Birch, 2004). In Australia, metal contamina- tion in the marine environment poses a particularly significant threat because over 86% of the population lives in heavy urbanised areas within 3 km of coastal rivers, estuaries or embayments Abbreviations: Cd/CdCl2, cadmium chloride; Cu/CuCl2, copper chloride; Pb/PbCl2, lead chloride; Zn/ZnCl2, zinc chloride; 2-DE, two-dimensional electrophoresis; CHAPS, 3-[(3-cholamidopropyl)dimethyl-ammonio]-1- propanesulfonate; DTT, DT dithiothreitol; IAA, iodoacetamide; IEF, isoelectric focussing; SDS, sodium dodecyl sulfate; MS, mass spectrometry; SDS-PAGE, sodium dodecyl sulfate-polyacrylamide gel electrophoresis; HSP, heat shock protein. ∗ Corresponding author at: Department of Biological Sciences, Macquarie Univer- sity, NSW 2109, Australia. Tel.: +61 9850 8213; fax: +61 9850 8245. E-mail address: [email protected] (E.L. Thompson). (Zann, 1996). Persistent and ongoing metal contamination has led government regulatory authorities to seek effective methods to monitor contamination at both the geochemical and biological levels. Chemical analyses of sediments provide fine-scale contaminant mapping of waterways (Birch and Taylor, 1999; Scanes and Roach, 1999) which allows historical and current day levels of contami- nants to be mapped. However, such geochemical analyses do not give an accurate assessment of the potential effects of metal con- tamination on the biota that inhabit coastal waterways, nor on the possible impacts on their ecosystems (Gray, 1992). Ecotoxicological techniques that assess mortality or morbidity among key indicator species provide some information about the potential biological impacts of metal contamination (Sanders et al., 1998; Stark, 1998). However, these types of ecotoxicological tools are generally endpoint assays that identify effects only at acute lev- els of toxicity (Newton and Bartsch, 2007; Roman et al., 2007). They do not provide information about the cellular and physiological processes affected by metal contamination at sub-lethal concen- trations that might affect ecosystem function without resulting in mortality or morbidity. In contrast, biomarkers can be measured from cellular to ecosys- tem level. The use of molecular biomarkers has the potential 0166-445X/$ – see front matter © 2011 Elsevier B.V. All rights reserved. doi:10.1016/j.aquatox.2011.09.018
Transcript of Proteomic discovery of biomarkers of metal contamination in Sydney Rock oysters ( Saccostrea...

Po
EDa
b
c
d
e
a
ARR2A
KMMSSPT
1
namTta1tta
Pepfd
s
0d
Aquatic Toxicology 109 (2012) 202– 212
Contents lists available at SciVerse ScienceDirect
Aquatic Toxicology
j ourna l ho me p ag e: www.elsev ier .com/ l ocate /aquatox
roteomic discovery of biomarkers of metal contamination in Sydney Rockysters (Saccostrea glomerata)
mma L. Thompsona,b,∗, Daisy A. Taylora,b, Sham V. Nairc, Gavin Birchd, Paul A. Haynese,avid A. Raftosa,b
Department of Biological Sciences, Macquarie University, NSW 2109, AustraliaSydney Institute of Marine Science, Chowder Bay, NSW 2088, AustraliaDepartment of Biological Sciences, Macquarie University, NSW 2109, AustraliaDepartment of Geochemistry, University of Sydney, NSW 2006, AustraliaDepartment of Chemistry and Biomolecular Sciences, Macquarie University, NSW 2109, Australia
r t i c l e i n f o
rticle history:eceived 26 July 2011eceived in revised form2 September 2011ccepted 27 September 2011
eywords:
a b s t r a c t
In the current study we examined the effects of metal contamination on the protein complement ofSydney Rock oysters. Saccostrea glomerata were exposed for 4 days to three environmentally relevantconcentrations (100 �g/l, 50 �g/l and 5 �g/l) of cadmium, copper, lead and zinc. Protein abundancesin oyster haemolymph from metal-exposed oysters were compared to those from non-exposed con-trols using two-dimensional electrophoresis to display differentially expressed proteins. Differentiallyexpressed proteins were subsequently identified using tandem mass spectrometry (LC–MS/MS), to assign
etal contaminationolecular biomarkers
accostrea glomerataydney Rock oystersroteomicswo-dimensional electrophoresis
their putative biological functions. Unique sets of differentially expressed proteins were affected byeach metal, in addition to proteins that were affected by more than one metal. The proteins identifiedincluded some that are commonly associated with environmental monitoring, such as HSP 70, and othernovel proteins not previously considered as candidates for molecular biomonitoring. The most commonbiological functions of proteins were associated with stress response, cytoskeletal activity and proteinsynthesis.
. Introduction
Metal contamination from anthropogenic sources poses a sig-ificant threat to the biological sustainability of coastal waterwaysround the world (Li et al., 2000). A variety of potentially toxicetals enter coastal waterways via urban and industrial processes.
hese include copper (Cu) from electrical products and agricul-ural fertilizers; zinc (Zn) from car tyres and pharmaceuticals;nd cadmium (Cd) from household batteries (Birch and Taylor,999; Snowdon and Birch, 2004). In Australia, metal contamina-
ion in the marine environment poses a particularly significanthreat because over 86% of the population lives in heavy urbanisedreas within 3 km of coastal rivers, estuaries or embaymentsAbbreviations: Cd/CdCl2, cadmium chloride; Cu/CuCl2, copper chloride;b/PbCl2, lead chloride; Zn/ZnCl2, zinc chloride; 2-DE, two-dimensionallectrophoresis; CHAPS, 3-[(3-cholamidopropyl)dimethyl-ammonio]-1-ropanesulfonate; DTT, DT dithiothreitol; IAA, iodoacetamide; IEF, isoelectricocussing; SDS, sodium dodecyl sulfate; MS, mass spectrometry; SDS-PAGE, sodiumodecyl sulfate-polyacrylamide gel electrophoresis; HSP, heat shock protein.∗ Corresponding author at: Department of Biological Sciences, Macquarie Univer-
ity, NSW 2109, Australia. Tel.: +61 9850 8213; fax: +61 9850 8245.E-mail address: [email protected] (E.L. Thompson).
166-445X/$ – see front matter © 2011 Elsevier B.V. All rights reserved.oi:10.1016/j.aquatox.2011.09.018
© 2011 Elsevier B.V. All rights reserved.
(Zann, 1996). Persistent and ongoing metal contamination has ledgovernment regulatory authorities to seek effective methods tomonitor contamination at both the geochemical and biologicallevels.
Chemical analyses of sediments provide fine-scale contaminantmapping of waterways (Birch and Taylor, 1999; Scanes and Roach,1999) which allows historical and current day levels of contami-nants to be mapped. However, such geochemical analyses do notgive an accurate assessment of the potential effects of metal con-tamination on the biota that inhabit coastal waterways, nor on thepossible impacts on their ecosystems (Gray, 1992).
Ecotoxicological techniques that assess mortality or morbidityamong key indicator species provide some information about thepotential biological impacts of metal contamination (Sanders et al.,1998; Stark, 1998). However, these types of ecotoxicological toolsare generally endpoint assays that identify effects only at acute lev-els of toxicity (Newton and Bartsch, 2007; Roman et al., 2007). Theydo not provide information about the cellular and physiologicalprocesses affected by metal contamination at sub-lethal concen-
trations that might affect ecosystem function without resulting inmortality or morbidity.In contrast, biomarkers can be measured from cellular to ecosys-tem level. The use of molecular biomarkers has the potential

c Toxi
tl(snC(bmem1
amagisscarttsr
tcmrgNBias2tiH1
e2pi2alotai222
hbtTco
protein concentrations were interpolated from a standard curve
E.L. Thompson et al. / Aquati
o identify cellular effects of metal contamination at sub-lethalevels. For instance, metallothionein and heat shock proteinHSP) levels have been used in field studies as indicators ofub-lethal Cd and Cu contamination in the crab Carcinus mae-as (Pedersen and Lundebye, 1996), and as indicators for Cd,u and Zn stress in the freshwater mussel Pyganodon grandisGiguère et al., 2003). Changes in the expression of moleculariomarkers reflect an organism’s initial response to environ-ental perturbation. They reveal biochemical or physiological
ffects on organisms and thus show a depth of biological infor-ation on the impact of contaminants (van der Oost et al.,
996).Despite its increasing adoption in weight-of-evidence
pproaches to environmental monitoring, the effectiveness ofolecular biomonitoring is limited by the restricted suites of
vailable biomarkers. Most of the currently used biomarkers areeneric molecules that are thought to have similar potential-ties across a broad range of species. These include moleculesuch as HSPs that act as molecular chaperones during cellulartress responses, and metallothioneins, which are a family ofysteine-rich proteins that interact with a range of physiologicalnd xenobiotic metals. Even though the currently used moleculesepresent effective biomarkers over a range of species, it is likelyhat there are other tissue- or species-specific genes and pro-eins that may be more effective molecular biomonitoring tools. Apecies relevant to the study area also makes the study ecologicallyelevant (Wu et al., 2005).
In this study we used two-dimensional protein gel elec-rophoresis (2-DE) to discover novel protein biomarkers of metalontamination in Sydney Rock oysters (Saccostrea glomerata) thatay be more sensitive or specific than the currently limited
ange of molecular biomarkers used in other species. Saccostrealomerata is a ubiquitous and ecologically relevant species inSW estuaries, and is the focus of a major aquaculture industry.ivalve molluscs have been used extensively in biomonitor-
ng due to their efficiency in bio-accumulating contaminantsnd their ability to show time-and dose-dependent relation-hips to contaminant exposure (Tanabe et al., 2000; Chase et al.,001; Gillikin et al., 2005). Their ability to bio-accumulate con-aminants quickly and depurate them slowly makes them andeal test species for this study (Brown and McPherson, 1992;ardiman and Pearson, 1995; Scanes, 1997; Scanes and Roach,999).
Proteomic approaches are powerful tools for biomarker discov-ry in environmental science (Viant et al., 2002; Jonsson et al.,006). Large numbers of proteins can be analysed simultaneously,otentially providing complex protein expression signatures for
ndividual chemicals and synergistic exposures (Bradley et al.,002; Rodríguez-Ortega et al., 2003; Apraiz et al., 2006). Thisllows subtle environmental changes to be detected at lowevels and provides quantitative information on the responsesf individual proteins and underlying biological activities ofhese proteins (Nesatyy and Suter, 2007). Such approaches havelready been used previously to detect biomarkers for contam-nant assessment, in the mussel, Mytilus edulis (Apraiz et al.,006), the oyster, Crassostrea virginica (Cruz-Rodríguez and Chu,002), and the clam, Chamaelea gallina (Rodríguez-Ortega et al.,003).
In this study we identified proteins in Sydney Rock oysteraemolymph that are differentially expressed in oysters that hadeen exposed to a range of environmentally relevant concentra-ions of Cd, Cu, Pb and Zn under controlled laboratory conditions.
he data are analysed in an effort to identify new biomarkers thatan discriminate between different types of metal contaminationver a broad range of doses.cology 109 (2012) 202– 212 203
2. Materials and methods
2.1. Oyster acclimation and exposure to metals
Eighteen month to 2 year old Sydney Rock oysters werepurchased from Aquaculture Enterprises (Eden, NSW, Australia).Oysters were placed in 12 × 25 l aquaria at the Sydney Institute ofMarine Science (Chowder Bay, Sydney, Australia) with each aquar-ium containing 7 oysters. They were left to acclimate to aquariumconditions for 10 days prior to metal exposures. Complete waterchanges were performed daily throughout the duration of theexperiment with water taken directly from Chowder Bay, and oys-ters were fed every 4 days with M-1 bivalve food (Aquasonic,Wauchope, NSW, Australia). Water quality parameters (temper-ature and salinity) were recorded daily. Prior to the start of theexposure trials, water samples were taken from Chowder Bay andthe levels of a suite of metals, polychlorinated biphenyls (PCBs),and poly-aromatic hydrocarbons (PAHs) were assessed by theAustralian Government National Measurement Institute (Pymble,NSW, Australia).
Following the 10 day acclimation period, oysters were exposedfor 4 days to 100 �g/l (three aquaria), 50 �g/l (three aquaria) and5 �g/l (three aquaria) of CdCl2. The remaining three aquaria wereused as controls with no added metal. The experiment was repeatedthree times using CuCl2, PbCl2 then ZnCl2. Stock solutions of metalswere dissolved in seawater before being added to aquaria and watercontaining metals was changed daily.
2.2. Protein extraction
After exposure to metals, oysters were shucked and 500 �lof haemolymph was harvested from the pericardial cavity usinga micropipette. The haemolymph was immediately mixed with1.3 ml of Tri-reagent LS (Sigma–Aldrich). RNA was removedby adding 100 �l of bromochloropropane for 15 min followedby centrifugation for 15 min at 12,000 × g (4 ◦C) and removalof the colourless aqueous phase. DNA was then removed byadding 300 �l of 100% ethanol for 3 min followed by centrifu-gation at 2,000 × g for 5 min (4 ◦C), after which the DNA pelletwas discarded. Finally, proteins were precipitated by adding 3×volumes of ice cold acetone, standing samples at room tem-perature for 10 min, followed by centrifugation for 10 min at12,000 × g (4 ◦C). The protein pellets were washed by incuba-tion four times in 1 ml 0.3 M guanidine hydrochloride in 95%ethanol (V:V) for 10 min per wash, followed by centrifugation at8,000 × g for 5 min (4 ◦C) and removal of the supernatant. Theresulting protein pellets were then air dried at room tempera-ture before re-suspension in 50 �l re-hydration buffer (7 M urea,2 M thiourea, 4% 3-[(3-cholamidopropyl)dimethyl-ammonio]-1-propanesulfonate (CHAPS); 50 mM dithiothreitol (DTT)).
2.3. Protein quantification and pooling of samples
The concentrations of proteins in the re-suspended pellets werequantified using Amersham 2-DE Quant Kits according to manufac-turer’s instructions (GE Healthcare, Buckinghamshire, UK). Briefly,2 �l of each sample was added to each three wells of a 96-wellmicrotiter plate. Ten microlitres of Cu solution, 40 �l of Milli Qwater and 100 �l of colour reagent was also added to each welland the plate was left to incubate at room temperature for 20 min.Absorbance was measured at 490 nm on a microplate reader and
generated with bovine serum albumin. Haemolymph from five ran-domly selected oysters in each aquarium were pooled to give atotal of three replicates per metal concentration (each replicate

2 c Toxi
rEb
2
t(sH12Gaweu(1wa
2
N(ceittc
2
dfptt1fatwbiTrf
2s
n(Cw1aet
04 E.L. Thompson et al. / Aquati
epresenting a single aquarium) plus three replicates of controls.ach pooled haemolymph sample contained 150 �g of proteinased on relative protein concentrations of each individual oyster.
.4. Two-dimensional electrophoresis (2-DE)
Two-dimensional electrophoresis was performed according tohe method of Thompson et al. (2011). Briefly, isoelectrofocusingIEF) was undertaken using immobilized pH linear gradient geltrips (7 cm, pH 4–7; GE Healthcare) on an IPGphor IEF system (GEealthcare). Gel strips were passively re-hydrated overnight with50 �g of extracted proteins in 125 �l rehydration buffer (7 M urea,
M thiourea, 4% CHAPS, 50 mM DTT and 0.5% carrier ampholytes;E Healthcare). IEF was performed at 100 V for 2 h, 500 V for 20 min,
gradient up to 5000 V for 2 h and 5000 V for 2 h. Gel stripsere then reduced (1% DTT, 20 min) and alkylated (2.5% iodoac-
tamide, 20 min). Second dimension separation was undertakensing sodium dodecyl sulfate-polyacrylamide gel electrophoresisSDS-PAGE) with 12% Tris–HCl polyacrylamide gels (1.5 M Tris–HCl,0% SDS, 12% acrylamide) in a Mini PROTEAN system (Bio-Rad). Gelsere stained with Lava Purple (Fluorotechnics, Sydney, Australia)
nd visualised using a Typhoon Trio laser scanner (GE Healthcare).
.5. Protein spot analysis
Progenesis proteomic analysis software (Non Linear Dynamics,ewcastle-upon-Tyne, UK) was used to identify significant changes
p < 0.05) in protein spot intensity between treatments. Fluores-ence intensities of protein spots on gel maps from each metal atach concentration were compared to intensities of correspond-ng proteins on gels from controls. Fold differences for each spothat differed in intensity between metal-exposed oysters and con-rols were calculated from the mean normalized spot volumes ofontrols compared to the respective metal treatment.
.6. In-gel digestion of proteins from 2-DE gels
Spots selected for further analysis were picked from gels andigested using trypsin. Each gel plug was washed three timesor 10 min with 100 mM ammonium bicarbonate (NH4HCO3). Gellugs were de-stained in 50% acetonitrile (ACN)/50 mM NH4HCO3hen dehydrated in 100% ACN for 5 min and air dried. They werehen reduced with 100 mM DTT in 100 mM NH4HCO3 at 56 ◦C for
h and alkylated with 55 mM iodoacetamide in 100 mM NH4HCO3or 45 min at room temperature in the dark before being washednd dehydrated as described above. Thirty microlitres trypsin solu-ion (12.5 ng/�l in 50 mM NH4HCO3, Promega, Sydney, Australia)ere added for 30 min at 4 ◦C, before the gel plugs were incu-
ated overnight at 37 ◦C. The gel plugs were then washed twicen 50% ACN/2% formic acid for 30 min to extract tryptic peptides.he resulting supernatants (50–60 �l) containing peptides wereeduced to 12 �l in a vacuum centrifuge then further centrifugedor 10 min at 14,000 rpm to remove microparticles.
.7. Nanoflow liquid chromatography–tandem masspectrometry
Tryptic peptides from excised gel plugs were analysed byanoflow liquid chromatography–tandem mass spectrometryLC–MS/MS) using an LTQ-XL ion-trap mass spectrometer (Thermo,A, USA) according to (Andon et al., 2003). Reversed phase columnsere packed in-house (approximately 7 cm, 100 �m i.d.) using
00 A, 5 mM Zorbax C18 resin (Agilent Technologies, CA, USA) in fused silica capillary using an integrated electrospray tip. A 1.8 kVlectrospray voltage was applied via a liquid junction up-stream ofhe C18 column. A Surveyor autosampler (Thermo, CA, USA) was
cology 109 (2012) 202– 212
used to injected samples onto the column followed by an initialwash step with buffer A (5% (v/v) ACN, 0.1% (v/v) formic acid) for10 min at 1 �l min−1. Peptides were subsequently eluted from theC18 column with 0–50% Buffer B (95% (v/v) ACN, 0.1% (v/v) formicacid) over 58 min at 500 nl min−1, followed by 50–95% Buffer Bover 5 min at 500 nl min−1. The column eluate was directed intoa nanospray ionization source of the mass spectrometer. Spec-tra were scanned over the range 400–1500 amu. Automated peakrecognition, dynamic exclusion, and tandem MS of the top six mostintense precursor ions at 35% normalization collision energy wereperformed using Xcalibur software (version 2.06) (Thermo, CA,USA).
2.8. Protein (peptide) identification
Raw MS data files were converted to mzXML format andthey were searched through the Global Proteome Machine(GPM) software version 2.1.1 of the X!Tandem algorithm(http://www.thegpm.org/) (Craig and Beavis, 2003, 2004) againsta database containing 14,002 peptide sequences from bivalve mol-luscs (plus common human and trypsin peptide contaminants)downloaded in August 2009 from the National Centre for Biotech-nology Information (NCBI, http://www.ncbi.nlm.nih.gov/). A searchwas also performed against a reversed sequence database to evalu-ate the false discovery rate (FDR). GPM search parameters includedMS and MS/MS tolerances of ±2 Da and ±0.4 Da, tolerance of upto 3 missed tryptic cleavages and K/R-P cleavages. Fixed modifica-tions were set for carbamidomethylation of cysteine and variablemodifications were set for oxidation of methionine. Only peptidesthat had log(e)+ values of <−10 and yielded at least five spec-tral counts were retained for further analysis. Using these criteria,no non-palindromic reverse database peptide identifications weredetected. Identified peptides were assigned a biological functionbased on functional annotations for the homologous sequences inthe NCBI database.
2.9. Statistical analysis
Relationships between proteins expressed in response to eachconcentration of metal were examined using cluster analysis. Pro-tein spot abundances were log(X + 1) transformed and similaritiesdetermined using Bray–Curtis index. All analyses were performedusing Primer 6+ statistical software (Plymouth Marine Laboratories,Plymouth, UK).
3. Results
3.1. Water quality data
Average water temperatures throughout each trial were 21.0 ◦C,20.0 ◦C, 22.5 ◦C and 22.5 ◦C for Cd-, Cu-, Pb- and Zn-exposures,respectively. There were significant differences in temperatureand salinity between the four metal exposure trials. Pb- and Zn-exposures had higher temperatures (p < 0.05) than both the Cd- andCu-exposures. However, the largest difference in temperature wasonly 2.5 ◦C (between Pb/Zn and Cu). The Cu-exposure had the low-est average salinity (34 ppt), whilst the highest salinity was in thePb-exposure (36 ppt). Metal and PCB concentrations in water sam-ples from Chowder Bay were all <2 �g/l, whilst levels of PAHs were<0.1 �g/l.
3.2. Protein expression patterns after metal exposure
An average of 305 distinct protein spots per 2-DE gel wasvisualised by Progenesis. A total of 129 spots changed signifi-cantly (p < 0.05) in intensity in response to metal exposure when

E.L. Thompson et al. / Aquatic Toxicology 109 (2012) 202– 212 205
Zn 5
ug/
l
Pb
100
ug/l
Pb
5 ug
/l
Pb
50 u
g/l
Zn 1
00 u
g/l
Cu
5 ug
/l
Cu
50 u
g/l
Cd
50 u
g/l
Cd
100
ug/
l
Cu
100
ug/l
Cd
5 ug
/l
Zn 5
0 ug
/l
Con
trol100
95
90
85
Sim
ilarit
y
Transform: Log(X+1)Resemblance: S17 Bray Curtis similarity
Tre
respon
cfacccs3a
mt51ZsC
iT(w
3
n
Fbs
Fig. 1. Dendogram showing similarity of the differential protein expression in
ompared to non-exposed controls. Twenty-one of these 129 dif-erential spots differed significantly in intensity between controlsnd exposure to more than one of the metals. None of the spotshanged in intensity in response to all metals when compared toontrols. However, 7 spots (spots 2, 4, 36, 68, 270, 271 and 299)hanged in response to three of the metals tested and a further 14pots (spots 9, 18, 25, 27, 35, 42, 55, 64, 67, 74, 108, 109, 276, and42) varied in response to two metals. All other spots responded in
metal-specific manner.The total numbers of differential spots were similar for each
etal concentration; 45 spots changed in intensity when comparedo controls in response to 5 �g/l, 41 spots varied in response to the0 �g/l exposures, and 43 spots changed in intensity in response to00 �g/l metal. When metal exposure was analysed, Cd, Cu, Pb andn resulted in significant changes in intensities of 34, 24, 38 and 33pots, respectively, with the number of spots altered in response tou being significantly (<0.05) lower than for Pb.
Multivariate cluster analysis (Fig. 1) shows there was similarityn the proteins expressed by Pb and Zn (except for Zn at 50 �g/l).here was also similarity in those proteins expressed by Cd and Cuexcept for Cd at 5 �g/l). However, these two groups of proteinsere distinctly separate to each other.
.3. Metal-specific protein expression
Fig. 2 shows that there were dose-dependent changes in theumber of protein spots altered by each metal. There was a
02468
101214161820
Cd Cu Pb Zn
Treatent
Num
ber o
f diff
eren
tially
ex
pres
sed
spot
s
5 ug/l
50ug/l
100ug/l
* * * *
ig. 2. The total number of proteins spots that were differentially expressedetween metal-exposed oysters and controls at each metal concentration. *Indicatestatistically significant differences.
atment
se to exposure to Cd, Cu, Pb and Zn at each concentration, relative to controls.
significant increase in the number of spots altered in response to Cdas concentration increased. An opposite effect was evident in oys-ters exposed to Cu, which had a greater impact on the number ofspots that changed relative to controls at the lowest concentration(5 �g/l) compared to the highest concentration (100 �g/l). After Pbexposure, significantly more spots changed in intensity in responseto 50 �g/l compared to 5 �g/l. Zn exposure resulted in more spotsresponding to 5 �g/l than to 50 �g/l.
Of the 129 differential proteins detected, 89 decreased inintensity after metal exposure whilst 40 increased in inten-sity. In Pb-exposed oysters, approximately the same number ofspots increased or decreased in intensity (17 increased and 22decreased). Cu and Zn exposures resulted in a far greater propor-tion of spots that decreased in intensity (80% and 70% decreasing,respectively).
Fig. 3 shows the fold differences in intensity of individual proteinspots at each concentration of metal. Spot 299 had the highest folddifference of any spot relative to controls. It decreased in intensityin response to Cu by 46-fold, to Pb by 38-fold and to Zn by 40-fold.Fold differences for all other spots ranged between 0.45 (spot 270,in response to Cu) and 8.25 (spot 349 in response to Zn).
3.4. Protein identification
Putative identifications were obtained for 47 unique differen-tial spots when peptide spectra were compared to sequences inthe custom Bivalvia sequence database. Details of these putativeidentifications are shown in Table 1. Among these, 33 spots werefound to match a single peptide. The peptide spectra of the remain-ing spots matched more than one peptide sequence in the databaseso that changes in the relative intensities of those spots could notbe unequivocally assigned to an individual protein. However, someproteins, such as 40S ribosomal protein, appeared in a number ofthe spots that contained matches to more than one peptide. Therewas further redundancy in the identifications meaning that thesame peptide was sometimes identified in more than one spot.As a result, peptides closely related to 20 unique proteins wereidentified among the 33 spots that contained a single peptide.
Several of the identified proteins responded to just one
metal. Arginine kinase, vitellogenin, triosephosphate isomeraseand myosin essential light chain changed in intensity only afterexposure to Pb, whilst shematrin-7, insoluble protein and mito-chondrial mortalin were altered only after exposure to Zn.
206 E.L. Thompson et al. / Aquatic Toxicology 109 (2012) 202– 212
-30 -20 -10 0 10152346
285256
30369
18235557585960616899
110113271
23642556774949598
100103104107
Fold Difference
Spot
Num
ber
5ug/l
50ug/l
100ug/l
-50 -20 -10 0 10
418
91011121314151617
27027136666964676870
303299303348349
Spot
Num
ber
Fold Difference
-50 -20 -10 0 1023242526272228
240276
5582
23564687173747576777981838485
3505154
109126153240270338342347108299
Spot
Num
ber
Fold Difference
-50 -20 -10 0 10
273638
34224
25333435374142434445
2702718990529192
108109203276239271279290299349
Spot
Num
ber
Fold Difference
ba
dc
Fig. 3. (a–d) Fold differences relative to non-exposed controls in spots that differed significantly (p < 0.05) in intensity between metal-exposed oysters and non-exposedcontrols: a, Cd; b, Cu; d, Pb; d, Zn.

E.L. Thompson et al. / Aquatic Toxicology 109 (2012) 202– 212 207
Table 1Average normalized spot volumes, putative identifications of proteins in the NCBI bi-valvia database for spots that differed in intensity (p < 0.05) between metal-exposedand control oysters.
Metal Spot # Conc. (�g/l) Number ofpeptides
Log(e)+ value T-test (p-value) Putativeidentification(s)
Identify of proteins in NCBIdatabase
Cd 2 5 77
−73.9−71.3
0.02 Tropomyosin and ATPsynthase
gi|219806594|Crassostreagigas/gi|86156234|Crassostreagigas
3 5 −55.0 0.001 40S ribosomal proteinSA
gi|229891605|Pinctadafucata
5 10 −35.1 0.001 Ferritin gi|93139010|Crassostreaariakensis
9 50 5 −33.4 0.01 Vasa gi|91179150|Chlamysfarreri
18 21 −293.2 0.01 HSP70 gi|7688162|Crassostreavirginica
55 7 −60.3 0.001 G protein beta subunit gi|46391574|Pinctadafucata
56 55
−37.2−33.7
0.03 G protein beta subunitand cytoplasmic HSP70
gi|46391574|Pinctadafucata/gi|21311271|Ostrea edulis
303 5 −39.2 0.01 Omega crystallin gi|9957079|Placopectenmagellanicus
2 100 77
−73.9−71.3
0.02 Tropomyosin and ATPsynthase
gi|219806594|Crassostreagigas/gi|86156234|Crassostreagigas
36 4715
−675.3−167.3
0.05 71 kDa heat shockprotein connate andBeta-actin
gi|46359616|Crassostreagigas/gi|159507454|Crasssostreaariakensis
55 7 −60.3 0.001 G protein beta subunit gi|46391574|Pinctadafucata
271 16 −116.3 0.05 Non-gradient byssalprecursor
gi|3513512|Mytilus edulis
Cu 9 5 5 −33.4 0.001 Vasa gi|91179150|Chlamysfarreri
10 55
−31.9−62.7
0.01 Alanopinedehydrogenase andcytosolic malate
gi|113927399|Crassostreagigas/gi|73656362|Mytiluscalifornianus
11 5 −49.5 0.02 Cytosolic malate gi|73656362|Mytiluscalifornianus
12 13 −123.2 0.01 Actin gi|18565104 Crassostreagigas
14 1088
−91.0−85.7−74.4
0.02 Alanopinedehydrogenase, tektinand actin
gi|113927399|Crassostreagigas/gi|194068377|Saccostreakegaki/gi|159507454|Crasssostreaariakensis
15 31 −380.6 0.01 Actin 2/beta-actin gi|159507454|Crassostreaariakensis
18 21 −293.2 0.03 HSP70 gi|7688162|Crassostreagigas
271 16 −116.3 0.01 Non-gradient byssalprecursor
gi|3513512|Mytilus edulis
36 50 4715
−675.3−167.3
0.01 71 kDa heat shockprotein connate andBeta-actin
gi|46359616|Crassostreagigas/gi|159507454|Crasssostreaariakensis
303 5 −39.2 0.001 Omega crystallin gi|9957079|Placopectenmagellanicus
299 100 6 −38.4 0.005 Vasa gi|91179150|Chlamysfarreri
303 5 −39.2 0.001 Omega crystallin gi|9957079|Placopectenmagellanicus
Pb 22 5 517
−39.7−155.3
0.02 Actin and extracellularSOD
gi|18565104|Crassostreagigas/gi|229485195 Saccostreaglomerata
23 555
−31.6−54.0−80.1
0.009 NADH dehydrogenase,extracellular SOD and40S ribosomal protein
gi|225393109|Pleurobemaclava gi|229485195Saccostrea glomerata/gi|229891605|Pinctadafucata
24 14 −166.4 0.02 40S ribosomal proteinSA
gi|229891605|Pinctadafucata
27 6 −47.6 0.009 Ferritin gi|32479251|Crassostreagigas

208 E.L. Thompson et al. / Aquatic Toxicology 109 (2012) 202– 212
Table 1 (Continued)
Metal Spot # Conc. (�g/l) Number ofpeptides
Log(e)+ value T-test (p-value) Putativeidentification(s)
Identify of proteins in NCBIdatabase
28 6 0.02 HSP70 gi|42494889|Mizuhopectenyessoensis
240 17 −46.1 0.001 Myosin essential lightchain
gi|40642994|Crassostreagigas
276 56
−30.7−42.1
0.12 Polyprotein andpre-collagen D
gi|124055243|Mizuhopectenyessoensis/gi|21105303|Mytilusgalloprovincialis
2 50 77
−73.9−71.3
0.01 Tropomyosin and ATPsynthase
gi|219806594|Crassostreagigas/gi|86156234|Crassostreagigas
35 83 25 −1103.5−92.4
0.01 71 kDa heat shockprotein connate andBeta-actin
gi|46359616|Crassostreagigas/gi|159507454|Crassostreaariakensis
55 7 −60.3 0.04 G protein beta subunit gi|46391574|Pinctadafucata
75 126
−103.3−54.3
0.03 Tubulin andextracellular SOD
gi|58219310|Crassostreagigas/gi|229485195|Saccostreaglomerata
76 8 −73.9 0.01 Tropomyosin gi|219806594|Crassostreagigas
79 6 −56.0 0.01 Arginine kinase gi|44885729|Crassostreagigas
81 5 −36.5 0.001 Cytosolic malatedehydrogenase
gi|73656362|Mytiluscalifornianus
82 6 −51.9 0.005 Extracellular SOD gi|229485195|Saccostreaglomerata
54 100 5 −39.9 0.02 Vitellogenin gi|158515777|Saccostreaglomerata
108 105
−73.0−30.9
0.03 Non-gradient byssalprecursor and SERCA
gi|3513512|Mytilus edulis/gi|152003987|Pinctadafucata
109 31 −402.2 0.006 Actin gi|3182893|Crassostreagigas
126 122 −223.2 0.02 40S ribosomal proteinSA
gi|229891605|Pinctadafucata
153 5 −39.9 0.04 Tropomyosin gi|15419048|Crassostreagigas
240 17 −46.1 0.001 Myosin essential lightchain
gi|40642994|Crassostreagigas
299 6 −38.4 0.005 Vasa gi|91179150|Chlamysfarreri
338 65
−55.2−41.9
0.04 Beta tubulin andomega crystallin
gi|56603670|Crassostreagigas/gi|9957079|Placopectenmagellanicus
342 3728
−412.1−56.0
0.005 Tubulin and ATPsynthase
gi|194068375|Saccostreakegaki/gi|86156234|Pinctadafucata
347 16 −175.7 0.01 Triosephosphateisomerase
gi|46909461|Mytilus edulis
Zn 2 5 77
−73.9−71.3
0.02 Tropomyosin and ATPsynthase
gi|219806594|Crassostreagigas/gi|86156234|Crassostreagigas
27 6 −47.6 0.03 Ferritin gi|32479251|Crassostreagigas
33 18 −187.0 0.03 71 kDa heat shockprotein connate
gi|46359616|Crassostreagigas
34 22 −242.0 0.02 71 kDa heat shockprotein connate
gi|46359616|Crassostreagigas
35 8325
−1103.5−92.4
0.05 71 kDa heat shockprotein connate andBeta-actin
gi|46359616|Crassostreagigas/gi|159507454|Crassostreaariakensis
36 4715
−675.3−167.3
0.04 71 kDa heat shockprotein connate andBeta-actin
gi|46359616|Crassostreagigas/gi|159507454|Crassostreaariakensis
44 5 −30.5 0.02 Mitochondrial mortalin gi|147907866|Mya arenaria45 6 −38.9 0.005 HSP70 gi|42494889|Mizuhopecten
yessoensis271 16 −116.3 0.001 Non-gradient byssal
precursorgi|3513512|Mytilus edulis
E.L. Thompson et al. / Aquatic Toxicology 109 (2012) 202– 212 209
Table 1 (Continued)
Metal Spot # Conc. (�g/l) Number ofpeptides
Log(e)+ value T-test (p-value) Putativeidentification(s)
Identify of proteins in NCBIdatabase
342 3728
−412.1−56.0
0.04 Tubulin and ATPsynthase
gi|194068375|Saccostreakegaki/gi|86156234|Pinctadafucata
90 50 855
−60.7−50.6−34.4
0.04 Molluscan prismaticand nacreous layer88 kDa protein,Cytosolic malate andVasa
gi|219566992|Pinctadafucata/gi|73656362|Mytiluscalifornianus/gi|194068383|Saccostreakegaki
91 10 −104.5 0.03 G protein beta subunit gi|46391574|Pinctadafucata
108 100 105
−73.0−30.9
0.01 Non-gradient byssalprecursor and SERCA
gi|3513512|Mytilus edulis/gi|152003987|Pinctadafucata
109 31 −402.2 0.006 Actin gi|3182893|Crassostreagigas
203 655
−39.0−33.7−30.0
0.04 Myosin, polyprotein,and non-gradientbyssal precursor
gi|13537551|Mizuhopectenyessoensis/gi|3513512|Mytilus edulis
239 10 −38.4 0.02 Non-gradient byssalprecursor
gi|3513512|Mytilus edulis
271 16 −116.3 0.01 Non-gradient byssalprecursor
gi|3513512|Mytilus edulis
276 56
−30.7−42.1
0.04 Polyprotein andpre-collagen D
gi|124055243|Mizuhopectenyessoensis/gi|21105303|Mytilusgalloprovincialis
279 28 −219.2 0.02 Insoluble protein gi|2204081|Pinctada fucata290 7 −48.9 0.03 Shematrin-7 gi|93102311|Pinctada
3
sci(gv1nidcs
l
FM
299 6 −38.4
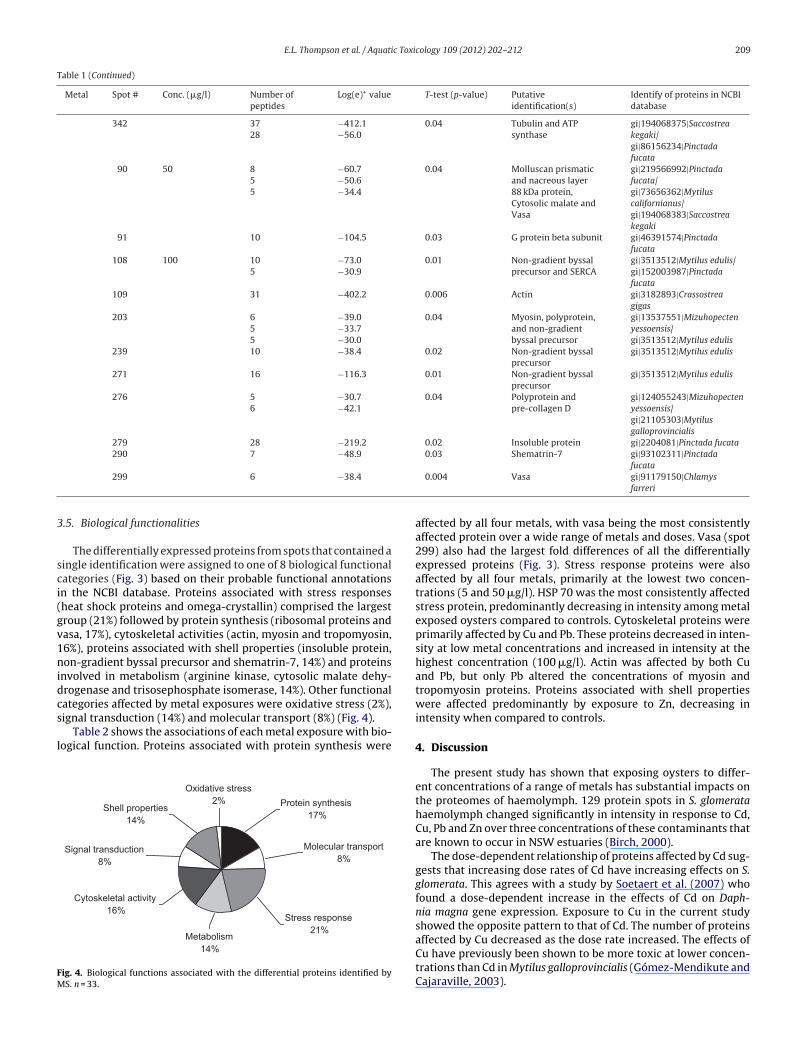
.5. Biological functionalities
The differentially expressed proteins from spots that contained aingle identification were assigned to one of 8 biological functionalategories (Fig. 3) based on their probable functional annotationsn the NCBI database. Proteins associated with stress responsesheat shock proteins and omega-crystallin) comprised the largestroup (21%) followed by protein synthesis (ribosomal proteins andasa, 17%), cytoskeletal activities (actin, myosin and tropomyosin,6%), proteins associated with shell properties (insoluble protein,on-gradient byssal precursor and shematrin-7, 14%) and proteins
nvolved in metabolism (arginine kinase, cytosolic malate dehy-rogenase and trisosephosphate isomerase, 14%). Other functionalategories affected by metal exposures were oxidative stress (2%),
ignal transduction (14%) and molecular transport (8%) (Fig. 4).Table 2 shows the associations of each metal exposure with bio-ogical function. Proteins associated with protein synthesis were
Stress response21%
Molecular transport8%
Protein synthesis17%
Metabolism14%
Cytoskeletal activity16%
Signal transduction8%
Oxidative stress2%
Shell properties14%
ig. 4. Biological functions associated with the differential proteins identified byS. n = 33.
fucata0.004 Vasa gi|91179150|Chlamys
farreri
affected by all four metals, with vasa being the most consistentlyaffected protein over a wide range of metals and doses. Vasa (spot299) also had the largest fold differences of all the differentiallyexpressed proteins (Fig. 3). Stress response proteins were alsoaffected by all four metals, primarily at the lowest two concen-trations (5 and 50 �g/l). HSP 70 was the most consistently affectedstress protein, predominantly decreasing in intensity among metalexposed oysters compared to controls. Cytoskeletal proteins wereprimarily affected by Cu and Pb. These proteins decreased in inten-sity at low metal concentrations and increased in intensity at thehighest concentration (100 �g/l). Actin was affected by both Cuand Pb, but only Pb altered the concentrations of myosin andtropomyosin proteins. Proteins associated with shell propertieswere affected predominantly by exposure to Zn, decreasing inintensity when compared to controls.
4. Discussion
The present study has shown that exposing oysters to differ-ent concentrations of a range of metals has substantial impacts onthe proteomes of haemolymph. 129 protein spots in S. glomeratahaemolymph changed significantly in intensity in response to Cd,Cu, Pb and Zn over three concentrations of these contaminants thatare known to occur in NSW estuaries (Birch, 2000).
The dose-dependent relationship of proteins affected by Cd sug-gests that increasing dose rates of Cd have increasing effects on S.glomerata. This agrees with a study by Soetaert et al. (2007) whofound a dose-dependent increase in the effects of Cd on Daph-nia magna gene expression. Exposure to Cu in the current studyshowed the opposite pattern to that of Cd. The number of proteins
affected by Cu decreased as the dose rate increased. The effects ofCu have previously been shown to be more toxic at lower concen-trations than Cd in Mytilus galloprovincialis (Gómez-Mendikute andCajaraville, 2003).
210 E.L. Thompson et al. / Aquatic Toxicology 109 (2012) 202– 212
Table 2Up (↑) or down (↓) regulation of identified proteins relative to non-exposed controls. Proteins are grouped by biological function.
Biological function Protein Cd Cu Pb Zn
Concentration 5 50 100 5 50 100 5 50 100 5 50 100
Stress response HSP70 ↓ ↑ ↓ ↓HSP71 ↓Mitochondrial mortalin ↓
Protein synthesis 40S ribosomal protein SA ↓ ↑ ↑Vasa ↓ ↓ ↓ ↓ ↓
Cytoskeletal activity Actin ↓ ↑ ↓Actin 2/beta-actin ↓Myosin essential light chain ↓ ↑Tropomyosin ↓ ↑
Shell properties Non-gradient byssal precursor ↑ ↓ ↓ ↓Insoluble protein ↓Shematrin-7 ↓
Metabolism Arginine kinase ↓Malate dehydrogenase ↓ ↓Omega crystalline ↑ ↓ ↓Triosephosphate isomerase ↑
Signal transduction G protein beta subunit ↓ ↓ ↑ ↓Molecular transport Ferritin ↑ ↑ ↑
n5tnd
dctOetstaadeZ
mtarcmcefcOct(oklwp
Vitellogenin
Oxidative stress Extracellular SOD
Of the four metals analysed in this study, Pb induced the highestumber of protein changes overall. Pb had the greatest effect at0 �g/l and thus did not show a linear dose–response relationshipo the concentrations of metals used in this study. Likewise, theumber of protein spots affected by Zn exposure did not fit a linearose–response.
The cluster analysis suggested that the proteome profiles ofifferentially expressed proteins of exposed oysters compared toontrols were related to metal exposure. Overall, the concentra-ions of each specific metal exposure were similar to each other.ther proteomic studies have also found similarities in proteinxpression to be more prevalent in exposure type than concen-ration of exposure (Apraiz et al., 2006; Gomiero et al., 2006). Theimilarity of Pb/Zn and Cd/Cu and the apparent separation betweenhese groupings could be attributed to the difference in temper-ture observed during experimentation. Temperatures during Pbnd Zn exposure trials were on average 1.5 ◦C higher than thoseuring Cd exposures and 2.5 ◦C higher than temperatures in Cuxposures. Alternatively, the clustering may indicate that Pb andn have similar cellular effects, as might Cd and Cu.
However, this explanation is not entirely bourne out by theass spectrometric identification of differentially expressed pro-
eins which confirmed that a range of biological processes wereffected by metals. Some functional pathways were affected by aange of metals, whilst others were metal specific. Proteins asso-iated with cytoskeletal activity (actin, actin-2, tropomyosin andyosin) were affected by exposure to Cu, and Pb. In non-muscle
ells, actin is involved in phagocytosis, organelle movement andndo/exo-cytosis (Wang et al., 2008) whilst other studies haveound alterations of actin after exposure to Cu in M. galloprovin-ialis (Fagotti et al., 1996; Gómez-Mendikute and Cajaraville, 2003).ur study is the first to highlight the effects of Pb exposure onytoskeletal activities. Among other cytoskeletal proteins affected,ropomyosin regulates motility and contractile functions in cellsBailey, 1957) whilst myosin is associated with cell motility andrganelle transport (Sellers, 2000). The disturbance of these three
ey cytoskeletal proteins by Cu or Pb suggest that these metals areikely to affect the motility and plasticity of S. glomerata haemocytesith ramifications for cellular processes such as wound healing andhagocytosis.
↑↑
Exposure to Cd, Cu or Pb all affected pathways involved in energymetabolism. Cytosolic malate dehydrogenase was affected by morethan one metal, whilst changes in arginine kinase and triosephos-phate isomerase (TIM) abundance were unique to Pb exposure.Malate dehydrogenase is an enzyme in the krebs cycle where itcatalyses the conversion malate into oxaloacetate and in the oys-ter, C. virginica, it is the most oxidized intermediate (Ulrich andMarsh, 2006). Changes in malate dehydrogenase have been linkedto the high variability of the intertidal environments in the oyster,C. virginica (Ulrich and Marsh, 2006). It has been shown to assistin anaerobic metabolism by reoxidizing NADH in bivalves (Zwannet al., 1981; Zubkoff and Ho, 1982), and correlates significantlywith respiration in the mussel, Mytilus californianus (Dahlhoff et al.,2002). TIM is a glycolytic enzyme essential for energy maintenancein the heart of the mollusc, Tapes watlingo (Jamieson and de Rome,1979). Such glycolytic enzymes, have been shown to be affectedby seasonal changes in C. virginica (Greenway and Storey, 1999).Arginine kinase facilitates the phosphorylation of arginine to ATPand so may also be related to changes of stress tolerance in oysters(Seals and Grossman, 1988). In the oyster, C. virginica, changes inmetabolic rates have resulted in a lowered stress tolerance (Lanniget al., 2006). Thus, the significant changes in these enzymes aftermetal exposure have the potential make S. glomerata susceptible tostress.
Proteins associated with shell properties were impacted pri-marily after exposure to Zn. These included insoluble protein,shematrin-7 and non-gradient byssal precursor. Whilst non-gradient byssal precursor was differentially expressed in responseto all metals, both insoluble protein and shematrin-7 were onlyaffected after oysters were exposed to Zn. Non-gradient byssal pre-cursor proteins have adhesive properties that may be affected byCu exposure in the mussel, P. viridis (Nicholson and Lam, 2005).Shematrin-7 and insoluble protein are both involved in the calcifi-cation and regeneration of oyster shells (Mount et al., 2004; Suzukiand Nagasawa, 2007). The significant decrease in the abundanceof these proteins suggests that Zn exposure has the potential to
affect shell adhesion, calcification and regeneration in S. glomer-ata. This differential expression in more than one concentration ofZn used in this study also suggests these proteins may representrobust biomarkers for Zn contamination.
c Toxi
swRmafgc
IeaemHcshtse2Aa1agRt(m
vebccolyctom(2
dscontfemfatVpesri
H., Garric, J., 2009. Development of biomarkers of stress related to endocrinedisruption in gastropods: Alkali-labile phosphates, protein-bound lipids and
E.L. Thompson et al. / Aquati
Only two protein functional categories were affected by expo-ure to all four metals, stress responses and protein synthesis. Vasa,hich has been shown to have a role in protein synthesis withNA metabolism in C. galloprovincialis (Venier et al., 2006), was theost consistently affected protein identified in this study. It was
ffected by all metals over a range of doses, and had the highestold differences between controls and metal exposures. This sug-ests that vasa might represent an effective biomarker of metalontamination.
Omega crystallin changed in response to Cd and Cu exposure.t has been linked to physiological stress in molluscs (Piatigorskyt al., 2000) and changes in omega crystallin has been linked to
reduction of temperature stress tolerance in C. virginica (Lannigt al., 2006). Heat shock proteins, predominantly HSP 70-likeolecules, were affected by all four metals. The induction of theSP family has been studied extensively after exposure to manyontaminants in bivalves including; C. virginica after PAH expo-ure (Cruz-Rodríguez and Chu, 2002), C. gigas after exposure toydrocarbons (Boutet et al., 2004), and M. edulis after exposureo tributlytin (Steinert and Pickwell, 1993). The increase in heathock protein expression has also been specifically linked to metalxposure in C. gigas haemolymph after Cd exposure (Choi et al.,008) and M. edulis (Sanders et al., 1991) linked to Cu exposure.n increase in the abundance of these stress response proteinsre thought to aid the recovery of metabolic pathways (Rothman,989). However, in the current study, HSPs mainly decreased inbundance at low concentrations of metal exposure. This sug-ests that the abundance of HSPs might be highly dose dependent.egardless, our identifications of HSPs associated with exposureo all four metals is consistent with the literature: these proteinsparticularly HSP 70) have been used extensively in the past as
olecular biomarkers of environmental stress.The significant changes in abundance of both HSP 70 and
asa in response to all four metals (and the high fold differ-nces of vasa) would suggest both may be suitable candidateiomarkers for non-specific metal contamination. In contrast,hanges in the abundance of other proteins were highly spe-ific to individual metals. For instance, changes in intensitiesf TIM, arginine kinase, myosin essential light chain and vitel-ogenin were unique to Pb exposure. Vitellogenin is involved inolk deposition regulated by estrogen receptors. This pathwayan be affected by contaminants such as estradiol, which disruptshe endocrine pathway (Gagné et al., 2001). Hence, the meritsf using vitellogenin as a biomarker for endocrine disruption inolluscs, including S. glomerata, have been studied extensively
Riffeser and Hock, 2002; Andrew et al., 2008; Gagnaire et al.,009).
Even though the present study has identified a number of tra-itional (HSP 70) and potentially novel (vasa, TIM, arginine kinase,hematrin-7, and insoluble protein) molecular biomarkers of metalontamination in oysters, the dataset highlights some of the pitfallsf this type of proteomics analysis. 2-DE is a low throughput tech-ique, which limits biological replication. This factor, along withhe difficulties inherent in identifying proteins in species withoutully sequenced genomes, means that statistically significant differ-nces in protein abundance are difficult to obtain by 2-DE. This alsoay explain why there was a lack of identified proteins commonly
ound in other biomarker studies, such as metallothionein (Butlernd Roesijadi, 2000; Schiedek et al., 2006; Faria et al., 2009), or pro-eins associated with oxidative stress (Rodríguez-Ariza et al., 2003;alavanidis et al., 2006; Duarte et al., 2011). As a result, the dataresented here are indicative of new candidate molecular biomark-rs in S. glomerata, and provide information on the physiologicalystems that are affected by metal contamination. However, they
equire additional, high throughput analyses to validate their utilityn environmental monitoring.cology 109 (2012) 202– 212 211
Acknowledgements
This research is supported by an Australian Research CouncilLinkage Grant in collaboration with the Department of Environ-ment, Climate Change and Water. Research has been facilitatedby access to the Sydney Institute of Marine Science (manuscriptreference number 55), and to the Australian Proteome Facilityestablished under the Australian Government’s Major NationalResearch Program. E Thompson is the recipient of an MQRes post-graduate scholarship from Macquarie University.
References
Andon, N.L., Eckert, D., Yates, J.R., Haynes, P.A., 2003. High-throughput functionalaffinity purification of mannose binding proteins from Oryza sativa. Proteomics3, 1270–1278.
Andrew, M.N., Dunstan, R.H., O’Connor, W.A., Van Zwieten, L., Nixon, B., MacFarlane,G.R., 2008. Effects of 4-nonylphenol and 17[alpha]-ethynylestradiol exposure inthe Sydney rock oyster, Saccostrea glomerata: Vitellogenin induction and gonadaldevelopment. Aquatic Toxicology 88 (1), 39–47.
Apraiz, I., Mi, J., Cristobal, S., 2006. Identification of proteomic signatures of expo-sure to marine pollutants in mussels (Mytilus edulis). Molecular and CellularProteomics 5 (7), 1274–1285.
Bailey, K., 1957. Invertebrate tropomyosin. Biochimica et Biophysica Acta 24,612–619.
Birch, G., Taylor, S., 1999. Source of heavy metals in sediments of the Port Jacksonestuary, Australia. The Science of the Total Environment 227 (2–3), 123–138.
Birch, G.F., 2000. Marine pollution in Australia, with special emphasis on central NewSouth Wales estuaries and adjacent continental margin. International Journal ofEnvironment and Pollution 13, 1–6.
Boutet, I., Tanguy, A., Moraga, D., 2004. Response of the Pacific oyster Crassostreagigas to hydrocarbon contamination under experimental conditions. Gene 329,147–157.
Bradley, B.P., Shrader, E.A., Kimmel, D.G., Meiller, J.C., 2002. Protein expression sig-natures: an application of proteomics. Marine Environmental Research 54 (3–5),373–377.
Brown, K.R., McPherson, R.G., 1992. Concentrations of copper, zinc and lead in theSydney rock oyster, Saccostrea commercialis (Iredale and Roughley) from theGeorges River, New South Wales. The Science of The Total Environment 126(1–2), 27–33.
Butler, R.A., Roesijadi, G., 2000. Metallothionein (MT) gene expression and cadmium-induced immunotoxicity in hemocytes of the eastern oyster Crassostrea virginica.Marine Environment Research 50 (1–5), 470.
Chase, M.E., Jones, S.H., Hennigar, P., Sowles, J., Harding, G.C.H., Freeman, K.,Wells, P.G., Krahforst, C., Coombs, K., Crawford, R., Pederson, J., Taylor, D.,2001. Gulfwatch: Monitoring Spatial and Temporal Patterns of Trace Metal andOrganic Contaminants in the Gulf of Maine (1991–1997) with the Blue Mussel,Mytilus edulis L. Marine Pollution Bulletin 42 (6), 490–504.
Choi, Y.K., Jo, P.G., Choi, C.Y., 2008. Cadmium affects the expression of heat shockprotein 90 and metallothionein mRNA in the Pacific oyster, Crassostrea gigas.Comparative Biochemistry and Physiology. Part C: Toxicology and Pharmacology147 (3), 286–292.
Craig, R., Beavis, R.C., 2003. A method for reducing the time required to matchprotein sequences with tandem mass spectra. Rapid Communications in MassSpectrometry 17 (20), 2310–2316.
Craig, R., Beavis, R.C., 2004. TANDEM: matching proteins with tandem mass spectra.Bioinformatics 20 (9), 1466–1467.
Cruz-Rodríguez, L.A., Chu, F.-L.E., 2002. Heat-shock protein (HSP70) response in theeastern oyster, Crassostrea virginica, exposed to PAHs sorbed to suspended arti-ficial clay particles and to suspended field contaminated sediments. AquaticToxicology 60 (3-4), 157–168.
Dahlhoff, E., Stillman, P., Menge, H.B.A., 2002. Physiological community ecology:variation in metabolic activity of ecologically important rocky intertidal inver-tebrates along environmental gradients. Integrative and Comparative Biology,862–871.
Duarte, C.A., Giarratano, E., Amin, O.A., Comoglio, L.I., 2011. Heavy metal concen-trations and biomarkers of oxidative stress in native mussels (Mytilus edulischilensis) from Beagle Channel coast (Tierra del Fuego, Argentina). Marine Pol-lution Bulletin 62 (8), 1895–1904.
Fagotti, A., Di Rosa, I., Simoncelli, F., Pipe, R.K., Panara, F., Pascolini, R., 1996. Theeffects of copper on actin and fibronectin Organization in Mytilus galloprovin-cialls haemocytes. Developmental & Comparative Immunology 20 (6), 383–391.
Faria, M., Carrasco, L., Diez, S., Riva, M.C., Bayona, J.M., Barata, C., 2009. Multi-biomarker responses in the freshwater mussel Dreissena polymorpha exposedto polychlorobiphenyls and metals. Comparative Biochemistry and Physiology.Part C: Toxicology and Pharmacology 149 (3), 281–288.
Gagnaire, B., Gagné, F., André, C., Blaise, C., Abbaci, K., Budzinski, H., Dévier, M.-
vitellogenin-like proteins. Aquatic Toxicology 92 (3), 155–167.Gagné, F., Blaise, C., Salazar, M., Salazar, S., Hansen, P.D., 2001. Evaluation of estro-
genic effects of municipal effluents to the freshwater mussel Elliptio complanata.

2 c Toxi
G
G
G
G
G
G
H
J
J
L
L
M
N
N
N
P
P
R
R
R
R
R
S
12 E.L. Thompson et al. / Aquati
Comparative Biochemistry and Physiology. Part C: Toxicology and Pharmacology128 (2), 213–225.
iguère, A., Couillard, Y., Campbell, P.G.C., Perceval, O., Hare, L., Pinel-Alloul, B.,Pellerin, J., 2003. Steady-state distribution of metals among metallothioneinand other cytosolic ligands and links to cytotoxicity in bivalves living along apolymetallic gradient. Aquatic Toxicology 64 (2), 185–200.
illikin, D.P., Dehairs, F., Baeyens, W., Navez, J., Lorrain, A., Andre, L., 2005. Inter- andintra-annual variations of Pb/Ca ratios in clam shells (Mercenaria mercenaria):A record of anthropogenic lead pollution? Marine Pollution Bulletin 50 (12),1530–1540.
ómez-Mendikute, A., Cajaraville, M.P., 2003. Comparative effects of cadmium, cop-per, paraquat and benzo[a]pyrene on the actin cytoskeleton and production ofreactive oxygen species (ROS) in mussel haemocytes. Toxicology In Vitro 17(5-6), 539–546.
omiero, A., Pampanin, D.M., Bjornstad, A., Larsen, B.K., Provan, F., Lyng, E., Andersen,O.K., 2006. An ecotoxicoproteomic approach (SELDI-TOF mass spectrometry) tobiomarker discovery in crab exposed to pollutants under laboratory conditions.Aquatic Toxicology 78 (Supplement 1), S34–S41.
ray, J.S., 1992. Biological and ecological effects of marine pollutants and their detec-tion. Marine Pollution Bulletin 25, 48–50.
reenway, S.C., Storey, K.B., 1999. The effect of prolonged anoxia on enzyme activi-ties in oysters (Crassostrea virginica) at different seasons. Journal of ExperimentalMarine Biology and Ecology 242 (2), 259–272.
ardiman, S., Pearson, B., 1995. Heavy metals, TBT and DDT in the Sydney rockoyster (Saccostrea commercialis) sampled from the Hawkesbury River estuary,NSW, Australia. Marine Pollution Bulletin 30 (8), 563–567.
amieson, D.D., de Rome, P., 1979. Energy metabolism of the heart of the molluscTapes watlingi. Comparative Biochemistry and Physiology Part B: ComparativeBiochemistry 63 (3), 399–405.
onsson, H., Schiedek, D., Grosvik, B.E., Goksoyr, A., 2006. Protein responses inblue mussels (Mytilus edulis) exposed to organic pollutants: A combined CYP-antibody/proteomic approach. Aquatic Toxicology 78 (Supplement 1), S49–S56.
annig, G., Flores, J.F., Sokolova, I.M., 2006. Temperature-dependent stress responsein oysters, Crassostrea virginica: pollution reduces temperature tolerance in oys-ters. Aquatic Toxicology 79 (3), 278–287.
i, X., Wai, O.W.H., Li, Y.S., Coles, B.J., Ramsey, M.H., Thornton, I., 2000. Heavy metaldistribution in sediment profiles of the Pearl River estuary, South China. AppliedGeochemistry 15 (5), 567–581.
ount, A.S., Wheeler, A.P., Paradkar, R.P., Snider, D., 2004. Hemocyte-mediated shellmineralization in the eastern oyster. Science 304 (5668), 297–300.
esatyy, V.J., Suter, M.J.F., 2007. Proteomics for the analysis of environmentalstress responses in organisms. Environmental Science and Technology 41 (20),6891–6900.
ewton, T.J., Bartsch, M.R., 2007. Lethal and sublethal effects of ammonia to juvenileLampsilis mussels (Unionidae) in sediment and water-only exposures. Environ-mental Toxicology and Chemistry 26 (10), 2057.
icholson, S., Lam, P.K.S., 2005. Pollution monitoring in Southeast Asia usingbiomarkers in the mytilid mussel Perna viridis (Mytilidae: Bivalvia). Environ-ment International 31 (1), 121–132.
edersen, S.N., Lundebye, A.-K., 1996. Metallothionein and stress protein levels inshore crabs (Carcinus maenas) along a trace metal gradient in the Fal estuary(UK). Marine Environment Research 42 (1-4), 241–246.
iatigorsky, J., Kozmik, Z., Horwitz, J., Ding, L., Carosa, E., Robison, W.G., Steinbach, P.J.,Tamm, E.R., 2000. �-Crystallin of the scallop lens. Journal of Biological Chemistry275 (52), 41064–41073.
iffeser, M., Hock, B., 2002. Vitellogenin levels in mussel hemolymph–a suitablebiomarker for the exposure to estrogens? Comparative Biochemistry and Phys-iology Part C: Toxicology & Pharmacology 132 (1), 75–84.
odríguez-Ariza, A., Rodríguez-Ortega, M.J., Marenco, J.L., Amezcua, O., Alhama,J., López-Barea, J., 2003. Uptake and clearance of PCB congeners inChamaelea gallina: response of oxidative stress biomarkers. Comparative Bio-chemistry and Physiology. Part C: Toxicology and Pharmacology 134 (1),57–67.
odríguez-Ortega, M.J., Grøsvik, B.E., Rodríguez-Ariza, A., Goksøyr, A., López-Barea,J., 2003. Changes in protein expression profiles in bivalve molluscs (Chamae-lea gallina) exposed to four model environmental pollutants. Proteomics 3 (8),1535–1543.
oman, Y.E., De Schamphelaere, K.A.C., Nguyen, L.T.H., Janssen, C.R., 2007. Chronictoxicity of copper to five benthic invertebrates in laboratory-formulated sedi-ment: Sensitivity comparison and preliminary risk assessment. Science of The
Total Environment 387 (1–3), 128–140.othman, J.E., 1989. Polypeptide chain binding proteins: catalysts of protein foldingand related processes in cells. Cell 59, 591–601.
anders, B.M., Martin, L.S., Nelson, W.G., Phelps, D.K., Welch, W., 1991. Relation-ships between accumulation of a 60 kDa stress protein and scope-for-growth in
cology 109 (2012) 202– 212
Mytilus edulis exposed to a range of copper concentrations. Marine EnvironmentResearch 31 (2), 81–97.
Sanders, M.J., Du Preez, H.H., Van Vuren, J.H.J., 1998. The freshwater river crab,Potamonautes warreni, as a bioaccumulative indicator of iron and manganesepollution in two aquatic systems. Ecotoxicology and Environmental Safety 41(2), 203–214.
Scanes, P.R., 1997. Uptake and depuration of organochlorine compounds in Syd-ney rock oysters (Saccosstrea commercialis). Marine and Freshwater Research48, 1–6.
Scanes, P.R, Roach, A.C., 1999. Determining natural ‘background’ concentrations oftrace metals in oysters from New South Wales, Australia. Environmental Pollu-tion 105 (3), 437–446.
Schiedek, D., Broeg, K., Barsiene, J., Lehtonen, K.K., Gercken, J., Pfeifer, S., Vuon-tisjärvi, H., Vuorinen, P.J., Dedonyte, V., Koehler, A., Balk, L., Schneider, R., 2006.Biomarker responses as indication of contaminant effects in blue mussel (Mytilusedulis) and female eelpout (Zoarces viviparus) from the southwestern Baltic Sea.Marine Pollution Bulletin 53 (8-9), 387–405.
Seals, J.D., Grossman, S.H., 1988. Purification and characterization of arginine kinasefrom the sea cucumber Caudina arenicola. Comparative Biochemistry and Phys-iology Part B: Comparative Biochemistry 89 (4), 701–707.
Sellers, J.R., 2000. Myosins: a diverse superfamily. Biochimica et Biophysica Acta(BBA) - Molecular Cell Research 1496 (1), 3–22.
Snowdon, R., Birch, G.F., 2004. The nature and distribution of copper, lead and zincin soils of highly urbanised sub-catchment (iron cove) of Port Jackson, Sydney.Australian Journal of Soil Research 42, 329–338.
Soetaert, A., Vandenbrouck, T., van der Ven, K., Maras, M., van Remortel, P., Blust,R., De Coen, W.M., 2007. Molecular responses during cadmium-induced stressin Daphnia magna: integration of differential gene expression with higher-leveleffects. Aquatic Toxicology 83 (3), 212–222.
Stark, J.S., 1998. Effects of copper on macrobenthic assemblages in soft sediments:a laboratory experimental study. Ecotoxicology 7, 161–173.
Steinert, S.A., Pickwell, G.V., 1993. Induction of HSP70 proteins in mussels by inges-tion of tributyltin. Marine Environment Research 35 (1–2), 89–93.
Suzuki, M., Nagasawa, H., 2007. The structure–function relationship analysis ofPrismalin-14 from the prismatic layer of the Japanese pearl oyster, (Pinctadafucata). FEBS Journal 274 (19), 5158–5166.
Tanabe, S., Prudente, M.S., Kan-atireklap, S., Subramanian, A., 2000. Mussel watch:marine pollution monitoring of butyltins and organochlorines in coastal watersof Thailand, Philippines and India. Ocean & Coastal Management 43 (8–9),819–839.
Thompson, E.L., Taylor, D.A., Nair, S.V., Birch, G., Haynes, P.A., Raftos, D.A., 2011. Aproteomic analysis of the effects of metal contamination on Sydney Rock Oyster(Saccostrea glomerata) haemolymph. Aquatic Toxicology 103 (3-4), 241–249.
Ulrich, P.N., Marsh, A.G., 2006. Interindividual variation of malate dehydrogenaseactivity in the oyster Crassostrea virginica. Marine and Freshwater Behaviourand Physiology 39, 293–306.
Valavanidis, A., Vlahogianni, T., Dassenakis, M., Scoullos, M., 2006. Molecularbiomarkers of oxidative stress in aquatic organisms in relation to toxic envi-ronmental pollutants. Ecotoxicology and Environmental Safety 64 (2), 178–189.
van der Oost, R., Goksøyr, A., Celander, M., Heida, H., Vermeulen, N.P.E., 1996.Biomonitoring of aquatic pollution with feral eel (Anguilla anguilla). II. Biomark-ers: pollution-induced biochemical responses. Aquatic Toxicology 36 (3–4),189–222.
Venier, P., De Pittà, C., Pallavicini, A., Marsano, F., Varotto, L., Romualdi, C., Don-dero, F., Viarengo, A., Lanfranchi, G., 2006. Development of mussel mRNAprofiling: can gene expression trends reveal coastal water pollution? MutationResearch/Fundamental and Molecular Mechanisms of Mutagenesis 602 (1–2),121–134.
Viant, M.R., Pincetich, C.A., Walton, J.H., Tjeerdema, R.S., Hinton, D.E., 2002. Utilizingin vivo nuclear magnetic resonance spectroscopy to study sublethal stress inaquatic organisms. Marine Environmental Research 54 (3–5), 553–557.
Wang, Z., Wu, Z., Jian, J., Lu, Y., 2008. Cloning and expression of an actin gene in thehaemocytes of pearl oyster (Pinctada fucata, Gould 1850). Marine Genomics 1(2), 63–67.
Wu, R.S.S., Siu, W.H.L., Shin, P.K.S., 2005. Induction, adaptation and recovery of bio-logical responses: implications for environmental monitoring. Marine PollutionBulletin 51 (8-12), 623–634.
Zann, L.P., 1996. The State of the Marine Environment Report for Australia (SOMER):process, findings and perspectives. Ocean and Coastal Management 33 (1–3),63–86.
Zubkoff, P.L., Ho, M.-S., 1982. Krebs cycle intermediates of the oyster, Crassostreavirginica and the mussel, Geukensia demissa. Comparative Biochemistry andPhysiology Part B: Comparative Biochemistry 72 (4), 577–580.
Zwann, A., Holwerda, De., Veenhof, D.A.P.R., 1981. Anaerobic malate metabolism inmitochondria of the sea mussel Mytilus edulis. Marine Biology Letters 2, 131–140.