Algebra II - Richland Parish School Board
211
Algebra II
-
Upload
khangminh22 -
Category
Documents
-
view
3 -
download
0
Transcript of Algebra II - Richland Parish School Board

Algebra II

Algebra II
Table of Contents
Unit 1: Functions ....................................................................................................... 1-1 Unit 2: Polynomial Equations and Inequalities........................................................ 2-1 Unit 3: Rational Equations and Inequalities ............................................................ 3-1 Unit 4: Radicals and the Complex Number System ................................................. 4-1 Unit 5: Quadratic and Higher Order Polynomial Functions................................... 5-1 Unit 6: Exponential and Logarithmic Functions ..................................................... 6-1 Unit 7: Advanced Functions ..................................................................................... 7-1 Unit 8: Conic Sections ............................................................................................... 8-1
Most of the math symbols in this document were made with Math Type®
software. Specific fonts must be installed on the user’s computer for the symbols to be read. Users can download and install the Math Type
® for Windows Font from
http://www.dessci.com/en/dl/fonts/default.asp on each computer on which the document will be used.

2012 Louisiana Transitional Comprehensive Curriculum Course Introduction
The Louisiana Department of Education issued the first version of the Comprehensive Curriculum in 2005. The 2012 Louisiana Transitional Comprehensive Curriculum is aligned with Grade-Level Expectations (GLEs) and Common Core State Standards (CCSS) as outlined in the 2012-13 and 2013-14 Curriculum and Assessment Summaries posted at http://www.louisianaschools.net/topics/gle.html. The Louisiana Transitional Comprehensive Curriculum is designed to assist with the transition from using GLEs to full implementation of the CCSS beginning the school year 2014-15. Organizational Structure The curriculum is organized into coherent, time-bound units with sample activities and classroom assessments to guide teaching and learning. Unless otherwise indicated, activities in the curriculum are to be taught in 2012-13 and continued through 2013-14. Activities labeled as 2013-14 align with new CCSS content that are to be implemented in 2013-14 and may be skipped in 2012-13 without interrupting the flow or sequence of the activities within a unit. New CCSS to be implemented in 2014-15 are not included in activities in this document. Implementation of Activities in the Classroom Incorporation of activities into lesson plans is critical to the successful implementation of the Louisiana Transitional Comprehensive Curriculum. Lesson plans should be designed to introduce students to one or more of the activities, to provide background information and follow-up, and to prepare students for success in mastering the CCSS associated with the activities. Lesson plans should address individual needs of students and should include processes for re-teaching concepts or skills for students who need additional instruction. Appropriate accommodations must be made for students with disabilities. Features Content Area Literacy Strategies are an integral part of approximately one-third of the activities. Strategy names are italicized. The link (view literacy strategy descriptions) opens a document containing detailed descriptions and examples of the literacy strategies. This document can also be accessed directly at http://www.louisianaschools.net/lde/uploads/11056.doc. Underlined standard numbers on the title line of an activity indicate that the content of the standards is a focus in the activity. Other standards listed are included, but not the primary content emphasis. A Materials List is provided for each activity and Blackline Masters (BLMs) are provided to assist in the delivery of activities or to assess student learning. A separate Blackline Master document is provided for the course. The Access Guide to the Comprehensive Curriculum is an online database of suggested strategies, accommodations, assistive technology, and assessment options that may provide greater access to the curriculum activities. This guide is currently being updated to align with the CCSS. Click on the Access Guide icon found on the first page of each unit or access the guide directly at http://sda.doe.louisiana.gov/AccessGuide.

2012-13 and 2013-14 Transitional Comprehensive Curriculum
Algebra IIUnit 1Functions 1-1
Algebra II Unit 1: Functions
Time Frame: Approximately five weeks Unit Description This unit focuses on the development of concepts of functions that was begun in Algebra I and that are essential to mathematical growth. This unit explores absolute value expressions and graphs of absolute value functions, step functions, and piecewise functions. It reviews linear functions and develops the concepts of composite functions and inverse functions. Student Understandings A major goal in mathematics today is for students to develop an understanding of functions, to be comfortable using numerical, symbolic, graphical, and verbal representations, and to be able to choose the best representation to solve problems. In this unit, students review finding the equation of a line in the various forms while developing the concepts of piecewise linear functions, absolute value equations, inequalities, and other functions. Students state their solutions in five forms – number lines or coordinate graphs, roster notation, set notation, interval notation, and absolute value notation. They also develop the concepts of composite and inverse functions. Guiding Questions
1. Can students state the difference between a function and a relation in graphical, symbolic, and numerical representations?
2. Can students extend their explanation of the slope of a line to special linear equations such as absolute value, piecewise linear functions, and greatest integer functions?
3. Can students solve absolute value equations and inequalities and state their solutions in five forms when appropriate – number lines or coordinate graphs, roster notation, set notation containing compound sentences using “and” or “or,” interval notation using and , and absolute value notation?
4. Can students determine the graphs, domains, ranges, intercepts, and global characteristics of absolute value functions, step functions, and piecewise linear functions both by hand and by using technology? Can they verbalize the real-world meanings of these?
5. Can students use translations, reflections, and dilations to graph new absolute value functions and step functions from parent functions?
6. Can students find the composition of two functions and decompose a composition into two functions?

2012-13 and 2013-14 Transitional Comprehensive Curriculum
Algebra IIUnit 1Functions 1-2
7. Can students define one-to-one correspondence, find the inverse of a relation, and determine if it is a function?
Unit 1 Grade-Level Expectations (GLEs) Teacher Note: The individual Algebra II GLEs are sometimes very broad, encompassing a variety of functions. To help determine the portion of the GLE that is being addressed in each unit and in each activity in the unit, the key words have been underlined in the GLE list, and the number of the predominant GLE has been underlined in the activity.
Grade-Level Expectations GLE # GLE Text and Benchmarks Algebra 4. Translate and show the relationships among non-linear graphs, related
tables of values, and algebraic symbolic representations (A-1-H) 6. Analyze functions based on zeros, asymptotes, and local and global
characteristics of the function10.
(A-3-H) Model and solve problems involving quadratic, polynomial, exponential, logarithmic, step function, rational, and absolute value equations
Geometry
using technology (A-4-H)
16. Represent translations, reflections, rotations, and dilations of plane figures using sketches, coordinates
Patterns, Relations, and Functions , vectors, and matrices (G-3-H)
24. Model a given set of real-life data with a non-linear function (P-1-H) (P-5-H) 25. Apply the concept of a function and function notation to represent and
evaluate functions (P-1-H) (P-5-H) 28. Represent and solve problems involving the translation of functions in the
coordinate plane (P-4-H) 29. Determine the family or families of functions that can be used to represent
a given set of real-life data, with and without technology (P-5-H) CCSS for Mathematical Content
CCSS # CCSS Text Building Functions F.BF.4a Find inverse functions.
a. Solve an equation of the form f(x) = c for a simple function f that has an inverse and write an expression for the inverse.
ELA CCSS CCSS # CCSS Text Writing Standards for Literacy in History/Social Studies, Science and Technical Subjects 6-12 WHST.11-12.10 Write routinely over extended time frames (time for reflection and
revision) and shorter time frames (a single sitting or a day or two) for a range of discipline-specific tasks, purposes, and audiences.

2012-13 and 2013-14 Transitional Comprehensive Curriculum
Algebra IIUnit 1Functions 1-3
Sample Activities Ongoing: Little Black Book of Algebra II Properties Materials List: black marble composition book, Little Black Book of Algebra II Properties BLM Activity: • Throughout the year, have students maintain a math journal of properties learned in each unit
which is a modified form of vocabulary cards (view literacy strategy descriptions). When students create vocabulary cards, they see connections between words, examples of the word, and the critical attributes associated with the word, such as a mathematical formula or theorem. Vocabulary cards require students to pay attention to words over time, thus improving their memory of the words. In addition, vocabulary cards can become an easily accessible reference for students as they prepare for tests, quizzes, and other activities with the words. These self-made reference books are modified versions of vocabulary cards because, instead of creating cards, the students will keep the vocabulary in black marble composition books (thus the name “Little Black Book” or LBB). Like vocabulary cards, the LBBs emphasize the important concepts in the unit and reinforce the definitions, formulas, graphs, real-world applications, and symbolic representations.
• Have students personalize the title page of their composition books including name, class, year, math symbols, and a picture of themselves.
• At the beginning of the unit, distribute copies of the Little Black Book of Algebra II Properties BLM. This is a list of properties in the order in which they will be learned in the unit. The BLM has been formatted to the size of a composition book, so students can cut the list from the BLM and paste or tape it into their composition books to use as a table of contents.
• The student’s description of each property should occupy approximately one-half page in the LBB and include all the information on the list for that property. The student may also add examples for future reference.
• Periodically check the Little Black Books and require that the properties applicable to a general assessment be finished by the day before the test, so pairs of students can use the LBBs to quiz each other on the concepts as a review.
Functions
1.1 Function of x – define function, how to identify equations as functions of x, how to identify
graphs as functions of x, how to determine if sets of ordered pairs are functions of x, how to explain the meaning of f(x) (e.g., If f(x) = 3x2 - 4, find f(3) and explain the process used in terms of a function machine.)
1.2 Four Ways to Write Solution Sets – explain/define roster notation, interval notation using ∪ and ∩, number line, set notation using “and” or “or”.
1.3 Absolute Value Equations and Inequalities as Solution Sets – write solutions in terms of “distance,” change absolute value notation to other notations and vice versa (e.g., write

2012-13 and 2013-14 Transitional Comprehensive Curriculum
Algebra IIUnit 1Functions 1-4
|x|<4, |x – 5| < 6, |x| > 9 as number lines, as words in terms of distance, as intervals, and in set notation; write : [−8, 8], (−4, 6) in absolute value notation.).
1.4 Domain and Range – write the definitions, give two possible restrictions on domains based on denominators and radicands, determine the domain and range from sets of ordered pairs, graphs, equations, and inputs and outputs of the function machine; define abscissa, ordinate, independent variable, and dependent variables.
1.5 Slope of a Line – define slope, describe lines with positive, negative, zero and no slope, state the slopes of perpendicular lines and parallel lines.
1.6 Equations of Lines – write equations of lines in slope-intercept, point-slope, and standard forms, and describe the process for finding the slope and y-intercept for each form.
1.7 Distance between Two Points and Midpoint of a Segment – write and explain the formula for each.
1.8 Piecewise Linear Functions – define and explain how to find domain and range for these
functions. (e.g., Graph and find the domain and range of ( )2 1 3
5 3x if x
f xx if x+ > −
= − − ≤ −
1.9 Absolute Value Function – define y = |x| as a piecewise function and demonstrate an understanding of the relationships between the graphs of y = |x| and y = a|x – h| + k (i.e., domains and ranges, the effects of changing a, h, and k). Write y = 2|x−3| +5 as a piecewise function, explain the steps for changing the absolute value equation to a piecewise function, and determine what part of the function affects the domain restrictions.
1.10 Step Functions and Greatest Integer Function – define each and relate to the piecewise function. Graph the functions and find the domains and ranges. Work and explain how to work the following examples: (1) Solve for x: 1
2x
= 7. (2) If ƒ(x) = 2 - 5 + 3x , find
ƒ(0.6) and ƒ(10.2). 1.11 Composite Functions – define, find the rules of f(g(x)) and g(f(x) using the example, f(x) =
3x + 5 and g(x) = x2, interpret the meaning of f g , explain composite functions in terms of a function machine, explain how to find the domain of composite functions, and how to graph composite functions with the graphing calculator.
1.12 Inverse Functions – define, write proper notation, find compositions, use symmetry to find the inverse of a set of ordered pairs or an equation, determine how to tell if the inverse relation of a set of ordered pairs is a function, explain how to tell if the inverse of an equation is a function, and explain how to tell if the inverse of a graph is a function.
Activity 1: Definition of Functions (GLEs: 24, 25; CCSS: WHST.11-12.10) Materials List: paper, pencil, graphing calculator, Math Log Bellringer BLM This activity has not changed because it already incorporates this CCSS. In this activity, students reinforce the concepts of function verbally, numerically, symbolically, and graphically.

2012-13 and 2013-14 Transitional Comprehensive Curriculum
Algebra IIUnit 1Functions 1-5
Math Log Bellringer: Determine if each of the following is a function of x. Explain both yes and no answers. (1) the set of ordered pairs {(x, y) : (1, 2), (3, 5), (3, 6), (7, 5), (8, 2)} (2) the set of ordered pairs {(x, y) : (1, 1), (2, 4), (3, 9), (–1, 1), (–2, 4), (–3,9)} (3) the relationship “x is a student of y” (4) the relationship “ x is the biological daughter of mother y” (5) the equation 2x + 3y = 6 (6) the equation x + y2 = 9 (7) the equation y = x2 + 4 (8)
(Teacher Note: The graphs and screen shots shown throughout this document were generated by a TI-84® graphing calculator.)
Solutions: (1) no, x = 3 has two values of y: 5 and 6 (2) yes, all values of x have only one value of y (3) no, if a student has more than one teacher; yes, if a student has only one
teacher (4) yes, each person has only one biological mother (5) yes, all values of x have only one value of y (6) no, if x = 0, y could equal +3 or – 3 (7) yes, all values of x have only one value of y (8) no, every value of x has two values of y
Activity: • Overview of the Math Log Bellringers in the Algebra II Comprehensive Curriculum: Each in-class activity throughout the eight Algebra II units is started with an activity
called a Math Log Bellringer that either reviews past concepts to check for understanding (reflective thinking about what was learned in previous classes or previous courses) or sets the stage for an upcoming concept (predictive thinking for that day’s lesson).
A math log is a form of a learning log (view literacy strategy descriptions) that students keep in order to record ideas, questions, reactions, and new understandings. Documenting ideas in a log about how content’s being studied forces students to “put into words” what they know or do not know. This process offers a reflection of understanding that can lead to further study and alternative learning paths. It combines writing and reading with content learning. The Math Log Bellringers will include mathematics done symbolically, graphically, and verbally.
Since Bellringers are relatively short, Blackline Masters have not been created for each of them. Write them on the board before students enter class, paste them into an enlarged Word™ document or PowerPoint™ slide and project using a TV or digital projector, or print and display using a document or overhead projector. A sample enlarged Math Log

2012-13 and 2013-14 Transitional Comprehensive Curriculum
Algebra IIUnit 1Functions 1-6
Bellringer Word™ document has been included in the Blackline Masters. This sample is the Math Log Bellringer for this activity.
Have the students write the Math Log Bellringers in their notebooks preceding the upcoming lesson during beginning−of−class record keeping, and then circulate to give individual attention to students who are weak in that area.
• Use the Bellringer to ascertain the students’ prior knowledge of functions and to have the
students verbalize a definition of a function of x. Several of the definitions may be: o A function is a set of ordered pairs in which no first component is repeated. o A function is a relation in which, for each value of the first component of the ordered
pairs, there is exactly one value of the second component. o A function is a relationship between two quantities such that one quantity is associated
with a unique value of the other quantity. The latter quantity, often called y, is said to depend on the former quantity, often denoted x.
• Discuss “unique value of the second component” as the key component to functions. The
relationship in problem 2 is not a function because, for example, Mary can be a student of Mrs. Joiner and Mr. Black. The relationship in problem 3 is a function because Mary is the biological daughter of only one woman.
• Discuss how to tell if ordered pairs, equations, and verbal descriptions are functions. • Function Machine: Paint a visual picture using a function machine, which converts one
number, the input, into another number, the output, by a rule in such a manner that each input has only one output. Define the input as the independent variable, and the output as the dependent variable, and the rule as the equation or relationship which acts upon the input to produce one output.
• Have students write the rule (equation) that symbolizes the relationship of the following and
draw a function machine for an input of 4 in the following situations: (1) The area of a circle depends on its radius. (2) The length of the box is twice the width, thus the length depends on the width. (3) The state tax on food is 5%, and the amount of tax someone pays depends on the cost
of the food bought. (4) y depends on x in Bellringer #2 Solutions:
rule: y = x2 + 3 input: x = 5 output: y = 28
l = 2w (2) w = 4
l = 8 in.
A = 2rπ (1) r = 4
A = 16π cm2
t = .05c (3) c = 4 t = $.20
y = x2 (4) x = 4 y = 16

2012-13 and 2013-14 Transitional Comprehensive Curriculum
Algebra IIUnit 1Functions 1-7
• Functions Symbolically:
o Discuss function notation. When the function f is defined with an equation using x for the independent variable and y for the dependent variable, the terminology “y is a function of x” is used to emphasize that y depends on x which is denoted by the notation y = f (x). (Make sure to remind the students that the parentheses do not indicate multiplication.) Stress that the symbolism f (3) is an easy way to say “find the y-value that corresponds to an x-value of 3.”
o Using the function machines above, have students rewrite the equations in function notation defining the functions A(r), l(w), t(c), and y(x)
Solutions: (1) ( ) 2A r rπ= , (2) l(w)= 2w, (3) t(c)= .05c, (4) y(x) = x2 o Using Bellringers #5 and #7, rewrite y as f(x).
Solutions: (5) ( ) 2 23
f x x= − + , (7) f (x) = x2 + 4
o Using Bellringer 6, have students determine why they cannot write y as a function of x. Solution: When y is isolated, there are two outputs: 9y x= + − and 9y x= − − .
• Functions Graphically:
o In Bellringer #8, there is no rule or set of ordered pairs, just a graph. Have the students develop the vertical line test for functions of x.
o Lead a discussion of the meaning of y = f (x) which permits substituting x for all independent variables and y for all dependent variables. Have the students use a graphing calculator to graph the functions developed above:
(1) A(r) graphed as 2y xπ= , (2) l(w) graphed as y = 2x, (3) t(c) graphed as y = .05x, (4) y(x) graphed as y = x2. Have students determine if the relations pass the vertical line
test. Solutions:
(1) , (2) , (3) , (4) • Critical Thinking Writing Assessment: (See Activity-Specific Assessments at end of unit.)
Rule: y = 9 x± − x = 4 5
5−

2012-13 and 2013-14 Transitional Comprehensive Curriculum
Algebra IIUnit 1Functions 1-8
Activity 2: Interval and Absolute Value Notation (GLEs: 10, 25) Materials List: paper, pencil This activity reviews how to express answers in roster and set notation and teaches interval and absolute value notation. Linear functions are taught extensively in Algebra I but should be continuously reviewed. In this activity, students will review graphing linear functions using interval notation. Math Log Bellringer:
Have students draw the following on a number line, then compare and contrast in #8 and #9: (1) x ∈ {5, 6, 7, 8} (2) {x : x > 4} (3) {x : x < 2 or x > 5} (4) {x : x > 3 and x < 0} (5) {x : x > 5 and x < 8}
(6) {x : –3 < x < 6} (7) { x∈ℜ} (8) Discuss the similarities and differences in the number line graphs for #1 and #5 (9) Discuss the difference in and and or statements.
Solutions: (1) (2) (3) . (4) (5) (6) (7) (8) #1 has four discrete points, #5 has an infinite number of points between and
including 5 and 8. (9) “and” statements form the intersection of the two sets, while “or” statements
form the union of the two sets. Activity: • Use the Bellringer to review three of the five ways to write solution sets:
(1) Roster Notation: This notation lists solutions in braces, { }. Use when the solutions are finite or when there is an infinite pattern in which the values are discrete and not

2012-13 and 2013-14 Transitional Comprehensive Curriculum
Algebra IIUnit 1Functions 1-9
continuous (e.g., {…, 2, 4, 6, …}). The three dots are called ellipsis and represent numbers that are omitted, but the pattern is understood.
(2) Set Builder Notation: Use when the answers are continuous and infinite. Review the use of the words and for intersection and or for union. Discuss that the notation in Bellringer #6 is an and situation similar to Bellringer #5. Ask the students to identify the difference in the set notation {x : 0 > x > 3} and notation used in Bellringer #4. (Teacher Note: 0 > x > 3 is an “and” notation so this set would signify an empty set because x cannot be both <0 and >3 at the same time.)
(3) Number Line: Use with roster notation using closed dots or set notation using solid lines. In Algebra I, an open dot for endpoints that are not included, such as in x > 2, and a closed dot for endpoints that are included, such as in x > 2, were used. Introduce the symbolism in which a parenthesis “(” represents an open dot, and a bracket “[” represents the closed dot on a number line. Use this notation to draw the number line answers for Bellringers 3, 5, and 6.
• Introduce Interval Notation: Use intervals to write continuous, infinite sets with the
following guidelines: (1) Bracket – indicates that the endpoint is included. Never use brackets with infinity. (2) Parenthesis – indicates that the endpoint is not included. (3) ∪ and ∩ : Use the symbol ∪ , union, for or statements and ∩ , intersection, for and
statements. Most and statements can be written as one interval, and this is rarely used. For example, since Bellringer 4 has no solution, the interval notation would be∅ . Since Bellringer 5 is between 5 and 8, the interval [5, 8] is more common and simpler than using [5, ∞ ) ∩ (−∞ , 8].
Have the students rewrite all the Bellringers in interval notation. Solutions: (1) Cannot use interval notation - the set is not continuous, (2) (4,∞ ), (3) (−∞ , 2) ∪ [5, ∞ ), (4) ∅ , (5) [5, 8], (6) [–3, 6), (7) ( ),−∞ ∞
• Introduce Absolute Value Notation: Review the absolute value concepts from Algebra I.
o Absolute Value Equalities: Define 00
a if aa
a if a≥
≡ − <; therefore |5| = 5 and |–5| = 5.
Have students solve |x| = 8 and list the answers in set builder notation and roster notation. Solution:{x : x = 8 or x = –8}, {8, –8}
o Absolute Value as Distance: Define absolute value as the distance on a number line from a center point. For example, |x| = 5 can be written verbally as, “This set includes the two numbers that are a distance of 5 from zero.” Have students express the following absolute
) 2
[ 5
#3
) 6
[ -3
#6
] 8
[ 5
#5

2012-13 and 2013-14 Transitional Comprehensive Curriculum
Algebra IIUnit 1Functions 1-10
• -7
• 7
| 0
7 7
value equalities in roster notation, set builder notation, on the number line, and verbally as distance.
(1) |x| = 7 Solution: Roster: {7, –7}, Set Notation: {x: x = 7 or x = –7} Verbally: This set includes the two numbers that are equal to a distance of 7 from zero. Number Line:
(2) |x + 2| = 8. Solution: Roster: {–10, 6}, Set Notation: {x: x = –10 or x = 6} Verbally: This set includes the two numbers that are equal to a distance of 8 from –2. Number Line:
(3) |x – 4| = 5. Solution: Roster: {–1, 9}, Set Notation: {x: x = –1 or x = 9}, Verbally: This set includes the two numbers that are equal to a distance of 5 from 4.) Number Line:
After working the examples, have students develop the formula |x – h| = d where h is the center and d is the distance.
o Absolute Value Inequalities:
Develop the meaning of |a| < b from the definition of absolute value:00
a if aa
a if a≥
≡ − <
|a| < b ⇒ a < b and –a < b ∴ a < b and a > –b.
Develop the meaning of |a| > b from the definition of absolute value: |a| > b ⇒ a > b or –a > b ∴ a > b or a < –b.
Replacing the “ = ” in the previous examples with inequalities, have students express the following absolute value inequalities in set builder notation, on the number line, verbally as distance, and in interval notation: (1) |x| < 7 (Solution: Set Notation: {x : –7 < x < 7}. Verbally: This set includes all
numbers that are less than or equal to a distance of 7 from 0. Interval Notation: [–7, 7].
• -10
• 6
| -2
8 8

2012-13 and 2013-14 Transitional Comprehensive Curriculum
Algebra IIUnit 1Functions 1-11
Number Line:
(2) |x + 2| > 8 (Solution: Set Notation: {x: x < –10 or x > 6}. Verbally: This set
includes all numbers that are greater than a distance of 8 away from –2. Interval Notation: ( ) ( ), 10 6,−∞ − ∪ ∞ . Number Line: (3) |x – 4| < 5 (Solution: Set Notation: {x : –1 < x < 9}. Verbally: This set includes
all numbers that are less than or equal to a distance of 5 from 4. Interval Notation: [–1, 9] . Number Line:
Now, have students go the other direction. Have students change the following intervals to absolute value notation. Remind them it is easier to graph on the number line first, find the center and distance, and then determine the absolute value inequality. (1) [-8, 8], (2) (–3, 3), (3) [–2, 8], (4) ( ) ( ),4 4,−∞ ∪ ∞ , (5) ( ] [ ), 6 2,−∞ − ∪ − ∞ (Solutions: (1) |x| <8, (2) |x| < 3, (3) |x – 3| < 5, (4) |x| > 4, (5) |x + 4| > 2)
• Using Interval Notation to Review Graphs of Linear Functions: (1) Give students the graph of a line segment with endpoints (–1, 2) and (3, 7). Ask students
to write the equation of the line and the values of x and y in interval notation.
Solution: (1) 5 134 4
y x= + , x: [–1, 3], y: [2, 7])
(2) Give students the equation f(x) = 3x – 6 and ask them to graph it on the interval [–3, 1].
(Make sure students understand that this is an interval of x.) Solution:
• -7
• 7
| 0
7 7
O -10
O 6
| -2
8 8
• -1
• 9
| 4
5 5

2012-13 and 2013-14 Transitional Comprehensive Curriculum
Algebra IIUnit 1Functions 1-12
Activity 3: Domain and Range (GLEs: 4, 6, 10, 24, 25; CCSS: WHST.11-12.10) Materials List: paper, pencil, graphing calculator, Domain & Range Discovery Worksheet BLM This activity has not changed because it already incorporates the CCSS listed. The focus of this activity is the use of roster, interval, and absolute value notations to specify the domain and range of functions from ordered pairs, equations, and graphs. Math Log Bellringer:
Have students graph the following functions on the graphing calculators, adjust the window to find both intercepts, sketch the graph in their notebooks, and find f(0) or discuss why f(0) does not exist:
(1) f(x) = 2x + 12, (2) f(x) = x2 + 23, (3) ( ) 5f x x= − , (4) ( ) 1f xx
=
Solutions:
(1)
(2)
(3) f(0) does not exist because ( )0 5f = − is not a real number and the calculator plots only points with real coordinates.(Students will most likely answer that they cannot take the square root of a negative number − students have not yet studied imaginary numbers.)
(4) f(0) does not exist because division by zero is not defined.
Activity: • Use the Bellringer to review steps for using the features of the graphing calculator such as
graphing, changing the window, and finding f(0) in three ways:

2012-13 and 2013-14 Transitional Comprehensive Curriculum
Algebra IIUnit 1Functions 1-13
(1) graph, then trace by moving the cursor (This is the most inaccurate method because of the limited number of pixels.)
(2) graph, then trace by typing a value into “x = ” (3) type y1(0) on the home screen (Note: y1 is under VARS > Y−VARS > 1: Function >
1: Y1. Discuss the relationship of this method to function notation. Discuss the types of error messages the calculator gives in answers to #3 and 4 above.)
• Domain and Range Discovery Worksheet BLM: A majority of the activities in all units of the Algebra II curriculum are designed to be
taught by discovery. The teacher can use the Discovery Worksheet BLMs to enhance the teacher’s full group guided discovery, or the students can work in pairs or groups to develop their own concepts while the teacher circulates to guide the development.
On the Domain & Range Discovery Worksheet BLM, the students walk through various real-world scenarios in order to clarify the meanings of independent and dependent variables and correctly define domain and range.
Put students in pairs and distribute the Domain & Range Discovery Worksheet BLM. Have the students complete the first section, Domain & Range in Real World Applications, and stop. Review the words independent variable (input) and dependent variable (output) discussed in Activity 1. Create a list of student definitions of domain and range on the board. Do not comment on any of the answers until they have created their own definitions in the discovery worksheet.
Investigate the domain and range definitions on the board to determine which are accurate. Domain should be defined as “the allowable values of the independent variable” and range as “the resulting values of the dependent variable” − not just x and y.
Students should continue the worksheet to discover domains and ranges from graphs, to determine the types of domain restrictions that result from equations, and to find domains of combinations of functions. Check for understanding after each of these sections.
When the students complete the worksheet, assign the following problems to be completed individually. Find the domain and range of the following and write in interval notation:
(1) y = 2x + 5 (2) {(2,8), (−1, 1), (4, 64)} (3)
Solutions: (1) D: (−∞,∞), R: (−∞, ∞), (2) D: {2, −1, 4}, R: 8, 1, 64}, (3) D: (−∞,∞) R:(−∞, 4]
• Critical Thinking Writing Assessment: See Activity-Specific Assessments at end of unit.

2012-13 and 2013-14 Transitional Comprehensive Curriculum
Algebra IIUnit 1Functions 1-14
Activity 4: Solving Absolute Value Equations and Inequalities (GLEs: 10, 29; CCSS: WHST.11-12.10)
Materials List: paper, pencil This activity has not changed because it already incorporates the CCSS listed. The focus for this activity is solving more absolute value equations and inequalities and expressing solutions in interval and set notation. Math Log Bellringer:
Have students write the solutions for the following absolute value equations in interval or roster notation and in terms of “distance.” (1) |x – 2| = 3 (2) |x + 3| < 4 (3) |x – 6| > 5 (4) |2x + 6| = 10 (5) |3x – 9| = –3
Solutions: (1) {5, –1}, The solutions for x are equal to a distance of 3 from 2. (2) [–7, 1], All the solutions for x are less than or equal to a distance of 4 from –3. (3) ( ) ( ),1 11,−∞ ∪ ∞ , The solutions are more than a distance of 5 from 6. (4) {–8, 2}. The solutions are equal to a distance of 5 from –3. (5) the empty set
Activity: • Use Bellringer problems #1 – 3 to review notations from Activity 2. • Absolute Value Equalities:
o Have the students discuss the procedures they used to solve Bellringer problem 4. o Review the definition – “what is inside the absolute value signs is positive and negative.”
The progression of steps in solving an absolute value analytically is important for future work with absolute values. Solve: |2x + 6| = 10
Solution: 2x + 6 = 10 or –(2x + 6) = 10 (Do not allow students to skip this step.) 2x = 4 2x + 6 = –10 x = 2 2x = –16 x = –8
o Stress that students should think of the big picture first when attempting to solve Bellringer problem #5 (i.e., absolute values cannot be negative; therefore, the answer is the empty set). This is also a good opportunity to stress that students check their work by substituting the answers back into the original equation.
• Properties of Absolute Value Expressions:
o Have the students decide if the following equations are true or false, and if false, give counter-examples:

2012-13 and 2013-14 Transitional Comprehensive Curriculum
Algebra IIUnit 1Functions 1-15
Property 1: |ab| = |a||b| Property 2: |a +b| = |a| + |b| (Solutions: (1) true (2) false |2 + (–5)|< |2| + |–5|)
o Ask the students how they would use Property #1 (above) to help solve the problem
|2x + 6|=10 using the “distance” discussion. Solution: |2x + 6| = 10 ⇒ |2(x+3)|=10 ⇒ |2||x+3|=10 ⇒2|x + 3| = 10 ⇒ |x + 3| = 5 ⇒”x is a distance of 5 from –3; therefore, the answer is –8 and 2.”
• Absolute Value Inequalities:
o Ask the students to solve and discuss how they can think through the following problems to find the solutions instead of using symbolic manipulations:
1) |3x–15| < 24 2) |5 – 2x| > 9.
Develop the concept that “is equal to” is the division between “ is greater than” and “is less than”; therefore, changing these inequalities into equalities to find the boundaries on the number line and then choosing the intervals that make the solution true are valid processes to use. Solutions:
(1) The boundaries occur at x = –3 and 13, and the interval between these satisfies the inequality, so the answer is –3 < x < 13 (2) The boundaries occur at –2 and 7, and the intervals that satisfy this equation occur outside of these boundaries, so the answer is x < –2 or x > 7.
o Relate these answers to the distance concepts in Activity 2 and use the discussion to develop the rules for > (or relationship) and < (and relationship) and tell why.
• Critical Thinking Writing Assessment: See Activity-Specific Assessments at the end of unit. Activity 5: Linear Functions (GLEs: 6, 16, 25, 28; CCSS: WHST.11-12.10) Materials List: paper, pencil, graphing calculator, Linear Equation Terminology BLM, Translating Graphs of Lines Discovery Worksheet BLM This activity has not changed because it already incorporates the CCSS listed. This activity focuses on reviewing the concepts of linear equations and on transforming linear equations into linear functions, as well as a discussion of function notation and domain and range. Depending on the students’ backgrounds, this activity may take two days. Math Log Bellringer:
With a partner, have students complete part one of the Linear Equation Terminology BLM which is a vocabulary self-awareness chart (view literacy strategy descriptions). Vocabulary self-awareness is valuable because it highlights students’ understanding of what they know, as well as what they still need to learn, in order to fully comprehend the concept. Students indicate their understanding of a term/concept, but then adjust or change the marking to reflect their change in understanding. The objective is to have all terms marked with a + at the end of the unit. To complete the chart, students should rate

2012-13 and 2013-14 Transitional Comprehensive Curriculum
Algebra IIUnit 1Functions 1-16
their personal understanding of each concept with either a “+” (understand well), “” (limited understanding or unsure), or a “−” (don’t know), and then write and solve a sample problem for each concept. Have students refer to the chart later in the unit to determine if their personal understanding has improved.
Mathematical Terms + − Formula or description
1 Slope of a line 2 Slope of horizontal line 3 equation of a horizontal line
4 slope of a line that starts in Quadrant III and ends in Quadrant I
5 slope of a line that starts in Quadrant II and ends in Quadrant IV
6 Slope of a vertical line 7 equation of a vertical line 8 slopes of parallel lines 9 slopes of perpendicular lines
10 point-slope form of equation of line 11 y-intercept form of equation of line 12 standard form of equation of line 13 distance formula 14 midpoint formula
Activity: • After the students have completed the vocabulary self awareness chart on the Linear
Equation Terminology BLM, discuss and correct the formulas. Then, allow the students to complete part two on the Linear Equation Terminology BLM, Sample Problems, where they are creating problems based on the mathematical terms listed above. Let each pair of students choose one of the concepts in the Bellringer and put their problem (unworked) on the board for everyone else to work. After all students have worked the problem, have the pair explain the problem and solution. If the students are having difficulties with a particular concept, choose another pair’s problem for everyone to work. The students should revisit the ratings in their charts after they have worked the problems and adjust their ratings if necessary.
• Point-slope form of the equation of a line is one of the most important forms of the equation
of a line for future mathematics courses such as Calculus. Have pairs of students find the equations of lines for the following situations using point-slope form without simplifying:
(1) slope of 4 and goes through the point (2, –3) (2) passes through the two points (4, 6) and (–5, 7) (3) passes through the point (6, –8) and is parallel to the line y = 3x + 5 (4) passes through the point (–7, 9) and is perpendicular to the line y = ½ x + 6 (5) passes through the midpoint of the segment whose endpoints are (4, 8) and (–2, 6) and
is perpendicular to that segment Solution:
(1) y + 3 = 4(x – 2), (4) y – 9 = –2(x + 7),
(2) y – 6 = 19− (x – 4) or y – 7 = 1
9− (x + 5) (5) y – 7 = –3 (x – 1) (3) y + 8 = 3(x – 6),

2012-13 and 2013-14 Transitional Comprehensive Curriculum
Algebra IIUnit 1Functions 1-17
• Graphing lines: Have the pairs of students use the above problems and their graphing calculators to do each of the following steps: o Isolate y in each of the above equations (without simplifying).
Teacher Note: Writing the equation in this form begins the study of transformations that is a major focus in Algebra II for all new functions. Solutions:
(1) y = 4(x – 2) – 3 (3) y = 3(x – 6) – 8
(2) ( )1 4 69
y x= − − + (4) y = –2(x +7) + 9
or ( )1 5 79
y x= − + + (5) y = –3(x – 1) + 7
o Graph each of the above equations on the calculator, adjusting the window to see both intercepts. Sketch a graph in your notebook labeling the intercepts.
o Trace to all of the points specified in the problem to make sure the equation is entered correctly (i.e., For problem #1, trace to x = 2 and verify that y = 3). Then for each problem, trace to x = 0.
Solutions:
(1) (2)
(3) (4)
(5)
o Simplify each of the equations above and replace y with f(x). Find f(0) analytically. Solutions:
(1) f(x) = 4x – 11, f(0)= –11
(2) ( ) 1 589 9
f x x= − + , ( ) 5809
f =
(3) f(x) = 3x – 26, f(0) = –26 (4) f(x) = –2x – 5, f(0) = –5 (5) f(x) = –3x + 10, f(0) = 10

2012-13 and 2013-14 Transitional Comprehensive Curriculum
Algebra IIUnit 1Functions 1-18
o Compare the answers written in f(x) form to the y-intercept form, identify the slope in both forms, and discuss the relationship between the y-intercept and f(0)(i.e. f(0) = the y-intercept). Discuss that the domain and range of linear functions are both all real numbers.
• Translating Graphs of Lines Discovery Worksheet BLM: On this worksheet, the students will begin to learn a major focus of the Algebra II
curriculum − translations, rotations, and transformations of graphs. They will use the equation of a line in the form f(x) = m(x − x1) + y1 to discover how f(x ± h) and f(x) ± k changes the graph.
Distribute the Translating Graphs of Lines Discovery Worksheet BLM and have the students graph each set of three lines on the same screen on their graphing calculators. Then have students write an explanation of the changes in the equation and what effect the change has on the graph.
When the students have completed the worksheet, draw conclusions from the students’ answers and assign the following problem to be completed individually: (1) Graph y = 3(x + 4) − 5. (2) Discuss what types of translations were made to the parent graph
y = 3x. Solution: The line was moved 4 units to the left and 5 units down.
• Critical Thinking Writing Assessment: See Activity-Specific Assessments at the end of unit.
Activity 6: Piecewise Linear Functions (GLEs: 6, 10, 16, 24, 25, 28, 29; CCSS: WHST.11-12.10)
Materials List: paper, pencil, graphing calculator, graph paper (optional) This activity has not changed because it already incorporates the CCSS listed. In this activity, the students will review the graphs of linear functions by developing the graphs for piecewise linear functions. Teacher Note: Before the Bellringer, explain to the students that throughout the year, as they hone their graphing skills, they will be asked to graph basic equations in a very limited amount of time, such as 30 seconds, in a process called “speed graphing.” Math Log Bellringer:
Speed graph the following functions by hand and discuss the process used to graph them:
(1) g(x) = 2x + 4 (2) h(x) = –3x – 9
Solution: “I found the y-intercept and counted the slope of change
in y over change in x from that point.”

2012-13 and 2013-14 Transitional Comprehensive Curriculum
Algebra IIUnit 1Functions 1-19
Activity: • Use the Bellringer to review the y-intercept form of an equation. Make sure students are
proficient in graphing lines quickly. • Give students the definition of a piecewise function ≡ a function made of two or more
functions and written as ( ) 1
( )( ) 2
g x if x Domainf x
h x if x Domain∈
= ∈
where 1 2Domain Domain∩ =∅ and 1 2Domain Domain All real numbers∪ = . (Teacher Note: The intersection of the two domains is usually required to be empty to ensure
that the relation is a function unless the endpoints share the same output. ) • Add the following restrictions to the domains of the functions in the Bellringer.
o Have students regraph g(x) with a domain of x > –2 and h(x) with a domain of x < –2 on the same graph with the starting points labeled.
o Have students rewrite f(x) as a piecewise function of g(x) and h(x).
Solution: o Discuss whether f(x) is a function referring to the = only on one
domain and the use of open dot on one graph and a closed dot on the other
o Find the domain and range. Solution: D: all reals, R: y > −3
• Guided Practice: Have the students graph the following two functions by hand and find the
domains, ranges, and x-intercepts. Calculate the designated function values for each.
(1) 3 2 1
( )4 2 1x if x
f xx if x+ >
= − − ≤, Find f(3), f(1), f(0)
(2) 3 1 0
( ) 42 0
x if xg x
x if x
− − ≥= − <
, Find g(4), g(0), and g(–2)
Solutions: (1) Domain: all reals, range: y > –6, x-intercept: x = – 1
2 , f(3) = 11, f(1) = –6, f(0) = –2
(2) Domain: all reals, range: ( ] ( ), 1 0,−∞ − ∪ ∞ , x-intercept: none, g(4)= –4, g(0)= –1, g(–2)=4
2 4 2( )
3 9 2x if x
f xx if x+ > −
= − − ≤ −

2012-13 and 2013-14 Transitional Comprehensive Curriculum
Algebra IIUnit 1Functions 1-20
• Critical Thinking Writing Assessment: See Activity-Specific Assessments at end of unit. Activity 7: Graphing Absolute Value Functions (GLEs: 4, 6, 10, 16, 24, 25, 28, 29) Materials List: paper, pencil, graphing calculator, Translating Absolute Value Functions Discovery Worksheet BLM, graph paper (optional) In this activity, students will relate the piecewise function to the graph of the absolute value function and continue their development of translating functions based on constants. Math Log Bellringer:
Graph the following piecewise function without a calculator:
0
( )0
x if xf x
x if x≥
= − < Solution:
Activity: Teacher Note: The Bellringer and following discussion are included on the Translating Absolute Value Functions Discovery Worksheet BLM. • Discuss whether the Bellringer is a function and find the domain and range of f(x). Solution: Yes, it is a function with D: all reals and R: y > 0 • Have students graph y = |x| on their graphing calculators and discuss its relationship to
Bellringer #1 and the definition of absolute value from Activity 2. Discuss the shape of the graph, slope of the two lines that create the graph, the vertex, the domain and range, and the axis of symmetry.
• Translating Absolute Value Functions Discovery Worksheet BLM: On this worksheet, the students will analyze the characteristics of the absolute value
function, then translate the graph using the rules developed in Activity 6 for f(x ± h) and f(x) ± k. Then, they will discover how ±f(x) and af(x) affect the graph.
Arrange the students in groups to complete the first two sections of the BLM in which they create their own rules, Graphing Absolute Value Functions and Translating Graphs of Absolute Value Functions. Stop and draw conclusions from the students’ answers.
Have the students complete the Synthesis and Analysis sections of the BLM to apply the rules. Circulate to check answers.
When the students finish the worksheet, assign the following problem to be worked individually: (1) Graph the function f(x) = 3|x – 2| + 4 without your calculators and then check with
your calculators. (2) Adjust the window to find all intercepts.

2012-13 and 2013-14 Transitional Comprehensive Curriculum
Algebra IIUnit 1Functions 1-21
(3) Locate the vertex and equation of the axis of symmetry. (4) State the domain and range. (5) Determine the slopes of the two lines that form the “V” and
find the x- and y-intercept. (6) How are the vertex and slopes related to the constants in the
equation of an absolute value in the form f(x) = a|x − h| + k? Solutions: vertex: (2, 4), axis of sym. x = 2, domain: all reals, range: y > 4, slopes = 3± , no x-intercept, y-intercept (0, 10), (h, k) is the vertex, ± a are the slopes
• Saga of the V−shaped Animal: Have the students demonstrate their understanding of the
transformation of the absolute value graph by completing the following RAFT writing (view literacy strategy descriptions). RAFT writing gives students the freedom to project themselves into unique roles and look at content from unique perspectives. In this assignment, students are in the Role of a V−shaped animal of their choice in which the Audience is an Algebra II student. The Form of the writing is a story of the exploits of the Algebra II student, and the Topic is transformations of the absolute value graph. Give each student the following directions: You are an animal of your choice, real or make-believe, in the shape of an absolute value function. Your owner is an Algebra II student who moves you, stretches you, hugs you, and turns you upside down. Using all you know about yourself, describe what is happening to you while the Algebra II student is playing with you. You must include at least ten facts or properties of the Absolute Value Function, f(x) = a|x – h| + k in your story. Discuss all the changes in your shape as a, h, and k change between positive, negative, or zero and get smaller and larger. Discuss the vertex, the equation of the axis of symmetry, whether you open up or down, how to find the slope of the two lines that make your “V−shape,” and your domain and range. (Write a small number (e.g., 1, 2, etc.) next to each property in the story to make sure you have covered ten properties.) Have students share their stories with the class to review for the end−of−unit test. A sample story would go like this: “I am a beautiful black and gold Monarch butterfly named Abby flying around the bedroom of a young girl in Algebra II named Sue. Sue lies in bed and sees me light on the corner of her window sill, so my (h, k) must be (0, 0) 1. I look like a “V” 2 with my vertex at my head and wings pointing at the ceiling at a 45° angle 3. My “a” must be positive one 4. I am trying to soak up the warm rays of the sun so I spread my wings making my “a” less than one 5. The sun seems to be coming in better in the middle of the window sill, so I carefully move three hops to my left so my “h” equals −3 6. My new equation is now y = .5|x + 3| 7. Sue decided to try to catch me, so I close my wings making my “a” greater than one 8. I begin to fly straight up five inches making my “k” positive five 9 and my new equation y = 2|x + 3| + 5 10. Then I turned upside down trying to escape her making my “a” negative 11. Sue finally decided to just watch me and enjoy my beauty. ”
Activity 8: Absolute Value Functions as Piecewise Linear Functions (GLEs: 4, 6, 10, 16, 25,
28, 29) Materials List: paper, pencil, graphing calculator, graph paper

2012-13 and 2013-14 Transitional Comprehensive Curriculum
Algebra IIUnit 1Functions 1-22
In this activity, students will change absolute value functions into piecewise functions. Math Log Bellringer:
(1) Graph the piecewise function without a calculator: ( )
( )
1 2 3 22( )1 2 3 22
x if xg x
x if x
− + ≥= − − + <
(2) Graph the absolute value function without a calculator f(x) = ½ |x − 2| + 3. (3) Discuss the shapes of the graphs, slopes of the two lines that create the graphs, the
vertex, the domain and range, and the axis of symmetry. Solutions: Both graphs are the same. They are V−shaped with the slopes ± ½ , vertex (2, 3), domain all reals, range y > 3 and the axis of symmetry x = 2.
Activity: • Have the students discover the method for writing a piecewise function for the absolute value
function using the following steps: o Graph f(x) = 3|x – 2| + 4 accurately on graph paper and extend both lines to intercept the
x- and y-axis. o Identify the slopes of the lines and the vertex as a common point. (Solution: slopes = ± 3,
vertex = (2, 4)) o Using the vertex as the point and +3 and −3 as the slopes, have them find the two
functions g(x) and h(x) that are the equations for the lines that create the “V,” using point−slope form of the equation of the line. Solution: y − 4 = 3(x − 2) ⇒ g(x) = 3(x − 2) + 4.
y − 4 = −3(x − 2) ⇒ h(x) = −3(x − 2) + 4 o Graph f(x) and the two lines g(h) and h(x) on the calculator to
see if they coincide with the f(x) graph. o Have students determine the domain restrictions to cut off the lines at the vertex, then
write f(x) as a piecewise function of the two lines: Discuss where the = sign should be on the domains and if it would be correct to put it on either or both and still create a function. (Teacher Note: Even though f(x) would still be a function if the = sign is on either or both domains, mathematical convention puts the = sign on the > symbol.)
Solution: ( )3 2 23 10 2x if x
f xx if x− ≥
= − + <.
• Have students develop the following steps to symbolically create a piecewise function for an absolute value function without graphing: (1) Remove the absolute value signs, replace with the parentheses keeping everything else
for g(x), and simplify. (2) Do the same for h(x), but put a negative sign in front of the parentheses and simplify.

2012-13 and 2013-14 Transitional Comprehensive Curriculum
Algebra IIUnit 1Functions 1-23
(3) Determine the domain by the horizontal shift inside the absolute value, – shifts right and + shifts left, and put the equal on >.
o Guided Practice: Have students change the following equations to piecewise functions and check on the graphing calculator: (1) f(x) = |x| +4 (2) f(x) = 2|x + 4|
(3) f(x) = –4|x| +5 (4) f(x) = –2|x – 4| + 5 Solutions:
(1) ( )4 04 0
x if xf x
x if x+ ≥
= − + <
(2) ( )2 8 42 8 4x if x
f xx if x+ ≥ −
= − − < −
(3) ( )4 5 0
4 5 0x if x
f xx if x
− + ≥= + <
(4) ( )2 13 42 3 4
x if xf x
x if x− + ≥
= − <
(The TEST feature of the TI 84 graphing calculator can be used to graph piecewise functions on the calculator. Inequalities are located under 2nd > MATH . f (x) above should look like this on the calculator: ( ) ( )1 3 2 / 1y x x= + > , ( ) ( )2 4 2 / 1y x x= − − ≤ . Activity 9: Solving Absolute Value Inequalities Using a Graph (GLEs: 4, 6, 10, 25, 28) Materials List: paper, pencil, graphing calculator, Absolute Value Inequalities Discovery Worksheet BLM In this activity, students will relate absolute value graphing and piecewise functions to solving absolute value inequalities. Math Log Bellringer:
Have students review absolute value inequalities by writing the solutions for the following in interval, roster notation, set notation, and in a sentence in terms of “distance.” (1) |x – 1| = 4 (2) |x + 2| < 3 (3) |x – 5| > 6

2012-13 and 2013-14 Transitional Comprehensive Curriculum
Algebra IIUnit 1Functions 1-24
Solutions: (1) Interval notation cannot be used in discrete solutions. Roster and set notation: {5, –3} Sentence: “The solutions for x are equal to a distance of 4 from 1.” (2) Interval notation: [–5, 1], Roster notation cannot be used for an infinite number of solutions. Set notation: {x: x > −5 and x < 1} “All the solutions for x are less than or equal to a distance of 3 from –2.” (3) Interval notation: ( ) ( ), 1 11,−∞ − ∪ ∞ Roster notation cannot be used for an infinite number of solutions. Set notation: {x: x<-1 or x>11} “The solutions for x are greater than a distance of 6 from 5.” Activity: • Use the Bellringer to review interval and roster notation, the difference in intersection and
union, and the difference in “and” and “or” notation. • Absolute Value Inequalities Discovery Worksheet BLM: On this worksheet, the students will discover how the translated graphs of absolute value
functions can be used to solve one variable absolute value inequalities. This technique will be applied in later chapters to solve other inequalities such as polynomials.
The directions in the worksheet instruct the students to “isolate zero” in the one-variable equation. They should perform the algebra necessary to move all variables and constants to one side of the equation (e.g., |x − 3| > 5 ⇒ |x − 3| − 5 > 0).
Arrange the students in groups and distribute the worksheet. As they work, circulate to make sure they make the connections between the one variable and two variable equations.
When they complete the worksheet, put the following problem on the board to be solved individually: (1) Graph f(x) = −2|x + 1| + 4. (2) Write the piecewise function. (3) Find the zeroes of the function. (4) Use the graph to solve for x in this equation: −2|x + 1| < −4.
Solutions:
(1)
(2) ( ) 2 2 12 6 1
x if xf x
x if x− + ≥ −
= + < −
(3) {−3, 1} (4) Find x values where y <0, x <−3 or x> 1.

2012-13 and 2013-14 Transitional Comprehensive Curriculum
Algebra IIUnit 1Functions 1-25
Activity 10: Step Functions (GLEs: 4, 6, 10, 16, 24, 25, 28, 29) Materials List: paper, pencil, graphing calculator, Greatest Integer Discovery Worksheet BLM, Step Function Data Research Project BLM, Step Function Data Research Project Grading Rubric BLM In this activity, the students will discover the applications of step functions. They will also learn how to graph step functions as well as how to graph and write the piecewise function for greatest integer functions. Math Log Bellringer:
(1) Graph by hand ( )5 32 4 33 4
if xf x if x
if x
≥= − ≤ <− < −
.
(2) Find domain, range, f(4), f(0) and f(–6) and explain how you found these answers. Solution: Domain: all reals, range: {5, 2, –3}, f(4) = 5, f(0) = 2 and f(–6) = –3. “I used the first equation in f(x) to find f(4) because 4 is in that domain, etc.”
Activity: • Use the Bellringer to review graphing piecewise functions, domain, range, and function
notation for particular domains. Ask students what kinds of lines each of the pieces are and to find the slope of each of the lines. Describe “step functions” as a series of horizontal lines.
• Ask the students for examples in real life of step functions (e.g., shoe sizes, postage rates, tax
brackets). • Greatest Integer Discovery Worksheet BLM: In this worksheet, the students will discover the greatest integer function by graphing it
on the graphing calculator. They will sketch the graph and write its piecewise- defined definition. They will then apply the previously learned translations and transformations to the parent graph ( ) f x x= .
Arrange the students in pairs and distribute the Greatest Integer Discovery Worksheet BLM. Stop the students after the first page to check for understanding. (Teacher Note: Make sure the line segments in the graph in #1 have closed dots on the left and open dots on the right and the domains in the piecewise function have the < sign on the left number. If students have difficulty with the section Solving Greatest Integer Problems, have them solve a basic problem such as x = 2 by looking at the graph in #1 or the piecewise function in #2 to see that the solution is a range of answers, 2 < x <3. Then complicate
the problem such as x =4 2⇒ 2 < 4x <3⇒ x≤ ≤1 32 4
.)

2012-13 and 2013-14 Transitional Comprehensive Curriculum
Algebra IIUnit 1Functions 1-26
Have the students complete the 2nd page of translations and check for understanding. The real-world application on the 3rd page can be done in class or as a homework assignment.
When the students complete the first two pages of the worksheet, put the following problem on the board to be solved individually:
(1) Graph ( ) 1 3f x x= − − + .
(2) Discuss the translations and transformations made.
Solution: The parent graph was moved to the right 1,
rotates through space around the y−axis, then shifted up 3.
• Step Function Data Research Project: In this project, the students will find data on the Internet or in the newspaper that is
conducive to creating a step function graph. Instruct them to graph the function on ½ sheet of poster paper, decorate it relative to the topic, write the equation, domain and range, and use it to interpolate and extrapolate to answer a real-world question.
Distribute Step Function Data Research Project BLM and Step Function Data Research Grading Rubric BLM and explain directions and grading. This is an out−of−class project that is due in a week.
When students return their projects, have them share their information with the class. Activity 11: Composition of Functions (GLEs: 4, 10, 24, 25; CCSS: WHST.11-12.10) Materials List: paper, pencil, graphing calculator, Composite Function Discovery Worksheet BLM This activity has not changed because it already incorporates the CCSS listed. The students will combine functions to create new functions, decompose functions into simpler functions, and find their domains and ranges. Math Log Bellringer:
f(x) = –2x + 5. Find the following: (1) f (0) (2) f (–2) (3) f (a) (4) f (a + 1) Solutions: (1) 5, (2) 9, (3) –2a + 5, (4) –2a + 3
2012-13 and 2013-14 Transitional Comprehensive Curriculum
Algebra IIUnit 1Functions 1-27
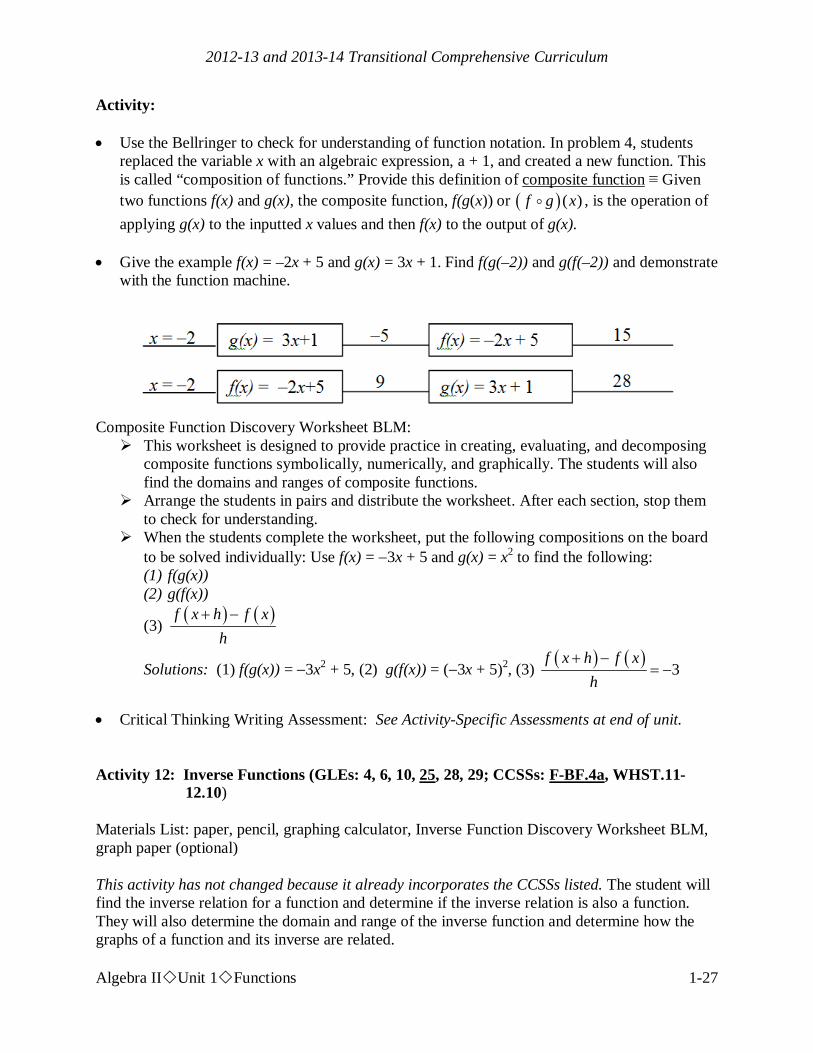
Activity: • Use the Bellringer to check for understanding of function notation. In problem 4, students
replaced the variable x with an algebraic expression, a + 1, and created a new function. This is called “composition of functions.” Provide this definition of composite function ≡ Given two functions f(x) and g(x), the composite function, f(g(x)) or ( ) ( )f g x , is the operation of applying g(x) to the inputted x values and then f(x) to the output of g(x).
• Give the example f(x) = –2x + 5 and g(x) = 3x + 1. Find f(g(–2)) and g(f(–2)) and demonstrate
with the function machine.
Composite Function Discovery Worksheet BLM: This worksheet is designed to provide practice in creating, evaluating, and decomposing
composite functions symbolically, numerically, and graphically. The students will also find the domains and ranges of composite functions.
Arrange the students in pairs and distribute the worksheet. After each section, stop them to check for understanding.
When the students complete the worksheet, put the following compositions on the board to be solved individually: Use f(x) = −3x + 5 and g(x) = x2 to find the following: (1) f(g(x)) (2) g(f(x))
(3) ( ) ( )f x h f xh
+ −
Solutions: (1) f(g(x)) = −3x2 + 5, (2) g(f(x)) = (−3x + 5)2, (3) ( ) ( ) 3f x h f x
h+ −
= −
• Critical Thinking Writing Assessment: See Activity-Specific Assessments at end of unit. Activity 12: Inverse Functions (GLEs: 4, 6, 10, 25, 28, 29; CCSSs: F-BF.4a, WHST.11-
12.10) Materials List: paper, pencil, graphing calculator, Inverse Function Discovery Worksheet BLM, graph paper (optional) This activity has not changed because it already incorporates the CCSSs listed. The student will find the inverse relation for a function and determine if the inverse relation is also a function. They will also determine the domain and range of the inverse function and determine how the graphs of a function and its inverse are related.

2012-13 and 2013-14 Transitional Comprehensive Curriculum
Algebra IIUnit 1Functions 1-28
Math Log Bellringer:
(1) Graph f(x) = 2x + 4 and g(x) = ½ x – 2 on the same graph by hand, then graph on your calculator.
(2) Find f(3) and g(10). (3) What point do they share? (Note: On the TI 84 calculator, after you have graphed the
functions on your calculator, you can find the intersection by the following steps: 2nd TRACE [CALC], 5: intersect, ENTER , ENTER , ENTER
(4) Find the equation for f(g(x)) and g(f(x)). Solutions: (1) (2) f(3) = 10 and g(10) = 3 (3) They share (–4, –4) (4) f(g(x)) = g(f(x)) = x
Activity: • Use the Bellringer to review graphing lines, using function
notation, and composing functions. Have students graph both equations on their calculators and use the ZOOM square feature. Note how the x and y values have swapped. Ask, “Are both graphs functions?” Have students graph y = x on the same graph and make comparisons.
• Define inverse relation ≡ any relation that swaps the independent and dependent variables. • Inverse Function Discovery Worksheet BLM: In this worksheet, the students will apply the definition of inverse relation to find the
inverse relationship and to determine if the inverse of every function is also a function. They will investigate numerical, verbal, algebraic, and graphical relationships.
Distribute the worksheet and put students in pairs to work questions #1 − 13, then stop to check for understanding.
Discuss the four definitions of inverse functions and discuss how to find the inverse of a function algebraically. The students should work questions #14 and 15.
When the students complete the worksheet, put the following problems on the board to be solved individually: Find the inverse of the function f(x) = −3x + 7.
Solution: ( )1 73
xf x− −=
−
• Critical Thinking Writing Assessment: See Activity-Specific Assessments at end of unit.

2012-13 and 2013-14 Transitional Comprehensive Curriculum
Algebra IIUnit 1Functions 1-29
Sample Assessments
General Assessments
• Use Bellringers as ongoing informal assessments. • Collect the Little Black Book of Algebra II Properties and grade for completeness at the
end of the unit. • Monitor student progress using small quizzes to check for understanding during the unit
on such topics as the following: (1) speed in graphing lines (2) changing among set notation, interval notation, absolute value notation, and
number lines (3) graphing piecewise linear functions (4) graphing absolute value functions
• Administer two comprehensive assessments: (1) functions, graphing piecewise linear functions, stating solution sets in all notations (2) graphing absolute value functions and greatest integer functions, changing
absolute value functions to piecewise functions, finding compositions of functions and inverse functions.
Activity-Specific Assessments Teacher Note: Critical Thinking Writings are used as activity-specific assessments in many of the activities in every unit. Post the following grading rubric on the wall for students to refer to throughout the year.
2 pts. - answers in paragraph form in complete sentences with proper grammar and punctuation
2 pts. - correct use of mathematical language 2 pts. - correct use of mathematical symbols 3 pts./graph - correct graphs (if applicable) 3 pts./solution - correct equations, showing work, correct answer 3 pts./discussion - correct conclusion
• Activity 1: Critical Thinking Writing
The relationship between the profit, f (x), in dollars made on the sale of a book sack and the cost to make the book sack, x, in dollars, is given by the function f (x) = –2x2 + 4x + 5. What is the value of f (1)? Describe in your own words what x = 1 and what f (1) mean in real-world terms, using the terminology independent and dependent variable. Graph the function on your graphing calculators, sketch the graph on paper, and explain what is happening to the relationship between cost and profit. Solution: f(1)=7; x is the independent variable, cost, and f(x) is the dependent variable, profit. f(1) means that the profit made on a book sack which costs $1.00 to make will be $7.00. As the cost of

2012-13 and 2013-14 Transitional Comprehensive Curriculum
Algebra IIUnit 1Functions 1-30
the book sack increases to $1, the greatest profit of $7.00 is made, but after that, less profit is made. (Answers may vary.)
• Activity 3: Critical Thinking Writing
Discuss which variable is the independent variable and which variable is the dependent variable and why. Describe the real-world domain and range of the following functions.
(1) The cost, c, of building a house, as a function of its square footage, f. (2) The height, h, of an egg dropped from a 300-foot building, as a function of time, t. (3) The number of hours, h, of daylight per day, d¸ over a two-year period. (4) The profit, p, in dollars, made on the sale of a book sack, and the price charged
the consumer, c, in dollars, to purchase the book sack, given by the function, p(c) = –2c2 + 4c +5. Graph the function on your calculator to determine the domain and range. Sketch and discuss why the graph looks like this.
Solutions: (1) The square footage, f, is the independent variable, and the cost, c is the dependent
variable because the cost depends on the square footage. The domain is f > 0 and the range is c > 0 because there is no negative or zero square footage or cost.
(2) The time, t, is the independent variable, and the height at a particular time, h, is the dependent variable because the height depends on the time. The domain is t > 0 because there is no negative time, and the range is 0 < h < 300 because the egg was dropped from that height and the ground is 0.
(3) The day of the year, d, is the independent variable, and the number of hours of daylight, h, is the dependent variable, because the number of hours of daylight depends on the day of the year. The domain is 1 < d < 730 because 1 represents the end of the first day of the year, and 730 the end of the last day of two years except in leap year. The range depends on where you are on Earth, but could be between 0 and 24.
(4) The independent variable is the price charged to purchase the book sack, c, and the dependent variable is the profit, p, because the profit on the sale of the book depends on how much is charged for the book. The domain is [0, 4] because if you could give away the book sack for free, the profit would be 0. The most that can be charged is $4.00, or you’ll make a negative profit. The range is [0, 7] because if cost stays between 0 and 4, the profit is at least 0 but maxes out at $7.00. The graph looks like this because the more you charge, the more profit you will make, but if you charge too much, the sales go down and you make less profit.
• Activity 4: Critical Thinking Writing
The specifications for machined parts are given with tolerance limits. For example, if a
part is to be 6.8 cm thick, with a tolerance of .01 cm, this means that the actual thickness must be at most .01 cm, greater than or less than 6.8 cm. Between what two thicknesses is the dimension of the part acceptable (discuss why)? Write an absolute value equation using “d” as the variable. Write, as well, the set notation and interval notation that

2012-13 and 2013-14 Transitional Comprehensive Curriculum
Algebra IIUnit 1Functions 1-31
models this situation and discuss the difference in what absolute value notation shows as opposed to set and interval notations.
Solution: The acceptable dimensions will be between and including 6.79 cm and 6.81 cm
because you would add and subtract the tolerance from the required thickness. |d – 6.8| < 0.01, 6.79 < d < 6.81, [6.79, 6.81]. Absolute value notation shows both the
required thickness and the tolerance, while set and interval notations show the boundaries for acceptable dimensions.
• Activity 5: Critical Thinking Writing Consider the linear function f(x) = A(x – B) + C. Discuss all the changes in the graph as
A, B, and C change from positive, negative, zero, as well as grow smaller or larger. Discuss the domain and range of linear functions. Discuss the procedure you would use to “speed graph” a line in this form.
Solution: Discussions will vary but should include the following information: A is the slope, change in y over change in x, and will affect the tilt of the line. A>0
tilts up to the right; A<0 tilts up to the left; A=0 is a horizontal line. As |A| becomes larger, the line is steeper. B shifts the graph horizontally; B>0 shifts the x-value of the initial graphing point to the right, B<0 shifts the x-value of the initial graphing point to the left, and if B=0 the x-value of the initial graphing point is 0. C shifts the vertically; C>0 shifts the y-value of the initial graphing point up. C<0 shifts the y-value of the initial graphing point down, and if C=0 the y-value of the initial graphing point is 0.
Since there are no restrictions such as denominators or radicals, the domain and range of linear functions are all real numbers.
In order to “speed graph” a line in this form, I would locate the point (B, C) and from that point apply the slope A to find another point, then connect the points.
• Activity 6: Critical Thinking Writing The market for domestic cars in the US reported the following data. In 1993, 73% of US
cars were domestic, in 1996, 72%, and in 1999, 69% were domestic. Using these three data points (3, 73), (6, 72), and (9, 69), find two linear equations for the line segments and write as a piecewise function. Discuss which interval was the greatest decline and why? Find f(7) and discuss what f(7) means in real-world terms. Solution: The decline was the greatest from 1996 to 1999,
174 3 6
( ) 31 78 6 9
x if xf x
x if x
− + ≤ ≤=
− + ≤ ≤
f(7) = 71 meaning in 1997, 71% of cars were domestic. (Teacher Note: Both domains may include 6 because f(6)=72 in both pieces of the
function.)

2012-13 and 2013-14 Transitional Comprehensive Curriculum
Algebra IIUnit 1Functions 1-32
• Activity 10: Step Function Data Research Project (Student directions and grading rubric in Blackline Masters.) The student will complete the project described in the activity, and the teacher will evaluate the project using the rubric.
• Activity 11: Critical Thinking Writing
(1) The price a store pays for a CD is determined by the function f(x) = x + 3, where x is the wholesale price. The price a store charges for the CD is determined by the function g(x) = 2x + 4 where x is the price the store pays. How can this be expressed as a composition of functions? Find the price to the customer if the wholesale price of the CD sale is $12.
(2) Explain the difference in the way you compute ( )f a h+ and f(a) + h and verbally work through the steps to compute both for the function f(x) = 4x2 – 1.
Solutions: (1) g(f(x)) = 2(x + 3) + 4, g(f(12))= $34 (2) In f(a+ h) you add “h” to “a”, then substitute it into the function. In
f(a) + h, you add “h” after you have substituted “a” into the function. f(a + h) = 4a2 –8ah + 4h2 – 1, f(a) + h = 4a2 – 1 + h
• Activity 12: Critical Thinking Writing
The temperature T, in degrees Fahrenheit, of a cold potato placed in a hot oven is given by T = f(t), where t is the time in minutes since the potato was put in the oven. What is the practical meaning of the symbolic statement, f(20) = 100? Discuss the practical meaning of the statement f -1(120) = 25 (use units in your sentence.). Solution: f(20) = 100 means that after 20 minutes in the oven, the potato has risen to 100 F . f -1(120) = 25 means that if the temperature is 120 F , then the potato must have been in the oven for 25 minutes.

2012-13 and 2013-14 Transitional Comprehensive Curriculum
Algebra IIUnit 2Functions 2-1
Algebra II Unit 2: Polynomial Equations and Inequalities
Time Frame: Approximately four weeks Unit Description This unit develops the procedures for factoring polynomial expressions in order to solve polynomial equations and inequalities. It introduces the graphs of polynomial functions using technology to help solve polynomial inequalities. Student Understandings Even in this day of calculator solutions, symbolically manipulating algebraic expressions is still an integral skill for students to advance to higher mathematics. However, these operations should be tied to real-world applications so students understand the relevance of the skills. Students need to understand the reasons for factoring a polynomial and determining the correct strategy to use. They should understand the relationship of the Zero–Product Property to the solutions of polynomial equations and inequalities, and connect these concepts to the zeroes of a graph of a polynomial function. Guiding Questions
1. Can students use the rules of exponents to multiply monomials? 2. Can students add and subtract polynomials and apply to geometric problems? 3. Can students multiply polynomials and identify special products? 4. Can students expand a binomial using Pascal’s triangle? 5. Can students factor expressions using the greatest common factor, and can they factor
binomials containing the difference in two perfect squares and the sum and difference in two perfect cubes?
6. Can students factor perfect square trinomials and general trinomials? 7. Can students factor polynomials by grouping? 8. Can students select the appropriate technique for factoring? 9. Can students prove polynomial identities and use them to describe numerical
relationships? 10. Can students apply multiplication of polynomials and factoring to geometric
problems? 11. Can students factor in order to solve polynomial equations using the Zero–Product
Property? 12. Can students relate factoring a polynomial to the zeroes of the graph of a polynomial? 13. Can students relate multiplicity to the effects on the graph of a polynomial?

2012-13 and 2013-14 Transitional Comprehensive Curriculum
Algebra IIUnit 2Functions 2-2
14. Can students determine the effects on the graph of factoring out the greatest common constant factor?
15. Can students predict the end-behavior of a polynomial based on the degree and sign of the leading coefficient?
16. Can students sketch a graph of a polynomial in factored form using end–behavior and zeros?
17. Can students solve polynomial inequalities by the factor/sign chart method? 18. Can students solve polynomial inequalities by examining the graph of a polynomial
using technology? Unit 2 Grade-Level Expectations (GLEs) Teacher Note: The individual Algebra II GLEs are sometimes very broad, encompassing a variety of functions. To help determine the portion of the GLE that is being addressed in each unit and in each activity in the unit, the key words have been underlined in the GLE list, and the number of the predominant GLE has been underlined in the activity. Some Grade 9 and Grade 10 GLEs have been included because of the continuous need for review of these topics while progressing in higher level mathematics.
Grade-Level Expectations GLE # GLE Text and Benchmarks Number and Number Relations 2. Evaluate and perform basic operations on expressions containing rational
exponents (N-2-H) Algebra 4. Translate and show the relationships among non-linear graphs, related
tables of values, and algebraic symbolic representations (A-1-H) 5. Factor simple quadratic expressions including general trinomials, perfect
squares, difference of two squares, and polynomials with common factors (A-2-H)
6. Analyze functions based on zeros, asymptotes, and local and global characteristics of the function (A-3-H)
7. Explain, using technology, how the graph of a function is affected by change of degree, coefficient, and constants in polynomial
9.
, rational, radical, exponential, and logarithmic functions (A-3-H) Solve quadratic equations by factoring, completing the square, using the quadratic formula, and graphing (A-4-H)
10. Model and solve problems involving quadratic, polynomial
Geometry
, exponential, logarithmic, step function, rational, and absolute value equations using technology (A-4-H)
16. Represent translations, reflections, rotations, and dilations of plane figures using sketches, coordinates
Data Analysis. Probability, and Discrete Math , vectors, and matrices (G-3-H)
19. Correlate/match data sets or graphs and their representations and classify

2012-13 and 2013-14 Transitional Comprehensive Curriculum
Algebra IIUnit 2Functions 2-3
Grade-Level Expectations GLE # GLE Text and Benchmarks
them as exponential, logarithmic, or polynomialPatterns, Relations, and Functions
functions (D-2-H)
22. Explain the limitations of predictions based on organized sample sets of data (D-7-H)
24. Model a given set of real-life data with a non-linear function (P-1-H) (P-5-H)
25. Apply the concept of a function and function notation to represent and evaluate functions (P-1-H) (P-5-H)
27. Compare and contrast the properties of families of polynomial
28.
, rational, exponential, and logarithmic functions, with and without technology (P-3-H) Represent and solve problems involving the translation of functions in the coordinate plane (P-4-H)
29. Determine the family or families of functions that can be used to represent a given set of real-life data, with and without technology (P-5-H)
CCSS for Mathematical Content CCSS # CCSS Text Arithmetic with Polynomials and Rational Expressions A.APR.4 Prove polynomial identities and use them to describe numerical
relationships. ELA CCSS
CCSS # CCSS Text Reading Standards for Literacy in Science and Technical Subjects 6-12 RST.11-12.4 Determine the meaning of symbols, key terms, and other domain-specific
words and phrases as they are used in a specific scientific or technical context relevant to grades 11–12 texts and topics.
Writing Standards for Literacy in History/Social Studies, Science and Technical Subjects 6-12 WHST.11-12.2d Use precise language, domain-specific vocabulary and techniques such as
metaphor, simile, and analogy to manage the complexity of the topic; convey a knowledgeable stance in a style that responds to the discipline and context as well as to the expertise of likely readers.
Sample Activities Ongoing: Little Black Book of Algebra II Properties Materials List: black marble composition book, Unit 2 - Little Black Book of Algebra II Properties BLM • Have students continue to add to the Little Black Books they created in Unit 1 which are
modified forms of vocabulary cards (view literacy strategy descriptions). When students

2012-13 and 2013-14 Transitional Comprehensive Curriculum
Algebra IIUnit 2Functions 2-4
create vocabulary cards, they see connections between words, examples of the word, and the critical attributes associated with the word, such as a mathematical formula or theorem. Vocabulary cards require students to pay attention to words over time, thus improving their memory of the words. In addition, vocabulary cards can become an easily accessible reference for students as they prepare for tests, quizzes, and other activities with the words. These self-made reference books are modified versions of vocabulary cards because, instead of creating cards, the students will keep the vocabulary in black marble composition books (thus the name “Little Black Book” or LBB). Like vocabulary cards, the LBBs emphasize the important concepts in the unit and reinforce the definitions, formulas, graphs, real-world applications, and symbolic representations.
• At the beginning of the unit, distribute copies of the Little Black Book of Algebra II Properties BLM for Unit 2. These are lists of properties in the order in which they will be learned in the unit. The BLM has been formatted to the size of a composition book so students can cut the list from the BLM and paste or tape it into their composition books to use as a table of contents.
• The student’s description of each property should occupy approximately one-half page in the LBB and include all the information on the list for that property. The student may also add examples for future reference.
• Periodically check the Little Black Books and require that the properties applicable to a general assessment be finished by the day before the test, so pairs of students can use the LBBs to quiz each other on the concepts as a review.
Polynomial Equations & Inequalities
2.1 Laws of Exponents - record the rules for adding, subtracting, multiplying, and dividing
quantities containing exponents, raising an exponent to a power, and using zero and negative values for exponents.
2.2 Polynomial Terminology – define and write examples of monomials, binomials, trinomials, polynomials, the degree of a polynomial, a leading coefficient, a quadratic trinomial, a quadratic term, a linear term, a constant, and a prime polynomial.
2.3 Special Binomial Products – define and give examples of perfect square trinomials and conjugates, write the formulas and the verbal rules for expanding the special products (a + b)2, (a – b)2, (a + b)(a – b), and explain the meaning of the acronym, FOIL.
2.4 Binomial Expansion using Pascal’s Triangle – create Pascal’s triangle through row 7, describe how to make it, explain the triangle’s use in binomial expansion, and use the process to expand both (a + b)5 and (a – b)5.
2.5 Common Factoring Patterns − define and give examples of factoring using the greatest common factor of the terms, the difference of two perfect squares, the sum/difference of two perfect cubes, the square of a sum/difference (a2 + 2ab + b2, a2 – 2ab + b2), and the technique of grouping.
2.6 Zero–Product Property – explain the Zero–Product Property and its relevance to factoring: Why there is a zero–product property and not a property like it for other numbers.
2.7 Solving Polynomial Equations – identify the steps in solving polynomial equations, define double root, triple root, and multiplicity, and provide one reason for the prohibition of dividing both sides of an equation by a variable.

2012-13 and 2013-14 Transitional Comprehensive Curriculum
Algebra IIUnit 2Functions 2-5
2.8 Introduction to Graphs of Polynomial Functions – explain the difference between roots and zeros, define end-behavior of a function, indicate the effect of the degree of the polynomial on its graph, explain the effect of the sign of the leading coefficient on the graph of a polynomial, and describe the effect of even and odd multiplicity on a graph.
2.9 Polynomial Regression Equations – explain the Method of Finite Differences to determine the degree of the polynomial that is represented by data.
2.10 Solving Polynomial Inequalities – indicate various ways of solving polynomial inequalities such as using the sign chart and using the graph. Provide two reasons for the prohibition against dividing both sides of an inequality by a variable.
Activity 1: Multiplying Binomials and Trinomials (GLEs: 2, 19; CCSS: WHST.11-12.2d)
Materials List: paper, pencil, large sheet of paper for each group, graphing calculator This activity has not changed because it already incorporates this CCSS. The students will apply the simple operations of polynomials learned in Algebra I to multiply complex polynomials. Math Log Bellringer:
Simplify the following expression: (x2)3 + 4x2 – 6x3(x5 – 2x) + (3x4)2 + (x + 3)(x – 6) and write one mathematical property, law, or rule that you used.
Solution: 3x8 + x6 + 12x4 + 5x2 – 3x – 18. Answers for property will vary but could include any of the following: laws of exponents, distributive property, commutative property, associative property, combining like terms, polynomial rule of listing terms in descending order.
Activity: • Overview of the Math Log Bellringers: As in Unit 1, each in-class activity in Unit 2 is started with an activity called a Math Log
Bellringer that either reviews past concepts to check for understanding (i.e., reflective thinking about what was learned in previous classes or previous courses) or sets the stage for an upcoming concept (i.e., predictive thinking for that day’s lesson).
A math log is a form of a learning log (view literacy strategy descriptions) that students keep in order to record ideas, questions, reactions, and new understandings. Documenting ideas in a log about content’s being studied forces students to “put into words” what they know or do not know. This process offers a reflection of understanding that can lead to further study and alternative learning paths. It combines writing and reading with content learning. The Math Log Bellringers will include mathematics done symbolically, graphically, and verbally.
Since Bellringers are relatively short, blackline masters have not been created for each of them. Write them on the board before students enter class, paste them into an enlarged Word® document or PowerPoint® slide, and project using a TV or digital projector, or print and display using a document or overhead projector. A sample enlarged Math Log

2012-13 and 2013-14 Transitional Comprehensive Curriculum
Algebra IIUnit 2Functions 2-6
Bellringer Word® document has been included in the blackline masters. This sample is the Math Log Bellringer for this activity.
Have the students write the Math Log Bellringers in their notebooks, preceding the upcoming lesson during beginning−of−class record keeping, and then circulate to give individual attention to students who are weak in that area.
• When students have completed the Bellringer, have them use discussion (view literacy
strategy descriptions) in the form of Think-Pair-Square-Share. It has been shown that students can improve learning and remembering when they participate in a dialog about class. In Think-Pair-Square-Share, after being given an issue, problem, or question, students are asked to think alone for a short period of time and then pair up with someone to share their thoughts. Then have pairs of students share with other pairs, forming, in effect, small groups of four students. It highlights students’ understanding of what they know, as well as what they still need to learn, in order to fully comprehend the concept. Have each student write one mathematical property, law or rule that he/she used to
simplify the expression in the Bellringer. The property, law or rule should be written in a sentence describing the process used.
Pair students to first check the correctness of their Bellringer and properties, laws and rules. If they have written the same property, law or rule, have the pair write an additional property, law or rule.
Divide the students into groups of four to compare their properties, laws and rules. Have the group write their combined properties, laws, and rules on large sheets of paper and tape them to the board to compare with other groups.
In addition to the laws of exponents, look for the commutative, associative, and distributive properties, FOIL, combining like terms, and arranging the terms in descending order.
• With students still in groups, review the definitions of monomial, binomial, trinomial,
polynomial, degree of polynomial, and leading coefficient. Have each group expand (a + b)2, (a – b)2, and (a + b)(a – b) and write the words for finding these special products, again comparing answers with other groups and voting on the best verbal explanation. Define the word conjugate.
• Have students expand several binomial and trinomial products. • Application:
(1) The length of the side of a square is x + 3 cm. Express the perimeter and the area as polynomial functions using function notation.
(2) A rectangular box is 2x + 3 feet long, x + 1 feet wide, and x – 2 feet high. Express the volume as a polynomial in function notation.
(3) For the following figures, write an equation showing that the area of the large rectangle is equal to the sum of the areas of the smaller rectangles.

2012-13 and 2013-14 Transitional Comprehensive Curriculum
Algebra IIUnit 2Functions 2-7
Solution:
(1) p(x) = 4x + 12 cm, A(x) = x2 + 6x + 9 cm2 (2) V(x) = 2x3 + x2 – 7x – 6
(3a) (x + 2)(x + 1) = x2 + 1x + 1x + 1x + 1 + 1 = x2 + 3x + 2 (3b) (2x + 1)( x + 2) = x2 + x2 + 1x + 1x + 1x +1x + 1x + 1 + 1= 2x2 +5x + 2
Activity 2: Using Pascal’s Triangle to Expand Binomials (GLEs: 2, 27)
Materials List: paper, pencil, graphing calculator, 5 transparencies or 5 large sheets of paper, Expanding Binomials Discovery Worksheet BLM The focus of this activity is to find a pattern in coefficients in order to quickly expand a binomial using Pascal’s triangle, and to use the calculator nCr button to generate Pascal’s triangle. Math Log Bellringer: Expand the following binomials:
(1) (a + b)0
(2) (a + b)1 (3) (a + b)2 (4) (a + b)3 (5) (a + b)4
(6) Describe the process you used to expand #5 Solutions: (1) 1, (2) a + b,(3) a2 + 2ab + b2,(4) a3 + 3a2b + 3ab2 + b3, (5)a4 + 4a3b + 6a2b2+4ab3 + b4, (6) Answers will vary.
Activity: • Have five of the students each work one of the Bellringer problems on a transparency or
large sheets of paper, while the rest of the students work in their notebooks. Have the five students put their answers in front of the class and explain the process they each used. Compare answers to check for understanding of the FOIL process.
• Write the coefficients of each Bellringer problem in triangular form (Pascal’s triangle) and have students find a pattern.
x 1 1
1 x
(a)
x x 1
1 1
x
(b)

2012-13 and 2013-14 Transitional Comprehensive Curriculum
Algebra IIUnit 2Functions 2-8
• Expanding Binomials Discovery Worksheet: On this worksheet, the students will discover how to expand a binomial using both Pascal’s
triangle and combinations. Distribute the Expanding Binomials Discovery Worksheet BLM and have students work in pairs on the Expanding Binomials section of the worksheet. Circulate to check for understanding and stop after this section to check for correctness.
Allow students to complete the section on Using Combinations to Expand Binomials and check for correctness.
• Administer the Activity−Specific Assessment to check for understanding expanding a binomial. Activity 3: Factoring Special Polynomials (GLEs: 2, 5, 10, 24, 27)
Materials List: paper, pencil, graphing calculator In this activity, students will factor a polynomial containing common factors, a perfect square trinomial, and binomials that are the difference of two perfect squares, the sum of two perfect cubes, or the difference of two perfect cubes. Math Log Bellringer:
Find the greatest common factor and describe the process you used: (1) 24, 36, 60 (2) 8x2y3, 12x3y, 20x2y2
Solutions: (1) 12, (2) 4x2y, (3) descriptions of the processes used will vary Activity: • Use the Bellringer to review the definition of factor and discuss the greatest common factors
(GCF) of numbers and monomials. Have students factor common factors out of several polynomials.
• Have students examine the first four trinomials below and use the verbal rules written in Activity 1 to determine how to rewrite the trinomials in factored form. Then have students apply the rules to more complicated trinomials (problems #5 and #6). (1) 3a +6a2 + 3a3 (2) a2 + 6a + 9 (3) s2 – 8s + 16 (4) 16h2 – 25 (5) 9x2 + 42x + 49 (6) 64x2 – 16xy + y2
Solutions: (1) 3a(1 + 2a + a2) or 3a(1+ a)2
(2) (a + 3)2 (3) (s – 4)2 (4) (4h – 5)(4h + 5) (5) (3x + 7)2 (6) (8x – y)2

2012-13 and 2013-14 Transitional Comprehensive Curriculum
Algebra IIUnit 2Functions 2-9
Solution: (1) (5x–4)(5x+4) (2) x2 – y2 = (x + y)(x – y)
x
y y
x
y x
• Have students expand the following (a + b)(a2 – ab + b2) and (a – b)(a2 + ab – b2) and write
two verbal rules that will help them factor a3 – b 3 and a3 + b3. • Have students work numerous factoring problems factoring out common factors, perfect
square trinomials, difference of two perfect squares, and sum and difference of two perfect cubes.
• Application:
(1) The area of a rectangle can be represented by 25x2 – 16. What is a binomial expression for each side?
(2) A small square of plastic is to be cut from a square plastic box cover. Express the area of the shaded form in factored form and show that it is equal to the area of the shaded region in the second figure.
Activity 4: Factoring Quadratic Trinomials (GLEs: 2, 5, 9, 10)
Materials List: paper, pencil, graphing calculator Students will expand and factor expressions to find the relationships necessary to factor quadratic trinomials. Math Log Bellringer:
Expand the following: (1) (x + 4)(x + 3) (2) (x – 4)(x – 3) (3) (x + 4)(x – 3) (4) (x – 4)(x + 3) (5) Discuss what makes the middle and last terms of the answer + or −.
Solutions: (1) x2 + 7x + 12 (2) x2 – 7x + 12 (3) x2 + x – 12 (4) x2 – x – 12

2012-13 and 2013-14 Transitional Comprehensive Curriculum
Algebra IIUnit 2Functions 2-10
(5) The sign of the middle term in the trinomial is determined by the sign of the larger second number of the binomials. When the signs in the two binomials are the same, the sign of the last term in the trinomial is positive. When the signs in the two binomials are different, the sign of the last term in the trinomial is negative.
Activity: • Use the Bellringer to discuss the relationships between the middle term as being the sum of
the inner and outer terms and the last term as the product of the last terms. Discuss the signs and have students write a rule based on their discussions in #5.
• Have students factor numerous quadratic trinomials including trinomials with leading
coefficients other than 1. • Application:
(1) A rectangular window has an area (x2 + 8x + 15) sq. meters. Find the factors that represent the sides of the window.
(2) The area of a rectangular lot is (5x2 – 3x – 2) sq. feet. What is the perimeter of the lot? (3) Write a quadratic trinomial that can be used to find the side of the square if the area less
the side is twenty. (Hint: Isolate zero and factor in order to find the possible lengths of the side.)
Solutions: (1) (x + 5)(x+3) (2) 12x+2 (3) ( )( )2 220 20 0 5 4 0 5 4s s s s s s s or s− = ⇒ − − = ⇒ − + = ⇒ = = − A side must be positive; therefore, s = 5 feet.
Activity 5: Factoring by Grouping (GLEs: 2, 5, 10)
Materials List: paper, pencil, graphing calculator Students will review all methods of factoring and factor a polynomial of four or more terms by grouping terms. Math Log Bellringer:
Factor completely and explain which special process you used in each: (1) 2x2y3 + 6xy2 + 8x3y (2) 4x2 + 4x + 1 (3) 16x2 – 36y2 (4) 1 + 8x3 (5) 9x2 – 12x +4 (6) 3x2 +6x

2012-13 and 2013-14 Transitional Comprehensive Curriculum
Algebra IIUnit 2Functions 2-11
Solutions: (1) 2xy(xy2 + 3y + 4x2), Factor out a common factor. (2) (2x + 1)2, This is a perfect square binomial. (3) (4x – 6y)(4x + 6y), This is the difference in two perfect squares. (4) (1 + 2x)(1 – 2x + 4x2), This is the sum of two perfect cubes. (5) (3x – 2)2 This is a perfect square trinomial. (6) 3x(x + 2) Factor out a common factor.
Activity: • Have the students use the Bellringer to develop the steps for factoring a polynomial
completely: (1) factor out GCF, (2) if the polynomial is a binomial, look for special products such as difference of two perfect squares or the sum/difference of two perfect cubes, and (3) if the polynomial is a trinomial, look for a perfect square trinomial or FOIL.
• Give the students a polynomial made of four monomials such as 6x3 + 3x2 –4x –2. Allow them to work in pairs to brainstorm possible methods of factoring and possible ways to group two monomials in order to apply one of the basic factoring patterns. Develop factoring by grouping and add to the list. Provide students with guided practice problems.
Solution: (3x2 – 2)(2x + 1) • Application:
(1) The area of a rectangle is xy + 2y + x + 2 ft2 . Find the possible lengths of the sides. (2) Prove that the ratio of the area of the circular shaded region below to the rectangular
shaded region equals π .
Solution: (1) (y + 1) and (x + 2) (2) Area1 = π (R2 – r2) and Area 2 = (R – r)(R + r)
Activity 6: Solving Equations by Factoring (GLEs: 2, 5, 6, 9, 24)
Materials List: paper, pencil, graphing calculator In this activity, the students will develop the Zero–Product Property and use it and their factoring skills to solve polynomial equations.
r R
r
r R
R
1
2
AreaArea
π=

2012-13 and 2013-14 Transitional Comprehensive Curriculum
Algebra IIUnit 2Functions 2-12
Math Log Bellringer: Solve for x: (1) 2x = 16 (2) 2x2 = 16x (3) Explain the property used to get the answer to #2.
Solutions: (1) x = 8 (2) x = 8 and x = 0 (3) There will be several explanations. See the activity below to guide students to
the correct explanation. Activity: • Determine how many students got both answers in Bellringer problem #2 and use this to start
a discussion about division by a variable − do not divide both sides of an equation by a
variable because the variable may be zero. Define division as a cb= if and only if bc = a and
have students explain why division by zero is “undefined.” • Have a student who worked problem #2 correctly, write the problem on the board showing
his/her work. (He/she should have isolated zero and factored.) Have the students develop the Zero–Product Property of Equality. Make sure students substitute to check their answers. Review the use of and and or in determining the solution sets in compound sentences. Compare the solution for problem #2 with the solution to the problem x(x + 2) = 8 solved incorrectly as {8, 6}. Have students substitute solutions to check answers and discuss why there is no “Eight Product Property of Equality” or any other number except zero. Use guided practice to allow students to solve several more quadratic polynomial equations using factoring.
• Have the students solve the following and discuss double and triple roots and multiplicity. Multiplicity occurs when the same number is a solution more than once. (1) (x – 4)(x – 3)(x + 2) = 0 (2) y3 – 3y2 = 10y (3) x2 + 6x = –9 (4) (x2 + 4x + 4)(x + 2) = 0
Solutions: (1) {–2, 3, 4} (2) {0, 5, –2} (3) {–3}, There is one solution with multiplicity of 2; therefore, the solution is called
a double root. (4) {–2}, There is one solution with multiplicity of 3; therefore, the solution is called
a triple root.
• Have students develop the steps for solving an equation by factoring: Step 1: Write in Standard Form (Isolate zero) Step 2: Factor

2012-13 and 2013-14 Transitional Comprehensive Curriculum
Algebra IIUnit 2Functions 2-13
Step 3: Use the Zero–Product Property of equality Step 4: Find the solutions Step 5: Check
• Application: Divide the students in groups to set up and solve these application problems: (1) The perimeter of a rectangle is 50 in. and the area is 144 in2. Find the dimensions of the
rectangle. (2) A concrete walk of uniform width surrounds a rectangular swimming pool. Let x
represent this width. If the pool is 6 ft. by 10 ft. and the total area of the pool and walk is 96 ft2, find the width of the walk.
(3) The longer leg of a right triangle has a length 1 in. less than twice the shorter leg. The hypotenuse has a length 1 in. greater than the shorter leg. Find the length of the three sides of the triangle.
Solutions: (1)16 in. by 9 in , (2) 1 foot, (3) 2.5 in., 2 in., and 1.5 in.
Activity 7: Investigating Graphs of Polynomial Functions (GLEs: 2, 4, 5, 6, 7, 9, 10, 16, 19, 25, 27, 28)
Materials List: paper, pencil, graphing calculator, Graphing Polynomials Discovery Worksheet BLM
In this activity, students will use technology to graph polynomial functions to find the relationship between factoring and finding zeros of the function. They will also discover end–behavior and the effects of a common constant factor, even and odd degrees, and the sign of the leading coefficient on the graph of a function. Math Log Bellringer:
(1) Factor x3 + 4x2 + 3x = 0 and solve. (2) Discuss what factoring properties you used to get the solution. (3) Graph y = x3 + 4x2 + 3x on your calculator and find the zeros.
Solutions: (1) x(x + 3)(x + 1) = 0, {0, –3, –1} (2) First I factored out the common factor, then (3) used the reverse of FOIL.
Activity: • Use the Bellringer to review calculator skills for finding zeros, adjusting the window to show
a comprehensive graph displaying both intercepts and the maximum and minimum points. Have students determine why the solutions to the equation are the zeros of the graph. Discuss the end–behavior.

2012-13 and 2013-14 Transitional Comprehensive Curriculum
Algebra IIUnit 2Functions 2-14
• Have the students graph f(x) = x3 – 3x2 – 10x + 24 on the graphing calculator. Find the zeros and use them to write the equation in factored form, then graph both the expanded and factored form on the graphing calculator to determine if they are the same equation. Use the calculator to find f(4) and f(2).
Solution: f(x) = (x – 4)(x + 3)(x – 2), f(4) = 0, f(2) = 0
• Have students graph y = (x – 2)2(x + 6) and find the zeros. Discuss the difference between root and zero: Zeros are x−intercepts where y = 0 indicating there must be a two-variable equation. Roots are solutions to one-variable equations. Solution: two zeros {2, –6}, three roots: 2 is a double root and -6 is a single root
• Discovering Graphs of Polynomials: Divide students into groups of three and distribute the Graphing Polynomials Discovery
Worksheet BLM. On this worksheet, the students will use their graphing calculators to discover the shapes of graphs, zeros, roots, end−behavior, translations, rotations and dilations.
Stop the groups after completing #1 to make sure they have a clear understanding of the answers and list their concepts in (i) on the board, then allow them to complete the remainder of the worksheet.
When the worksheet is complete, assign each group one problem in which to lead the discussion and list any general conclusions on the board.
• When students have completed going over the worksheet, enact the professor know−it−all
strategy (view literacy strategy descriptions). Draw graphs similar to the following on the board, and tell the students that each group will come to the front of the class to be a team of Math Wizards (or any relevant and fun name) to answer questions concerning a particular graph. Students and the teacher should hold the Math Wizards accountable for their answers to the questions by assigning a point for all correct answers. Before they start, each group should come up with 3 questions that they will ask the Math Wizards about the graph. When the wizards are in front of the class, they can confer before answering the questions, but the speaking role should rotate among members of the group. Some sample questions are: 1. What are the domain and range? 2. Is the degree of the polynomial even or odd? Why? 3. How many zeros are there? 4. What is the smallest degree the polynomial can have? Why? 5. What is the smallest number of roots this graph may have? Why? 6. What is f(0)? 7. Write the polynomial in factored form.
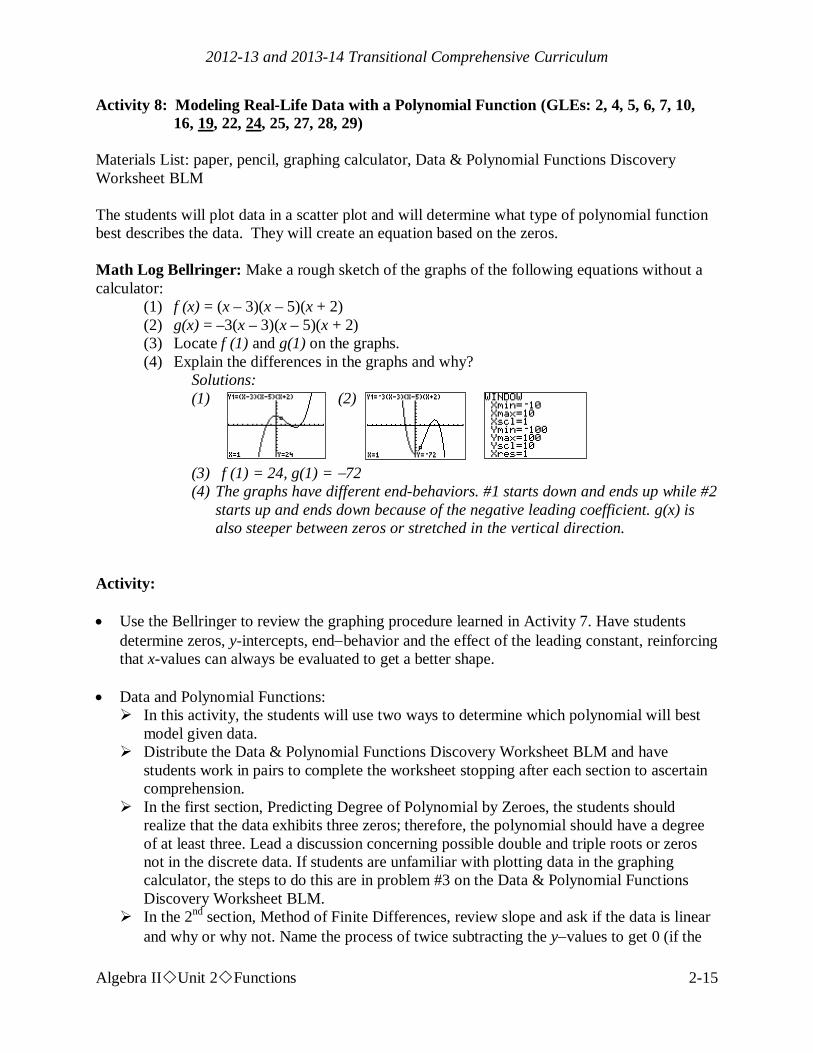
2012-13 and 2013-14 Transitional Comprehensive Curriculum
Algebra IIUnit 2Functions 2-15
Activity 8: Modeling Real-Life Data with a Polynomial Function (GLEs: 2, 4, 5, 6, 7, 10, 16, 19, 22, 24, 25, 27, 28, 29)
Materials List: paper, pencil, graphing calculator, Data & Polynomial Functions Discovery Worksheet BLM
The students will plot data in a scatter plot and will determine what type of polynomial function best describes the data. They will create an equation based on the zeros. Math Log Bellringer: Make a rough sketch of the graphs of the following equations without a calculator:
(1) f (x) = (x – 3)(x – 5)(x + 2) (2) g(x) = –3(x – 3)(x – 5)(x + 2) (3) Locate f (1) and g(1) on the graphs. (4) Explain the differences in the graphs and why?
Solutions: (1) (2)
(3) f (1) = 24, g(1) = −72 (4) The graphs have different end-behaviors. #1 starts down and ends up while #2
starts up and ends down because of the negative leading coefficient. g(x) is also steeper between zeros or stretched in the vertical direction.
Activity: • Use the Bellringer to review the graphing procedure learned in Activity 7. Have students
determine zeros, y-intercepts, end−behavior and the effect of the leading constant, reinforcing that x-values can always be evaluated to get a better shape.
• Data and Polynomial Functions: In this activity, the students will use two ways to determine which polynomial will best
model given data. Distribute the Data & Polynomial Functions Discovery Worksheet BLM and have
students work in pairs to complete the worksheet stopping after each section to ascertain comprehension.
In the first section, Predicting Degree of Polynomial by Zeroes, the students should realize that the data exhibits three zeros; therefore, the polynomial should have a degree of at least three. Lead a discussion concerning possible double and triple roots or zeros not in the discrete data. If students are unfamiliar with plotting data in the graphing calculator, the steps to do this are in problem #3 on the Data & Polynomial Functions Discovery Worksheet BLM.
In the 2nd section, Method of Finite Differences, review slope and ask if the data is linear and why or why not. Name the process of twice subtracting the y−values to get 0 (if the

2012-13 and 2013-14 Transitional Comprehensive Curriculum
Algebra IIUnit 2Functions 2-16
change in x is constant), the Method of Finite Differences, and refresh the students’ memories of this method that was discussed in the Algebra I curriculum. (Teacher Note: In the Method of Finite Differences, if the increments of x are equal, then repeated calculations of the differences in y will determine the degree of the polynomial. In the example to the right, y is a quadratic function because it took two iterations of differences to get to constant values. More examples:
Solution: y1 – quadratic, y2 – cubic, y3 – linear, y4 – quartic Discuss the limitation of using this method in evaluating real-life data. The finite
differences in real-life data will get close to constant to indicate a trend, but because the data is not exact, the differences usually will not become constant.
Activity 9: Solving Polynomial Inequalities (GLEs: 2, 4, 5, 6, 7, 9, 10, 16, 19, 25, 27, 28)
Materials List: paper, pencil, graphing calculator, Solving Polynomial Inequalities by Graphing BLM In this activity, students will solve single variable polynomial inequalities using both a sign chart and Cartesian graph. Math Log Bellringer:
Solve for x: (1) –2x + 6 > 0 (2) x(x – 4) > 0 (3) x(x – 4) < 0 (4) x(x − 4) = 0 (5) Explain the property used in #4.
Solutions: (1) x < –3 (2) x < 0 or x > 4 (3) 0 < x < 4 (4) {0, 4} (5) Zero−Product Property of Equality in which an answer of zero requires
that one of the factors must equal zero.

2012-13 and 2013-14 Transitional Comprehensive Curriculum
Algebra IIUnit 2Functions 2-17
Activity: • Have students state the Zero−Product Property of Equality. Most students will solve
Bellringer problem #2 incorrectly, forgetting about the negative−times−negative solution. Ask students if x = –5 is a solution. Use the Bellringer to generate the discussion concerning the following inequality properties:
(1) ab > 0 if and only if a > 0 and b > 0 or a < 0 and b < 0. (Review compound sentence use of and and or.) (2) ab < 0 if and only if a < 0 and b > 0 or a > 0 and b < 0.
• Solving Inequalities Using a Sign Chart: Have students draw a number line and locate the zeros for Bellringer problem #2 and #3. Reinforce that the zeros are the values that divide the number line into intervals and satisfy the equation. Test values in each interval and write + and − signs above that interval on the number line. Write the solution in set notation and interval notation. Repeat with problem #3. Solutions: #2 – interval notation: ( ) ( ),0 4,−∞ ∪ ∞ , set notation {x : x < 0 or x > 4} #3 - interval notation: [0, 4], set notation {x: 0 < x < 4}
• Have students solve the following after discussing isolating 0 and not dividing by the variable. (Teacher Note: Students should not only not divide by a variable because the variable may be zero, but if the variable is negative, the inequality sign will change.) Use guided practice for more polynomials. Write answers in set notation.
(1) (x – 3)(x + 4)(x – 7) > 0 (2) x2 – 9x < – 14 (3) 5x3 < 15x2
Solutions: (1) –4 < x < 3 or x > 7, (2) 2 < x < 7, (3) x < 3
• Solving Polynomials by Graphing: Distribute the Solving Polynomial Inequalities by Graphing BLM. Have students work
in pairs in this activity to discover an alternate method for solving polynomial inequalities using the graphs of polynomial functions.
Graph the first equation together and guide the students in understanding how a two−variable graph can assist in solving a one-variable inequality.
Allow students to finish the worksheet, and then check for individual understanding by assigning the Activity-Specific Assessment.
) 0
( 4
#2
] 4
[ 0
#3
+ + + + + + + + + + + + − − − − −
+ + + + + + + + + + + + − − − − −

2012-13 and 2013-14 Transitional Comprehensive Curriculum
Algebra IIUnit 2Functions 2-18
2013-14 Activity 10: More Polynomial Identities and Applying Them to Numerical Relationships
(CCSS: A.APR.4, RST.11-12.4, WHST.11-12.2d) Materials List: paper, pencil, Polynomial Identities Discovery Worksheet BLM In this activity, the students will delineate the differences in polynomial expressions, equations, functions, and identities they have studied in previous activities and develop additional polynomial identities. Math Log Bellringer: Classify the following:
(1) x2 + 6x + 9 (A) polynomial expression (2) x2 = -6x - 9 (B) polynomial equation (3) 3 2 4y x x−= + + (C) polynomial inequality (4) (x+y)2 = x2 + 2xy + y2 (D) polynomial function (5) f (x) = x2 + 6x + 9 (E) polynomial identity (6) x2 + 6x + 9 > 0 (F) not a polynomial (7) y = x2 + 6x + 9
Solutions: (1) A, (2) B, (3) F, (4) E, (5) D, (6) C, (7) D Activity: • When students have completed the Bellringer, have them apply a modified form of GISTing
(view literacy strategy descriptions). GISTing is an excellent strategy for helping students paraphrase and summarize essential information. Students are required to limit the gist of a paragraph to a set number of words. Have students write a paragraph using good mathematical vocabulary to describe the
differences in polynomial expressions, equations, functions and identities referring to previous activities in the unit.
Put students in pairs to compare and rewrite the answers using fewer than 15 words for each definition. Answers should look something like this: (1) A polynomial expression has variables and constants with whole number exponents
added, subtracted or multiplied. (Discussion: Polynomial expressions follow the definition of a polynomial reviewed ion Activity 1 and have no equal signs.)
(2) A polynomial equation has a polynomial expression set equal to another polynomial expression. (Discussion: In a polynomial equation, students are finding a finite number of values for the variable that make both sides of the equation true.)
(3) A polynomial function equates a polynomial expression to f(x) or y. (Discussion: In a polynomial function, students are inputting a value for the independent variable to determine the value of the dependent variable.)
(4) A polynomial identity is an equation where both sides represent the same polynomial in different forms. (Discussion: In a polynomial identity, any number or numbers replacing the variables on the left will create the same value when replacing the variables with these numbers on the right side.)

2012-13 and 2013-14 Transitional Comprehensive Curriculum
Algebra IIUnit 2Functions 2-19
Have 4 volunteers write one of their definitions on the board and allow all groups to refine.
Have students list several more examples of polynomial identities they have used in previous activities.
• Polynomial Identities: Distribute the Polynomial Identities Discovery Worksheet BLM on which the students
will discover additional identities and create rules for factoring them. To save time, assign different polynomials to different groups and share answers before groups discover the patterns.
In the 2nd section, students will prove the square of a trinomial three ways: expanding in two different ways and using the geometric interpretation similar to Activity 3.
In the 3rd section, students will examine a polynomial identity that will generate Pythagorean triples.
• Mental Math for fun: Have students use the polynomial identity (a + b)2 = a2 + 2ab + b2 to
square two digit numbers mentally. Start with easy numbers. Square any two digit number like 172 = (10 +7)2 by squaring the left number (100),
double the product of the two numbers (140), square the right number (49) and add (100+140 + 49 =289).
Sample Assessments
General Assessments
• Use Bellringers as ongoing informal assessments. • Collect the Little Black Books of Algebra II Properties and grade for completeness at the
end of the unit. • Monitor student progress using small quizzes to check for understanding during the unit
on such topics as the following: (1) expanding and factoring the difference of two perfect squares and cubes (2) factoring trinomials (3) solving polynomial equations by factoring (4) factoring and graphing polynomials (5) solving polynomial inequalities
• Administer two comprehensive assessments: (1) factoring polynomial expressions (2) solving polynomial equations and inequalities and graphing

2012-13 and 2013-14 Transitional Comprehensive Curriculum
Algebra IIUnit 2Functions 2-20
Activity-Specific Assessments
• Activity 2: Draw Pascal’s triangle to the row beginning with 5, then expand the following binomials: (1) (x − y)5 (2) (4x + y)3 Solutions:
(1) x5 − 5x4y + 10x3y2 − 10x2y3 + 5xy4 − y5 (2) 64x3 + 48x2y + 12xy2 + y3
• Activity 3:
Factor the following polynomials: (1) 9 − a2 (2) 27 − x3 (3) 8 + y3 (4) x2 + 8x + 16 (5) y2 − 10y + 25 (6) 7t2 + 14 t Solutions:
(1) (3 − a)(3 + a) (2) (3 − x) (9 + 3x + x2) (3) (2 + y)(4 − 2y + y2)
(4) (x + 4)2 (5) (y − 5)2 (6) 7t(t + 2)
• Activity 4:
Factor the following trinomials:
(1) x2 + 7x + 10, (2) x2 − 7x + 10, (3) y2 + 2y − 15, (4) t2 − 2t − 8, (5) 5x2 + 28x + 15 (6) Discuss the difference in the way you factored #1 and #2 and why.
Solutions: (1) (x + 2)(x + 5) (2) (x − 2)(x − 5) (3) (y − 3)(y + 5) (4) (t − 4)(t + 2), (5) (5x + 3)(x + 5) (6) Both signs have to be the same to get +10, but in #1 both signs have to be
positive and in #2 both signs have to be negative.

2012-13 and 2013-14 Transitional Comprehensive Curriculum
Algebra IIUnit 2Functions 2-21
• Activity 6:
Solve the following equations by factoring: (1) x2 + 10x + 16 = 0 (2) x2 − 25 = 0 (3) x3 − x2 = 6x Solutions: (1) {−2, −8}, (2) {±5}, (3) {0, 3, −2}
• Activity 7: Specific Assessment Graphing Polynomials BLM
• Activity 9:
Solve the following inequalities by both the sign chart method and the graphing method without using a graphing calculator showing all your work. (1) x(x – 4)(x + 6)(x – 2) > 0 (2) –2x(x – 3)2(x + 4) < 0 (3) Discuss which method you prefer and why. Solutions:
(1) ( ) ( ) ( ), 6 0,2 4,−∞ − ∪ ∪ ∞ (2) ( ] [ ), 4 0,−∞ − ∪ ∞ (3) Answers will vary.

2012-13 and 2013-14 Transitional Comprehensive Curriculum
Algebra IIUnit 3Rational Equations and Inequalities 3-1
Algebra II Unit 3: Rational Equations and Inequalities
Time Frame: Approximately three weeks Unit Description The study of rational equations reinforces the students’ abilities to multiply polynomials and factor algebraic expressions. This unit develops the process for simplifying rational expressions, adding, multiplying, and dividing rational expressions, and solving rational equations and inequalities. Student Understandings Students symbolically manipulate rational expressions in order to solve rational equations. They determine the domain restrictions that drive the solutions of rational functions. They relate the domain restrictions to vertical asymptotes on a graph of the rational function but realize that the calculator does not give an easily readable graph of rational functions. Therefore, they solve rational inequalities by the sign chart method instead of the graph. Students also solve application problems involving rational functions. Guiding Questions
1. Can students simplify rational expressions in order to solve rational equations? 2. Can students add, subtract, multiply, and divide rational expressions? 3. Can students simplify a complex rational expression? 4. Can students solve rational equations? 5. Can students identify the domain and vertical asymptotes of rational functions? 6. Can students solve rational inequalities? 7. Can students solve real world problems involving rational functions?
Unit 3 Grade-Level Expectations (GLEs) Teacher Note: The individual Algebra II GLEs are sometimes very broad, encompassing a variety of functions. To help determine the portion of the GLE that is being addressed in each unit and in each activity in the unit, the key words have been underlined in the GLE list, and the number of the predominant GLE has been underlined in the activity.

2012-13 and 2013-14 Transitional Comprehensive Curriculum
Algebra IIUnit 3Rational Equations and Inequalities 3-2
Grade-Level Expectations GLE # GLE Text and Benchmarks Number and Number Relations 2. Evaluate and perform basic operations on expressions containing rational
exponents (N-2-H) Algebra 4. Translate and show the relationships among non-linear graphs, related tables
of values, and algebraic symbolic representations (A-1-H) 5. Factor simple quadratic expressions including general trinomials, perfect
squares, difference of two squares, and polynomials with common factors(A-2-H) 6. Analyze functions based on zeros, asymptotes, and local and global
characteristics of the function (A-3-H) 7. Explain, using technology, how the graph of a function is affected by change
of degree, coefficient, and constants in polynomial, rational
9.
, radical, exponential, and logarithmic functions (A-3-H) Solve quadratic equations by factoring, completing the square, using the quadratic formula, and graphing (A-4-H)
10. Model and solve problems involving quadratic, polynomial, exponential, logarithmic, step function, rational
Patterns, Relations, and Functions
, and absolute value equations using technology (A-4-H)
24. Model a given set of real-life data with a non-linear function (P-1-H) (P-5-H) 25. Apply the concept of a function and function notation to represent and evaluate
functions (P-1-H) (P-5-H) 27. Compare and contrast the properties of families of polynomial, rational
29.
, exponential, and logarithmic functions, with and without technology (P-3-H) Determine the family or families of functions that can be used to represent a given set of real-life data, with and without technology (P-5-H)
CCSS for Mathematical Content CCSS # CCSS Text Reasoning with Equations & Inequalities A.REI.2 Solve simple rational and radical equations in one variable, and give examples
showing how extraneous solutions may arise. ELA CCSS
CCSS # CCSS Text Reading Standards for Literacy in Science and Technical Subjects 6-12 RST.11-12.4 Determine the meaning of symbols, key terms, and other domain-specific
words and phrases as they are used in a specific scientific or technical context relevant to grades 11–12 texts and topics.
Writing Standards for Literacy in History/Social Studies, Science and Technical Subjects 6-12 WHST.11-12.2d Use precise language, domain-specific vocabulary and techniques such as
metaphor, simile, and analogy to manage the complexity of the topic; convey a knowledgeable stance in a style that responds to the discipline and context as well as to the expertise of likely readers.

2012-13 and 2013-14 Transitional Comprehensive Curriculum
Algebra IIUnit 3Rational Equations and Inequalities 3-3
Sample Activities Ongoing Activity: Little Black Book of Algebra II Properties
Materials List: Black marble composition book, Little Black Book of Algebra II Properties BLM Activity: • Have students continue to add to the Little Black Books they created in previous units which
are modified forms of vocabulary cards (view literacy strategy descriptions). When students create vocabulary cards, they see connections between words, examples of the word, and the critical attributes associated with the word, such as a mathematical formula or theorem. Vocabulary cards require students to pay attention to words over time, thus improving their memory of the words. In addition, vocabulary cards can become an easily accessible reference for students as they prepare for tests, quizzes, and other activities with the words. These self-made reference books are modified versions of vocabulary cards because, instead of creating cards, the students will keep the vocabulary in black marble composition books (thus the name “Little Black Book” or LBB). Like vocabulary cards, the LBBs emphasize the important concepts in the unit and reinforce the definitions, formulas, graphs, real-world applications, and symbolic representations.
• At the beginning of the unit, distribute copies of the Little Black Book of Algebra II Properties BLM for Unit 3. These are lists of properties in the order in which they will be learned in the unit. The BLM has been formatted to the size of a composition book so students can cut the list from the BLM and paste or tape it into their composition books to use as a table of contents.
• The student’s description of each property should occupy approximately one-half page in the LBB and include all the information on the list for that property. The student may also add examples for future reference.
• Periodically check the Little Black Books and require that the properties applicable to a general assessment be finished by the day before the test, so pairs of students can use the LBBs to quiz each other on the concepts as a review.
Rational Equations and Inequalities
3.1 Rational Terminology – define rational number, rational expression, and rational function,
least common denominator (LCD), complex rational expression. 3.2 Rational Expressions – explain the process for simplifying, adding, subtracting,
multiplying, and dividing rational expressions; define reciprocal, and explain how to find denominator restrictions.
3.3 Complex Rational Expressions – define and explain how to simplify. 3.4 Vertical Asymptotes of Rational Functions – explain how to find domain restrictions and
what the domain restrictions look like on a graph; explain how to determine end-behavior of a rational function around a vertical asymptote.
3.5 Solving Rational Equations – explain the difference between a rational expression and a

2012-13 and 2013-14 Transitional Comprehensive Curriculum
Algebra IIUnit 3Rational Equations and Inequalities 3-4
rational equation; list two ways to solve rational equations and define extraneous roots. 3.6 Solving Rational Inequalities − list the steps for solving an inequality by using the sign
chart method. Activity 1: Simplifying Rational Expressions (GLEs: 2, 5, 7) Materials List: paper, pencil, graphing calculator, Math Log Bellringer BLM, Simplifying Rational Expressions BLM In this activity, the students will review non-positive exponents and use their factoring skills from the previous unit to simplify rational expressions. Math Log Bellringer: Simplify:
(1) (x2)(x5) , (2) ( )42 5x y , (3) ( )35
8
xx
, (4) 7
7
xx
, (5) 3
5
xx
(6) Choose one problem above and write in a sentence the Law of Exponents used to determine the solution.
Solutions: (1) x7, Law of Exponents: When you multiply variables with exponents, you add
the exponents. (2) x8y20, Law of Exponents: When you raise a variable with an exponent to a
power, you multiply exponents. (3) x7, 0x ≠ , Law of Exponents: Same as #2 plus when you divide variables with
exponents, you subtract the exponents. (4) 1, 0x ≠ , Law of Exponents: Same as #3 plus any variable to the 0 power
equals 1. (5) 2
2
1xx
− = , 0x ≠ , Law of Exponents: Same as #3 plus a variable to a negative
exponent moves to the denominator. (6) See Laws of Exponents above.
Activity: • Overview of the Math Log Bellringers: As in previous units, each in-class activity in Unit 3 is started with an activity called a
Math Log Bellringer that either reviews past concepts to check for understanding (reflective thinking about what was learned in previous classes or previous courses) or sets the stage for an upcoming concept (predictive thinking for that day’s lesson).
A math log is a form of a learning log (view literacy strategy descriptions) that students keep in order to record ideas, questions, reactions, and new understandings. Documenting ideas in a log about how content’s being studied forces students to “put into words” what they know or do not know. This process offers a reflection of understanding that can lead to further study and alternative learning paths. It combines writing and reading with

2012-13 and 2013-14 Transitional Comprehensive Curriculum
Algebra IIUnit 3Rational Equations and Inequalities 3-5
content learning. The Math Log Bellringers will include mathematics done symbolically, graphically, and verbally.
Since Bellringers are relatively short, Blackline Masters have not been created for each of them. Write them on the board before students enter class, paste them into an enlarged Word® document or PowerPoint® slide, and project using a TV or digital projector, or print and display using a document or overhead projector. A sample enlarged Math Log Bellringer Word® document has been included in the Blackline Masters. This sample is the Math Log Bellringer for this activity.
Have the students write the Math Log Bellringers in their notebooks preceding the upcoming lesson during beginning−of−class record keeping and then circulate to give individual attention to students who are weak in that area.
• It is important for future mathematics courses that students find denominator restrictions
throughout this unit. They should never write 1xx= unless they also write if 0x ≠ because
the two graphs of these functions are not equivalent. • Write the verbal rules the students created in Bellringer #6 on the board or overhead
projector. Use these rules and the Bellringer problems to review Laws of Exponents and develop the meaning of zero and negative exponents. The rules in their words should include the following:
(1) “When you multiply like variables with exponents, you add the exponents.” (2) “When you raise a variable with an exponent to a power, you multiply exponents.” (3) “When you divide like variables with exponents, you subtract the exponents.” (4) “Any variable raised to the zero power equals 1.” (5) “A variable raised to a negative exponent moves the variable to the denominator and
means reciprocal.” • Simplifying Rational Expressions: Distribute the Simplifying Rational Expressions BLM. This is a guided discovery/review
in which students work only one section at a time and draw conclusions. Connect negative exponents to what they have already learned about scientific notation in
Algebra I and science. To reinforce the equivalencies, have students enter the problems in Section I of the Simplifying Rational Expressions BLM in their calculators. This can be done by getting decimal representations or using the TEST feature of the calculator:
Enter 33
122
− = (The “=” sign is found under 2nd , TEST (above the MATH)). If the
calculator returns a “1” then the statement is true; if it returns a “0” then the statement is false.
Use guided practice with problems in Section II of the Simplifying Rational Expressions BLM which students simplify and write answers with only positive exponents.
Have students define rational number to review the definition as the quotient of two
integers pq
in which 0q ≠ , and then define rational algebraic expression as the quotient

2012-13 and 2013-14 Transitional Comprehensive Curriculum
Algebra IIUnit 3Rational Equations and Inequalities 3-6
of two polynomials P(x) and Q(x) in which Q(x) ≠ 0. Discuss the restrictions on the denominator and have students find the denominator restrictions Section III of the Simplifying Rational Expressions BLM.
Have students simplify 2440
in Section IV and let one student explain the steps he/she
used. Make sure there is a discussion of dividing out and cancelling of a common factor. Then have students apply this concept to simplify the expressions in Section V of the Simplifying Rational Expressions BLM.
Remind students that the domain restrictions on any simplified rational expression are obtained from the original expression and apply to all equivalent forms; therefore, they should find the domain restrictions (due to a denominator = 0) prior to simplifying they expression. To stress this point, have students work Section VI of the Simplifying Rational Expressions BLM.
Conclude the worksheet by having students work the application problem.
Activity 2: Multiplying and Dividing Rational Expressions (GLEs: 2, 5; CCSS: WHST.11-12.2d)
Materials List: paper, pencil This activity has not changed because it already incorporates this CCSS. In this activity, the students will multiply and divide rational expressions and use their factoring skills to simplify the answer. They will also express domain restrictions. Math Log Bellringer:
Simplify the following:
(1) 3 104 11⋅
(2) 7 48⋅
(3) 2 3
5
45 12x yy x⋅
(4) 2 43 5
xx+
⋅−
(5) ( )2 3 25
x xx+
⋅ −−
(6) 2 34 5
x xx x− +
⋅+ −
(7) Write in a sentence the rule for multiplying and simplifying fractions. (8) What mathematical rule allows you to cancel constants? (9) What restrictions should you state when you cancel variables?
Solutions:

2012-13 and 2013-14 Transitional Comprehensive Curriculum
Algebra IIUnit 3Rational Equations and Inequalities 3-7
(1) 2215 , (2)
27 , (3) 3
2
15xy , y ≠ 0, (4)
15584
−+
xx ,
(5) 5
62 2
−−−
xxx , (6)
206
2
2
−−−+
xxxx
(7) When you multiply fractions, you multiply the numerators and multiply the denominators. Then you find any common factors in the numerator and denominator and cancel them to simplify the fractions. (8) If “a” is a constant, 1a
a= , the identity element of multiplication;
therefore, you can cancel common factors without changing the value of the expression.
(9) If you cancel variables, you must state the denominator restrictions of the cancelled factor or the expressions are not equivalent. (Teacher Note: If the original problem already has a factor with a variable in the denominator, then the domain is assumed to already be restricted; these domain restrictions do not have to be repeated in the solution even though the factor is still in the denominator. It is not incorrect to restate the original domain restrictions, such as x ≠ 0 in #3 or x ≠ 3 in #4, but it is redundant.)
Activity: • Use the Bellringer to review the process of multiplying numerical fractions and have students
extend the process to multiplying rational expressions. Students should simplify and state domain restrictions.
• Have students multiply and simplify 2
2
4 2 63 7 10
x xx x x− +
⋅+ + +
and let students that have different
processes show their work on the board. Examining all the processes, have students choose the most efficient (factoring, canceling, and then multiplying). Make sure to include additional domain restrictions.
Solution: 2 4 2 35
x , x ,xx−
≠ − ≠ −+
• Have the students work the following 3 104 11÷ = and 7 4
8÷ . Define reciprocal and have
students rework the Bellringers with a division sign instead of multiplication.
(1) 3 104 11÷ (2) 7 4
8÷ (3)
2 3
5
45 12x yy x÷ (4) 2 4
3 5xx+
÷−
(5) ( )2 3 25
x xx+
÷ −−
(6) 2 34 5
x xx x− +
÷+ −
Solutions: (1) 3340
(2) 732
(3)7
4
485
xy
(4) 5 104 12
xx+−
(5) 2
2 3 27 10x , x
x x+
≠− +
(6) 2
2
7 10 37 12
x x , xx x− +
≠ −+ +

2012-13 and 2013-14 Transitional Comprehensive Curriculum
Algebra IIUnit 3Rational Equations and Inequalities 3-8
• Application:
Density is mass divided by volume. The density of solid brass is 35 /2
x g cm+ . If a sample of
an unknown metal in a laboratory experiment has a mass of 2 2 15
2 8x x
x+ −
−g and a volume of
2
2
1216
x xx+ −−
cm3, determine if the sample is solid brass.
Solution: yes
• Critical Thinking Writing Assessment: (See Activity-Specific Assessments at end of unit.)
Activity 3: Adding and Subtracting Rational Expressions (GLEs: 2, 5, 10, 24, 25; CCSS:
WHST.11-12.2d) Materials List: paper, pencil, Adding & Subtracting Rational Expressions BLM This activity has not changed because it already incorporates this CCSS. In this activity, the students will find common denominators to add and subtract rational expressions. Math Log Bellringer:
Simplify and express answer as an improper fraction:
(1) 2 75 11+ (2) 2 7
15 25+ (3) 2 6
5+
(4) Write the mathematical process used to add fractions.
Solutions: (1)5557 , (2)
7531 , (3)
532 , (4) When you add fractions, you have to find a
common denominator. To find the least common denominator, use the highest degree of each factor in the denominator.
Activity: • Use the Bellringer to review the rules for adding and subtracting fractions and relate them to
rational expressions. • Adding/Subtracting Rational Functions BLM: Distribute the Adding & Subtracting Rational Expressions BLM and have students work
in pairs to complete. On this worksheet, the students will apply the rules they know about adding and subtracting fractions to adding and subtracting rational expressions with variables.
In Section I, have the students write the rule developed from the Bellringers, then apply the rule to solve the problems in Section II. Have two of the groups write the problems on the board and explain the process they used.

2012-13 and 2013-14 Transitional Comprehensive Curriculum
Algebra IIUnit 3Rational Equations and Inequalities 3-9
Have the groups work Section III and IV and again have two of the groups write the problems on the board and explain the process they used.
Have students work the application problem and one of the groups explain it on the board.
Finish by giving the students additional problems adding and subtracting rational expressions from the math textbook.
• Critical Thinking Writing Assessment: (See Activity-Specific Assessments at end of unit.) Activity 4: Complex Rational Expressions (GLEs: 5; CCSS: WHST.11-12.2d) Materials List: paper, pencil This activity has not changed because it already incorporates this CCSS. In this activity, the students will simplify complex rational fractions. Math Log Bellringer: Multiply and simplify the following:
(1) 2 22 2
366 2
x yx yy x
+
(2) ( )( ) 3 72 52 5
x xx x
+ − + + −
(3) What mathematical properties are used to solve the above problems? Solutions: (1) x3 + 9y3, x ≠ 0, y ≠ 0, (2) 10x – 1, x ≠ -2, x ≠ 5 (3) First, you use the Distributive Property of Multiplication over Addition. Second, you cancel like factors which uses the identity element of multiplication. Then you combine like terms.
Activity: • Use the Bellringer to review the Distributive Property.
• Define complex fraction and ask students how to simplify 1659
. Most students will invert and
multiply. Discuss an alternate process of multiplying by 18/18 or the LCD ratio equivalent to 1. Solution: 3/10
• Define complex rational expression and have students determine the best way to simplify 1 4
35x
y
+
+. Discuss why it would be wrong to work this problem this way: 1 14
5 3y
x + +
.
Solution: 45 3y xyxy x++

2012-13 and 2013-14 Transitional Comprehensive Curriculum
Algebra IIUnit 3Rational Equations and Inequalities 3-10
• Have students determine the process to simplify 2
2 53 9
4 23 3
xx x
x x
++ −
++ −
Solution: 6667
−−
xx
• Use the math textbook for additional problems. • Critical Thinking Writing Assessment: (See Activity-Specific Assessments at end of unit.) Activity 5: Solving Rational Equations (GLEs: 5, 6, 10; CCSS: A.REI.2) Materials List: paper, pencil This activity has not changed because it already incorporates this CCSS. In this activity, the students will solve rational equations. Math Log Bellringer:
3 52 4x x+ = Solve for x showing all the steps. Is this a rational equation or linear
equation? Why? Solution: x = 4. This is a linear equation because x is raised to the first power
and there are no variables in the denominators. Activity:
• Use a SPAWN writing prompt (view literacy strategy descriptions) to set the stage for solving
rational functions with a variable in the denominator. SPAWN is an acronym that stands for five categories of writing prompts (Special Powers, Problem Solving, Alternative Viewpoints, What If?, and Next), which can be crafted in numerous ways to stimulate students’ predictive, reflective, and critical thinking about content-area topics. Write this “Problem Solving” writing prompt on the board and give students a few
minutes to complete the SPAWN writing prompt individually. “In the Bellringer, there are constants in the denominator. Discuss what you would do differently if there were variables in the denominator.”
Ask several students with alternate methods to put their comments on the board to share their answers to the writing prompt.
• Have students solve and check the following:
1. 1 3 74 4x x
− =
2. 1 22 2 2
xx x
= +− −
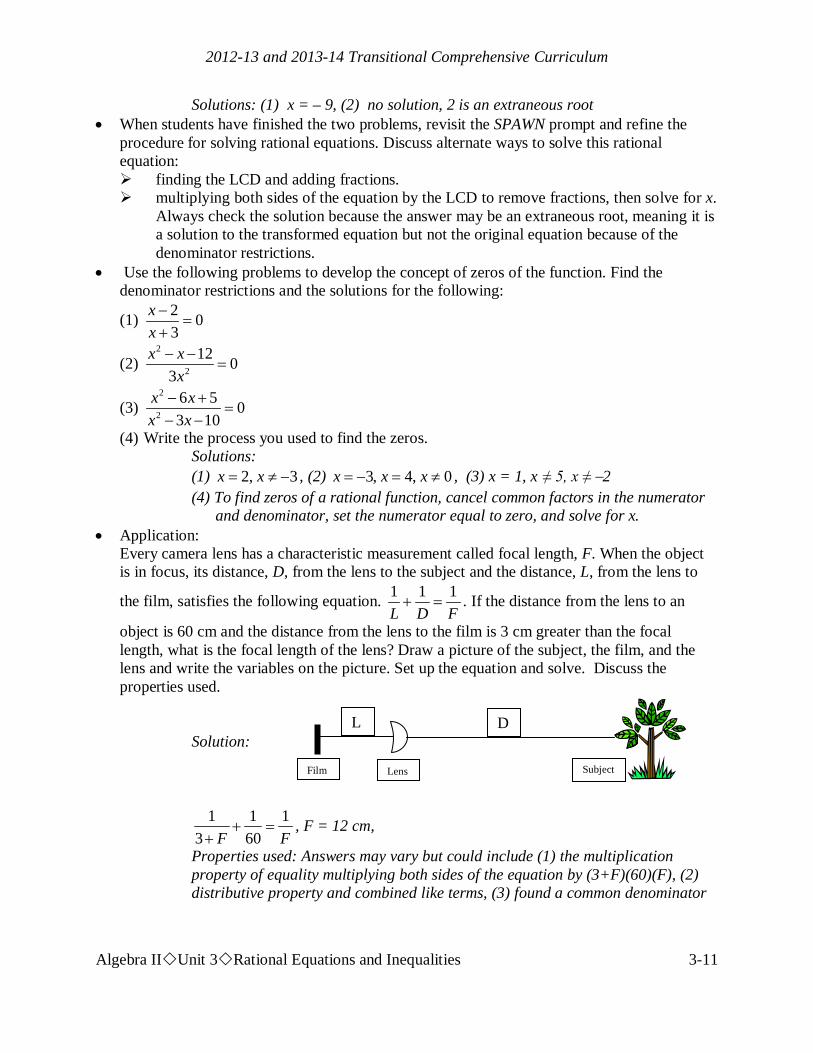
2012-13 and 2013-14 Transitional Comprehensive Curriculum
Algebra IIUnit 3Rational Equations and Inequalities 3-11
Solutions: (1) x = – 9, (2) no solution, 2 is an extraneous root • When students have finished the two problems, revisit the SPAWN prompt and refine the
procedure for solving rational equations. Discuss alternate ways to solve this rational equation: finding the LCD and adding fractions. multiplying both sides of the equation by the LCD to remove fractions, then solve for x.
Always check the solution because the answer may be an extraneous root, meaning it is a solution to the transformed equation but not the original equation because of the denominator restrictions.
• Use the following problems to develop the concept of zeros of the function. Find the denominator restrictions and the solutions for the following:
(1) 2 03
xx−
=+
(2) 2
2
12 03
x xx
− −=
(3) 2
2
6 5 03 10
x xx x
− +=
− −
(4) Write the process you used to find the zeros. Solutions: (1) 2, 3x x= ≠ − , (2) 3, 4, 0x x x= − = ≠ , (3) x = 1, x ≠ 5, x ≠ −2 (4) To find zeros of a rational function, cancel common factors in the numerator
and denominator, set the numerator equal to zero, and solve for x. • Application:
Every camera lens has a characteristic measurement called focal length, F. When the object is in focus, its distance, D, from the lens to the subject and the distance, L, from the lens to
the film, satisfies the following equation. 1 1 1L D F+ = . If the distance from the lens to an
object is 60 cm and the distance from the lens to the film is 3 cm greater than the focal length, what is the focal length of the lens? Draw a picture of the subject, the film, and the lens and write the variables on the picture. Set up the equation and solve. Discuss the properties used.
Solution:
1 1 13 60F F
+ =+
, F = 12 cm,
Properties used: Answers may vary but could include (1) the multiplication property of equality multiplying both sides of the equation by (3+F)(60)(F), (2) distributive property and combined like terms, (3) found a common denominator
Film Subject Lens
D L

2012-13 and 2013-14 Transitional Comprehensive Curriculum
Algebra IIUnit 3Rational Equations and Inequalities 3-12
using the identity element 60160
= and 313
FF
+=
+.
Activity 6: Applications Involving Rational Expressions (GLEs: 5, 9, 10, 29; CCSS:
A.REI.2) Materials List: paper, pencil, graphing calculator, Rational Expressions Applications BLM This activity has not changed because it already incorporates this CCSS. In this activity, students will solve rate problems that are expressed as rational equations. Math Log Bellringer:
In an Algebra II class, 2 out of 5 of the students are wearing blue. If 14 of the students are wearing blue, how many are there in the class? Set up a rational equation and solve. Describe the process used.
Solution: 2 145 x= , x = 35
Activity: • Use the Bellringer to review the meaning of ratio (part to part) and proportion (part to
whole). Ask the students what is the rate of blue wearers to any color wearers, and have them define rate as a comparison of two quantities with different units. Define proportion as an equation setting two rates equal to each other (with the units expressed in the same order).
• Rational Expressions Applications BLM: On this worksheet, the students will set up rational equations, using the concepts of rate
and proportion, and solve. Distribute the Rational Expressions Applications BLM and have students work with a
partner to set up and solve the application problems. Stop after each problem to check for understanding and to discuss the process used.
• Give additional problems in the math textbook for practice.
Activity 7: Vertical Asymptotes on Graphs of Rational Functions (GLEs: 4, 5, 6, 7, 9, 10,
25, 27; CCSS: RST.11-12.4)
Materials List: paper, pencil, graphing calculator, Vertical Asymptotes Discovery Worksheet BLM This activity has not changed because it already incorporates this CCSS. In this activity, students will use technology to look at the graphs of rational functions in order to locate vertical asymptotes and to relate them to the domain restrictions.

2012-13 and 2013-14 Transitional Comprehensive Curriculum
Algebra IIUnit 3Rational Equations and Inequalities 3-13
Math Log Bellringer: Find the solution and the domain restrictions for the following rational equation and
describe the process used. 2 6 02
xx−
=+
Solution: x = 3, 2x ≠ − , Process: Set the numerator = 0 to find the solution for x and set the denominator = 0 to find the domain restrictions.
Activity: • Use SQPL (Student Questions for Purposeful Learning) (view literacy strategy descriptions) to
set the stage for graphing rational functions with a horizontal asymptote at y = 0 and one or more vertical asymptotes. (Teacher note: Finding complex horizontal asymptotes and graphing complicated rational functions is a skill left to Precalculus because of its relationship to limits.) In this literacy strategy, create an SQPL lesson by first looking over the material to be
covered in the day’s lesson. Then, generate a statement related to the material that would cause students to wonder, challenge, and question. The statement does not have to be factually true as long as it provokes interest and curiosity.
Before graphing rational functions on their graphing calculators, the students will generate questions they have about the graphs based on an SQPL prompt.
Tell students they are going to be told something about the graphs before they graph them. State the following: “The graphs of rational functions follow the same rules learned in Unit 2 about the graphs of polynomials.” Write it on the board or a piece of chart paper. Repeat it as necessary.
Next, ask students to turn to a partner and think of one good question they have about the graphs based on the statement: The graphs of rational functions follow the same rules learned in Unit 2 about the graphs of polynomials. As students respond, write their questions on the chart paper or board. A question that is asked more than once should be marked with a smiley face to signify that it is an important question. When students finish asking questions, contribute additional questions to the list as needed. Make sure the following questions are on the list:
1. Is the end-behavior the same for odd and even degree factors? 2. How do you locate the zeros? 3. How do the domain restrictions affect the graph? 4. Is there a hole in the graph at the domain restrictions? 5. How do you find the y-intercept?
Proceed with the following calculator practice before addressing the questions.
• Since graphs of rational functions are difficult to see on the graphing calculator, before distributing the discovery worksheet, have the students graph
2 6( )2
xf xx−
=+
from the Bellringer on their calculators.
Ask them to find the zero of the graph. Ask the question, “What do you see at x = –2?” (Some students

2012-13 and 2013-14 Transitional Comprehensive Curriculum
Algebra IIUnit 3Rational Equations and Inequalities 3-14
may see a line and some may not depending on the tolerance and number of pixels in their calculators. This line is simply connecting the pixels because the calculator is in connected mode.)
Have students find f(–2) by tracing to x = –2 which has no y value. Change the calculator from connected mode to dot mode to show
that there really is no graph at x = –2. (The connected mode gives an easier graph to see as long as the students realize that the line is not part of the graph.)
Define asymptote as a line a graph approaches near infinity (i.e., as x or y gets extremely large (x → +∞ or y → +∞) or small (x → −∞ or y → −∞)) and demonstrate how to draw a dotted line at the vertical asymptote on a graph.
Have students trace to a large x-value and define the y−value it approaches as the horizontal asymptote. Have students draw a dotted line at y = 2. Tell students that all the graphs today will have a horizontal asymptote at y = 0. Other horizontal asymptotes will be explored in Precalculus next year.
• After this practice, have students add questions to
the previously generated SQPL, such as: 1. Can a graph cross the vertical asymptote? 2. How do you know end−behavior on either side of the vertical asymptote? 3. Can a graph cross the horizontal asymptote? 4. When is the graph above and/or below the horizontal asymptote? 5. What effect do ± signs in the numerator have?
• Vertical Asymptotes Discovery Worksheet BLM: This discovery worksheet will explore how the factors in the denominator and the
exponents on the factors in the denominator affect the graphs of equations in the form y
x a n=−1
b g.
Distribute the Vertical Asymptotes Discovery Worksheet BLM and have students graph the example on their calculators with the specified window setting. Remind students to dot the asymptotes and review how to find the y-intercepts.
Tell students to look carefully for the answers to the questions generated from the SQPL prompts as they graph the functions. Have students work with their partners to graph #1 − 3. Stop after graph #3 and ask students if they have found answers to any of their questions. Allow students to confer with their partners before responding. Mark questions that are answered.
Continue this process until all the graphs are completed. Go back to the list of questions to check which ones may still need to be answered. Remind students they should ask questions before they learn something new, then listen and look for answers to their questions.
Now have students answer the questions on the back of the worksheet and complete the

2012-13 and 2013-14 Transitional Comprehensive Curriculum
Algebra IIUnit 3Rational Equations and Inequalities 3-15
worksheet. • Assign the Activity-Specific Assessment to check for individual understanding. Activity 8: Rational Equation Lab “Light at a Distance” (GLEs: 4, 6, 7, 10, 25, 29) Materials List: one set of the following for each lab group of students: graphing calculator with EasyData application or BULB program, CBL data collection interface, light sensor probe, meter stick or tape measure, masking tape, dc−powered point light source, Rational Equations Lab BLM, Rational Equations Lab Data Collection & Analysis BLM It is important that students get to experience the use of rational functions in applications. In the lab in this activity, the students use a light sensor along with a CBL unit to record light intensity as the sensor moves away from the light bulb. • Rational Equations Lab: This lab is “Light at a Distance: Distance and Intensity,” Activity 16 in Real World Math
Made Easy, Texas Instruments Incorporated (2005). In this activity, the students will explore the relationship between distance and intensity for a light bulb which results in a rational equation. The Rational Equation Lab Teacher Information BLM explains the best way to conduct the lab.
Distribute the Rational Equations Lab BLM, the Rational Equations Lab Data Collection and Analysis Sheet BLM, and the equipment listed in the lab and materials list above.
Divide the students in groups and allow them to proceed on their own. When the lab is complete, they should turn in the Rational Equations Lab Data Collection & Analysis BLM to be graded using the rubric in the Activity−Specific Assessments.
Have students write a paragraph outlining what they learned from the lab and what they liked and disliked about the lab.
• Alternate Projects if CBL equipment is unavailable: Whelk-Come to Mathematics: Using Rational Functions to Investigate the Behavior of
Northwestern Crows, http://illuminations.nctm.org/index_o.aspx?id=143 – Students make conjectures, conduct an experiment, analyze the data, and work to a conclusion using rational functions to investigate the behavior of Northwestern Crows.
Alcohol and Your Body by Rosalie Dance and Hames Sandifer (1998), http://www.georgetown.edu/projects/handsonmath/downloads/alcohol.htm - Students use rational functions to model elimination of alcohol from the body and learn to interpret horizontal and vertical asymptotes in context.
\ Activity 9: Rational Inequalities (GLEs: 4, 5, 6, 9, 10, 24, 27, 29)

2012-13 and 2013-14 Transitional Comprehensive Curriculum
Algebra IIUnit 3Rational Equations and Inequalities 3-16
Materials List: paper, pencil, graphing calculator, Rational Inequalities BLM In this activity, the students will solve rational inequalities using a sign chart. Math Log Bellringer:
Solve for x using a sign chart: (x – 3)(x + 4)(x – 5) > 0. Explain why x = –2 is a solution to the inequality even though –2 < 0 when the problem says “ > 0.”
Solution: [ ] [ )4, 3 5,− ∪ ∞ Activity: • Use the Bellringer to review the concept that the zeros create endpoints to the intervals of
possible solutions to polynomial inequalities. Have students locate the zeros on a number line and check numbers in each interval. Determine that the students’ explanations include a review of the properties of inequalities.
(1) ab > 0 if and only if a > 0 and b > 0 or a < 0 and b < 0. (Review compound sentence use of and and or.)
(2) ab < 0 if and only if a < 0 and b > 0 or a > 0 and b < 0. • Use an anticipation guide (view literacy strategy descriptions) to set the stage for solving
rational inequalities. The anticipation guide involves giving students a list of statements about the topic to be studied and asking them to respond to them before reading and learning, and then again after reading and learning. This strategy is especially helpful to struggling and reluctant learners as it heightens motivation and helps students focus on important content. Write the following statements on the board and tell students to respond individually to the statements as “true” or “false” and be prepared to explain their responses:
(1) The only solutions for
( ) ( )2 10 0
2 3x
x x+
≥− +
would occur when 2x+10 > 0, or x-2 >0, or x+3 > 0.
(2) The answers will always be closed intervals because of the > sign.
Put students in pairs to solve the inequality under a heading on their paper entitled “My Original Solution.” They will usually answer x > –5. Ask if x = 1 is a solution.
Remind students of the sign chart used previously to solve polynomial inequalities and discuss how it could be used with rational inequalities with intervals created by the zeros and the denominator restrictions.
Have students work the problem again using a sign chart under a heading on their paper entitled “My Final Solution.”
( Ans: [ ) ( )5, 3 2,− − ∪ ∞ . The symbol ⌠ on the sign chart means “does not exist.”)
) −3
( 2
− − 0 + + + + ⌠ ⌠ + + + + + + − − − − − [ −5
sign of y
x

2012-13 and 2013-14 Transitional Comprehensive Curriculum
Algebra IIUnit 3Rational Equations and Inequalities 3-17
Stop periodically as answers are generated to consider the statements from the anticipation guide and have students reconsider their pre-lesson responses. Students should revise their original responses to reflect their new learning.
Discuss inclusion or non-inclusion of endpoints, thus open or closed intervals, based on denominator domain restrictions.
• Have students graph
( ) ( )2 10
2 3xy
x x+
=− +
on their graphing
calculator and discuss that since graphs of rational functions are not easily graphed by hand, finding the solution intervals for inequalities is easier using a sign chart rather than a graph.
• Have students solve 1 1
3x−
≤−
. Discuss why they cannot multiply both sides of the equation
by x – 3 to solve (because the inequality sign would change if the denominator is negative.). Have students understand that they must isolate zero and find the LCD to form one rational expression, then find the zeros and the domain restrictions to mark the number line intervals for the sign chart.
Solution: 1 13x
−≤
− ⇒ 2 0
3x
x−
≤−
⇒ x < 2 or x > 3
• Have students refer to their “Final Solutions” in their anticipation guides to develop the steps
for solving rational inequalities with a sign chart: (1) Isolate zero and find the LCD to form one rational expression. (2) Set the numerator and denominator equal to 0 and solve the equations. (3) Use the solutions to divide the number line into regions. (4) Find the intervals that satisfy the inequality. (5) Consider the endpoints and exclude any values that make the denominator zero.
• Guided Practice in Solving Rational Inequalities: Distribute the Rational Inequalities BLM. Allow students to work in pairs to practice
solving rational inequalities using a sign chart. When they have completed the worksheet, have each pair of students put the sign charts
and answers on the board for others to agree or disagree. Clarify.
Sample Assessments
General Assessments
• Use Bellringers as ongoing informal assessments. • Collect the Little Black Books of Algebra II Properties and grade for completeness at the
end of the unit. • Monitor student progress using small quizzes to check for understanding during the unit

2012-13 and 2013-14 Transitional Comprehensive Curriculum
Algebra IIUnit 3Rational Equations and Inequalities 3-18
on such topics as the following: (1) multiplying and dividing rational expressions (2) adding and subtracting rational expressions (3) solving rational equations (4) finding domain restrictions and vertical asymptotes
• Administer two comprehensive assessments: (1) adding, subtracting, multiplying, dividing, and simplifying rational expressions,
specifying denominator restrictions (2) solving rational equations and inequalities, finding vertical asymptotes and
matching graphs of rational functions Activity-Specific Assessments Teacher Note: Critical Thinking Writings are used as activity-specific assessments in many of the activities in every unit. Post the following grading rubric on the wall for students to refer to throughout the year.
2 pts. - answers in paragraph form in complete sentences with proper grammar and punctuation
2 pts. - correct use of mathematical language 2 pts. - correct use of mathematical symbols 3 pts./graph - correct graphs (if applicable) 3 pts./solution - correct equations, showing work, correct answer 3 pts./discussion - correct conclusion
• Activity 2: Critical Thinking Writing
(1) Describe what is similar about simplifying both expressions:
2 2
3
42 7 2 7 21 14 7and72 12 12 12 124
x x x xx x x− + +
= ⋅ =+ −
(2) What error did the student make when writing the statement below?
The reciprocal of 7 55 7x xis
x x + +
.
(3) Describe how to find the correct reciprocal. Find the correct reciprocal and simplify. Solutions: (1) Both expressions have common factors that should be cancelled. (2) The reciprocal of a sum is not the sum of the reciprocals.
(3) Find a common denominator first, then reciprocate. 2
535
xx −
• Activity 3: Critical Thinking Writing
(1) Describe the common process used to find both sums:

2012-13 and 2013-14 Transitional Comprehensive Curriculum
Algebra IIUnit 3Rational Equations and Inequalities 3-19
2
2 3 2 3
5 4 41 5 4 15 812 15 60 2 3 6
y xandx y xy x y
++ = + =
(2) What error did the student make when subtracting the rational expressions below? a b d a b dc c c
− − −− =
(3) Describe the process to simplify a b dc c
−− and simplify it correctly.
Solutions: (1) I found a least common denominator (LCD) then multiplied each term on the left
side of the expression by the identity element that would equal the LCD. In the
first equation, the LCD is 60 so I multiplied 5 512 5
and 4 415 4
and then
added numerators. In the second equation, the LCD is 6x2y3, so I multiplied 2
2 2
5 32 3
yx y y
and 3
4 23 2
xxy x
and then added numerators.
(2) The student did not distribute the negative sign. (3) Distribute the negative sign to change the expression to a b d
c c− +
+ then add
numerators and put over the common denominator. a b dc
− +
• Activity 4: Critical Thinking Writing
Put students in groups of three to simplify three complex fractions from the text. Have each student take one of the problems and write a verbal explanation of the step-by-step process used to simplify the problem, including all the properties used and why. They should critique each other’s explanations before handing in the assessment.
• Activity 7:
Graph the following rational functions without a graphing calculator. Label and dot the vertical and horizontal asymptotes and locate and label the y−intercepts.
(1) ( )( )2
16
f xx
=+
(2) ( )( )( )3
15 4
g xx x
−=
+ −
Solutions: (1) (2)

2012-13 and 2013-14 Transitional Comprehensive Curriculum
Algebra IIUnit 3Rational Equations and Inequalities 3-20
• Activity 8:
Evaluate the Lab Report for “Light at a Distance” (see activity) using the rubric below: Grading Rubric for Labs –
10 pts./ question - correct graphs and equations showing all the work 2 pts. - answers in paragraph form in complete sentences with
proper grammar and punctuation 2 pts. - correct use of mathematical language 2 pts. - correct use of mathematical symbols
• Activity 9:
Solve the following rational inequalities using a sign chart.
(1) 3 06
xx+
>+
(2) 2
5 05 4
xx x
−≤
− +
Solutions: (1) (−∞, −6) ∪ (−3, ∞), (2) (1, 4) ∪ [5, ∞)

2012-13 and 2013-14 Transitional Comprehensive Curriculum
Algebra IIUnit 4Radicals and the Complex Number System 4-1
Algebra II Unit 4: Radicals and the Complex Number System
Time Frame: Approximately three weeks Unit Description This unit expands student understanding developed in previous courses regarding simplification of radicals with numerical radicands to include adding, subtracting, multiplying, dividing, and simplifying radical expressions with variables in the radicand. Students learn to solve equations containing radicals. The unit also includes the development of the complex number system in order to solve equations with imaginary roots. Student Understandings Students will simplify radicals containing variables and will solve equations containing radicals. Students will understand the makeup of the complex number system by identifying and classifying each subgroup of numbers. Students will connect the factoring skills developed in Unit 2 to finding complex roots. They will realize the roles of imaginary and irrational numbers in mathematics and determine when to use decimal approximations versus exact solutions. Upon investigation of the graphs of equations containing radicals and polynomials with imaginary roots, students should continue to develop the concepts of zeros, domain, and range and use these to explain real and imaginary solutions and extraneous roots. Guiding Questions
1. Can students simplify complex radicals having various indices and variables in the radicand?
2. Can students solve equations containing radicals and model real-world applications as a radical equation?
3. Can students explain extraneous roots with and without technology? 4. Can students classify numbers in the complex number system as rational, irrational,
or imaginary? 5. Can students simplify expressions containing complex numbers? 6. Can students solve equations containing imaginary solutions?
Unit 4 Grade-Level Expectations (GLEs) Teacher Note: The individual Algebra II GLEs are sometimes very broad, encompassing a variety of functions. To help determine the portion of the GLE that is being addressed in each

2012-13 and 2013-14 Transitional Comprehensive Curriculum
Algebra IIUnit 4Radicals and the Complex Number System 4-2
unit and in each activity in the unit, the key words have been underlined in the GLE list, and the number of the predominant GLE has been underlined in the activity.
Grade-Level Expectations GLE # GLE Text and Benchmarks Number and Number Relations 1. Read, write, and perform basic operations on complex numbers (N-1-H) (N-5-H) 2. Evaluate and perform basic operations on expressions containing rational
exponents (N-2-H) Algebra 4. Translate and show the relationships among non-linear graphs, related tables
of values, and algebraic symbolic representations (A-1-H) 5. Factor simple quadratic expressions including general trinomials, perfect
squares, difference of two squares, and polynomials with common factors (A-2- H)
6. Analyze functions based on zeros, asymptotes, and local and global characteristics of the function
7. (A-3-H)
Explain, using technology, how the graph of a function is affected by change of degree, coefficient, and constants in polynomial, rational, radical
9.
, exponential, and logarithmic functions (A-3-H) Solve quadratic equations by factoring, completing the square, using the quadratic formula, and graphing (A-4-H)
10. Model and solve problems involving quadratic
Geometry
, polynomial, exponential, logarithmic, step function, rational, and absolute value equations using technology (A-4-H)
16. Represent translations, reflections, rotations, and dilations of plane figures using sketches
Patterns, Relations, and Functions , coordinates, vectors, and matrices (G-3-H)
24. Model a given set of real-life data with a non-linear function (P-1-H) (P-5-H)
25. Apply the concept of a function and function notation to represent and evaluate functions (P-1-H) (P-5-H)
28. Represent and solve problems involving the translation of functions in the coordinate plane (P-4-H)
CCSS for Mathematical Content CCSS # CCSS Text Reasoning with Equations & Inequalities A.REI.2 Solve simple rational and radical equations in one variable, and give
examples showing how extraneous solutions may arise. ELA CCSS
CCSS # CCSS Text Reading Standards for Literacy in Science and Technical Subjects 6-12 RST.11-12.4 Determine the meaning of symbols, key terms, and other domain-specific
words and phrases as they are used in a specific scientific or technical context relevant to grades 11–12 texts and topics.

2012-13 and 2013-14 Transitional Comprehensive Curriculum
Algebra IIUnit 4Radicals and the Complex Number System 4-3
Writing Standards for Literacy in History/Social Studies, Science and Technical Subjects 6-12 WHST.11-12.2d Use precise language, domain-specific vocabulary and techniques such as
metaphor, simile, and analogy to manage the complexity of the topic; convey a knowledgeable stance in a style that responds to the discipline and context as well as to the expertise of likely readers.
Sample Activities
Ongoing Activity: Little Black Book of Algebra II Properties
Materials List: black marble composition book, Little Black Book of Algebra II Properties BLM Activity: • Have students continue to add to the Little Black Books they created in Unit 1 which are a
modified form of vocabulary cards (view literacy strategy descriptions). When students create vocabulary cards, they see connections between words, examples of the word, and the critical attributes associated with the word, such as a mathematical formula or theorem. Vocabulary cards require students to pay attention to words over time, thus improving their memory of the words. In addition, vocabulary cards can become an easily accessible reference for students as they prepare for tests, quizzes, and other activities with the words. These self-made reference books are modified versions of vocabulary cards because, instead of creating cards, the students will keep the vocabulary in black marble composition books (thus the name “Little Black Book” or LBB). Like vocabulary cards, the LBBs emphasize the important concepts in the unit and reinforce the definitions, formulas, graphs, real-world applications, and symbolic representations.
• At the beginning of the unit, distribute copies of the Little Black Book of Algebra II Properties BLM for Unit 4. This is a list of properties in the order in which they will be learned in the unit. The BLM has been formatted to the size of a composition book so students can cut the list from the BLM and paste or tape it into their composition books to use as a table of contents.
• The student’s description of each property should occupy approximately one-half page in the LBB and include all the information on the list for that property. The student may also add examples for future reference.
• Periodically check the Little Black Books and require that the properties applicable to a general assessment be finished by the day before the test, so pairs of students can use the LBBs to quiz each other on the concepts as a review.
Radicals and the Complex Number System
4.1 Radical Terminology − define radical sign, radicand, index, like radicals, root, nth root,
principal root, conjugate. 4.2 Rules for Simplifying nn b − identify and give examples of the rules for even and odd
values of n.

2012-13 and 2013-14 Transitional Comprehensive Curriculum
Algebra IIUnit 4Radicals and the Complex Number System 4-4
4.3 Product and Quotient Rules for Radicals – identify and give examples of the rules. 4.4 Rationalizing the Denominator – explain: what does it mean, why do it, the process for
rationalizing a denominator of radicals with varying indices and a denominator that contains the sum of two radicals.
4.5 Radicals in Simplest Form − list what to check for to make sure radicals are in simplest form.
4.6 Addition and Subtraction Rules for Radicals – identify and give examples. 4.7 Graphing Simple Radical Functions – show the effect of a constant both inside and outside
of a radical on the domain and range. 4.8 Steps to Solve Radical Equations – identify and give examples. 4.9 Complex Numbers – define: a + bi form, i, i2, i3, and i4; explain how to find the value of
i4n, i4n + 1, i4n+2, i4n+3, explain how to conjugate and find the absolute value of a + bi. 4.10 Properties of Complex Number System – provide examples of the Equality Property, the
Commutative Property Under Addition/Multiplication, the Associative Property Under Addition/Multiplication, and the Closure Property Under Addition/Multiplication.
4.11 Operations on Complex Numbers in a + bi form – provide examples of addition, additive identity, additive inverse, subtraction, multiplication, multiplicative identity, squaring, division, absolute value, reciprocal, raising to a power, and factoring the sum of two perfect squares.
4.12 Root vs. Zero – explain the difference between a root and a zero and how to determine the number of roots of a polynomial.
Activity 1: Roots and Radicals (GLEs: 2, 7, 9, 10, 24, 25)
Materials List: paper, pencil, graphing calculator, Math Log Bellringer BLM In this activity, the students will review the concepts of simplifying nth roots and solving equations of the form xn = k in order to develop the properties of radicals and to simplify more complex radicals. Emphasis in this lesson is on the new concept that 2x x= . Math Log Bellringer:
Graph on the graphing calculator and find the points of intersection: (1) y1 = x2 and y2 = 9 (2) y1 = x2 and y2 = –9 (3) y1 = x2 and y2 = 0 (4) Discuss the number of points of intersection each set of equations has.
Solutions: (1) (±3, 9) (2) empty set
(3) (0, 0) (4) There are 2 solutions to #1,
no solutions to #2, 1 solution to #3 (a double root)

2012-13 and 2013-14 Transitional Comprehensive Curriculum
Algebra IIUnit 4Radicals and the Complex Number System 4-5
Activity: • Overview of the Math Log Bellringers: As in previous units, each in-class activity in Unit 4 is started with an activity called a
Math Log Bellringer that either reviews past concepts to check for understanding (i.e., reflective thinking about what was learned in previous classes or previous courses) or sets the stage for an upcoming concept (i.e., predictive thinking for that day’s lesson).
A math log is a form of a learning log (view literacy strategy descriptions) that students keep in order to record ideas, questions, reactions, and new understandings. Documenting ideas in a log about how content’s being studied forces students to “put into words” what they know or do not know. This process offers a reflection of understanding that can lead to further study and alternative learning paths. It combines writing and reading with content learning. The Math Log Bellringers will include mathematics done symbolically, graphically, and verbally.
Since Bellringers are relatively short, Blackline Masters have not been created for each of them. Write them on the board before students enter class, paste them into an enlarged Word® document or PowerPoint® slide, and project using a TV or digital projector, or print and display using a document or overhead projector. A sample enlarged Math Log Bellringer Word® document has been included in the Blackline Masters. This sample is the Math Log Bellringer for this activity.
Have the students write the Math Log Bellringers in their notebooks, preceding the upcoming lesson during beginning−of−class record keeping, and then circulate to give individual attention to students who are weak in that area.
• Use the Bellringer to generate a discussion about the number of answers for x2 = 9, x2 = –9,
x2 = 0. Review the definition of root as the solution to an equation in one variable. Ask how this definition relates to the use of the word square root.
• Have the students define the terms index, radical, radicand. Have the students enter 1y x= and trace to x = 9 in their calculators. There is one answer, 3, as opposed to the solution of #1 in the Bellringer, which has two answers, ±3. Discuss the definition of principal square root as the positive square root.
• Ask the students to solve the following:
(1) 26 (2) ( )26− (3) 33 2 (4) ( )33 2− Solutions: (1) 6, (2) 6, (3) 2, (4) −2
• Add the following problems to the list above (5) 2x and (6) 33 x .
Discuss solutions. The students will usually answer “x” as the solution to both. Have them enter 2y x= and 33y x= in their graphing calculators and identify the graphs as y = |x| and y = x.

2012-13 and 2013-14 Transitional Comprehensive Curriculum
Algebra IIUnit 4Radicals and the Complex Number System 4-6
Review the piecewise function for |x| and how it relates to 2x . 2 00
x if xx x
x if x≥
= ≡ − <
• A very important concept for future mathematical study is the progression of the following
solution. Explain and lead a class discussion about its importance. x2 = 9 2 9x = |x| = 3 3x = ±
• Have the students solve some radical problems with different indices and develop the rules
for nth root of bn where n is even and n is odd.
1) If n is even, then 00
n n b if bb b
b if b≥
= ≡ − <
2) If n is odd, then nn b b=
• Have students determine how the nth root rule can be applied to expressions with multiple
radicands, such as ( )24 2 281 9 9x x x= = , discussing why absolute value is not needed in
this situation. (9x2 is always positive.) Work and discuss ( )315 5 53 364 4 4x x x= = .
• Review the rules for solving absolute value equations and have students apply nth root rule to
solve ( )23 12x + =
Solution: ( )23 12 3 12 9 15x x x or x+ = ⇒ + = ⇒ = = −
• Application: Meteorologists have determined that the duration of a storm is dependent on the diameter of the storm. The function ( ) ( )3
.07f d d= defines the relationship where d is the diameter of
the storm in miles and f(d) is the duration in hours. How long will a storm last if the diameter of the storm is 9 miles? Write the answer in function notation with the answer in decimals and write the answer in a sentence in hours and minutes.
Solution: f(9) = 1.890, The storm will last approximately 1 hour and 53 minutes.

2012-13 and 2013-14 Transitional Comprehensive Curriculum
Algebra IIUnit 4Radicals and the Complex Number System 4-7
Activity 2: Multiplying and Dividing Radicals (GLEs: 2, 24, 25) Materials List: paper, pencil, graphing calculator, Sets of Numbers BLM, Multiplying & Dividing Radicals BLM In this activity, the students will review the product and quotient rules for radicals addressed in previous math courses. They will use them to multiply, divide, and simplify radicals with variables in the radicand. Math Log Bellringer:
Simplify showing the steps used:
(1) 50 (2) 3 40− (3) 89
(4) 23
(5) Write the rules symbolically and verbally for multiplying and dividing radicals. Solutions: (1) ( )( ) ( )( )2 1 250 25 2 5 2 5 2 5 2= = = =
(2) ( )( ) ( )( )( ) ( )3 33 3 333 340 8 5 2 5 2 5 2 5− = − = − = − = −
(3) ( )2 2
2 2
2 28 2 2 2 29 3 33= = =
(4) 2
2 2 3 2 3 2 333 3 3 3
= = =
(5) If n na and b are real numbers and n is a natural number, then • n n nab a b= . The radical of a product equals the product of two
radicals.
• n
nn
a ab b= . The radical of a quotient is the quotient of two radicals,
0b ≠ . Activity: • Have students put both the Bellringer problems and answers in the calculators on the home
screen to check for equivalency. This can be done by getting decimal representations or using the TEST feature of the calculator: Enter 50 5 2= (The “=” sign is found under 2ND ,[TEST], (above MATH ). If the calculator returns a “1,” then the statement is true; if it returns a “0”, then the statement is false.)

2012-13 and 2013-14 Transitional Comprehensive Curriculum
Algebra IIUnit 4Radicals and the Complex Number System 4-8
• Discuss why the product rule does not apply in the following situation: ( )( )4 9 4 9− − ≠ − −
(Have students enter 4− in the calculator. They will get this error message, . The rule says, “If n na and b are real numbers, ....” These nonreal numbers will be discussed in Activity 7.)
• Reviewing Sets of Numbers: In this activity, the students will use the Venn diagram which is a form of graphic
organizer (view literacy strategy descriptions) to review the mathematical relationships between different sets of numbers. Graphic organizers are visual displays teachers use to organize information in a manner that makes the information easier to understand and learn. Graphic organizers enable students to assimilate new information by organizing it in visual and logical ways. Later in this unit in Activity 7, the students will add the sets of imaginary numbers and complex numbers to their Venn diagrams.
Distribute the Sets of Numbers BLM and give the students an opportunity to work in pairs to complete the diagram and to write as much information as they can remember about the sets of numbers.
Put a large Venn diagram on the board and have the students volunteer their answers and correct their worksheets.
Develop a definition for rational numbers and apply the definition to answer question #3 about the Bellringer problems.
• Multiplying and Dividing Radicals Worksheet: This is a guided worksheet for the students to review simplifying radicals of numbers and
rationalizing the denominator. They will then apply this previous knowledge to multiply and divide radicals with variables.
Distribute the Multiplying & Dividing Radicals BLM. Have students work in pairs to answer #1, 2, and 3. Lead a full class discussion of these concepts to develop the answer to #4.
Work the first problem in #5 with the class, and then give the students an opportunity to complete the worksheet. When everyone is finished, allow student volunteers to explain their processes on the board.
Activity 3: Adding and Subtracting Radicals (GLEs: 2, 5; CCSSs: WHST.11-12.2d,
RST.11-12.4) Materials List: paper, pencil This activity has not changed because it already incorporates these CCSSs. In this activity, the students will review the sum and difference rules for radicals addressed in previous courses and use them to add, subtract, and simplify radicals with variables in the radicand.

2012-13 and 2013-14 Transitional Comprehensive Curriculum
Algebra IIUnit 4Radicals and the Complex Number System 4-9
Math Log Bellringer: Simplify
(1) 6x2 + 4y – x + 5x2 – 7y + 9x (2) 3 36 2 4 3 2 5 2 7 3 9 2+ − + − + (3) (3x + 5)(7x – 9) (4) ( )( )3 2 5 7 2 9+ −
(5) How do the rules of polynomials in #1 compare to the rules of radicals in #2? Solutions: (1) 11x2+ 8x − 3y, (2) 311 2 8 2 3 3+ − , (3) 21x2 + 8x − 45,
(4) ( )221 2 8 2 45 42 8 2 45 8 2 3+ − = + − = −
(5) Add the coefficients of like radicals. Activity: • Use the Bellringer to compare addition and multiplication of polynomials to addition and
multiplication of radicals and to show how the distributive property is involved. • Have students simplify the following to review addition and subtraction of radicals with
numerical radicands: 6 18 4 8 3 72+ − . Have students define “like radicals” as expressions that have the same index and same radicand, and then have students develop the rules for adding and subtracting radicals. Solution: 4 2
• Put students in pairs to simplify the following radicals: (1) 4 18 72 50x x x− +
(2) 2 4 53 364 27xy x y+
(3) ( )( )2 3 4 7a b a b− +
(4) ( )25x +
(5) ( )( )3 3x x+ −
Solutions: (1) 11 2x
(2) ( ) 234 3xy xy+
(3) 8 2 21a ab b+ − (4) 2 2 5 5x x+ + , (5) x2 – 3
• Use problem #5 above to define conjugate and have students determine how to rationalize the
denominator of 12 5+
.Solution: 2 53−−
• Critical Thinking Writing Assessment: (See Activity-Specific Assessments at end of unit.)

2012-13 and 2013-14 Transitional Comprehensive Curriculum
Algebra IIUnit 4Radicals and the Complex Number System 4-10
Activity 4: Graphing the Radical Function (GLEs: 4, 6, 7, 16, 28) Materials List: paper, pencil, graphing calculator, Graphing Radical Functions Discovery Worksheet BLM In this activity, the students will use technology to graph simple functions that involve radical expressions in preparation for solving equations involving radical expressions analytically. They will determine domain, range, and x- and y-intercepts. Math Log Bellringer:
(1) Set the window: x: [−1, 10], y: [−5, 5]. Graph ( )f x x= and ( ) 3g x x= on the graphing calculator and state the domain, range, and x− and y–intercepts.
(2) From the graph screen find f(8) and g(8) and round three decimal places. Are these answers rational or irrational numbers?
(3) Graph y = 2 and use the intersection feature of the calculator to solve 2 x− = and 32 x− = .
Solutions: (1) Domain: x > 0, Range y > 0, (0, 0) Domain: all reals, Range: all reals (0, 0) (2) f(8) = 2.828 irrational, g(8) = 2, rational
(3) no solution to 2 x− = one solution (−8, −2)
Activity: • Use the Bellringer to review graphing calculator skills. • Graphing Radical Functions Discovery Worksheet:

2012-13 and 2013-14 Transitional Comprehensive Curriculum
Algebra IIUnit 4Radicals and the Complex Number System 4-11
Divide the students into pairs and distribute Graphing Radical Functions Discovery Worksheet BLM. On this worksheet, the students will learn how to graph translations of square root and cube root functions.
When students have finished the worksheet, make sure they have come to the correct conclusions in #10 and 11.
• Assign similar homework from the math textbook. Activity 5: Solving Equations with Radical Expressions (GLEs: 2, 4, 6, 7, 10, 24; CCSS:
A.REI.2) Materials List: paper, pencil, graphing calculator This activity has not changed because it already incorporates this CCSS. In this activity, students will solve equations that involve radical expressions analytically as well as use technology, and apply the equations to real-world applications. Math Log Bellringer:
Use the graphing calculator to graph the two functions and find the points of intersection in order to solve: (1) Graph 1 3 2y x= − and y2 = 4 to solve 3 2 4x − =
(2) Graph 1 3 2y x= − and y2 = –4 to solve 3 2 4x − = − . (3) Explain the difference.
Solutions:
(1) x=6 (2) no solution , (3) A radical is never negative therefore there is no solution.
Activity: • Ask the students to solve the following mentally, and have them discuss their thought
processes: (1) 4 0x − = (2) 3 2x = (3) 5x = −
Solutions: (1) x = 16, (2) x = 8, (3) empty set
• Define and discuss extraneous roots ≡ extra roots that are not true solutions of the original radical equation. Use the discussion to generate steps to solve equations containing variables under radicals: 1. Isolate the radical 2. Raise both sides of the equation to a power that is the same as the index of the radical 3. Solve for x 4. Check

2012-13 and 2013-14 Transitional Comprehensive Curriculum
Algebra IIUnit 4Radicals and the Complex Number System 4-12
• Continuing from the previous three problems, have students solve the following analytically
and discuss: (4) 3 2 4x − = (5) 3 2 4x − = − (6) How are the problems above related to the graphs in the Bellringer?
Solutions: (4) x = 6, (5) no solution, x = 6 is an extraneous root, (6) same
• Continuing from the above problems, have students solve the following analytically and graphically: (7) 3 5x x− + = . (Teacher Note: Review the process of solving polynomials by factoring
and using the zero property.) Solution: x = 7
(8) Graph both sides of the equation in #7 above (i.e. 1 3 5y x= − + and y2 = x) and explain why x = 7 is a solution and x = 4 is not.
Solution: The graphs intersect only once. 4 is an extraneous root. • Solve and check analytically and graphically:
(9) 3 2 2 7 0x x+ − + = (10) 5 2x x− − =
Solutions:
(9) x = 5, (10) no solution
• Application: The length of the diagonal of a box is given by 2 2 2d L W H= + + . What is the length, L, of the box if the height, H, is 4 feet, the width, W, is 5 feet and the diagonal, d, is 9 feet? Express the answer in a sentence in feet and inches rounding to the nearest inch.
Solution: The length of the box is approximately 6 feet, 4 inches. • Critical Thinking Writing Assessment: (See Activity-Specific Assessments at end of unit.) Activity 6: Imaginary Numbers (GLEs: 1, 2, 4, 5, 6, 7, 9, 10) Materials List: paper, pencil, graphing calculator In this activity, students will develop the concept of imaginary numbers and determine their place in the complex number system. They will simplify square root radicals whose radicands are negative and rationalize the denominator of fractions with imaginary numbers in the denominator.

2012-13 and 2013-14 Transitional Comprehensive Curriculum
Algebra IIUnit 4Radicals and the Complex Number System 4-13
Math Log Bellringer: I. Graph the following without a
calculator and find the zeros: (1) y = x2 – 4 (2) y = x2 – 8 (3) y = x2
(4) y = x2 – 1 (5) y = x2 + 1
II. Solve the following analytically. Determine if the roots are rational or irrational: (6) x2 – 4 = 0 (7) x2 – 8 = 0 (8) x2 = 0 (9) x2 – 1 = 0 (10) x2 + 1 = 0
III. Explain the relationship between the problems in I and II above.
Solutions:
(1) 2 zeros: x = ±2,
(2) 2 zeros: 2 2x = ± ,
(3) 1 zero: x = 0,
(4) 2 zeros: x = ±1,
(5) no zeros, (6) 2 roots: x = ±2, rational, (7) 2 roots: 2 2x = ± , irrational, (8) double root: x = 0, rational, (9) 2 roots: x = ±1, rational,
(10) 2 roots: 1x i= ± − = ± III: #1-5 are two-variable equations locating zeros which are x-intercepts or real
roots. #6-10 are one-variable equations locating roots which can be real and nonreal.
Activity: • Use the Bellringer to review the definition of zeros, the number of roots of a polynomial, and
a double root. Determine that 1− is the number needed to solve the equation: x2 + 1 = 0. Define that number as the number i in the set of Imaginary numbers which in union with the set of Real numbers makeup the set of Complex numbers. If 1 i− = , then i2 = –1 and for all positive real numbers b, b i b− = .
• Have students simplify 7, 16, 24− − −
Solutions: 7 7, 16 4 , 24 2 6i i i− = − = − = • Put students in pairs to determine the values of i2, i3, i4, i5, i6, i7, i8, i9, and have them write a
rule that will help determine the answer to i27, i37, i42, and i20. Sample Verbal Rule: Divide the exponent by 4 and use the remainder to follow the pattern i1 = i, i2 = −1, i3 = − i, and i4 = 1. Symbolic Rule: i4n+1 = i, i4n+2 = −1, i4n+3=− i, i4n = 1

2012-13 and 2013-14 Transitional Comprehensive Curriculum
Algebra IIUnit 4Radicals and the Complex Number System 4-14
• Review the term, rationalize the denominator, and discuss how it applies to a problem in the
form 43i
. Discuss how to use the rules of i to rationalize this denominator. Since i is an
imaginary number, rationalizing the denominator means making the denominator a rational number; therefore, no i can be in the denominator. Use the property that i2 = −1, which is a
rational number. Solution: 2
4 4 43 3 3
i i ii i i
= =−
• Return the students to pairs to rationalize the denominator of the following:
( ) ( ) ( )5
3 12
3 5 61 , 2 , 36
ii i−
. Solutions: ( ) ( ) ( )5
3 12
3 5 30 61 , 2 6 , 326
i ii ii i
= − = =−−
• Critical Thinking Writing Assessment: (See Activity-Specific Assessments at end of unit.) Activity 7: Properties and Operations on Complex Numbers (GLEs: 1, 2, 5) Materials List: paper, pencil, Complex Number System BLM, overhead transparency or large chart paper for each pair of students In this activity, students will develop the Complex number system and develop all operations on complex numbers including absolute value of a complex number. Math Log Bellringer:
Distribute the Complex Number System BLM on which students should individually complete the word grid (view literacy strategy descriptions) and then compare their answers with a partner. Challenge students to find other sets of numbers and examples to add to the word grid to be discussed at a later date. (e.g., algebraic numbers, transcendental numbers, perfect numbers, prime numbers, composite numbers, and surds). The completed word grid can serve as a review tool for students as they prepare for other class assignments and quizzes.
Activity: • Use the Bellringer to define complex numbers as any number in the form of a + bi in
which a and b are real numbers and i is 1− . Redefine the set of Real numbers as numbers in the form a + bi where b = 0, and Imaginary numbers as numbers in the form a + bi where a = 0 and b ≠ 0. Therefore, if the Complex number is a + bi, then the real part is a, and the imaginary part is b. The complex conjugate is defined as a – bi

2012-13 and 2013-14 Transitional Comprehensive Curriculum
Algebra IIUnit 4Radicals and the Complex Number System 4-15
• Have the students refer to the Venn diagram they created in Activity 2 and add the set of Complex numbers and Imaginary numbers in the following manner.
• Complex Property Race: (The directions, a sample, and the list of properties are on the
Complex Number System BLM.) When creating any new number system, certain mathematical terms must be defined. To review the meaning of these terms in the Real number system and to allow students to define them in the Complex number system, divide students into teams and assign each team an equal number of properties. Give each team a piece of chart paper or overhead transparency for each different property. Have them define what they think the property is in words (verbally), and using a + bi (symbolically), give a Complex number example without using the book. Have each member of the team present the property to the class, and let the class decide if the team should earn three points for that property. The team with the most points wins a bonus point (or candy, etc.).
• As the students present the properties to the class in the Complex Property Race above, have
the students use split-page notetaking (view literacy strategy descriptions) to record the properties in their notebooks. The approach is modeled on the Complex Number System BLM with sample split-page notes from the properties. Explain the value of taking notes in this format by saying it logically organizes information and ideas from multiple sources; it helps separate big ideas from supporting details; it promotes active reading and listening; and it allows inductive and deductive prompting for rehearsing and remembering the information. Time should be made for students to review their notes by using one column to recall information in the other column.
• Assign more problems from the math textbook in which students have to add, subtract,
multiply, and divide Complex numbers. • Critical Thinking Writing Assessment: (See Activity-Specific Assessments at end of unit.)
Complex Number System
Real Numbers
Rational Numbers
Irr
atio
nal N
umbe
rs
Integers Whole Numbers
Natural Numbers
Imag
inar
y N
umbe
rs

2012-13 and 2013-14 Transitional Comprehensive Curriculum
Algebra IIUnit 4Radicals and the Complex Number System 4-16
Activity 8: Finding Complex Roots of an Equation (GLEs 1, 2, 4, 5, 6, 7, 9) Materials List: paper, pencil, graphing calculators In this activity, students will find the complex roots of an equation and will reinforce the difference in root and zeros using technology. Math Log Bellringer:
Solve the following equations analytically and write all answers in a + bi form: (1) x2 – 16 = 0 (2) x2 + 16 = 0 (3) x2 + 50 = 0
(4) (2x – 3)2 − 18 = 0 (5) (3x – 2)2 + 24 = 0
(6) x3 – 28x = 0 (7) x3 + 32x = 0
Solutions:
(1) ± 4 + 0i, (2) 0± 4i, (3) 0 5 2i± , (4) 3 3 2 02
i±+ ,
(5) 2 2 63 3
i± , (6) 0, 2 7 0i± + , (7) 0, 0 4 2i±
Activity: • Have students classify each of the answers of the Bellringer as real or imaginary. • Have students graph each of the equations in the Bellringer in their graphing calculators and
draw conclusions about (1) the number of roots, (2) types of roots, and (3) number of zeros of a polynomial. Review the definitions of roots and zeros: root ≡ the solution to a single variable equation which can be real or imaginary; zero ≡ the x-value where y equals zero which is always real. Reiterate that the x− and y-axes on the graph represent real numbers; therefore, a zero is an x-intercept.
Solutions:
(1) 2 real rational roots, 2 zeros
(2) 2 imaginary roots, no zeros
(3) 2 imaginary roots, no zeros,
(4) 2 real irrational roots and 2 zeros

2012-13 and 2013-14 Transitional Comprehensive Curriculum
Algebra IIUnit 4Radicals and the Complex Number System 4-17
(5) 2 imaginary roots, no zeros
(6) 3 roots, 2 irrational and 1 rational, 3 zeros
(7) 3 roots, 1 real & rational, 2 imaginary, 1 zero • Review solving polynomials by factoring using the Zero Property. Have the students predict
the number of roots of x4 – 16 = 0, solve it by factoring into (x + 2)(x – 2)(x2 + 4) = 0 and applying the Zero Property, then predict the number of zeros and end-behavior of the graph of y = x4 – 16. Solution: four roots: two zeros or real roots at x=± 2 and two imaginary roots at x = ±2i. End-behavior: starts up and ends up.
Sample Assessments
General Assessments
• Use Bellringers as ongoing informal assessments. • Collect the Little Black Books of Algebra II Properties and grade for completeness at the
end of the unit. • Monitor student progress using small quizzes to check for understanding during the unit
on such topics as the following: (1) simplifying radicals (2) adding, subtracting, and multiplying radicals (3) dividing radicals and rationalizing the denominator (4) simplifying complex numbers
• Administer two comprehensive assessments: (1) Radicals (2) Complex Number System

2012-13 and 2013-14 Transitional Comprehensive Curriculum
Algebra IIUnit 4Radicals and the Complex Number System 4-18
Activity-Specific Assessments
• Activity 3: Critical Thinking Writing (1) The product rule says that the radical of a product equals the product of the radicals.
Discuss whether there is a sum rule that says that the radical of the sum equals the sum of the radicals. Give a symbolic example and discuss whether it is true and why.
(2) Discuss whether the following is true: 2 2a b a b+ = + . If not give a counter example. (3) The Scarecrow in the 1939 movie The Wizard of Oz asked the Wizard for a brain.
When the Wizard presented him with a diploma granting him a Th. D. (Doctor of Thinkology), the Scarecrow recited the following: “The sum of the square roots of the sides of an isosceles triangle is equal to the square root of the remaining side…” Write a symbolic equation for what the scarecrow said. Did the Scarecrow recite the Pythagorean Theorem correctly? If not, write the correct Pythagorean Theorem verbally and symbolically.
Solutions: (1) 9 16 9 16+ ≠ + , This is not true because there is no sum rule for
simplifying radicals. (2) This is not correct. 2 23 4 3 4+ ≠ + (3) The Scarecrow stated if a, b, and c are sides of an isosceles triangle, then
a b c+ = . The correct Pythagorean Theorem states, “The sum of the squares of the sides (the legs) of a right triangle is equal to the square of the remaining side (the hypotenuse).” a2 + b2 = c2.
• Activity 5: Critical Thinking Writing
(1) In solving radical equations, you have been squaring both sides of the equation and have not been concerned with the absolute value we used in previous lessons. Graph
2y x= and ( )2y x= on the graphing calculator. Sketch the graphs and explain the
differences and explain why the process used today has been accurate. (2) Consider the radical mn b . Determine whether the following are true or false.
(a) ( )339 9=
(b) ( )223 38 8=
(c) ( ) ( )229 9− = −
(d) ( ) ( )22 33 27 27− = −
(3) Explain when it is mathematically appropriate to apply the property ( )mmn nb b= .
Solutions:

2012-13 and 2013-14 Transitional Comprehensive Curriculum
Algebra IIUnit 4Radicals and the Complex Number System 4-19
(1) 2x x= ; the domain is all reals and the
graph is a “V”. ( )2x x= with a restricted domain of x > 0; the answer is
only the positive portion of the line y = x. (2a) true, (b) true, (c) false, (d) true (3) This property is true for all b when n is odd, but only for b > 0 if n is even and
not a multiple of 4.
• Activity 6: Critical Thinking Writing
Previously discussed was the fact that the property ( )mmn nb b= cannot be applied to
this problem: (1) ( ) ( )229 9− ≠ − and that the radical product rule n n nab a b=
cannot be applied to this problem: (2) ( )( )4 9 4 9− − ≠ − − . Using imaginary numbers, justify that these two statements are truly inequalities and explain why.
Solutions:
(1) ( )
( ) ( )
2
2 2 2 2
9 81 9
9 3 3 9i i
− = =
− = = = − (2)
( )( )( )( ) 2
4 9 36 6
4 9 2 3 6 6i i i
− − = =
− − = = = −
• Activity 7: Distribute the Specific Assessment Critical Thinking Writing BLM in which
students classify numbers as real or imaginary and discuss why.

2012-13 and 2013-14 Transitional Comprehensive Curriculum
Algebra IIUnit 5Quadratic and Higher Order Polynomial Functions 5-1
Algebra II Unit 5: Quadratic and Higher Order Polynomial Functions
Time Frame: Approximately six weeks Unit Description
This unit covers solving quadratic equations and inequalities by graphing, factoring, using the Quadratic Formula, and modeling quadratic equations in real-world situations. Graphs of quadratic functions are explored with and without technology, using symbolic equations as well as using data plots. Student Understandings Students will understand the progression of their learning in Algebra II. They studied first-degree polynomials (lines) in Unit 1, and factored to find rational roots of higher order polynomials in Units 2, and were introduced to irrational and imaginary roots in Unit 4. Now they can solve real-world application problems that are best modeled with quadratic equations and higher order polynomials, alternating from equation to graph and graph to equation. They will understand the relevance of the zeros, domain, range, and maximum/minimum values of the graph as it relates to the real-world situation they are analyzing. Students will distinguish between root of an equation and zero of a function, and they will learn why it is important to find the roots and zeros using the most appropriate method. They will also understand how imaginary and irrational roots affect the graphs of polynomial functions. Guiding Questions
1. Can students graph a quadratic equation and find the zeros, vertex, global characteristics, domain, and range with technology?
2. Can students graph a quadratic function in standard form without technology? 3. Can students complete the square to solve a quadratic equation? 4. Can students solve a quadratic equation by factoring and using the Quadratic
Formula? 5. Can students determine the number and nature of roots using the discriminant? 6. Can students explain the difference in a root of an equation and zero of the function? 7. Can students look at the graph of a quadratic equation and determine the nature and
type of roots? 8. Can students determine if a table of data is best modeled by a linear, quadratic, or
higher order polynomial function and find the equation? 9. Can students draw scatter plots using real-world data and create the quadratic
regression equations using calculators? 10. Can students solve quadratic inequalities using a sign chart and a graph?
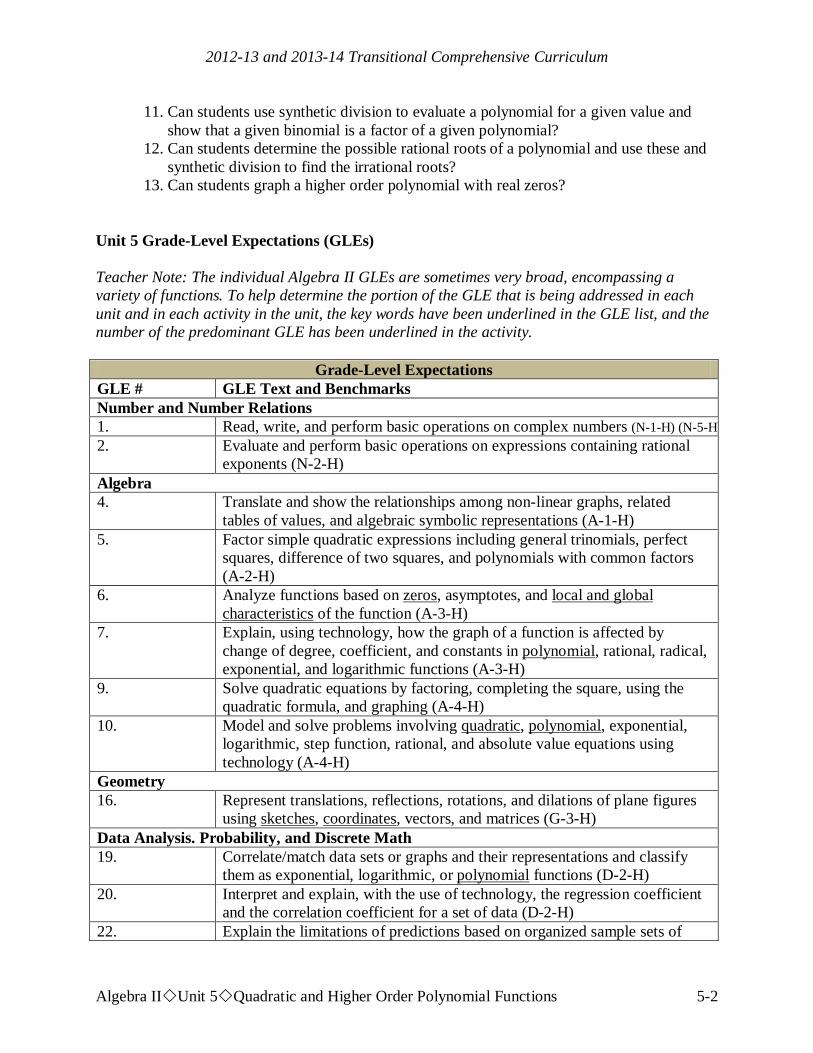
2012-13 and 2013-14 Transitional Comprehensive Curriculum
Algebra IIUnit 5Quadratic and Higher Order Polynomial Functions 5-2
11. Can students use synthetic division to evaluate a polynomial for a given value and show that a given binomial is a factor of a given polynomial?
12. Can students determine the possible rational roots of a polynomial and use these and synthetic division to find the irrational roots?
13. Can students graph a higher order polynomial with real zeros? Unit 5 Grade-Level Expectations (GLEs) Teacher Note: The individual Algebra II GLEs are sometimes very broad, encompassing a variety of functions. To help determine the portion of the GLE that is being addressed in each unit and in each activity in the unit, the key words have been underlined in the GLE list, and the number of the predominant GLE has been underlined in the activity.
Grade-Level Expectations GLE # GLE Text and Benchmarks Number and Number Relations 1. Read, write, and perform basic operations on complex numbers (N-1-H) (N-5-H) 2. Evaluate and perform basic operations on expressions containing rational
exponents (N-2-H) Algebra 4. Translate and show the relationships among non-linear graphs, related
tables of values, and algebraic symbolic representations (A-1-H) 5. Factor simple quadratic expressions including general trinomials, perfect
squares, difference of two squares, and polynomials with common factors (A-2-H)
6. Analyze functions based on zeros, asymptotes, and local and global characteristics
7. of the function (A-3-H)
Explain, using technology, how the graph of a function is affected by change of degree, coefficient, and constants in polynomial
9.
, rational, radical, exponential, and logarithmic functions (A-3-H) Solve quadratic equations by factoring, completing the square, using the quadratic formula, and graphing (A-4-H)
10. Model and solve problems involving quadratic, polynomial
Geometry
, exponential, logarithmic, step function, rational, and absolute value equations using technology (A-4-H)
16. Represent translations, reflections, rotations, and dilations of plane figures using sketches, coordinates
Data Analysis. Probability, and Discrete Math , vectors, and matrices (G-3-H)
19. Correlate/match data sets or graphs and their representations and classify them as exponential, logarithmic, or polynomial
20. functions (D-2-H)
Interpret and explain, with the use of technology, the regression coefficient and the correlation coefficient for a set of data (D-2-H)
22. Explain the limitations of predictions based on organized sample sets of

2012-13 and 2013-14 Transitional Comprehensive Curriculum
Algebra IIUnit 5Quadratic and Higher Order Polynomial Functions 5-3
data(D-7-H) Patterns, Relations, and Functions 24. Model a given set of real-life data with a non-linear function (P-1-H) (P-5-H) 25. Apply the concept of a function and function notation to represent and
evaluate functions (P-1-H) (P-5-H) 27. Compare and contrast the properties of families of polynomial
28.
, rational, exponential, and logarithmic functions, with and without technology (P-3-H) Represent and solve problems involving the translation of functions in the coordinate plane (P-4-H)
29. Determine the family or families of functions that can be used to represent a given set of real-life data, with and without technology (P-5-H)
CCSS for Mathematical Content CCSS # CCSS Text Arithmetic with Polynomials and Rational Expressions A.APR.2 Know and apply the Remainder Theorem: For a polynomial p(x) and a
number a, the remainder on division by x – a is p(a), so p(a) = 0 if and only if (x – a) is a factor of p(x).
A.APR.6 Rewrite simple rational expressions in different forms; write a(x)/b(x) in the form q(x) + r(x)/b(x), where a(x), b(x), q(x), and r(x) are polynomials with the degree of r(x) less than the degree of b(x), using inspection, long division, or, for the more complicated examples, a computer algebra system.
ELA CCSS CCSS # CCSS Text Reading Standards for Literacy in Science and Technical Subjects 6-12 RST.11-12.3 Follow precisely a complex multistep procedure when carrying out
experiments, taking measurements, or performing technical tasks; analyze the specific results based on explanations in the text.
RST.11-12.4 Determine the meaning of symbols, key terms, and other domain-specific words and phrases as they are used in a specific scientific or technical context relevant to grades 11–12 texts and topics.
Writing Standards for Literacy in History/Social Studies, Science and Technical Subjects 6-12 WHST.11-12.2d Use precise language, domain-specific vocabulary and techniques such as
metaphor, simile, and analogy to manage the complexity of the topic; convey a knowledgeable stance in a style that responds to the discipline and context as well as to the expertise of likely readers.

2012-13 and 2013-14 Transitional Comprehensive Curriculum
Algebra IIUnit 5Quadratic and Higher Order Polynomial Functions 5-4
Sample Activities Ongoing: Little Black Book of Algebra II Properties Materials List: black marble composition book, Little Black Book of Algebra II Properties BLM Activity: • Have students continue to add to the Little Black Books they created in previous units which
are modified forms of vocabulary cards (view literacy strategy descriptions). When students create vocabulary cards, they see connections between words, examples of the word, and the critical attributes associated with the word, such as a mathematical formula or theorem. Vocabulary cards require students to pay attention to words over time, thus improving their memory of the words. In addition, vocabulary cards can become an easily accessible reference for students as they prepare for tests, quizzes, and other activities with the words. These self-made reference books are modified versions of vocabulary cards because, instead of creating cards, the students will keep the vocabulary in black marble composition books (thus the name “Little Black Book” or LBB). Like vocabulary cards, the LBBs emphasize the important concepts in the unit and reinforce the definitions, formulas, graphs, real-world applications, and symbolic representations.
• At the beginning of the unit, distribute copies of the Little Black Book of Algebra II Properties BLM for Unit 5. This is a list of properties in the order in which they will be learned in the unit. The BLM has been formatted to the size of a composition book so students can cut the list from the BLM and paste or tape it into their composition books to use as a table of contents.
• The students’ description of each property should occupy approximately one-half page in the LBB and include all the information on the list for that property. The student may also add examples for future reference.
• Periodically check the Little Black Books and require that the properties applicable to a general assessment be finished by the day before the test, so pairs of students can use the LBBs to quiz each other on the concepts as a review.
Quadratic & Higher Order Polynomial Functions
5.1 Quadratic Function – give examples in standard form and demonstrate how to find the
vertex and axis of symmetry. 5.2 Translations and Shifts of Quadratic Functions − discuss the effects of the symbol ±
before the leading coefficient, the effect of the magnitude of the leading coefficient, the vertical shift of equation y = x2 ± c, the horizontal shift of y = (x − c)2.
5.3 Three ways to Solve a Quadratic Equation – write one quadratic equation and show how to solve it by factoring, completing the square, and using the quadratic formula.
5.4 Discriminant – give the definition and indicate how it is used to determine the nature of the roots and the information that it provides about the graph of a quadratic equation.
5.5 Factors, x-intercept, y-intercept, roots, zeroes – write definitions and explain the difference between a root and a zero.

2012-13 and 2013-14 Transitional Comprehensive Curriculum
Algebra IIUnit 5Quadratic and Higher Order Polynomial Functions 5-5
5.6 Comparing Linear functions to Quadratic Functions – give examples to compare and contrast y = mx + b, y = x(mx + b), and y = x2 + mx + b, explain how to determine if data generates a linear or quadratic graph.
5.7 How Varying the Coefficients in y = ax2 + bx + c Affects the Graph − discuss and give examples.
5.8 Quadratic Form – Define, explain, and give several examples. 5.9 Solving Quadratic Inequalities – show an example using a graph and a sign chart. 5.10 Polynomial Function – define polynomial function, degree of a polynomial, leading
coefficient, and descending order. 5.11 Synthetic Division – identify the steps for using synthetic division to divide a polynomial
by a binomial. 5.12 Remainder Theorem, Factor Theorem – state each theorem and give an explanation and
example of each, explain how and why each is used, state their relationships to synthetic division and depressed equations.
5.13 Fundamental Theorem of Algebra, Number of Roots Theorem – give an example of each theorem.
5.14 Intermediate Value Theorem − state theorem and explain with a picture. 5.15 Rational Root Theorem – state the theorem and give an example. 5.16 General Observations of Graphing a Polynomial – explain the effects of even/odd
degrees on graphs, explain the effect of the use of ± leading coefficient on even and odd degree polynomials, identify the number of zeros, explain and show an example of double root.
5.17 Steps for Solving a Polynomial of 4th degree – work all parts of a problem to find all roots and graph.
Activity 1: Why Are Zeros of a Quadratic Function Important? (GLEs: 2, 4, 5, 6, 7, 9, 10,
16, 25, 27, 28) Materials List: paper, pencil, graphing calculator, Math Log Bellringer BLM, Zeros of a Quadratic Function BLM In this activity, the students will plot data that creates a quadratic function and will determine the relevance of the zeros and the maximum and minimum of values of the graph. They will also examine the sign and magnitude of the leading coefficient in order to make an educated guess about the regression equation for some data. By looking at real-world data first, the symbolic manipulations necessary to solve quadratic equations have significance. Math Log Bellringer:
One side (s) of a rectangle is four inches less than the other side. Draw a rectangle with these sides and find an equation for the area A(s) of the rectangle.
Solution: A(s)= s(s - 4) = s2 – 4s
s − 4 s

2012-13 and 2013-14 Transitional Comprehensive Curriculum
Algebra IIUnit 5Quadratic and Higher Order Polynomial Functions 5-6
Activity: • Overview of the Math Log Bellringers: As in previous units, each in-class activity in Unit 5 is started with an activity called a
Math Log Bellringer that either reviews past concepts to check for understanding (reflective thinking about what was learned in previous classes or previous courses) or sets the stage for an upcoming concept (predictive thinking for that day’s lesson).
A math log is a form of a learning log (view literacy strategy descriptions) that students keep in order to record ideas, questions, reactions, and new understandings. Documenting ideas in a log about how content’s being studied forces students to “put into words” what they know or do not know. This process offers a reflection of understanding that can lead to further study and alternative learning paths. It combines writing and reading with content learning. The Math Log Bellringers will include mathematics done symbolically, graphically, and verbally.
Since Bellringers are relatively short, blackline masters have not been created for each of them. Write them on the board before students enter class, paste them into an enlarged Word™ document or PowerPoint™ slide, and project using a TV or digital projector, or print and display using a document or overhead projector. A sample enlarged Math Log Bellringer Word™ document has been included in the blackline masters. This sample is the Math Log Bellringer for this activity.
Have the students write the Math Log Bellringers in their notebooks, preceding the upcoming lesson during beginning−of−class record keeping, and then circulate to give individual attention to students who are weak in that area.
• Use the Bellringer to relate second-degree polynomials to the name “quadratic” equations
(area of a quadrilateral). Discuss the fact that this is a function and have students identify this shape as a parabola.
• Zeroes of a Quadratic Function BLM: Distribute the Zeros of a Quadratic Function BLM. This is a teacher/student interactive
worksheet. Stop after each section to clarify, summarize, and stress important concepts. Zeros: Review the definition of zeros from Unit 2 as the x-value for which the y−value
is zero, thus indicating an x-intercept. In addition to the answers to the questions, review with the students how to locate zeros and minimum values of a function on the calculator. (TI−83 and 84 calculator: GRAPH CALC (2nd TRACE) 2: zero or 3: minimum)
Local and Global Characteristics of a Parabola: In Activity 2, the students will develop the formulas for finding the vertex and the equation of the axis of symmetry. In this activity, students are simply defining, identifying, and reviewing domain and range.
Reviewing 2nd Degree Polynomial Graphs: Review the concepts of end-behavior, zeroes and leading coefficients.
Application: Allow students to work this problem in groups to come to a consensus. Have the students put their equations on the board or enter them into the overhead calculator. Discuss their differences, the relevancy of the zeros and vertex, and the various methods used to solve the problem. Discuss how to set up the equation from the truck problem to solve it analytically. Have the students expand, isolate zero, and find

2012-13 and 2013-14 Transitional Comprehensive Curriculum
Algebra IIUnit 5Quadratic and Higher Order Polynomial Functions 5-7
integral coefficients to lead to a quadratic equation in the form y = ax2 + bx + c. Graph this equation and find the zeros on the calculator. This leads to the discussion of the reason for solving for zeros of quadratic equations.
Activity 2: The Vertex and Axis of Symmetry (GLEs: 4, 5, 6, 7, 9, 10, 16, 27, 28, 29) Materials List: paper, pencil, graphing calculator In this activity, the student will graph a variety of parabolas, discovering the changes that shift the graph vertically, horizontally, and obliquely, and will determine the value of the vertex and axis of symmetry. Math Log Bellringer:
(1) Graph y1 = x2, y2 = x2 + 4, and y3 = x2 – 9 on your calculator, find the zeros and vertices, and write a rule for the type of shift f(x) + k.
(2) Graph y1 = (x – 4)2, y2 = (x + 2)2 on your calculator, find the zeros and vertices, and write a rule for the type of shift f(x + k).
(3) Graph y1 = x2 – 6x and y2 = 2x2 − 12x on your calculator. Find the zeros and vertices on the calculator. Find the equations of the axes of symmetry. What is the relationship between the vertex and the zeros? What is the relationship between the vertex and the coefficients of the equation?
Solutions: (1) Zeros: y1: {0}, y2: none, y3: {±3}. Shift up if k >0 and down if k < 0 (2) Zeros: y1: {4}, y2: {−2}. Vertices: y1: (4, 0), y2: (−2, 0). Shift right if
k < 0, shift left if k > 0 (3) Zeros: y1: {0, 6}, y2: {0, 6}. vertices: y1: (3, −9), y2: (3, –18), axes of
symmetry x = 3. The x-value of the vertex is the midpoint between the x-values of the zeros. A leading coefficient changes the y-value of the vertex.
Activity: • Use a process guide (view literacy strategy descriptions) to help students develop the steps
for graphing a quadratic function in the form f(x) = ax2 + bx + c without a calculator. Process guides are used to guide students in processing new information and concepts. They are used to scaffold students’ comprehension and are designed to stimulate students’ thinking during and after working through a set of problems. Process guides also help students focus on important information and ideas. Write the following process guide directions and questions on the board: 1. Set ax2 + bx equal to 0 to find the zeroes. Does this relationship hold true for the zeros
you found in the Bellringers? (Solution: 0 and ba− )
2. Find the midpoint between the zeros of ax2 + bx. How is this midpoint related to the x-

2012-13 and 2013-14 Transitional Comprehensive Curriculum
Algebra IIUnit 5Quadratic and Higher Order Polynomial Functions 5-8
value of the vertices in your Bellringers? How is it related to the equation for the axis of symmetry? (Solution: The midpoint at
2ba− is the x-value of the vertices, and the axis of
symmetry is2
bxa−
= .)
3. Substitute the abscissa into the equation f(x) = ax2 + bx to find the ordinate of the vertex
and check your answers in the Bellringers to verify your conclusion. (Solution:2
bfa−
.)
4. Using previous activities and the conclusions developed in your process guide, develop a set of steps to graph a factorable quadratic function in the form f(x) = ax2 + bx + c. Sample set of steps: 1. Find the zeros by factoring the equation and applying the Zero Product
Property of Equations.
2. Find the vertex by letting 2
bxa−
= and 2
by fa− =
.
3. Graph and make sure that the graph is consistent with the end−behavior property that says, if a > 0 the graph opens up and if a < 0 it opens down
• Assign problems from the textbook for students to apply the formula for the vertex
,2 2
b bfa a
− −
developed in the process guide to practice graphing functions in the form
f(x) = ax2 + bx + c. • Revisit the process guide to see if it can be applied to all types of quadratic equations and if
the students want to refine the procedure. • Application:
The revenue, R, generated by selling games with a particular price is given by R(p) = –15p2 + 300 p + 1200. Graph the revenue function without a calculator and find the price that will yield the maximum revenue. What is the maximum revenue? Explain in real world terms why this graph is parabolic.
Solution: price = $10, maximum revenue = $2700. A larger price will generate more revenue until the price is so high that no one will buy the games and the revenue declines.
Activity 3: Completing the Square (GLEs: 1, 2, 4, 5, 9, 24, 29) Materials List: paper, pencil In this activity, students will review solving quadratic equations by factoring and will learn to solve quadratic equations by completing the square.

2012-13 and 2013-14 Transitional Comprehensive Curriculum
Algebra IIUnit 5Quadratic and Higher Order Polynomial Functions 5-9
Math Log Bellringer: Solve the following for x: (1) x2 – 8x + 7 = 0 (2) x2 – 9 = 0 (3) x2 = 16
(4) x2 = –16 (5) (x – 4)2 = 25 (6) (x – 2)2 = –4
(7) Discuss the difference in the way you solved #1 and #3.
Solutions: (1) x = 7, 1, (2) x = 3, –3, (3) x = 4, –4, (4) x = 4i, –4i, (5) x = 9, –1, (6) x = 2i + 2, –2i+2, (7) To solve #1, I factored and used the Zero Product Property of Equations. To solve #3, I took the square root of both sides to get ±.
Activity: • Use the Bellringer to:
(1) Review the rules for factoring and the Zero Product Property of Equations for problems #1 and #2.
(2) Review the rules for taking the square root of both sides in problems #3 and 4 with real and complex answers, reiterating the difference between the answer for 16 and the solution to the equation x2 = 16. (The solution to 16 4= is only the positive root, but the solutions to x2 = 16 are ±4.)
(3) Discuss the two methods that can be used to solve problem #5: (1) expand, isolate zero, and factor or (2) take the square root of both sides and isolate the variable.
(4) Discuss whether both of these methods can be used to solve problem #6. • Have students factor the expressions x2 + 6x + 9 and x2 –10x + 25 to determine what properties
of the middle term make these the square of a binomial (i. e. (x ± c)2). (Rule: If the leading coefficient is 1, and the middle coefficient is double the ±square root of the constant term, then it is a perfect square of a binomial (i.e. 6 2 9= + and 10 2 25− = − ). Have students check their conclusions by expanding (x + d)2 = x2 + 2dx + d2 and (x − d)2 = x2 −2dx + d2. These are called perfect square trinomials.
• Have students find c so the expressions x2 + 8x + c and x2 – 18x + c will be squares of
binomials or perfect square trinomials. Name this process “completing the square” and have the students develop a set of steps to solve by this process. (1) Move all constants to the right side. (2) If the leading coefficient is not 1, factor out the leading coefficient and divide both sides
by the leading coefficient. (3) Take ½ the middle coefficient of x and square it to find the constant, adding the same
quantity to the both sides of the equation. (4) Write the perfect square trinomial as a binomial squared. (5) Take the square root of both sides making sure to get ±. (6) Isolate x for the two solutions.
• Guided Practice: Solve 3x2 + 18x − 9 = 15 by completing the square showing all the steps. Solution: Steps:

2012-13 and 2013-14 Transitional Comprehensive Curriculum
Algebra IIUnit 5Quadratic and Higher Order Polynomial Functions 5-10
1. 3x2 + 18x = 24 2. x2 + 6x = 8 3. x2 + 6x + 9 = 8 + 9 4. (x + 3)2 = 17 5. x + 3 = 17± 6. 3 17 3 17x or x= − + = − −
• Assign problems from the textbook to practice solving quadratic equations by completing the
square whose solutions are both real and complex. • Application: Put students in pairs to solve the following application problem:
(1) A farmer has 120 feet of fencing to fence in a dog yard next to the barn. He will use part of the barn wall as one side and wants the yard to have an area of 1000 square feet. What dimensions will the three sides of the yard be? (Draw a picture of the problem. Set up an equation to solve the problem by completing the square showing all the steps.)
(2) Suppose the farmer wants to enclose four sides with 120 feet of fencing. What are the dimensions to have an area of 1000 square feet? (Draw a picture of the problem. Set up an equation to solve the problem. Find the solution by completing the square showing all the steps.)
(3) Approximately how much fencing would be needed to enclose 1000 ft2 on four sides? Discuss how you determined the answer. Solutions: (1) Perimeter: w + w + length = 120 ⇒ length = 120 − 2w Area: (120 − 2w)w = 1000 120w − 2w2 = 1000 −2(w2−60w) = 1000 w2 − 60w = −500 w2 − 60w + 900 = −500 + 900 (w − 30)2 = 400 w − 30 = ±20 w = 50 or w = 10, so there are two possible scenarios: (1) the three sides of the
yard could be (1) 10, 10 and 100 ft. or (2) 50, 50 and 20 feet (2) Perimeter: 2w + 2 lengths = 120 ⇒ length = 60 − w Area: w(60 − w) = 1000 60w − w2 = 1000 w2 − 60w = −1000 (w2 − 60w + 900) = −1000 + 900 (w − 30)2 =−10 There is not enough fencing to enclose 1000 ft2. (3) I need to get a positive number when I complete the square so considering the equation
w2−bw+c = −1000+c, c must be > 1000 therefore 1 1000 31.6232
b > ≈ ⇒ b ≈ 63.245.
Since 2b = perimeter, you will need approximately 126.491 ft of fencing.
w
120−2w
BARN
w
60 − w
BARN

2012-13 and 2013-14 Transitional Comprehensive Curriculum
Algebra IIUnit 5Quadratic and Higher Order Polynomial Functions 5-11
Activity 4: The Quadratic Formula (GLEs: 1, 2, 4, 5, 9, 10, 29) Materials List: paper, pencil, graphing calculator Students will develop the quadratic formula and use it to solve quadratic equations. Math Log Bellringer: Solve the following quadratic equations using any method:
(1) x2 – 25 = 0 (2) x2 + 7 = 0 (3) x2 + 4x =12 (4) x2 + 4x = 11 (5) Discuss the methods you used and why you chose that method.
Solutions: (1) x = 5, –5, (2) 7x i= ± , (3) x = –6, 2, (4) 2 15x = − ± , (5) Answers will vary: factoring, isolating x2 and taking the square root of both sides, and completing the square.
Activity: • Use the Bellringer to check for understanding of solving quadratic equations by all methods.
Emphasize that Bellringer problem #4 must be solved by completing the square because it does not factor into rational numbers.
• Use the following process of completing the square to develop the quadratic formula.
ax2 + bx + c = 0 ax2 + bx = −c
2 b cx xa a
+ = −
2 22
2 2 + + = −
b b b cx xa a a a
2 2
2 2
42 4 4b b acxa a a
+ = −
2 2
2
42 4b b acxa a
− + =
2 2
2
42 4b b acxa a
− + =
2 42 2b b acxa a
−+ = ±

2012-13 and 2013-14 Transitional Comprehensive Curriculum
Algebra IIUnit 5Quadratic and Higher Order Polynomial Functions 5-12
2 42
b b acxa
− ± −=
• Use the quadratic formula to solve all four Bellringer problems. • Use the math textbook for additional problems. • Relating quadratic formula answers to graphing calculator zeros: Have the students put y =
x2 + 4x – 7 in their calculators, find the zeroes, and then use the quadratic formula to find the zeros. Use the calculator to find the decimal representation for the quadratic formula answers and compare the results. Discuss difference in exact and decimal approximation.
• Critical Thinking Writing Assessment: (See Activity-Specific Assessments at end of unit.) Activity 5: Using the Discriminant and the Graph to Determine the Nature of the Roots
(GLEs: 1, 2, 4, 5, 6, 7, 9, 10, 27, 28, 29) Materials List: paper, pencil, graphing calculator In this activity, students will examine the graphs of shifted quadratic functions, determine the types of roots and zeros from the graph and from the discriminant, and describe the difference in a root and zero of a function. Math Log Bellringer: Find the roots of the following functions analytically.
(1) f(x) = x2 + 4x –5 (2) f(x) = x2 – 5 (3) f(x) = x2 − 4x + 4 (4) f(x) = x2 − 3x + 7 (5) Graph the above functions on your calculator and describe the differences in the
graphs, zeros, and roots.
Solutions: (1) x = –5, 1, (2) 5x = ± , (3) x = 2, (4) 3 192ix ±
=
(5) #1 has two zeros and two real rational roots,
#2 has two zeros and two real irrational roots,
#3 has one zero and one real rational double root,

2012-13 and 2013-14 Transitional Comprehensive Curriculum
Algebra IIUnit 5Quadratic and Higher Order Polynomial Functions 5-13
#4 has no zeros and two complex (imaginary) roots Activity: • Use the Bellringer to check understanding of finding zeros and relating them to the graph.
Review the definition of double root from Unit 2 and what it looks like on a graph. • Have students set up the Quadratic Formula for each of the equations in the Bellringer.
o Solutions: (1) 4 362
− ± , (2) 0 202
± , (3) 4 02± , (4) 3 19
2± −
o Have students determine from the set-ups above what part of the formula determines if the roots are real or imaginary, rational or irrational, one, two or no roots.
o Define 2 4b ac− as the discriminant and have the students develop the rules concerning the nature of the solutions of the quadratic equation.
1. If b2 − 4ac = 0 ⇒ one zero and one real, rational double root 2. If b2 − 4ac > 0 ⇒ two zeros and two real roots which are rational roots if b2 – 4ac
is a perfect square and irrational if not 3. If b2 − 4ac < 0 ⇒ no zeros and two imaginary roots
o Emphasize the difference in the word root, which can be real or imaginary, and the word zero, which refers to an x-intercept of a graph.
• Assign problems from the textbook to practice predicting the nature of the solutions using the
discriminant. • Application:
Put students in pairs to determine if the following application problem has a solution using a discriminant: The length of the rectangle is twice the length of the side of the square and the width of the rectangle is 5 less than the side of the square. The area of the square is 40 more than the area of the rectangle. Find the length of the side of the square. (1) Draw pictures with the dimensions and set up the equation to compare areas. Use a
discriminant to determine if this scenario is possible. Explain why your solution is possible or not.
(2) Find a scenario that would make the solution possible, discuss, and solve. Solution: (1) s2= 2s(s − 5) + 40 ⇒ 0 = s2 − 10s + 40. The
discriminant = −60 therefore a solution is not possible,
(2) Answers will vary, but one scenario is an area of a square that is < 25 more than the area of the rectangle.
s 2s s − 5

2012-13 and 2013-14 Transitional Comprehensive Curriculum
Algebra IIUnit 5Quadratic and Higher Order Polynomial Functions 5-14
Activity 6: Linear Functions versus Quadratic Functions (GLEs: 4, 6, 7, 9, 10, 16, 19, 22, 27, 28)
Materials List: paper, pencil, graphing calculator In this activity, the students will discover the similarities and differences in the data for linear and quadratic functions and use several methods to find best-fit curves. Math Log Bellringer:
Graph without a calculator: y = 4x – 8 and y = x(4x – 8). Find the x- and y- intercepts of both and the vertex of the parabola. Solutions:
(1) x−intercept: (2, 0), y−intercept: (0, -8)
(2) x−intercept: (2, 0) and (0, 0), y−intercept: (0, 0), vertex: (1, − 4)
Activity: • Using the Bellringer for discussion, have the students check other pairs of equations in the
form y = mx + b and y = x(mx + b) to make conjectures. Sample conjectures: o Both equations share an x-intercept, but y = x(mx + b) also has an x-intercept at x=0. o The y-intercept of y=mx+b is b, but the y-intercept of y = x(mx + b) is always y=0. o The vertex of y= x(mx + b) is half way between the origin and x-intercept. o Positive slope on the y=mx+b yields a parabola y=x(mx+b) opening up.
• Have students graph the Bellringer equations on their calculators and
adjust the window to x: [1, 3] and y: [–1, 1]. Have them discuss that both graphs look like a line with the same x-intercept.
• Give the students the following tabular functions and ask them which one can best be
modeled by a linear equation and why. (Review the method of finite differences used in Activity 8 in Unit 2.) Have students find the equation of the line.
x 2 3 4 5 6 7 8 9 y1 –2 0 2 4 6 8 10 12 y2 –4 0 8 20 36 56 80 108
Solution: y1 is a line because the slope, 1yx
∆∆
, always equals 2, y = 2x − 6

2012-13 and 2013-14 Transitional Comprehensive Curriculum
Algebra IIUnit 5Quadratic and Higher Order Polynomial Functions 5-15
• Finding the best-fit quadratic equation in the form y = x(mx + b) by hand: (These are also referred to as regression equations, prediction equations, and models.)
o Have students find the yx
∆∆
twice on y2 data to prove the data in the tabular function
below can be modeled by a quadratic equation. Solution: o If the y-intercept of the quadratic data is the origin, then the best-fit graph of the quadratic
equation can be written in the form y = x(mx+b). By following the pattern backwards, the students can see that y2 goes through the origin.
o The slope of the linear portion of the quadratic equation will be half the final constant and
the 2nd x-intercept will be shared by the line and the parabola. (Teacher Note: The reason the slope is ½ the constant is proved in calculus.) Have students find the equation of y2.
Solution: Using a slope of 2 and the point (3,0) to find the linear portion of the equation (y = 2x-6), the equation of the parabola is y=x(2x-6).
o Have students enter the x, y1 and y2 data in List 1, 2, and 3 on the
graphing calculator and make 2 scatter plots, one using x and y1 (L1 and L2) and one using x and y2 (L1`and L3) using different symbols for the plotted points and ZOOM STAT. (Teacher Note: Steps for plotting data can be found in Unit 2, Activity 8 BLM.)
o Have students enter the two equations: y1 = 2x − 6,
y2 = x(2x − 6) and change window to determine if the data fits the graphs of the equations.

2012-13 and 2013-14 Transitional Comprehensive Curriculum
Algebra IIUnit 5Quadratic and Higher Order Polynomial Functions 5-16
o Have students work several more examples such as the one below. x -1 0 1 2 3 4 5 6 y3 0 0 6 18 36 60 90 126
Solution: y = x(3x + 3)
• Finding the best-fit quadratic equation in the form y = ax2 + bx + c by calculator: o Have students use the method of finite differences on the tabular function below to
determine what type of polynomial would best model the data.
x −2 −1 0 1 2 3 4 5 y1 28 14 10 10 8 −2 −26 −70
o Have students plot the data on the calculator in L1 and L2 and use
the regression feature of the calculator to find the best fit equation. STAT > CALC > 5:QuadReg > Xlist: L1 , YList: L2 , Store RegEQ: Y1 > Calculate Solution: The polynomial is cubic. f(x) = −x3 + 2x2 − x + 10
Activity 7: How Varying the Coefficients in y = ax2 + bx + c Affects the Graphs (GLEs: 2, 4, 5, 6, 7, 9, 10, 16, 19, 27, 28; CCSS: WHST.11-12.2d)
Materials List: paper, pencil, graphing calculator, Graphing Parabolas Anticipation Guide BLM, The Changing Parabola Discovery Worksheet BLM This activity has not changed because it already incorporates this CCSS. In this activity, students will discover how changes in the equation for the quadratic function can affect the graph in order to create a best-fit parabola. Math Log Bellringer:
Graph y1 = –4x + 6 and y2 = x(–4x + 6) without a calculator, discuss similarities, then describe the method you used to graph the equations. Solution:
Students should say that the graphs both have the same zero at x = 3/2. Answers to the discussion may vary. They could have graphed y1 by finding the y−intercept and using the slope to graph, or they could have plotted points. Students could have found the zeros in y2 at x = 0 and 3/2 by using the Zero Product Property of Equations or the quadratic formula, and they could have found the vertex by finding the midpoint between the zeros or by using ,
2 2b bfa a
− −
.

2012-13 and 2013-14 Transitional Comprehensive Curriculum
Algebra IIUnit 5Quadratic and Higher Order Polynomial Functions 5-17
Activity: • Use the Bellringer to check for understanding of the relationship between y = mx + b and
y = x(mx+b) before going on to other changes. (See sample conjectures in Activity 6.) • Distribute the Graphing Parabolas Anticipation Guide BLM. An anticipation guide (view literacy strategy descriptions) promotes deep and meaningful
understandings of content area topics by activating and building relevant prior knowledge, and by building interest in and motivation to learn more about particular topics. Anticipation guides are developed by generating statements about a topic that force students to take positions and defend them. Anticipation guides are especially useful for struggling and reluctant readers and learners as they increase motivation and help students focus on important information.
In the Graphing Parabolas Anticipation Guide BLM, the students will use their prior knowledge of translating graphs to predict how changes in a, b, and c in the equation y = ax2 + bx + c will affect the graph.
This should take approximately five minutes after which the students will discover exactly what happens to the graph using The Changing Parabola Discovery Worksheet BLM. There is no Graphing Parabolas Anticipation Guide with Answers BLM because the answers may vary based on the students’ opinions. However, when the students finish The Changing Parabola Discovery Worksheet, have them return to the anticipation guide to correct their answers based on what they discovered.
• The Changing Parabola Discovery Worksheet: On this worksheet the students will use their graphing calculators to graph the parabola
y = ax2 + bx + c with various changes in the constants to determine how these changes affect the graph, and they will compare their answers to the predictions in the anticipation guide.
Teach the following graphing technique before distributing the worksheet. Instead of graphing every equation individually, students can easily change the constants in one of three ways on the TI83 and TI84 graphing calculator. Practice with the following example: y = x2 + a for a = {−2, 0, 4} (1) Type three related equations: y1 = x2, y2 = y1 − 2, y3 = y1
+ 4. (y1 is found under VARS, Y−VARS, 1:Function…, 1:Y1)
(2) Use a list: y1 = x2 + {−2, 0, 4} (brackets are found above
the parentheses.) (3) Use the Transformation APPS:
• Turn on the application by pressing APPS Transfrm ENTER ENTER
• Enter the equation y1 = x2 + A (Use the letters A, B,
C, or D for constant that will be changed.)

2012-13 and 2013-14 Transitional Comprehensive Curriculum
Algebra IIUnit 5Quadratic and Higher Order Polynomial Functions 5-18
• Set the window by pressing WINDOW cursor to SETTINGS, set where A will start, in this example
A = −2, and adjust the step for A to Step = 1.
• GRAPH and use the & % cursor to change the values of A.
• When finished, uninstall the transformation APP by
pressing APPS Transfrm, 1:Uninstall • For more information see the TI 83/TI84
Transformation App Guidebook at http://education.ti.com/downloads/guidebooks/eng/transgraph-eng.
Distribute The Changing Parabola Discovery Worksheet BLM and arrange the students
in pairs to complete it. Circulate to make sure they are graphing correctly. The answers to “why the patterns occur” will vary. When the students finish the
worksheet, list the answers from the students on the board reviewing all the information they have learned in previous units, such as finding the vertex from ,
2 2b bfa a
− −
and the axis of symmetry from 2bxa
= − , as well as using the discriminant b2 − 4ac to
determine when there are real roots. • Critical Thinking Writing Assessment: (See Activity-Specific Assessments at end of unit.) Activity 8: Parabolic Graph Lab (GLEs: 4, 6, 9, 10, 19, 20, 22, 24, 28, 29; CCSS: RST.11-
12.3) Materials List: paper, pencil, graphing calculator, Drive the Parabola Lab BLM, Drive the Parabola Collection and Analysis BLM, the following for each lab group − CBR motion detector with cable to connect to graphing calculator, large truck or ball, ramp or board set on books, Drive the Parabola Lab Teacher Information BLM This activity has not changed because it already incorporates this CCSS. Students will collect data with a motion detector to determine a quadratic equation for the position of a moving object and use the equation to answer questions. Math Log Bellringer:
The position of a falling object with initial velocity of 50 ft/sec thrown up from a height of 100 feet is given by f(t) = –16t2 + 50t + 100. (1) Graph the equation on your calculator adjusting the window to see the intercepts and
vertex. (2) Find the maximum height of the object and the time it gets to this height. (3) Find the time the object hits the ground.

2012-13 and 2013-14 Transitional Comprehensive Curriculum
Algebra IIUnit 5Quadratic and Higher Order Polynomial Functions 5-19
Solutions: (1) (2) The maximum height is 139.063 ft. at 1.563 seconds (3) It hits the ground in 4.5106 sec.
Activity: • Use the Bellringer to check for understanding of the meaning of the vertex and the zeros. • Drive the Parabola Lab: Divide the students into groups and distribute the Drive the Parabola Lab BLM and the
Drive the Parabola Lab Collection and Analysis BLM Each group will collect data from the motion detector and use the data to answer
questions. Groups can share the motion detectors, because once the data is collected, the analysis
can be finished with the calculator. After the students collect the data, they should link to a partner’s calculator to transfer data so everyone in the group can do the analysis. Students can finish for homework if there isn’t enough time in class.
Teacher Note: If motion detectors are unavailable, use the following data and the Drive the Parabola Data Collection and Analysis BLM. The sample answers on the BLM correspond to this data.
time (sec) 0 0.2 .4 0.6 0.8 1.0 1.2 1.4 1.6 1.8 2.0 2.2 2.4 2.6 2.8 distance (m) 0.273 0.123 0 −.095 −.1632 -0.204 −.2176 −.2038 −.1628 −.0946 .001 .1238 .2739 .4514 .656
Activity 9: Solving Equations in Quadratic Form (GLEs: 1, 2, 5, 9, 27) Materials List: paper, pencil The students will examine equations that are not truly quadratic but in which they can use the same strategies to solve. Math Log Bellringer:
Solve the following for t: 2t2 – 4t + 1 = 0 and discuss which method you used and why.
Solution: 2 2 2 22 2
t and t+ −= = , I used the quadratic formula because I could not
factor the equation. Activity:

2012-13 and 2013-14 Transitional Comprehensive Curriculum
Algebra IIUnit 5Quadratic and Higher Order Polynomial Functions 5-20
• Use the Bellringer to review the quadratic formula making sure to have students use the
variable t in the quadratic formula 2 4
2b b act
a− ± −
= and in the answer, then write the two
answers separately. Substitute (s - 3) for t in the equation and ask them how to solve. Remind students to check the answers to prove that they are solutions and not extraneous roots.
Solution: 2(s − 3)2 − 4(s − 3) + 1 = 0
2 2 2 23 32 2
2 2 2 23 32 2
s or s
s or s
+ −− = − =
+ −= + = +
Finding a common denominator: 8 2 8 22 2
s and s+ −= =
• Define quadratic form as any equation that can be written in the form at2 + bt + c where t is
any expression of a variable. Have students identify the expression that would be t in the following to make the equation quadratic form: (1) x4 +7x2 + 6 = 0 (2) 2(y +4)2 + (y + 4) – 6= 0 (3) 3 4 0x x− − = (4) s4 + 9s2 = 0
Solutions: (1) t = x2, (2) t = y + 4, (3) t x= (4) t = s2
• Have students work in pairs to solve the problems above making sure to check answers for extraneous roots.
Solution: (1) x = { }, 6i i± ± , (2) y = 5 , 62
− −
, (3) x =16, (4) s = {0, 3i± }
• Application: In a certain electrical circuit, the resistance of any R, greater than 6 ohms, is
found by solving the quadratic equation (R – 6)2 = 4(R – 6) + 5. Show all of your work. (1) Find R by solving the equation using quadratic form. (2) Find R by first expanding the binomials and factoring. (3) Find R by expanding the binomials then quadratic formula. (4) Find R by graphing f(R)= (R – 6)2 – 4(R – 6) – 5 and finding the zeroes. (5) Discuss which of the above methods you like the best and why both solutions for R are
not used.
Solution: R = 11 ohms, 5 ohms is not valid for the initial conditions Activity 10: Solving Quadratic Inequalities (GLEs: 2, 4, 5, 6, 9, 10, 24, 27, 29)
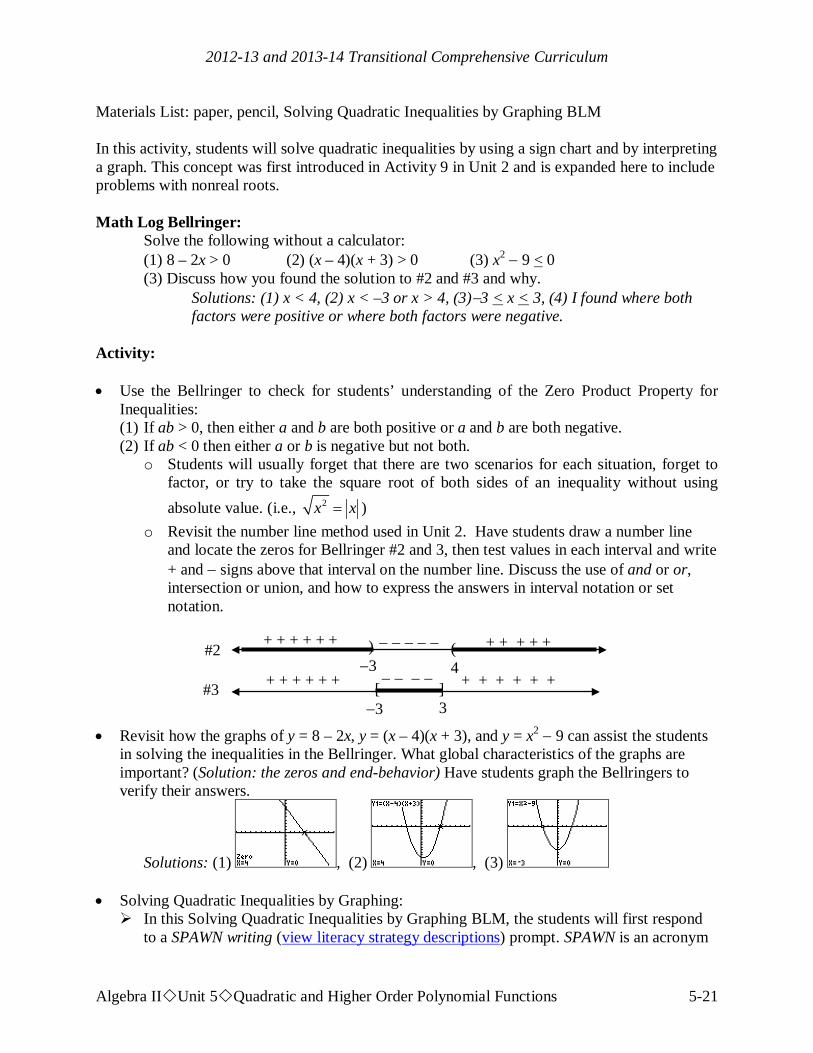
2012-13 and 2013-14 Transitional Comprehensive Curriculum
Algebra IIUnit 5Quadratic and Higher Order Polynomial Functions 5-21
Materials List: paper, pencil, Solving Quadratic Inequalities by Graphing BLM In this activity, students will solve quadratic inequalities by using a sign chart and by interpreting a graph. This concept was first introduced in Activity 9 in Unit 2 and is expanded here to include problems with nonreal roots. Math Log Bellringer: Solve the following without a calculator:
(1) 8 – 2x > 0 (2) (x – 4)(x + 3) > 0 (3) x2 − 9 < 0 (3) Discuss how you found the solution to #2 and #3 and why.
Solutions: (1) x < 4, (2) x < –3 or x > 4, (3)−3 < x < 3, (4) I found where both factors were positive or where both factors were negative.
Activity: • Use the Bellringer to check for students’ understanding of the Zero Product Property for
Inequalities: (1) If ab > 0, then either a and b are both positive or a and b are both negative. (2) If ab < 0 then either a or b is negative but not both.
o Students will usually forget that there are two scenarios for each situation, forget to factor, or try to take the square root of both sides of an inequality without using absolute value. (i.e., 2x x= )
o Revisit the number line method used in Unit 2. Have students draw a number line and locate the zeros for Bellringer #2 and 3, then test values in each interval and write + and − signs above that interval on the number line. Discuss the use of and or or, intersection or union, and how to express the answers in interval notation or set notation.
• Revisit how the graphs of y = 8 – 2x, y = (x – 4)(x + 3), and y = x2 − 9 can assist the students
in solving the inequalities in the Bellringer. What global characteristics of the graphs are important? (Solution: the zeros and end-behavior) Have students graph the Bellringers to verify their answers.
Solutions: (1) , (2) , (3) • Solving Quadratic Inequalities by Graphing: In this Solving Quadratic Inequalities by Graphing BLM, the students will first respond
to a SPAWN writing (view literacy strategy descriptions) prompt. SPAWN is an acronym
) −3
( 4
#2
] 3
[ −3
#3
+ + + + + + + + + + +
− − − − −
+ + + + + + + + + + + + − − − −

2012-13 and 2013-14 Transitional Comprehensive Curriculum
Algebra IIUnit 5Quadratic and Higher Order Polynomial Functions 5-22
that stands for five categories of writing prompts: Special Powers, Problem Solving, Alternative Viewpoints, What If, and Next. In the first section of this BLM the students will answer a “What If” writing prompt concerning using graphs to help solve inequalities if the zeros are not real.
Distribute the Solving Quadratic Inequalities by Graphing BLM and give students a few minutes to complete the SPAWN writing prompt individually. Ask several students to share their answers.
The students should then continue the worksheet in which they will find the zeros and roots and graph the related equations to solve the inequalities. Stress that it is not important to find the vertices of the parabolas, just the zeros and end-behavior.
When students have finished the worksheet, revisit the SPAWN prompt and refine the procedure for finding the roots and end-behavior in order to determine if there are any solutions or not.
To check for understanding, assign the following problems to be solved individually: Write the related “y =” equation, find the roots, zeros and graph without a calculator, then write the solution to the inequality in interval notation. (1) x2 + 3x > 0 (2) x2 − 2x < 2 (3) x2 − 2x + 2 > 0 (4) −x2 − 8 < 0
Solutions: (1) y = x2 + 3x, zeroes: x = −3, 0, roots: x = −3, 0
Solution to inequality: (−∞, −3) ∪ (0,∞) (2) y = x2 − 2x − 2, zeroes, 1 3x = ± , roots: 1 3x = ± , Solution to inequality: 1 3,1 3 − +
(3) y = x2 − 2x + 2; zeroes: none, roots, x = 1 ± i Solution to inequality: (−∞, ∞)
(4) y = −x2 − 8, zeroes: none, roots 2 2i± , Solution to inequality: all reals
• Critical Thinking Writing Assessment: (See Activity-Specific Assessments at end of unit.)
Activity 11: Synthetic Division (GLEs: 2, 5; CCSS: A.APR.6, RST.11-12.4) Materials List: paper, pencil This activity has not changed because it already incorporates these CCSSs. In this activity, students will use synthetic division to divide a polynomial by a first-degree binomial. Math Log Bellringer: Divide by hand to simplify the following quotients:

2012-13 and 2013-14 Transitional Comprehensive Curriculum
Algebra IIUnit 5Quadratic and Higher Order Polynomial Functions 5-23
(1) 7 1342 (2) 3 22 4 7 14x x x x− + − −
(3) Discuss the difference in writing the answer to 7/5 in these two ways:
7 5 1÷ = Remainder 2 or 27 5 15
÷ =
Solutions: (1) 51917
(2) 2 46 52
x xx
+ + −−
, (3) See Activity for discussion
Activity:
• Use Bellringer #1 to review elementary school terminology:
remainderquotientdivisor
divisor dividend
+
. Rewrite this rule in Algebra II form: dividend remainderquotient
divisor divisor= + and relate to Bellringer
problem 2. • Review the definition of polynomial and the steps for long division, stressing descending
powers and missing powers. Have students divide 32 3 100
4x x
x+ ++
.
Solution: 2
3 2 2
2 8 35404 2 0 3 100 40 2 8 35
4
x xx x x x with a remainder of x x
x
− ++ + + + − = − + −
+
• Introduce synthetic division illustrating that in the long division problems, the variable is not
necessary, and if we had divided by the opposite of 4, we could have used addition instead of subtraction. Rework the problems using synthetic division.
Solution: −4| 2 0 3 100 −8 32 −140 2 −8 35 −40 • Have students develop the steps for synthetic division:
(1) Set up the coefficients in descending order of exponents. (2) If a term is missing in the dividend, write a zero in its place. (3) When dividing by the binomial x – c, use c as the divisor (c is the value of x that makes
the factor x – c = 0).
(4) When dividing by the binomial ax – c, use ca
as the divisor. ( ca
is the value of x that
makes the factor ax – c = 0.) • Have students practice the use of synthetic division to simplify the following and write the
answers in equation form as dividend remainderquotientdivisor divisor
= + .
(1) (2x3 + 5x2 –7x –12) ÷ (x + 3) (2) (x4 –5x2 – 10x – 12) ÷ (x + 2)

2012-13 and 2013-14 Transitional Comprehensive Curriculum
Algebra IIUnit 5Quadratic and Higher Order Polynomial Functions 5-24
Solutions:
(1) 3 22x + 5x -7x -12
x+3= (2x2 – x – 4) + 0
3x +
(2) 4 2x -5x - 10x - 12
x+2= 3 2 42 8
2x x x
x− − − +
+
• Use the math textbook for additional problems.
Activity 12: Remainder and Factor Theorems (GLEs: 1, 2, 5, 6, 9, 25; CCSS: A.APR.2, A.APR.6 )
Materials List: paper, pencil, graphing calculator, Factor Theorem Discovery Worksheet BLM This activity has not changed because it already incorporates these CCSSs. In this activity, the students will evaluate a polynomial for a given value of the variable using synthetic division, and they will determine if a given binomial is a factor of a given polynomial. Math Log Bellringer: Use long division and synthetic division to simplify the following problem.
(2x3 + 3x2 − 8) ÷ (x − 4)
Solution: 2x2 + 11x + 44 + 1684x −
Activity: • Factor Theorem Discovery Worksheet: In this worksheet, the students will use synthetic division to find a relationship between
the remainder when dividing a polynomial by (x − c) and the value of the polynomial at f(c) developing the Remainder Theorem. They will use this information to determine when (x − c) is a factor of a polynomial thus developing the Factor Theorem.
Distribute the Factor Theorem Discovery Worksheet BLM. This worksheet should be used as guided discovery. Allow students to work in pairs or groups stopping after each section to ascertain understanding.
After questions #1 and #2 under the Synthetic Division section, have a student write the answers on the board for others to check.
After questions #3 and #4, ask students to complete the Remainder Theorem. It states: If P(x) is a polynomial and c is a number, and if P(x) is divided by x – c, then the remainder equals P(c).
In the beginning of the Factor Theorem section, have students verbalize the definition of factor ≡ two or more numbers or polynomials that are multiplied together to get a third number or polynomial. Allow the students to complete the problems in this section to develop the Factor Theorem: If P(x) is a polynomial, then x – c is a factor of P(x) if and only if P(c) = 0. Have students define a depressed polynomial. Make sure students understand that the goal of this process is to develop a quadratic depressed equation that can be solved by quadratic function methods, such as the quadratic formula or simple factoring.

2012-13 and 2013-14 Transitional Comprehensive Curriculum
Algebra IIUnit 5Quadratic and Higher Order Polynomial Functions 5-25
When the theorems have been developed, have students practice the concepts using the Factor Theorem Practice section of the BLM.
• Assign additional problems from the math textbook if necessary. Activity 13: The Calculator and Exact Roots of Polynomial Equations (GLEs: 1, 2, 5, 6, 7,
9, 10, 25; CCSS: A.APR.2) Materials List: paper, pencil, graphing calculator, Exactly Zero BLM This activity has not changed because it already incorporates this CCSS. In this activity, the students will use the calculator and a synthetic division program to help find the exact roots of polynomial equations. Math Log Bellringer:
Graph f(x) = x3 + 5x2 −18 on your graphing calculator and find all zeros. Discuss how you know how many roots and zeros exist. Teacher Note: Students must ZOOM IN around –3 to find both negative zeros.
Solution: zeros: {–3, –3.646, 1.646}, The degree of the polynomial tells how many roots there are; but some roots may be imaginary and some may be double roots, so there are at most three different roots and at most three different zeros.
Activity: • Use the Bellringer to review the following concepts from Unit 2:
(1) finding zeros of a polynomial on a graphing calculator (2) determining the maximum number of roots for a polynomial equation (3) remembering what a double zero looks like on a graph (4) approximate values vs exact values
• Have the students decide how to use the integer root they found from the graphs and from synthetic division to find the exact answers of the Bellringer problems.
Solutions: Use the integer root x = −3 and synthetic division to find the depressed equation which is a quadratic equation. Then use the quadratic formula to find the exact roots { }3, 1 7, 1 7− − + − −
• The problem with using the Factor Theorem is finding one or more of the rational roots to
use in synthetic division to create a depressed quadratic equation. The students can find the integer or rational roots found on the calculator and synthetic division to find the irrational or imaginary roots. o Have students find the exact roots and factors for the following equation explaining their
reasoning: x4 −6x3 + 13x2 − 24x + 36 = 0.

2012-13 and 2013-14 Transitional Comprehensive Curriculum
Algebra IIUnit 5Quadratic and Higher Order Polynomial Functions 5-26
Solutions: From the graph, it is obvious that there is a double root at x = 3, so 3 would be
used twice − once in synthetic division in the original equation and then again in the depressed equation to get to a quadratic equation that can be solved.
3 | 1 −6 13 −24 36 3 | 1 −3 4 −12 3 − 9 12 -36 3 0 12 1 −3 4 −12 0 1 0 4 0 Depressed quadratic equation: x2 + 4 = 0 ⇒ x = ±2i Roots: {3, 3, ±2i}, factors: (x − 3)2(x − 2i)(x + 2i)
• If the students are going to use the calculator to find the rational roots, then it is logical that
they could use the calculator to run a synthetic division program that will generate that depressed equation. This program is available for the TI 83 and 84 at the following website. http://www.ticalc.org/pub/83plus/basic/math/
• Exactly Zero BLM: On the Exactly Zero BLM, the students will practice finding the exact zeros by first
graphing the function on the calculator to find one or more rational roots and then using these roots in synthetic division (either by hand or using the program). Repeated use of synthetic division will generate a depressed quadratic equation which can then be solved by one of the methods for solving quadratic equations.
Distribute the Exactly Zero BLM and allow the students to work in pairs. When students complete the worksheet, check their answers and assign the following
problem to be worked individually. Find the roots and factors of the following equation: x4 − 6x3 +14x2 − 14x + 5 = 0 Solution: Roots: {1, 1, 2 + i, 2 − i}, factors: (x − 1)2( x−2− i)(x − 2 + i)
Activity 14: The Rational Root Theorem and Solving Polynomial Equations (GLEs: 1, 2, 5,
6, 7, 9, 25, 27; CCSS: A.APR.2) Materials List: paper, pencil, graphing calculator, Rational Roots of Polynomials BLM, Exactly Zero BLM from Activity 13 This activity has not changed because it already incorporates this CCSS. In this activity, the students will use the Rational Root Theorem and synthetic division to solve polynomial equations. Math Log Bellringer: Distribute the Rational Roots of Polynomials BLM. Have students complete the vocabulary self-awareness (view literacy strategy descriptions) chart. They should

2012-13 and 2013-14 Transitional Comprehensive Curriculum
Algebra IIUnit 5Quadratic and Higher Order Polynomial Functions 5-27
rate their personal understanding of each number system with either a “+” (understands well), a “” (limited understanding or unsure), or a “−” (don’t know). They should then look back at the Exactly Zero BLM completed in Activity 13 and list all the roots found and place them in the correct category in the chart. Have students refer to the chart later in the unit to determine if their personal understanding has improved and to make any corrections in the chart. For terms in which students continue to have checks and minuses, additional teaching and review may be necessary.
Complex Number System Terms + − Root from Exact Zero BLM 1 integer 2 rational number 3 irrational number 4 real number 5 imaginary number 6 complex number
Activity: • Use the Bellringer to make sure students can classify types of numbers, a skill begun in Unit 4. • Rational Roots of Polynomials: The remainder of the Rational Roots of Polynomials BLM should be a teacher-guided
interactive worksheet. Have students define rational number. Possible student answers: (1) a repeating or
terminating decimal, (2) a fraction, (3) pq
where p and q are integers and q ≠ 0.
Have students list the rational roots in each of the Exactly Zero BLM problems from Activity 13. o What is alike about all the polynomials that have integer rational roots?
Solution: leading coefficient of 1. o What is alike about all the polynomials that have fraction rational roots?
Solution: The leading coefficient is the denominator. State the Rational Root Theorem: If a polynomial has integral coefficients, then any
rational roots will be in the form pq
where p is a factor of the constant and q is a factor of
the leading coefficient. Discuss the following theorems and how they apply to the problems above:
o Fundamental Theorem of Algebra: Every polynomial function with complex coefficients has at least one root in the set of complex numbers
o Number of Roots Theorem: Every polynomial function of degree n has exactly n complex roots. (Some may have multiplicity.)
o Complex Conjugate Root Theorem: If a complex number a + bi is a solution of a polynomial equation with real coefficients, then the conjugate a – bi is also a solution of the equation.

2012-13 and 2013-14 Transitional Comprehensive Curriculum
Algebra IIUnit 5Quadratic and Higher Order Polynomial Functions 5-28
Have students decide how to choose which of the many rational roots to use to begin synthetic division. Relate back to finding the zeroes on a calculator by entering a lower bound and upper bound.
Discuss continuity of polynomials. Develop the Intermediate Value Theorem for Polynomials: (as applied to locating zeros). If f(x) defines a polynomial function with real coefficients, and if for real numbers a and b the values of f(a) and f(b) are opposite signs, then there exists at least one real zero between a and b.
Have students apply the Rational Root Theorem to solve the last polynomial. • Assign additional problems in the math textbook for practice. Activity 15: Graphing Polynomial Functions (GLEs: 1, 2, 4, 5, 6, 7, 9, 10, 16, 25, 27, 28;
CCSSs: A.APR.2, A.APR.6, WHST.11-12.2d) Materials List: paper, pencil, graphing calculator, Solving the Polynomial Mystery BLM This activity has not changed because it already incorporates these CCSSs. In this activity, the students will tie together all the properties of polynomial graphs learned in Unit 2 and in the above activities to draw a sketch of a polynomial function with accurate zeros and end-behavior. Math Log Bellringer: Graph on your graphing calculator. Adjust WINDOW to see maximum and minimum y values and intercepts. Find exact zeros and exact roots.
(1) f(x) = x3 – x2 – 4x + 4 (2) f(x)= x4 – 1 (3) f(x)= –x4 + 8x2 + 9 (4) f(x)= –x3 – 3x (5) Discuss the difference in zeroes and roots Solutions:
(1) zeros {–2, 1, 2}, roots {–2, 1, 2}, (2) zeroes: {1, –1}, roots: {1, –1, i, –i} (3) zeros: { }3, 3− , roots: { }3, 3, ,i i− − , (4) zeroes: {0}, roots: { }3i±
(5) Zeros are the x−intercepts on a graph where y = 0. Roots are solutions to a one variable equation and can be real or imaginary.
Activity: • Use the Bellringer to review the following:
(1) Unit 2 concepts (end-behavior of odd and even degree polynomials, how end-behavior changes for positive or negative leading coefficients).

2012-13 and 2013-14 Transitional Comprehensive Curriculum
Algebra IIUnit 5Quadratic and Higher Order Polynomial Functions 5-29
(2) Unit 5 concepts (the Number of Roots Theorem, Rational Root Theorem, and synthetic division to find exact roots).
(3) What an imaginary root looks like on a graph (i.e. imaginary roots cannot be located on a graph because the graph is the real coordinate system.) (Students in Algebra II will be able to sketch the general graph with the correct zeros and end-behavior, but the particular shape will be left to Calculus.)
• Before assigning the problem of graphing a polynomial with all of its properties, ask the
students use a modified form of GISTing (view literacy strategy descriptions). GISTing is an excellent way to help students paraphrase and summarize essential information. Students are required to limit the GIST of a concept to a set number of words. Begin by reminding students of the fundamental characteristics of a summary or GIST by placing these on the board or overhead:
(1) Shorter than the original text (2) A paraphrase of the author’s words and descriptions (3) Focused on the main points or events
Assign the following GIST: When you read a mystery, you look for clues to solve the case. Think of solving for the roots of a polynomial equation as a mystery. Discuss all the clues you would look for to find the roots of the equation. Your discussion should be bulleted, concise statements, not full sentences, and cover about ½ sheet of paper.
When students have finished their GISTs, create a list on the board of characteristics that should be examined in graphing a polynomial. The lists should include the following bullets. If the students leave any out, have them correct their GISTs after they complete the BLM. o Fundamental Theorem of Algebra - one root o Number of Roots Theorem - number of roots = degree of polynomial o Rational Root Theorem - possible rational roots use constant and leading coefficient o Intermediate Value Theorem – interval location of roots o Factor Theorem – synthetic division finds root and depressed equation o Multiplicity – even skims off, odd passes through o x- and y-intercepts – set x and y = 0 o End behavior - degree of polynomial and leading coefficient
• Solving the Polynomial Mystery: In the Solving the Polynomial Mystery BLM, the students will combine all the concepts
developed in this unit that help to find the roots of a higher degree polynomial and will check to see if their GISTing were complete.
Distribute the Solving the Polynomial Mystery BLM. This is a noncalculator worksheet. Allow students to work in pairs circulating to make sure they are applying all the theorems correctly.
When students have completed the graph have them check it on their graphing calculators finding both the graph and the decimal approximations of the roots. Make sure all the elements in the worksheet − intercepts, roots, end-behavior, and ordered pairs in the chart − are located on the graph. (They will not be able to find the maximum and minimum points by hand until Calculus.)
Have students return to their GISTs and add any concepts they had forgotten.

2012-13 and 2013-14 Transitional Comprehensive Curriculum
Algebra IIUnit 5Quadratic and Higher Order Polynomial Functions 5-30
• Critical Thinking Writing Assessment: (See Activity-Specific Assessments at end of unit.)
Sample Assessments
General Assessments
• Use Bellringers as ongoing informal assessments. • Collect the Little Black Books of Algebra II Properties and grade for completeness at the
end of the unit. • Monitor student progress using small quizzes to check for understanding during the unit
on such topics as the following: (1) speed graphing y = x2, y = –x2, y = x2 + 4, y = (x + 4)2 (2) solving quadratic equations by using the quadratic formula (3) solving quadratic equations by completing the square
• Administer three comprehensive assessments: (1) graphing quadratic functions (2) solving quadratic equations and inequalities and application problems (3) using synthetic division and the Factor Theorem to graph polynomials
Activity-Specific Assessments
• Activities 4, 7, 10 and 15: Evaluate the Critical Thinking Writing using the following rubric:
Grading Rubric for Critical Thinking Writing Activities 2 pts. - answers in paragraph form in complete sentences with proper grammar and punctuation 2 pts. - correct use of mathematical language 2 pts. - correct use of mathematical symbols 3 pts./graph - correct graphs (if applicable) 3 pts./solution - correct equations, showing work, correct answer 3 pts./discussion - correct conclusion
• Activity 4: Critical Thinking Writing
John increased the area of his garden by 120 ft2. The original garden was 12 ft. by 16 ft., and he increased the length and the width by the same amount. Find the exact dimensions of the new garden and approximate the dimensions in feet and inches. Discuss which method you used to solve the problem and why you chose this method.
Solution: 14 2 79x = − + , dimensions = ( ) ( )2 2 79 X 2 2 79− + + ≈ 15ft. 9 in. X 19 ft. 9 in
• Activity 7: Critical Thinking Writing

2012-13 and 2013-14 Transitional Comprehensive Curriculum
Algebra IIUnit 5Quadratic and Higher Order Polynomial Functions 5-31
Answer the following questions using the conclusions from The Changing Parabola Discovery Worksheet BLM. (1) Discuss what happens to the zeros, the y-intercept and the graph of the equation y
= x2 + 8x + c as c changes from 0 to values approaching infinity determining which values of c will result in one, two or no zeros.
(2) Discuss what happens to the zeros, the y-intercept, and the graph of the equation y = x2 + bx – 5 as b changes from 0 to values approaching infinity determining which values of b will result in one, two or no zeros.
(3) Discuss what happens to the zeros and the graph of the equation y = ax2 + x – 5 when a > 0, and what happens to the positive zero when a → 0. Solutions: (1) When c = 0, the zeros are {0, −8} and a y-intercept of 0. As c →∞ , the graph of y
= x2 + 8x + c moves up with the y-intercept moving up. When the discriminant b2 − 4ac = 64 − 4c > 0 or c > 16, there are no real zeros and two imaginary roots. When c = 16, there is one real zero at x = − 4 and a double real root.
(2) When b = 0 there are two real roots and two zeros at 5x = ± with a y-intercept of − 5. There will always be zeros or real roots because b2 − 4ac = b2 + 20 is always >0. As b→∞ , the y−intercept remains at y = −5 and the axis of
symmetry which is 2bxa
= − moves left. As b becomes larger and larger, the
constant becomes less significant. If the constant is ignored, the equation becomes y = x2+bx or y= x(x+b) which has the zeros 0 and –b.
(3) When a > 0, the graph is a parabola opening up, and as a → 0, the zeroes become wider and wider apart. As a → 0, the equation starts looking like the equation y = x − 5 which is a line with a zero at x = 5, so the positive zero approaches 5.
• Activity 10: Critical Thinking Writing
A truck going through the parabolic tunnel over a two-lane highway has the following features: the tunnel is 30 feet wide at the base and 15 feet high in the center. (1) Sketch your tunnel so that the base is on the x-axis and the x intercepts are ±15. (2) Find the equation of the parabola. What do the variables x and y represent? (3) The truck is 10 feet high. Determine the range of distances the truck can drive from
the center of the tunnel and not hit the top of the tunnel. (a) Find the inequality you will be solving. (b) Find the zeros and sketch of the related equation. (c) Express your exact answer to the range of distances in feet and inches.
(4) Discuss how you set up the equation for the parabola and how you solved the problem. Solutions: (1)

2012-13 and 2013-14 Transitional Comprehensive Curriculum
Algebra IIUnit 5Quadratic and Higher Order Polynomial Functions 5-32
(2) 21 1515
y x= − + , y = the height of the tunnel a distance of x from the center of the
tunnel
(3a) 21 15 1015
x− + >
(b) related equation 21 515
y x= − + , zeros: 5 3x = ±
(c) Distance from center of the tunnel < 5 3 ft ≈ 8 ft 8”
• Activity 15: Critical Thinking Writing
One of your rational roots in The Polynomial Mystery BLM is a fraction. Discuss the difference in the graph if you use the factor (x – ½ ) or the factor (2x – 1). Which one is correct for this problem and why?
Solution: 2x – 1 is correct for this problem. Both equations have the same zeros, but one has higher and lower minimum points. Since f(x) has a leading coefficient of 4, my factors must expand to 4x4 + …

2012-13 and 2013-14 Transitional Comprehensive Curriculum
Algebra IIUnit 6Exponential and Logarithmic Functions 6-1
Algebra II Unit 6: Exponential and Logarithmic Functions
Time Frame: Approximately four weeks Unit Description In this unit, students explore exponential and logarithmic functions, their graphs, and applications. Student Understandings Students solve exponential and logarithmic equations and graph exponential and logarithmic functions by hand and by using technology. They will compare the speed at which the exponential function increases to that of linear or polynomial functions and determine which type of function best models data. They will comprehend the meaning of a logarithm of a number and know when to use logarithms to solve exponential functions. Guiding Questions
1. Can students solve exponential equations with variables in the exponents and having a common base?
2. Can students solve exponential equations not having the same base by using logarithms with and without technology?
3. Can students graph and transform exponential functions? 4. Can students graph and transform logarithmic functions? 5. Can student write exponential functions in logarithmic form and vice versa? 6. Can students use the properties of logarithms to solve equations that contain
logarithms? 7. Can students find natural logarithms and anti-natural logarithms? 8. Can students use logarithms to solve problems involving exponential growth and
decay? 9. Can students look at a table of data and determine what type of function best models
that data and create the regression equation? Unit 6 Grade-Level Expectations (GLEs) Teacher Note: The individual Algebra II GLEs are sometimes very broad, encompassing a variety of functions. To help determine the portion of the GLE that is being addressed in each unit and in each activity in the unit, the key words have been underlined in the GLE list, and the number of the predominant GLE has been underlined in the activity.

2012-13 and 2013-14 Transitional Comprehensive Curriculum
Algebra IIUnit 6Exponential and Logarithmic Functions 6-2
Grade-Level Expectations GLE # GLE Text and Benchmarks Number and Number Relations 1. Read, write, and perform basic operations on complex numbers (N-1-H) (N-5-H) 2. Evaluate and perform basic operations on expressions containing rational
exponents (N-2-H) 3. Describe the relationship between exponential and logarithmic equations
(N-2-H) Algebra 4. Translate and show the relationships among non-linear graphs, related
tables of values, and algebraic symbolic representations (A-1-H) 6. Analyze functions based on zeros, asymptotes, and local and global
characteristics of the function (A-3-H) 7. Explain, using technology, how the graph of a function is affected by
change of degree, coefficient, and constants in polynomial, rational, radical, exponential, and logarithmic
10. functions (A-3-H)
Model and solve problems involving quadratic, polynomial, exponential, logarithmic
Data Analysis. Probability, and Discrete Math
, step function, rational, and absolute value equations using technology (A-4-H)
17. Discuss the differences between samples and populations (D-1-H) 19. Correlate/match data sets or graphs and their representations and classify
them as exponential, logarithmic20.
, or polynomial functions (D-2-H) Interpret and explain, with the use of technology, the regression coefficient and the correlation coefficient for a set of data (D-2-H)
22. Explain the limitations of predictions based on organized sample sets of data (D-7-H)
Patterns, Relations, and Functions 24. Model a given set of real-life data with a non-linear function (P-1-H) (P-5-H) 25. Apply the concept of a function and function notation to represent and
evaluate functions (P-1-H) (P-5-H) 27. Compare and contrast the properties of families of polynomial, rational,
exponential, and logarithmic28.
functions, with and without technology (P-3-H) Represent and solve problems involving the translation of functions in the coordinate plane (P-4-H)
29. Determine the family or families of functions that can be used to represent a given set of real-life data, with and without technology (P-5-H)
CCSS for Mathematical Content CCSS # CCSS Text Building Functions F.BF.4a Find inverse functions.
a. Solve an equation of the form f(x) = c for a simple function f that has an inverse and write an expression for the inverse.

2012-13 and 2013-14 Transitional Comprehensive Curriculum
Algebra IIUnit 6Exponential and Logarithmic Functions 6-3
Linear, Quadratic, and Exponential Models F.LE.4
For exponential models, express as a logarithm the solution to abct
ELA CCSS
= d where a, c, and d are numbers and the base b is 2, 10, or e; evaluate the logarithm using technology.
CCSS # CCSS Text Reading Standards for Literacy in Science and Technical Subjects 6-12 RST.11-12.3 Follow precisely a complex multistep procedure when carrying out
experiments, taking measurements, or performing technical tasks; analyze the specific results based on explanations in the text.
RST.11-12.4 Determine the meaning of symbols, key terms, and other domain-specific words and phrases as they are used in a specific scientific or technical context relevant to grades 11–12 texts and topics.
Writing Standards for Literacy in History/Social Studies, Science and Technical Subjects 6-12 WHST.11-12.7 Conduct short as well as more sustained research projects to answer a
question (including a self-generated question) or solve a problem; narrow or broaden the inquiry when appropriate; synthesize multiple sources on the subject, demonstrating understanding of the subject under investigation.
Sample Activities Ongoing Activity: Little Black Book of Algebra II Properties Materials List: black marble composition book, Little Black Book of Algebra II Properties BLM Activity: • Have students continue to add to the Little Black Books they created in previous units which
are modified forms of vocabulary cards (view literacy strategy descriptions). When students create vocabulary cards, they see connections between words, examples of the word, and the critical attributes associated with the word such as a mathematical formula or theorem. Vocabulary cards require students to pay attention to words over time, thus improving their memory of the words. In addition, vocabulary cards can become an easily accessible reference for students as they prepare for tests, quizzes, and other activities with the words. These self-made reference books are modified versions of vocabulary cards because, instead of creating cards, the students will keep the vocabulary in black marble composition books (thus the name “Little Black Book” or LBB). Like vocabulary cards, the LBBs emphasize the important concepts in the unit and reinforce the definitions, formulas, graphs, real-world applications, and symbolic representations.
• At the beginning of the unit, distribute copies of the Little Black Book of Algebra II Properties BLM for Unit 6. This is a list of properties in the order in which they will be learned in the unit. The BLM has been formatted to the size of a composition book so

2012-13 and 2013-14 Transitional Comprehensive Curriculum
Algebra IIUnit 6Exponential and Logarithmic Functions 6-4
students can cut the list from the BLM and paste or tape it into their composition books to use as a table of contents.
• The students’ description of each property should occupy approximately one-half page in the LBB and include all the information on the list for that property. The students may also add examples for future reference.
• Periodically check the Little Black Books and require that the properties applicable to a general assessment be finished by the day before the test, so pairs of students can use the LBBs to quiz each other on the concepts as a review.
Exponential and Logarithmic Functions
6.1 Laws of Exponents – write rules for adding, subtracting, multiplying and dividing values
with exponents, raising an exponent to a power, and using negative and fractional exponents.
6.2 Solving Exponential Equations – write the rules for solving two types of exponential equations: same base and different bases (e.g., solve 2x = 8x – 1 without calculator; solve 2x = 3x – 1 with and without calculator).
6.3 Exponential Function with Base a – write the definition, give examples of graphs with a > 1 and 0 < a < 1, and locate three ordered pairs, give the domains, ranges, intercepts, and asymptotes for each.
6.4 Exponential Regression Equation − give a set of data and explain how to use the method of finite differences to determine if it is best modeled with an exponential equation, and explain how to find the regression equation.
6.5 Exponential Function Base e – define e, graph y = ex and then locate 3 ordered pairs, and give the domain, range, asymptote, intercepts.
6.6 Compound Interest Formula – define continuous and finite, explain and give an example of each symbol
6.7 Inverse Functions – write the definition, explain one-to-one correspondence, give an example to show the test to determine when two functions are inverses, graph the inverse of a function, find the line of symmetry and the domain and range, explain how to find inverse analytically and how to draw an inverse on the calculator.
6.8 Logarithm – write the definition and explain the symbols used, define common logs, characteristic, and mantissa, and list the properties of logarithms.
6.9 Laws of Logs and Change of Base Formula – list the laws and the change of base formula and give examples of each.
6.10 Solving Logarithmic Equations – explain rules for solving equations, identify the domain for an equation, find log28 and log25125, and solve each of these equations for x: logx 9 = 2, log4 x = 2, log4(x – 3)+log4 x=1).
6.11 Logarithmic Function Base a – write the definition, graph y = logax with a < 1 and a > 1 and locate three ordered pairs, identify the domain, range, intercepts, and asymptotes, and find the domain of y = log(x2 + 7x + 10).
6.12 Natural Logarithm Function – write the definition and give the approximate value of e, graph y = ln x and give the domain, range, and asymptote, and locate three ordered pairs, solve ln x = 2 for x.
6.13 Exponential Growth and Decay − define half-life and solve an example problem, give and solve an example of population growth using A(t) = Pert.

2012-13 and 2013-14 Transitional Comprehensive Curriculum
Algebra IIUnit 6Exponential and Logarithmic Functions 6-5
Activity 1: Fractional Exponents (GLEs: 1, 2; CCSSs: RST.11-12.3, RST.11-12.4) Materials List: paper, pencil, graphing calculator, Math Log Bellringer BLM This activity has not changed because it already incorporates these CCSSs. In this activity, students will review properties of numbers with integral exponents first discussed in Unit 3 and extend them to simplify and evaluate expressions with fractional exponents. Math Log Bellringer:
Simplify the following. (1) a2a3
(2) 7
3
bb
(3) (c3)4 (4) 2x5 + 3x5 (5) (2x)3 (6) (a + b)2 (7) x0 (8) 2–1
Solutions: (1) a5 , (2) b4 (3) c12, (4) 5x5,(5) 8x3, (6) a2 + 2ab + b2, (7) 1, (8) ½
Activity: • Overview of the Math Log Bellringers: As in previous units, each in-class activity in Unit 6 is started with an activity called a
Math Log Bellringer that either reviews past concepts to check for understanding (reflective thinking about what was learned in previous classes or previous courses) or sets the stage for an upcoming concept (predictive thinking for that day’s lesson).
A math log is a form of a learning log (view literacy strategy descriptions) that students keep in order to record ideas, questions, reactions, and new understandings. Documenting ideas in a log about how content’s being studied forces students to “put into words” what they know or do not know. This process offers a reflection of understanding that can lead to further study and alternative learning paths. It combines writing and reading with content learning. The Math Log Bellringers will include mathematics done symbolically, graphically, and verbally.
Since Bellringers are relatively short, Blackline Masters have not been created for each of them. Write them on the board before students enter class, paste them into an enlarged Word document or PowerPoint slide, and project using a TV or digital projector, or print and display using a document or overhead projector. A sample enlarged Math Log Bellringer Word document has been included in the Blackline Masters. This sample is the Math Log Bellringer for this activity.
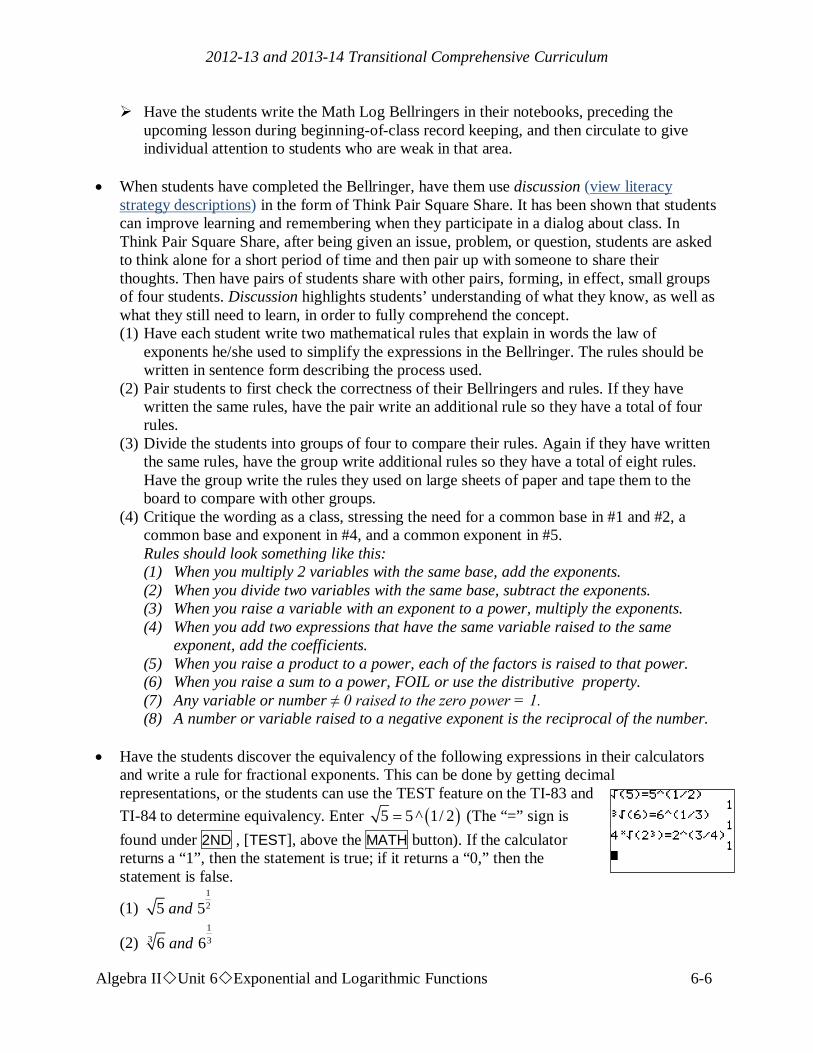
2012-13 and 2013-14 Transitional Comprehensive Curriculum
Algebra IIUnit 6Exponential and Logarithmic Functions 6-6
Have the students write the Math Log Bellringers in their notebooks, preceding the upcoming lesson during beginning-of-class record keeping, and then circulate to give individual attention to students who are weak in that area.
• When students have completed the Bellringer, have them use discussion (view literacy
strategy descriptions) in the form of Think Pair Square Share. It has been shown that students can improve learning and remembering when they participate in a dialog about class. In Think Pair Square Share, after being given an issue, problem, or question, students are asked to think alone for a short period of time and then pair up with someone to share their thoughts. Then have pairs of students share with other pairs, forming, in effect, small groups of four students. Discussion highlights students’ understanding of what they know, as well as what they still need to learn, in order to fully comprehend the concept. (1) Have each student write two mathematical rules that explain in words the law of
exponents he/she used to simplify the expressions in the Bellringer. The rules should be written in sentence form describing the process used.
(2) Pair students to first check the correctness of their Bellringers and rules. If they have written the same rules, have the pair write an additional rule so they have a total of four rules.
(3) Divide the students into groups of four to compare their rules. Again if they have written the same rules, have the group write additional rules so they have a total of eight rules. Have the group write the rules they used on large sheets of paper and tape them to the board to compare with other groups.
(4) Critique the wording as a class, stressing the need for a common base in #1 and #2, a common base and exponent in #4, and a common exponent in #5. Rules should look something like this: (1) When you multiply 2 variables with the same base, add the exponents. (2) When you divide two variables with the same base, subtract the exponents. (3) When you raise a variable with an exponent to a power, multiply the exponents. (4) When you add two expressions that have the same variable raised to the same
exponent, add the coefficients. (5) When you raise a product to a power, each of the factors is raised to that power. (6) When you raise a sum to a power, FOIL or use the distributive property. (7) Any variable or number ≠ 0 raised to the zero power = 1. (8) A number or variable raised to a negative exponent is the reciprocal of the number.
• Have the students discover the equivalency of the following expressions in their calculators
and write a rule for fractional exponents. This can be done by getting decimal representations, or the students can use the TEST feature on the TI-83 and TI-84 to determine equivalency. Enter ( )5 5 ^ 1/ 2= (The “=” sign is found under 2ND , [TEST], above the MATH button). If the calculator returns a “1”, then the statement is true; if it returns a “0,” then the statement is false.
(1) 125 5and
(2) 1
3 36 6and

2012-13 and 2013-14 Transitional Comprehensive Curriculum
Algebra IIUnit 6Exponential and Logarithmic Functions 6-7
(3) 3
34 42 2and Solutions: All are equivalent. The rule for fractional exponents is if n a is a real number, then
( )b bbc cca a a= =
• Have students practice changing radicals to fractional exponents and vice versa using the
laws of exponents by simplifying complex radicals. Have students simplify problems such as the following without calculators and use the properties in the Bellringers to simplify similar problems with fractional exponents:
(1) 121
100
(2) 138
(3) 15625
(4) 34
Solutions: (1) 110
, (2) 2, (3) 5, (4) 8
• Assign additional problems from the math textbook. • Critical Thinking Writing Assessment: (See Activity-Specific Assessments at end of unit.) Activity 2: Graphs of Exponential Function (GLEs: 2, 4, 6, 7, 19, 25, 27, 28, 29; CCSS:
RST.11-12.3) Materials List: paper, pencil, graphing calculator, Graphing Exponential Functions Discovery Worksheet BLM This activity has not changed because it already incorporates this CCSS. In this activity, the students will discover the graph of an exponential function and its domain, range, intercepts, shifts, and effects of differing bases, and will use the graph to explain irrational exponents. Math Log Bellringer:
(1) Graph y = x2 and y = 2x on your graphing calculator individually with a window of x: [−10, 10] and y: [−10, 10] and describe the similarities and differences.
(2) Graph them on the same screen with a window of x: [−10, 10] and y: [−10, 100] and describe any additional differences.
Solutions:

2012-13 and 2013-14 Transitional Comprehensive Curriculum
Algebra IIUnit 6Exponential and Logarithmic Functions 6-8
(1) Both have the same domain, all reals, but the range of y = x2 is y > 0 and the range of y = 2x is y > 0. There are different y−intercepts, (0, 0) and (0, 1). The end- behavior is the same as x approaches ∞; but as x approaches -∞, the end-behavior of y = x2 approaches ∞ and the end- behavior of y = 2x approaches 0.
(2) y = 2x grows faster than y = x2.
Activity: • Discuss the Bellringer in terms of how fast the functions increase. Show how fast exponential
functions increase by the following demonstration: Place 1 penny on the first square of a checker board, double it and place two pennies on the second square, 4 on the next, 8 on the next, and so forth until the piles are extremely high. Have the students determine how many pennies would be on the last square, tracing to that number on their calculators. Measure smaller piles to determine the height of the last pile and compare it to the distance to the sun, which is 93,000,000 miles.
• Graphing Exponential Functions Discovery Worksheet BLM: On this worksheet, the students will use their graphing calculators to graph the
exponential function f(x) = bx with various changes in the constants to determine how these changes affect the graph.
The students can graph each equation individually or use the Transformation APP on the TI 83 and TI 84 as they did in Activity 7 in Unit 5. To use the Transformation APPS:
• Turn on the application by pressing APPS , Transfrm ENTER ENTER
• Enter the equation y1 = Bx • Set the window by pressing WINDOW and cursor to
SETTINGS, set where B will start, in this example B = 2, and adjust the step for B to Step = 1.
• GRAPH and use the & % cursor to change the values of B.
• When finished, uninstall the transformation APP by
pressing APPS , Transfrm, 1:Uninstall • For more information see the TI 83/TI84 Transformation
App Guidebook at http://education.ti.com/downloads/guidebooks/eng/transgraph-eng. Distribute Graphing Exponential Functions Discovery Worksheet BLM. Graph the first
equation together having the students locate the y-intercept and trace to high and low x

2012-13 and 2013-14 Transitional Comprehensive Curriculum
Algebra IIUnit 6Exponential and Logarithmic Functions 6-9
values to determine end-behavior and that there is a horizontal asymptote at y = 0. (This is not obvious on the graph.) Have them sketch the graph and dot the horizontal asymptote on the x−axis.
Arrange the students in pairs to complete the graphs and answer the questions. Circulate to make sure they are graphing correctly.
When the students finish the worksheet, go over the answers to the questions making sure they have all come to the correct conclusions.
• Examine the graph of f(x) = 2x in #1 and discuss its continuity by using the trace function on
the calculator to determine ( ) ( )3 , 3 , 22
f f and f
. Because it is a continuous function, a
number can be raised to any real exponent, rational and irrational, and have a value. Discuss irrational exponents with the students and have them apply the Laws of Exponents to simplify the following expressions: (1) 3 6 35 5⋅
(2) 5 2
2
66
(3) 82
π
π
(4) 5 3 5
12 54
2 4
16 8−
Solutions: (1) 7 35 , (2) 4 26 , (3) 4π , (4) 1 52 +
• Assign additional graphing problems and irrational exponent problems from the math
textbook.
Activity 3: Regression Equation for an Exponential Function (GLEs: 2, 4, 6, 7, 10, 19, 22,
27, 28, 29; CCSSs: RST.11-12.3, RST.11-12.4) Materials List: paper, pencil, graphing calculator, Exponential Regression Equations BLM This activity has not changed because it already incorporates these CCSSs. In this activity, the students will enter data into their calculators and change all the parameters for an exponential equation of the form, y = Abx–C + D, to find the best regression equation. They then will use the equation to interpolate and extrapolate. Math Log Bellringer:
Use what you know about shifts and translations to graph the following without a calculator locating asymptotes and y-intercepts. (1) f(x) = 3x (2) f(x) = –3x

2012-13 and 2013-14 Transitional Comprehensive Curriculum
Algebra IIUnit 6Exponential and Logarithmic Functions 6-10
(3) f(x) = 3–x (4) Describe the translations in #2 and #3 (5) f(x) = 3x – 4 (6) f(x) = 3x – 4 (7) Describe the shifts in #5 and #6 (8) f(x) = 5(3x)
Solutions:
(1) horizontal asymptote at y = 0,
(2) horizontal asymptote at y = 0,
(3) horizontal asymptote at y = 0, (4) #2 rotates the parent function through space around the x-axis and #3 rotates
it around the y-axis
(5) 10,81
, horizontal asymptote at y = 0
(6) horizontal asymptote at y = −4 (7) #5 shifted the parent function to the right 4 and #6 shifted it down 4
(8) horizontal asymptote at y = 0 Activity: • Use the Bellringer to check for understanding of translations.

2012-13 and 2013-14 Transitional Comprehensive Curriculum
Algebra IIUnit 6Exponential and Logarithmic Functions 6-11
• Ignite interest in the upcoming activity by using lesson impressions (view literacy strategy descriptions). Lesson impressions create situational interest in the content to be covered by capitalizing on students’ curiosity. By asking students to form a written impression of the topic to be discussed, they become eager to discover how closely their impression text matches the actual content. This strategy is especially helpful to struggling and reluctant learners as it heightens motivation and helps students focus on important content. In this strategy, present a list of ideal words to students and tell students they are to use the words to make a guess as to what will be covered in class that day. Students are then encouraged to write a short descriptive passage, a story, or an essay using the impression words.. Write the following impression words on the board: exponential function, data, scatter
plot, regression equation, model, best fit equation, interpolate, extrapolate, method of finite differences, point of intersection.
Tell students to write a short paragraph that predicts today’s lesson activity and incorporates all the impression words.
Have students share their paragraphs with their classmates. • Exponential Regression Equations BLM: In the first section on this Exponential Regression Equations BLM, the students will enter
real-world data into their calculators to create a scatter plot, find an exponential regression (prediction) equation, and use the model to interpolate and extrapolate points to answer real-world questions. In the second section, they will be using the method of finite differences to determine which data is exponential and to find its regression equation.
Distribute the Exponential Regression Equations BLM and have students work in pairs. If necessary, review with students the steps for making a scatter plot. (To enter data on a
TI-84 calculator: STAT, 1:Edit, enter data into L1 and L2 . To set up the plot of the data: 2nd , [STAT PLOT] (above Y= ), 1:PLOT1, ENTER, On, Type: Scatter Plot, Xlist: L1, Ylist: L2, Mark (any). To graph the scatter plot: ZOOM , 9: ZoomStat).
When all the students have found an equation in Section 1, Real-World Exponential Data, write all the equations on the board and have the students determine which equation is the best fit.
Have students use that best fit equation to answer the interpolation and extrapolation questions in #3.
Discuss how they determined the answer to #4. Since the calculator cannot trace to a dependent variable, the best method is to graph y = 25 and find the point of intersection. Review this process with the students. On the TI−84, use 2nd [CALC] (above TRACE), 5: intersect, enter a lower and upper bound on either side of the point of intersection and ENTER.
Review the Method of Finite Differences from Unit 2, Activity 8, and have students apply it to determine which data in Section 2 is exponential then to find a regression equation for each set of data.
When all students have completed the BLM, discuss their answers. Have students revisit their lesson impressions and choose the one that best predicted the
lesson content.

2012-13 and 2013-14 Transitional Comprehensive Curriculum
Algebra IIUnit 6Exponential and Logarithmic Functions 6-12
Activity 4: Exponential Data Research (GLEs: 4, 6, 7, 10, 19, 22, 24, 27, 29; CCSS: WHST.11-12.7)
Materials List: paper, pencil, graphing calculator (or computer), Exponential Data Research Project BLM This activity has not changed because it already incorporates this CCSS. This is an out-of-class activity in which the students will find data that is best modeled by an exponential curve. Activity: • Exponential Data Research Project: Distribute the Exponential Data Research Project BLM and discuss the directions with
the students. State that this is an individual project and each person must have different data, so they
should be the first to print out the data and claim the topic. Possible topics include: US Bureau of Statistics, Census, Stocks, Disease, Bacteria Growth, Investments, Land Value, Animal Population, number of stamps produced each year.
Give the students approximately one week to complete the project. When the students hand in their projects have each student present his/her findings to the
class.
Activity 5: Solving Exponential Equations with Common Bases (GLEs: 2, 4, 10) Materials List: paper, pencil, graphing calculator In this activity, students will use the properties of exponents to solve exponential equations with similar bases. Math Log Bellringer:
Graph y = 2x+1 and y = 82x+1 on your graphing calculator. Zoom in and find the point of intersection. Define point of intersection.
Solution: A point of intersection is an ordered pair that is a solution for both equations.
Activity: • Define exponential equation as any equation in which a variable appears in the exponent and
have students discuss a method for solving the Bellringer analytically. Students have a difficult time understanding that a point of intersection is a shared x and
y-value; therefore, to solve for a point of intersection analytically, students should solve

2012-13 and 2013-14 Transitional Comprehensive Curriculum
Algebra IIUnit 6Exponential and Logarithmic Functions 6-13
the set of equations simultaneously, meaning set y = 2x+1 and y = 82x+1 equal to each other, 2x+1 = 82x+1 and solve for x.
They should develop the property, necessitating getting the same base and setting the exponents equal to each other.
Solution: 2x+1 = 82x+1 2x+1 = (23)2x+1 2x+1 = 26x+3
∴ x + 1 = 6x + 3 ⇒ 25
x = −
• Use the property above to solve the following equations.
(1) 3x+2 = 92x (2) 3–x = 81
(3) 13 27
2 8
x x+ =
(4) 8x = 4
(5) 1 8127
x =
Solutions: (1) 23
x = , (2) x = –4, (3) x = ½, (4) 23
x = , (5) 43
x = −
• Assign additional problems from the math textbook. • Critical Thinking Writing Assessment: (See Activity-Specific Assessments at end of unit.) Activity 6: Inverse Functions and Logarithmic Functions (GLEs: 2, 3, 4, 25, 27; CCSSs:
F-BF.4a, RST.11-12.4) Materials List: paper, pencil, graph paper, graphing calculator This activity has not changed because it already incorporates these CCSSs. In this activity, students will review the concept of inverse functions in order to develop the logarithmic function which is the inverse of an exponential function. Math Log Bellringer:
(1) Find the domain and range of 2( )1
f xx
=+
(2) Find the inverse f–1(x) of 2( )1
f xx
=+
and state its domain and range.
(3) Discuss what you remember about inverse functions. Solutions:

2012-13 and 2013-14 Transitional Comprehensive Curriculum
Algebra IIUnit 6Exponential and Logarithmic Functions 6-14
(1) D: x ≠ −1, R: y ≠ 0
(2) ( )1 2 xf xx
− −= D: x ≠ 0, R: y ≠ −1
(3) The students should generate these statements: o Definition: f−1(x) is an inverse function of f(x) if and only if
( )( ) ( )( )1 1f f x f f x x− −= = . o You find the inverse of a function by swapping the x and y and solving for y. o The graphs of a function and its inverse are symmetric over the line y = x. o You swap the domains and ranges. o In all ordered pairs, the abscissa and ordinate are swapped. o If an inverse relation is going to be an inverse function, then the original
function must have a one-to-one correspondence. o You can tell if an inverse relation is going to be an inverse function from
the graph if the original function passes both the vertical and horizontal line test.
Activity: • Review the concepts of an inverse function from Unit 1, Activity 12, and have the students
practice finding an inverse function on the following problem: (1) Analytically find the inverse of f(x) = x2 + 3 on the restricted domain x > 0 (2) Prove they are inverses using the definition ( )( ) ( )( )1 1f f x f f x x− −= = (3) What is the domain and range of f(x) and f−1(x)? (4) Graph both by hand on the same graph labeling x- and y-intercepts. (5) Graph the line y = x on the same graph and locate one pair of points that are symmetric
across the line y = x. (6) Why is the domain of f(x) restricted?
Solution: (1) ( )1 3f x x− = −
(2) ( )2 23 3 3 3x x x− + = + − = ( )2 0x x if x= ≥
(3) f(x): domain x > 0, range y > 3, f−1(x): domain x > 3, range y > 0
(4) y− intercept of f(x) is (0, 3), x−intercept of f−1(x) is (3, 0)
(5) Ordered pairs may vary. f(2) = 7, f−1(7) = 2 (6) f(x) would not have a one−to−one correspondence and the inverse would not
be a function.

2012-13 and 2013-14 Transitional Comprehensive Curriculum
Algebra IIUnit 6Exponential and Logarithmic Functions 6-15
• Give the students graph paper and have them discover the inverse of the exponential function in the following manner: Graph f(x) = 2x by hand dotting the horizontal asymptote
and label the ordered pairs at x = −2, −1, 0, 1, 2, 3.
Is this function a one-to-one correspondence? (Solution: yes, therefore an inverse function must exist) Graph y = x on the same graph and draw the inverse
function by plotting ordered pairs of the inverse and dotting the vertical asymptote. Compare the graph of the inverse with the graph of the original function discussing domains, ranges, increasing and decreasing, intercepts, and asymptotes. Solution: o The domain of the original function is all reals and the
range is y > 0, but the domain of the inverse is x > 0 and the range is all reals.
o The inverse is increasing just like the original function. o The y-intercept of the original function is 1, but the x-
intercept of the inverse is 1. o The asymptote of the original function is y=0. The asymptote of the inverse is x=0.
On the calculator graph y1 = 2x and y2 = x. Use the calculator
function, ZOOM, 5:ZSquare. Draw the graph of the inverse on graphing calculator (2nd , [DRAW], (above PRGM ), 8: DrawInv, VARS , Y−VARS, 1:Function, 1:Y1).
• Have students try to find the inverse of y = 2x analytically by swapping x and y and
attempting to isolate y. Use this discussion to define logarithm and its relationship to exponents: logba = c if and
only if bc = a Use the definition to rewrite log28 = 3 as an exponential equation. (Solution: 23 = 8) Find log525 by thinking exponentially: “5 raised to what power = 25?”
(Solution: 52 = 25 therefore log525 = 2) Define common logarithm as logarithm
with base 10 in which the base is understood: f(x) = log x. On the calculator, have the students ZOOM Square and graph y1 = 10x, y2 = log x, y3 = x to see that y1 and y2 are symmetric across the line y = x.

2012-13 and 2013-14 Transitional Comprehensive Curriculum
Algebra IIUnit 6Exponential and Logarithmic Functions 6-16
Have the students find log 100 without a calculator (Solution: log 100 = 2 because 102 = 100) and use the definition of logarithm to evaluate the following logarithmic expressions. Have students write “because” and the exponential equivalent after each problem: (1) log5125 (2) log 0.001 (3) 1
4
log 16
(5) log381 (6) 12
3log 3
Solutions: (1) log5125 = 3 because 53 =125 (2) log .001 = −3 because 10−3 = .001
(3) 2
14
1log 16 2 164
because−
= − =
(4) log381=4 because 34 = 81
(5) ( )24124
12 1223
log 3 24 3 3 3because
= = =
• Applying the definition of inverses ( )( ) ( )( )1 1f f x f f x x− −= = to logs implies
log logb x xbb b x= = . Use the definition of inverse to simplify the following expressions:
(1) 3log 83
(2) 5log 25
(3) 173log 3
(4) 1315log 15
Solutions: (1) 8, (2) 2 , (3) 17, (4) 13
• Assign additional problems from the math textbook to practice these skills. • Critical Thinking Writing Assessment: (See Activity-Specific Assessments at end of unit.) Activity 7: Graphing Logarithmic Functions (GLEs: 3, 4, 6, 7, 10, 19, 25, 27, 28) Materials List: paper, pencil, graphing calculator, Graphing Logarithmic Functions Discovery Worksheet BLM In this activity, students will learn how to graph logarithmic functions, determine the properties of logarithmic functions, and apply shifts and translations.

2012-13 and 2013-14 Transitional Comprehensive Curriculum
Algebra IIUnit 6Exponential and Logarithmic Functions 6-17
Math Log Bellringer: Evaluate the following: If there is no solution, discuss why. (1) log 100000 = (2) log232 = (3) 1
9
log 243 =
(4) ( )2log 4− = Solutions: (1) 5 , (2) 5, (3) 5
2−
(4) no solution, 2 raised to any power will be a positive number. Activity: • Use the Bellringer to check for understanding of evaluating logarithms in different bases. • Graphing Logarithmic Functions: In the Graphing Logarithmic Functions Discovery Worksheet, the students will first
graph f(x) = log x by hand by plotting points and discuss its local and global characteristics, then use their knowledge of shifts to graph additional log functions by hand.
Distribute the Graphing Logarithmic Functions Discovery Worksheet BLM. Have students work in pairs to complete the first section of the worksheet. This is a noncalculator worksheet, so students can get a better understanding of the logarithm function. Circulate to make sure they are plotting the points correctly. When they have finished the first section, review the answers to the questions.
Have students complete the worksheet and review answers to the questions. When they have finished, have students individually graph the following by hand to
check for understanding. (1) Graph f(x) = log2 x plotting and labeling five ordered pairs. (2) Graph f(x) = log2 (x − 3) + 4
Solutions: Ordered pairs: (½, −1), (1, 0), (2, 1), (4, 2), (8, 3) (1)
(2)

2012-13 and 2013-14 Transitional Comprehensive Curriculum
Algebra IIUnit 6Exponential and Logarithmic Functions 6-18
Activity 8: Laws of Logarithms and Solving Logarithmic Equations (GLEs: 2, 3, 10;
CCSS: WHST.11-12.7) Materials List: paper, pencil, graphing calculator This activity has not changed because it already incorporates this CCSS. In this activity, the students will express logarithms in expanded form and as a single log in order to solve logarithmic equations. Math Log Bellringer:
Solve for x. If there is no solution, discuss why. (1) log2x = 3 (2) log525 = x (3) logx16 = 4 (4) log3(log273)=log4x (5) logx (−36) = −2
Solutions: (1) x = 8 (2) x = 2 (3) x = 2 (4) x = ¼ (5) no solution. Bases must be positive so a positive number raised to any power
will be positive. Activity: • Use the Bellringer to discuss how to solve different types of logarithmic equations by
changing them into exponential equations. • Give students additional practice problems from the math textbook. • Have the students discover the Laws of Logarithms using the following modified directed
learning−thinking activity (DL−TA) (view literacy strategy descriptions). DL-TA is an instructional approach that invites students to make predictions and then to check their predictions during and after the reading. DL-TA provides a frame for self-monitoring because of the pauses throughout the reading to ask students questions. This is a modified a DL−TA because the students will be calculating not reading. In DL−TA, first activate and build background knowledge for the content to be read. This
often takes the form of a discussion eliciting information the students may already have, including personal experience, prior to reading. Ask the students to reiterate the first three Laws of Exponents developed in Activity 1 and write the words for the Law on the board.
Solutions: (1) When you multiply two variables with the same base, add exponents. (2) When you divide two variables with the same base, subtract the exponents.

2012-13 and 2013-14 Transitional Comprehensive Curriculum
Algebra IIUnit 6Exponential and Logarithmic Functions 6-19
(3) When you raise a variable with an exponent to a power, multiply the exponents.
Next in DL−TA, students are encouraged to make predictions about the text content. Ask the students to list what they think will happen with logarithms and list these on the board.
Then in DL−TA, guide students through a section of text, stopping at predetermined places to ask students to check and revise their predictions. This is a crucial step in DL-TA instruction. When a stopping point is reached, ask students to reread the predictions they wrote and change them, if necessary, in light of new evidence that has influenced their thinking. Have the students find the following values in their calculators rounding three places behind the decimal. Once they have finished, have them reread their predictions to see if they want to change one.
(1) log 4 + log 8 (2) log 32, (3) log ½ + log 100, (4) log 50 Solutions: (1 & 2) 1.505, (3 & 4) 1.699 Continue this DL-TA cycle with the next set of problems stopping after #8 and #12 to
rewrite predictions. (5) log 16 − log 2 (6) log 8 (7) log 4 – log 8 (8) log 0.5 Solutions: (5 & 6) 0.903, (7& 8) −0.301 (9) 2log 4 (10) log 16 (11) ½ log 9 (12) log 3 Solutions: (9 & 10) 1.204, (11 & 12) 0 .477 When the students are finished, their revised predictions should be the Laws of
Logarithms. Write the Laws symbolically and verbally. Stress the need for the same base and relate the Laws of Logs back to the Laws of Exponents. (1) logb a + logb c = logb ac. Adding two logs with the same base is equivalent to taking
the log of the product − the inverse operation of the first Law of Exponents.
(2) log log logb b baa cc
− = . Multiplying two logs with the same base is equivalent to
taking the log of the quotient − the inverse operation of the second Law of Exponents. (3) a logb c = logb ca. Multiplying a log by a constant is equivalent to taking the log of the
number raised to that exponent − the inverse operation of the third Law of Exponents. Check for understanding by asking the students to solve the following problems without a
calculator: (1) log 4 + log 25 (2) log3 24 − log38 (3) ½ log2 64
Solutions: (1) 10, (2) 1, (3) 3 • Give guided practice problems solving exponential equations by applying the Laws of Logs.
Remind students that the domain of logarithms is x > 0; therefore, all answers should satisfy this domain. (1) log x + log (x − 3) = 1 (2) log4 x − log4 (x − 1) = ½ (3) log5 (x − 2) + log5 (x − 1) = log5 (4x − 8)
Solutions: (1) x = 5 is the solution because x = −2 is not in the domain

2012-13 and 2013-14 Transitional Comprehensive Curriculum
Algebra IIUnit 6Exponential and Logarithmic Functions 6-20
(2) x = 2 (3) x = 5 is the solution because x = 2 is not in the domain of log5 (x − 2)
• Assign additional problems from the math textbook. • Critical Thinking Writing Assessment: (See Activity-Specific Assessments at end of unit.) Activity 9: Solving Exponential Equations with Unlike Bases (GLEs: 2, 3, 10; CCSS: F-LE.4) Materials List: paper, pencil, graphing calculator This activity has not changed because it already incorporates this CCSS. Students will use logarithms to solve exponential equations of unlike bases and will develop the change of base formula for logarithms. Math Log Bellringer:
Solve for x: If it cannot be solved by hand, discuss why. (1) 32x = 27 x+ 1 by hand. (2) 23x = 64x
Solution: (1) x = –3 (2) This problem cannot be solved by hand because 2 and 6 cannot be converted
to the same base. Activity: • Use the Bellringer to review solving exponential equations which have the same base. • Have students find log10 62 on the calculator, then change log10 62 = x to the exponential
equation 10x = 62, noting that this is an exponential equation with different bases, 10 and 6. Develop the process for solving exponential equations with different bases using logarithms.
(1) When x is in the exponent, take the log of both sides using base 10 because that base is on the calculator.
(2) Apply the 3rd Law of Logarithms to bring the exponent down to the coefficient. (3) Isolate x. Guided Practice:
4(x+3) = 7 log 4(x + 3) = log 7 (x + 3) log 4 = log 7
log 73log 4
x + =
log 7 3log 4
x = −

2012-13 and 2013-14 Transitional Comprehensive Curriculum
Algebra IIUnit 6Exponential and Logarithmic Functions 6-21
• Use the calculator to find the point of intersection of y = 4x+3 and y = 7.
Discuss this alternate process for solving the equation 4x+3 = 7. Compare the decimal answer to the decimal equivalent of the exact answer above, and discuss the difference in an exact answer and
decimal approximation. (Solution: log 7 3 1.596log 4
x = − = − )
• Application:
Have students work in pairs to solve the following application problem. When they finish the problem, have several groups describe the steps they used to solve the problem and what properties they used.
A biologist wants to determine the time t in hours needed for a given culture to grow to 567 bacteria. If the number N of bacteria in the culture is given by the formula
( )7 2tN = , find t. Discuss the steps used to solve this problem and the properties you used. Find both the exact answer and decimal approximation rounded 3 places.
Solution: Replace N with 567 to get the equation ( )567 7 2t= . Divide both sides
by 7 to get ( )81 2t= . Take log base 2 of both sides to solve for t.
2 81 6 340log .= hours.
• Have students determine log2 8 by hand and 10
10
log 8log 2
on the calculator, then formulate a
formula for changing the base: logloglog
bc
b
aac
= . Verify the formula by solving the equation
log5 6 = x in the following manner: log5 6 = x 5x = 6 log 5x = log 6
x log 5 = log 6
(Teacher Note: Even though the TI-84 calculator with OS 2.53 can evaluate logs in different bases, the change of base formula is necessary for calculus.)
• Assign additional problems from the math textbook solving exponential equations and
changing base of logarithms.
10
10
log 6log 5
x =

2012-13 and 2013-14 Transitional Comprehensive Curriculum
Algebra IIUnit 6Exponential and Logarithmic Functions 6-22
Activity 10: Exponential Growth and Decay (GLEs: 2, 3, 4, 7, 17, 19, 20, 24, 29; CCSSs: F-LE.4, RST.11-12.3, RST.11-12.4)
Materials List: paper, pencil, graphing calculator, Skittles (50 per group), Exponential Growth and Decay Lab BLM, 1 cup per group This activity has not changed because it already incorporates these CCSSs. Students will model exponential growth and apply logarithms to solve the problems. Math Log Bellringer:
A millionaire philanthropist walks into class and offers to either pay you one cent on the first day, two cents on the second day, and double your salary every day thereafter for thirty days or to pay you one lump sum of exactly one million dollars. Write the exponential equation that models the daily pay and determine which choice you will take.
Solution: y = 2x − 1 if x starts with 1 and ends with 30, y = 2x if x starts with 0 and ends with 29. If you took the first option, after 30 days you would have $10,737,418.23.
Activity: • Have students explain the process they used to generate the pay for each of the thirty days to
find the answer. Discuss the following calculator skills. • Most students will have written down the 30 days of pay and added them up. Show the
different calculator methods for generating and adding a list of numbers. (1) Iteration Method: On the home screen type 1 ENTER. Then type X 2
ENTER . Continue to press ENTER and count thirty days recording the numbers and adding them up.
(2) List Method: STAT , EDIT. Put the numbers 1 through 30 in L1. In L2, move the cursor up to highlight L2 and enter 2^(L1 − 1) ENTER and L2 will fill with the daily salary. On the home screen, type 2nd STAT (LIST), MATH, 5:sum (L2) and it will add all the numbers in List 2 and give the answer in cents.
(3) Summing a Sequence: On the home screen, type 2ND , [LIST] (above STAT), MATH, 5:sum(, 2nd [LIST] (above STAT), OPS, 5:seq(, 2^(x−1), x, 1, 30)
• Exponential Growth and Decay Lab: In this lab, the students will simulate exponential growth and decay using Skittles® (or M
& M’s®) to find a regression equation and use that equation to predict the future. Review, if necessary, how to enter data into a calculator and enter a regression equation.
(steps in the Activity 3 Exponential Regression Equations BLM) Introduce the correlation coefficient. The correlation coefficient, r2, is the
measure of the fraction of total variation in the values of y. This concept will be covered in depth in future math courses, so it is sufficient to refer to r2 simply as the percentage of points that are clustered in a small band about the regression equation. Therefore, a higher percentage would be a

2012-13 and 2013-14 Transitional Comprehensive Curriculum
Algebra IIUnit 6Exponential and Logarithmic Functions 6-23
better fit regression equation. It is interesting to show the students the formula that determines r, but the calculator will automatically calculate this value. The feature must be turned on. 2ND , [CATALOG], (above 0. ), DiagnosticOn, ENTER. When the regression equation is created, it will display the correlation coefficient.
( ) ( )( )
( ) ( ) ( ) ( )2 22 2
n xy x yr
n x x n y y
−=
− −
∑ ∑ ∑∑ ∑ ∑ ∑
Divide the students in groups of four. Give each group a cup with approximately 50 candies in each cup and the Exponential Growth and Decay Lab BLM.
As the groups finish the Exponential Growth section, circulate and have each group explain the method they used to solve the related questions.
When the groups have finished both sets of data, combine the statistics and have half of the groups find a regression equation and correlation coefficient for the whole set of growth data. The other groups will find the regression equation and correlation coefficient for the decay data. Discuss the differences in a sample (the 50 candies each group has) and a population (the entire bag of candies), then discuss the accuracy of predictions based on the size of the sample.
Activity 11: Compound Interest and Half-Life Applications (GLEs: 2, 3, 10, 19, 24, 29;
CCSSs: F-LE.4, RST.11-12.4) Materials List: paper, pencil, graphing calculator This activity has not changed because it already incorporates these CCSSs. Students will develop the compound interest and half-life formulas, then use them to solve application problems. Math Log Bellringer:
If you have $2000 dollars and you earn 6% interest in one year, how much money will you have at the end of a year? Explain the process you used.
Solution: $2120. Students will have different discussions of how they came up with the answer.
Activity: • Use the Bellringer to review the concept of multiplying by 1.06 to get the final amount in a
one-step process. • Discuss the meaning of compounding interest semiannually and quarterly. Draw an empty
chart similar to the one below on the board or visual presenter. Guide students through its completion to develop a process to find the value of an account after 2 years. o $2000 is invested at 6% APR (annual percentage rate) compounded semiannually (thus
3% each 6 months = 2 times per year). What is the account value after t years? o While filling in the chart, record on the board the questions the students ask such as:

2012-13 and 2013-14 Transitional Comprehensive Curriculum
Algebra IIUnit 6Exponential and Logarithmic Functions 6-24
1. Why do you divide .06 by 2? 2. Why do you have an exponent of 2t? 3. How did you come up with the pattern?
Time years
Do the Math Developing the Formula Account Value
0 $2000 $2000 $2000.00 ½ $2000(1.03) $2000(1+.06/2) $2060.00 1 $2060(1.03) $2000(1+.06/2)(1+.06/2) $2121.80
1½ $2121.80(1.03) $2000(1+.06/2)(1+.06/2)(1+.06/2) $2185.454 2 $2185.454(1.03) $2000(1+.06/2)(1+.06/2)(1+.06/2)(1+.06/2) $2251.01762 t $2000(1+.06/2)2t
• Use the pattern to derive the formula for finding compound interest: ( ) (1 )ntrA t Pn
= + .
A(t) represents the value of the account in t years, P − the principal invested, r − the APR or annual percentage rate, t − the time in years, n − the number of times compounded in a year.
• Have students test the formula ( ) 2.062000(1 )2
tA t = + by finding A(10),
then using the iteration feature of the calculator to find the value after 10 years. Solution:$3612.22
• Have the students use a modified form of questioning the content (QtC)
(view literacy strategy descriptions) to work additional problems. The goals of QtC are to construct meaning of text, to help students go beyond the words
on the page, and to relate outside experiences to the texts being read. Participate in QtC as a facilitator, guide, initiator, and responder. Students need to be taught that they can, and should, ask questions of authors as they read.
In this modified form of QtC, the student is the author. Assign different rows of students to do the calculations for investing $2000 with APR of 6% for ten years if compounded (1) yearly, (2) quarterly, (3) monthly, and (4) daily. Then have the students swap problems with other students and ask the questions developed earlier about compounded interest. Once each student is sure that his/her partner has answered the questions and solved the problem correctly, ask for volunteers to work the problem on the board.
Solutions:
(1) yearly: ( ) 1(10).062000(1 ) $3581.701
A t = + =
(2) quarterly: ( ) 4(10).062000(1 ) $3628.044
A t = + =

2012-13 and 2013-14 Transitional Comprehensive Curriculum
Algebra IIUnit 6Exponential and Logarithmic Functions 6-25
(3) monthly: ( ) 12(10).062000(1 ) $3638.7912
A t = + =
(4) daily: ( ) 365(10).062000(1 ) $3644.06365
A t = + =
Have students solve the following problem for their situations: How long will it take to double your money in these situations? Again swap problems and once again facilitate the QtC process.
Solutions:
(1) yearly: 1( ).064000 2000(1 )1
t= + ⇒ t =11.896 years
(2) quarterly: 4( ).06$4000 2000(1 )4
t= + ⇒ t =11.639 years
(3) monthly: 12( ).064000 2000(1 )12
t= + ⇒ t =11.581 years
(4) daily: 365( ).064000 2000(1 )365
t= + ⇒ t =11.553 years
• Define half-life, develop the exponential decay formula, 012
tk
A A= where k is the
half−life, and use it to solve the following problem: A certain substance in the book bag deteriorates from 1000g to 400g in 10 days. Find its half-life.
Solution: 10
1400 10002
k=
10.42
tk
=
1log 0.4 log2
tk
=
10 1log 0.4 log
2k=
log 0.4 10log 0.5 k
=
10 log 0.5 7.565log 0.4
k days= =
• Assign additional problems on compound interest and half−life from the math textbook.

2012-13 and 2013-14 Transitional Comprehensive Curriculum
Algebra IIUnit 6Exponential and Logarithmic Functions 6-26
Activity 12: Natural Logarithms (GLEs: 2, 3, 4, 6, 10, 24, 27, 29; CCSSs: F-LE.4, RST.11-12.4)
Materials List: paper, pencil, graphing calculator This activity has not changed because it already incorporates these CCSSs. The students will determine the value of e and define natural logarithm. Math Log Bellringer:
Use your calculator to determine log 10 and ln e. Draw conclusions. Solution: log 10 = 1 and ln e = 1. ln must be a logarithm with a base e.
Activity: • Define ln as a natural logarithm base e. Have students do the following activity to discover
the approximation of e. Let students use their calculators to complete the following table. Have them put the equation in y1 and use the home screen and the notation y1(1000) to find the values.
n 10 100 1000 10,000 100,000 1,000,000 1,000,000,000 11
n
n +
2.05937
2.07048
2.7169
2.7181
2.7182682
2.718280469
2.718281827
• Define e as the value that this series approaches as n gets larger and larger. It is
approximately equal to 2.72 and was named after Leonard Euler in 1750. Stress that e is a transcendental number similar to π . Although it looks as if it repeats, the calculator has limitations. The number is really 2.71828182845904590… and is irrational.
• Graph y = ln x and y = ex and discuss inverses and the domain and range of y = ln x. Locate
the x-intercept at (1, 0) which establishes the fact that ln e = 1.
• Compare 11n
n +
to the compound interest formula, A(t) = Pert, which is derived by
increasing the number of times that compounding occurs until interest has been theoretically compounded an infinite number of times. Revisit the problem from Activity 11 in which the students invested $2000 at 6% APR,
but this time compound it continuously for one year and discuss the difference. Solution: $3644.24
Revisit the problem in Activity 11 of how long it will take to double money. When the students take the log of both sides to solve for t, they should use the natural logarithm because ln e = 1.
Solution: $4000 = $2000e.06t 2 = e.06t
ln 2 = ln e.06t

2012-13 and 2013-14 Transitional Comprehensive Curriculum
Algebra IIUnit 6Exponential and Logarithmic Functions 6-27
ln 2 = .06t ln e ln 2 = .06t (1) ln 2.06
t=
t = 11.552 years
• Discuss use of this formula in population growth. Work with the students on the following two part problem: If the population in Logtown, USA, is 1500 in 2000 and 3000 in 2005, what would the population be in 2015? o Most students will answer 6000. Take this opportunity to explain the difference in a
proportion, which is a linear equation having a constant slope, and population growth which is an exponential equation that follows the A(t) = Pert formula.
o Part I: Find the rate of growth (r) A(t) = Pert
3000 = 1500(er(5)) 2 = e5r ln 2 = le e5r ln 2 = (5r) ln e ln 2 = 5r ln 25
r= . Have students store this decimal representation in a letter in the calculator
such as R. Discuss how the error can be magnified if a rounded number is used in the middle of a problem.
o Part II: Use the rate to solve the problem. A(t) = Pert A(15) = 1500(eR(15)) using the rate stored in R A(10) = 12000
o Discuss the difference in what they thought was the answer (6000), which added 1500 every 5 years (linear), and the real answer (12000) which multiplied by 2 every 5 years (exponential).
• Assign additional problems from the math textbook. • Critical Thinking Writing Assessment: (See Activity-Specific Assessments at end of unit.) Activity 13: Comparing Interest Rates (GLEs: 2, 10, 24, 29; CCSS: F-LE.4) Materials List: paper, pencil, graphing calculator, Money in the Bank Research Project BLM This activity has not changed because it already incorporates this CCSS. This is an out-of-class activity. Distribute the Money in the Bank Research Project BLM. Have students choose a financial institution in town or on the Internet. If possible, have each student in a class choose a different bank. Have them contact the bank or go online to find out information about the interest rates available for two different types of accounts and how they are compounded. Have

2012-13 and 2013-14 Transitional Comprehensive Curriculum
Algebra IIUnit 6Exponential and Logarithmic Functions 6-28
students fill in the following information and solve the following problems. When all projects are in, have students report to the class.
Money in the Bank Research Project Information Sheet: Name of bank, name of person you spoke to, bank address and phone number or the URL if online, types of accounts, interest rates, and how funds are compounded. Problem: Create a hypothetical situation in which you invest $500. (1) Find the equation to model two different accounts for your bank. (2) Determine how much you will have for each account at the end of high school, at the end of
college, and when you retire. (Assume you finish high school in one year, college four years later, and retire 50 years after you finish college.)
(3) Determine how many years it will take you to double your money for each account. (4) Determine in which account you will put your money and discuss why. (5) Display all information on a poster board and report to the class.
Sample Assessments
General Assessments
• Use Bellringers as ongoing informal assessments. • Collect the Little Black Books of Algebra II Properties and grade for completeness at the
end of the unit. • Monitor student progress using small quizzes to check for understanding during the unit
on such topics as the following: (1) solving exponential equations with same base (2) graphing y = ex and y = log x with shifts (3) evaluating logs such as log2 8
• Administer two comprehensive assessments: (1) exponential equations and graphs, evaluating logs, properties of logs and
logarithmic graphs (2) solving exponential equations with the same base and different bases, and
application problems Activity-Specific Assessments
• Teacher Note: Critical Thinking Writings are used as activity-specific assessments in many of the activities in every unit. Post the following grading rubric on the wall for students to refer to throughout the year.
2 pts. - answers in paragraph form in complete sentences with proper grammar and punctuation
2 pts. - correct use of mathematical language 2 pts. - correct use of mathematical symbols

2012-13 and 2013-14 Transitional Comprehensive Curriculum
Algebra IIUnit 6Exponential and Logarithmic Functions 6-29
3 pts./graph - correct graphs (if applicable) 3 pts./solution - correct equations, showing work, correct answer 3 pts./discussion - correct conclusion
• Activity 1: Critical Thinking Writing
(1) Simplify ( )29− .
(2) Simplify ( )29− .
(3) Discuss why the answers to problems 1 and 2 are different.
(4) Discuss why one of the Laws of Exponents, ( )b bbc cca a a= = , does not apply to
problems #1 and #2. Solutions: (1) 9 (2) –9 (3) By order of operations, in problem 1 you have to square the expression first to
get 81 and then take the square root to get 9. In problem 2 you have to take the square root first to get 3i, then square it to get −9.
(4) This Law of Exponents only applies when a > 0.
• Activity 4: Evaluate the Exponential Data Research Project (see activity) using the following rubric:
Grading Rubric for Data Research Project 10 pts. − table of data with proper documentation (source and date of data) 10 pts. − scatterplot with model equation from the calculator or spreadsheet (not by
hand) 10 pts. − equations, domain, range, 10 pts. − real-world problem using extrapolation with correct answer 10 pts. − discussion of subject and limitations of the prediction 10 pts. − poster - neatness, completeness, readability 10 pts. − class presentation
• Activity 5: Critical Thinking Writing
(1) Solve the two equations: (a) x2 = 9 and (b) 3x = 9 (2) Discuss the family of equations to which they belong. (3) Discuss how the equations are alike and how they are different. (4) Discuss the two different processes used to solve for x.
Solutions: (1) (a) x = ±3, (b) x = 2 (2) x2 belongs to the family of polynomial equations and 3x is an exponential
equation

2012-13 and 2013-14 Transitional Comprehensive Curriculum
Algebra IIUnit 6Exponential and Logarithmic Functions 6-30
(3) Both equations have exponent; but in the first the exponent is a number, and in the 2nd the exponent is a variable
(4) (a) Take the square root of both sides. (b) Find the exponent for which you can raise 3 to that power to get 9.
• Activity 6: Critical Thinking Writing
The value of log316 is not a number you can evaluate easily in your head. Discuss how you can determine a good approximation.
Solution: Answers will vary but should discuss the fact that the answer to a log problem is an exponent and 32 = 9 and 33 = 27 so log316 is between 2 and 3.
• Activity 8: Critical Thinking Writing
The decibel scale measures the relative intensity of a sound. One formula for the decibel
level, D, of sound is 0
10log IDI
=
, where I is the intensity level in watts per square
meter and I0 is the intensity of barely audible sound. (1) If the intensity level of a jet is 1014 watts per square meter times the intensity of
barely audible sound (1014I0), what is the decibel level of a jet take-off. (2) The decibel level of loud music with amplifiers is 120. How many times more intense
is this sound than a barely audible sound? (3) Compare the decibel levels of jets and loud music. (4) Are there any ordinances in your town about the acceptable decibel level of sound?
Solutions: (1) 140 decibels, (2) 1012I0
• Activity 12: Critical Thinking Writing
In 1990, statistical data estimated the world population at 5.3 billion with a growth rate of approximately 1.9% each year. (1) Let 1990 be time 0 and determine the equation that best models population growth. (2) What will the population be in the year 2010? (3) What was the population in 1980? (4) In what year will the population be 10 billion? (5) Discuss the validity of using the data to predict the future.
Solution: (1) A = 5.3e.019t, (2) 7.8 billion, (3) 4.4 billion, (4) 2023
• Activity 13: Evaluate the Money in the Bank Research Project (see activity) using the following rubric:
Grading Rubric for Money in the Bank Research Project 10 pts. − Information sheet: Name of bank, name of person you spoke to, bank
address and phone number or the URL if online, types of accounts, interest rates, and how funds are compounded (source and date of data)

2012-13 and 2013-14 Transitional Comprehensive Curriculum
Algebra IIUnit 6Exponential and Logarithmic Functions 6-31
10 pts. − Compound interest equation for each situation; account value for both accounts at the end of high school, college, and when you retire in 50 years (show all your work)
10 pts. − Solution showing your work of how long it will take you to double your money in each account
10 pts. − Discussion of where you will put your money and why 10 pts. − Poster - neatness, completeness, readability 10 pts. − Class presentation

2012-13 and 2013-14 Transitional Comprehensive Curriculum
Algebra IIUnit 7 Advanced Functions 7-1
Algebra II Unit 7: Advanced Functions
Time Frame: Approximately five weeks Unit Description This unit ties together all the functions studied throughout the year. It categorizes them, graphs them, translates them, and models data with them. Student Understandings The students will demonstrate how the rules affecting change of degree, coefficient, and constants apply to all functions. They will be able to quickly graph the basic functions and make connections between the graphical representation of a function and the mathematical description of change. They will be able to translate easily among the equation of a function, its graph, its verbal representation, and its numerical representation. Guiding Questions
1. Can students quickly graph lines, power functions, radicals, logarithmic, exponential, step, rational, and absolute value functions?
2. Can students determine the intervals on which a function is continuous, increasing, decreasing, or constant?
3. Can students determine the domains, ranges, zeros, asymptotes, and global characteristics of these functions?
4. Can students use translations, rotations, reflections, and dilations to graph new functions from parent functions?
5. Can students determine domain and range changes for translated and dilated abstract functions?
6. Can students graph piecewise defined functions, which are composed of several types of functions?
7. Can students identify the symmetry of these functions and define even and odd functions?
8. Can students analyze a set of data and match the data set to the best function graph?
Unit 7 Grade-Level Expectations (GLEs) Teacher Note: The individual Algebra II GLEs are sometimes very broad, encompassing a variety of functions. To help determine the portion of the GLE that is being addressed in each unit and in each activity in the unit, the key words have been underlined in the GLE list, and the number of the predominant GLE has been underlined in the activity.

2012-13 and 2013-14 Transitional Comprehensive Curriculum
Algebra IIUnit 7 Advanced Functions 7-2
Grade-Level Expectations
GLE # GLE Text and Benchmarks Algebra 4. Translate and show the relationships among non-linear graphs, related
tables of values, and algebraic symbolic representations (A-1-H) 6. Analyze functions based on zeros, asymptotes, and local and global
characteristics of the function (A-3-H) 7. Explain, using technology, how the graph of a function is affected by
change of degree, coefficient, and constants in polynomial, rational, radical, exponential, and logarithmic functions (A-3-H)
10. Model and solve problems involving quadratic, polynomial, exponential, logarithmic, step function, rational, and absolute value equations using technology (A-4-H)
Geometry 16. Represent translations, reflections, rotations, and dilations of plane figures
using sketches, coordinatesData Analysis, Probability, and Discrete Math
, vectors, and matrices (G-3-H)
19. Correlate/match data sets or graphs and their representations and classify them as exponential, logarithmic, or polynomial functions (D-2-H)
20. Interpret and explain, with the use of technology, the regression coefficient and the correlation coefficient for a set of data (D-2-H)
22. Explain the limitations of predictions based on organized sample sets of data (D-7-H)
Patterns, Relations, and Functions 24. Model a given set of real-life data with a non-linear function (P-1-H) (P-5-H) 25. Apply the concept of a function and function notation to represent and
evaluate functions (P-1-H) (P-5-H) 27. Compare and contrast the properties of families of polynomial, rational,
exponential, and logarithmic functions, with and without technology (P-3-H) 28. Represent and solve problems involving the translation of functions in the
coordinate plane (P-4-H) 29. Determine the family or families of functions that can be used to represent a
given set of real-life data, with and without technology (P-5-H) CCSS for Mathematical Content
CCSS # CCSS Text Trigonometric Functions F.TF.5 Choose trigonometric functions to model periodic phenomena with
specified amplitude, frequency, and midline. Linear, Quadratic, and Exponential Models F.TF.8 Prove the Pythagorean identity sin2(θ) + cos2(θ) = 1 and use it find sin(θ),
cos(θ), or tan(θ) given sin(θ), cos(θ), or tan(θ) and the quadrant.

2012-13 and 2013-14 Transitional Comprehensive Curriculum
Algebra IIUnit 7 Advanced Functions 7-3
ELA CCSS
CCSS # CCSS Text Reading Standards for Literacy in Science and Technical Subjects 6-12 RST.11-12.3 Follow precisely a complex multistep procedure when carrying out
experiments, taking measurements, or performing technical tasks; analyze the specific results based on explanations in the text.
RST.11-12.4 Determine the meaning of symbols, key terms, and other domain-specific words and phrases as they are used in a specific scientific or technical context relevant to grades 11–12 texts and topics.
Writing Standards for Literacy in History/Social Studies, Science and Technical Subjects 6-12 WHST.11-12.7 Conduct short as well as more sustained research projects to answer a
question (including a self-generated question) or solve a problem; narrow or broaden the inquiry when appropriate; synthesize multiple sources on the subject, demonstrating understanding of the subject under investigation.
Sample Activities Ongoing Activity: Little Black Book of Algebra II Properties Materials List: black marble composition book, Little Black Book of Algebra II Properties BLM Activity: • Have students continue to add to the Little Black Books they created in previous units
which are modified forms of vocabulary cards (view literacy strategy descriptions). When students create vocabulary cards, they see connections between words, examples of the word, and the critical attributes associated with the word, such as a mathematical formula or theorem. Vocabulary cards require students to pay attention to words over time, thus improving their memory of the words. In addition, vocabulary cards can become an easily accessible reference for students as they prepare for tests, quizzes, and other activities with the words. These self-made reference books are modified versions of vocabulary cards because, instead of creating cards, the students will keep the vocabulary in black marble composition books (thus the name “Little Black Book” or LBB). Like vocabulary cards, the LBBs emphasize the important concepts in the unit and reinforce the definitions, formulas, graphs, real-world applications, and symbolic representations.
• At the beginning of the unit, distribute copies of the Little Black Book of Algebra II Properties BLM for Unit 7. This is a list of properties in the order in which they will be learned in the unit. The BLM has been formatted to the size of a composition book so students can cut the list from the BLM and paste or tape it into their composition books to use as a table of contents.

2012-13 and 2013-14 Transitional Comprehensive Curriculum
Algebra IIUnit 7 Advanced Functions 7-4
• The students’ description of each property should occupy approximately one-half page in the LBB and include all the information on the list for that property. The students may also add examples for future reference.
• Periodically check the Little Black Books and require that the properties applicable to a general assessment be finished by the day before the test, so pairs of students can use the LBBs to quiz each other on the concepts as a review.
Advanced Functions
7.1 Basic Graphs − Graph and locate f(1): y = x, x2, x3, 3 1, , , , ,x x x xx
log x, 2x.
7.2 Continuity – provide an informal definition and give examples of continuous and discontinuous functions.
7.3 Increasing, Decreasing, and Constant Functions – write definitions and draw example graphs such as 29y x= − , state the intervals on which the graphs are increasing and decreasing.
7.4 Even and Odd Functions – write definitions and give examples, illustrate properties of symmetry, and explain how to prove that a function is even or odd (e.g., prove that
y = x4 + x2 + 2 is even and y = x3 + x is odd). 7.5 General Piecewise Function – write the definition and then graph, find the domain and
range, and solve the following example f xx if xx if x
( ) =+ ≥
− <RST2 1 5
52
for f (4) and f (1).
For properties 7.6 − 7.9 below, do the following: • Explain in words the effect on the graph. • Give an example of the graph of a given abstract function and then the
function transformed (do not use y = x as your example). • Explain in words the effect on the domain and range of a given function. Use
the domain [–2, 6] and the range [–8, 4] to find the new domain and range of the transformed function.
7.6 Translations ƒ(x + k) and ƒ(x − k), ƒ(x) + k and ƒ(x) − k 7.7 Rotations ƒ(–x) and –ƒ(x) 7.8 Dilations ƒ(kx), (|k|<1 and |k|>1), kƒ(x) (|k|<1 and |k|>1) 7.9 Reflections and Rotations ƒ(|x|) and |ƒ(x)| Activity 1: Basic Graphs and their Characteristics (GLEs: 6, 25, 27; CCSSs: RST.11-
12.4) Materials List: paper, pencil, graphing calculator, Math Log Bellringer BLM, Vocabulary Card Template BLM This activity has not changed because it already incorporates this CCSS. In this activity, the students will work in groups to review the characteristics of all the basic graphs they have

2012-13 and 2013-14 Transitional Comprehensive Curriculum
Algebra IIUnit 7 Advanced Functions 7-5
studied throughout the year. They will also develop a definition for the continuous, increasing, decreasing, and constant functions. Math Log Bellringer:
Graph the following by hand, locate zeroes and f(1), and identify the function. (1) f(x) = x (2) f(x) = x2 (3) ( )f x x= (4) f(x) = x3 (5) f(x) = |x| (6) f(x) = 2x (7) 1( )f x
x=
(8) ( ) 3f x x= (9) f(x) = log x (10) ( )f x x=
(11) Solutions:
(1) f (1) = 1, linear function, zero (0,0)
(2) f (1) =1, quadratic function also polynomial function, zero (0, 0)
(3) f(1) = 1, radical function square root function, zero (0, 0)
(4) f(1) = 1, cubic function also polynomial function,

2012-13 and 2013-14 Transitional Comprehensive Curriculum
Algebra IIUnit 7 Advanced Functions 7-6
zero (0, 0)
(5) f(1) = 1,
absolute value function, zero (0, 0)
(6) f(1) = 2, exponential function no zeroes
(7) f(1) = 1, rational function no zeroes
(8) f(1) = 1 , radical function cube root function, zero (0, 0)
(9) f(1) = 0, logarithmic function, zero (1, 0)
(10) f(1) = 1, greatest integer function, zeroes: 0 < x < 1

2012-13 and 2013-14 Transitional Comprehensive Curriculum
Algebra IIUnit 7 Advanced Functions 7-7
Activity: • Overview of the Math Log Bellringers: As in previous units, each in-class activity in Unit 7 is started with an activity called a
Math Log Bellringer that either reviews past concepts to check for understanding (reflective thinking about what was learned in previous classes or previous courses) or sets the stage for an upcoming concept (predictive thinking for that day’s lesson).
A math log is a form of a learning log (view literacy strategy descriptions) that students keep in order to record ideas, questions, reactions, and new understandings. Documenting ideas in a log about content being studied forces students to “put into words” what they know or do not know. This process offers a reflection of understanding that can lead to further study and alternative learning paths. It combines writing and reading with content learning. The Math Log Bellringers will include mathematics done symbolically, graphically, and verbally.
Since Bellringers are relatively short, blackline masters have not been created for each of them. Write them on the board before students enter class, paste them into an enlarged Word® document or PowerPoint® slide, and project using a TV or digital projector, or print and display using a document or overhead projector. A sample enlarged Math Log Bellringer Word® document has been included in the blackline masters. This sample is the Math Log Bellringer for this activity.
Have the students write the Math Log Bellringers in their notebooks, preceding the upcoming lesson during beginning−of−class record keeping, and then circulate to give individual attention to students who are weak in that area.
• Function Calisthenics: Use the Bellringer to review the ten basic parent graphs. Then
have the students stand up, call out a parent function, and form the shape of the graph with their arms.
• Increasing/decreasing/constant functions:
o Ask students to come up with a definition of continuity. (An informal definition of continuity is sufficient for Algebra II.)
o Have them develop definitions for increasing, decreasing, and constant functions. o Have students look at the abstract graph to the right
and determine if it is continuous and the intervals in which it is increasing and decreasing. (Stress the concept that when intervals are asked for, students should always give intervals of the independent variable, x in this case, and the intervals should always be open intervals.)
Solution: Increasing ( ) ( ), 1 0,−∞ − ∪ ∞ Decreasing (–1, 0)
o Have each student graph any kind of graph he/she desires on the graphing calculator and write down the interval on which the graph is increasing and decreasing. Have students trade calculators with a neighbor and answer the same question for the neighbor’s graph, then compare answers

2012-13 and 2013-14 Transitional Comprehensive Curriculum
Algebra IIUnit 7 Advanced Functions 7-8
• Flash that Function: Divide students into groups of four and give each student the
Vocabulary Card Template BLM and ten blank 5 X 7” cards to create vocabulary cards (view literacy strategy descriptions). When students create vocabulary cards, they see connections between words, examples of the word, and the critical attributes associated with the word such as a mathematical formula or theorem. Have each student in the group choose one assignment – Grapher, Symbol Maker, Data Driver, and Verbalizer. Have each member of the group create flash cards of the ten basic graphs in the Bellringer activity, but the front of each will be different based on his/her assignment. (They can use their Little Black Books to review the information.) The front of Grapher’s card will have a graph of the function. The front of the Symbol Maker’s card will have the symbolic equation of the function. The front of the Data Driver’s card will have a table of data that models the function. The front of the Verbalizer’s card will have a verbal description of the function. The back of the card will have all of the following information: function, graph, the family (category of parent functions), table of data, domain, range, asymptotes, x- and y-intercepts, zeros, end-behavior, and increasing or decreasing. Once all the cards are complete, have students practice flashing the cards in the group asking questions about the function, then set up a competition between groups. (see samples below for y = x2)
Sample back of vocabulary cards:
Sample fronts of vocabulary cards:

2012-13 and 2013-14 Transitional Comprehensive Curriculum
Algebra IIUnit 7 Advanced Functions 7-9
Activity 2: Horizontal and Vertical Shifts of Abstract Functions (GLEs: 4, 6, 7, 16, 19, 25, 27, 28)
Materials List: paper, pencil, graphing calculator, Translations BLM In this activity, the students will review horizontal and vertical translations, apply them to abstract functions, and determine the effects on the domain and range. Math Log Bellringer:
Graph the following without a calculator: Discuss how the shifts in #2−5 change the domain, range, and vertex of the parent function. (1) f(x) = x2 (2) f(x) = x2 + 4 (3) f(x) = x2 – 5 (4) f(x) = (x + 4)2 (5) f(x) = (x – 5)2
Solutions:
(1)
(2) changes the range, vertex moves up
(3) changes the range, vertex moves down
(4) no change in domain and range, vertex moves left
(5) no change in domain or range, vertex moves right
Activity: • Have the students check the Bellringer graphs with their calculators and use the
Bellringer to ascertain how much they remember about translations. • Vertical Shifts: ( )f x k±
o Have the students refer to Bellringer problems 1 through 3 to develop the rule that f(x) + k shifts the functions up and f(x) – k shifts the functions down.
o Determine if this shift affects the domain or range. (Solution: range) o For practice, have students graph the following:

2012-13 and 2013-14 Transitional Comprehensive Curriculum
Algebra IIUnit 7 Advanced Functions 7-10
(1) f(x) = x3 (2) f(x) = x3 + 4 (3) f(x) = x3 – 6
Solutions: (1) (2) (3)
• Horizontal Shifts: ( )f x k± o Have the students refer to Bellringer problems 1, 4, and 5 to develop the rule that +k
inside the parentheses shifts the function left and – k shifts the function right, stressing that it is the opposite of what seems logical when shown in the parentheses.
o Determine if this shift affects the domain or range. (Solution: domain) o For practice, have students graph the following:
(1) f(x) = x3 (2) f(x) = (x + 4)3 (3) f(x) = (x – 6)3
Solutions: (1) (2) (3)
• Abstract Translations Divide students into groups of two or three and distribute the Translations BLM. Have students work the first section shifting an abstract graph vertically and
horizontally. Stop after this section to check their answers. Have students complete the Translations BLM graphing by hand, applying the shifts
to known parent functions. After they have finished, they should check their answers with a graphing calculator.
Check for understanding by having students individually graph the following: (1) f(x) = 4x (2) g(x) = 4x − 2 (3) h(x) = 4x − 2
Solutions: (1) (2) (3)
• Finish the class with Function Calisthenics again, but this time call out the basic
functions with vertical and horizontal shifts. (e.g. x2, x2 + 2, x3, x3 – 4, x , 4x − , 5x + )

2012-13 and 2013-14 Transitional Comprehensive Curriculum
Algebra IIUnit 7 Advanced Functions 7-11
Activity 3: How Coefficients Change Families of Functions (GLEs: 4, 6, 7, 16, 19, 25, 27, 28)
Materials List: paper, pencil, graphing calculator, Rotations Discovery Worksheet BLM, Dilations Discovery Worksheet BLM, Abstract Rotations & Dilations BLM In this activity, the students will determine the effects of a negative coefficient, coefficients with different magnitudes on the graphs, and the domains and ranges of functions. Math Log Bellringer:
Graph the following on your calculator. Discuss what effect the negative sign has. (1) ( )f x x=
(2) ( )f x x= −
(3) ( )f x x= − Solutions: (1) (2) (3)
(2) rotates graph through space around the x-axis, affects range (3) rotates graph through space around the y-axis, affects domain
Activity: • Discovering Rotations through Space: Distribute the Rotations Discovery Worksheet BLM. This BLM is designed to be
teacher−guided discovery with the individual students working small sections of the worksheet at a time, stopping after each section to discuss the concept.
Negating the function: –f(x). o Have the students sketch their Bellringer problems on the Rotations Discovery
Worksheet BLM and refer to Bellringer problems #1 and #2 to develop the rule, “that a negative sign in front of the function rotates the graph through space around the x-axis” (i.e., all positive y-values become negative and all negative y-values become positive). Have students write the rule in their notebooks.
o Determine if this affects the domain or range. (Solution: range) o Allow students time to complete the practice on problems #1 − 6. Check their
answers. Negating the x within the function: f(–x)
o Have the students refer to Bellringer problems #1 and #3 to develop the rule, “that the negative sign in front of the x rotates the graph through space around the y-axis” (i.e., all positive x-values become negative and all negative x-values become positive). Have students write the rule in their notebooks.
o Determine if this affects the domain or range. (Solution: domain)

2012-13 and 2013-14 Transitional Comprehensive Curriculum
Algebra IIUnit 7 Advanced Functions 7-12
o Allow students time to complete the practice on problems #7−13. Check their answers.
Some changes do not seem to make a difference. Have the students examine the following situations and answer the questions in their notebooks: (1) Draw the graphs of y = x2, f(x) = –x2 and h(x) = (–x)2. Find f(2) and h(2). (2) Discuss the difference in the graphs. Discuss order of operations. Explain what
effect the parentheses have. (3) Draw the graphs of y = x3, f(x) = –x3 and h(x) = (–x)3. Find f(2) and h(2). (4) Discuss the difference in the graphs. Explain what effect the parentheses have. (5) Why do the parentheses affect one set of graphs and not the other?
Solutions: (1)
f(2) = -4, h(2) = 4 (2) f(x) = –x2 rotates the graph y = x2 through space around the x-axis while
h(x) = (–x)2 rotates the graph y = x2 through space around the y-axis. In f(x) the x is squared first then the value is negated. The parenthesis negates first then squares the negative value.
(3) f(2)= –8, h(2) = –8 (4) f(x) = –x3 rotates the graph y = x3 through space around the x-axis while
h(x) = (–x)3 rotates the graph y = x3 through space around the y-axis. The results are the same. The parenthesis negates first then cubes the negative value.
(5) Even exponents change negatives to positives while odd exponents keep negative signs negative.
• Discovering Dilations Discovery Worksheet BLM: Distribute the Dilations Discovery Worksheet BLM. This BLM is designed to be
teacher-guided discovery with the individual students working small sections of the worksheet at a time, stopping after each section to discuss the concept.
Continue the guided discovery using the problems on the Dilations Discovery Worksheet BLM, problems #14−18.
Coefficients in front of the function: k f(x) (k > 0) o Have the students refer to problems #14, 15, and 16 to develop the rule for the
graph of k f(x): If k > 1, the graph is stretched vertically compared to the graph of

2012-13 and 2013-14 Transitional Comprehensive Curriculum
Algebra IIUnit 7 Advanced Functions 7-13
f(x); and if 0 < k < 1, the graph is compressed vertically compared to the graph of f(x). Write the rule in #19.
o Ask students to determine if this affects the domain or range. (Solution: range) Coefficients in front of the x: f(kx) (k > 0)
o Have the students refer to problems #14, 17, and 18 to develop the rule for the graph of f(kx): If k > 1, the graph is compressed horizontally compared to the graph of f(x); and if 0 < k < 1, the graph is stretched horizontally compared to the graph of f(x). (When the change is inside the parentheses, the graph does the opposite of what seems logical.) Write the rule in #20.
o Determine if this change affects the domain or range. (Solution: domain) Write the rule in #21.
o Allow students to complete the practice on this section in problems #22−28.
• Abstract Rotations and Dilations: Distribute the Abstract Rotations & Dilations BLM. Divide students into groups of
two or three to complete this BLM, problems #29−34. When the students have completed this BLM, have them swap papers with another
group. If they do not agree, have them justify their transformations. • More Function Calisthenics: Have the students stand up, call out a function, and have
them show the shape of the graph with their arms. This time have one row make the parent graph and the other rows make graphs with positive and negative coefficients (i.e. x2, –x2, 2x2, x3, –x3, x , – x , x− ).
Activity 4: How Absolute Value Changes Families of Functions (GLEs: 4, 6, 7, 16, 19,
25, 27, 28) Materials List: paper, pencil, graphing calculator, Abstract Rotations and Dilations BLM in Activity 3 In this activity, students will discover how a graph changes when an absolute value sign is placed around the entire function or placed just around the variable. Math Log Bellringer:
(1) Graph f(x) = x2 – 4 by hand and locate the zeroes. (2) Use the graph to solve x2 – 4 > 0. (3) Use the graph to solve x2 – 4 < 0. (4) Discuss how the graph can help you solve #2 and #3.
Solutions: (1) zeroes: {−2, 2} (2) x < –2 or x > 2, (3) –2 < x < 2

2012-13 and 2013-14 Transitional Comprehensive Curriculum
Algebra IIUnit 7 Advanced Functions 7-14
(4) Since y = f(x) = x2 − 4, the x−values that make the y−values positive solve #2. The x−values that make the y−values negative solve #3. Use the zeroes as the endpoints of the intervals.
Activity:
• Review the definition of absolute value: 00
x if xx
x if x≥
= − < and review the rules for
writing an absolute value as a piecewise function: What is inside the absolute value is both positive and negative. What is inside the absolute value affects the domain.
• Absolute Value of a Function: |f(x)|
o Have students use the definition of absolute value to write |f(x)| as a piecewise
function ( ) ( ) 0
( )( ) ( ) 0
f x if f xf x
f x if f x≥
= − <
o Have the students write |x2 – 4| as a piecewise function and use the Bellringer to simplify the domains.
Solution: ( )2 2
22 2
4 4 04
4 4 0
x if xx
x if x
− − ≥− = − − − <
= ( )2
2
4 2 2
4 2 2
x if x or x
x if x
− ≤ − ≥− − − < <
o Have the students graph the piecewise function by hand reviewing what –f(x) does to a graph and find the domain and range.
Solution: D: all reals, R: y > 0 o Have the students check the graph f(x) = |x2 – 4| on the graphing
calculator. o Have students develop the rule for graphing the absolute value of
a function: Make all y-values positive. More specifically, keep the portions of the graphs in Quadrants I and II and rotate the graphs in Quadrant III and IV through space around the x-axis into Quadrants I and II.
o Ask students to determine if this affects the domain or range. (Solution: range) o Have students practice on the following graphing by hand first, then checking on the
calculator: (1) Graph g(x) = |x3| and find the domain and range. (2) Graph f(x) = |log x| and find the domain and range. (3) If the function h(x) has a domain [–4, 6] and range [–3, 10], find the domain and
range of |h(x)|. (4) If the function j(x) has a domain [–4, 6] and range [–13, 10], find the domain and
range of |j(x)|. Solutions:
(1) D: all reals, R: y >0

2012-13 and 2013-14 Transitional Comprehensive Curriculum
Algebra IIUnit 7 Advanced Functions 7-15
(2) D: x > 0, R: y > 0 (3) D: same, R: [0, 10] (4) D: same, R: [0, 13]
• Absolute Value only on the x: f(|x|) o Have the students write g(x) = (|x| – 4)2 – 9 as a piecewise function.
Solution: g(x) = ( )( )( )( )
22
2
4 9 04 9
4 9 0
x if xx
x if x
− − ≥− − = − − − <
o Have the students graph the piecewise function for g(x) by hand reviewing what the negative only on the x does to a graph.
Solution:
o Have students find the domain and range of g(x). Discuss the fact that negative x−values are allowed and negative y-values may result. The range is determined by the lowest y-value in Quadrant I and IV, in this case the vertex.
Solution: D: all reals, R: y > − 9 o Have students graph y1 = (x – 4)2 – 9 and y2 = (|x| –4)2 – 9 on the graphing calculator.
Turn off y1 and discuss what part of the graph disappeared and why. Solution: The portion of the graph in Quadrants II and III are erased because the output for positive x’s is the same as the outputs for |x|’s when x’s are negative.
o Have students develop the rule for graphing a function with only the x in the absolute value. Graph the function without the absolute value first. Keep the portions of the graph in Quadrants I and IV, discard the portion of the graph in Quadrants II and III, and reflect Quadrants I and IV into II and III. Basically, the y-output of a positive x-input is the same y-output of a negative x-input when absolute value is around the x. (Teacher Note: A rotation of a curve through space around an axis moves the curve from two quadrants into two other quadrants, while a reflection keeps the original curve and its reflection across an axis.)
o Have students practice on the following: (1) Graph y = (|x| + 2)2 and find the domain and range. (2) Graph y = (|x| – 1)(|x| − 5)(|x| – 3) and find the domain and range.

2012-13 and 2013-14 Transitional Comprehensive Curriculum
Algebra IIUnit 7 Advanced Functions 7-16
(–5, –3)
(4, 8)
g(x)
4
(1, 2)
(3) Graph 3y x= − and find the domain and range. (4) If the function h(x) has a domain [–4, 6] and range [–3, 10], find the domain and
range of h(|x|). (5) If the function j(x) has a domain [–8, 6] and range [–3, 10], find the domain and
range of j(|x|).
Solutions: (1) D: (−∞, ∞), R: y > 4 (2) D: (−∞, ∞), R: y > −15, this value cannot be determined without a
calculator until Calculus because another minimum value may be lower than the y-intercept
(3) D: x < –3 or x > 3, R: y > 0 (4) D: [–6, 6], R: cannot be determined (5) D: [–10, 10], R: cannot be determined
o Use the practice problems above to determine if f(|x|) affects the domain or range.
Solution: f(|x|) affects the domain and possibly the range. To find the new domain, keep the domain for positive x-values and change the signs to include the reflected negative x-values. The range cannot be determined unless the maximum and minimum values of y in Quadrants I and IV can be determined.
• Abstract Absolute Value Rotations |f(x)| and Reflections f(|x|): Have students draw in
their notebooks the same abstract graph from the Abstract Reflections & Dilations BLM from Activity 3, then sketch |g(x)| and g(|x|) putting solutions on the board.

2012-13 and 2013-14 Transitional Comprehensive Curriculum
Algebra IIUnit 7 Advanced Functions 7-17
Solutions: Activity 5: Functions - Tying It All Together (GLEs: 4, 6, 7, 16, 25, 27, 28; CCSS:
RST.11-12.4) Materials List: paper, pencil, graphing calculators, Tying It All Together BLM, ½ sheet poster paper for each group, index cards with one parent graph equation on each card This activity has not changed because it already incorporates these CCSSs. In this activity, students pull together all the rules of translations, shifts, and dilations. Math Log Bellringer:
Graph the following by hand labeling h(1). Discuss the change in the graph and whether the domain or range is affected. (1) h(x) = 3x (2) h(x) = 3−x (3) h(x) = −(3x) (4) h(x) = 3x + 1 (5) h(x) = 3x + 1 (6) h(x) = |3x| (7) h(x) = 3|x| (8) h(x) = 32x (9) h(x) = 2(3x)
(–5, 3)
(4, 8)
|g(x)|
4
(1, 2)
(4, 8)
g(|x|)
(1, 2) (−1, 2)
(−4, 8)
4

2012-13 and 2013-14 Transitional Comprehensive Curriculum
Algebra IIUnit 7 Advanced Functions 7-18
Solutions:
(1) (2) rotate around y-axis (3) rotates around x-axis no change in D or R range changes
(4) shift left 1 (5) shifts up 1, (6) no change in graph, no change D or R range changes no change in D or R (7) discard graph in Q II & III (8) horizontal compression, (9) vertical stretch, and reflect Q I into Q II, y−intercept stayed the same, y−intercept changed, no change in D or R. no change in D or R no change in D or R
• Tying It All Together: Divide students into groups of two or three and distribute the Tying It All Together BLM. Have students complete I. GRAPHING and review answers. Have students complete II. DOMAINS AND RANGES and review answers. When students have completed the worksheet, enact professor know−it−all (view literacy
strategy descriptions). Explain that each group will draw one graph and the other groups will come to the front of the class to be a team of Math Wizards (or any other appropriate name). This team is to come up with the equation of the graphs. Distribute ½ sheet of poster paper to each group. Pass out an index card with one
parent graph equation: f(x) = x, f(x) = x2, ( )f x x= , f(x) = x3, f(x) = |x|, 1( )f xx
= ,
f(x) = 2x, ( ) 3f x x= , f(x) = log x, ( )f x x= , to secretly assign each group a parent graph. Tell them to draw an x− and y−axis and their parent graphs with two (or three if it is an advanced class) dilations, translations, rotations or reflections on one side of the poster, and write the equation of the graph on the back. They should draw very accurately and label the x− and y−intercepts and three other ordered pairs, and then they should use their graphing calculators to make sure the equation matches the graph. Circulate to make sure graphs and equations are accurate.

2012-13 and 2013-14 Transitional Comprehensive Curriculum
Algebra IIUnit 7 Advanced Functions 7-19
Tape all the posters to the board and give the groups several minutes to confer and to decide which poster matches which parent graph. Students should not use their graphing calculators at this time.
Call one group of Math Wizards to the front and give the group an index card to assign a parent graph. The group should first model the parent graph using “Function Calisthenics,” then find the poster with that graph, explain why it chose that graph, and discuss what translations, dilations, rotations, or reflections have been applied. The group should write the equation under the graph. Do not evaluate the correctness of the equation until all groups are finished. The other groups are allowed to ask the Math Wizards leading questions about the choice of equations, such as, “Why did you use a negative? Why do you think your graph belongs to that parent graph?”
When all groups are finished, ask if there are any changes the groups want to make in their equations after hearing the other discussions. Calculators should not be used to check. Turn over the graphs to verify correctness.
Hold the Math Wizards accountable for their answers to the questions by assigning points for their answers and have other groups assign points as well..
Activity 6: More Piecewise Functions (GLEs: 4, 6, 7, 10, 16, 19, 24, 25, 27, 28, 29) Materials List: paper, pencil, Picture the Pieces BLM In this activity, the students will use piecewise functions to review the translations of all basic functions. Math Log Bellringer:
(1) Graph ( ) 2 5 00
x if xf x
x if x+ <
= − ≥without a calculator
(2) Find f(−3) and f(4) (3) Find the domain and range
Solutions:
(1) (2) f(−3) = −1, f(4) = −4, (3) D: all reals, R: y < 5 Activity: • Use the Bellringer to review the definition of a piecewise function begun in Unit 1 ≡ a
function made of two or more functions and written as ( ) Domain 1
( )( ) Domain 2
g x if xf x
h x if x∈
= ∈
where Domain 1 omain 2D∩ = ∅ .

2012-13 and 2013-14 Transitional Comprehensive Curriculum
Algebra IIUnit 7 Advanced Functions 7-20
• Picture the Pieces: o Divide students into groups of two or three and distribute the Picture the Pieces BLM. o Have the students work the section Graphing Piecewise Functions and circulate to check
for accuracy. o Have the students work the section Analyzing Graphs of Piecewise Functions, then have
one student write the equation of g(x) on the board and the other students analyze it for accuracy.
o Discuss the application problem as a group, discussing what the students should look for when trying to graph: how many functions are involved, what types of functions are involved, what translations are involved, and what are the restricted domains for each piece of the function?
o When students have finished, assign the application problem in the Activity−Specific Assessments to be completed individually.
Activity 7: Symmetry of Graphs (GLEs: 4, 6, 7, 16, 25, 27, 28) Materials List: paper, pencil, graphing calculator, Even & Odd Functions Discovery Worksheet BLM In this activity, students will discover how to determine if a function is symmetric to the y-axis, the origin, or other axes of symmetry. Math Log Bellringer: Graph without a calculator.
(1) f(x): y = (x)2 , f(–x): y = (–x)2 −f(x): y = –x2 (2) f(x): y = log x, f(–x): y = log (–x) –f(x): y = –log x (3) Discuss the translations made by f(−x) and −f(x).
Solutions:
(1) , ,
(2) , , (3) f(−x) rotates the parent graph around the y-axis and −f(x) rotates the parent
graph around the x-axis

2012-13 and 2013-14 Transitional Comprehensive Curriculum
Algebra IIUnit 7 Advanced Functions 7-21
Activity: • Use the Bellringer to review the reflections f(–x) and –f(x) covered in Activity 3. • Even and Odd Functions:
o Distribute the Even & Odd Functions Discovery Worksheet BLM. o This is a guided discovery worksheet. Give the students an opportunity to graph in their
notebooks the functions in the Rotations Revisited section. Circulate to make sure they have mastered the concept.
o Even & Odd Functions Graphically: Ask the students which of the parent functions in the Bellringer and the worksheet have the property that the graphs of f(–x) and f(x) match. (Solutions: f(x) = x2 and f(x) = |x|.) Define these as even functions and note that this does not necessarily mean that every variable has an even power. Ask what kind of symmetry they have in common. (Solution: symmetric to the y-axis)
o Ask the students which of the parent functions in the Bellringer and the worksheet have the property that the graphs of f(–x) and –f(x) match. (Solutions: f(x) = x3, ( ) 3f x x= ,
( ) 1f xx
= , f(x) = x). Define these as odd functions. Ask what kind of symmetry they
have in common. (Solution: symmetric to the origin) Discuss what symmetry to the origin means (i.e. same distance along a line through the origin.)
o Have students graph y = x3 + 1 and note that just because it has an odd power does not mean it is an odd function. Ask the students which of the parent functions do not have any symmetry and are said to be neither even nor odd?
Solution: f(x) = log x, f(x) = 2x, ( ) f x x= o Even & Odd Functions Numerically: Have students work this section and ask for answers
and justifications. Discuss whether the seven sets of ordered pairs are enough to prove that a function is even or odd. For example in h(x), h(–3) = h(3), but the rest of the sets do not follow this concept.
o Even & Odd Functions Analytically: In order to prove whether a function is even or odd, the student must substitute (–x) for every x and determine if f(–x) = f(x), if f(–x) = –f(x), or if neither substitution works. Demonstrate the process on the first problem and allow students to complete the worksheet circulating to make sure the students are simplifying correctly after substituting −x.
Activity 8: History, Data Analysis, and Future Predictions Using Statistics (GLEs: 4, 6, 10,
19, 20, 22, 24, 28, 29; CCSSs: RST.11-12.3, WHST.11-12.7) Materials List: paper, pencil, graphing calculator, Modeling to Predict the Future BLM, Modeling to Predict the Future Rubric BLM This activity has not changed because it already incorporates these CCSSs. This activity culminates the study of the ten families of functions. Students will collect current real-world data and decide which function best matches the data, then use that model to extrapolate to predict the future.

2012-13 and 2013-14 Transitional Comprehensive Curriculum
Algebra IIUnit 7 Advanced Functions 7-22
Math Log Bellringer:
Enter the following data into your calculator. Enter 98 for 1998 and 100 for 2000, etc., making year the independent variable and # of stock in millions, (i.e., use 4.551 million for 4,550,678), the dependent variable. Sketch a scatter plot and find the linear regression and correlation coefficient. Discuss whether a linear model is good for this data. Use the model to find the number of stocks that will be traded in 2012. (i.e., Find f (112).)
year 1998 1999 2000 2001 2002 2003 # of GoMath stocks traded
4, 550,678 4, 619,700 4,805,230 5, 250, 100 5,923,010 7, 000, 300
Solution:
The linear model does not follow the data very well and the correlation coefficient is only 0.932. It should be closer to 1. In 2012, 10,812,124 stocks will be traded.
Activity: • Use the Bellringer to review the processes of entering data, plotting the data, turning on
Diagnostics to see the correlation coefficient, and finding a regression equation. Review the meaning of the correlation coefficient.
• Discuss why use 98 instead of 1998 and 4.551 instead of 4, 550,678 − the calculator will
round off, too, using large numbers. Students could also use 8 for 1998 and 10 for 2000. • Have each row of students find a different regression equation to determine which one best
models the data, graph it with ZOOM , Zoom Stat and on a domain of 80 to 120 (i.e. 1980 − 2020), and use their models to predict how many GoMath stocks will be traded in 2012.
Solutions:
In 2012, 26,960,314 stocks will be traded.

2012-13 and 2013-14 Transitional Comprehensive Curriculum
Algebra IIUnit 7 Advanced Functions 7-23
In 2012, 45,164,048 stocks will be traded.
R2 = .99987079. In 2012, 56,229,191 stocks will be traded.
In 2012, 10,513,331 stocks will be traded.
In 2012, 14,122,248 stocks will be traded.
In 2012, 13,387,785 stocks will be traded.
• Discuss which model is the best, based on the correlation coefficient. (Solution: quartic) • Discuss real-world consequences and what model would be the best based on end-behavior.
Discuss extrapolation and its reasonableness. Suggested Reasoning: Extrapolation is reasonable if the model follows the same trend. Extrapolation too far in the future is usually unreasonable.
• Have students add the following scenario to their data: In 1997, only 1 million shares of
stock were traded the first year they went public. (1) Have students find quartic regression and the number of stocks traded in 2012 and
discuss the correlation. Solution: R2 = .9918924557… The correlation coefficient is good, but the leading coefficient is negative indicating that end-behavior is down, and hopefully the stock will not go down in the future. In 2012, −597,220,566 stocks will be traded

2012-13 and 2013-14 Transitional Comprehensive Curriculum
Algebra IIUnit 7 Advanced Functions 7-24
(2) Have students find the cubic regression and the number of stocks traded in 2012 and discuss the correlation.
Solution: The R2 is not as good but the trend seems to match better because of the end−behavior. In 2012, 181,754,238 stocks will be traded.
(3) Discuss how outliers may throw off a model and should possibly be deleted to get a more realistic trend.
• Modeling to Predict the Future Data Analysis Project: This is an out-of-class end-of-unit activity. The students may work alone or in pairs. They
will collect data for the past twenty years concerning statistics for their city, parish, state, or US, trace the history of the statistics discussing reasons for outliers, evaluate the economic impact, and find a regression equation that best models the data. They should use either the regression equation on the calculator or the trendline on an Excel® spreadsheet. They will create a PowerPoint® presentation of the data including pictures, history, economic impact, spreadsheet or the calculator graph of regression line and equation, and future predictions.
Distribute the Modeling to Predict the Future BLM with the directions for the data analysis project and the Modeling to Predict the Future Rubric BLM. Then discuss the objectives of the project and the list of possible data topics.
Timeline: 1. Have students bring data to class along with a problem statement (why they are
examining this data) three days after assigned, so it can be approved and they can begin working on it under teacher direction.
2. The students will utilize one to two weeks of individual time in research and project compilation, and two to three days of class time for analysis and computer use if necessary.
Discuss each of the headings on the Blackline Master: 1. Research: Ask each group to choose a different topic concerning statistical data for
their city, parish, state, or for the US. List the topics on the board and have each group select one. The independent variable should be years, and there must be at least twenty years of data with the youngest data no more than five years ago. The groups should collect the data, analyze the data, research the history of the data, and take relevant pictures with a digital camera.
2. Calculator/Computer Data Analysis: Students should enter the data into their graphing calculators, link their graphing calculators to the computer, and download the data into a spreadsheet, or they should enter their data directly into the spreadsheet. They should create a scatterplot and regression equation or trendline of the data points using the correlation coefficient (called R−squared value in a spreadsheet) to determine if the function they chose is reliable. They should be able to explain why they chose this function, based on the correlation coefficient as well as function characteristics. (e.g., end-behavior, increasing decreasing, zeros).
3. Extrapolation: Using critical thinking skills concerning the facts, have the students make predictions for the next five years and explain the limitations of the predictions.

2012-13 and 2013-14 Transitional Comprehensive Curriculum
Algebra IIUnit 7 Advanced Functions 7-25
4. Presentation: Have students create a PowerPoint® presentation including the graph, digital pictures, economic analysis, historical synopsis, and future predictions.
5. Project Analysis: Ask each student to type a journal entry indicating what he/she learned mathematically, historically, and technologically, and express his/her opinion of how to improve the project. If students are working in pairs, each student in the pair must have his/her own journal.
Final Product: Each group must submit: 1. A flash drive containing the PowerPoint® presentation with the slides listed in BLM. 2. A print-out of the slides in the presentation. 3. Release forms signed by all people in the photographs. (Regulations regarding
release forms and the forms themselves are relative to individual school districts.) 4. Project Analysis 5. Rubric
• Have students present the information to the class. Either require the students to also present in another one of their classes or award bonus points for presenting in another class. As the students present, use the opportunity to review all the characteristics of the functions studied during the year.
2013-2014 Activity 9: Modeling with Trigonometric Functions (CCSS: F.TF.5, RST.11-12.4) Materials List: paper, pencil, graphing calculator, Discovering Trigonometric Graphs BLM, Modeling with Trigonometric Functions BLM In this activity, students will be introduced to sinusoidal waves to model periodic data. Math Log Bellringer: Distribute the Discovering Trigonometric Graphs BLM. With a partner, have students complete the vocabulary self-awareness (view literacy strategy descriptions) chart. Vocabulary self-awareness is valuable because it highlights students’ understanding of what they know, as well as what they still need to learn in order to fully comprehend the concept. Students indicate their understanding of a term/concept, but then adjust or change the marking to reflect their change in understanding. The objective is to have all terms marked with a + at the end of the unit. They should rate their personal understanding of each concept with either a “+” (understand well), “” (limited understanding or unsure), or a “−” (don’t know), and then write a short description for each concept. Have students refer to the chart later in the unit to determine if their personal understanding has improved and revise their descriptions of each term.
Mathematical Terms + − Short description 1 modeling 2 scatter plot 3 best fit equation
4 regression equation 5 interpolate

2012-13 and 2013-14 Transitional Comprehensive Curriculum
Algebra IIUnit 7 Advanced Functions 7-26
6 extrapolate 7 translation 8 reflection 9 dilation
10 periodic function 11 fundamental period 12 frequency 13 amplitude 14 midline 15 sin θ 16 cos θ 17 sinusoidal curve
Activity: • After the students have completed the vocabulary self-awareness chart on the Discovering
Trigonometric Graphs BLM, have students quickly share their answers to #1-9. These terms have been used throughout Units 1-7 so should be review and mostly “+”. Postpone the discussion of #10-14 until after the 2nd problem.
• Have students refer to the graph in “New Characteristics of a Graph” on the Discovering
Trigonometric Graphs BLM to conjecture answers to the questions. Discuss their answers and have students revisit their vocabulary self-awareness charts to refine their definitions. Sample definitions:
o periodic ≡ a periodic function is a function that repeats its values in regular intervals or periods.
o fundamental period ≡ the length of a smallest continuous portion of the domain over which the function completes a cycle.
o frequency ≡ the number of occurrences of a repeating event per unit time. The period is the duration of one cycle in a repeating event, so the period is the reciprocal of the frequency.
o midline ≡ a horizontal line halfway between maximum and minimum point of a periodic function.
o amplitude ≡ the distance from the midline to the highest or lowest point of the function.
• Have the students complete the back of the Discovering
Trigonometric Graphs BLM applying these definitions to the sine and cosine curves. • After checking the answers for the graphs, assign the Modeling with Trigonometric
Functions BLM in class or as a home assignment. 2013-2014

2012-13 and 2013-14 Transitional Comprehensive Curriculum
Algebra IIUnit 7 Advanced Functions 7-27
opposite leg
adjacent leg
Θ
hypotenuse
Activity 10: Trigonometric Functions and the Pythagorean Identity (CCSS: F.TF.8, RST.11-12.4)
Materials List: paper, pencil, graphing calculator, Pythagorean Identity for Trig Functions BLM, Properties of Functions BLM In this activity, students will prove the Pythagorean Identity for Trigonometric functions and use it to find values of sin, cos and tan in all quadrants. Math Log Bellringer: Remember the right triangle trig formulas you learned in geometry to answer the following questions concerning the given right triangle: (1) sin Θ = ________ (2) cos Θ = ________ (3) tan Θ = ________ Solutions: (1) 3/5, (2) 4/5, (3) ¾ Activity: • Use the Bellringer to ascertain how much the students remember about the right triangle trig
ratios: If Θ is an acute angle in a right triangle then,
• Distribute the Pythagorean Identity for Trig Functions BLM and allow students to complete it with a partner and allow them to share their answers.
• Point out to students that cos2θ is the same thing as (cos θ)2 so the Pythagorean Identity could also be written cos2θ + sin2θ = 1.
• Assign the following problems. Students should use the Pythagorean Identities to find the following:
(1) 45
sinθ = , find cos Θ in Quadrant II
(2) 513
cosθ = − , find tan Θ in Quadrant III
(3) 16
sinθ = − , find cos θ in Quadrant IV
Solutions: (1) 35
− (2) 125
(3) 356
3
4
Θ
opposite legsinhypotenuseadjacent legcoshypotenuse
opposite legtanadjacent leg
θ
θ
θ
=
=
=

2012-13 and 2013-14 Transitional Comprehensive Curriculum
Algebra IIUnit 7 Advanced Functions 7-28
• Now that all the properties of the parent graphs have been addressed, distribute the Properties of Functions BLM on which students should individually complete the word grid (view literacy strategy descriptions) and then compare their answers with a partner. The completed word grid can serve as a review tool for students as they prepare for the final assessment on this chapter. (A sample section of the Properties of Functions Word Grid is presented below.)
Sample Assessments
General Assessments
• Use Math Log Bellringers as ongoing informal assessments. • Collect the Little Black Books of Algebra II Properties and grade for completeness at the
end of the unit. • Monitor student progress using small quizzes to check for understanding during the unit
on such topics as the following: (1) speed graphing basic graphs (2) vertical and horizontal shifts (3) coefficient changes to graphs (4) absolute value changes to graphs (5) even and odd functions
• Administer one comprehensive assessment about translations, reflections, shifts of functions, and graphing piecewise functions.
Activity-Specific Assessments Teacher Note: Critical Thinking Writings are used as activity-specific assessments in many of the activities in every unit. Post the following grading rubric on the wall for students to refer to throughout the year.
2 pts. - answers in paragraph form in complete sentences with
proper grammar and punctuation 2 pts. - correct use of mathematical language 2 pts. - correct use of mathematical symbols 3 pts./graph - correct graphs (if applicable) 3 pts./solution - correct equations, showing work, correct answer

2012-13 and 2013-14 Transitional Comprehensive Curriculum
Algebra IIUnit 7 Advanced Functions 7-29
3 pts./discussion - correct conclusion
• Activity 1: Evaluate the Flash That Function flash cards for accuracy and completeness.
• Activity 2: Critical Thinking Writing
Graph the following and discuss the parent function and whether there is a horizontal shift or vertical shift. (1) k(x) = x + 5 (2) ( ) 2g x x= +
(3) ( ) 2h x x= + Solutions: (1) The parent function is the line f(x) = x, and the graph of k(x)
is the same whether you shifted it vertically up 5 or horizontally to the left 5.
(2) and (3)The parent function is greatest integer ( ) f x x= , and both graphs are the same even though
g(x) is shifted up 2 and h(x) is shifted to the right 2.
• Activity 6: Critical Thinking Writing
Mary is diabetic and takes long-acting insulin shots. Her blood sugar level starts at 100 units at 6:00 a.m. She takes her insulin shot, and the blood sugar increase is modeled by the exponential function f(t) = Io(1.5t) where Io is the initial amount in the blood stream and rises for two hours. The insulin reaches its peak effect on the blood sugar level and remains constant for five hours. Then it begins to decline for five hours at a constant rate and remains at Io until the next injection the next morning. Let the function i(t) represent the blood sugar level at time t measured in hours from the time of injection. Write a piecewise function to represent Mary’s blood sugar level. Graph i(t) and find the blood sugar level at (a) 7:00 a.m. (b) 10:00 a.m. (c) 5:00 p.m. (d) midnight. (e) Discuss the times in which the function is increasing, decreasing and constant.
Solution:
( )100 1.5 0 2
225 2 7( )
25( 7) 225 7 12
100 12 24
t if t
if ti t
t if t
if t
≤ ≤ ≤ ≤= − − + ≤ ≤
≤ ≤
(a) 150 units, (b) 225 units, (c) 125 units, (d) 100 units,

2012-13 and 2013-14 Transitional Comprehensive Curriculum
Algebra IIUnit 7 Advanced Functions 7-30
(e) The function is increasing from6:00 a.m. to 8:00 a.m., constant from 8:00 a.m. to 1:00 p.m., decreasing from 1:00 p.m. to 6:00 p.m. and constant from 6:00 p.m. to 6:00 a.m.
• Activity 7: Critical Thinking Writing
Discuss other symmetry you have learned in previous units, such as the axis of symmetry in a parabola or an absolute value function and the symmetry of inverse functions. Give some example equations and graphs and find the lines of symmetry.
• Activity 8: Modeling to Predict the Future Data Research Project
Use the Modeling to Predict the Future Rubric BLM to evaluate the research project discussed in Activity 8.

2012-13 and 2013-14 Transitional Comprehensive Curriculum
Algebra IIUnit 8Conic Sections 8-1
Algebra II Unit 8: Conic Sections
Time Frame: Approximately three weeks Unit Description This unit focuses on the analysis and synthesis of graphs and equations of conic sections and their real-world applications. Student Understandings The study of conics helps students relate the cross-curriculum concepts of art and architecture to math. They define parabolas, circles, ellipses, and hyperbolas in terms of the distance of points from the foci. Students identify various conic sections in real-life examples and in symbolic equations. Students solve systems of conic and linear equations with and without technology. Guiding Questions
1. Can students use the distance formula to define and generate the equation of each conic?
2. Can students complete the square in a quadratic equation? 3. Can students transform the standard form of the equations of parabolas, circles,
ellipses, and hyperbolas to graphing form? 4. Can students identify the major parts of each of the conics from their graphing
equations and can they graph the conics? 5. Can students formulate the equations of each of these conics from their graphs? 6. Can students find real-life examples of these conics, determine their equations, and
use the equations to solve real-life problems? 7. Can students identify these conics given their standard and graphing equations? 8. Can the students predict how the graphs will be transformed when certain parameters
are changed? Unit 8 Grade-Level Expectations (GLEs) Teacher Note: The individual Algebra II GLEs are sometimes very broad, encompassing a variety of functions. To help determine the portion of the GLE that is being addressed in each unit and in each activity in the unit, the key words have been underlined in the GLE list, and the number of the predominant GLE has been underlined in the activity.

2012-13 and 2013-14 Transitional Comprehensive Curriculum
Algebra IIUnit 8Conic Sections 8-2
GLE # GLE Text and Benchmarks Algebra 4. Translate and show the relationships among non-linear graphs, related
tables of values, and algebraic symbolic representations (A-1-H) 5. Factor simple quadratic expressions including general trinomials, perfect
squares, difference of two squares, and polynomials with common factors (A-2-H)
6. Analyze functions based on zeros, asymptotes, and local and global characteristics of the function (A-3-H)
7. Explain, using technology, how the graph of a function is affected by change of degree, coefficient, and constants in polynomial, rational, radical
9.
, exponential, and logarithmic functions (A-3-H) Solve quadratic equations by factoring, completing the square, using the quadratic formula, and graphing (A-4-H)
10. Model and solve problems involving quadratic, polynomial
Geometry
, exponential, logarithmic, step function, rational, and absolute value equations using technology (A-4-H)
16. Represent translations, reflections, rotations, and dilations of plane figures using sketches, coordinates
Patterns, Relations, and Functions , vectors, and matrices (G-3-H)
24. Model a given set of real-life data with a non-linear function (P-1-H) (P-5-H) 27. Compare and contrast the properties of families of polynomial
28.
, rational, exponential, and logarithmic functions, with and without technology (P-3-H) Represent and solve problems involving the translation of functions in the coordinate plane (P-4-H)
29. Determine the family or families of functions that can be used to represent a given set of real-life data, with and without technology (P-5-H)
ELA CCSS CCSS # CCSS Text Reading Standards for Literacy in Science and Technical Subjects 6-12 RST.11-12.3 Follow precisely a complex multistep procedure when carrying out
experiments, taking measurements, or performing technical tasks; analyze the specific results based on explanations in the text.
RST.11-12.4 Determine the meaning of symbols, key terms, and other domain-specific words and phrases as they are used in a specific scientific or technical context relevant to grades 11–12 texts and topics.
Writing Standards for Literacy in History/Social Studies, Science and Technical Subjects 6-12 WHST.11-12.2d Use precise language, domain-specific vocabulary and techniques such as
metaphor, simile, and analogy to manage the complexity of the topic; convey a knowledgeable stance in a style that responds to the discipline and context as well as to the expertise of likely readers.

2012-13 and 2013-14 Transitional Comprehensive Curriculum
Algebra IIUnit 8Conic Sections 8-3
Sample Activities
Ongoing Activity: Little Black Book of Algebra II Properties Materials List: black marble composition book, Little Black Book of Algebra II Properties BLM Activity: • Have students continue to add to the Little Black Books they created in previous units which
are modified forms of vocabulary cards (view literacy strategy descriptions). When students create vocabulary cards, they see connections between words, examples of the word, and the critical attributes associated with the word such as a mathematical formula or theorem. Vocabulary cards require students to pay attention to words over time, thus improving their memory of the words. In addition, vocabulary cards can become an easily accessible reference for students as they prepare for tests, quizzes, and other activities with the words. These self-made reference books are modified versions of vocabulary cards because, instead of creating cards, the students will keep the vocabulary in black marble composition books (thus the name “Little Black Book” or LBB). Like vocabulary cards, the LBBs emphasize the important concepts in the unit and reinforce the definitions, formulas, graphs, real-world applications, and symbolic representations.
• At the beginning of the unit, distribute copies of the Little Black Book of Algebra II Properties BLM for Unit 8. This is a list of properties in the order in which they will be learned in the unit. The BLM has been formatted to the size of a composition book so students can cut the list from the BLM and paste or tape it into their composition books to use as a table of contents.
• The student’s description of each property should occupy approximately one-half page in the LBB and include all the information on the list for that property. The student may also add examples for future reference.
• Periodically check the Little Black Books and require that the properties applicable to a general assessment be finished by the day before the test, so pairs of students can use the LBBs to quiz each other on the concepts as a review.
Conic Sections
8.1 Circle – write the definition, provide examples of both the standard and graphing
forms of the equation of a circle, show how to graph circles, and provide a real-life example in which circles are used.
8.2 Parabola – write the definition, give the standard and graphing forms of the equation of a parabola and show how to graph them in both forms, find the vertex from the equation and from the graph, give examples of the equations of both vertical and horizontal parabolas and their graphs, find equations for the directrix and axis of symmetry, identify the focus, and provide real-life examples in which parabolas are used

2012-13 and 2013-14 Transitional Comprehensive Curriculum
Algebra IIUnit 8Conic Sections 8-4
8.3 Ellipse – write the definition, write standard and graphing forms of the equation of an ellipse and graph both vertical and horizontal, locate and identify foci, vertices, major and minor axes, explain the relationship of a, b, and c, and provide a real-life example in which an ellipse is used.
8.4 Hyperbola – write the definition, write the standard and graphing forms of the equation of a hyperbola and graph both vertical and horizontal, identify vertices, identify transverse and conjugate axes and provide an example of each, explain the relationships between a, b, and c, find foci and asymptotes, and give a real-life example in which a hyperbola is used.
Activity 1: Deriving the Equation of a Circle (GLEs: 4, 5, 7, 9, 10, 16, 27, 28) Materials List: paper, pencil, graphing calculator, Math Log Bellringer BLM In this activity, students will review the concepts of the Pythagorean theorem and the distance formula studied in Algebra I in order to derive the equation of a circle from its definition. Math Log Bellringer:
(1) Draw a right triangle with legs that measure 6 and 7 units and find the length of the hypotenuse.
(2) Find the distance between the points (x, y) and (1, 3). (3) Define a circle.
Solutions: (1)
(2) ( ) ( )2 21 3d x y= − + − , (3) Set of all points in a plane equidistant from a fixed point.
Activity: • Overview of the Math Log Bellringers: As in previous units, each in-class activity in Unit 8 is started with an activity called a
Math Log Bellringer that either reviews past concepts to check for understanding (i.e. reflective thinking about what was learned in previous classes or previous courses) or sets the stage for an upcoming concept (i.e., predictive thinking for that day’s lesson).
A math log is a form of a learning log (view literacy strategy descriptions) that students keep in order to record ideas, questions, reactions, and new understandings. Documenting ideas in a log about how content’s being studied forces students to “put into words” what they know or do not know. This process offers a reflection of understanding that can lead to further study and alternative learning paths. It combines writing and reading with content learning. The Math Log Bellringers will include mathematics done symbolically, graphically, and verbally.
6
7
85

2012-13 and 2013-14 Transitional Comprehensive Curriculum
Algebra IIUnit 8Conic Sections 8-5
Since Bellringers are relatively short, blackline masters have not been created for each of them. Write them on the board before students enter class, paste them into an enlarged Word® document or PowerPoint® slide, and project using a TV or digital projector, or print and display using a document or overhead projector. A sample enlarged Math Log Bellringer Word® document has been included in the blackline masters. This sample is the Math Log Bellringer for this activity.
Have the students write the Math Log Bellringers in their notebooks preceding the upcoming lesson during beginning−of−class record keeping, and then circulate to give individual attention to students who are weak in that area.
• Compare the Pythagorean Theorem used in the Bellringer to the distance formula, and have
students use this to derive the graphing form of the equation of a circle with the center at the origin.
( ) ( )2 2
2 2
2 2 2
0 0r x y
r x y
r x y
= − + −
= +
= +
• Apply the translations learned in Unit 7 to create the graphing form of equation of a circle
with the center at (h, k) and radius = r: (x – h)2 + (y – k)2 = r2. • Use the math textbook for practice problems: (1) finding the equation of a circle given the
center and radius, (2) graphing circles given the equation in graphing form. • Have students expand the graphing form of a circle with center (−5, 3) and radius = ½
to derive the standard form of an equation of a circle. Ax2 + By2 + Cx + Dy + E = 0 where A = B.
Solution: (x + 5)2 + (y – 3)2 = (½)2 x2 + 10x + 25 + y2 − 6y + 9 = ¼ 4x2 + 40x + 100 + 4y2 − 24y + 36 = 1 4x2 + 4y2 + 40x − 24y + 135 = 0 • Review the method of completing the square introduced in Unit 5, Activity 3. Have students
use the method of completing the square to transform the standard form of the circle above back to graphing form in order to graph the circle.
Solution: 4x2 + 4y2 + 40x − 24y + 135 = 0 rearrange grouping variables 4x2 + 40x + 4y2 − 24y = −135 factor coefficient on squared terms 4(x2 + 10x) + 4(y2 − 6y) = −135 complete the square 4(x2 + 10x + 25) + 4(y2 − 6y + 9) = 1 4(x + 5)2 + 4(y − 3)2 = 1 divide by coefficient (x + 5)2 + (y − 3)2 = ¼ identify the center and radius center (−5, 3), radius = ½ • Use the math textbook for practice problems finding the graphing form of the equation of a
circle given the standard form.
(x, y) r

2012-13 and 2013-14 Transitional Comprehensive Curriculum
Algebra IIUnit 8Conic Sections 8-6
• Have students graph a circle on their graphing calculators. This should include a discussion
of the following: 1. Functions: The calculator is a function grapher, and a circle is not a function. 2. Radicals: In order to graph a circle, isolate y and take
the square root of both sides creating two functions. Graph both y1 = positive radical and y2 = negative radical or enter y2 = −y1
3. Calculator Settings: o ZOOM , 5:ZSquare to set the window so the graph looks circular. The circle may
not look like it touches the x−axis because there are only a finite number of pixels (94 pixels on the TI−83 and TI−84 calculators) that the graph evaluates. The x-intercepts may not be one of these.
o Set the MODE for SIMUL to allow both halves of the circle to graph simultaneously and HORIZ to see the graph and equations at the same time.
• Have students bring in pictures of something in the real-life world with a circular shape for
an application problem in Activity 2. Activity 2: Circles - Algebraically and Geometrically (GLEs: 9, 10, 16, 24, 28) Materials List: paper, pencil, graphing calculators, pictures of real-world circles, Circles & Lines Discovery Worksheet BLM, one copy of Circles in the Real World − Math Story Problem Chain Example BLM for an example In this activity, students will review geometric properties of a circle and equations of lines to find equations of circles and apply to real-life situations. Math Log Bellringer:
(1) Draw a circle and draw a tangent, secant, and chord for the circle and define each. (2) What is the relationship of a tangent line to a radius? (3) What is the relationship of a radius perpendicular to a chord? (4) Find the equation of a line perpendicular to y = 2x and through the
point (6, 10). Solutions:
(1) tangent line ≡ A line in the same plane as the circle which intersects the circle at one point. secant line ≡ A line that intersects the circle at two points. chord ≡ A segment that connects two points on a circle.

2012-13 and 2013-14 Transitional Comprehensive Curriculum
Algebra IIUnit 8Conic Sections 8-7
(2) The tangent line is perpendicular to the radius of the circle at the point of tangency.
(3) A radius which is perpendicular to a chord also bisects the chord. (4) y = – ½ x + 13
Activity: • Use the Bellringer to review relationships between lines and circles and finding equations of
lines. Give the following problem to practice: (a) Graph the circle x2 + y2 = 25 by hand. (b) Find the slope of the radius through the point (3, 4) and slope of a line tangent to the
circle through the point (3, 4) (c) Find the equation of the tangent line in point-slope form through the point (3, 4). (d) Graph the circle and the line on the graphing calculator to check.
Solutions:
(b) slope of radius = 43
, slope of tangent line = 34
−
(c) ( )34 34
y x− = − −
(d)
• Graphing Circles & Lines: Put students in groups of four and distribute the Circles & Lines Discovery Worksheet
BLM. On this worksheet, the students will combine their knowledge of the distance formula and relationships of circles to tangent lines to find equations of circles and to graph them.
When the students get to problem #7, they will use the real-world pictures of circles they brought in to write a modified text chain (view literacy strategy descriptions). The text chain strategy gives students the opportunity to demonstrate their understanding of newly learned material. This form of modified text chains are especially useful in teaching math concepts, while at the same time promoting writing and reading. The process involves a small group of students writing a story problem using the math concepts being learned and then solving the problem. Writing out the problem in a story provides students a reflection of their understanding. This is reinforced as students attempt to answer the story problem. In this text chain the first student initiates the story. The next must solve the first student’s problem to add a second problem, the next, a third problem, etc. All group members should be prepared to revise the story based on the last student’s input as to whether it was clear. Model the process for the students before they begin with the Circles in the Real World − Math Story Problem Chain Example BLM.
When the text chains are complete, check for understanding of circle and linear concepts and correctness by swapping stories with other groups.

2012-13 and 2013-14 Transitional Comprehensive Curriculum
Algebra IIUnit 8Conic Sections 8-8
Activity 3: Developing Equations of Parabolas (GLEs: 4, 5, 6, 7, 9, 10, 16, 24, 27, 28; CCSS: RST.11-12.4)
Materials List: paper, pencil, graphing calculator, graph paper, string, Parabola Discovery Worksheet BLM This activity has not changed because it already incorporates this CCSS. In this activity, students will apply the concept of distance to the definition of a parabola to derive the equations of parabolas, to graph parabolas, and to apply them to real-life situations. Math Log Bellringer: Graph the following by hand:
(1) y = x2 (2) y = x2 + 6 (3) y = (x + 6)2 (4) y = x2 + 2x – 24 (5) Discuss the translations made and why.
Solutions: (1) (2) (3) (4) (5) #2 is a vertical translation up because the constant is on the y as in f(x)+k. #3
is a horizontal translation to the left of the form f(x +k). #3 is translated both horizontally and vertically. Activity: • Use the Bellringer to review the graphs of parabolas as studied in Unit 5 on quadratic
functions. Review horizontal and vertical translations in Bellringer #2 and #3. Review
finding the vertex in Bellringer #4 using ,2 2
b bfa a− −
and finding the zeros by factoring.
• Have students complete the square in Bellringer #4 to put the equation of the parabola in
graphing form, y = a(x − h)2 + k, and discuss translations from this formula that locate the vertex at (h, k). (Solution: y = (x + 1)2 − 25).
• Have the students practice transforming quadratic equations into graphing form and locating
the vertex using the following equations. Compare vertex answers to values of
,2 2
b bfa a− −
. Graph both problem equation and solution equation to determine if the
graphs are coincident. Examine the graphs to determine the effect of a ± leading coefficient.

2012-13 and 2013-14 Transitional Comprehensive Curriculum
Algebra IIUnit 8Conic Sections 8-9
(8, 4)
y = 2
(x, y)
(x, 2)
(1) y = 2x2 + 12x + 7 (2) y = −3x2 + 24x − 42
Solutions: (1) y = 2(x + 3)2 − 11, vertex (−3, −11), opens up (2) y = −3(x − 4)2 + 6, vertex (4, 6), opens down • Define a parabola ≡ set of points in a plane equidistant from a point called the focus and a
line called the directrix. Identify these terms on a sketch. Parabolas can be both vertical and horizontal. Demonstrate this definition using the website, www.explorelearning.com.
• Discuss real-life parabolas. If a ray of light or a sound wave travels in a path parallel to the axis of symmetry and strikes a parabolic dish, it will be reflected to the focus where the receiver is located in satellite dishes, radio telescopes, and reflecting telescopes.
• Discovering Parabolas: Divide students in pairs and distribute two sheets of graph paper, a piece of string, and
the Parabola Discovery Worksheet BLM. This is a guided discovery sheet with the students stopping at intervals to make sure they are making the correct assumptions.
In I. Vertical Parabolas, the students will use the definition of parabola and two equal lengths on the string to plot points that form a parabola. Demonstrate finding several of the points to help the students begin. Locate the vertex.
Label one of the points on the parabola (x, y) and the corresponding point on the directrix (x, 2). Discuss the definition of parabola and how to use the distance formula to find the equation of the parabola.
Solution: The distance from the focus to any point on the parabola (x, y) equals the distance from that point (x, y) to the directrix;
therefore, ( ) ( ) ( ) ( )2 2 2 28 4 2x y x x y− + − = − + − .

2012-13 and 2013-14 Transitional Comprehensive Curriculum
Algebra IIUnit 8Conic Sections 8-10
Have students expand this equation and isolate y to write the equation in standard form. Use completing the square to write the equation in graphing form and to find the vertex.
Solution: 21 4 194
y x x= − + , ( )21 8 34
y x= − + , vertex (8, 3)
In II. Horizontal Parabolas, the students should use the string to sketch the horizontal parabola and to find the equation without assistance. Check for understanding when they have completed this section.
Help students come to conclusions about the standard form and graphing form of vertical and horizontal parabolas and how to find the vertex in each. o Vertical parabola:
Standard form: y = Ax2 + Bx + C, vertex: ,2 2
b bfa a− −
Graphing form: y = A(x − h)2 + k, vertex (h, k)
o Horizontal parabola:
Standard form: x = Ay2 + By + C, vertex: ,2 2
b bfa a
− −
.
This is not a function of x but it is a function of y. Graphing form: x = A(y − k)2 + h, vertex (h, k)
In III. Finding the Focus, have the students answer questions #1 relating the leading coefficient to the location of the focus and #2 helping students come to the conclusion that the closer the focus is to the vertex, the narrower the graph. Allow students to complete the worksheet.
Check for understanding by giving the students the following application problem. (If an
old satellite dish is available, use the dimensions on it to find the location of its receiver.) A satellite is 18 inches wide and 2 inches at its deepest part. What is the equation of the parabola? (Hint: Locate the vertex at the origin and write the equation in the form y = ax2.) Where should the receiver be located to have the best reception? Hand in a graph and its equation showing all work. Be sure to answer the question in a complete sentence and justify the location.
Solution: 2118
y x= . The receiver should be located 4½ inches above the vertex.

2012-13 and 2013-14 Transitional Comprehensive Curriculum
Algebra IIUnit 8Conic Sections 8-11
major axis
minor axis focal radii
focus focus
Activity 4: Discovering the Graphing Form of the Equation of an Ellipse (GLEs: 4, 5, 7, 9,
10, 16, 24, 27, 28; CCSS: RST.11-12.4) Materials List: graph paper on cardboard, two tacks and string for each group, Ellipse Discovery Worksheet BLM, paper, pencil This activity has not changed because it already incorporates this CCSS. In this activity, students will apply the definition of an ellipse to sketch the graph of an ellipse and to discover the relationships between the lengths of the focal radii and axes of symmetry. They will also find examples of ellipses in the real world. Math Log Bellringer: (1) Draw an isosceles triangle with base = 8 and legs = 5. Find the length of the altitude. (2) Discuss several properties of isosceles triangles.
Solutions: (1)
(2) An isosceles triangle has congruent sides and congruent base angles. The
altitude to the base of the isosceles triangle bisects the vertex angle and the base.
Activity: • Define ellipse ≡ set of all points in a plane in which the sum
of the focal radii is constant. Draw an ellipse and locate the major axis, minor axis, foci, and focal radii. Ask for some examples of ellipses in the real world, such as the orbit of the earth around the sun.
• Discovering Ellipses: Divide students into groups of three. Give each group a
piece of graph paper glued to a piece of cardboard. On the cardboard are two points on one of the axes, evenly spaced from the origin, and a piece of string with tacks at each end. Each group should have a different set of points and a length of string. On the back of each cardboard, write the equation of the ellipse that will be sketched. Sample foci, string sizes and equations below:
Group 1: foci (±3, 0), string 10 units, equation 2 2
125 16x y
+ =
5 5
8
3

2012-13 and 2013-14 Transitional Comprehensive Curriculum
Algebra IIUnit 8Conic Sections 8-12
Group 2: foci (0, ±3), string 10 units, equation 2 2
116 25x y
+ =
Group 3: foci (±4, 0), string 10 units, equation 2 2
125 9x y
+ =
Group 4: foci (0, ±4), string 10 units, equation 2 2
19 25x y
+ =
Group 5: foci (±6, 0), string 20 units, equation 2 2
1100 64x y
+ =
Group 6: foci (0, ±6), string 20 units, equation 2 2
164 100x y
+ =
Group 7: foci (±8, 0), string 20 units, equation 2 2
136 100x y
+ =
Group 8: foci (0, ±8), string 20 units, equation 2 2
1100 36x y
+ =
Distribute the Ellipse Discovery Worksheet BLM and have groups follow directions
independently to draw an ellipse. After all ellipses are taped to the board, review the answers to the questions to make sure they have come to the correct conclusions.
Use the graphs on the board to draw conclusions about the location of major and minor axes and the relationships with the foci and focal radii. Clarify the graphing form for the
equation of an ellipse with center at the origin. (i.e. horizontal ellipse: 2 2
2 2 1x ya b
+ = ,
vertical ellipse: 2 2
2 2 1x yb a
+ = )
Discuss how the graphing form will change if the center is moved away from the origin
and to a center at (h, k) relating the new equations to the translations studied in previous
units. (i.e. horizontal ellipse: ( ) ( )2 2
2 2 1x h y k
a b− −
+ = , vertical ellipse:
( ) ( )2 2
2 2 1x h y k
b a− −
+ = )
• Demonstrate the definition of ellipse by having the students use the website,
www.explorelearning.com , to discover what the distance between foci does to the shape of the ellipse. (i.e., The closer the foci, the more circular the ellipse.)
• Critical Thinking Writing Activity: Assign each group one real-life application to research,
find pictures of, and discuss the importance of the foci (e.g., elliptical orbits, machine gears, optics, telescopes, sports tracks, lithotripsy, and whisper chambers).

2012-13 and 2013-14 Transitional Comprehensive Curriculum
Algebra IIUnit 8Conic Sections 8-13
Activity 5: Equations of Ellipses in Standard Form (GLEs: 4, 5, 7, 9, 10, 16, 24, 27, 28) Materials List: paper, pencil In this activity, students will determine the standard form of the equation of an ellipse and will complete the square to transform the equation of an ellipse from standard to graphing form. Math Log Bellringer:
(1) Graph ( ) ( )2 22 31
25 9x y− +
+ = by hand. What is the center and the values of a and b
from the graphing form of the equation? (2) Find the foci and explain how. (3) Expand the equation so that there are no fractions and isolate zero. (4) Discuss the difference in this expanded form of an ellipse and the expanded of a
circle. Solutions: (1) Graph to the right. The center is (2, -3), a=5, b=3 (2) c is the distance from the center to each focus. To find c,
use the relationship found in Activity 4 BLM b2 + c2 = a2
⇒ c = 4. Foci: (6, −3) and (−2, −3) (3) 9x2 + 25y2 − 36x + 150y + 36 = 0 (4) The coefficients of x2 and y2 on a circle are equal. On an ellipse, the coefficients are the same sign but are not equal.
Activity: • Use the Bellringer to check for understanding of graphing ellipses and finding foci. • Use the expanded equation in the Bellringer to have students determine the general
characteristics of the standard form of the equation of an ellipse. Compare the standard form of an ellipse to the standard forms of equations of lines, parabolas, and circles. Line: Ax + By + C = 0 (x and y are raised only to the first power. Coefficients may
be equal or not or one of them may be zero.) Parabola: Ax2 + Bx + Cy + D = 0 or Ay2 + By + Cx + D = 0 (only one variable is
squared) Circle: Ax2 + Ay2 + Bx + Cy + D = 0 (both variables are squared with the same
coefficients) Ellipse: Ax2 + By2 + Cx + Dy + E = 0 (both variables are squared with different
coefficients which have the same sign) • Have students determine how to transform the standard form into the graphing form of an
ellipse by completing the square. Assign the Bellringer solution #3 to see if they can transform it into the Bellringer problem.

2012-13 and 2013-14 Transitional Comprehensive Curriculum
Algebra IIUnit 8Conic Sections 8-14
• Have students give their reports on the real-life application assigned in Activity 4. • Assign additional problems in the math textbook. Activity 6: Determining the Equations and Graphs of Hyperbolas (GLEs: 4, 5, 6, 7, 9, 10,
16, 27, 28; CCSS: RST.11-12.4) Materials List: paper, pencil, graphing calculator This activity has not changed because it already incorporates this CCSS. In this activity, students will apply what they have learned about ellipses to the graphing of hyperbolas. Math Log Bellringer:
Determine which of the following equations is a circle, parabola, line, hyperbola or ellipse. Discuss the differences. (1) 9x2 + 16y2 + 18x – 64y – 71=0 (2) 9x + 16y – 36 = 0 (3) 9x2 + 16y – 36 = 0 (4) 9x – 16y2 – 36 = 0 (5) 9x2 + 9y2 – 36 = 0 (6) 9x2 + 4y2 – 36 = 0 (7) 9x2 – 4y2 – 36 = 0
Solutions: (1) ellipse, different coefficients on x2 and y2 but same sign (2) line, x and y are raised only to the first power (3) parabola, only one of the variables is squared (4) parabola, only one of the variables is squared (5) circle, equal coefficients on the x2 and y2 (6) ellipse, different coefficients on x2 and y2 but same sign
(7) hyperbola, opposite signs on the x2 and y2
Activity: • Use the Bellringer to check for understanding in problems #1 through 6. • Students will be unfamiliar with the equation in problem #7. Have the students graph the two
halves on their graphing calculators by isolating y. Reinforce the concept that the calculator is a function grapher and because both variables are squared, this is not a function.
• Define hyperbola ≡ set of all points in a plane in which the difference in the focal radii is
constant. Compare the definition of a hyperbola to the definition of an ellipse and ask what is different about the standard form of the hyperbola. Demonstrate the definition using the website, www.explorelearning.com.

2012-13 and 2013-14 Transitional Comprehensive Curriculum
Algebra IIUnit 8Conic Sections 8-15
conjugate axis
transverse axis focus focus
• Have students transform the equation in Bellringer problem #6 into the graphing form of an
ellipse and graph it by hand. Then have the students transform the equation in Bellringer problem #7 in the same way by isolating 1. Have students graph both on the calculator isolating y and graphing ±y.
Solutions:
(6) 2 2
14 9x y
+ =
(7) 2 2
14 9x y
− =
• Determine the relationships of the numbers in the equation of the hyperbola to the graph. (i.e.
The square root of the denominator under the x2 is the distance from the center to the vertex.) • Have students graph 9y2 – 4x2 = 36 on their calculators and determine how the graph is
different from the graph generated by the equation in Bellringer problem 7. Solution: If x2 has the positive coefficient, the vertices are located on the x−axis. If y2 has the positive coefficient, the vertices are located on the y−axis.
• Isolate 1 in the equation above and compare to Bellringer problem #7. Develop the graphing
form of the equation of a hyperbola with the center at the origin:
1. horizontal hyperbola: 2 2
2 2 1x ya b
− = 2. vertical hyperbola: 2 2
2 2 1y xa b
− = .
• Discuss transformations and develop the graphing form of the equations of a hyperbola with
the center at (h, k):
1. horizontal hyperbola: ( ) ( )2 2
2 2 1x h y k
a b− −
− =
2. vertical hyperbola: ( ) ( )2 2
2 2 1y k x h
a b− −
− = .
• Locate vertices and general position of foci on the
graph. Define and locate: 1. transverse axis ≡ the axis of symmetry connecting the vertices.

2012-13 and 2013-14 Transitional Comprehensive Curriculum
Algebra IIUnit 8Conic Sections 8-16
a
c b
c
2. conjugate axis ≡ the axis of symmetry not connecting the vertices • Label ½ the transverse axis as a, ½ the conjugate
axis as b, and the distance from the center of the hyperbola to the focus as c. Have students draw a right triangle with a right angle at the center and the ends of the hypotenuse at the ends of the transverse and conjugate axes. Demonstrate with string how the length of the hypotenuse is equal to the length of the segment from the center of the hyperbola to the focus. Let the students determine the relationship between a, b, and c. Solution: a2 + b2 = c2
• Draw the asymptotes through the corners of the box formed by the conjugate and transverse
axes and explain how these are graphing aids, then find their equations. The general forms of equations of asymptotes are given below, but it is easier to simply find the equations of the lines using the center of the hyperbola and the corners of the box.
1. horizontal hyperbola with center at origin: 2 2
2 2 1x ya b
− = ,
asymptotes: by xa
= ±
2. vertical hyperbola with center at origin: 2 2
2 2 1y xa b
− = ,
asymptotes: ay xb
= ±
3. horizontal hyperbola with center at (h, k): ( ) ( )2 2
2 2 1x h y k
a b− −
− =
asymptotes: ( )by k x ha
− = ± −
4. vertical hyperbola with center at (h, k): ( ) ( )2 2
2 2 1y k x h
a b− −
− =
asymptotes: ( )ay k x hb
− = ± −
• Discuss the applications of a hyperbola: the path of a comet often takes the shape of a
hyperbola, the use of hyperbolic (hyperbola-shaped) lenses in some telescopes, the use of hyperbolic gears in many machines and in industry, the use of the hyperbolas in navigation

2012-13 and 2013-14 Transitional Comprehensive Curriculum
Algebra IIUnit 8Conic Sections 8-17
since sound waves travel in hyperbolic paths, etc. Some very interesting activities using the hyperbola are available at: http://www.geocities.com/CapeCanaveral/Lab/3550/hyperbol.htm.
Activity 7: Saga of the Roaming Conic (GLEs: 7, 16, 24, 27, 28; CCSS: WST.11-12.2d) Materials List: paper, pencil, graphing calculator, Saga of the Roaming Conic BLM This activity has not changed because it already incorporates this CCSS. This can be an open or closed-book quiz or in-class or at-home creative writing assignment making students verbalize the characteristics of a particular conic. Math Log Bellringer: Graph the following pairs of equations on the graphing calculator. (ZOOM , 2:Zoom In, 5:ZSquare)
(1) y = x2 and y = 9x2 (2) 2x2 + y2 = 1 and 9x2 + y2 = 1 (3) x2 – y2 = 1 and 9x2 – y2 = 1 (4) Discuss what the size of the coefficients on the x2 does to the shape of the graph
Solutions : (1) (2) (3) (4) A larger coefficient on the x2 makes a narrower graph because 9x2 is
actually (3x)2 creating a transformation in the form f(kx) which shrinks the domain.
Activity: • Discuss answers to the Bellringer. • Saga of the Roaming Conic: Have the students demonstrate their understanding of the transformations of conic graphs
by completing the following RAFT writing (view literacy strategy descriptions). RAFT writing gives students the freedom to project themselves into unique roles and look at content from unique perspectives. In this assignment, students are in the Role of a conic

2012-13 and 2013-14 Transitional Comprehensive Curriculum
Algebra IIUnit 8Conic Sections 8-18
of their choice and the Audience is an Algebra II student. The Form of the writing is a story of the exploits of the Algebra II student and the Topic is transformations of the conic graph.
Distribute the Saga of the Roaming Conic BLM giving each student one sheet of paper with a full size ellipse, hyperbola or parabola drawn on it and the following directions: You are an ellipse (or parabola or hyperbola). Your owner is an Algebra II student who moves you and stretches you. Using all you know about yourself, describe what is happening to you while the Algebra II student is doing his/her homework. You must include ten facts or properties of an ellipse (or parabola or hyperbola) in your discussion. Discuss all the changes in your shape and how these changes affect your equation. Write a small number (e.g. 1, 2, etc.) next to each property in the story to make sure you have covered ten properties. (See sample story in Unit 1.)
Have students share their stories with the class to review properties. Students should listen for accuracy and logic in their peers’ RAFTs.
Activity 8: Solving Systems of Equations Involving Conics (GLEs: 5, 6, 7, 9, 10, 16, 28) Materials List: paper, pencil, graphing calculator Is this activity, students will review the processes for solving systems of equations begun in previous courses. They will apply some of these strategies to solving systems involving conics. Math Log Bellringer: (1) Graph y = 3x + 6 and 2x – 6y = 9 by hand. (2) Find the point of intersection by hand. (3) What actually is a point of intersection?
Solutions: (1)
(2) 45 39- -16, 16
(3) A point of intersection is the point at which the two graphs have the same x- and y-value.
Activity: • Use the Bellringer to determine if the students remember that finding a point of intersection
and solving a system of equations are synonymous. Review solving systems of equations from previous courses by substitution and elimination (addition).

2012-13 and 2013-14 Transitional Comprehensive Curriculum
Algebra IIUnit 8Conic Sections 8-19
• Use SQPL (Student Questions for Purposeful Learning) (view literacy strategy descriptions) to set the stage for finding points of intersection of lines and conics and of two conics. Create an SQPL lesson by generating a statement related to the material that would cause
students to wonder, challenge, and question. The statement does not have to be factually true as long as it provokes interest and curiosity.
State the following: “The graphs of a line and a conic will always intersect two times.” Write it on the board or a piece of chart paper. Repeat it as necessary.
Next, ask students to turn to a partner and think of one good question they have about the graphs based on the statement: The graphs of a line and a conic will always intersect two times. As students respond, write their questions on the chart paper or board. A question that is asked more than once should be marked with a smiley face to signify that it is an important question. When students finish asking questions, contribute additional questions to the list as needed. Make sure the following questions are on the list:
1. What type of conic is it and does it matter? 2. Is the line vertical, horizontal or slant and does it matter? 3. Does the line go through the center of the conic and does it matter? 4. What is the end behavior of the conic and does it matter? 5. Is the line tangent to the conic? 6. Is the line an asymptote of the conic?
Proceed with the following calculator practice before addressing the questions. During this first calculator practice, have the students discuss with their partners which of
their SQPL questions can be answered, then ask for volunteers to share. Calculator Practice #1: Give the students the equations x2 + y2 = 25
and y = x – 1 and have them work in pairs to solve analytically. Then have them graph on their calculators (ZOOM , 5:ZSquare) to find points of intersection.
Solution: (4, 3) and (−3, −4) Assign the system x2 + y2 = 25 and y = x + 8 that has no solutions. Assign the system
x2 + y2 = 25 and 3 64
y x= + that has one solution. Solve analytically and graphically.
• Change the SQPL statement to, “The graphs of two conics will always intersect two times.”
Ask the students to determine if any of the original questions in the list should change and make those changes. Proceed with the following calculator practice before addressing the new questions. During the second calculator practice, have the students discuss with their partners which
questions can be answered, then ask for volunteers to share. Calculator Practice #2: Assign the following systems which require simultaneous solving
of two conic equations. Have students graph the equations first by hand to determine how many points of intersection exist, and then have the students solve them analytically using the most appropriate method.

2012-13 and 2013-14 Transitional Comprehensive Curriculum
Algebra IIUnit 8Conic Sections 8-20
(1) x2 + y2 = 25 and 2 2
19 16y x
− =
(2) x2 + y2 = 25 and 2 2
19 16x y
+ =
(3) x2 + y2 = 25 and 2 2
19 25x y
+ =
Solutions: (1) (2) no solutions (3) (0, 5), (0, −5)
• Assign additional problems in the math textbook for practice. Activity 9: Graphing Art Project (GLEs: 4, 6, 7, 9, 10, 16, 24, 27, 28, 29; CCSSs: RST.11-
12.3) Materials List: paper, pencil, graphing calculator, Graphing Art Bellringer BLM, Graphing Art Sailboat Graph BLM, Graphing Art Sailboat Equations BLM, Graphing Art Project Directions BLM, Graphing Art Graph Paper BLM, Graphing Art Project Equations BLM, Graphing Art Evaluation BLM, Optional: Math Type®, EquationWriter®, Graphmatica® and TI Interactive® computer software This activity has not changed because it already incorporates these CCSSs. In this Graphing Art Project, students will analyze equations to synthesize graphs and then analyze graphs to synthesize equations. The students will draw their own pictures composed of familiar functions, write the equation of each part of the picture finding the points of intersection, and learn to express their creativity mathematically. Math Log Bellringer: Distribute the Graphing Art Bellringer BLM in which the students will individually graph
a set of equations to produce the picture of a heart. Solution:
16 369 16 369 16 369 16 369, , , , , , ,5 5 5 5 5 5 5 5
− − − −

2012-13 and 2013-14 Transitional Comprehensive Curriculum
Algebra IIUnit 8Conic Sections 8-21
Activity: This culminating activity is taken from the February, 1995, issue of Mathematics Teacher in an article by Fan Disher entitled “Graphing Art” reprinted in Using Activities from the Mathematics Teacher to Support Principles and Standards, (2004) NCTM. It uses two days of in-class time and one week of individual time. It follows the unit on conics but involves all functions learned throughout the year. • Use the Bellringer to review the graphs of lines and absolute value relations, the writing of
restricted domains in various forms, and finding points of intersection. The Bellringer models the types of answers that will be expected in the next part of the activity. Use the Bellringer also to review graphing equations on a calculator with restricted domains.
• Divide students into five member cooperative groups and distribute the Graphing Art
Sailboat BLM and the Graph and Graphing Art Sailboat Equations BLM. Have group members determine the equation of each part of the picture and the restrictions on either the domain or range. This group work will promote some very interesting discussions concerning the forms of the equations and how to find the restrictions.
• The students are now ready to begin the individual portion of their projects. Distribute Graphing Art Project Directions BLM, Graphing Art Graph Paper BLM and
the Graphing Art Project Equations BLM. In the directions, students are instructed to use graph paper either vertically or horizontally to draw a picture containing graphs of any function discussed this year. On the Graphing Art Project Equations BLM, the students will record a minimum of ten equations, one for each portion of the picture − see Graphing Art Project Directions BLM for equation requirements. There is no maximum number of equations, which gives individual students much flexibility. The poorer students can draw the basic picture and equations and achieve while the creative students can draw more complex pictures.
Distribute the Graphing Art Evaluation BLM and explain how the project will be graded.
At this point, this is now an out-of-class project in which the students are monitored halfway through, using a rough draft. Give the students a deadline to hand in the numbered rough draft and equations. At that time, they should exchange equations and see if they can graph their partner’s picture.
Later, have students turn in final copies of pictures and equations and their Graphing Art Evaluation BLMs. After all the equations have been checked for accuracy, appoint an editor from the class to oversee the compilation of the graphs and equations into a booklet to be distributed to other mathematics teachers for use in their classes. The

2012-13 and 2013-14 Transitional Comprehensive Curriculum
Algebra IIUnit 8Conic Sections 8-22
students enjoy seeing their names and creations in print and gain a feeling of pride in their creations.
Have students write a journal stating what they learned in the project, what they liked and disliked about the project, and how they feel the project can be improved.
Sample Assessments General Assessments
• Use Bellringers as ongoing informal assessments. • Collect the Little Black Books of Algebra II Properties and grade for completeness at the
end of the unit. • Monitor student progress using a small quiz after each conic to check for understanding. • Administer two comprehensive assessments:
(1) circles and parabolas (2) all conic sections
Activity-Specific Assessments
• Activity 6:
Determine which of the following equations is a circle, parabola, line, hyperbola or ellipse. (1) 8x2 + 8y2 + 18x – 64y – 71=0 (2) 8x + 7y – 81 = 0 (3) 4x2 + 3y – 6 = 0 (4) 2x + 6y2 –26 = 0 (5) 8x2 − 8y2 – 6 = 0 (6) 7x2 + y2 – 45 = 0 (7) x2 – y2 – 36 = 0
Solutions : (1) circle (2) line (3) parabola (4) parabola
(5) hyperbola (6) ellipse (7) hyperbola
• Activity 7: Evaluate the Saga of the Roaming Conic (see activity) using the following
rubric: 3 points each for the ten properties, 5 points for sentence structure and grammar, 5 points for creativity. (40 points)
• Activity 9: Evaluate the Graphing Art project using several assessments during the
project to check progress. (1) The group members should assess each other’s rough drafts to catch mistakes before
the project is graded for accuracy. (2) Evaluate the final picture and equations using the Graphing Art Evaluation BLM.

2012-13 and 2013-14 Transitional Comprehensive Curriculum
Algebra IIUnit 8Conic Sections 8-23
(3) Evaluate the opinion journal to decide whether to change or modify the unit for next year.