Alaris Capture Pro Software - Download Online Books
299
CONTENTS Chapters Page No. SECTION-A 1. Introduction 2. Overview of System Analysis and Design . 3-26 27^8 SECTION-B 3. Preliminary Investigation 4. Feasibility Study 51-60 61-74 SECTION-C 5. Requirement Determination and Specification '6. Process Modeling 7. Logic Modeling 8. Designing Forms and Reports 9. Designing Interfaces and Dialogues ] 0. Designing Databases 77-106 107-130 131-150 151-174 175-204 205-240 SECTION-D 243-272 11. System Development 12. Implementation 13. Maintenance and Review 273-294 295-312
-
Upload
khangminh22 -
Category
Documents
-
view
3 -
download
0
Transcript of Alaris Capture Pro Software - Download Online Books
CONTENTSChapters Page No.
SECTION-A1. Introduction2. Overview of System Analysis and Design
. 3-2627^8
SECTION-B3. Preliminary Investigation4. Feasibility Study
51-6061-74
SECTION-C5. Requirement Determination and Specification
'6. Process Modeling7. Logic Modeling8. Designing Forms and Reports9. Designing Interfaces and Dialogues
] 0. Designing Databases
77-106
107-130131-150151-174175-204205-240
SECTION-D243-27211. System Development
12. Implementation13. Maintenance and Review
273-294295-312
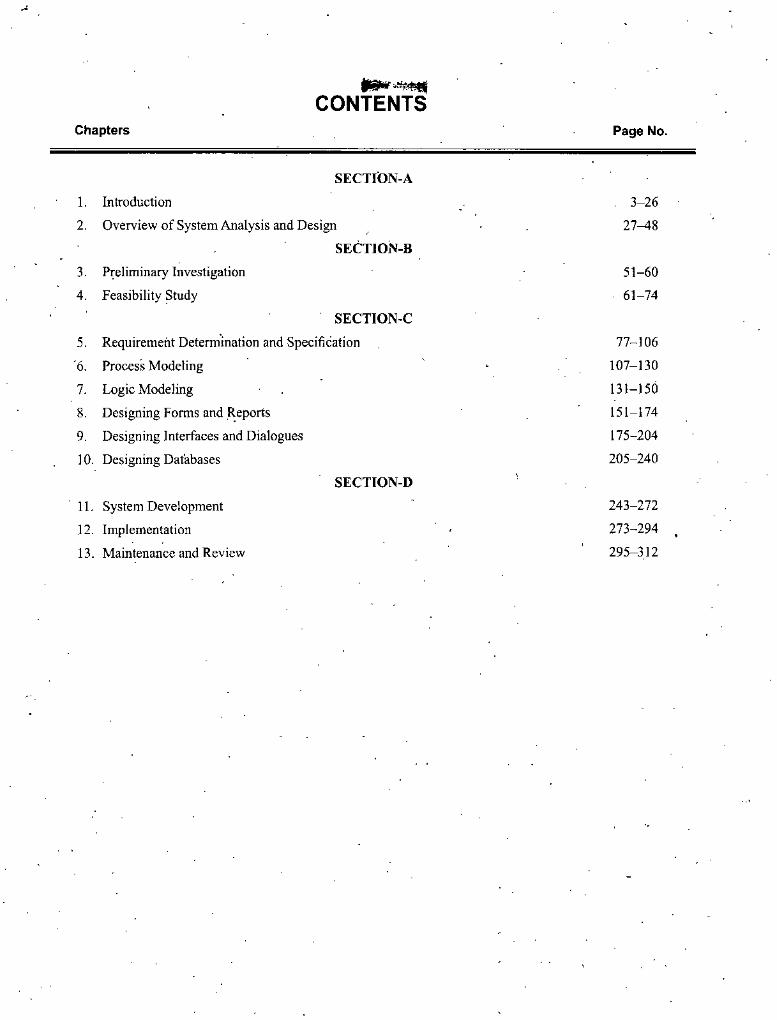
SYLLABUS
SYSTEM ANALYSIS AND DESIGN
SECTION A1. Introduction
Concepts of a system, examples of systems, types of systems-open and closed, static and dynamic with examples.
2. Overview of System Analysis and DesignSystem development life cycle, brief introduction to analysis, design, implementation and testing and maintenance.
SECTION B3. Preliminary Investigation
Project selection, scope definition and preliminary investigation.
4. Feasibilty StudyTechnical and economic and operational feasibility, cost and benefit analysis.
SECTION C5. Requirement Specification and Analysis
Fact finding techniques, data flow diagrams, data dictionaries, decision trees and tables.
6. * Detailed DesignModule Specification,-file design, database design.
SECTION D7. Testing and Quality Assurance
Maintenance, unit and integration testing techniques, design objectives, quality factors such as reliability correctness etc.
8. User Education and TrainingIssues in user education and training, method of educating and training the user.
SECTION A
1. Introduction2.. Overview of System Analysis and Design

V
I
/
\
V
t
IntroductionCHAPTER
1NOTES
INTRODUCTION
LEARNING OBIECTIVES1.1 Introduction1.2 System and its Parts1.3 Concepts of a System1.4 Types of Systems
1.4.1 Physical or Abstract Systems1.4.2 Open or Closed Systems1.4.3 Man-made Information Systems
1.5 Organizations, Managers and Information1.5.1 Departmants1.5.2 Management Levels1.5.3 Types of Information
1.6 Computer-based Information Systems1.6.1 Transacfien Processing Systems (TPSs)1.6.2 Management Information Systems (MISs) '1.8.3 Dedsion Support Systems (DSSs)1.6.4 Executive Support Systems (ESSs)1.6.5 Office Automation and Expert Systems (OASs and ESs)
1.1 INTRODUCTIONThe term ‘system’ is derived from the'Greek word ‘system’ (to combine), which means an organized relationship among functioning units or components. A system • exists because it is designed to achieve one or more objectives. A system is an orderly arrangement of its components. The components of a aystem have structure and order. The organization determines the flow of control, communication and the chain of commands.There are many system concepts which play an important role in understanding the system. The flow of information in an organization is very vital. There are various departments in an organization, depending on the services or products they provide to us. With each department there are three traditional levels of management—top, middle and lower. For making the proper decisions—the different levels of managers require the right kind of information at right time. Information system is a system that provides information to people in an organization. There are various types of computer-based information systems, which serve different levels of management.
Self-In3lructional Material 8
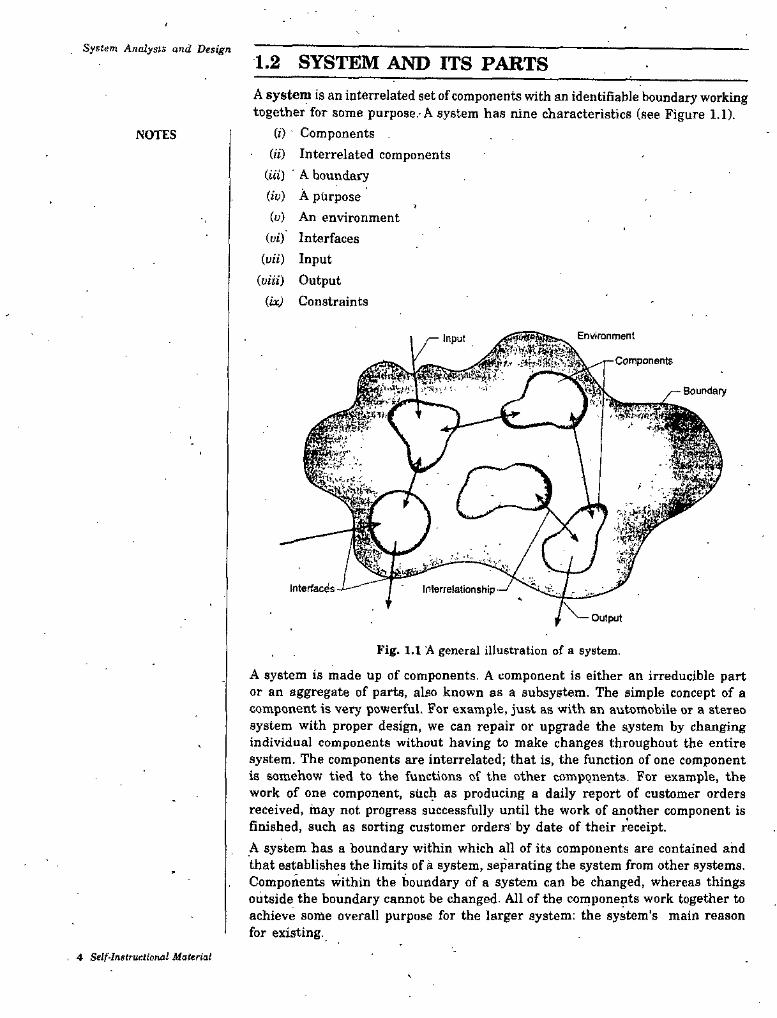
System Analysis and Design1.2 SYSTEM AND ITS PARTSA system is an interrelated set of components with an identifiable boundary working together for some purpose.-A system has nine characteristics (see Figure 1.1).
(j) Components («) Interrelated components
Uii) ' A boundary (iv) A purpose (o) An environment
(vi) Interfaces ivii) Input
(viii) Output (ix) Constraints
NOTES
Environment
—Components
y— Boundary
Interfaces Ir^lerrKationship
Output
Fig. l.l 'A general illustration of a system.
A system is made up of components. A component is either an irreducible part or an aggregate of parts, also known as a subsystem. The simple concept of a component is very powerful. For example, just as with an automobile or a stereo system with proper design, we can repair or upgrade the system by changing individual components without having to make changes throughout the entire system. The components are interrelated; that is, the function of one component is somehow tied to the functions of the other components. For example, the work of one component, such as producing a daily report of customer orders received, may not progress successfully until the work of another component is finished, such as sorting customer orders by date of their receipt.A system has a boundary within which all of its components are contained and that establishes the limits of a system, separating the system from other systems. Components within the boundary of a system can be changed, whereas things outside the boundary cannot be changed. All of the components work together to achieve some overall purpose for the larger system: the system’s main reason for existing.
4 Self-Inslruetional Material
IntroductionA system exists within an environment, which comprises of everything outside the system’s boundary. For example, we might consider the environment of a state university to include the legislature, prospective students, foundations and funding agencies, and the news media. Usually the system interacts with its environment, exchanging, in the case of an information system, data and information. The points at which the system meets its environment are known as interfaces, and there are also interfaces between subsystems. An example of subsystem interface is the clutch subsystem, which acts as the point of interaction between the engine and transmission subsystems of a car. Special characteristics of interfaces are given below;
NOTES
Interface FunctionsBecause an interface exists at the point where a system meets its environment, the interface has several special, important functions. An interface provides
• Security, protecting the system from undesirable elements that may want to infiltrate it
• Filtering unwanted data, both the elements leaving the system and enteringit
• . Coding and decoding incoming and outgoing messages• Detecting the correcting errors in its interaction with the environment• Buffering, providing a layer of slack between the system and its environment,
so that the system and its environment can work on different cycles and' at different speeds
• Summarizing raw data and transforming them into the level of detail and format required throughout the system (for an input interface) or in the
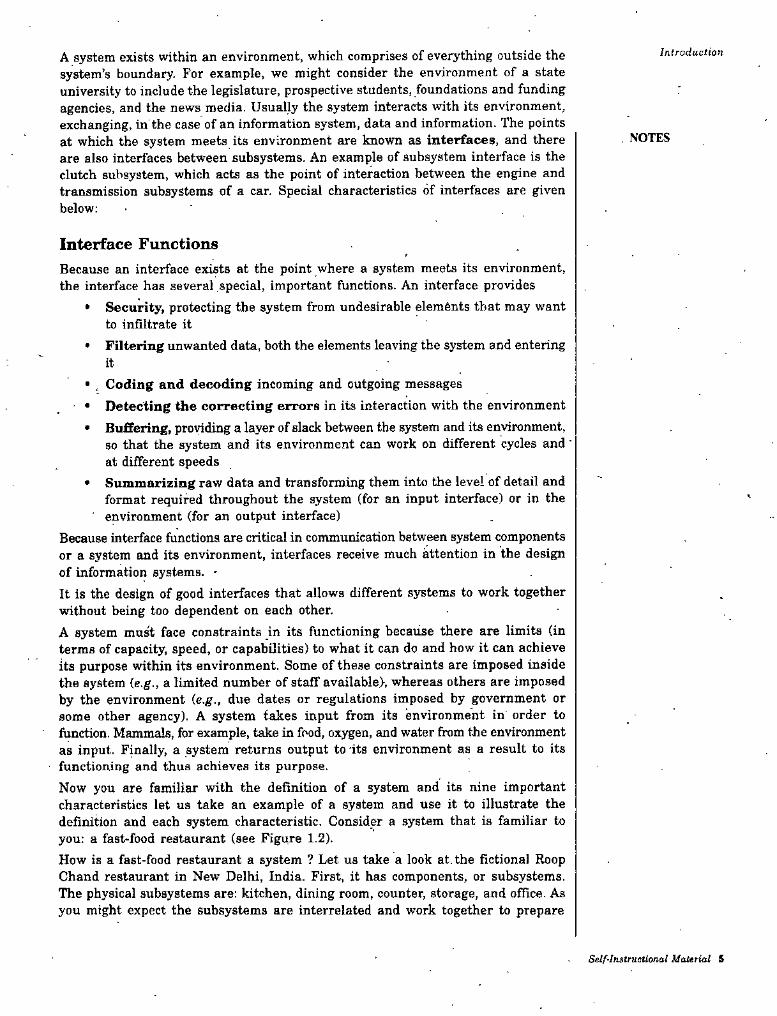
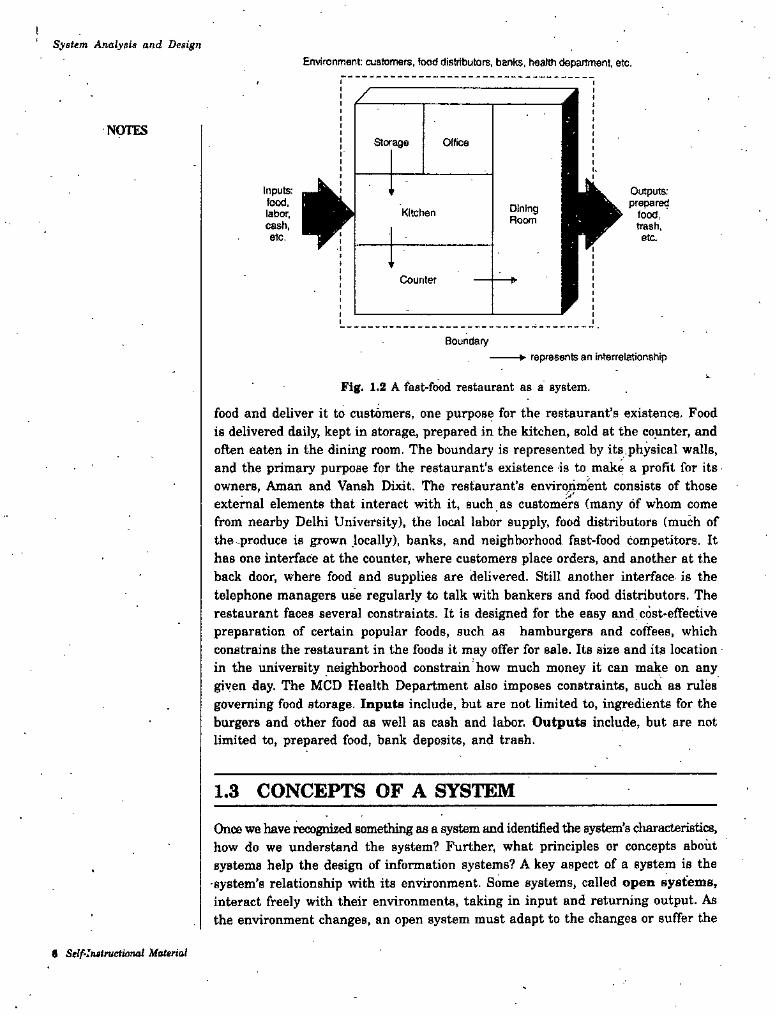
■ environment (for an output interface)Because interface functions are critical in communication between system components or a system and its environment, interfaces receive much attention in the design of information systems. •It is the design of good interfaces that allows different systems to work together without being too dependent on each other.A system must face constraints in its functioning because there are limits (in terms of capacity, speed, or capabUities) to what it can do and how it can achieve its purpose within its environment. Some of these constraints are imposed inside the system {e.g., a limited number of staff available), whereas others are imposed by the environment (e.g., due dates or regulations imposed by government or some other agency). A system takes input from its environment in order to function. Mammals, for example, take in food, oxygen, and water from the environment as input. Finally, a system returns output to-its environment as a result to its functioning and thus achieves its purpose.Now you are familiar with the definition of a system and its nine important characteristics let us take an example of a system and use it to illustrate the definition and each system characteristic. Consider a system that is familiar to you: a fast-food restaurant (see Figure 1.2).How is a fast-food restaurant a system ? Let us take a look at. the fictional Roop Chand restaurant in New Delhi, India. First, it has components, or subsystems. The physical subsystems are: kitchen, dining room, counter, storage, and office. As you might expect the subsystems are interrelated and work together to prepare
Self-Instructional Material 6
System Analysis and DesignEnwronment: customers, food distributors, banks, health depamnent, etc.
LNOTESStorage Office
*Inputs: Outputs;prepared
food,trash.
food. DiningRoom
Kitchenlabor,cash.etc. r etc.
Counter ♦
Boundaryrepresents an interrelationship
Fig. 1.2 A fast'food restaurant as a system.
food and deliver it to customers, one purpose for the restaurant’s existence. Food is delivered daily, kept in storage, prepared in the kitchen, sold at the counter, and often eaten in the dining room. The boundary is represented by its,physical walls, and the primary purpose for the restaurant's existence is to make a profit for its owners, Aman and Vansh Dixit. The restaurant’s environment consists of those external elements that interact with it, such as customers {many of whom come from nearby Delhi University), the local labor supply, food distributors (much of the produce is grown locally), banks, and neighborhood fast-food competitors. It has one interface at the counter, where customers place orders, and another at the back door, where food and supplies are delivered. Still another interface is the telephone managers use regularly to talk with bankers and food distributors. The restaurant faces several constraints. It is designed for the easy and cost-effective preparation of certain popular foods, such as hamburgers and coffees, which constrains the restaurant in the foods it may offer for sale. Its size and its location in the university neighborhood constrain how much money it can make on any given day. The MCD Health Department also imposes constraints, such as rules governing food storage. Inpute include, but are not limited to, ingredients for the burgers and other food as well as cash and labor. Outputs include, but are not limited to, prepared food, bank deposits, and trash.
1.3 CONCEPTS OF A SYSTEMOnce we have recognized something as a sj^m and identified the system’s diaracteristics, how do we understand the system? Further, what principles or concepts about systems help the design of information systems? A key aspect of a system is the •system’s relationship with its environment. Some systems, called open systems, interact freely with their environments, taking in input and returning output. As the environment changes, an open system must adapt to the changes or suffer the
0 Self'Iastruethnal Material
Introductionconsequences. A closed system does not interact with the environment; changes in the environment and adaptability are not issues for a closed system. However, ail business information systems are open, and in order to understand a system and its relationships to other information systems, to the organization, and to the larger environment, you must always think of information systems as open and constantly interacting with the environment. ,There are many other important systems concepts with which systems analysts (the key individuals in the systems development process) need to become familiar:
* Modularity• Cohesion
NOTES
• • Decomposition • Coupling
Decomposition deals with being able to break down a system into its components. These components may themselves be systems (subsystems) and can be broken down into their components as well. How does decomposition aid understanding of a system? Decomposition results in smaller and less complex pieces that are easier to understand than larger, complex pieces^ Decomposing a system also helps us to focus on one particular part of a system, making it easier to think of how to modify that one part independently of the entire system.Decomposition aids a systems analyst and other systems development project team members by
• Breaking a system into smaller, more manageable, and understandable subsystems
• Facilitating the focusing of attention on one area (subsystem) at a time without interference from other parts
• Allowing attention to concentrate on the part of the system pertinent to a particular audience, without confusing people with details irrelevant to their interests
I
• Permitting different parts of the system to be built at independent times and/or by different- person.
Alter DecomposKlon
CD Player System
settings
SignalReading
Subsystem
SignalAmplifyif>gSubsystem
CD----- ► ■¥
TMusic
SignalCwitrol
Subsyst^
SignalCotwersionSubsystem
Comtal__settings -* Music
Fig. 1.3 An example of decomposition.
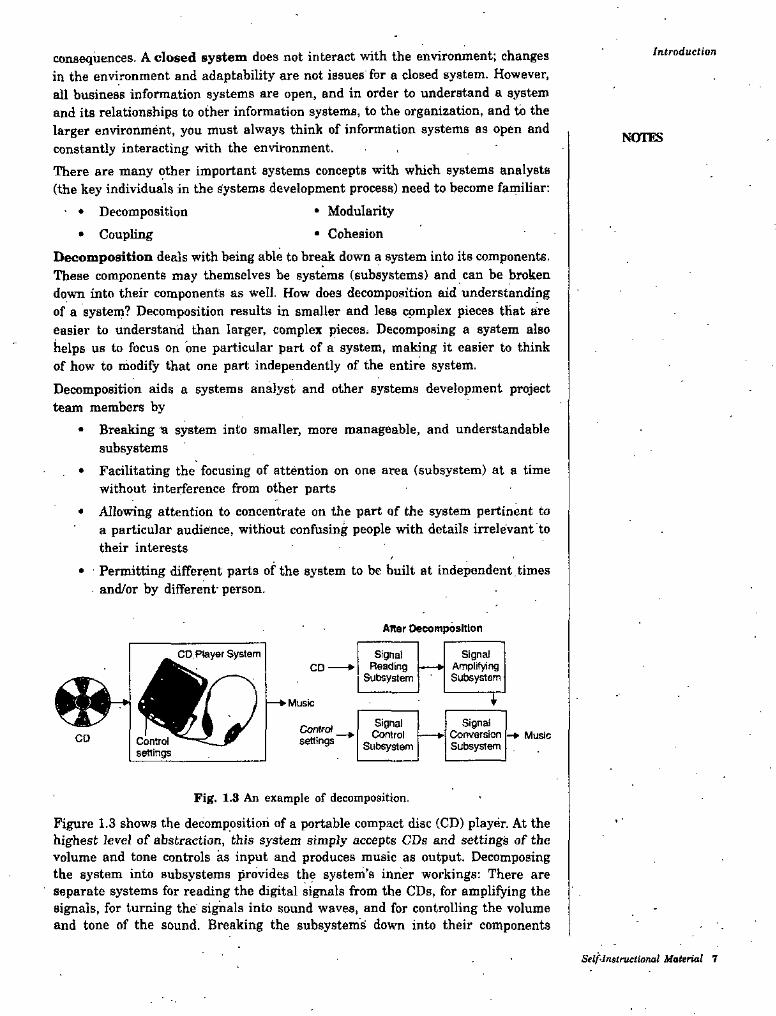
Figure 1.3 shows the decomposition of a portable compact disc (CD) player. At the highest level of abstraction, this system simply accepts CDs and settings of the volume and tone controls as input and produces music as output. Decomposing the system into subsystems provides the system’s inner workings: There are separate systems for reading the digital signals from the CDs, for amplifying the signals, for turning the signals into sound waves, and for controlling the volume and tone of the sound. Breaking the subsystem's down into their components
Self-Initrvetional Material 7
System Analysis and Design would provide even more about the inner workings of the system and greatlyenhance our understanding of how the overall works.Modularity, a direct result of decomposition, means dividing a system up into chunks or modules of a relatively uniform size. Modules can represent a system simply, making it not only easier to understand, but also easier to redesign and rebuild.Coupling is the extent to which subsystems are dependent on each other. Subsystems should be as independent as possible. If one subsystem fails and other subsystems are highly dependent on it, the others will either fail themselves or have problems functioning. After looking at Figure 1.3, we would say the components of a portable CD player are tightly coupled. The amplifier and the unit that reads the CD signals are wired together in the same container, and the boundaries between these two subsystems may be difficult to draw clearly. If one subsystem fails, the entire CD player must be sent off for repair. In a home stereo system, the components are loosely coupled because the subsystems, such as the speakers, the amplifier, the receiver, and the CD player, are all physically separate and function independently For example, if the amplifier in a home stereo system fails, only the amplifier needs to be repaired.Finally, cohesion is the extent to which a subsystem performs a single function. In biological systems, subsystems tend to be well differentiated, and thus very cohesive. In human made systems, subsystems are not always as cohesive as they should be.One final key systems concept with which you should be familiar is the difference between logical and physical systems. Any description of a system is abstract .because the definition is not the system itself. When we talk about logical and phj^ical systems, we are actually talking about logical and physical system descriptions.A logical system description gives the purpose and function of the system without tying the description to any specific physical implementation. For example, in developing a logical description of the portable CD player, we describe the basic components of the player (signal reader, amplifier, speakers, controls) and their relations to each other, focusing on the function of playing CDs using a self- contained, portable unit. We do not specify whether the earphone jack contains aluminium or gold, where we could buy the laser that reads the CDs, or how much the jack or the laser cost to produce.One the other hand, the physical system description is a material depiction of the system, a central concern of which is building the system. A physical description of the portable CD player would provide details on the construction of each subunit, such as the design of the laser, the composition of the earphones, and whether the controls feature digital readouts. A systems analyst should deal with function (logical system description) before form (physical system description), just as an architect does for the analysis and design of buildings before actual construction.
NOTES
1.4 TYPES OF SYSTEMSThe frame of reference within which one views a system is related to the use of the systems approach for analysis. Systems'have been classified in different ways. Common classifications are:
1- Physical or abstract,2. Open or closed, and3. “Man-made” information systems.
8 Self-Instructional Material
Introduction1.4.1 Physical or Abstract systemsPhysical systems are tangible entities that may be static or dynamic in operation. For example, the physical parts of the computer center are the offices, desks, and chairs that facilitate operation of the computer. They can be seen and counted; they are static. In contrast, a programmed computer is a dynamic system. Data, programs, output, and applications change as the user's demands or the priority of the information requested changes.Abstract systems are conceptual or nonphysical entities. They may be as straightforward as formulas of relationships among sets of variables or models—the abstract conceptualization of physical situations. A model is a representation of a real or a planned system. The use of models makes it easier for the analyst to visualize relationships in the system under study. The objective is to point out the significant elements and the key interrelationships of a complex system.
NOTES
System ModelsIn no field are models used more widely and with greater variety than in systems analysis. The analyst begins by creating a model of the reality (facts, relationships, procedures, etc.) with which the system is concerned. Every computer system deals with the real world, a problem area, or a reality outside itself. For. example, a
■ telephone switching system is made up of subscribers, telephone handsete, dialing, conference calls, and the like. The analyst begins by modeling this ri .‘lity before considering the functions that the system is to perform.Various business system models are used to show the benefits of abstracting complex systems to model form. The major models .discussed here are schematic, flow, static, and dynamic system models.
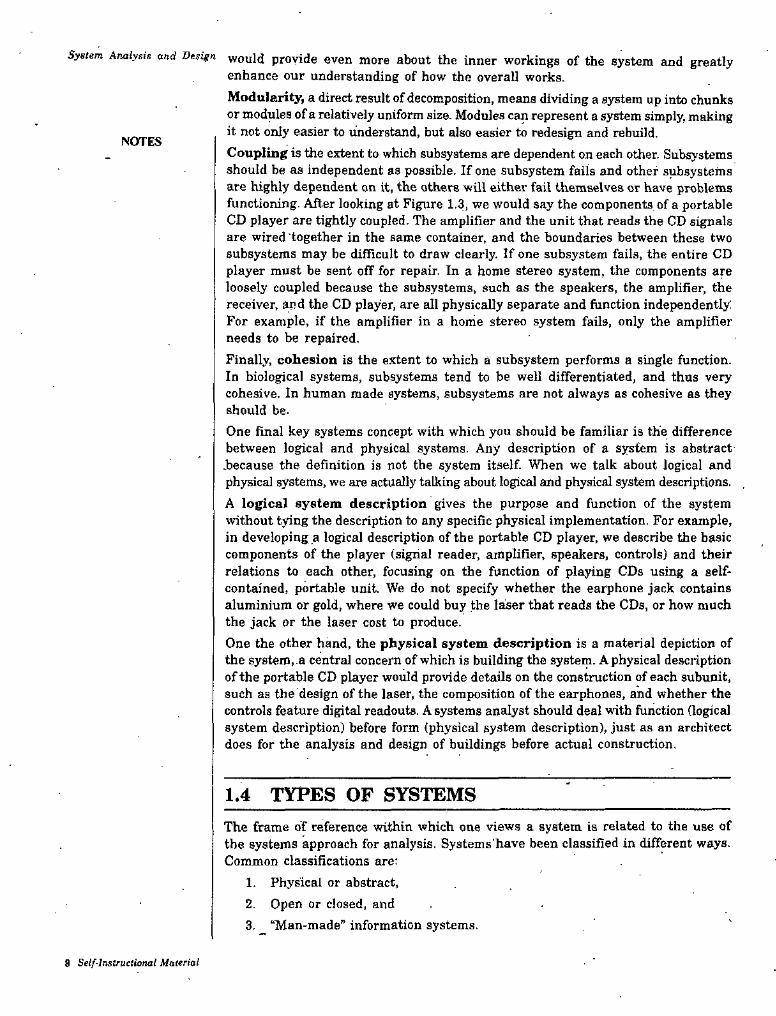
Schematic ModelsA schematic model is a two-dimensional chart depicting system elements and their linkages. Fugure 1.4 shows the major elements of a personnel infonnation system together with material and information flow, - :
Book keeping Department
Forming notices
; •Labor distribufion : repofta : •Fringa benellts t repckts
• Cneckmg arc balance• Overdraft informationPayroll
Externalenvironment I;------ . Transter notces
• Salary adjusterronts * Salary adjustments• Tex withnctolng data * PromoUon noUces
• Safety/secuntyInformat on
• Signature veriflcatoo
I «: Tellerdepartment• Department payrol
reports• Hours worked
** Human resources departmentrApplicante
Gov reports
Inquiries i
Trustdepartment■»
< Absence reports• Job requisitions■ vacation schedule• Accidenl reports
♦• Biographical Informaton• EEO update• wage and asiaiy reports Instaflment
loandepartmentI I
• ERISA • Performance evaluationCommercial
toan• department
Report forms, Evaluation form, etc.
* information fow > Meterialfiow ¥■ Infonnation feedback
Fig, 1.4 Personnel information flow in a banking environment.
Stlf-Inatructional Mattrial 9

System Analysis and Design flow System ModcU
A flow system model shows the flow of the material, energy, and information that hold the system together. There is an orderly flow of logic in such models. A widely known example is PERT (Program Evaluation and Review Ttechnique). It is used to abstract a realworld system in model form, manipulate spetific values to determine the critcal path, interpret the relationships, and relay them back as a control. The probability of completion within a time period is considered in connection with time, resources, and performance specifications (See Figure 1.6).
NOTES
14 days
Fig. 1.6 A CPM chart showing flow system model.
Static System Models■ This type of model exhibits one pair of relationships such as activity-time or cost- quantity. The Gantt chart, for example, gives a static picture of an activity-time relationship. In Figure 1.6 planned activities (stamping, sanding, etc.) are plotted in relation to time. The date column has light lines that indicate the amount of time it takes to complete a given activity. The heavy line represents the comulative time schedule for each activity. The stamping department for example, is scheduled to start working on order number 25 Wednesday morning and complete the job by the same evening. One day is also scheduled for order number 28, two days for order number 22, and two days (August 10-11) for order number 29. The total of six days is represented by the heavy line opposite the stamping department. The broken line indicates that Uie department is two days behind schedule. The arrowhead indicates the data when the chart is to be in effect.
Gantt ChartMama ol
department^umber of workers ■
Capacityper week., August 5 6 12
2225 28 29Stempirrg 75 4500
2521Sanding 10 BOO
19 2060 3600Assemtrly
13 416 4S0Patong
Fig. 1.6 Gantt chart-An example.
10 Self-Instructional Material
IntroduetianDynamic System ModelsBusiness organizations are dynamic systems. A dynamic model approximates the type of organization or applications that analysts deal with. It depicts an ongoing, constantlychangingsystem. As mentioned earlier, it consists of (1) inputs that enter the system, (2) the processor through which transformation takes place, (3) the program(s) required for processing, and (4) the outputs) that result from processing. NOTES
1.4.2 Open or Closed SystemsAnother classification of systems is based on their degree of independence An open system has many interfaces with its environment. It permits interaction across its boundary; it receives inputs from and delivers outputs to the outside. An information system falls into this category, since it must adapt to the changing demands of the user. In contrast, a closed system is isolated from environmental influences. In reality, a completely closed system is rare. In systems analysis, organizations, applications, and computers are invariably open, dynamic systems influenced by their environment.A focus on the characteristics of an open system is particularly timely in the light of present-day business concerns with computer fraud, invasion of privacy, security controls, and ethics in computing. Whereas the technical aspects of systems analysis deal with internal routines within the user’s application area, systems' analysis as an open system lends to expand the scope of analysis to relationships between the
and other users and to environmental factors that must b' considereduser areabefore a new system is finally approved. Furthermore, being open to duggestions implies that the analyst has to be flexible and the system being designed has to be responsive to the changing needs of the user and the environment.Five important characteristics of open systems can be identified. These are given below;
1. Input from OutsideOpen systems are self-adjusting and self-regulating. When functioning properly, an open system reaches a steady state or equilibrium. In a retail firm, for example,
. a steady state exists when goods are purchased and sold without being either out of stock or over-stocked. An increase in the cost of goods forces a comparable increase in prices or ‘decrease in operating costs. This response gives the firm its steady state.
2. EntropyAll dynamic systems tend to run down over time, resulting in entropy or loss of energy. Open. systems resist entropy by seeking new inputs or modifying the processes to return to a steady state. In our example/no reaction to increase in cost of merchandise makes the business unprofitable which could force it into insolvency—a state of disorganization.
3. Process, Output and CyclesOpen systems produce useful output and operate in cycles, following a continuous flow path.
4. Differentiation
. Open systems have a tendency toward an increasing specialization of functions and a greater differentiation of their components. In business, the roles of people and
Seif-Inetructional Material 11
S^isfem Analysis and Design machines tend toward greater specialization and greater interaction. This characteristicoffers a compelling reason for the increasing value of the concept of systems in the systems, analyst’s thinking.
5. EquifinalityNOTES The term implies that go^s are achieved through differing courses of action and
a variety of paths. In most systems, there is more of a consensus on goals than oh paths to reach the goals.Understanding system characteristics helps analysts to identify their role and relate their activities to the attainment of the firm’s objectives as they undertake a system project. Analysts are themselves part of the organization. They have opportunities to adapt the organization to changes through computerized applications so that the system does not “sun down”. A key to this process is information feedback from the prime user of the new system as well as from top management.
1.4.3 Man-Made Infonnation SystemsAn infonnation system is an open system that allows inputs and facilitates interaction with the user. These are discussed in detail later on in this unit.
I2 Self-Instructional Material

Introduction
STUDENT ACTIVITY 1.1
1. What' is a system ? What are its parts ? Explain,
2. Describe the following; (i) Open systems (») Closed Systems
Self-Ins'.ructionol Materiat 13
System Analysis and Design1.5 ORGANIZATIONS, MANAGERS AND
INFORMATIONAt the heart of an organization is information and how it is used. To understand how to bring about change in an organization, we need to understand how organizations and their managers work—how they need, organize, and use information.The flow of Information within an Organization. Take any sizable organization you are familiar with. Its main purpose is to perform a service or deliver a product. If it is nonprofit, for example, it may deliver service of educating students about AIDS or product of food for famine victims. If it is profit-oriented, it may, for example, sell the- service of fixing computers or the product of computers themselves.Information—whether computer-based or not-has to flow vrithin an organization in a way that will help managers, and the organization, achieve their goals, lb this end, organizations are often structured horizontally and vertically—horizontally to reflect functions and vertically to reflect management levels.
1.5.1 DepartmentsDepending on the services or products they provide, most organization have departments that perform five functions:
(0 Research and Development (R & D) - (ii) Production
(Hi) Marketing (to) Accounting and Finance (o) Human Resources (Personnel)(j) Research and development. The research and development (R .& D)
department does two thing.s;(1) It conducts basic research, relating discoveries to the organization’s
existing or new products.(2) It does product development and tests and modifies new products or
services created by researchers.Special software programs are available to aid in these functions.
(ii) Production. The production department produces the product or provides the service. In a manufacturing company, it takes the raw materials and has people or machinery turn them into finished goods. In many cases, this department uses CAD/CAM software and workstations, as well as robotics.
. In another type of company, this department might manage the purchasing, handle the inventories, and control the flow of goods and services.
(Hi) Marketing. The marketing department looks after advertising, promotion, and sales. The people in this department plan, price, advertise, promote, package, and distribute the services or goods to customers or clients. The sales representatives may use laptop computers, cellphones, wireless e-
. mail, and faxes in their work while in their fields.(iv) Accounting and finance. The accounting and finance department handles
all financial matters. It handles cash management,, pays bills and. taxes, issues paychecks, records payments, makes investments, and compiles financial statements and reports. It also produces financial budgets and forecasts
14 Self-Instructtonai Material
Introductionfinancial performance after receiving information from other departments at certain time intervals.
iv) Human resources. The human resources, or personnel, department finds and hires people and administers sick leave and retirement matters. It is also concerned with compensation levels, professional development, employee relations, and government regulations. NOTES
1.5.2 Management Levels
Within each of the five departments discussed above there are three traditional levels of management—top, middle, and lower. These levels are reflected in the organization chart shown in Figure 1.7. An organization chart is a schematic drawing showing the hierarchy of formal relationships among an organization’s employees. Managers on each of the three levels have different levels of responsibility and are therefore required to make different kinds of decisions. (See Figure 1.7).
• Top managers. The chief executive officer (CEO) or president is the very top manager. However, for our purposes, “top management” refers to the vice presidents, one of whom heads each department. IVpical titles found at the top management level ^ treasi irer, director, controller (chief accounting officer), and senior partner.Top managers are concerned with long-range, or strategic, planning ^nd decisions. Strategic decisions are complex decisions rarely based on predetermined routine procedures; they involve the subjective judgment of the decision maker. For example, strategic decisions might relate to how growth should be financed and what new markets should be tackled first. Determining the company’s 10-year goals, evaluating future financial resources, and formulating a response to competitors’ actions are also strategic decisions.An AT & T vice president of marketing might have to make strategic decisions about promotional campaigns to sell a new cable-modem service. The top manager who runs an electronics store might have to make strategic decisions about stocking a new line of personal digital assistants (PDAs)
■ Middle managers. Some example of middle managers are plant manager, division manager, sales manager, branch manager, and director of personnel. Middle-level managers make tactical decisions to implement the strategic goals of the organization. A tactical decision is made without a base of clearly defined informational procedures; it may require detailed analysis and computations. An example might be deciding how many units of a specific product (PDAs, say) should be kept in inventory. Another is whether or not to purchase a larger computer system.The director of sales, who reports to the vice president of marketing for AT & T, sets sales targets for district sales managers throughout the country. They in turn feed him or her weekly and monthly sales reports.
• Supervisory managers. An example of a supervisory manager is a warehouse manager in charge of inventory restocking. Supervisory managers make operational decisions—predictable decisions that can be made by following well-defined sets of routine procedures. These managers focus principally on supervising nonmanagement employees, monitoring day-to-day events, and taking corrective action where necessary.Determining not to restock inventory is an operation decision. (The guideline on when to restock may be determined at the level above.) A district sales manager for AT & T would monitor the promised sales and orders for cable
Self-Instructional Material 16

S ' C<5'i7t/1
6. . 3I a
7. o_8aaaa Cu
£ C3Ia
I Crtfgf Exoculivo Oflicor(ceo)Chl»< Cx.c^iiiivc.OHlier
<■-
IResponsible for sfrwejw pi an ningVK*'Prss)l
Human.••;>,ndFlp.rt«. 1^. Rswur^Dsoslopmsnt WHlueOfn ,
- Jl .
*\ ^f ■ Top managomont:
unslrucfurod decisionsm
4 » %r
rFmM*
' ^ •*
Dlr*eto( o(^ PersofinsV. .
. Fsyfoil. *DIreoloi of AteouTiUn^
-• ■* l. .i
Middle managomonl:ssmistructureddecisiorts
Iii Ik
ResponBt)la tor
MsnaptWi I Sedounu Ps^aMs '
»oi’ ManagerManagerAccMirfM ’ I
f^tcclvaols
■'r •.of Lower mstttgornont;
ktructurod docisloneaReports
«• Ai-»«
•f
Nonmertagemeni errployoes
Fig. 1.7 An organisation chart, and mnnsgement levels and responsibilities.
Introductionmodems coming in from sales representatives. When sales begin to drop off, the supervisor would need to take immediate action.
1.5.3 lypes of InformationTo make the proper decisions—strategic, tactical, operational—the different levels of managers need the right kind of information: structured, semistructured, and unstructured.
In general, all' inforniation to support intelligent decision making at all three levels must be correct—that is, accurate. It must also be complete, including all relevant data, yet concise, including only relevant data. It must be cost effective, meaning efficiently obtained, yet understandable. It must be current, meaning timely, yet also time sensitive, based on historical, current, or future information needs. This shows that information has three distinct properties as given below:
(j) Level of summarization
(ii) Degree of accuracy
(.Hi) Timeliness
These properties will be different for structured and unstructured information. Whether structured or unstructured information is more appropriate depends on the level of management and the type of decision making required. Structured information is detailed, current, not subjective, concerned with past events, records a narrow range of facts, and covers an organisation’s internal activities. Unatruchired information is the opposite. Unstructured information is summarized, less current, highly subjective, concerned with future events, records a broad range of facts, and covers activities outside as well as inside an organization. Semistructured information includes some structured information and some unstructured information.
As we have covered some basic concepts about how organizations are structured and what kinds of information are required at different levels of management, we need to examine what types of management information systems provide the information.
NOTES
1.6 COMPUTER-BASED INFORMATION SYSTEMSThe main purpose of a computer-based information system is to provide managers (and various categories of employees) with the appropriate kind of information to help them make decisions. There are six types of computer-based information systems which serve different levels of management. (See Figure 1.8).
• For lower managers. TVansaction processing systems (TPSs)
• For middle managers. Management information systems (MISs) and decision support systems (DSSs)
■ For top managers. Executive support systems (ESSs)
• For all levels, including nonmanageiuent. Cffice automation systems (OASs) and expert systems (ESs)
Let us describe these.
Self-Instructional Material 17
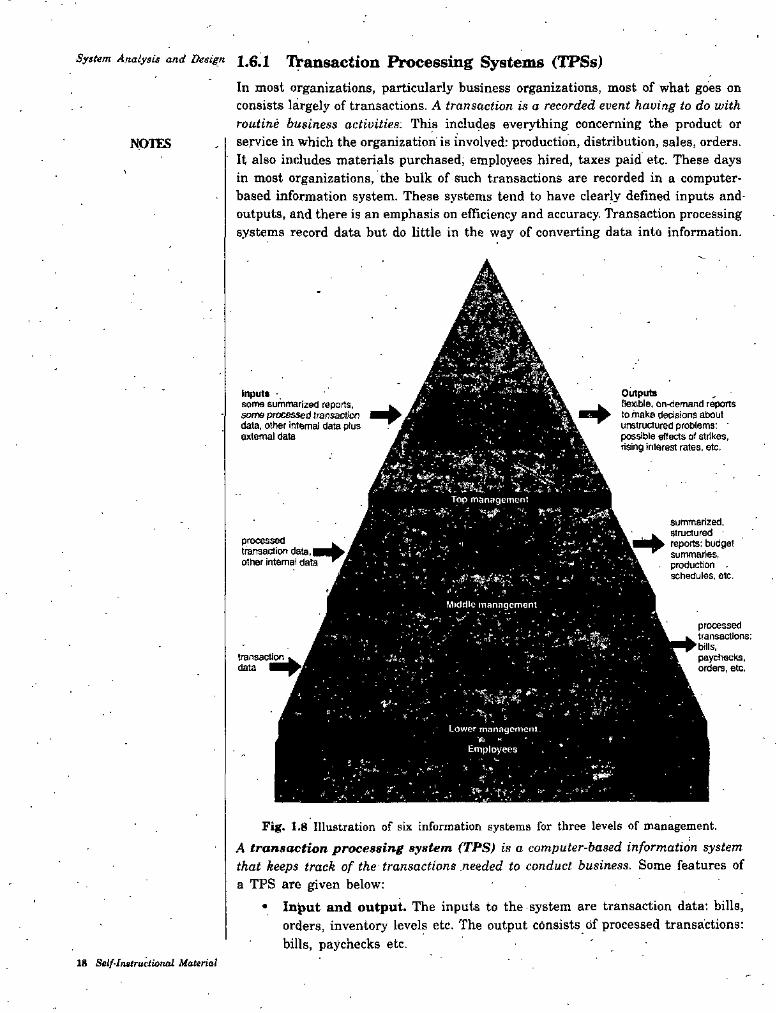
System Analysis and Design Transaction Proccssing Systcitts (TPSs)
In most organizations, particularly business organizations, most of what goes on consists largely of transactions. A transaction is a recorded event having to do with routine business activities: This includes everything concerning the product or service in which the organization is involved: production, distribution, sales, orders. It also includes materials purchased; employees hired, taxes paid etc. These days in most organizations, the bulk of such transactions are recorded in a computer- based information system. These systems tend to have clearly defined inputs and- outputs, and there is an emphasis on efficiency and accuracy. Transaction processing systems record data but do little in the way of converting data into information.
NOTES
A
'MkA
input* 'some surtimarizeO reports, some processed JransacfJco data, other internal data plus external data
OutputsIlexiUe. on-demand reports to make deosions atxiut unstructured protilems; possible effects of strikes, rising interest rates, etc.
' : ■r-.
Top management
ted.- .. jproems ludget
Atransact ss,Other int fi
s. etc.i
•' . *Widdic manngcmenl
jcessednsactions;Is,
IransactI ychecks, }ers, etc.
a >-■Lower manflgemcnl.
- fEmploy eps
Fig. 1.8 Illustration of six information systems for three levels of management,A transaction processing system (TPS) is a computer-based information system that keeps track of the transactions needed to conduct business. Some features of a TPS are given below:
• Input and output. The inputs to the system are transaction data; bills, orders, inventory levels etc. The output consists of processed transactions: bills, paychecks etc, ' •
18 5ef/'./n«(rucfiO'U>i Mattria!
Introduction• For lower managers. Because the TPS deals with day-to-day matters, it is principally of use to supervisory managers. That is, the TPS helps in making tactical decisions. Such systems are not usually helpful to middle or top managers in an organization.
• Produces detail reports. A manager at this level typically will receive information in the form of detail reports. A detail report contains specific
, information about routine activities. For example, the information needed to decide whether to restock inventory.
• One TPS for each department. Each department or functional area of an organization—research and development, production, marketing, accounting and finance, and human resources—usually has its own TPS. For example, the accounting and finance TPS handles order processing, accounts receivable, inventory and purchasing, accounts payable, order processing, and payroll.
• Basis for MIS and DSS. The database of transactions stored in a TPS provides the basis for management information systems and decision support systems, as described next.
NOTES
1.6.2 Management Information Systems (MISs)A management information system (MIS) is a computer-based information system that uses data recorded by TPS as input into programs that produce routine reports as output.Feature of an MIS are given below:
• Input and output. Inputs consist of processed transaction data, such as bills, orders, and paychecks, plus other internal data. Outputs consist of summarized, structured reports: budget summaries, production schedulesetc.
. * For middle managers. An MIS is intended principally to assist middle managers—specifically to help them with tactical decisions. It helps them to spot trends and get an overview of current business activities.
• Draws from all departments. The MIS draws from ail five departments or functional areas, not just one.
• Produces several kinds of reports. Manners at this level usually receive information in the form of several kinds of reports: summary, exception, periodic, demand.
Summary reports show totals and trends. For example, a report showing total sales by office, by product, and by salesperson, as well as total overall sales. Exception reports show out-of-the-ordinary data. For example, an inventory report listing only those items of which fewer than 20 are in stock.Periodic reports are produced on a regular schedule. Such daily, weekly, monthly, quarterly, or annual reports may have sales figures, income statements, or balance sheets. They are usually produced on paper, such as computer printouts.Demand repoHs produce information in response to an unscheduled demand. A director of finance might order a demand credit-background report on an unknown customer who wants to place a large order. Demand reports are often produced on a terminal or microcomputer screen, rather than on paper.
Self-Instructional Material IS
System Analysis and Design 1.6o3 Decision Support Systems (DSSs)A decision support system (DSS) is a computer-based information system that provides a flexible tool for analysis and helps managers focus on the future. ' Whereas a TPS records data and an MIS summarizes data, a DSS analyzes data. To reach the DSS level of sophistication in information technology, an organization must have established TPS and MIS systems first. Some features of a DSS are given below :
• Inputs and outputs. Inputs include internal data—such as summarized reports and processed transaction data—and also data that is external to the organization. External data may be produced by trade associations, marketing research firms, the Indian Bureau of the Ctiisus, and other government agencies.
The outputs are demand reports on which a top manager can make decisions about unstructured problems.
• Mainly for middle managers. A DSS is intended principally to assist middle managers in making tactical decisions. Questions addressed by
• the DSS might be, for example, whether interest rates will rise or whether there will be a strike in an important materials-supplying industry.
• Produces analj’tic models. The key attribute of a DSS is that it uses models. A model is a mathematical representation of a real system. The models use a DSS database, which draws on the TPS and MIS files, as well as external data such as stock reports, government reports, and national and international news. The system is accessed using the DSS software.
The model allows the manager to do a .simulation—play a “what-if game—to reach decisions. Thus, the manager can simulate an aspect of the organization’s environment in order to decide how to react to a change in conditions affecting it. By changing.the hypothetical inputs to the model, the manager can see how the model’s outputs are affected by doing so.
Many DSSs are developed to support the types of derisions faced by managers in specific industries, such as airlines or real estate. Curious how airlines deride how many seats to'sell on a flight when so many-passengers are no-shows? Wonder how owners of those big apartment complexes set rents and lease terms? Investors in commercial real estate use a DSS called RealPlan to forecast property values up to 40 years into the future, based on income, expense, and cash-flow projections. Ever speculate about how insurance carriers set different rates. Many companies use DSSs called geographic information systems (GISs), such as
• Mapinfo and Atlas GIS, which integrate geographic databases with other business data and display maps.
NOTES
1,6.4 Executive Support Systems (ESSs)An executive support system (ESS) is an easy-to-use DSS made especially for top managers; it specifically supports .strategic- decision making. An ESS is also known as executive information, system (EIS). It draws oh data not only, from systems internal to the organization but also from those outside, such as news services or market-research databases. {See Figure i.9).
20 Stlf-Instructional Material
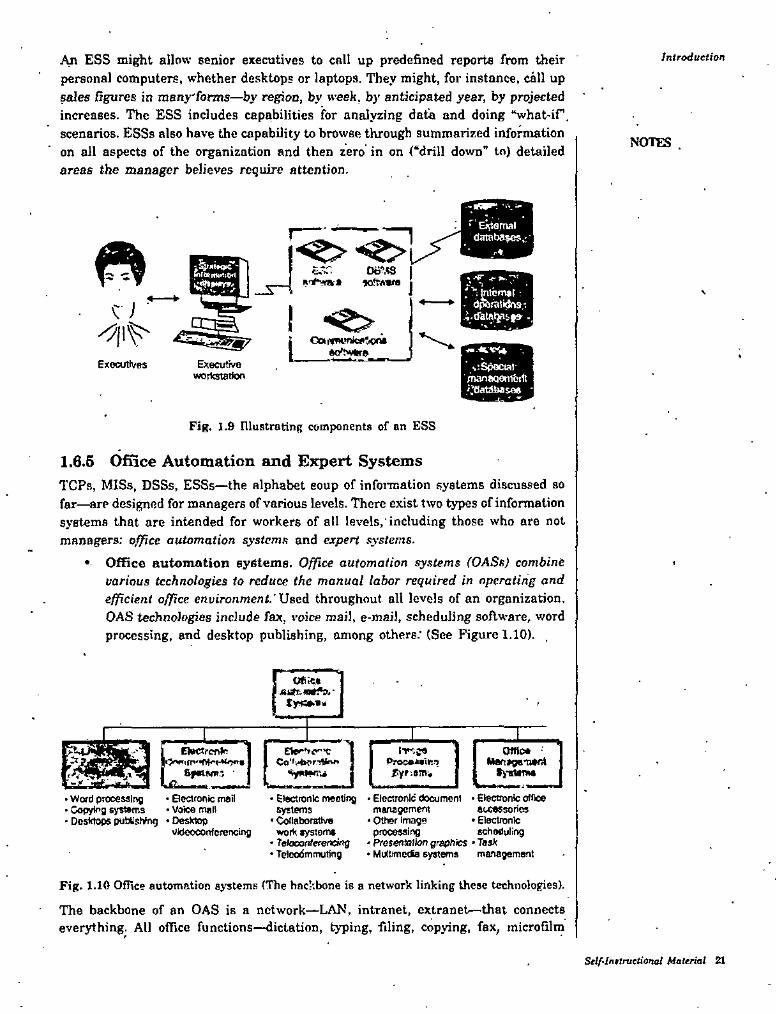
InlroduetionESS might allow senior executives to call up predefined reports from their personal computers, whether desktops or laptops. They might, for instance, call up sales figures in raany'forms—by region, by week, bj’ anticipated year, by projected increases. The ESS includes capabilities for analyzing data and doing “what-ir. scenarios. ESSs also have the capability to browse through summarized information on all aspects of the organization and then zero in on l“drill down” to) detailed areas the manager believes require attention.
NOTES
aatab8^,t-rr*
fritOnvKiOft O&AS
- d^ratiijnsis~i
!.
I CoiMwnice^iontMy^v*ra
Executives Executiveworlotatioo
' ^;SpocMt rnanaqontbill iyiatabasee '
Fig. 1.9 niustroting components of an ESS
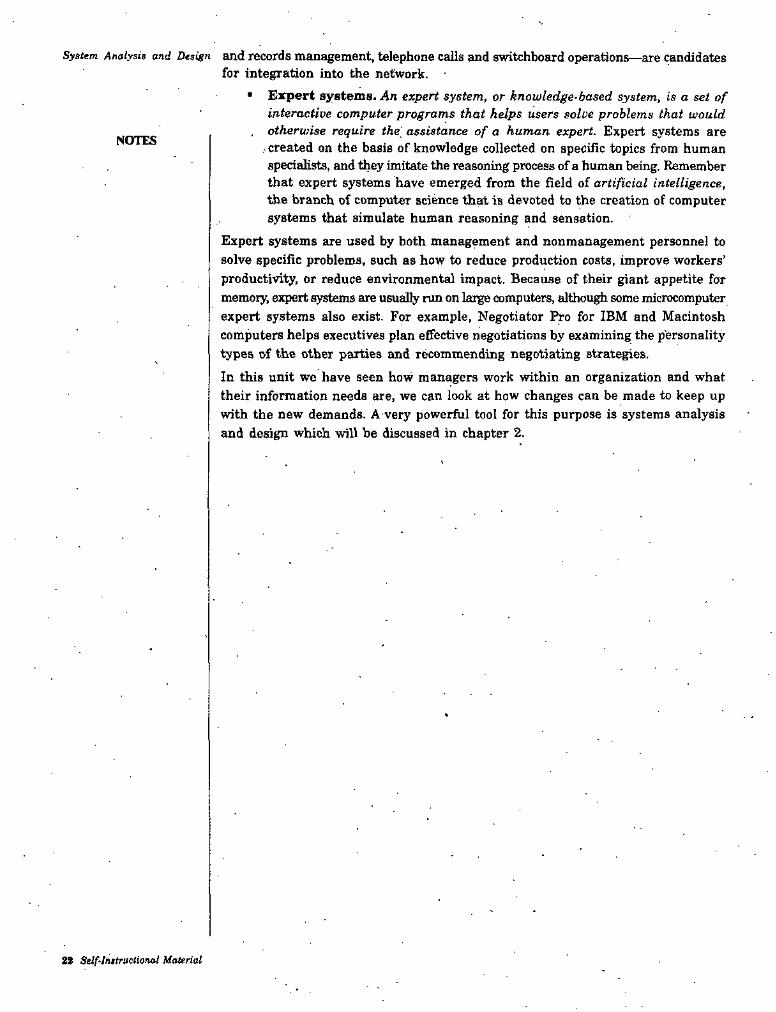
1.6.5 Office Automation and Expert SystemsTCPs, MISs, DSSs, ESSs—the alphabet eoup of information systems discussed so far—are designed for managers of various levels. There exist two types of information systems that are intended for workers of all levels,'including those who are not managers; office outomafion systems and expert sn-stems.
• Office automation eyfitems. Office automation systems (OASs) combine various technologies to reduce the manual labor required in operating and efficient office environment.'Used throughout all levels of an organization. OAS technologies include tax, voice mail, e-maiJ, scheduling soA.w’are, word processing, and desktop publishing, among others.' (See Figure 1.10). ,
IT(
f n»<srefilr I OfMAm.*, '
iT'.ce omc*Maosgemer^
ti-suma
Ete^*»e^*c
• Electronic meeting • Electronic documeni • Electronic cilice management
• Other image processing
' Pretentalion gr^ics > TasJt• Muittmetfa systems managemertt
• Electronic mail• Voice mall
• Word prooessirtg• Copyir>g systems• Dosldops pubtishing • Desktop
accessories • Bectronlc
scheduling
systems• Ctflaborative
vidcocotTlorertcing work lystoms• Tetocortfereneing• Tcleodmmuting
Fig. 1.10 Office automation systems (The hacltbone is a network linking these technologies).
The backbone of an OAS is a network—LAN. intranet, extranet—that connects everything. All office functions—dictation, typing, ■filing, copying, fax, microfilm
Self.In$truetionaI Material 21
System Analysis and Design and records management, telephone calls and switchboard operations—are candidatesfor integration into the network.
• Expert systems. An expert system, or knowledge-based system, is a set of interactive computer programs that helps users solve problems that would otherwise require the' assistance of a human expert. Expert systems are created on the basis of knowledge collected on specific topics from human specialists, and they imitate the reasoning process of a human being. Remember that expert systems have emerged from the field of artificial intelligence, the branch of computer science that is devoted to the creation of computer systems that simulate human reasoning and sensation.
Expert systems are used by both management and nonman^ement personnel to solve specific problems, such as how to reduce production costs, improve workers’ productivity, or reduce environmental impact. Because of their giant appetite for memoiy, expert systems are usually run on large computers, althoi^ some microcomputer expert systems also exist. For example, Negotiator Pro for IBM and Macintosh computers helps executives plan effective negotiations by examining the personality types of the other parties and recommending negotiating strategies.In this unit we have seen how managers work within an organization and what their infonnation needs are, we can look at how changes can be made to keep up with the new demands. A very powerful tool for this purpose is systems analysis and design which will be discussed in chapter 2.
NOTES
22 Self-Instructional Material

Introduction
STUDENT ACUVITy 1.2
1. What is the difference between structured and unstructured information ?
5
J
t
2. What is an expert system, and what can it be used for ?
V
Stlf-InttruetieneU Material 23
System Analysis and Design
SUMMARY• System is an interrelated set of components with an identifiable boundary
working together for some purpose!• Component is an irreducible part or aggregation of parts that make
system, also known as a subsystem.• Interrelated components means dependence of one subsystem on one or
more subsystems.• Boundary is the line that marks the inside and outside of a system and
that sets off the system from its environment.• .Purpose means the overall goal or function of a system.• Environment represents everything external to a system that interacts-
with the system.• Interface represents point of contact where a system meets its environment
or where subsystems meet each other.• Constraint is the limit to what a system can accomplish.• Input is whatever a system takes from its environment in order to fulfill
its purpose.• Output is -whatever a system returns to its environment in order to fulfill
its purpose.• Open system is a system that interacts freely with its environment, taking
input and returning output.• Closed system is a system that is cut off from its environment and does
not interact with it.• Decomposition is the process of breaking down a system into smaller and
less complex pieces that are easier to understand.• Modularity means dividing a system up into chunks or modules of a relatively
uniform size.• Coupling is the extent to which a subsystems depend on each other.• Cohesion is the extent to which a system or a subsystem performs a single
function.• Logical system description is the description of a system that focuses on
the system’s function and purpose without regard to how the system will be physically implemented.
• Physical system description is the description of a system that focuses on how the system will be materially constructed.
• Depending on' the services or products they provide, most organizations have departments that perform five functions; research and development (R & D), production, marketing, accounting and finance, human resources (personnel).
• Top managers also called strategic managers are concerned with long- range planning and strategic decision require information that i.s unstructured.
• Middle-level managers implement the goals of the organization. They require information that is both structured and unstructured.
• Supervisory managers implement the operational decisions.• Structured information is the detailed, current information concerned
with post events; it records a narrow range of facts and covers an organization’s internal activities.
• Unstructured information is the summarized, less current information concerned with future events; it records a broad range of facts and covers
NOTES up a
24 Se!f-instru(tiohal Material
• SemUtructured information is the information that does not necessarily result from clearly defined, routine procedures.
• Transaction Processing System (TPS) is the computer-based information system that keeps track of the transactions needed to conduct business.
• • Management Information System (MIS) is the computer-based information system that derives data from all departments of an organization and produces summary, exception, periodic, and on-demand reports of the organization's performance.
• Decision Support System (DSS) is the computer-based information system that helps managers v/ith nonroutine decision-making tasks.
• Executive Support System (ESS) is also called an executive information system. It is made especially for top managers that specifically supports strategic decision making.
• Office Automation System (OAS) is the computer-based information system that combines various technologies t.o reduce the manual labor needed to operate an office efficiently; used at all levels of an organization.
• Expert System is also called knowledge-based system. It is a set of computer programs that perform a task at the level of a human expert.
Introduction
NOTES
TEST YOURSELFAnswer the following questions;
1. Give an example of a system around you and identify its characteristics.2. Describe Decomposition, Coupling and Cohesion. What are the purposes?3. Describe the function and activities of rhanagerfs) of an information system
department.4. Describe Office Automation and Expert Systems.5. Explain the following system concepts:
• (i) Decomposition iiii) Coupling
6. What is the difference between a logical system description and physical system description ?
7. What are the departments, tasks and levels of managers in an organization, and what type of decisions do they make ?
8. What does an organization chart show ?9. What are the six computers-based information .systems and what are their
purposes ?.10. Describe the following terms in brief:
(i) Detail report iiii) Exception report (v) Demand'report
11. State True or False:(i) A system is a collection of related components thafinteract to perform,
a task in order to accomplish a goal.Hi) Environment represents everything interna! to a system that interacts
with the system.
(it) Modularity (it») Cohesion
[it) Summary report (it) Periodic report
Seif-Instructional Material 2S
Sy$tem Analysis and Design (Hi) Open system is a system that is cut ofT from its environment and does not interact with it.
(iu) Physical system description is the description of a system that focuses on how the system will be materially constructed.
(o) An information system is an open system that allows inputs and facilitates interaction with the user.
(ft) Managerial levels donot determine the kind of information needed to solve a problem.
(vii) The key element of MIS is the data base—ideally, a nonredundant collection of interrelated data items that are processed through application programs.
(uiti) Expert systems are used by both management and nonmanagement ' personnel to solve specific problems.
12. Fill in the blanks:
I
NOTES
.................... is an irreducible part of aggregation of parts that makeup a system, also known as a subsystem...................... represents point of contact where a system meets itsenvironment or where subsystems meet each other..
(i)
(ii)
..................... is a system that interacts freely with its environment,taking input and returning output.................... is the description of a system that focuses on the system’sf,notion and purpose without regard to how the system will be.physically . implemented.
{Hi}
(iv)
.................... also called strategic managers are concerned with long-range planning and strategic decisions...................... implement the operational decisions.
is a recorded event having to do with routine business
(v)
ivi)(vii) A
activities.Expert system is also called(oiii)
ANSWERSTest Yourself
11. state True or False:(i) True
(tit) False (o) True
(vii) True12. Fill in the blanks;
(i) Component (Hi) Open system • (v) Top managers (vii) transaction
(ii) FalseTrueFalseTrue
(io)(oi)
(viii)
InterfaceLogical system description Supervisory managers knowledge based system
(ii)(iv)(vi)
(vUi)
36 Self-Instructional Material
Syitem Anelytii and Dtiign ■ • Ibp management may decide independently to take a look at a system that looks ineHldent.
• A steering committee may be formed to decide which of many possible projects should be worked on.
Three types of participants are there in the project as given below:• Users. Ihe system under consideration should oluioys be developed in
consultation with users, whether floor sweepers, research scientists, or customers. Indeed, if user involvement in analysis and design is inadequate; the system may fail for lack of acceptance.
• Management. Managers within the organization should also be consulted about the system.
• Technical staff. Members of the company’s information systems (IS) department, consisting of systems analysts and programmers, need to be involved. For one thing, they mfiy have to execute the project. Even if they do not, they will have to work with outside IS people contracted to do the job.
Complex projects will require one or several systems analysts. A systems analyst is an information specialist who performs systems analysis, design, and implementation. The analyst's job is to study the information and communications needs of an organization end determine what changes arc required to deliver better information to people who need it. “Better” information means inff Tnation that is summarized in the acron^ “CART"—complete, accurate, relevant, and timely. The systems analyst achieves this goal through the problemsolving method of systems analysis and design.
NOTES
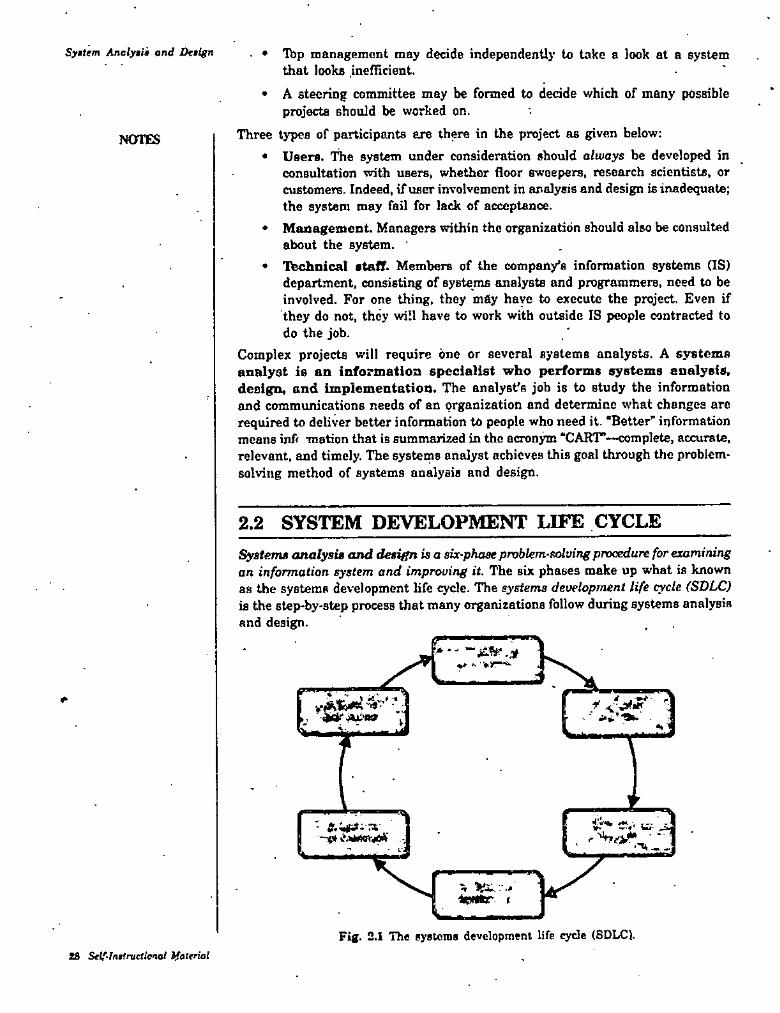
2.2 SYSTEM DEVELOPMENT LIFE CYCLESysfenu analyaig and design is a six-phase pnAlem-solving procedure for examining an information system and improoing it. The six phases make up what is known as the systems development life cycle. The systems development life cycle (SDLC) is the step-by-step process that many organizations follow during systems analysis end design.
' hi-TTi /““I""
*•1
i.7—«yt i.>idsir^eh
I*.
^ If*,:-.*kyimr I
Fig. 2.1 The systems development life cycle (SDLC).2S Ifeitriol
Oucroicw of Sj'item Analysit and DetignCHAPTER
2NOTES
OVERVIEW OF SYSTEM ANALYSIS
AND DESIGN• '>LEARNING OBJECTIVES
2.1 Introduction System Development Life Cycle2.2.1 Preliminary Investigation
2.2.2 Systems Analysis2.2.3 Systems Design -2.2.4 Systems Development2.2.5 Systems Implementation2.2.6 Systems MaintenanceSystem Documentation Considerations2.3.1 PrincifMes of System Documentation2.3.2 Types of Documentation and their Importance2.3.3 Enforcing Documentation in an Organizahon Life Cycle ModelsDifferent Approaches to Improving Development2.5.1 Prototyping2.5.2 CASE Tools
Vt
22
ti
2.3
2.42.5
2,1 INTRODUCTIONA ayotem is defined as a collection of related components that interact to perform a task in order to accomplish a goal. A system may not work very well, but it is nevertheless a system. The point of systems analysis and design is to ascertain how a system works and then take' steps to make it better.An organization’s computer-beised information sj^tem consists of hardware, software, people, procedures, and data, as well as communications setups. These work together to provide people with information for running the oi^anization.An oi^anizatioD may feel the need for a system due to a variety of reasons. Some examples are ; '
• A single individual who believes that something badly needs changing is all it takes to get the project rolling.
• An employee may influence a supervisor.]!, ,• ' A customer or supplier may get the attention of someone in higher
management.Self-Instructional Material n
«»nether applied to a very big company or a three-person engineering business, the six phases in systems analysis and design are as shown in Figure 2.1, Phases often overlap, and a new one may start before the old one is finished. After the first four phases, management must decide whether to proceed to the next phase. User input and review is a critical part of each phase.
Oventiew of SyKtem Analy/iis and Design
NOTES2.2.1 Preliminary InvestigationThe objective of Phase 1, preliminary inveetigation, is to conduct a preliminary onolysis, propose alternative' solutions, describe costs and benefits, and submit a preliminary plan with recommendations. These steps are given below:
(i) Conduct preliminary analysis. It includes stating the objectives, defining nature and scope of the problem.
{it) Propose alternative solutions: leave system alone, make it more efficient, or build a new system.
{Hi) Describe costs and benefits of each solution.{iv) Submit a preliminary plan with recommendations.
Let us explain these in detail:• Conduct the preliminary analysis. In ^is step, you need to find out
what the organization's objectives are and the nature and scope of the problem under consideration. Even if a problem pertains only to a small segment of the organization, you cannot study it in isolation. You need to find out what the objectives of the organization itself are. Then you need to see how the problem being studied fits in with them.
• Propose alternative solutions. In delving into the organization’s objectives and the specific problem, you may have already discovered some solutions. Other possible solutions can come from intemewing people inside the organizatioD, clients or customers affected by it, suppliers and consultants. You can also study what competitors are doing now a days. With this data, you then have three choices. You can leave the system as is, improve it, or develop a new system.
• Describe the costs and benefits. Whichever of the three alternatives is chosen, it will have costs and benefits. In this step, you need to indicate what these are. Costs may depend on benefits,, which may offer savings. A broad spectrum of benefits may be derived. A process may be speeded up, streamlined through elimination of unnecessary steps, or combined with other processes. Input errors or redundant output may be reduced. Systems and subsystems may be better integrated. Users may be happier with the
. system. Customers’ or suppliers’ interactions with the system may be more satisfactory. Security may be improved. Costs may be cut.
• Submit a preliminary plan. Now you need to wrap up all your findings in a written report. The readers, of this report will be the executives who are in a position to decide in which direction to proceed— make no changes, change a little, or change a lot—and how much money to allow the project. You should describe the potential solutions, costs, and benefits and mention your recommendations.
Self-Instructional Material SS
Sytlem Analysis and Design 2.2Ji System AnalysisThe objective of Phase 2, syatem analytis, is to gather data, analyze the data, and write a report. In this second phase of the SDLC, you will follow the course that management has indicated after having read your Phase 1 feasibility report. We are assuming that they have ordered you to perform Phase 2—to do a careful analysis or study of the existing system in order to underst^d how the new system you proposed would differ. This analysis will also consider how people's positions and tasks will have to change if the new system is put into effect. The steps are given below:
(i) Gather data, using tools of written documents, interviews, questionnaires, and observations.
iii) Analyze the data, using modelling tools: grid charts, decision tables, data flow diagrams, systems flow charts, connectivity diagrams.
(iii) Write a report.Let us explain these in detail:
• Gather data. In gathering data, you will review written documents, interview employees and managers, develop questionnaires, and observe people and processes at their place of work.
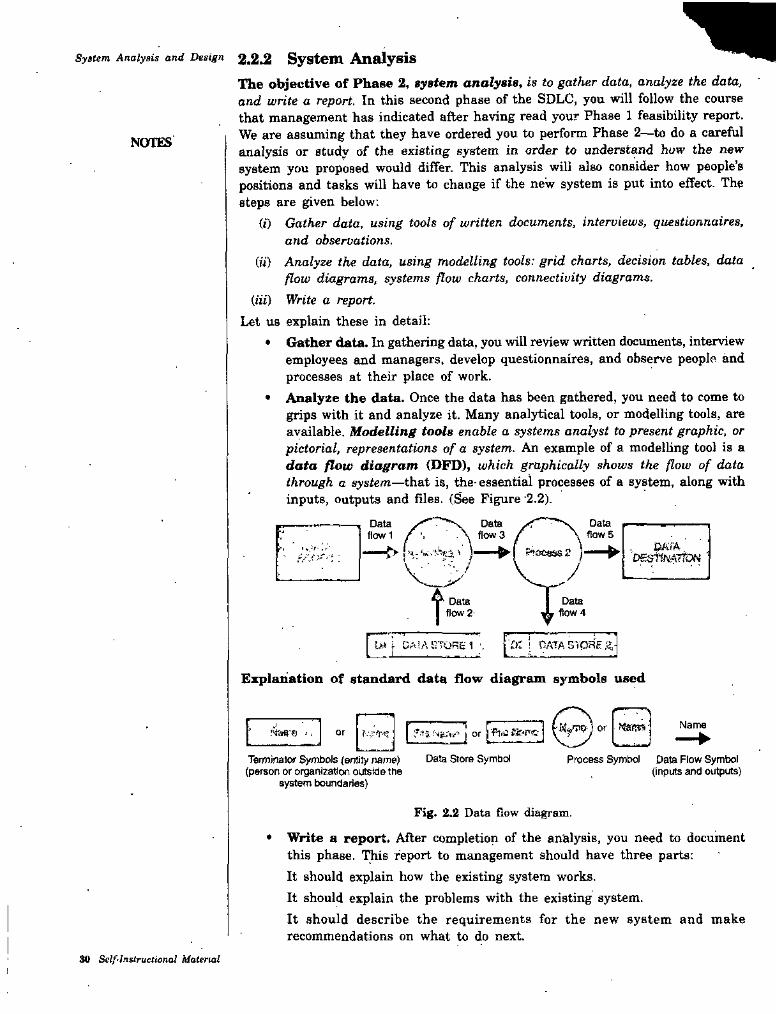
• Analyze the data. Once the data has been gathered, you need to come to grips with it and analyze it. Many analytical tools, or modelling tools, are available. Modelling tools enable a systems analyst to present graphic, or pictorial, representations of a system. An example of a modelling tool is a data flow diagram (DFD), which graphically shows the flow of data through a system—that is, the- essential processes of a system, along with inputs, outputs and files. (See Figure‘2.2).
NOTES
Dataflow 5
BArADESHKAlfON
fiow 4now 2
d: ! n.ATAsroFtE
Explanation of standard data flow diagram sjnnbols used
Nameor.^■i5 I or J'Fiii: ilc-riz■. or
TemiinalO)’ Symbols (erniiy name) Data Store Symbol (person or organizaton outside the
system boundaries)
Process Symbol Data Flow Symbol (inputs and outputs)
Fig. 2.2 Data flow diagram.
• Write a report. After completion of the analysis, you need to document this phase. This report to management should have three parts:It should explain how the existing system works.It should explain the problems with the existing system.It should describe the requirements for the new system and make recommendations on what to do next.
30 Self-Instructional Ualenal
Overview of Syalem Analysis and Design
At this stage, not a lot of money will have been spent on the systems analysis and design project. If the costs of going forward appear prohibitive, this is a good time for the managers reading the report to call a halt, Otherwise, you will be asked to go ahead to Phase 3.
NOTES2.2.3 System DesignThe objective of Phase 3, systems design is to do a preliminary design and then'a detail design, and write a report. The steps are given below:
(i) Do a preliminary design, using CASE (Computer-Aided Software Engineering) tools, prototyping tools, and project management software, among others.
(ii) Do a detail design, defining requirements for output, input, storage, and processing and system controls and backup.
(Hi) Write a report.In this third phase of the SDLC, you will essentially create a “rough draft” and then a “detail draft” of the proposed information system.Let us explain the above mentioned steps in detail:
Do a preliminary design. A prelindnary design describes the general functional capabilities of a proposed information system.'It reviews the system requirements and then considers major components of the system under consideration. Usually several alternative systems (called candidates) are considered, and the costs and the benefits of each are evaluated.Some tools that may be used in the design are CASE tools and project management software.CASE (Computer-Aided Software Engineering) tools are programs that automate various activities of the SDLC in several phases. This technology is intended to speed up the process of developing systems and to improve the quality of the resulting systems. These tools, which are also known as automated design tools, may be used at other stages of the SDLC as well. Some examples of such programs are Excelerator, Iconix, System Architect, and Powerbuilder.Prototyping refers to using workstations, CASE tools, and other software applications to build working models of system components, so that they can be quickly tested and evaluated. Thus, a prototype is a limited working system developed to test out design concepts. A prototype, which may be constructed in just a few days, allows users to find out immediately how a change in the system might benefit them. For example, a systems analyst might develop a menu as a possible screen display, which users could try out. The menu can then be redesigned or fine-tuned, if necessary. Project management software consists of programs used to plan, schedule, and control the people, costs, and resources required to complete a project on time.
* Do a detail design: A detail design describes how a proposed information system will deliver the general capabilities described in the preliminary design. The detail design, usually considers the following parts of the system in this order: output requirements input requirements storage requirements
Stlf-Iiutrueticnel Matertal >1
System Analysis and Design processing requirements, and system control and back up.
• Write a report. All the work of the preliminary and detail designs will end up in a large, detailed report. When you hand over this report to senior management, you will probably also make some sort of presentation or speech.NOTES
2.2.4 System DevelopmentIn Phase 4, systems development, the systems analyst or others in the organization develop or acquire the software, acquire the hardware, and then test the system. The steps are given below :
(i) Acquire software.Hi) Acquire hardware.
(Hi) Test the system.Depending on the size of the project, this phase will probably involve the organization in spending substantial sums of money, It could also involve spending a lot of time. However, at the end you should have a workable system.Let us explain the above mentioned steps in detail;
* Develop or acquire the software. During the design stage the systems analyst may have had to address what is called the “make-or-buy” decision, but that decision certainly cannot be avoided at this stage. In the make- or-buy decision, you decide whether- you have to create a program—
. have it custom-written—or buy it, meaning simply purchase ah existing software package. Sometimes programmers decide they can buy an existing program and modify it rather than write it from scratch.If you decide to create a new program, then the question is whether to use the organization’s own staff programmers or to hire outside contract programmers (outsource it). Whichever way you go, the task could.take many months.
* Acquire hardware. Once the software has been chosen, the hardware to* run it must be acquired or upgraded. It’s possible your new system will
not require any new hardware. It’s also possible that the new hardware will cost a huge amount and involve many items: microcomputers, mainframes, monitors, modems, and many other devices. The organization may find it’s better to lease rather than to buy some equipment, especially since, as we know (Moore’s law), chip capability has traditionally doubled every 18 months.
* Test the system. With the software and hardware acquired, you can now start testing the system. Testing is usually done in two stages: unit testing,
■ then system testing.In unit testing, the performance of individual parts is examined, using test (made- up, or sample) data. If the program is written as a collaborative effort by multiple programmers, each part of the program is tested separately.In system testing, the parts are linked together, and test data is used to see if the parts work together. At this point, actual organization data may be used to test the system. The system is also tested with erroneous and massive amounts of data to see if the system can be made to fail (“crash").
32 Self-Instructional Material
Overview of. System Analysis and DesignAt the end of this long process, the organization will have a workable information
system, one ready for the implementation phase.
2.2.5 Systems ImplementationWhether the new information system involves a few handheld computers, an elaborate telecommunications network, or expensive mainframes, the fifth phase will involve some close coordination in order to make the system not just workable but successful. Phase 5, systems implementation, consists of converting the hardware, software, and files to the new system and training the users. The steps are given below:
{») Convert hardware, software, and files through one of four types of conversions:direct, parallel, phased, or pilot.
(ii) Compile final documentation.(Hi) Train the users.
Let us explain the above mentioned steps in detail:* Convert to the new system. Conversion, the process of transition from
an old information system to a new one, requires converting hardware, software, and files. There are four strategies for handling conversion: direct, parallel, phased, and pilot.Direct Implementation means that the user simply stops using the old system and starts using the new one. The risk of this method should be evident: What if the new system doesn’t work ? If the old system has truly been discontinued, there is nothing to fall back on.Parallel implementation means that the old and new systems are operated side by side until the new system has shown it is reliable, at which time the old system is discontinued. Obviously there are benefits in taking this cautious approach. If the new system fails, the organization can switch back to the old one. The difficulty with this method is the expense of paying for the equipment and people to keep two systems working at the same time.Phased implementation means that parts of the new system are phased in separately—either at different times (parallel) or all at once in groups (direct).Pilot implementation means that the entire system is tried out but only by some users. Once the reliabUity has been proved, the ^^m is implemented with the rest of the intended users. The pilot approach still has its risks, since all of the users of a particular group are taken off the old system. However, the risks are confined to a small part of the organization.
* Compile final documentation. Documentation of a system consists of written description of system’s specification, its design, code, operating procedures etc. It is quite useful to users and maintenance programmers. Documentation can be broadly classified into two types:Documentation for users—it describes how to use the system. Documentation for Maintenance Programmers—it is also called technical documentation and used for system modification at some later st^es. Documentation of a system must start with the system definition. It is very difficult to think about the documentation in the end.
* Train the users. Various tools are available to familiarize users with a new system—from documentation (instruction manuals) to videotapes to
NOTES
Sttflnsiractiortal Material 33
Sy$tem Analysit and Design live classes to one-on-one, side-by-side teacher-student training. Sometimes training is done by the organization’s own staffers, at other times it is contracted out.
2.2.6 Systems MaintenanceNOTES
Phase 6, systems maintenance, adjusts and improves the system by having system audits and periodic evaluations and by making changes based on new conditions.The sixth phase is to keep the system running through system audits and periodic evaluations.Even with the conversion accomplished and the users trained, the system would not just run itself. There is a sixth—and never-endii^—phase in which the information system must be monitored to ensure that it is successful. Maintenance includes not only keeping the machinery running but also updating and upgrading the
- system to keep pace with new products, services, customers, government regulations, and other requirements.So we can conclude that “the better the system maintenance, the best the user satisfaction”.
2.3 SYSTEM DOCUMENTATION CONSIDERATIONS
2.3.1 Principles of System DocumentationAn often overlooked and underrated part of a system is its documentation. Documentation is an integral part of the various phases of the life cycle and is produced as part of the phase. Unfortunately, many system persons see documentation as a formality to be performed at the end of the stage rather than work to be done as an integral part of a sta^. This results in ineftective, poorly written and incomplete documentation, which is not usable.Documentation is a major means of communication. It is the means of communication, which survives over time after the analyst has left the project and the team has disbanded—the documentation is what remains. It is through the documents that users learn about the system and they need to refer to the documents to use the system.. Documentation forms a written record for the work; it establishes design and performance criteria for the project phases..Care needs to be taken to create good and effective documentation.Documentation should be created as part of the process and not written after the fact. Documentation is the product of all phases. It should be a working by-product throughout the life cycle. The tendency to “postdocument” (document after the fact) should be avoided.All documentation should follow certain standards which are prescribed out for the project or the organization.Documentation should be reviewed and approved for release. It should be available to all authorized persons who may need to refer to it. Obsolete documents should not be in circulation to avoid confusion. . -The procedure to be used to request for change in documentation, to evaluate and process such changes, to review changes made and to release the modified documents . should be clearly laid. Unauthorized persons should not be able to change documentation. All changes made to the documents and the reasons why they were made should be noted as part of the documents.
34 Stlf-Instructional Material

Overoitie of System Analysis and Design 'Standard used to create documents ^pically address the following :
• Title page and documents id, alongwith other identifiers Jike project name• Versions control information,• Names of author, reviewer, approver• Date of release• Version number• Change control history• Table of contents, figures and tables• Scope of the documents• Expected reader profile• Definitions and acronyms• Other documents to refer to (specific references)• Overview/introduction• Summary/conclusions as executive summary, if relevant• Main body of the documents• Supporting appendices.
The style used should ensure that each art of the documents can be referred to (has some identifier). The language should be
• IVined to the reader profile• Clear• Concise• Comprehensive• Courteous• Precise• Simple• Flowing properly• Easy to read and understand
Maintaining continuity.Documents should include all necessary illustrations and tables. References should be provided for the ease of the user. The style should be consistent.The headings, style and general appearance should be consistent. The hierarchy of the documents should be clear to the reader.Technical editors are sometimes used to ensure that the documents are well written.lypicaliy, organizations have standards for each type of documents. For example, the organization may have a standard for requirements specification which give each of the topics to be addressed and the order in which they are to be put in the documents. These standards are derived using industry standard organizations based on quality models previous experiences and the opinions of senior staff in the organization.
NOTES
' /
0.
2.3.2 lypes of Documentation and their ImportanceDocumentation is created at each phase of a project. The mqjor types of documentation and their importance are tabulated in Table 2.1.
Self-Jnsiructional Material $S
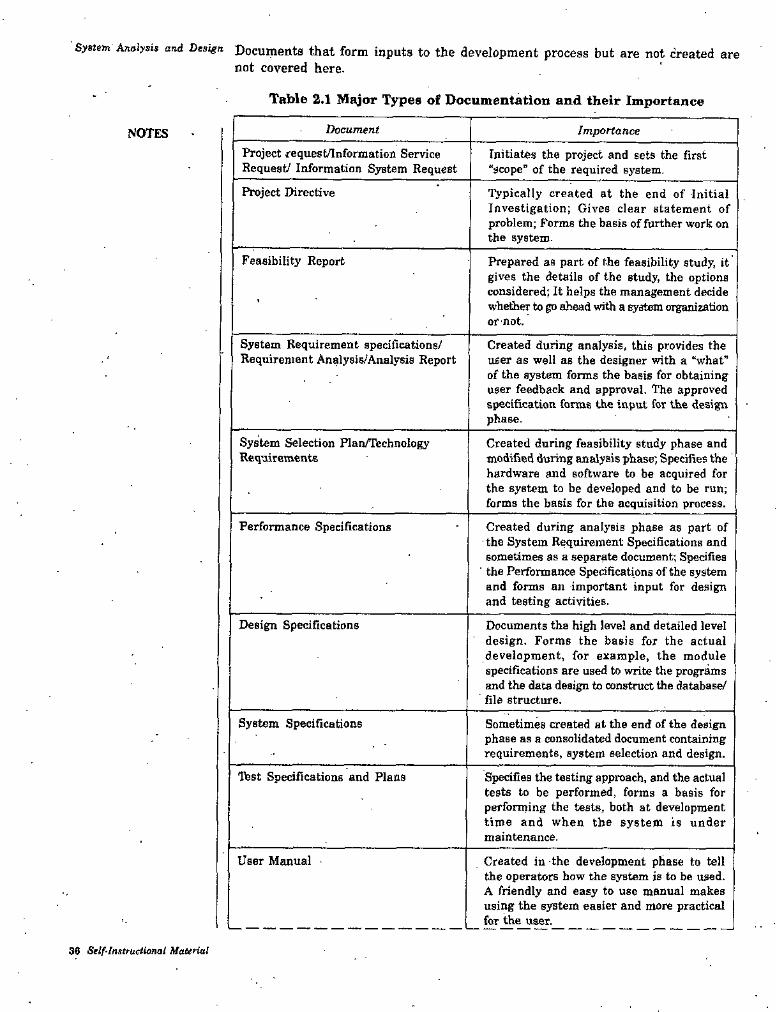
System Anolysu and Design Documents that form inputs to the development process but are not created arenot covered here.
Table 2.1 Major Types of Documentation and their Importance
£)ocu77ien< ImportanceNOTESProject request/information Service Request/ Information System Request
Initiates the project and sets the first “scope” of the required system.
Project Directive Typically created at the end of Initial Investigation; Gives clear statement of problem; Forms the basis of further work on the system.
Feasibility Report Prepared as part of the feasibility study, it gives the details of the study, the options considered; It helps the management decide whether to go ahead with a system organization or not.
System Requirement specifications/ Requirement Analysis/Analysis Report
Created during analysis, this provides the user as well as the designer with a “what” of the system forms the basis for obtaining user feedback and approval. The approved specification forms the input for the design phase.
System Selection Plan/Technology Requirements
Created during feasibility study phase and modified during analysis phase; Specifies the hardware and software to be acquired for the system to be developed and to be run; forms the basis for the acquisition process.
Performance Specifications Created during analysis phase as part of the System Requirement Specifications and sometimes as a separate document; Spedfies
■ the Performance Specifications of the system and forms an important input for design and testing activities.
Design Specifications Documents the high level and detailed level design. Forms the basis for the actual development, for example, the module specifications are used to write the programs and the data design to construct the database/ file structure.
System Specifications Sometimes created at the end of the design phase as a consolidated document containing requirements, system selection and design.
Test Specifications and Plans Specifies the testing approach, and the actual tests to be performed, forms a basis for performing the tests, both at development time and when the system is under maintenance.
Created in the development phase to tell the operators how the system is to be used. A friendly and easy to use manual makes using the 85^tem easier and more practical for the user.
User Manual ■
36 Self-Instructional Material

Overview of Syetem . Analysis and DesignC rested in the development phase to tell
t le operator how to operate the system. C peratore may not know much about the B rstem and this needs to be comprehensive e lough 'to take care of both normal operations' a nd error conditions.
Operations Manual
I ecorda created while working on the project s nd using the system like
• Review reports
■ Tbst logs
* Change requests
' Evaluation reports, etc.
Project Records
Often, plan documents get ignored as t ley are used mainly within the team. However, they are also important docum snts for a project to function properly. Examples of major plan documents and th 5ir uses are tabulated in Table 2.2 given below :
Table 2.2 Major Plan Documents and their Uses
Plan Description
Project Plan/ Quality Plan Us id to plan the use of resources, schedules, cor trols etc. for executing a project with time, cost and quality. Includes reviews and audits ret uired. Needs to be regularly referred to an 1 updated by the project manager as the . situation changes. Also used by the ms nagement to review the project.
Configuration Management Plan Us id to ensure the development’s configuration mi nagement procedures are defined and used. Se s out what is needed to ensure version coi trol and related configuration management issues.
Tfest Plan Approach Se s out the overall test plan strategy which is hen used to detail further into specific ' teit specifications, plans and test packs.
Tl; e approach to maintenance activities and ch inge control and the related resource - re uirements and reporting procedures are sp ilt out- in this'it is used to handle the maintenance activities.
’ Maintenance plan
2.3.3 Enforcing Documentatioi i Discipline in an OrganizationAs mentioned earlier, unfortunately, doci mentation is usually done after the fact. In fact, some teams actually have a “dm umentation phase” after the rest of the work is over, in which, the documents a e generated.The discipline of documentation has to 1 e enforced in an organization.Tb ensure that the culture of documenl ation is an integral part of the system team’s work habit, it is necessary that < ocumentation be considered an integral part of work. This implies that;
Self-Instructional Material S7
Syittm Analyaia and Deiign * Budgets should include documentation effort.* Procedures are set up to create, review documents.* Management does not say “as time is running short, just create the system.
We will create the document later”.To reinforce the integral aspect of documentation, “completion” of an activity should include completion of the associated document. For example,
> A phase should not be considered complete unless the documentation is complete.
* A program should not be considered complete unless it has required comment lines.
* A unit test activity should not be considered complete unless the test packs and records are correctly available.
Also, the next phase should not be started unless a phase is “complete” including the documentation.Documentation completion (of the required quality) should be one of the aspects considered whUe evaluating work.lb make documentation happen, the task of documenting should be made easy, lb enable persons document easily and properly organization should have in place standards which let the staff know how the document should be written. This ensures that good quality documents are created easily.Tlraining in technical writing and workshops help system persons write better. A technical editor may also be used to provide a more professional look..Tools should be available to simplify the task. Proper word processors and drawing tools, with appropriately set up templates help in meiking the task easier and reducing the resistance.
8S 3a^-In»tnietionaI MattruU

Ouervitw of Sy»tem Analysis and Design
STUDENT ACTIVITY 2.1
1. Wbat are the six phases of the System Development Life Cycle (SDLC) ?
2. What is documentation ? Explain. '
Self-Instructional Uaterial S8
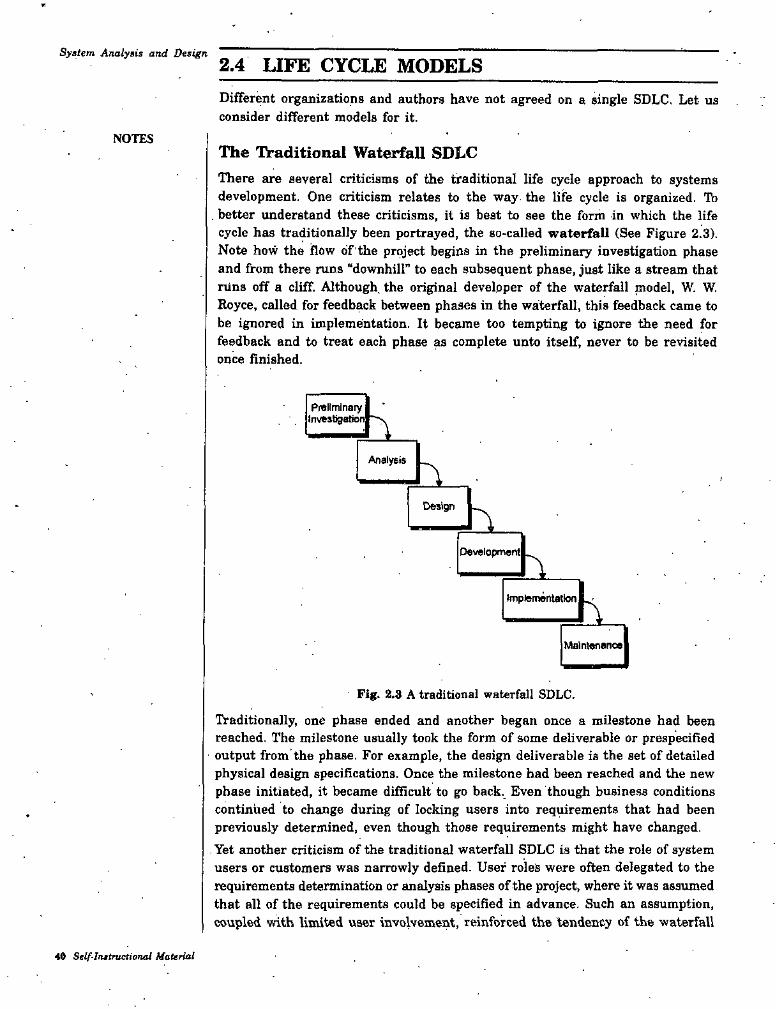
System A/ialysis and Design2.4 LIFE CYCLE MODELSDifferent organizations and authors have not agreed on a single SDLC, Let us consider different models for it.
NOTESThe IVaditional WaterfaU SDLCThere are several criticisms of the traditional life cycle approach to systems development. One criticism relates to the way the life cycle is organized, lb
. better understand these criticisms, it is best to see the form in which the life cycle has traditionally been portrayed, the so-called waterfall (See Figure 2.3). Note how the flow of the project begins in the preliminary investigation phase and from there runs “downhill” to each subsequent phase, just like a stream that runs off a cliff. Although, the original developer of the waterfall model, W. W. Royce, called for feedback between phases in the waterfall, this feedback came to be ignored in implementation. It became too tempting to ignore the need for feedback and to treat each phase as complete unto itself, never to be revisited once finished.
PrellmlnaiyInvesbgstior
Analysis nDesign n
Development
KImplementation
Maintenance
Fig. 2.3 A traditional waterfall SDLC.
Traditionally, one phase ended and another began once a mUestone had been reached. The milestone usually took the form of some deliverable or prespecified output from the phase. For example, the design deliverable is the set of detailed physical design specifications. Once the milestone had been reached and the new phase initiated, it became difficult to go back. Even though business conditions continued to change during of locking users into requirements that had been previously determined, even though those requirements might have changed. Yet another criticism of the traditional waterfall SDLC is that the role of system users or customers was narrowly defined. User roles were often delegated to the requirements determination or analysis phases of the project, where it was assumed that all of the requirements could be specified in advance. Such an assumption, coupled with limited user involvement, reinforced the tendency of the waterfall
40 Self-InstruetioruU Ualerial
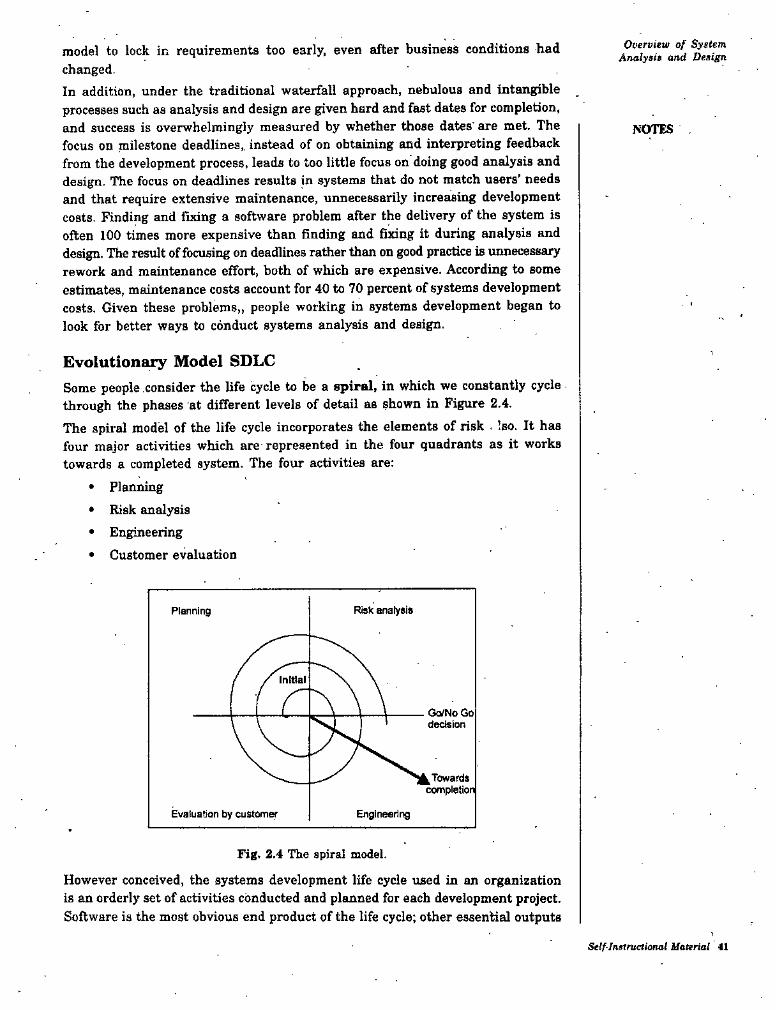
Overview of System Analysis and Designmodel to lock in requirements too early, even after business conditions had
changed.In addition, under the traditional waterfall approach, nebulous and intangible processes such as analysis and design are given hard and fast dates for completion, and success is overwhelmingly measured by whether those dates' are met. The focus on milestone deadlines,, instead of on obtaining and interpreting feedback from the development process, leads to too little focus on doing good analysis and design. The focus on deadlines results in systems that do not match users’ needs and that require extensive maintenance, unnecessarily increasing development costs. Finding and iixing a software problem after the delivery of the system is often 100 times more expensive than finding and fixing it during analysis and design. The result of focusing on deadlines rather than on good practice is unnecessary rework and maintenance effort, both of which are expensive. According to some estimates, maintenance costs account for 40 to 70 percent of systems development costs. Given these problems,, people working in systems development began to look for better ways to conduct systems analysis and design.
NOTES
Evolutionary Model SDLCSome people consider the life cycle to be a spiral, in which we constantly cycle through the phases at different levels of detail as shown in Figure 2.4.The spiral model of the life cycle incorporates the elements of risk . 'so. It has four major activities which are represented in the four quadrants as it works towards a completed system. The four activities are:
• Planning
• Risk analysis• Engineering• Customer evaluation
Risk enatysisPlanning
completion
Evaluation by customer Engineering
Fig. 2.4 The spiral model.
However conceived, the systems development life cycle used in an organization is an orderly set of activities conducted and planned for each development project. Software is the most obvious end product of the life cycle; other essential outputs
Self-Instructional Material 41
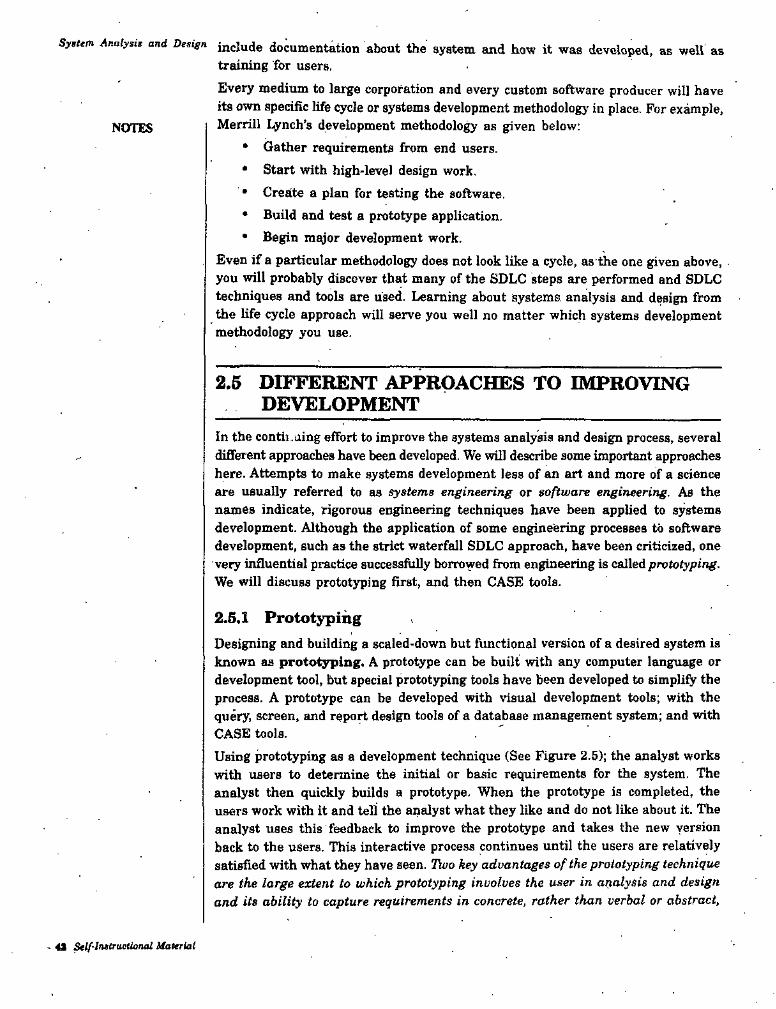
System Analyst, and Design include documentation about the system and how it was developed, as well astraining for users.Every medium to large corporation and every custom software producer will have its own specific life cycle or systems development methodology in place. For example, Merrill Lynch’s development methodology as given below:
• Gather requirements from end users.• Start with high-level design work,• Create a plan for testing the software.• Build and test a prototype application.• Begin mqjor development work.
Even if a particular methodology does not look like a cycle, as the one given above, you will probably discover that many of the SDLC steps are performed and SDLC techniques and tools are used. Learning about systems analysis and design from the life cycle approach will serve you well no matter which systems development methodology you use.
NOTES
2.6 DIFFERENT APPROACHES TO IMPROVING DEVELOPMENT
In the contii.aing effort to improve the systems analysis and design process, several different approaches have been developed. We will describe some important approaches here. Attempts to make systems development less of an art and more of a science are usually referred to as systems engineering or software engineering. As the names indicate, rigorous engineering techniques have been applied to systems development. Although the application of some engineering processes to software development, such as the strict waterfall SDLC approach, have been criticized, one very influential practice successfully borrowed from engineering is called prototyping. We will discuss prototyping first, and then CASE tools.
2.5.1 PrototypingDesigning and building a scaled-down but functional version of a desired system is known as prototyping. A prototype can be built with any computer language or development tool, but special prototyping tools have been developed to simplify the process. A prototype can be developed with visual development tools; with the query, screen, and report design tools of a database management system; and with CASE tools. . 'Using prototyping as a development technique (See Figure 2.5); the analyst works with users to determine the initial or basic requirements for the system. The analyst then quickly builds a prototype. When the prototype is completed, the users work with it and tell the analyst what they like and do not like about it. The analyst uses this feedback to improve the prototype and takes the new version back to the users. This interactive process continues until the users are relatively satisfied with what they have seen. Two key advantages of the prototyping technique are the large extent to which prototyping involves the user in analysis and design and its ability to capture requirements in concrete, rather than verbal or abstract,
~ 41 ^If-lnttractiorud Material
from. In addition to being used as a stand-alone process, prototyping may also be used to augment the SDLC. For example, a prototype of the final system may be developed early in analysis to help the analysts identify what users want. Then the final system is developed based on the specifications of the prototype.
Ovtrvieu of SynUm Analysis and Dttign
NOTESInitial' RequirementsIdentefy
ProblemDevelop
Prototype
d-'Convert to Operational
System<•
New Requirements/If Prototype
Inefflcient
RrobiemsImplement and Use Prototype
Revise and Enhance ■ Prototype4 Next Version
Fig. 2.5 The prototyping methodology.
2.5.2 CASE ToolsOther efforts to improve the systems development process have taken idvantage of the benefits offered by computing technology itself. The result has been the creation and fairly widespread use of computer-aided software engineering, or CASE, tools. CASE tools have been developed for internal use and for sale by several leading firms, including Oracle (Designer), Computer Associates (Advantage (3en), and IBM (Rational Rose).CASE tools are built around a central repository for system descriptions and specifications, including information about data names, format, uses, and locations. The idea of a central repository of information about a project is not new—^the manual form of such a repository is called project dictionary or workbook. The difference is that CASE tools automate the repository for easier updating and consistency. CASE tools also include diagramming tools for data flow diagrams and other graphical aids, screen and report design tools, and other special-purpose tools. CASE helps programmers and analysts do their jobs more efficiently and more effectively by automating routine tasks. In some organizations, CASE has been extremely successful, whereas in others it has not.
Stlf-IrMructicnal Mattrial 4S

SyBtem AaalyBia and Dtaign
STUDENT ACTIVnY 2.21. What are the various criticisms to traditional waterfall SLDC ? Explain.
2. What is JAD ? How does is help group members ?
44. Sclf-InBiructional Maurial
Overview of System Analysis and DesignSUMMARY
* A system is defined as a collection of related components that interact to perform a task in order to accomplish a goal.
* System analysis and design is a six-phase problem-solving procedure for . examining an information system and improving it.
* The System Development Life Cycle (8DLC) is the step-by-step process that many organizations follow during systems analysis and design.
* The purpose of preliminary Investigation is to conduct a preliminary analysis, propose alternative solutions, describe costs and benefits and submit a preliminary plan with - recommendations.
* Data Flow DUgram (DFD) is a modelling tool that graphically shows the flow of data through a system.
. • The purpose of systems design is to do a preliminary design and then a detail design, and write a report.
* Systems design is one of the most crucial phases of a SDLC.Prototj^ping involves building a model or experimental version of all or part of a system so that it can be quickly tested and evaluated.
* In systems cUsvelopment, the hardware and software for the new system are acquired and tested.
* Systems implementation consists of converting the hardware, software, and files to the new system and training the users.
* System maintenance consists of keeping the system working by having system audits and periodic evaluations.
* Documentation is an integral part of the various phases of the life cycle and is produced as part of the phase.
* The spiral model of life cycle also incorporates the elements of risk also.* Prototyping is an iterative process of systems development in which requirements
are converted to a working system that is continually revised through close collaboration between an analyst and users.
* Computer-aided Software Engineering (CASE) tools are software tools that provide automated support for some portion of the systems development process.
NOTES
TEST YOURSELFAntwer the following queatione:
1. List different phases in the SDLC.2. Is it necessary to follow systems analysis and design methodologies when
building an information system ? Why not just build the system in any random manner ? What would happen ?
3. What are the variations in SDLC model ? Explain.4. Describe the various types of participants in any .types of project.6. What is prototyping ? What are its advantages ? How can a prototype be
developed ?/
Stif-lnstrur.lional MnlerM 45
System Analysis and Design 6. Write short notes on the following:(i) CASE tools
(it) RAD(Hi) Agile Methodologies (iv) extreme Programming.
7. What are the various approaches that have been developed during the course of time to improve traditional systems analysis and design process?
8. State True or False:(t) A feasibility study is conducted to see whether the required system is
workable or not.- (it) Analysis phase is not relevant with the detailed study of existing system.(Hi) The SDLC is not a structured sequence of phases for implementing an
information system.(jo) The maintenance phase is typically the longest process in the life
cycle.(c) Prototyping is an iterative'process of systems development in hich-
requirements are converted to a working system that is continually revised through close collaboration between an analyst and users.
(vi) CASE tools cannot be used to automate the SDLC.(vii) JAD is a structured.,process in which users, managers, and analysts
work together for several days in a series of intensive meeting to • specify or review system requirements.
(viii) Rational Unified Process (RUP) is an object-oriented systems development methodology.
NOTES>
9. Fill in the blanks:
(j) A.................... is an information specialist who performs systems analysis, design, and implementation.
(jj) The purpose ofdetail design, and write a report.
is to do a preliminary design and then a
................... consists of keeping the system working by having systemaudits and periodic evaluations.................... is an integral part of the various phases of the life cycleand is produced as part of the phase.
; model of the life cycle incorporates the elements of
(jjj)
(to)
<v) The ........risk also.Attempts to make systems development less of an art and more of a science are usually referred to as ........................Designing and building a scaled-down but functional version of a desired system is known as........................
(ot)
(vii)
................... helps programmers and analysts do their jobs more efficientlyby automating routine tasks.
(viii)
46 Self-Insiructiona! Material
Overview of System Analysis and DesignANSWERS
Test Yourself8. State True or False:
- (i) True {Hi) False(li) True
(vH) True9. Pill in the blanks:
(t) systems analyst {Hi) system maintenance ■(v) spiral{vi) systems engineering or software engineering
{vii) prototyping {viii) CASE
NOTES(n) False •
{iu) True {vi) False
{viii) True
(«) systems design {iv) Documentation
Self-Instruetional Material 47

>
I
K
SECTION B
3. Preliminary Investigation4. Feasibility Study
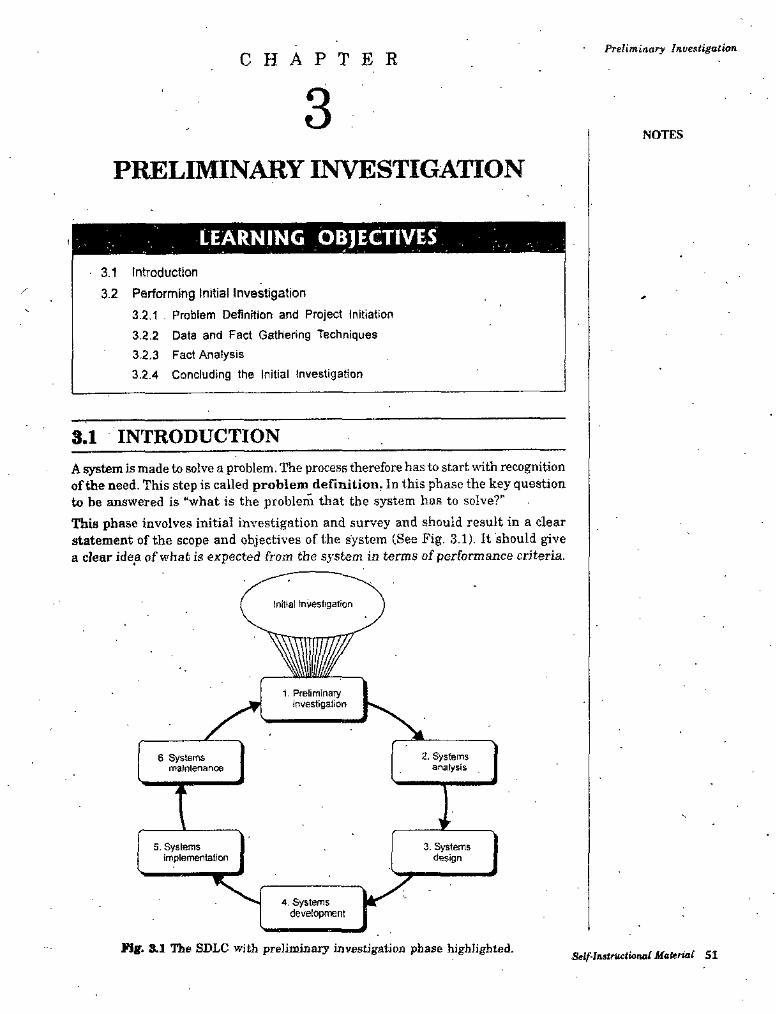
Preliminary InvestigationCHAPTER
3NOTES
PRELIMINARY INVESTIGATION
LEARNING OBJECTIVESi
• 3.1 Introduction 3.2 Performing Initial Investigation
3.2.1 . Problem Definition and Project Initiation3.2.2 Data and Fact Gathering Techniques3.2.3 Fact Analysis3.2.4 Concluding the Initial Investigation
3.1 INTRODUCTIONA system is made to solve a problem. The process therefore has to start whth recognition of the need. This step is called problem definition. In this phase the key question to be answered is "what is the problern that the system has to solve?"This phase involves initial investigation and survey and should result in a clear statement of the scope and objectives of the system (See Fig. 3.1). It should give a clear idea of what is expected from the system in terms of performance criteria.
Initial Investigation
1. Preliminary investigation
2. Systems analysis
6 Systems maintenance
I5. Systems
implementation3. Systems
design
4. Systems development
Fi|f. S.1 The SDLC with preiiminaxy investigation phase highlighted. Self-InstructioluU Material SI
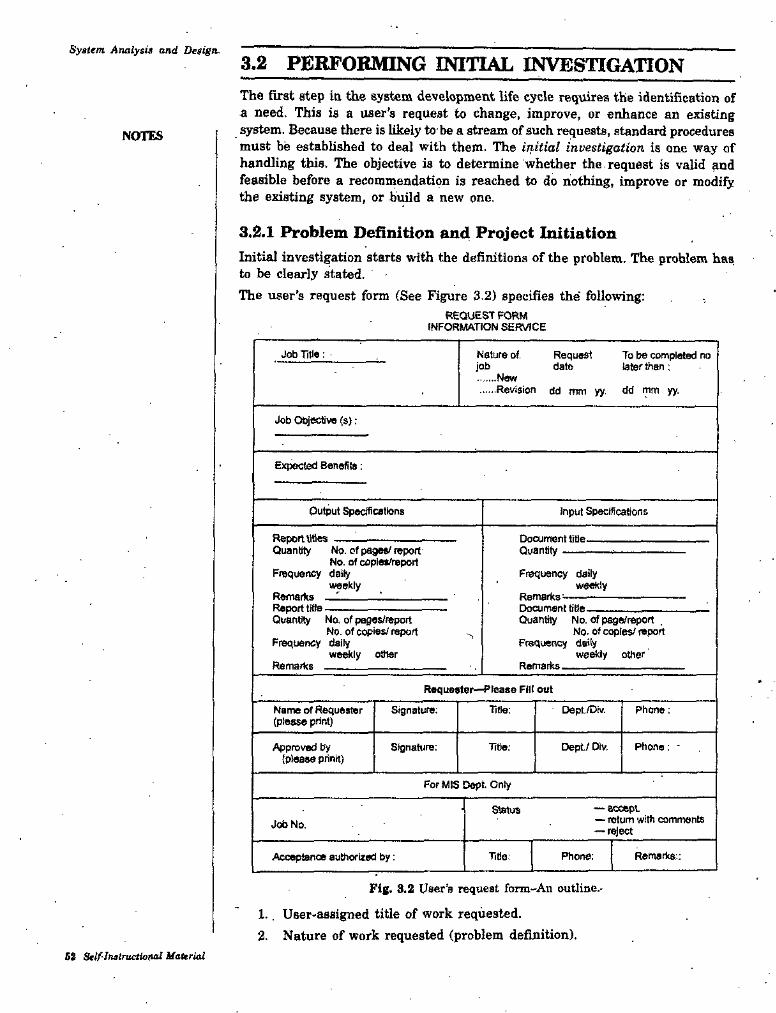
System Analysis and Design.3.2 PERFORMING INITIAL INVESTIGATIONThe first step in the system development life cycle requires the identification of a need. This is a user’s request to change, improve, or enhance an existing system. Because there is likely to be a stream of such requests, standard procedures must be established to deal with them. The initial investigation is one way of handling this. The objective is to determine whether the request is valid and feasible before a recommendation is reached to do nothing, improve or modify the existing system, or build a new one.
NOTES
3.2.1 Problem Definition and Project InitiationInitial investigation starts with the definitions of the problem. The problem has to be clearly stated.The user’s request form (See Figure 3.2) specifies the’ following:
REQUEST FORM INFORMATION SERVICE
Job Utle: Nature of. Request To be completed no later ^an:job date
.New■Revision pd mm yy. dd mm yy.
Job Objective (s);
Expected Benefits:
Output Specifications Input Specificatons
Report titles ------------------------Quantity No. of p^ea/report
No. of cpples/report
Document litie. Quantity------ -
Frequency daib Frequency daily weeKlyweekly
Rematirs Report title Quantity No. ofpeges/report
No. of copies/ report
Remarks ^----------------------------Document tlHe_____________Quantity No. of page/report
No. of copies/ reportFrequertcy dally Frequency dally
weekly otHer weekly otherRemadrs Remarks
Requeater-^lease Fill out
Name of Requester (please print)
TlBe: Dept./Div. Phono:Signature:
Dept/ DIv. Phane:Approved by (please piinit)
Signature: Tree;
For MIS Dept. Only
— accept— return with comments— reject
StatusJob No.
Remarks::Title: Phono;Acceptance authorized by:
Fig. 3.2 Uaer'a request form-An outline.-
1.. User-assigned title of work requested.2. Nature of work requested (problem definition).
62 Self-tnalTuctional Material
Preliminary Investigation3. Date request to be submitted.4. Date job should be completed.6. Job objective(8>^purpose of job requested.6. Expected benefits to be derived from proposed change.7. InpuVoutput description—quantity (number of copies or pages) and frequency
(daily, weekly, etc.) of inputs and outputs of proposed change.8. Requester’s signature, title, department and phone number.9. Signature, title, department, and phone number of person approving the
request.The user request identifies the need for change and authorises tiie initial investigation. It may undergo several modifications before it becomes a written commitment. .Once the request is approved, the following activities are carried out: background investigation, fact-finding and analysis, and presentation of results—called project proposal. The proposal, when approved, initiates a detailed user-oriented specification of system performance and analysis of the feasibility of the candidate system. A feasibility study focuses on identifying and evaluating alternative candidate systems
' with a recommendation of the best system for the job. This chapter deals with the initial investigation. Chapter 4 discusses the feasibility study.The user or the system analyst may. identify the need for a candidate system or for enhancements in the existing system.Often problems come into focus after a joint meeting between the user and the analyst. In either case, the user initiates an investigation by filling out a request form for information. The request provides for statements of objective and expected benefits.The problem definition should clearly given:
• The objective• The results which the user wants to achieve with the system.
The problem must not be confused with the solution.For example the following is not a problem:“We need a computerized database of customers”This statement given no idea of what are the objectives of the system or what results a user wants. The problem in this case could have been any of the following:We need to be able to generate a mailing list of all our old customers based on selection criteria like products purchased from us, city, income etc.
NOTES
or
Our MD (Managing Director) needs to be able to claim, that we use computers at the next industry meeting to enhance out corporate.
or
We need to be able to effectively follow up pending payments as we have too many outstanding.The .problem should be separate from the symptoms and the causes and the solutions. An analyst may start off with a statement like “the line in front of the teller is too long” and find the problem which could be related to excessive processing time or a badly laid out.building or a clerk who always comes in late.The analyst needs to be alert and inquiring to define the actual problem and not get misled at this initial stage by possible solutions.
Self-Instructiojutl Material 68
System Analysis and Design Stating the problems is the initial step of the project- Once the problem is defined,the project is initiated and the planning moves to the next step, where some background analysis is performed.
3.2.2 Data and Fact Gathering TechniquesNOTES
Overview
Fact-finding is an important step for the analyst, based on which the analyst gains an understanding of the existing system and its problem, and of the requirement from the new system. There are a number of fact finding tools, which the analyst uses for this; the.se are discussed in the following sub-section. The analyst chooses the tools he considers suitable and uses them to gather all the required information, which is then analyzed.
Study Existing Documents and RecordsMany systems and organizations have some type of documents and records already available. Examples of such documents are:
• Input form• Existing system user manuals, and other system documentation• System review/audit• Correspondence, for example, problem logs, request for enhancements• Brochures• Reports from the system• Data file procedure manuals.
Study of available documentation is a fast and person-independent way of fact gathering. The analyst can study these document comfortably and use these to prepare further questions for the rest of the fact gathering exercise.
Interviews
Personal interviews are a direct method of obtaining information from people. By this the analyst learns about the existing system, problems and expectations.During an interview the analyst and the person being interviewed are meeting face to face. This gives the analyst a flexible opportunity to learn various pertinent facts. As the interviewer is facing the interviewee, he can observe the reaction of the interviewee and see how the person being asked a question is responding to it. This gives the interviewer an idea of the reliability of the inforniation being gathered. It also gives the interviewer chance to ask more questions along with some promising line, which may not have been thought of earlier.
Questionnaires
A questionnaire seeks information from persons in a written form and in a prescribe format against a set of questions. Questionnaires are good for gathering specific information where the questions can be structured in advance and uniformly for a number of persons.Questionnaires are useful as they are a quick means of gathering information and analyzing it together. They are particularly useful if the respondents are scattered geographically or there is no time to hold interviews.Questions could be;
64 StlfSMtmetioiKd Material
Preliminary Invettigation• Structured—here the respondent has to select from possible options and the range of answers is limited.
• Unstructured—asking the respondent’s opining and letting the respondent answer freely. Such questions are open-ended.
Examples of structured questions are where the answer could be:• Yes/no type• Selected from specified multiple choice• Selections on a ranking scale• Selections of a rating• Fill in the blank.
Structured questions need more analysis and may or may not give the type of information sought. Also, analyzing them may introduce analyst bias. They may however give better insights into the problems as they are open ended and exploratory. Often, they need follow up in the form of interviews.
Group Communication
\Vhen information is required from face-to-face sessions, but there is not enough time to conduct personal interviews, meetings can be held. Here, since there'are many persons present, more types of ideas can be discussed in a short time. Also, the comments of one person may prompt other persons to contribute facts they may have otherwise forgotten.Conducting a group session is a skilled matter as there are problems like:
• The group may be dominated by some persons and others, who mayotherwi,se have something to contribute, may be'shy and not speak up.*
• Problems with seniors may not be voiced because of seniors being present.• The situation could lead to a verbal fight between persons which may
need moderation.• Internal politics of an organization may determine what is said and what
is left unsaid, thus resulting in a false picture.• There may be situations where may persons talk simultaneously and are
agitated and the comments they make may not be heard or get recorded.
Presentations
At times, the analyst may hold a presentation presenting his understanding of the system and problems etc. Such a presentation would typically involve showing slides and talking to a group of users whose response is sought. The persons attending the presentation have an opportunity to respond and confirm of affect the analyst’s understanding.Presentations are useful in situations where the users are passive or too busy to actively explain things. Here, an analyst may use study of existing records and questionnaires etc., to put together a presentation.
NOTES
. 3.2.3 Fact Analysis
Data gathered by analyst has to be organized and evaluated to draw conclusions. Various means used to document and:analyze the data gathered include:
• Flow charts• DFDs • . '
Self-Imsinietuaci Material K5
System Analysis and Design * Decision tables* Structure charts.
Analysis is done using techniques like data elements;* Input-output* Recurring data* Reports usage.
NOTES
3.2.4 Concluding the Initial InvestigationBy this stage, the analyst has a thorough knowledge of the system as part of the initial investigation. The initial investigation culminates with a system proposal or a project request.Work on the initial investigation was initiated with a system request or an information system request which gave the system objectives, benefits expected, output descriptions, input descriptions. This document is modified as a result of the initial investigation,; even the objectives may be modified and refined. The benefits and the input and output descriptions are expanded. The requirements for the feasibility study resources are also included.The modified system request is presented by the analyst and is reviewed by the user. Review comments of the user are then incorporated to generate a final document.
56 Self-Instructioiud liaU'ial

Preliminary Ineestigation
STUDENT ACTIVITY 3.1
1. How system planning is important for any system?
2. Write a short note on fact analysis.
Self-Inttnictional Maltriat 37
System Anoiysis ond PesignSUMMARY
*. Planning information systems has become increasingly important because information is a vital resource and company asset, more and more funds are committed to information systems, and system development is a serious business for computers that incorporate data bases and'networking.
• Planning for information systems has a time horizon and a focus dimension. The time horizon dimension specifies the time range of the plan, whereas the focus dimension relates whether the primary concern is strategic, managerial, or operational.
• The initial investigation has the objective of determining the validity of the user’s request for a candidate .system and whether a feasibility study should be conducted, The objectives of the problem posed by the user must be understood within the framework of the organization’s MIS plan.
• Determining user requirements is not easy. System requirements change, the articulation of requirements is difficult, and heavy user involvement and motivation are uncertain. Problems with the user/analyst interface add further difficulties to the procedure,
• There are three strategies for eliciting information regarding the user’s requirements: asking questions, obtaining information from the present system, and prototyping. The asking strategy assumes a stable system whei e the user is well informed about information requirements. In contrast, the prototyping strategy is appropriate for high-uncertainty information requirements determination.
• Fact-finding is the first step in the initial investigation. It includes a review of written documents, on-site observations, interviews, and questionnaires. The next step is fact analysis,-which evaluates the elements related to the inputs and outputs of a given system. Data flow diagrams and other charts are prepared during this stage.
• Personal interviews are a direct method of obtaining information from people.
• Questionnaires are useful as they are a quick means of gathering information and analyzing it together.
• The data flow diagram (DFD) shows the flow of data, the processes, and the • areas where they are stored. It is a commonly used structured tool for displaying the logical aspects of the system under study. Decision tables are' used as a supplement when complex decision logic cannot be represented clearly in a DFD.
• The outcome of the initial investigation is to determine whether an alternative system is feasible. The proposal details the findings of the investigation. Approval of the document initiates a feasibility study which leads to the selection of the best candidate system.
NOTES
TEST YOURSELFAnswer the following questions:
,1. What important information does the user’s request form provide? 'Why is it so important in the initial investigation? Explain in detail.
. 68 Self insiructional Ualtrial

P/vliminary Inuesligalicn2. Why is it difficult to determine user requirements? Illustrate.3. Why it is so critical to manage system development? Explain, •4. What are the different fact gathering techniques? Discuss.5. By giving suitable examples describe each type of fact gathering technique.6. State True of False;
(t) System selection means selecting the various hardware, software and services.
(it) Questionnaires are useful for gathering information and analysing it together.
(ui) Since the current system is studied in feasibility study, it does not need to be studied in later phases.
(iv) Data and fact gathering techniques include interviews and questionnaires.7. Fill in the blanks:
(i) Initial investigation starts with the(ii) The user request identifies the need for change and authorises the
NOTES
of the problem.
(in) The user initiates an investigation by filling out a ......information.'
(id) Personal interviews are a direct method of obtaining . from people.
for
ANSWERS
Test Yourself6. State True of False:
(i) True (Hi) False
7. Fill in the blanks:(0 definitions
(iii) request form
(ii) True (iu) True
(h) initial investigation • (ill) information
Se/f /nstructional Material 59
Feasibility StudyCHAPTER
NOTES
FEASIBILITY STUDY
LEARNING OB]ECTIVES4.1 Introduction
4.2 Assessing Project Feasibility
4.2.1 Assessing Economic Feasibility .4.2.2 Assessing Technical Feasibility4.2.3 Assessing .Operational Feasibility
4.2.4 Assessing Schedule Feasibility4.2.5 Assessing Legal and Contractual Feasibility
4.2.6 Assessing Political Feasibility
4.3 Feasibility Report
4.1 INTRODUCTIONDuring the first phase of ttie systems development life cycle, preliminary investigation, two primary activities are performed. The first project identification and selection, focuses on the activities during which the need for a new or enhanced system is recognized. This activity does not deal with a specific project but rather identifies the portfolio of projects to be undertaken by the organization. Thus, project identification and selection is often thought of as a “preproject* step in the SDLC. This recognition of potential projects may come as part of a lai^r preliminary investigation process, information ^sterns preliminary invest^ation, or from requests from managers and business units.Regardless of how a project is identified and selected, the next step is to conduct a more detailed assessment during project identification and selection. This assessment does not focus oh how the propo.sed system will operate but rather on understanding the scope of a proposed project and its feasibility of completion given the available resources. It is crucial that organizations understand whether resources should be devoted to a project; otherwise veiy expensive mistakes can be made. Preliminary investigation is where projects are accepted for development, rejected, or redirected. This is also where a systems analyst plays a major role in the systems development process. Numerous techniques for assessing project feasibility are described in this chapter.
4.2 ASSESSING PROJECT FEASIBILITYAll projects are feasible given unlimited resources and infinite time. Unfortunately, most projects must be developed within tight budgetary (i.e.. financial) and time
Self-Instructional Material 61
System Analysis and Design constraints. It means that assessing project feasibility is a required activity for all information systems projects and is a potentially large undertaking. It requires that a system analyst should evaluate a wide range of factors. Typically, some of these factors will be more important than others for some prt>jects and relatively unimportant for others. Although the specifies of a given project will dictate which factors are important, most feasibility factors are represented by the categories given below ;
• • Economic• Technical
Operational• Schedule• Legal and contractual• Political
Together, the culmination of these feasibility analyses forms the business case that justifies the expenditure of resources on the project. Let us examine the various feasibility issues.
NOTES
, •
4.2.1 Assessing Economic FeasibilityThe purpose of assessing economic feasibility is to identify the financial benefits and costs associated with the .development project. Economic feasibility is often referred to as cost-benefit analysis. During preliminary investigation, it will be- impossible to precisely define all benefits and costs related to a particular project. Yet, it is important that the analyst should spend adequate time identifying and quantifying these items or it will be impossible to conduct an adequate economic analysis and make meaningful comparisons between rival projects. Here, we will describe typical benefits and costs resulting from the development of an information system. Useful worksheets can also be provided for recording costs and benefits. Additionally, several common techniques for making cost- benefit calculations are presented. These worksheets and techniques are used after each SDLC phase as the project is reviewed in order to decide whether to continue, redirect, or kill (abandon) a project.
Determining Project BenefitsAn information system can provide many benefits to an organization. For example, a new or renovated information system can automate monotonous jobs; and reduce errors; provide innovative services to customers and suppliers; and improve organizational efficiency, speed, flexibility, and morale. In general, the benefits can be viewed as being both tangible and intangible. Tangible benefits refer to items that can be measured in rupees and with certainty. Examples of tangible benefits might include reduced personnel expenses, lower transaction costs, or higher profit margins. It is important to note that not all tangible benefits can be easily quantified. For example, a tangible benefit that allows a company to perforin a task in 50 percent of the time may be difficult to quantity in terms of hard rupee savings. Most tangible benefits will fit within the following categories:
• Cost reduction and avoidance• Error reduction
62 Self-Instructional Material

Feasibility Study• Increased flexibility
• Increased speed of activity
• Improvement of management planning and control
• Opening new markets and increasing sales opportunities.Intangible benefits refer'to items that cannot be easily measured in rupees or with certainty. Intangible benefits may have direct organizational benefits, such as the improvement of employees morale, or they may have broader societal implications, siich as the reduction of waste creation or resource consumption. Potential tangible benefits may have to be considered intangible during preliminary investigation because an analyst may not be able to quantify them in rupees or with certainty at this stage in the life cycle. During later stages, such intangibles can become tangible benefits as he/she better understands the ramifications of the system he/ she is designing; In this case, the BPP (Baseline Project Plan—A mqjor outcome and deliverable from the preliminary investigation phase that contains the best estimate of a project’s scope, benefits, costs, risks and resource requirements) is updated and the business case revised to justify continuation of the project to the nex phase. Table 4.1 provides numerous intangible benefits often associated with the development of an information system. Actual benefits will vary from system to system. After determining project benefits, project costs must be identified.
Table 4.1 Intangible Benefits fixim the Development of an Information System
NOTES
Competitive necessity More timely information Improved organizational planning Increased organizational flexibilityPromotion of organizational learning and understandingAvailability of new. better, or more informationAbility to investigate more alternativesFaster decision makingInformation processing efficiencyImproved asset utilizationImproved resource controlIncreased accuracy in clerical operationsImproved work process that can improve employee moralePositive impacts on society.
Determining Project Costs
Similar to benefits, an information system can have bofh tangible and intangible costs. Tangible costs refer to items that an analyst can easily measure in rupees and with certainty. From an IS development perspective, tangible costs include items such as hardware costs, labour costs, and operational costs including employee training and building renovations. Alternatively, intangible costs are those items that an analyst cannot easily measure in terms of rupees or with certainty. Intangible costs can include loss of customer goodwill, employee morale, or operational inefficiency. Table 4.2 provides a summary of common costs associated with the development and operation of an information system.
Self-Instructional Material 63
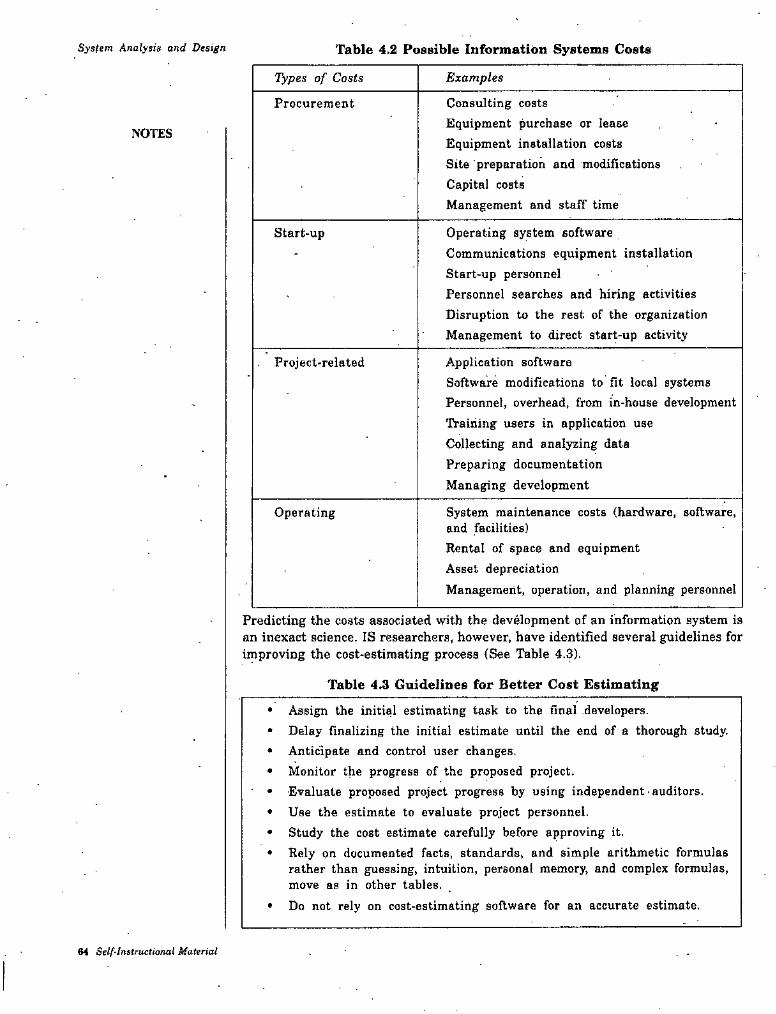
System Analysis and Design Table 4.2 Possible Information Systems Costs
Types of Costs Examples
Procurement Consulting costs Equipment purchase or lease Equipment installation costs Site preparation and modifications Capital costsManagement and staff time
NOTES
Operating system software Communications equipment installation Start-up personnelPersonnel searches and hiring activities Disruption to the rest of the organization Management to direct start-up activity
Start-up
Project-related Application softwareSoftware modifications to fit local systems Personnel, overhead, from in-house development Training users in application use Collecting and analyzing data Preparing documentation Managing development
System maintenance costs (hardware, software, and facilities)Rental of space and equipment Asset depreciationManagement, operation, and planning personnel
Operating
Predicting the costs associated with the development of an information system is an inexact science. IS researchers, however, have identified several guidelines for improving the cost-estimating process (See Table 4.3).
Table 4.3 Guidelines for Better Cost Estimating
Assign the initial estimating task to the final developers.Delay finalizing the initial estimate until the end of a thorough study. Anticipate and control user changes.Monitor the progress of the proposed project.•Evaluate proposed project progress by using independent'auditors.Use the estimate to evaluate project personnel.Study the cost estimate carefully before approving it.Rely on documented facts, standards, and simple arithmetic formulas rather than guessing, intuition, personal memory, and complex formulas, move as in other tables.
• Do not rely on cost-estimating software for an accurate estimate.
64 Self-Instructional Material
StudyBoth underestimating and overestimating costs are problems an analyst must avoid. Underestimation results in cost overruns, whereas overestimation results in unnecessary allocation of resources that might be better utilized.Besides tangible and intangible costs, an analyst can distii^uish IS-related development costs as either one-time or recurring (the same is true for benefits although we do not discuss this difference for benefits). One-time costs refer to those associated with project initiation and development and the start-up of the system. These . costs typically encompass activities such as systems development, new hardware and software purchases, user training, site preparation, aiid data or system conversion. When conducting an economic cost-benefit analysis, a worksheet should be created for capturing these expenses. For very large projects, one-time costs may be staged over one or more years. In these cases, a separate, one-time cost worksheet should be created for each year. This separation will make it easier to^perform present value calculations (described later). Recurring costa refer to those costs resulting from the ongoing evolution and use of the system, Examples of these costs typically include :
• Application software maintenance• Incremental data storage expenses• Incremental communications• New software and hardware leases• Supplies and other expenses (e.g., paper, forms, data center personnel).
Both one-time and recurring costs can consist of items that are fixed or variable in nature. Fixed costs refer to costs that are billed or incurred at a regular interval and usually at a fixed rate (a facility lease payment). Variable costs refer to items that vary in relation to usage (long-distance phone charges).Because the development and useful life of a system may span several years, the benefits and costs must be normalized into present-day values in order to perform meaningful cost-benefit comparisons. In the next section, we will describe the relationship between ,time and money.
NOTES
The Time Value of MoneyMost techniques used to determine economiic feasibility encompass the concept of the time value of money (TVM). TVM refers to the concept of comparing present cash outlays to future expected returns. As previously discussed, the development of an information system has both one-time and recurring costs. Furthermore, benefits from systems development will likely occur sometime in the future. Because many projects may be competing for the same investment rupees and may have different useful life expectancies, all costs and benefits must be viewed in relation to their present value when comparing investment options.A simple formula can be used when finding out the present value of the payments:
1FV„ = Y X(i+ir
Here, PV^ is the present value of Y rupees n years, from now when i is the discount rate (the rate at which money can be borrowed or invested is called the cost of capital, and is called the discount rate for TVM calculations).lb calculate the net present value (NPV) of the payments, simply add the present values calculated using the above formula, i.e.,
NPV = PV, + PV, + .... + PVi 2 n
*
Self-InatrucUonat Material 66
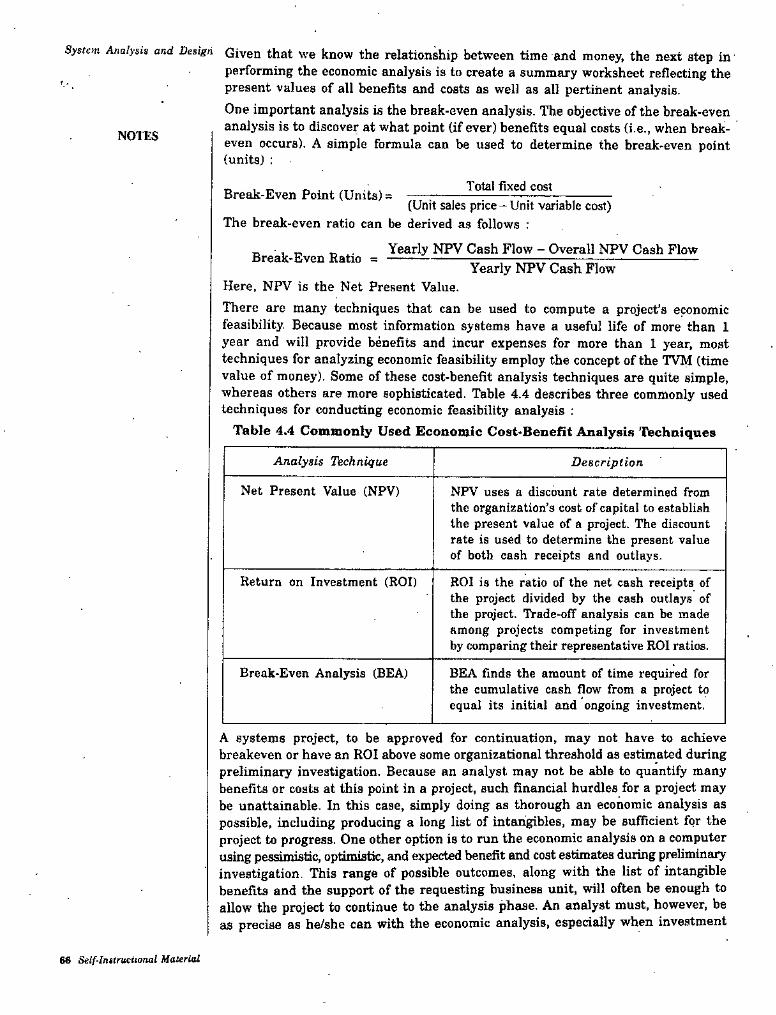
S>sf£m Analysis and Design Given that we know the relationship between time and money, the next step inperforming the economic analysis is to create a summary worksheet reflecting the present values of all benefits and costs as well as all pertinent analysis.One important analysis is the break-even analysis. The objective of the break-even analysis is to discover at what point (if ever) benefits equal costs (i.e., when breakeven occurs). A simple formula can be used to determine the break-even point (units) :
r .
NOTES
Total fixed costBreak-Even Point (Units) =(Unit sales price-Unit variable cost)
The break-even ratio can be derived as follows :
Yearly NPV Cash Flow - Overall NPV Cash FlowBreak-Even Ratio =
Yearly NPV Cash FlowHere, NPV is the Net Present Value.There are many techniques that can be used to compute a project’s economic feasibility Because most information systems have a useful life of more than 1 year and will provide benefits and incur expenses for more than 1 year, most techniques for analyzing economic feasibility employ the concept of the TVM (time value of money). Some of these cost-benefit analysis techniques are quite simple, whereas others are more sophisticated. Table 4.4 describes three commonly used techniques for conducting economic feasibility analysis :
Table 4.4 Commonly Used Economic Cost-Beneflt Analysis Techniques
Analysis Technique Description
Net Present Value (NPV) NPV uses a discount rate determined from the organization’s cost of capital to establish the present value of a project. The discount rate is used to determine the present value of both cash receipts and outlays.
Return on Investment (ROD ROl is the ratio of the net cash receipts of the project divided by the cash outlays of the project. ’Trade-off analysis can be made among projects competing for investment by comparing their representative ROI ratios.
Break-Even Analysis (BEA) BEA finds the amount of time required for the cumulative cash flow from a project to equal its initial and ongoing investment.
A systems project, to be approved for continuation, may not have to achieve breakeven or have an ROI above some organizational threshold as estimated during preliminary investigation. Because an analyst may not be able to quantify many benefits or costs at this point in a project, such financial hurdles for a project may be unattainable. In this case, simply doing as thorough an economic analysis as possible, including producing a long list of intangibles, may be sufficient for the project to progress. One other option is to run the economic analysis on a computer using pessimistic, optimistic, and expected benefit and cost estimates during preliminary investigation. This range of possible outcomes, along with the list of intangible benefits and the support of the requesting business unit, will often be enough to allow the project to continue to the analysis phase. An analyst must, however, be as precise as he/sbe can with the economic analysis, especially when investment
66 Self-lnUrucUonal Material
Feasibility Studycapital is scarce. In this case, it may be necessary to conduct some typical analysis phase activities during preliminary investigation in order to clearly identify inefficiencies and shortcomings with the existing system and to explain how a new system will overcome these problems. Thus, building the economic case for a systems project is an open-ended activity; how much analysis is needed depends on the particular project, stakeholders, and business conditions. Also, conducting, economic feasibility analyses for new types of information systems is often very difficuit.
NOTES
4.2.2 Assessing Technical FeasibilityThe purpose of assessing technical feasibility is to gain an understanding of the organization’s ability to construct the proposed system. This analysis should include an assessment of the development group’s understanding of the possible target hardware, software, and operating environments to be used as well as system size, complexity, and the group’s experience with similar systems. Here, we will discuss a framework that can be used for assessing the technical feasibility of a project in which a level of project risk can be determined after answering a few fundamental questions.It is important to note that all projects have risk and that risk is not necessarily something to avoid. Yet it is also true that, because organizations typically expect a greater return on their investment for riskier projects, understanding the sources and types of technical risks proves to be a valuable tool when a project is assessed. Also, risks need to be managed in order to be minimized; an analyst should, therefore, identify potential risks as early as possible in a project. The potential consequences of not assessing and managing risks can Include the following ;
• Failure to attain expected benefits from the project• Inaccurate project cost estimates• Inaccurate project duration estimates• Failure to achieve adequate system performance levels• Failure to adequately integrate the new system with existing hardware,
software, or organizational procedures.An analyst can manage risk on a project by changing the project plan to avoid risky factors, assigning project team members to carefully manage the risky aspects, and setting up monitoring methods to determine whether or not potential risk is, in fact, materializing.The amount of technical risk associated with a given project is contingent on four primary factors; project size, project structure, the development group’s experience with the application and technology area, and the user group’s experience with systems development projects and the application area. Aspects of each of these risk areas are summarized in Table 4.5,
'Table 4.5 Project Risk Assessment Factors
Risk Factor Examples
Project Size Number of members on the project team Project duration timeNumber of organizational departments involved in projectSize of programming effort (e.g., hours, function points)
Self-Instructional Material 67
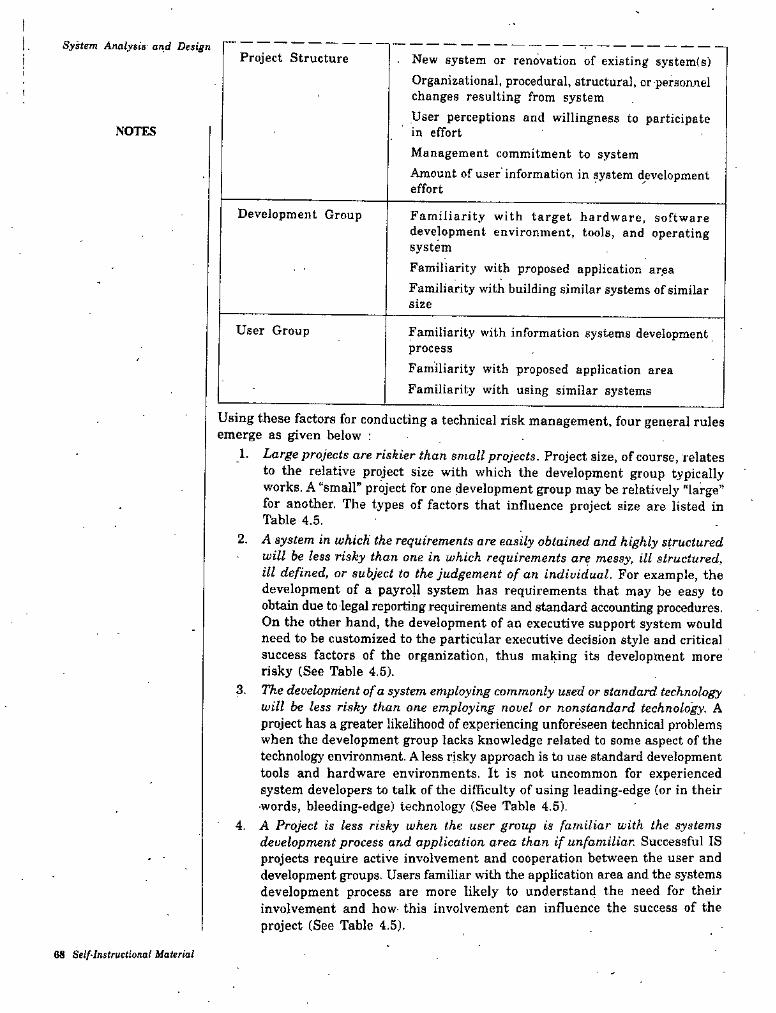
System Analysis and DesignProject Structure • New system or renovation of existing system(B)
Organizational, procedural, structural, or personnel changes resulting from systemUser perceptions and willingness to participate in effortManagement commitment to systemAmount of user information in system development effort
NOTES
Development Group Familiarity with target hardware, software development environment, tools, and operating systemFamiliarity with proposed application areaFamiliarity with building similar systems of similar size
User Group Familiarity with information systems development processFamiliarity with proposed application area Familiarity with using similar systems
Using these factors for conducting a technical risk management, four general rules emerge as given below :
1. Large projects are riskier than small projects. Project size, of course, relates to the relative project size with which the development group typically works. A “small" project for one development group may be relatively "large” for another. The types of factors that influence project size are listed in Table 4.5,
2. A system in which the requirements are easily obtained and highly structured will be less risky than one in which requirements are messy, ill structured, ill defined, or subject to the judgement of an individual. For example, the development of a payroU system has requirements that may be easy to obtain due to legal reporting requirements and standard accounting procedures. On the other hand, the development of an executive support system would need to be customized to the particular executive decision style and critical success factors of the organization, thus making its development more risky (See Table 4.6).
3. The developnient of a system employing commonly used or standard technology will be less risky than one employing novel or nonstandard technology. A project has a greater likelihood of experiencing unfore.seen technical problems when the development group lacks knowledge related to some aspect of the technology environment. A less risky approach is to use standard development tools and hardware environments. It is not uncommon for experienced system developers to talk of the difficulty of using leading-edge (or in their •words, bleeding-edge) technology (See Table 4.5).
4- A Project is less risky when the user group is familiar with the systems development process and application area than if unfamiliar. Successful IS projects require active involvement and cooperation between the user and development groups. Users familiar with the application area and the systems development process are more likely to understand the need for their involvement and how this involvement can influence the success of the project (See Table 4.5).
68 Selflnslructional Material
Feasibility StudyA project with high risk may still be conducted. Many organizations look at risk as a portfolio issues. Considering all projects, it is okay to have a reasonable percentage of high-, medium-, and low-risk projects. Given that some high-risk projects will get into trouble, an organization cannot afford to have too many of these. Having too many low-risk projects may not be aggressive enough to make major breakthroughs in innovative uses of systems. Each organization must decide on its acceptable mix of projects of varying risk.There are numerous other issues which can influence the success of the project. These nonfinancial and nontechnical issues are described ahead.
NOTES
4.2.3 Assessing Operational FeasibilityThere are other forms of feasibility that an analyst may need to consider when formulating the business case for a system during preliminary investigation. One relates to examining the likelihood that the project will attain its desired objectives,
• is called operational feasibility. Its purpose is to gain an understanding of the degree to which the proposed system will likely solve the business problems or take advantage of the opportunities outlined in the System Service Request or project identification study. For a project motivated from information systems planning, operational feasibility includes justifying the project on the basis of being consistent with or necessary for accomplishing the information systems plan. In fact, the business.case for any project can be enhanced by showing a link to the business or information systems plan. An analyst’s assessment of operational feasibility should also include an analysis of how the proposed system wiU affect organizational structures and procedures. Systems that have substantial and widespread impact on an organization’s structure or procedures are lypically riskier projects to undertake. Thus, it is important to have a clear understanding of how an information system will fit into the current day-to-day operations of the oiganization.
4.2.4 Assessing Schedule FeasibilityA feasibility concern that relates to project duration is referred to as assessing schedule feasibility. The purpose of assessing schedule feasibility for a systems analyst is to gain an understanding of the likelihood that all potential time frames - and completion date schedules can be met and that meeting these dates wOl be sufficient for dealing with the requirements of the organization. For example, a system may have to be operational by a government-imposed deadline, by a particular point in the business cycle (such as the beginning of the season when new products
, are introduced), or at least by the time a competitor is expected to introduce a similar system. Further, detailed activities may only be feasible if resources are available when called for in the schedule. For example, the schedule should not call for system testing during rushed business periods or for key project meetings during annual vacation or holiday periods. The schedule of activities produced during preliminary investigation will be very precise and detailed for the analysis phase. The estimated activities and associated times for activities after the analysis phase are typically not as detailed (e.g., it will take 2 weeks to program the payroll report module) but are rather at the life-cycle-phase level (e.g., it will take 6 weeks for physical design, 4 months for programming, and so oh). This means that assessing schedule feasibility during project initiation and planning is more of a “rough-cut” analysis of whether the system can be completed within the constraints of the business opportunity or the desires of the users. While assessing schedule feasibility, an analyst should also evaluate scheduling trade-offs For example, factors such as project team size, availability of key personnel; subcontracting or
Self-Instructional Material 69
System Analysis and Design outsourcing activities, and changes in development environments may all be consideredas having a possible impact on'the eventual schedule. As with all forms of feasibility, schedule feasibility will be reassessed after each phase when an analyst can specify
•with greater certainty the details of each step for the next phase.
NOTES 4.2.5 Assessing Legal and Contractual FeasibilityIt is a feasibility concern that relates to assessing legal and contractual feasibility issues. In this area, an analyst need to gain an understanding of any potential legal ramifications due to the construction of the system. Possible considerations might include copyright or nondisclosure infringements, labour laws, antitrust legislation (which might limit the creation of systems to share data with other organizations), foreign trade regulations [e.g., some countries limit access to employee data by foreign corporations), and financial reporting standards as well as current or pending contractual obligations. Contractual obligations may involve ownership of software used in joint ventures, license agreements for use of hardware or software, nondisclosure agreements with partners, or elements of a labour agreement (e.g., a union agreement may preclude certain compensation or work-monitoring capabilities a user may want in a system). A common situation is that development of a new application system for use on new computers may require new or expanded, and more costly, system software licenses. Topically, legal and contractual feasibility is a greater consideration if an organization has historically used an outside organization for specific systems or services that it now is considering handling itself. In this case, ownership of program source code by another party may make it difficult to extend an existing system or link a new system with an existing purchased system.
4.2.6 Assessing Political FeasibilityA final feasibility concern focuses on assessing political feasibility in which an analyst attempts to gain an understanding of how key stakeholders within the organization view the proposed system. Because an information system may affect the distribution of information within the organization, and thus the distribution of power, the construction of an information system can have political ramifications. Those stakeholders not supporting the project may take steps to block, disrupt, or change the intended focus of the project.In summary, depending upon the given situation, numerous feasibility issues must be considered when planning a project. This analysis should consider economic, technical, operational, schedule, legal, contractual, and political issues related to the project. In addition to these considerations, project selection by an organization may be influenced by issues beyond those discussed here. For example, projects may be selected for construction despite high project costs and high technical risk if the systepi is viewed as a strategic necessity; that is, the organization views the project as being critical to the organization’s survival. Alternatively, projects may be selected because they are deemed to require few resources and have little risk. Projects may also be selected due to the power or persuasiveness of the manager proposing the system. This means that project selection may be influenced by factors beyond those discussed here and b^ond items that can be analyzed. Understanding the reality that projects may be selected based on factors beyond analysis, the role of a systems analyst is to provide a thorough examination of the items that be assessed. The analysis will ensure that a project review committee has as much information as possible when making project approval decisions.
can
70 Self-Instructional Material
, ?'easi5i/tt> Study4.3 FEASIBILITY REPORTIt is the final report of feasibility study about the findings and conclusions of the study. It should be possible to review the report and take a decision on the project based on it.For the convenience of the reader the report usually includes an executive summary, which gives the salient points and the conclusions of the report.The report has to contain the clear scope of the system. It should give the description of both the existing system and the proposed system. The alternatives considered and how they were evaluated should also be given.The report may also contain details on the methods used for the study and the persons contacted, correspondence, and other- similar things.The report contains the following ;
• Title page with the name of the project and the customer.* Version information-version number, name of author, approver, reviewer,
NOTES
etc.• Table of contents.• Scope and system boundaries.
' • Background of the system.• Problem statement along with
♦ Current system description' ♦ Proposed system description
♦ Description of how the proposed system will solve the problem
• Executive summary.• Cost/benefit statement—detailed cost benefit quantification and workings.
Alternative systems considered and evaluated are given here along with the basic for evaluation and the conclusion.
• Implementation schedule for implementing the proposed system include resource requirements and overall project plan and schedule.
• Hardware configuration.• Appendices with details to supplement the report.
Self-instructional Material 71

System. Analysis and Design
STUDENT ACTIVITY 4.1
1. List and discuss different types of project feasibility factors. Which factor is most important ? Why?
2. Write a short note on feasibility report.
72 Self-Instructional Material
Featibility StudySUMMARY
All projects are feasible given unlimited resources and infinite time.Economic feasibility is a process of identifying the financial benefits and costs associated with a development project.Tan^ble benefit is a benefit derived from the creation of an information system that can be measured in'rupees and with certainty.Intangible benefit is a benefit derived from the creation of an information system that cannot be easily measured -in rupees or with certainty.Tangible coat is a cost associated with an information system that can be measured in rupees and with certainty.
Intangible cost is a cost associated with an information system that cannot be measured in terms of rupees or with certainty.
One-time cost is a cost associated with project start-up and development or system start-up.
Recurring coat is a cost resulting from the ongoing evolution and use of a system.Discount rate is the rate of return used to compute the present value of future cash flow,Present value is the current value of a future.cash flow.
Technical feasibility is a process of assessing the development organization's ability to construct a proposed system.
Operational feasibility is the process of assessing the degree to which a proposed system solves business problems or takes advantage of business opportunities.
Schedule feasibility is the process of assessing the degree to which the potential time frame and completion dates for all major activities within a project meet organizational deadlines and constraints for aiTecting change.
Legal and contractual feasibility is the process of assessing potential legal and contractual ramifications due to the construction of a system.
Political feasibility is the process of evaluating how key stake-holders within the organization view the proposed system.
NOTES
TEST YOURSELFAnswer the following questions :
1. “Many feasibility studies produce disillusions to users and analysts.” Do you agree ? Why ? Explain.
2. How important is a project team in feasibility analysis ? Is it mandatory in every study ? What are the expectations ?
3. Contrast the following terms ;Economic feasibility legal feasibility, operational feasibility, political feasibility, schedule feasibility
4. What are the common methods for performing economic cost-benefit analysis? What are the inputs and outcomes of each method ? .
Self-instructional Maierioi 73
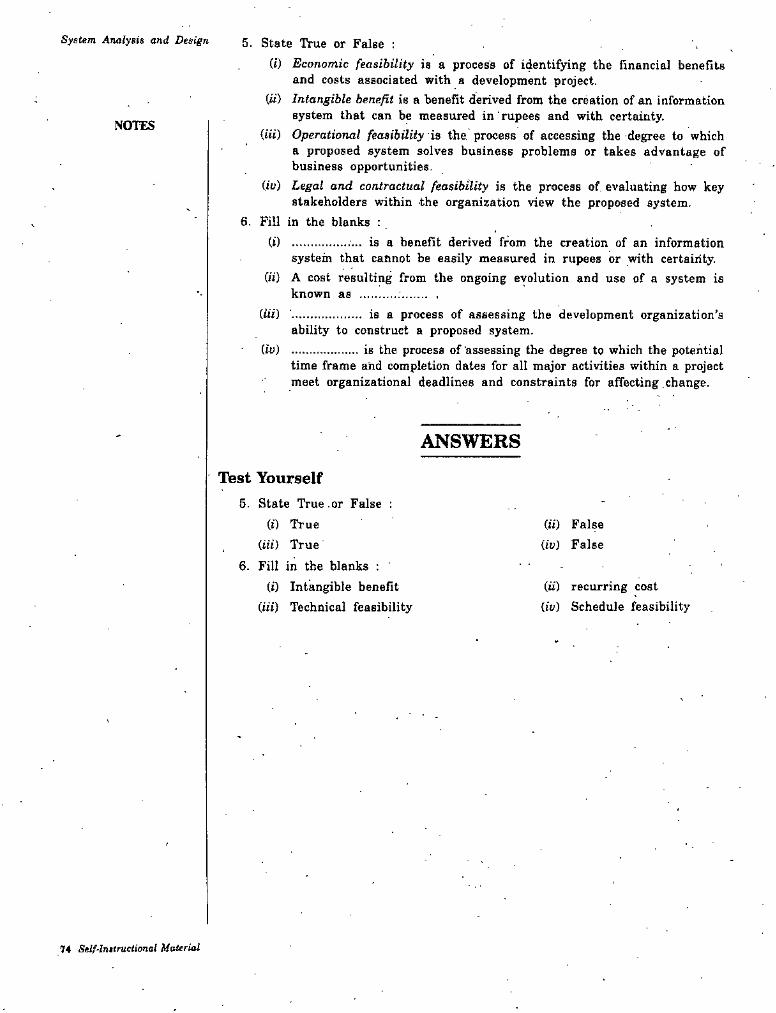
System Analysis and Design 5. State True or False ;(i) Economic feasibility is a process of identifying the financial benefits
and costs associated with a development project.(h) Intangible benefit is a benefit derived from the creation of an information
system that can be measured in rupees and with certainty.[Hi) Operational feasibility is the. process of accessing the degree to which
a proposed system solves business problems or takes advantage of business opportunities.
[iv) Legal and contractual feasibility is the process of, evaluating how key stakeholders within the organization view the proposed system.
6. Fill in the blanks :
NOTES
.... is a benefit derived from the creation of an information system that cannot be easily measured in rupees or with certainty.
(h) a cost resulting from the ongoing evolution and use of a system is known as .......... ............
(i)
m ■.................... is a process of assessing the development organization’sability to construct a proposed system.................... is the process of assessing the degree to which the potentialtime frame and completion dates for all major activities within a project meet organizational deadlines and constraints for affecting change.
(jt>)
ANSWERSTest Yourself
5. State True.or False ;(j) True
(Hi) True6. Fill in the blanks :
(t) Intangible benefit (Hi) Technical feasibility
(«) False (iv) False
(ii) recurring cost (iv) Schedule feasibility
74 Self-Instructional Material
SECTION C
5. Requirement Determination and Specification6. Process Modeling7. Logic Modeling8. Designing Form and Reports9. Designing Interfaces and Dialogues
10. Designing Databases
Requirement Determination and SpecificationCHAPTER
NOTES
REQUIREMENT DETERMINATION
AND SPECIFICATION
LEARNING OBJECTIVES5.1 Introduction
5.2 Performing Requirements Determination
5.2.1 The Process of Determining Requirements
5.2.2 Deliverables and Outcomes
5.3 Traditional Methods for Determining Requirements
5.3.1 Interviewing and Listening5.3.2 Choosing Interview Questions5.3.3 Interview Guidelines
/5.3.4 Interview GroupsS^S.S Nominal Group Technique
5.3.6 Directly Observing Users
5.3.7 Analyzing Procedures and other Documents
5.4 Contemporary Methods for Determining System Requirements
5.4.1 Joint Application Design
5.4.2 Participating in a JAD5.4.3 CASE Toots During JAD5.4.4 Supporting JAD with Group Support Systems5.4.5 Using Prototyping During Requirements Determination
5.5 Radical Methods for Determining System Requirements
5.5.1 Identifying Processes to Reengineer5.5.2 Disruptive Technologies
./
6.1 INTRODUCTIONSystem analysis is the part of the systems development life cycle in which an
. analyst determines how the current information system functions and access what users would like to see in a new system. Analysis has two sub phases:requirements determination and requirements stiHicturing.In this unit, you will learn about determining system requirements and specification. Techniques used in requirements determination have evolved over time to become
Self-Instructional Material 77
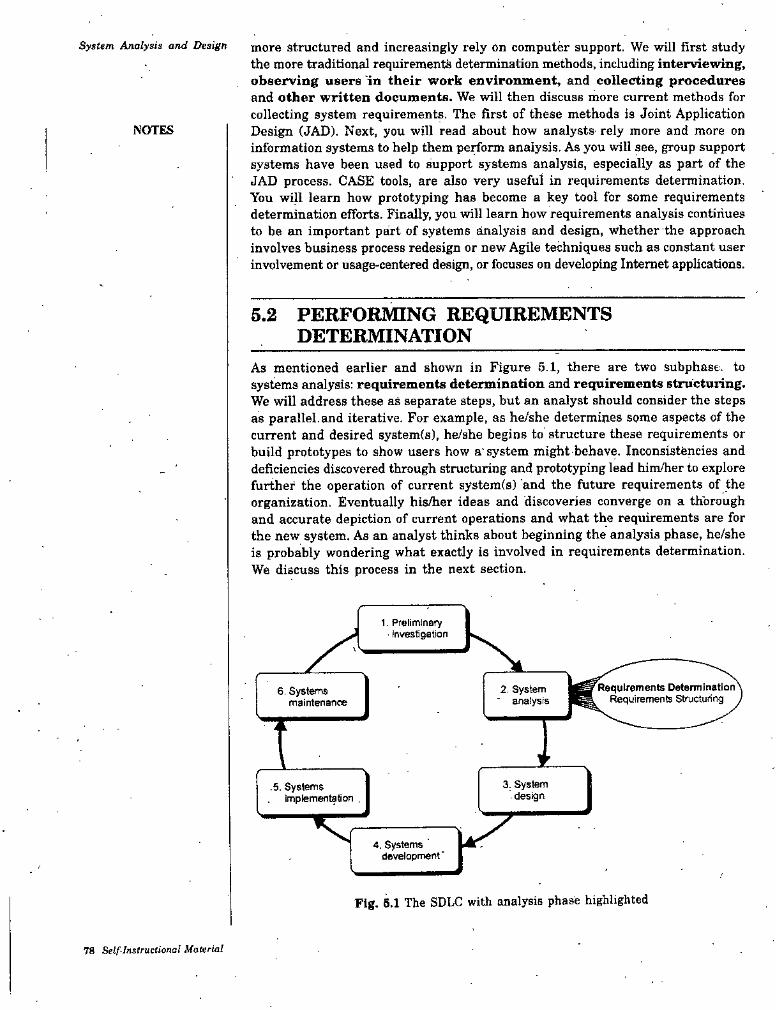
System Analysis and Design more structured and increasingly rely on computer support. We will first study the more traditional requirements determination methods, including interviewing, observing users in their work environment, and collecting procedures and other written documents. We will then discuss more current methods for collecting system requirements. The first of these methods is Joint Application Design (JAD). Next, you will read about how analysts rely more and more on information systems to help them perform analysis. As you will see, group support systems have been used to support systems analysis, especially as part of the JAD process. CASE tools, are also very useful in requirements determination. You wiU learn how prototyping has become a key tool for some requirements determination efforts. Finally, you will learn how requirements analysis contdriues to be an important part of systems analysis and design, whether the approach involves business process redesign or new Agile techniques such as constant user involvement or usage-centered design, or focuses on developing Internet applications.
NOTES
5.2 PERFORMING REQUIREMENTS DETERMINATION
As mentioned earlier and shown in Figure 5.1, there are two subphase. to systems analysis: requirements determination and requirements structuring. We will address these as separate steps, but an analyst should consider the steps as parallel.and iterative. For example, as he/she determines some aspects of the current and desired system(s), he/she begins to structure these requirements or build prototypes to show users how a'system might behave. Inconsistencies and deficiencies discovered through structuring and prototyping lead him/her to explore further the operation of current system(s) and the future requirements of the organization. Eventually his/her ideas and discoveries converge on a thorough and accurate depiction of current operations and what the requirements are for the new system. As an analyst thinks about beginning the analysis phase, he/she is probably wondering what exactly is involved in requirements determination. We discuss this process in the next section.
1. Preliminary invesfisation
Requirements Determination Requirements Structuring
2. System analysis
6. Systems maintenance
I3. System
design.5. Systems
implementation ,
4. Systems development'
Fig. 5.1 The SDLC with analysis phase highlighted
78 Self-Instructional Material
Requirement Determination and Specification5J2.1 The Process of Determining Requirements
Once management has granted permission to start development of a new system (this was done at the end of the project identification and selection phase of the SDLC) and a project is initiated and planned an analyst begins determining what the new system shoulddo. During requirements determination, he/she and other analysts gather information on what the system should do from as many sources as possible: from users of. the current system; hrom observing users; and from reports, forms and procedures. All of the system requirements are carefully documented and made ready for structuring.In many ways, gathering system requirements resembles conducting any investigation. Have you read any of the Sherlock Holmes or similar mystery stories? Do you like solving puzzles? From these experiences, we can detect some similar characteristics for a good systems analyst during the requirements determination subphase. These characteristics are given below:
• Impertinence. An analyst should question everything. He/she needs to ask such questions as:Are all transactions processed the sume way?Could anyone be charged something other than the standard price?Might we someday want to allow and encourage employees to work for more than one department?
• Impartiality. An analyst’s role is to find the best solution to a business problem or opportunity. It is not, for example, to find a way to justify the purchase of new hardware or to insist on incorporating what users think they want into the new system requirements. He/she must consider issue’s raised by all parties and try to find the best organizational solution.
• Relax constraints. Assume that anything is possible and eliminate the infeasible. For example, do hot accept this statement: “We have always done it that way, so we have to continue the practice." Traditions are different from rules and policies. Traditions probably started for a good reason but, as the organization and its environment change, they may turn into habits rather than sensible procedures.
• - Attention to details. Every fact most fit with every other fact. One elementout of place means that even the best system will fail at some stage. For example, an imprecise definition of who a customer is may mean that an analyst purges customer data when a customer has no active orders, yet these past customers may be vital contacts for fixture sales.
[VOTES
• Refraining. Analysis is, in part, a creative process. An analyst must challenge himself/herself to look at the organization in new ways. He/she must consider how each user views his or her requirements. An analyst
on amust be careful not to jump to the following conclusion: “I worked system like that once—this new system must work the same way as the one I built earlier.
5.2.2 Deliverables and Outcomes. The primary deliverables from requirements determination are the various forms
of information gathered during the determination process: transcripts of interviews;
■ Self-lnsOnictionat Material 7B
System Analysis and Design notes from observation and analysis of documents; sets of forms, reports, job ' descriptions, and other documents; and computer-generated output such as system ' prototypes. In short, anything that the analysis team collects as part of determining system requirements is included in the deliverables resulting from this subphase of the systems development life cycle. Examples of some specific information that might be gathered during requirements determination are given below ;
Information collected ^oih conversations with or observations of users. It includes interview transcripts, notes from observation, meeting minutes.
NOTES
1.
Existing written information. It includes business mission and strategy statements, sample business forms and reports and computer displays, procedure manuals, job descriptions, training manuals, flowcharts and documentation of existing systems, consultant reports.Computer-based information. It includes results from Joint Application Design sessions, transcripts or files from group support system sessions, CASE repository contents and reports of existing systems, and displays and reports from system prototypes.
These deliverables contain the information an analyst needs for systems analysis within the scope of the system he/sh'e is developing. In addition, he/she nee Is to understand the following components of an organization :
• The business objectives that drive what and' how work is done• The information people require to do their jobs• The data (definition, volume, size, etc.) handled within the organization to
support the jobs• %Tien, how, and by whom or what the data are moved, transformed, and
stored• The sequence and other dependencies among different data-handling activities• The rules governing how data are handled and processed• Policies and guidelines that describe the nature of the business and the
market and environment in which it operates• Key events affecting data values and when these events occur.
As should be obvious, such a large amount of information must be organized in order to be useful, This is the purpose of the next subphase—requirements structuring.
2.
3,
From just this subphase of analysis, you have probably already realized that the amount of information to be gathered could be huge, especially if the scope of the system under development is broad. The time required to collect and structure a great deal of information can be extensive and, because it involves so much human effort, quite expensive. Tbo much analysis is not productive, and the term analysis paralysis has been coined to describe a systems development project that has become bogged down in an abundance of analysis work. Because of the dangers of excessive analysis, today’s systems analysts focus more on the system to be developed than on the current system. The techniques JAD and prototyping,
developed to keep the analysis effort at a minimum yet still effective. Newerweretechniques have also been developed to keep requirements determination fast and flexible, including continual user involvement, usage centered design, and the Planning Game from eXtreme Programming, Traditional fact gathering techniques are discussed next.
80 Seif-Instructional Material
Requirement Determination and Specification5.3 TRADITIONAL METHODS FOR
DETERMINING REQUIREMENTSAt the core of systems analysis is the collection of information. At the outset, an analyst must collect information about the information systems that are currently being used and how users would like to improve the current systems and oi^anizational operations with new or replacement information systems. One of the best ways to get this information is to talk to the people who are directly or indirectly involved in the different parts of the organizations affected by the possible system changes: users, managers, funders, etc. Another way to find out about the current system is to gather copies of documentation relevant to current systems and business processes. In this unit, we will discuss about various ways to get information directly from stakeholders: interviews, group interviews, the Nominal Group Technique, and direct observation. We will d^cuss about collecting documentation on the current system and organizational operation in the form of written procedures, forms, reports and other hard copy. These traditional methods of collecting system requirements are given below:
• Individually interview people informed about the operation and issues of the current system and future systems requirements.
• Interview groups of people with diverse needs to find synergies and contrasts among system needs.
• Observe workers at selected times to see how data are handled and what information people require to do their jobs
• Study business documents to discover reported issues, policies, rules, and directions as well as concrete examples of the use of data and information in the organization.
NOTES
5.3.1 Interviewing and ListeningInterviewing is one of the primary ways analysts gather information about an
’ information systems project. Early in a project, an analyst may spend a large amount of time interviewing people about their work, the information they use to do it, and the types of information processing that might supplement their work. Other stakeholders are intetwiewed to understand organizational direction, policies, expectations managers have on the units they supervise, and other nonroutine aspects of organizational operations.During interviewing an analyst will gather facts, opinions, and speculation and observe body language emotions and other signs of what people want and how they assess current systems.There are many ways to effectively interview someone, and no one method is necessarily better than another. Some guidelines an analyst should keep in mind when he/she interviews are given below :Plan the Interview
• Prepare interviewee : appointment, priming questions• Prepare checklist, agenda, and questions
Listen carefully and take notes {tape-record if permitted)Review notes within 48 hours of interviewBe neutralSeek diverse views
Self-Instructional Material 81
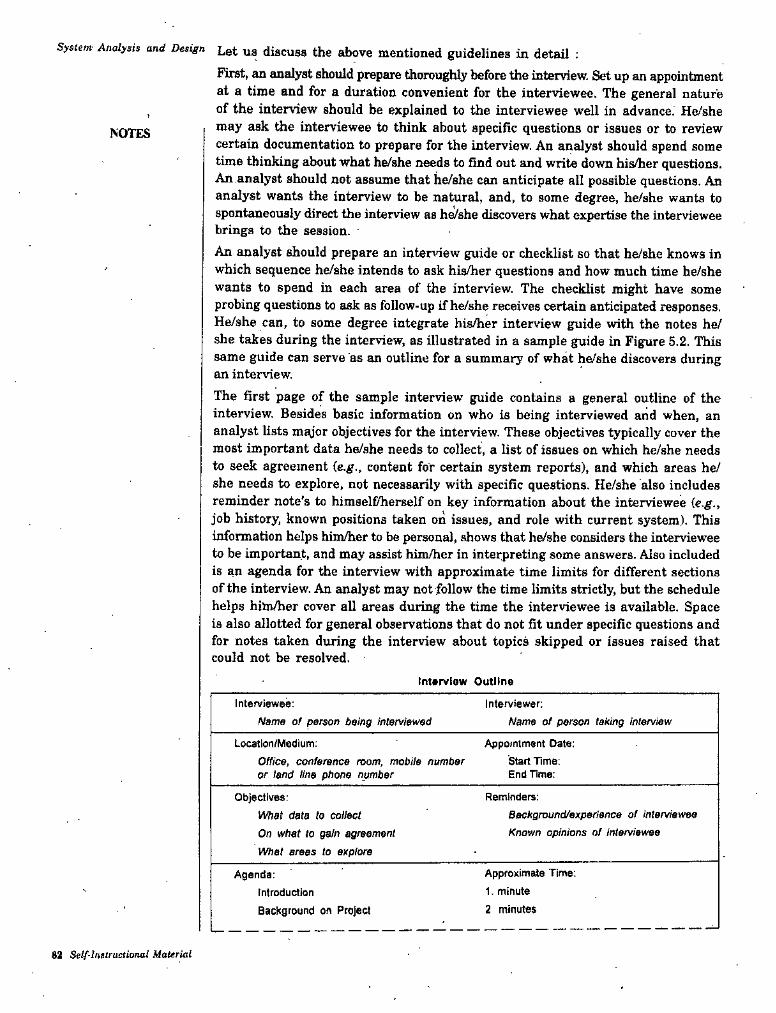
System Analysts and Design Let U8 discuss the jd)ove mentioned guidelines in detail ;First, an analyst should prepare thoroughly before the interview. Set up an appointment at a time and for a duration convenient for the interviewee. The general nature of the interview should be explained to the interviewee well in advance. He/she may ask the interviewee to think about specific questions or issues or to review certain documentation to prepare for the interview. An analyst should spend some time thinking about what he/she needs to find out and write down his/her questions. An analyst should not assume that he/she can anticipate all possible questions. An analyst wants the interview to be natural, and, to some degree, he/she wants to spontaneously direct the interview as he^she discovers what expertise the interviewee brings to the session.An analyst should prepare an interview guide or checklist so that he/she knows in which sequence he/ahe intends to ask his/her questions and how much time he/she wants to spend in each area of the interview. The checklist might have some probing questions to ask as follow-up if he/she receives certain anticipated responses. He/she can, to some degree integrate his/her interview guide with the notes he/ she takes during the interview, as illustrated in a sample guide in Figure 5.2. This same guide can serve as an outline for a summary of what he/she discovers during an interview.The first page of the sample interview guide contains a general outline of the interview. Besides basic information on who is being interviewed and when, an analyst lists m^'or objectives for the interview. These objectives typically cover the most important data he/ahe needs to collect, a list of issues on which he/she needs to seek agreement (e.g., content for certain system reports), and which areas he/ she needs to explore, not necessarily with specific questions. He/she also includes reminder note’s to himself/herself on key information about the interviewee (e.g., job history, known positions taken on issues, and role with current system). This information helps him/her to be personal, shows that he/she considers the interviewee to be important, and may assist him/her in interpreting some answers. Also included is an agenda for the interview with approximate time limits for different sections of the interview. An analyst may not follow the time limits strictly, but the schedule helps him/her cover all areas during the time the interviewee is available. Space is also allotted for general observations that do not fit under specific questions and for notes taken during the interview about topics skipped or issues raised that could not be resolved.
NOTES
Interview OutlineInterviewee:
Name of person being interviewed
Interviewer;Name of person taking interview
Locatlon/MeCium:Office, conference room, mobile number or land line phone number
Appointment Date: Start Time: End Time:
Objectives:Wtat data to collect On what to gain agreement What areas to explore
Reminders:Background/experiance of interviewee Known opinions of interviewee
Approximate Time; 1. minute 2 minutes
Agenda;introductionBa^ground on Proje^
82 Self-Instructional Material
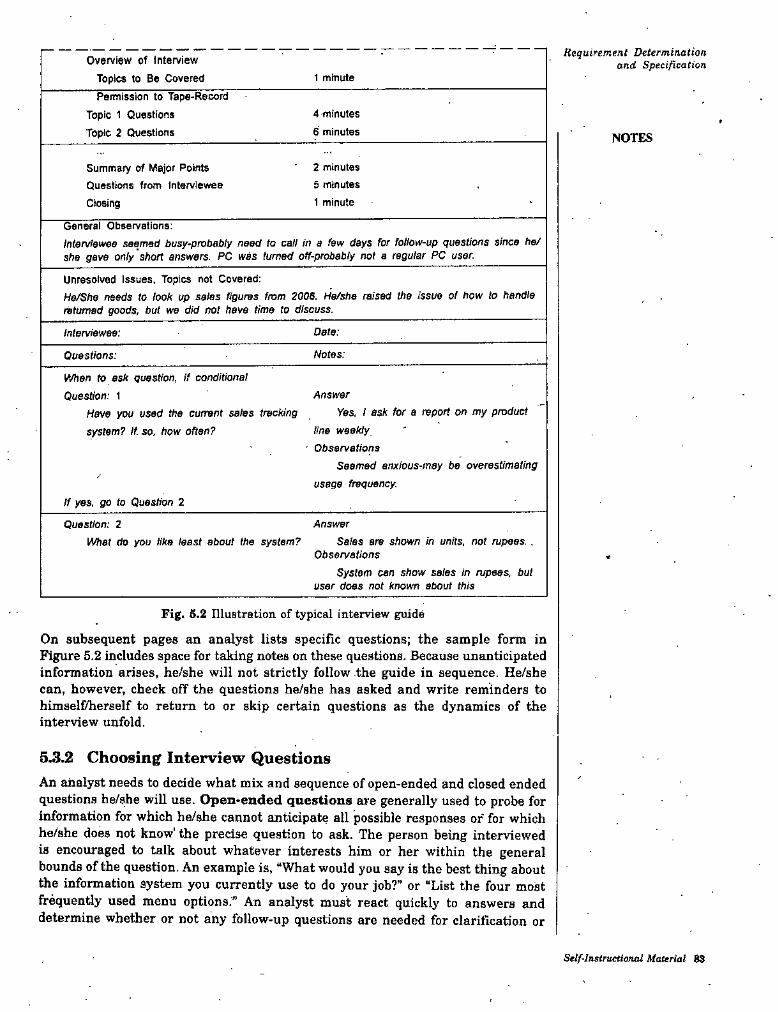
Requirement Determination and SpecificationOverview of Interview
Topics to Be Covered 1 minute
Permission to Tape-Record Topic 1 Questions Topic 2 Questions
4-minutes 6 minutes NOTES
2 minutes 5 minutes 1 minute
Summary of Major Points Questions from Interviewee Closing
General Observations:/nterv/ewee seerrred bosy-probeUy need to call in a few days for follow-up questions since he/ she gave only short answers. PC was turned off-probably not a regular PC user.
Unresolved Issues, Topics not Covered:He/She needs to look up sales figures from 200$. Ha/she ra/sod the issue of how to handle returned goods, but we did not have time to discuss.
Date:Interviewee:
Notes:Questions:
When to ask question, if conditional Question: 1
Have you used the current sales tracking system? If. so, how often?
Answer
Yes, I ask for a report on my product line weekly,
■ Observations
Seemed anxious-may be overest/maf/nfif usage frequency.
If yes. go to Question 2
AnswerQuestion: 2Whet do you Ilka least about the system? Sales are shown in units, not rupees..
ObservationsSystem can show sales In rupees, but
user does not known about this
Fig. 6.2 Illustration of typical interview guide
On subsequent pages an analyst lists specific questions; the sample form in Figure 5.2 includes space for taking notes on these questions. Because unanticipated information arises, he/she will not strictly follow the guide in sequence. He/she can, however, check off the questions he/she has asked and write reminders to himself/herself to return to or skip certain questions as the dynamics of the interview unfold.
5.3.2 Choosing Interview QuestionsAn analyst needs to decide what mix and sequence of open-ended and closed ended questions he/she will use. Open.eaded questions are generally used to probe for information for which he/she cannot anticipate all possible responses of for which he/she does not know' the precise question to ask. The person being interviewed is encouraged to talk about whatever interests him or her within the general bounds of the question. An example is, “What would you say is the best thing about the information system you currently use to do your job?” or “List the four most frequently used menu options.” An analyst must react quickly to answers and determine whether or not any follow-up questions are needed for clarification or
Self-Instructional Material 63
System Analysis and Design elaboration. Sometimes body language will suggest that a user has given an incompleteanswer or is reluctant to divulge some information; a follow-up question might provide additional insight. One advantage of open-ended questions in an interview is.that previously unknown information can surface. An analyst can then continue exploring along unexpected lines of inquiry to reveal even more new information. Open-ended questions also often put the interviewees at ease because they are able to respond in their own words using their own structure; open-ended questions- give interviewees more of a sense of involvement and control in the interview. A major disadvantage of open-ended questions is the length of time it can take for the questions to be answered. In addition, open-ended questions can be difficult to summarize.Closed-ended questions have a range of answers from which the interviewee may choose. For example:Which of the following would you say is the one best thing about the information system you currently use to do your job (select only one):
(o) Having easy access to all of the data you require (6) The system’s response time(c) The ability to access the system from remote locations
Closed-ended questions work well when the major answers to questions are well known. Another plus is' that interviews based on closed-ended' questions do not necessarily require a large time commitment—more topics can be covered. An •analyst can see body language and hear voice tone, which can aid in interpreting the interviewee’s responses. Closed-ended questions can also be an easy way to begin an interview and to determine which line of open-ended questions to pursue. An analyst can include an “other”'option to encourage the interviewee to add unanticipated responses. A major disadvantage of closed-ended questions is that useful information that does not quite fit into the defined answers may be overlooked as the respondent tries to make a choice instead of providing his or her best answer.Closed-ended questions, like objective questions on an examination, can follow several forms, including the choices given below :
• True or false.• Multiple choice (with only one response or selecting all relevant choices).• Rating a response or idea on some scale, say from bad to good or strongly
agree to strongly disagree. Each point on the scale should have' a clear and consistent meaning to each person, and there is usually a neutral point in the middle of the scale.
• Ranking items in their order of importance.
NOTES
5.3.3 Interview GuidelinesThe major guidelines for taking .an interview are given below :
1. .With either open or closed-ended questions, do not phrase a question in a way that implies a right or wrong answer. The respondent must feel that he or she can state his or her true opinion and perspective and that his or her idea will be considered equally with those of others. Questions such as “Should the system continue to provide the ability to override the default value, even though most users now do not like the feature?” should be avoided because such wording predefines a socially acceptable answer.
S4 Self-Instructional Material
2. One of the important things to remember about interviews is to listen very Requirement Determinationand Specificationcarefully to what is being said. Take careful notes or, if possible, record the interview on a tape recorder (be sure to take permission first!). The answers may have extremely important information for the project. Also, this may be the only chance an analyst has to get information from this particular person. If an analyst runs out of time and still needs to get information from the person he/she is talking to, ask to schedule a follow-up interview.
NOTES
3. Once the interview is over, an analyst should go back to his/her office and type up his/her notes within 48 hours. If he/she recorded the interview, use the recording to verify the material in his/her notes. After 48 hours, the analyst’s memory of the interview will fade quickly. As he/she types and organize his/her notes, he/she should write down any additional questions that might arise from lapses in his/her notes or from ambiguous information. Separate facts from his/her opinions and interpretations. Prepare a list of unclear points that need clarification. Call the person he/she interviewed and get answers to these new questions. Use the phone call as an opportunity to verify the accuracy of his/her notes. He/she may also want to send a written copy of his/her notes to the person he/she interviewed so the person can check the analysts notes for accuracy. Finally, the analyst must make sure he/she thanks the person for his or her time spent. An analyst may need to talk to his/her respondent again. If the interviewee will be a user of his/her system or is involved in some other way in the system's success, he/she wants to leave a good impression.,
4. The analyst should be careful during the interview not to set expectations about the new or replacement system unless he/she is that sure these features will be part of the delivered system. Let the interviewee know that there are many steps to the project and the perspectives of many people need to be considered, along with what is technically possible. Let respondents know that their ideas will be carefully considered, but that due to the iterative nature of the systems development process, it is premature to say now exactly what the ultimate system will or will not do.
5. Seek a variety of perspectives from the interviews. Find out what potential users of the system, users of other systems that might be affected by changes, manners and superiors, information systems staff who have experience with the current system, and otiiers think the current problems dnd opportunities are and what new information services might better serve the organization. An analysts wants to understand all possible perspectives so that in a later approval step he/she will have information on which to base a recommendation or design decision that all stakeholders can accept.
5.3.4 Interviewing GroupsOne drawback to using interviews to collect systems requirements is the need for the analyst to reconcile apparent contradictions in the information collected. A series of interviews may turn up inconsistent information about the current system or its replacement. An analyst must work through all of these inconsistencies to figure out what the most accurate representation of current and future systems might be. Such a process requires several follow-up phone calls and additional interviews. Catchii^ important people in their offices is often difficult and frustrating, and scheduling new interviews may become very time-consuming. In addition, new interviews may reveal new questions that in turn require additional interviews with those interviewed earlier.-Clearly, gathering information about an information
Self-Instructional Material 86
S>sfem Analy$i$ and Design system Uirough a series of individual interviews and follow-up calls is notefficient process.One more option available to an analyst is the group interview. In a group interview, he/she interviews several key people at once. To make sure all of the important information is collected, he/she may conduct the interview with analysts. In the case of multiple interviewers, one analyst may ask que.stions while another takes notes,' or different analysts might concentrate on different kinds of information. For example, one analyst may listen for data requirements while another notes the timing and triggering of key events. The number of interviewees involved in the process may range from two to however many you think can be comfortably accommodated.A group interview has a few advantages.These are given below:
1. It is a much more effective use of an analyst’s time than a series of interviews with individuals (although the time commitment of the interviewees may be more of a concern).
2. Interviewing several people together allows them to hear the opinions of other key people and gives them the opportunity to agree or disagree with their peers.
Synergies also often occur. For example, the comments of one person might cause another person to say, “That reminds me of” Or “I didn’t know that was a problem.” An analysts can benefit from such a discussion as it helps him/her identify issues on which there is general agreement and areas where views diverge widely.The primal^ disadvantage of a group interview is the difficulty in scheduling it. The more people who are involved, the more difficult it will be finding a convenient time and place for everyone. Modem technology ; such as videoconferences and videophones can minimize the geographical dispersion factors that make scheduling meetings so difficult. Group interviews are at the core of the Joint Application Design process, which will be discussed later on in this unit. A specific technique for working with groups. Nominal Group Ibcbnique, is discussed next.
an
one or moreNOTES
5.3.5 Nominal Group TechniqueVarious techniques have been developed over the years to improve the process of working with groups. One of the more popular techniques for generating ideas among group members is called Nominal Group Technique (NGT). NGT is exactly what'.the name indicates—the individuals working together to solve a problem are a group in name only, or nominally. Group members may be gathered in the same room for NGT, but they all work alone for a period of time. 'Typically, group members make a written list of their ideas. At the end of the idea generation time, group members pool their individual ideas under the guidance of a trained facilitator. Pooling usually involves having the facilitator ask each person in turn for an idea that has not been presented before. As the person reads the idea aloud, someone else writes down the idea on a blackboard or flip chart. After all of the ideas have been introduced, the facilitator will then ask for the group to openly discuss each idea, primarily for clariflcation.Once all of the ideas are understood by all of the participants in the group, the facilitator will try to reduce the number of ideas the group will carry forw’ard for additional consideration. There are many ways to reduce the number of ideas. The facilitator may ask participants to choose only a subset of ideas that they believe are important. Then the facilitator will go around the room, asking each person
66 Self-Inttruetional Materiai
Requirement Determination and Specifitation
to read aloud an idea that is important to him or her that has not yet been identified by someone else. Or the facilitator may work with the group to identify and either eliminate or combine ideas that are very similar to others. At some point, the facilitator and the group end up with a tractable set of ideas, which can be further prioritized.In a requirements determination context, the ideas being sought in an NGT exercise would typically apply to problems with the existing system or ideas for new features in the system being developed. The end result would be a list of either problems or features that group members themselves had generated and prioritized. There should be a high level'of ownership of such a list, at least for the group that took part in the NGT exercise.There is some evidence to support the use of NGT to help focus and refine the work of a group in that the number and quality of ideas that result from an NGT may be higher than what would normally be obtained from an unfacilitated group meeting. An NGT exercise could be used to complement the work done in a typical group interview or as part of a Joint Application Design effort, described in more detail later on in this unit.
NOTES
6.3.6 Directly Observing UsersAll the methods of collecting information that we have discussed so far involve getting people to recall and convey information they have about an organizational area and the information systems that support these processes. People, however, are not always very reliable informants, even when they try to be reliable and tell what they think is the truth. As odd as it may sound, people often do not have a completely accurate appreciation of what they do or how they do it. This is especially true concerning infrequent events, issues from the past, or issues for which people have considerable passion." Because people cannot always be trusted to reliably interpret and report their own actions, an analyst can supplement and corroborate what people tell him/her by watching what they do or by obtaining relatively objective measures of how people behave in work situations.For example, one possible view of how a hypothetical manager does her job is that a manager carefully plans her activities, works long and consistently on solving problems, and controls the pace of her work. A manager might tell an analyst that is how she spends her day. When Mintzberg observed how managers work, however, he found that a manager’s day is actually punctuated by many, many interruptions. Managers work in a fragmented manner, focusing on a problem or on a communication for only a short time before they are interrupted by phone calls or visits from their subordinates and other managers. An information system designed to fit the work environment described by our hypothetical manager would not effectively support the actujil work environment in which that manager finds herself.As another example, consider the difference between what another employee might tell the analyst about how much he/she uses e-mail and how much e-maO use the analyst might discover through more objective means. An employee might tell the analyst he/she is swamped wdth e-mail messages and that he/she spends a significant proportion of his/her time responding to e-mail messages. However, if the analyst was able to check electronic mail records, he/she might find that this employee receives only four e-mail messages per day' on average, the employee that the most messages the employee has ever received during one 8-hour period is ten. In this case, the analyst was were able to obtain an accurate behavioral of how much e-mail this employee copes with without having to watch the employee read his/her e-mail.
measure
Self'lnslructionai Material 87
System Analysis ani Design The intent behind obtaining system records and direct observation is the same,however, and that is to obtain more firsthand and objective measures of employee interaction with information systems. In some cases, behavioral measures will be a more accurate reflection of reality than what employees themselves believe. In other cases, the behavioral information will substantiate what employees have told the analyst directly. Although observation and obtaining objective measures are desirable ways to collect pertinent information, such methods are’ not always possible in real organizational settings. Thus, these methods are not totally unbiased, just as no other one data-gathering method is unbiased.
NOTES
For example, observation can cause people to change their normal operating behavior. Employees who know they are being observed may be nervous and make more mistakes than normal, may be careful to follow exact procedures they do not typically follow, and may work faster or slower than normal. Moreover, because observation typically cannot be continuous, an analyst receives only a snapshot
' image of the person or task he/she observes, which may not include important events or activities. Because observation is very time consuming, the analyst will not only observe for a limited time, but also a limited number of people and a limited'number of sites. Again, observation 3deld8 only a small segment of data from a possibly vast variety of data sources. Exactly which people or sites to observe is a difficult selection problem. An analyst want to pick both typical and atypical people and sites, and observes during normal and abnormal conditions and times to receive the richest possible data from observation.
5^.7 Analyzing Procedures and Other DocumentsAs mentioned earlier, asking questions of the people who use a system every day /- or who have an interest in a system is an effective way to gather information about current and future systems (systems to be developed). Observing current system users is a more direct way of seeing how an existing system operates, but even this method provides limited exposure to all aspects of current operations. These methods of determining system requirements can be enhanced by examining system and organizational documentation to discover more details about current systems and the organization these systems support.'Although we discuss here several important types of documents that are useful in understanding possible future system requirements, our discussion does not exhaust all possibilities. An analyst should attempt to find all written documents about the organizational areas relevant to the systems under redesign. Besides the few specific documents we discuss, organizational mission statements, business plans, organization charts, business policy manuals, job descriptions, internal and external correspondence, and reports from prior organizational studies can all provide valuable insight.What can the analysis of documents tell an analyst about the requirements for a new system? In documents he/she can find information about the following :
• Problems with existing systems (e.g., missing information or redundant steps)
• Opportunities to meet new needs if only certain information or information processing were available (.e.g., analysis of sales based on customer type.)
• Organizational direction that can affect information system requirements (e.g., trying to link customers and suppliers more closely to the organization).
• Titles and names of key persons who have an interest in relevant existing systems (e.g., the name of a sales manager who led a study of buying behavior of key customers)
S8 Self-lnstructianal Material
Values of the organization or persons «'ho can help deterraiDC priorities for Heguirement Determinationana Specificationdifferent capabilities desired by different users (e.g., maintaining market
share even if it means lower short-term profits)• Special information processing circumstances that occur irregularly that
may not be identified by any other requirements determination technique (e.g., special handling needed for a few very large-volume customers and which requires use of customized customer ordering procedures)
• The reason why current systems are designed as they are, which can suggest features left out of current software, which may now be feasible and more desirable (e.g., data about a customer’s purchase of competitors products were not available when the current system was designed; these data are now available from many sources)
• Data, rules for processing data, and principles by which the organization - operates that must be enforced by the information system (e.g., each customer
is assigned exactly one sales department staff member as a primary contact if the customer has any questions).
One type of useful document is a written work procedure for an individual or a work group. The procedure describes how a particularjob or task is performed, including data and information that are used and created in the process of performing the job. For example, the procedure shown in Figure 5.3 includes the data (list of features and advantages, drawings, inventor name, and witness names) that are required to prepare an invention disclosure. It also indicates that besides the inventor, the vice president for research and. department head an. dean must review the material, and that a witness is required for any filing of an invention disclosure. These insights clearly affect what data must be kept, to whom information must be sent, and the rules that govern valid forms.Procedures are not trouble-free, sources of information, however. Sometimes an analyst’s analysis of several written procedures will reveal a duplication of effort in two or more jobs. He/she should cal! such duplication to the attention of management as an issue to be resolved before system design can proceed. That is, it may be necessary to redesign the organization before the redesign of an information system can achieve its full benefits. Another problem he/she may find with a procedure occurs when the procedure is missing. Again, it is not an analyst's job to create a document for a missing procedure—that is up to management. A third and common problem with a written procedure happens when the procedure is out of date. An analyst may realize the procedure is out of date when he/she interviews the person responsible for performing the task described in the procedure. Once again, the decision to rewrite the procedure so that it matches reality is made by management, but he/she may make suggestions based upon his/her understanding of the organization. A fourth problem often encountered with written procedures
. is. that the formal procedures may contradict information he/she collected from interviews and observation about how the organization operates and what information is required- As in the other cases, resolution rests with management.
NOTES
GUIDE FOR PREPARATION OF INVENTION DISCLOSURE (See Faculty and Staff Manuals for detailed Patent Policy and routing procedures.)
1 DISCLOSE ONLY ONE INVENTION PER FORM.2- PREPARE COMPLETE DISCLOSUf^.
The disclosure of your invention is adequate for patent purposes ONLY if it helps a person skilled In the art to understand the Invention.
3. - CONSIDER THE FOLLOWING IN PREPARING ACOMPLETE DISCLOSURE:
Self-Instructional Material 89
System Analysis and Design(a) All essentlat elements of the invention, their relationship to one another, and their
mode of operation.
(fj) Equivalents that can be substituted for any elements.(c) List of features believed to be new.
(d) Advantages this invention has over the earlier art.(e) Whether the invention has been built and/or tested.
4. PROVIDE APPROPRIATE AODiTiONAL MATERIAL. . .Drawings and descriptive material should be provided as required to clarify the disclosure. Each page of this material must be signed and dated by each inventor and property witnessed. A copy of any current and/or planned publication relating to the invention should be included.
5. INDICATE PRIOR KNOWLEDGE AND INFORMATIONPertinent publications, patents or previous devices, and related research or engirteering activities should be Identified.
6. HAVE DISCLOSURE WITNESSED.Persons other than coInventors should serve as witnesses and should sign each sheet of the disclosure only after reading and understanding the disclosure.
7. FORWARD ORIGINAL PLUS ONE COPY (two copies if supported by grant/contract) TO VICE PRESIDENT FOR RESEARCH VIA DEPARTMENT HEAD AND DEAN-
NOTES
Fig. 5.3 Example of a procedure
All of these above mentioned problems illustrate the difference between formal systems and informal systems. Formal systems are systems recognized by the official docu nentation of the organization; informal systems are the way in which the organization actually works. Informal systems develop because of inadequacies of formal procedures, individual work habits and preferences, resistance.to control, and other factors. It is important to understand both formal and informal systems
, because each provides insight into information requirements and what will be needed to convert from present to future information services.A second type of document useful to systems analysts is a business form (see Figure 5.4). Forms are used for all types of business functions, from recording an order acknowledging the payment of a bill to indicating what goods have been shipped. Forms are important for understanding a system because they explicitly indicate what data flow in dr out of a system and which are necessary for the system to function. In the sample invoice form in Figure 5.4, we have locations for data such as the name of the customer, the customer’s sold to and ship to addresses, data (item number, quantity, etc.) about each line item on the invoice, and calculated data such as tax, freight, and totals.The form provides us crucial information about the nature of the oi^anization.For example, the company can ship and bill to different addresses; customers can have discounts applied; and the freight expense is charged to the customer. A printed form may correspond to a computer display-that the system will generate for someone to enter and maintain data or to display data to online users. Forms are most useful to an analyst when they contain actual organizational data, because this allows him/her to determine the characteristics of the data that are actually used by the application. The ways in which people use forms change over time, and data that were required when a form was designed may no longer be required. An analyst can use the systems analysis techniques to help him/her determine which data are no longer needed.
90 Self-Instructinnat Material
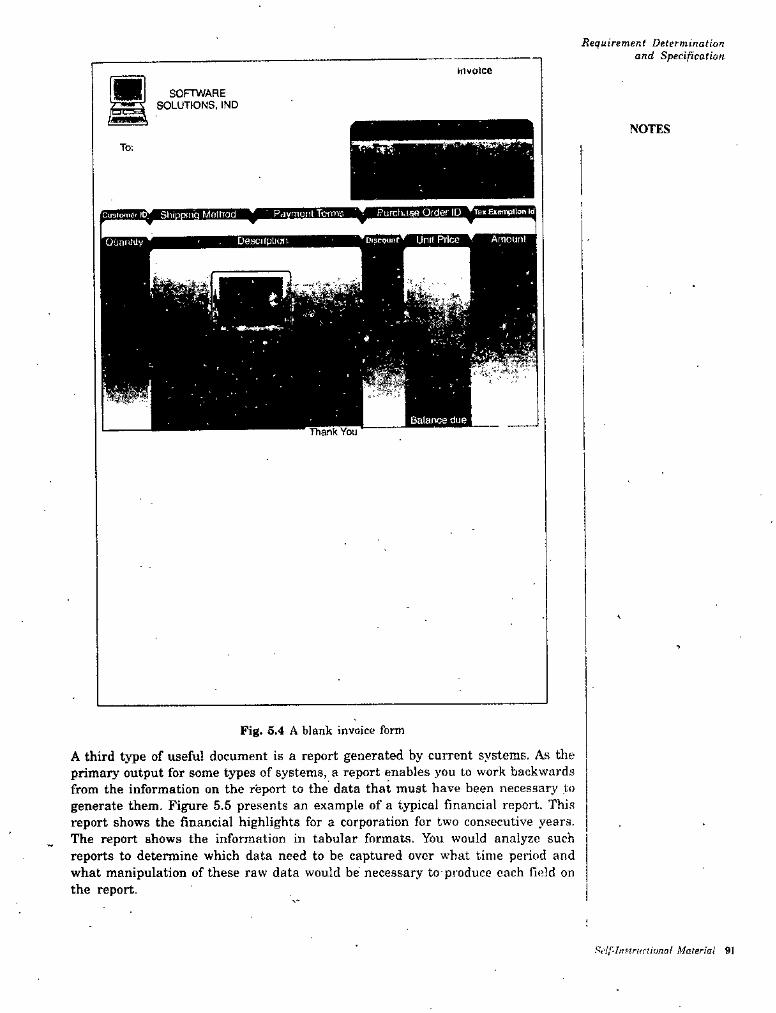
Requirement Determination and Specification
invoice
SOFTWARE SOLUTIONS, IND
NOTESTo;
i'cusronii;-ID^ Shiooiiia MomoJ * PdvmonlTcfmj ’T Purchaae Order ID ^Ts.ExempitonUi
W\^Discount Unit Price ^ Amount jDescifpiKxvO’jnniily
Balance dueI hanK YOU
\
Fig. 6.4 A blank invoice form
A third type of useful document is a report generated by current systems. As tlie primary output for some types of systems, a report enables you to work backwards from the information on the report to the data that must have been necessary to generate them. Figure 5.5 presents an example of a typical financial report. Thi.s report shows the financial highlights for a corporation for two consecutive years. The report shows the information in tabular formats. You would analyze such reports to determine which data need to be captured over what time period and what manipulation of these raw data would be' necessary to produce each field on the report.
Sdf-Innructiimol Material 91
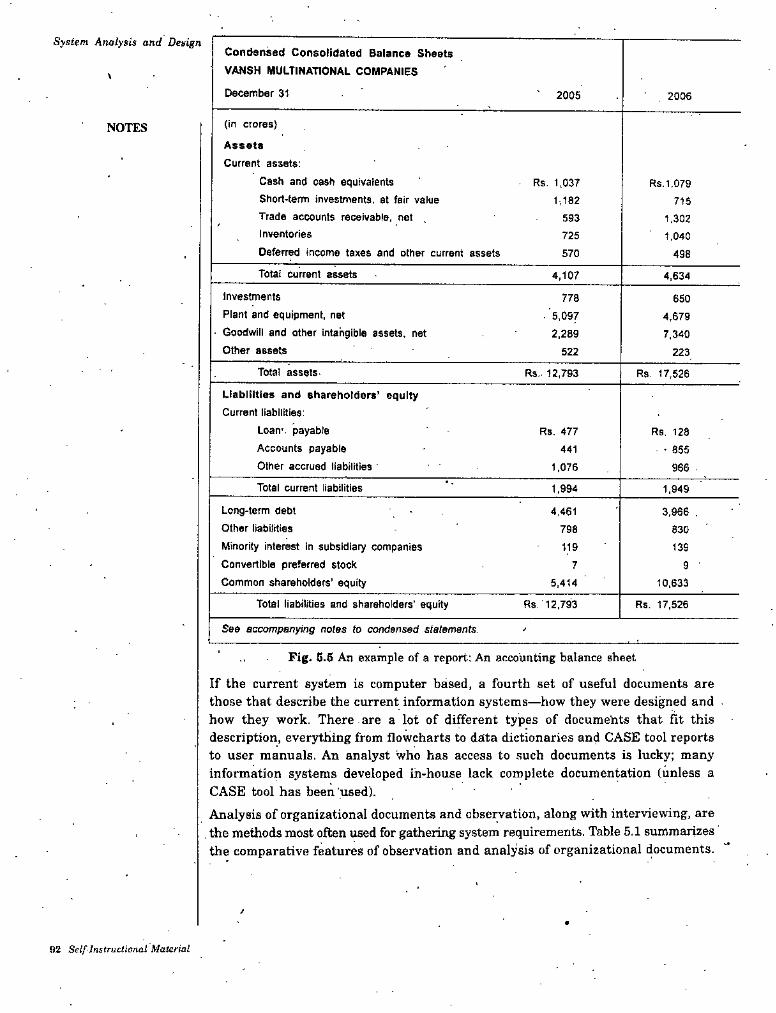
System Analysis and DesignCondensed Consolidated Balance Sheets VANSH MULTINATIONAL COMPANIES December 31
\2005 2006
(in crores)
Assets Current assets:
Cash and cash equivalents Short-term investments, at fair vaiue Trade accounts receivable, net inventories
Deferred income taxes and other current assets
NOTES
Rs. 1,037 1,182
Rs. 1,079715
593 1,3021,040725
570 498
Total current assets 4,107 4,634
InvestmentsPlant and equipment, net
' Goodwill and other intangible assets, net Other aasets
778 650. 5,097
2,2894,6797,340
522 223
Total assets. Rs. 12,793 Rs. 17,526
Liabilities and shareholders’ equity Current liabilities:
Loan*, payable Accounts payable Other accrued liabilities
Rs. 477 Ra, 128 ■ - 855441
1,076 966Total current liabilities 1,994 1,949
Long-term debt Other liabilitiesMinority interest in subsidiary companies Convertible preferred stock Common shareholders' equity
4,461 3,966 .798 830119 139
7 910,6335,414
Rs. 12,793Total liabilities and shareholders' equity Rs. 17,526
See Bixompanying notes to condensed s/afemenfs.
Fig. 5.5 An example of a report: An accounting balance sheet
If the current system is computer based, a fourth set of useful documents are those that describe the current information systems—how they were designed and how they work. There , are a lot of different types of documents that fit this description, everything from flowcharts to data dictionaries and CASE tool reports to user manuals. An analyst who has access to .such documents is lucky; many information systems developed ih-house lack complete documentation (unless a CASE tool has been used).Analysis of organizational documents and observation, along with interviewing, are the methods most often xised for gathering system requirements. Table 5.1 summarizes the comparative features of observation and analysis of organizational documents.
/
92 Self Instructional Material

Table Comparison of Observation and Document Analysis Requirement Determination and Specification
. Characteristic Observation. Document Analysis
Information Richness Time Needed ExpenseChance for Follow-up
and Probing
High (many channels)Can be extensive Can be highGood: probing and clarifi
cation questions can be asked during or after observation
Observee is known to interviewer; observee may change behaviour ' when observed
Interviewees may or may not be involved and committed depending on whether they know if they are being observed
Limited numbers and limited time (snapshot) of each
Low (passive) and old Low to moderate
• Low to moderate Limited; probing possible only
if original author is available
NOTES
Confidentiality Depends on nature of document; does not change simply by being read
Involvement of Subject
None, no clear commitment
Potentially biased by which documents were kept or because document not created for this purpose
Potential Audience
Self-Instructional Material 93

System Analysis and Design
\I
STUDENT ACTIVITY 5.1
1. What is systems analysis? What is its main purpose? What are its main activities?
2. List all possible deliverables and outcomes of requirements determination. How can a systems analyst use these outcomes?
94 Self-Instructional Material

Requirement Determination and Specification5.4 CONTEMPORARY METHODS FOR
DETERMINING SYSTEM REQUIREMENTSEven though we called interviews, observation, and document analysis traditional methods for determining a system’s requirements, all of these methods are still very much -used by analysts to collect important information. Tbday, however, there are additional techniques to collect information about the current system, the organizational area requesting the new system, and what the new system should be like. In this section, you will learn about several contemporary informationgathering techniques for analysis: Joint Application Design (JAD), group support system, CASE tools, and prototyping. As we said earlier, these techniques can support effective inforination collection and structuring while reducing the amount of time required for analysis. The contemporary methods for collecting system requirement are given below;
Bringing together in a Joint Application Design (JAD) session users, sponsors, analysts, and others to discuss and review system requirements.Using group support systems to facilitate the sharing of ideas and voicing of opinions about system requirements.Using CASE tools to analyze current systems to discover requirements to meet .changing business conditions.Iteratively developing system prototypes that refine the understanding of system requirements in concrete terms by showing working versions of system features.
NOTES
. •
5.4.1 Joint Application DesignJoint Applicatio." Design or JAD started in the late 1970s at IBM and that since then the practice of JAD has spread throughout many companies and industries. The main idea behind JAD is to bring together the key users, managers, and systems analysts involved in the analysis of a current system. In that respect, JAD is similar to a group interview; a JAD. however, follows a particular structure of roles and agenda that is quite different from a group interview during which analysts control the sequence of questions answered by users. The primary purpose of using JAD in the analysis phase is to collect systems requirements simultaneously from the key people involved with the system. The result is an intense and structured, but highly effective, process, As with a group interview, having all the key people together in one place at one time allows analysts to see where there are areas of agreement and where there are conflicts. Meeting with all of these important people for over a week of intense sessions allows an analyst the opportunity to resolve conflicts, or at least to understand why a conflict may not be simple to resolve.JAD sessions are usually conducted at a location other than the place where the people involved normally work. The idea behind such a practice is to keep participants away from as many distractions as possible so that they can concentrate on systems analysis. JAD sessions are time-consuming processes and quite expensive.The typical participants in a JAD are given below;
• JAD session leadier. The JAD session leader organizes and runs the JAD.This person has been trained in group management and facilitation as well as in systems analysis. The JAD leader sets the agenda and sees that it is met. The JAD leader remains neutral on issues and does not contribute ideas
Self-Instructional Material 95
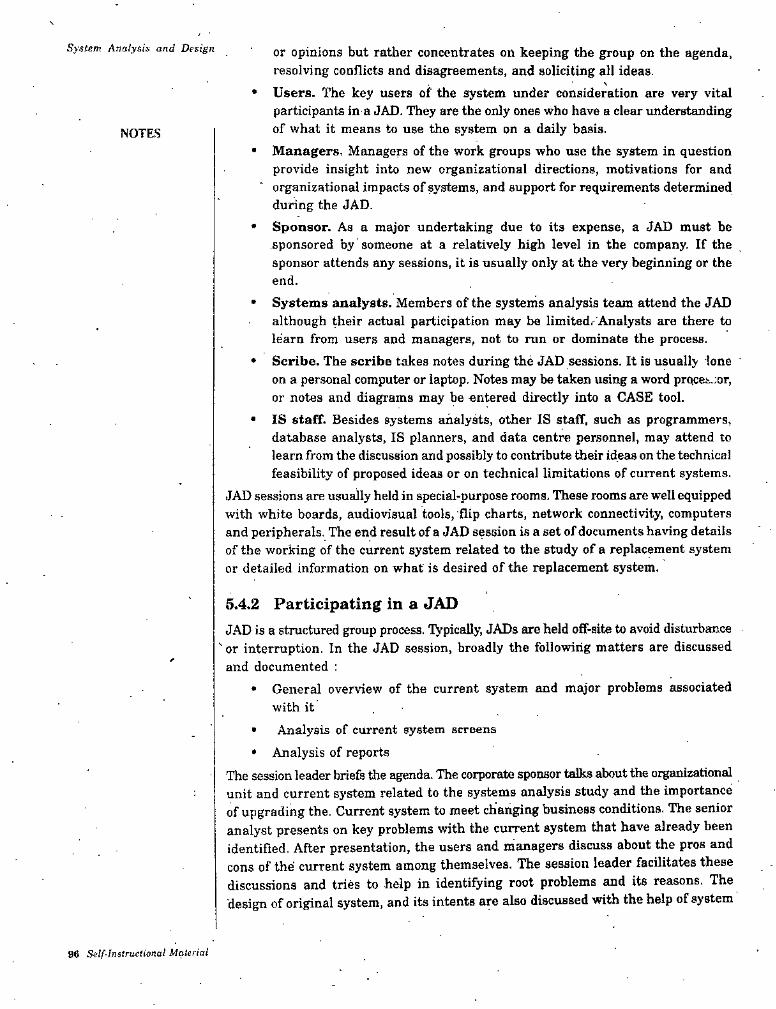
System Analysis and Design or opinions but rather concentrates on keeping the group on the agenda, resolving conflicts and disagreements, and soliciting all ideas.
• Users. The key users of the system under consideration are very vital participants in a JAD. They are the only ones vi-ho have a clear understanding of what it means to use the system on a daily basis.
• Managers, Managers of the work groups who use the system in question provide insight into new organizational directions, motivations for and organizational impacts of systems, and support for requirements determined during the JAD.
• Sponsor. As a major undertaking due to its expense, a JAD must be sponsored by someone at a relatively high level in the company. If the sponsor attends any sessions, it is usually only at the very beginning or the end.
■ Systems analysts. Members of the systems analysis team attend the JAD although their actual participation may be limitedr Analysts are there to learn from users and managers, not to run or dominate the process.
• Scribe. The scribe takes notes during the JAD sessions. It is usually lone ' on a personal computer or laptop. Notes may be taken using a word prQcet.;or, or notes and diagrams may be entered directly into a CASE tool.
• IS staff. Besides systems analysts, other IS staff, such as programmers, database analysts, IS planners, and data centre personnel, may attend to learn from the discussion and possibly to contribute their ideas on the technical feasibility of proposed ideas or on technical limitations of current systems.
JAD sessions are usually held in special-purpose rooms. These rooms are well equipped with white boards, audiovisual tools, flip charts, network connectivity, computers and peripherals. The end result of a JAD session is a set of documents having details of the working of the current system related to the study of a replacement system or detailed information on what is desired of the replacement system.
NOTES
5.4.2 Participating in a JADJAD is a structured group process. Typically, JADs are held off-site to avoid disturbance
'or interruption. In the JAD session, broadly the following matters are discussed and documented :
• General overview of the current system and major problems associated with it
• Analysis of current system screens• Analysis of reports
The session leader briefs the agenda. The corporate sponsor talks about the organizationalunit and current system related to the systems analysis study and the importance of upgrading the. Current system to meet chianging business conditions. The senior analyst presents on key problems with the current system that have already been identified. After presentation, the users and managers discuss about the pros and
of the current system among themselves. The session leader facilitates theseconsdiscussions and tries to help in identifying root problems and its reasons. The design of original system, and its intents are also discussed with the help of system
96 Self-Instructional Material
analysts. Various issues that cannot be resolved during the JAD or issues that ncguirement Dcurminaiionand Speckfication
require additional information are immediately noted on the flip chart paper and answered subsequently during that session or rather JAD sessions. Analysts present and discuss on forms and report design, answer questions form users and managers, and take notes on what is being said. After each meeting, the analysis team meets informally to discuss the proceedings of the meeting and consolidates what they have learned. When a JAD is over, the session leader prepares a report that documents the flndings in the JAD and that is circulated among users and analysts.
NOTES
5.4.3 CASE Tools During JADThe CASE tools most useful to systems analysis during a JAD are those referred to as upper CASE, as they apply most directly to activities occurring early in the systems development life cycle. Upper CASE tools usually include planning tools, diagramming tools, and prototyping tools, such as computer form and report generators. For requirements determination and structuring, the most useful CASE tools are for diagramming and for form and report generation. The more interaction analysts have with users during this phase, the more useful this set of tools is. The analyst can use diagramming and prototyping tools to give graphic form to system requirements, show the tools to users, and make changes based on the users’ reactions. The same tools are very valuable for requirements structuring as well. Using common CASE tools during requirements determination and structuring makes the transition between these two subphases easier and reduces the total time spent. In structuring, CASE tools that analyze requirements information for correctness, completeness, and consistency are also useful. Finally, for alternative generation and selection, diagrflTTiTning and prototyping tools are key to presentii^ users with graphic illustrations of what the alternative systems will look like. Such a practice provides users and analysts with better information to select the most desirable alternative system.Some observers advocate using CASE tools during JADs. Running a CASE tool during a JAD enables analysts to enter system models directly into a CASE tool, providing consistency and reliability in the joint model-building process. The CASE tool captures system requirements in a more flexible and useful way than can a scribe or an analysis team making notes. Further, the CASE tool can be used to project menu display, and report designs, so users can directly observe old and new designs and evaluate their usefulness for the analysis team.
5.4.4 Supporting JAD with Group Support SystemsEven though CASE tools can greatly augment a JAD, the group interaction process is typically not well supported by computing. Other than CASE tools, most of the computer use at a JAD is by one person, the scribe taking notes. Because JAD is a structured group process, JAD can benefit from the same computer-based support that can be applied to any group process. Group support systems (GSS) can be used to support group meetings. Here we will discuss how JAD can benefit from GSS use.One disadvantage to a JAD session is that it suffers from many of the same problems as any group meeting. For example, the more people there are in a group, the less time there is for all of them to speak and state their views. Even if you assumed that they all spoke for an equal amount of time, no one would have much time to talk in a 1-hour meeting for ten people (only 6 minutes each!). The
Self-Insiruclional Material 97

System AnoJysis and Design assumption about speaking equally points out a second problem with meetings—one or a few people always dominate the discussion. On the other hand, some people will say absolutely nothing. Whatever outcome the meeting produces tends to be tilted toward those who spoke the most during the meeting, and others may not be fully committed to the conclusions reached. A third problem with group meetings is that some people are afraid to speak out for fear they will be criticized. A fourth problem is that most people are not willing to criticize or challenge their bosses in a meeting, even if what the boss is saying is wrong.JADs suffer from ail of these same problems. The result is that important views often are not aired. Such an outcome is unfortunate because the design of the new system could be adversely impacted and the system may have to be reworked at great expense when those important views finally become known.
CSSs have been designed specifically to help alleviate some of the problems with group meetings. In order to provide everyone in the meeting with the same chance to contribute, group members type their comments into computers rather than speak them. The GSS is set up so that all members of the group can see what every other member has been typing. In the 1-hour meeting for ten people mentioned earlier, ail ten can contribute for the full hoUr, instead of just for 6 minutes, using a GSS. If everyone in the meeting is typing, not talking, and everyone has the same chance to contribute, then the chances of domination of the meeting by any one individual are greatly reduced. Also, comments typed into a GSS can be anonymous- Anonymity helps those who fear criticism because only the comment, and not the person can be criticized, because no one knows who typed what, Anonymity also provides the ability to criticize your boss.Supporting a JAD with a GSS has many potential benefits. Using a GSS, a JAD session leader is more likely to obtain contributions from everyone, rather than from just a few. Important ideas are less likely to be missed. Similarly, poor ideas are more likely to be criticized. A study comparing traditional JAD to JAD supported with GSS found that using a GSS did lead to certain enhancements in the JAD process. Among the findings were that'GSS-supported JADs tended to be more time-efficient than traditional JAD and participation was more equal because there was less domination by certain individuals than in traditional JAD. The study also found that introducing a GSS into a JAD session had other, less desirable, effects. GSS-supported JADs tended to be less structured, and it was more difficult to identify and resolve conflicts when a GSS was used, due in part to the anonymity of interaction. Supporting a JAD with GSS, then, does seem to provide some benefits by altering how the group works together. Yet a reduction in the JAD leader’s ability to resolve conflicts could be a problem, especially since JAD was designed to help uncover and resolve conflicts.
NOTES
5.4.5 Using Prototyping During Requirements DeterminationPrototyping is an iterative process involving analysts and users whereby a rudimentary version of an information system is built and rebuilt according to user feedback. In can replace the systems development life .cycle or augment it. What we are interested in here is how prototyping can augment the requirements determination process.
In order to gather an initial basic set. of requirements, an analyst will still have to interview' users and collect documentation. Prototyping, however, will enable
98 Self-liistruenona! Material
Requirement Determination and Specificationhim/her to quickly convert basic requirements into a working, though limited,
version of the desired information system. The prototype will then be viewed and tested by the user. Typically, seeing verbal descriptions of requirements converted into a physical system will prompt the user to modify existing requirements and generate new ones. For example, in the initial interviews, a user might have said that he/she wanted all relevant utility billing information on a single computer display form, such as the client’s name and address, the service record, and pajnnent history. Once the same user sees how crowded and confusing such a design would be in the prototype, he/she might change his/her mind arid instead ask for the information to be organized on several screens, but with easy transitions from one screen to another. He/she might also be reminded of some important requirements (data, calculations, etc.) that had not surfaced during the initial interviews.The analyst would then redesign the prototype to incorporate the suggested changes. Once modified, user's would again view and test the prototype. And, once again, the analyst would incorporate their suggestions for change. Through such an iterative process, the chances are good that he/she will be able to better capture a system’s requirements. The goal with using prototyping to support reqmrements determination is to develop concrete specifications for the ultimate system, not to build the ultimate system from prototyping.Prototyping is possible with several fourth-generation lan^ages (4GLs) and with CASE tools, as pointed out in the earlier section on CASE tools and analysis in this unit. As we saw there, an analyst can use CASE tools as part of a JAD to provide a type of limited proto^ping with a group of users:Prototyping is most useful for requirements determination when:
• User requirements are not clear or well understood, which is often the case for totally new systems or systems that support decision making.
• One or a few users and other stakeholders are involved with the system.• Possible designs are-complex and require concrete form to fully evaluate.• Communication problems have existed in the past between users and analysts
and both parties want to be sure that system requirements are as specific as possible.
• Tools (such as form and report generators) and data are readily available to rapidly build working systems.
Prototyping also has some drawbacks as a tool for requirements determination. These are given below :
• A tendency to avoid creating formal documentation of system requirements, which can then make the system more difficult to develop into a fully working system.
• Prototypes can become very idiosyncratic (person’s particular way of thinking) to the initial user and difficult to diffuse or adapt to other potential users.
• Prototypes are often built as stand alone systems, thus ignoring issues of sharing data and interactions with other existing systems, as well as issues with scaling up (i.e., increasing) applications.
• Checks in the SDLC are bypassed so that some more subtle, but still important, system requirements might be forgotten (e.g., security, some data entry controls, or standardization of data across systems).
NOTES
Self-Instructional Material 89
System Analysis and Design
5.5 RADICAL METHODS FOR DETERMINING SYSTEM REQUIREMENTS
Whether traditional or contemporary, the methods for determining system requirements that you have read about in this unit apply to any requirements determination effort, regardless of its motivation. But most of what you have learned has traditionally been applied to systems development projects that involve automating existing processes. Analysts use system requirements determination to understand current problems and opportunities, as well as to determine what is needed and desired in future systems. Typically, the current way of doing things has a large impact on the new system. In some organizations, though, management is looking for new ways to perform current tasks. These new ways may be radically different from how things are done now, but the payoffs may be enormous: Fewer people may be required to do the same work, relationships with customers may improve dramatically, and processes may become much more efficient and effective, all of which can result in increased profits. The overall process by which current methods are replaced with radically new methods is generally referred to as business process reengineering or BPR. Although the term BPR is usually associated with a management fad that occurred in the 1990s, businesses remain vitally interested in business processes and how to improve them. Even if the term business process reengineering may seem dated to some, process orientation remains a lasting legacy of the BPR movement.To better understand BPR, consider the following analogy. Suppose you are a successful Indian cricketer who has tuned your game to fit' the style of grounds and weather in India. You have learned how to control the flight of the ball on slow pitches. When you come to Australia or West Indies you discover that the fast pitches are not suited to your style of the game. You need to reengineer your whole approach. If you ate good enough, you may survive, but without reengineering, you will never win matches for your team.-Just as the competitiveness of cricket forces good players to adapt their games to changing conditions, the competitiveness of our global economy has driven most companies into a mode of continuously improving the quality of their products and services. Organizations realize that creatively using information technologies can yield significant improvements in most business processes. The idea behind-BPR is not just to improve each business process, but, in a systems modeling sense, to reorganize the complete flow of data in major sections of an organization to eliminate unnecessary steps, achieve synergies among previously separate steps, and become more responsive to future changes. Companies such as IBM, Procter & Gamble, Wal-Mart, and Ford are actively pursuing BPR efforts and have had great success. Yet, many other companies have found difficulty in applying BPR principles. Nonellieless, BPR concepte are actively applied in both corporate strategic planning and information systems planning as a way to radically improve business processes.BPR advocates suggest that radical increases in the quality.of business processes can be achieved through creative application of information technologies. BPR advocates also suggest that radical improvement cannot be achieved by tweaking (i.e., pinching and twisting sharply) existing processes but rather by using a clean sheet of paper and asking, “If we were a new organization, how would we accomplish
NOTES
100 Self-Instructional Material
Requirement Determination and Specificationthis activity?” Changing the way work is performed also changes the way information
is shared and stored, which means that the results of many BPR efforts are the development of information system maintenance requests or requests for system replacement. It is likely that an analyst will encounter or has encountered BPE initiatives in him/her own organization. NOTES
5.5.1 Identifying Processes to ReengineerA first step in any BPR effort relates to understanding what processes to change, lb do this, an analyst must first understand which processes represent the key business processes for the organization. Key business processes are the structured set of measurable activities designed to produce a specific output for a particular customer or market. The important aspect of this definition is that key processes are focused on some type of organizational outcome, such as the creation of a product or the delivery of a service. Key business processes are also customer focused. In other words, key business processes would include all activities used to design, build, deliver, support, and service a particular product for a particular customer. BPR efforts, therefore, first try to understand those activities that are part of the organization’s key business processes and then change the sequence and structure of activities to achieve radical improvements in speed, quality, and customer satisfaction. The same techniques an analyst learned to use for systems requirements determination can be used to discover and understand key business processes. Interviewing key individuals, observing activities, reading and studying organization documents, and conducting JADs can all be used to find and fathom (understand or comprehend fully) key business processes.After identifying key business processes, the next step is to identify specific activities that can be radically improved through re-engineering. Hammer and Charapy, the two people most identified with the term BPR, suggest that three questions be asked to identify activities for radical change. These questions are given below :
1. How important is the activity to delivering an outcome?2. How feasible is changing the activity?3. How dysfunctional is the activity?
The answers to these questions provide guidance for selecting which activities to change. Those activities deemed important, changeable, yet dysfunctional, are primary candidates. Tb identify dysfunctional activities, they suggest an analyst looks for activities where there are excessive information exchanges between individuals, where information is redundantly recorded or needs to be rekeyed, where there are excessive inventory buffers or inspections, and where there is a lot of rework or complexity. Many of the tools and techniques for modelling data, processes, events, and logic within the IS development process are also being applied to model business processes within BPR efforts. So, the skills of a systems analyst are often central to many BPR efforts.
5.5.2 Disruptive Technologies■ Once key business processes and activities have been identified, information technologies
must be applied to radically improve business processes. To do this, Hammer and Champy surest that organizations think “inductively” about information technology. Induction is the process of reasoning from the specific to the general, which means
Self-Instructional Material 101
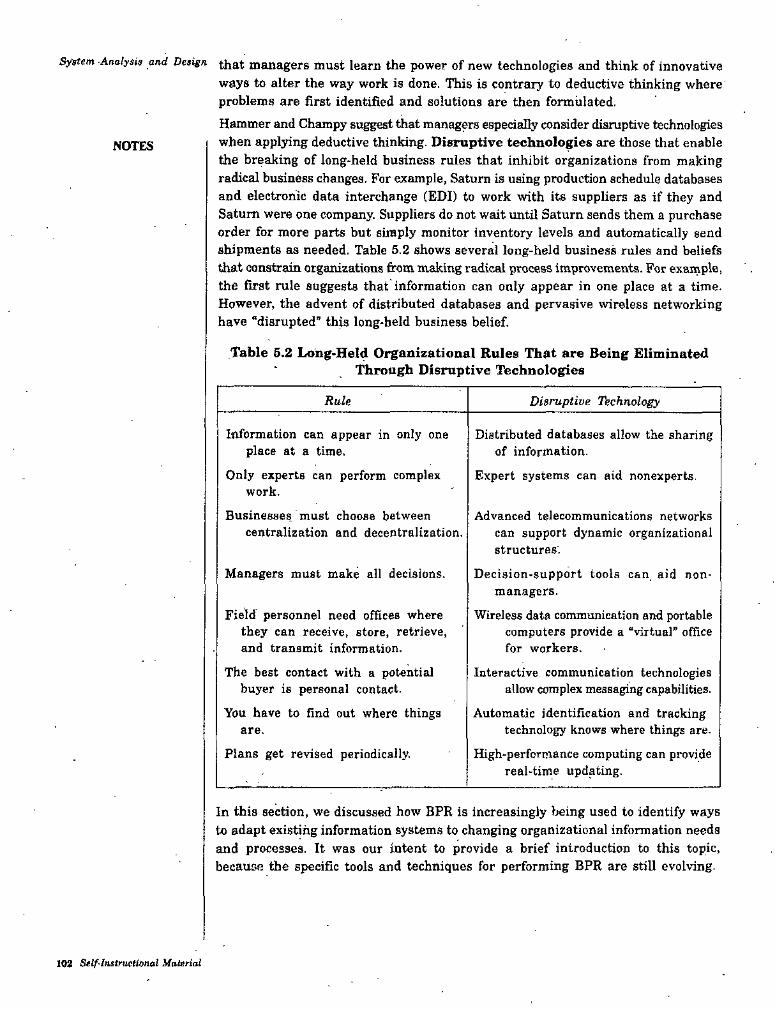
System Analysis and Design managers must learn the power of new technologies and think of innovativeways to alter the way work is done. This is contrary to deductive thinking where problems are first identified and solutions are then formulated.Hammer and Champy surest that managers especially consider disruptive technologies when applying deductive thinking. Disruptive technologies are those that enable the breaking of long-held business rules that inhibit organizations from making radical business changes. For example, Saturn is using production schedule databases and electronic data interchange (EDI) to work with its suppliers as if they and Saturn were one company. Suppliers do not wait until Saturn sends them a purchase order for more parts but simply monitor inventory levels and automatically send shipments as needed. Table 5.2 shows several long-held business rules and beliefs that constrain organizations from m^ing radical process improvements. For example, the first rule suggests that information can only appear in one place at a time. However, the advent of distributed databases and pervasive wireless networking have “disrupted” this long-held business belief.
Table 5.2 Lohg>Held Organizational Rules That are Being Eliminated Through Disruptive Technologies
NOTES
Rule Disruptive Thcknology
Information can appear in only one place at a time.
Only experts can perform complex work.
Businesses, must choose betweencentralization and decentralization.
Distributed databases allow the sharing of information.
Expert systems can aid nonexperts.
Advanced telecommunications networks can support dynamic organizational structures.
Decision-support tools can. aid nonmanagers.
Wireless data communication and portable computers provide a “virtual" office for workers.
Interactive communication technologies allow complex messaging capabilities.
Automatic identification and tracking technology knows where things are.
High-performance computing can provide real-time updating.
Managers must make all decisions.
Field personnel need offices where they can receive, store, retrieve, and transmit information.
The best contact with a potential buyer is personal contact.
You have to find out where things are.
Plans get revised periodically.
In this section, we discussed how BPR is increasingly being used to identify ways to adapt existing information systems to changing organizational information needs and processes. It was our intent to provide a brief introduction to this topic, because the specific tools and techniques for performing BPR are still evolving-
102 Self-Instructional Material

Requiremint Determination and Speeification
STUDENT ACTIVITY 6.211. What are the contenit>orary methods of information gathering techniques? Explain:
2. What is JAD? What are its merits and limitations?
Self-Initruclional Material 103
System Analysis and DesignSUMMARY
• Open«ended questions are the questions in interviews that have no prespecified answers.
• Closed-ended questions are the questions in interviews that ask (hose responding to choose from among a set of specified responses.
• Nominal Group Technique (NGT) is a facilitated process that supports idea generation by groups. At the beginning of the process, group members work alone to generate ideas, which are then pooled under the guidance of a trained facilitator.
• Formal System is the official way a system works as described in organizational documentation.
• Informal System' is the way a system actually works.
NOTES
TEST YOURSELFAnswer the following questions;
1. Why is an interview plan important ?
2. What is the difference between closed and open-ended questions ?3. What is prototyping? Explain how prototyping helps in determining information
systems requirement. In what situations prototyping is most suitable and useful for requirements determination? What are the limitations of this method ?
4. List common traditional methods of collecting information system requirements. Compare and contrast different methods. 'What are the limitations of methods? , Which one .you think is the best method?
5. Compare and contrast group interview process with individual interview.6. How formal systems differ from ,informal systems in an organization? Explain,7. What are: CASE Tools? How can CASE tools be used to support requirements
determination?8. T^at is BPR? How system requirements are determined is BPR? Explain.
9. State True or False:({) System analysis is the part of the SDLC in which you determine how
the current information system functions and access what users would like to see in a new system.
(«) Interviewing is not one of the primary ways analysts gather information about an information systems project'.
(.Hi) With either open or closed-ended questions, do phrase a question in a way that implies a right or wrong answer.
(iv) The form provides us crucial information about the nature of the organization.
(o) The primary purpose of using JAD in the analysis phase is to collect systems requirements simultaneously from the key people involved with the system.
(ni) JAD sessions are usually conducted at the same place where the people involved normally work.
t04 Self-Insiructionot Malarial
Reguirement Determination and Specification(utt) Prototyping can not replace the SDLC or augment it.
^ I *
(vUi) The overall process by which current methods are replaced with radically new methods is generally referred to as business process reei^ineering or BPR.
10. Fill in the blanks;(t) System analysis has two subphases,
structuring.(u) In many ways, gathering system requirements resembles conducting
any .......................(jit) One of the more popular techniques for generating ideas among group
members is called .....................
NOTESand requirements
systems are systems recognized by the official documentation(to)of the organization.
in the analysis phase is to collect systems requirements simultaneously from the key people involved with the system.
(v) The primary purpose of using
................... is an iterative process involving analysts and users wherebya rudimentary version of an information system is built and rebuilt according to user feedback..................... are the structured set of measurable activities designedto produce a specific output for a particular customer or market.
(oiit) The planning game has three phases; exploration commitment and
(oi)
(ojj)
ANSWERSTest Yourself
9. State True or False; ' (i) True
{Hi) False (o) True
(oil) False
FalseTrueFalseTVue
Hi)(iv)ivi)
(vUi)10. Fill in the blanks:
investigationFormalPrototypingsteering
(i) requirements determination (fij) Nominal Group Technique (NGT)
(i^) JAD(tijj) Key business processes
(it)iiv)(Vi)
ivUi)
Self-Instructional Material 106

Proccst ModtiingCHAPTER
NOTES
PROCESS MODELING
LEARNING OBJECTIVESIntroduction
Process Modeling6.2.t Modeling a System's Process for Structured Analysis
6.2.2 Deliverables and Outcomes
Data Flow Diagramming Mechanics6.3.1 Definitions and Symbols 6.3-2 Developing DFDs: An Example6.3.3 Rules of Data Flow Diagramming6.3.4 Decomposition of DFDs6.3.5 Balancing DFDs
Types of DFDsUsing Data Flow Diagramming in the Analysis Process
6.5.1 Guidelines for Drawing DFDs
6.16.2
6.3
- 6.46.5
6.1 INTRODUCTIONIn the last unit, you learned of various methods that systems analysts use to collect the information necessary to determine information systems requirements. In this Unit, we will focus on one tool that is used to coherently represent the information gathered as part of requirements determination—data flow diagrams. Data flow diagrams (DFDs) help to model how data flow through an information system, the relationships among the data flows, and how data come to be stored at specific locations. DFDs also show the processes that change or transform data. Because DFDs concentrate on the movement of data between processes, these diagrams are known as process models.As the name indicates, a data flow diagram is a graphical tool that allows systems analysts (and users, for that matter) to depict the flow of data in an information system. The system can be physical or logical, manual or computer based. In this unit, you will learn how to draw and revise data flow diagrams. We present the basic symbols used in such diagrams and a set of rules that govern how these diagrams are drawn. You will also learn about what to do and what not to do when drawing data flow diagrams related to data flow diagrams are also given: balancing and decomposition. In addition, you will learn the
Self-Jnslructional Material 107
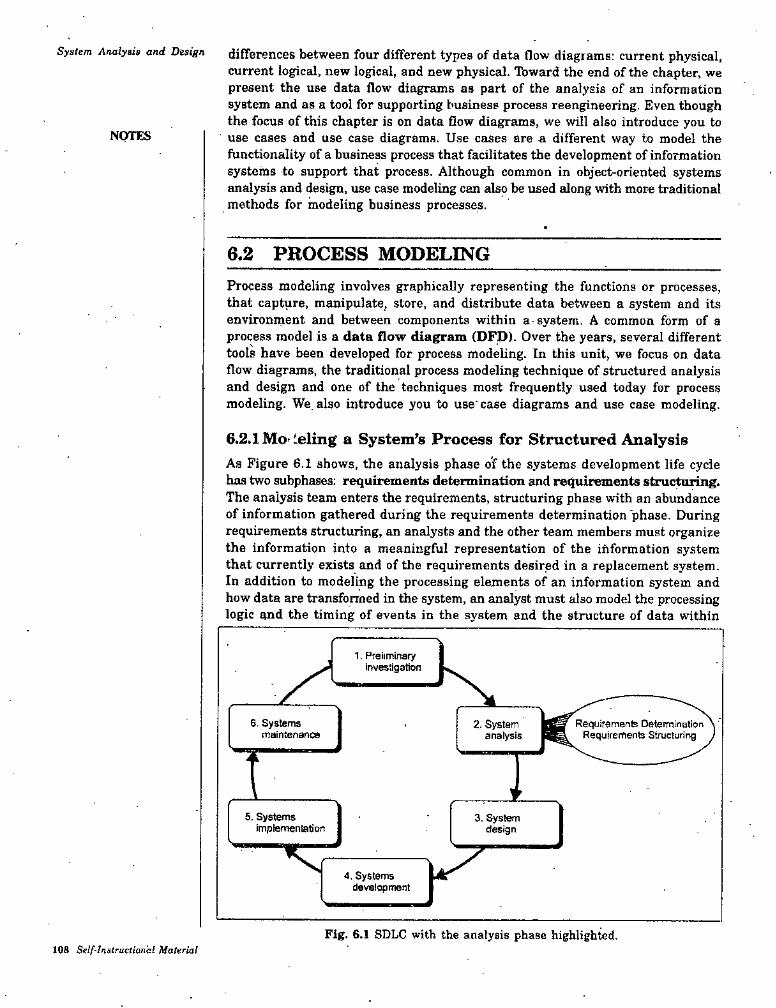
System Analysis and Design differences between four different types of data flow diagrams: current physical, current logical, new logical, and new physical. Tbward the end of the chapter, we present the use data flow diagrams as part of the analysis of an information system and as a tool for supporting business process reengineering. Even though the focus of this chapter is on data flow diagrams, we will also introduce you to use cases and use case diagrams. Use cases are a different way to model the functionality of a business process that facilitates the development of information systems to support that process. Although common in object-oriented systems analysis and design, use case modeling can also be used along with more traditional methods for modeling business processes.
NOTES
6.2 PROCESS MODELINGProcess modeling involves graphically representing the functions or processes, that capture, manipulate, store, and distribute data between a system and its environment and between components within a system. A common form of a process model is a data flow diagram (DFD). Over the years, several different tools have been developed for process modeling. In this unit, we focus on data flow diagrams, the traditional process modeling technique of structured analysis and design and one of the techniques most frequently used today for process modeling. We also introduce you to use' case diagrams and use case modeling.
6.2.1 Mo deling a System’s Process for Structured AnalysisAs Figure 6.1 shows, the analysis phase o’f the systems development life cycle has two subphases: requirements determination and requirements structuring. The analysis team enters the requirements, structuring phase with an abundance of information gathered during the requirements determination phase. During requirements structuring, an analysts and the other team members must organize the information into a meaningful representation of the information system that currently exists and of the requirements desired in a replacement system. In addition to modeling the processing elements of an information system and how data are transformed in the system, an analyst must also model the processing logic and the timing of events in the system and the structure of data within
1. Preiiminary I investigation
6. Systems maintenance
2. System analysis
Requirements Determination \ Requirements Structuring I
15. Systems
implementatiDn3. Systen
design
4. Systems development
Fig. 6.1 SDLC with the analysis phase highlighted.108 Self-Instructional Material

the system. For traditional structured analysis, a process model is only one of three major complementary views of an information system. Togetl^er, process, logic and timing, and data models provide a thorough specification of an
! information system and, with the proper supporting tools, also provide the basis for the automatic generation of many working information system components.
Process Modeling
NOTES6.2.2 Deliverables and OutcomesIn structured analysis, the primary deliverables from process modeling are a set of coherent, interrelated data flow diagrams. The deliverables that result when data flow diagrams are used to study and document a system’s processes are given as follows:
Context Data Flow Diagram (DFD). A content diagram shows the scope of the system, indicating which elements are inside and which are outside the system.DFDs of Current Physical System (adequate detail only). Data flow diagrams of the current physical system specify which people and technologies are used in which processes to move and transform data, accepting inputs and producing outputs. 'These diagrams are developed with sufficient detail to understand the current system and to eventually determine how to convert the current system into its replacement.DFDs of current logical system. Tbchnology-independent, or logical, data flow diagrams of the current system show what data processing functions are performed by the current information system. ^DFDs of new logical system. The data movement, or flow, structure, and functional requirements of the new system are represented in logical data flow diagraihs.Thorough description of each DFD component. Entries for all of the objects included in all of the diagrams are included in the project dictionary or CASE repository.
This logical progression of deliverables allows an analyst to understand the existing system. He/she can then abstract this system into its essential elements to show how the new system should meet the information processing requirements identified during requirements determination. Remember, the deliverables of process modeling are simply stating what an analyst learned during requirements determination; in later steps in the systems development life cycle, an analyst and other project team members will make decisions on exactly how the new system will deliver these new requirements in specific manual and automated functions. Because requirements determination and structuring are often parallel steps, data flow diagrams that evolve from the more general to the more detailed as current and replacement systems are better understood.Even though data flow diagrams remain popular tools for process modeling and can significantly increase software development' productivity, data flow diagrams are not used in all systems development methodologies. Some oiganizations have developed their own diagrams to model processes. Other organizations rely on process modeling tools in CASE tool sets. Some methodologies, such as RAD and object-oriented analysis and design methodologies, do not model processes separately at all.Data flow diagrams provide notation as well as illustrate important concepts about
1.
2.
3.
4.
5.
Self-Instruciional Material 109
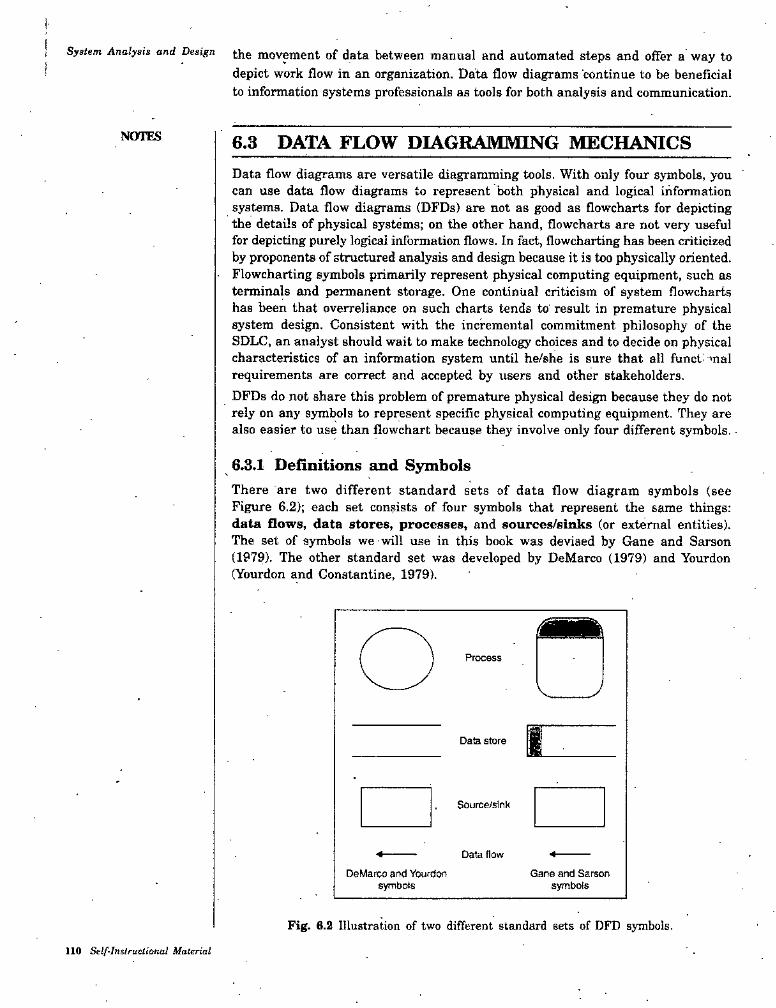
System Analysis and Design the movement of data between manual and automated steps and offer a way to depict work flow in an organization. Data flow diagrams continue to be beneficial to information systems professionals as tools for both analysis and communication.
NOTES 6.3 DATA FLOW DIAGRAMMING MECHANICSData flow diagrams are versatile diagramming tools. With only four symbols, you can use data flow diagrams to represent both physical and logical information systems. Data flow diagrams (DFDs) are not as good as flowcharts for depicting the details of physical systems; on the other hand, flowcharts are not very useful for depicting purely logical information flows. In fact, flowcharting has been criticized by proponents of structured analysis and design because it is too physically oriented. Flowcharting symbols primarily represent physical computing equipment, such as terminals and permanent storage. One continual criticism of system flowcharts has been that overreliance on such charts tends to result in premature physical system design. Consistent with the incremental commitment philosophy of the SDLC, an analyst should wait to make technology choices and to decide on physical characteristics of an information system until he/she is sure that all fund mal requirements are correct and accepted by users and other stakeholders.DFDs do not share this problem of premature physical design because they do not rely on any symbols to represent specific physical computing equipment. They are also easier to use than flowchart because they involve only four different symbols.
6.3.1 Definitions and SymbolsThere are two different standard sets of data flow diagram symbols (see Figure 6.2); each set consists of four symbols that represent the same things: data flows, data stores, processes, and sources/sinks (or external entities). The set of symbols we will use in this book was devised by Gane and Sarson (1979). The other standard set was developed by DeMarco (1979) and Yourdon (Yourdon and Constantine, 1979).
Process
Data store
Source/slnk
Data flow
DeMarco and Yourdon synbiMs
Gane and Sarson symbols
Fig. 6.2 Illustration of two different standard sets of DFD symbols.110 Stlf-Inslruclional Material

Process ModelingA data flow can be best understood as data in motion, moving from one place in a system to another. A data flow could represent data on a customer order form or a payroll check. A data flow could also represent the results of a query to a database, the contents of a printed report, or data on a data entry computer display form. A data flow is data that move together. Thus, a data flow can be composed of many individual pieces of data that are generated at the same time and that flow together to common destinations. A data store is data at rest. A data store may represent one of many different physical locations for data, for example, a file folder, one or more computer-based file(6), or a notebook. To understand data movement and handling in a system, it is not important to understand the system’s physical configuration. A data store might contain data about customers, students, customer orders, or supplier invoices. A process is the work or actions performed on data so that they are transformed, stored, or distributed. When modeling the data processing of a system, it does not matter whether a process is performed manually or by a computer. Finally, a- source/ sink is the origin and/or destination of the data. Sources/sinks are sometimes referred to as external entities because they are outside the system. Once processed, dat or information leave the system and go to some other place. Because sources and sinks are outside the system we are studying, many of the characteristics of sources and sinks are of no interest to us- In particular, we do not consider the following:
NOTES
• Interactions that occur between sources and sinks• What a source or sink does with information or how it operates (i.e., a
source or sink is a “black box”)• How to control or redesign a source or sink because, from the perspective
of the system we are studying, the data a sink receives and often what data a source provides are fixed
• How to provide sources and sinks direct access to stored data, because, as external agents, they cannot directly access or manipulate data stored within the system; that is, processes within the system must receive or. distribute data between the system and its environment.
The symbols for each set of DFD conventions are presented in Figure 6.2. In both conventions, a data flow is depicted as an arrow. The arrow is labeled with a meaningful name for the data in motion; for example. Customer .Order, Sales Receipt, or Paycheck. The name represents the aggregation of all the. individual elements of data moving as part of one packet, that is, all the data moving together at the same time. A square is used in both conventions for .sources/sinks and has a name that states what the external agent is, such as customer, Ibller,.. EPA Office, or Inventory Control System. The Gane and Sarson symbol for a process is a rectangle with rounded corners; it is a circle for DeMarco and Yourdon. The Gane and Sarson rounded rectangle has a line drawn through the top. The upper portion is used to indicate the number of the process. Inside the lower portion is a name for the process, such as Generate Paycheck, Calculate Overtime Pay, or Compute Grade Point Average. The Gane and Sarson symbol for a data store is a rectangle that is missing its right vertical side. At the left end is a small box used to number the data store, and inside the main part of the rectangle is a meaningful, label for the data store, such as Student File, or Transcripts. The DeMarco and Yourdon data store symbol consists of two parallel
Self-Instructiorml Material 111

System Anolyais and Design which may be depicted horizontally or vertically.
As mention earlier, sources/sinks are always outside the information system and define the boundaries of the system. Data must originate outside a system from one or more sources, and the system must produce information to one or more sinks (these are principles of open systems, and almost every information system is an open system). If any data processing takes place inside the source/sink, it is of no interest, because this processing takes place outside of the system we are diagramming. A source/sink might consist of the following;
• Another organization or organization unit that sends data to or receives infonnation from the system you are analyzing (e.g., a supplier or an academic depart.ment—in either case, the organization is external to the system you are studying)
• A person inside or outside the business unit supported by the system you are analyzing who interacts with the system (c.g., a customer or loan officer)
• Another information system with which the system you are analyzing exchanges information
Many times students who are just learning how to use DFDs will become confused as to whether something is a source/sink or a process within a system. This dilemma occurs most often when the data flows in a system cross office or departmental boundaries so that some processing occurs in one office and the processed data are moved to another office where additional processing occurs. Students are tempted to identify the second office as a source/sink to emphasize the fact that the data have been moved from one physical location to another (Figure 6.3a).’However, we are not concerned with where the data are physically located. We are more interested in how they are moving through the system and how they are beii^ processed^ It the processing of data in the other office may be automated by your system or the handling of data there may be subject to redesign, then you shoiild represent the second office as one dr more processes rather than as a source/sink (Figure 6.3b).
NOTES
CUSTOMER
i.
Payment RecordPayment
aReceipt VMakeBank
Deposit
Payment Data^V ✓
Payment Datant\ Oepoat Data BANK*
Credit Data CUSTOMERMASTER
(a) An Improperly drawn DFD showing a process as a source/sink.
112 Self-InstrucUnnal Material

Process Modeling
CUSTOMER
Payment RecordPayment NOTES
Receipt
Make Bank ’
Deposit
Payment Data^
UpdateCustomer
Master
Payment Data v:Deposit Data BANK♦
Credit Data CUSTOMERMASTER
(6) A DFD showing proper use of a process.Fig. 6.S Differences between source/sink and processes.
6.3.2 Developing DFDs: An ExampleTo illustrate how DFDs sire used to model the logic of data flows in information systems, we will present and work through an example. Consider Roop Chand restaurant, a fictional restaurant in New Delhi, India, owned by Aman and Vansh Dixit. Some are convinced that its hamburgers are the best in New Delhi, maybe even in northern India. Many people, especially Delhi University students and faculty, firequently eat at Roop Chand restaurant. The restaurant uses an information system that takes customer orders, sends the orders to the kitchen, monitors the goods sold and inventory, and generates reports for management.The information system is shown as a data flow diagram in Figure 6.4. The highest-level view of this system, shown in the figure, is known as context diagram. Notice that this context diagram has only one process, no data stores, four data flows, and three sources/sinka. The single process, labeled 0, represents the entire system; all context diagrams have only one process, labeled 0. The sources/sinks represent the environmental boundaries of the system.
KITCHENCUSTOMER
Customer Order♦ Food OrderFood
OrderingSystemReceipt
ManagementReports
RESTAURANTM^^AQER
Pig. 6.4 Context diagram of Roop Chand restaurant’s food ordering system.
Because the data stores of the system are conceptually inside the one process, data stores do not appear on a context diagram.
Self-Instructional Material 113
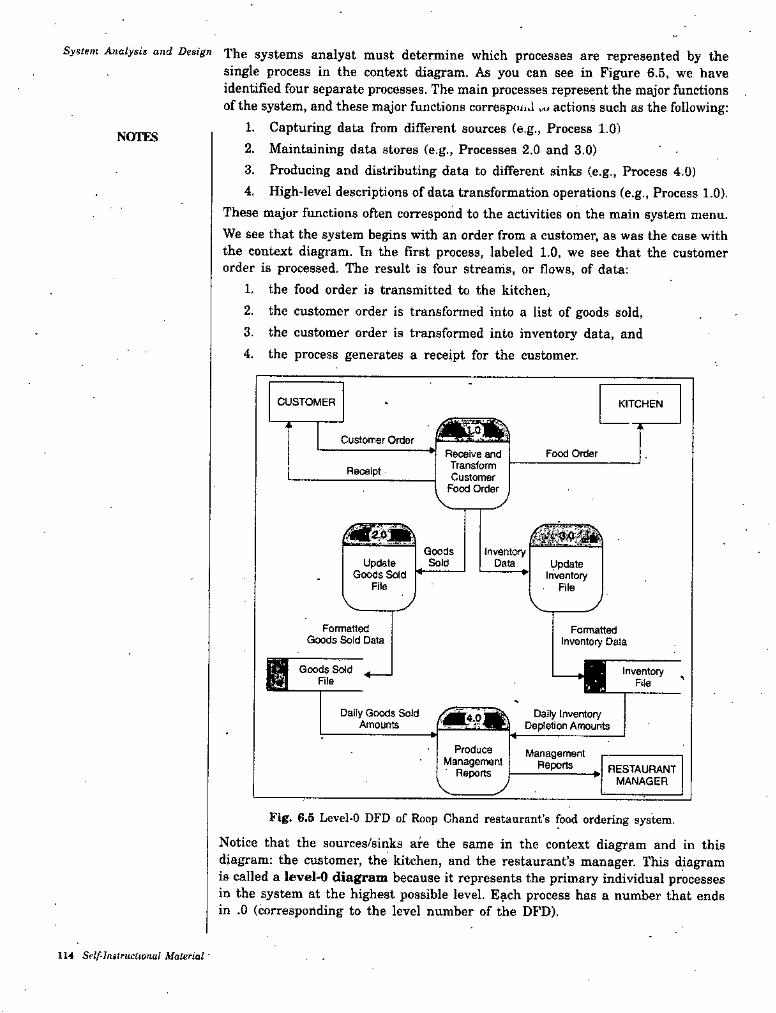
System Analysts and Design Tjje systems analyst must determine which processes are represented by thesingle process in the context diagram. As you can see in Figure 6.5, we have identified four separate processes. The main processes represent the major functions of the system, and these m^or functions correspond actions such as the following:
1. Capturing data from different sources (e.g., Process 1.0)2. Maintaining data stores (e.g., Processes 2.0 and 3.0)3. Producing and distributing data to different sinks (e.g., Process 4.0)4. High-level descriptions of data transformation operations (e.g., Process 1.0).
These major functions often correspond to the activities on the main system menu. We see that the system begins with an order from a customer, as was the case with the context diagram. In the first process, labeled 1.0, we see that the customer order is processed. The result is four streams, or flows, of data:
1. the food order is transmitted to the kitchen,2. the customer order is transformed into a list of goods sold,3. the customer order is transformed into inventory data, and4. the process generates a receipt for the customer.
NOTES
CUSTOMER KITCHEN
Customer OrderFood OrderReceive and
Transform Customer
Food OrderReceipt
Goods InventorySoldUpdate
Goods SoldData Update
InventoryFile
« ♦File
Formatted Goods Sold Data
Formatted Inventory Data
1Goods Sold Inventory ^«File File
Daily Goods Sold Amounts
Daily Inventory Dei^etion Amounts
ProduceManagement
Reports
ManagementReports . RESTAURANT
MANAGER
Fig. 6.5 Level-0 DFD of Roop Chand restaurant’s food ordering system.
Notice that the sources/sinks are the same in the context diagram and in this diagram: the customer, the kitchen, and the restaurant’s manager. This diagram is called a level-0 diagram because it represents the primary individual processes in the system at the highest possible level. Each process has a number that ends in .0 (corresponding to the level nvunber of the DFD).
114 Sflf-lnstrucUonal Material -
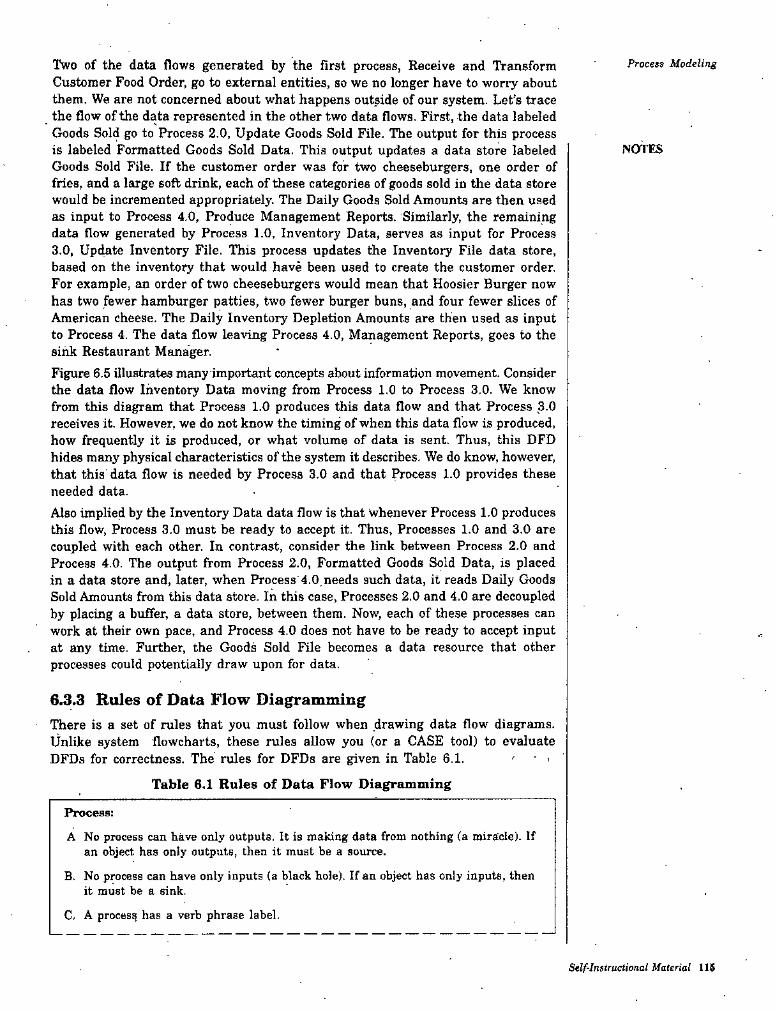
Process ModelingTwo of the data flows generated by the first process, Receive and Transform Customer Food Order, go to external entities, so we no longer have to worry about them. We are not concerned about what happens outside of our system. Let’s trace the flow of the data represented in the other two data flows. First, the data labeled Goods Sold go to Process 2.0, Update Goods Sold File. The output for this process is labeled Formatted Goods Sold Data. This output updates a data store labeled Goods Sold File. If the customer order was for two cheeseburgers, one order of fries, and a large soft drink, each of these categories of goods sold in the data store would be incremented appropriately. The Daily Goods Sold Amounts are then used as input to Process 4.0, Produce Management Reports. Similarly, the remaining data flow generated by Process 1.0, Inventory Data, serves as input for Process 3.0, Update Inventory File. This process updates the Inventory File data store, based on the inventory that would have been used to create the customer order. For example, an order of two cheeseburgers would mean that Hoosier Burger now has two fewer hamburger patties, two fewer burger buns, and four fewer slices of American cheese. The Daily Inventory Depletion Amounts are then used as input to Process 4. The data flow leaving Process 4.0, Management Reports, goes to the sink Restaurant Manager,Figure 6.5 Ulustrates many important concepts about information movement. Consider the data flow Inventory Data moving from Process 1,0 to Process 3,0. We know from this diagram that Process 1.0 produces this data flow and that Process 3.0 receives it. However, we do not know the timing of when this data flow is produced, how frequently it is produced, or what volume of data is sent. Thus, this DFD hides many physical characteristics of the system it describes. We do know, however, that this data flow is needed by Process 3.0 and that Process 1.0 provides these needed data.Also implied by the Inventory Data data flow is that whenever Process 1.0 produces this flow. Process 3.0 must be ready to accept it. Thus, Processes 1.0 and 3.0 are coupled with each other. In contrast, consider the link between Process 2.0 and Process 4.0. The output from Process 2.0, Formatted Goods Sold Data, is placed in a data store and, later, when Process 4.0,needs such data, it reads Daily Goods Sold Amounts from this data store. In this case. Processes 2.0 and 4.0 are decoupled by placing a buffer, a data store, between them. Now, each of these processes can work at their own pace, and Process 4.0 does not have to be ready to accept input at any time. Further, the Goods Sold File becomes a data resource that other processes could potentially draw upon for data.
NOTES
6.3.3 Rules of Data Flow DiagrammingThere is a set of rules that you must follow when drawing data flow diagrams. Unlike system flowcharts, these rules allow you (or a CASE tool) to evaluate DFDs for correctness. The rules for DFDs are given in Table 6.1. ' • <
Table 6.1 Rules of Data Flow Diagramming
Process:
A No process can have only outputs. It is making data from nothing (a miracle). If an object has only outputs, then it must be a source.
B. No process can have only inputs (a black hole). If an object has only inputs, then it must be a sink.
C, A process has a verb phrase label.
Self-Instructional Material 115
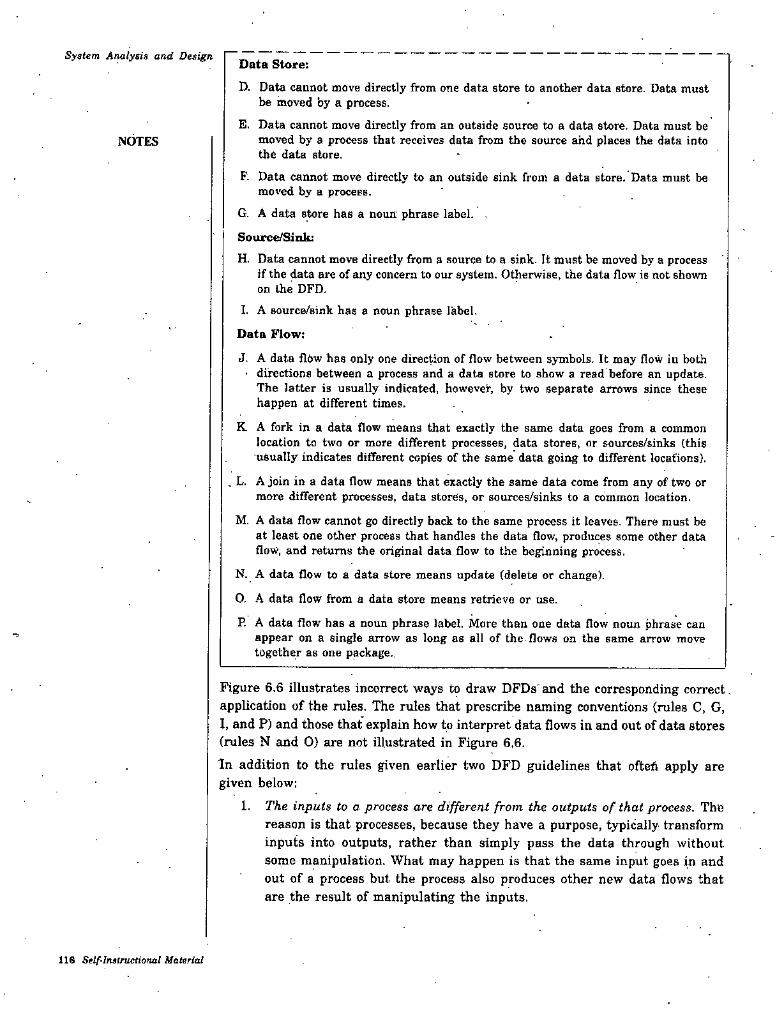
System Analysis and Design Data Store:
D. Data cannot move directly from one data store to another data store. Data must be moved by a process.
E. Data cannot move directly from an outside source to a data store. Data must be moved by a process that receives data from the source ahd places the data into the data store.
F. Data cannot move directly to an outside sink from a data store. Data must be moved by a process.
G. A data store has a noun phrase label. .
Source/Sink:H. Data cannot move directly from a source to a sink. It must be moved by a process
if the data are of any concern to our system. Otherwise, the data flow is not shown on the DFD.
I. A source/sink has a noun phrase label.
Data Flow:
J. A data flow has only one direction of flow between symbols. It may flow in both ' directions between a process and a data store to show a read before an update.
The latter is usually indicated, however, by two separate arrows since these happen at different times.
K A fork in a data flow means that exactly the same data goes from a common location to two or more diflferent processes, data stores, or sources/sinks (this usually indicates different copies of the same data goii^ to different locations).
. L. A join in a data flow means that exactly the same data come from any of two or more different processes, data stores, or sources/sinks to a common location.
M. A data flow cannot go directly back to the same process it leaves. There must be at least one other process that handles the data flow, produces some other data flow, and returns the original data flow to the beginning process.
N. A data flow to a data store means update (delete or change).
O. A data flow from a data store means retrieve or use.
P. A data flow has a noun phrase label. More than one data flow noun phrase can appear on a single arrow as long as all of the flows on the same arrow move together as one package..
NOTES
Figure 6.6 illustrates incorrect ways to draw DFDs' and the corresponding correct. application of the rules. The rules that prescribe naming conventions (rules C, G, I, and P) and those that explain how to interpret data flows in and out of data stores (rules N and 0) are not illustrated in Figure 6,6.
In addition to the rules given earlier two DFD guidelines that oftefi apply are given below;
1. The inputs Co a process are different from the outputs of that process. The reason is that processes, because they have a purpose, typically transform inputs into outputs, rather than simply pass the data through without some manipulation. What may happen is that the same input goes in and out of a process but the process also produces other new data flows that are the result of manipulating the inputs.
116 Self-Instructional Material
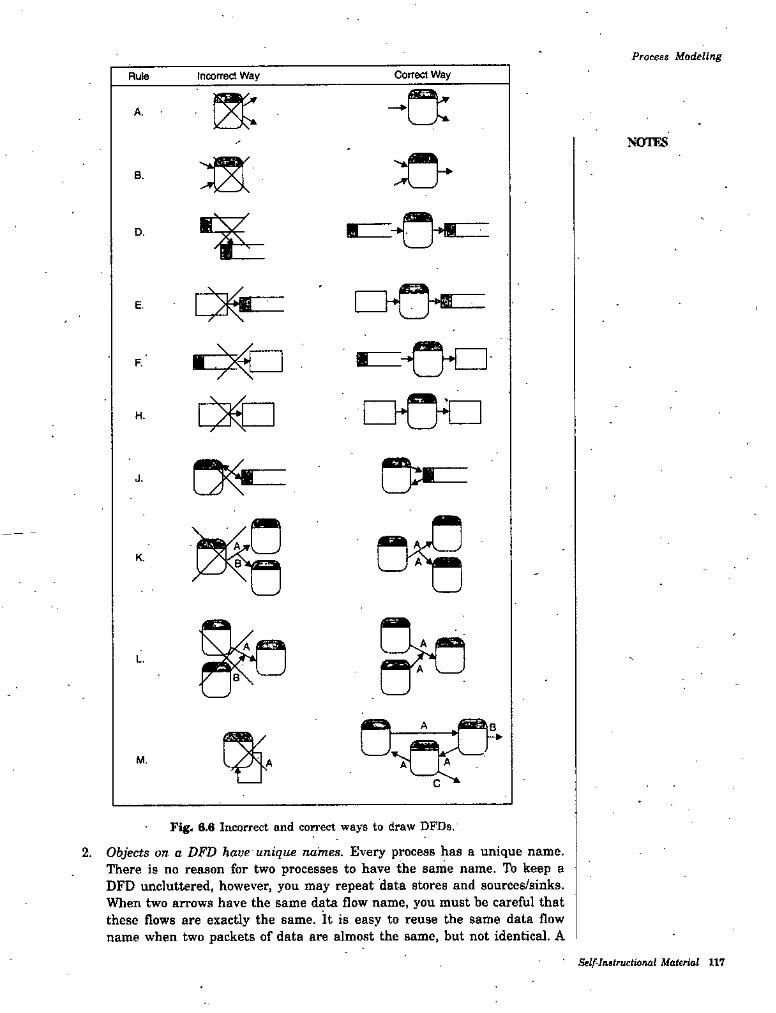
Process Modeling
NOTES
Fig. 6.6 Incorrect and correct ways to draw DFDs.
2. Objects on a DFD have unique names. Every process has a unique name. There is no reason for two processes to have the same name. Tb keep a DFD uncluttered, however, you may repeat data stores and sourcee/sinks. When two arrows have the same data flow name, you must be careful that these flows are exactly the same. It is easy to reuse the same data flow name when two packets of data are almost the same, but not identical. A
Self-Instructional Material 117
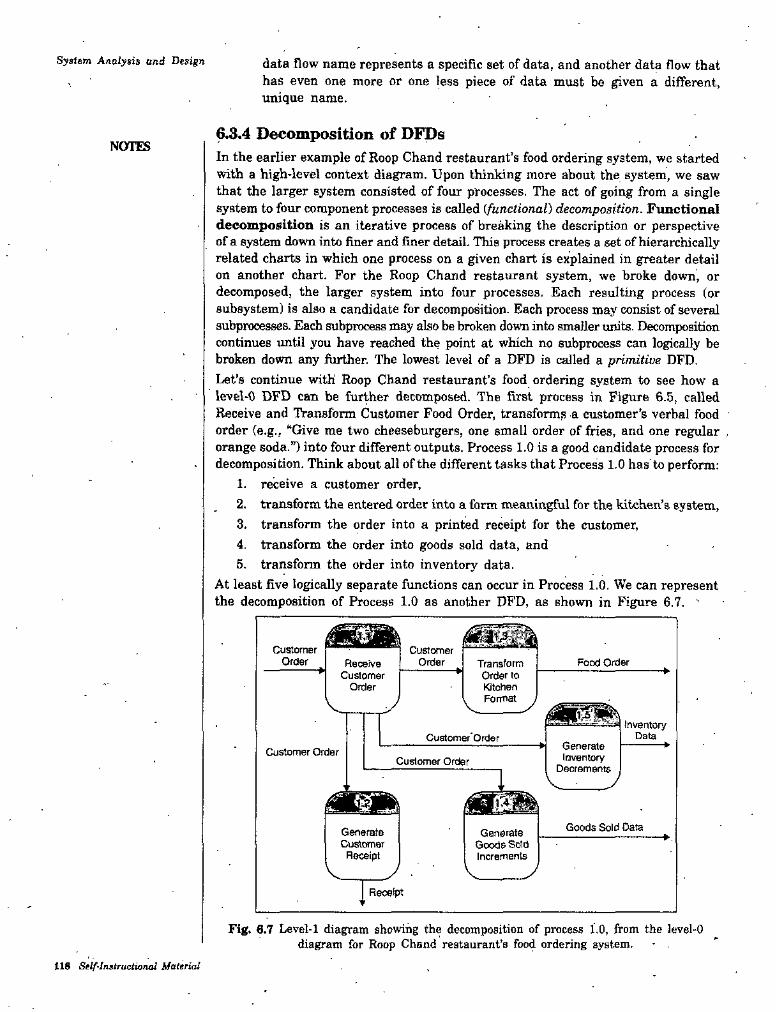
System A/iolysis and Design data flow name represents a specific set of data, and another data flow that has even one more or one less piece of data must be given a different, unique name.
6.3.4 Decomposition of DFDsIn the earlier example of Roop Chand restaurant’s food ordering system, we started with a high-level context diagram. Upon thinking more about the system, we saw that the larger system consisted of four processes. The act of going from a single system to four component processes is called (functional) decomposition. Functional decomposition is an iterative process of breaking the description or perspective of a system down into finer and finer detail. This process creates a set of hierarchically related charts in which one process on a given chart is explained in greater detail on another chart. For the Roop Chand restaurant system, we broke down, or decomposed, the larger system into four processes. Each resulting process (or subsystem) is also a candidate for decomposition. Each process may consist of several subprocessfis. Each subprocess may also be broken down into smaller units. Decomposition continues imtil you have reached the point at which no subprocess can logically be broken down any further. The lowest level of a DFD is called a primitive DFD.Let’s continue with Roop Chand restaurant’s food ordering system to see how a level-0 DFD can be further decomposed. The first process in Figure 6.5, called Receive and Transform Customer Food Order, transforms a customer’s verbal food order (e.g., “Give me two cheeseburgers, one small order of fries, and one regular , orange soda.”) into four different outputs. Process 1.0 is a good candidate process for decomposition. Think about all of the different tasks that Process 1.0 has to perform:
1. receive a customer order,2. transform the entered order into a form meaningful for the kitchen’s system,3. transform the order into a printed receipt for the customer,4. transform the order into goods sold data, and5. transform the order into inventory data.
At least five logically separate functions can occur in Process 1.0. We can represent the decomposition of Process 1.0 as another DFD, as shown in Figure 6.7. ’
NOUS
fr*
CustomerOrder
CustWTierOrder Food OrderReceive
CustomerOrder
Transform Order to Kitc^ien Format
* ♦
yInventory
DataCustomer'OrderGenerateInventory
DecrementsCustomer Order
Customer Order
3,4:1
Goods Sold DataGener^eCustomer
Receipt
Generate Goods Sold Increments
y .Receipt
Fig. 8.7 Level-l diagram showing the decomposition of process 1,0, from the level-0 diagram for Roop Chand restaurant's food ordering system.
118 Self-Inalructiona! Material
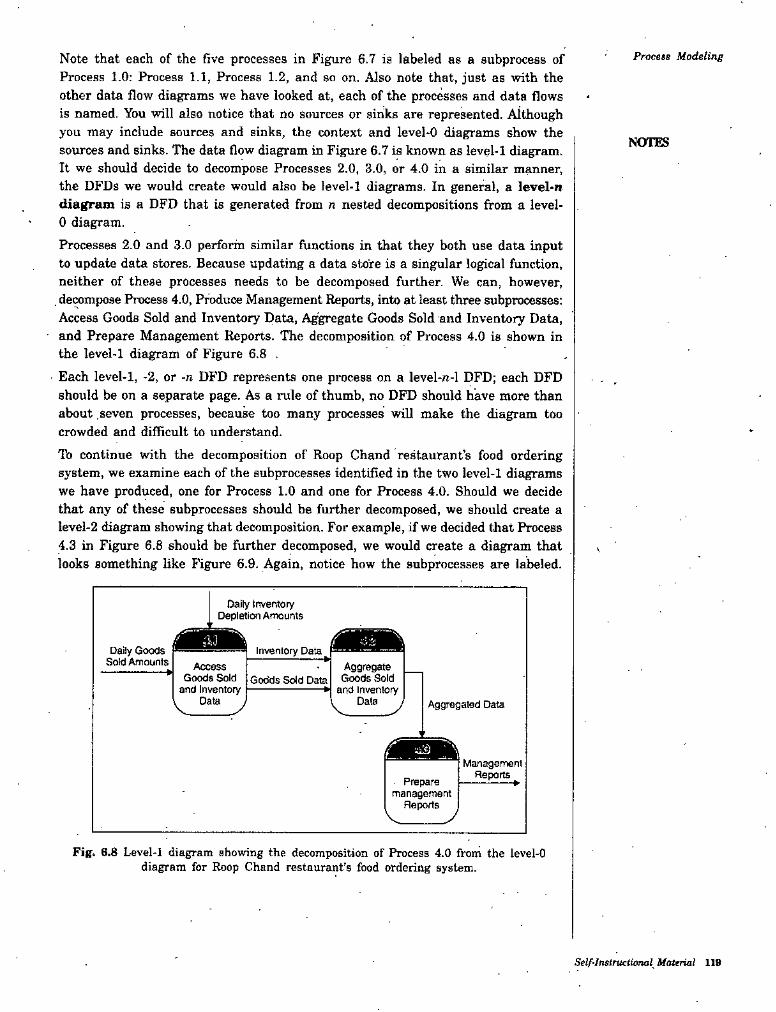
Process ModelingNote that each of the five processes in Figure 6.7 is labeled as a subprocess of Process 1.0: Process 1.1, Process 1.2, and so on. Also note that, just as with the other data flow diagrams we have looked at, each of the processes and data flows is named. You will also notice that no sources or siiiks are represented. Although you may include sources and sinks, the context and level-0 diagrams show the sources and sinks. The data flow diagram in Figure 6.7 is known as level-1 diagram. It we should decide to decompose Processes 2.0, 3.0, or 4.0 in a similar manner, the DFDs we would create would also be level-1 diagrams. In general, a level*n diagram is a DFD that is generated from n nested decompositions from a level- 0 diagram.Processes 2.0 and 3.0 perform similar functions in that they both use data input to update data stores. Because updating a data store is a singular logical function, neither of these processes needs to be decomposed further. We can, however,
. decompose Process 4.0, Produce Management Reports, into at least three subprocesses: Access Goods Sold and Inventory Data, Aggregate Goods Sold and Inventory Data,
• and Prepare Management Reports. The decomposition of Process 4.0 is shown in the level-1 diagram of Figure 6.8 .Each level-1, -2, or -n DFD represents one process on a level-n-l DFD; each DFD should be on a separate page. As a rule of thumb, no DFD should have more than about seven processes, because too many processes will make the diagram too crowded and difficult to understand.Tb continue wnth the decomposition of Roop Chand restaurant’s food ordering system, we examine each of the aubprocesses identified in the two level-1 diagrams we have produced, one for Process 1.0 and one for Process 4.0. Should we decide that any of these subprocesses should be further decomposed, we should create a level-2 diagram showing that decomposition. For example, if we decided that Process 4.3 in Figure 6.8 should be further decomposed, we would create a diagram that looks something like Figure 6.9. Again, notice how the subprocesses are labeled.
NOTES
Daily Inventory DepletiOT Amounts
r-'13Daily Goods
Sold AmountsInventory Data^
Access Goods Sold
and Inventory
Aggregate Goods SoldGodds Sold Data
and InventoryData Data Aggregated Data
ManagementReports. Prepare
management Reports
Fig. 6.8 Level-1 diagram showing the decomposition of Process 4.0 from the level-0 diagram for Roop Chand restaurant’s food ordering system.
Self-Inslruclional Material IIS
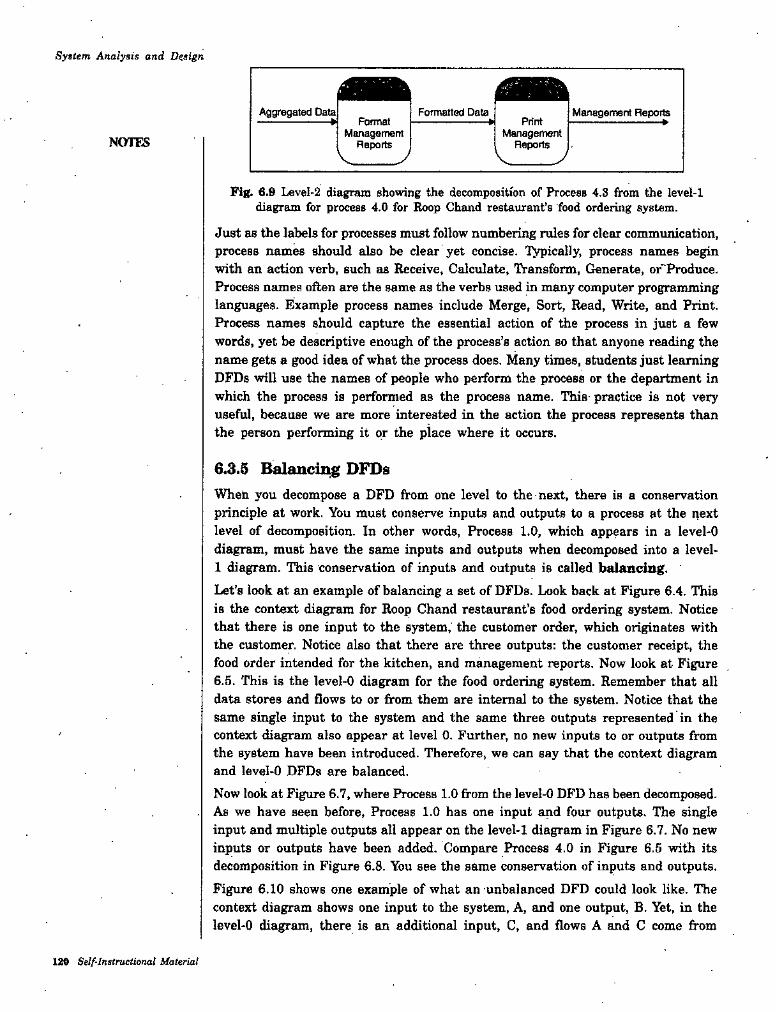
Sy$lem Analysis and Design
Aggregated Data Formatted Data Management ReportsFormatManagement
Reports
Print*Management
ReportsNOTES
Fig. 6.9 LeveI-2 diagram showing the decomposition of Process 4.S from the level-1 diagram for process 4.0 for Roop Chand restaurant’s food ordering system.
Just as the labels for processes must follow numbering rules for clear communication, process names should also be clear yet concise, lypically, process names begin with an action verb, such as Receive, Calculate, IVansform, Generate, or'Produce. Process names often are the same as the verbs used in many computer programming languages. Example process names include Merge, Sort, Read, Write, and Print. Process names should capture the essential action of the process in just a few words, yet be descriptive enough of the process’s action so that anyone reading the name gets a good idea of what the process does. Many times, students just learning DFDs will use the names of people who perform the process or the department in which the process is performed as the process name. This- practice is not very useful, because we are more interested in the action the process represents than the person performing it or the place where it occurs.
6.3.5 Balancii^ DFDsWheti you decompose a DFD from one level to the next, there is a conservation principle at work. You must conserve inputs and outputs to a process at the next level of decomposition. In other words. Process 1.0, which appears in a level-0 diagram, must have the same inputs and outputs when decomposed into a level- 1 diagram. This conservation of inputs and outputs is called balancing.Let’s look at an example of balancing a set of DFDs. Look back at Figure 6.4. 'This is the context diagram for Roop Chand restaurant’s food ordering system. Notice that there is one input to the system, the customer order, which originates with the customer. Notice also that there are three outputs: the customer receipt, the food order intended for the kitchen, and management reports. Now look at Figure 6.5. This is the IeveI-0 diagram for the food ordering system. Remember that all data stores and flows to or from them are internal to the system. Notice that the same single input to the system and the same three outputs represented in the context diagram also appear at level 0. Further, no new inputs to or outputs from the system have been introduced. Therefore, we can say that the context diagram and leveI-0 DFDs are balanced.Now look at Figure 6.7, where Process 1.0 from the level-0 DFD has been decomposed. As we have seen before. Process 1.0 has one input and four outputs. The single input and multiple outputs all appear on the level-1 diagram in Figure 6.7. No new inputs or outputs have been added. Compare Process 4.0 in Figure 6.5 with its decomposition in Figure 6.8. You see the same conservation of inputs and outputs.Figure 6.10 shows one example of what an unbalanced DFD could look like. The context diagram shows one input to the system, A, and one output, B. Yet, in the level-0 diagram, there is an additional input, C, and flows A and C come from
X20 Self-Instructional Material
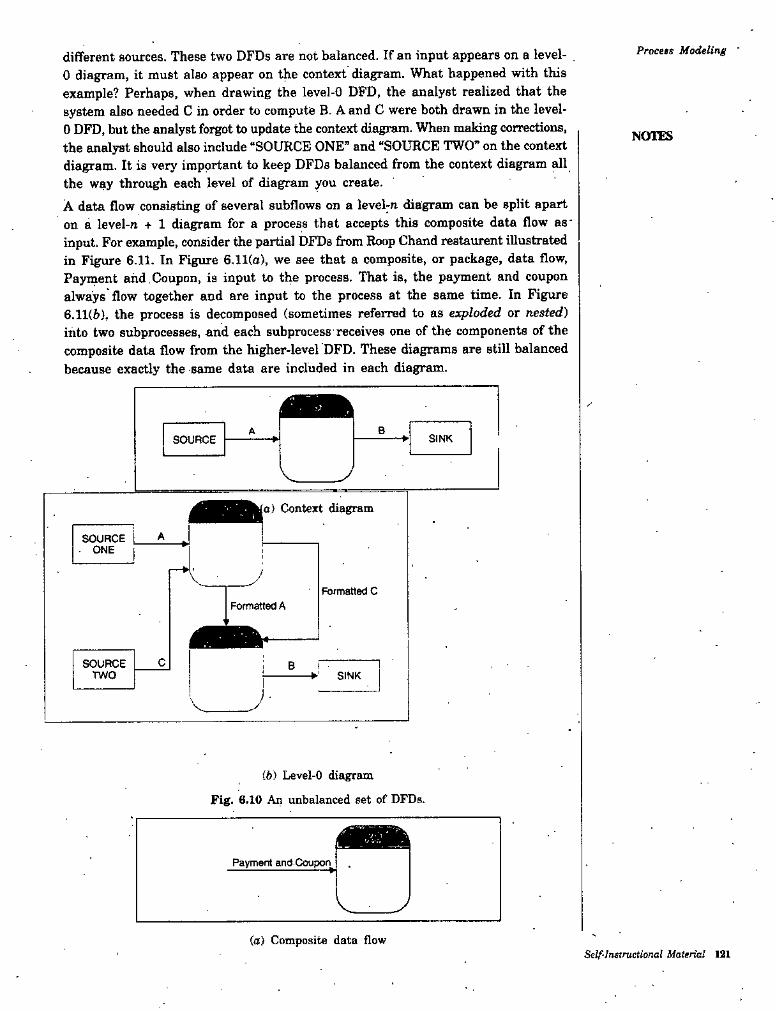
Procets Modelingdifferent sources. These two DFDs are not balanced. If an input appears on a level- , 0 diagram, it must also appear on the context diagram. What happened with this example? Perhaps, when drawing the level-0 DFD, the analyst realized that the system also needed C in order to compute B. A and C were both drawn in the level- 0 DFD, but the analyst forgot to update the context diagram. When making corrections, the eLnal)rst should also include “SOURCE ONE” and “SOURCE TWO” on the context diagram. It is very important to keep DFDs balanced from the context diagram all the way through each level of diagram you create.A data flow consisting of several subflows on a level-n. diagram can be split apart on a level-ra + 1 diagram for a process that accepts this composite data flow as' input. For example, consider the partial DFDs from Roop Chand restaurant illustrated in Figure 6.11. In Figure 6.11(o), we see that a composite, or package, data flow. Payment and Coupon, is input to the process. That is, the payment and coupon always flow together and are input to the process at the same time. In Figure 6.11(6), the process is decomposed (sometimes referred to as exploded or nested) into two subprocesses, and each subprocess receives one of the components of the composite data flow from the higher-level DFD. These diagrams are still balanced because exactly the same data are included in each diagram.
NOUS
BASINKSOURCE ♦
a) Context diagram
ASOURCE . ONE
Formatted CFormatted A
CSOURCE BTWO V SINK
(6) Level-0 diagram
Fig. 6.10 An unbalanced set of DFDs.
Payment and Coopon
V
(a) Composite data flowStlf-Ineiruetional Material 121
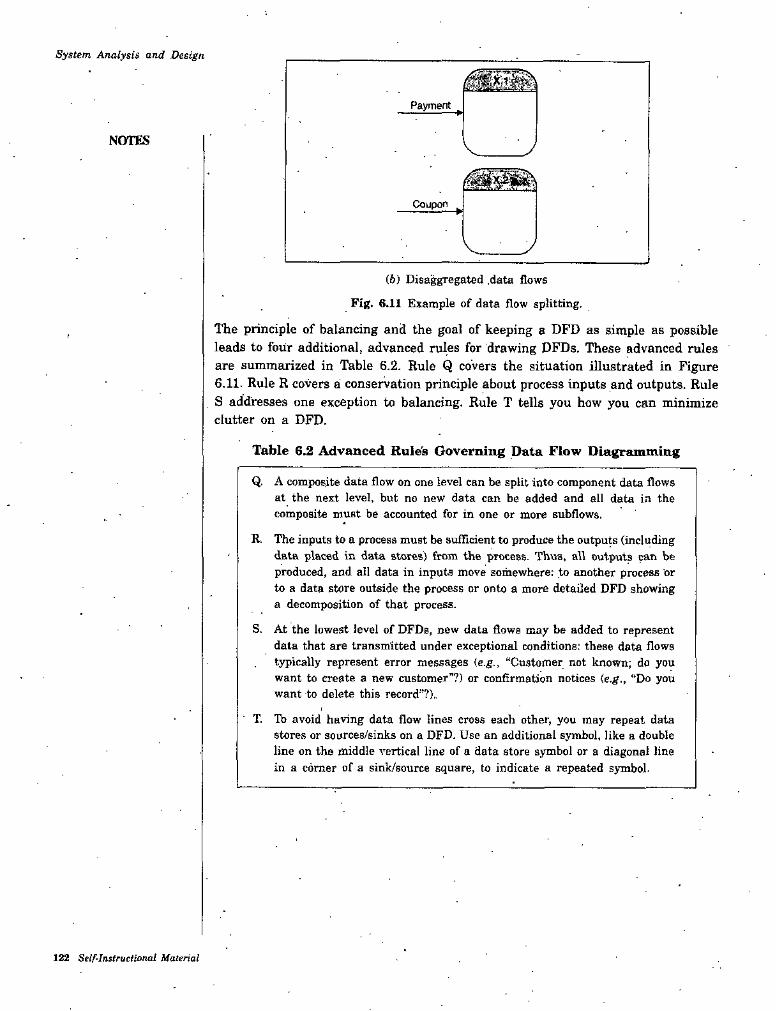
System Analysis and Design
Payment
NOTES
Coupon >
(6) Disaggregated .data flows
Fig. 6.11 Example of data flow splitting.
The principle of balancing and the goal of keeping a DFD as simple as possible leads to four additional, advanced rules for drawing DFDs. These advanced rules are summarized in Table 6.2. Rule Q covers the situation illustrated in Figure 6.11. Rule R covers a conservation principle about process inputs and outputs. Rule S addresses one exception to balancing. Rule T tells you how you can minimize clutter on a DFD.
Table 6.2 Advanced Rule's Governing Data Flow Diagramming
Q A composite data flow on one level can be split into component data flows at the next level, but no new data can be added and all data in the composite must be accounted for in one or more subflows.
The inputs to a process must be sufficient to produce the outputs (including data placed in data stores) from the process. Thus, all outputs can be produced, and ail data in inputs move somewhere: to another process or to a data store outside the process or onto a more detailed DFD showing a decomposition of that process.
At the lowest level of DFDs, new data flows may be added to represent data that are transmitted under exceptional conditions: these data flows typically represent error messages ie.g., “Customer not known; do you want to create a new customer"?) or confirmation notices (e.g., “Do you want to delete this record”?),.
To avoid having data flow lines cross each other, you may repeat data stores or sources/sinks on a DFD. Use an additional symbol, like a double line on the middle vertical line of a data store symbol or a diagonal line in a comer of a sink/source square, to indicate a repeated symbol-
R.
S.
• T.
122 Self-Inslruclional Material

Process Modeling
STUDENT ACTIVITY 6.1
1. What is the purpose of process modeling? What are the inputs to and deliverables from process .modeling in structured analysis.
2. What is a data flow diagram? What characteristics and functions of data in information systems are modeled by DFD? Why do systems analysts use DFDs?
Self-Instructional Material 123
System Analysis and Design6.4 TYPES OF DFDsFour different types of data flow diagrams are used in the systems development process ;
(1) Current physical(2) Current b)gical(3) New logical, and(4) New physical
When structured analysis and design was first introduced in the late 1970s, it was argued that system analysts should prepare all four types of DFDs in the order given above.
(1) Current physical. In a current physical DFD, process labels include the names of people or their positions or the names of computer systems that might provide some of the overall system’s processing. That is, the label includes an identification of the “technology” used to process the data. Similarly, data flows and data stores are often labeled with the names of the actual physical media on which data flow or in which data are stored, such as file folders, computer files, business forms, or computer tapes.
(2) Current logical. For the current logical model, the physical aspects of the systf-n are removed as much as possible so that the current system is reduced to its essence, to the data and the processes that transform them, regardless of the system’s actual physical form.
(3) New logical. The new logical model would be exactly like the current logical model if the user were completely happy with the functionality of the current system but had problems with how it was implemented. Typically, though, the new logical model will differ from the current logical model by having additional functions. In addition, obsolete functions will have been . removed and inefficient flows reorganized.
(4) New physical. The DFDs for the new physical system represent the physical implementation of the new system. The DFDs for the new physical system will reflect the analyst’s decision about which system functions, including those added in the new logical model, will be automated and which will be manual.
Experts used to recommend that all four levels of DFDs be constructed based on the following three assumptions.
(j) Analysts knew little about the user’s business and needed to develop' a detailed current physical DFD in order to understand the user’s business.
(if) Users were not able to work with a new logical DFD right away.(Hi) Little work is needed to turn current logical DFDs into new logical DFDs.
The above three assumptions proved to be correct but overlooked a greater danger. Analysts tended to devote a great deal of time to creating and refining a detailed set of DFDs for the current physical system, most of which was thrown away in the transition of the current logical DFDs.
NOTES
124 Self-Instructionai Materiai
PrtJCMs Modeling6.5 USING DATA FLOW DIAGRAMMING IN THE ANALYSIS PROCESS
Learning the mechanisms of drawing DFDs is important, because DFDs have proven to be essential tools for the structured analysis process. In addition to drawing mechanically correct DFDs, there are some other important issues related to- process modeling which are of prime concern for an analyst. These issues include : whether the DFDs are complete and consistent across all levels, how you can use DFDs as a useful tool for systems analysis.
NOTES
6.5.1 Guidelines for Drawing DFDsWe have already studied the simple mechanics of drawing diagrams and making sure that the rules listed in Tables 6.1 and 6.2 are followed. Let us consider some additional guidelines as given below:
(1) Completeness
i"u Consistency(3) Timing considerations(4) The iterative nature of drawing DFDs, and(5) Primitive DFDs
1. Completeness
The concept of DFD completeness refers to whether you have in your DFDs all of the components necessary for the system you are modeling. If your DFD has data flows that do not lead anywhere or data stores, processes, or external entities that are not connected to anything else, your DFD is not complete. Most CASE tools have built-in facilities that you can run to help you determine if your DFD is incomplete. When you draw many DFDs for a system, it is not uncommon to make
■ errors. CASE tool analysis functions or walk through with other analysts can help you identify such problems.
2. ConsistencyThe concept of DFD consistency refers to whether or not the depiction of the system shown at one level of a nested set of DFDs is compatible with the depictions of the system shown at other levels. A gross violation of consistency would be a level-1 diagram with no level-0 diagram. Another example of inconsistency would be a data flow that appears on a higher-level DFD but not on lower levels (also
. a violation of balancing). Yet another example of inconsistency is a data flow attached to one object on a lower-level diagram but also attached to another object at a higher level; for example, a data flow named Payment, which serves as input to Process 1 on a level-0 DFD, appears as input to Process 2.1 on a level-1 diagram for Process 2.CASE tools also have analysis facilities that you can use to detect such inconsistencies across nested data flow diagrams. For example, when you draw a DFD using a CASE tool, most tools will automatically place the inflows and outflows of a process on the DFD you create when you inform the tool to decompose that process. In
Self-lnstrurtionul tlalfrial 12B .
System Analysis and Design manipulating the lower-level diagram, you could accidentally delete or change adata flow that would cause the diagrams to be out of balance; thus, a consistency- check facility with a CASE tool is quite helpful.
3. TimingNOTK
You may have noticed in some of the DFD examples presented in this Unit that DFDs do not do a very good job of representing time. On a given DFD, there is no indication of whether a data flow occurs constantly in real time, once per week, or once per year. There is also no indication of when a system would run. For example, many large transaction-based systems may run several large, computingintensive jobs in batch mode at night, when demands on the computer system are lighter A DFD has no way of indicating such overnight batch processing. When you draw DFDs, then, draw them aS if the system you are modeling has never started and will never stop.
4. Iterative DevelopmentThe first DFD you draw will rarely capture perfectly the system you are mode ling. You should count on drawing the same diagram over and over again, in an itera ive fashion. With each attempt, you will come closer to a good approximation of the system or aspect of the system you are modeling. Iterative DFD development recognizes that requirements determination and requirements structuring are interacting, not sequential, subphases of the analysis phase of the SDLG.One rule of thumb is that it should take you about three revisions for each DFD you draw. Fortunately, CASE tools make revising drawings a lot easier than it would be if you had to draw each revision with a pencil and a template.
5. Primitive DFDsOne of the more difficult decisions you need to make when drawing DFDs is when to stop decomposing processes. One rule is to stop drawing when you have reached the lowest logical level; however, it is not always easy to know what the lowest logical level is. Other more concrete rules for when to stop decomposing are given below ;
• When you have reduced each process to a single decision or calculation or to a single database operation, such as retrieve, update, create, delete, or read.
• When each data store represents data about a single entity, such as a customer, employee, product, or order.
• When the system user does not care to see any more detail or when the systems analysts have documented sufficient detail to do subsequent systems development tasks.
• When every data flow does not need to be split further to show that different data are handled in different ways,
• When you believe that you have shown each business form or transaction, computer online display, and report as a single data flow (this often means, for example, that each system display and report title corresponds to the name of an individual data flow). -
126 Self-Instructional Material
Process Modeling• When you believe there ia a separate process for each choice on all lowest- level menu options for the system.
Obviously, the iteration guideline discussed earlier and the various feedback loops in the SDLC fSee figure 6.1) suggest that when you think you have met the rules
' for stopping, you may later discover nuances to the system that require you to further decompose a set of DFDs. ‘By the time you stop decomposing a DFD, it may be quite detailed. Seemingly simple actions, such as generating an invoice, may pull information from several entities and may also return different results depending on the specific situation. For example, the final form of an invoice may be based on the type of customer (which would determine such things as discount rate), where the customer lives (which would determine such things as sales tax), and how the goods are shipped (which would determine such things as the shipping and handling charges). At the lowest-level DFD, called a primitive DFD, all of these conditions would have to be met. Given the amount of detail called for in a primitive DFD, perhaps you can see why many experts believe analysts should not spend their tim'j completely diagramming the current physical information system because
. m .ch of the detail will be discarded when the current logical DFD is created.Using the guidelines presented in this section will help you to create DFDs that are more than just mechanically correct. Your data flow diagrams will also be
, robust and accurate representations of the information system you are modeling. Primitive DFDs also facilitate consistency checks with the documentation produced from other requirements structuring techniques and also* makes it easy for you to transition to system design steps. Having mastered the skills of drawing good DFDs, you can now use them to support the analysis process.
NOTES
Material 187

Svxfcm Analysis and Design
STUDENT ACTIVITY 6.2
1. What are the differences between new logical and new physical DFDs ?
2. How can DFDs be used as systems analysis tools ?
128 Se/r-l’‘s!ructional-MeteriaJ
Process ModelingSUMMARY
* Data flow diagram is a picture of the movement of data between external entities and the processes and data stores within a system.
• A data store is data at rest, which may take the form of many different physical representations.
♦ Process is the work or actions performed on data so that they are transformed, stored, or distributed.
* CoDtezt diagram is an overview of an organizational system that shows the system boundary, external entities that interact with the system, and the major information flows between the entities and the system.
* Functional decomposition is an iterative process of breaking the description of a system down into finer and finer detail, which creates a set of charts in which one process on a given chart is explained in greater detail on another chart.
N * DFD completeness is the extent to which all necessary components of a• data flow diagram have been included and fully described.
• DFD consistency is the extent to which information contained on one level of a set of nested data flow diagrams is also included on other levels.
• Primitive DFD is the lowest level of decomposition for a data flow diagram.* Gap analysis is the process of discovering discrepancies between two or
more sets of data flow diagrams or discrepancies within a single DFD.
NOTES
TEST YOURSELFAnswer the following questions:
1. List down the various tools for modeling processes of an information system.2. Give examples of unbalanced set of DFDs.3. Explain the rules for drawing good DFDs. What are the don’ts that need to
be followed while drawing DFDs?4. What is decomposition? What is balancing? How can you determine if DFDs
are not balanced? What would be the consequences if we use DFDs that are not balanced?
5. Compare data flow diagrams with context diagrams with an example.
6. What are the different types of DFDs used in the system development process ? List. -
7. What are the primary differences between current physical and current logical DFDs ?
8. State True or False:(i) Data flow diagram is a picture of the movement of data between external
entities and the processes that data stores within a system.(it) A data store is data not at rest.
(iii) Level‘0 diagram is a data flow diagram that represents a system’s major processes, data flows, and data stores at a high level of detail.
(iv) Balancing is the conservation of inputs and outputs to a DFD process when that process is decomposed to a lower level.
Self-Instructional Material 129
(t!) Four different types of DFDs that are used in systems development process are : current physical, current logical, new logical and new physical.
(i>() DFD consistency is the extent to which information contained on. one level of a set of nested DFDs is also included on other levels.
9. Fill in the blanks:
System Analysis and Design
NOTES
.................... involves graphically representing the functions or process,that capture, manipulate, store, and distribute data between a system and its environment and between components within a system.
is the work or actions performed on data so that they are transformed, stored, or distributed...................... is an overview of an organizational system that showsthe system boundaries, external entities that interact with the system, and the major information flows between the entities and the system...................... is an iterative process of breaking the description of asystem down into finer and finer detail, which creates a set of charts in which one process on a given chart is explained in greater detail on another, chart.
(t)
(«) A
(Ui)
Uv)
..................... is the extent to which all necessary components of aDFD have been included and fully described..................... is the process of discovering discrepancies between twoor more sets of DFDs or discrepancies within a single DFD.
................... DFD is the lowest level of decomposition for a data flow
{v)
;{w)
ivii)diagram....................... is the extent to which information contained on onelevel of a set of nested data flow diagrams is also included on other- levels.
(otu)
ANSWERSTest Yourself
8. State True or False:(t) True
(ui) True ' iv) True
9. Fill in the blanks:(i) Process modeling
(iti) Context diagram (a) DFD completeness
(ati) Primitive
(it) False (ia) True (vi) True
(it) process(ia) Functional decomposition (ai) Gap analysis
(atii) DFD consistency
ISO Self-Instructional Material
Logic ModelingCHAPTER
7NOTES
LOGIC MODELING
LEARNING OBJECTIVES7.1 • Introduction7.2 Logic Modeling
7.2.1 Modeling a System’s Logic7.2.2 Deliverables and Outcomes
7.3 .Data Dictionaries7.4 Logic Modeling Using Structured English7.5 Logic Modeling Using Decision Tables7.6 Logic Modeling Using Decision Trees7.7 Deciding Among Structured English, Decision Tables, and Decision
Trees
7.1 INTRODUCTIONIn chapter 6, you learned how the processes that convert data to information are key parts of information systems. As good as data flow diagrams (DFDs) are for identifying processes, they are not very good at showing the logic inside the processes. The processes on the primitive-level DFDs do not show even the most fundamental processing steps. Just what occurs within a process? How are the input data converted into output information? Because DFDs are not really designed to show the detailed logic of processes, you must model process logic using other techniques. In this unit, you will learn techniques for modeling process decision logic.First of all, you will be introduced to Structured English, a modified version of English language that is useful for representing the logic in information, system processes. You can use Structured English to represent all three of the fundamental statements necessary for structured programming: sequence, selection (choice) and repetition (iteration or loop) given in Figure 7.1.In the sequence control structure, one program statement- follows another in logical order.
• The selection control structure—also known, as an IF-THEN-ELSE structure— represents a choice. It offers two paths to follow when a decision must be made by a program.
Self-Instructional Material 131
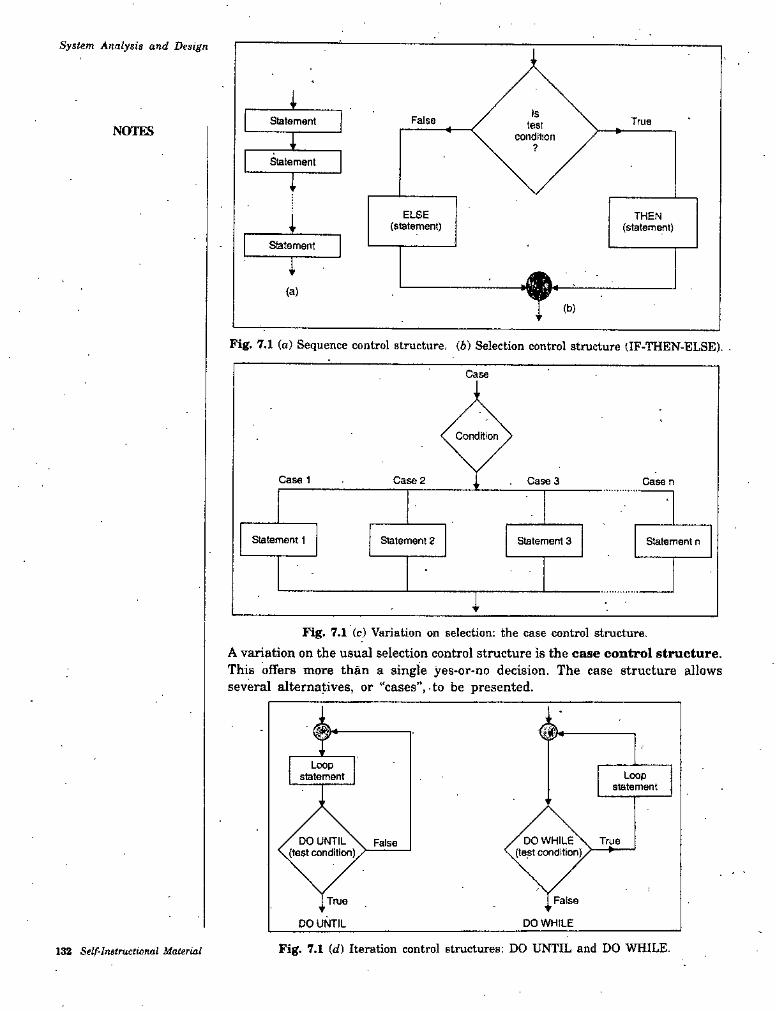
System Analysis and Design
Statement False TrueNOTES I
Statement
ELSE(statement)
THEN(statement)i
Statement
(a)(b)
Fig. 7.1 (o) Sequence control structure, (b) Selection control structure (IF-THEN-ELSE). .
Case 1 Case n
Statement 1 Statement n
Fig. 7.1 (c) Variation on selection: the case control structure,A variation on the usual selection control structure is the case control structure. This offers more than a single yes-or-no decision. The case structure allows several alternatives, or “cases”, to be presented.
w
DO VWILEDO UNTIL
Fig. 7.1 (d) Iteration control structures: DO UNTIL and DO WHILE.132 Self-Instructional Material
Logic ModelingIn the repetition (iteration or loop) control structure, a statement may be repeated as long as a certain condition reniains true.Second, you will learn about decision tables. Decision -tables allow you to represent a set of conditions and the actions that follow from them in a tabular format. When there are several conditions and several possible actions that can occur, decision tables can help you keep track of the possibilities in a clear and concise way.Third, you will learn how to model the logic of choice statements using decision trees. Decision trees model the same elements as a decision table, but in a more graphical manner.Finally after reviewing these three techniques, you will learn when to use Structured English, decision tables, and decision trees. This unit presents criteria you can use to choose among these three logic modeling techniques.
NOTES
7.2 LOGIC MODELINGIn unit-6, you learned how the requirements for an information system are collected. Systems analysts structure the requirements information into data flow diagrams that model the flow of data into and through the information system. Data flow diagrams, though versatile and powerful techniques, are not adequate for modeling all of the complexity of an information system. Although decomposition allows you to represent a data flow diagram’s processes at finer and finer levels of detail, the process names themselves cannot adequately represent what a process does and how it does it. For that reason, you must represent the logic contained in the . process symbols on DFDs with other modeling techniques.Logic modeling involves representing the internal structure and functionality
. of the processes represented on data flow diagrams. These processes appear on DFDs as little more than black boxes; we cannot tell from their names or CASE repository descriptions precisely what they do and how they do it. Yet the structure and functionality of a system's processes are a key element of any information system. Processes must be clearly described before they can be translated into a programming language. In this unit, we will focus on techniques you can use during the analysis phase to model the logic wdthin processes; that is, data-to- information transformations and decisions. In the analysis phase, logic modeling will be complete and reasonably detailed, but it will also be generic in that it will not reflect the structure or syntax of a particular programming language. You will, focus on more precise, language-based logic modeling in the design phase of the system development life cycle.
7.2.1 Modeling a System’s LogicThe two subphases of systems analysis are requirements determination and requirements structuring (Figure 7.2). Modeling a system’s logic is part of requirements structuring, just as was representing the system with data flow diagrams. Here, our focus is on the processes pictured on the data flow diagrams and the logic contained within each process. You can also use logic modeling to indicate when processes on a DFD occur (e.g., when a process extracts a certain data flow from a given data store). Just as we use logic modeling to represent the logic contained in a data flow diagram’s processes, we will use data modeling to represent the contents and structure of a data flow diagram’s data flows and data stores.
Self-Instructional Material 183
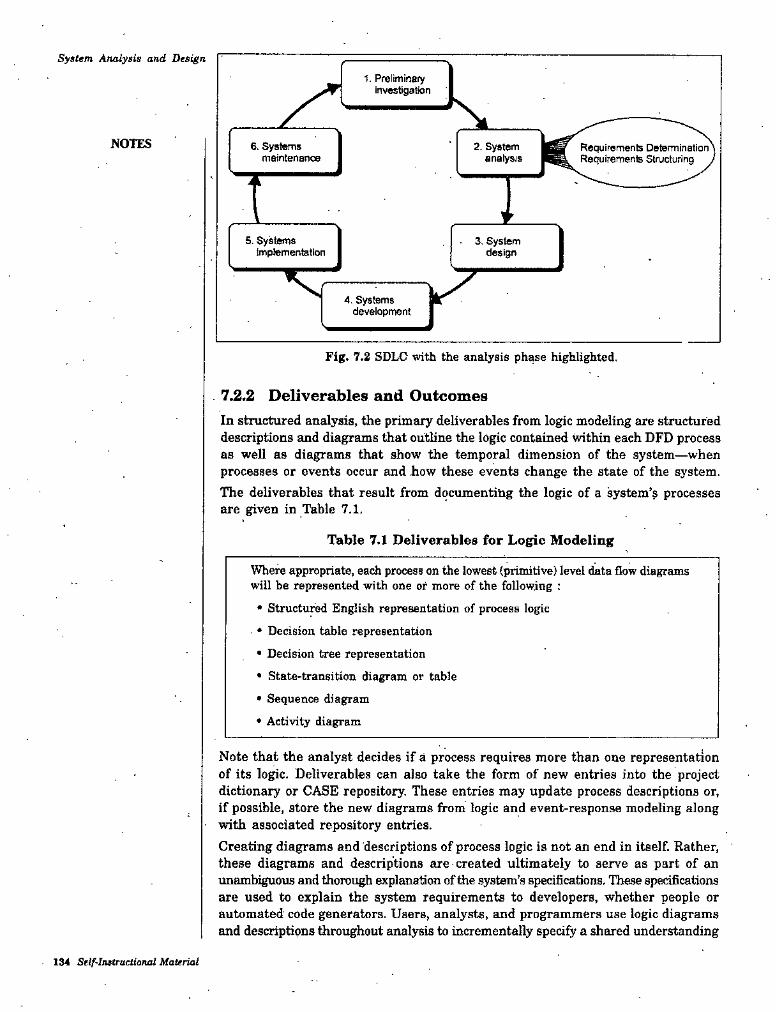
System Analysis and Des^n
1. Preliminary investigation
NOTES 6. Systems meintenancs
2, System analysis
Requirements Determination Requiremente Structuring
I5. Systems
Implementation3. System
design
r4. Systems development
Fig. 7.2 SDLC with the analysis phase highlighted.
7^.2 Deliverables and OutcomesIn structured analysis, the primary deliverables from logic modeling are structured descriptions and diagrams that outline the logic contained within each DFD process as well as diagrams that show the temporal dimension of the system—when processes or events occur and how these events change the state of the system. The deliverables that result from documenting the logic of a system’? processes are given in Table 7.1.
Table 7.1 Deliverables for Logic Modeling
Where appropriate, each process on the lowest (primitive) level data flow diagrams will be represented with one of more of the following :• Structured English representation of process logic
• Decision table representation• Decision tree representation
• State-transition diagram or table• Sequeirce diagram
• Activity diagram
Note that the analyst decides if a process requires more than one representation of its logic. Deliverables can also take the form of new entries into the project dictionary or CASE repository. These entries may update process descriptions or, if possible, store the new diagrams from logic and event-response modeling along with associated repository entries.Creating diagrams and descriptions of process logic is not an end in itself. Rather, these diagrams and descriptions are created ultimately to serve as part of an unambiguous and thorough explanation offrie system’s specifications. These specifications are used to explain the system requirements to developers, whether people or automated code generators. Users, analysts, and programmers use logic diagrams and descriptions throughout analysis to incrementally specify a shared understanding
134 Self-Iastructianal Material
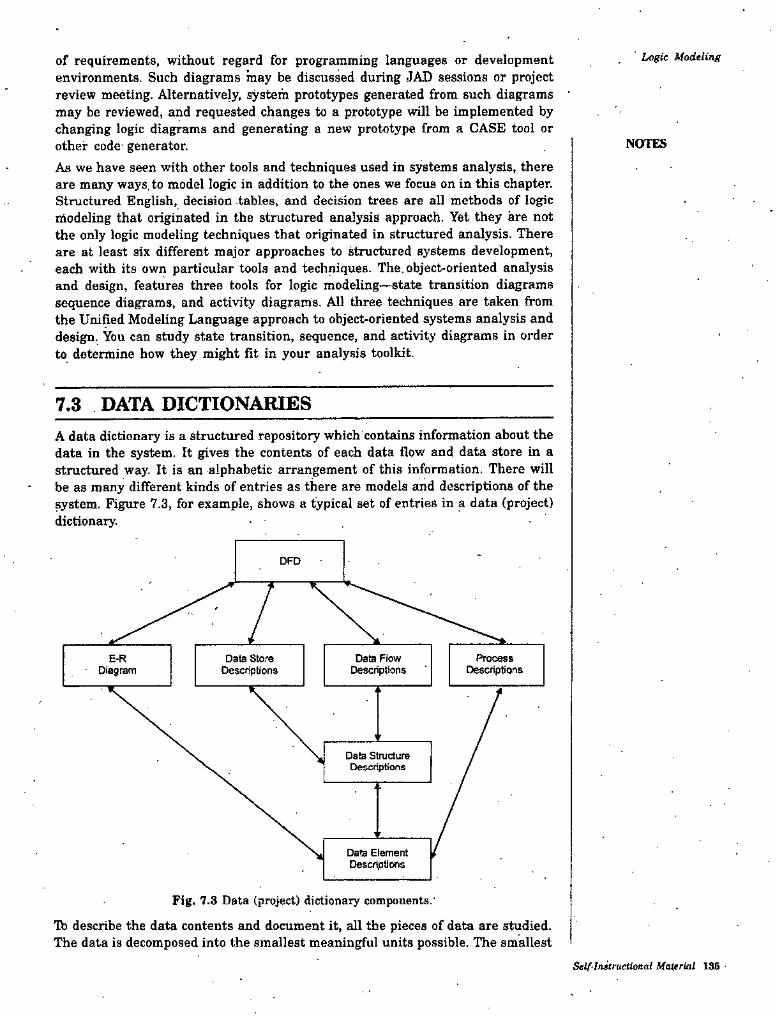
Logic Modelingof requirements, without regard for programming languages or development environments- Such diagrams inay be discussed during JAD sessions or project review meeting. Alternatively, system prototypes generated from such diagrams may be reviewed, and requested changes to a prototype will be implemented by changing logic diagrams and generating a new prototype from a CASE tool or other code generator.As we have seen with other tools and techniques used in systems analysis, there are many ways, to model logic in addition to the ones we focus on in this chapter. Structured English, decision tables, and decision trees are all methods of logic modeling that originated in the structured analysis approach. Yet they are not the only logic modeling techniques that originated in structured analysis. There are at least six different major approaches to structured systems development, each with its own particular tools and techniques. The. object-oriented analysis and design, features three tools for logic modeling—state transition diagrams sequence diagrams, and activity diagrams. All three techniques are taken from the Unified Modeling Language approach to object-oriented systems analysis and design. You can study state transition, sequence, and activity diagrams in order to determine how they might fit in your analysis toolkit.
NOTES
7.3 DATA DICTIONARIESA data dictionary is a structured repository which contains information about the data in the system. It gives the contents of each data flow and data store in a structured way. It is an alphabetic arrangement of this information. There will be as many different kinds of entries as there are models and descriptions of the system. Figure 7.3, for example, shows a typical set of entries in a data (project) dictionary.
Data Store Descriptions
Data Flow Descriptions
ProcessDescriptions
E-RDiagram
Data Structure Descriptions
Data Element Descriptions
Fig. 7.3 Data (project) dictionary components.'
Tb describe the data contents and document it, all the pieces of data are studied. The data is decomposed into the smallest meaningful units possible. The smallest
Setf-lnitructiona! Material 136
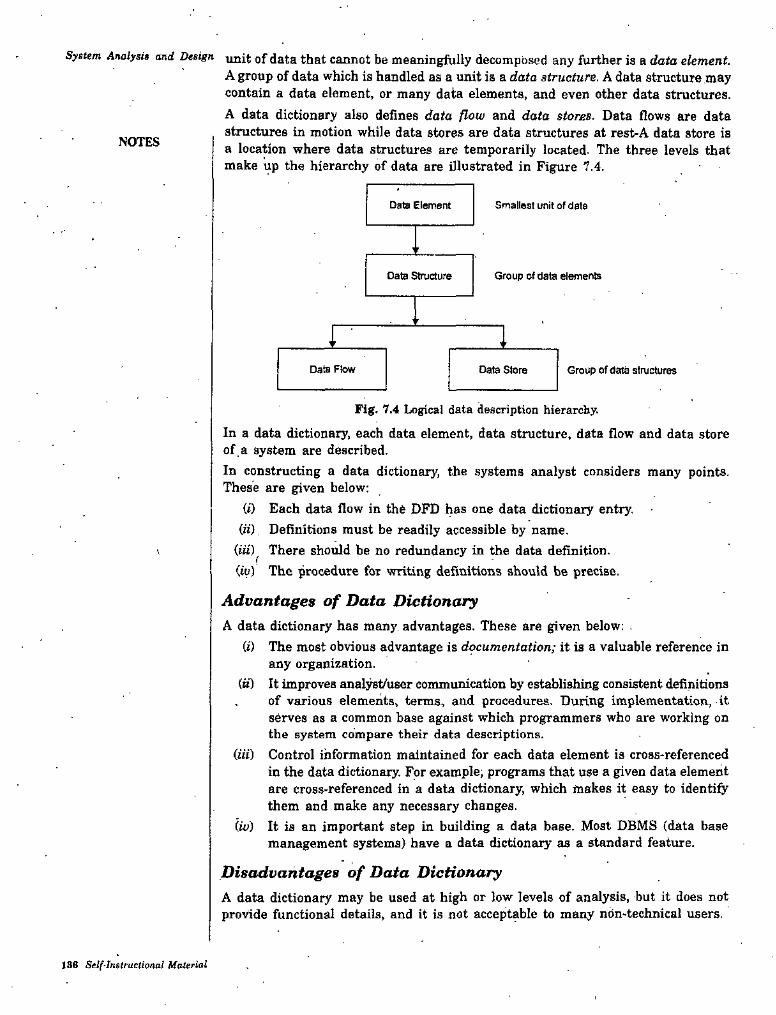
System Analysis and Design unit gf (jatg that cannot be meaningfully decomposed any further is a data element.A group of data which is handled as a unit is a data structure. A data structure may contain a data element, or many data elements, and even other data structures.A data dictionary also defines data flow and data stores. Data flows are data structures in motion while data stores are data structures at rest-A data store is a location where data structures are temporarily located. The three levels that make up the hierarchy of data are illustrated in Figure 7.4.
NOTES
Data Element Smallest unit of data
Data Structure Group of data el«nents
Data Flow Data Store Group of data structures
Fig. 7.4 Logical data description hierarchy.In a data dictionary, each data element, data structure, data flow and data storeof a system are described.In constructing a data dictionary, the systems analyst considers many points.These are given below;
(0 Each data flow in the DFD has one data dictionary entry.Hi). Definitions must be readily accessible by name.
(ih)^ There should be no redundancy in the data definition.(id) The procedure for writing definitions should be precise.
Advantages of Data DictionaryA data dictionary has many advantages. These are given below: .
(i) The most obvious advantage is documentation; it is a valuable reference in any organization.
(ti) It improves analyst/user communication by establishing consistent definitions . of various elements, terms, and procedures. During implementation., it
serves as a common base against which programmers who are working on the system compare their data descriptions.
HU) Control information maintained for each data element is cross-referenced in the data dictionary. For example, programs that use a given data element are cross-referenced in a data dictionary, which makes it easy to identify them and make any necessary changes.
liv) It is an important step in building a data base. Most DBMS (data base management systems) have a data dictionary as a standard feature.
Disadvantages of Data DictionaryA data dictionary may be used at high or low levels of analysis, but it does notprovide functional details, and it is not acceptable to many ndn-technical users.
J36 Self-Instructional Material

Logic Modeling
7.4 LOGIC MODELING USING STRUCTURED ENGLISH
You must understand more than just the flow of data into, through, and out of an information system. You must also understand what each identified process does and how it accomplishes its task. Starting with the processes depicted in the various sets of data flow diagrams the analysis team have produced, they must now begin to study and document the logic of each process. Structured English is one method used to illustrate process logic.Structured English is a modified, form of English that is used to specify the contents of process boxes in a DFD. It differs .from regular English in that it uses a subset of English vocabulary to express information system process procedures. The same action verbs we listed in chapter-6 for naming processes are also used in Structured English. These include verbs such as read, write, print, sort, move, merge, add, subtract, multiply, and divide. Structured English also uses noun phrases to describe data structures, such as patron-name and patron-address. Unlike regular English, Structured English does not use adjectives or adverbs. The whole point of using Structured English is to represent processes in a shorthand manner that is relatively easy for users and programmers to read and understand. Because there is no standard version, each analyst will have his or her own particular dialect of Structured English.It is possible to use Structured English to represent all three proces, 'S typical of stnictured programming: sequence, conditional statements, and repetition. Sequence requires no special structure but can be represented with one sequential statement following another. Conditional statements can be represented with a structure like the following;BEGIN IF
IF Quantity-in-stock is less than Minimum-order-quantity THEN GENERATE new order
ELSEDO nothing
END IFAnother type of conditional statement is a case statement where there are many different actions a program can follow, but only one is chosen. A case statement might be represented as given below:READ Quantity-in-stockSELECT CASE
NOTES
CASE 1 (Quantity-in-stock greater than Minimum-order-quantity) DO nothing
CASE 2 (Quantity-in-stock equals Minimum-order-quantity)DO nothing
CASE 3 (Quantity-in-stock is less than Minimum-order-quantity) GENERATE new order
CASE 4 (Stock out)INITIATE emergency reorder routine
END CASESelf-Instructional Material 137
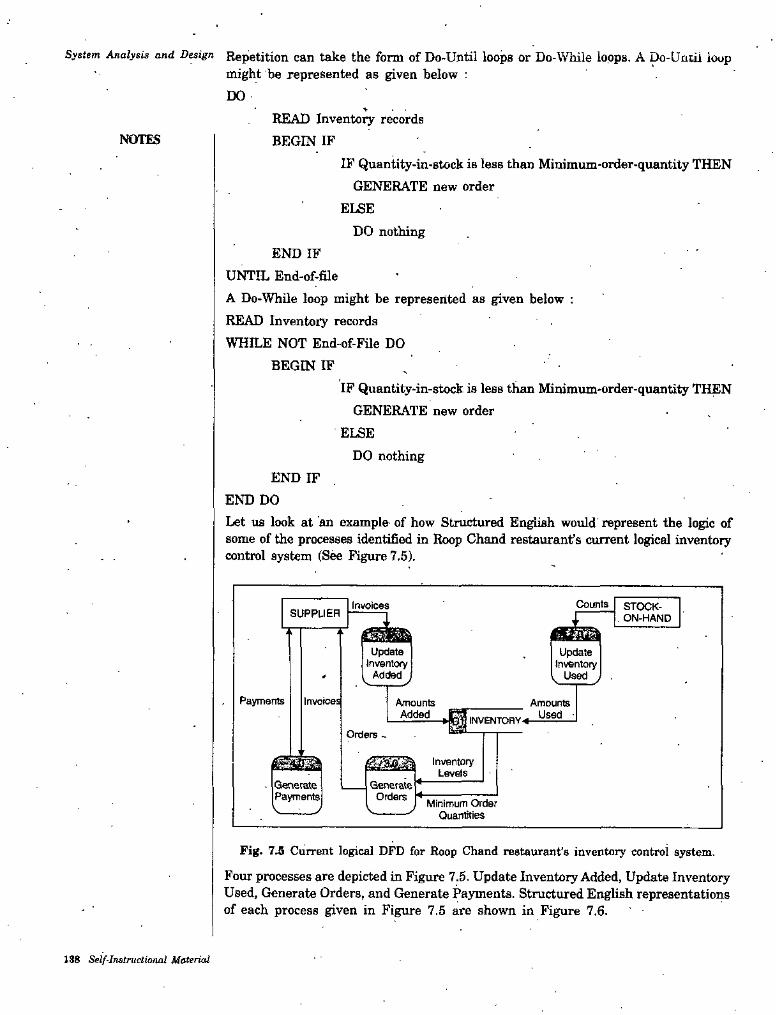
System Analysis and Design Repetition can take the form of Do-Until loops or Do-While loops. A Do-Uuiil loopmight be represented as given below :DO
READ Inventory records BEGIN IFNOTES
IF Quantity-in-stock is less than Minimum-order-quantity THEN GENERATE new order
ELSEDO nothing
END IFUNTIL End-of-aeA Do-WhOe loop might be represented as given below : READ Inventory records
WHILE NOT End-of-File DO BEGIN IF
IF Quantity-in-stock is less than Minimum-order-quantity THEN GENERATE new order
ELSEDO nothing
END IFEND DOLet us look at an example of how Structured English would represent the logic of some of the processes identified in Roop Chand restaurant’s current logical inventory control system (See Figure 7.5).
CountsInvoices STOCK- . ON-HANDSUPPUER
iUpdate
InventoryAdded
UpdateInventory
Used y •
Payments Invoices AmountsAdded
Amounts , Used 'INVENTORY
Orders ~
InventoryLev^s«Generate j
Payments!Generate Orders K Minimum Order
Quantities
Fig. 7.5 Current logical DFD for Roop Chand restaurant’s inventory control system.
Four processes are depicted in Figure 7.5. Update Inventory Added, Update Inventory Used, Generate Orders, and Generate Payments. Structured English representations of each process given in Figure 7.5 are shown in Figure 7.6.
138 Self-Instructional Material
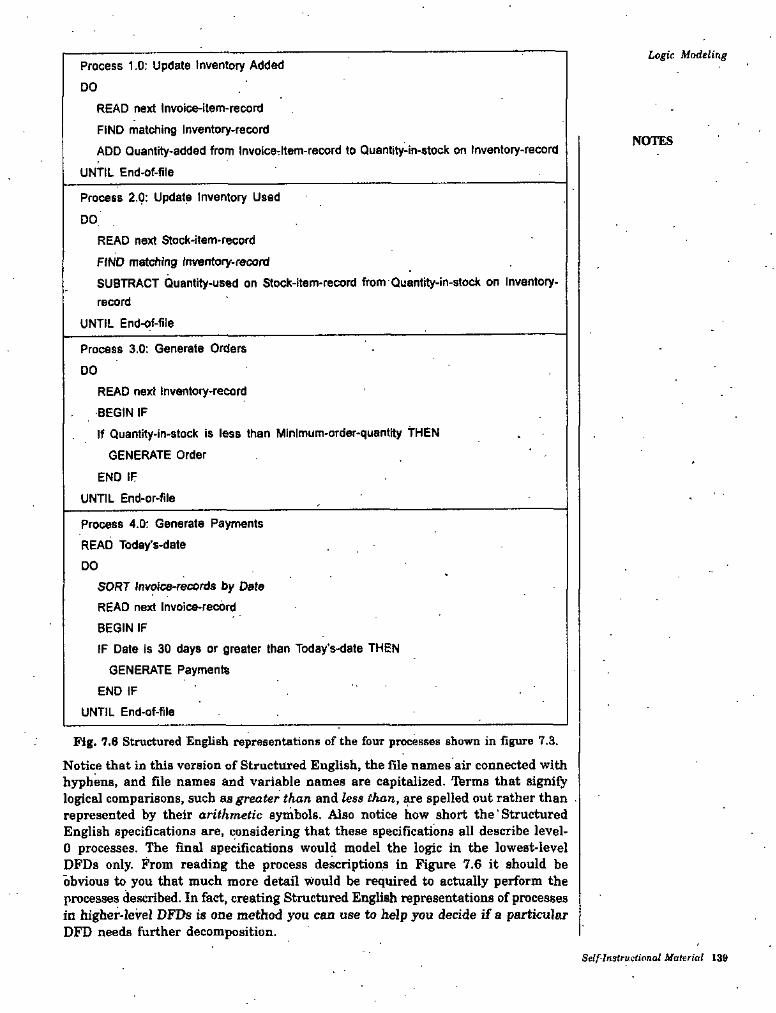
Logic ModelingProcess 1.0; Update Inventory Added
DOREAD next Invoice-item-record FIND matching Inventory-recordADD Quantity-added from Invoicerltem-record to Quantity-in-stock on Inventory-record
UNTIL End-of-file
NOTES
Process 2.0: Update Inventory Used
DOREAD next Stock-item-record FIND matching Inventory-recordSUBTRACT Quantity-used on Stock-item-record from Quantity-in-stock on Inventory- record
UNTIL End-of-file
Process 3.0: Generate Orders
DOREAD next Inventory-record BEGIN IFIf Quantity-in-stock is less than Minimum-order-quantity THEN
GENERATE Order END IF
UNTIL End-or-file
Process 4.0: Generate Payments READ Today’s-dateDO
SORT Irrvotee-records by Date READ next Invoice-record BEGIN IFIF Date is 30 days or greater than Today's-date THEN
GENERATE Payments END IF
UNTIL End-of-file
Fig. 7.6 Structured English representations of the four processes shown in figure 7.3.Notice that in this version of Structured English, the file names air connected with hyphens, and file names and variable names are capitedized. Ihrms that signify logical comparisons, such as greater than and less than, are spelled out rather than represented by their arithmetic symbols. Also notice how short the' Structured English specifications are, considering that these specifications all describe level- 0 processes. The final specifications would model the logic in the lowest-level DPDs only. From reading the process descriptions in Figure 7.6 it should be obvious to you that much more detail would be required to actually perform the processes described. In fact, creating Structured English representations of processes in higher-level DFDs is one method you can use to help you decide if a particular DFD needs further decomposition.
Self-Inetructional Ualeriat 139
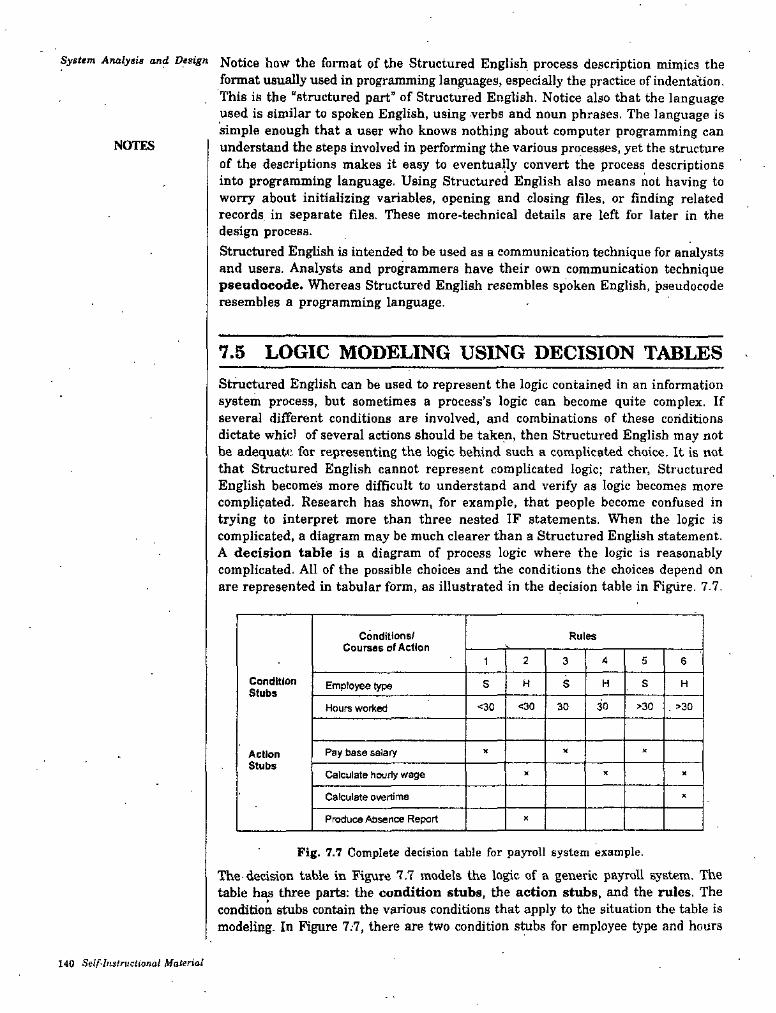
System Analysts and Design Notice how the format of the Structured English process description mimics theformat usually used in programming languages, especially the practice of indentation. This is the “structured part” of Structured English. Notice also that the language used is similar to spoken English, using verbs and noun phrases. The language is simple enough that a user who knows nothing about computer programming can understand the steps involved in performing the various processes, yet the structure of the descriptions makes it easy to eventually convert the process descriptions into programming language. Using Structured English also means not having to worry about initializing variables, opening and closing files, or finding related records in separate files. These more-technical details are left for later in the design process.Structured English is intended to be used as a communication technique for analysts and users. Analysts and programmers have their own communication technique pseudocode. Whereas Structured English resembles spoken English, pseudocode resembles a programming language.
NOTES
7.5 LOGIC MODELING USING DECISION TABLESStructured English can be used to represent the logic contained in an information system process, but sometimes a process’s logic can become quite complex. If several different conditions are involved, and combinations of these conditions dictate whic) of several actions should be taken, then Structured English may not be adequatit for representing the logic behind such a complicated choice. It is not that Structured English cannot represent complicated logic; rather. Structured English becomes more difficult to understand and verify as logic becomes more complicated. Research has shown, for example, that people become confused in trying to interpret more than three nested IF statements. When the logic is complicated, a diagram may be much clearer than a Structured English statement, A decision table is a diagram of process logic where the logic is reasonably complicated. All of the possible choices and the conditions the choices depend on are represented in tabular form, as illustrated in the decision table in Figure. 7.7.
Conditions/ Courses of Action
Rules
2 4 51 3 6
ConditionStubs
H $ H SS HEmployee type
<30 30 30 >30 . »30<30Hours worked
Pay base salary X XXActionStubs
Calculate hourly v/age X XX
Calculate overtime X
Produce Absence Report X
Pig. 7.7 Complete decision table for payroll system example.The-decision table in Figure 7.7 models the logic of a generic payroll system. The table has three parts: the condition stubs, the action stubs, and the rules. The condition stubs contain the various conditions that apply to the situation the table is modeling. In Figure 7:7, there are two condition stubs for employee type and hours
140 Selflnslruclional Malerial
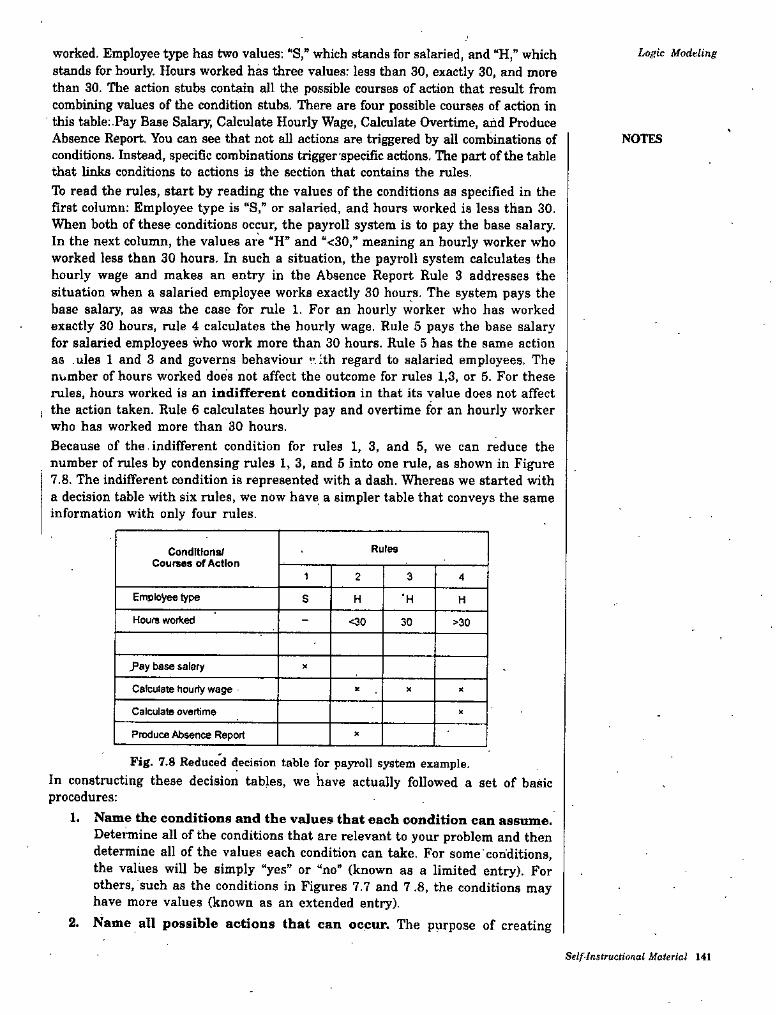
worked. Employee type has two values; “S,” which stands for salaried, and “H," which stands for hourly. Hours worked has three values; less than 30, exactly 30, and more than 30. The action stubs contain all the possible courses of action that result from combining values of the condition stubs. There are four possible courses of action in this table; .Pay Base Salary, Calculate Hourly Wage, Calculate Overtime, and Produce Absence Report. You can see that not all actions are tri^ered by all combinations of conditions. Instead, specific combinations trigger -specific actions. The part of the table that links conditions to actions is the section that contains the rules.To read the rules, start by reading the values of the conditions as specified in the first column; Employee type is “S,” or salaried, and hours worked is less than 30, When both of these conditions occur, the payroll system is to pay the base salary. In the next column, the values are “H” and “<30,” meaning an hourly worker who worked less than 30 hours. In such a situation, the payroll system calculates the hourly wage and makes an entry in the Absence Report Rule 3 addresses the situation when a salaried employee works exactly 30 hours. The system pays the base salary, as was the case for rule 1. For an hourly worker who has worked exactly 30 hours, rule 4 calculates the hourly wage. Rule 5 pays the base salary for salaried employees who work more than 30 hours. Rule 5 has the same action as .ules 1 and 3 and governs behaviour v.lth regard to salaried employees. The number of hours worked does not affect the outcome for rules 1,3, or 5. For these rules, hours worked is an indifferent condition in that its value does not affect
, the action taken. Rule 6 calculates hourly pay and overtime for an hourly worker who has worked more than 30 hours.Because of the indifferent condition for rules 1, 3, and 5, we can reduce the number of rules by condensing rules 1, 3, and 5 into one rule, as shown in Figure 7.8. The indifferent condition is represented with a dash. Whereas we started with a decision table with six rules, we now have a simpler table that conveys the same information with only four rules.
Logic Modeling
NOTES
RulesConditions/ Courses of Action
1 2 3 4
Employee type 'HS H H
Hours tvortied <30 30 >30
J^sy base salary
Calculate hourly wage
Calculate overtime
Produce Absence Report
Fig. 7.8 Reduced decision table for payroll system example.In constructing these decision tables, we have actually followed a set of basic procedures;
1. Name the conditions and the values that each condition Determine all of the conditions that are relevant to your problem and then determine all of the values each condition can take. For some conditions, the values will be simply “yes” or “no" (known as a limited entry). For others, such as the conditions in Figures 7.7 and 7 .8, the conditions may have more values (known as an extended entry).
2. Name all possible actions that can occur. The purpose of creating
can assume.
Self Instructional Material 141
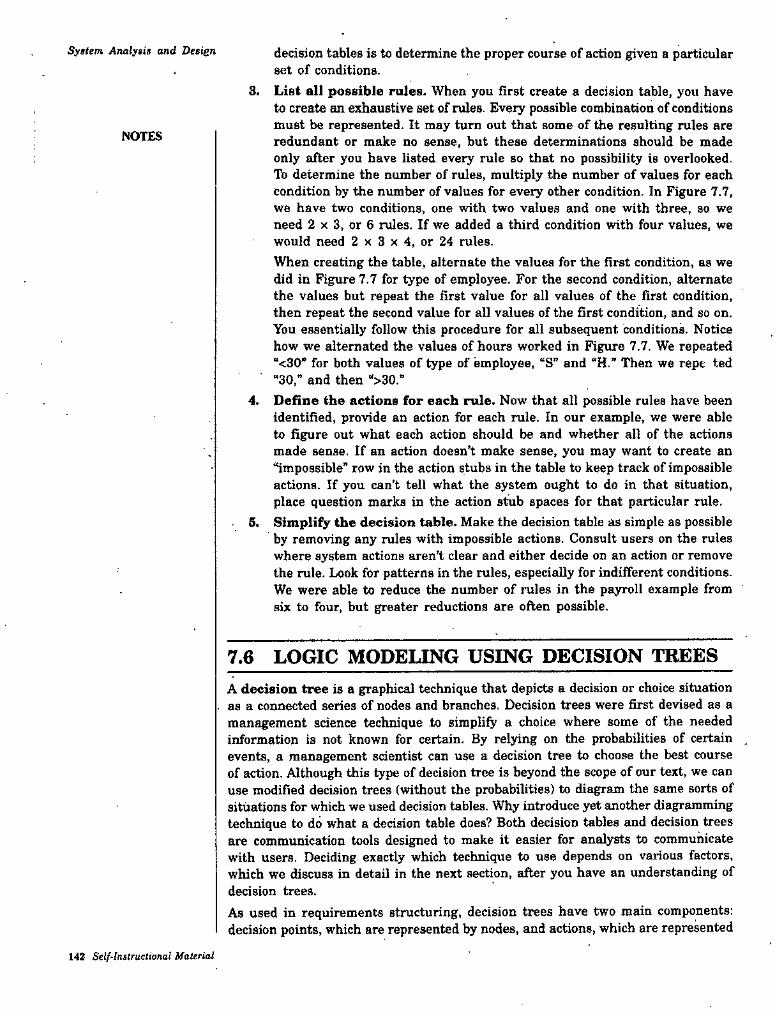
System Analysis and Design decisioQ tables is to detennine the proper course of action given a particular set of conditions.
3. Liat all possible rules. When you first create a decision table, you have to create an exhaustive set of rules. Every possible combination of conditions must be represented. It may turn out that some of the resulting rules are redundant or make no sense, but these determinations should be made only after you have listed every rule so that no possibility is overlooked. To determine the number of rules, multiply the number of values for each condition by the number of values for every other condition. In Figure 7.7, we have two conditions, one with two values and one with three, so we need 2 x 3, or 6 rules. If we added a third condition with four values, we would need 2 x 3 x 4, or 24 rules.When creating the table, alternate the values for the first condition, as we did in Figure 7.7 for type of employee. For the second condition, alternate the values but repeat the first value for all values of the first condition, then repeat the second value for all values of the first condition, and so on. You essentially follow this procedure for all subsequent conditions. Notice how we alternated the values of hours worked in Figure 7.7. We repeated “<30" for both values of type of employee, “S” and “H.” Then we rept ted “30,” and then “>30.”
4. Define the actions for each rule. Now that all possible rules have been identified, provide an action for each rule. In our example, we were able to figure out what each action should be and whether all of the actions made sense. If an action doesn’t make sense, you may want to create an “impossible" row in the action stubs in the table to keep track of impossible actions. If you can’t tell what the system ought to do in that situation, place question marks in the action stub spaces for that particular rule.
5. Simplify the decision table. Make the decision table as simple as possible by removing any rules with impossible actions. Consult users on the rules where system actions aren’t clear and either decide on an action or remove the rule. Look for patterns in the rules, especially for indifferent conditions. We were able to reduce the number of rules in the payroll example from six to four, but greater reductions are often possible.
NOTES
7.6 LOGIC MODELING USING DECISION TREESA decision tree is a graphical technique that depicts a decision or choice situation
. as a connected series of nodes and branches. Decision trees were first devised as a management science technique to simplify a choice where some of the needed information is not known for certain. By relying on the probabilities of certain . events, a management scientist can use a decision tree to choose the best course of action. Although this type of decision tree is beyond the scope of our text, we can use modified decision trees (without the probabilities) to diagram the same sorts of situations for which we used decision tables. Why introduce yet another diagramming technique to do what a decision table does? Both decision tables and decision trees are communication tools designed to make it easier for analysts to communicate with users. Deciding exactly which technique to use depends on various factors, which we discuss in detail in the next section, after you have an understanding of decision trees.As used in requirements structuring, decision trees have two main components: decision points, which are represented by nodes, and actions, which are represented
142 Self-Instructional Material
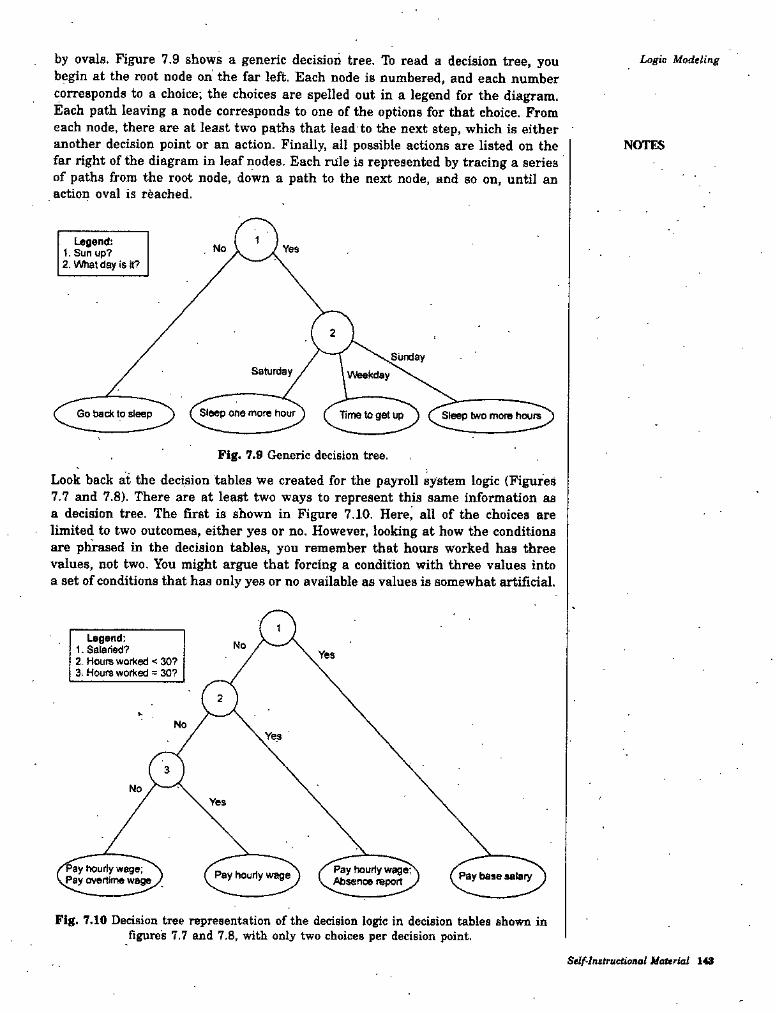
by ovals. Figure 7.9 shows a generic decision tree, lb read a decision tree, you begin at the root node on the far left. Each node is numbered, and each number corresponds to a choice; the choices are spelled out in a legend for the diagram. Each path leaving a node corresponds to one of the options for that choice. From each node, there are at least two paths that lead to the next step, which is either • another decision point or an action. Finally, all possible actions are listed on the far right of the diagram in leaf nodes. Each rule is represented by tracing a series of paths from the root node, down a path to the next node, and so on, until an action oval is reached.
Logic Modeling
NOTES
1Legend:1. Sun up?2. Whalday >sit?
No Yes
2
SundaySaturday Weekday
lime to two moreSteep one morecGo back to sleep
Fig. 7.9 Generic decision tree.
Look back at the decision tables We created for the payroll system logic (Figtires 7.7 and 7.8). There are at least two ways to represent this same information as a decision tree. The first is shown in Figure 7.10. Here, all of the choices are limited to two outcomes, either yes or no. However, looking at how the conditions are phrased in the decision tables, you remember that hours worked has three values, not two. You might ai^e that forcing a condition with three values into a set of conditions that has only yes or no available as values is somewhat artificial.
1Legend:
1. Sale tied?2. Hours worked < 30? 3: Hours worked = 30?
NoYes
2
NoYes
3
NoYes
"Pay hourly wage; Pay overtime wage
Pay hourly wage: Absence reportPay hourly wage Pay base salary
Fig. 7.10 Decision tree representation of the decision logic in decision tables shown in figures 7.7 and 7.8, with only two choices per decision point.
5e</-/n8(ruc<toRai Material 148
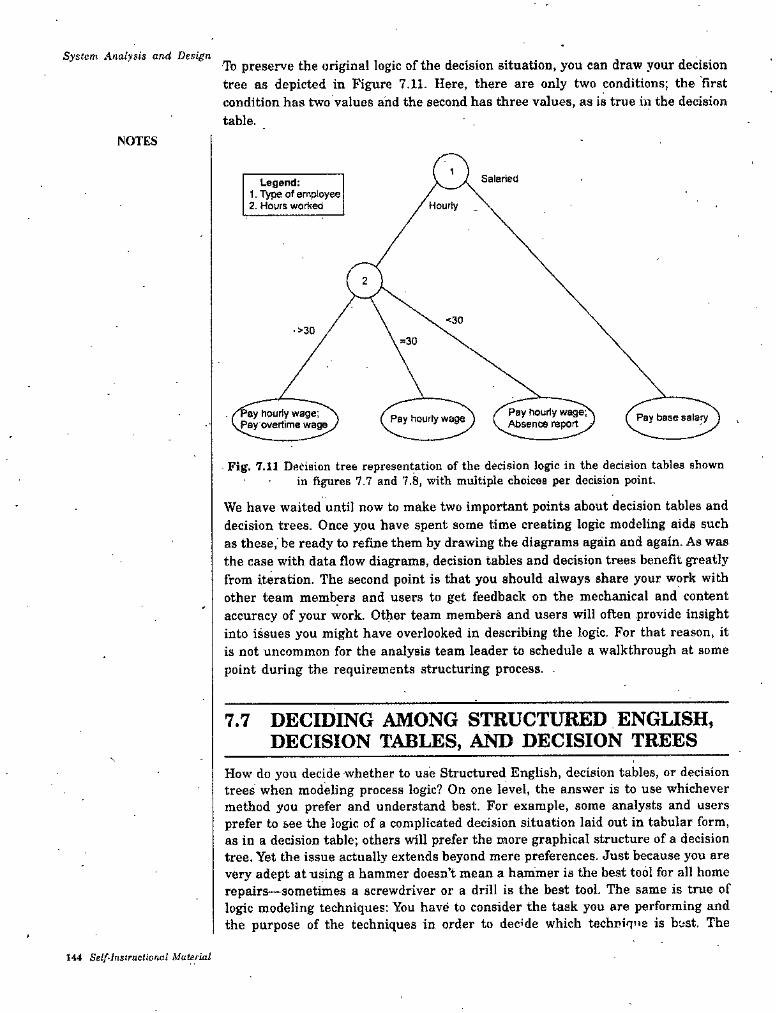
System Analysis and DesignTo preserve the original logic of the decision situation, you can draw your decision tree as depicted in Figure 7.11. Here, there are only two conditions; the first condition has two values and the second has three values, as is true in the decision table.
NOTES
1SalanedLegend:
1. Type of employee2. Hours worked Hourly
2
<30.>30
=30
Pay hourly wage; Absence report
Pay hourly wage; Pay overtime wage
Pay base salaryPay hourly wage
Fig. 7.11 Decision tree representation of the decision logic in the decision tables shown in figures 7.7 and 7.8, with multiple choices per decision point.
We have waited until now to make two important points about decision tables and decision trees. Once you have spent some time creating logic modeling aids such as these, be ready to refine them by drawing the diagrams again and again. As was the case with data flow diagrams, decision tables and decision trees benefit greatly from iteration. The second point is that you should always share your work with other team members and users to get feedback on the mechanical and content accuracy of your work. Other team members and users will often provide insight into issues you might have overlooked in describing the logic. For that reason, it is not uncommon for the analysis team leader to schedule a walkthrough at some point during the requirements structuring process. .
7.7 DECIDING AMONG STRUCTURED ENGUSH, DECISION TABLES, AND DECISION TREES
How do you decide whether to use Structured English, decision tables, or decision trees when modeling process logic? On one level, the answer is to use whichever method you prefer and understand best. For example, some analysts and users prefer to see the logic of a complicated decision situation laid out in tabular form, as in a decision table; others will prefer the more graphical structure of a decision tree. Yet the issue actually extends beyond mere preferences. Just because you are very adept at using a hammer doesn’t mean a heimmer is the best tool for all home repairs—sometimes a screwdriver or a drill is the best tool. The same is true of logic modeling techniques: You have to consider the task you are performing and the purpose of the techniques in order to dec’de which technique is bust. The
144 Self-Instructional Material
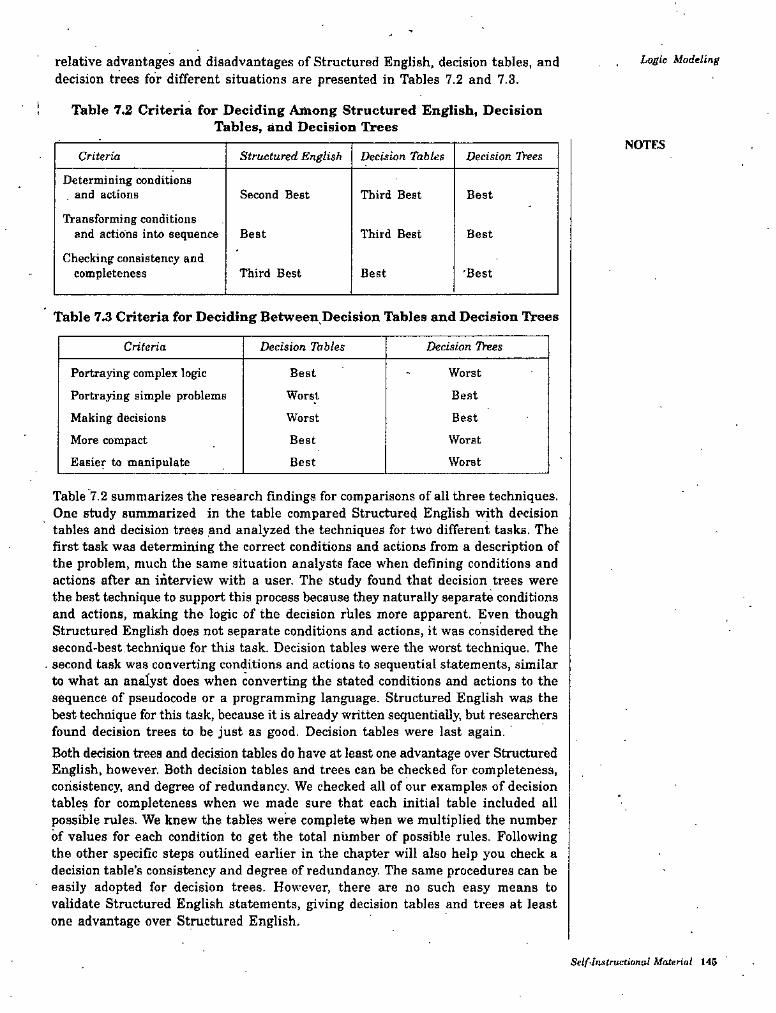
Logic Modelingrelative advantages and disadvantages of Structured English, decision tables, and decision trees for different situations are presented in Tables 7.2 and 7,3.
Table 7.2 Criteria for Deciding Among Structured English, Decision Tables, and Decision Trees
NOTESCriteria Structured English Decision Thbles Decision TYees
Determining conditions and actions Second Best Third Best Best
TVansforming conditions and actions into sequence
Checking consistency and completeness
Best Third Best Best
Third Best 'BestBest
Table 7.3 Criteria for Deciding Between Decision Tables and Decision Trees
Criteria Decision Thbles Decision Trees
WorstPortraying complex logic Portraying simple problems Making decisions More compact Easier to manipulate
Best
Worst BestWorst BestBest Worst
WorstBest
Table 7.2 summarizes the research findings for comparisons of all three techniques. One study summarized in the table compared Structured English with decision tables and decision trees and analyzed the techniques for two different tasks. The first task was determining the correct conditions and actions from a description of the problem, much the same situation analysts face when defining conditions and actions after an interview with a user. The study found that decision trees were the best technique to support this process because they naturally separate conditions and actions, making the logic of the decision rbles more apparent. Even though Structured English does not separate conditions and actions, it was considered the second-best.technique for this task. Decision tables were the worst technique. The
- second task was converting conditions and actions to sequential statements, similar to what an analyst does when converting the stated conditions and actions to the sequence of pseudocode or a programming language. Structured English was the best technique for this task, because it is already written sequentially, but researchers found decision trees to be just as good. Decision tables were last again. ’Both decision trees and decision tables do have at least one advantage over Structured English, however. Both decision tables and trees can be checked for completeness, consistency, and degree of redundancy. We checked all of our examples of decision tables for completeness when we made sure that each initial table included all possible rules. We knew the tables were complete when we multiplied the number of values for each condition to get the total number of possible rules. Following the other specific steps outlined earlier in the chapter will also help you check a decision table’s consistency and degree of redundancy. The same procedures can be easily adopted for decision trees. However, there are no such easy means to validate Structured English statements, giving decision tables and trees at least one advantage over Structured English.
Self-Instructional Material 145

Sy$tem Anoly»ia and Deiign Researchers have also compared decision tables with decision trees (Table 7.3).The pioneers of structured £malysis and design thought decision tables were best for portraying complex logic, whereas decision trees were better for simpler problems. Others have found decision trees to be better for guiding decision making in practice, but decision tables have the advantage of being more compact than decision trees and easier to manipulate. If more conditions are added to a situation, a decision table can easily accommodate more conditions, actions, and rules. If the taUe becomes too large, it can easQy be divided into subtables, without the inconvenience of using the flowchart-like tree connections used with decision trees. Creating and maintaining complex decision tables can be made easier with the help of computer.
NOTES
14S Seif-lnttruetional Material

Logic Modeling
STUDENT ACTIVITY 7.1
1. What are the ioputs to and deliverables and outcomes from logic modeling?
2. List the various techniques to model decision logic.
Stlf-Inslructionai Malerial 147

System Analysis and DesignSUMMARY
• Logic modeling is one of the three key activities in the requirements structuring phase of systems analysis.
• A data dictionary is a structured repository of data about data.• Structured English is the modified form of the English language used to
specify the logic of information system processes.• Decision table is a matrix representation of the logic of a decision, which
specifies the possible conditions for the decision and the resulting actions.■ Condition stubs is that part of a decision table that lists the conditions
relevant to the decision-.• Action stubs is that part of a decision table that lists the actions that
result for a given set of conditions.• Rules is that part of a decision table that specifies which actions are to be
• followed for a given set of conditions.• Indifferent condition in a decision table, is a condition whose value does
not affect which actions are taken for two or more rules.• Decision tree is a graphical representation of a decision situation in which
decision points (nodes) are connected together by arcs (one for each alternative on a decision) and terminate in ovals (the action that is the result of all of the decisions made on the path leading to that oval).
NOTES
TEST YOURSELFAnawer the following queationa :
1. Which modeling is to be conducted first while designing information system; logic modeling or process modeling ? Can you bypass process modeling and proceed to logic modeling ? How is logic modeling related to process modeling? Explain.
2. What points should be considered in constructing a data dictionary? Be specific.
3. What words are used in Structured English ? What types of words are not used in Structured English ?
4. Is it possible to use syntax of a programming language in logic modeling in the analysis phase ?
5. Explain how logic modeling helps the subsequent steps in system analysis and design phase.
6. "A data dictionary is a structured repository of data about data”. Discuss.7. What is structured English and how is it similar to and different from
regular English? Why is structured English popular within users and programmers? Explain how structured English can be used to represent different types of logic constructs of structured programming.
8. What is pseudocode? Why do you use pseudocode when a technique such as structured English is available?
9. What are the components of a decision table? How do you find the number of rules a decision table must cover? Why do you need a decision table when structured English can represent complex logic? Which technique is better?
148 Self-Instructional Material

Logic Modeling10. Explain the structure of a decision tree.11. Is it possible to model the logic of repetition and sequence statements of
structured programming using decision trees? Explain.12- State True or False :
(0 Logic modeling involves representing the internal structure and functionality of the processes represented on DFDs,
(«) It is not possible to use structured English to represent all three processes of structured programming: sequence, conditional statements and repitition.
(Hi) A decision table is a diagram of process logic where the logic is reasonably complicated.
(iv) A decision tree is not a graphical technique that depicts a decision or choice situation as a connected series of nodes and branches.
13.- Fill in the blanks :
NOTES
(0 ................... is a modified form of the English language used to specifythe logic of information, system processes. •................... is a matrix representation of the logic of a decision, whichspecifies the possible conditions for the decision and the resulting actions...................... is a graphical representation of a decision situation inwhich decision situation points are connected together by arcs and terminate in ovals.
(«)
(Hi)
................... is that part of a decision table that specifies which actionsare to be followed for a given set of conditions.
(w)
ANSWERS .Test Yourself
12. State True or False :(i) True'
(in) True13. Fill in the blanks :
(t) Structured English (Hi) Decision tree
(it) False(lu) False
(if) Decision table (to) Rules
Self-Instructional Material 148
Deeigning Forms and ReportsCHAPTER
NOTES
DESIGNING FORMS AND REPORTS
LEARNING OBIECTIVES8.1 Inbwiuction8.2 Designing Forms and Reports
8.2.1 The Process of Designing Forms and Reports6.2.2 Deliverables and Outcomes
8.3 Formatting Forms and Reports8.3.1 General Formatting Guidelines8.3.2 Highlighting Information8.3.3 Colour versus No-colour8.3.4 Displaying Text8.3.5 Designing Tables and Lists8.3.6 Paper versus Electronic Reports
6.4 Assessing Usability8.4.1 Usability Success Factors
' 8.4.2 Measures of Usability
8.1 INTRODUCTIONIn this unit, you will learn guidelines to follow when designing forms and reports. In general, forms are used to present or collect information on a single item, such as an employee, product, or event. Forms can be used for both input and output. Reports, on the other hand, are used to convey information on a collection of items. Form and report design is a key ingredient for successful systems. Because users often equate the quality of a system with the quality of its input and output methods, you can see that the design process for forms and reports is an especially important activity. And because information can be collected and formatted in many ways, gaining an understanding of design do's and don'ts and the trade-offs between different foimatting options is useful for all systems analysts. In this unit, first the process of designing forms and reports is briefly described, and guidance on the deliverables produced diiring diis process is also provided. Guidelines for formatting information are then provided that serve as the building blocks for designing all forms and reports. Finally we describe methods for assessing the useibility of forms and report designs.
Self ■Instructional Material 151
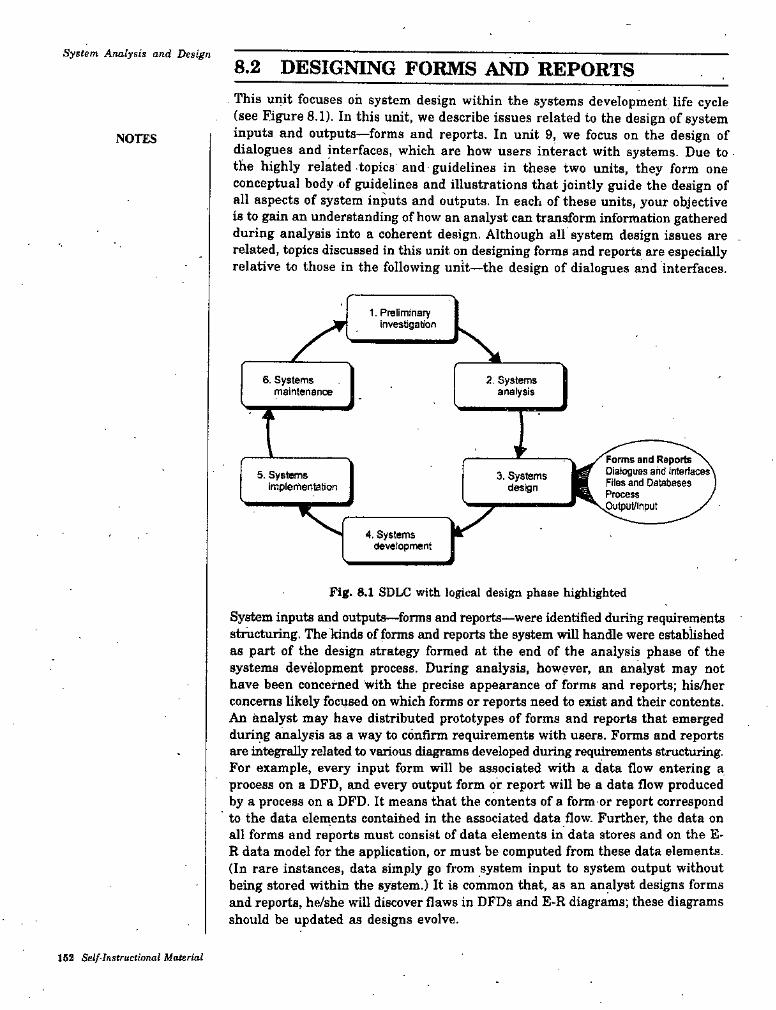
System Analysis and Design
8.2 DESIGNING FORMS AND REPORTSThis unit focuses oh system design within the systems development life cycle (see Figure 8.1). In this unit, we describe issues related to the design of system inputs and outputs—forms and reports. In unit 9, we focus on the design of dialogues and interfaces, which are how users interact with systems. Due to the highly related topics and guidelines in these two units, they form one conceptual body of guidelines and illustrations that jointly guide the design of all aspects of system inputs and outputs. In each of these units, your objective is to gain an understanding of how an analyst can transform information gathered during analysis into a coherent design. Although all system design issues are related, topics discussed in this unit on designing forms and reports are especially relative to those in the following unit—the design of dialogues and interfaces.
NOTES
1. Preliminary Invesbgat'on
6. Systems maintenance
2. Systems analysis
I V Forms and Reports N. □ialoguas arid interfaces' Files and Databases Process Putput/input
5. Systems implernentatiwi
3. Systems design
4. Systems development
Pig. 8.1 SDLC with logical design phase highlighted
System inputs and outputs—forms and reports—were identified during requirements structuring. The kinds of forms and reports the system will handle were established as part of the design strategy formed at the end of the analysis phase of the systems development process. During analysis, however, an analyst may not have been conceimed with the precise appearance of forms and reports; his/her concerns likely focused on which forms or reports need to exist and their contents. An analyst may have distributed prototypes of forms and reports that emerged during analysis as a way to confirm requirements with users. Forms and reports are integrally related to various diagrams developed during requirement structuring. For example, every input form will be associated with a data flow entering a process on a DFD, and every output form or report will be a data flow produced by a process on a DFD. It means that the contents of a form or report correspond to the data elements contained in the associated data flow. Further, the data on all forms and reports must consist of data elements in data stores and on the E- R data model for the application, or must be computed from these data elements. (In rare instances, data simply go from system input to system output without being stored within the system.) It is common that, as an analyst designs forms and reports, he/she will discover flaws in DFDs and E-R diagrams; these diagrams should be updated as designs evolve.
1S2 Self-Instructional Material
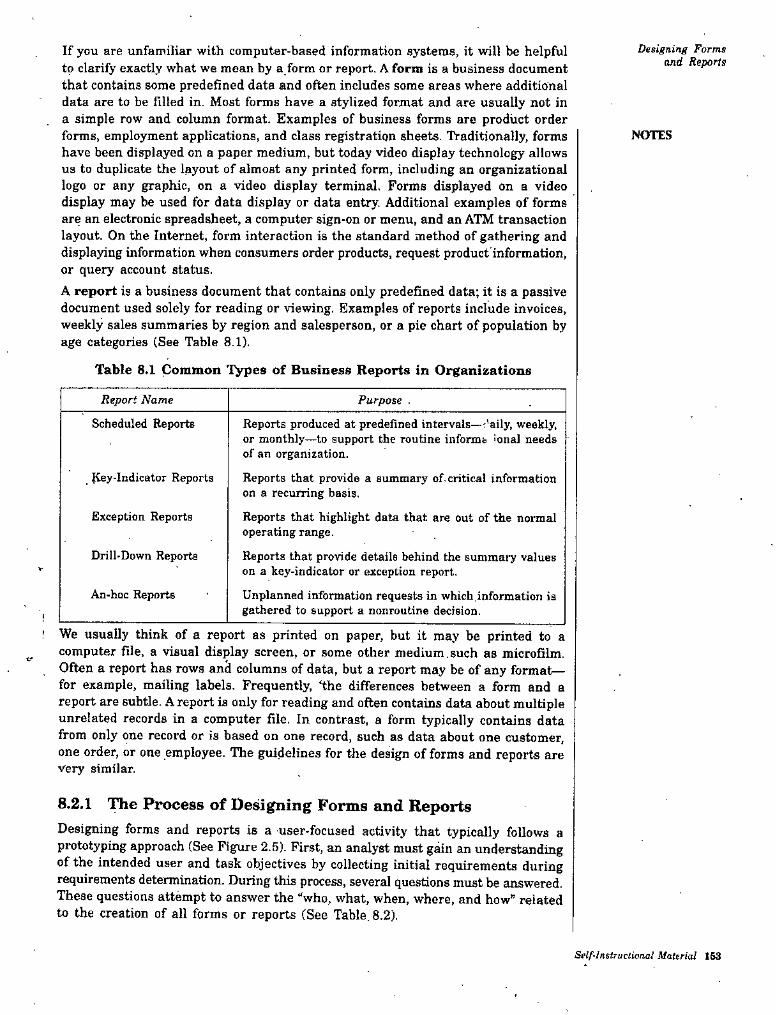
Designing Forms and Reports
If you are unfamiliar with computer-based information systems, it will be helpful to clarify exactly what we mean by a form or report, A form is a business document that contains some predefined data and often includes some areas where additional data are to be filled in. Most forms have a stylized format and are usually not in a simple row and column format. Examples of business forms are product order forms, employment applications, and class registration sheets. Traditionally, forms have been displayed on a paper medium, but today video display technology allows us to duplicate the layout of almost any printed form, including an organizational logo or any graphic, on a video display terminal. Forms displayed on a video display may be used for data display or data entry. Additional examples of forms are an electronic spreadsheet, a computer sign-on or menu, and an ATM transaction layout. On the Internet, form interaction is the standard method of gathering and displaying information when consumers order products, request product'information, or query account status.A report is a business document that contains only predefined data; it is a passive document used solely for reading or viewing. Examples of reports include invoices, weekly sales summaries by region and salesperson, or a pie chart of population by age categories (See Table 8.1).
Table 8.1 Common Types of Business Reports in Organizations
NOTES
Report Name Purpose .
Scheduled Reports Reports produced at predefined intervals—r'aily, weekly, or monthly—to support the routine informs 'onal needs of an organization.
Reports that provide a summary of. critical information on a recurring basis.
Reports that highlight data that are out of the normal operating range.
Reports that provide details behind the summary values on a key-indicator or exception report.
Unplanned information requests in which.information is gathered to support a nonroutine decision.
Key-Indicator Reports
Exception Reports
Drill-Down Reports
An-hoc Reports
! We usually think of a report as printed on paper, but it may be printed to a computer file, a visual display screen, or some other medium , such as microfilm. Often a report has rows anS columns of data, but a report may be of any format— for example, mailing labels. Frequently, ‘the differences between a form and a report are subtle. A report is only for reading and often contains data about multiple unrelated records in a computer file. In contrast, a form typically contains data from only one record or is based on one record, such as data about one customer, one order, or one employee. The guidelines for the design of forms and reports very similar.
are
8.2.1 The Process of Designing Forms and ReportsDesigning forms and reports is a user-focused activity that typically follows prototyping approach (See Figure 2.5). First, an analyst must gain an understanding of the intended user and task objectives by collecting initial requirements during requirements determination. During this process, several questions must be answered. These questions attempt to answer the "who, what, when, where, and how” related to the creation of all forms or reports (See Table, 8.2),
a
Self-lnstruclionol Material 1S3
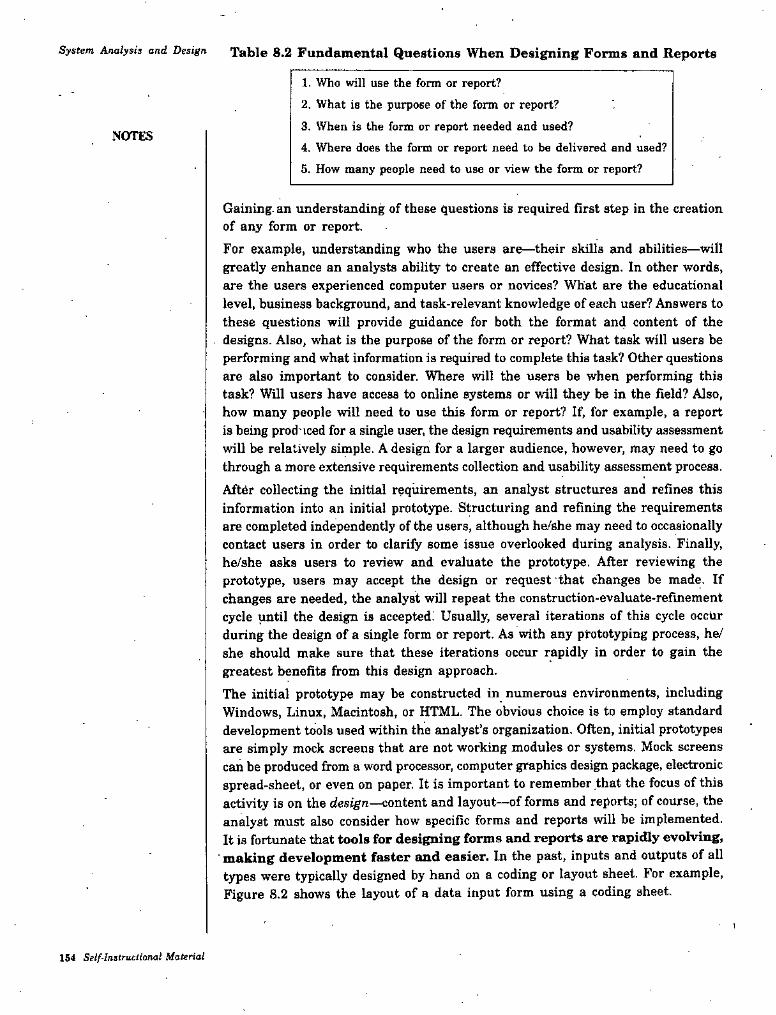
System Analysis and Design Table 8.2 Fundamental Questions When Designing Forms and Reports
1. Who will use the form or report?2. What is the purpose of the form or report?3. When is the form or report needed and used?4. Where does the form or report need to be delivered and used?5. How many people need to use or view the form or report?
NOTES
Gaining, an understanding of these questions is required first step in the creation of any form or report.
For example, understanding who the users are—their skills and abilities—will greatly enhance an analysts ability to create an effective design. In other words, are the users experienced computer users or novices? What are the educational level, business background, and task-relevant knowledge of each user? Answers to these questions will provide guidance for both the format and content of the designs. Also, what is the purpose of the form or report? What task will users be performing and what information is required to complete this task? Other questions are also important to consider. Where will the users be when performing this task? Will users have access to online systems or will they be in the field? Also, how many people will need to use this form or report? If, for example, a report is being produced for a single user, the design requirements and usability assessment will be relatively simple. A design for a larger audience, however, may need to go through a more extensive requirements collection and usability assessment process. After collecting the initial requirements, an analyst structures and refines this information into an initial prototype. Structuring and refining the requirements are completed independently of the users, although ha^she may need to occasionally contact users in order to clarify some issue overlooked during analysis. Finally, he/she asks users to review and evaluate the prototype. After reviewing the prototype, users may accept the design or request that changes be made. If changes are needed, the analyst will repeat the construction-evaluate-refinement cycle until the design is accepted. Usually, several iterations of this cycle occur during the design of a single form or report. As with any prototyping process, he/ she should make sure that these iterations occur rapidly in order to gain the greatest benefits from this design approach.The initial prototype may be constructed in numerous environments, including Windows, Linux, Macintosh, or HTML. The obvious choice is to employ standard development tools used within the analyst’s organization. Often, initial prototypes are simply mock screens that are not working modules or systems. Mock screens can be produced from a word processor, computer graphics design package, electronic spread-sheet, or even on paper. It is important to remember that the focus of this activity is on the c/csign—content and layout—of forms and reports; of course, the analyst must also consider how specific forms and reports will be implemented. It is fortunate that tools for designing forms and reports are rapidly evolving,
■ making development faster and easier. In the past, inputs and outputs of all types were typically designed by hand on a coding or layout sheet. For example, Figure 8.2 shows the layout of a data input form using a coding sheet.
164 Self-Instructional Material
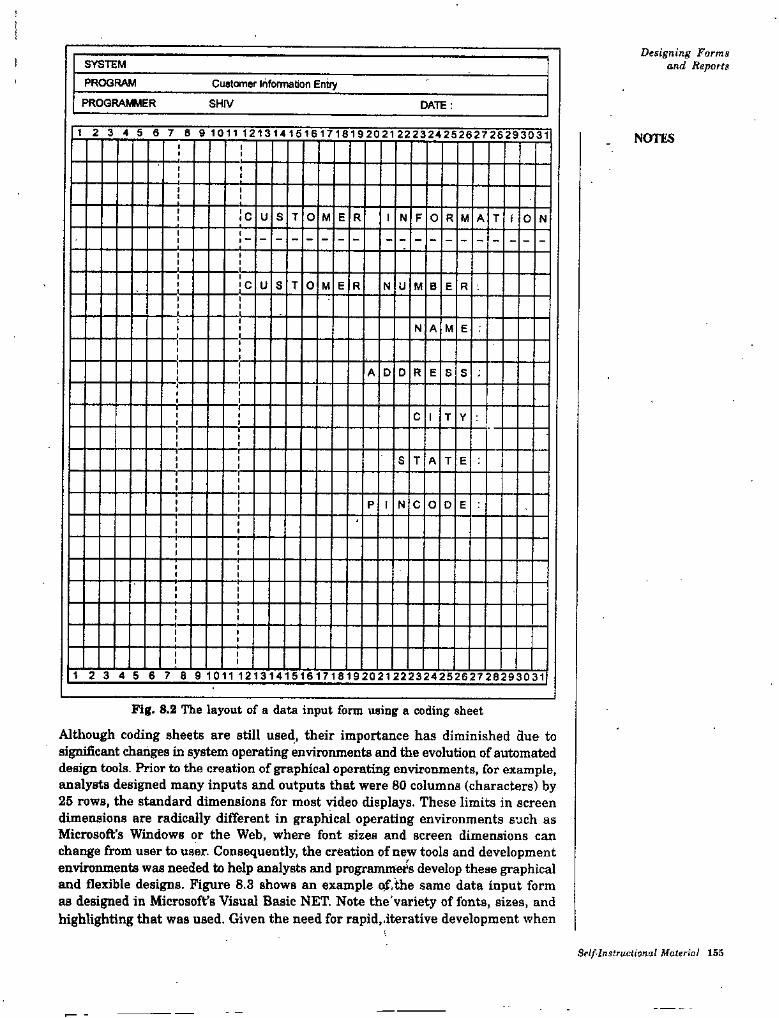
t
Designing Forms and ReportsSYSTEM
PROGRAM Cuatomer Information Entry
PROGR/iMilER SHIV DATE :
12345678 910111213141516171619202122232425262726293031 NOTES
C U S T O M E R I N F O R M A T I O N
C u s T o M E R N U M B E R
N A M E
A D D R E S S
c I T Y
S T A T E
N C OP I D E
1 2345676 910111213141516171819202122232425262728293031
Fig. 8.2 The layout of a data input form using a coding sheet
Althoi^h coding sheets are still used, their importance has diminished due to significant chains in system operating environments and the evolution of automated design tools. Prior to the creation of graphical operating environments, for example, analysts designed many inputs and outputs that were 80 columns (characters) by 25 rows, the standard dimensions for most video displays. These limits in screen dimensions are radically different in graphical operating environments such as Microsoft’s Windows or the Web, where font sizes and screen dimensions can change from user to user. Consequently, the creation of new tools and development environments was needed to help analysts and programmers develop these graphical and flexible designs. Figure 8.3 shows an example of,the same data input form as designed in Microsoft’s Visual Basic NET. Note the'variety of fonts, sizes, and highlighting that was used. Given the need for rapid,.iterative development when
Self-lnsiruclional Ualerial ISS

Syetem Analysis and Design
STUDENT ACTIYITY 8.1
1. What types of information are generally collected while designing forms and reports in the prototyping approach? Describe the prototyping process of designing forms and reports.
I-
2. What are the inputs to design phase of forms and reports? What are its deliverables? Explain in brief.
168 Self-Instructional ifalerialy
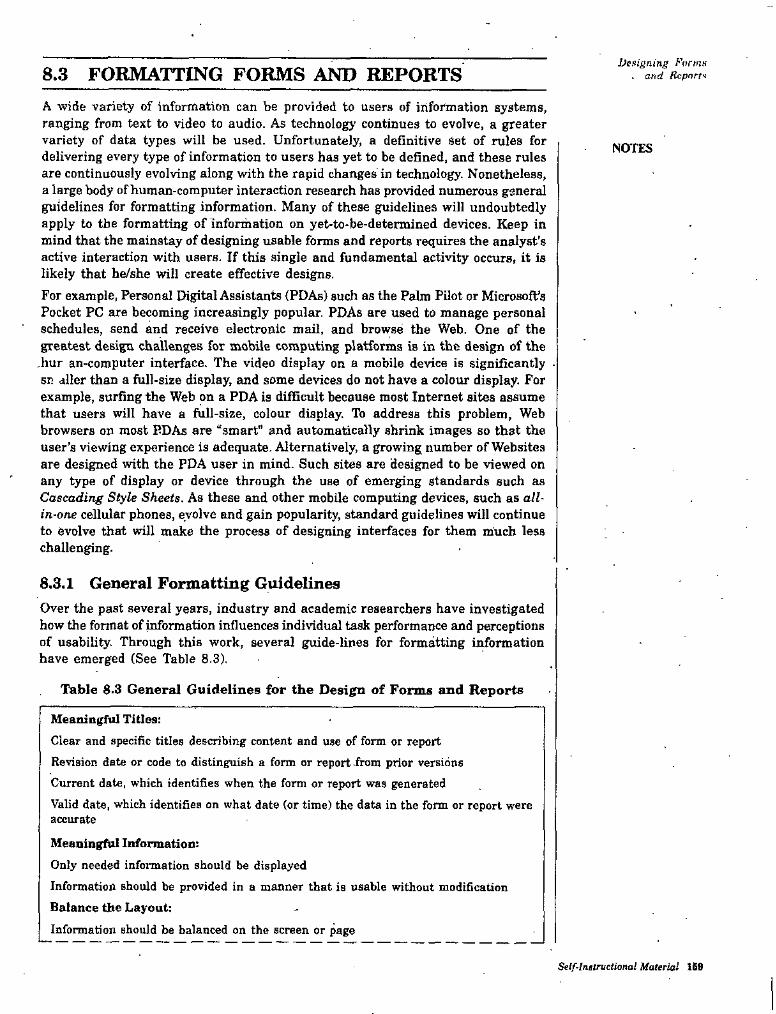
Designing Forms . and Reports8.3 FORMATTING FORMS AND REPORTS
A wide variety of information can be provided to users of information systems, ranging from text to video to audio. As technology continues to evolve, a greater variety of data types will be used. Unfortunately, a definitive Set of rules for delivering every type of information to users has yet to be defined, and these rules are continuously evolving along with the rapid changes in technology. Nonetheless, a large body ofhuman-computer interaction research has provided numerous general guidelines for formatting information. Many of these guidelines will undoubtedly apply to the formatting of information on yet-to-be-determined devices. Keep in mind that the mainstay of designing usable forms and reports requires the analyst's active interaction with users. If this single and fundamental activity occurs, it is likely that he/she will create effective designs.For example, Personal Digital Assistants (PDAs) such as the Palm Pilot or Microsoft’s Pocket PC are becoming increasingly popular. PDAs are used to manage personal schedules, send and receive electronic mail, and browse the Web. One of the greatest design challenges for mobile computing platforms is in the design of the .hur an-computer interface. The video display on a mobile device is significantly • sr aller than a full-size display, and some devices do not have a colour display. For example, surfing the Web on a PDA is difficult because most Internet sites assume that users will have a full-size, colour display. To address this problem, Web browsers on most PDAs are “smart” and automatically shrink images so that the user’s viewing experience is adequate. Alternatively, a growing number of Websites are designed with the PDA user in mind. Such sites are designed to be viewed on any type of display or device through the use of emerging standards such as Cascading Style Sheets. As these and other mobile computing devices, such as all- in-one cellular phones, evolve and gain popularity, standard guidelines will continue to evolve that will make the process of designing interfaces for them much less challenging.
NOTES
8.3.1 General Formatting GuidelinesOver the past several years, industry and academic researchers have investigated how the format of information influences individual task performance and perceptions of usability. Through this work, several guide-lines for formatting information have emerged (See Table 8.3),
Table 8.3 General Guidelines for the Design of Forms and Reports
Meaningful Titles:Clear and specific titles describing content and use of form or reportRevision date or code to distinguish a form or report from prior versionsCurrent date, which identifies when the form or report was generatedValid date, which identifies on what date (or time) the data in the form or report were accurate
Meaningfiil Information:Only needed information should be displayedInformation should be provided in a manner that is usable without modification Balance the Layout:Information should be balanced on the screen or page
Self-lnttructional Material 169
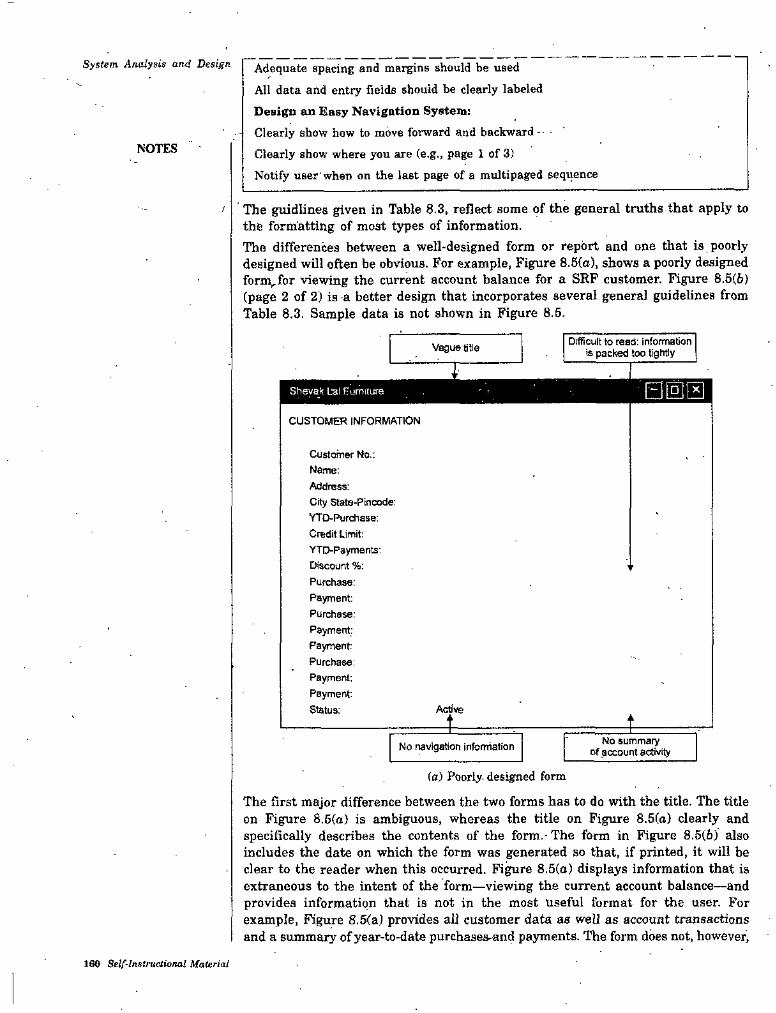
System Analysis and Design Adequate spacing and margins should be used All data and entry fields should be clearly labeled Design (ui Easy Navigation System:Clearly show how to move forward and backward - Clearly show where you are (e.g., page i of 3)Notify user'when on the last page of a multipaged sequence
NOTES
The guidlines given in Table 8.3, reflect some of the general truths that apply to the formatting of most types of information.The differences between a well-designed form or report and one that is poorly designed will often be obvious. For example, Figure 8.5(a), shows a poorly designed fornvfor viewing the current account balance for a SRP customer. Figure 8.5(6) (page 2 of 2) is a better design that incorporates several general guidelines from Table 8.3. Sample data is not shown in Figure 8.5.
/
Difficult to read: information is packed too tightiyVague Bile
TShevak Ual frumiiure
CUSTOMER INFORMATION
Customer No.: Name:Address:City State-Pincode:YTO-Purchase:Credit Limit;YTD-Payments:Discount %:Purchase:Payment:Purchase:Payment:Payment:Purchase:Payment;Payment:Status: Active
t i:No summary
of account activityNo navigation infomiation
(a) Poorly- designed form
The first major difference between the two forms has to do with the title. The title on Figure 8.5(a) is ambiguous, whereas the title on Figure 8.5(o) clearly and specifically describes the contents of the form.-The form in Figure 8.5(6) also includes the date on which the form was generated so that, if printed, it will be clear to the reader when this occurred. Figure 8.5(o) displays information that is extraneous to the intent of the form—viewing the current account balance—and provides information that is not in the most Useful format for the user. For example. Figure 8.5(a) provides ail customer data as well as account transactions and a summary of year-to-date purchases-and payments. The form does not, however,
160 Self-Instructional Material
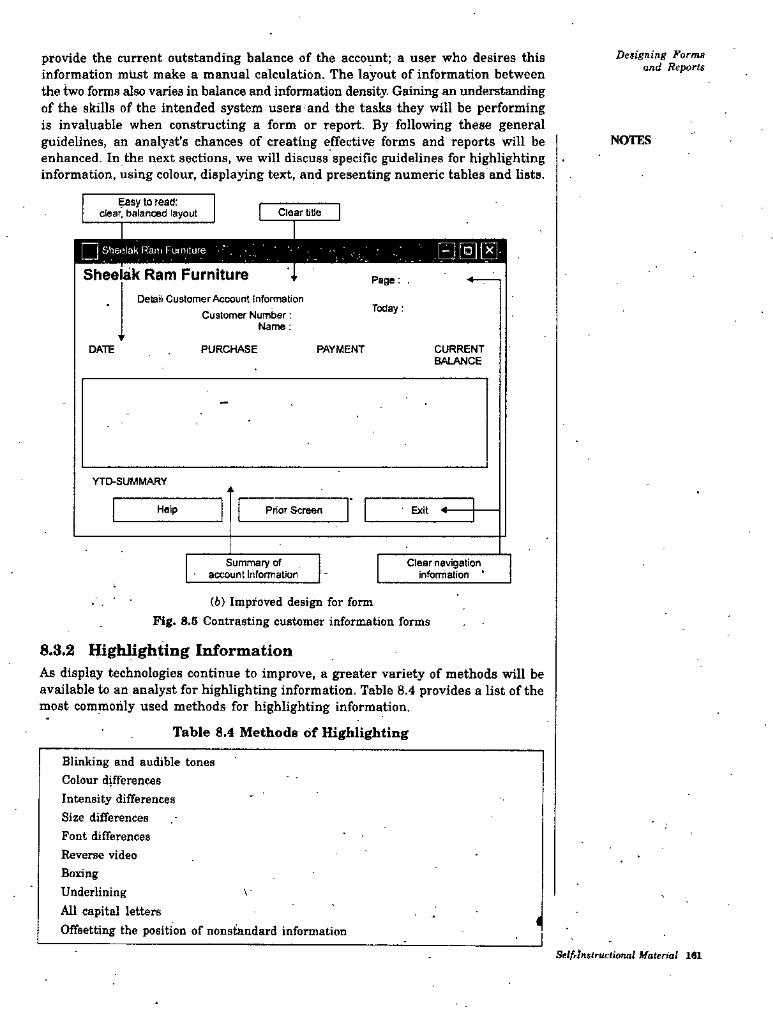
Designing Forms and Reports
provide the current outstanding balance of the account; a user who desires this information must make a manual calculation. The layout of information between the two forms also varies in balance and information density. Gainir^ an understanding of the skills of the intended system users and the tasks they will be performing is invaluable when constructing a form or report. By following these general guidelines, an analyst’s chances of creating effective forms and reports will be enhanced. In the next sections, we will discuss specific guidelines for highlighting information, using colour, displaying text, and presenting numeric tables and lists.
NOTES
to read;clear, balanced layout Clear title
' E][§][Z-Sheirlak Rani Fuiniiure•v.
Shee ak Ram Furniture Page: .
Detail Customer Account Information Customer Number:
Name:Today:
PURCHASE PAYMENT CURRENTBALANCE
DATE
YTD-SUMMARY
Help Prior Screen Exit *
Summary of account infonnatior
Clear navigation if'forrnation ‘
(6) Improved design for form Fig. 8.S Contrasting customer information forms
8.3.2 Highlighting Information
As display technologies continue to improve, a greater variety of methods will be available to an analyst for highlighting information. Table 8.4 provides a list of the most commonly used methods for highlighting information.
Table 8.4 Methods of Highlighting
Blinking and audible tones Colour differences Intensity differences Size differences Font differences Reverse video Boxing Underlining All capital letters Offsettii^ the position of nonstandard information
\-
<
Selfrlnstructional Material 161

y.t m Analisis and Design Given this vast array of options, it is more important than ever to consider howhighlighting can be used to enhance an output and not prove a distraction. In general, high%hting should be used sparingly to draw the user to or away from certain information and to group together related information. There are several situations when highlighting can be a valuable technique for conveying special information:
• Notifying users of errors in data entry or processing• Providing warnings to users regarding possible problems such as unusual
data values or an unavailable device• Drawing attention to keywords, commands, high-priority messages, and
data that have changed gone outside normal operating rangesAdditionally, many highlighting techniques can be used singularly or in tandem, depending upon the level of emphams desired by the designer. Figure 8.6 illustrates a form where several types of highlighting are used. Sample data is not shown in Figure 8.6.
NOTES
Font size, Intensity All capital tetters
Sheelak Ram Furniture♦
Sheelak Ram Furniture .Detail Customer Account Information
Page:,Today:
Customer Number
Name:
DATE PURCHASE PAYMENT CURREtlTBALANCE
YTD-SUIIMARY
Help Prior Screen Exit
Boxing Intercity differences
Fig. 8.6 Customer account status display using various highlighting techniques
In this example, boxes clarify different categories of data, capital letters and different fonts distinguish labels from actual data, and bolding is used to draw attention to important data.Much research has focused on the effects of varying highlighting techniques on task performance and user perceptions. A general guideline resulting from this research is that highlighting should be used conservatively. For example, blinking and audible tones should only be used to highlight critical information requiring- an immediate response from the user Once a response is made, these highlights should be turned off. Additionally, highlighting methods should be consistently • used and selected based upon the level of importance of the emphasized information. It is also important to examine how a particular highlighting method appears on all possible output devices that could be used with the system. For example, some colour combinations may convey appropriate information on one display configuration but wash out and reduce legibility on another.
162 Self-Jnatructional Material
The continued evolution of graphical operating environments such as Windows, Macintosh,, and the Web has provided designers with some standard highlighting guidelines. However, these guidelines are often quite vague and are continuously evolving, leaving a great deal of control in the hands of the systems developer. Therefore, in order for organizations to realize the benefits of using standard graphical operating environments—such as reduced user training time and interperability among systems—an analyst must be disciplined in how he/she uses highlighting.
Detigning forms and Beportg
NOTES
8.3.3 Colour Versus No>ColourColour is a powerful tool for the designer in influencing the usability of a system. When applied appropriately, colour provides many potential benefits to forms and reports, which are summarized in Table 8.5. As the use of colour displays became widely available during the 1980s, a substantial amount of colour versus no-colour research was conducted. The objective of this research was to gain a better understanding of the effects of colour on human task performance.The general findings from this research were that the use of colour had positive effects on user task performance and perceptions when the user was under time constraints for the completion of a task. Colour was also beneficial for gaining greater understanding from a display or chart. An important conclusion from this research was that colour was not universally better than no colour. The benefits of colour only seem to apply if the information is first provided to the user in the most appropriate presentation format. That is, if information is most effectively displayed in a bar chart, colour can be used to enhance or supplement the display. If information is displayed in an inappropriate format, colour has little or no effect on improving understanding or task performance.There axe several problems associated with using colour, also summarized in Table 8,5. Most of these dangers are related more to the technical capabilities of the display and hard-copy devices than misuse. However, colour blindness is a particular user issue that is often overlooked in the design of systems; many people all over the world have some form of colour blindness. It is recommended that an analyst first designs video displays for monochrome and allow colour (or better yet, a flexible palette of colours) to be a user-activated option. It is suggested that an analyst limits the number of. colours and where they are applied, using colour primarily as a tool to assist in the highlighting and formatting of information.
Table 6.S Benefits and Problems from Using Colour
Benefits from Using Colour :Soothes or strikes the eye.Accents an unintereeting display. 'Facilitates subtle discriminations in complex displays.Emphasizes the logical organization of information.Draws attention to warnings,'Evokes more emotional reactions.Problems from Using Colour :Colour pairings may wash out or cause problems for some users (e.g., colour blindness). Resolution may degrade with different displays.(Colour fidelity may degrade on different displays.Printing or conversion to other media may not easily translate.
Sctf-fiiseructioocii Ma(eria2 ISS
System Analysis and Design 8.3.4 Displaying TCXt
In business-related systems, textual output is becoming increasingly important as text-based applications such as electronic mail, bulletin boards, and information services are more widely used. The display and formatting of system help screens, which often contain lengthy textual descriptions and examples, is one example of textual data that can benefit from following a few simple guidelines that have emerged from past research,. These guidelines are given in Table 8.6.
NOTES
Table 8.6 Guidelines for Displaying Text
Case. Display text in mixed uppercase and lowercase and use cwnventional punctuation.Use double spacing if space permits. If not, place a blank line between paragraphs.Left justify text and leave a ragged-right margin.Do not hyphenate words between lines.Use abbreviations and acronyms only when they are widely understood by users and are significantly shorter than the full text.
Spacing
JustificationHyphenationAbbreviations
The first guideline is simple: The text should be displayed using common writing conventions such as mixed uppercase and lowercase letters and appropriate punctuation. For large blocks of text, if space permits, text should be double spaced. However, if the text is short, or rarely used, it may be appropriate to use single spacing and place a blank line between each paragraph. Left justify text and use a ragged-right margin-research shows that a ragged-right margin makes it easier to find the next line of text when reading than when text is both left and right justified.When displa3ang textual infoi-mation, be careful not to hyphenate words between lines or use obscure abbreviations and acronyms. Users may not know whether the hyphen is a significant character if it is used to continue words across lines. Information and terminology that are not widely understood by the intended users may significantly influence the usability of the system. Thus, abbreviations and acronyms should be used only if they are significantly shorter than the full text and are commonly known by the intended system users.
8.3.5 Designing Tables and ListsUnlike textual information, where context and meaning are derived through reading, the context and meaning of tables arid lists are derived from the format of the information. Consequently, the usability of information displayed in tables and alphanumeric lists is likely to be much more heavily influenced by effective layout than moat other types of information display. As with file display of textual information, tables and lists can also be greatly enhanced by following a few simple guidelines. These are summarized in Table 8.7. Systems analysts should review these guidelines and carefully apply them to ensure that their tables and lists are highly usable.
Table 8.7 General Guidelines for Displaying Tables and Lists
Use meaningful labels :All columns and rows should have meaningful labels.Labels should be separated from other information by using highlighting. Redisplay labels when the data extend beyond a single screen or page.
164 Self-Instructional Material
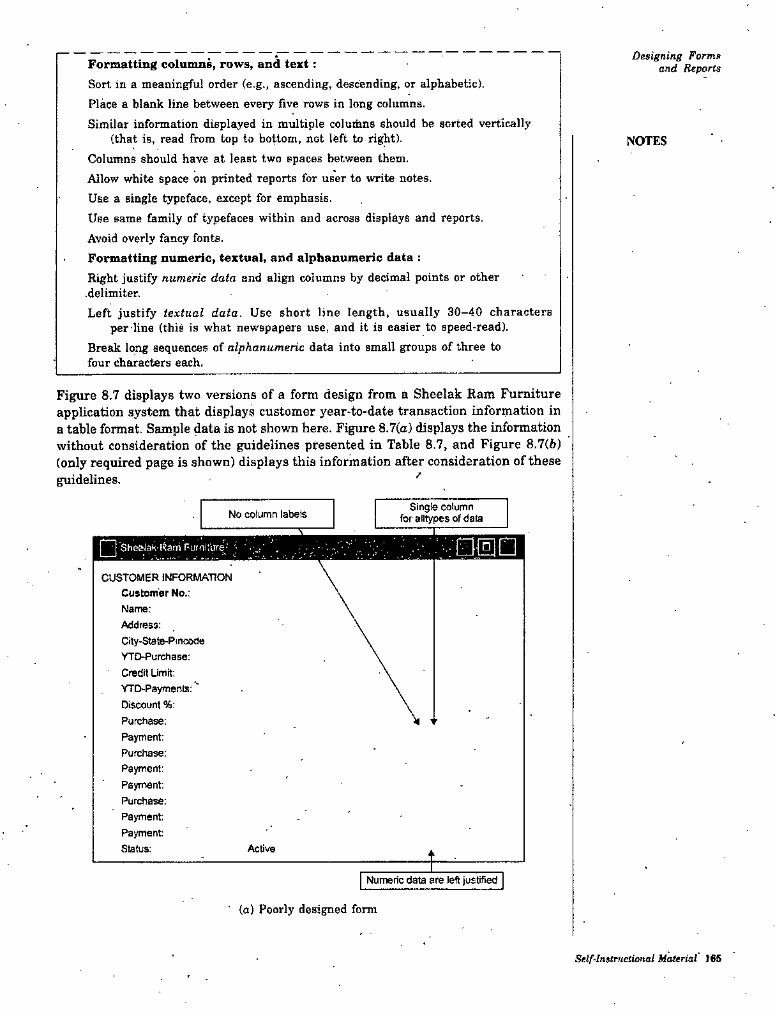
Designing Forms and ReportsFormatting columns, rows, and text;
Sort in a meaningful order (e.g., ascending, descending, or alphabetic).Place a blank line between every five rows in long columns.Similar information displayed in multiple columns should be sorted vertically
(that is, read from top to bottom, not left to right).
Columns should have at least two spaces between them.Allow white space on printed reports for user to write notes.
Use a single typeface, except for emphasis.Use same family of typefaces within and across displays and reports.Avoid overly fancy fonts.Formatting numeric, textual, and alphanumeric data :Right justify numeric data and align columns by decimal points or other .delimiter.Left justify textual data. Use short line length, usually 30-40 characters
per line (this is what newspapers use, and it is easier to speed-read).Break long sequences of alphanumeric data into small groups of three to four characters each.
NOTES
Figure 8.7 displays two versions of a form design from a Sheelak Ram Furniture application system that displays customer year-to-date transaction information in a table format. Sample data is not shown here. Figure 8.7(a) displays the information without consideration of the guidelines presented in Table 8.7, and Figure 8.7(6) (only required page is shown) displays this information after consideration of these guidelines. ''
Single column for alltypes oFdataNo column labels
Sheelak Karri Fuiniiure- ;• ,
CUSTOMER INFORMATION Customer No.:Name:Address:City-State-PmeodeYTD-Purchase:Credit Limit: YTD-Payments:' Discount %:Purchase:Payment:Purchase:Payment:Payment:Purchase:Payment;Payment:Status: Active
Numeric data are left justified
■ (a) Poorly designed form
Self-Instructional Material 165
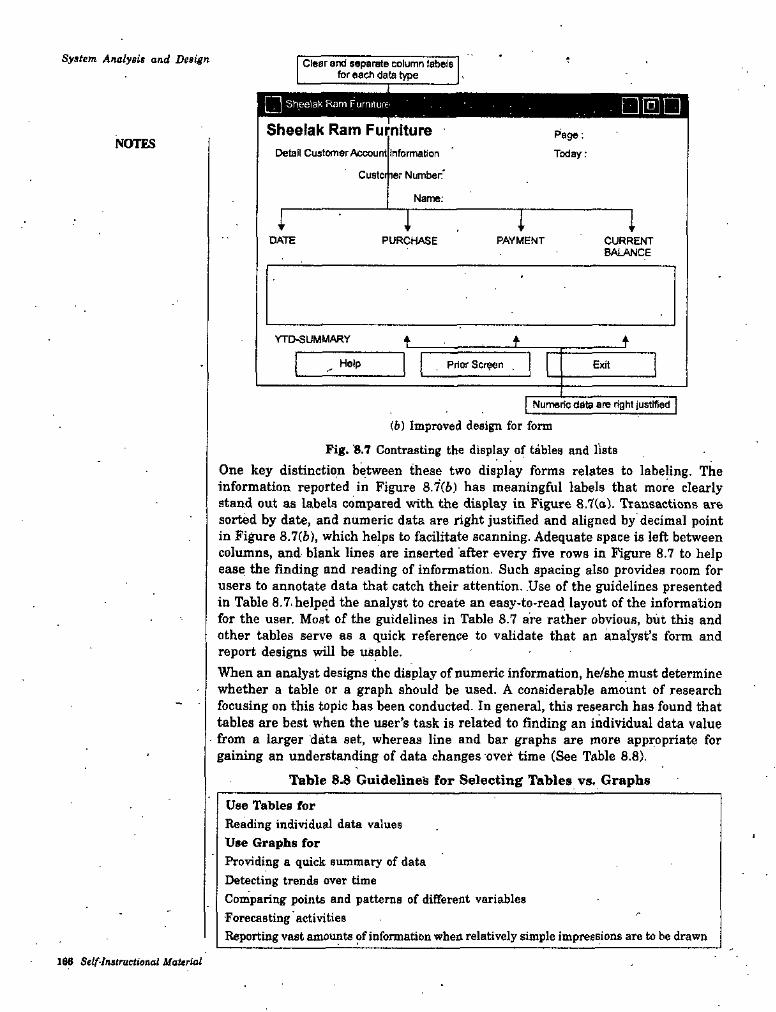
System Analyeis and Design Clear and separate column labels for each datatype
, StieelaKRnm furniture' ' , . . ■ □EDSheelak Ram Furniture Page:
Today:NOTES
Detail Customer Account Information
Custoi ter Number*
Name:
DATE PURCHASE PAYMENT CURRENTBALANCE
YTD-SUMMARY fHelp Prior Screen Exit
Numeric data are right justified
(6) Improved design for form
Fig. 8.7 Contrasting the display of tables and lists One key distinction between these two display forms relates to labeling. The information reported in Figure 8.7(6) has meaningful labels that more clearly stand out as labels compared with the display in Figure 8.7(a). Transactions are sorted by date, and numeric data are right justified and aligned by decimal point in Figure 8.7(6), which helps to facilitate scanning. Adequate space is left between columns, and blank lines are inserted after every five rows in Figure 8.7 to help ease the finding and reading of information. Such spacing also provides room for users to annotate data that catch their attention. Use of the guidelines presented in Table 8.7.helped the analyst to create an easy-to-read layout of the information for the user. Most of the guidelines in Table 8.7 are rather obvious, but this and other tables serve as a quick reference to validate that an analyst’s form and report designs will be usable.When an analyst designs the display of numeric information, he/she must determine whether a table or a graph should be used. A considerable amount of research focusing on this topic has been conducted. In general, this research has found that tables are best when the user’s task is related to finding an individual data value from a larger data set, whereas line and bar graphs are more appropriate for gaining an understanding of data changes over time (See Table 8.8).
Table 8.8 Guidelines for Selecting Tables vs. Graphs
Use Tables forReading individual data valuesUse Graphs forProviding a quick summary of data Detecting trends over timeComparing points and patterns of difierent variables Forecasting activitiesReporting vast amounts of information when relatively simple impressions are to be drawn
leS Setf-tnsirueiional Material
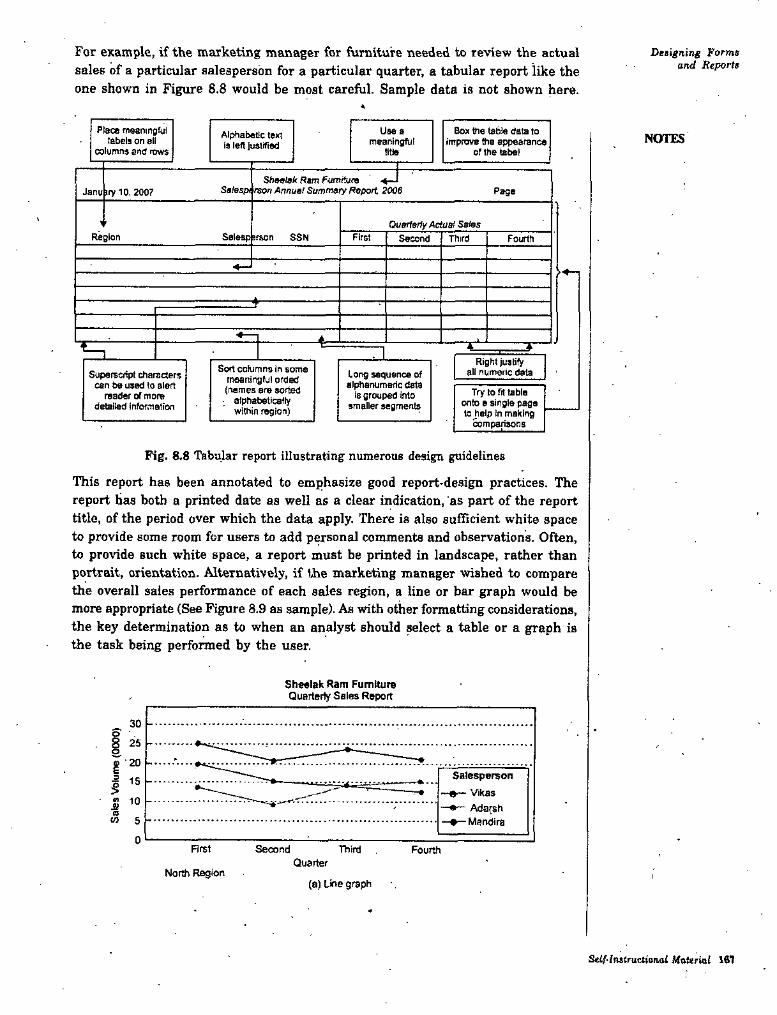
For example, if the marketing manager for furniture needed to review the actual sales of a particular salesperson for a particular quarter, a tabular report like the one shown in Figure 8.8 would be most careful. Sample data is not shown here.
Designing Forms and Reports
«
Place meaningful labels on all
columns and lows
Box table data to impiove the appearance
of the tabel
Use aAlphabetic text la left justified NOTESmeaningful
titia
Sfieeiak f?8m Pomifuie Sa/espi fson Annuel Summary Report 2006 PageJanu iry 10, 2007
Ouarferfy Actual SalesSalesp irson SSNRegion First Second Third Fourth
>♦-!
44 X yn1Right justify
all numeric dataSon colurnnsinsome meaningful orded (hemes are sorted
alphabetically within regioh)
Long sequmce of alphanumeric data
Is grouped into smaller segments
Superscript characters can be used to alert
reader of more detailed information
Try to fit table onto e single page to help in making
comparisons
Fig. 8.8 Tabular report illustrating numerous design guidelines
This report has been annotated to emphasize good report-design practices. The report has both a printed date as well as a clear indication, as part of the report title, of the period over which the data apply. There is also sufficient white space to provide some room for users to add personal comments and observations. Often, to provide such white space, a report must be printed in landscape, rather than portrait, orientation. Alternatively, if liie marketing manager wished to compare the overall sales performance of each sales region, a line or bar graph would be more appropriate (See Figure 8.9 as sample). As with other formatting considerations, the key determination as to when an analyst should select a table or a graph is the task being performed by the user.
Sheelak Ram Fumitura Quarterly Sales Report
30
25♦•20i Salesperson
Vikas•—*— Adarsh —Mendira
I• I 10
oW 5
0Rrst Second •niird . Fourth
QuarterNorth Region I
(a) Lif»e graph
Scif-insfructtonat Material 367
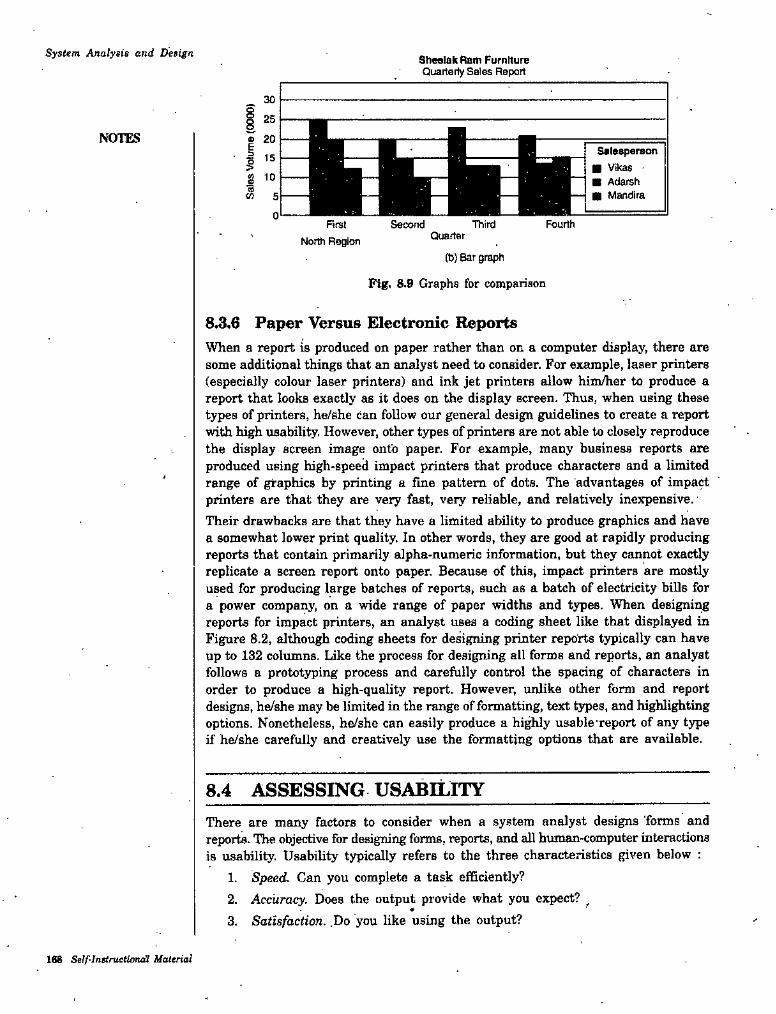
Sysltm Analysia and Design SheelakRam Furniture Quarterly Sales Report
30§8
NOTES 20B Salasperaon■ Vikas '■ Adarsh■ Mattdira
. 3 15o>10we
■aw
FourthFirst Second ThirdQuarterNorth Region
(t>) Bar graph
Fig. 8.9 Graphs for comparison
8^.6 Paper Versus Electronic ReportsWhen a report is produced on paper rather than on a computer display, there are some additional things that an analyst need to consider. For example, laser printers (especially colour laser printers) and ink jet printers allow him/her to produce a report that looks exactly as it does on the display screen. Thus, when using these types of printers, he/she can follow our general design guidelines to create a report with high usability. However, other types of printers are not able to closely reproduce the display screen image onto paper. For example, many business reports are produced using high-speed impact printers that produce characters and a limited range of graphics by printing a fine pattern of dots. The advantages of impact printers are that they are very fast, very reliable, and relatively inexpensive. Their drawbacks are that they have a limited ability to produce graphics and have a somewhat lower print quality. In other words, they are good at rapidly producing reports that contain primarily alpha-numeric information, but they cannot exactly replicate a screen report onto paper. Because of this, impact printers are mostly used for producing large batches of reports, such as a batch of electricity bills for a power company, on a wide range of paper widths and types. When designii^ reports for impact printers, an analyst uses a coding sheet like that displayed in Figure 8.2, although coding sheets for derigning printer reports typically can have up to 132 columns. Like the process for designing all forms and reports, an analyst follows a prototyping process and carefully control the spacing of characters in order to produce a high-quality report. However, unlike other form and report designs, he/she may be limited in the range of formatting, text types, and highlighting options. Nonetheless, he/she can easily produce a highly usable report of any type if he/she carefully and creatively use the formatting options that are available.
8.4 ASSESSING USABILITYThere are many factors to consider when a system analyst designs forms and reports. The objective for designii^ forms, reports, and all hximan-computer interactions is usability. Usability typically refers to the three characteristics given below :
1. Speed. Can you complete a task efficiently?2. Accuracy. Does the output provide what you expect? ^3. Satisfaction. .Do you like using the output?
166 Self-Instntctiondl Material
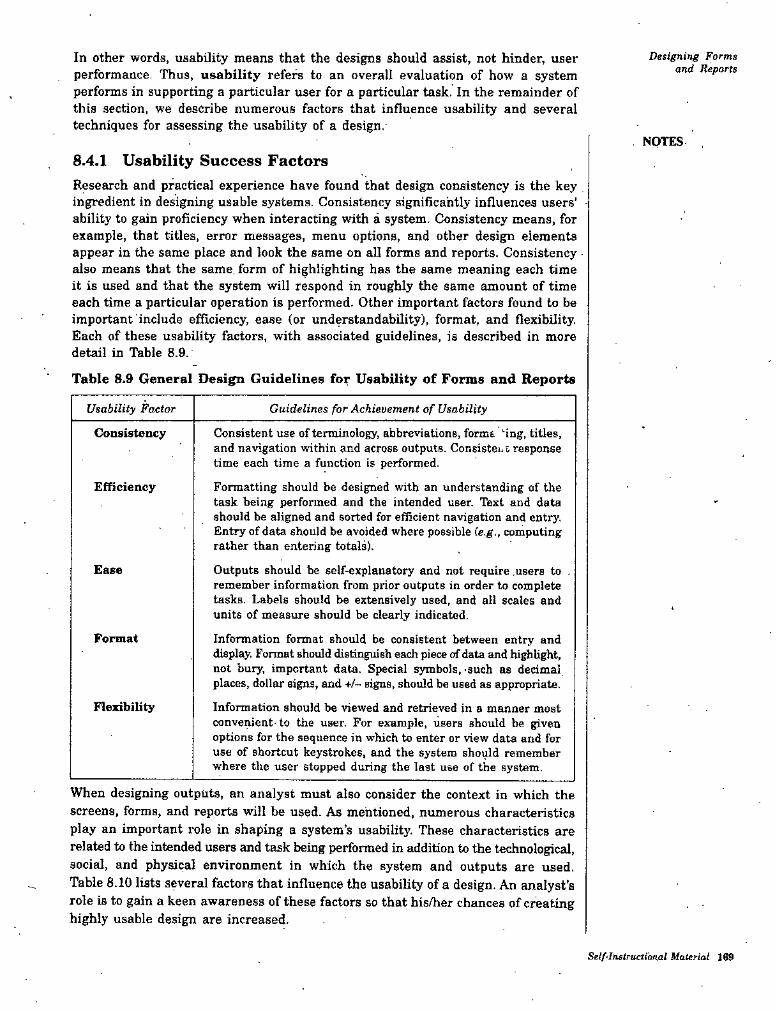
In other words, usability means that the designs should assist, not hinder, user performance. Thus, usability refers to an overall evaluation of how a system performs in supporting a particular user for a particular task. In the remainder of this section, we describe numerous factors that influence usability and several techniques for assessing the usability of a design.'
Designing Forms and Reports
NOTES8.4.1 Usability Success FactorsResearch and practical experience have found that design consistency is the key ingredient in designing usable systems. Consistency significantly influences users’ ability to gain proficiency when interacting with a system. Consistency means, for example, that titles, error messages, menu options, and other design elements appear in the same place and look the same on all forms and reports. Consistency . also means that the same form of highlighting has the same meaning each time it is used and that the system will respond in roughly the same amount of time each time a particular operation is performed. Other important factors found to be important include efficiency, ease (or understandability), format, and flexibility, Each of these usability factors, with associated guidelines, is described in more detail in Table 8.9.
Table 8.9 General Design Guidelines for Usability of Forms and Reports
Usability Factor Guidelines for Achievement of Usability
Consistency Consistent use of terminology, abbreviations, forme ‘ing, titles, and navigation within and across outputs. Consistei.t response time each time a function is performed.
Formatting should be designed with an understanding of the task being performed and the intended user. Text and data should be aligned and sorted for efficient navigation and entry. Entry of data should be avoided where possible (e.g., computing rather than entering totals).
Outputs should be self-explanatory and not require .users to . remember information from prior outputs in order to complete tasks. Labels should be extensively used, and all scales and units of measure should be clearly indicated.
Information format should be consistent between entry and display. Format shoxild distinguish each piece of data and hi^light, not bury, important data. Special symbols,'SUch as decimal places, dollar signs, and */- signs, should be used as appropriate.
Information should be viewed and retrieved in a manner most convenient-to the user. For example, users should be given options for the sequence in which to enter or view data and for use of shortcut keystrokes, and the system should remember where the user stopped during the last use of the system.
Efficiency
Ease
Format
Flexibility
When designing outputs, an analyst must also consider the context in which the screens, forms, and reports will be used. As mentioned, numerous characteristics play an important role in shaping a system’s usability. These characteristics are related to the intended users and task being performed in addition to the technological, social, and physical environment in which the system and outputs are used. Table 8.10 lists several factors that influence the usability of a design. An analyst’s role is to gain a keen awareness of these factors so that his/her chances of creating highly usable design are increased.
Self-Instructional Material 169
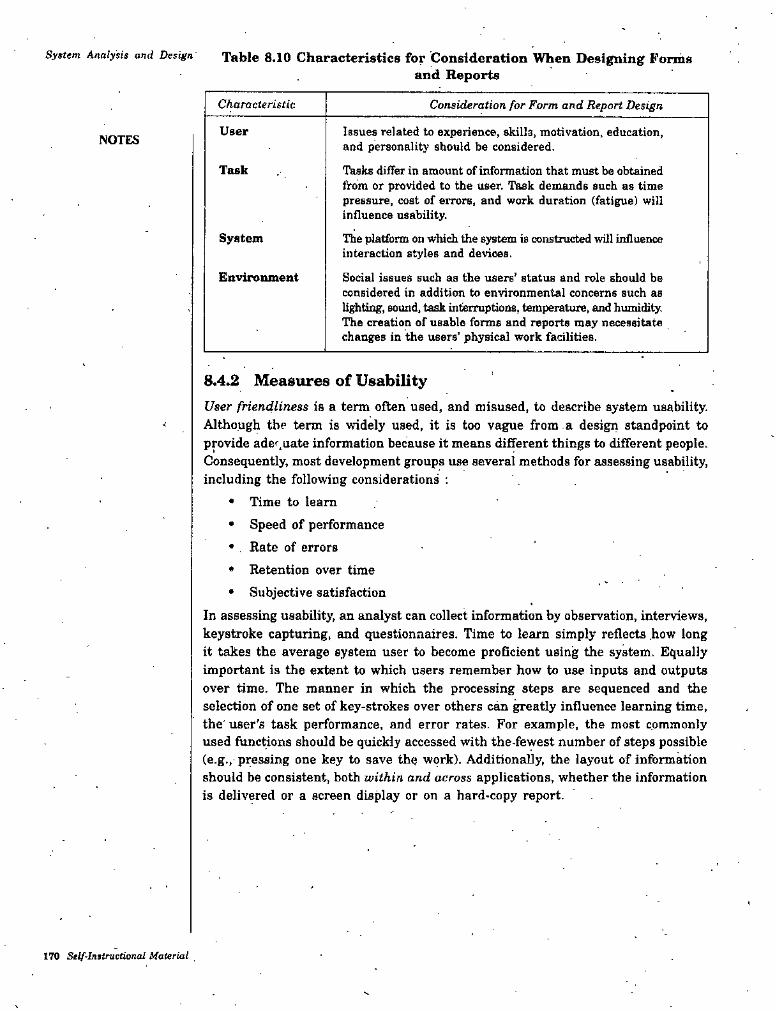
System Analysis and Design Table 8.10 Characteristics for Consideration When Designing Formsand Reports
Characteristic Consideration for Form and Report Design
User Issues related to experience, skills, motivation, education, and personality should be considered.
l^sks differ in amount of information that must be obtained from or provided to the user. Task demands such as time pressure, cost of errors, and work duration (fatigue) will influence usability.
The platform on which the system is constructed will influence interaction styles and devices.
Social issues such as the users’ status and role should be considered in addition to environmental concerns such as lifting, sound, task interruptions, temperature, and humidity. The creation of usable forms and reports may necessitate changes in the users’ physical work facilities.
NOTES
Task
System
Environment
8.4.2 Measttres of UsabilityUser friendliness is a term often used, and misused, to describe system usability. Although the term is widely used, it is too vague from a design standpoint to provide ade<^,uate information because it means different things to different people. Consequently, most development groups use several methods for assessing usability, including the following considerations ;
• Time to learn
• Speed of performance• Rate of errors
• Retention over time• Subjective satisfaction
In assessing usability, an analyst can collect information by observation, interviews, keystroke capturing, and questionnaires. Time to learn simply reflects how long it takes the average system user to become proficient using the system. Equally important is the extent to which users remember how to use inputs and outputs over time. The manner in which the processing steps are sequenced and the selection of one set of key-strokes over others can greatly influence learning time, the' user's task performance, and error rates. For example, the most commonly used functions should be quickly accessed with the-fewest number of steps possible (e.g., pressing one key to save the work). Additionally, the layout of information should be consistent, both within and across applications, whether the information is delivered or a screen display or on a hard-copy report.
170 Self-Instructional Material

Denigning Form^ and Reports
STUDENT ACTIVITY 8.2
^/f^rn^ting forms and reports.
ai-
z/
z
2. What is meant by usahiUty and what characteristics of an interface are used to assess a system’s usability?
Self-lnstruotU>nal Material 17*
Seif./,'“froraj,

V.System AnaiysU and Design r
SUMHAEY - \ \• A form ie a busioess docmaent tbat,cQpiin^-
include some areas wnersrsrf^- fffion.isatyp*NOTFi?
✓
*
\
I
t
\f
* -S >
; ,
*
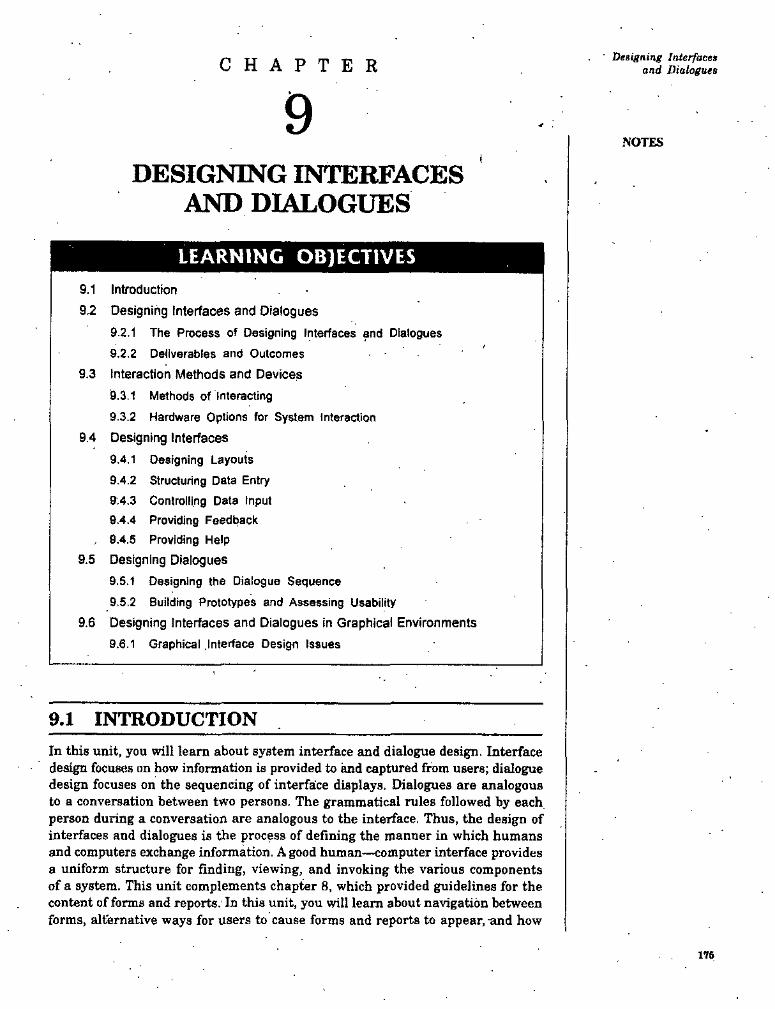
' Designing Interfaces and DialoguesCHAPTER
NOTES
DESIGNING INTERFACES
AND DIALOGUES
LEARNING OB)ECTIVES9.1 Inbxjduction9.2 Designing Interfaces and Oiaiogues
9.2.1 The Process of Designing Interfaces and Dialogues9.2.2 Deliverables and Outcomes
9.3 interaction Methods and Devices9.3.1 Methods of Interacting9.3.2 Hardware Options for System Interaction
9.4 Designing Interfaces
9.4.1 Designing Layouts9.4.2 Structuring Data Entry9.4.3 Controlling Data Input9.4.4 Providing Feedback
, 9.4.5 Providing Help9.5 Designing Dialogues
9.5.1 Designing the Dialogue Sequence9.5.2 Building Prototypes and Assessing Usability
9.6 Designing Interfaces and Dialogues in Graphical Environments 9.6.1 Graphical .Interface Design Issues
9.1 INTRODUCTIONIn this unit, you will learn about system interface and dialogue design. Interface design focuses on how information is provided to and captured from users; dialogue design focuses on the sequencing of interface displays. Dialogues are analogous to a conversation between two persons. The grammatical rules followed by each person during a conversation are analogous to the interface. Thus, the design of interfaces and dialogues is the process of defining the manner in which humans and computers exchange information. A good human—computer interface provides a uniform structure for finding, viewing, and invoking the various components of a system. This unit complements chapter 8, which provided guidelines for the content of forms and reports. In this unit, you will learn about navigation between forms, alternative ways for users to cause forms and reports to appear, and how
176
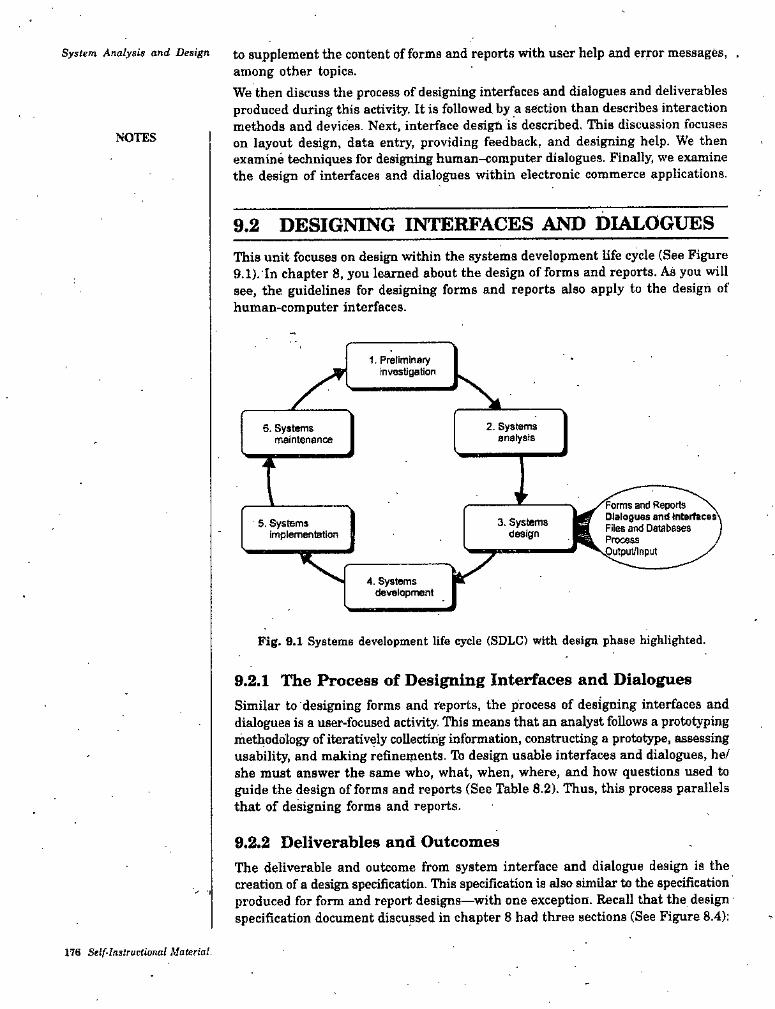
System Analysis and Design to supplement the content of forms and reports with user help and error messages, ,among other topics.We then discuss the process of designing interfaces and dialogues and deliverables produced during this activity. It is followed by a section than describes interaction methods and devices. Next, interface design is described, This discussion focuses on layout design, data entry, providing feedback, and designing help. We then examine techniques for designing human-computer dialogues. Finally, we examine the design of interfaces and dialogues within electronic commerce applications.
NOTES
9.2 DESIGNING INTERFACES AND DIALOGUESThis unit focuses on design within the systems development life cycle (See Figure 9.1). In chapter 8, you learned about the design of forms and reports. As you will see, the guidelines for designing forms and reports also apply to the design of human-computer interfaces.
1. Preliminary investigation
2. Systems anaiysis
6. Systems maintenance
I Forms and Reports \Dialogues and Interfaces Files and Databases Process /.Output/lnput
3. Systems design
5. Systems implementation
fVj 4. Systems development
Pig. 9.1 Systems development life cycle (SDLC) with design phase highlighted.
9.2.1 The Process of Designing Interfaces and DialoguesSimilar to designing forms and reports, the process of designing interfaces and dialogues is a user-focused activity. This means that an analyst follows a prototyping methodology of iteratively collecting information, constructing a prototype, assessing usahili^, and making refinements. Tb design usable interfaces and dialogues, he/ she must answer the same who, what, when, where, and how questions used to guide the design of forms and reports (See Table 8.2). Thus, this process parallels that of designing forms and reports.
9.2.2 Deliverables and OutcomesThe deliverable and outcome from system interface and dialogue design is the creation of a design specification. This speciiication is also similar to the specification produced for form and report designs—with one exception. Recall that the design specification document discussed in chapter 8 had three sections (See Figure 8.4):
176 Self-Instructioml Material.
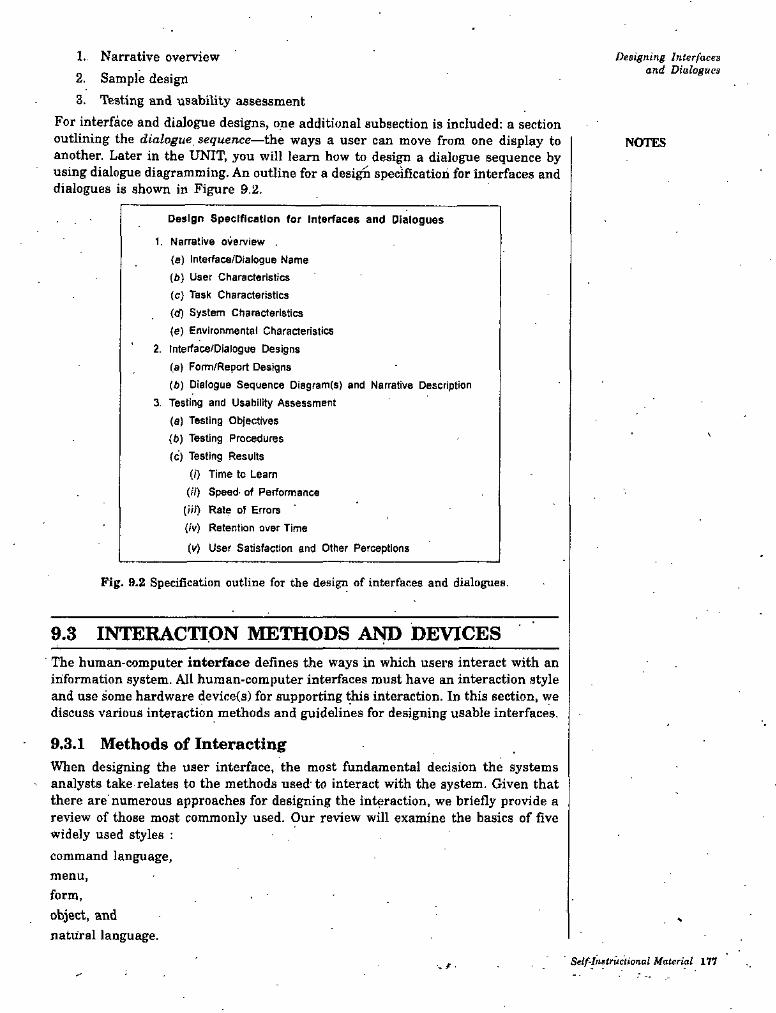
1. Narrative overview2. Sample design3. Testing and -usability assessment
For interface and dialogue designs, one additional subsection is included: a section outlining the dialogue sequence—the ways a user can move from one display to another. Later in the UNIT, you will learn how to design a dialogue sequence by using dialogue diagramming. An outline for a desi^ specification for interfaces and dialogues is shown in Figure 9.2.
Designing Interfaces and Dialogues
NOTES
Design Specification (or Interfaces and Dialogues
1. Narrative overview .
(a) Interface/Dialogue Name(b) User Characteristics(c) Task Characteristics(d) System Characteristics(e) Environmental Characteristics
2. Interface/Dialogue Designs(a) Form/Report Designs(6) Dialogue Sequence Oiagram(s) and Narrative Description
3. Testing and Usability Assessment (s) Testing Objectives(b) Testing Procedures
(c) Testing Results (0 Time to Learn
(//) Speed' of Perfomiance[i'll) Rale of Errors(I’v) Retention over Time
(v) User Satisfaction and Other Perceptions
Fig. 9.2 Specification outline for the design of interfaces and dialogues.
9.3 INTERACTION METHODS AND DEVICESThe human-computer interface defines the ways in which users interact with an information system. All human-computer interfaces must have an interaction style and use some hardware device(s) for supporting this interaction. In this section, we discuss various interaction methods and guidelines for designing usable interfaces.
9.3.1 Methods of InteractingWhen designing the user interface, the most fundamental decision the systems
' analysts take relates to the methods used-to interact with the system. Given that there are'numerous approaches for designing the interaction, we briefly provide a review of those most commonly used. Our review will examine the basics of five widely used styles : command language, menu, form,object, and natural language.
Self-Instructional Material 177
We will also describe several devices for interacting, focusing primarily on their usability for various interaction activities.Command Language Interaction. In command language interaction, the user enters explicit statements to invoke operations within a 83r8tem. This type of interaction requires system users to remember command syntax and semantics. For example, to copy a file named BIODATA.DOC from one storage location (C:) to another (A:) using Microsoft’s disk operating system (DOS), a user would type the following command':COPY C;BIODATA.DOC A:BIODATA.DOCCommand language interaction places a substantial burden on the user to remember names, syntax, and operations. Most newer or large-scale systems no longer rely entirely on a command language interface. Yet, command languages are good for experienced users, for systems with a limited command set, and for rapid interaction with the system.A relatively simple application such as a word processor may have hundreds of
. commands for such operations as saving a file, deleting words, cancelling the current action, finding a specific piece of data, or switching between windows. Some of the' burden of assigning keys to actions has been taken oft u^rs shoulders through the development of user interface standards such as those for the Macintosh, Microsoft Windows, or Java. 'Menu Interaction. A significant amount of interface design research has stressed the importance of a system's ease of use and understandability. Menu interaction is a means by which many designers have accomplished this goal. A menu is simply a list of options; when an option is selected by the user, a specific command is invoked or another menu is activated. Menus have become the most widely used interface method because the user only needs to understand simple signposts and route options to effectively navigate through a system.Menus can differ signiGcantly in . their design and complexity. The variation of their design is most often related to the capabilities of the development environment, the skills of the developer, and tiie size and complexity of the system. For smaller and less complex systems with limited system options, you may use a single menu or a linear sequence of menus. A single menu has obvious advantages over a command language but may provide little guidance beyond .invoking the command. An example of a menu is shown in Figxua 9.3.
SytUm Analyaii and Design
rt
NOTES
I
' -jT’ , T g •■r
>.»Ja !t
t-'
\
t -
t
Fig. 9.3 Example of a menu.178 Self-lntirvelieneU Hauriai

Designing Forms and Reports
STUDENT ACTIVITY 8.2
1. Write a short note of formatting forms and reports.
2. What is meant by usability and what characteristics of an interface are used to assess a system's usability?
Self-Instructional Material 171
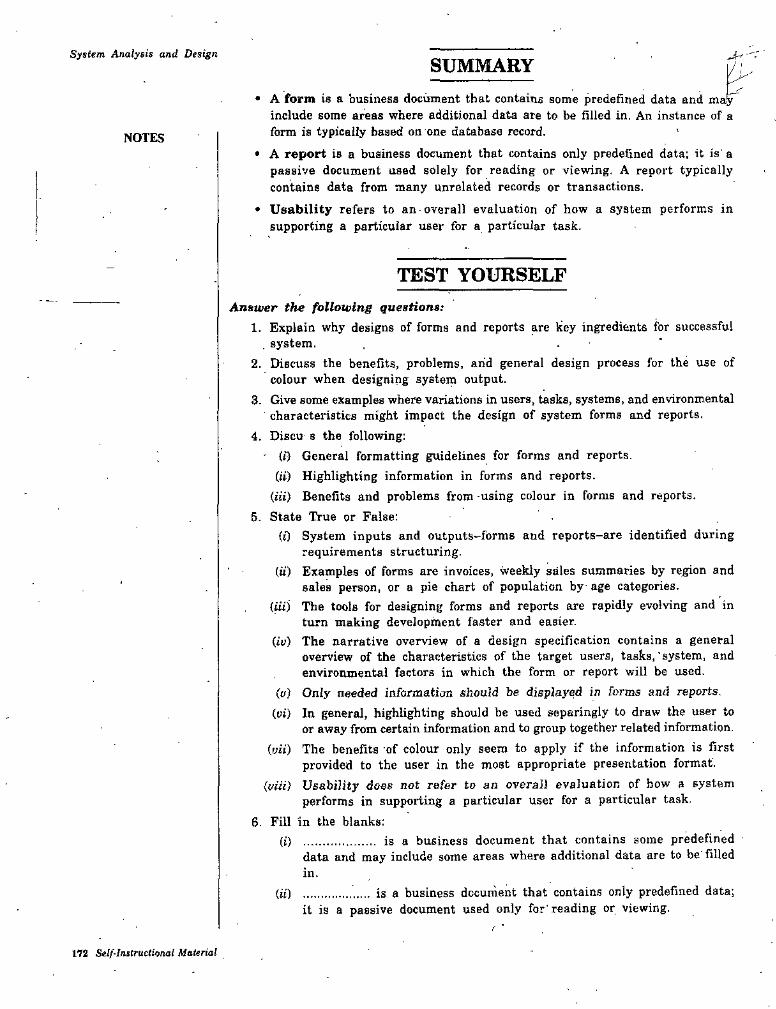
System Analysis and DesignSUMMARY {/ '
• A form is a business dociiinent that contains some predefined data and ma^ include some areas where additional data are to be filled in. An instance of a form is typically based on one database record.
• A report is a business document that contains only predefined data; it is' a passive document used solely for reading or viewing. A report typically contains data from many unrelated records or transactions.
• Usability refers to an overall evaluation of how a system performs in supporting a particular user for a particular task.
NOTES
TEST YOURSELFAnswer the following questions;
1. Explain why designs of forms and reports are key ingredients for successfulsystem. . ‘
2. Discuss the benefits, problems, arid general design process for the use of colour when designing system output.
3. Give some examples where variations in users, tasks, systems, and environmental characteristics might impact the design of system forms and reports.
4. Discu s the following:- (i) General formatting guidelines for forms and reports.
(ii) Highlighting information in forms and reports.(Hi) Benefits and problems from -using colour in forms and reports.
5. State True or False:(0 System inputs and outputs-forms and reports-are identified during
requirements structuring.(ii) Examples of forms are invoices, weekly sales summaries by region and
sales person, or a pie chart of population by age categories.(iii) The tools for designing forms and reports are rapidly evolving and in
turn making development faster and easier.(to) The narrative overview of a design specification contains a general
overview of the characteristics of the target users, tasks,'system, and environmental factors in which the form or report will be used.
(u) Only needed information should be displayed in forms and reports, (oi) In general, highlighting should be used separingly to draw the user to
or away from certain information and to group together related information. ivii) The benefits of colour only seem to apply if the information is first
provided to the user in the most appropriate presentation format.(i/iii) Usability does not refer to an overall evaluation of bow a system
performs in supporting a particular user for a particular task.6. Fill in the blanks:
..................... is a business document that contains some predefineddata and may include some areas where additional data are to be filled
(i)
in.................... is a business document that contains only predefined data;it is a passive document used only for'reading or viewing.
(«)
172 Self-Instructional Material
(ui) Designing forms and reports is a user-focused activity that typically follows approach.
(io) Using actual development tools allows the forms and reports design to be more thoroughly
(p) Benefits from using or strikes the eye.
Designing Forms and Reportsa
in forms and reports is that it soothes NOTES
.... for reading individual data values in forms and reports....... for providing a quick summary of data in reports.is an overall evaluation of how a system performs in
supporting a particular user for a particular task.
(pi) Use(vii) Use
(ptii) ......
ANSWERSTest Yourself
5. State True or False:(i) True
m True (v) True
{vii) True6. Fill in the blanks;
(0 Form (iit). prototyping
(p) colour (pii) graphics
(ii) False (ill) True (pi) True
(put) False
(it) Report(ip) tested and assessed (pt) tables
(piti) Usability
Self-Inttnefitinal’MMerial 173

4
/
N
*
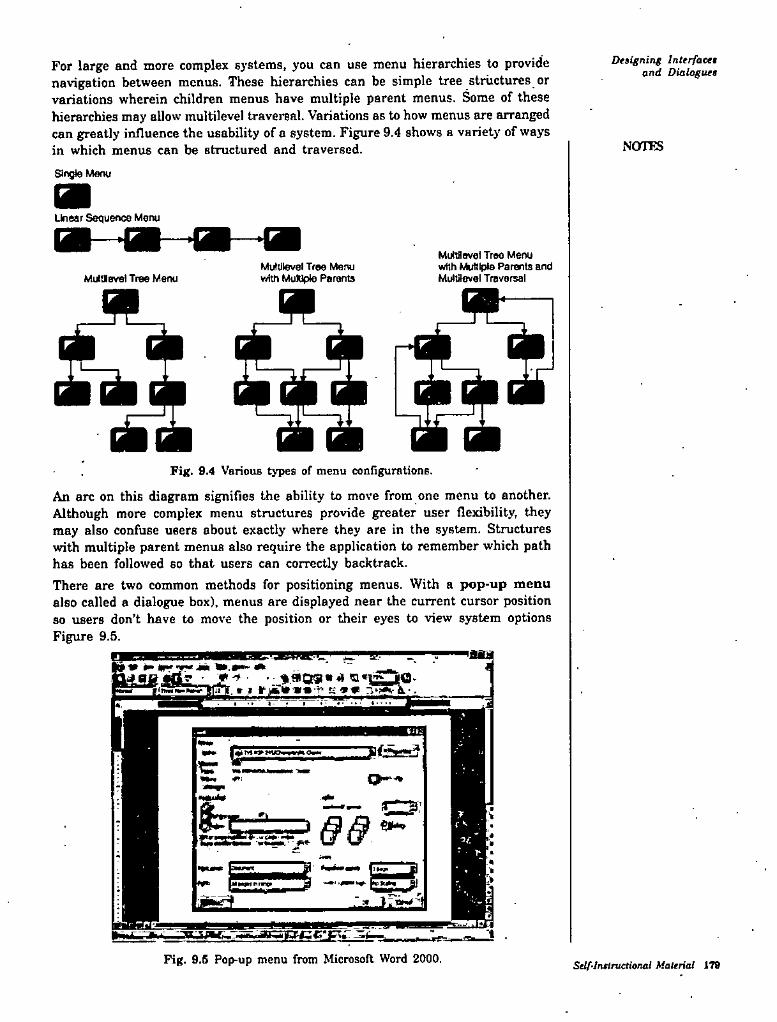
Detigning Interfaett and Dialogue$For large and more complex systems, you can use menu hierarchies to provide
navigation between menus. These hierarchies can be simple tree structures or variations wherein children menus have multiple parent menus. Some of these hierarchies may allow multilevel traversal. Variations as to how menus are arranged can greatly influence the usability of a system. Figure 9.4 shows a variety of ways in which menus can be structured and traversed.Slngte Menu
NOTES
Linear Seouence Menu
Multilavel Tree Menu with Mutilpis Parents and Muliilsvel Traversal
MulUlevel Tree Menu wfth MuWple ParentsMultlBvel Tree Menu m
fiiX [¥liSdfa liBi
Fig. 9.4 Various types of menu configurations.
An arc on this diagram signifies the ability to move from one menu to another. Although more complex menu structures provide greater user flexibility, they may also confuse users about exactly where they are in the system. Structures with multiple parent menus also require the application to remember which path has been followed so that users can correctly backtrack.There are two common methods for positioning menus. With a pop-up menu also called a dialogue box), menus are displayed near the current cursor position so users don’t have to move the position or their eyes to view system options Figure 9.5.
P 4,>#a.
I. i «-u.
cr *--------- -.'r
>eg-*
.«t*
F■» Jrww
1 .
Fig. 9.8 Pop-up menu from Microsoft Word 2000. Self-lnttruetionel Material 179
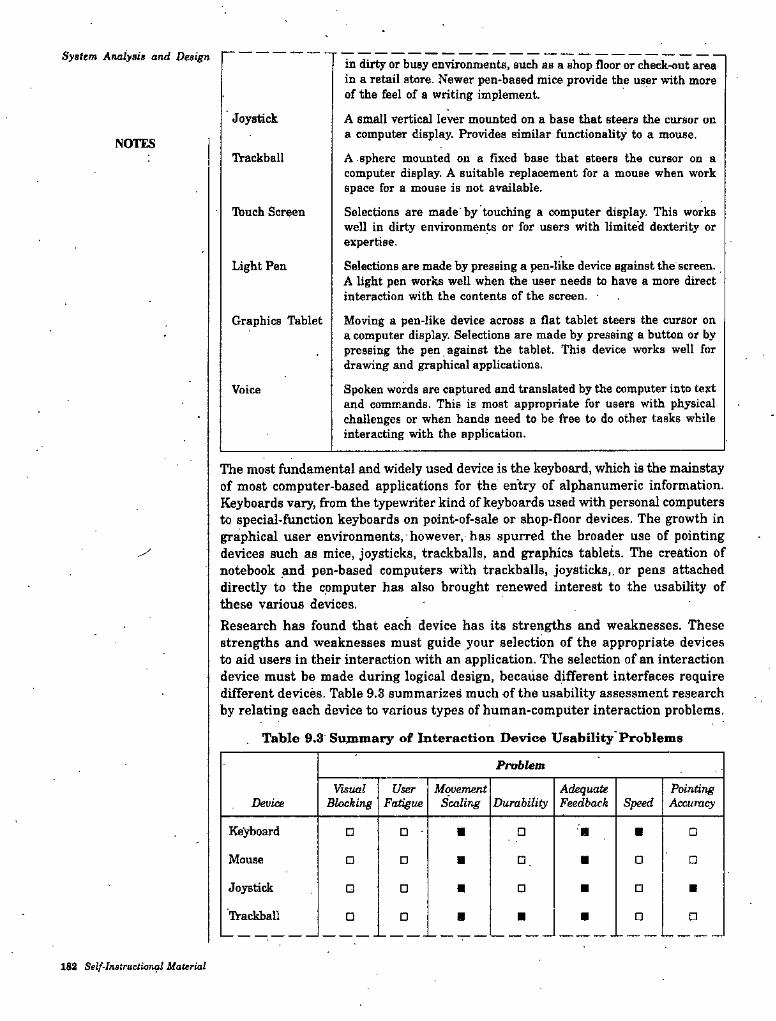
System Analysis and Design in dirty or busy environments, such as a shop floor or check-out area in a retail store. Newer pen-based mice provide the user with more of the feel of a writing implement.
A small vertical lever mounted on a base that steers the cursor on a computer display. Provides similar functionality to a mouse.
A .sphere mounted on a fixed base that steers the cursor on a computer display. A suitable replacement for a mouse when work space for a mouse is not available.
Selections are made'by touching a computer display. This works well in dirty environments or for users with limited dexterity or expertise.
Selections are made by pressing a pen-like device against the screen. A light pen works well when the user needs to have a more direct interaction with the contents of the screen.
Moving a pen-like device across a flat tablet steers the cursor on a computer display. Selections are made by pressing a button or by pressing the pen against the tablet. This device works well for drawing and graphical applications.
Spoken words are captured and translated by the computer into text and commands. This is moat appropriate for users with physical challenges or when hands need to be free to do other tasks while interacting with the application.
Joystick
NOTESIVackball
Ibuch Screen
Light Pen
Graphics Tablet
Voice
The most fundamental and widely used device is the keyboard, which is the mainstay of most computer-based applications for the entry of alphanumeric information. Keyboards vary, from the typewriter kind of keyboards used with personal computers to special-function keyboards on point-of-sale or shop-floor devices. The growth in graphical user environments, however, has spurred the broader use of pointing devices such as mice, joysticks, trackballs, and graphics tablets. The creation of notebook and pen-based computers with trackballs, joysticks,, or pens attached directly to the computer has also brought renewed Interest to the usability of these various devices.Research has found that each device has its strengths and weaknesses. These strengths and weaknesses must guide your selection of the appropriate devices to aid users in their interaction with an application. The selection of an interaction device must be made during logical design, because different interfaces require different devices. Table 9.3 summarizes much of the usability assessment research by relating each device to various types of human-computer interaction problems.
Table 9.3 Su;ininary of Interaction Device Usability Problems
Problem
PointingAccuracy
VisualBlocking
UserFatigue
MovementScaling
AdequateFeedbackDurability SpeedDevice
Ifeyboard □ □ ■ □ □Mouse □ □ □□ □Joystick □ □ ■ □ □IVackball □ □ □ O
182 Self-Instructional Material
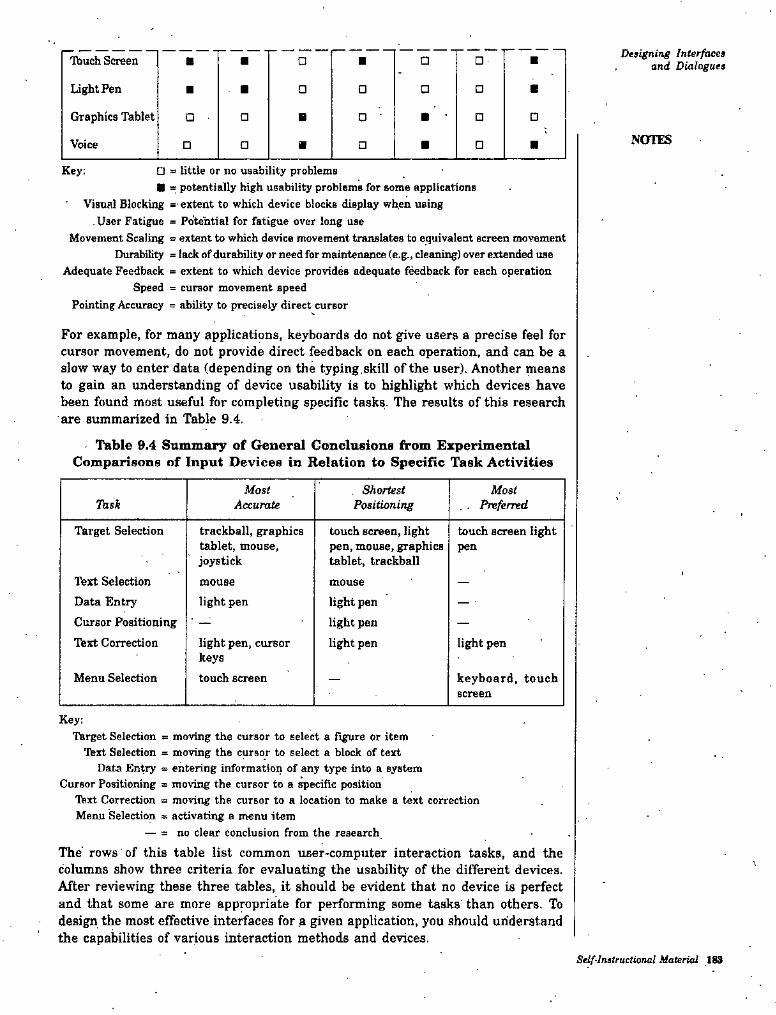
Designing Internees and DialoguesTbuch Screen □ □ ■■ Q
Light Pen □ □ □ □Graphics Tablet □□ • □ □ □
NOTESVoice □□ □ □□ = little or no usability problems■ = potentially high usability problems for some applications
Visual Blocking =■ extent to which device blocks display wh.en using User Fatigue = Potential for fatigue over long use
Movement Scaling = extent to which device movement tramlates to equivalent screen movement Durabili^ = lack of durability or need for maintenance (e.g., cleaning) over extended use
Adequate Feedback = extent to which device provides adequate feedback for each operation Speed = cursor movement speed
Pointing Accuracy = ability to precisely direct cursor
Key;
For example, for many applications, keyboards do not give users a precise feel for cursor movement, do not provide direct feedback on each operation, and can be a slow way to enter data (depending on the typing ,skill of the user). Another means to gain an understanding of device usability is to highlight which devices have been found most useful for completing specific tasks. The results of this research are summarized in Table 9.4.
Table 9.4 Summary of General Gonclusiona from Experimental Comparisons of Input Devices in Relation to Specific Task Activities
MostAccurate
. Shortest Positioning
Most. PreferredThsk
Target Selection trackball, graphics tablet, mouse, joystick
mouse light pen
touch screen, light pen, mouse, graphics tablet, trackball
mouse light pen light pen light pen
touch screen light pen
Text Selection Data Entry Cursor Positioning Text Correction light pen, cursor
keys
touch screen
light pen
Menu Selection keyboard, touch screen
Key:Target Selection = moving the cursor to select a figure or item
Ibxt Selection = moving the cursor to select a block of text Data Entry = entering information of any type into a system
Cursor Positioning = moving the cursor to a specific positionTbxt Correction =■ moving the cursor to a location to make a text correction Menu Selection * activating a menu item
— = no clear conclusion from the research
The rows of this table list common user-computer interaction tasks, and the columns show three criteria for evaluating the usability of the different devices. After reviewing these three tables, it should be evident that no device is perfect and that some are more appropriate for performing some tasks than others. To design the most effective interfaces for a given application, you should understand the capabilities of various interaction methods and devices.
\
Self’Imtructional Material 183

Syatem Analysis and Design
STUDENT ACTIVITY 9.1
1. Describe the process of designing interfaces and dialogues. What deliverables are produced from this process? Are these deliverables the same for all types of system projects? Why?
2. Discuss various methods of interacting with a system. Is any method better than others? Why?
184 Self-Instructional Material
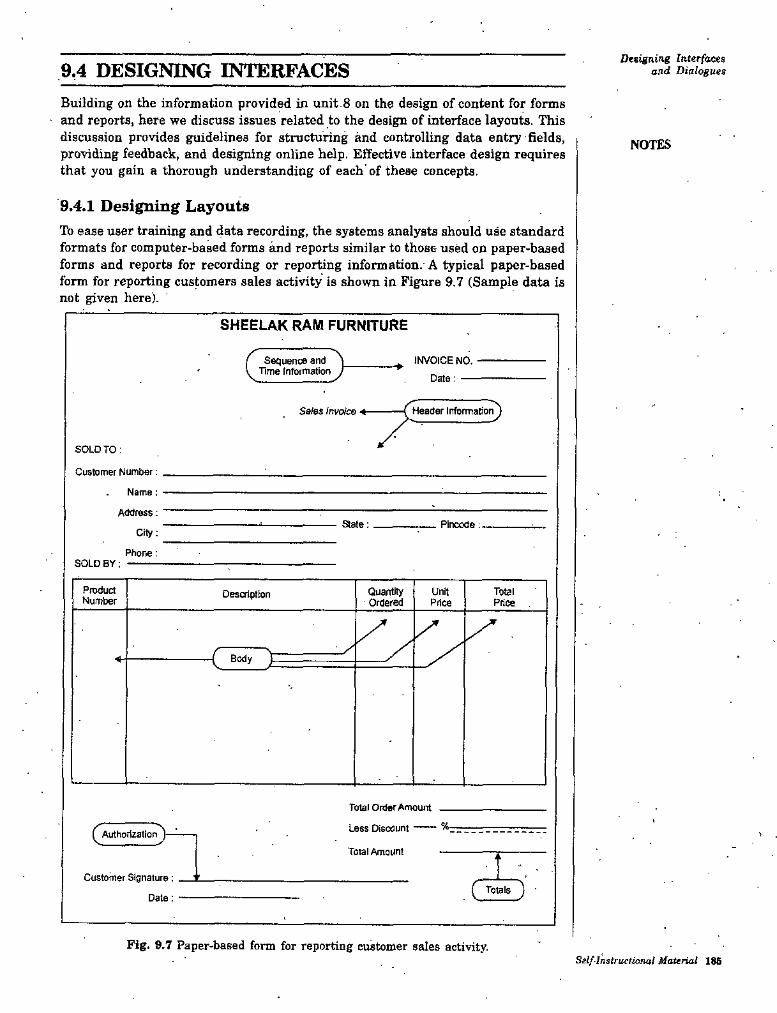
Designing Interfatxs and Dialogues9.4 DESIGNING INTERFACES
Building on the information provided in unit 8 on the design of content for forms ' and reports, here we discuss issues related to the design of interface layoute. This
discussion provides guidelines for structuring and controlling data entry fields, providing feedback, and designing online help. Effective interface design requires that you gain a thorough understanding of each of these concepts.
NOTES
9.4.1 Designing Layoutslb ease user training and data recording, the systems analysts should use standard formats for computer-based forms and reports similar to those used on paper-based forms and reports for recording or reporting information. A typical paper-based form for reporting customers sales activity is shown in Figure 9.7 (Sample data is not given here).
SHEELAK RAM FURNITURE
Sequence and Time Information
INVOICE NO- Date: —
Header Irformatio^Sales Invoice
SOLD TO:
Customer Number
Name
AddressState: Pincode;
City
PhoreSOLD BY:
ProductNumber
QuantityOrdered
Unit TotalPrice
DescriptionPrice
■( Body ^*
Total Order Amount
^^AuthortzationJ—^ Less Discount >Total Amount
Customer Signature; t Date:------ .c ) ■Totals
Fig. 9.7 Paper-based form for reporting customer sales activity.Self-Instructional Material 186
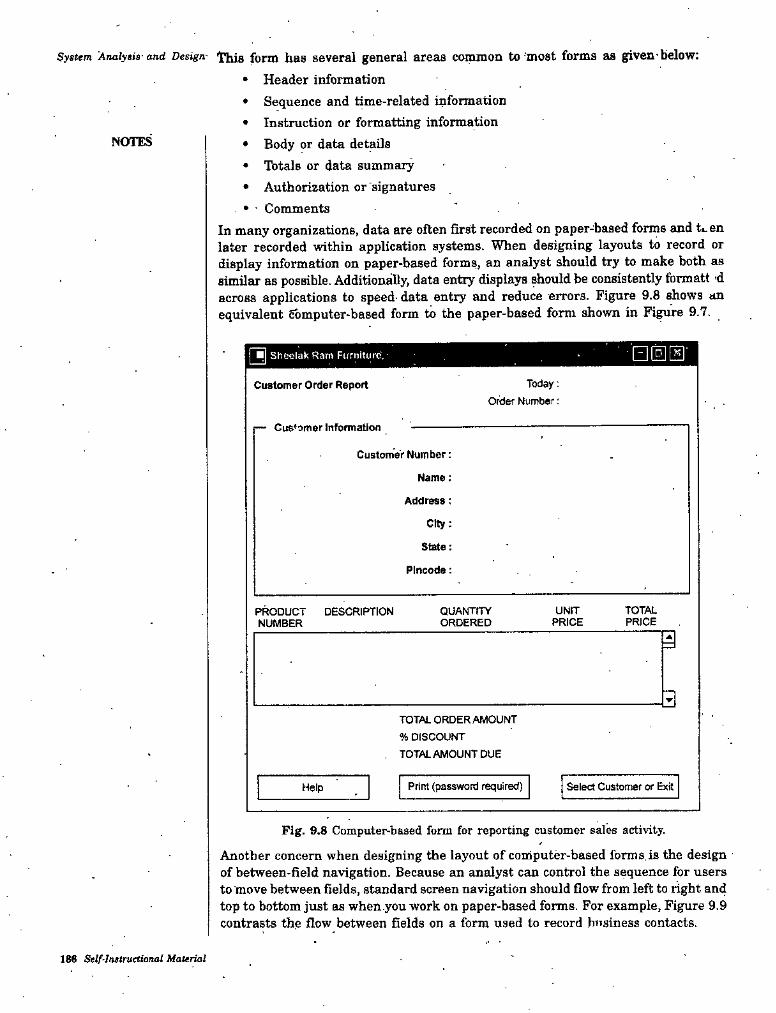
System Analysis-and Design- This form has several general areas common to most forms as given below:• Header information• Sequence and time-related information• Instruction or formatting information• Body or data details• Totals or data summary• Authorization or 'signatures• Comments ' .
In many organizations, data are often first recorded on paper-bsised forms and ti.en later recorded within application systems. When designing layouts to record or display information on paper-based formss, an analyst should try to make both as similar as possible. AdditionaDy, data entry displays ^ould be consistently formatt'd across applications to speed- data entry and reduce errors. Figure 9.8 shows an equivalent computer-based form to the paper-based form shown in F^ure 9.7.
NOTES
000■ Sheelak Ram Furniture.
Today; 0«Jer Number:
Customer Order Report
Customer Information
Custwner Number:
Name:
Address;
City;
State:
PIncode:
TOTALPRICE
QUANITTYORDERED
UNITPRICE
PRODUCT DESCRIPTION NUMBER
A
TOTAL ORDERAMOUNT % DISCOUNT
. TOTALAMOUNTDUE
Print (password required) Select Customer or ExitHelp
Fig. 9.8 Computer-based form for reporting customer sales activity.
Another concern when designing the layout of computer-based forms, is the design of between-field navigation. Because an analyst can control the sequence for users to move between fields, standard screen navigation should flow from left to right and top to bottom just as when.you work on paper-based forms. For example. Figure 9.9 contrasts the flow between fields on a form used to record business contacts.
186 Self-lnstruetional Material
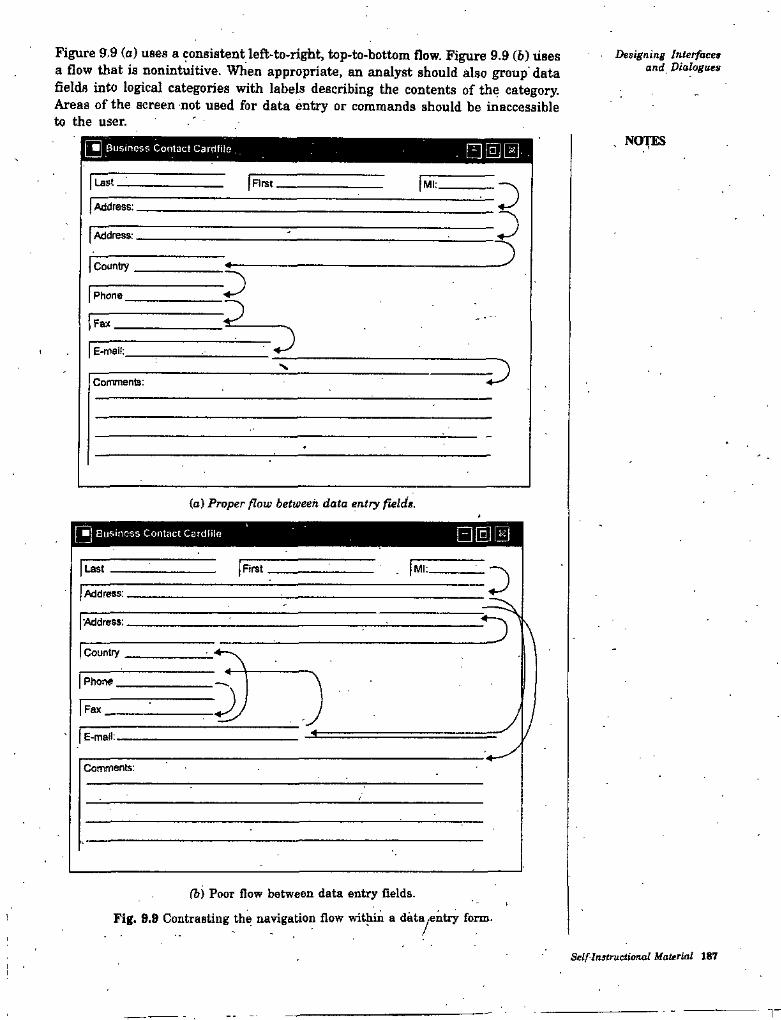
Figure 9.9 (a) uses a consistent left-to-right, top-to-bottom flow. Figure 9.9 (b) uses a flow that is nonintuitive. When appropriate, an analyst should also group' data fields into logical categories with labels describing the contents of the category. Areas of the screen not used for data entry or commands should be inaccessible to the user.
Designing Interfaces and Dialogues
, NOTES■ Business Contact Cardfile . . E][e]S- •Last Rrst
Address:
Address;
♦Country
Phone 2Ifw
E-mail:N
Comment:
(o) Proper flow between data entry fields.
Business Contact Cardfilo BSS|Mh!RrstLast :)
Address;
-Address:
Country
*Phone
Fax
E-mafI:
Comments:
(b) Poor flow between data entry fields.
Fig. 9.9 Contrasting the navigation flow within a data^ntry form.
Self-Instructional Material 187

System Analysis and Design requested, As with the display of information, all data entered onto a form shouldautomatically justify in a standard format {e.g., date, time, money). Table 9.7 illustrates a few options appropriate for printed forms.
Table 9.7 Options for Entering TextNOTES ExampleOptions
Line caption Phone Number ( )
Drop caption ()
Phone Number
Phone NumberBoxed caption
Delimited characters ( )
Phone Number
Check-off boxes Method of payment (check one)
□ Check
O Cash
□ Credit card: Type
For data entry on video display terminals, an analyst should highlight the area in which text is entered so that the exact number of characters per line and number of lines are clearly shown. Systems analysts can also use check boxes or radio buttons to allow users to choose standard textual responses, And, you can use data entry controls to ensure that the proper type of data (alphabetic or numeric, as required) are entered. Data entry controls are discussed in the following section.
9.4.3 Controlling Data InputOne objective of interface design is to reduce data entry errors. As data are entered into an information system, steps must be taken to ensure that the input is valid. A systems analyst must anticipate the types of errors users may make and design features into the system's interfaces to avoid, detect and correct data entry mistakes. Several types of data errors are summarized in Table 9.8.
Table 9.8 Sources of Data Errors
Data Error Description
Adding additional characters to a held
Losing characters from a field
Entering invalid data into a field
Reversing the sequence of one or more characters in a field
Appending
IVuncating
Transcripting
Transposing
In essence, data errors can occur from appending extra data onto a field, truncating characters off a field, transcripting the wrong characters into a field, or transposing one or more characters within a field. Systems designers have developed numerous tests and'techniques for catching invalid data before saving or transmission, thus improving the likelihood that data will be valid (See Table 9.9 for a summary of these techniques).
190 Self Instructional Material
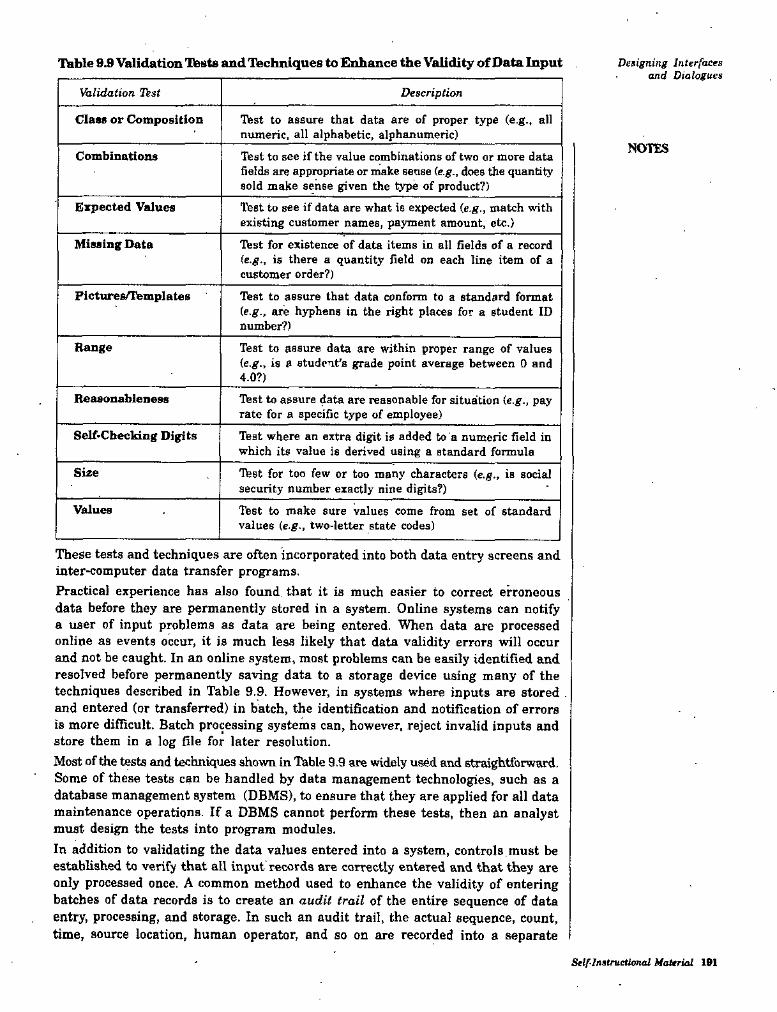
Table 9.9 Validation Testa and Techniques to Enhance the Validity of Data Input Designing Interfaces and Dialogues
Validation list Description
Class or Composition Ttest to assure that data are of proper type (e.g., all numeric, all alphabetic, alphanumeric)
NOTESCombinations Tbst to see if the value combinations of two or more data fields are appropriate or make sense (e.g., does the quantity sold make sense given the type of product?)
Expected Values Test to see if data are what is expected (e.g., match with existing customer names, payment amount, etc.)
Missing Data Ibst for existence of data items in all fields of a record (e.g., is there a quantity field on each line item of a customer order?)
Pictures/lbmplates Test to assure that data conform to a standard format (e.g., are hyphens in the right places for a student ID number?)
Range Test to assure data are within proper range of values (e.g., is a student’s grade point average between 0 and 4.0?)
Reasonableness Ibst to assure data are reasonable for situation (e.g., pay rate for a specific type of employee)
Self-Checking Digits Ibst where an extra digit is added to a numeric field in which its value is derived using a standard formula
Size Tfest for too few or too many characters (e.g., is social security number exactly nine digits?)
Values Test to make sure values come from set of standard values (e.g., two-letter state codes)
These tests and techniques are often incorporated into both data entry screens and inter-computer data transfer programs.Practical experience has also found that it is much easier to correct erroneous data before they are permanently stored in a system. Online systems can notify a user of input problems as data are being entered. When data are processed online as events occur, it is much less likely that data validity errors will occur and not be caught. In an online system, most problems can be easily identified and resolved before permanently saving data to a storage device using many of the techniques described in Table 9,9. However, in systems where inputs are stored and entered (or transferred) in batch, the identification and notification of errors is more difficult. Batch processing systems can, however, reject invalid inputs and store them in a log file for later resolution.Most of the tests and techniques shown in Table 9.9 are widely used and straightforward. Some of these tests can be handled by data management technologies, such as a database management system (DBMS), to ensure that they are applied for all data maintenance operations. If a DBMS cannot perform these tests, then an analyst must design the tests into program modules.In addition to validating the data values entered into a system, controls must be established to verify that all input records are correctly entered and that they are only processed once. A common method used to enhance the validity of entering batches of data records is to create an audit frail of the entire sequence of data entry, processing, and storage. In such an audit trail, the actual sequence, count, time, source location, human operator, and so on are recorded into a separate
Self-Instructional Material 191
System Analysis and Design transaction log in the event of-a data input or processing error. If an error occurs,corrections can be made by reviewing the contents of the log. Detailed logs of data inputs are not only useful for resolving batch data entry errors and system audits, but also serve as a powerful method for performing backup and recovery operations in the case of a catastrophic system failure.
NOTES9.4.4 Providing FeedbackWhen talking with a friend, you would be concerned if be or she did not provide you with feedback by nodding and replying to your questions and comments. Without feedback, you would be concerned that he or she was not listening, likely resulting in a less-than-satisfactory experience. Similarly, when designing system interfaces, providing appropriate feedback is an easy method for making a user’s interaction more eqjoyable; not providing feedback is a sure way to frustrate and confuse. There are throe types of system feedback as given below :
1. Status information2. Prompting cues3. Error or warning messages
Status Information. Providing status infonnation is a simple technique for keep. ng users informed of what is going on within a system. For example, relevant status information such as displaying the current customer name or time, placing appropriate titles on a menu or screen, or identifying the number of screens following the current one (e.g., Screen 1 to 3) all provide needed feedback to the user. Providing status infonnation during processing operations is especially important if the operation takes longer than a second or two. For example, when opening a file you might display “Please wait while 1 open the file” or, when performing a large calculation, flash the message “Working...” to the user. Further, it is important to tell the user that besides working, the system has accepted the user’s input and tiiat the input was in the correct form. Sometimes it is important to give the user a chance to obtain more feedback. For example, a function key could toggle between showing a “Working...” message and giving more specific information as each intermediate step is accomplished. Providing status information will reassure users that nothing is wrong and make them feel in command of the system, not vice versa. Prompting Cues. A second feedback method is to display prompting cues. When prompting the user for information or action, it is useful to be specific in user request. For example, suppose a system prompted users with tiie following request; ENTER THE DATA :______________With such a prompt, the designer assumes that the user knows exactly what to enter. A better design would be specific in its request, possibly providing an example, default values, or formatting information. An improved prompting request might be as follows:Enter the customer account number (123-466-7)__ -Errors and Warning Messages. A final method available to an analyst for providing system feedback is using error and warning messages. Practical experience has found that a few simple guidelines can greatly improve their usefulness. First, messages should be specific and free of error codes and jargon. AdditionaUy, messages should never scold the user and should attempt to guide the user toward a resolution. For example, a message might say “No customer record found for that Customer ID. Please verify that digits were not transposed.” Messages should be in user, not computer, terms. Hence, such terms as “end of file,” “disk I/O error,” or “write
IK Self-Instructional Material
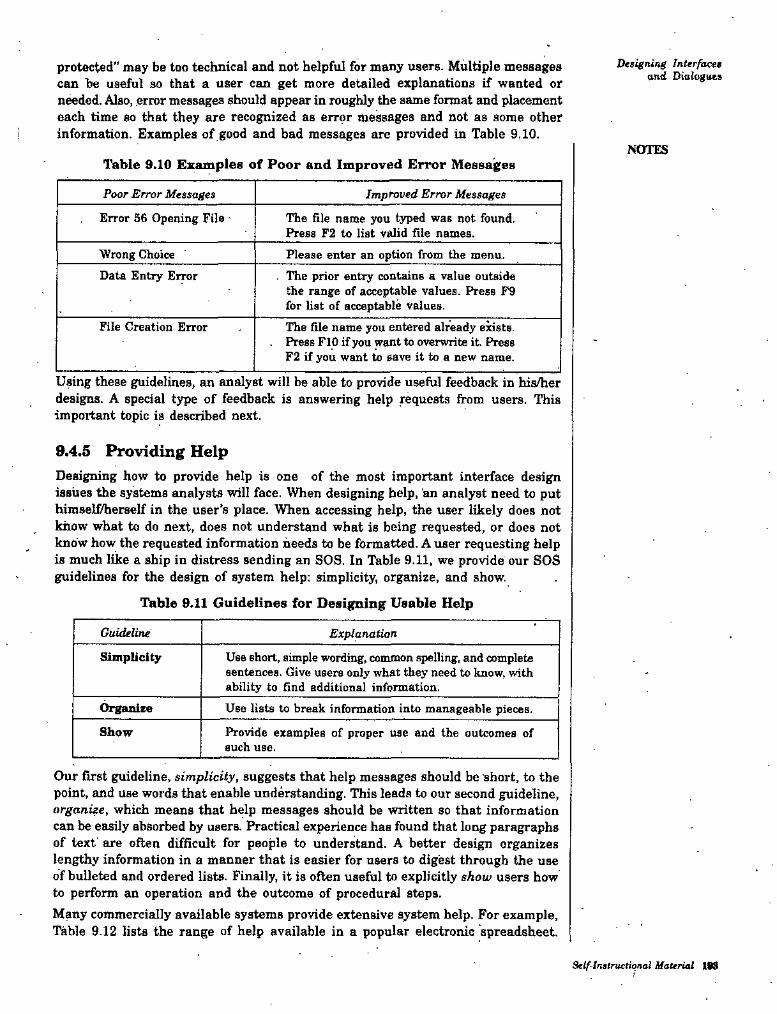
Designing Interfaces antj Diatogoes
protected” may be too technical and not helpful for many users. Multiple messages can be useful so that a user can get more detailed explanations if wanted or needed. Also, error messages should appear in roughly the same format and placement each time so that they are recognized as error messages and not as some other information. Examples of good and bad messages are provided in Table 9.10.
Table 9.10 Examples of Poor and Improved Error MessagesNOTES
Poor Error Messages Improved Error Messages
The file name you typed was not found. Press F2 to list valid file names.
Error 56 Opening File
Wrong Choice Please enter an option from the menu.Data Entry Error . The prior entry contains a value outside
the range of acceptable values. Press F9 for list of acceptable values.The file name you entered already exists. Press FIO if you want to overwrite it Press F2 if you want to save it to a new name.
File Creation Error
Using these guidelines, an analyst will be able to provide useful feedback in his/her designs. A special type of feedback is answering help requests from users. This important topic is described next.
9.4.5 Providing HelpDesigning how to provide help is one of the most important interface design issues the systems analysts will face. When designing help, an analyst need to put bimself^erself in the user’s place. When accessii^ help, the user likely does not know what to do next, does not understand what is being requested, or does not know how the requested information heeds to be formatted. A user requesting help is much like a ship in distress sending an SOS. In Table 9.11, we provide our SOS guidelines for the design of system help: simplicity, organize, and show.
Ihble 9.11 Guidelines for Designing Usable Help
Guideline Explanation
Simplicity Use short, simple wordit^, common spelling, and complete sentences. Give users only what they need to know, with ability to find additional information.
Organize Use lists to break information into manageable pieces.
Show Provide examples of proper use and the outcomes of such use.
Our first guideline, simplicity, suggests that help messages should be short, to the point, and use words that enable understanding. This leads to our second guideline, organize, which means that help messages should be written so that information can be easily absorbed by users. Practical experience has found that long paragraphs of text are often difficult for people to understand. A better design organizes lengthy information in a manner that is easier for users to digest through the use of bulleted and ordered lists. Finally, it is often useful to explicitly show users how to perform an operation and the outcome of procedural steps.Many commercially available systems provide extensive system help. For example, Table 9.12 lists the range of help available in a popular electronic spreadsheet.
Self-Instructional Material 193
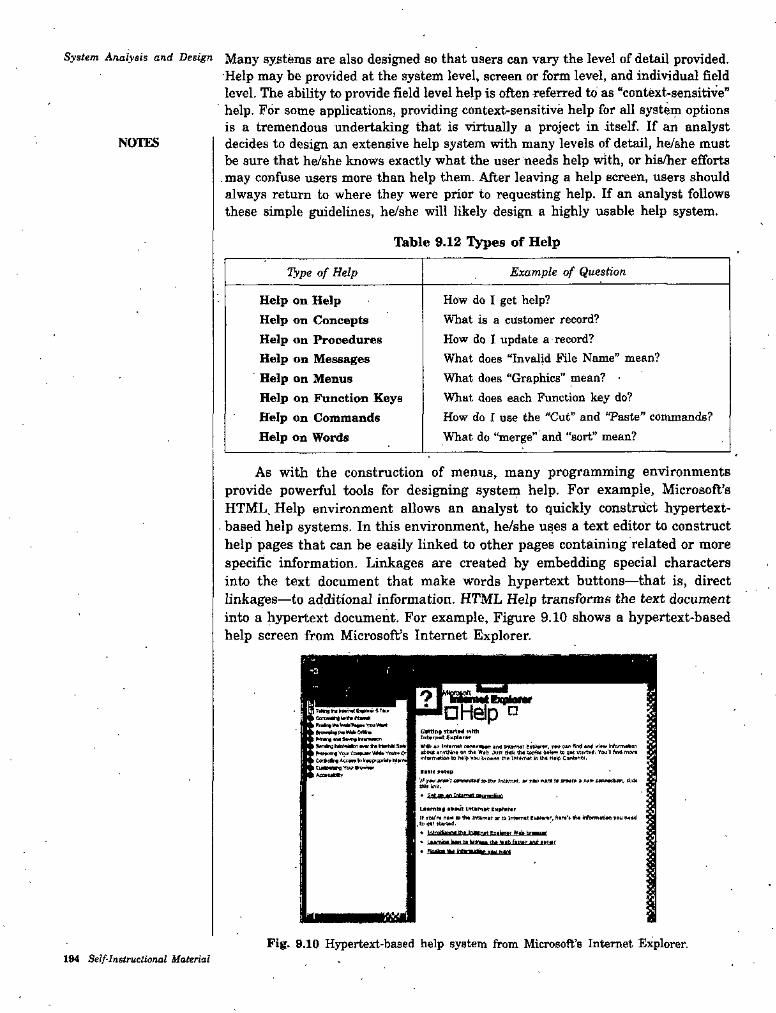
System Analysis and Design Many systems are also designed 80 that users can vary the level of detail provided.Help may be provided at the system level, screen or form level, and individual field level. The ability to provide field level help is often referred to as “context-sensitive” help. For some applications, providing context-sensitive help for all system options is a tremendous imdertaking that is virtually a project in itself. If an analyst decides to design an extensive help system with many levels of detail, he/she must be sure that he/she knows exactly what the user needs help with, or his/her efforts may confuse users more than help them. After leaving a help screen, users should always return to where they were prior to requesting help. If an analyst follows these simple guidelines, he/ahe will likely design a highly usable help system.
NOTES
Table 9.12 Types of Help
Example of QuestionType of Help
How do I get help?What is a customer record?How do I update a record?What does “Invalid File Name” mean?What does “Graphics” mean?What does each Function key do?How do I use the "Cut” and “Paste” commands? What do “merge” and “sort” mean?
Help on Help Help on Concepts Help on Procedures Help on Messages Help on Menus Help on Function Keys Help on Commands Help on Words
As with the construction of menus, many programming environments provide powerful tools for designing system help. For example, Microsoft’s HTML, Help environment allows an analyst to quickly construct h3T)ertext- based help systems. In this environment, he/she uses a text editor to construct help pages that can be easily linked to other pages containing related or more specific information. Linkages are created by embedding special characters into the text document that make words hypertext buttons—that is, direct linkages—to additional information. HTML Help transforms the text document into a hypertext document. For example. Figure 9.10 shows a hypertext-based help screen from Microsoft’s Internet Explorer.
Cfttint stsHtd ntthiMi
18«n»e ir* niM Sm»Nmeir ̂ym Cmuwveu*v C*I Cdr*alr« i«c«B to nc9 HanNk Cy«MP«kAcevMt**
n r«v ca^ ^ tAd nd** irfvtMeriarlr(^■w O'! yur »» soem to qm Tm'ii fM
>ri4o>m«bo>v to the in IM n«lp
•■«k<'M r«v InUfnM, v nJW to OtoAto * A««> AtovxaJttoV did(8df kau.
Laamttg •»M eaptortrS> TM'to 'isa er to tfitamtt hair*’* irfofi
fUrWd.• Wa Bf—g• I n ti WHm
f»w fwM
MSMi
HAiM
Pig. 8.10 Hypertext-based help system from Microsoft’s Internet Explorer.194 Self-Instruclional Material
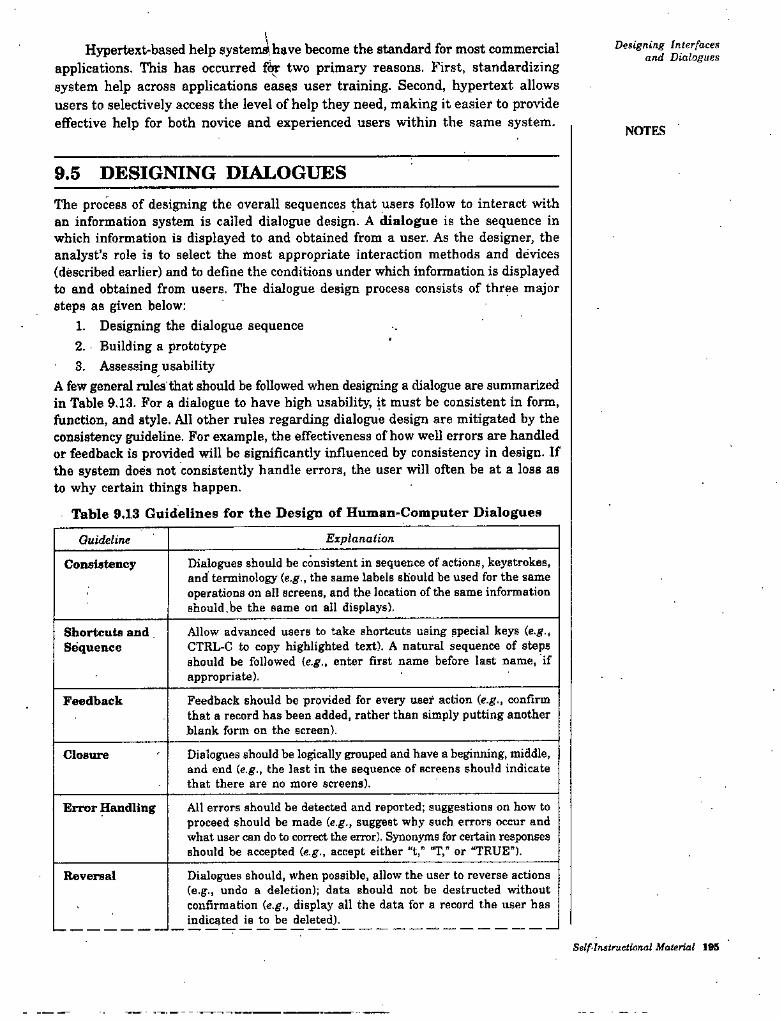
Hypertext-based help system^ have become the standard for most commercial
applications. This has occurred fw two primary reasons, First, standardizing system help across applications eases user training. Second, hypertext allows users to selectively access the level of help they need, making it easier to provide effective help for both novice and experienced users within the same system.
Designing Interfaces and Dialogues
NOTES
9.5 DESIGNING DIALOGUESThe process of designing the overall sequences that users follow to interact with an information system is called dialogue design. A dialogue is the sequence in which information is displayed to and obtained from a user. As the designer, the analyst’s role is to select the most appropriate interaction methods and devices (described earlier) and to define the conditions under which information is displayed to and obtained from users. The dialogue design process consists of three major steps as given below:
1. Designing the dialogue sequence2. Building a prototype3. Assessing usability
A few general rules that should be followed when designing a dialogue are summarized in Table 9.13. For a dialogue to have high usability, it must be consistent in form, function, and style. All other rules regarding dialogue design are mitigated by the consistency guideline. For example, the effectiveness of how well errors are handled or feedback is provided will be significantly influenced by consistency in design. If the system does not consistently handle errors, the user will often be at a loss as to why certain things happen.
Table 9.13 Gaidelines for the Design of Human-Computer Dialogues
ExplanationGuideline
Dialogues should be consistent in sequence of actions, keystrokes, and terminology {e.g., the same labels should be used for the same operations on all screens, and the location of the same information should.be the same on all displays).
Consistency
Allow advanced users to take shortcuts using special keys (e.g., CTRL-C to copy highlighted text). A natural sequence of steps should be followed {e.g., enter first name before last name, if appropriate).
Shortcuts and Sequence
Feedback should be provided for every i«er action (e.g., confirm that a record has been added, rather than simply putting another blank form on the screen).
Feedback
Dialogues should be lo^cally grouped and have a beginning, middle, and end (e.g., the last in the sequence of screens should indicate that there are no more screens).
Closure
All errors should be detected and reported; suggestions on how to proceed should be made (e.g., suggest why such errors occur and what user can do to correct the error). Synonyms for certain responses should be accepted (e.g., accept either "t,” “T,” or “TRUE”).
Error Handling
Dialogues should, when possible, allow the user to reverse actions (e.g., undo a deletion); data should not be destructed without confirmation (e.g., display all the data for a record the user has indicated is to be deleted).
Reversal
Self-Inslruetional Material 195
System Analysis and Design These demo systems allow users to enter data and move through displays as ifusing the actual system. Such activities are not only useful for him/her to show how an interface will look and feel, they are also usefiil for assessing usability and for performing user training long before actual systems are completed. In the next section, we extend our discussion of interface and dialogue design to consider issues specific to graphical user interface environments.-NOTES
9,6 DESIGNING INTERFACES AND DIALOGUES GRAPfflCAL ENVIRONMENTS
Graphical user interface (GUI) environments have become the de facto standard for human-computer interaction. Although all of the interface and dialogue design guidelines presented previously apply to designing GUIs, additional issues that are unique to these environments must be considered. We briefly discuss some of these issues in the next section.
9.6.1 Graphical Interface Design IssuesWhen designing GUIs for an operating environment such as Microsoft Windows or the Apple Macintosh, numerous factors must be considered. Some factors are common to all GUI environments, whereas others are specific to a single environment. We will not, however, discuss the subtleties and details of any single environment. Instead, our discussion will focus on a few general truths that experienced designers mention as critical to the design of usable GUIs. In most discussions of GUI programming, two rules repeatedly emerge as comprising the first step to becoming an effective GUI designer as given below:
1. Become an expert user of the GUI environment.2. Understand the available resources and how they can be used.
The first step should be an obvious one, The greatest strength of designing within a standard operating environment is that standards for the behavior of most system operations have already been defined. For example, how cut and paste, set up the default printer, design menus, or assign commands to functions have been standardized both within and across applications. This allows experienced users of one GUI-based application to easily learn a new application. Thus, in order to design effective interfaces in such environments, an analyst must first understand how other applications have been designed so that he/she will adopt the established standards for “look and feel.” Failure to adopt the standard conventions in a given environment will result in a system that will likely frustrate and confuse users.The second rule—gaining an understanding of the available resources and how they can be used—is a much larger undertaking. For example, within Windows you can use menus, forms, and boxes in many ways. In fact, the flexibility with which these resources can be used versus the established standards for how most designers actually use these resources makes design especially challenging. For example, an analyst has the ability to design menus using all uppercase text, putting multiple words on the top line of the menu, and other nonstandard conventions. Yet, the standards for menu design require that top-level menu items consist of one word and follow a specific ordering, Numerous other standards for menu design have also been established (See Figure 9.13 for illustrations of many of
IM Self-InstruetUmal Material
Detigning Inlerfaett and Dialogueithese standards). Failure to follow standard design Oonventions will likely prove
very confusing to users.
^ L>«- 11^1 WtiH
In* v* fcr—- i* NOTES
t
•lb *»*
>*9
*rm f«•ii
2SSSCSSS5S!SSS2r!HSI2lii3
Fig. 9.IS Highlighting graphical user interface design standards.
In GUIs, information is requested by placing a window (or form) on the visual display screen. Like menu design, forms can also have numerous properties that can be mixed and matched (sec Table 9.14).
Table 9.14 Common Properties of Windows and Forms in a Graphical User Interface Environment that can be Active or Inactive
Property Explanation
Requires users to resolve the request for information before proceeding (e.g., need to cancel or save before closing a window).
Modality
Resizable Allows users to resize a window or form (e.g., to make room to see other windows that are also on the screen).
Movable Allows users to move a window or form (e.g.. to allow another window to be seen).
Maximize Allows users to expand a window or form to a full-size screen (e.g., to avoid distraction from other active windows or forms).
Minimize Allows users to shrink a window or form to an icon (e.g., to get the window out of the way while working on other active windows).
System Menu Allows a window or form to also have a system menu' to directly access system-level functions (e.g., to save or copy data).
Example, properties about a form determine whether a form is resizable or movable after being opened. Because properties define how users can actually work with a form, the effective application of properties is fundamental to gaining usability. This means that, in addition to designing the layout of a form, an analyst must
Self-litttruaional Material 199
SyBtem Analysis and Des^n aiaj define the “personality* of the form with its characteristic properties. Fortunately,numerous GUI. design tools have been developed that allow analysts to “visually” . design forms and interactively engage properties. Interactive GUI design tools have greatly facilitated tiie design and construction process.In addition to the issues related to interface des^, the sequencing of displays turns out to be a bit more challenging in graphical environments. This topic is discussed next.Dial<qpie Design Issues in a Graphical Environment. When designing a dialogs, an analyst’s goal is to establish the sequence of displays (full screens or windows) that ueen will encounter when working with the ^stem. Witiiin many GUI environments, thin process can be a bit more challei^ing due to tiie GUI’s ability to suspend activities (without resolving a request for information or exiting the application altogether) and switch to another application or task. For example, within Microsoft Word, the spell checker executes independently from the general word processor. This means that you can easily jump between the spell checker and word processor without exitii^ either one. Conversely, when selecting the print operation, you • must either initiate printing or abort the request before returning to the word processor. This is an example of the concept of “modality” described in Table 9.14. Thus, Windows-type environments allow analysts to create forms that eitiier require the user to resolve a request-before proceeding (print example) or selectively choose to resolve a request before proceeding (the spell checker). Creating dialogues that allow the user to jump from application to application or from module to module within a given application requires that the analyst carefully thinks through the design of dialogues.One easy way to deal with the complexity of designing advanced graphical user interfaces is to require users to always resolve all requests for information before proceeding. For such designs, the dialogue diagrammii^ technique is an adequate design tool. This, however, would make the system operate in a manner similar to a traditional non-GUI environment where the sequencing of displays is tightly controlled. The drawback to such an approach would be the failure to capitalize on the task-switching capabilities of these environments. Consequently, designing dialogues in environments where the sequence between displays cannot be predetermined offers significant challenges to the designer. Using tools such as dialogue diagramming helps analysts to better manage the complexity of designing graphical interfaces.
NOTES
200 Self-Instructional Material

Daigrting Interfixeta and Dialogue*
STUDENT ACnVITY 9.2
1. Why do computer interface users take help to interact with an information system?
2. Write a short note on dialogue design.'
/Self-tnalruetlontd Material 901
System Analysis and DesignSUMMARY
• The process of designing interfaces and dialogues is a user-focused activity.
• Interface is a method by which users interact with an information system.
• Command language interaction is a human-computer interaction method whereby users enter explicit statements into a system to invoke operations.
• Menu interaction is a human-computer interaction method in which a list of system options is provided and a specific command is invoked by user selection of a menu option.
• Form interaction is a highly intutive human-computer interaction method whereby data fields are formatted in a manner similar to paper-based forms.
• Object-based interaction is a human-computer interaction method in which symbols are used to represent commands or functions.
• Icons are graphical pictures that represent specific functions within a system.
• Dialogue is the sequence of interaction between a user and a system.
NOTES
TEST YOURSELFAnswer the following questions:
1. What type of business tasks are most suitable and also required for form-based interaction within an information system? Explain with an illustration.
2. In online system, what are the various type of errors in data? What type of • techniques can be applied to validate the errors?
3. What is an interface? What are the basic objectives of an interface design?How is an interface different from a dialogue?
4. Discuss the graphical interface design issues.
5. State True or False; • '(i) The design of interfaces and dialogues is not the process of defining the •
manner in which humans and computers exchange information.{«) The process of designing interfaces and dialogues is a user-focused
activity.(m) Interface is a method by which users interact with an information
system.{iv) Icons are graphical pictures that represent specific functions within a
system.(d) When designing the navigation procedures within a system, flexibility
and consistency are primary concerns.(yf) One objective of interlace design is to reduce data entry errors.,
(vii) When accessing help, the user likely, knows what to do next, understands what is being requested, or knows how the requested information needs to be formatted.
(viii) When designing a dialogue, an analyst’s goal is to establish the sequence of displays that users will encounter when working with the system.
202 Self-Instructional Material
Designing Interfaces and Dialogues
6. Fill in the blanks:................. is a human-computer interaction method whereby users
enter explicit statements into a system to invoke .operations.(i)
from system interface and dialogue design is the(u) Thecreation of a design specification. NOTES.................... is a menu-positioning method that places a menu nearthe current cursor position.The selection of an interaction device must be .made during.....................because dilTerent interfaces require different devices.
m(m)
is the sequence in which information is displayed to(o) Aand obtained from a user.A formal method for'designing and representing dialogues is......................As data are entered into an information system, steps must be taken to ensure that the
(w)
(vii)is valid.
environments have become the de-facto standard for human-(viii)computer interaction.
ANSWERSTest Yourself
5. State True or False:(() False
(i«) True (i;) True
(oil) False6. Fill in the blanks:
(i) Command language interaction [Hi) Pop-up menu (i;) dialogue
{vii) input
(U) True iw)- True {ui) True
iviii) True
(u) deliverable and outcome (to) Logical design (vi) dialogue diagramming
(out) Graphical user interface (GUI)
Self-Instniclionai Materia! 203
Designing DaiobasvsCHAPTER
NOTES
DESIGNING DATABASES
LEARNrNG OBJECTIVES10.1 Introduction
10.2 Database Design
10.2.1 The Process of Database Design
10.2.2 Deliverables and Outcomes ' 0.3 Relational Database Model
10.3.1 Well-Structured Relations
10.4 Normalization
10.4.1 Rules of normalization
10.4.2 Functional Dependence and Primary Keys
10.4.3 Second Normal Form10.4.4 Third Normal Form
10.5 Merging Relations
10.5.1 Ah Example of Merging Relations
10.5.2 View Integration Problems
10.6 Physical File and Database Design
10.7 Designing Fields
10.7.1 Choosing Data Types
10.7.2 Controlling Data Integrity
10.8 Designing Physical Tables
10.8.1 Arranging Table Rows
10.8.2 Designing Controls for Fites
10.9 The Role of the Data Base Administrator
10.1 INTRODUCTIONWe have learned how to represent an organization’s data graphically using an entity-relationship (E-R) and case diagram^ In this unit, we learn guidelines for well-structured and efficient'database files and about logical and physical database design. It is likely that the human interface and database design steps will happen in parallel, as shown in the SDLC in Figure 10.1.
Self Instructional Halerinl ‘205
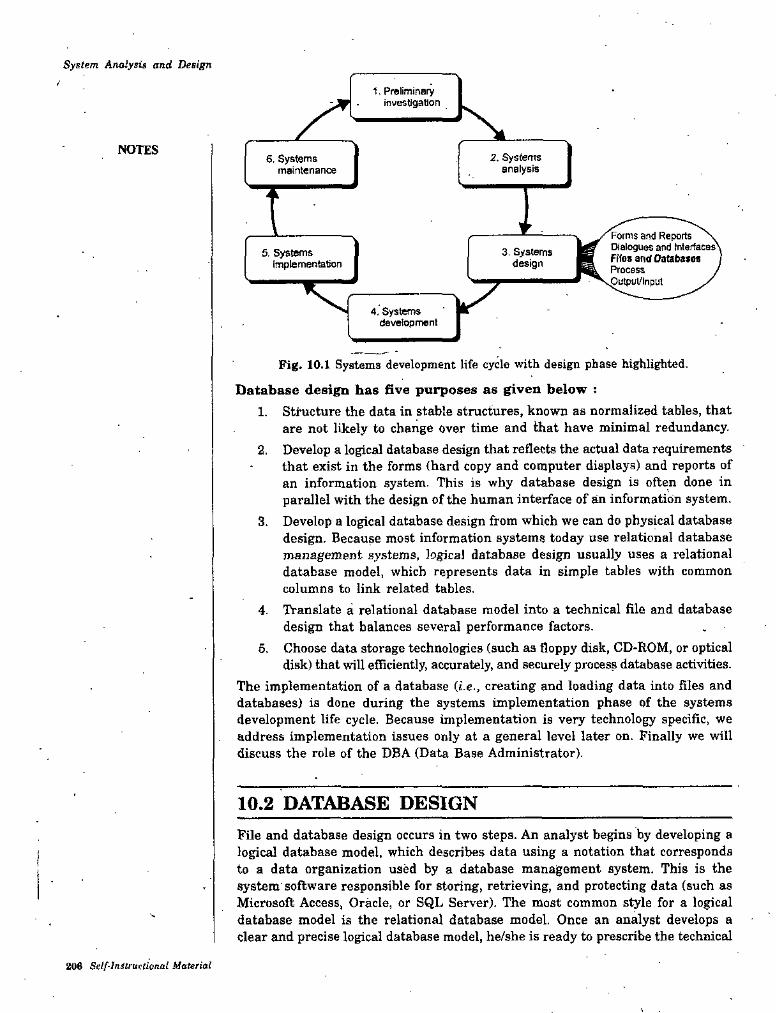
System Anaiysis and Design
1. Preliminary investigation
1NOTES 2. Systems analysis
6. Systems maintenance
1I Forms and Reports \ Oalogues and Interfaces' Fifes antf Databases Process yputpoUInput
3. Systems design
5. Systems implementation
4, Systems development
Fig. 10.1 Systems development life cycle with design phase highlighted.
Database design has five purposes as given below :1. Stiiicture the data in stable structures, known as normalized tables, that
are not likely to change over time and that have minimal redundancy.2. Develop a logical database design that reflects the actual data requirements
that exist in the forms (hard copy and computer displays) and reports of an information system. This is why database design is often done in parallel with the design of the human interface of an information system.
3. Develop a logical database design from which we can do physical database design. Because most information systems today use relational database management systems, logical database design usually uses a relational database model, which represents data in simple tables with common columns to link related tables.
4. Translate a relational database model into a technical file and database design that balances several performance factors.
5. Choose data storage technologies (such as floppy disk, CD-ROM, or optical disk) that will efficiently, accurately, and securely process database activities.
The implementation of a database (i.e., creating and loading data into files and databases) is done during the systems implementation phase of the systems development life cycle. Because implementation is very technology specific, we address implementation issues only at a general level later on. Finally we will discuss the role of the DBA (Data Base Administrator).
10.2 DATABASE DESIGNFile and database design occurs in two steps. An analyst begins by developing a logical database model, which describes data using a notation that corresponds to a data organization used by a database management system. This is the system'software responsible for storing, retrieving, and protecting data (such as Microsoft Access, Oracle, or SQL Server). The most common style for a logical database model is the relational database model. Once an analyst develops a clear and precise logical database model, he/she is ready to prescribe the technical
206 Self-Instructional Material
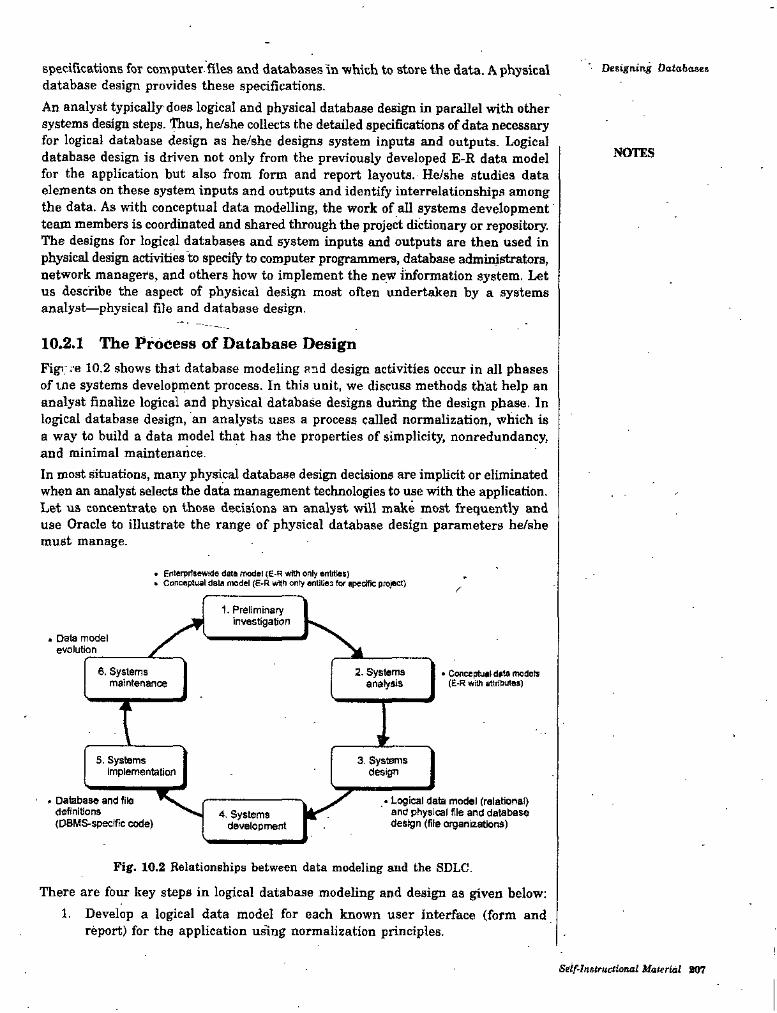
specifications for computer, files and databases in which to store the data. A physical database design provides these specifications.An analyst typically does logical and physical database design in parallel with other systems design steps, '^us, he/she collects the detailed specifications of data necessary for logical database design as he/she designs system inputs and outputs. Logical database design is driven not only from the previously developed E-R data model for the application but also from form and report layouts. He/she studies data elements on these system inputs and outputs and identify interrelationships among the data. As with conceptual data modelling, the work of all systems development team members is coordinated and shared through the project dictionary or repository. The designs for logical databases and system inputs and outputs are then used in physical design activities to specify to computer programmers, database administrators, network managers, and others how to implement the new information system. Let us describe the aspect of physical design most often undertaken by a systems analyst—physical file and database design.
Oestsitirtg Databases
NOTTS
10.2.1 The Process of Database DesignFigr-e 10.2 shows that database modeling and design activities occur in all phases of ine systems development process. In this unit, we discuss methods that help an analyst finalize logical and physical database designs during the design phase. In logical database design, an analysts uses a process called normalization, which is a way to build a data model that has the properties of simplicity, nonredundancy, and minimal maintenance.In most situations, many physical database design decisions are implicit or eliminated when an analyst selects the data management technologies to use with the application. Let us concentrate on those decisions an analyst will make most frequently and use Oracle to illustrate the range of physical database design parameters he/she must manage.
• ErlerprtsewKle data model with only entitles). COTce{Hual data model (E-R witnonty entities for epedfic project)
K1- Preliminary investigation
• Data model evolution
I6. Systems maintenance
2- Systems analysis
• Concepbiai data models (E-R with atirnrtitea)
I \ ’
5. Systems Implementation
3. Systems design
. Database and file definltons{DBMS-specific code)
• Logical dab model (relational) and physical file and database design (file organizations)
4. Systems development
Fig. 10.2 Relationahips between data modeling and the SDLC.
There are four key steps in logical database modeling and design as given below;1. Develop a logical data model for each known user interface (form and
report) for the application uring normalization principles.
Seif-Instructional Material 807
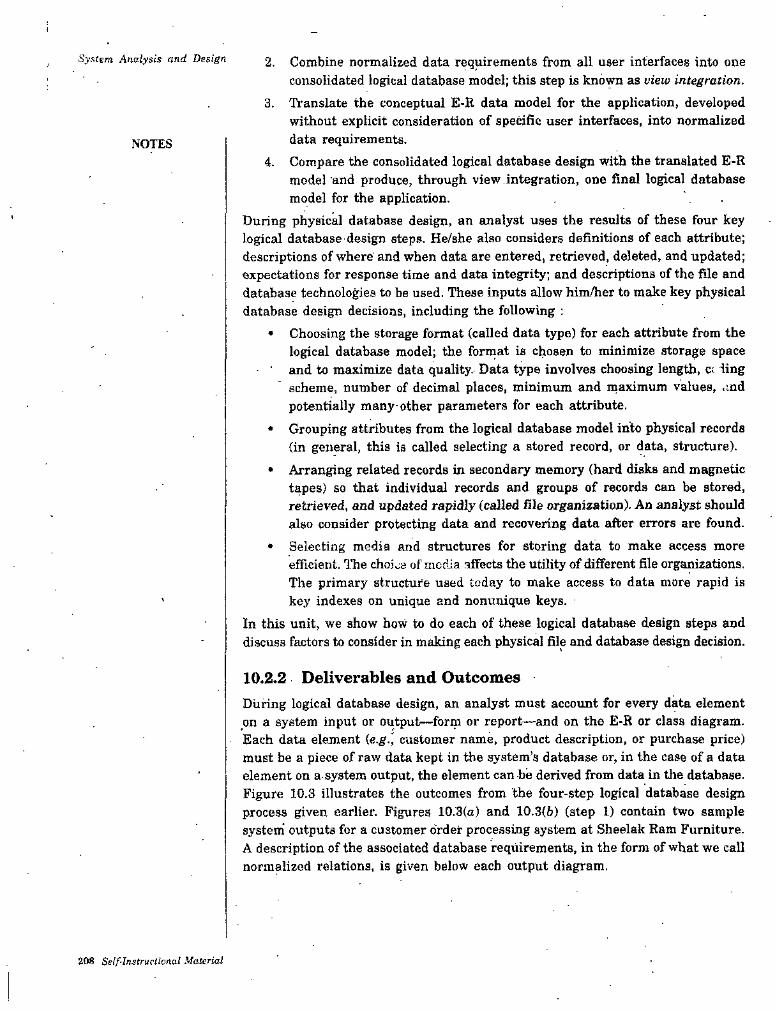
Syaiem Analysis and Design 2- Combine normalized data requirements from all user interfaces into one consolidated logical database model; this step is known as view integration.
3. Translate the conceptual E-R data model for the application, developed without explicit consideration of spedfic user interfaces, into normalized data requirements.
4. Compare the consolidated logical database design with the translated E-Rmodel and produce, through view integration, one final logical database model for the application. ' . .
During physical database design, an analyst uses the results of these four key logical database design steps. He/she also considers definitions of each attribute; descriptions of where and when data are entered, retrieved, deleted, and updated; expectations for response time and data integrity; and descriptions of the file and database technologies to be used. These inputs allow him/her to make key physical database design decisions, including the following :
• Choosing the storage format (called data type) for each attribute from the logical database model; the format is chosen to minimize storage space and to maximize data quality. Data type involves choosing length, cc iing scheme, number of decimal places, minimum and maximum values, .ind potentially many-other parameters for each attribute.
• Grouping attributes from the logical database model into physical records (in general, this is called selecting a stored record, or data, structure).
• Arranging related records in secondary memory (hard disks and magnetic tapes) so that individual records and groups of records can be stored, retrieved, and updated rapidly (called file organization). An analyst should also consider protecting data and recovering data after errors are found.
• Selecting media and structures for storing data to make access more efficient. The choice of media affects the utility of different file organizations. The primary structure used today to make access to data more rapid is key indexes on unique and nonunique keys.
In this unit, we show how to do each of these logical database design steps and discuss factors to consider in making each physical file and database design decision.
NOTES
10.2.2 Deliverables and OutcomesDuring logical database design, an analyst must account for every data element on a system input or output—form or report—and on the E-R or class diagram. Each data element (e.g.l customer name, product description, or purchase price) must be a piece of raw data kept in the system’s database or, in the case of a data element on a system output, the element can be derived from data in the database. Figure 10.3 illustrates the outcomes from the four-step logical database design process given earlier. Figures 10.3(a) and 10.3(6) (step 1) contain two sample system' outputs for a customer order processing system at Sheelak Ram Furniture. A description of the associated database requirements, in the form of what we call normalized relations, is given below each output diagram.
208 Self-Instructivnal Material
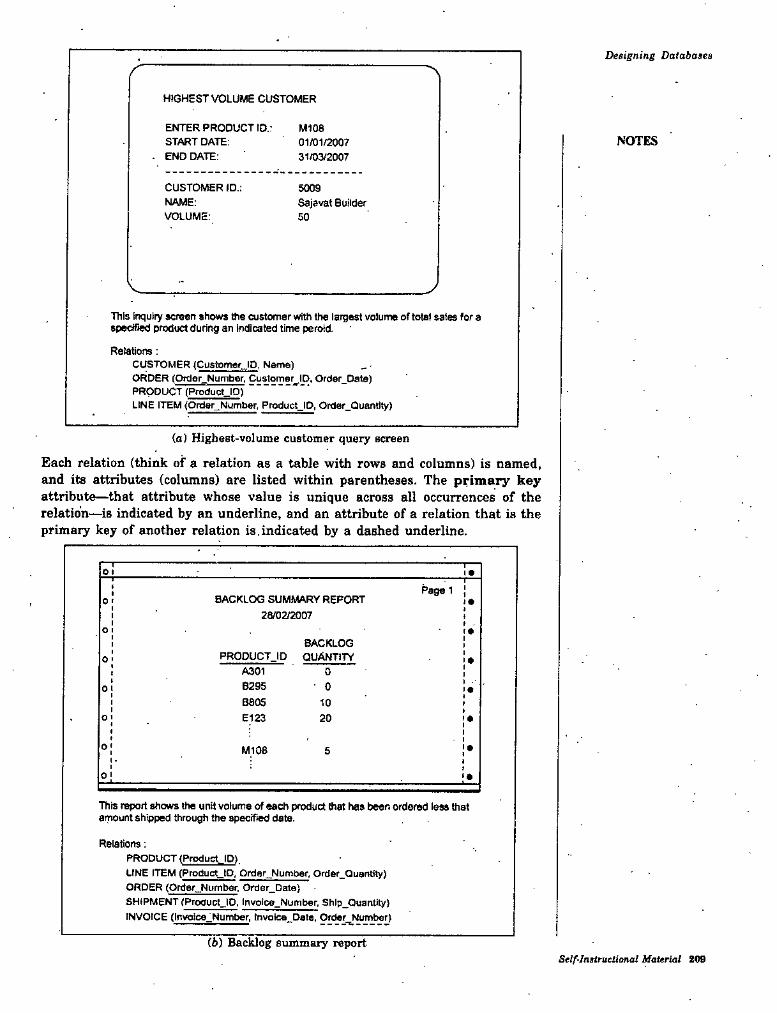
Designing Databases
HIGHEST WLUMS CUSTOMER
ENTER PRODUCT 10.: START DATE:
- END DATE:
M10601/01/200731/03/2007
NOTES
CUSTOMER ID.:NAME:VOLUME:
5009Sajavat Builder50
This inquiry screen shows the customerwith the iargest volume of total sales fora speofred product during an indicated time perotd.
Relations:CUSTOMER (Cuslomef_lD, Name)ORDER (Order_Number, Customer^lD. Order_Oate)PRODUCT (ProductJO) ~~LINE ITEM <Order_Numt>«r, ProductJO, Order_Quantlty)
(a) Highest-volume customer query screen
Each relation (think of a relation as a table with rows and columns) is named and its attributes (columns) are listed within parentheses. The primary key attribute—that attribute whose value is unique across all occurrences of the relation—is indicated by an underline, and an attribute of a relation that is the primary key of another relation is.indicated by a dashed underline.
0
Page 1BACKLOG SUMMARY REPORT
28/02/20070
oBACKLOG
PRODUCT_ID QUANTITY0A301 0B295B80SE123
• 001020o
0 M108 5
0
This report shows the unit volume of each product that has been ordered less that amount shipped through the specrTted date.
Relations:PRODUCT (ProductJO)LINE ITEM (ProductJO, Order_NumOer, Order_Quaf»tfty) ORDER (Order_Numt>ef, Order_Date)SHIPMENT (ProductJO, lnvolce_Number, ShlpJ3uantity) INVOICE (lnvolce_Number, lnvolce_Dete, OrderJ^umber)
(b) Backlog summary reportSelf-Instructional Material 209
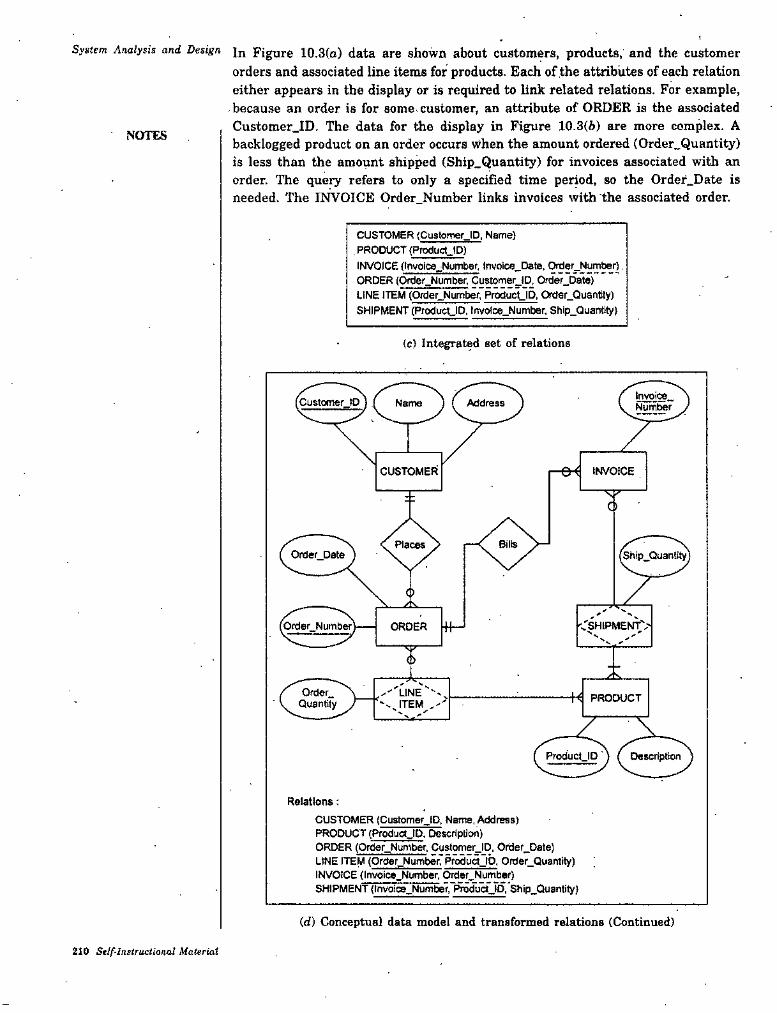
System ^naiysis and Design jn Figure 10.3(a) data are shown about customers, products, and the customerorders and associated line items for products. Each of the attributes of each relation either appears in the display or is required to link related relations. For example, because an order is for some, customer, an attribute of ORDER is the associated Customer_ID. The data for the display in Figure 10.3{6) are more complex. A backlogged product on an order occurs when the amount ordered (Order_Quantity) is less than the amount shipped (Ship.Quantity) for invoices associated with an order. The query refers to only a specified time period, so the Order.Date is needed. The INVOICE Order Number links invoices with the associated order.
NOTES
CUSTOMER (CustomefJD, Name). PRODUCT (ProdoclJD)INVOICE (involce^Number, Involce.Dale.ORDER (Order.Number, CustomerJD, Order.Date)LINE ITEM (Ofder.Number, Pr^ucljp, Order.Ouantty) SHIPMENT (ProducUlD, lnvcriee_Number. Shlp.Quanlity)
(c) Integrated set of relatione
Invoice.NumberCustomerJD Name Address
CUSTOMER INVOICE
N
Order Date Ship.Quantity
'Order.Numb^ CSHIPMEN^.-'ORDER ++
IX
..-•'une'''*'..^ITEM
0*der_Quantity H PRODUCT
zProduclJD ) ( Description
Relations:CUSTOMER (CustomwJD, Name, Address)PRODUCT (ProductJDrpescrlpUon)ORDER (Order.Number, Customer.lD, Ofder.Date)LINE ITEM (Order_Number7 Pr^ua jo, Order.Quantity) INVOICE (Invoice.Number, Order.Number)SHIPMENT (invoiee.Number, f^ducUD.'Ship.Quantity)
(d) Conceptual data model and transformed relations (Continued)
210 Stlf-lnstructional Material
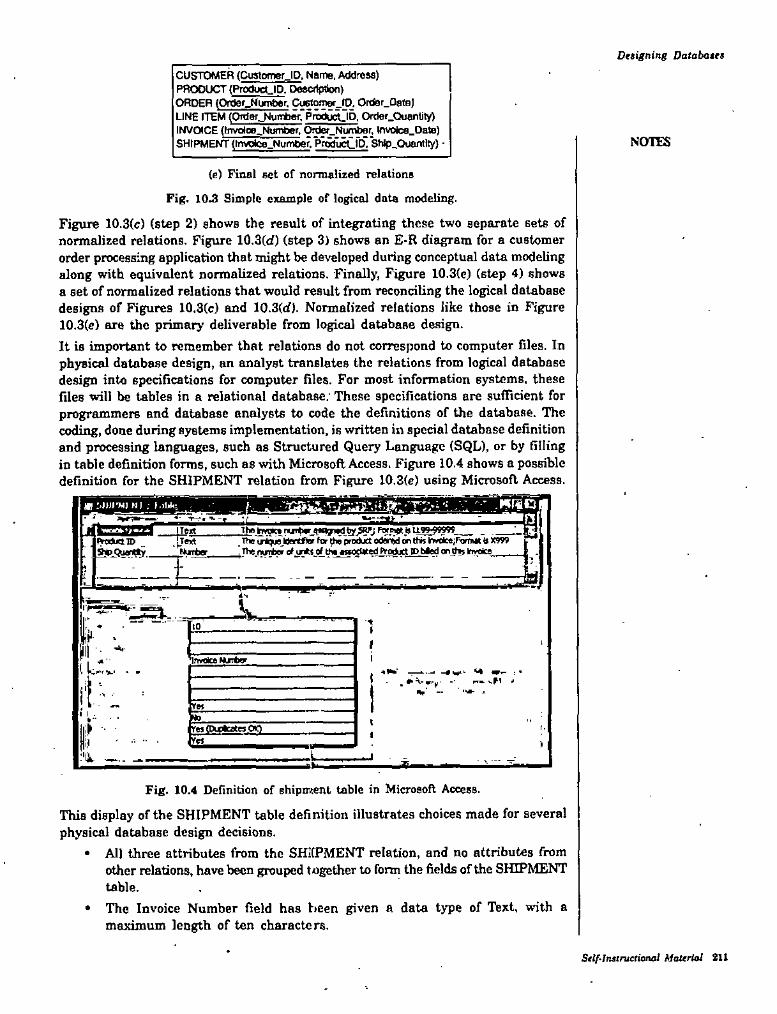
Designing Databases
CUSTOMER (Cusiofnef_IP. Name, A<klros8)PRODUCT (ProOucLID. Descfipawi)ORDER (OfOef_Nun<>er. Cu6tom9r_tO. Ordar_DateJ UNE ITEM (Ottiefjgurrt»wrpro»letriD, Order.Quantity) INVOICE (Ifivolce^Numftef. 0^_Number. lnvote8_Oa») SHIPMENT (lnvolce_Num6er.PfochjcCl[^*SMp_Ouantlty) • NOTCS
<e) Final act of normalized relationsFig. 10.3 Simple example of logical data modeling.
Figure 10.3(c) (step 2) shows the result of integrating these two separate sets of normalized relations. Figure 10.3({f) (step 3) shows an £>R diagram for a customer order processing application that might be developed during conceptual data modeling along with equivalent normalized relations. Finally, Figure 10.3(e) (step 4) shows a set of normalized relations that would result from reconciling the logical database designs of Figures 10.3(c) and 10.3(rf). Normalized relations like those in Figure 10.3(e) are the primary deliverable from logical database design.It is important to remember that relations do not correspond to computer files. In physical database design, an analyst translates the relations from logical database design into specifications for computer files. For most information systems, these files will be tables in a relational database.- These specifications are sufficient for programmers and database analysts to code the definitions of the database. The coding, done during systems implementation, is written in special database definition and processing languages, such as Structured Query Language (SQL), or by filling in table definition forms, such as with Microsoft Access. Figure 10.4 shows a possible definition for the SHIPMENT relation from Figure 10.3(c) using Microsoft Access.
iP.Finem MWM) H) ; t.ll*:. ;. J ■ia ^
'lh»>w]ic»r»iTt>a«p»dt'ygyjPB<.nKBU9»WW_ _ _____-n* Hertftar Ftr (h« pro^ cn ChK rMiice;F«TMt a n99
^Jhe.fMTto rf><*trftl4«woclKedPri>cbctlDbted on^ Inmlca
TB«t(vsduciro lTeirt
NurtetJii
A'.
I- 10 >II'InvalceWirto
-«w -A m- ■ — vH *I . # V meIt- ¥'
■r-' Irei (Pwteatn do
1%
Fig. 10.4 Definition of shipment table in Microsoft Access.
This display of the SHIPMENT table definition illustrates choices made for several physical database design decisions.
• All three attributes from the SHKPMENT relation, and no attributes from other relations, have been grouped together to form the fields of the SHIPMENT table.
• The Invoice Number field has been given a data type of Text, with a maximum length of ten characters.
Self-Instructional Material 211
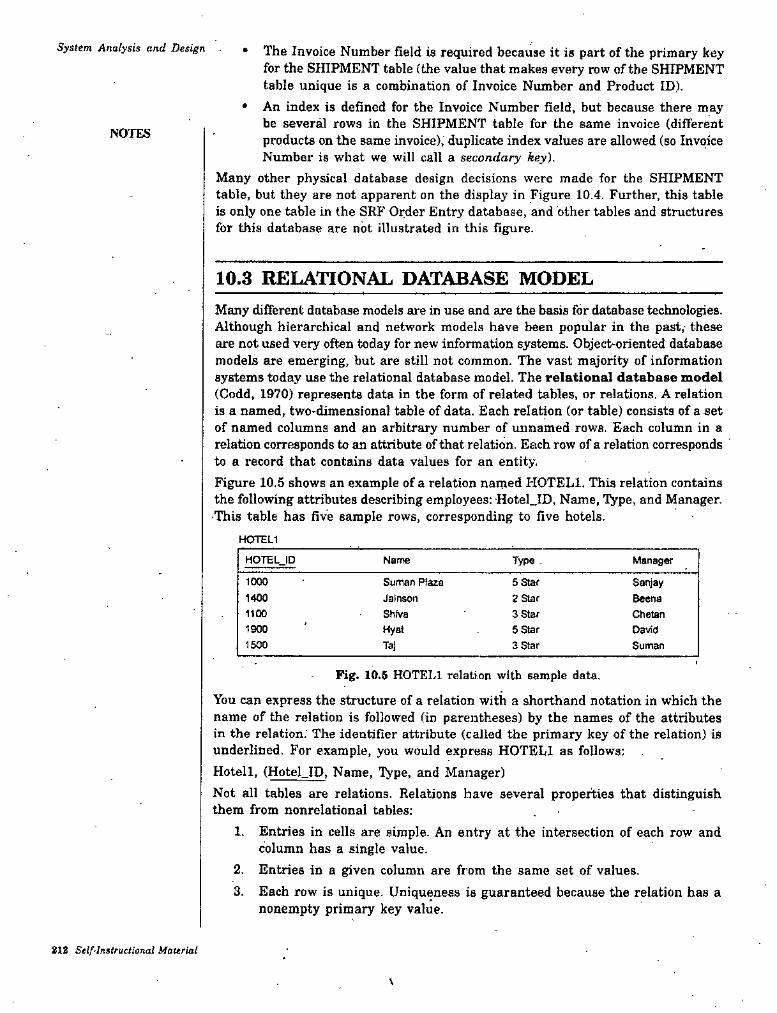
System Analysis and Design • The Invoice Number field is required because it is part of the primary key for the SHIPMENT table (the value that makes every row of the SHIPMENT table unique is a combination of Invoice Number and Product ID).
• An index is defined for the Invoice Number field, but because there may be several rows in the SHIPMENT table for the same invoice (different products on the same invoice), duplicate index values are allowed (so Invoice Number is what we will call a secondary key).
Many other physical database design decisions were made for the SHIPMENT table, but they are not apparent on the display in Figure 10.4. Further, this table is only one table in the SRF Order Entry database, and other tables and structures for this database are not illustrated in this figure.
NOTES
10.3 RELATIONAL DATABASE MODELMany different database models are in use and are the basis for database technologies. Although hierarchical and network models have been popular in the past, these are not used very often today for new information systems. Object-oriented database models £ire emerging, but are still not common. The vast m^ority of information systems today use the relational database model. The relational database model (Codd, 1970) represents data in the form of related tables, or relations. A relation is a named, two-dimensional table of data. Each relation (or table) consists of a set of named columns and an arbitrary number of unnamed rows. Each column in a relation corresponds to an attribute of that relation. Each row of a relation corresponds to a record that contains data values for an entity.Figure 10.5 shows an example of a relation named HOTELl. This relation contains the following attributes describing employees: HoteLID. Name, Type, and Manager. •This table has five sample rows, corresponding to five hotels.
HOTCL1
HOTELJD Name Type . Manage'
1000 Suman Plaza Jalnson Shiva Kyat
5 Star2 Star3 Star 5 Star 3 Star
SanjayBeenaChetanOawdSuman
1400110019001500 Taj
Fig. 10.5 HOTELl relation with aample data.
You can express the structure of a relation with a shorthand notation in which the name of the relation is followed fin parentheses) by the names of the attributes in the relation.' The identifier attribute (called the primary key of the relation) is underlined. For example, you would express HOTELl as follows;Hotell, (Hotel_ID, Name, TVpe, and Manager)Not all tables are relations. Relations have several properties that distinguish them from nonrelational tables:
1. Entries in cells are simple. An entry at the intersection of each row and column has a single value.
2. Entries in a given column are from the same set of values.3. Each row is unique. Uniqueness is guaranteed because the relation has a
nonempty primary key value.
212 Self-Instructional Material
\
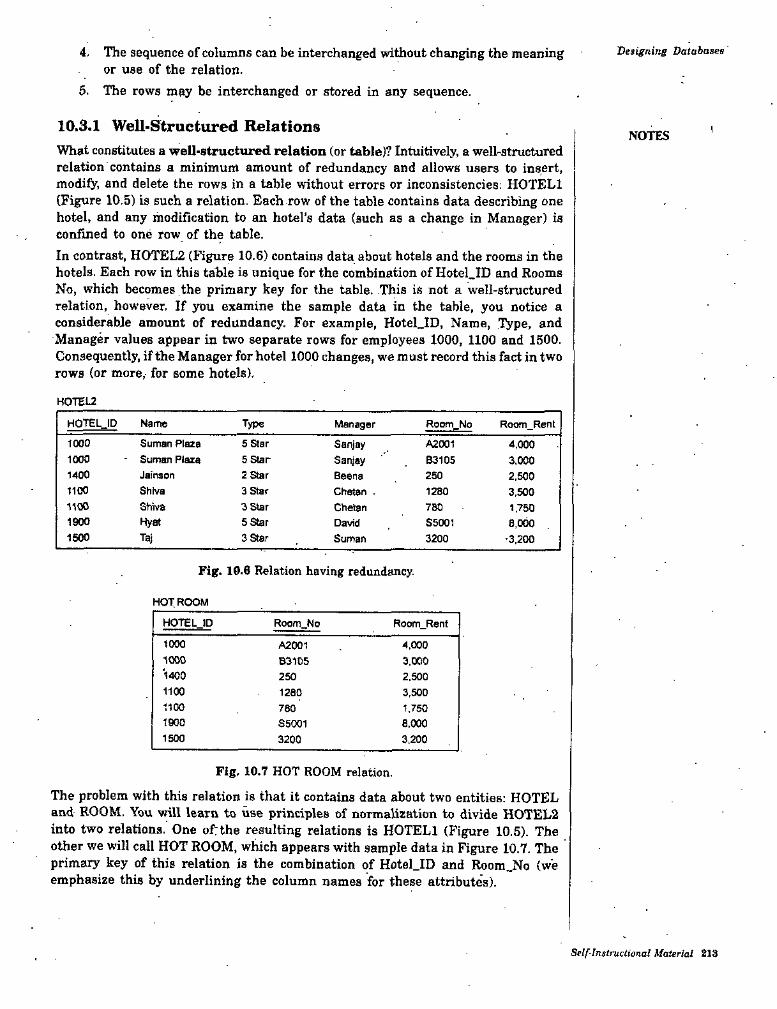
Designing Databases4. The sequence of columns can be interchanged without changing the meaning or use of the relation.
6. The rows may be interchanged or stored in any sequence.
10.3.1 Well-Structured Relations NOTESWhat constitutes a well-structured relation (or table)? Intuitively, a well-structured relation contains a minimum amount of redundancy and allows users to insert, modify, and delete the rows in a table without errors or inconsistencies; HOTELl (Figure 10.5) is such a relation. Each row of the table contains data describing one hotel, and any modification to an hotel’s data {such as a change in Manager) is confined to one row of the table.In contrast, HOTEL2 (Figure 10.6) contains data about hotels and the rooms in the hotels. Each row in this table is unique for the combination of Hotel_ID and Rooms No, which becomes the primary key for the table. This is not a well-structured relation, however, If you examine the sample data in the table, you notice a considerable amount of redundancy. For example, Hotel_ID, Name, Type, and Manager values appear in two separate rows for employees 1000, 1100 and 1500. Consequently, if the Manager for hotel 1000 changes, we must record this fact in two rows (or more,- for some hotels).
HOTEL2
HOTELJD Name Type Manager Room No Room Rent
1000 Suman Plaza Suman Plaza Jainson Shiva Shiva
5 Star 5 Star2 Star3 Star 3 Star 5 Star 3 Star
SanjaySanjayBeenaChstan .ChelanDavidSuman
A2001B3105
4,0003,0002.5003.500 1,750 8,000
•3,200
10001400 2501100 12801100 7801900 Hyat S50011500 Tai 3200
Fig. 10.6 Relation having redundancy.
HOTROOM
HOTELJD Room No Room_Renf
1000 4,0003,0002.5003.500 1,750 8.000 3,200
A2001B31051000
1400 2501100 12801100 7801900 S5001
32001500
Fig. 10.7 HOT ROOM relation.
The problem with this relation is that it contains data about two entities: HOTEL and ROOM. You will learn to use principles of normalization to divide HOTEL2 into two relations. One ofthe resulting relations is HOTELl (Figure 10.5). The other we will call HOT ROOM, which appears with sample data in Figure 10.7. The primary key of this relation is the combination of HoteI_ID and Room_No (we emphasize this by underlining the column names for these attributes).
Self-Instructional Material 213

System Analysis and Design
STUDENT ACTIVITY 10.1
l.'What are the purposes of database design?
2. List the various data models used in information systems. Which one is popular nowadays and why?
214 Self-Instructional Material
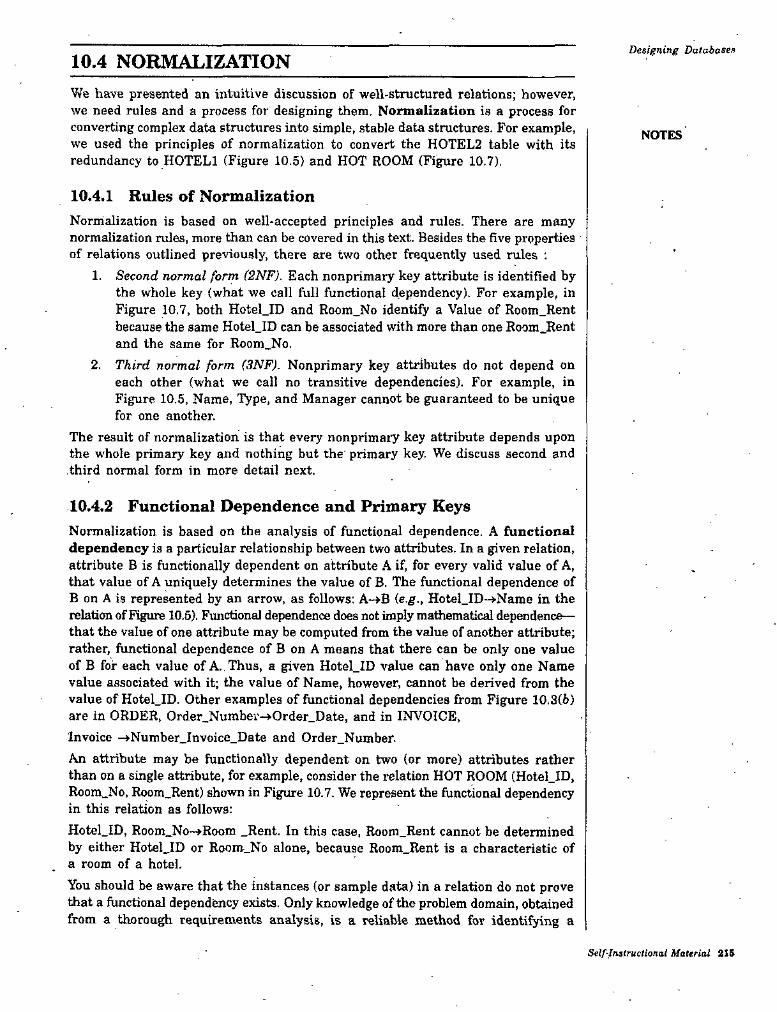
Designing Databases10.4 NORMALIZATIONWe have presented an intuitive discussion of well-structured relations; however, we need rules and a process for designing them. Nonnalization is a process for converting complex data structures into simple, stable data structures. For example, we used the principles of normalization to convert the HOTEL2 table with its redundancy to HOTELl (Figure 10.5) and HOT ROOM (Figure 10.7).
NOTES
10.4.1 Rules of NormalizationNormalization is based on well-accepted principles and rules. There are many normalization rules, more than can be covered in this text. Besides the five properties • of relations outlined previously, there are two other frequently used rules ;
1. Second normal form (2NF). Each nonprimary key attribute is identified by the whole key (what we call full functional dependency). For example, in Figure 10.7, both Hotel_ID and Room_No identify a Value of Room_Rent because the same Hotel_ID can be associated with more than one Room_Rent and the same for Room_No.
2. Third normal form (3NF). Nonprimary key attributes do not depend on each other (what we call no transitive dependencies). For example, in Figure 10.5, Name, Type, and Manager cannot be guaranteed to be unique for one another.
The result of normalization is that every nonprimary key attribute depends upon the whole primary key and nothing but the primary key. We discuss second and third normal form in more detail next.
10.4.2 Functional Dependence and Primary KeysNormalization is based on the analysis of functional dependence. A functional dependency is a particular relationship between two attributes. In a given relation, attribute B is functionally dependent on attribute A if, for every valid value of A, that value of A uniquely determines the value of B. The functional dependence of B on A is represented by an arrow, as follows: A-»B ie.g., Hotel_ID-»Name in the relation of Figure 10.5). Functional dependence does not imply mathematical dependence— that the value of one attribute may be computed from the value of another attribute; rather, functional dependence of B on A means that there can be only one value of B for each value of A. Thus, a given Hotel_ID value can have only one Name value associated with it; the value of Name, however, cannot be derived from the value of Hotel_ID. Other examples of functional dependencies from Figure 10.3(5) are in ORDER, Order_Numbev-»Order_Date, and in INVOICE,Invoice -»Number_Invoice_Date and Order_Number-An attribute may be functionally dependent on two (or more) attributes rather than on a single attribute, for example, consider the relation HOT ROOM (HoteI_ID, Room_No, Room_Rent) shown in Figure 10.7. We represent the functional dependency in this relation as follows:Hotel_ID, Room_No--»Room _Rent. In this case, Room_Rent cannot be determined by either HotelJD or Room_No alone, because Room_Rent is a characteristic of a room of a hotel.You should be aware that the instances (or sample data) in a relation do not prove that a functional dependency exists. Only knowledge of the problem domain, obtained from a thorough requirements analysis, is a reliable method for identifying a
Self-Instructional Material 215
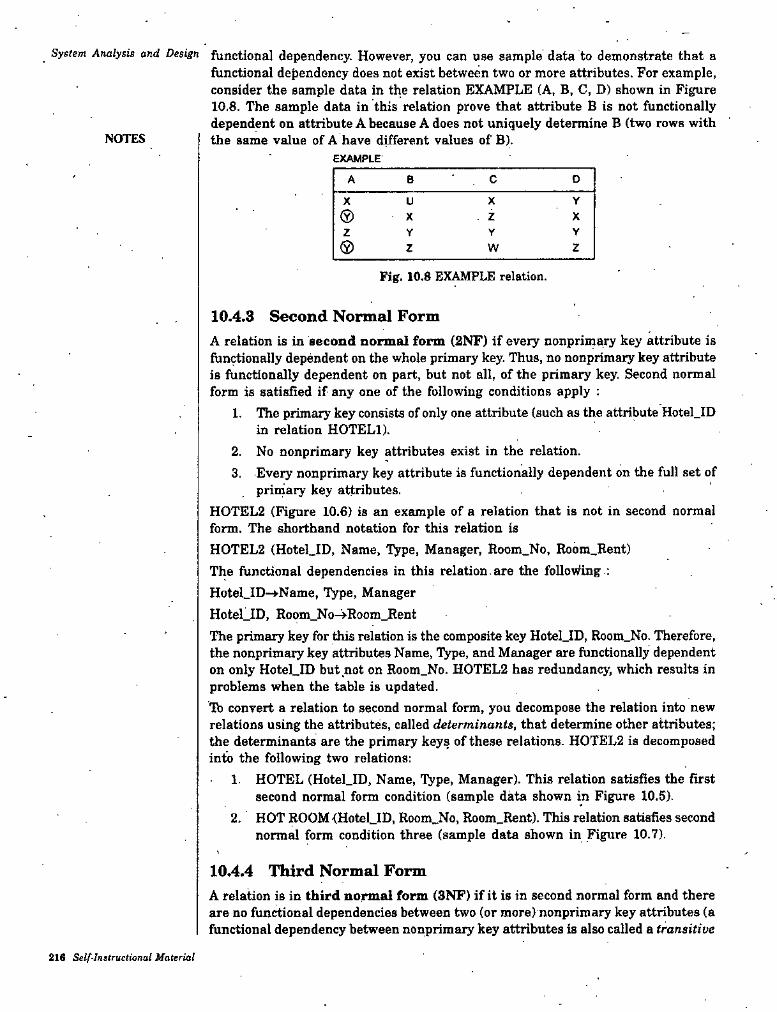
System Analysis and Design functional dependency. However, you can use sample data to demonstrate that afunctional dependency does not exist between two or more attributes. For example, consider the sample data in the relation EXAMPLE (A, B, C, D) shown in Figure 10.8. The sample data in this relation prove that attribute B is not functionally dependent on attribute A because A does not uniquely determine B (two rows with the same value of A have different values of B).
EXAMPLE
NOTES
A B C O
X YX UXX zVz Y Y
0 w zz
Fig. 10.8 EXAMPLE relation.
10.4.3 Second Normal FormA relation is in second normal form {2NF) if every nonprimary key attribute is functionally dependent on the whole primary key. Thus, no nonprimary key attribute is functionally dependent on part, but not all, of the primary key. Second normal form is satisfied if any one of the following conditions apply :
1. The primary key consists of only one attribute (such as the attribute Hotel_ID in relation HOTELl).
2. No nonprimary key attributes exist in the relation.3. Every nonprimary key attribute is functionally dependent on the full set of
primary key attributes.HOTEL2 (Figure 10.6) is an example of a relation that is not in second normal form. The shorthand notation for this relation isHOTEL2 (Hotel_ID, Name, TVpe. Manager, Room_No, Room_Rent)The functional dependencies in this relation.are the following.: Hotel_ID-+Name, Type, Manager HoteLID, Room_No-»Room_RentThe primary key for this relation is the composite key HoteLID, Room_No. Therefore, the nonprimary key attributes Name, Type, and Manager are functionally dependent on only HoteLID but not on Room_No. HOTEL2 has redundancy, which results in problems when the table is updated.Tb convert a relation to second normal form, you decompose the relation into new relations using the attributes, called determinants, that determine other attributes; the determinants are the primary keys of these relations. HOTEL2 is decomposed into the following two relations;
1. HOTEL (HoteLID, Name, Type, Manager). This relation satisfies the first second normal form condition (sample data shown in Figure 10.5).
2. HOT ROOM (HoteLID, Room^No, Room.Rent). This relation satisfies second normal form condition three (sample data shown in Figure 10.7).
10.4.4 Third Normal FormA relation is in third normal form (3NF) if it is in second normal form and there are no functional dependencies between two (or more) nonprimary key attributes (a functional dependency between nonprimary key attributes is also called a transitive
216 Self-Instructional Material
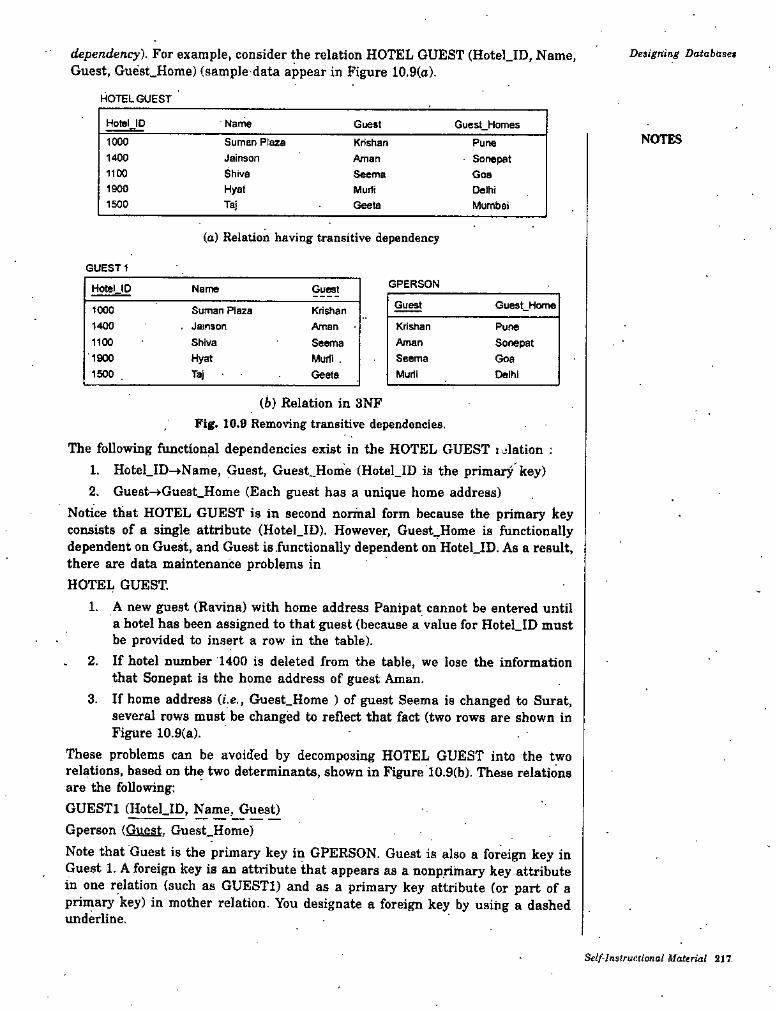
dependency). For example, consider the relation HOTEL GUEST (Hotel.ID, Name, Guest, Guest^Home) (sample data appear in Figure 10.9(a).
Designing Databases
HOTELGUEST
HoteIJO ' Name Guest Guest HomesNOTES1000 Sumen Plaza
Jainson Shiva Hyet
KhshanAman
Pune1400 Sonepat1100 Seema GoaIdOO Muili Delhi
Mumbai1500 Taj Geete
(a) Relation having transitive dependency
GUEST 1GPERSONHotel ID Name GuestGuest Guest_HorT>e1000 Suman Plaza
. Jainson Shiva HyatTaj • •
Krishan Aman Seema Murli . Geeta
1400 KrishanAmanSeemaMutli
PuneSonepatGoaDelhi
110019001500
(6) Relation in 3NFFig. 10.9 Removing transitive dependencies.
The following functional dependencies exist in the HOTEL GUEST i jiation ;1. Hotel_ID-»Name, Guest, Guest_Home (Hotel_ID is the primary key)2. Guest-^Guest.Home (Each guest has a unique home address)
Notice that HOTEL GUEST is in second normal form because the primary key consists of a single attribute (Hotel_ID). However, Guest_Home is functionally dependent on Guest, and Guest is .functionally dependent on HoteLID. As a result, there are data maintenance problems inHOTEL GUEST.
1. A new guest (Ravina) with home address Panipat cannot be entered until a hotel has been assigned to that guest (because a value for HoteLID must be provided to insert a row in the table).
. 2. If hotel number 1400 is deleted from the table, we lose the informationthat Sonepat is the home address of guest Aman.
3. If home address (t.e., Guest_Home ) of guest Seema is changed to Surat, several rows must be changed to reflect that fact (two rows are shown in Figure 10.9(a).
These problems can be avoided by decomposing HOTEL GUEST into the two relations, based on the two determinants, shown in Figure T0.9(b). These relations are the following:GUESTl (HoteLID, Name, Guest)Gperson (Guest. Guest_Home)Note that Guest is the primary key in GPERSON. Guest is also a foreign key in Guest 1. A foreign key is an attribute that appears as a nonprimary key attribute in one relation (such as GUESTl) and as a primary key attribute (or part of primary key) in mother relation. You designate a foreign key by using a dashed underline.
a
Self-Instrue.tional Material 217.
System Analysis and Design A foreign key must satisfy referential integrity, which specifies that the value ofan attribute in one relation depends on the value of the same attribute in another relation. Thus, in Figure 10.9(6), the value of Guest in each row of table GUESTl is limited to only the current values of Guest in the GPERSON table. Referential integrity is and of the most important principles of the relational model.
NOTES
10.5 MERGING RELATIONSAs part of the logical database design, normalized relations likely have been created from a number of separate E-R diagrams and various user interfaces. Some, of the relations may be redundant—they may refer to the same entities. If so, an analyst should merge those relations to remove the redundancy. This section describes merging relations, or view integration, which is the last step in logical database design and prior to physical file and database design.
10.5.1 An Example of Merging RelationsSuppose that modeling a user interface or transforming an E-R diagram results in the following 3NF relation :TEXT BOOKl (ISBN. Title, Price)Modeling a second user interface might result in the following relation:TEXT BOOK? (ISBN. Title, Edition, Publisher.ID, Publisher„Addre8s)Because these two relations have the same primary key (ISBN) and describe the same entity, they should be merged into one relation. The result of merging the relations is the following relation:TEXT BOOK (ISBN. Title, Price, Edition, PublisherJD, Publisher_Address). • Notice that an attribute that appears in both relations (such as Title in this example) appears only once in the merged relation.
10.5.2 View Integration ProblemsWhen integrating relations, an analyst must understand the meaning of the data and be prepared to resolve any problems that may arise in the process. In this section, we describe and illustrate four problems that arise in view integration; synonyn^, homonyms, dependencies between nonkeys, and class/subclass relationships. Synonyms. In some situations, two or more attributes may have different names but the same meaning, as when they describe the same characteristic of an entity. Such attributes are called synonyms. For example, Stu_ID and Student_Number may be synonyms.When merging relations that contain synonyms, an analyst should obtain, if possible, agreement from users on a single standardized name for the attribute and eliminate the other synonym. Another alternative is to choose a third name to replace the synonyms. For example, consider the following relations:TEXT BOOKl (Book_No, Title, Edition)TEXT BOOK2 (Registration_No, Price, Publisher)In this case, the analyst recognizes that both the Book_No and the Registration.No are synonyms for a Book’s ISBN number and are identical attributes. One possible resolution would be to standardize one of the two attribute names, such as Book_No. Another option is to use a new attribute name, such as ISBN, to replace both synonyms. Assuming the latter approach, merging the two relations would produce
218 Self-Instructional Material
the following result:TEXT BOOK (I5BN. Title, Edition, Price, Publisher)'Homonyms. In other 'situations, a single attribute name, called a homonym, may have more than one meaning or describe more than one characteristic. For example, the term account might refer to a bank’s checking account, savings account, loan account, or other type of account; therefore, account refers to different data, depending on how it is used.You should be on the lookout for homonyms when merging relations. Consider the following example :CUSTOMERl (CuBtomer_ID, Name, Account_No)CUSTOMER2 (Customer_ID, Name, Address, Account_No)In discussions with users, the systems analyst may discover that the attribute Account_No in CUSTOMERl refers to a Customer’s Barings Bank Account Number whereas in CUSTOMER2 the same attribute refers to a Customer’s Fixed Deposit account number. To resolve this conflict, we would probably need to create new attribute names and the merged relation would become CUSTOMER (Gustomer.ID, Name, Address, SB.ACCNO, FD_ACCNO) Dependencies Between Nonkeys. When two 3NF relations are merged to form a single relation, dependencies between nonkeys may result. For example, consider the following two relations:EMPLOYEEl (EMP_NO, SB_ACCNO)EMPLOYEE2 (EMP_N0, SALCR.BANK)Because EMPLOYEEl and EMPLOYEE2 have the same primary key, the two relations may be merged:EMPLOYEE (EMP_NO, SB.ACCNO, SALCR_BANK)However, suppose that each Savings bank account number (SB.ACCNO) belongs to exactly one bank (employee’s directed single bank account for salary transfer). In this case, SALCR.BANK is functionally dependent bn SBjACCNO : SB.ACCNO-»SALCR.BANKIf this dependency exists, then EMPLOYEE is in 2NF but not 3NF. because it contains a functional dependency between nonkeys. The analyst can create 3NF relations by creating two relations with SB.ACCNO as a foreign key in EMPLOYEE: EMPLOYEE (EMP.NO, SB.ACCNO)ACCOUNT BANK (^B^C^NO, SALCR.BANK)Class/Subclaaa. Class/subclass relationships may be hidden in user views or relations. Suppose that we have the follovring two hospital relations:PATIENTl (Patient.ID, Name, Address, Date.’Treated)PATIENT2 (Patient.ID, Room.Number)
• Initially, it appears that these two relations can be merged into a single PATIENT relation. However, suppose that there are two different types of patients: inpatients and outpatients. PATIENTl actually contains attributes common to all patients. PATIENT2 contains an attribute (Room.Number) that is a,characteristic only of inpatients. In this situation, you should create class/subclass relationships for these entities:PATIENT (Patient.ID. Name.Address)INPATIENT (Patient.ID, Room.Number)OUTPATIENT (Patient.ID, Date.Treated)
Designing Databases
NOTES
Si'l/'-Instniclional Material 219

Syflem Analysis and Design
STUDENT ACTIVITY 10.2
1. What type of relationship exists in relational data model—explicit or implicit? How is the relationship between entities represented? Explain with an example.
2. What is referential integrity? What is its purpose? Give an example.
220 Self-Instructional Material
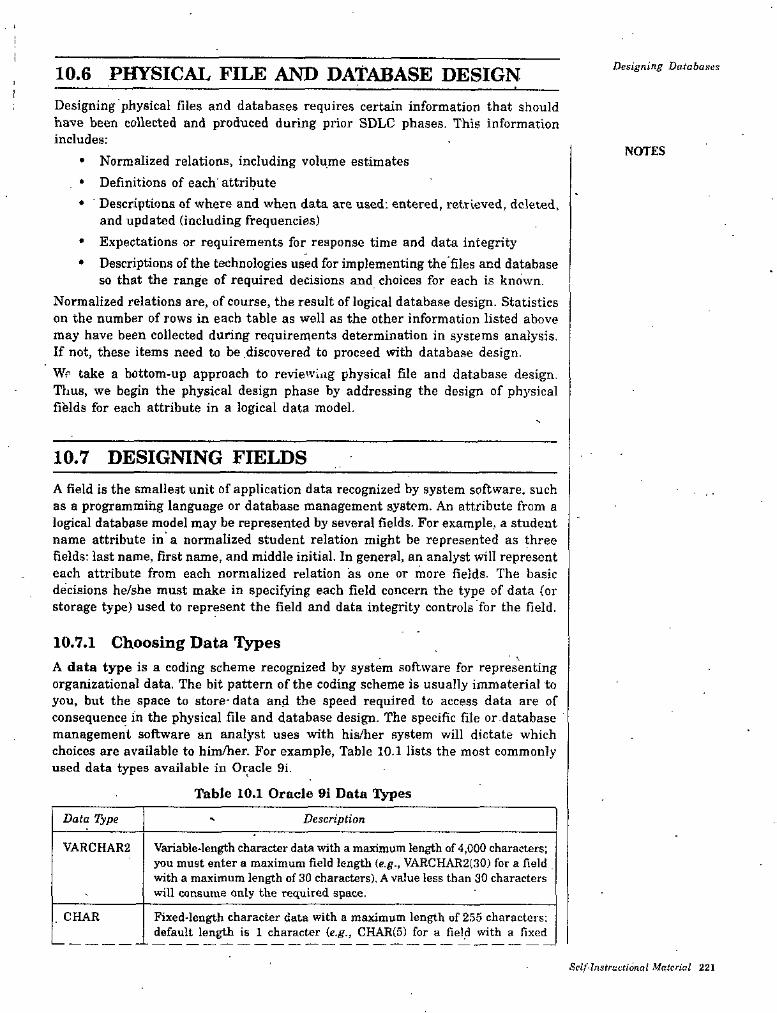
De$igning Databases10.6 PHYSICAL FILE AND DATABASE DESIGNDesigning physical files and databases requires certain information that should have been collected and produced during prior SDLC phases. This information includes:
• Normalized relations, including volume estimates , • Definitions of each' attribute
• ■ Descriptions of where and when data are used; entered, retrieved, deleted,and updated (including frequencies)
• Expectations or requirements for response time and data integrity• Descriptions of the technologies used for implementing the'files and database
so that the range of required decisions and choices for each is known.Normalized relations are, of course, the result of logical database design. Statistics on the number of rows in each table as well as the other information listed above may have been collected during requirements determination in systems analysis. If not, these items need to be discovered to proceed with database design.Wp take a bottom-up approach to reviewing physical file and database design. Tlius, we begin the physical design phase by addressing the design of physical fields for each attribute in a logical data model.
NOTES
10.7 DESIGNING FIELDSA field is the smallest unit of application data recognized by system software, such as a programmihg language or database management system. An attribute from a logical database model may be represented by several fields. For example, a student name attribute in a normalized student relation might be represented as three fields; last name, first name, and middle initial. In general, an analyst will represent each attribute from each normalized relation as one or more fields. The basic decisions he/she must make in specifying each field concern the type of data (or storage type) used to represent the field and data integrity controls for the field.
10.7.1 Choosing Data TypesA data type is a coding scheme recognized by system software for representing oi^anizational data. The bit pattern of the coding scheme is usually immaterial to you, but the space to store-data and the speed required to access data are of consequence in the physical file and database design. The specific file or.database management software an analyst uses with his/her system will dictate which choices are available to him/her. For example. Table 10.1 lists the most commonly used data types available in Oracle 9i.
Table 10.1 Oracle 9i Data Types
Data Type Description
VARCHAR2 Variable-length character data with a maximum length of 4,000 characters; you must enter a maximum field length te.g., VARCHAR2C30) for a field with a maximum length of 30 characters), A value less than 30 characters will consume only the required space.
CHAR Fixed-length character data with a maximum length of 255 charactei s; default length is 1 character (e.g., CHAR(5) for a field with a fixed
Self InstruLtional Material 221

System Analysis and Design length of five characters, capable of holding a value from 0 to 5 characters long).
LONG Capable of storing up to two gigabytes of one variable-length character data field {e.g., to hold a medical instruction or a customer comment);
Positive and negative numbers in the range 10"^^“ to 10**®; can specify the precision {total number of digits to the left and right of the decimal point) and the scale (the number of digits to the right of the decimal point) (e.g., NUMBER (5) specifies an integer field with a maximum of 5 digits and NUMBER(5, 2) specifies a field with no more than five digits and exactly two digits to the right of the decimal point).
NOTES NUMBER
Any date from January 1,4712 B.C. to December 31,4712 A.D.; date stores the century, year,- month, day, hour, minute, and second.
DATE
Binary large object, capable of storing up to four gigabytes of binary data (e.g., a photograph or sound clip).
BLOB
Selecting a data tjrpe balances four objectives that will vary in degree of importance, depending on the application:
1. Minimize storage space2. Represent all possible values of the field3. Improve data integrity for the field4. Support all data manipulations desired on the field.
An analyst wants to choose a data type for a field that minimizes space, represents every possible legitimate value for the associated attribute, and allows the data to be manipulated as needed. For example, suppose a quantity sold field can be represented by a Number data type. An analyst would select a length for this field that would handle the maximum value, plus some room for grov^th of the business. Further, the Number data type will restrict users from entering inappropriate values (text), but it does allow, negative numbers (if this is a problem, application code or form design may be required to restrict the values to positive ones).Be careful — the data type must be suitable for the life of the application; otherwise, maintenance will be required. Choose data types for future needs by anticipating growth- Also, be careful that date arithmetic can be done so that dates can be subtracted or time periods can be added to or subtracted from a date.Several other capabilities of data types may be available with some database technologies. We discuss a few of the most common of these features next: calculated fields and coding and compression techniques.Calculated Fields. It is common for an attribute to be mathematically related to other data. For example, an invoice may include a total due field, which represents the sum of the amount due on each item on the invoice. A field that can be derived from other database fields is called a calculated (or computed or derived) field (recall that a functional dependency between attributes does not imply a calculated field). Some database technologies allow you to explicitly define calculated fields along with other raw data fields. If you specify a field as calculated, you would then usually be prompted to enter the formula for the calculation; the formula can involve other fields from the same record and possibly fields from records in related files. The database technology will either store the calculated value or compute it when requested.Coding and Compression Teciiniqucs. Some attributes have very few values from a large range of possible values. For example, suppose in Sheelak Ram
222 Self-lnsirucUortal Material

Furniture that each product has a finish attribute, with possible values of Birch, Walnut, Oak, and so forth. To store this attribute as Text might require 12.16, or even 20 bytes to represent the longest finish value. Suppose that even a liberal, estimate is that Sheelak Ram Furniture will never have more than 30 finishes. Thus, a single alphabetic or alphanumeric character would be more than sufficient. We not only reduce storage space but also increase integrity (by restricting input to only a few values), which helps to achieve two of the physical file and database design goals. Codes also have disadvantages. If used in system inputs and outputs, they can be more difficult for users to remember, and programs must be written to decode fields if codes will not be displayed.
Designing Databases
NOTES
10.7.2 Controlling Data IntegrityWe have already explained that data typing helps control data integrity by limiting the possible range of values for a field. There are additional physical file and database design options an analyst might use to ensure higher-quality data. Although these controls can be imposed within application programs, it is better to include these as part of the file and database definitions so that the controls are guaranteed to b 1 applied all the time as well as uniformly for all programs. There are four po"^ alar data integrity control methods: default value, range control, referential integrity, and null value control explained below:
• Default value. A default value is the value a field will assume unless an explicit value is entered for the field. For example, the city and state of most customers for a particular retail store will likely be the same as the store's city and state. Assigning a default value to a field can reduce data entry time (the field can simply be skipped during data entry) and data entry errors, such as typing IM instead of IN for India.,
• ■ Range control. Both numeric and alphabetic data may have a limited set ofpermissible values. For example, a field for the number of product units sold may have a lower bound of zero, and a field that represents the month of a product sale may be limited to the values JAN. FEB, and so forth. ■ ^
• Referential integrity. As noted earlier in this UNIT, the most common example of referential integrity is cross-referencing between relations. For example, consider the pair of relations in Figure 10.10(a). In this case, the values for the foreign key Ciistomer.ID field within a customer order must be limited to the set of Customer_ID values from the customer relation; we would not want to accept an order for a nonexisting or unknown customer.
CUSTOMER (Customer ID, Cust_Name, Cust_AdcjfBss....)
CUST_ORreR (Ortler_ID. CustomeMD, Or!Jef_Date.-..)and CustomerJD may not be null because every order must be for some existing customer
(a) Referential integrity between relations
■TEMPLOYEE (EtnployeeJD, SupervIsorJO, Empl_Name....)
and SupervisorJO may be null because not all employees have supervisors
(A) Referential integrity within a relation
Fig. 10.10 Examples of referential integrity field controls.Self-Instructional Material 223
System Analysis and Design Referential integrity may be useful in other instances. Consider the employee relation example in Figure lO.lO(fe). In this example, the employee relation has a field of Supervisor_ID. This field refers to the Employee^ID of the employee’s supervisor and should have referential integrity on the EmployeeJD field within the same relation. Note in this case that because some employees do not have supervisors, this is a weak referential integrity constraint because the value of a Supervisor_ID field may be empty.
• Null value control. A null value is a special field value, distinct from a zero, blank, or any other value, that indicates that the value for the field is missing or otherwise unknown. It is not uncommon that when it is time to enter data—for example, a new customer—you might not know the customer’s phone number. The question is whether a customer, to be valid, must have a value for this field. The answer for this field is probably initially no, because most data processing can continue without knowing the customer’s phone number. Later, a null value may not be allowed when you are ready to ship product to the customer. On the other hand, you must always know a value for the Customer^ID field. Due to referential integrity, you cannot enter any customer orders for this new customer without knowing an existing Customer_ID value, and customer na, 'e is essential for visual verification of correct data entry. Besides using a spe ial null value when a field is missing its value, you can also estimate the value, produce a report indicating rows of tables with critical missing values, or determine whether the missing value matters in computing needed information.
NOTES
10.8 DESIGNING PHYSICAL TABLESA relational database is a set of related tables (tables are related by foreign keys referencing primary keysi. In logical database design, an analyst grouped into a relation those attributes that concern some unifying, normalized business concept, such as a customer, product, or employee. In contrast, a physical table is a named set of rows and columns that specifies the fields in each row of the table.
• A physical table may or may not correspond to one relation. Whereas normalized relations possess properties of well-structured relations, the design of a physical table has two goals different from those of normalization; efficient use of secondary storage and data processing speed.The efficient use of secondary storage (disk space) relates to how data are loaded on disks. Disks are physically divided into units (called pages) that can be read or written in one machine operation. Space is used efficiently when the physical length of a table row divides close to evenly into the length of the storage unit. For many information systems, this even division is very difficult to achieve because it depends on factors, such as operating system parameters, outside the control of each database. Consequently, we do not discuss this factor of physical table design in this text.A second and often more important consideration when selecting a physical table design is efficient data processing. Data are most efficiently processed when'they are stored close to one another in secondary memory, thus minimizing the number of input/output (I/O) operations that must be performed. Typically, the data in one physical table (all the rows and fields in those rows) are stored close together on disk. Denormalizatiom is the process of splitting or combining normalized relations into- physical tables based on affinity of use of rows and fields. Consider Figure
224 Self.lnslnielionat Material
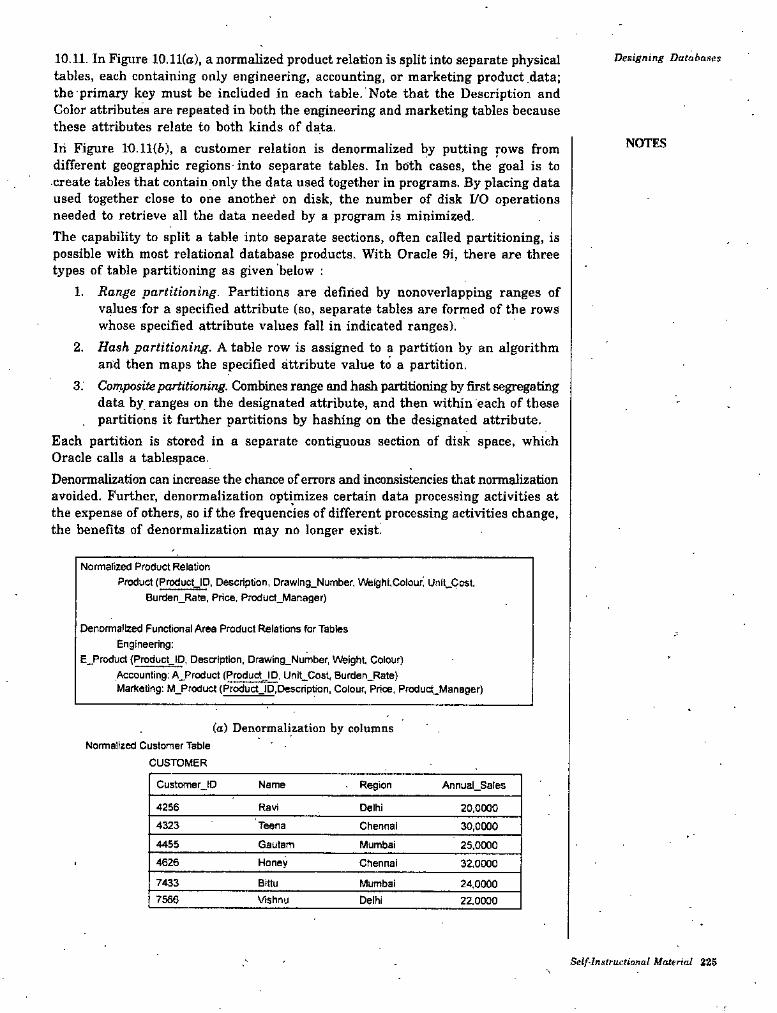
10.11. In Figure lO.ll(o), a normalized product relation is split into separate physical tables, each containing only engineering, accounting, or marketing product data; the primary key must be included in each table. Note that the Description and Color attributes are repeated in both the engineering and marketing tables because these attributes relate to both kinds of data.Iii Figure 10.11{f»), a customer relation is denormalized by putting rows from different geographic regions into separate tables. In both cases, the goal is to create tables that contain only the data used together in programs. By placing data used together close to one another on disk, the number of disk I/O operations needed to retrieve all the data needed by a program is minimized.The capability to split a table into separate sections, often called partitioning, is possible with most relational database products. With Oracle 9i, there are three types of table partitioning as given below :
1. Range pariitioning. Partitions are defined by nonoverlapping ranges of values for a specified attribute (so, separate tables are formed of the rows whose specified attribute values fall in indicated ranges).
2. Hash partitioning. A table row is assigned to a partition by an algorithm and then maps the specified attribute value to a partition.
3. Composite partitioning. Combines range and hash partitioning by first s^regating data by ranges on the designated attribute, and then within each of these partitions it further partitions by hashing on the designated attribute.
Each partition is stored in a separate contiguous section of disk space, which Oracle calls a tablespace.Denormalization can increase the chance of errors and inconsistencies that normalization avoided. Further, denormalization optimizes certain data processing activities at the expense of others, so if the frequencies of different processing activities change, the benefits of denormalization may no longer exist.
Designing Databases
NOTES
Normarued Product RelationProduct (ProductJD, Description, Drawlng_Number, Weight,Colour, Unit_Cost,
Burden_Rate, Price. Product_Manager)
Denormalized Functional Area Product Relations for Tables Engineering:
Byproduct (Product_ID, Description, Drawing_Number, Weight, Colour)Accounting: A_Product (ProductJD, Unit_Cost, Burden_Rate)Martceting: M_Product (ProductJD,Descripbon, Colour, Price, Produ(3_ManBger)
(a) Denormalization by columnsNormalized Customer Table
CUSTOMER
Custwner_ID Name Region Annual Sales
4256 Ravi Delhi 20,00004323 Teena Chennai 30,00004455 Gautam Mumbai 25,00004626 Honey Chennai 32,0000
7433 Bittu Mumbai 24,00007566 Vtshnu Delhi 22,0000
Self-Instructional Material 225
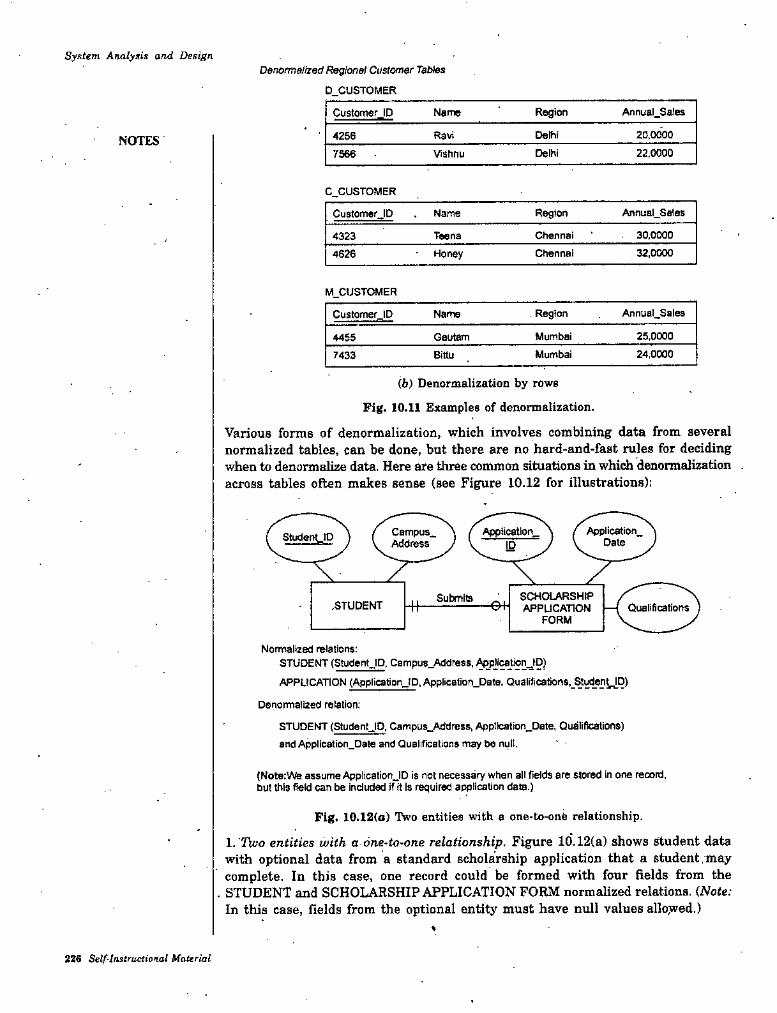
Syatem Analysis and DesignDenomelized Regional Customer Tables
D CUSTOMER
Annual SalesRegionCuslomerJD Natne
Delhi 20,0000Ravi4256NOTES22,0000Delhi7566 Vishnu
C CUSTOMER
Region Annual SalesCustomefJD Name
Chennai . 30,0000Teena43234626 Chennai 32,0000Honey
M CUSTOMER
Annual Sales. RegionCustomer ID Name
25.0000Mumbai4455 GautemMumbai 24,00007433 Bittu
(b) Denormalizatioo by rowa
Fig. 10.11 Examples of denomalization.
Various forms of denormalization, which involves combining data from several normalized tables, can be done, but there are no hard-and-fast rules for deciding when to denormalize data. Here are tliree common situations in which denormalization . across tables often makes sense (see Figure 10.12 for illustrations):
Application_Date
Application,Campus,AddressStudenyp
ID\_zV__ ZSCHCXARSHIPAPPUCATION
FORM
Submits.STUDENT Qualifications
Normalized relations:STUDENT (StudentJD, Campu8,Addre8S,
APPLICATION (Application,lD,Applicatlon,Date. Qualifications, St^en^D)
Denormalized relation:
STUDENT (StudentJD, Campus_Address, Appllcation,Date, Qualifications) and Application_Date and Qualifications may be null
(NoterWe assume ApplicationJD is not necessary when all fields ere stored in orre record, but this field can be included if it Is required application data.)
Fig. 10.12(a) Two entities with a one-to-one relationship.
1. Two entities with a one-tO'One relationship. Figure 10.12(a) shows student data with optional data from a standard scholarship application that a student , may complete. In this case, one record could be formed with four fields from the
. STUDENT and SCHOLARSHIP APPLICATION FORM normalized relations, {Note: In this case, fields from the optional entity must have null values alloyred.)
♦
226 Self'Instructional MaUrial
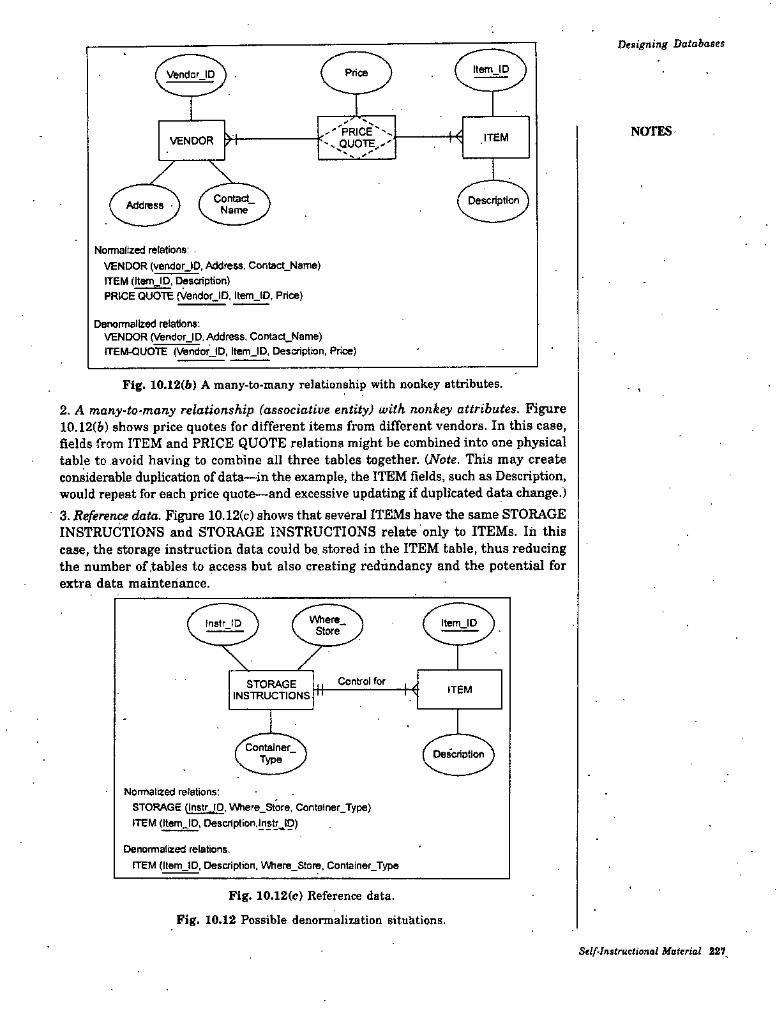
Designing Databases
ItemJDVlBndorJD
QUOTE,-'* V ^ ^
NOTESH .ITEMVENDOR H-
Contact.Name
DescriptionAddress -
Normalized refatior^s:VENDOT (vendorJD, Address, Cont8ct_N8me) ITEM (ItemJD, Description)PRICE QUOTE (Vendor_ID, ltem_lD. Price)
Denormalized relations:VENDOR (VendorJD. Address, Contact_Name) ITEM-QUOTE (VendorJD, ItemJD, Description, Price)
Fig. 10.12(6) A many-to-many relationship with nonkey attributes.
2. A many-to-many relationship (associative entity) with nonkey attributes. Figure 10.12(6) shows price quotes for different items from different vendors. In this case, fields from ITEM and PRICE QUOTE relations might be combined into one physical table to avoid having to combine all three tables together. (iVote. This may create considerable duplication of data—^in the example, the ITEM fields, such as Description, would repeat for each price quote—and excessive updating if duplicated data change.)3. Reference data. Figure 10.12(c) shows that several ITEMs have the same STORAGE INSTRUCTIONS and STORAGE INSTRUCTIONS relate only to ITEMs. In this case, the storage instruction data could be. stored in the ITEM table, thus reducing the number of .tables to access but also creating redundancy and the potential for extra data maintenance.
ltem IDfnstrJD
Contfol forSTORAGEINSTRUCTIONS ITEM
Contalrter_Type Description
Normalized relations:STORAGE (InstrJO, Where_Store, ContalnerJType) ITEM (jtemJD, Description,Instf^lO)
Denormalized relations.ITEM (ItemJD, Description, Where_Store, Container_Type
Fig. 10.12(c) Reference data.
Fig. 10.12 Possible denonnalization situations.
Self-Instructional Material 227.
System Analysis and Design iQ.g.i Arranging Table Rows
The result of denormalization is the definition of one or more physical files. A computer operating system stores data in a physical file, which is a named set of table rows stored in a contiguous 'section of secondary memory, A file contains rows and columns from one or more tables, as produced from denormalization. Tb the operating system (e.g., Windows, Linux, or UNIX), each table may be one file or the whole database may be in one file, depending on how the database technology and database designer organize data,
T)fpes of files in an Organization System
File is a collection of related records. It is organized to ensure that records are available for processing. The various types of files are given below ;
Master Files
These files contain records that are relatively permanent in nature. Records created in master file remain there for a long time. Data of the fields on the records may get changed but the record occurrence is active for a long pejiod of time. Master files are used for repeated processing. They can be further sub-classified into reference master files and dynamic master files.Reference master files contain highly static data — the data iii the records here does not change frequently. These are also called table files when they are directly put in the system and no program is provided to maintain the data in them. Examples:
• List of divisions in an organization• Pay scales in a company• Grades of employees• List of subject offered by a university.
Dynamic master files hold data that is continuously changed by business transactions. Examples:
• Account master which has the account code, name, and latest credit and debit balances (the balances changes with every financial transaction'involving that account).
• Item master which contains item code, name, and stock level (the stock level changes every time there is an isaue or receipt).
Transaction FilesTransaction files hold records describing business. These are temporary in nature as data-describing events have a limited useful life. For example, a store issue transaction is of active use only till the item master has been updated for the quantity issued, After that, the transaction can be “archived” or stored off-line-in case it is later required for audit or some analysis. For example.
Archive FilesThese are off-line files like transactions and master files that are no longer needed to be kept online. They are required only for audit, and possibly further analysis.
Work FilesIntermediate transient files need to be created during processing for storing temporary data. These are called work files.
NOTES
228 Self-Instructional Material
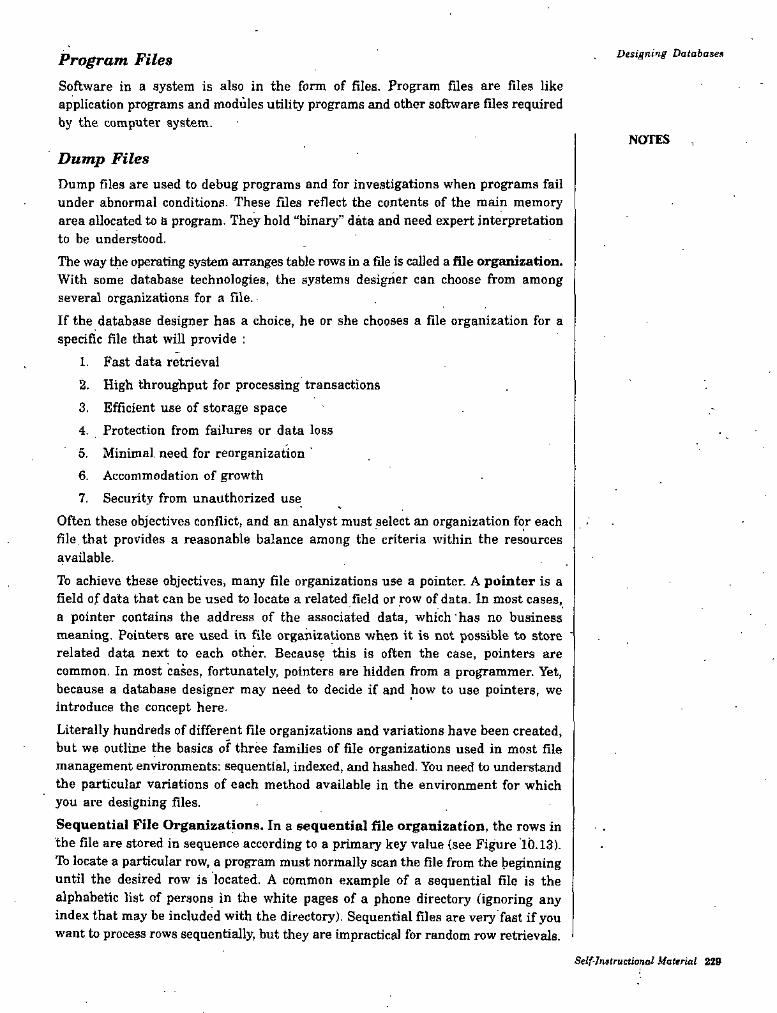
Designing DatabasesProgram FilesSoftware in a system is also in the form of files. Program files are files like application programs and modules utility programs and other software files required by the computer system.
NOTES
Dump FilesDump files are used to debug programs and for investigations when programs fail under abnormal conditions. These files reflect the contents of the main memory area allocated to a program- They hold “binary” data and need expert interpretation to be understood.The way the operating sj^m arranges table rows in a file is called a file organization. With some database technologies, the systems designer can choose from among several organizations for a file.If the database designer has a choice, he or she chooses a file organization for a specific file that will provide :
1. Fast data retrieval2. High throughput for processing transactions3. Efficient use of storage space4- Protection from failures or data loss
5. Minimal, need for reorganization '6- Accommodation of growth 7. Security from unauthorized use
Often these objectives conflict, and an analyst must select an organization for each file, that provides a reasonable balance among the criteria within the resources available.To achieve these objectives, many file organizations use a pointer. A pointer is a field of data that can be used to locate a related field or row of data. In most cases, a pointer contains the address of the associated data, which has no business meaning. Pointers are used in file organizations when it is not possible to store ’ related data next to each other. Because this is often the case, pointers are common. In most cases, fortunately, pointers are hidden from a programmer. Yet, because a database designer may need to decide if and how to use pointers, we introduce the concept here.Literally hundreds of different file organizations and variations have been created, but we outline the basics of three families of file organizations used in most file management environments: sequential, indexed, and hashed. You need to understand the particular variations of each method available in the environment for which you are designing files.Sequential File Organizations. In a sequential file organization, the rows in the file are stored in sequence according to a primary key value {see Figure 10.13). lb locate a particular row, a program must normally scan the file from the beginning until the desired row is located. A common example of a sequential file is the alphabetic list of persons in the white pages of a phone directory (ignoring any index that may be included with the directory). Sequential files are very fast if you want to process rows sequentially, but they are impractical for random row retrievals.
Self-Instructional Ualeriat 229
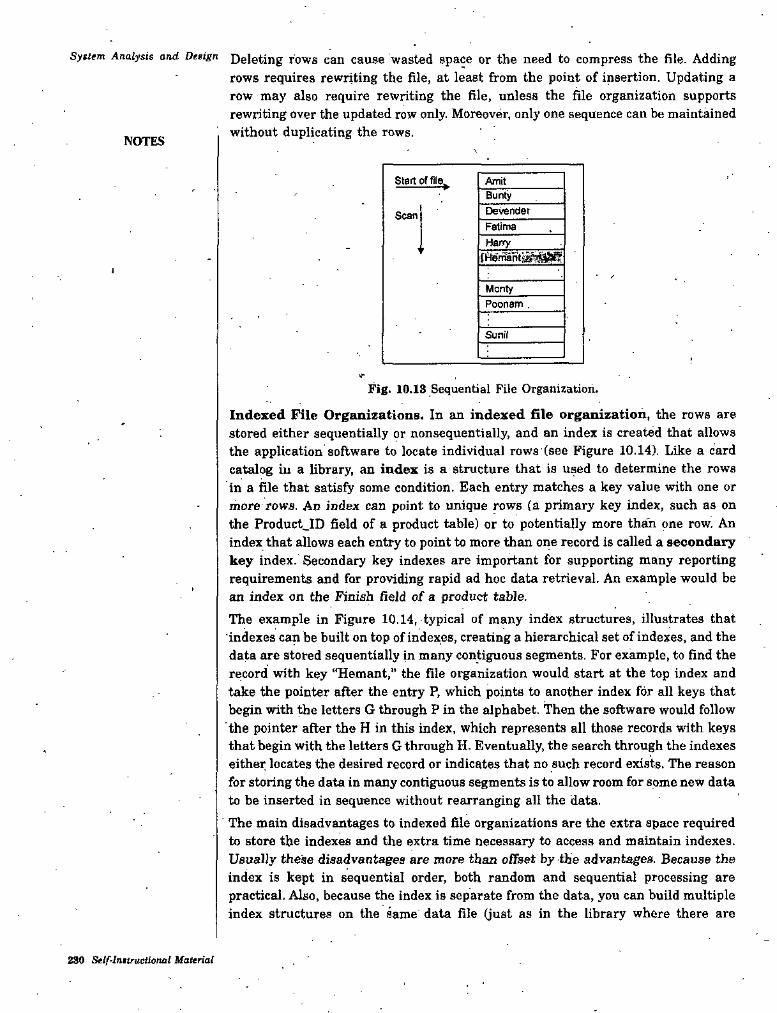
S>«rtm Anaiysis and Design Deleting rows can cause wasted space or the need to compress the file. Addingrows requires rewriting the file, at least from the point of insertion, Updating a row may also require rewriting the file, unless the file organization supports rewriting over the updated row only. Moreover, only one sequence can be maintained without duplicating the rows.NOTES
Start of file^ AmitBurih"DevenderScanFatimaHarry
tHerrrrit^a&g
MontyPoonam ,
SunrI
Fig. 10.13 Sequential File Organization.
Indexed File Organizations. In an indexed file organization, the rows are stored either sequentially or nonsequentially, and an index is created that allows the application software to locate individual rows (see Figure 10.14). Like a card catalog ill a library, an index is a structure that is used to determine the rows in a file that satisfy some condition. Each entry matches a key value with one or more rows. An index can point to unique rows (a primary key index, such as on the Product^ID field of a product table) or to potentially more thaih one row. An index that allows each entry to point to more than one record is called a secondary key index. Secondary key indexes are important for supporting many reporting requirements and for providing rapid ad hoc data retrieval. An example would be an index on the Finish field of a product table.The example in Figure 10.14, typical of many index structures, illustrates that 'indexes can be built on top of indexes, creating a hierarchical set of indexes, and the data are stored sequentially in many contiguous segments. For example, to find the record with key “Hemant,” the file organization would start at the top index and take the pointer after the entry P, which points to another index for all keys that begin with the letters G through P in the alphabet. Then the software would follow the pointer after the H in this index, which represents all those records with keys that begin with the letters G through H. Eventually, the search through the indexes either locates the desired record or indicates that no such record exists. The reason for storing the data in many contiguous segments is to allow room for some new data to be inserted in sequence without rearranging all the data.The main disadvantages to indexed file organizations are the extra space required to store the indexes and the extra time necessary to access and maintain indexes. Usually these disadvantages are more than offset by the advantages. Because the index is kept in sequential order, both random and sequential processing are practical. Also, because the index is separate from the data, you can build multiple index structures on the same data file (just as in the library where there are
230 Self-Instructional Material
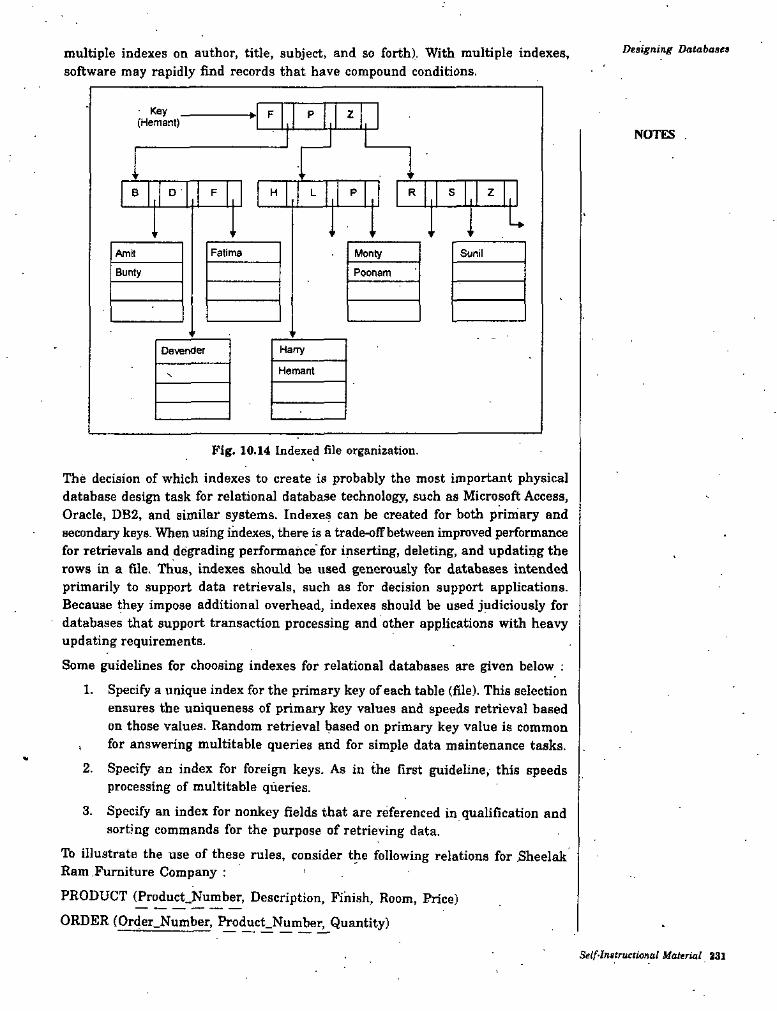
Designing Databasesmultiple indexes on author, title, subject, and so forth). With multiple indexes, software may rapidly find records that have compound conditions.
• Key (Hemant)
2F P♦
NOTES
B D H L P R S zF
FatimaAm it Monty Sunil
Bunty Poonam
HafiyOevender
HemantS
Fig. 10.14 Indexed file organization.
The decision of which indexes to create is probably the most important physical database design task for relational database technology, such as Microsoft Access, Oracle, DB2, and similar systems. Indexes can be created for both primary and secondary keys. When using indexes, there is a trade-off between improved performance for retrievals and degrading performance for inserting, deleting, and updating the rows in a file. Thus, indexes should be used generously for databases intended primarily to support data retrievals, such as for decision support applications. Because they impose additional overhead, indexes should be used judiciously for databases that support transaction processing and other applications with heavy updating requirements.
Some guidelines for choosing indexes for relational databases are given below :Specify a unique index for the primary key of each table (file). This selection ensures the uniqueness of primary key values and speeds retrieval based on those values. Random retrieval based on primary key value is common for answering multitable queries and for simple data maintenance tasks.Specify an index for foreign keys. As in the first guideline, this speeds processing of multitable queries.
Specify an index for nonkey fields that are referenced in qualification and sorting commands for the purpose of retrieving data.
To illustrate the use of these rules, consider the following relations for Sheelak Ram Furniture Company : ’
PRODUCT {Product_,Number, Description, Finish, Room, Price)ORDER (Order_Number, Product_Number, Quantity)
1.
4%
2.
3.
Self-Instructional Material 231
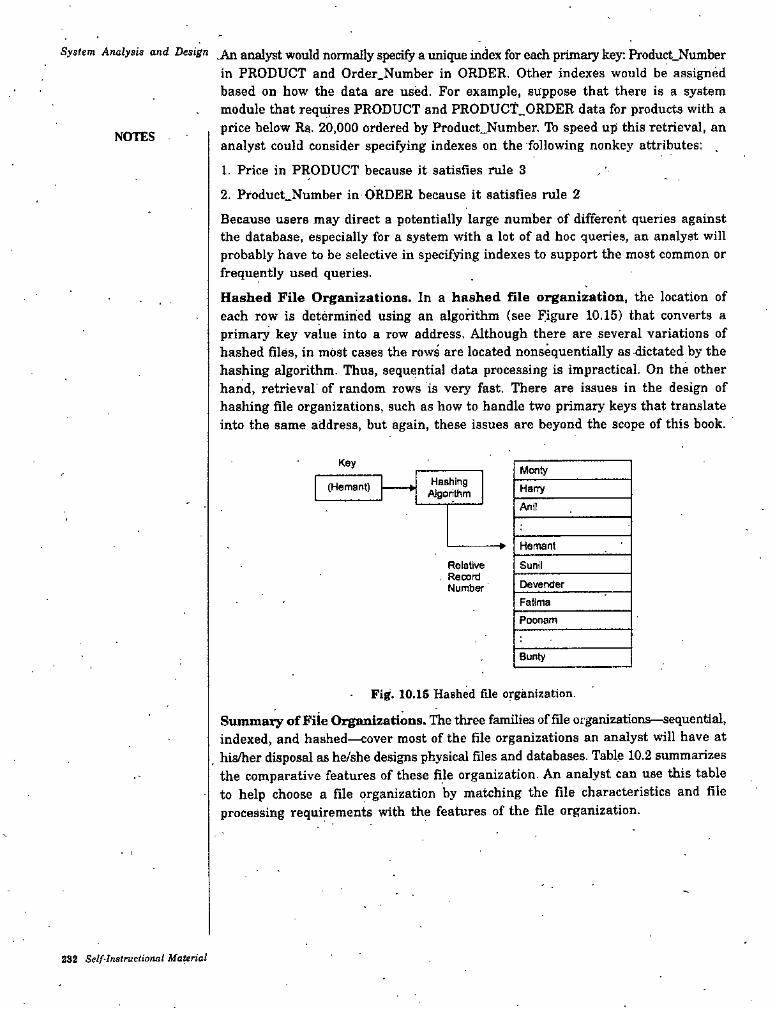
System Analysis and Design ^ analyst would normally specify a unique index for each primary key: Product_Numberin PRODUCT and Order.Number in ORDER. Other indexes would be assigned based on how the data are used. For example, suppose that there is a system module that requires PRODUCT and PRODUCT„ORDER data for products with a price below Rs. 20,000 ordered by Product_Number. To speed up this retrieval, an analyst could consider specifying indexes on the following nonkey attributes: .
1. Price in PRODUCT because it satisfies rule 32. Product_Number in ORDER because it satisfies rule 2Because users may direct a potentially large number of different queries against the database, especially for a system with a lot of ad hoc queries, an analyst will probably have to be selective in specifying indexes to support the most common or frequently used queries.Hashed File Organizations. In a hashed file organization, the location of each row is determined using an algorithm (see Figure 10,15) that converts a primary key value into a row address. Although there are several variations of hashed files, in most cases the rows are located nonsequentially as dictated by the hashing algorithm. Thus, sequential data processing is impractical. On the other hand, retrieval' of random rows is very fast. There are issues in the design of hashing file organizations, such as how to handle two primary keys that translate into the same address, but again, these issues are beyond the scope of this book.
NOTES
Key MontyHashing
AJgortthm(Hemant) ♦ HarryAnil
Hemant♦
Relative . Record
Numb«'
Sunil
DevenderFatimaPoonam
Bunty
Fig. 10.15 Hashed file organization.
Summary of File Ozg^anizations. The three families of file organizations—sequential, indexed, and hashed—cover roost of the file organizations an analyst will have at his/her disposal as he/she designs physical files and databases. Table 10.2 summarizes the comparative features of these file organization. An analyst can use this table to help choose a file organization by matching the file characteristics and file processing requirements with the features of the file organization.
2S2 Self-Instructional MaUrial

Table 10.2 Comparative Features of Sequential, Indexed, and Hashed File Organizations
Designing Dalahases
File Organization,
Factor Sequential Indexed flashedNOTESStorage space No wasted space No wasted space for
data, but extra space for index
Extra space may be need to allow for addition, and deletion ofrecords
✓ 'Sequential retrieval on primary key
Very fast Moderately fast ImpracticalI
Random retrieval on primary key.
Impractical Moderately fast Very fast
Multiple key retrieval Possible, but requires scanning whole file
Very fast with multiple indexes
Not possible
If space can be dynamically allocated, this is easy, but requires maintenance of indexes
Deleting rows Can create wasted space or require reorganizing
Very easy
Adding rows Requires rewriting If space can be dynamically allocated, this is easy, but requires maintenance of indexes
Very easy, except multiple keys with same address i ‘quire extra’ work
file
Updating rows Usually requires rewriting file
Easy, but requires maintenance of indexes
Very easy
10.8.2 Designing Controls for FilesTwo of the goals of physical table design mentioned earlier are protection from failures or data loss and security from unauthorized use. These goals are achieved primarily by implementing controls on each file. Data integrity controls, a primary type of control, were mentioned earlier in the unit. Two other important types of controls address file backup and security.It is almost inevitable that a file will be damaged or lost, due to either software or human errors. When a file is damaged, it must be restored to an accurate and reasonably current condition. A file and database designer has several techniques for file restoration, including;
• Periodically making a backup copy of a file• Storing a copy of each change to a file in a transaction log or audit trail• Storing a copy of each row before or after it is changed.
For example, a backup copy of a file and a log of rows after they were changed can be used to reconstruct a file from a previous state (the backup copy) to its current values. This process would be necessary if the current file were so damaged that it could not be used. If the current file is operational but inaccurate, then a log of before images of rows can be use'd in reverse order to restore a file to an accurate but previous condition. Then a log of the transactions can be reapplied to the restored file to bring it up to current values. It is important that the information system designer make provisions for backup, audit trail, and image files so that data files can be rebuilt-when errors and damage occur.
\
row
Self-Irtsl'MCtional Material -iSy. y
System Analysis and Design ^ information system designer can build data security into a file by severaJmeans, including:
• Coding, or .encrypting, the data in the file so that they cannot be readunless the reader knows how to decrypt the stored values.✓
• Requiring data file users to identify themselves by entering user names and pass words, and then possibly allowing only certain file activities (read, add, delete change) for selected users to selected data in the file.• Prohibiting users from directly manipulating any data in the file, but
' rather force programs and users to work with a copy (real or virtual) of the data they need; the copy contains only tiie data that users or programs are allowed to manipulate, and the original version of the data will change only after changes to the copy are thoroughly checked for validity.
Security procedures such as these all add overhead to an information system, so only necessary controls should be included.
NOTES
10.9 THE ROLE OF THE DATA BASE ADMINISTRATOR
A data base is a shared resource. When two or more users are tied to a common. data base, certain difficulties in sharing are likely to occur. Perceptions regarding data ownership, priority of access, and the like become issues that need to be resolved when the data base is in operation. To manage the data base, companies hire a data base administrator or DBA to protect and manage the data base on a regular basis.In addition to resolving user conflicts, the DBA performs maintenance and update tasks—recovery procedures, performance evaluation, data base timing, and new enhancement evaluation. Specifically, the DBA performs three key, functions : managing data activities, managing the data base structure, and managing the DBMS. Lets us discuss these in detail ;
1. Managing data activities. The DBA manages data base activities by providing standards, control procedures, and documentation to ensure each user’s independence from other users. Standardization is extremely important in a centralization-oriented environment. Every data base record must have a standard name, format, and unique strategy for access. Standardization, though resisted by users, simplifies reporting and facilitates management control.In addition to standardization, the DBA is concerned about data access and modification. Deciding who has authorization to modify what data is job in itself. Locks have to be established to implement this activity. Failures and recovery procedures are added concerns. Failures may be caused by machines, media, communications, or users. The user must be familiar with a recovery procedure for reinputtii^ reports. ’Raining users and maintaining documentation for successful recovery are important responsibilities of the DBA.
2. Managing data base structure. This responsibility centers around the design of the schema and special programs for controlling redundancy.
234 Self-Instructional Material
Designing Databasesmaintaining control of change requests, implementing changes in the schema, and maintaining user documentation. In the case of documentation, the DBA must known what changes have been made, how they were made, and when they were made. Data base changes must be backed by a record of test runs and test results.
3. Managing DBh^. A third responsibility involves the central processing unit (CPU), compiling statistics on system efficiency, including CPU times and elapsed times of inquiries. CPU time is the amount of time the CPU requires to process a request. Elapsed time is the actual clock time needed to process the activities and return a result (output). Much of this time depends on the nature of the activity, other activities that occur in the interim, and ffie peak-load requirements of the system.
Other elements also affect DBMS management. The DBA investigates riser performance complaints and keeps the system’s capabilities in tune with user requirements. Modifications may have to be made to the communication network, the operating system, or their interfaces with the DBMS. It is the DBA’s responsibility to evaluate changes and determine their impact on the data base environment.The DBA has a full-time, highly responsible job. In addition to a managerial backgroimd, the DBA needs technical knowledge to deal with data base designers. For example, he/she needs to maintain the data dictionary and evaluate new data base features and their implementation. The combination of technical an ' managerial backgrounds make the job of the DBA unique.Where does the DBA fit into the organization structure? There is considerable debate about this. Two views are commonly accepted. One proposes that the DBA should not be subordinate to a group that imposes restnctions. The second view is that the DBA should be no more than one level above the prime user that uses the system most frequently. In the long run, the key to the success of the DBA in the organization is the attitude and support of the senior MIS staff and upper management for the DBA function.
NOTES
Self-Instructional Material 235

Syslem Aiui!y$ie and Deeign
STUDENT ACTIVITY 10.3
1. What is a file organization? List the types of file organizations.
2. Write a short note on the role of the Data Base Administrator.
236 Sflf-Imlructional Material
Designing DatabasesSUMMARY
• Primary key is an attribute whose value is unique across all occurrences of a relation.
• Relational database model is data represented as a set of related tables or relations-
• A relation is a named, two-dimensional table of data. Each relation consists of a set of named columns and an arbitrary number of unnamed rows.
• Well-structured relation (or table) is a relation that contains a minimum amount of redundancy and allows users to insert, modify, and delete the rows without errors or inconsistencies.
• Normalization is the process of converting complex data structures into simple, stable data structures.
• Functional dependency is a particular relationship between two attributes.• Second normal form (2NF) A relation for which every nonprimary key
attribute is functionally dependent on the whole primary key.Third normal form (8NF) A relation that is in second normal form and that has no functional (transitive) dependencies between two (or more) nonprimary key attributes.
• Foreign key is an attribute that appears as a nonprimary key attribute in one relation and as a primary key attribute (or part of a primary key) in another relation.
• Referential integrity An integrity constraint specifying that the value (or existence) of an attribute in one relation, depends on the value (or existence) ■of the same attribute in another relation.
■ • Recursive foreign key is a foreign key in a relation that references the primary key values of that same relation.
• Synonyms are two different names that are used for the same attribute.• Homonym is a single attribute name that is used for two or more different
attributes.• A field is the smallest unit of named application data recognized by system
software.• A data type is a coding scheme recognized by system software for representing
organizational data.• Calculated (or computed or derived) field is a field that can be derived
from other database fields.• A default value is a value a field will assume unless an explicit value is
entered for that field.• A null value is a special field value, distinct from a zero, blank, or any
other value, that indicates that the value for the field is missing or otherwise unknown.
• A physical table is a named set of rows and columns that specifies the fields in each row of the table.
• Denormalization is the process of splitting or combining normalized relations into physical tables based on alTinity of use of rows and fields.
• A physical file is a named set of table rows stored in a contiguous section of secondary memory.
• File organization is a technique for physically arranging the records of a file.
NOTES
Self-Instnictionnl Material 237
System Analysis and Design A pointer is a Held of data that can be used to locate a related field or row of data.In a sequential file organization the rows in the file are stored in sequence according to a primary key value.-In an indexed file organization the rows are stored either sequentially or nonsequentially, and an index is created that allows software to locate individual rows.An index is a table used to determine the location of rows in a file that satisfy some condition.Secondary key is one or a combination of fields for which more than one row may have the same combination of values.In a hashed file organization the address for each row is determined using an algorithm.Managing the data base requires a data base administrator (DBA) whose key functions are to manage data activities, the data base structure, and the DBMS.In addition to a managerial background, the DBA needs technical knowledge to deal with data base designers. Important for the success of this impoiiant job is the support of the senior MIS staff and upper management for the overall data base function.
NOTES
TEST YOURSELF
Answer the following questions:1. What is the role of designing databases in the analysis and design phase of an
information system? Explain.2. What are the inputs to and deliverables and outcomes from the normalization
process?3. Why is deciding the type of data important in physical database design?
Explain.4. What are the factors that influence the decision to create an index on a
field?5; What would be the consequences if logical data model were designed without
normalization principles? Explain.6. Discuss the role of the DBA.7. What are the inputs to and deliverables and outcomes form logical database
modeling? What are the steps involved in logical database design?8. What are the properties of a relation? Is the relation different from table?9. What is normalization? What types of functional dependencies may exist in
relations? What types of problems you may encounter if the dependencies are not removed? Describe with an illustration.
10. What is a foreign key? How is it different from a primary key? Explain how referential integrity is maintained in relation.
11. Why do we merge relations in logical database design? While merging relations (view integration), what type of issues do you expect? How can you avoid or solve these problems? Explain-with an illustration.
238 Self-Instructional Material

Designing Databases12. What type of information should be collected durifig the physical file and database design prior to the SDLC phases?
13. What are the inputs to and deliverables and outcomes from physical database design? Explain.
14. What are the factors that should be considered in selecting a file organization?15. State True or False:
(t) It is likely that the human interface and database design steps happen in parallel.
(ii) Database modeling and design activities' occur in all phases of the systems development process.- '
(Hi) A relation is not a named, two-dimensional table of data.(io) The vast majority of information systems today use the relational
database model.(o) We do not need rules and a process for designing well-structured relatione.
(vi) A functional dependency is a particular relationship between two attributes.(uii) Some of the relations may be redundant, we cannot merge those relations
to remove the redundancy.
(viiiy Synonyms are two different names that are used for the same attribute.(ix) Designing physical files and databases does not require certain information
that should have been collected and produced-during prior SDLC phases.(x) Field is not the smallest unit of named application data recognized by
system software.(xt) A physical file is a named set of table rows stored in a contiguous
section of secondary memory.
(xit) An index is a table used to determine the location of rows in a file that satisfy some condition.
16. Fill in the blanks:(t) .The most common style for a logical database model is the ...................
database model.
NOTES
is an attribute whose value is unique across all occurrences(«)of a relation.
(itt) The represents data in the form of related tables, orrelations.
(io) In a relation, each row isis the process of converting complex data structures into
'simple, stable data structures.(vi) A relation is in
functionally dependent on the whole primary key..................... is an attribute that appears as a nonprimary key attributein one relation and as a primary key attnbute (or part of a primary key) in another relation.
............is a coding scheme recognized by system software for representingorganizational data.............. is a value a field will assume unless an explicit value isentered for that field.
(x) The process of splitting or combining normalized relations into physical tables based on affinity of use of rows and fields is known as.....................
(o)
if every nonprimary key attribute is
(vii)
(vUi)■ \
(tx)
Sct/’./natructional Materioi 139
Analysis and Design is a iile organization in which the address for each row is determined using an algorithm.
(ri)
ANSWERSNOTES
Test Yourself15. State True or False:
UY True (tit) False (u) False
(vU) False (w) False ixi) True
16. Fill in the blanks;U) relational
(tit) relational database model (o) Normalization
(oil) Foreign key (ix) Default value (xi) Hashed file organization
(«) True (to) True (vi) True
{viii) True (x)' False
ixii) True
(ii) Primary key •(iu) uniqueIvi) second normal form (2NF)
(viii) Data type (x) denormalization
240 Self-lnslructional Material
SECTION D
11. System Development12. Implementation13. Maintenance and Review

;
/I
/
V
)
System DevelopmentCHAPTER
NOTES
SYSTEM DEVELOPMENT
LEARNING OBJECTIVESIntroduction Systems Development11.2.1 The Processes of Coding, Acquiring Hardware, and Testing11.2.2 Deliverables and Outcomes from Coding. Acquiring Hardware and
TestingWhere Programming Fits in the SDLC 11:3.1 Clarify, the Progratnmlng Needs11.3.2 Design the Program •11.3.3 Code the Program11.3.4 Test the Program11.3.5 Document and Maintain the Program Acx|uiring Hardware11.4.1 Hardware Suppliers11.4.2 A Procedure for Hardware Selection11.4.3 Financial Considerations in Selection11.4.4 The Computer Contract Software Application Testing11.5.1 Seven Different Types of Tests11.5.2 The Testing Process11.5.3 Combining Coding and Testing11.5.4 Acceptance Testing by Users
11.111.2
11-3
11.4
11.5
11.1 INTRODUCTIONOnce the system design phase is over, next system development is begun. The necessary hardware and software are acquired or developed and the system is tested. The fourth-phase of the six-phase SDLC is made up of many activities. These activities are shown in Figure 11.1.This phase is expensive because so many peoples are involved in the process; it is time-consuming because of a lot of work has to be completed. Begardless of the methodology used, once coding and testing are complete the system is ready to “go live”.
Self-Instructional Material 243
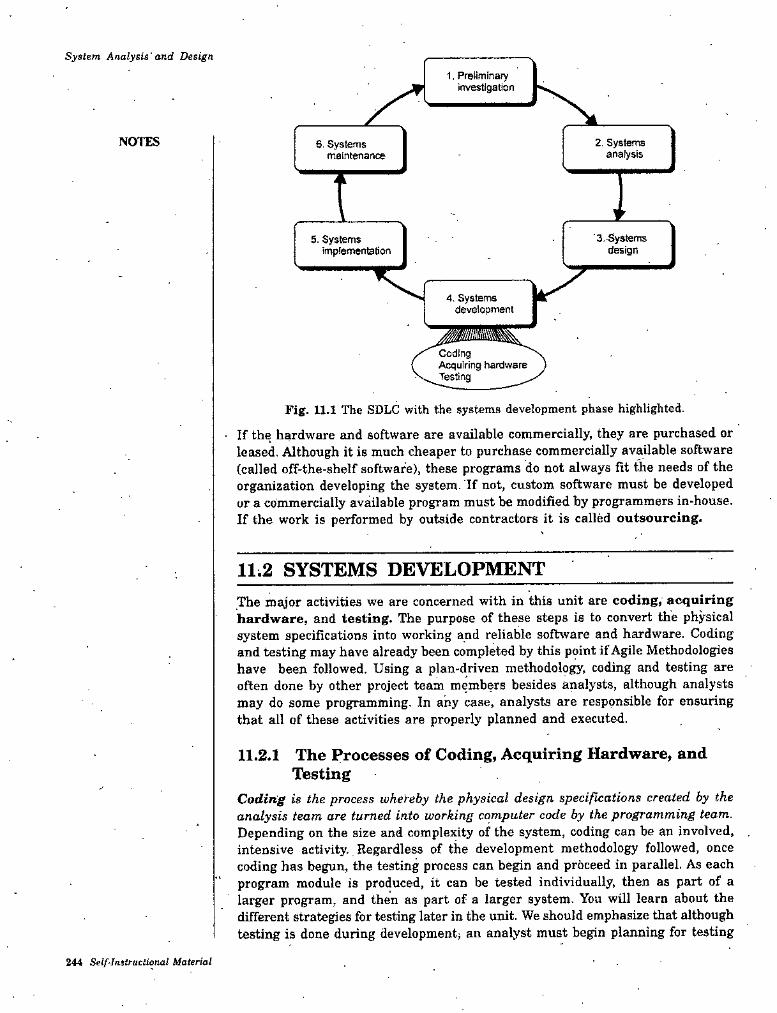
System Analysis ' and Design
1. Preliminary investigation
NOTES 2. Systems analysis
6. Systems maintenance
I'3.Systems
design5. Systems
imptementation
4. Systems development
CodingAcquiring hardware Testing
Fig. 11.1 The SDLC with the systems development phase highlighted.
- If the hardware and software are available commercially, they are purchased or leased. Although it is much cheaper to purchase commercially available software (called off-the-shelf software), these programs do not always fit the needs of the organization developing the system. If not, custom software must be developed or a commercially available program must be modified by programmers in-house. If the work is performed by outside contractors it is called outsourcing.
11;2 SYSTEMS DEVELOPMENTThe major activities we are concerned with in this unit are coding, acquiring hardware, and testing. The purpose of these steps is to convert the physical system specifications into working and reliable software and hardware. Coding and testing may have already been completed by this point if Agile Methodologies have been followed. Using a plan-driven methodology, coding and testing are often done by other project team members besides analysts, although analysts may do some programming. In any case, analysts are responsible for ensuring that all of these activities are properly planned and executed.
11.2.1 The Processes of Coding, Acquiring Hardware, and Testing
Coding is the process whereby the physical design specifications created by the analysis team are turned into working computer code by the programming team. Depending on the size and complexity of the system, coding can be an involved, , intensive activity. Regardless of the development methodology followed, once coding has begun, the testing process can begin and proceed in parallel, As each program module is produced, it can be tested individually, then as part of a larger program, and then as part of a larger system. You will learn about the different strategies for testing later in the unit. We should emphasize that although testing is done during development; an analyst must begin planning for testing
244 Self-Instructional Material
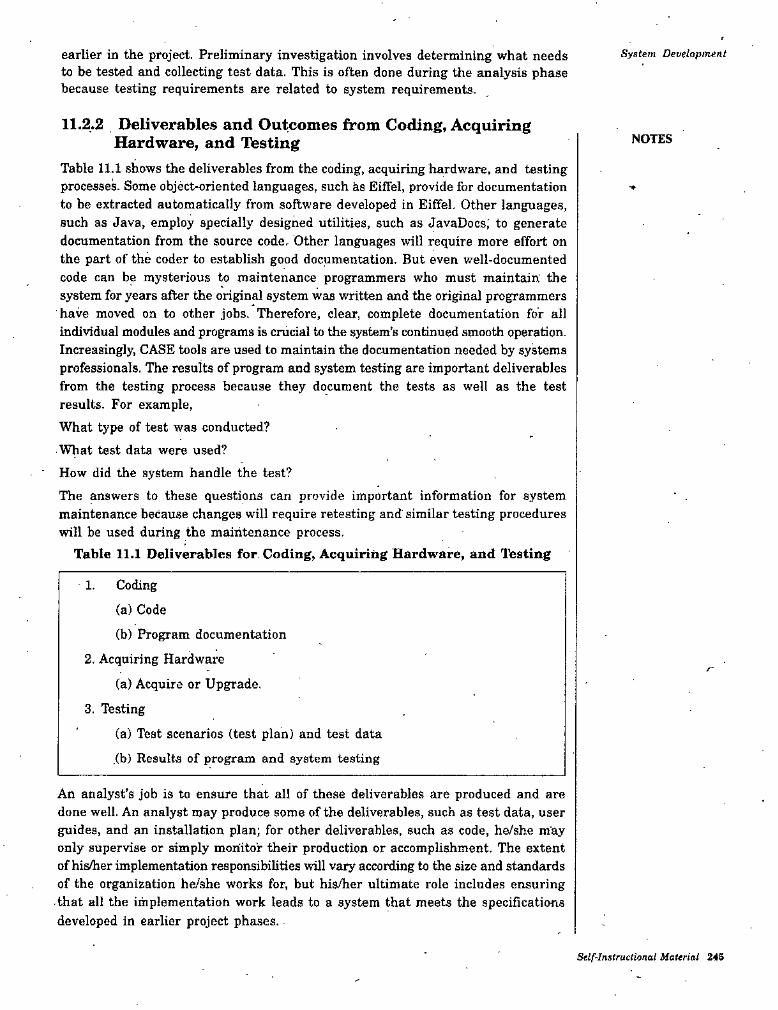
earlier in the project. Preliminary investigation involves determining what needs to be tested and collecting test data. This is often done during the analysis phase because testing requirements are related to system requirements.
System Development
11.2.2 Deliverables and Outcomes from Coding, Acquiring Hardware, and Testing
Table 11.1 shows the deliverables from the coding, acquiring hardware, and testing processed Some object-oriented languages, such as Eiffel, provide for documentation to be extracted automatically from software developed in Eiffel. Other languages, such as Java, employ specially designed utilities, such as JavaDocs; to generate documentation from the source code. Other languages will require more effort on the part of the coder to establish good documentation. But even well-documented code can be mysterious to maintenance programmers who must maintain' the system for years after the original system was written and the original programmers have moved on to other jobs. Therefore, clear, complete documentation for all individual modules and programs is crucial to the system’s continued smooth operation. Increasingly, CASE tools are used to maintain the documentation needed by systems professionals. The results of program and system testing are important deliverables from the testing process because they document the tests as well as the test results. For example.What type of test was conducted?What test data were used?How did the system handle the test?The answers to these questions can provide important information for system maintenance because changes will require retesting and similar testing procedures will be used during the maintenance process.
Table 11.1 Deliverables for Coding, Acquiring Hardware, and Testing
NOTES
1- Coding
(a) Code(b) Program documentation
2. Acquiring Hardware
(a) Acquire or Upgrade.
3. Testing
(a) Test scenarios (test plan) and test data
,(b) Results of program and system testing
An analyst’s job is to ensure that all of these deliverables are produced and are done well. An analyst may produce some of the deliverables, such as test data, user guides, and an installation plan; for other deliverables, such as code, he/she may only supervise or simply monitor their production or accomplishment. The extent of his/her implementation responsibilities will vary according to the size and standards of the organization he/she works for, but his/her ultimate role includes ensuring •that all the implementation work leads to a system that meets the specifications developed in earlier project phases.
Self-Instructional Material 245
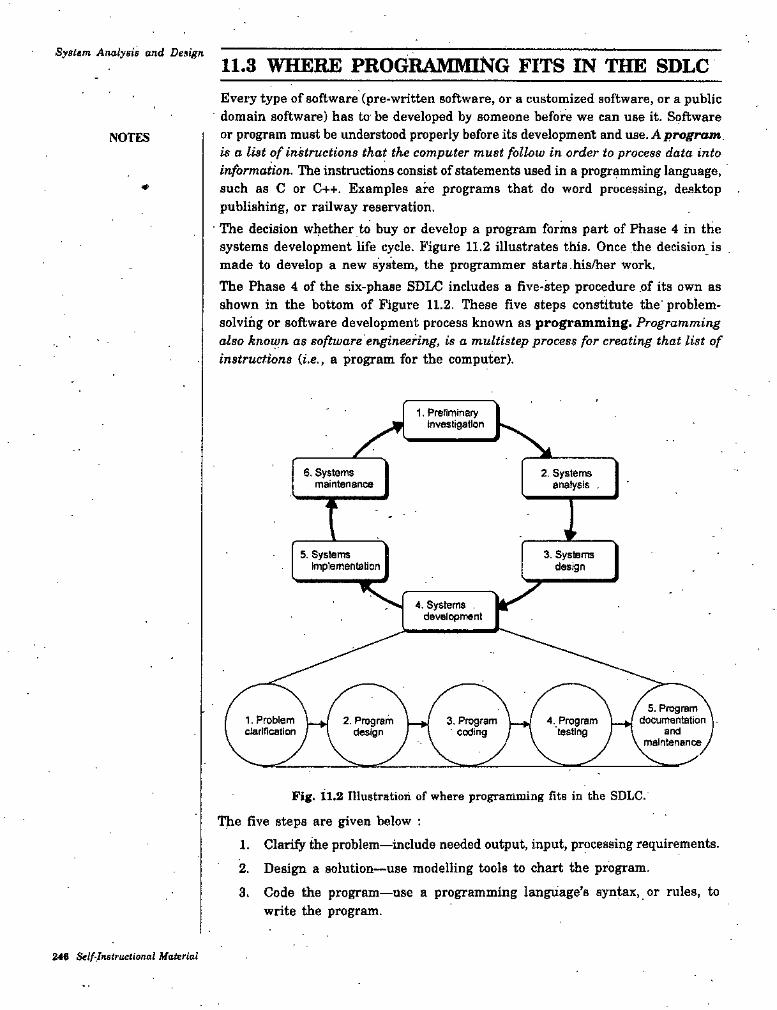
SyBlem Analysis and Design11.3 WHERE PROGRAMMING FITS IN THE SDLCEvery type of software (pre-written software, or a customized software, or a public domain software) has to be developed by someone before we can use it. Software or program must be understood properly before its development and use. A program, is a list of instructions that the computer must follow in order to process data into information. The instructions consist of statements used in a programming language, such as C or C-f+. Examples are programs that do word processing, desktop publishing, or railway reservation.
■ The decision whether to buy or develop a program forms part of Phase 4 in the systems development life cycle. Figure 11.2 illustrates this. Once the decision is made to develop a new system, the programmer starts.his/her work,The Phase 4 of the six-phase SDLC includes a five-step procedure .of its own as shown in the bottom of Figure 11.2. These five steps constitute the' problemsolving or software development process known as programming. Programming also known as software engineering, is a multistep process for creating that list of instructions {i.e., a program for the computer).
NOTES
*
K1. Preliminary Investigation
6. Systems maintenance
2. Systems anatysis .
I5. Systems
implementation3. Systems
des^n
4. Systems . deveiopment
5. Program documentation1. Probiam
clarification3. Program ' coding
4. Program testing
2. Program design and
maintenance
Fig. 11.2 Illustration of where programming fits in the SDLC.
The five steps are given below ;1. Clarify the problem—include needed output, input, processing requirements.2. Design a solution-use modelling tools to chart the program.3. Code the program—use a programming language’s syntax, or rules, to
write the program.
246 Self-Instructional Material
4. Test the program—get rid of any logic errors, or "bugs", in the program (“debug" it).
5. Document and maintain the program—include written instructions for users, explanation of the program, and operating instructions.
Coding—sitting at the keyboard and typing words into a computer—is what many people imagine programming to be. As we see, however, it is only one of the five steps. Coding consists of translating the logic requirements into a programming language—the letters, numbers and symbols that make up the program.
System Development
NOTES
11.3.1 Clarify the Programming NeedsThe problem clarification step consists of six sub-steps—clarifying program ot^ectives and users, outputs, inputs and processing tasks; studying the feasibility of the program; and documenting the analysis. Let us consider these six sub-steps.
(0 Clarify Objectives and Users. We solve problems all the time. A problem might be deciding whether to take a required science course this term or next, or selecting classes that allow us also to fit a job into our schedule. In such cases, we are specifying our objectives. Programming works the same way. We need to write a statement of the objectives we are trying to accomplish—the problem we are trying to solve. If the problem is that our company’s systems analysts have designed a new computer-based payroll processing program and brought it to us as the programmer, we need to clarify the programming needs.We also need to make sure us know who the users of the program will be. Wll they be people inside the company, outside, or both ? What kind of skills will they bring?
(«) Clarify Desired Outputs. Make sure to understand the outputs—what the system designers want to get out of the system—before we specify the inputs. For example, what kind of hardcopy is wanted? What information should the outputs include ? This step may require several meetings with systems designers and users to make sure we are creating what they want.
iiii) Clarify Desired Inputs. Once weicnow the kind of outputs required, we can then think about input. What kind of input data is needed? What form should it appear in? What is its source?
(u) Clarify the Desired Processing. Here we make sure to understand the processing tasks that must occur in order for input data to be processed into output data.
(o) Double-Check the Feasibility of Implementing the Program. Is thekind of program we are supposed to create feasible within the present budget ? Will it require hiring a lot more staff ? Will it take too long to accomplish ?Sometimes programmers decide they can buy an existing program and modify it rather than write it from scratch.
(vi) Dociunent the Analysis. Throughout program clarification, programmers . must document everythii^ they do. This includes writing objective specifications of the entire process being described.
Self-lmlructional MdUrM 247
System Analysis and Design 11.3,2 Design the Program
Assuming the decision is to make, or custom-write, the program, we then move on to design the solution specified by the systems analysts. In the program design step, the software is designed in three mini-steps. First, the program logic is determined through a top-down approach and modularization, using a hierarchy chart. Then it is designed in detail, either in narrative form, using pseudocode, or graphically, using flowcharts.
Today most programmers use a design approach called structured programming. Structured programming takes a top-down approach that breaks programs into modular forms. It also uses standard logic tools called control structures (sequential, selection, case and iteration).
NOTES
11.3.3 Code the ProgramOnce the design has been developed, the actual writing of the program begins. Writing the program is called coding. Coding is what many people think of when they think of programming, although it is only one of the five steps. Coding consists of translating the logic requirements from pseudocode or flowcharts into a programming language—the letters, numbers, and symbols that make up the program.
(i) Select theAppropriate Programming hangaage. Aprogramming language ' is a set of rules that tells the computer what operations to do. Examples of well-known programming languages are C, C++, COBOL, visual Basic and JAVA. These are called “high-level languages”. Not all languages are appropriate for all uses. Some, for example, have strengths in mathematical and statistical processii^. Others are more appropriate for database man^ement. Thus, in choosing the language, we need to consider what purpose the program is designed to serve and what languages are already being used in our organization or in our field.
(it) Follow the Syntax. In order for a program to work, we have to follow the syntax, the rules of the programming language) Programming languages ' have their own grammar just as human languages do. But computers are probably a lot less forgiving if we use these rules incorrectly.
11.3.4 Test the ProgramProgram testing involves running various tests and then running real-world data to make sure the program works. Two principal activities are desk-checking and debugging. These steps are known as alpha-testing.
(i) Perform Desk-Checking. Desk-checking is simply reading through, or checking, the program to make sure that it's free of errors and that the logic works. In other words, desk-checking is like proofreading. This step could be taken before the program is actually run. on a computer.
(it) Debug the Program. Once the program has been desk-checked, further errors, or "bugs”, will doubtless surface, lb debug means to detect, locate, and remove all errors in a computer program. Mistakes may be syntax errors or logical errors. Syntax errors are caused by typographical errors and incorrect use of the programming language. Logic errors are caused by
>
248 Self-Instructional Material
System Developmentincorrect use of control structures. Programs called diagnostics exist to check program syntax and display syntax-error mess^es. Diagnostic programs thus help identify and solve problems.
(iii) Run Real-World Data. After desk-checking and debugging, -the program may run fine—in the laboratory. However, it needs to be tested with real data; this is called beta testing. Indeed, it is even advisable to test the program with bad data—data that is faulty, incomplete, or in overwhelming quantities—to see if you can make the system crash. Many users, aft#r all, may be far more heavy-handed, ignorant and careless than programmers have anticipated.
Several trials using different test data maybe required before the programming team is satisfied that the program can be released. Even then, some bugs may persist, because there comes a point where the pursuit of errors is uneconomical; This is one reason why many users are nervous about using the first version (version 1.0) of a commercial software package.
NOTES
11.3.5 Document and Maintain the ProgramWriting the program documentation is the fifth step in programming. The resulting documentation consists of written descriptions of what a program is and how to use it. Documentation is not just an end-stage process of programming. It has been (or should have been) going on throughout all programming steps. Do. .imentation is needed for people who will be using or be involved with the program in the future.
Documentation should be prepared for' several different kinds of readers—users, operators and programmers.
(i) Prepare User Documentation. When we buy a commercial software package, such as a spreadsheet, we normally get a manual with it.,This is user documentation.
(ii) Prepare Operator Documentation. The people who run large computers are called computer operators. Because they are hot always programmers,, they need to be told what to do when the program malftinctions. The operator documentation gives them this information.
(Hi) Write Programmer Documentation. Long after the original programming team has disbanded, the program may still be in use. If, as is often the case, a fourth of the programming staff leaves every year, after 4 years there could be a whole new bunch of programmers who know nothing about the software. Program documentation helps train these newcomers and enables'them to maintain the existing system.
(iv) Maintain the Program. Maintenance includes any activity designed to keep programs in working condition, error-free, and up to date—adjustments, replacements, repairs, measurements, tests and so on. The rapid changes in modem organizations—in products, marketing strategies, accounting systems, and so on—are bound to be reflected in their computer systems. Thus, maintenance is an important matter, and documentation must be available to help programmers, make adjustments an existing systems.
Self-Instructional Material 249
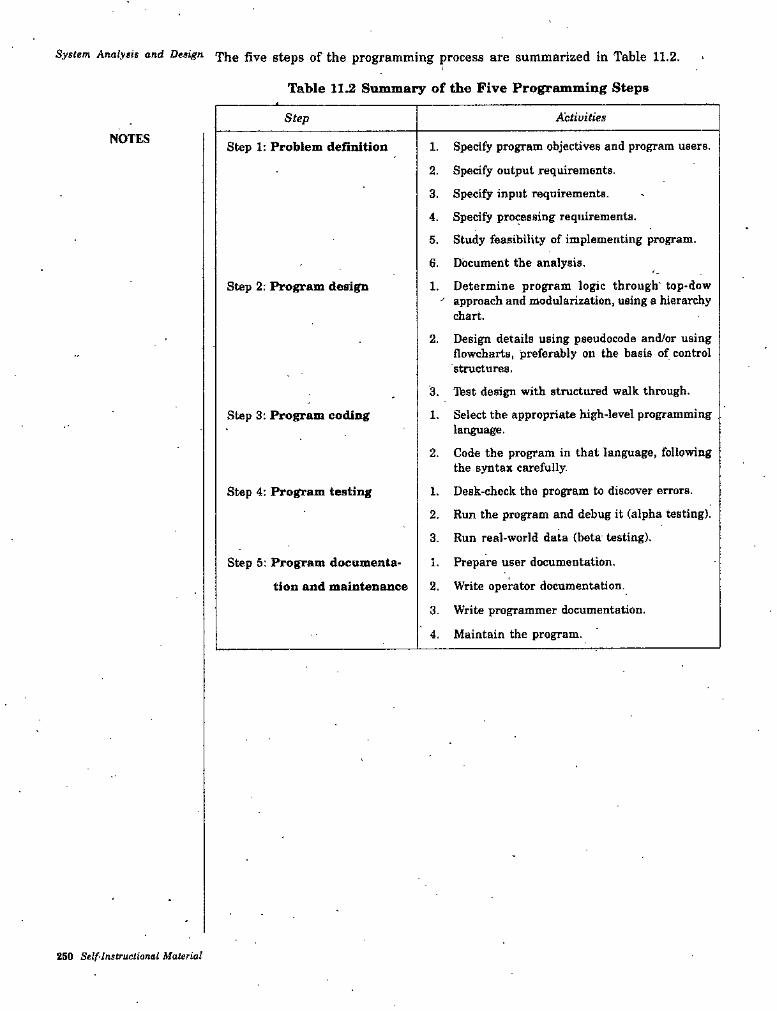
System Analysis and Design ipjjg steps of the programming process are summarized in Table 11.2.
Table 11^ Summary of the Five Programming Steps
ActivitiesStepNOTES 1. Specify program objectives and program users.
2. Specify output requirements.
3. Specify input requirements.
4. Specify processing requirements.5. Study feasibility of implementing program.
6. Document the analysis.
1. Determine program logic through' top*dow approach and modularization, using a hierarchy chart.
2. Design details using pseudocode and/or using flowcharts, preferably on the basis of control structures,
3. Ibst design with structured walk through.
1. Select the appropriate high-level programming language.
2- Code the program in that language, following the syntax carefully.
1. Desk-check the program to discover errors.
2. Run the program and debug it (alpha testing).
3. Run real-world data (beta testing).
1. Prepare user documentation.
2. Write operator documentation.
3. Write programmer documentation.
4. Maintain the program.
Step 1: Problem definition
Step 2; Program design
Step 3: Program coding
Step 4: Program testing
Step 5: Program documenta
tion and maintenance
250 Self'Instructional Material

System Development
STUDENT ACTIVITY 11.1
1. What are the inputs to the various processes of system development phase and what are their deliverables? What is the main purpose of this phase?
2. What is programming and what are the live steps in accomplishing it?
Seif-Instructional Material 251
System Analysis and Design11.4 ACQUIRING HARDWARE
- A major element in developing systems is selecting compatible hardware and software. The systems analyst has to determine what software package is best for the candidate system and where software is not an issue, the kind of hardware and peripherals required for the final conversion. To accomplish the job, the analyst must be familiar with the computer industry in general, what different types of computers can and cannot do, whether to purchase or lease a system, the vendors and their outlets, and the selection procedure.Haedware/Software selection starts with requirements analysis, followed by a request for proposal and vendor evaluation. The final system selection initiates contract negotiations. It includes purchase price, maintenance agreements, and the amount of updating or enhancements to be available by the vendor over the life of the system. Contract negotiations should be designed to get the best deal for the user and protect the user’s interest in the acquired system.
NOTES
11.4.1 Hardware SuppliersA large number of vendors, throughout the world, provide a wide range of computer products and services. The hardware suppliers group includes mainframe manufacturers, peripheral vendors, supplies vendors, computer leasing firms, and used systems dealers. IBM is one of the major supplier of mainframe computers. In microcomputers t.e., PCS, IBM and Apple top the list.Peripheral manufacturers supply tape drives, disk and diskette drives, printers, and other components. Vendors of supplies provide consumable supplies such as diskettes, and printer forms and nonconsumable supplies such as disk packs, tape reels, tape library shelves, and fireproof vaults. Hundreds of independent vendors are in this field. Used computer dealers buy second-hand equipment from computer users, rebuild them, and sell them at attractive prices. Computer leasing • firms generally finance hardware and software acquisition. Leasing companies may also under write or insure the development of a computer system.
11.4.2 A Procedure for Hardware SelectionSelecting a system is o serious and time-consuming business. Unfortunately, many systems are still selected based on vendor reputation only or other subjective factors. The time spent on the selection process is a function of the applications and whether the system is a basic microcomputer or a mainframe. In either case, planning system selection and acquiring experienced help where necessary pay off in the long run.The factors tb consider before the system selection are given below;
1. Define system capabilities that make sense for business. Computers have proven valuable to business in the following areas;(а) Cost reduction includes reduction of inventory, savings on space, and
improved ability to predict business trends.(б) Cost avoidance includes early detection of problems and ability to
expand operations without adding clerical help.(c) Improved service emphasizes quick availability of information to customers,
improved accuracy, and fast turnaround- id) Improved profit reflects the “bottom line" of the business and its
ability to keep receivables within reason.
262 Self-Instructional Material

2. Specify the magnitude of the problem; i.e., clarify whether selection entails a few peripherals or a major decision concerning the mainframe.Assess the competence of the in-house staff. This involves determining the expertise required in areas such as telecommunications and database design. Acquiring a computer often results in securing temporary help for conversion. Planning for this step is extremely important.
4. Consider hardware and software as a package. This approach ensures compatibility. In fact, software should be considered first, because often the use secures the hardware and then wonders what software is available for it. Retnember that software solves problems and hardware drives the software to facilitate solutions.
5. Develop a schedule (a time frame) for the selection process. Maintaining a schedule helps keep the project under control.
6. Provide user indoctrination (with a particular set of beliefs). This is crucial,. especially for first-time users. Selling the system to the user staff, providing
proper training, and preparing an environment conducive to implementation are pre-requisites for system acquisition for an organization.
M ijor Phases in Hardware Selection
The hardware nelection process should be viewed a& a project, and a project team should be organized with management support. In larger projects the team includes one or more user representatives, an analyst, and EDP auditor, and a consultant. Several steps make up the selection process; some overlap due to the dynamic nature of selection process. These are given below:
1. Requirements analysis.2. System specifications.3. Request for proposal (RFP).4. Evaluation and validation.5. Vendor selection.6. Post-installation review.
System Develnpment
3,
NOTES
Requirements AnalysisThe first step in hardware selection is understanding the 'user’s requirements within the framework of the organization’s objectives and the'environment in which the system is being installed. Consideration is given to the user’s resources as well as to finances available.
Note: In selecting software, the user must decide whether to develop it in- •house, hire a service company or a contract programmer to create it, or simply acquire it from a software house. The choice is logically made after the user has clearly defined the requirements expected of the software. Therefore, requirements analysts sets the tone for software selection.
System SpecificationsFailure to specify system requirements before the final selection almost always results in a faulty acquisition. The specifications should delineate {i.e., show by drawing or describing) the user’s requirements and allow room for bids from ‘ various vendors. They must reflect the actual applications to be handled by the system and include system objectives, flowcharts, input-output requirements, file structure, and cost. The specifications must also describe each aspect of the system clearly, consistently, and completely.
Self-Instructional Material 26S
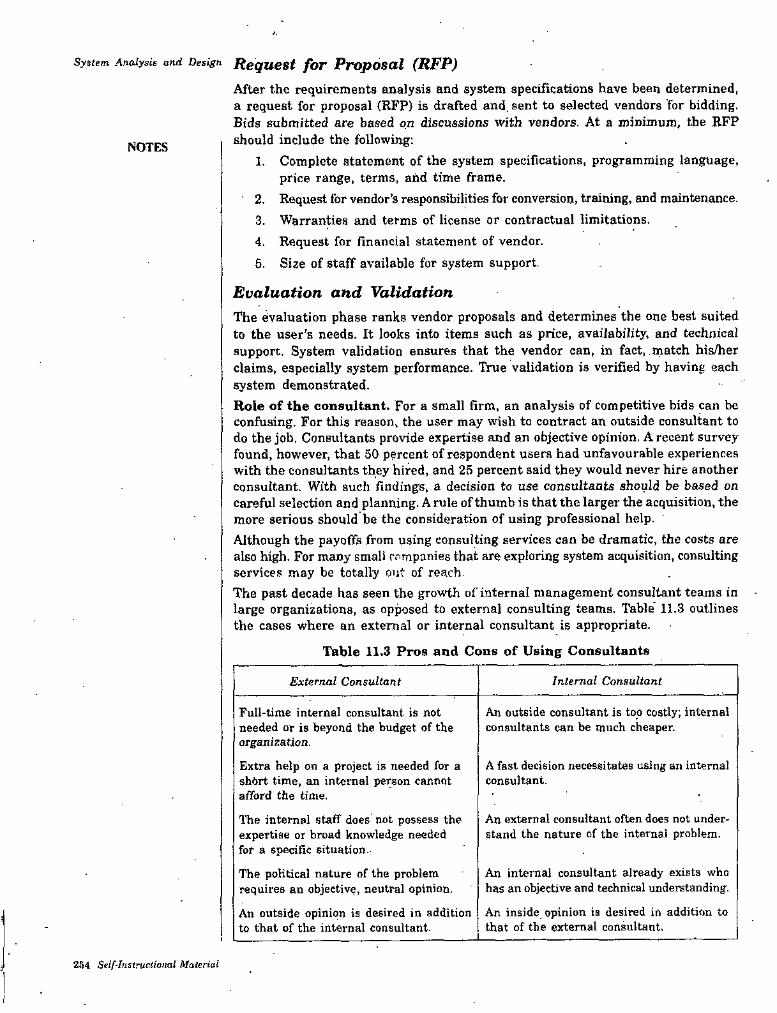
System Analysis and Design RegueSt for PropOSUl (RFP)
After the requirements analysis and system specifications have been determined, a request for proposal (RFP) is drafted and. sent to selected vendors for bidding. Bids submitted are based on discussions with vendors. At a minimum, the RFP should include the following:
1. Complete statement of the system specifications, programming language, price range, terms, and time frame.
2. Request for vendor’s responsibilities for conversion, training, and maintenance.3. Warranties and terms of license or contractual limitations.4. Request for financial statement of vendor.5. Size of staff available for system support.
Evaluation and ValidationThe evaluation phase ranks vendor proposals and determines the one best suited to the user's needs. It looks into items such as price, availability, and technical support. System validation ensures that the vendor can, in fact, .match his/her claims, especially system performance. True validation is verified by having each system demonstrated.Role of the consultant. For a small firm, an analysis of competitive bids can be confusing. For this reason, the user may wish to contract an outside consultant to do the job. Consultants provide expertise and an objective opinion, A recent survey found, however, that 50 percent of respondent users had unfavourable experiences with the consultants they hired, and 25 percent said they would never hire another consultant. With such findings, a decision to use consultants should be based on careful selection and planning. A rule of thumb is that the larger the acquisition, the more serious should be the consideration of using professional help.Although the payoffs from using consulting services can be dramatic, the costs are also high. For many smali pompanies that are exploring system acquisition, consulting services may be totally nut of reach.The past decade has seen the growth of internal management consultant teams in large organizations, as opposed to external consulting teams. Table 11.3 outlines the cases where an external or internal consultant is appropriate.
Table 11.3 Pros and Cons of Using Consultants
NOTES
Internal ConsultantExternal Consultant
Full-time internal consultant is not needed or is beyond the budget of the organization.
Extra help on a project is needed for a short time, an internal person cannot afford the time.
The internal staff does not possess the expertise or broad knowledge needed for a specific situation.
The political nature of the problem requires an objective, neutral opinion.
An outside opinion is desired in addition to that of the internal consultant.
An outside consultant is too costly; internal consultants can be much cheaper.
A fast decision necessitates using an internal consultant.
An external consultant often does not understand the nature of the internal problem.
An internal consultant already exists who has an objective and technical understanding.
An inside opinion is desired in addition to that of the external consultant.
254 Self-Instructional Material
Vendor Selection
This step determines the "winner”—^.the vendor with the best combination of reputation, reliability, service record, training, delivery time, lease/finance terms, and conversion schedule. Initially, a decision is made on which vendor to contact. The sources available to check on vendors include the following;
1. Users.2. Software houses.3. Trade associations.4. Universities.5. Publications/journals.6. Vendor software lists.7. Vendor referral directories.8. Published directories.9. Consultants.
10. Industry contacts.Fo- comprehensive applications, the user routinely submits an RFP that specifies the performance requirements and information needed to make an evaluation. Copies of the vendor’s annual financial statement are also requested. Once received, each vendor’s report is matched against the selection criteria. Those that come the closest are invited to give a presentation of their system. The system chosen goes through contract negotiations before implementation. This area is covered later in the unit..
System Development
NOTES
Post-Installation Review
Sometime after the package is installed, a system evaluation is made to determine how closely the new system conforms to plan. System specifications and user requirements are audited to pinpoint and correct any differences.
Performance EvaluationEvaluating a system includes the hardware and software as a unit. Hardware selection requires an analysis of several performance categories:
1. System availability. When will the system be available?2. Compatibility. How compatible is the system with existing programs?3. Cost. What is the lease or purchase price of the system? What about
maintenance and operation costs?4. Performance. What are the capacity and throughput of the system?
' 5. Uptime. WTiat is the “uptime” record of the system? What maintenance schedule is required?
6. Support. How competent and available are the vendor’s staff to support the system?
7. Usability. How easy is it to program, modify, and operate the system? For the software evaluation,-the following factors are considered:
1. The programming language and its suitability to the applicationfs).2. Ease of installation and training.3. Extent of enhancements to be made prior to installation.
Self-Instructional Material 265
System Analysis and Design In addition to hardware/software evaluation, the quality of the vendor’s services■ should be examined. Vendor support services include the following:
1. Backup. Emergency computer backup available from vendor.2. Conversion. Programming and installation service provided during conversion.3. Maintenance. Adequacy and cost of hardware maintenance.4. • System development. Availability of competent analysts and programmers
for system development'.
NOTES
11.4.3 Financial Considerations in SelectionWhen the decision to go ahead with the acquisition has been made, the next question is whether to purchase or lease. There are three methods of acquisition:
1. rental directly from the manufacturer,2. leasing through a third party or from the vendor, and3. outright purchase.
The Rental Option
Rent is a form of lease directly by the manufacturer. The user agrees to a monthly payment, usually for one year or less. The contract can be terminated without penalty by a 90 day advance notice. Rental charges are based on 176 usage hours (8 hours per day x 22 working days) per month. Additional usage means higher . total charges per month. Computer users favor renting'a system for three reasons:
1. Insurance, maintenance, and other expenses are included in the rentalcharge. , '
2. There is financial leverage for the user. With no investment in equipment, user capital is freed for other projects. Futhermore, rental charges are tax deductible.
3, Rental makes it easier to change to other systems, thereby reducing the risk of technological obsolescence.
The primary, drawback of a rental contract is its high cost because of the uncertainty of rental revenues to the vendor.
The Lease Option
A leased system is acquired through a third party or from the vendor. A third-party purchase ranges from six months with month-to-month renewals to seven years. Longer-running leases have more favourable terms but entail a higher risk as the user is “strapped” with the system. With a short-term lease, the user’s risk is low, but lease charges are high.From the user’s view, leasing has several advantages as given, below ;
1. No financing is required. The risk of system obsolescence is shifted to the lessor (vendor).
•2. Lease charges are lower than rental charges for the same period and are ' also tax deductible.
•3. Leases may be written to show higher payments in early years to reflect the decline in value of the system.
4, Leases may or may not include, maintenance or installation costa or.providing a replacement system in an emergency.
256 Self Instructional Material
The drawbacks of leasing are given below;Unless there is a purchase option, the lessee (user) loses residual rights to the system when the lease expires.
2. The lease period cannot be terminated without a heavy penalty.3. In the absence of an upgrade clause, the user may not be able to exchange
the leased system for another system. Also, if interest rates decrease, the user is committed to lease payments at the higher rate.
4. Unlike a purchase system, a leased system does not provide tax benefits from accelerated depreciation and interest deductions in the early years of use. There are no cash savings in a lease arrangement.
The Purchase Option
Purchasing a computer has benefits and'drawbacks. Purchasing means assuming all the risks of ownership including taxes, insurance, and technological obsolescence. However, the owner obtains all the services and support that are available under the lease or rental agreement. Compared with renting or leasing, the key advantages of purchasing are :
1. The flexibility of modifying the system at will.2. Lower continuing cash outlays than those for a leased system due to cash,
savings from depreciation and investment tax credit. If the equipment is held for five years or more, a credit of 10 percent of the purchase price is deducted from the organization’s income tax. '
3. A lower total cash outflow if the user keeps the system longer than five years.
• The major drawbacks are:1.. Initial high cost in relation to leasing.2. , Insurance expense and various taxes, which are carried by the user. The
maintenance agreement is also paid for by the user when the warranty expires.
. 3. High overall risk. A poorly selected system means adapting to a “problem ' child.” Selling a used computer with flaws could be a real problem.
Each acquisition method has characteristics that are both common and unique. A choice based on these facts meets the qualitative test only. Quantitatively, an effective method is the net present value (NPV) approach. It allows users to evaluate alternatives while recognizing that a rupee received today is worth more than tomorrow’s rupee.
The Used Computer
Under what circumstances should one consider a used computer? Computers last between five and eight.years. Most organizations outgrow their computers long before they become obsolete, however. This means that users are forced to unload equipment at a loss in order to acquire new systems. Savings of 15 to 70 percent can be realized by buying used systems, depending on the model and condition of the system.Availability is a major advantage to buying used computers. The demand for some systems is so high that promised six-week deliveries can stretch up to six months. For certain highly sought microcomputers, delivery may take as long as four months. Used computer dealers have been known to deliver the same day.
System Development
1.
NOTES
Self-Instructional Material 2B7
Sysiem Analysis and Design Sales in the used computer market are increasing every year. Independent vendorshave been successful'in training operators and programmers to use the equipment. They generally rebuild used systems after they have been acquired from the second user.For stand-alone systems, used computers are ideal for users with in-house expertise who are located in an area where technical support is adequate, or who are assured of vendor support. Although the biggest drawback to used computers.is maintenance, this is readily available from the vendor or independent service firms.Used computers are acquired through dealers or end users. Most dealers are knowledgeable about the system they sell. The best bargain, however, is buying directly from the end user, provided there is a log that verifies the maintenance record of the system. Checking the maintenance log will reveal how reliable the system has been. The buyer must be sure that the seller has clear title to the system. A qualified consultant can help.In conclusion, there are savings from acquiring used systems, and more and more organizations are going that route. Furthermore, it is an excellent way to extend the useful life of the computer.
NOTES
11.4.4 The Computer ContractAfter a decision has been made about the equipment or software, the final step in system acquisition is to negotiate a contract. Unfortunately, the typical user does not negotiate. The assumption is that a contract drafted by a reputable firm is a standard instrument and is not subject to change. Tb the contrary, every contract is negotiable to some extent. Large users often spend weeks negotiating amenities and terms, using legal counsel or consultants.The primary law governing contracts is the law of contracts, although contracts can be influenced by other laws, such as the Uniform Commercial Code (UCC). Under the law of contracts, the formation of a contract requires mutual assent - (meeting of the minds) and consideration. Performance of a contract is the fulfilling of the duties created by it.
The AH of NegotiationMany users enter into contract negotiations at the mercy of the vendor, with little preparation. Negotiating is an art. Timing is critical. Strategies must be planned and rehearsed. The leverage eryoyed by either party can change during the course of the negotiations. Figure 11.3 illustrates the negotiation procedure. Part A represents the poorly prepared user, outmaneuvered completely throughout the negotiations. Part B shows a relatively informed user, but one who has a sense of urgency. The user’s negotiating leverage drops to nearly zero as he/she enters the contract- negotiating phase. At this point, the vendor recognizes the user’s state of mind and becomes less willing to negotiate in earnest. In part C, the user is following good negotiating procedures and retains fair leverage into the negotiations.
Strategies and TacticsVarious strategies and tactics are used to control the negotiation process. A key strategy is to control the environment. The user’s “home field advantage” allows the user’s representative to concentrate on the negotiation process in a familiar setting. Other strategies are the following:
1. Use the "good guy" and "bad guy" approach. The consultant is often perceived
258 Self-lnsirueitonal Material

System Development .as the bad guy, the user as the good guy. The consultant is the “shrewd” negotiator, whereas the user is the compromiser.
2. Be prepared with alternatives at all times. It is a give-and-take approach.3. Use trade-offs. Rank less important objectives high early in the negotiations:4. Be prepared to drop some issues. Certain issues may be better discussed in
later sessions.NOTES
100%
Lessor (vendor)
A. Deficient
Lessee (user)
Bid Award Conclusion
100%
Lessor
6. Fair
Lessee
ConclusionAwardBid '
100%
C. Good
Award ConclusionBid
Fig. 11.3 Negotiation procedures.
Contract ChecklistA contract should spell out the following ;
1. Vendor responsibilities and remedies in the event of nonperformance; with hardware, the results to be achieved with the system.
2. Remedies for failure to meet the delivery schedule and failure of the system to pass the user acceptance test.
3. Implied warranties,regarding system performance.4. Guarantee of reliability in terras of uptime, mean time between failures,
and response time to repairs.
11.5 SOFTWARE APPLICATION TESTINGAs mentioned earlier, in traditional plan-driven systems development projects, analysts prepare system specifications that are passed on to programmers for coding. Although coding takes considerable effort and skill, the practices and processes
Self-Instructional Material 2SB
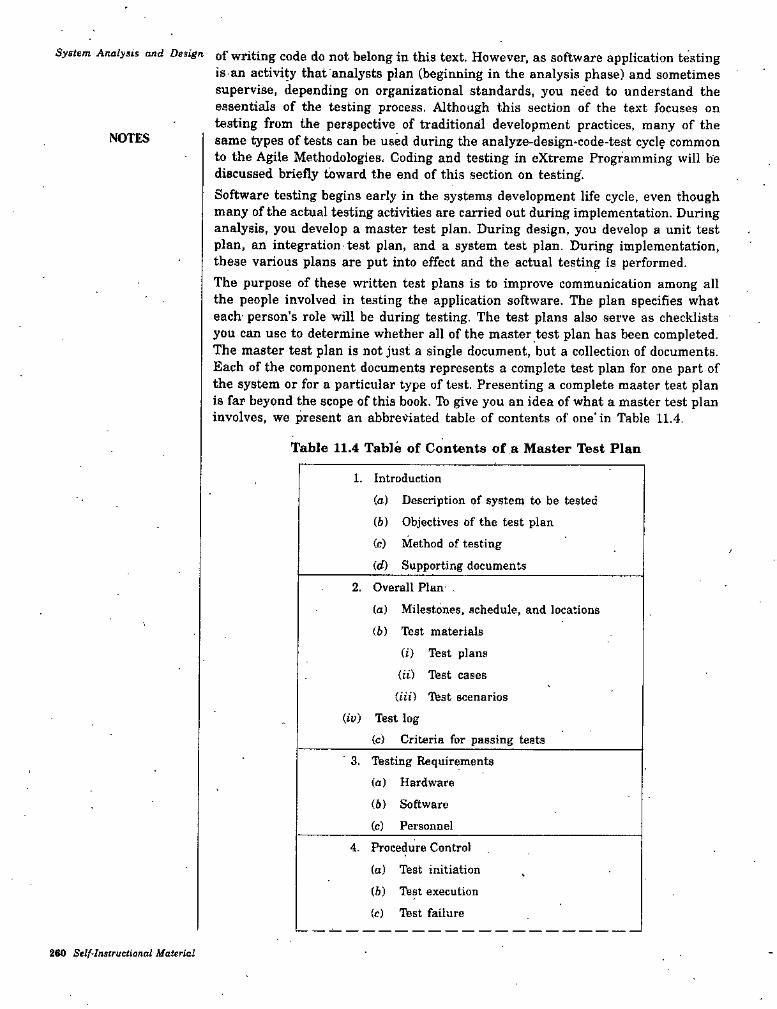
System Analysis and Design of writing code do not belong in this text. However, as software application testingis an activity that analysts plan (beginning in the analysis phase) and sometimes supervise, depending on organizational standards, you need to understand the essentials of the testing process, Although this section of the text focuses on testing from the perspective of traditional development practices, many of the same types of tests can be used during the analyze-design-code-test cycle common to the Agile Methodologies. Coding and testing in eXtreme Programming will be discussed briefly toward the end of this section on testing.Software testing begins early in the systems development life cycle, even though many of the actual testing activities are carried out during implementation. During analysis, you develop a master test plan. During design, you develop a unit test plan, an integration test plan, and a system test plan. During implementation, these various plans are put into effect and the actual testing is performed.The purpose of these written test plans is to improve communication among all the people involved in testing the application software. The plan specifies what each- person’s role will be during testing. The test plans also serve as checklists you can use to determine whether all of the master test plan has been completed. The master test plan is not just a single document, but a collection of documents. Each of the component documents represents a complete test plan for one part of the system or for a particular type of test. Presenting a complete master teat plan is far beyond the scope of this book. To give you an idea of what a master test plan involves, we present an abbreviated table of contents of one'in Table 11.4.
NOTES
Table 11.4 Table of Contents of a Master Test Plan
1. Introduction(а) Description of system to be tested(б) Objectives of the test plan(c) Method of testing(d) Supporting documents
2. Overall Plan(а) Milestones, schedule, and locations(б) Test materials
(i) Test plans (ti) Test cases (til) Ibst scenarios
(ii>) Test log(c) Criteria for passing tests
3. Testing Requirements (a) Hardware(6) Software(c) Personnel
4. Procedure Control(а) Test initiation(б) Tbst execution (c) Ifest failure
260 Self-Instructional Material
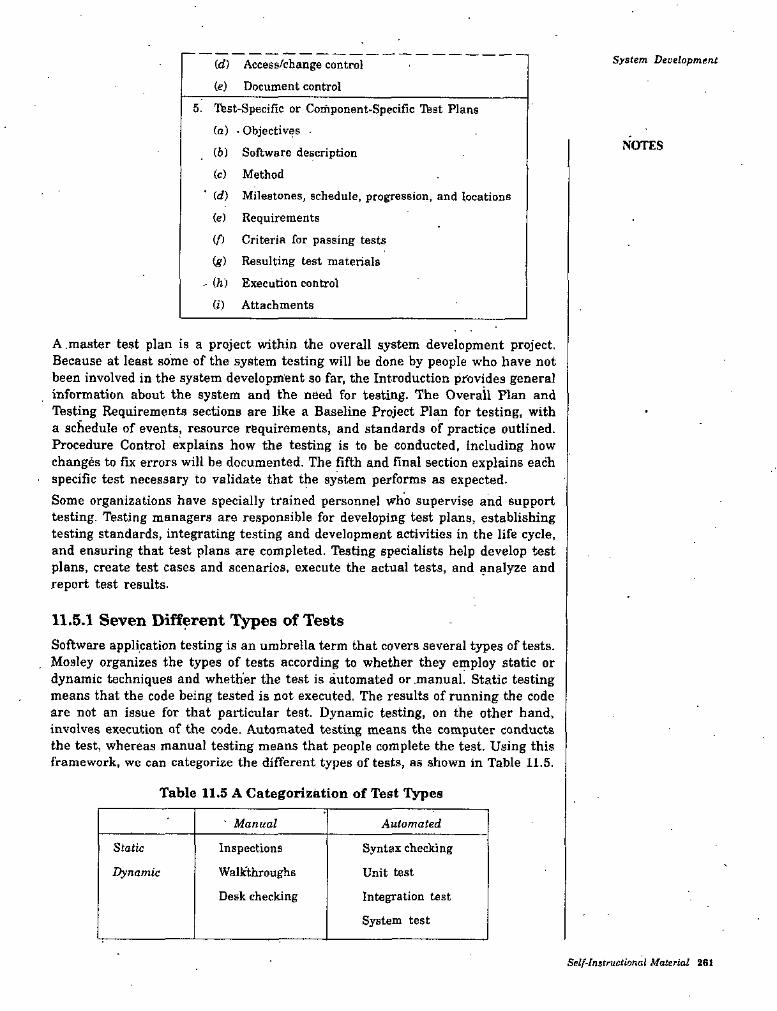
System Development(d) Access/change control(e) Document control
5. 'ftst-Specific or Component-Specific Tfest Plans(а) -Objectives •(б) Software description(c) Method(d) Milestones, schedule, progression, and locations(e) Requirements(/) Criteria for passing tests (g) Resulting test materials
- (h) Execution control (i) Attachments
NOTES
A.master test plan is a project within the overall system development project. Because at least some of the system testing will be done by people who have not been involved in the system development so far, the Introduction provides general information about the system and the need for testing. The Overall Plan and Testing Requirements sections are like a Baseline Project Plan for testing, with a schedule of events, resource requirements, and standards of practice outlined. Procedure Control explains how the testing is to be conducted, including how changes to fix errors will be documented. The fifth and final section explains each specific test necessary to validate that the system performs as expected-Some organizations have specially trained personnel who supervise and support testing. Thstlng managers are responsible for developing test plana, establishing testing standards, integrating testing and development activities in the life cycle, and ensuring that test plans are completed. Testing specialists help develop test plans, create test cases and scenarios, execute the actual tests, and analyze and report test results.
11.5.1 Seven Different Types of TestsSoftware application testing is an umbrella term that covers several types of tests. Mosley organizes the types of tests according to whether they employ static or dynamic techniques and whether the test is automated or manual. Static testing means that the code being tested is not executed. The results of running the code are not an issue for that particular test. Dynamic testing, on the other hand, involves execution of the code. Automated testing means the computer conducts the test, whereas manual testing means that people complete the test. Using this framework, we can categorize the different types of tests, as shown in Table 11.5.
Table 11.5 A Categorization of Test Types
' Manual Automated
Static Inspections Syntax checking
Unit test
Integration test
System test
WalkthroughsDynamic
Desk checking
Self-Instructional Material 261
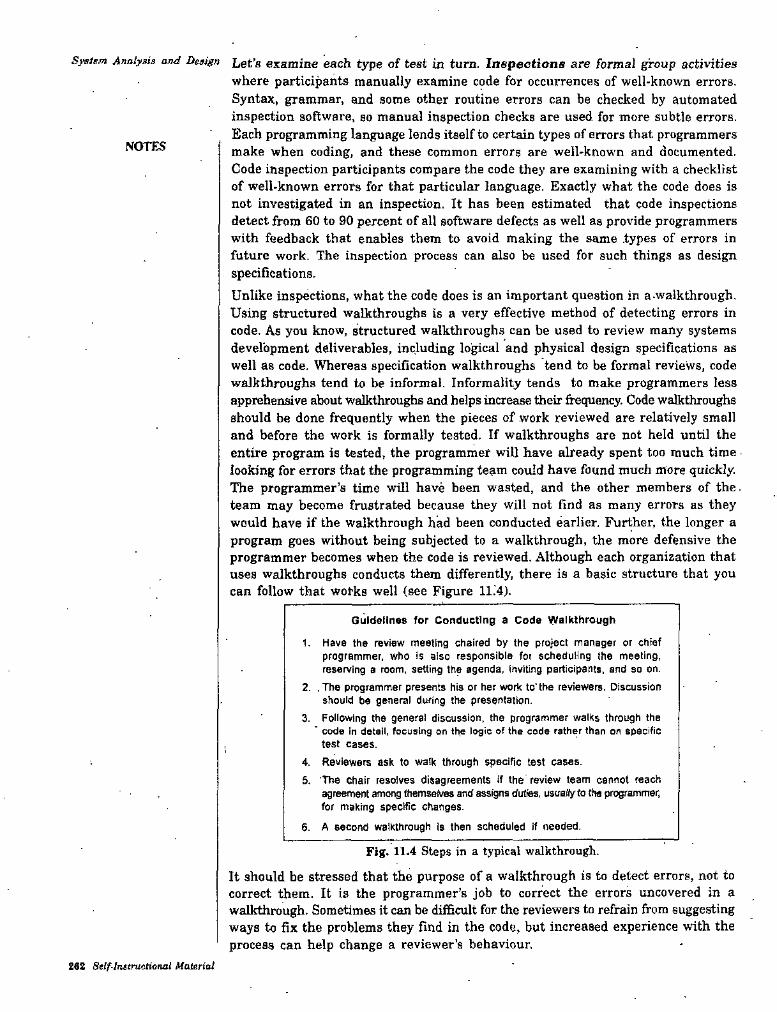
System Analysis and Design Let’s examine each type of test in turn. Inspections are formal group activitieswhere participants manually examine code for occurrences of well-known errors. Syntax, grammar, and some other routine errors can be checked by automated inspection software, so manual inspection checks are used for more subtle errors. Each programming language lends itself to certain types of errors that programmers make when coding, and these common errors are well-known and documented. Code inspection participants compare the code they are examining with a checklist of well-known errors for that particular language. Exactly what the code does is not investigated in an inspection. It has been estimated that code inspections detect from 60 to 90 percent of all software defects as well as provide programmers with feedback that enables them to avoid making the same types of errors in future work. The inspection process can also be used for such things as design specifications.Unlike inspections, what the code does is an important question in a.walkthrough. Using structured walkthroughs is a very effective method of detecting errors in code. As you know, structured walkthroughs can be used to review many systems development deliverables, including logical and physical design specifications as well as code. Whereas specification walkthroughs tend to be formal reviews, code walkthroughs tend to be informal. Informality tends to make programmers less apprehensive about walkthroughs and helps increase their frequency. Code walkthroughs should be done frequently when the pieces of work reviewed are relatively small and before the work is formally tested. If walkthroughs are not held until the entire program is tested, the programmer will have already spent too much time looking for errors that the programming team could have found much more quickly. The programmer’s time will have been wasted, and the other members of the. team may become frustrated because they will not find as many errors as they would have if the walkthrough had been conducted earlier. Further, the longer a program goes without being subjected to a walkthrough, the more defensive the programmer becomes when the code is reviewed. Although each organization that uses walkthroughs conducts them differently, there is a basic structure that you can follow that works well (see Figure 11.4).
NOTES
Guidelines for Conducting a Code Walkthrough
1. Have the review meeting chaired by the project manager or chief programmer, who is also responsible for scheduling the meeting, reserving a room, setting the agenda, inviting participants, and so on.
2. , The programmer presents his or her work to' the reviewers. Discussionshould be general during the presentation.
3. Following the general discussion, the programmer walks through the ' code in detail, focusing on the logic of the code rather than on specific
test cases.4. Reviewers ask to walk through specific test cases.5. ’The chair resolves disagreements if the review team cannot reach
agreernent among themselves and assigns dut^. usuaHyto the programmer, for making specific changes.
6. A second walkthrough Is then scheduled if needed.
Fig. 11.4 Steps in a typical walkthrough.
It should be stressed that the purpose of a walkthrough is to detect errors, not to correct them. It is the programmer’s job to correct the errors uncovered in a walkthrough. Sometimes it can be difficult for the reviewers to refrain from suggesting ways to fix the problems they find in the code, but increased experience with the process can help change a reviewer's behaviour.
262 Self-hltnictUinal Material
What the code does is important in desk checking, an informal process in which the programmer or someone else who understands the logic of the program works through the code with a paper and pencil. The programmer executes each instruction, using test cases that may or may not be written down. In one sense, the reviewer acts as the computer, mentally checking each step and its results for the entire set of computer instructions.Among the list of automated testing techniques in Table 11,5, only one technique is static—syntax checking. Syntax checking is typically done the a compiler. Errors in syntax are uncovered but the code is not executed. For the other three automated techniques, the code is executed.Unit testing, sometimes called module testing, is an automated technique whereby each module is tested alone in an attempt to discover any errors that may exist in the module’s code. But because modules coexist and work with other modules in programs and the system, they must also be tested together'in larger groups. Combining modules and testing them is called integration testing. Integration testing is gradual. First you test the coordinating module (the root module in a structure chart tree) and only one of its subordinate modules. After the first test, you add one or two other subordinate modules from the same level. Once the program has been tested with the coordinating module and all of its immediately subordinate modules, you add modules from the next level and then test the program. You continue this procedure until the entire program has been tested as a unit. System testing is a similar process, but instead of integrating modules into programs for testing, you integrate programs into systems. System testing follows the same incremental logic that integration testing does. Under both integration and system testing, not only do individual modules and programs get tested many times, so do the interfaces between modules and programs.Current practice calls for a top-down approach to writing and testing modules. Under a top-down approach, the coordinating module is written first. Then the modules at the next level in the structure cheui;' are written, followed by the modules at the next level, and so on, until all of the modules in the system are done. Each module is tested as it is written. Because lop-level modules contain many calls to subordinate modules, you may wonder how they can be tested if the lower-level modules haven’t been written yet. The answer is stub testing. Stubs are two or three lines of code written by a programmer to stand in for the missing modules. During testing, the coordinating module calls the stub instead of the subordinate module. The stub accepts control and then returns it to the coordinating module.Figure 11.5 illustrates stub and integration system testing. Stub testing is depicted as the innermost oval. Here, the Get module (where data are input, and read) is being written and tested, but because none of its subordinate modules have been written yet, each one is represented by a stub. In the stub testing illustrated by Figure 11.5, Get is tested with only one stub in place, for its left-most subordinate module. You would of course write stubs for all of the Get module’s subordinate modules, just as you would for the Make-(where new information is calculated) and Put (where information is output) modules. Once all of the subordinate modules have been written and tested, you would conduct an integration test of Get and its subordinate modules, as represented by the second oval. As stated previously, the focus of an integration test is on the interrelationships among modules. You would also conduct integration tests of Make and its subordinate modules; of Put and its subordinaies; and of System and its subordinates, (jret. Make, and Put.- Eventually, your integration testing would include all of the modules in the large over that encompasses the entire program.
SyBtem Development
NOTES
Self'Inatructionai Material 263
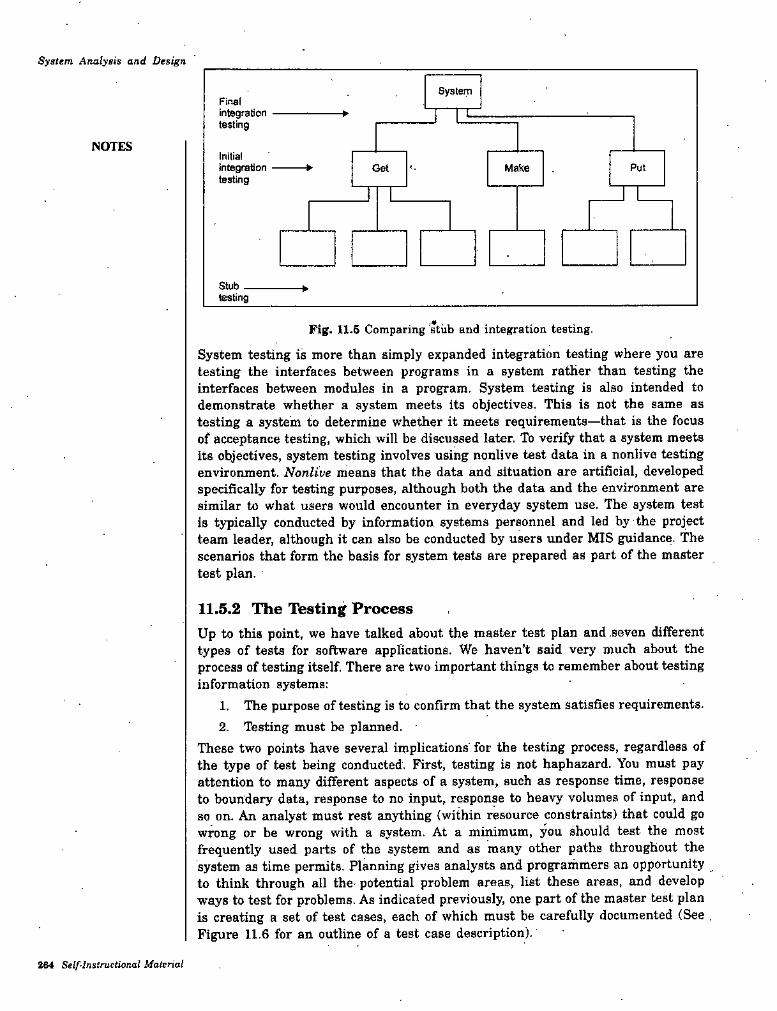
System Analysis and Design
SystemFinalintegrabontesting
NOTESInitialintegrationtesting
Put* Get Make
Stub ♦testing
Fig. 11.5 Comparing 'stub and integration testing.
System testing is more than simply expanded integration testing where you are testing the interfaces between programs in a system rather than testing the interfaces between modules in a program. System testing is also intended to demonstrate whether a system meets its objectives. This is not the same as testing a system to determine whether it meets requirements—that is the focus of acceptance testing, which will be discussed later. To verify that a system meets its objectives, system testing involves using nonlive test data in a nonlive testing environment. Nonlive means that the data and situation are artificial, developed specifically for testing purposes, although both the data and the environment are similar to what users would encounter in everyday system use. The system test is typically conducted by information systems personnel and led by the project team leader, although it can also be conducted by users under MIS guidance. The scenarios that form the basis for system tests are prepared as part of the master test plan.
11.5.2 The Testing ProcessUp to this point, we have talked about the master test plan and seven different types of tests for software applications. We haven’t said very much about the process of testing itself There are two important things to remember about testing information systems:
1. The purpose of testing is to confirm that the system satisfies requirements.2. Testing must be planned.
These two points have several implications for the testing process, regardless of the type of test being conducted. First, testing is not haphazard. You must pay attention to many different aspects of a system, such as response time, response to boundary data, response to no input, response to heavy volumes of input, and so on. An analyst must rest anything (within resource constraints) that could go wrong or be wrong with a system. At a minimum, you should test the most frequently used parts of the system and as many other paths throughout the system as time permits. Planning gives analysts and programmers an opportunity _ to think through all the- potential problem areas, list these areas, and develop ways to test for problems. As indicated previously, one part of the master test plan is creating a set of test cases, each of which must be carefully documented (See , Figure 11.6 for an outline of a test case description).
264 Self-lnstmctionai Material

System DevelopmentSheelak Ram Furniture Company Test Case Description
Test Case Number: Date:Test Case Description: NOTES
Program Name; ' Testing State:Test Case Prepared By;
Test Administrator: Description of Test Data:
Expected Results:
Actual Results;
Fig. 11.6 Ifest case description form.
A test case is a specific scenario of transactions, queries, or navigation paths that represent a typical, critical, or abnormal use of the system. A test case should be repeatable so that it can be rerun as new versions of the software are tested. This is important for all code, whether written in-house, developed by a l ^ntractor, or purchased. Test cases need to determine that new software works with other existing software with which it must share data. Even though analysts often do not do the testing, systems analysts, because of their intimate knowledge of applications, often make up or find test data. The people who create the test cases should not be the same people as those who coded and tested the system. In addition to a description of each test case, there must also be a description of the test results, with an emphasis on how the actual results differed from the expected results (see Figure 11.7). This description will indicate why the results were different and what, if anything, should be done to change the software. This description will then suggest the need for retesting, possibly introducing new tests to discover the source of the differences.
Sheeiak Ram Furniture Company Test Case Results
Test Case Number: Date:
Program Name: Module Under Test:
Explanation of difference between actual and expected output:
Suggestions for next steps:
Fig. 11.7 Test case results form.Self-lnstruc/ional Material 26S
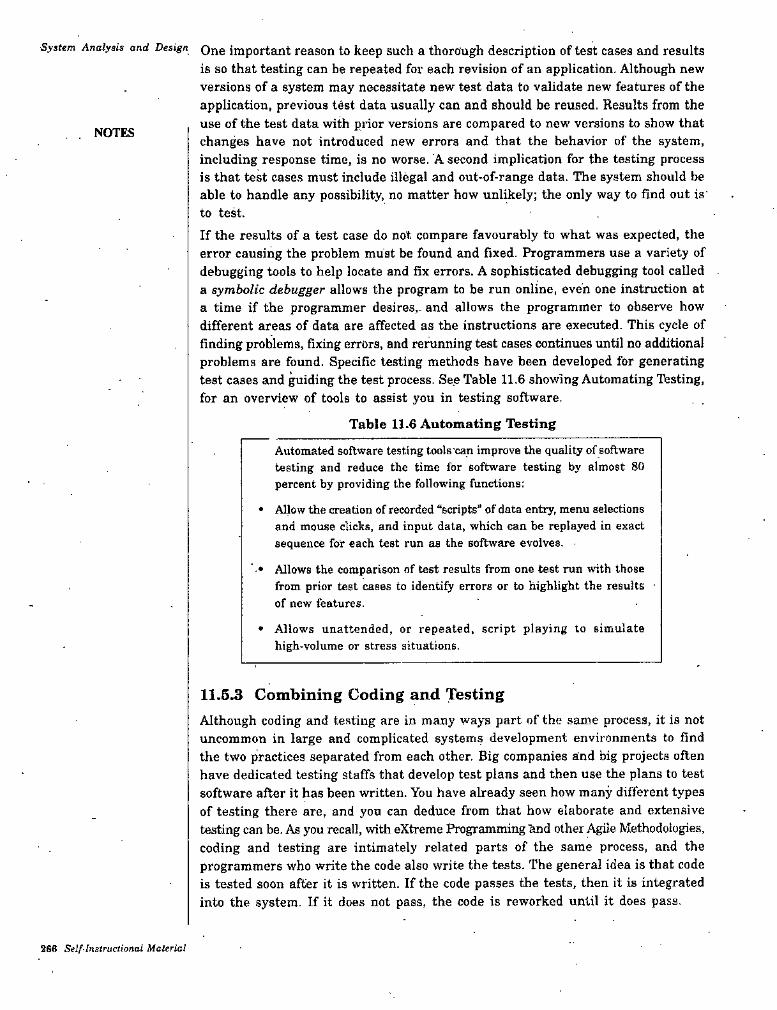
System Analysis and Design Qj^g important reason to keep such a thorotigh description of test cases and resultsis so that testing can be repeated for each revision of an application. Although new versions of a system may necessitate new test data to validate new features of the application, previous test data usually can and should be reused. Results from the use of the test data with prior versions are compared to new versions to show that changes have not introduced new errors and that the behavior of the system, including response time, is no worse. A second implication for the testing process is that test cases must include illegal and out-of-range data. The system should be able to handle any possibility, no matter how unlikely; the only way to find out is' to test.If the results of a test case do not. compare favourably to what was expected, the error causing the problem must be found and fixed. Programmers use a variety of debugging tools to help locate and fix errors. A sophisticated debugging tool called a symbolic debugger allows the program to be run online, even one instruction at a time if the programmer desires,- and allows the programmer to observe how different areas of data are affected as the instructions are executed. This cycle of finding problems, fixing errors, and rerunning test cases continues until no additional problems are found. Specific testing methods have been developed for generating test cases and guiding the test process. See Table 11.6 showing Automating lasting, for an overview of tools to assist you in testing software.
Table 11.6 Automating Testing
NOTES
Automated software testing tools'can improve the quality of software testing and reduce the time for software testing by almost 80 percent by providing the following functions:
• Allow the creation of recorded “scripts” of data entry, menu selections and mouse dicks, and input data, which can be replayed in exact sequence for each test run as the software evolves.
• • Allows the comparison of test results from one test run with thosefrom prior test cases to identify errors or to highlight the results • of new features.
• Allows unattended, or repeated, script playing to simulate high-volume or stress situations.
11.5.3 Combining Coding and TestingAlthough coding and testing are in many \vays part of the same process, it is not uncommon in large and complicated systems development environments to find the two practices separated from each other. Big companies and big projects often have dedicated testing staffs that develop test plans and then use the plans to test software after it has been written. You have already seen how many different types of testing there are, and you can deduce from that how elaborate and extensive testing can be. As you recall, with extreme Programming 'and other i^le Methodologies, coding and testing are intimately related parts of the same process, and the programmers who write the code also write the tests. The general idea is that code is tested soon after it is written. If the code passes the tests, then it is integrated into the system. If it does not pass, the code is reworked until it does pass.
268 Self-Instructional Material
System Development11.5.4 Acceptance Testing by UsersOnce the system tests have been satisfactorily completed, the system is ready for acceptance testing, which is testing the system in the environment where it will eventually be used. Acceptance refers to the fact that users typically sign off on the system and “accept” it once they are satisfied with it. As we said previously, the purpose of acceptance testing is for users to determine whether the system meets their requirements. The extent of acceptance testing wiD vary with the organization and with the system in question. The most complete acceptance testing will include alpha testing, in which simulated but typical data are used for system testing; ' beta testing, in which live data are used in the users’ real working environment; and a system audit conducted by the organization’s internal auditors or by members of the quality assurance group.During alpha testing, the entire system is implemented in a test environment to discover whether the system is overtly destructive to itself or to the rest of the environment. The types of tests performed during alpha testing include the following:
• Recovery testing—forces the software (or environment) to fail in order to verify that recovery is properly performed.
• Security testing—verifies that protection mechanisms built into the system will protect it from improper penetration.
• Stress testing—tries to break the system ie.g., what happens ^ hen a record is written to the database with incomplete information or wi.at happens under extreme online transaction loads or with a large number of concurrent users).
• Performance testing—determines how the system performs in the range of possible environments in which it may be used ie.g., different hardware configurations, networks, operating systems, and so on); often the goal is to have the system perform with similar response time and other performance measures in each environment.
In beta testing, a subset of the intended users run the system in their own environments using their own data. The intent of the beta test is to determine ■ whether the software, documentation, technical support, and training activities work as intended. In essence, beta testing can be viewed as a rehearsal of the installation phase. Problems uncovered in alpha and beta testing in any of these areas must be corrected before users'can accept the system. There are many stories systems analysts can tell about long delays in final user acceptance due to system bugs.
NOTES
Self-Instructional Material 2fi7

System Analysis and'Design
STUDENT ACTIVITY 11.2
1. What are the various factors to be considered prior to system (computer) selection?
2. What is software testing? Explain the testing process.
268 Self-Instructional Material
System DevelopmentSUMMARY* The major activities in the systems development phase are coding, acquiring
hardware, and testing.* Coding is the process whereby the'physical design specifications created by
the analysis team are turned into working computer code by the programming team.
* A program is a list of instructions that the computer must follow in order to process data into information.
* Programming also known as software engineering! is a multi-step process for creating that list of instructions.
* In the program design step, the software is designed in three mini-steps. First, the program logic is determined through a top-down approach and modularization, using a hierarchy chart. Then it is designed indetail, either in narrative form, using pseudocode, or graphically, using flowcharts.
* Structured programming takes a top-down approach that breaks programs into modular forms. It also uses standard logic tools called control structures (sequential, selection, case and iteration).
* Writing the program is called coding.* A programming language is a set of rules that tells the computer what
operations to do.* Program testing involves various tests and then running real-world data
to make sure the program works.* Documentation consists of written descriptions of what a program is and
how to use it.* Hardware/soilware selection starts with requirements analysis, followed by
a request for proposal and vendor evaluation.* There are three methods of hardware acquisition: rental directly from the'
manufactures, leasing through a third party or from the vendor, and outright purchase.
* The final step in system acquisition is to negotiate a contract. Negotiation is an art.
* System testing is the bringing together of all the programs that a system comprises for testing purposes. Programs are typically integrated in a top-down, incremental fashion.
NOTES .
TEST YOURSELF
Answer the fitllowing questions:1. Describe system implementation in brief.2. Hardware selection requires the analysis of several performance categories.
For a fiTSt-time user of microcomputers, what category or categories would be most important? Why?
3. Under what circumstances would one consider buying a used computer? What are the benefits and drawbacks to such an acquisition? Discuss.
4. Where programming fits in the systems development life cycle? Discuss it.
Self-Instructional Materia! 269
System Analysis and Design 6. Discuss in short the software application testing.6. How are programming needs clarified?7. How is a program designed?8. What is involved in coding a program?
9. How is a program tested?10. What is involved in documenting and maintaining a program?11. Discuss the major phases in hardware selection.12. In what way is computer negotiation an art? Explain.13. List the different t3T)e of tests conducted in software development life cycle.
Categorize these tests. How do these tests differ? Describe the purpose of each test.
14. What is acceptance testing? When is this test performed? What type of tests are performed during the acceptance testing?
15. State Thus or False;(() The major activities in the system development phase are coding,
acquiring hardware, and testing.(t{) The results of program and system testing are important deliverables
from the testing process.({{() Writing the program is not called coding.(iv) Program documentation consists of written descriptions of what a program
is and how to use it.(i>) Hardware/Software selection starts with requirements analysis, followed
by a request for proposal and vendor evaluation.(oi) Selecting a system is not a serious and time-consuming business.
(ou) Software application testing is an umbrella term that covers several types of tests.
(vtii) Beta testing is user testing of a complicated information system using real data in the real user environment.
NOTES
16. Fill in the blanks:(i) Using a plan-driven methodology,
often done by other project team members besides analysts, although analysts may do some programming.
(ii) Deliverables from the coding are................... are known as software engineering, is a multi-step processfor creating that list of instructions....................... involves running various tests and then running realworld data to make sure the program works.
(u) The primaiyof the uncertainty of rental revenues to the vendor.
is acquired through a third party or from the vendor.
and are
and
mUv)
of a rental contract is its high cost because
(vi) A.................... is a testing technique in which participants examine programcode for predictable language-specific errors...................... is user testing of a complicated information system using
(oil)
(viii)simulated data.
270 Self-Instruetionol Material
System DevelopmentANSWERS
Test Yourself15. Slate True or False:,
(i) True (it/) False (d) True
(uti) True
16. Fill in the blanks:(i) coding, testing
(Hi) Programming (u) drawback
(vii) Inspections
NOTES(ii) True (in) True (vi) False
(viii) True
(») code, program documentation
(io) Program testing (oO teased system
(viii) Alpha testing
Self-Insirttrlhnal Material 271
ImpltmentalionCHAPTER
NOTES
IMPLEMENTATION
LEARNING OBJECTIVESIntroductionSystem Implementation12.2.1 The Process of Installation, Documenting the System, Training Users,
and Supporting Users. . .12.2.2 Deliverables and Outcomes from Installation, Documenting the system.
Training Users, and Supporting Users
12.112.2
12.3 Installation12.3.1 Direct Installation12.3.2 Parallel Installation12.3.3 Single-Location Installation12.3.4 Phased Installation12.3.5 Planning Installation Documenting the system12.4.1 User Documentation12.4.2 Preparing User Documentation Training and Supporting Users12.5.1 Training information Systems Users12.5.2 Supporting Information Systems Users12.5.3 Support Issues for the Analyst to Consider Project Closedown
12.4
12.5
12.6
12.1 INTRODUCTIONAfter maintenance, the implementation phase of the systems development phase is the most expensive and time-consuming phase of the entire life cycle. It is due to involvement of many people and a lot of time is taken for this process. Regardless of the methodology used, once the system development phase is over, it must be installed (or put into production), user sites must be prepared for the new system, and users must come to rely on the new system rather than the existing one to get their work done.Implementing a new information system into an organizational context is not a mechanical process. The organizational context has been shaped and reshaped by the people who work in the organization. The work h^its, beliefs, interrelationships.
Self-ln»tructionai Material 873
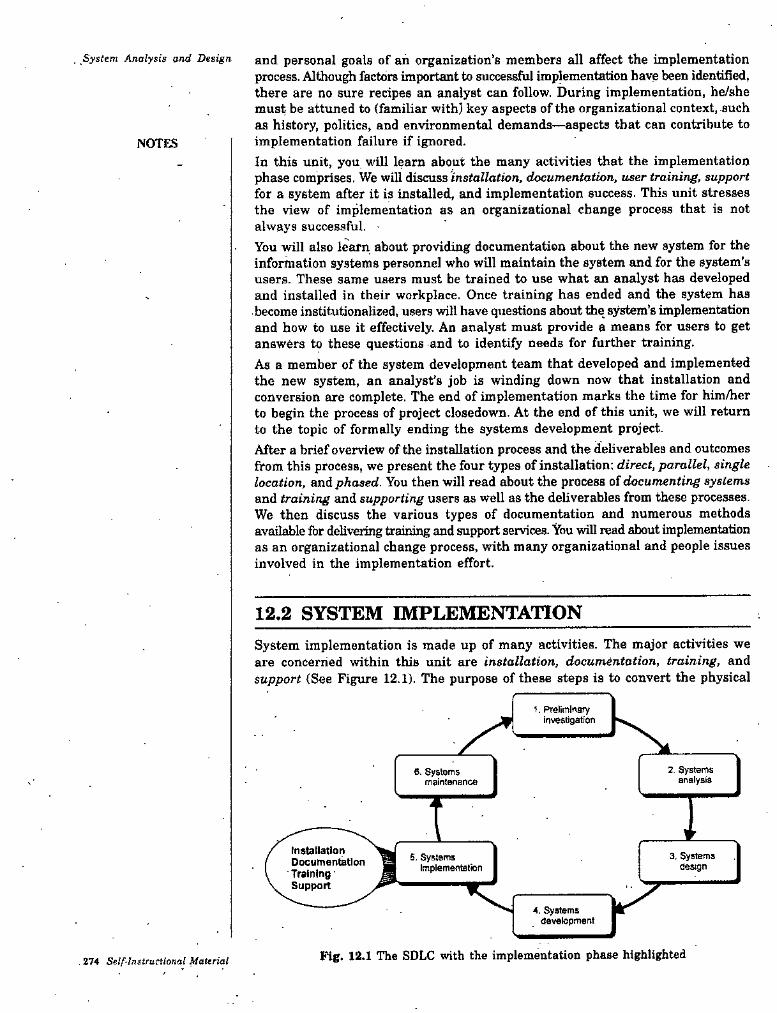
and personal goals of an organization’s members all affect the implementation process. Althou^ factors important to successful implementation have been identified, there are no sure recipes an analyst can follow. During implementation, he/she must be attuned to (familiar with) key aspects of the organizational context, such as history, politics, and environmental demands—aspects that can contribute to implementation failure if ignored.In this unit, you will learn about the many activities that the implementation phase comprises. We will discuss installation, documentation, user training, support for a system after it is installed, and implementation success. This unit stresses the view of implementation as an organizational change process that is not always successful.You will also learn about providing documentation about the new system for the information systems personnel who will maintain the system and for the system’s users. These same users must be trained to use what an analyst has developed and installed in their workplace. Once training has ended and the system has become institutionalized, users will have questions about the system’s implementation and how to use it effectively. An analyst must provide a means for users to get answers to these questions and to identify needs for further training.As a member of the system development team that developed and implemented the new system, an analyst’s job is winding down now that installation and conversion are complete. The end of implementation marks the time for him/her to begin the process of project closedown. At the end of this unit, we will return to the topic of formally ending the systems development project.After a brief overview of the installation process and the deliverables and outcomes from this process, we present the four types of installation: direct, parallel, single location, phased. You then will read about the process of documenting systems and training and supporting users as well as the deliverables from these processes. We then discuss the various types of documentation and numerous methods available for delivering training and support services. You will read about implementation as an organizational change process, with many organizational and people issues involved in the implementation effort.
System Analysis and Design
NOTES
12.2 SYSTEM IMPLEMENTATIONSystem implementation is made up of many activities. The major activities we are concerned within this unit are installation, documentation, training, and support (See Figure 12.1). The purpose of these steps is to convert the physical
K1. Preliminary Investigation
2. Systems analysis
6. Systems maintenance
TInstallationDocumentationTrainingSupi>ort
3. Systems Oestgn
5. Systems Implementation
K4. Systems development
Fig. 12.1 The SDLC with the implementation phase highlighted. 274 Self-Instructional Material
Implementationsystem specifications into working and reliable software and hardware, document the work that has been done, and provide help for current and future users and caretakers of the system. Analysts are responsible for ensuring that all of these various activities are properly planned and executed. Next we will briefly discuss these activities. NOTES
12.2.1 The Process of Installation, Documenting the System, Training Users, and Supporting Users
Installation is the process during which the current system is replaced by the new system. This includes conversion of existing data, software, documentation, and work procedures to those consistent with the new system. Users must give up the old ways of doing their jobs, whether manual or automated, and adjust to accomplishing the same tasks with the new system. Users will sometimes resist these changes,
. and an analyst must help them adjust. However, he/she cannot control all the dynamics of user-system interaction involved in the installation process. Although the process of documentation proceeds throughout the life cycle, it receives
I formal attention during the implementation phase because the end of implementation largely marks the end of the analysis team’s involvement in systems development.
I As the team is getting ready to move on to new projects, all the analysts working ■ on the system need to prepare documents that reveal all of the important information they have learned about this system during its development and implementation. There are two audiences for this final documentation :
1. the information systems personnel who will maintain the system throughout its productive life and
2. the people who will use the system as part of their daily lives.The analysis team in a large organization can get help in preparing documentation from specialized staff in the information systems department.Larger organizations also tend to provide training and support to computer users throughout the organization. Some of training and support is very specific to particular application systems, whereas the rest is general to particular operating systems or off-the-shelf software packages. For, example, it is common to find courses oh Microsoft Windows and WordPerfect in organizationwide training facilities. Analysts are mostly uninvolved with general training and support, but they do work with corporate trainers to provide training and support tailored to particular computer applications they have helped to develop. Centralized information system training facilities tend to have specialized staff who can help with training and support issues. In smaller organizations that cannot afford to have well-staffed centralized training and support facilities, fellow users are the best source of training and support users have, whether the software is customized or off the shelf.
12.2.2 Deliverables and Outcomes from Installation, Documenting the System, Training Users, and Supporting Users
Table 12.1 Shows the deliverables from installation, documenting the system, training users, and supporting users.
Self-Instructional hfaterial 275

Sy$tem Analysis and Design Table 12.1 Deliverables for Installation, Documenting the System, Training, and Supporting Users
1. Installation(a) User guides(fe) User training plan(c) Installation and conversion plan
' (i) Software and hardware installation schedule (ii) Data conversion plan (Hi) Site and facility remodelling plan
2. Documentation(a) System documentation(b) User documentation
3. User training plan(а) Classes(б) Tutorials
4. User training modules(a) Training materials(b) Computer-based training aids
5. User support plan(a) Help desk(b) Online help(c) Bulletin boards and other support mechanisms
NOTES
The two deliverables, user guides and the user training plan, result from the installation process. User guides provide information on how to use the new system, and the training plan Is a strategy for training users so that they can quickly learn the new system. The development of the training plan probably began earlier in the project, and some training, on the concepts behind the new system, may have already taken place. During the early stages of implementation, the training plans are finalized and training on the use of the system begins.The installation plan lays out a strategy for moving from the old system to the new, from the beginning to the end of the process. Installation includes installing the system (hardware and software) at central and user sites. The installation plan answers such questions as when the new system will be installed, which installation strategies will be used, who will be involved, what resources are required, which data will be converted and cleansed, and how long the installation process will take.It is not enough that the system is installed; users must actually use it.The development team must prepare user documentation. For most modem information . systems, documentation includes any online help designed as part of the system interface. The development team should think through the user training process the following:Who should be trained?How much training is adequate for each training audience?What do different types of users need to learn during training?The training plan should be supplemented by actual training modules, or at least outlines of such modules, that at a minimum address the three questions stated
276 Self.Jnstruclional Material
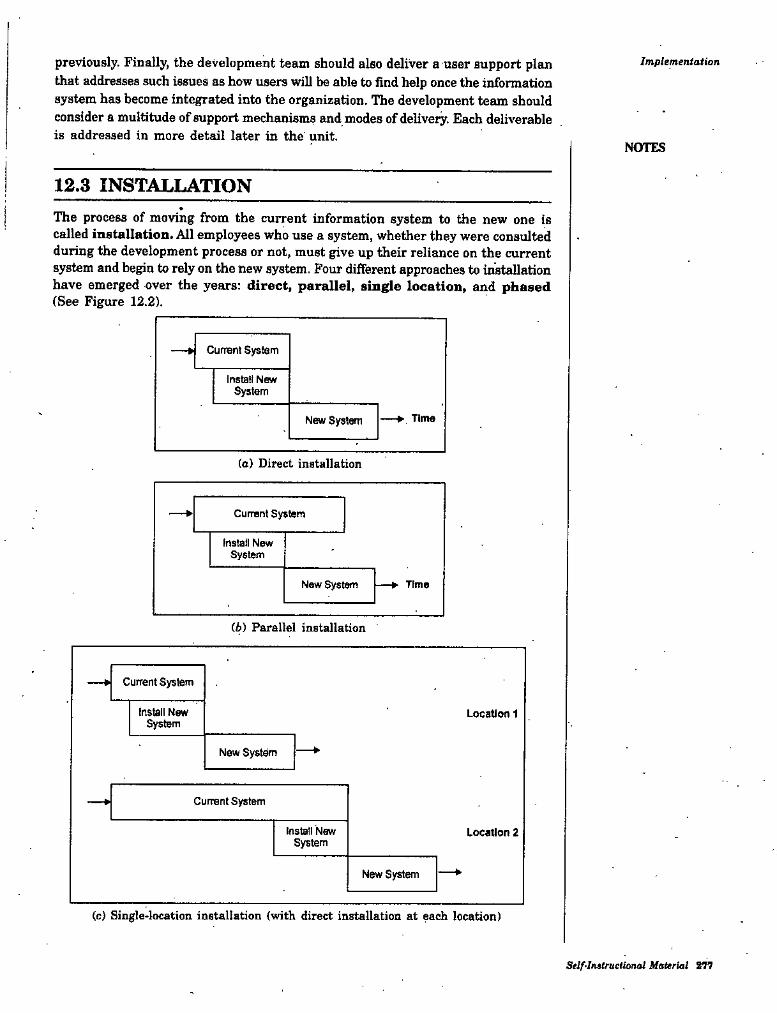
previously. Finally, the development team should also deliver a user support plan that addresses such issues as how users will be able to find help once the information system has become integrated into the organization. The development team should consider a multitude of support mechanisms and modes of delivery. Each deliverable is addressed in more detail later in the unit.
Implementation
NOTES
12.3 INSTALLATIONThe process of moving from the current information system to the new one is called installation. All employees who use a system, whether they were consulted during the development process or not, must give up their reliance on the current system and begin to rely on the new system. Four different approaches to installation have emerged over the years: direct, parallel, single location, and phased (See Figure 12.2).
* Currant System
Install New System
> TimeNew System
(a) Direct installation
Current System
Irtstall New SystMTi
New System * Time
(.b) Parallel installation
* Currant System
Install New System
Location 1
New System
Current System
Install New System
Location 2
New System
(c) Single>location installation (with direct installation at each location)
Self-ln»trucHonal Material 277
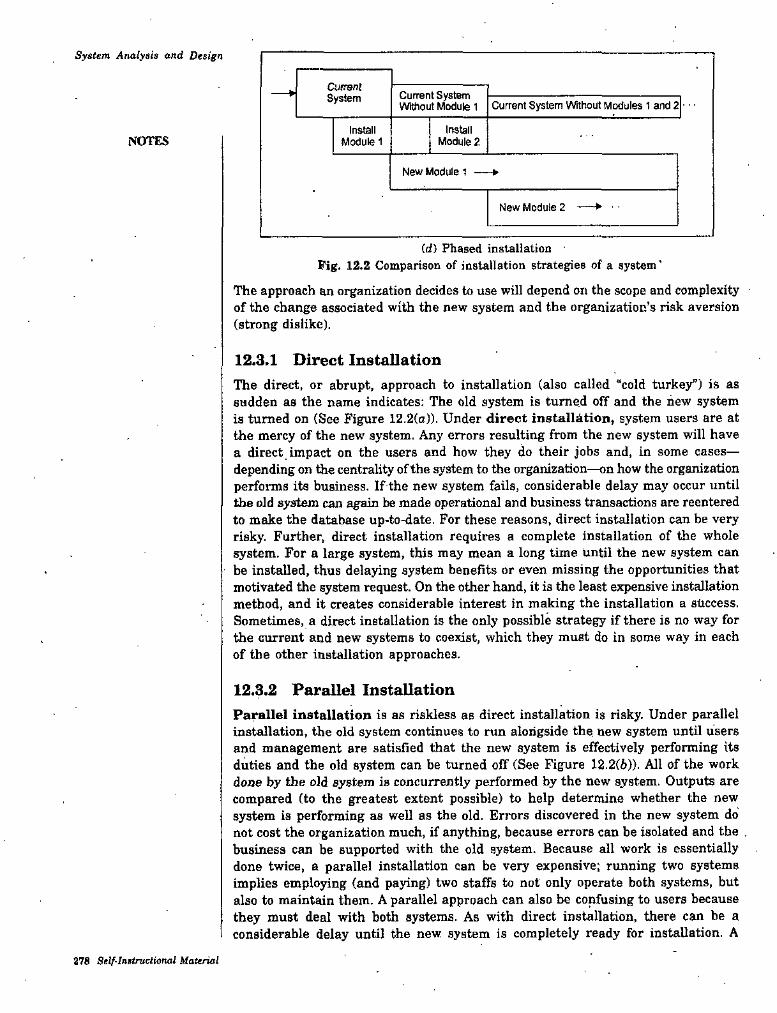
System Analysis and Design
CurrsntSystem* Current System
Witfiout Module 1 Current System Without Modules 1 and 2 • • •
Irrstall Module 2
Install Module 1NOTES
New Module 1 ♦
*New Module 2
(d) Phased installationFig. 12.2 Comparison of installation strategies of a system'
The approach an organization decides to use will depend on the scope and complexity • of the change associated with the new system and the organization's risk aversion (strong dislike).
12.3.1 Direct InstallationThe direct, or abrupt, approach to installation (also called “cold turkey”) is as sudden as the name indicates: The old system is turned off and the hew system is turned on (See Figure 12.2(a)). Under direct installation, system users are at the mercy of the new system. Any errors resulting from the new system will have a direct impact on the users and how they do their jobs and, in some cases— depending on the centrality of the system to the organization—on how the organization performs its business. If the new system fails, considerable delay may occur until the old system can again be made operational and business transactions are reentered to make the database up-to-date. For these reasons, direct installation can be very risky. Further, direct installation requires a complete installation of the whole system. For a large system, this may mean a long time until the new system can be installed, thus delaying system benefits or even missing the opportunities that motivated the system request. On the other hand, it is the least expensive installation method, and it creates considerable interest in making the installation a sticcess, Sometimes, a direct installation is the only possible strategy if there is no way for the current and new systems to coexist, which they must do in some way in each of the other installation approaches.
12.3.2 Parallel InstallationParallel installation is as riskless as direct installation is risky. Under parallel installation, the old system continues to run alongside the new system until users and management are satisfied that the new system is effectively performing its duties and the old system can be turned off (See Figure 12.2(6)). All of the work done by the old system is concurrently performed by the new system. Outputs are compared (to the greatest extent possible) to help determine whether the new system is performing as well as the old. Errors discovered in the new system do not cost the organization much, if anything, because errors can be isolated and the , business can be supported with the old system. Because ail work is essentially done twice, a parallel installation can be very expensive; running two systems implies employing (and paying) two staffs to not only operate both systems, but also to maintain them. A parallel approach can also be confusing to users because they must deal with both systems. As with direct installation, there can be a considerable delay until the new system is completely ready for installation. A
276 Self-Instructional Material
Implementationparallel approach may not be feasible, especially if the users of the system (such as customers) cannot tolerate redundant effort or if the size of the system (number of users or extent of features) is large.
12.3.3 Single-Location InstallationSingle-location installation, also called location or pilot installation, is a middle-of-the-road approach compared with direct and parallel installation. Rather than convert all of the system in organization at once, single-legation installation involves changing from the current to the new system in only one place or in a series of separate sites over time (See Figure 12.2(c)) illustrates this approach for a simple situation of two locations). The single location may be a branch office, a single factory, or one department, and the actual approach used for installation in that location may be any of the other approaches. The key advantage to single- location installation is that it limits potential damage and potential cost by limiting the effects to a single site. Once management has determined that installation has been successful at one location, the new system may be deployed.in the rest of the organization, possibly continuing with installation at one location at a time. Success at the pilot site can be used to convince reluctant personnel at other sites that the system can be worthwhile for them as well. Problems with the system (the actual software as well as documentation, training, and support) can be resolved before deployment to other sites of the organization. Even though the single-location approach may be simpler for users, it still places a large burden on IS (Information Systems) staff to support two versions of the system. On the other hand, because problems are isolated at one site at a time, IS staff can devote all of their efforts to the success at the pilot site. Also, if different locations require sharing of data, extra programs will need to be written to synchronize the current and new systems; although this will happen transparently to users, it is extra work for IS staff. As with each of the other approaches (except phased installation), the whole system is installed; however, some parts of the organization will not gel the benefits of the new system until the pilot installation has been completely tested.
NOTES
12.3.4 Phased InstallationPhased installation, also known as staged installation, is an incremental approach. With phased installation, the new system is brought online in functional components; different parts of the old and new systems are used in cooperation until the whole new system is installed. (See Figure 12.2{<i)) shows the phase-in of the first two modules of a new system.) Phased installation, like single-location installation, is an attempt to limit the organization’s exposure to risk, whether in terms of cost or disruption of the business. By converting gradually, the organization’s risk is spread out over time and place. Also, a phased installation allows for some benefits from the new system before the whole system is ready. For example, new data-capture methods can be used before all reporting modules are ready. For a phased installation, the new and replaced systems must be able to coexist and probably share data. Thus, bridge programs connecting old and new databases and programs often must be built. Sometimes, the new and old systems are so incompatible (built using totally different structures) that pieces of the old system cannot be incrementally replaced, so this strategy is not feasible. A phased installation is akin to bringing out a sequence of releases of the system. Thus, a phased approach requires careful version control, repeated conversions at each phase, and a long period of change, which may be frustrating and confusing to users. On the other hand, each phase of change is smaller and more manageable for all involved.
Self-Instructional Material 278
System Analysis and Design 12.3.6 Planning Installation
Each installation strategy involves converting not only software, but also data and (potentially) hardware, documentation, work methods, job descriptions, offices and other facilities, training materials, business forms, and other aspects of the system. For example, it is necessary to recall or replace all the current system documentation and business forms, which suggests that the IS department must keep track of who has these items so that they can be notified and receive replacement items. In practice, an analyst will rarely choose a single strategy to the exclusion of all others; most installations will rely on a combination of two or more approaches. For example, if he/she selects a single-location strategy, he/she has to decide how installation will proceed there and at subsequent sites. Will it be direct, parallel, or phased?Of special interest in the installation process is the conversion of data. Because existing systems usually contain data required by the new system, current data must be made error free, unloaded from current files, combined with new data, and loaded into new files. Data may need to be reformatted to be consistent with more advanced data types supported by newer technology used to build the new system. New data fields may have to be entered in large quantities so that every record copied from the current system has all the new fields populated. Manual tasks, such as taking a physical inventory, may need to be done in order to validate data before they are transferred to the new flies. The total data conversion process can be tedious. Furthermore, this process may require that current systems be shut off while the data are extracted so that updates to old data, which would contaminate the extract process, cannot occur.Any decision that requires the current system to be shut down, in whole or in part, before the replacement system is in place must be done with care. Typically, off hours are used for installations that require a lapse in system support. Whether a lapse in service is required or not, the installation schedule should be announced to users well in advance to let them plan their work schedules around outages in service and periods when their system support might be erratic. Successful installation steps should also be announced, and special procedures put in place so that users can easily inform the analyst of problems they encounter during installation periods. An analyst shoxUd also plan for emergency staff to be available in case of system failure so that business operations can be recovered and made operational as quickly as possible. Another consideration is the business cycle of the organization. Most organizations face heavy workloads at particular times of year and relatively light loads at other times. A well-known example is the retail industry, where the busiest time of year is the fall, right before the year’s major gift-giving holidays. An analyst wouldn’t want to schedule installation of a new point-of-sale system to begin December 1 for a department store. Make sure he/she understands the cyclical nature of the business he/she is working with before he/she schedules installation.Planning for installation may begin as early as the analysis of the organization supported by the system. Some installation activities, such as buying new hardware, remodeling fadUties, validating data to be transferred to the new system, and collecting new data to be loaded into the new ^stem, must be done before the software installation can occur. Other the project team leader is responsible for anticipating all installation tasks and assigns responsibility for each to different analysts.Each installation process involves getting workers to change the way they work. As such, installation should be looked at not as simply installing a new computer system, but as an oiganizational change process. More than just a computer system is involved—the analyst is also changing how people do their jobs and how the organization operates.
NOTES
280 Self-Instructional Material

Implementation
STUDENT ACTIVITY 12.1
1. What are the inputs to the various processes of system implementation phase and what are their deliverables? What is the main purpose of this phase?
2. Write a short note on planning installation.
Self-lnatruetional Materi^ 881
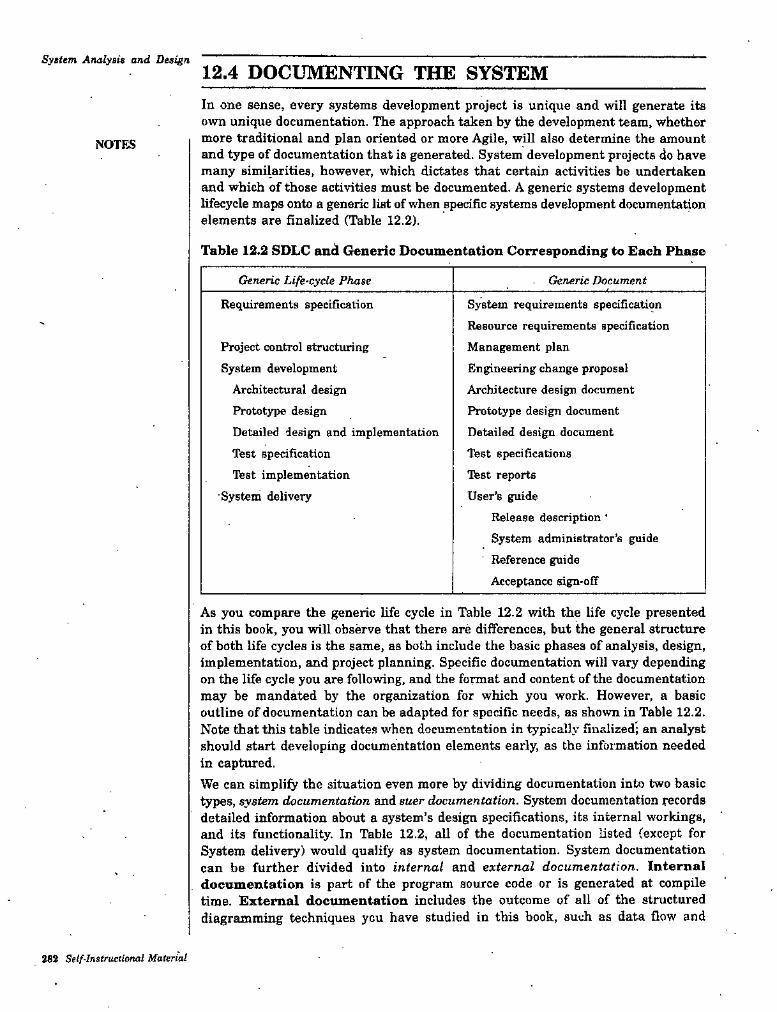
Sytlem Analysis and Design12.4 DOCUMENTING THE SYSTEMIn one sense, every systems development project is unique and will generate its own unique documentation. The approach taken by the development team, whether more traditional and plan oriented or more Agile, will also determine the amount and type of documentation that is generated. System development projects do have many similarities, however, which dictates that certain activities be undertaken and which of those activities must be documented. A generic systems development lifecycle maps onto a generic list of when specific systems development documentation elements are finalized (Table 12.2).
NOTES
Table 12.2 SDLC and Generic Documentation Corresponding to Each Phase
Generic Life-cycle Phase Generic Document
System requirements specification Resource requirements specification Management plan Engineering change proposal Architecture design document Prototype design document Detailed design, document Test specifications Ibst reports User’s guide
Release description'System administrator’s guide Reference guide Acceptance sign-off
Requirements specification
Project control structuring System development
Architectural design Prototype designDetailed design and implementation Test specification Tbst implementation
System delivery
As you compare the generic life cycle in Table 12.2 with the life cycle presented in this book, you will observe that there are differences, but the general structure of both life cycles is the same, as both include the basic phases of analysis, design, implementation, and project planning. Specific documentation will vary depending on the life cycle you are following, and the fomat and content of the documentation may be mandated by the orgjinization for which you work. However, a basic outline of documentation can be adapted for specific needs, as shown in Table 12.2. Note that this table indicates when documentation in typically finalized; an analyst should start developing documentation elements early, as the infoimation needed in captured.We can simplify the situation even more by dividing documentation into two basic types, system documentation and suer documentation. System documentation records detailed information about a system’s design specifications, its internal workings, and its functionality. In Table 12.2, all of the documentation listed (except for System delivery) would qualify as system documentation. System documentation can be further divided into internal and external documentation. Internal documentation is part of the program source code or is generated at compile time. External documentation includes the outcome of all of the structured diagramming techniques you have studied in this book, such as data flow and
26S Self-Instructional Material

entity-relationship diagrams. Although not part of the code itself, external documentation can provide useful information to the primary users of system documentation— maintenance pro^ammers. In the past, external documentation was typically discarded after implementation, primarily because it was considered too costly to keep up- to-date, but today’s CASE environment makes it possible to maintain and update external documentation as long as desired.Whereas system documentation is intended primarily for maintenance programmers, user documentation is intended primarily for users. An organization may have definitive standards on system documentation, often consistent with CASE tools and the systems development process. These standards may include the outline for the project dictionary and specific pieces of documentation within it. Standards for user documentation are not as explicit.
Implementation
NOTES
12.4.1 User Documentation'User documentation consists of written or other visual information about an application system, how it works, and how to use it. An excerpt of online user documentation or Microsoft Excel appears in Figure 12.3.
\Os^3 ^ ‘ 0.^'icrtwis j I
0»«irg I£ % TroManMUrg RatrWv
SmttWttriQ MCs n tiao a ;'.r
9«o£«WtoprtB
gfiMKnMfn.i ! n Pin a asm fv at '2 OM. Mr tfM r-
Ki e>rc|Ken;vaijniiyu:: 'i ( i SCMTQ . On.-vinic* ^
e< > SMig C<rn>M Sruui
futun values andperlormregressiondnatysl*You can fill in a itntt of v«Iub$ Chat fi( a drnpla tnev (rand or
exponan&al qronth tr«nd hf u»ing fill handle. Ta axtan4 compiax and nonUnaar data, should use the rvoriistieat functians littad halOM, or ij<t Qia ragreition analyais too< m tha Anaiyfis Taol^alr.Tou cart ___for tha 9and!ina.
£]>JV :
.1sI
IJ
}
Wh«t do you want to do?
Uta ttio fill haodia or the Sorias esmmond
J'ai.‘V % ■
B ^ ArMcTocM 'a I f Sh»rQaWvtta:t««tCi( / B * f emuar vk%ia< '< |B 1 k VtfevTtgCas^rvm 'r,S i kPiAvWTrcmftSicaiOiMl ''I'll.:' I ' .if'
Use a wolltshett fuflctlenProie^. ya'i>a8 br ustrvo the For.SCAffT furoiten
vr'‘rfaf frf p n^a>aht yand line fey-USir.a gta TOPN&5
»•? PrQ?*i:*-Trh«t fit| ^ furvo Bv the CftC*’! lifvncM"
^■*1'Fig. 12.S Example of online user documentation (from Microsoft Excel™)
4 i*arr
Notice bow the documentation has some words and phrases in a different color of text. The definitions of these words and the explanations of the phrases are hidden are hidden from view and can be made visible by clicking on the word or phrase. The phrases each have arrowheads next to them, which indicates that there is more to be seen by clicking on the phrase or arrowhead. These presentation methods have become standard for help files in online PC documentation. Many PC help files also have links to the software vendor’s Website, where more information, and more up-to-date information, can be found.Figure 12.3 shows the content of a reference guide which is just one type of user documentation. Other types of user documentation include quick reference guides, user’s guides, release descriptions, system administrator’s guides, and acceptance sign-offs (Table 12.2). A reference guide consists of an exhaustive list of a system’s functions and commands, usually in alphabetic order. Most online reference guides allow you to search by topic area or by typing in the first few letters of a keyword. Reference guides are very good for locating specific information (as in Figure 12.3);
Self-Instructional Material 2S3
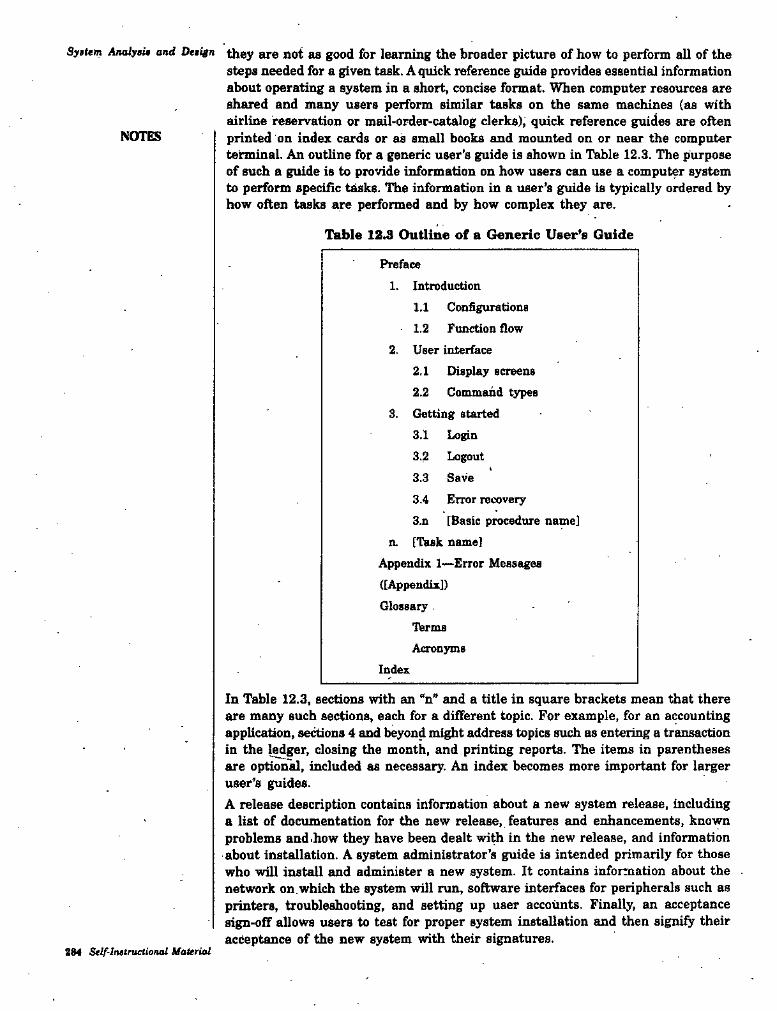
Syttem Analysu and DeiSgn they are not as good for le£immg the broader picture of how to perform aU of thesteps needed for a given task. A quick reference guide provides essential infonnation about operating a system in a short, concise format. When computer resources are shared and many users perform similar tasks on the same machines (as with airline reservation or mail-order-catalog clerks); quick reference guides are often printed on index cards or as small books and mounted on or near the computer terminal. An outline for a generic user's guide is shown in Table 12.3. The purpose of such a guide is to provide infonnation on how users can use a computer system to perform specific tasks. The information in a user’s guide is typically ordered by how often tasks are performed and by how complex they are.
NOTES
Table 12,3 Outline of a Generic User’s Guide
Preface1. Introduction
1.1 Configurations ' 1.2 Function flow
2. User interface2.1 Display screens2.2 Command 4i>es
S. Getting started3.1 Login3.2 Logout3.3 Save3.4 Error recovery3.n [Basic procedure name]
n. [Task name]Appendix 1—Error Messages ([Appendix])Glossary
TermsAcronyms
Index
In Table 12.3, sections with an “n” and a title in square brackets mean that there are many such sections, each for a different topic. For example, for an accounting application, sections 4 and beyond might address topics such as entering a transaction in the ledger, closing the month, and printing reports. The items in parentheses are option^, included as necessary. An index becomes more important for larger user’s guides.A release description contains information about a new system release, including a list of documentation for the new release, features and enhancements, known problems andihow they have been dealt wi^ in the new release, and information about installation. A system administrator’s guide is intended primarily for those who will install and administer a new system. It contains information about the . network on which the system will run, software interfaces for peripherals such as printers, troubleshooting, and setting up user accoimts. Finally, an acceptance sign-off allows users to test for proper system installation and then signify their acceptance of the new system with their signatures.
884 Stlf-lnitractional Uaterial

12.4.2 Preparing User DocumentationUser documentation, regardless of its content or intended audience, was once provided almost exclusively in big, bulky paper manuals, and it was out of date almost as soon as it was printed. Most documentation is now delivered online in hypertext format. Regardless of the format, user documentation is an upfront investment that should pay off in reduced training and consultation costs later. A future analyst, should consider the source of documentation, its quality, and whether its focus is on the information system’s functionality or on the tasks the system can be used to perform.The traditional source of user documentation has been the organization’s information systems (IS) department. Even though information systems departments have always provided some degree of user documentation, for much of the history • of data processing the primary focus of documentation was the system. In a traditional information systems environment, the user interacted with an analyst and computer operations staff for all of his or her computing needs. ’The analyst acted as intermediary’ between the user and all computing resources. Any reports or other output that went to the user was generated by the operations staff, based on a regular reporting sche :ule. Because users were consumers and providers of data and information, me c documentation developed during a traditional information systems development project was system documentation for the analysts and programmers who had to know how the system worked. Although some user documentation was generated, most documentation was intended to assist maintenance programmers who tended to the system for years after the analyst team had finished its work.In today’s end-user information systems environment, users interact directly with many computing resources, they have many options or querying capabilities from which to choose when using a system, and they are able to develop many local applications themselves. Analysts often serve as consultants for these local end- user applications. For end-user applications, the nature and purpose of documentation has changed from documentation intended for the maintenance programmer to documentation for the end user. Application-oriented documentation, whose purpose is to increase user understanding and use of the organization’s computing re.sources, has also come to be important. While some of this user-oriented documentation continues to be supplied by the information systems department, much of it now originates with vendors and with users themselves.
Implemenialion
NOTES
12.5 TRAINING AND SUPPORTING USERSTraining and support are two aspects of an organization’s computing infrastructure. The computing infrastructure is all of the resources and practices required to help people adequately use computer systems to do their primary work. It is analogous to the infrastructure of the water mains, electric power lines, streets, and bridges
• that form the foundation for providing essential services in a city. Infrastructure is one of four fundamental issues IS managers must address. It is suggested that trjuning and support are most important in the early stages of end-user computing growth and less so later on. The development and implementation of a general, and eventually, “seamless”, information technology infrastructure is a major demand on information technology. Thus, training and support are critical for the success of an information system. As the person whom the user holds responsible for the new system, the analysts on the project team must ensure that high-quality training and 'support are available.
Self-Instructional Material 285
System Analysis and Design Although training and support can be talked about as if they are two separatethings, in organizational practice, the distinction between the two is not all that clear, because the two sometimes overlap. After all, both deal with learning about computing.It is clear that support mechanisms are also a good way to provide training, especially for intermittent users of a system. Intermittent or occasional system users.are not interested in, nor would they profit from, typical user training methods. Intermittent users must be provided with “point-of-need support”—specific answers to specific questions at the time the answers are needed. A variety of mechanisms, such as the system interface itself and online help facilities, can be designed to provide both training and support at the same time.The value of support is often underestimated. Few organizations invest heavily in support staff, which can lead to users solving problems for themselves or somehow working around , them. Adequate user support may be essential for successful information system development, however. One study found that user satisfaction with support provided by the information systems department was the factor most closely related to overall satisfaction with user development of computer based applications.
NOTES
12.5.1 Training Information Systems UsersComputer use requires skills, and training people to use computer applications can be expensive for organizations. Training of all types is a major activity in many corporations, but information systems training is often neglected. Many organizations tend to underinvest in computing skills training. It is true that some organizations institutionalize high levels of information system training, but many others offer no systematic training at all.The type of training ueeded will vary by system type and user expertise. The list of potential topics from which an analyst will determine if training will be useful include the following:
• Use of the system (e^., how to enter a class registration request)• General computer concepts (e.g., computer files and how to copy them)• Information system concepts (e.g., batch processing)• Organizational concepts (e.g., FIFO inventory accounting)• System management (€.g., bow to request changes to a system)• System installation (e.g., how to reconcile current and new systems during
phased installation)As you can see from this partial list, many potential topics go beyond simply how to use the new system. It may be necessary for an analyst to develop training for users in other areas so that users will be ready, conceptually and psychologically, to use the new system. Some training, such as concept training, should begin early in the project because this training can assist in the “unfreezing”—helping users let go of long-established work procedures—element of the organizational change process. •
«Each element of training can be delivered in a variety of ways. Table 12.4 lists the most common training methods used by information system departments a few years ago.
26S Self-Instructional Material

ImplementationTable 12.4 Seven Common Methods for Computer Training
1. Tutorial—one person taught at a time
2. Course—-several people taught at a time
3- Computer-aided instruction
4. Interactive training manuals--combination of tutorials and computer-aided instruction
5. Resident expert
6. Software help components
7. External sources, such as vendors.
NOTES
Despite the importance and value of training, most of the methods listed in Table 12.4 are underutilized in many organizations. Users primarily rely on just one of these delivery modes; More often than not, users turn to the resident expert and to fellow users for training. Users are more likely to turn to local exi iita for help than to the organization’iijchnical support staff because the local expert understands both the users’ primary work and the computer systems they use. Given their dependence on fellow users for training, it should not be surprising that end users describe their most common mode of computer training as “selftraining”, Self-training has been found to be associated with particular seta of user skills: using application development software, using packaged application software, data communication, using hardware, using operating systems, and graphics skills. The last four sets of skills are also highly associated with company-provided training. Some areas of training might best be accomplished by centralized, company- provided training, whereas other areas might be more amenable -to self-training. One conclusion from the experience'with user raining methods is that an effective strategy for training on- a new system is to first train a few key users and then organize training programs and support mechanisms that involve these users to provide further training, both formal and on demand. Often, training is most effective if the analysts customize it to particular user groups, and the lead trainers from these groups are in the best position to provide this training to their other colleagues.Although individualized training is expensive and time-consuming, technological advances and decreasing costs have made this type, of training more feasible. Similarly, the number of training modes used by information systems departments today has increased dramatically beyond what is listed in Table 12.4. Training modes now include videos, interactive television for remote training, multimedia training, online tutorials, and electronic performance support systems (EPSSs). These maybe delivered via videotapes, CD-ROMs, company intranets, and the Internet.EPSSs are online help systems that go beyond simply providing help—they embed training directly into a software package. An EPSS may take on one.or more forms: It can be an online tutorial, provide hypertext-based access to context-sensitive reference material, or consist of an expert system shell that acts as a coach. The main idea behind the development of an EPSS is that the user never has to leave the application to get the benefits of training. Users learn a new system or unfamiliar features at their own pace and on their own machines, without having to lose work time to remote group training sessions. Furthermore, tins learning is on demand;
Self-Inelructionai Material 187
System Analysis and Design g ^ggj. completes the EPSS when he or she is most motivated to learn. EPSS issometimes referred to as “just-in-time knowledge.” One example of an EPSS with which you may be familiar is Microsoft’s Office Assistant. Office Assistants are animated characters that come up on top of such applications as Excel and Word, The user asks the Office Assistant a question and the Office Assistant returns an answer, providing educational information, such as graphics, examples, and procedures, as well as hypertext nodes for jumping to related help topics. Microsoft’s Office Assistants communicate with the application you are running to see where you are so you can determine, by reading the context-sensitive information, if what you want to do is possible from your present location. Some EPSS environments actually walk the user step-by-step through the task, coaching the user on what to do or allowing the user to get additional online assistance.TVaining for information systems is increasingly being made available both over company intranets and over the Internet. Individual companies may prepare the training and make it available with the help of vendors who convert the content to work on the Internet. Alternatively, an organization may prepare its own training content using course-authoring software. Still a third alternative is to access training provided by third-party vendors, Accessing training over the Internet can i’ve companies a huge amount of money each year in training costs, especially when it comes to information technology training. Instead of having to send personnel off-site for weeks and pay their travel expenses, companies can gain access to Internet training for lower cost and personnel can get the training at their desks.As both training and support for computing are increasingly able to be delivered online iri modules, with some embedded in software packages and applications (as is the case for EPSS), the already blurred distinction between training and support blurs even more. Some of the issues most particular to computer user support are examined in the next section.
NOTES
12.5.2 Supporting Information Systems UsersHistorically, computing support for users has been provided in one of a few forms: on paper, through online versions of paper-based support, by third-party vendors, or by other people who work for the same organization. As we stated earlier, support, whatever its form, has often been inadequate for users’ needs. Yet users consider support to be extremely important.As computing spread throughout the organization, especially with the advent of personal computers, the need for support increased as more and more employees came to rely on computing to do their jobs. As organizations moved to client/server architectures, their need for support increased even more, and organizations began to rely more and more on vendor support. This increased need for support came in part from the lack of standards governing client/server products and the resulting need to make equipment and software from different vendors compatible. Vendors are able to provide the necessary support, but as they have shifted their offerings from primarily expensive mainframe packages to inexpensive off-the-shelf software, they find they can no longer bear the cost of providing the support for free. Most vendors now charge for support, and many have instituted 900 numbers or sell customers unlimited support for a given monthly or annual charge.
286 Stlf lnstructionai Material
ImplemenlalionAutomating SupportIn an attempt to cut the costs of providing support and to catch up with the demand for additional support services, vendors have automated many of their support oiTerings. Online support forums provide users access to information on new releases, bugs, and tips for more effective usage. Forums are offered over the Internet or over company intranets. On-demand fax allows users to order support information through an 800 number and receiv’ that information instantly over their fax machines. Finally, voice-response systems allow users to navigate option menus that lead to prerecorded messages about usage, problems, and workarounds. Organizations have established similar support mechanisms for systems developed or purchased by the organization. Internal e-mail, group support systems, and ofBce automation can be used to support such capabilities within an organization. Vendors may offer support that enables users to access a vendor’s knowledge bases, including electronic support services, a single point of contact, and priority access to vendor support personnel. Product knowledge bases include all of the technical and support information about vendor products and provide additional information for on-site personnel to use in solving problems. Vendors routinely supply complete user and technical documentation over the Internet, including periodic updates, so that a user oi^anization can provide this library of documentation, bug reports, workaround notices, and notes on undocumented features online to all internal users. Electronic support services include all of the vendor support services discussed earlier, but are tailored specifically for the corporation. The single point of contact is a system engineer who is often based on site and serves as a liaison between the corporation and the vendor. Finally, priority access means that corporate workers can always get help via telephone or e-mail from a person at the vendor company, usually within a prespecified response time of 4 hours or less.Such vendor-enhanced support is especially appropriate in organizations where a wide variety of a particular vendor’s products is in use or where most in-house application development either uses the vendor’s products as components of the larger system or where the vendor’s products are themselves used as the basis for applications. An example of the former would be the case where an organization has set up a client/server architecture based on a particular vendor’s SQL server and APIs. Which applications are developed in-house to run under the client/server architecture depends heavily on the server and APIs, and direct vendor support dealing with problems in these components would be very helpful to the enterprise information systems staff. An example of the second would include order entry and inventory control application systems developed using Microsoft’s Access or Excel. In this case, the system developers and users, who are sometimes the same people for such package-based applications, can benefit considerably from directly questioning vendor representatives about their products.Providing Support Through a Help Desk. Whether assisted by vendors or going it alone, the center of support activities for a specific information system in many organizations is the help desk. A help desk is an information systems department function and is staffed by IS personnel. The help desk is the first place users should call when they need assistance with an information system. The help desk staff either deals with the users questions or refers the users to the most appropriate person.
NOTES
Self-Inatructionol Material 389

System Analysts and Design for many years, a help desk was the dumping ground for people IS managers didnot know what else to do with. Tiirnover rates were high because the help desk was sometimes little more than a complaints department, the pay was low, and burnout rates were high. In today’s information-systeros-dependent enterprises, however, this situation has changed. Help desks are gaining new respect as management comes to appreciate the special combination of technical skills and people skills needed to make good help desk staffers. In fact, a recent survey reveals that the top two valued skills for help desk personnel are related to communication and customer service.Help desk personnel need to be good at communicating with users, listening to their problems, and intelligently communicating potential solutions. These personnel also need to understand the technology they are helping users with. It is crucial, however, that help desk personnel know when new systems and releases are being implemented and when users are being trained for new systems. Help desk personnel themselves should be well trained on new systems. One sure recipe for disaster is to train users on new systems but not train the help desk personnel these same users will turn to for their support needs.
.NOTES
12.5.3 Support Issues for the Analyst to ConsiderSupport is more than just answering user questions about how to use a system to perform a particular task or about the system’s functionality. Support also consists of such tasks as providing for recovery and backup disaster recovery, and PC maintenance; writing newsletters and offering other types of proactive information sharing; and setting up user groups. It is the responsibility of analysts for a new
■ system to be sure that all forms of support are in place before the system is installed.For medium to large organizations with active information systems functions, many of these issues are dealt with centrally. For example, users may be provided with backup software by the central information systems unit and a schedule for routine backup. Policies may also be in place for initiating recovery procedures in case of system failure. Similarly, disaster recovery plana are almost always established by the central IS unit. Information systems personnel in medium-to-large organizations are also routinely responsible for PC maintenance, because the PCs belong to the enterprise. IS unit specialists might also be in charge of composing and transmitting newsletters or overseeing automated bulletin boards and organizing user groups. When all of these (and more) services are provided by central IS, an analyst must follow the proper procedures to include any new system and its users in the lists of those to whom support is provided. An analyst must design training for the support staff on the new system, and he/she must make sure that system ddcumentation will be available to it. An analyst must make the support staff aware of the installation schedule, and he/she must keep these people informed as the system evolves. Similarly, any new hardware and off-the-shelf software has to be registered with the central IS authorities.When there is no official IS support function to provide support services, an analyst must come up with a creative plan to provide as many services as possible. He/she may has to write backup and recovery procedures and schedules, and the users’ departments may have to purchase and be responsible for the maintenance
290 Self-Inatruvtional MaUriai
Implementationof their hardware. In some cases, software and hardware maintenance may have to be outsourced to .vendors or other capable professionals. In such situations, user interaction and information dissemination may have to be more informal than formal: Informal user groups may meet oyer lunch or over a coffeepot rather than in ofticially formed and sanctioned forums. NOTES
12.6 PROJECT CLOSEDOWNYou are familiar with the various phases of project management, from project initiation to closing down the project. If you are the project manager and you have successfully guided your project through all of the phase.s of the systems development lifecycle presented so far in this book, you are now ready to close down your project. Although the maintenance phase is just about to begin, the development project itself is over. As you will see in the next chapter, maintenance can be thought of as a series of smaller development projects, each with its own series of project management phases.Your first task in closing down the project involves many different activities, from dealing with project personnel to planning a celebration of the project’s ending. You will likely have to evaluate your team members, re-assign most to other projects, and perhaps terminate others. As project manager, you will also have to notify all .of the affected parties that the development project is ending and that you are now switching to maintenance mode.Your second task is to conduct postproject reviews with both your management and your customers. In some organizations, these postproject reviews will follow formal procedures and may involve internal or EDP (electronic data processing) auditors. The point of a project review is to critique the project, its methods, its deliverables, and its management. You can learn many lessons to improve future projects from a thorough postproject review.The third m^or task in project closedown is closing out the customer contract. Any contract that has been in effect between you and your customers during the project (or as the basis for the- project) must be completed, typically through the consent of all contractually involved parties. This may involve a formal “signing- ofF by the clients stating that your work is complete and acceptable. T^e maintenance phase will typically be covered under new contractual agreements. If the customer is of an outside organization, an' analyst will also likely negotiate a separate support agreement.The job of an analyst as a member of the development team, on this particijiar project ends during project closedown. He/she will likely be reassigned to another project dealing with some other organizational problem. Maintenance on this new
.system will begin and continue without him/her.For completing our consideration of the SDLC, however, we will cover the maintenance and review in last unit.
Self-Inttriictional Material 291

System 'Analysis and Design
STUDENT ACTIVITY 12.2
1. What is documentation? Describe the general structure of documentation.
2. Write a short note on project closedown.
292 Self-lnetruclional Material

ImplementationSUMMARY
Installation is the organizational process of changing over from the current information system to a nev? one.Direct installation is changing over from the old information system to a new one by turning off the old system when the new one is turned on. Parallel installation is running the old information system and the new one at the same time until management decides the old system- can be turned off.Single-location installation is trying out a new information system at one site and using the experience to decide if and how the new system should be deployed throughout the organization.Phased installation is changing from the old information system to the new one incrementally, starting with one or a few functional components and then gradually extending the installation to cover the whole new system. System documentation is detailed information about a system’s design specifications, its internal workings, and its functionality.User documentation is written or other visual information, about an application system, how it works, and how to use it.Internal documentation is system documentation that is part of the program source code or is generated at Compile time.External documentation is system documentation that includes the outcome of structured diagramming techniques, such as data flow and entity-relationship diagrams.Support is providing ongoing educational and problem-solving assistance to information system users. Support material and jobs must be designed along with the associated information system.Computing infrastructure is all the resources and practices required to help people adequately use computer systems to do their, primary work. Electronic perfonuance support system (EP8S) is component of a software package or application in which training and educational information are embedded. It may include a tutorial, expert system, and hypertext jumps to reference materials. .Help desk is a single point of contact for all user inquiries and problems about a particular information system or for all users in a particular department.
NOTES
*•
TEST YOURSELFAnswer the following questions:
1. What is installation? Explain in brief.2. What is system documentation? Explain in brief.3. Why training and support are critical for the success of an information system?4. Describe the various ways software vendors provide customer support.5. What are the four approache-s to installation? Compare the approaches with
reference to cost and risks. How does an organization decide which approach to use?
6. What is the difference between system documentation and user documentation?7. List the topics covered during training.8. What factors are important to successful implementation-efforts? Explain in brief.
Self-Instructional Material 2ft3
System Analysis and Design 9. State True or False:(i) The installation plan lays out a strategy for moving &om the old system
to the new, from, the beginning to the end of the process.(it) The deliverables from user training plan are classes and tutorials,
(til) Direct installation is not the changing over from the old information system to a new one by turning off the old system when the new one is turned on.
(to) Planning for installation may begin as early as the analysis of the organization supported,by the system.
(u) In one' sense, every systems development project is unique and will generate its own unique documentation.
(oi) User documentation does not consist of written or other visual information about an application system, how it works, and how to use it.
(t)«) Training and support are two aspects on ah organization's computing infrastructure.
(out) The type of training needed will vary by system type and user expertise.
NOTES
10. Fill in the blanks:(i) The major activities in system implementation are
documentation, training and support. «(ii) Installation includes installing the
is running the old information system and the new oneat the same-time until management decides the old system can be turned off.
(iv) Of special interest in the installation process is the ........................................... is detailed information about a system’s design speciScations,its internal working, and its functionality.
is all of the resources and practices required to help people adequately use computer systems to do their primary work....................... ia.a single point of contact for all user inquiries andproblems about a particular information system or for all users in a particular department.
at central and user sites.(.Hi)
(0)
(w) The
(vit)
.................... is more than just answering user questions about how touse aaystem to perform a particular task or about the system’s functionality.
(oiii)
ANSWERS
Test Yourself9. State True or False:
(i) True (tii) False
(t>) True (vii) True
10. Fill in the blanks:({) installation
(Hi) Parallel installation (u) System documentation
(Kti) Help desk
(h) TrueTrueFalseTrue
(m)(ut)
(vHi)
(ii) system (hardware and software) conversion of data computing infrastructure Support
(iv)(ui)
(viii)
294 Stlf-Instnictianal Material
Maintenance and ReviewCHAPTER
NOTES
MAINTENANCE AND REVIEW
LEARNING OBJECTIVES13.1 Introduction13.2 Maintaining Information Systems
13.2.1 The Process of Maintaining Information Systems13.2.2 Deliverables and Outcomes
13.3 Conducting Systems Maintenance13.3.1 Types of Maintenance13.3.2 The Cost of Maintenance
13-4 Review of System Performance (Systems Audit)13.4.1 System Performance13.4.2 Cost/benefits13.4.3 Quality Assurance
13.4.4 Recommendations 13.5 System Audit Report
13.1 INTRODUCTIONIn this unit, we discuss systems maintenance, the largest systems development expenditure for many organizations. In fact, more programmers today work on maintenance activities than work on new development. Your first job after graduation/ post ^aduation may very well be as a maintenance programmer/analyst. This
' disproportionate distribution of maintenance programmers is interesting because software does not wear out in a physical way as do buildings and machines, There is no single reason why software is maintained; however, most reasoiw relate to a desire to evolve system functionality in order to overcome internal processing errors or to better support changing business requirements. Thus, maintenance is a fact of life for most systems. It means that maintenance can begin soon after the-. system is installed. As with the initial design of a system, maintenance activities are not limited only to software changes, but include changes to hardware and business procedures. A question many persons have about maintenance relates to how long organizations should maintain a system. Five years? Ten years? Longer? This is not an easy question to answer, but it is most often an issue of economics. In other words, at what point of time does it make financial sense to discontinue evolving an older system and build or purchase a new one? The focus of a great deal of upper IS (Information Systems) management attention is devoted to assessing the trade-offs between maintenance and new development. In this unit, we will provide
Seif-In»tractianal Material 206
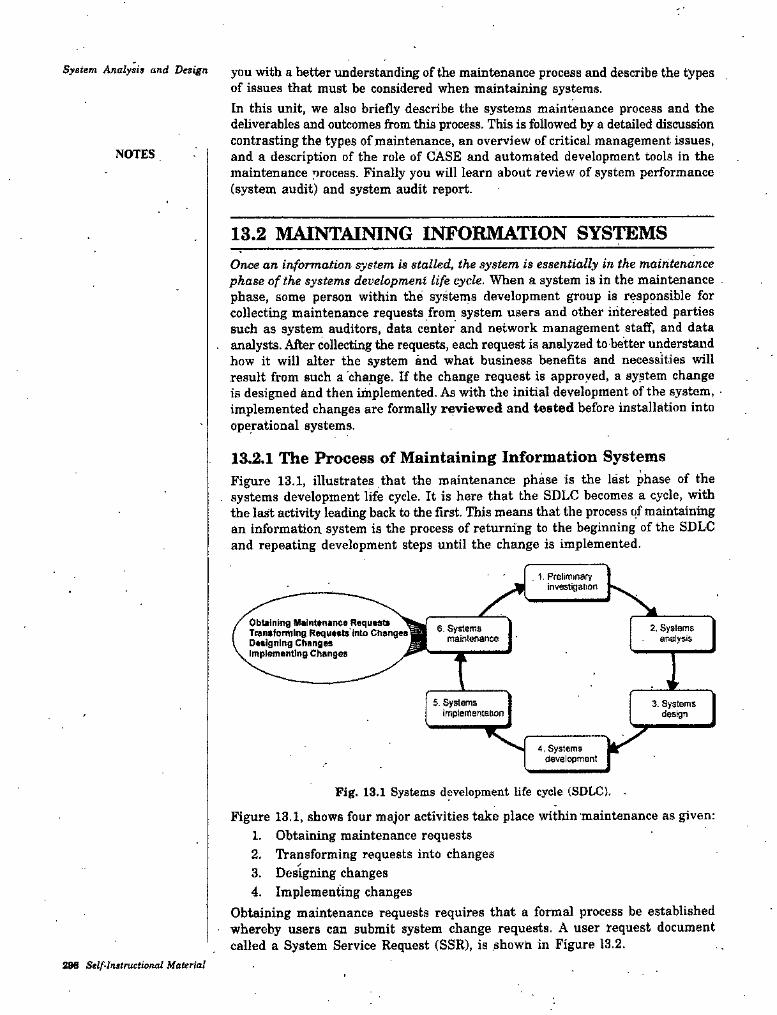
System Analyst* and Drs^n you with a better understanding of the maintenance process and describe the types of issues that must be considered when maintaining systems.In this unit, we also briefly describe the systems maintenance process and the deliverables and outcomes &om this process. This is followed by a detailed discussion contrasting the types of maintenance, an overview of critical management issues, and a description of the role of CASE and automated development tools in the maintenance process. Finally you will learn about review of system performance (system audit) and system audit report.
NOTES
13.2 MAINTAINING INFORMATION SYSTEMSOnce an information system is stalled, the system is essentially in the maintenance phase of the systems development life cycle. When a system is in the maintenance . phase, some person within the systems development group is responsible for collecting maintenance requests from system users and other interested parties such as system auditors, data center and network management staff, and data
. analysts. After collecting tiie requests, each request is analyzed to better understand how it will alter the system and what business benefits and necessities will result from such a change. If the change request is approyed, a system change is designed and then implemented. As with the initial development of the system, • implemented changes are formally reviewed and tested before installation into operational systems.
13.2.1 The Process of Maintaining Information SystemsFigure 13.1, illustrates that the maintenance phase is the last phase of the
. systems development life cycle. It is here that the SDLC becomes a cycle, with the last activity leading back to the first. This means that the process of maintaining an information, system is the process of returning to the beginning of the SDLC and repeating development steps until the change is implemented.
. 1. Prelimnafy investigalion
Obtaining MalnttnanceRequtst* ^ Traniforming Raquaats'into Changaa Dnignlng Changes implefflentJng Changes J
2. Systems analysis
6. Systems mainlenance
T5. Systems
Implemeniaiion3. Systems
design
4. Systems d^elopment
Fig. 13.1 Systems development life cycle (SDLC). -
Figure 13.1, shows four major activities take place within maintenance as given:1. Obtaining maintenance requests2. Transforming requests into changes✓3. Designing changes4. Implementing changes
Obtaining maintenance requests requires that a formal process be established whereby users can submit system change requests. A user request document called a System Service Request (SSR), is shown in Figure 13.2.
2H Stlf-liutructional Material
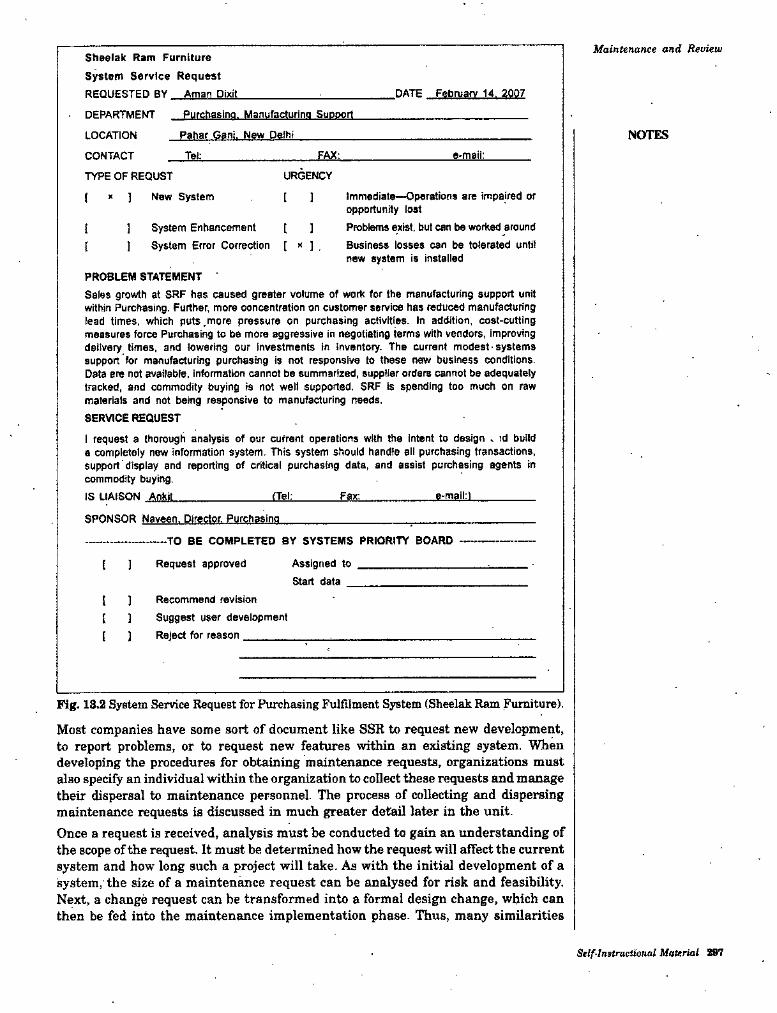
Maintenance and ReviewStieelak Ram Furniture System Service Request REQUESTED BY Aman Dixit DATE February 14. 2007
• DEPARTMENT PurehasinQ- Manufacturing Support
NOTESPabar Gani. New DelhiLOCATION
e-mail:CONTACT Tei: FAX:
TYPE OF REQUST URGENCY
Immediate—Operations are impaired or opportunity lostProblems exist, but can be worked around Business losses can be tolerated until new system Is Installed
[ ]( X ] New System
[ ] System Enhancement [ ]I System Error Correction [ * ] ,[
PROBLEM STATEMENTSales growth at SRF has caused greater volume of work for the manufacturing support unit within Purchasing. Further, more concentration on customer service has reduced manufacturing lead times, which puts .more pressure on purchasing activities. In addition, cost-cutting measures force Purchasirtg to be more aggressive In negotiating terms with vendors, Improving delivery times, and lowering our investments in inventory. The current modest systems support for manufacturing purchasing is not responsive to these new business conditions. Data are not available, information cannot be summarized, supplier ordem cannot be adequately tracked, and commodity buying is not well supported. SRF is spending too much on raw materials and not being responsive to manufacturing needs.SERVICE REQUEST
I request a thorough analysis of our current operations wrtth the Intent to design . id build a completely new information system. This system should handle all purchasing transactions, support display and reporting of critical purchasing data, and assist purchasing agents in commodity buying.IS LIAISON Ankit e-mail:!<Tel: Fax:
SPONSOR Naveen. Director. Purchasing
TO BE COMPLETED BY SYSTEMS PRIORITY BOARD
Request approved Assigned to Start data
( ]
Recommend revision Suggest user devel^ment Reject for reason_______
I ][ ]( ]
Fig. 13.2 System Service Request for Purchasing Fulfilment System (Sheelak Ram Furniture).
Most companies have some sort of document like SSR to request new development, to report problems, or to request new features within an existing system. When developing the procedures for obtaining maintenance requests, organizations must also speciiy an individual within the organization to collect these requests and manage their dispersal to maintenance personnel. The process of collecting and dispersing maintenance requests is discussed in much greater detail later in the unit.Once a request is received, analysis must be conducted to gain an understanding of the scope of the request. It must be determined how the request will affect the current system and how long such a project will take. As with the initial development of a system, the size of a maintenance request can be analysed for risk and feasibility. Next, a change request can be transformed into a formal design change, which can then be fed into the maintensuice implementation phase. Thus, many similarities
Self-Instructional Material 297
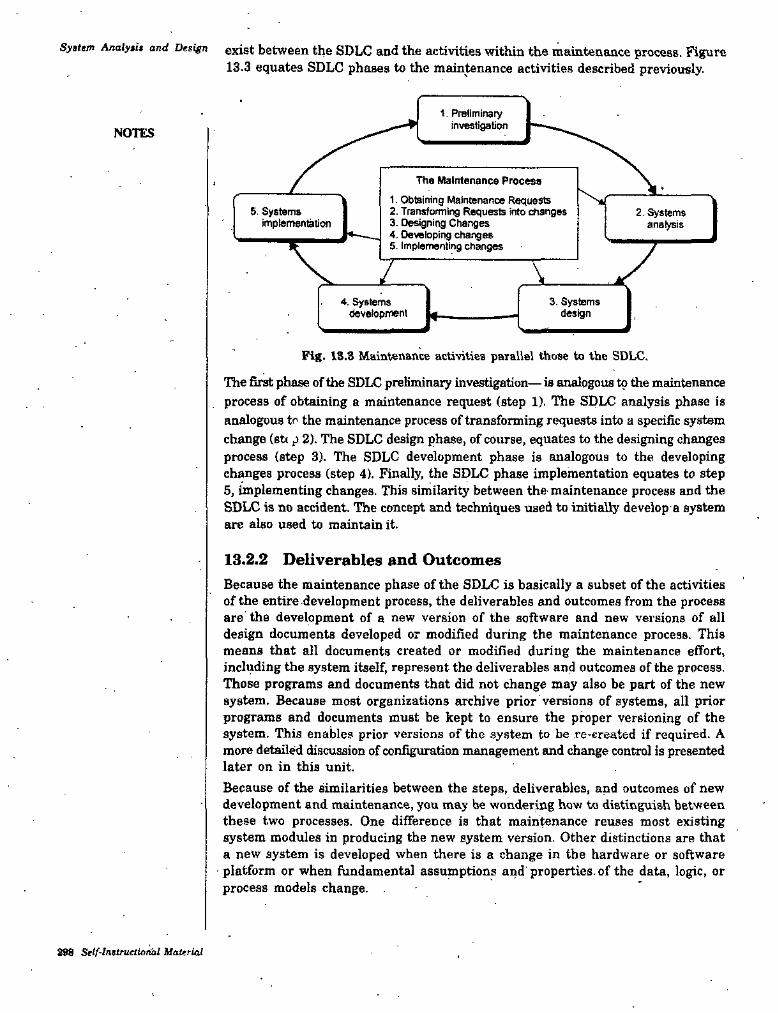
Syttem Analy$u and Dtsign exUt between the SDLC and the activities within the maintenance process. Figure13.3 equates SDLC phases to the maintenance activities described previously.
1. Preliminary investigationNOTES
The Maintenance Process
1. Obtaining Maintenance Requests2. Transforming Requests into changes3. Deigning Changes4. Oeveioping changes5. implementing changes
L5. Systems implerttentatiOT
2. Systems anelysis
V3. Systems
design4. Systems
devetopmeni
Fig. 13.3 Maintenance activities parailei those to the SDLC.
The firat phase of the SDLC preliminary investigation— is analogous to the maintenance process of obtaining a maintenance request (step 1). The SDLC analysis phase is analogous tr the maintenance process of transforming requests into a specific system change (eti p 2). The SDLC design phase, of course, equates to the designing changes process (step 3). The SDLC development phase is analogous to the developing changes process (step 4). Finally, the SDLC phase implementation equates to step 5, implementing changes. This similariQ’ between the maintenance process and the SDLC is no accident. The concept and techniques used to initially develop a system are also used to maintain it.
13.2.2 Deliverables and OutcomesBecause the maintenance phase of the SDLC is basically a subset of the activities of the entire development process, the deliverables and outcomes from the process are the development of a new version of the software and new versions of all design documents developed or modified during the maintenance process. This means that all documents created or modified during the maintenance effort, including the system itself, represent the deliverables and outcomes of the process. Those programs and documents that did not change may also be part of the new system. Because most organizations archive prior versions of systems, all prior programs and documents must be kept to ensure the proper versioning of the system. This enables prior versions of the system to be re-ereated if required. A more detailed discussion of configuration management and change control is presented later on in this unit.Because of the similarities between the steps, deliverables, and outcomes of new development and maintenance, you may be wondering how to distinguish between these two processes. One difference is that maintenance reuses most existing system modules in producing the new system version. Other distinctions are that a new system is developed when there is a change in the hardware or software platform or when fundamental assumptions and properties, of the data, logic, or process models change. .
298 Self-lnstruetiondl UaUrial

Maintenance and Review
STUDENT ACTIVITY 13.1
1. What are the inputs to maintenance phase and what are the deliverables and outcomes of the process?
2. What are the steps involved in the maintenance process? Is there any similarity between the phases of. SDLC aind the steps in the maintenance process?
N
Self-Instructional Material 2S9
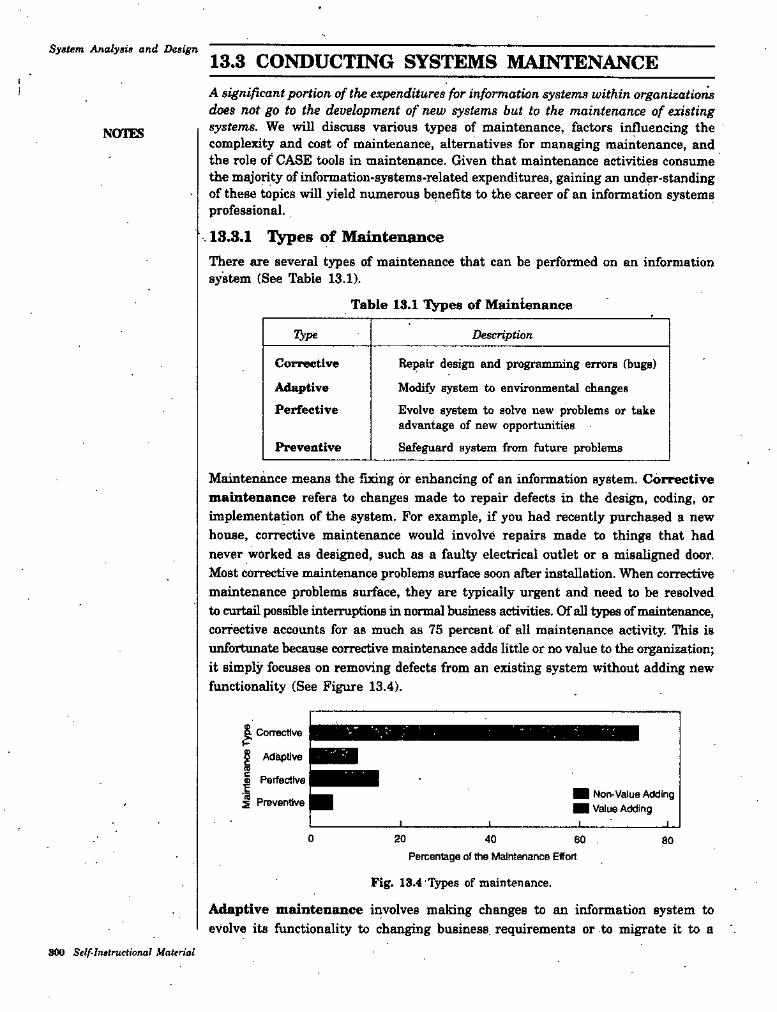
System Analysis and Design13.3 CONDUCTING SYSTEMS MAINTENANCEA significant portion of the expenditures for information systems within organizations does not go to the development of new systems but to the maintenance of existing systems. We will discuss various types of maintenance, factors influencing the complexity and cost of maintenance, alternatives for managing maintenance, and the role of CASE tools in maintenance. Given that maintenance activities consume the mt^onty of information-systems>related expenditures, gaining an under-standing of these topics will yield numerous benefits to the career of an information systems professional.
. 13.3.1 lypes of MaintenanceThere are several types of maintenance that can be performed on an information system (See Table 13.1).
NOTES
Table 13.1 types of Maintenance
Type Description
Corrective Repair design and programming errors (bugs)Modify system to environmental changesEvolve system to solve new problems or take advantage of new opportunitiesSafeguard system from future problems
AdaptivePerfective
Preventive
Maintenance means the fbdng or enhancing of an information system. Con^tive maintenance refers to changes made to repair defects in the design, coding, or implementation of the system. For example, if you had recently purchased a new house, corrective maintenance would involve repairs made to things that had never worked as designed, such as a faulty electrical outlet or a misaligned door. Most corrective maintenance problems surface soon after installation. When corrective maintenance problems surface, they are typically urgent and need to be resolved to curtail possible interruptions in normal business activities. Of all types of maintenance, corrective accounts for as much as 75 percent of all maintenance activity. This is unfortunate because corrective maintenance adds little or no value to the organization; it simply focuses on removing defects from an existing system without adding new functionality (See Figure 13.4).rE Corrective
Ad^tive
1 PerfectiveNoivValue Adding \^ue Adding
S2 Preventive
0 20 40 60 . 80Percentage o! the Maintenance Effort
Fig. 18.4 lypes of maintenance.
Adaptive maintenance involves making changes to an information system to evolve its functionality to changing business requirements or to migrate it to a
S80 Self-I’tstructional Material
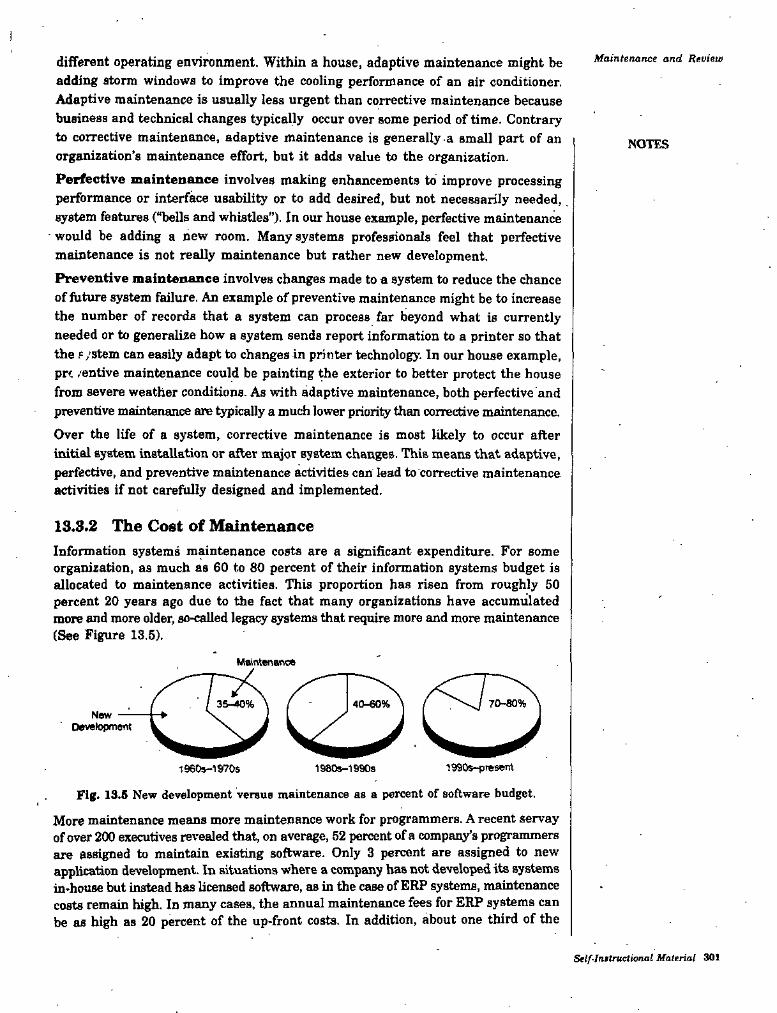
Maintenance and Reviewdifferent operating environment. Within a house, adaptive maintenance might be adding storm windows to improve the cooling performance of an air conditioner Adaptive maintenance is usually less urgent than corrective maintenance because business and technical changes typically occur over some period of time. Contrary to corrective maintenance, adaptive maintenance is generally a small part of an organization’s maintenance effort, but it adds value to the organization.Perfective maintenance involves making enhancements to improve processing performance or interface usability or to add desired, but not necessarily needed, system features (“bells and whistles”). In our house example, perfective maintenance
' would be adding a new room. Many systems professionals feel that perfective maintenance is not really maintenance but rather new development.Preventive maintenance involves changes made to a system to reduce the chance of futime system failure. An example of preventive maintenance might be to increase the number of records that a system can process far beyond what is currently needed or to generalize how a system sends report information to a printer so that ^e f /stem can easily adapt to changes in printer technology. In our house example, prc ,'entive maintenance could be painting the exterior to better protect the house from severe weather conditions. As with adaptive maintenance, both perfective and preventive maintenance are typicaiUy a much lower priority than corrective maintenance.Over the life of a system, corrective maintenance is most likely to occur after initial system installation or after major system changes. This means that adaptive, perfective, and preventive maintenance activities can lead to corrective maintenance activities if not carefully designed and implemented.
NOTiS
13.3.2 The Cost of MaintenanceInformation systems maintenance costs are a significant expenditure. For some organization, as much as 60 to 80 percent of their information systems budget is allocated to maintenance activities. This proportion has risen from roughly 50 percent 20 years ago due to the fact that many organizations have accumulated more and more older, so-called legacy systems that require more and more maintenance (See Figure 13.5).
Maif^enance
70-80%35-40% 40-60%New *
Oevefopment
1990s-pT»serrt
Fig. 13.6 New development versus maintenance as a percent of software budget.
More maintenance means more maintenance work for programmers. A recent servay of over 200 executives revealed ftiat, on average, 52 percent of a company’s programmers
assigned to maintain existing software. Only 3 percent are assigned to new application development. In situations where a company has not developed its systems in-house but instead has licensed software, as in the case of ERP systems, maintenance costs remain high. In many cases, the annual maintenance fees for ERP systems can be as high as 20 percent of the up-front costs. In addition, about one third of the
196CW-19705 1980S-1990S
are
Self-Initructional Material 301
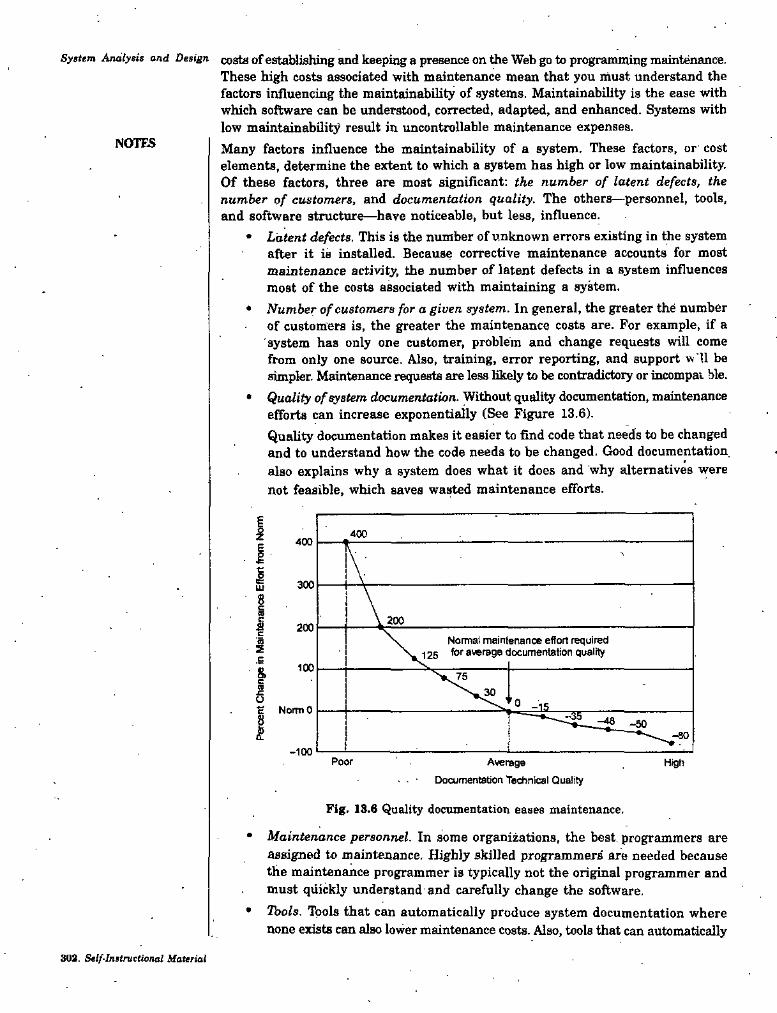
System A/uilysis and Design costs of establishing and keeping a presence on the Web go to progranuning maintenance.These high costs associated with maintenance mean that you must understand the factors influencing the maintainability of systems. Maintainability is the ease with which software can be understood, corrected, adapted, and enhanced. Systems with low maintainability result in uncontrollable maintenance expenses.Many factors influence the maintainability of a system. These factors, or cost elements, determine the extent to which a system has high or low maintainability. Of these factors, three are moat signiflcant: tJie number of latent defects, the number of customers, and documentation quality. The others—personnel, tools, and software structure—have noticeable, but less, influence.
• Latent defects. This is the number of unknown errors existing in the system after it is installed. Because corrective maintenance accounts for most maintenance activity, the number of latent defects in a system influences most of the costs associated with maintaining a system.
• JVumfcerof customers/or a gjucn system. In general, the greater the number of customers is, the greater the maintenance costs are. For example, if a system has only one customer, problem and change requests will come from only one source. Also, training, error reporting, and support v- 'll be simpler. Maintenance requests are less likely to be contradictory or incompat ble.
• Quality of system documentation. Without quality documentation, maintenance efforts can increase exponentially (See Figure 13.6).Quality documentation makes it easier to find code that needs to be changed and to understand how the code needs to be changed. Ckiod documentation also explains why a system does what it does and why alternatives were not feasible, which saves wasted maintenance efforts.
NOTES
400400
ILU 3008§
200cNormal mainteiunce effort required for average documentatiort quality
as.s too&ScOE NormO
-100Poor Average
. . Documentation Technical QualityHigh
Fig. 13.6 Quality documentation eases maintenance.
Maintenance personnel. In some organizations, the best programmers are assigned to maintenance. Highly skilled programmers are needed because the maintenance programmer is typically not the original programmer and must quickly understand and carefully change the software.Tools. Tools that can automatically produce system documentation where none exists can also lower maintenance costs. Also, tools that can automatically
302. S^lf•Instructional Material
MainteTMnct and Reviewgenerate new code based on system specification changes can dramatically reduce maintenance time and costs.
• Vfell-structured programs. Well-designed programs are easier to understand and fix.
Since the mid-1990s, many organizations have taken a new approach to managing maintenance costs. Rather than develop custom systems internally or through contractors, they have chosen to buy packaged application software. Although vendors of packaged software charge an annual maintenance fee for updates, these charges are more predictable and lower than for custom-developed systems. However, internal maintenance work may still be necessary when using packages. One major maintenance task is to make the packaged software compatible with other packages and internally developed systems with which it must cooperate. When new releases of the purchased pack^es appear, maintenance may be required to make all the packages continue to share and exchange data. Some companies are minimizing this effort by buying comprehensive packages, such as ERP packages, which provide information services for a wide range of oi^anizational functions (from human resources to accounting, manufacturing, and sales and marketing). Although the initial costs to install such ERP packages can be significant, they promise great potential for drastically reducing system maintenance costs.
NOTES
13.4 REVIEW OF SYSTEM PERFORMANCE (SYSTEMS AUDIT)
The S3rstem8 audit is an investigation to review the performance of an operational system; to compare actual with planned performance; to veiify that the stated objectives of the system are still valid in the present environment; and to evaluate the achievement of these objectives.This investigation and evaluation may be carried out; by a systems analyst, preferably one who was not responsible for the original design; by representatives of users, computer operations, or internal auditors; or by a team composed of these representativea A knowledge of systems design is essential for analysis of findings.The initial review should take place when the system has had time to settle down, when any additional assistance by systems analysts and temporary staff is no longer required, when both equipment and people are operating satisfactorily, and before any major changes are made to the original design specification. This is unlikely to be less tb{Lo three months after changeover. Ihe initial systems audit provides the opportunity to check whether the objectives and benefits forecast in the feasibility study have been, achieved. Subsequent audits, carried out as part of regular reviews of systems (perhaps annually) will be concerned with the continued achievement of benefits, any deviations from the master system specification, and opportunities for improvement.The detailed tasks to be carried for this investigation are based on a checklist of the contents required for the Systems Audit Report. They are summarised under two main headings:
• system performance• cost/benefit.
It must be emphasised that the over-riding reason for an audit is to verify that the stated objectives of the system are being achieved, or that they are still valid in
Self-tnetruclionai Material 803
System Analysis and Design the present environment. These objectives (for which management authorised theuse of resources in the first place) must be established before attempting to evaluate the system performance. The objectives and cost/benefits will be found in the management report of the feasibility study, and in subsequent reports. The expected performance of the system, in broad terms, should also be found there, but the System. Specification should be referred to for details.NOTES
13.4.1 Sjnstem PerformanceThe investigation should start by making contact with the manager of the user departments, not only to deal vrtth the normal formalities but, in particular, to establish :
• whether or not the manager is satisfied with the performance of the system, and if not, what are the reasons;
• the use being made of the output reports; whether they are accurate; if they are timely; whether they contain insufficient or unwanted information;
• the operational aspects: whether the procedures are causing problems and if any changes have been made;
• effectiveness: if there are many error reports; whether there are inaccuracies not being reported; turnround and response times; the level of equipment utilization, reliability and service;
• changes in volumes of data, information, paper handling and their effect on the system;
• amendment requests, whether they have been implemented correctly whether there are any pending.
The above facts should also be. established in more detail, from other levels of user staff employing the procedures.When the personal interviews have been concluded,-the auditor should quantify actual performance to establish any deviations from the planned performance, together with explanations: this is the main objective of the audit. Deviations, which may be classed as avoidable, can arise from incorrect estimates, for example:
• clerical and computer procedure timings;• data volumes and growth rates;• staffing levels;• error rates.
13.4.2 Costs/BenefitsHere the actual costs and benefits are compared with those planned showing any deviation from expectations. The causes of any deviation of costs or benefits from those planned should be established and stated. These may arise from the following:
• unplanned pay increases;• extra staffing, retention of initial temporary staff, inaccurate estimates;• changed methods of computer charging;• inaccurate estimates of data volume and timing;• authorised, or unauthorised changes to procedures and documents.
Deviations may be either advantageous or disadvantageous, and all details should
304 Seif-Instructional Material
be reported. An increased cost may, of course, produce a better service, perhaps giving higher value.Other types of deviation usually environmental, arising from operational, trading or statutory changes, eg:
• pay methods, accounting policy, new equipment and techniques;• production and selling methods;■ product and market standardisation or diversification;• organisational expansion or contraction;• government statutory returns, new taxes.
Where changes already have been made to the system, these should be summarised together with the causes. A check should be made that these have been officially approved and have followed the correct amending procedures, particularly that the changes have been recorded on the master system file and in the other appropriate reference manuals.The performance statistics should first show the comparison of actual with planned, and only then should the effect on these of any amendments and improvements be shown. These comparison records can be fed back to the planning and estimatii^ section, to system analysts and programmers to Improve future forecasting methods. Management requires to know of any benefits which have not been realised, and the causes, lb enable a realistic comparison to be made, the criteria used initially as a basis for estimating the financial benefits should be employed. Where these are found to be ineffective in any way, reasons should be given, and alternative criteria then applied to both the estimates and the actual evaluation. This is particularly applicable to the criteria used to evaluate intangible benefits. Any additional benefits arising which were not expected should be noted; and any financial gains arising from changes made since the changeover. There should also be comment on the likelihood, of attaining any long-term benefits.
Maintenance and Review
NOTES
13.4.3 Quality AssuranceThe level of control within the system deserves special attention. It is essential that adequate control procedures are built into the system as it is designed! These should be checked to ensure that they are working effectively, one being maintained, and that the system is secure. The following checklist gives a summary of the questions which should be asked.
Control Envirwiment• is there clear segregation of control responsibilities?• have all mandatory controls been specified?• what standby procedures are there, and what is the cost of having to use
them?• can user involvement be adequately demonstrated?• how will the user monitor system operation?• are there procedures of authorisation to check the quality of data?• are documentation standards maintained?
Source Data Collection• have batch sizes been defined and maintained for maximum control?
Self-ImtrucUonal Uateiial 305
System Analysis and Design have batch control records been deflned and maintained? are batch controls established as soon as possible? is the data collection environment suitable? are data collection and verification procedures clearly specified? are the following procedures defined and maintained correctly ; ii) registration of receipts?
(u) verification of receipts?(iu) recording of work distribution?(to) data conversion controls?(o) error procedures?
(ot) procedures for special equipment?
NOTES
Validation• is all input verified to the required standard before processing?• are all fields validated for range, format and size?■ are check-digits used where appropriate?• are input records verified for completeness, content and field sequence?• has sufficient use been made of possible field comparison tests; consistency,
credibility, cross-checking, acceptability?
Error Control• are control reports adequate both for errors and successful runs?• are any .errors processed with acceptable data, and if so are suitable safeguards
included?• do error-override facilities exist, and are there special controls to prevent
their misuse?■ has the moat appropriate method been used for clearing a validation run?
Computer Procedure and File Controls• does the program design include contingencies for overflow, timing and
frequency variations, environment changes, and variations in madiine conditions?• are. file controls adequate in Uie form of labels or special control records?• are control totals kept for all significant fields, plus record counts and hash
totals?• could separate control files be usefully kept?• is there a full reconciliation system linking input data to all output?■ is there appropriate provisioning of an audit trail?
Output Procedures• do output programs validate new fields created for output purposes?• are key fields rechecked for credibilit;^• are fields and reports edited according to standard?• are full control reports provided?• are reconciliations reported whether successfiil or not, with supporting
control totals?
306 Self-Instructional Material
* are program performance figures reported?* are output control reports produced?* is all output approved and monitored by an output control section.* is there an output control register?■ are control totals verified by output control section?* are special procedures defined for confidential data?* does the user receive a control report showing costs, volumes, and error-
rates?■ are periodic in-depth checks performed bn output data?
Use of Terminals* does terminal dialogue have built-in redundant for error detection?* is clerical data input minimised by the use of machine-generated data, or
avoidance of fixed data ke3ring?* is input distinguished from output?* are there adequate message controls (serial numbers, logging, hard copy,
audit trail)?* is the terminal design best for this application in terms of keyboard, screen
format, security, etc.?* what data protection facilities are provided for data transmis ion?* are error correction facilities provided through retransmission, reconstruction
or using the principle of no acknowledgement?
Mainttnanee and Review
NOTES
. Fallback and Recovery• are fallback clerical input procedures defined?• is -there a specified procedure for re-establishing controls?• are all messages logged on receipt, and are these logs retrievable for
recovery purposes?
External Requirements• have all appropriate external authorities been consulted?• has the auditor approved the system controls?
13.4.4 RecommendationsWays to improve system performance should be given: either to meet or exceed expectations. If additional work is needed, then the terms of reference should be formulated in detail.
13.6 SYSTEM AUDIT REPORTWhen the system is operational, a document that the systems analyst may be involved in producing is the system Audit Report. Its purpose is to report on the performance of a system (in particuleu’ to compare actual with planned performance), to verify that the stated objectives are still valid in the present environment, and to evaluate the achievement of these objectives. A checklist of contents might be as given below :
’ Self-Inetnetional Material 807

Syglem 'Analysit and Design
STUDENT ACTIVITy 13.2
1. What are the different types of maintenance? What are the changes made to the system in each type of maintenance?
2. Write a short note on the cost of maintenance.
I
310 Self-Instructional Material
Miintenanet and RtuiewSUMMARY
Maintenance refers to changes made to a system to Hx or enhance its functionality.Corrective maintenance refers to changes made to a system to repair flaws in its design, coding, or implementation.Adaptive maintenance refers to changes made to a system to evolve its functionality to changing business needs or technologies.Perfective maintenance refers to changes made to a system to add new features or to improve performance.Preventive maintenance refers to changes made to a system to avoid possible future problems.Maintainability is the ease with which software can be understood, corrected, adapted, and enhanced-System audit (review of system performance) will usually take place when the system has settled down and will be concerned primarily with looking for improvements in the performance of the system and ensuring that it is achieving the forecasted benefits.The system audit will also examine the level of control in the system. It may be that the result of one of the annual audits will be to recommend a complete redesign of the system and so the cycle of development will start again. System audit report is a report, that the systems analyst is lik ly to have to produce, which reports on the review of the system.
NOTES
TEST YOURSELFAnswer ihe following queationt:
1. Information systems are designed as per users’ need and also tested before implementation. State reasons why these systems are maintained?
2. Do similarities exist between deliverables and outcomes related to new development and maintenance of information systems. How do you distinguish between these two processes?
3. What is maintainability? What is the difference between high and low maintainability? What factors influence and determine the maintainability of a system?
4. What alternative approaches do organitations adopt to manage maintenance cost? How?
6. Write a short note on system audit report.6. What are the ways for organizing maintenance personnel? Contrast the
advantages and disadvantages of each process.7. Describe the review of system performance (system' audit).8. State True or False;
(i) Systems maintenance is the largest systems development expenditure for many organizations.
(ii) Maintenance is not a fact of life for most systems.(»i) The process of maintaining an information system is the process of
returning to the beginning of the SDLC and repeating development steps until the change is implemented.
Self-Instructional Material 911
System Analysis and Design (iv) Once a request is received, anal^Bls must be conducted to gain an understanding of the scope of the request.
(o) A significant portion of the expendij^ure for iuformation systems within organizations does not go to the development of new systems but to the maintenance of existing systems.
(ft) Corrective maintenance does not refer to changes made to a system to repair flaws-in its design, coding or implementation.
(vii) Preventive maintenance does not refer to changes made to a system to avoid possible future problems.
9. Fill in the blanks:
NOTES
•(i) can begin soon after the system is installed.(ii) As with the initial design of a system, maintenance activities are not
changes, but include changes to hardwarelimited only to ...............and buaineBB procedures.
(ut) As with the initial development of the system, implemented changes areinto operational systems.formally reviewed and tested before
(ii;} The maintenance phase is the last phase of the(e) means the changes made to a sy'stem to fix or enhance
its functionality.- (t-i) ................... maintenance refers to changes made to a system to evolve
its functionality to changing business needs or technologies..................... is a person responsible for controlling the cheeking outand checking in of baseline modules for a system when a system is being developed or maintained.'
(vii)
ANSWERSTest Yourself
8. State True or False:(0 True
(m) True (o) True
(oil) False9. Fill in the blanks:
(t) Maintenance iiii) installation (v) Maintenance
(vii) System librarian
(ii) False (jy) True (vi) False
Oi) software(iu) systems development life cycle (SDLC) (of) Adaptive
318 Seif-Instructional Material