Air Pollution in the GCC Countries, 1-5 March 2012, Bangkok , Thailand.
17
1 GCC economies and air pollution: A qualitative analysis to a carbon dioxide emissions issue Ahmed Saddam PhD candidate, Economics University of Malaya, Kuala Lumpur Malaysia
Transcript of Air Pollution in the GCC Countries, 1-5 March 2012, Bangkok , Thailand.

1
GCC economies and air pollution: A qualitative analysis to a carbon dioxide
emissions issue
Ahmed Saddam PhD candidate, Economics
University of Malaya, Kuala LumpurMalaysia
2
Contents:Abstract IntroductionReview of LiteratureMethodologyCarbon dioxide emissions in GCC countries. Conclusions:

3
Abstract:
This study seeks to analayse the major factors of air pollution in GCC countries over the period 1998-2008. In this paper, the research objective is to show the role of increasing level of carbon dioxide emissions of these countries. As well as, the main components of the GDP and their relation to the level of air pollution in order to find out whether GCC countries are subject to Environmental Kuznets Curve assumption or not ?. Furthermore, extrapolating that GCC countries have followed a strict environment policy or non-strict ?. However, the methodology of this paper is based on a qualitative approach, where we will analyse annual data of carbon dioxide emissions, and the relative importance of the main commodity sectors for the period 1998-2008.
4
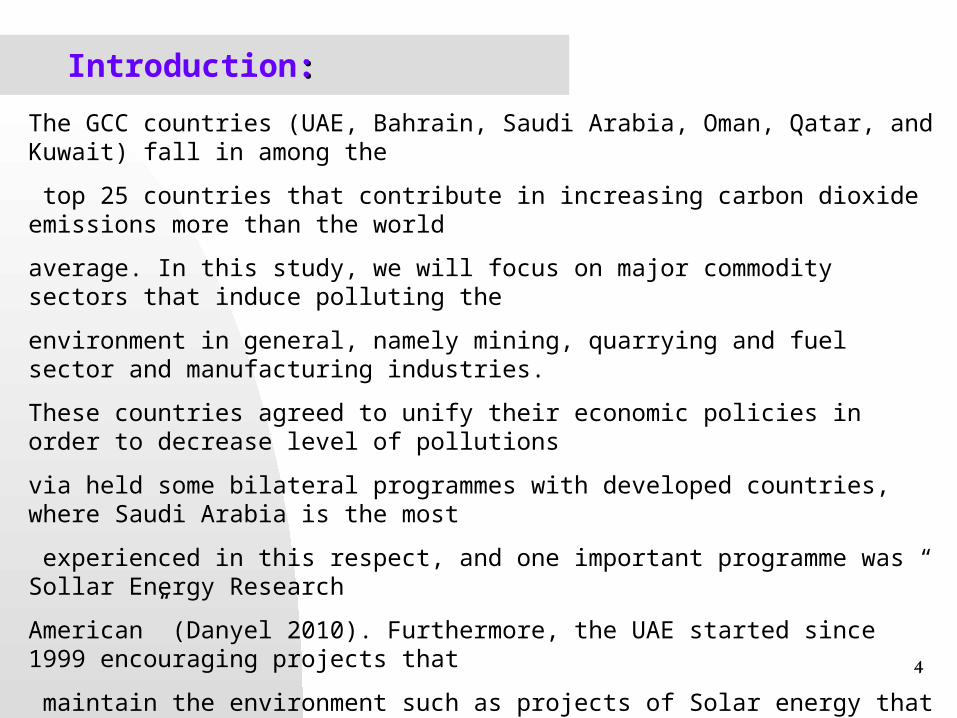
Introduction::The GCC countries (UAE, Bahrain, Saudi Arabia, Oman, Qatar, and Kuwait) fall in among the top 25 countries that contribute in increasing carbon dioxide emissions more than the world average. In this study, we will focus on major commodity sectors that induce polluting the environment in general, namely mining, quarrying and fuel sector and manufacturing industries. These countries agreed to unify their economic policies in order to decrease level of pollutions via held some bilateral programmes with developed countries, where Saudi Arabia is the most experienced in this respect, and one important programme was “ Sollar Energy Research American” (Danyel 2010). Furthermore, the UAE started since 1999 encouraging projects that maintain the environment such as projects of Solar energy that used for multiple purpose, and banned using of leaded fuel since 2003 in an attempt to reduce level of carbon emissions of transport sector (Mohamed, 2008) (Farid, 2008).

5
Review of literature:
Stern, et.al (1996), Bruyn, et al (1998) and Kathleen, et.al (2002) studied the impact of economic activities on environment.They indicated that there is an inverse relationship between environmental degradation, and per capita national income, where economic growth reduces the environment impact. These studies focused on the role of advanced technologies as a significant way for decreasing level of pollution. However, these studies are subject to Environmental Kuznets Curve assumption, which assumes that the level of emissions will be reduced with the increase of economic growth.
In contrast, Danyel (2010) found that there is a significant linkage between GDP and pollution, because of the rapid movement of capital, and expanding share of industries to GDP. Also, [Wen Chen (2007) and Thomas (2009)] found that the increase of economic activities and economic growth lead for more pollution. Where the assumption of Environmental Kuznets Curve is not clear. However, we noted many environmental studies, which based on assumptions of Environmental Kuznets Curve (EKC) have addressed the environment in countries that follow a strict policy in this respect. However, this study is a further attempt to determine the impact of the oil economies on the increase of carbon dioxide emissions over the period 1998-2008.

6
Carbon dioxide emissions in GCC countries:
The period 1998-2008 have witnessed a high increase of oil export in GCC countries, where the contribution of oil sector in GDP rose from 30.8% in 2002 to 40% in 2008 (Saif, 2009). In contrast, we noted increasing of level of carbon dioxide emissions over the said period, where the pollution have increased in the UAE from 83.6 million metric tons in 2002 to 128.5 million metric ton in 2008. Also, in Saudi Arabia from 323.4 million metric tons to 339 million metric tons. Accordingly, we found that GCC countries are not subject to assumptions of Environmental Kuznets Curve (EKC), which assumes that the pollution will first increase with the level of GDP per capita, and then decrease at higher levels of income, as shown in the following figure:
7
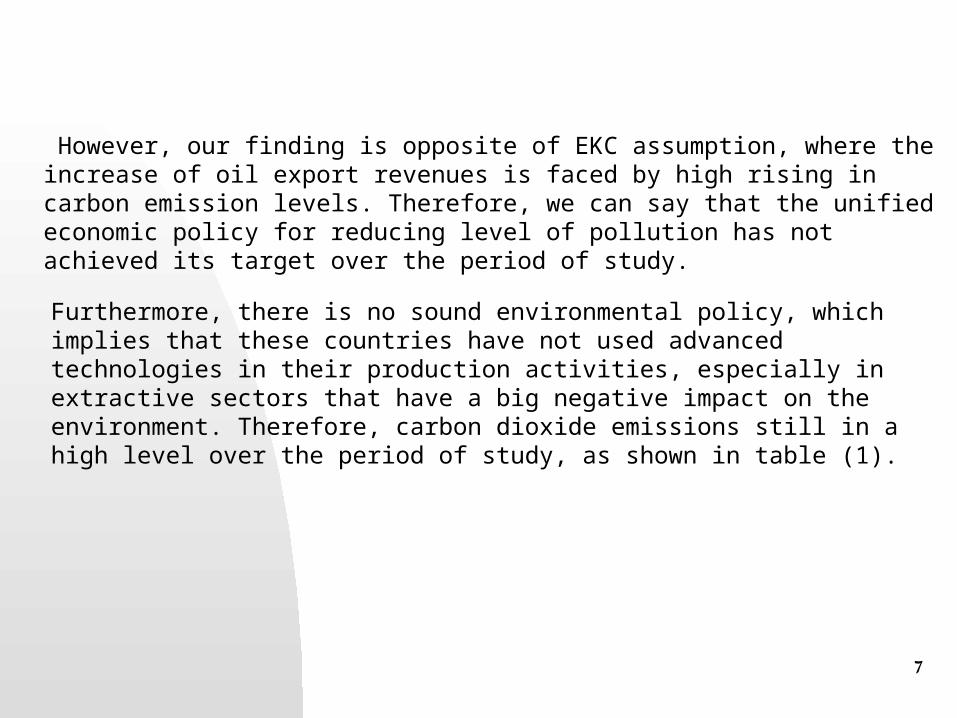
Furthermore, there is no sound environmental policy, which implies that these countries have not used advanced technologies in their production activities, especially in extractive sectors that have a big negative impact on the environment. Therefore, carbon dioxide emissions still in a high level over the period of study, as shown in table (1).
However, our finding is opposite of EKC assumption, where the increase of oil export revenues is faced by high rising in carbon emission levels. Therefore, we can say that the unified economic policy for reducing level of pollution has not achieved its target over the period of study.
8
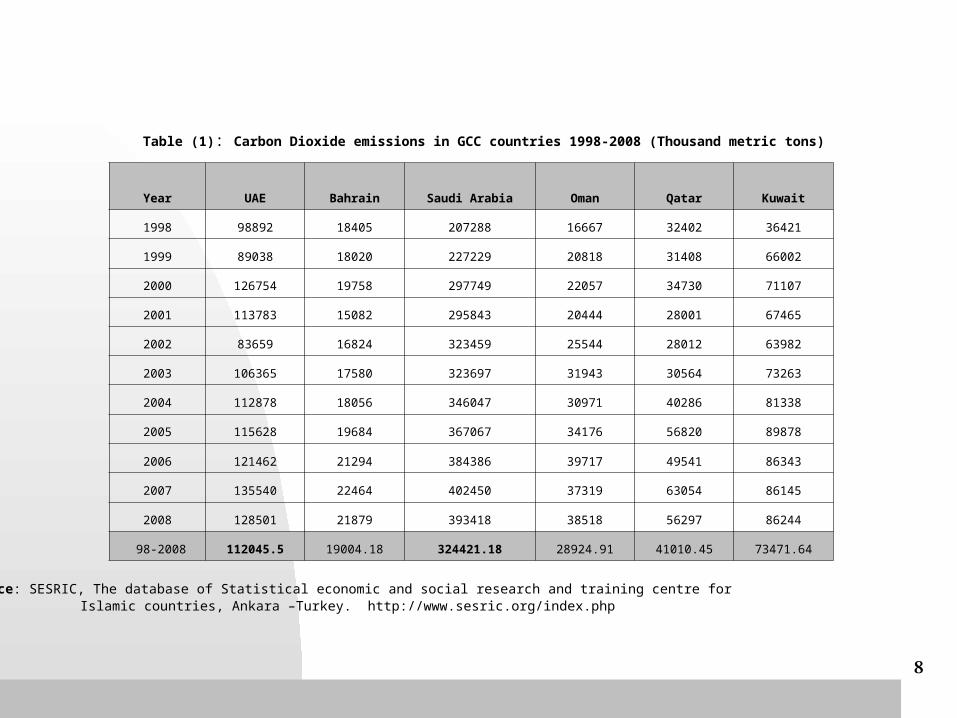
Table (1): Carbon Dioxide emissions in GCC countries 1998-2008 (Thousand metric tons)
Year UAE Bahrain Saudi Arabia Oman Qatar Kuwait
1998 98892 18405 207288 16667 32402 36421
1999 89038 18020 227229 20818 31408 66002
2000 126754 19758 297749 22057 34730 71107
2001 113783 15082 295843 20444 28001 67465
2002 83659 16824 323459 25544 28012 63982
2003 106365 17580 323697 31943 30564 73263
2004 112878 18056 346047 30971 40286 81338
2005 115628 19684 367067 34176 56820 89878
2006 121462 21294 384386 39717 49541 86343
2007 135540 22464 402450 37319 63054 86145
2008 128501 21879 393418 38518 56297 86244
98-2008 112045.5 19004.18 324421.18 28924.91 41010.45 73471.64
Source: SESRIC, The database of Statistical economic and social research and training centre for Islamic countries, Ankara –Turkey. http://www.sesric.org/index.php

9
Table (1) shows that Saudi Arabia and the UAE are the main contributor during the period of study, as mentioned previously. Kuwait has come in the third level, (73.4) million metric tons, on average, followed by Qatar which its carbon emissions rose from (32.4) million metric tons to (56.2) million metric tons in 2008 due its high production levels of natural gas. In Oman, the carbon dioxide emissions have jumped from (16.6) million metric tons in 1998 to (38.5) million metric tons in 2008, and in Bahrain from (98.8) million metric tons to (128.5) million metric tons for the same period. However, the main reason of the increase of emissions over the period of study is the role of the extractive industries of GCC countries. The following figure shows this fact:

10
0.00%
10.00%
20.00%
30.00%
40.00%
50.00%
60.00%
UAE Bahrain Saudi Arabaia O m an Qatar Kuwait
M ining,Q uarrying and fuelM anufacturing industriesElectricity and G as
Figure (2): Share of main commodity sectors to GDP in GCC countries- Average 1998-2008(Percentages)
Source: Based on data of Arab Monetary Fund, AMF, Kuwait; www.amf.org.ae
11
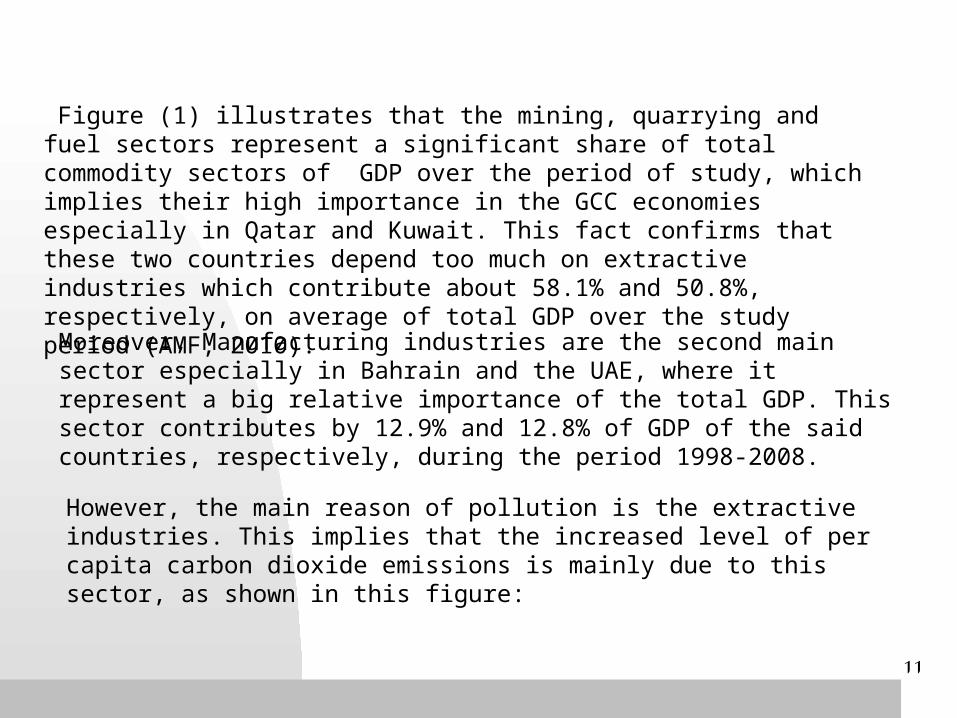
Figure (1) illustrates that the mining, quarrying and fuel sectors represent a significant share of total commodity sectors of GDP over the period of study, which implies their high importance in the GCC economies especially in Qatar and Kuwait. This fact confirms that these two countries depend too much on extractive industries which contribute about 58.1% and 50.8%, respectively, on average of total GDP over the study period (AMF, 2010).
Moreover, Manufacturing industries are the second main sector especially in Bahrain and the UAE, where it represent a big relative importance of the total GDP. This sector contributes by 12.9% and 12.8% of GDP of the said countries, respectively, during the period 1998-2008.
However, the main reason of pollution is the extractive industries. This implies that the increased level of per capita carbon dioxide emissions is mainly due to this sector, as shown in this figure:

12
O m an
KSA
Bahrain
UAE
Kuwait
Q atar
0
20
40
60
80
100
120
140
160
180
200
1998 1999 2000 2001 2002 2003 2004 2005 2006 2007 2008
Figure ( 2 ): Per capita carbon dioxide emissions in GCC countries, 1998-2008
Source: SESRIC, The database of Statistical economic and social research and training centre
for Islamic countries, Ankara –Turkey. http://www.sesric.org/index.php

13
Figure (2) shows that Qatar has a highest share in terms of per capita carbon dioxide emissions over the period of study, where the average of these emissions amounted to be 51.33 metric ton. However, this figure confirms the negative role of high reliance on natural gas industries in Qatar.
Also, this means that the economic policy of these countries is still focusing on the increase level of investments and then production with out pay more attention for the environment and advanced technologies to reduce level of emissions. Furthermore, this fact indicates that these countries especially in Qatar and Kuwait have not diversified their economic production level as a major target of the unified economic policy of the GCC countries. As well as the environmental policy is not active during the period of study.
14
Conclusions:
The unified economic policy of GCC countries does not achieved it target in terms of decreasing level of emissions, and diversity level of non-oil industries. We found that these countries still depend too much on fossil fuel and other polluted industries especially oil and gas industries. However, Qatar and Kuwait have a high level in terms of per capita carbon dioxide emissions. While Bahrain, Saudi Arabia and Oman have constituted less share compared with the rest of GCC countries. We noted that the share of per capita carbon dioxide emissions witnessed evident fluctuations during the period 1998-2002 especially in Qatar and Kuwait and the UAE, these changes are attributed to volatility of economic activities that generated these emissions in that period. Accordingly, this fact confirms the positive linking between economic growth and pollution, which represent an adverse result to the Environmental Kuznets Curve assumption. Finally, the economic growth of GCC countries is not sustained, and the environmental policy of these countries is not strict as well.
15
References:Arab Monetary Fund (AMF), Kuwait, different tables. (www.amf.org.ae). David I. Stern,, Michael S. & Barbier, Edward B. (1996), Economic Growth and environmental degradation: the Environmental Kuznets Curve and Sustainable Development, world development, Vol. 24, No. 7 pp 1151-1160. UK. .Kathleen M., & Quentin, R.,(2002) Growth and the environmental impact in Canada: An empirical Analysis, University of Ottawa. Reiche, Danyel (2010), Energy policies of gulf cooperation council (GCC) countries- possibilities and limitations of ecological modernization in rentier states, energy policy, dio:10-1016/j-enpol-2009.12.031.
Saif, Ibrahim (2009), The oil boom in GCC countries, 2002-2008, CARNEGIE papers. P.13S.M de Bruyn,., Bergh J.C Van den., & Opschoor, JB (1998) Economic Growth and Emissions: reconsidering the empirical bases of Environmental Kuznets Curves. Ecological Economics, (25), p161.Netherlands.
SESRIC, data base of statistical economics and social research and training, Turkey- Ankara.
Thomas A. Pugel, (2004) International Economics, twelfth edition, Mc Graw Hill Irwan, p36.
SESRIC (2007) Statistical year book, statistical, economics and social research and training centre for OIC countries, Turkey- Ankara. Wen Chen (2007), Economic growth and the environment in China: an empirical test of the environmental Kuznets curve using provincial panel data, annual conference on developing and change in Capi town..

16
Thank YouThank You

17