Air pollution and mortality in Valencia, Spain: a study using the APHEA methodology
7
J7ournal of Epidemiology and Community Health 1996;50:527-533 Air pollution and mortality in Valencia, Spain: a study using the APHEA methodology Ferran Ballester, Dolors Corella, Santiago Perez-Hoyos, Anna Hervas Abstract Study objective - To assess the short term relationship between daily air pollution in- dicators (black smoke and sulphur dioxide (SO2)) and mortality in Valencia. Design - This was an ecological study using time series data with application of Pois- son regression. Daily variations in four selected outcome variables (total mor- tality, mortality in those over 70 years of age, and cardiovascular and respiratory mortality) were considered in relation to daily variations in air pollution levels for the period 1991-93. Setting - The city of Valencia, Spain. Main results - The mean daily mortality was 17.5, and the average daily levels of air pollutants from the three monitoring stations included in the study were, 67.7 tgIm' for black smoke, and 39.9 tg/ m3 for SO2. A significant positive as- sociation between black smoke and three of the four outcomes in the study was found. The estimated relative risk (RR) of dying corresponding to a 10 pg/m3 in- crease in mean daily black smoke over the whole period was 1.009 (95% confidence interval (95% CI): 1.003, 1.015). For mor- tality in the group aged more than 70 years and for cardiovascular mortality, the RRs were 1.008 (95% CI: 1.001, 1.016) and 1.012 (95% CI: 1.003, 1.022) respectively. The association with SO2 was less clear: it was only evident during the warm season. The estimated RRs in this case were 1.007 (95% CI: 0.999, 1.015) for total mortality, 1.009 (95% CI: 1.00, 1.21) for total mortality in those older than 70, and 1.012 (95% CI: 0.995, 1.026) for cardiovascular deaths. No significant association was found between mortality from respiratory diseases and either of the two pollutants. Conclusions - A positive relationship be- tween air pollution and mortality was found in the short term, as has been shown in an important number of studies carried out elsewhere. Although the current levels of particulate air pollution in Valencia are not very high, they could have an effect on the number of premature deaths. Despite the fact that the association is weak, it is important at the public health level both because of the numbers of population ex- posed and the possibility of establishing control measures. (J7 Epidemiol Community Health 1996;50:527-533) In recent years, a growing number of epi- demiological studies have suggested that in- creases in air pollution could cause increases in daily mortality, even where levels of pol- lutants are below those considered as safe. Most published reports of this have come from investigations carried out in the USA, which show that particulate matter is the pollutant which exhibits this relationship most clearly. 1 234' In Europe, a series of investigations has also been carried out but with more diverse results in terms of the pollutant with the strong- est association (in many cases it has been SO2 and not particulate matter), and because of difficulties in comparing results obtained from studies in which different methods have been used to determine the concentrations of pol- lutants or where different methodology may have been used for the epidemiological analysis.678 9 In Valencia, air pollution is not currently regarded as a serious probleml' and there are no previous published reports on air pollution and mortality. Towards the end of 1993 we began a study which aimed to examine whether there was an association between pollution and mortality in Valencia as elsewhere. We un- dertook this study using the APHEA protocol which has been described previously." This European project began in 1992 and has de- veloped an extensive and valuable database from 10 countries with different social, cli- matic, and environmental conditions. We pres- ent here the results of our study in Valencia using epidemiological analysis of the time series data from the APHEA study. Methods DESIGN This was an ecological study using time series data to which Poisson regression was applied. Daily variations in several selected causes of death were related with daily variations in air pollution levels for the period 1991-93. STUDY AREA The study was carried out in the city of Valencia (Spain). Its population, according to the census, of 1991, is over 750 000. Valencia is situated on the shores of the Mediterranean. There are few green spaces within the boundaries, although several zones dedicated to agriculture are retained. The climate is that known as mesothermal (temperate), with mild, humid winters and warm, hot summers. Given the low level of rainfall it is classified as arid- Department of Epidemiology and Statistics, Institut Valencia d'Estudis en Salut Publica (IVESP), C/Joan de Garay 23, 46017 Valencia, Spain F Ballester D Corella S Nrez-Hoyos A Hervas Correspondence to: Dr F Ballester. Accepted for publication April 1996 527
-
Upload
independent -
Category
Documents
-
view
6 -
download
0
Transcript of Air pollution and mortality in Valencia, Spain: a study using the APHEA methodology
J7ournal of Epidemiology and Community Health 1996;50:527-533
Air pollution and mortality in Valencia, Spain: astudy using the APHEA methodology
Ferran Ballester, Dolors Corella, Santiago Perez-Hoyos, Anna Hervas
AbstractStudy objective - To assess the short termrelationship between daily air pollution in-dicators (black smoke and sulphur dioxide(SO2)) and mortality in Valencia.Design - This was an ecological study usingtime series data with application of Pois-son regression. Daily variations in fourselected outcome variables (total mor-tality, mortality in those over 70 years ofage, and cardiovascular and respiratorymortality) were considered in relation todaily variations in air pollution levels forthe period 1991-93.Setting - The city of Valencia, Spain.Main results - The mean daily mortalitywas 17.5, and the average daily levels ofair pollutants from the three monitoringstations included in the study were,67.7 tgIm' for black smoke, and 39.9 tg/m3 for SO2. A significant positive as-sociation between black smoke and threeof the four outcomes in the study wasfound. The estimated relative risk (RR) ofdying corresponding to a 10 pg/m3 in-crease in mean daily black smoke over thewhole period was 1.009 (95% confidenceinterval (95% CI): 1.003, 1.015). For mor-tality in the group aged more than 70 yearsand for cardiovascular mortality, the RRswere 1.008 (95% CI: 1.001, 1.016) and 1.012(95% CI: 1.003, 1.022) respectively. Theassociation with SO2 was less clear: it wasonly evident during the warm season. Theestimated RRs in this case were 1.007 (95%CI: 0.999, 1.015) for total mortality, 1.009(95% CI: 1.00, 1.21) for total mortality inthose older than 70, and 1.012 (95% CI:0.995, 1.026) for cardiovascular deaths. Nosignificant association was found betweenmortality from respiratory diseases andeither of the two pollutants.Conclusions - A positive relationship be-tween air pollution and mortality wasfound in the short term, as has been shownin an important number of studies carriedout elsewhere. Although the current levelsof particulate air pollution in Valencia arenot very high, they could have an effect onthe number of premature deaths. Despitethe fact that the association is weak, it isimportant at the public health level bothbecause of the numbers of population ex-posed and the possibility of establishingcontrol measures.
(J7 Epidemiol Community Health 1996;50:527-533)
In recent years, a growing number of epi-demiological studies have suggested that in-creases in air pollution could cause increasesin daily mortality, even where levels of pol-lutants are below those considered as safe.Most published reports of this have comefrom investigations carried out in the USA,which show that particulate matter is thepollutant which exhibits this relationship mostclearly.1 234' In Europe, a series ofinvestigationshas also been carried out but with more diverseresults in terms ofthe pollutant with the strong-est association (in many cases it has been SO2and not particulate matter), and because ofdifficulties in comparing results obtained fromstudies in which different methods have beenused to determine the concentrations of pol-lutants or where different methodology mayhave been used for the epidemiologicalanalysis.6789
In Valencia, air pollution is not currentlyregarded as a serious probleml' and there areno previous published reports on air pollutionand mortality. Towards the end of 1993 webegan a study which aimed to examine whetherthere was an association between pollution andmortality in Valencia as elsewhere. We un-dertook this study using the APHEA protocolwhich has been described previously." ThisEuropean project began in 1992 and has de-veloped an extensive and valuable databasefrom 10 countries with different social, cli-matic, and environmental conditions. We pres-ent here the results of our study in Valenciausing epidemiological analysis ofthe time seriesdata from the APHEA study.
MethodsDESIGNThis was an ecological study using time seriesdata to which Poisson regression was applied.Daily variations in several selected causes ofdeath were related with daily variations in airpollution levels for the period 1991-93.
STUDY AREAThe study was carried out in the city ofValencia(Spain). Its population, according to the census,of 1991, is over 750 000. Valencia is situatedon the shores of the Mediterranean. Thereare few green spaces within the boundaries,although several zones dedicated to agricultureare retained. The climate is that known asmesothermal (temperate), with mild, humidwinters and warm, hot summers. Given thelow level of rainfall it is classified as arid-
Department ofEpidemiology andStatistics, InstitutValencia d'Estudis enSalut Publica(IVESP), C/Joan deGaray 23, 46017Valencia, SpainF BallesterD CorellaS Nrez-HoyosA Hervas
Correspondence to:Dr F Ballester.
Accepted for publicationApril 1996
527

Ballester, Corella, Perez-Hoyos, Hervas
semiarid.'2 Its topography is completely flat,with infrequent temperature inversion phe-nomena. The wind predominantly blows fromthe sea (to the east), thus alleviating the intenseheat in the summer months.
MORTALITY DATAThe daily number of deaths in Valencia wasobtained from the Valencian community's mor-tality register. The group to be studied wasrestricted to the city's residents only. Therehave been many published reports on the com-pleteness of the register and the quality ofpatient diagnosis and the cause of death datathat appear on the certificate used to create thestatistics."'4 These show that the register isreliable. To be more specific, a high level ofaccuracy of the results obtained for all causemortality and for mortality from tumours anddiseases of the circulatory system has beenshown, but in the case of diseases of the res-piratory system the results have been less satis-factory." The groups considered in this studywere: total mortality, total mortality for subjectsover 70 years of age, and mortality from dis-eases of the circulatory system (ICD9 codes390 to 459) and the respiratory system (ICD9codes 460 to 519). In our study we tried veryhard to guarantee the quality of our data, andin a second phase of the programme we re-covered 44 deaths that had been registered late.
AIR POLLUTION DATAThe information on the values of the levelsof air pollutants comes from the Valenciancommunity's Air Pollution Monitoring Net-work. This network also has at its disposal theReference Laboratory for Air Pollution whichsystematically intercalibrates the differentlaboratories that produce data for the network.The basic parameters with which this networkdeals are sulphur dioxide (SO2) and the part-icles in suspension (black smoke). The in-dicator that is obtained is the accumulatedvalue over 24 hours. The analytical methodsand the characteristics of the monitoring setswere established in the context ofthe EuropeanUnion. 6 17 SO2 is detected using the "thorine"'technique (spectrophotometric method). Withregard to the suspended particles, the methodused is that of "normalised smoke" (blacksmoke). The blackening is measured by re-flectometry. Using this method, it is principallythe breathable particles that are captured (typ-ically those with an aerodynamic diameter ofless than 4.5 gim), from there on the numberof particles captured decreases, with the pro-portion ofparticles with a diameter greater than7-9 gm being much lower.
In the city of Valencia, the network currentlyhas 13 fixed monitoring sets for measuring thelevels of particles and SO2. Ofthese 13 stations,five have corresponded since the end of 1990to the type known as "weekly", which allowsthe collection of sequenced samples for up toeight days at a time. The other eight sets areof the "daily" type in which the change of filterand capture solution has to be carried out
manually by an operative on each occasion. Asa result of this the number of weekly de-terminations in these eight stations is limitedto four. Because of this, we have limited thestudy to the years 1991-93, and used data fromthe "weekly" monitoring stations.
Air pollution data from two if these fivestations were excluded because one of themshowed around 35% missing values for thestudy period and the other was in a locationthat was considered as inadequate. As a result,the values used to measure air pollution arethose obtained from an average of the threeremaining stations. The percentage ofdays withmissing values in any one of the three selectedsets varied between 6% and 13% for blacksmoke, and between 8% and 13% for SO2.The sets are located within the urban area ofValencia with a medium to intense level ofvehicular traffic. Motor vehicles are consideredone of the principal sources of pollutant emis-sion given that there is not a great deal ofheavyindustry in the city and people do not oftenbum fuels for heating because of the mildclimate during the winter.
METEOROLOGICAL DATAThe mean daily temperature and daily relativehumidity figures were obtained from the Na-tional Institute of Meteorology at the city'sweather station in the Meteorological Centreof Valencia. This location was considered morerepresentative than another centre near the city,situated at the airport given that in variousstudies the effects of the thermal island, whichis produced in the city of Valencia, showedup.'819 This effect consists of the modificationof the temperature fields produced by largeurban agglomerations. In the city of Valencia,its magnitude varies from almost nil valueswhen there are strong winds to over 6°C inanticyclonic situations with clear skies andslight winds.
INFLUENZAIn Spain there is a monitoring procedure fornotifiable diseases that involves every doctor.The quality of this register has also been evalu-ated and shows a good level of coverage in theValencia region.'o The numbers of cases ofinfluenza registered weekly was obtained fromthe epidemiological services of the city of Va-lencia, and this total was divided by seven toobtain an approximation of the daily incidenceof influenza. The use of the variable with con-tinuous data was preferred to the constructionof a variable dummy with only two possiblevalues, epidemic and non-epidemic periods.
ANALYSISThe analysis procedure followed to assess therelationship between mortality and pollutantsis based on that of the APHEA project and isexplained in more detail elsewhere.2"22 Thisensures the comparability of the results with
528

Air pollution and mortality in Valencia, Spain
those obtained in the other cities of the study.In our case this approach consisted of thefollowing.
Identification of the core modelsIdentifying a core model, by means of the leastsquares regression method, was undertaken foreach of the causes of mortality studied. Forcontrol of confounding the following factorswere taken into account:
(1) Seasonality. For this the sinusoidal termsup to the 6th order were tested. The criteriato decide sin and cos terms to be includedin the model were, either, when they jointlyimproved the model (F of change on in-troducing them jointly <0.10), or whenone of them (sin or cos of the same order)remained significant (p<0.05) with thefinal core model.
(2) Temperature and humidity. Both were in-troduced into the linear form model, thisbeing the form with the best adjustment.The lags were tested jointly for both vari-ables up to two days before, selecting theset according to its adjustment.
(3) Long term trends. A trend variable was
introduced for the whole period and a
dummy variable was tested for each year.An additional seasonality control was car-
ried out preserving the year-indicating vari-ables within the models and introducingthe interactions of these var-iables with tri-gonometric functions.
(4) Day of the week and holiday. Six dummyvariables were tested for the days of theweek, taking Monday as the base. Thesevariables were maintained in the model on
the basis of statistical significance (F-testfor all six variables <0.10). The "holiday"variable was introduced separately into themodel, with the same criteria for main-taining it there.
(5) Influenza incidence, in continuous form,as mentioned above. Its lags from 1 to 15were tested.
Selection of the air pollution variablesEach pollutant was studied separately in orderto avoid multicollinearity. The residuals ofmor-tality and of each pollutant after applying thecore model were plotted to decide if the pol-lution variables were transformed. Also tested
in the model was the log-transformation ofeach pollutant, but as the linear form fitted themodel better, it was the one finally chosen.
Subsequently, the lags of each pollutant weretested (up to the 5th) choosing in each casethe current lag with best adjustment. This was
performed in similar fashion with the averagesof 2, 3, and 4 days, including lag 0 in all cases.
Final Poisson regression modelsWith the models defined in the previous stagethe final models were built using the Poissonregression. Four final models were obtainedfor each pollutant. In the first two cases thevariable used as a pollution indicator was eitherthe current lag (one day measurement) or thecumulative (average) selected in the previousstage. In the other two cases the models were
the same as in the previous case, includingadditionally a dummy variable for the season
(1 if month =from November to April "coldseason", and 0 ifmonth = from May to October"warm season") in the model, plus an inter-action term for the air pollutant and the season
variable in order to assess modification effectin relation to season.
When the seasonality terms were introduced,qualitative changes were seen in some of thegroups studied, and we proceeded to carry outan analysis stratified by season. In all cases thepossible autocorrelation of mortality residueswas checked, along with the significance of theparameters up to the second order.
Finally, the interaction between black smokeand SO2 was investigated. A dummy variablewas created for black smoke (cut off pointfor "low" versus "high" - 100,g/m3) and theinteraction term between the said variable andSO2 was introduced into the S02 model withno statistical significance emerging. A dummyvariable was not created for S02, since for theValencian data there was only one day duringwhich the cut off point established in the pro-
cedures ofthe APHEA project (100 gg/m3) was
exceeded.
ResultsDESCRIPTIVE RESULTSTable 1 summarises the average daily mortalityvalues, the levels of black smoke and SO2, as
well as the average temperature and relativehumidity in relation to the whole period andthe two seasons in the study. In Valencia there
Table 1 Daily mortality in the groups studied, air pollutant values (uglm3), and meteorological data, Valencia, Spain1991-93
All year Warm months Cold months
Mean SD Min Max No Mean SD Mean SD
Total mortality 17.49 5.03 5 36 1096 15.68 4.37 19.33 5.00Total mortality age 70+ 11.68 4.05 2 27 1096 10.24 3.36 13.14 4.17Respiratory mortality 1.59 1.36 0 7 1096 1.25 1.15 1.93 1.48Cardiovascular mortality 6.93 3.06 0 19 1096 5.91 2.69 7.97 3.07Black smoke (24-h) 67.68 28.83 5.00 226.00 1096 58.07 20.79 77.43 32.37SO, (24-h) 39.94 15.38 7.00 105.50 1088 39.35 16.28 40.54 14.39Mean temperature ('C) 17.51 5.72 5.00 30.30 1096 22.05 3.86 12.91 2.95Humidity (%) 67.65 13.15 32.46 95.41 1096 66.48 12.23 67.65 14.02
Warm months = May, June, July, August, September, October. Cold months =November, December, January, February, March,April.
529

Ballester, Corella, Perez-Hoyos, Hervas
Raw dataPredicted counts
------- Residuals
1 Jan1993
1 Jan 92 1 Jan 93
Day
Figure 1 Time series of daily values of raw data, predicted counts, and residicore model for total mortality.
were a third more deaths in wintesummer. The seasonal variations fopollutants in the study were not very
in the case of SO2 were quite low (oithe levels in winter were 15% higher tin summer). The variations were
black smoke (60% more in winter),a reference in each case the valuesmonitoring station with highest levelThe correlation between the thr
toring stations was relatively highsmoke (between 0.63 and 0.76), butfor SO2 (between 0.14 and 0.63). Beaverage of the three stations for blaand SO2 the correlation was also(0.24). In comparing the pollutantat the station giving the maximum valimeasured at the station giving thevalues, we again found a differenttween the two pollutants. Whereas iiof the black smoke the levels measu
station with the highest values were r
double those measured at the stationest values, in the case of SO2 there i
less variation - approximately 20% r
REGRESSION RESULTSFigure 1 shows the daily values of the raw data,the predicted values, and the residuals of thecore model for total mortality, obtained by leastsquare regression before including the pollutantvariables. With the construction of this modelthe intention was to deseasonalise the mortalityseries. In the case of total mortality, the core
model accounts for more than 20% of thevariability of the daily mortality (R2 = 0.22).The results of final Poisson models for pol-
lutants are shown in table 2, with an indicationof the variables included in each case. None ofthe dummy variables for the years resulted instatistical significance, as a result of which theywere not retained in the model. Likewise, thedummy variables were not included in any
other model because they did not exhibit the1 Jan 94 required level ofadjustment in the case of either
"movable feasts" or (despite all cases beingexamined) the autoregressive terms.
uals of the Following theAPHEA protocol the pollutionindicator with the best adjustment is shownfor each model. In general, the associationsbetween mortality and air pollution were more
significant using one day measurements than
r than inthe average of several days, except in the case
of subjects over 70 years of age, among whomlarge and a greater regression coefficient was obtainedl
average, when taking into consideration the mean valueshan those for both the date of death and the three dayswider for prior to it (regression coefficient 0.00114,taking as standard error 0.00052). The linear form was
from the chosen for the pollutants because it showed a
Is. better adjustment than its logarithmic trans-
^ee moni- formation.
for black On studying the whole series, before in-
was lower cluding the interaction term, a significant as-
tween the sociation can be found between daily mortalityck smoke and the concentrations of black smoke butquite low not for S02. This association is seen more
measured specifically with mortality from all causes, mor-
ues to that tality in those older than 70 years, and mortalityminimum from cardiovascular diseases. No association
trend be- was found, however, between black smoke and
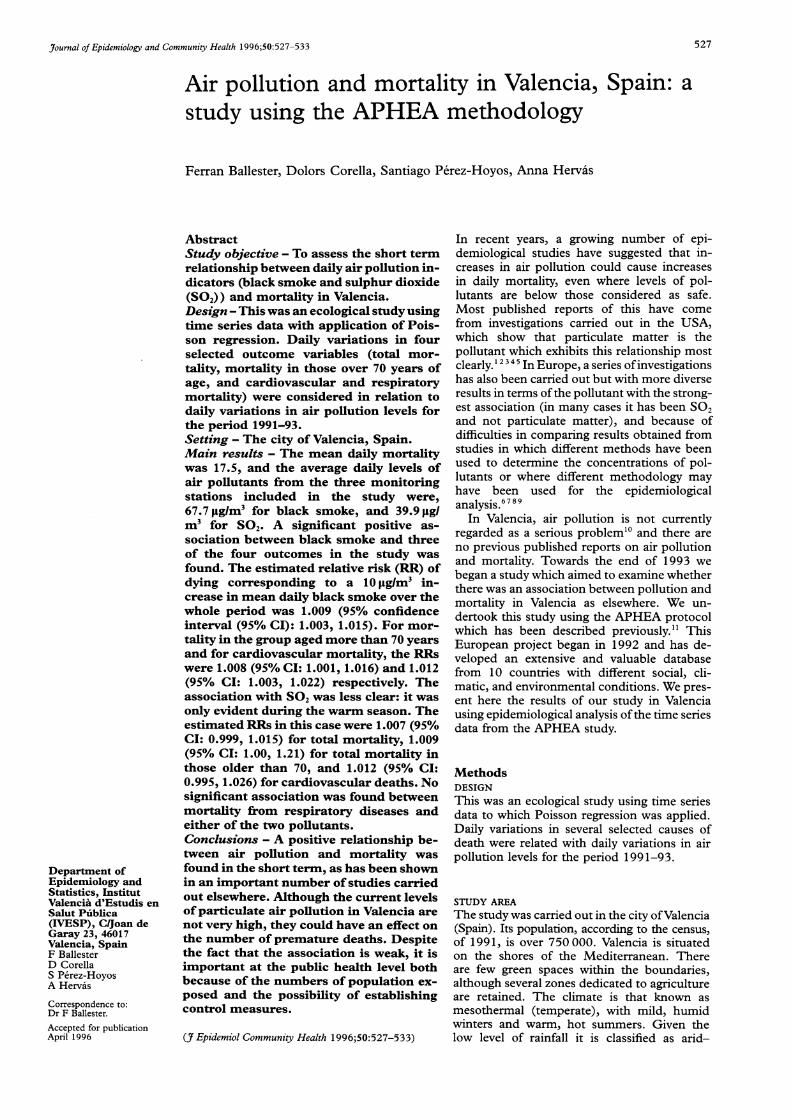
n the case mortality from respiratory diseases.red at the With regard to black smoke, the introductionmore than of its interaction term with season did not showwith low- substantial seasonal behaviour. In figure 2 thewas much relative risks (RR) corresponding to each cause
more. for the whole year are shown. In the case of
Table 2 Summary results of Poisson regression models for air pollutants, Valencia, Spain 1991-93
Pollutant (,ugim3) Cause of death Lag* Coefficient SD RR 95%(d) Beta (per I pglm') confidence interval
Black smoke (24-h) Total mortality 3 0.0008951 0.000310 1.0009 1.0003, 1.0015Total age 70+y 0 0.0008302 0.000380 1.0008 1.0001, 1.0016Respiratory mortality 1 -0.0007272 0.000898 0.9993 0.9975, 1.0010Cardiovascular mortality 4 0.0012320 0.000481 1.0012 1.0003, 1.0022
SO2 (24-h) Total mortality 2 0.0006906 0.000425 1.0007 0.9999, 1.0015Total age 70+y 2 0.0008731 0.000619 1.0009 0.9997, 1.0021Respiratory mortality 2 -0.0028560 0.001750 0.9971 0.9937, 1.0006Cardiovascular mortality 2 0.0009878 0.000783 1.0012 0.9995, 1.0025
* Lag (x) indicates the lag (x) of air pollutant with the best fit.Model for total moftality: sinl, cosl, sin4, cos4, sin5, cos5, sin6, cos6, trend, temperature (lag 1), humidity (lag 1), days of theweek.Model for total mortality in older than 70 years: sinl, cosl, sin4, cos4, sin5, cos5, sin6, cos6, trend, temperature (lag 1),humidity (lag 1), days of the week.Model for respiratory mortality: sinl, cosl, sin2, cos2, sin3, cos3, influenza incidence, temperature (lag 2), humidity (lag 2).Model for cardiovascular mortality: sinl, cosl, sin3, cos3, sin4, cos4, temperature, humidity, days of the week.
530

Air pollution and mortality in Valencia, Spain
1.03 r
1.02
1.01 b-
cn._
0)
. 1.00
a:
I Io0.99
0.98
0.97All All cause Cardiovascular Respiratory
cause > 70 y
Causes of death
Figure 2 Relative risks (95% confidence intervals) of death associated with an inin the concentration of black smoke of 10ug/im3.
1.08 r
1.06 [-
1.04
1.02
0)a, 1 00
X 0.98a)
0.96
0.94
0.92
I- I
_ Cold months(Nov-April)
* Warm months_- (May-Oct)
All All cause Cardiovascular Respiratorycause >70y
Causes of death
Figure 3 Seasonal variations in the relative risks (95% confidence intervals) of dassociated with an increase in the concentration of sulphur dioxide of 10 MigIm3.
SO2, however, on introduction of the va
season and its interaction there were chin some of the coefficients of interest as aof which we proceeded to carry out a stn
analysis. In this case, seasonal behaviouevident. As can be observed in figure 3, tlof dying associated with daily concentratiS02 are greater during the warm month,during the cold months in all four grFurthermore, for total mortality in thosethan 70 years and (to a large extent) fccardiovascular causes of death, this associs significant for the warm season. Thditional control for seasonality by meainteracting year-designating variables wilgonometric functions did not alter the maassociation. The inclusion of the internterm between the two pollutants did ndicate a possible synergistic effect.
DiscussionCompared with the other cities that parti(in the APHEA study (descriptive resultsbeen reported elsewhere"), the Valenciar
are intermediate with regard to pollution levels,lower for SO2 than for black smoke, and, interms of meteorology, Valencia has one of themildest winters and the hottest summers, com-parable to Athens. With regard to seasonality(data not shown here), mortality shows a pat-tern similar to the other Mediterranean citiesand is more accentuated than in the cities tothe north and centre of Europe.One of the main findings of this study is the
discovery of a significant association betweenair pollution and mortality indicators in thecity of Valencia. The methodology employedhas been similar to that ofthe other participantsin the APHEA project, a fact which permits thecomparison of our results with those obtainedfrom the data sets of other cities in the study.The aim of this approach to take into adequateaccount the possible confounding factors, as
crease well as controlling the autocorrelation. Theexistence of seasonal patterns in relation to thestudy and the possible interaction between thepollutants were also investigated.When evaluating the results of this type of
study, it has to be remembered that the vari-- ability of the parameters obtained in the
adjusted regression models depends on the sizeof the population and the duration of the study.With regard to the first point, the populationof Valencia is not large when compared withsome of the cities in the APHEA study, as aresult of which the estimates obtained couldbe a little unstable, especially when they arestudied in relation to causes. With regard tothe second point, the availability of pollutiondata restricted the study period to three years,which hinders attainment of statistical sig-nificance.
This choice presents certain advantages, suchas having up to date information which allowsa more accurate estimation of the impact of
Fwath pollution on mortality with the present char-acteristics regarding levels and the compositionof the pollutants. On the other hand, however,the time periods studied are not long enough
riable to hope that the variation in the age structureLanges and other population characteristics that areresult important factors in the variation of the oc-atified currence ofdeath (smoking habit, employment,ir was exposure in the home, diet, exercise etc) willhe RR change substantially.23 As in all ecological stud-ons of ies, the results of the study should be vieweds than with caution when making causal imputations.roups. An important, widely known problem in thisolder type ofstudy is the high level ofmisclassificationDr the in terms of evaluating exposure. The whole,iation population of the city has the same level ofie ad- exposure assigned, independent of the area inns of which they carry out their daily lives and with-th tri- out taking into account the time they spendnifest inside buildings. In addition, classification ofaction exposure depends on the quality of the at-ot in- mospheric information. The pollutant data de-
pend largely on the situation of the monitoringstations. The need to improve the quality ofinformation required to carry out this type ofstudy should be highlighted, especially when
cipate referring to levels of exposure. We believe thathave in both the field of epidemiology as well asdata in that of the professionals involved in the
531

Ballester, Corella, Perez-Hoyos, Hervas
monitoring of air pollution, an effort should bemade to collaborate closely in this type ofstudy.
This is the first study ofthe short term effectsof air pollution on mortality carried out inValencia. The results obtained are consistentwith those from other European cities. Theyare, however, more similar to those obtainedin American studies, where the association be-tween air pollution and mortality is clearer forparticulate matter than for SO,. Over the pastfew years, there have been various reviews ofthe topic.2"'6 In these, the authors resolve theproblems of comparability of results betweenthe different measures of exposure de-termination by using criteria based on chemicaland morphological knowledge of the particleswhich allow the transformation of the valuesobtained into a measurement method that cor-responds to the one that would have beenobtained using a different measurement pro-cedure. In this sense it is considered that,among other criteria, the value obtained forblack smoke levels using the reference meas-uring method used within the EuropeanUnion,617 should approximate to that obtainedby the measurement method of the En-vironmental Protection Agency (EPA) of theUSA (for measuring particles smaller than10 mm).27 Both measures would be ap-proximately equivalent, according to the au-thors, to 55-60% of the total suspendedparticles (TSP), allowing an approximation ofthe relative magnitude ofthe effects to be made.In this way, the estimated effect in the threementioned revisions ranges between a 0.6%and 1% increase in daily mortality for an in-crease of 10 mg/m' in suspended particles, ex-pressed in PM1o. In our case, the effect estimateof the change in daily mortality from all causesfor each 10 mg/m' increase in black smokeconcentration was of 0.9% (95% confidenceinterval, 0.3, 1.5%), a result that is very similarto those mentioned above. For mortality fromspecific causes, our results are in line with thoseobtained in other studies,26 with a higherestimated risk for cardiovascular mortalitycompared with all cause mortality, but no sig-nificant association for respiratory mortality.This fact could be due to various reasons, butin our opinion it is principally due to the lownumber of deaths from respiratory diseases inValencia (approximately 1.5 deaths per averageday). However, as we mentioned in themethods section, studies carried out in Va-lencia"5 have shown that in the case of deathsfrom respiratory causes the reliability of thediagnosis obtained from the medical certificateis relatively low (sensitivity of 55%).
Occasionally, the results ofthese studies havebeen put in doubt by the lack of a physio-pathological mechanism that would be bio-logically plausible, especially in the case of theassociation with mortality from cardiovasculardiseases.28 Faced with these objections it hasbeen argued that as well as the misclassificationthat can exist (eg, deaths from bronchitis andbronchiolitis being classified as caused bycardiovascular diseases), some acute res-piratory diseases can cause a pulmonary oed-ema."9 In addition, some authors have
suggested that the episodes of air pollutionconstitute an additional environmental stressfactor that can cause the death ofcompromisedpatients. Several physiological hypotheses havebeen formulated on the way in which the part-icles act on the human body. In a recentreport,"0 it was suggested that the explanationfor this association is that the particulate matterin cities might contain a very high concentrationof ultra fine particles. Even though their con-centration might not be not very high gra-vimetrically, these particles could provokealveolar inflammation that would liberate me-diators capable, in susceptible individuals, ofcausing an exacerbation of respiratory prob-lems and increasing the coagulability of theblood. This might explain the increase in thenumber of deaths from cardiovascular prob-lems as a result of air pollution. A similarhypothesis has been presented in which theultra fine particles (<50nm) present in theurban atmosphere have a toxic reactive cap-ability.3"SO2 presents less clear results in our study.
It shows a seasonal pattern with a mortalityassociation that is significant only during warmmonths. This fact contrasts with the resultsobtained in other European studies, where itemerges as the pollutant with the clearest as-sociation with mortality.89 In a study carried outin The Netherlands,32 no statistically significantassociation was found either, although in thisparticular case the levels of SO2 were low (av-erage 18 mg/m3), and in addition, the samemeasure of exposure (determined by six moni-toring stations spread nationwide) was appliedto the Dutch population as a whole. The levelsof SO2 in Valencia during the study were alsolow or moderate, partly explaining the non-significant association when the year is analysedas a whole.The greater effect of SO2 on mortality during
the warmer months could be a result of itsgreater detectibility at a time when there arefewer competing risk factors (especially res-piratory infections). Furthermore, as there arefewer deaths during the warmer months, anyvariations have a greater impact on the results.However, it has been suggested that the greatesteffects of pollution during hot months couldbe a result of higher individual exposure basedon modified activity patterns." This includesthe fact that people spend more time outdoorsand windows are left open for longer, so theindoor concentrations are closer to those foundoutdoors.
In conclusion, the association found showsa positive relationship between air pollutionand mortality in the short term, as has beenwitnessed in a considerable number of in-vestigations carried out elsewhere. These find-ings suggest that although the present levels ofparticulate air pollution in the city of Valenciaare not being very high, they could have aneffect on the number of premature deaths. Theassociation is a weak one, but it is neverthelessimportant at a public health level both due tothe numbers of population exposed and to thepossibility of establishing control measures.
532

Air pollution and mortality in Valencia, Spain
1 Schwartz J, Dockery DW. Particulate air pollution and dailymortality in Steubenville, Ohio. AmJfEpidemiol 1992;135:12-9.
2 Schwartz J. Air pollution and daily mortality in Birmingham,Alabama. Am J Epidemiol 1993;137: 1136-47.
3 Pope CA III, Schwartz J, Ramsom MR. Daily mortality andPM,o pollution in Utah Valley. Arch Environ Health 1992;47:211-7.
4 Schwartz J. Particulate air pollution and daily mortality inDetroit. Environ Res 1991;56(2):204-13.
5 Schwartz J. Total suspended particulate matter and dailymortality in Cincinnati, Ohio. Environ Health Perspect1994;102(2): 186-9.
6 Loewenstein JC, Bourdel MC, Bertin M. Influence dela pollution atmospherique (SO2 - poussieres) et desconditions meteorologiques sur la mortalite a Paris entre1969 et 1976. Rev Epidemiol Sante Publique 1983;31:143-61.
7 Hatzakis A, Katsouyanni K, Kalandidi A, Day N, Tri-chopoulos D. Short-term effects of air pollution on mor-tality in Athens. Int 3 Epidemiol 1986;15:397-9.
8 Derrienic F, Richardson S, Mollie A, Lellouch J. Short-term effects of sulphur dioxide pollution on mortality intwo French cities. IntJfEpidemiol 1989;18:186-97.
9 Toulomi G, Pocock SJ, Katsouyanni K, Trichopoulos D.Short-term rffects of air pollution on daily mortality inAthens: a time series analysis. Int J Epidemiol 1994;23:957-67.
10 Laboratorio Municipal. Delegaci6n de Salud y Consumo.Ayuntamiento de Valencia. Contaminaci6n atmosferica enla ciudad de Valencia. Marzo 1992. In: Medio ambiente ysalud. Valencia: Fundaci6n Cadiada Blanch, 1993.
11 Katsouyanni K, Zmirou D, Spix C, et al. Short-term effects ofair pollution on health: a European approach using ep-idemiologic time series data. Eur RespirJ 1995;8:1030-8.
12 Roldfn A. Notas para una climatologia de Valencia. InstitutoNacional de Meteorologia. Publicaci6n Serie K no 6.Madrid: Instituto Nacional de Meteorologia, 1985.
13 Benavides FG, Bolumar F, Peris R. Quality of death cer-tificates in Valencia, Spain. Am J Public Health 1989;79:1352-4.
14 Benavides FG, Segura A, Godoy C. Estadisticas de mor-talidad en Espafia: pequefios problemas, grandes per-spectivas. Revis Salud Publica 199 1;2:43-66.
15 Benavides FG. Fiabilidad de las estadisticas de mortalidad.Generalitat Valenciana. Conselleria de Sanitat i Consum.Monografies Sanitaries Serie A, num 2, 1986. Valencia:Conselleria de Sanitat i Consum, 1986.
16 Diario Oficial de las Comunidades Europeas. Directiva delConsejo de 15 de julio de 1980, relativa a los valoreslimite y a los valores guia de calidad atmosferica para elanhidrido sulfuroso y las particulas en suspensi6n (80/779/CEE).
17 Diario Oficial de las Comunidades Europeas. Directiva delConsejo de 21 de junio de 1989 por la que se modificala Directiva 80/779/CEE (89/427/CEE).
18 Caselles V, L6pez Garcia MJ, Melia J, Perez Cueva AJ.El efecto de la isla termica de la ciudad de Valenciaobtenido a partir de transectos e imagenes NOAA-AVHRR. Libro de comunicaciones de la III Reuni6nCientifica del Grupo de Trabajo en Teledetecci6n. Madrid,Octubre 1989. Madrid: Asociaci6n Espafiola de Ter-modinamica, 1989:259-69.
19 Perez Cueva AJ. Brisas e isla termica urbana en Valencia.In: Universitat de Valencia. Aportaciones en homenaje alprofesor Luis Miguel Albentosa. Valencia: Universitat deVal&ncia, 1992:193-203.
20 Tello 0, Cano R, Hernandez G. Situaci6n actual y analisisde la vigilancia epidemiol6gica en Espafia. In: VigilanciaEpidemiol6gica: !!hacia que modelo vamos?. Madrid: Cen-tro Nacional de Epidemiologia, 1992:91-9.
21 Schwartz J, Spix C, Touloumi G et al. Methodological issuesin studies of air pollution and daily counts of deaths orhospital admissions. J Epidemiol Community Health 1996;50:S3-11.
22 Katsoyanni K, Schwartz J, Spix C et al. Short term effectsof air pollution on health: a European approach usingepidemiologic time series data. The APHEA protocol. JEpidemiol Community Health 1996;50:S12-18.
23 Holland WW, Bennett AE, Cameron IR, et al. Health effectsof particulate pollution: reappraising the Evidence. Am JEpidemiol 1979;110:525-659.
24 Ostro B. The association of air pollution and mortality:examining the case for inference. Arch Environ Health1993;48(5):336-42.
25 Schwartz J. Air pollution and daily mortality: a review andmeta-analysis. Environ Res 1994;64(1):36-52.
26 Dockery DW, Pope CA III. Acute respiratory effects ofparticulate air pollution. Annu Rev Public Health 1994;15:107-32.
27 U.S. Environmental Protection Agency. Revisions to thenational ambient air quality standards for the particulatematter: final rules. Washington: Federal Register 1987;52(126):24634-69.
28 Waller RE, Swan AV. Invited commentary: particulate airpollution and daily mortality. Am J Epidemiol 1992;135:20-2.
29 Bates DV. Health indices of the adverse effects of air pol-lution: the question of coherence. Environ Res 1992;59:336-49.
30 Seaton A, MacNee W, Donaldson K, Godden D. ParticulateAir pollution and acute health effects. Lancet 1995;345:176-8.
31 Oberdorster G. Airborne pollutants and acute health effects.Lancet 1995;345:799-800.
32 Mackenbach JP, Looman CW, Knust AE. Air pollution,lagged effects of temperature, and mortality: The Neth-erlands 1979-87. J Epidemiol Community Health 1993;47:121-6.
33 Katsouyanni K. Health effects of air pollution in southernEurope: are there interacting factors?. Environ Health Per-spect 1995;103(Suppl2):23-7.
533