MONTHLY FINANCIAL SUMMARY - Valencia College
111
Original Budget Revenues Collected YTD % Collected of Annual Student Based 117,632,793 $ 47,235,693 $ 40.2% State Funding 99,279,931 16,456,164 16.6% Other Revenues 10,257,121 123,394 1.2% Total Revenues 227,169,845 $ 63,815,251 $ 28.1% Original Budget Expenditures Expended YTD % Expended of Annual Salaries 188,170,963 $ 23,657,259 $ 12.6% Current Expense 34,946,465 6,143,850 17.6% Capital Outlay 4,052,417 277,422 6.8% Total Expenditures 227,169,845 $ 30,078,531 $ 13.2% Rev. Projected Year End $227.2M Exp. Projected Year End $227.2M Projected Fund Balance $29.5M Projected Fund Balance as % 11.5% Financial Health Indicators MONTHLY FINANCIAL SUMMARY FISCAL YEAR 2021-22 (August)
-
Upload
khangminh22 -
Category
Documents
-
view
0 -
download
0
Transcript of MONTHLY FINANCIAL SUMMARY - Valencia College

Original Budget Revenues Collected YTD % Collected of Annual
Student Based 117,632,793$ 47,235,693$ 40.2%State Funding 99,279,931 16,456,164 16.6%Other Revenues 10,257,121 123,394 1.2%
Total Revenues 227,169,845$ 63,815,251$ 28.1%
Original Budget Expenditures Expended YTD % Expended of Annual
Salaries 188,170,963$ 23,657,259$ 12.6%Current Expense 34,946,465 6,143,850 17.6%Capital Outlay 4,052,417 277,422 6.8%
Total Expenditures 227,169,845$ 30,078,531$ 13.2%
Rev. Projected Year End $227.2M
Exp. Projected Year End $227.2M
Projected Fund Balance $29.5M
Projected Fund Balance as % 11.5%
Financial Health Indicators
MONTHLY FINANCIAL SUMMARY FISCAL YEAR 2021-22 (August)

Original Budget YTD FY2021-22 % Collected YTD FY2020-21 Year over YearStudent Based: Tuition 78,505,809$ 31,616,701$ 40% 34,272,033$ (2,655,332)$ Non-Credit Tuition 9,989,445$ 1,881,742$ 19% 1,369,511$ 512,231$ Student Fees 14,908,001$ 5,721,406$ 38% 5,726,240$ (4,834)$ Out of State Fees 14,229,538$ 8,015,844$ 56% 7,597,619$ 418,225$ State Funding: State Support - CCPF Recurring 87,467,179$ 14,578,206$ 17% 13,417,658$ 1,160,548$ State Support - CCPF NonRecurring -$ -$ 0% -$ -$ State Support - Special Appropriation -$ -$ 0% -$ -$ State Support - Lottery, License Tag 11,812,752$ 1,877,958$ 16% 1,508,818$ 369,140$ Other Revenue: Indirect Cost Recovered 341,444$ 74,308$ 22% 15,898$ 58,410$ Other Revenue - Transfer, Interest, Rent, Contract, Misc 9,915,677$ 49,086$ 0% 2,039,028$ (1,989,942)$ Total Revenue 227,169,845$ 63,815,251$ 28% 65,946,801$ (2,131,554)$
Original Budget YTD FY2021-22 % Expensed YTD FY2020-21 Year over YearPersonnel Expenses:
Salaries & Wages 149,886,491$ 18,600,924$ 12% 17,729,197$ (871,727)$ Fringe Benefits 23,872,730$ 3,081,488$ 13% 2,947,634$ (133,854)$ Other Taxable Benefits 14,411,742$ 1,974,847$ 14% 2,069,166$ 94,319$ Expense Suspense Accounts -$ -$ 0% -$ -$ Personnel Expense Contingency -$ -$ 0% -$ -$
Total Personnel 188,170,963$ 23,657,259$ 13% 22,745,997$ (911,262)$
Other Expenses:Other Services & Expenses 8,371,106$ 2,163,676$ 26% 2,573,996$ 410,320$ Utilities & Communications 5,618,947$ 658,424$ 12% 707,572$ 49,148$ Contractual Services 9,437,018$ 1,322,837$ 14% 914,882$ (407,955)$ Materials & Supplies 10,730,644$ 1,870,129$ 17% 1,697,061$ (173,068)$ Scholarships & Waivers 16,040$ -$ 0% -$ -$ Interest on Capital Debt 456,460$ 76,077$ 17% 76,077$ -$ NonPersonnel Expense Contingency -$ -$ 0% -$ -$ Payment on Debt 316,250$ 52,708$ 17% 52,708$ -$
Total Direct Expenditures and Transfers 34,946,465$ 6,143,850$ 18% 6,022,296$ (121,555)$
Original Budget YTD FY2021-22 % Expensed YTD FY2020-21 Year over YearCapital Expenditures 4,052,417$ 277,422$ 7% 148,705$ (128,717)$
Total Capital Expenditures 4,052,417$ 277,422$ 7% 148,705$ (128,717)$ Total All Expenses 227,169,845$ 30,078,531$ 13% 28,916,999$ (1,161,534)$
Total Revenues Less Expenses and Transfers -$ 33,736,720$ 37,029,802$ (3,293,088)$
REVENUES
CAPITAL OUTLAY
EXPENDITURES

JUL AUG SEP OCT NOV DEC JAN FEB MAR APR MAY JUNMONTHLY
FY2020-21 46,676,185 19,270,616FY2021-22 46,167,066 17,648,185
CUMULATIVE CUMUL. 2020-21 46,676,185 65,946,801CUMUL. 2021-22 46,167,066 63,815,251
REVENUES MONITOR
$40
$60
$80
$100
$120
$140
$160
$180
$200
$220
$0
$5
$10
$15
$20
$25
$30
$35
$40
$45
$50
JUL AUG SEP OCT NOV DEC JAN FEB MAR APR MAY JUN
Millions
Millions
FY2020-21 FY2021-22 CUMUL. 2020-21 CUMUL. 2021-22

JUL AUG SEP OCT NOV DEC JAN FEB MAR APR MAY JUNMONTHLY
FY2020-21 15,554,531 13,362,468 FY2021-22 14,554,684 15,523,847
CUMULATIVECUMUL. 2020-21 15,554,531 28,916,999 CUMUL. 2021-22 14,554,684 30,078,531
.
EXPENSE MONITOR
-$30
$20
$70
$120
$170
$220
$0
$5
$10
$15
$20
$25
$30
$35
JUL AUG SEP OCT NOV DEC JAN FEB MAR APR MAY JUN
Millions
Millions
FY2020-21 FY2021-22 CUMUL. 2020-21 CUMUL. 2021-22

SUMMARY OF MAJOR CONSTRUCTION PROJECTSVALENCIA COLLEGE
FY 2021-2022 (ALL FUNDS)
CONSTRUCTION: PROJECT TO DATE (PTD) as of August 31, 2021
State Funding Operational
FundingRestricted Funding Student Tuition Committed Balance
Project DescriptionEstimated
Completion Date
Cost Estimate
Fund 7 Capital Outlay
& Debt Service
Fund 1 Transfer
Fund 2 Grant Fund 7 Gift
Fund 3 Transfer
Fund 4 Transfer
Capital Improvement
Fee
Expended or Encumbered
to Date Unexpended
Funds
East Campus CAT Bldg 01/2023 7,000,000 550,000 489,670 60,330
MID-Downtown CAT Bldg 05/2021 2,200,000 2,610,000 2,531,405 78,595
District Office Roof Replacement 01/2021 1,000,000 879,653 879,653 -
SPS/ EAC Chiller Replacement 04/2021 802,120 710,562 17,880 728,442 -
OSC CIT 3rd Floor Renovation 08/2022 700,000 700,000 - 700,000
PNC Solar Project 08/2022 2,000,000 2,000,000 - 2,000,000
PNC Lab Renovation 08/2022 500,000 500,000 - 500,000
CW Signs Continous 500,000 - - -
Collegewide Repair & Maintenance 06/2022 4,950,000 4,950,000 1,465,179 3,484,821
Collegewide Remodel & Renovation Various 2,400,000 - 2,400,000 81,070 2,318,930
FUNDING SOURCE FISCAL YEAR 2021-2022 (YTD) as of August 31, 2021
Funding Source Beginning Fund Balance
Projected Revenue
Total Funds Projected FY2122
East CAT BLG
OSC CIT
PNC Lab
PNC Solar
CW Signs
CW Repair & Remodel Other
State Funding 2,351,358 775,000 3,126,358
Restricted Funding - -
Local Funding 22,195 - 22,195 - 22,195
Tuition 17,007,635 5,934,906 22,942,541 6,450,000 700,000 450,000 2,000,000 500,000 5,190,000
8/31/2021
Local Funding
Funding Source Cash Flow Commitments by Major Project
Summary: Cost estimates above include furniture and equipment, landscaping, parking and other costs to complete the project.
Summary: Local funds are available at the discretion of the Board of Trustees. Committed amounts include expenditures, encumbrances, and/or designated funding for these projects.

SUMMARY OF INVESTMENT RESULTS SUMMARY OF INVESTMENT RESULTSVALENCIA COLLEGE VALENCIA COLLEGE
FY 2021-22 (ALL FUNDS) FY 2020-21 (ALL FUNDS)
FISCAL YEAR 2021-22 REVENUE/RATES OF RETURN FISCAL YEAR 2020-21 REVENUE/RATES OF RETURN
PeriodInterest Income
Dividend Income
Annual Interest
Income % Unrealized Gain/Loss
Average Principal Invested Period Interest Income
Dividend Income
Annual Interest
Income % Unrealized Gain/Loss
Average Principal Invested
July 8,491$ 11,636$ 0.307% 10,932$ $78,796,611 July 16,172$ 20,646$ 0.585% 36,221$ 75,551,568$ August 4,232 12,230 0.243% (10,942) $81,151,990 August 15,119 19,378 0.461% - 89,756,434$ September September 15,181 19,911 0.462% - 91,086,530$ October October 14,775 17,961 0.522% (10,724) 75,266,328$ November November 9,807 17,399 0.425% 10,737 76,888,852$ December December 7,794 129,373 1.948% (107,484) 84,497,441$ January January 8,930 14,761 0.334% - 85,007,108$ February February 7,467 15,436 0.312% (21,768) 88,067,486$ March March 6,892 13,546 0.284% (15,101) 86,298,892$ April April 5,982 13,165 0.291% 10,904 79,018,071$ May May 5,182 12,959 0.274% - 79,428,326$ June June 4,348 12,605 0.242% (15,139) 83,950,003$ TOTAL 12,724$ 23,867$ 0.275% (9)$ 79,974,300$ TOTAL 117,649$ 307,141$ 0.512% (112,353)$ 82,901,420$
1 Yr Treasury SEI SBA Date
Principal Invested
Income/Capital Gains
Change in Market Value Book Value
0.07% 0.96% 0.10% 1/31/2016 25,000,000$ 25,000,000$ 6/30/2016 74,066 230,044 25,304,109
INVESTMENT MIXTURE AS OF 8/31/2021 6/30/2017 393,504 (160,314) 25,537,300 B of A SEI SBA TOTAL 6/30/2018 (1,600,000) 489,225 (188,898) 24,237,627 20.8% 18.8% 60.4% 100.0% 6/30/2019 (10,548,239) 611,193 151,674 14,452,254
6/30/2020 362,332 210,371 15,024,957 CASH HOLDINGS AS OF 8/31/2021 6/30/2021 307,141 (112,353) 15,219,745
B of A SEI SBA TOTAL 8/31/2021 23,867 (9) 15,243,603 $16,876,130 15,243,603$ $49,032,257 $81,151,990 162,303,980 1,930,320$ 242,877$
ANNUAL RATES OF RETURN AS OF 8/31/2021 Cumulative Fixed Income Investment Return Information

VALENCIA COLLEGE STATEMENT OF REVENUES, EXPENDITURES, AND OTHER CHANGES
FISCAL YEAR 2021-2022 (through August 31, 2021)
Current Fund Other Quasi Unexpended DebtRestricted Campus Stores Auxiliary Endowments Scholarship Plant Service
REVENUESStudent Fees 2,474,530$ -$ -$ -$ 1,709,452$ 2,531,516$ -$ State Support 76,670 891,814 Federal Support 295,673 5,033,007 HEERF Stimulus 5,042,834 7,470,202 Gifts & Contracts 11,958 125,000 39,241 Sales 2,950,766 11,913 Other Revenues 11,598 146,441 16,224 (150) 3,573 Transfers from Other Funds 169,421
TOTAL REVENUES 7,901,664$ 2,962,365$ 283,353$ 16,224$ 15,312,987$ 2,535,088$ -$
EXPENDITURES
Personnel ExpendituresFull Time 859,325$ 144,418$ 11,837$ Part Time 232,171 12,424 Fringe Benefits 228,520 59,361 3,307
Subtotal 1,320,016$ 216,204$ 15,144$ -$ -$ -$ -$
Other ExpensesTravel 14,695$ 5,868$ 219$ Postage & Telephone 200 105,764 Printing 1,863 15 1,825 Repairs & Maintenance 555 4,072 34,527 Rental & Insurance 605 15,672 1,825 Utilities 110 Services 410,185 4,801 13,509 3,154 Materials & Supplies 488,349 59,576 109,617 31,194 Cost of Goods Sold 3,401,235 Scholarships & Waivers 3,503,218 13,131,228 Uninsured Loss Fed Expense (CV19) 802,277 (70,313) Transfers to Other Funds 169,421 Other Expenses 74,308 93,678
Subtotal 5,465,231$ 3,616,851$ 129,242$ -$ 13,131,228$ 70,700$ -$
Capital OutlayFurniture & Equipment 240,527$ 788$ 114,284$ Architect & Engineering Services 17,255 General Construction 89,729 Renovation & Remodeling 21,646 263,138 LandLeasehold Improvements 693,801 Structures & Improvements
Subtotal 262,173$ 788$ -$ -$ -$ 1,178,207$ -$
TOTAL EXPENDITURES 7,047,421$ 3,833,843$ 144,386$ -$ 13,131,228$ 1,248,906$ -$
NET INCREASE (DECREASE) IN FUND BALANCE 854,243$ (871,479)$ 138,967$ 16,224$ 2,181,759$ 1,286,182$ -$

VALENCIA COLLEGEBALANCE SHEET BY FUND
FISCAL YEAR 2021-2022 (through August 31, 2021)
Current Fund Current Fund Other Quasi Unexpended Debt InvestmentUnrestricted Restricted Campus Stores Auxiliary Endowments Scholarship Plant Service in Plant
ASSETSCash 32,847,526$ 1,795,532$ (1,156,035)$ 4,443,230$ 537,416$ 3,781,369$ 21,109,731$ 34,514$ -$ Accounts Receivable, Net 40,155,843 889,656 2,153,625 18,769 Investments 2,749,215 2,219,675 10,274,714 Inventories 1,357,267 Prepaid Expenses 1,550,800 36,000 Deferred Outflows - FRS Pension 33,600,074Deferred Outflows - HIS Pension 10,435,703Deferred Outflows - OPEB 3,593,463Capital Leases, Net 14,110,680 Land 32,987,698 Buildings, Net 209,080,779 Leasehold Improvements, Net 11,960,233 Other Structures & Improvements, Net 2,260,222 Furniture & Equipment, Net 5,444,416 Construction in Progress 1,173,312
TOTAL ASSETS 122,183,409$ 2,685,189$ 5,140,073$ 6,662,905$ 10,812,130$ 3,800,138$ 21,109,731$ 34,514$ 277,017,339$
LIABILITIES AND FUND BALANCE
Liabilities:Accounts Payable 884,914$ 15,987$ 79,002$ -$ -$ -$ 4,870$ -$ -$ Retainage Payable 117,700 Salaries & Benefits Payable 2,362,804 3,102
7,620,730Compensated Leave-Curr/NonCurr 11,954,571
382,9378,289,292
Net FRS Pension Liability-Current/NonCurr 86,476,445Net HIS Pension LiabilityCurrent/NonCurr 38,685,478Deferred Inflows - FRS Pension 1,403,057
2,863,451Deferred Inflows - OPEB 263,299Sales Tax Payable 238 164,105 Capital Leases Payable 15,085,987 Bonds Payable 1,463,000 Leases Payable
Total Liabilities 161,187,216$ 19,089$ 243,107$ -$ -$ -$ 122,570$ -$ 16,548,987$
Fund Balance:Funds Restricted for Encumbrances 10,739,194$ 10,079,294 160,446 152,003 -$ -$ 2,289,367 -$ -$ Investment in Plant 260,336,351 Unallocated Fund Balance (49,743,001) (7,413,195) 4,736,520 6,510,901 10,812,130$ 3,800,138 18,697,794 34,514
Total Fund Balance (39,003,807)$ 2,666,099$ 4,896,965$ 6,662,905$ 10,812,130$ 3,800,138$ 20,987,161$ 34,514$ 260,336,351$
TOTAL LIABILITIES AND FUND BALANCE 122,183,409$ 2,685,189$ 5,140,073$ 6,662,905$ 10,812,130$ 3,800,138$ 21,109,731$ 34,514$ 277,017,339$
Deferred Inflows - HIS Pension
Health Insurance Claims Reserve
Net OPEB Liability-Current/NonCurrSpecial Termination Benefit-Curr/NonCurr

Valencia College Higher Education Emergency Relief funds (HEERF) Awards Summary
As of August 2021 in millions
HEERF ICares Act
$29.4
HEERF IICRSSA Act
$62.8
HEERF IIIARP Act$107.8
Total HEERF Funds Awarded
$200.0
Student Aid $18.5 $17.3 - $35.8
Institutional Support $8.2 $2.8 - $11.0
Lost Revenue $1.8 $0.1 $0.0 $1.9
Total Reported $28.5 $20.1 - $48.7
As a percent from total award 96.9% 32.0% - 24.3%
1

District Board of Trustees Valencia College
ANNUAL FINANCIAL REPORT
For the Fiscal Year July 1, 2020 to June 30, 2021
VALENCIA COLLEGE ANNUAL FINANCIAL REPORT
DIVISION OF FLORIDA COLLEGES YEAR-END REPORTS SCHEDULE OF EXPENDITURES OF FEDERAL AWARDS
For the Fiscal Year July 1, 2020 to June 30, 2021
Table of Contents Annual Financial Statements
Management’s Discussion and Analysis................................................................................................... 1
Statement of Net Position........................................................................................................................ 11
Statement of Revenues, Expenses & Changes in Net Position................................................................. 13
Statement of Cash Flows.......................................................................................................................... 14
Notes to the Financial Statements........................................................................................................... 16
Other Required Supplementary Information………………………………………………………………………….…………….42
Division of Florida Colleges Year End Reports
Summary of Accounts by General Ledger Code....................................................................................... 48
Summary of Expenditures by Function (Fund 1)...................................................................................... 55
Report of Capital Improvement Fees....................................................................................................... 56
Distance Learning Course User Fee Report.............................................................................................. 57
Report of Student Activity and Service Fees............................................................................................ 58
Tuition and Fees Report……………………………………………………………………………………………………………………….59
Florida College System and Component Unit Schedules……………..……………………………………………………….61
Certification of Financials…………………………………………………………………………………………………………………….85
Composite Financial Index Calculations………………………………………………………………………………….……………86
Schedule of Expenditures of Federal Awards (SEFA)
SEFA Data………………………..……………………………………................................................................................ 90
SEFA Loans…………………………………………………………………………………………………………………………………………..93
SEFA Reconciling Template……………………………………................................................................................ 94
SEFA Checklist…………………………………....................................................................................................... 95

ANNUAL FINANCIAL STATEMENTS
Management’s Discussion and Analysis
Statement of Net Position
Statement of Revenues, Expenses and Changes in Net Position
Statement of Cash Flows
Notes to the Financial Statements
Other Required Supplementary Information
MANAGEMENT’S DISCUSSION AND ANALYSIS
Management’s discussion and analysis (MD&A) provides an overview of the financial position and activities of the College for the fiscal year ended June 30, 2021, and should be read in conjunction with the financial statements and notes thereto. The MD&A, and financial statements and notes thereto, are the responsibility of College management. The MD&A contains financial activity of the College for the fiscal years ended June 30, 2021, and June 30, 2020.
FINANCIAL HIGHLIGHTS
The College’s assets and deferred outflows of resources totaled $420.4 million at June 30, 2021. This balance reflects a $1.5 million, or 0.4 percent, increase as compared to the 2019-20 fiscal year, resulting from an increase in the account receivable for the summer term guaranteed tuition installment plan managed by a third-party provider. While assets and deferred outflows of resources grew, liabilities and deferred inflows of resources increased by $15.2 million, or 8.9 percent, totaling $186.4 million at June 30, 2021, resulting from an increase in the net pension liability defined pension plans because of a decrease in the expected long-term rate of return on plan investments. As a result, the College’s net position decreased by $13.7 million, resulting in a year-end balance of $234.0 million.
The College’s operating revenues totaled $80.0 million for the 2020-21 fiscal year, representing a 7.5 percent increase compared to the 2019-20 fiscal year due mainly to a decrease in scholarship allowances, resulting in a lesser portion of tuition paid by Federal and State financial aid, instead of the student or third party on behalf of the student. Operating expenses totaled $334.2 million for the 2020-21 fiscal year, representing an increase of 4.3 percent as compared to the 2019-20 fiscal year due mainly to a decrease in scholarship allowances which resulted in a greater portion of financial aid awards disbursed directly to the student.
Net position represents the residual interest in the College’s assets and deferred outflows of resources after deducting liabilities and deferred inflows of resources. The College’s comparative total net position by category for the fiscal years ended June 30, 2021, and June 30, 2020, is shown in the following graph:
1

Net Position (In Thousands)
The following chart provides a graphical presentation of College revenues by category for the 2020-21 fiscal year:
Total Revenues 2020-21 Fiscal Year
OVERVIEW OF FINANCIAL STATEMENTS
Pursuant to the Governmental Accounting Standards Board (GASB) Statement No. 35, the College’s financial report consists of three basic financial statements: the statement of net position; the statement of revenues, expenses, and changes in net position; and the statement of cash flows. The financial statements, and notes thereto, encompass the College and its component unit, the Valencia College Foundation, Inc. (Foundation). Based on the application of the criteria for determining component units, the Foundation is included within the College reporting entity as a discretely presented component unit.
-$100,000
$0
$100,000
$200,000
$300,000
Net Investmentin Capital Assets
Restricted Unrestricted
$260,468
$33,962
-$60,381
$265,578
$33,414
-$51,266
2021 2020
Operating Revenues25%
Nonoperating Revenues
73%
Other Revenues2%
2

This MD&A focuses on the College, excluding the discretely presented component unit.
The Statement of Net Position
The statement of net position reflects the assets, deferred outflows of resources, liabilities, and deferred inflows of resources of the College, using the accrual basis of accounting, and presents the financial position of the College at a specified time. Assets, plus deferred outflows of resources, less liabilities, less deferred inflows of resources, equals net position, which is one indicator of the College’s current financial condition. The changes in net position that occur over time indicate improvement or deterioration in the College’s financial condition.
The following summarizes the College’s assets, deferred outflows of resources, liabilities, deferred inflows of resources, and net position at June 30:
Condensed Statement of Net Position at June 30 (In Thousands)
2021 2020
AssetsCurrent Assets 64,989$ 62,175$ Capital Assets, Net 277,017 282,011 Other Noncurrent Assets 30,736 30,507
Total Assets 372,742 374,693
Deferred Outflows of Resources 47,629 44,265
LiabilitiesCurrent Liabilities 21,741 25,631 Noncurrent Liabilities 160,051 138,016
Total Liabilities 181,792 163,647
Deferred Inflows of Resources 4,530 7,585
Net PositionNet Investment in Capital Assets 260,468 265,578 Restricted 33,962 33,414 Unrestricted (60,381) (51,266)
Total Net Position 234,049$ 247,726$
Noncurrent liabilities increased primarily due to growth in net pension liability of $18.5 million which caused net position to be reduced.
The Statement of Revenues, Expenses, and Changes in Net Position
The statement of revenues, expenses, and changes in net position presents the College’s revenue and expense activity, categorized as operating and nonoperating. Revenues and expenses are recognized when earned or incurred, regardless of when cash is received or paid.
The following summarizes the College’s activity for the 2020-21 and 2019-20 fiscal years:
3

Condensed Statement of Revenues, Expenses, and Changes in Net Position For the Fiscal Years
(In Thousands)
2020-21 2019-20
Operating Revenues 79,977$ 74,449$ Less, Operating Expenses 334,208 320,527
Operating Income (Loss) (254,231) (246,078) Net Nonoperating Revenues 233,384 228,032
Income (Loss) Before Other Revenues, Expenses, Gains, or Losses (20,847) (18,046) Other Revenues, Expenses, Gains, or Losses 7,170 7,898
Net Increase (Decrease) In Net Position (13,677) (10,148)
Net Position, Beginning of Year 247,726 257,874 Adjustment(s) to Beginning Net Position - -
Net Position, Beginning of Year, as Restated 247,726 257,874
Net Position, End of Year 234,049$ 247,726$
Operating Revenues
GASB Statement No. 35 categorizes revenues as either operating or nonoperating. Operating revenues generally result from exchange transactions where each of the parties to the transaction either gives or receives something of equal or similar value.
The following summarizes the operating revenues by source that were used to fund operating activities for the 2020-21 and 2019-20 fiscal years:
Operating Revenues For the Fiscal Years
(In Thousands) 2020-21 2019-20
Student Tuition and Fees, Net 70,692$ 63,925$ Grants and Contracts 1,130 1,390 Sales and Services of Educational Departments 33 137 Auxiliary Enterprises, Net 7,220 8,232 Other 902 765
Total Operating Revenues 79,977$ 74,449$
The following chart presents the College’s operating revenues for the 2020-21 and 2019-20 fiscal years:
4

Operating Revenues (In Thousands)
College operating revenue increased by $5.5 million as a result of the following factors:
• Net student tuition and fees increased by $6.8 million due to a decrease in scholarship allowance.
• Auxiliary enterprises revenue decreased by $1.0 million due to all Campus Stores physical locations being closed during the 2020-2021 fiscal year due to the coronavirus pandemic.
Operating Expenses
Expenses are categorized as operating or nonoperating. The majority of the College’s expenses are operating expenses as defined by GASB Statement No. 35. GASB gives financial reporting entities the choice of reporting operating expenses in the functional or natural classifications. The College has chosen to report the expenses in their natural classification on the statement of revenues, expenses, and changes in net position and has displayed the functional classification in the notes to financial statements.
The following summarizes operating expenses by natural classification for the 2020-21 and 2019-20 fiscal years:
Operating Expenses For the Fiscal Years
(In Thousands) 2020-21 2019-20
Personnel Services 200,056$ 197,866$ Scholarships and Waivers 65,161 55,531 Utilities and Communications 4,398 5,276 Contractual Services 10,619 11,963 Other Services and Expenses 8,526 10,283 Materials and Supplies 34,430 29,056 Depreciation 11,018 10,552
Total Operating Expenses 334,208$ 320,527$
$0 $40,000 $80,000
Other
Auxiliary Enterprises, Net
Sales and Services ofEducational Departments
Grants and Contracts
Student Tuition and Fees, Net
$765
$8,232
$137
$1,390
$63,925
$902
$7,220
$33
$1,130
$70,692
2020-21 2019-20
5

The following chart presents the College’s operating expenses for the 2020-21 and 2019-20 fiscal years:
Operating Expenses (In Thousands)
College operating expense changes were the result of the following factors:
• All full-time and staff and faculty received a 2.5 percent salary increase; part-time faculty received a 5.0 percent wage increase.
• Scholarship expenses increased primarily due to a reduction in calculated scholarship allowances, resulting in a greater portion of Federal and State financial aid awards disbursed directly to student, instead of being used for tuition and bookstore charges. This increase was partially offset by a reduction in Pell Grant awards of $4.0 million because less students were eligible in the 2020 – 2021 fiscal year; in addition, Pell recipients received a one-time blanket waiver from the Federal government in the prior fiscal year for withdrawals that occurred in spring term 2020 in response to the coronavirus pandemic, which automatically kept these students eligible for future Pell awards.
• Materials and supplies expenses grew by $5.4 million primarily due to an increase in college-wide renovation and remodeling projects that were able to occur throughout the fiscal year because of limited on on-campus presence of college personnel and students as a result of the coronavirus pandemic.
Nonoperating Revenues and Expenses
Certain revenue sources that the College relies on to provide funding for operations, including State noncapital appropriations, Federal and State student financial aid, certain gifts and grants, and investment income, are defined by GASB as nonoperating. Nonoperating expenses include capital
$0 $115,000 $230,000
Depreciation
Materials and Supplies
Other Services and Expenses
Contractual Services
Utilities and Communications
Scholarships and Waivers
Personnel Services
$10,552
$29,056
$10,283
$11,963
$5,276
$55,531
$197,866
$11,018
$34,430
$8,526
$10,619
$4,398
$65,161
$200,056
2020-21 2019-20
6

financing costs and other costs related to capital assets. The following summarizes the College’s nonoperating revenues and expenses for the 2020-21 and 2019-20 fiscal years:
Nonoperating Revenues (Expenses) For the Fiscal Years
(In Thousands) 2020-21 2019-20
State Noncapital Appropriations 95,308$ 90,772$ Federal and State Student Financial Aid 103,669 112,739 Gifts and Grants 34,270 23,241 Investment Income (Loss) 333 1,513 Other Nonoperating Revenues 352 325 Interest on Capital Asset-Related Debt (548) (558)
Net Nonoperating Revenues 233,384$ 228,032$
Net nonoperating revenues increased by $5.4 million or 2.4 percent primarily due to an increase in State appropriations from the Florida College System Program Fund of $3.4 million (general revenue) and $1.3 million (lottery).
Other Revenues, Expenses, Gains, or Losses
This category is mainly composed of State capital appropriations and capital improvement fees. The following summarizes the College’s other revenues, expenses, gains, or losses for the 2020-21 and 2019-20 fiscal years:
Other Revenues, Expenses, Gains, or Losses For the Fiscal Years
(In Thousands) 2020-21 2019-20
State Capital Appropriations 1,263$ 1,183$ Capital Contracts and Fees 5,907 6,715
Total 7,170$ 7,898$
Other revenues decreased by $0.7 million, or 8.9 percent, because the College did not receive any proceeds from refunding bonds and experienced a reduction in capital improvement fee revenue due to a decline in fee paying students which excludes participants in the dual enrollment program.
The Statement of Cash Flows
The statement of cash flows provides information about the College’s financial results by reporting the major sources and uses of cash and cash equivalents. This statement will assist in evaluating the College’s ability to generate net cash flows, its ability to meet its financial obligations as they come due, and its need for external financing. Cash flows from operating activities show the net cash used by the operating activities of the College. Cash flows from capital financing activities include all plant funds and related long-term debt activities. Cash flows from investing activities show the net source and use of
7

cash related to purchasing or selling investments, and earning income on those investments. Cash flows from noncapital financing activities include those activities not covered in other sections.
The following summarizes the College’s cash flows for the 2020-21 and 2019-20 fiscal years:
Condensed Statement of Cash Flows For the Fiscal Years
(In Thousands) 2020-21 2019-20
Cash Provided (Used) by:Operating Activities (230,517)$ (225,634)$ Noncapital Financing Activities 233,201 226,738 Capital and Related Financing Activities 317 (6,523) Investing Activities 142 948
Net Increase (Decrease) in Cash and Cash Equivalents 3,143 (4,471) Cash and Cash Equivalents, Beginning of Year 61,776 66,247
Cash and Cash Equivalents, End of Year 64,919$ 61,776$
Major sources of funds came from Federal and State student financial aid ($103.7 million), State noncapital appropriations ($95.3 million), student tuition and fees ($67.2 million), and Federal Direct Loan program receipts ($45.9 million). Major uses of funds were for payments to employees and for employee benefits ($187.3 million), scholarships ($65.2 million), suppliers ($50.4 million) and disbursements to students for the Federal Direct Loan program ($46.0 million).
Changes in cash and cash equivalents were the result of the following factors:
• Cash used by operating activities increased by $5.0 million, primarily due to an increase in payment to students for scholarships of $9.6 million, partially offset by an increase in revenue provided from distance learning fees of $3.5 million.
• Cash provided by noncapital financing activities increased by $6.5 million primarily due to Federal grants receipts from the Higher Education Emergency Relief Fund (HEERF).
• Cash used by capital and related financing activities decreased by $7.0 million because there were no major capital projects occurring in the 2020-21 fiscal year.
CAPITAL ASSETS, CAPITAL EXPENSES AND COMMITMENTS, AND DEBT ADMINISTRATION
Capital Assets
At June 30, 2021, the College had $436.0 million in capital assets, less accumulated depreciation of $159.0 million, for net capital assets of $277.0 million. Depreciation charges for the current fiscal year totaled $11.0 million. The following table summarizes the College’s capital assets, net of accumulated depreciation, at June 30:
8

Capital Assets, Net at June 30 (In Thousands)
2021 2020Land 32,988$ 32,988$ Construction in Progress 1,173 16,074 Buildings 209,081 200,829 Other Structures and Improvements 2,260 1,166 Furniture, Machinery, and Equipment 5,444 4,665 Leasehold Improvements 11,960 12,358 Assets Under Capital Leases 14,111 13,931
Capital Assets, Net 277,017$ 282,011$
Additional information about the College’s capital assets is presented in the notes to financial statements.
Capital Expenses and Commitments
Major capital expenses through June 30, 2021 were incurred for leasehold improvements to the Midtown Center for Accelerated Training building. The College’s construction commitments at June 30, 2021, are as follows:
Amount(In Thousands)
Total Committed 2,705$ Completed to Date (1,173)
Balance Committed 1,532$
Additional information about the College’s construction commitments is presented in the notes to financial statements.
Debt Administration
As of June 30, 2021, the College had $16.5 million in outstanding State Board of Education (SBE) capital outlay bonds and capital leases payable, representing an increase of $0.1 million, or 0.6 percent, from the prior fiscal year. The following table summarizes the outstanding long-term debt by type for the fiscal years ended June 30:
Long-Term Debt at June 30 (In Thousands)
2021 2020
SBE Capital Outlay Bonds 1,463$ 1,595$ Capital Leases 15,086 14,838
Total 16,549$ 16,433$
The State Board of Education (SBE) issues capital outlay bonds on behalf of the College. During the 2020-21 fiscal year, there were no bond sales and debt repayments totaled $0.5 million. Additional information about the College’s long-term debt is presented in the notes to financial statements.
9

ECONOMIC FACTORS THAT WILL AFFECT THE FUTURE
The College’s economic condition is closely tied to that of the State of Florida. Because of limited economic growth and increased demand for State resources, only a modest increase in State funding is anticipated in the 2021-22 fiscal year. The College’s current financial and capital plans indicate that there are adequate financial resources to maintain its present level of services.
REQUESTS FOR INFORMATION
Questions concerning information provided in the MD&A or other required supplementary information, and financial statements and notes thereto, or requests for additional financial information should be addressed to the Vice President for Business Operations and Finance, Valencia College, Post Office Box 3028, Orlando, Florida 32802.
10

VALENCIA COLLEGEA COMPONENT UNIT OF THE STATE OF FLORIDA
STATEMENT OF NET POSITIONFor the Fiscal Year Ended June 30, 2021
College College Component Totals(from AGL) Adjustments Unit
ASSETSCurrent Assets:
Cash and Cash Equivalents 42,712,994.26 42,712,994 3,148,412$ 45,861,406 Restricted Cash and Cash Equivalents 2,505,970.45 - 2,505,970 - 2,505,970 Investments 4,219,529.73 - 4,219,530 - 4,219,530 Restricted Investments - - - - - Accounts Receivable, Net 8,969,054.05 - 8,969,054 1,050,777 10,019,831 Notes Receivable, Net - - - - - Due from Other Governmental Agencies 4,864,340.59 - 4,864,341 - 4,864,341 Due from Component Unit/College 258,887.25 - 258,887 626 259,513 Inventories 1,357,267.36 - 1,357,267 - 1,357,267 Prepaid Expenses 101,235.13 - 101,235 - 101,235 Deposits - - - - - Other Assets - - - 5,962,808 5,962,808
Total Current Assets 64,989,278.82 -$ 64,989,279$ 10,162,623$ 75,151,901$
Noncurrent Assets:Restricted Cash and Cash Equivalents 19,700,978.85 -$ 19,700,979 - 19,700,979 Investments 11,000,216.09 - 11,000,216 - 11,000,216 Restricted Investments 34,514.18 - 34,514 89,286,309 89,320,823 Prepaid Expenses - - - - - Loans and Notes Receivable, Net - - - - - Depreciable Capital Assets, Net 242,856,328.81 - 242,856,329 5,097,459 247,953,788 Nondepreciable Capital Assets 34,161,009.89 - 34,161,010 3,084,064 37,245,074 Other Assets - - - - -
Total Noncurrent Assets 307,753,047.82 -$ 307,753,048 97,467,832 405,220,880
TOTAL ASSETS 372,742,326.64 -$ 372,742,327$ 107,630,455$ 480,372,781$
DEFERRED OUTFLOWS OF RESOURCESDeferred Outflow Related to Service Concession Arrangement - - - - - Deferred Outflows of Resources - Pension FRS 33,600,074.00 - 33,600,074 - 33,600,074 Deferred Outflows of Resources - Pension HIS 10,435,703.00 - 10,435,703 - 10,435,703 Deferred Outflows of Resources - Other Postemployment Benefits 3,593,463.00 - 3,593,463 - 3,593,463 Deferred Outflows of Resources - Asset Retirement Obligations - - - - Deferred Outflows of Resources - Lease Agreements - - - - - Deferred Outflows - Accumulated Decrease in Fair Value of Securities - - - - -
TOTAL DEFERRED OUTFLOWS OF RESOURCES 47,629,240.00 - 47,629,240$ $ 47,629,240$ TOTAL ASSETS AND DEFERRED OUTFLOWS OF RESOURCES 420,371,566.64 - 420,371,567$ 107,630,455$ 528,002,021$
LIABILITIESCurrent Liabilities:
Accounts Payable 1,906,222.75$ 1 1,906,224$ 113,310$ 2,019,534 Accrued Interest Payable - - - - - Salary and Payroll Taxes Payable 6,809,958.28 - 6,809,958 - 6,809,958 Retainage Payable 77,568.22 - 77,568 - 77,568 Due to Other Governmental Agencies 776,766.98 - 776,767 - 776,767 Due to Component Unit/College 440.95 441 345,507 345,948 Unearned Revenue 150,824.25 - 150,824 144,307 295,131 Estimated Insurance Claims Payable 9,094,271.36 - 9,094,271 - 9,094,271 Deposits Held for Others 712,071.47 - 712,071 - 712,071 Long-Term Liabilities - Current Portion: - - - -
Bonds Payable 136,000.00 - 136,000 - 136,000 Notes and Loans Payable - - - - - Installment Purchases Payable - - - - - Capital Leases Payable 472,925.08 - 472,925 - 472,925 Asset Retirement Obligations - Current - - - - - Special Termination Benefits Payable 35,333.88 - 35,334 - 35,334 Compensated Absences Payable 733,888.56 - 733,889 - 733,889 FRS Net Pension Liability - - - - - HIS Net Pension Liability 403,297.00 - 403,297 - 403,297 Other Postemployment Benefits Payable 431,421.00 - 431,421 - 431,421 Other Long-Term Liabilities - - - - -
Total Current Liabilities 21,740,989.78 1 21,740,991$ 603,124$ 22,344,114$
11

VALENCIA COLLEGEA COMPONENT UNIT OF THE STATE OF FLORIDA
STATEMENT OF NET POSITION (Continued)For the Fiscal Year Ended June 30, 2021
College College Component Totals(from AGL) Adjustments Unit
Noncurrent Liabilities:Bonds Payable 1,327,000.00$ - 1,327,000$ $ 1,327,000 Notes and Loans Payable - - - - - Installment Purchases Payable - - - - Capital Leases Payable 14,613,062.26 - 14,613,062 - 14,613,062 Asset Retirement Obligations - Non Current - - - - - Special Termination Benefits Payable 373,370.02 - 373,370 - 373,370 Compensated Absences Payable 11,121,514.34 - 11,121,514 - 11,121,514 FRS Net Pension Liability 86,476,445.00 - 86,476,445 - 86,476,445 HIS Net Pension Liability 38,282,181.00 - 38,282,181 - 38,282,181 Other Postemployment Benefits Payable 7,857,871.00 - 7,857,871 - 7,857,871 Other Long-Term Liabilities - - - - -
Total Noncurrent Liabilities 160,051,444 - 160,051,443 160,051,443
TOTAL LIABILITIES 181,792,433.40$ 1 181,792,434$ 603,124$ 182,395,557$
DEFERRED INFLOWS OF RESOURCESDeferred Inflow Related to Service Concession Arrangement - - - - - Deferred Inflows of Resources - Pension FRS 1,403,057.00 - 1,403,057 - 1,403,057 Deferred Inflows of Resources - Pension HIS 2,863,451.00 - 2,863,451 - 2,863,451 Deferred Inflows of Resources - Other Postemployment Benefits 263,299.00 263,299 - 263,299 Deferred Inflows - Irrevocable Split-Interest Agreements - - - - - Deferred Inflows - Lease Agreements - - - - - Deferred Inflows - Accumulated Increase in Fair Value of Securities - - - - -
TOTAL DEFERRED INFLOWS OF RESOURCES 4,529,807.00$ - 4,529,807$ $ 4,529,807 TOTAL LIABILITIES AND DEFERRED INFLOWS OF RESOURCES 186,322,240.40$ 1$ 186,322,241$ 603,124$ 186,925,364$
NET POSITIONNet Investment in Capital Assets 260,468,351.36 - 260,468,351 8,181,523 268,649,874 Restricted:
Nonexpendable: - Endowment - - - 39,489,309 39,489,309
Expendable: - - Endowment 10,794,371.11 - 10,794,371 - 10,794,371 Grants and Loans 1,813,390.52 - 1,813,391 51,280,673 53,094,064 Scholarships 1,618,379.37 - 1,618,379 - 1,618,379 Capital Projects 19,700,978.85 - 19,700,979 - 19,700,979 Debt Service 34,514.18 - 34,514 - 34,514 Other - - - -
Unrestricted (60,380,659.15) - (60,380,659) 8,075,826$ (52,304,833)
Total Net Position 234,049,326.24$ - 234,049,326$ 107,027,331$ 341,076,657$
TOTAL LIABILITIES, DEFERRED INFLOWS OF RESOURCES AND NET POSITION 420,371,566.64$ 1 420,371,567$ 107,630,455$ 528,002,021$
The accompanying notes to financial statements are an integral part of this statement.
12

VALENCIA COLLEGEA COMPONENT UNIT OF THE STATE OF FLORIDA
STATEMENT OF REVENUES, EXPENSES, AND CHANGES IN NET POSITIONFor the Fiscal Year Ended June 30, 2021
College College Component Totals(from AGL) Adjustments Unit
REVENUESOperating Revenues:
Student Tuition and Fees, Net of ScholarshipAllowances of $ 47,636,757 70,691,973.72 $ 70,691,974 $ 70,691,974$
Federal Grants and Contracts 1,130,065.30 - 1,130,065 - 1,130,065$ State and Local Grants and Contracts - - - 272,103 272,103$ Nongovernmental Grants and Contracts - - - 2,503,152 2,503,152$ Sales and Services of Educational Departments 33,040.00 - 33,040 - 33,040$ Auxiliary Enterprises, Net of Scholarship -
Allowances of $ 4,535,571 7,220,367.28 - 7,220,367 - 7,220,367$ Other Operating Revenues 710,765.53 190,965 901,731 782,070 1,683,801$
Total Operating Revenues 79,786,211.83 190,965.00$ 79,977,177 3,557,325.00$ 83,534,502$
EXPENSESOperating Expenses:
Personnel Services 200,056,808.74 $ 200,056,809 1,107,060$ 201,163,869$ Scholarships and Waivers 65,160,587.28 - 65,160,587 6,075,778 71,236,365$ Utilities and Communications 4,398,434.36 - 4,398,434 - 4,398,434$ Contractual Services 10,618,847.36 - 10,618,847 382,239 11,001,086$ Other Services and Expenses 8,526,093.43 1 8,526,094 1,682,978 10,209,072$ Materials and Supplies 34,429,850.57 - 34,429,851 18,782 34,448,633$ Depreciation 11,017,585.62 - 11,017,586 160,729 11,178,315$
Total Operating Expenses 334,208,207.36 1.00$ 334,208,208 9,427,566.00$ 343,635,774$
Operating Loss (254,421,995.53) 190,964.00$ (254,231,031) (5,870,241.00)$ (260,101,272)$
NONOPERATING REVENUES (EXPENSES)State Noncapital Appropriations 95,308,089.00 $ 95,308,089 $ 95,308,089$ Federal and State Student Financial Aid 103,669,206.78 - 103,669,207 - 103,669,207$ Gifts and Grants 34,269,621.20 - 34,269,621 - 34,269,621$ Investment Income 445,775.91 - 445,776 3,267,217 3,712,993$ Net Gain (Loss) on Investments (112,353.07) - (112,353) 23,062,399 22,950,046$ Other Nonoperating Revenues 325,912.44 - 325,912 - 325,912$ Gain on Disposal of Capital Assets 26,352.36 - 26,352 - 26,352$ Interest on Capital Asset-Related Debt (548,299.09) - (548,299) - (548,299)$ Other Nonoperating Expenses - - - - -$
Net Nonoperating Revenues (Expenses) 233,384,305.53 -$ 233,384,305 26,329,616.00$ 259,713,921$
Income (Loss) Before Other Revenues,Expenses, Gains, or Losses (21,037,690.00) 190,964.00$ (20,846,726) 20,459,375.00$ (387,351)$
State Capital Appropriations 1,263,200.00 $ 1,263,200 $ 1,263,200$ Capital Grants, Contracts, Gifts, and Fees 5,906,741.63 - 5,906,742 - 5,906,742$ Additions to Endowments - - - - -$ Other Revenues (Expenses) - - - - -$
Total Other Revenues 7,169,941.63$ -$ 7,169,942$ -$ 7,169,942$
Increase (Decrease) in Net Position (13,867,748.37)$ 190,964.00$ (13,676,784)$ 20,459,375.00$ 6,782,591$
Net Position, Beginning of Year 247,726,110 86,567,956 334,294,066 Adjustments to Beginning Net Position - -
Net Position, Beginning of Year, as Restated 247,726,110 86,567,956 334,294,066
Net Position, End of Year 234,049,326 107,027,331 341,076,657
The accompanying notes to financial statements are an integral part of this statement.
13

VALENCIA COLLEGEA COMPONENT UNIT OF THE STATE OF FLORIDA
STATEMENT OF CASH FLOWSFor the Fiscal Year Ended June 30, 2021
College(from AGL) Adjustments College
CASH FLOWS FROM OPERATING ACTIVITIESTuition and Fees, Net 67,165,450.66$ -$ 67,165,451$ Grants and Contracts 1,956,984.81 - 1,956,985 Payments to Suppliers (50,352,161.65) - (50,352,162) Payments for Utilities and Communications (4,398,434.36) - (4,398,434) Payments to Employees (148,485,080.46) - (148,485,080) Payments for Employee Benefits (38,828,385.80) - (38,828,386) Payments for Scholarships (65,160,587.28) - (65,160,587) Loans Issued to Students - - - Collection of Loans to Students - - - Auxiliary Enterprises, Net 7,112,521.89 - 7,112,522 Sales and Services of Educational Departments 33,040.00 - 33,040 Other Receipts 440,011.87 - 440,012
Net Cash Used by Operating Activities (230,516,640.32)$ -$ (230,516,639)$
CASH FLOWS FROM NONCAPITAL FINANCING ACTIVITIESState Noncapital Appropriations 95,308,089.00$ - 95,308,089$ Federal and State Student Financial Aid 103,669,256.43 - 103,669,256 Federal Direct Loan Program Receipts 45,910,346.00 - 45,910,346 Federal Direct Loan Program Disbursements (45,955,266.00) - (45,955,266) Gifts and Grants Received for Other than Capital or Endowment Purposes 34,269,621.20 - 34,269,621 Private Gifts for Endowment Purposes - - - Other Nonoperating Receipts (Disbursements) - - -
Net Cash Provided by Noncapital Financing Activities 233,202,046.63$ -$ 233,202,046$
CASH FLOWS FROM CAPITAL AND RELATED FINANCING ACTIVITIESProceeds from Capital Debt -$ - -$ State Capital Appropriations 1,265,479.81 - 1,265,480 Capital Grants and Gifts 5,889,741.63 - 5,889,742 Proceeds from Sale of Refunding of Bonds - - - Proceeds from Sale of Capital Assets 325,912.44 - 325,912 Purchases of Capital Assets (6,088,224.61) - (6,088,225) Principal Paid on Capital Debt and Leases (527,741.78) - (527,742) Interest Paid on Capital Debt and Leases (548,299.09) - (548,299) Deposits with Trustee - - -
Net Cash Provided by Capital and Related Financing Activities 316,868.40 316,868
CASH FLOWS FROM INVESTING ACTIVITIESProceeds from Sales and Maturities of Investments 112,353.17 - 112,353 Purchase of Investments - - - Investment Income 29,427.53 - 29,428
Net Cash Provided by Investing Activities 141,780.70 -$ 141,781
Net Increase in Cash and Cash Equivalents 3,144,056 Cash and Cash Equivalents, Beginning of Year 61,775,887
Cash and Cash Equivalents, End of Year 64,919,943$
14

VALENCIA COLLEGEA COMPONENT UNIT OF THE STATE OF FLORIDASTATEMENT OF CASH FLOWS (Continued)For the Fiscal Year Ended June 30, 2021
College
RECONCILIATION OF OPERATING LOSSTO NET CASH USED BY OPERATING ACTIVITIES
Operating Loss (254,231,031)$ Adjustments to Reconcile Operating Loss to Net Cash Used by Operating Activities:
Depreciation Expense 11,017,586 Changes in Assets and Liabilities:
Receivables, Net (3,175,461.56)$ - (3,175,462)$ Notes Receivables, Net (Loans to Students) -$ - - Due from Other Governmental Agencies 416,378.63$ - 416,379 Due from Component Unit 344,538.98$ - 344,539 Due to Other Governmental Agencies (653,803.30)$ - (653,803) Inventories 559,385.38$ - 559,385 Prepaid Expenses 2,188,889.34$ - 2,188,889 Other Assets 169.00$ - 169 Accounts Payable 414,119.62$ - 414,120 Retirement Plan(s) Payable -$ - - Salaries and Payroll Taxes Payable 1,112,055.38$ - 1,112,055 Unearned Revenue (332,668.62)$ - (332,669) Estimated Insurance Claims Payable (3,235,307.33)$ - (3,235,307) Deposits Held for Others 191,915.64$ - 191,916 Special Termination Benefits Payable 33,867.77$ - 33,868 Compensated Absences Payable 1,579,970.66$ - 1,579,971 Other Postemployment Benefits Payable 1,356,189.00$ - 1,356,189 Net Pension Liability 18,316,309.00$ - 18,316,309 Deferred Outflows of Resources Related to Pensions (3,364,303.00)$ - (3,364,303) Deferred Inflows of Resources Related to Pensions (3,055,439.00)$ - (3,055,439) Deferred Outflows of Resources Asset Retirement Obligations -$ - -
Net Cash Used by Operating Activities (230,516,639)
SUPPLEMENTAL DISCLOSURE OF NONCASH INVESTING AND CAPITAL FINANCING ACTIVITIES
Unrealized losses on investments were recognized on the statement of revenues, expenses, and changes in net position, but are not cash transactions for the statement of cash flows. 112,353$
The College entered into capital lease purchases totaling $624,849 and $18,672 for theacquisition of servers and vehicles, respectively. The new debt and capital assests related to the captial lease purchases were recorded as an increase to long term debt and capitalassets on the statement of net position, but are not cash transactions for the statement of of cash flows. 643,521$
The accompanying notes to financial statements are an integral part of this statement.
15

NOTES TO FINANCIAL STATEMENTS
1. Summary of Significant Accounting Policies
Reporting Entity. The governing body of Valencia College, a component unit of the State of Florida, is the College Board of Trustees. The Board of Trustees constitutes a corporation and is composed of nine members appointed by the Governor and confirmed by the Senate. The Board of Trustees is under the general direction and control of the Florida Department of Education, Division of Florida Colleges, and is governed by State law and State Board of Education (SBE) rules. However, the Board of Trustees is directly responsible for the day-to-day operations and control of the College within the framework of applicable State laws and SBE rules. The College serves Orange and Osceola Counties.
Criteria for defining the reporting entity are identified and described in the Governmental Accounting Standards Board’s (GASB) Codification of Governmental Accounting and Financial Reporting Standards, Sections 2100 and 2600. These criteria were used to evaluate potential component units for which the Board of Trustees is financially accountable and other organizations for which the nature and significance of their relationship with the Board of Trustees are such that exclusion would cause the College’s financial statements to be misleading. Based on the application of these criteria, the College is a component unit of the State of Florida, and its financial balances and activities are reported in the State’s Comprehensive Annual Financial Report by discrete presentation.
Discretely Presented Component Unit(s). Based on the application of the criteria for determining component units, the Valencia College Foundation, Inc. (Foundation), a legally separate entity, is included within the College’s reporting entity as a discretely presented component unit and is governed by a separate board.
The Foundation is also a direct-support organization, as defined in Section 1004.70, Florida Statutes, and although legally separate from the College, is financially accountable to the College. The Foundation is managed independently, outside the College’s budgeting process, and its powers generally are vested in a governing board pursuant to various State statutes. The Foundation receives, holds, invests, administers property, and makes expenditures to or for the benefit of the College.
The Foundation is audited by other auditors pursuant to Section 1004.70(6), Florida Statutes. The Foundation’s audited financial statements are available to the public and can be obtained from the Vice President for Business Operations and Finance, Valencia College, Post Office Box 3028, Orlando, Florida 32802. The financial data reported on the accompanying financial statements was derived from the Foundation’s audited financial statements for the fiscal year ended March 31, 2021.
Basis of Presentation. The College’s accounting policies conform with accounting principles generally accepted in the United States of America applicable to public colleges and universities as prescribed by GASB. The National Association of College and University Business Officers (NACUBO) also provides the College with recommendations prescribed in accordance with generally accepted accounting principles promulgated by GASB and the Financial Accounting Standards Board (FASB). GASB allows public colleges various reporting options. The College has elected to report as an entity engaged in only
16

business-type activities. This election requires the adoption of the accrual basis of accounting and entitywide reporting including the following components:
Management’s Discussion and Analysis Basic Financial Statements:
Statement of Net Position Statement of Revenues, Expenses, and Changes in Net Position Statement of Cash Flows Notes to Financial Statements
Other Required Supplementary Information
Measurement Focus and Basis of Accounting. Basis of accounting refers to when revenues, expenses, assets, deferred outflows of resources, liabilities, and deferred inflows of resources are recognized in the accounts and reported in the financial statements. Specifically, it relates to the timing of the measurements made, regardless of the measurement focus applied. The College’s financial statements are presented using the economic resources measurement focus and the accrual basis of accounting. Revenues, expenses, gains, losses, assets, deferred outflows of resources, liabilities, and deferred inflows of resources resulting from exchange and exchange-like transactions are recognized when the exchange takes place. Revenues, expenses, gains, losses, assets, deferred outflows of resources, liabilities, and deferred inflows of resources resulting from nonexchange activities are generally recognized when all applicable eligibility requirements, including time requirements, are met. The College follows GASB standards of accounting and financial reporting.
The College’s component unit uses the economic resources measurement focus and the accrual basis of accounting, and follows FASB standards of accounting and financial reporting for not-for-profit organizations.
Significant interdepartmental sales between auxiliary service departments and other institutional departments have been accounted for as reductions of expenses and not revenues of those departments.
The College’s principal operating activity is instruction. Operating revenues and expenses generally include all fiscal transactions directly related to instruction as well as administration, academic support, student services, physical plant operations, and depreciation of capital assets. Nonoperating revenues include State noncapital appropriations, Federal and State student financial aid, and investment income (net of unrealized gains or losses on investments). Interest on capital asset-related debt is a nonoperating expense
The statement of net position is presented in a classified format to distinguish between current and noncurrent assets and liabilities. When both restricted and unrestricted resources are available to fund certain programs, it is the College’s policy to first apply the restricted resources to such programs followed by the use of the unrestricted resources.
The statement of revenues, expenses, and changes in net position is presented by major sources and is reported net of tuition scholarship allowances. Tuition scholarship allowances are the difference between the stated charge for goods and services provided by the College and the amount that is actually paid by the student or the third party making payment on behalf of the student. The College calculated its
17

scholarships allowance by identifying amounts within its student accounts receivable system paid by student aid for tuition and books. The amounts are deducted from student tuition and fees and auxiliary enterprises, respectively.
The statement of cash flows is presented using the direct method in compliance with GASB Statement No. 9, Reporting Cash Flows of Proprietary and Nonexpendable Trust Funds and Governmental Entities That Use Proprietary Fund Accounting.
Cash and Cash Equivalents. The amount reported as cash and cash equivalents consists of cash on hand, cash in demand accounts, and cash placed with the State Board of Administration (SBA) Florida PRIME investment pool. For reporting cash flows, the College considers all highly liquid investments with original maturities of 3 months or less, that are not held solely for income or profit, to be cash equivalents. Under this definition, the College considers amounts invested in SBA Florida PRIME investment pool to be cash equivalents.
College cash deposits are held in banks qualified as public depositories under Florida law. All such deposits are insured by Federal depository insurance, up to specified limits, or collateralized with securities held in Florida’s multiple financial institution collateral pool required by Chapter 280, Florida Statutes. Cash and cash equivalents that are externally restricted to make debt service payments, maintain sinking or reserve funds, or to purchase or construct capital or other restricted assets are classified as restricted.
At June 30, 2021, the College reported as cash equivalents $55,019,533 in the Florida PRIME investment pool administered by the SBA pursuant to Section 218.405, Florida Statutes. The College’s investments in the Florida PRIME investment pool, which the SBA indicates is a Securities and Exchange Commission Rule 2a7-like external investment pool, are similar to money market funds in which shares are owned in the fund rather than the underlying investments. The Florida PRIME investment pool carried a credit rating of AAAm by Standard & Poor’s and had a weighted-average days to maturity (WAM) of 50 days as of June 30, 2021. A portfolio’s WAM reflects the average maturity in days based on final maturity or reset date, in the case of floating-rate instruments. WAM measures the sensitivity of the Florida PRIME investment pool to interest rate changes. The investments in the Florida PRIME investment pool are reported at amortized cost.
Section 218.409(8)(a), Florida Statutes, provides that “the principal, and any part thereof, of each account constituting the trust fund is subject to payment at any time from the moneys in the trust fund. However, the executive director may, in good faith, on the occurrence of an event that has a material impact on liquidity or operations of the trust fund, for 48 hours limit contributions to or withdrawals from the trust fund to ensure that the Board [State Board of Administration] can invest moneys entrusted to it in exercising its fiduciary responsibility. Such action must be immediately disclosed to all participants, the trustees, the Joint Legislative Auditing Committee, and the Investment Advisory Council. The trustees shall convene an emergency meeting as soon as practicable from the time the executive director has instituted such measures and review the necessity of those measures. If the trustees are unable to convene an emergency meeting before the expiration of the 48-hour moratorium on contributions and withdrawals, the moratorium may be extended by the executive director until the trustees are able to meet to review the necessity for the moratorium. If the trustees agree with such measures, the trustees shall vote to continue the measures for up to an additional 15 days.” The trustees must convene and
18

vote to continue any such measures before the expiration of the time limit set, but in no case may the time limit set by the trustees exceed 15 days. As of June 30, 2021, there were no redemption fees or maximum transaction amounts, or any other requirements that serve to limit a participant’s daily access to 100 percent of their account value.
Inventories. Inventories consist of items for resale by the campus bookstore, and are valued using the last invoice cost, which approximates the first-in, first-out method of inventory valuation. Consumable laboratory supplies, teaching materials, and office supplies on hand in College departments are expensed when purchased, and are not considered material. Accordingly, these items are not included in the reported inventory.
Capital Assets. College capital assets consist of land, construction in progress, buildings, other structures and improvements, furniture, machinery, and equipment, leasehold improvements, and assets under capital leases. These assets are capitalized and recorded at cost at the date of acquisition or at acquisition value at the date received in the case of gifts and purchases of State surplus property. Additions, improvements, and other outlays that significantly extend the useful life of an asset are capitalized. Other costs incurred for repairs and maintenance are expensed as incurred. The College has a capitalization threshold of $5,000 for tangible personal property and $50,000 for buildings and other structures and improvements. Depreciation is computed on the straight-line basis over the following estimated useful lives:
Buildings – 40 years Other Structures and Improvements – 10 years Furniture, Machinery, and Equipment:
Computer Equipment – 3 years Vehicles, Office Machines, and Educational Equipment – 5 years Furniture – 7 years
Leasehold Improvements – 10 to 40 years
Asset(s) Under Capital Lease(s) – 3 to 40 years
Noncurrent Liabilities. Noncurrent liabilities include bonds payable, capital leases payable, special termination benefits payable, compensated absences payable, other postemployment benefits payable (OPEB), and net pension liabilities that are not scheduled to be paid within the next fiscal year.
Pensions. For purposes of measuring the net pension liability, deferred outflows of resources and deferred inflows of resources related to pensions, and pension expense, information about the fiduciary net positions of the Florida Retirement System (FRS) defined benefit plan and the Health Insurance Subsidy (HIS) defined benefit plan and additions to/deductions from the FRS and HIS fiduciary net positions have been determined on the same basis as they are reported by the FRS and the HIS plans. Benefit payments (including refunds of employee contributions) are recognized when due and payable in accordance with benefit terms. Investments are reported at fair value.
19

2. Deficit Net Position in Individual Funds
The College reported an unrestricted net position which included a deficit in the current funds - unrestricted, as shown below. This deficit can be attributed to the full recognition of long-term liabilities (i.e., compensated absences payable, OPEB payable, and net pension liabilities) in the current unrestricted funds.
3. Investments
The Board of Trustees has adopted a written investment policy providing that surplus funds of the College shall be invested in those institutions and instruments permitted under the provisions of Florida Statutes. Section 218.415(16), Florida Statutes, authorizes the College to invest in the Florida PRIME investment pool administered by the State Board of Administration (SBA); Securities and Exchange Commission registered money market funds with the highest credit quality rating from a nationally recognized rating agency; interest-bearing time deposits and savings accounts in qualified public depositories, as defined by Section 280.02, Florida Statutes; direct obligations of the United States Treasury; obligations of Federal agencies and instrumentalities; securities of, or interests in, certain open-end or closed-end management type investment companies; and other investments approved by the Board of Trustees as authorized by law. State Board of Education (SBE) Rule 6A-14.0765(3), Florida Administrative Code, provides that College loan, endowment, annuity, and life income funds may also be invested pursuant to Section 215.47, Florida Statutes. Investments authorized by Section 215.47, Florida Statutes, include bonds, notes, commercial paper, and various other types of investments.
Investments set aside to make debt service payments, maintain sinking or reserve funds, or to purchase or construct capital assets are classified as restricted.
Fair Value Measurement. The College categorizes its fair value measurements within the fair value hierarchy established by generally accepted accounting principles. The hierarchy is based on the valuation inputs used to measure the fair value of the asset. Level 1 inputs are quoted prices in active markets for identical assets, Level 2 inputs are significant other observable inputs, and Level 3 inputs are significant unobservable inputs.
All of the College’s recurring fair value measurements as of June 30, 2021, are valued using quoted market prices (Level 1 inputs),
The College’s investments at June 30, 2021, are reported as follows:
Fund Net Position
Curent Funds - Unrestricted (72,673,040)$ Auxiliary Funds 12,292,381
Total (60,380,659)$
20

State Board of Administration Debt Service Accounts. The College reported investments totaling $34,514 at June 30, 2021, in the SBA Debt Service Accounts. These investments are used to make debt service payments on bonds issued by the SBE for the benefit of the College. The College’s investments consist of United States Treasury securities, with maturity dates of 6 months or less, and are reported at fair value (Level 1 inputs). The College relies on policies developed by the SBA for managing interest rate risk and credit risk for these accounts. Disclosures for the Debt Service Accounts are included in the notes to financial statements of the State’s Comprehensive Annual Financial Report.
Other Investments.
The College’s other investments totaling $15,219,746 at June 30, 2021, consists of fixed income mutual funds reported at their fair value. The following risks apply to these investments:
Interest Rate Risk: Interest rate risk is the risk that changes in interest rates will adversely affect the fair market value of each investment. The College’s investment policy limits interest rate risk by attempting to match investments maturities to known cash needs and anticipated cash flow requirement.
As a means of managing its exposure to fair-value losses arising from increasing interest rates, the College has established a target duration of its fixed-income portfolio of 1 to 3 years.
Credit Risk: Credit risk is the risk that an issuer or other counterparty to an investment will not fulfill its obligations. The College’s investment policy provides for credit risk. The risk varies depending on the type of investment. The College’s investment in mutual funds at June 30, 2021 were not rated.
Custodial Credit Risk: Custodial credit risk is the risk that, in the event of failure of the counterparty, the College will not be able to recover the value of its investments or collateral securities that are in the possession of an outside party. The College’s investment policy pursuant to Section 218.415(18), Florida Statutes, requires securities, with the exception of certificates of deposit, be held with a third-party custodian; and all securities purchased by, and all collateral obtained by College, should be properly designated as an asset of the College. The securities must be held in an account separate and apart
Quoted Prices Significant in Active Other Significant
Markets for Observable UnobservableIdentical Assets Inputs Inputs
Investments by fair value level Amount (Level 1) (Level 2) (Level 3)SBA Debt Service Accounts 34,514$ 34,514$ -$ -$ Mutual Funds: Fixed Income 15,219,746 15,219,746 - - Total investments by fair value level 15,254,260$ 15,254,260$ -$ -$
Fair Value Measurements Using
Investment Maturities
Percent of
Portfolio
Less than 1 Year 28%1 to 3 Years 72%
100%
21

from the assets of the financial institution. A third-party custodian is defined as any bank depository chartered by the Federal Government, State of Florida, or by a national association organized and existing under the laws of the United States which is authorized to accept and execute trust and is doing business in the State of Florida. Certificates of deposit will be placed in the provider’s safekeeping department for the term of the deposit.
At June 30, 2021, the College’s mutual fund investments were held by a third-party custodian as required by the College’s investment policy.
Concentration of Credit Risk: Concentration of credit risk is the risk of loss attributable to the magnitude of the College’s investments to a single issuer. The College’s investment policy has established asset allocation and issuer limits which are designed to reduce concentration of credit reis of the College’s investment portfolio. United States Treasury securities and obligations explicitly guaranteed by the U.S. Government are not considered to have credit risk and do not have purchase limitations. As of June 30, 2021, there were no concentrations of credit risk.
Component Unit(s) Investments.
The Foundation categorizes its fair value measurements within the hierarchy established by generally accepted accounting principles. The fair value of investments consists of the following:
The valuation method for investments measured at the net asset value (NAV) per share (or its equivalent) is presented in the following table:
Quoted Prices Significant in Active Other Significant
Markets for Observable UnobservableIdentical Assets Inputs Inputs
Investments by fair value level Amount (Level 1) (Level 2) (Level 3)
Cash & Equivalents 2,528,734$ 2,528,734$ Fixed income mutual funds 21,281,985 21,281,985 -$ -$ Equity mutual funds 38,124,300 38,124,300 - - International mutual funds 19,571,852 19,571,852 - -
Total investments by fair value level 81,506,871$ 81,506,871$ -$ -$
Investments measured at the net asset value (NAV)
SEI Energy Debt Fund, LP 2,694,043 SEI Structured Credit Fund, LP 4,616,165 SEI Structured Core Property, LP 2,997,964
Total investments measured at NAV 10,308,172
Total investments measured at fair value 91,815,043$
Fair Value Measurements Using
22

4. Accounts Receivable
Accounts receivable represent amounts for student fee deferments, unused credit memos, and contract and grant reimbursements due from third parties. The accounts receivable are reported net of a $1,528,501 allowance for doubtful accounts.
5. Due From Other Governmental Agencies
The amount due from other governmental agencies primarily consists of $1,866,535 due from the United States Department of Education for reimbursement of expenditures from the Institutional Portion of the Higher Education Emergency Relief Fund (HEERF) Formula Grants and $915,557 due from Florida Prepaid College Board for payment of tuition and fees for students under contract enrolled in summer term.
6. Due From and To Component Unit(s)/College
The $258,887 amount due from component unit consists of amounts owed to the College by the Foundation for grant expenditure reimbursements and scholarship costs. The $441 reported as due to component unit consists of amounts owed by the College to the Foundation for theater production ticket sales. The College’s financial statements are reported for the fiscal year ended June 30, 2021. The College’s component unit financial statements are reported for the fiscal year ended March 31, 2021. Accordingly, amounts reported by the College as due from and to component unit on the statement of net position do not agree with amounts reported by the component unit as due from and to the College.
Redemption RedemptionUnfunded Frequency (if Notice
Investments measured at the NAV Fair Value Commitments Currently Eligible) Period
SEI Energy Debt Fund, L.P. 2,694,043$ -$ 3-year lock up on each subscription (50% available after lockup then 25% available for each of the next 2 semi-annual periods.)
Semi-annual with 95 days notice, 10% holdback on total redemptions.
SEI Structured Credit Fund, L.P. 4,616,165$ -$ 2-year lockup on each subscription.
Made via tender offer. Tender offer is at discretion of advisor. 65 days notice, 10% holdback on total redemptions.
SEI Structured Core Property, LP 2,997,964$ -$ No lock up period. Subject to gate that can be imposed if withdrawal amounts are greater than 25% of NAV.
Requires a 95-day notice, subject to certain holdback restrictions.
Total investments measured at the NAV 10,308,172$ -$
23

7. Capital Assets
Capital assets activity for the fiscal year ended June 30, 2021, is shown in the following table:
8. Long-Term Liabilities
Long-term liabilities activity for the fiscal year ended June 30, 2021, is shown in the following table:
Bonds Payable. The State Board of Education (SBE) issues capital outlay bonds on behalf of the College. These bonds mature serially and are secured by a pledge of the College’s portion of the State-assessed motor vehicle license tax and by the State’s full faith and credit. The SBE and the SBA
DescriptionBeginning Balance Additions Reductions
Ending Balance
Nondepreciable Capital Assets:Land 32,987,698$ -$ -$ 32,987,698$ Construction in Progress 16,073,573 2,132,116 17,032,377 1,173,312
Total Nondepreciable Capital Assets 49,061,271$ 2,132,116$ 17,032,377$ 34,161,010$
Depreciable Capital Assets:Buildings 324,491,920$ 15,624,470 - 340,116,390$ Other Structures and Improvements 1,731,345 1,407,907 - 3,139,252 Furniture, Machinery, and Equipment 26,889,160 3,294,420 738,208 29,445,372 Leasehold Improvements 13,193,098 - - 13,193,098 Asset Under Capital Lease 15,298,374 643,521 - 15,941,895
381,603,897 20,970,318 738,208 401,836,007
Less, Accumulated Depreciaton:Buildings 123,663,450 7,372,162 - 131,035,612 Other Structures and Improvements 565,105 313,925 - 879,030 Furniture, Machinery, and Equipment 22,223,617 2,468,983 691,644 24,000,956 Leasehold Improvements 834,732 398,133 - 1,232,865 Asset Under Capital Lease 1,366,832 464,383 - 1,831,215
148,653,736 11,017,586 691,644 158,979,678
Total Depreciable Capital Assets, Net 232,950,161$ 9,952,732$ 46,564$ 242,856,329$
DescriptionBeginning Balance Additions Reductions Ending Balance
Current Portion
Bonds Payable 1,595,000$ -$ 132,000$ 1,463,000$ 136,000$ Capital Lease Payable 14,838,208 643,521 395,742 15,085,987 472,925 Special Termination Benefits Payable 374,836 66,855 32,987 408,704 35,334 Compensated Absences Payable 10,275,432 2,190,762 610,791 11,855,403 733,889 Other Postemployment
Benefits Payable 6,933,103 1,715,163 358,974 8,289,292 431,421 Net Pension Liability 106,845,614 63,539,487 45,223,178 125,161,923 403,297
140,862,193$ 68,155,788$ 46,753,672$ 162,264,309$ 2,212,866$
24

administer the principal and interest payments, investment of debt service resources, and compliance with reserve requirements. The College had the following bond payable at June 30, 2021:
Annual requirements to amortize all bonded debt outstanding as of June 30, 2021, are as follows:
Capital Leases Payable. The College entered into a capital lease agreement in the amount of $6,615,433 at a stated interest rate of 6.77 percent to acquire an administrative office building. The lease agreement commenced on April 1, 2014 and expires 60 years from this date. The lease agreement contains a purchase option that may be exercised during the period commencing January 1, 2020 and expiring the earlier of May 31, 2073, or the sale of property to a third party. As of June 30, 2021, the College has not exercised its option to purchase the building.
The College had the following capital lease agreements to acquire vehicles for College use as of June 30, 2021:
All lease agreements contain a buy-out option that may be exercised at the end of their respective lease agreement terms.
The College entered into a capital lease agreement in the amount of $624,849 at a stated interest rate of 3.85 percent to acquire two data servers on April 29, 2021. Lease payments commence on August 1,
Bond TypeAmount
Outstanding
Interest Rates
(Percent)
Annual Maturity
To
SBE Capital Bond:Series 2020A 1,463,000$ 2.0 - 5.0 2030
Total 1,463,000$
Fiscal YearEnding June 30 Principal Interest Total
2022 136,000$ 68,920$ 204,920$ 2023 141,000 62,120 203,120 2024 145,000 59,300 204,300 2025 152,000 52,050 204,050 2026 161,000 44,450 205,450 2027-2030 728,000 93,300 821,300
Total 1,463,000$ 380,140$ 1,843,140$
SBE Capital Outlay Bond
Lease Commenced
Lease Expiration
(Years)Imputed
Interest RateNumber of Vehicles Principal Interest Total
February 2019 5 11.82 - 12.03 9 77,330 12,943 90,273 August 2019 5 13.43 2 24,506 5,557 30,063 May 2021 5 10.38 1 18,193 5,022 23,215
12 120,029$ 23,522$ 143,551$
25

2021 and expires 5 years from this date. The lease agreement conveys title of the servers to the college at the end of the lease term.
The College entered into a capital lease agreement in the amount of $8,357,399 at an imputed interest rate of 4 percent to acquire classroom and academic support space. The lease agreement commenced on August 1, 2019 and expires 40 years from this date.
Future minimum payments under the capital lease agreements and present value of the minimum payments as of June 30, 2021, are as follows:
Special Termination Benefits Payable. Executive management employees are provided 7 days of administrative incentive leave credit each year. Such credit is prorated for each month worked to a maximum of 35 days. Payment of such credited service is made at the time of termination from full-time executive management for any reason other than cause. Accrued benefits for 21 participants at June 30, 2021, totaled $408,704.
Compensated Absences Payable. College employees may accrue annual and sick leave based on length of service, subject to certain limitations regarding the amount that will be paid upon termination. The College reports a liability for the accrued leave; however, State noncapital appropriations fund only the portion of accrued leave that is used or paid in the current fiscal year. Although the College expects the liability to be funded primarily from future appropriations, generally accepted accounting principles do not permit the recording of a receivable in anticipation of future appropriations. At June 30, 2021, the estimated liability for compensated absences, which includes the College’s share of the Florida Retirement System and FICA contributions, totaled $11,855,403. The current portion of the compensated absences liability, $733,889, is the amount expected to be paid in the coming fiscal year and represents a historical percentage of leave used applied to total accrued leave liability.
Fiscal Year Ending June 30 Amount2022 956,801$ 2023 956,801 2024 942,240 2025 947,297 2026 952,557 2027-2031 4,145,430 2032-2036 4,351,680 2037-2041 4,557,930 2042-2046 4,764,180 2047-2051 4,970,430 2052-2056 5,176,680 2057-2061 4,198,138 2062-2066 2,282,305 2067-2071 2,282,305 2072-2074 1,369,382
Total Minimum Payments 42,854,156 Less, Amount Representing Interest 27,768,169
Present Value of Minumum Payments 15,085,987$
26

Other Postemployment Benefits Payable. The College follows GASB Statement No. 75, Accounting and Financial Reporting for Postemployment Benefits Other Than Pensions, for certain other postemployment benefits administered by the College and life, dental and vision insurance benefits through purchased commercial insurance.
General Information about the OPEB Plan
Plan Description. The Other Postemployment Benefits Plan (OPEB Plan) is a single-employer defined benefit plan administered by the College that provides OPEB for all employees who satisfy the College’s retirement eligibility provisions. Pursuant to the provisions of Section 112.0801, Florida Statutes, former employees who retire from the College are eligible to participate in the College’s health and hospitalization plan for medical, prescription drug, dental, vision, and life insurance coverage. The College subsidizes the premium rates paid by retirees by allowing them to participate in the OPEB Plan at reduced or blended group (implicitly subsidized) premium rates for both active and retired employees. These rates provide an implicit subsidy for retirees because, on an actuarial basis, their current and future claims are expected to result in higher costs to the OPEB Plan on average than those of active employees. The College does not offer any explicit subsidies for retiree coverage. Retirees are required to enroll in the Federal Medicare (Medicare) program for their primary coverage as soon as they are eligible. The OPEB Plan contribution requirements and benefit terms of the College and the OPEB Plan members are established and may be amended by action from the Board. No assets are accumulated in a trust that meet the criteria in paragraph 4 of GASB Statement No. 75.
Benefits Provided. The OPEB Plan provides healthcare benefits for retirees and their dependents. The OPEB Plan only provides an implicit subsidy as described above.
Employees Covered by Benefit Terms. At June 30, 2019, the following employees were covered by the benefit terms:
Inactive Employees or Beneficiaries Currently Receiving Benefits 108
Inactive Employees Entitled to But Not Yet Receiving Benefits 32 Active Employees 1,852
Total 1,992
Total OPEB Liability
The College’s total OPEB liability of $8,289,292 was measured as of June 30, 2020, and was determined by an actuarial valuation as of June 30, 2019.
Actuarial Assumptions and Other Inputs. The total OPEB liability in the June 30, 2019, actuarial valuation was determined using the following actuarial assumptions and other inputs, applied to all periods included in the measurement, unless otherwise specified:
27

The discount rate was based on the Bond Buyer General Obligation 20-year Municipal Bond Index.
Mortality rates were based on the Generational RP-2000 with Projection Scale BB.
The demographic actuarial assumptions for retirement, disability incidence, withdrawal, and salary increases used in the June 30, 2019 valuation were based on the results of an actuarial experience study for the period July 1, 2013, through June 30, 2018, adopted by the FRS.
The remaining actuarial assumptions (e.g., initial per capita costs, health care cost trends, rate of plan participation, rates of plan election, etc.) used in the June 30, 2019 valuation were based on a review of recent plan experience done concurrently with the June 30, 2019 valuation.
Changes in the Total OPEB Liability
Changes of assumptions and other inputs reflect a change in the discount rate from 3.50 percent in 2019 to 2.21 percent in 2020.
Sensitivity of the Total OPEB Liability to Changes in the Discount Rate. The following table presents the total OPEB liability of the College, as well as what the College’s total OPEB liability would be if it were
Inflation 2.40%Real wage growth 0.85%Wage inflation 3.25%Salary increases, including wage inflation Regular employees 3.40% - 7.80% Senior management 4.10% - 8.20%Municipal Bond Index Rate Prior Measurement Date 3.50% Measurement Date 2.21%Health Care Cost Trends Pre-Medicare 7.00% for 2019 decreasing to an
ultimate rate of 4.60% by 2026 Medicare 5.00% for 2019 decreasing to an
ultimate rate of 4.60% by 2021
AmountBalance at 6/30/19 6,933,103$
Changes for the year:Service Cost 535,324 Interest 255,167 Difference between expected and actual experience 198,921 Changes in Assumptions or Other Inputs 725,751 Benefit Payments (358,974)
Net Changes 1,356,189
Balance at 6/30/20 8,289,292$
28

calculated using a discount rate that is 1 percentage point lower (1.21 percent) or 1 percentage point higher (3.21 percent) than the current rate:
Sensitivity of the Total OPEB Liability to Changes in the Healthcare Cost Trend Rates. The following table presents the total OPEB liability of the College, as well as what the College’s total OPEB liability would be if it were calculated using healthcare cost trend rates that are 1 percentage point lower or 1 percentage point higher than the current healthcare cost trend rates:
OPEB Expense and Deferred Outflows of Resources and Deferred Inflows of Resources Related to OPEB
For the fiscal year ended June 30, 2021, the College recognized OPEB expense of $1,095,293. At June 30, 2021, the College reported deferred outflows of resources and deferred inflows of resources related to OPEB from the following sources:
Of the total amount reported as deferred outflows of resources related to OPEB, $431,421 was a result of benefits paid subsequent to the measurement date and before the end of the fiscal year will be included as a reduction of the total OPEB liability in the year ended June 30, 2022. Other amounts reported as deferred outflows of resources and deferred inflows of resources related to OPEB will be recognized in OPEB expense as follows:
1% Decrease
Current Discount
Rate (2.21%) 1% Increase
Total OPEB Liability 9,731,556$ 8,289,292$ 7,132,556$
1% Decrease
Healthcare Cost Trend
Rates 1% IncreaseTotal OPEB Liability 6,672,401$ 8,289,292$ 1,050,658$
29

Net Pension Liability. As a participating employer in the Florida Retirement System (FRS), the College recognizes its proportionate share of the collective net pension liabilities of the FRS cost-sharing multiple-employer defined benefit plans. As of June 30, 2021, the College’s proportionate share of the net pension liabilities totaled $125,161,923. Note 9 includes a complete discussion of defined benefit pension plans.
9. Retirement Plans – Defined Benefit Pension Plans
General Information about the Florida Retirement System (FRS)
The FRS was created in Chapter 121, Florida Statutes, to provide a defined benefit pension plan for participating public employees. The FRS was amended in 1998 to add the Deferred Retirement Option Program (DROP) under the defined benefit plan and amended in 2000 to provide a defined contribution plan alternative to the defined benefit plan for FRS members effective July 1, 2002. This integrated defined contribution pension plan is the FRS Investment Plan. Chapter 121, Florida Statutes, also provides for nonintegrated, optional retirement programs in lieu of the FRS to certain members of the Senior Management Service Class employed by the State and faculty and specified employees of State colleges. Chapter 112, Florida Statutes, established the HIS Program, a cost-sharing multiple-employer defined benefit pension plan to assist retired members of any State-administered retirement system in paying the costs of health insurance.
Essentially all regular employees of the College are eligible to enroll as members of the State-administered FRS. Provisions relating to the FRS are established by Chapters 121 and 122, Florida Statutes; Chapter 112, Part IV, Florida Statutes; Chapter 238, Florida Statutes; and FRS Rules, Chapter 60S, Florida Administrative Code; wherein eligibility, contributions, and benefits are defined and described in detail. Such provisions may be amended at any time by further action from the Florida Legislature. The FRS is a single retirement system administered by the Florida Department of Management Services, Division of Retirement, and consists of two cost-sharing multiple-employer defined benefit plans and other nonintegrated programs. A comprehensive annual financial report of the FRS, which includes its financial statements, required supplementary information, actuarial report, and other relevant information, is available from the Florida Department of Management Services Web site (www.dms.myflorida.com).
The College’s FRS and HIS pension expense totaled $22,684,498 for the fiscal year ended June 30, 2021.
Fiscal Year Ending June 30 Amount
2022 304,802$ 2023 304,802 2024 304,802 2025 304,802 2026 304,802 Thereafter 1,374,733
Total 2,898,743$
30

FRS Pension Plan
Plan Description. The FRS Pension Plan (Plan) is a cost-sharing multiple-employer defined benefit pension plan, with a DROP for eligible employees. The general classes of membership are as follows:
Regular Class – Members of the FRS who do not qualify for membership in the other classes. Senior Management Service Class (SMSC) – Members in senior management level positions.
Employees enrolled in the Plan prior to July 1, 2011, vest at 6 years of creditable service and employees enrolled in the Plan on or after July 1, 2011, vest at 8 years of creditable service. All vested members, enrolled prior to July 1, 2011, are eligible for normal retirement benefits at age 62 or at any age after 30 years of creditable service. All members enrolled in the Plan on or after July 1, 2011, once vested, are eligible for normal retirement benefits at age 65 or any time after 33 years of creditable service. Employees enrolled in the Plan may include up to 4 years of credit for military service toward creditable service. The Plan also includes an early retirement provision; however, there is a benefit reduction for each year a member retires before his or her normal retirement date. The Plan provides retirement, disability, death benefits, and annual cost-of-living adjustments to eligible participants.
The DROP, subject to provisions of Section 121.091, Florida Statutes, permits employees eligible for normal retirement under the Plan to defer receipt of monthly benefit payments while continuing employment with an FRS-participating employer. An employee may participate in DROP for a period not to exceed 60 months after electing to participate. During the period of DROP participation, deferred monthly benefits are held in the FRS Trust Fund and accrue interest. The net pension liability does not include amounts for DROP participants, as these members are considered retired and are not accruing additional pension benefits.
Benefits Provided. Benefits under the Plan are computed on the basis of age and/or years of service, average final compensation, and service credit. Credit for each year of service is expressed as a percentage of the average final compensation. For members initially enrolled before July 1, 2011, the average final compensation is the average of the 5 highest fiscal years’ earnings; for members initially enrolled on or after July 1, 2011, the average final compensation is the average of the 8 highest fiscal years’ earnings. The total percentage value of the benefit received is determined by calculating the total value of all service, which is based on retirement plan and/or the class to which the member belonged when the service credit was earned. Members are eligible for in-line-of-duty or regular disability and survivors’ benefits. The following table shows the percentage value for each year of service credit earned:
31

Class, Initial Enrollment, and Retirement Age/Years of Service % Value
Regular Class members initially enrolled before July 1, 2011 Retirement up to age 62 or up to 30 years of service 1.60 Retirement at age 63 or with 31 years of service 1.63 Retirement at age 64 or with 32 years of service 1.65 Retirement at age 65 or with 33 or more years of service 1.68
Regular Class members initially enrolled on or after July 1, 2011 Retirement up to age 65 or up to 33 years of service 1.60 Retirement at age 66 or with 34 years of service 1.63 Retirement at age 67 or with 35 years of service 1.65 Retirement at age 68 or with 36 or more years of service 1.68
Senior Management Service Class 2.00
Special Risk Class 3.00
As provided in Section 121.101, Florida Statutes, if the member was initially enrolled in the Plan before July 1, 2011, and all service credit was accrued before July 1, 2011, the annual cost-of-living adjustment is 3 percent per year. If the member was initially enrolled before July 1, 2011, and has service credit on or after July 1, 2011, there is an individually calculated cost-of-living adjustment. The annual cost-of-living adjustment is a proportion of 3 percent determined by dividing the sum of the pre-July 2011 service credit by the total service credit at retirement multiplied by 3 percent. Plan members initially enrolled on or after July 1, 2011, will not have a cost-of-living adjustment after retirement.
Contributions. The Florida Legislature establishes contribution rates for participating employers and employees. Contribution rates during the 2020-21 fiscal year were:
(1) Employer rates include 1.66 percent for the postemployment health insurance subsidy.
Also, employer rates, other than for DROP participants, include 0.06 percent for administrative costs of the Investment Plan.
(2) Contribution rates are dependent upon retirement class in which reemployed.
The College’s contributions to the Plan totaled $8,488,845 for the fiscal year ended June 30, 2021.
Pension Liabilities, Pension Expense, and Deferred Outflows of Resources and Deferred Inflows of Resources Related to Pensions. At June 30, 2021, the College reported a liability of $86,476,445 for its proportionate share of the net pension liability. The net pension liability was measured as of June 30, 2020, and the total pension liability used to calculate the net pension liability was determined by an actuarial valuation as of July 1, 2020. The College’s proportionate share of the net pension liability was based on the College’s 2019-20 fiscal year contributions relative to the total 2019-20 fiscal year contributions of all participating members. At June 30, 2020, the College’s proportionate share was
Class Employee Employer (1)FRS, Regular 3.00 10.00FRS, Senior Management Service 3.00 27.29Deferred Retirement Option Program (applicable to 0.00 16.98 members from all of the above classes)FRS, Retired Employee (2) (2)
Percent of Gross Salary
32

0.199523546 percent, which was a decrease of 0.005721941 from its proportionate share measured as of June 30, 2019.
For the fiscal year ended June 30, 2021, the College recognized pension expense of $18,521,205. In addition, the College reported deferred outflows of resources and deferred inflows of resources related to pensions from the following sources:
The deferred outflows of resources totaling $8,488,845, resulting from College contributions subsequent to the measurement date will be recognized as a reduction of the net pension liability in the fiscal year ending June 30, 2022. Other amounts reported as deferred outflows of resources and deferred inflows of resources related to pensions will be recognized in pension expense as follows:
Actuarial Assumptions. The total pension liability in the July 1, 2020, actuarial valuation was determined using the following actuarial assumptions, applied to all periods included in the measurement:
Inflation 2.40 percent Salary increases 3.25 percent, average, including inflation Investment rate of return 6.80 percent, net of pension plan investment
expense, including inflation
Deferred Outflows Deferred InflowsDescription of Resources of Resources
Difference between expected and
actual experience 3,309,630$ -$
Change of assumptions 15,654,988
Net difference between projected and actual
earnings on FRS Plan investments 5,148,891 -
Changes in proportion and difference between
College FRS contributions and proportionate
share of contributions 997,720 1,403,057
College FRS contributions subsequent to
the measurement date 8,488,845 -
Total 33,600,074$ 1,403,057$
Fiscal Year Ending June 30 Amount
2022 5,411,908$ 2023 7,553,797 2024 6,443,033 2025 3,695,025 2026 604,167 Thereafter 242
Total 23,708,172$
33

Mortality rates were based on the PUB-2010 base table, projected generationally with Scale MP-2018.
The actuarial assumptions used in the July 1, 2020, valuation were based on the results of an actuarial experience study for the period July 1, 2013, through June 30, 2018.
The long-term expected rate of return on pension plan investments was not based on historical returns, but instead is based on a forward-looking capital market economic model. The allocation policy’s description of each asset class was used to map the target allocation to the asset classes shown below. Each asset class assumption is based on a consistent set of underlying assumptions, and includes an adjustment for the inflation assumption. The target allocation and best estimates of arithmetic and geometric real rates of return for each major asset class are summarized in the following table:
Asset Class Target
Allocation (1)
Annual Arithmetic Return
Compound Annual
(Geometric) Return
Standard Deviation
Cash 1.0% 2.2% 2.2% 1.2% Fixed Income 19.0% 3.0% 2.9% 3.5% Global Equity 54.2% 8.0% 6.7% 17.1% Real Estate (Property) 10.3% 6.4% 5.8% 11.7% Private Equity 11.1% 10.8% 8.1% 25.7% Strategic Investments 4.4% 5.5% 5.3% 6.9% Total 100.0% Assumed inflation - Mean 2.4% 1.7%
(1) As outlined in the Plan’s investment policy.
Discount Rate. The discount rate used to measure the total pension liability was 6.80 percent. The Plan’s fiduciary net position was projected to be available to make all projected future benefit payments of current active and inactive employees. Therefore, the discount rate for calculating the total pension liability is equal to the long-term expected rate of return. The discount rate used in the 2020 valuation was updated from 6.90 percent to 6.80 percent.
Sensitivity of the College’s Proportionate Share of the Net Pension Liability to Changes in the Discount Rate. The following presents the College’s proportionate share of the net pension liability calculated using the discount rate of 6.80 percent, as well as what the College’s proportionate share of the net pension liability would be if it were calculated using a discount rate that is 1 percentage point lower (5.80 percent) or 1 percentage point higher (7.80 percent) than the current rate:
1% Decrease
(5.80%)
Current Discount Rate (6.80%)
1% Increase
(7.80%) College’s proportionate share of the net pension liability $138,088,350 $86,476,445 $43,369,958
Pension Plan Fiduciary Net Position. Detailed information about the Plan’s fiduciary net position is available in the separately issued FRS Pension Plan and Other State Administered Systems Comprehensive Annual Financial Report.
34
Payables to the Pension Plan. At June 30, 2021, the College reported a payable of $1,211,192 for the outstanding amount of contributions to the Plan required for the fiscal year ended June 30, 2021.
HIS Pension Plan
Plan Description. The HIS Pension Plan (HIS Plan) is a cost-sharing multiple-employer defined benefit pension plan established under Section 112.363, Florida Statutes. The benefit is a monthly payment to assist retirees of State-administered retirement systems in paying their health insurance costs and is administered by the Florida Department of Management Services, Division of Retirement.
Benefits Provided. For the fiscal year ended June 30, 2021, eligible retirees and beneficiaries received a monthly HIS payment of $5 for each year of creditable service completed at the time of retirement with a minimum HIS payment of $30 and a maximum HIS payment of $150 per month, pursuant to Section 112.363, Florida Statutes. To be eligible to receive a HIS benefit, a retiree under a State-administered retirement system must provide proof of health insurance coverage, which can include Medicare.
Contributions. The HIS Plan is funded by required contributions from FRS participating employers as set by the Florida Legislature. Employer contributions are a percentage of gross compensation for all active FRS members. For the fiscal year ended June 30, 2021, the contribution rate was 1.66 percent of payroll pursuant to Section 112.363, Florida Statutes. The College contributed 100 percent of its statutorily required contributions for the current and preceding 3 years. HIS Plan contributions are deposited in a separate trust fund from which HIS payments are authorized. HIS Plan benefits are not guaranteed and are subject to annual legislative appropriation. In the event the legislative appropriation or available funds fail to provide full subsidy benefits to all participants, benefits may be reduced or canceled.
The College’s contributions to the HIS Plan totaled $1,977,998 for the fiscal year ended June 30, 2021.
Pension Liabilities, Pension Expense, and Deferred Outflows of Resources and Deferred Inflows of Resources Related to Pensions. At June 30, 2021, the College reported a net pension liability of $38,685,478 for its proportionate share of the net pension liability. The current portion of the net pension liability is the College’s proportionate share of benefit payments expected to be paid within 1 year, net of the College’s proportionate share of the HIS Plan’s fiduciary net position available to pay that amount. The net pension liability was measured as of June 30, 2020, and the total pension liability used to calculate the net pension liability was determined by an actuarial valuation as of July 1, 2020. The College’s proportionate share of the net pension liability was based on the College’s 2019-20 fiscal year contributions relative to the total 2019-20 fiscal year contributions of all participating members. At June 30, 2020, the College’s proportionate share was 0.316838605 percent, which was a decrease of 0.006353179 from its proportionate share measured as of June 30, 2019.
For the fiscal year ended June 30, 2021, the College recognized pension expense of $4,163,293. In addition, the College reported deferred outflows of resources and deferred inflows of resources related to pensions from the following sources:
35

The deferred outflows of resources totaling $1,977,998, resulting from College contributions subsequent to the measurement date will be recognized as a reduction of the net pension liability in the fiscal year ending June 30, 2022. Other amounts reported as deferred outflows of resources and deferred inflows of resources related to pensions will be recognized in pension expense as follows:
Actuarial Assumptions. The total pension liability at July 1, 2020, actuarial valuation was determined using the following actuarial assumptions, applied to all periods included in the measurement:
Inflation 2.40 percent Salary increases 3.25 percent, average, including inflation Municipal bond rate 2.21 percent
Mortality rates were based on the PUB-2010 base table, projected generationally with Scale MP-2018. This is a change from the prior year mortality assumption which was based on the Generational RP-2000 with Projection Scale BB tables.
While an experience study had not been completed for the HIS Plan, the actuarial assumptions that determined the total pension liability for the HIS Plan were based on certain results of the most recent experience study for the FRS Plan.
DescriptionDeferred Outflows
of ResourcesDeferred Inflows
of Resources
Differences between expected and 1,582,471$ 29,843$ actual experienceChange of assumptions 4,159,790 2,249,410 Net difference between projected and actual earnings on HIS Plan Investments 30,887 - Changes in proportion and differences between College HIS contributions and proportionate share of HIS contributions 2,684,557 584,198 College contributions subsequent to the measurement date 1,977,998
Total 10,435,703$ 2,863,451$
Fiscal Year Ending June 30 Amount
2022 1,781,675$ 2023 1,426,622 2024 775,087 2025 599,666 2026 585,797 Thereafter 425,407
Total 5,594,254$
36

Discount Rate. The discount rate used to measure the total pension liability was 2.21 percent. In general, the discount rate for calculating the total pension liability is equal to the single rate equivalent to discounting at the long-term expected rate of return for benefit payments prior to the projected depletion date. Because the HIS benefit is essentially funded on a pay-as-you-go basis, the depletion date is considered to be immediate, and the single equivalent discount rate is equal to the municipal bond rate selected by the plan sponsor. The Bond Buyer General Obligation 20-Bond Municipal Bond Index was adopted as the applicable municipal bond index. The discount rate used in the 2020 valuation was updated from 3.50 percent to 2.21 percent.
Sensitivity of the College’s Proportionate Share of the Net Pension Liability to Changes in the Discount Rate. The following presents the College’s proportionate share of the net pension liability calculated using the discount rate of 2.21 percent, as well as what the College’s proportionate share of the net pension liability would be if it were calculated using a discount rate that is 1 percentage point lower (1.21 percent) or 1 percentage point higher (3.21 percent) than the current rate:
1% Decrease
(1.21%)
Current Discount Rate (2.21%)
1% Increase
(3.21%) College’s proportionate share of the net pension liability $44,718,686 $38,685,478 $33,747,315
Pension Plan Fiduciary Net Position. Detailed information about the HIS Plan’s fiduciary net position is available in the separately issued FRS Pension Plan and Other State Administered Systems Comprehensive Annual Financial Report.
Payables to the Pension Plan. At June 30, 2021, the College reported a payable of $15,905 for the outstanding amount of contributions to the HIS Plan required for the fiscal year ended June 30, 2021
10. Retirement Plans – Defined Contribution Pension Plans
FRS Investment Plan. The SBA administers the defined contribution plan officially titled the FRS Investment Plan (Investment Plan). The Investment Plan is reported in the SBA’s annual financial statements and in the State’s Comprehensive Annual Financial Report.
As provided in Section 121.4501, Florida Statutes, eligible FRS members may elect to participate in the Investment Plan in lieu of the FRS defined benefit plan. College employees already participating in the State College System Optional Retirement Program or DROP are not eligible to participate in the Investment Plan. Employer and employee contributions are defined by law, but the ultimate benefit depends in part on the performance of investment funds. Service retirement benefits are based upon the value of the member’s account upon retirement. Benefit terms, including contribution requirements, are established and may be amended by the Florida Legislature. The Investment Plan is funded with the same employer and employee contributions rates, that are based on salary and membership class (Regular Class, Senior Management Service Class, etc.), as the FRS defined benefit plan. Contributions are directed to individual member accounts and the individual members allocate contributions and account balances among various approved investment choices. Costs of administering the Investment Plan, including the FRS Financial Guidance Program, are funded through an employer contribution of
37

0.06 percent of payroll and by forfeited benefits of Investment Plan members. Allocations to the Investment Plan member accounts during the 2020-21 fiscal year were as follows:
Class
Percent of Gross
Compensation FRS, Regular 6.30 FRS, Senior Management Service 7.67
For all membership classes, employees are immediately vested in their own contributions and are vested after 1 year of service for employer contributions and investment earnings regardless of membership class. If an accumulated benefit obligation for service credit originally earned under the FRS Pension Plan is transferred to the Investment Plan, the member must have the years of service required for FRS Pension Plan vesting (including the service credit represented by the transferred funds) to be vested for these funds and the earnings on the funds. Nonvested employer contributions are placed in a suspense account for up to 5 years. If the employee returns to FRS-covered employment within the 5-year period, the employee will regain control over their account. If the employee does not return within the 5-year period, the employee will forfeit the accumulated account balance. For the fiscal year ended June 30, 2021, the information for the amount of forfeitures was unavailable from the SBA; however, management believes that these amounts, if any, would be immaterial to the College.
After termination and applying to receive benefits, the member may roll over vested funds to another qualified plan, structure a periodic payment under the Investment Plan, receive a lump-sum distribution, leave the funds invested for future distribution, or any combination of these options. Disability coverage is provided in which the member may either transfer the account balance to the FRS Pension Plan when approved for disability retirement to receive guaranteed lifetime monthly benefits under the FRS Pension Plan, or remain in the Investment Plan and rely upon that account balance for retirement income.
The College’s Investment Plan pension expense totaled $4,047,884 for the fiscal year ended June 30, 2021.
State College System Optional Retirement Program. Section 1012.875, Florida Statutes, provides for an Optional Retirement Program (Program) for eligible college instructors and administrators. The Program is designed to aid colleges in recruiting employees by offering more portability to employees not expected to remain in the FRS for 8 or more years.
The Program is a defined contribution plan, which provides full and immediate vesting of all contributions submitted to the participating companies on behalf of the participant. Employees in eligible positions can make an irrevocable election to participate in the Program, rather than the FRS, and purchase retirement and death benefits through contracts provided by certain insurance carriers. The employing college contributes 5.15 percent of the participant’s salary to the participant’s account, 3.44 percent to cover the unfunded actuarial liability of the FRS pension plan, for a total of 8.59 percent, and employees contribute 3 percent of the employee’s salary. Additionally, the employee may contribute, by payroll deduction, an amount not to exceed the percentage contributed by the college to the participant’s annuity account. The
38

contributions are invested in the company or companies selected by the participant to create a fund for the purchase of annuities at retirement.
The College’s contributions to the Program totaled $414,489 and employee contributions totaled $241,451 for the 2020-21 fiscal year.
11. Construction Commitments
The College’s construction commitments at June 30, 2021, were as follows:
(1) Individual projects with a current balance committed of less than $1 million at June 30, 2021.
12. Operating Lease Commitments
The College leased two building under operating leases that expire in 2022 and 2029, and equipment under an operating lease, which expires in 2021. These leased assets and the related commitments are not reported on the College’s statement of net position. Operating lease payments are recorded as expenses when paid or incurred. Outstanding commitments resulting from these lease agreements are contingent upon future appropriations. Future minimum lease commitments for this these noncancelable operating lease(s) are as follows:
12. Risk Management Programs
The College is exposed to various risks of loss related to torts; theft of, damage to, and destruction of assets; errors and omissions; injuries to employees; and natural disasters. The College provided coverage for these risks primarily through the Florida College System Risk Management Consortium (Consortium), which was created under authority of Section 1001.64(27), Florida Statutes, by the boards of trustees of the Florida public colleges for the purpose of joining a cooperative effort to develop, implement, and participate in a coordinated Statewide college risk management program. The Consortium is self-sustaining through member assessments (premiums) and purchases excess
Total Completed BalanceProject Description Commitment To Date Committed
Midtown CAT Building 2,163,901$ 1,069,736$ 1,094,165$ Other Projects (1) 541,489 103,576 437,913
Total 2,705,390$ 1,173,312$ 1,532,078$
Fiscal Year Ending June 30 Amount2022 202,879 2023 71,984 2024 46,848 2025 48,722 2026 50,671 2027-2029 126,009
Total Minimum Payments Required 547,113$
39

insurance through commercial companies for claims in excess of specified amounts. Excess insurance from commercial companies provided coverage of up to $110 million to February 28, 2021, and up to $100 million from March 1, 2021, for property insurance. Insurance coverage obtained through the Consortium included fire and extended property, general and automobile liability, workers’ compensation, health, life, and other liability coverage. Settled claims resulting from these risks have not exceeded commercial coverage in any of the past 3 fiscal years.
Life, dental, vision and long-term disability coverage are provided through purchased commercial insurance.
Self-Insured Program. The Board has established an individual self-insured program to provide group health insurance for its employees, retirees, former employees, and their dependents. The College’s liability was limited by excess reinsurance of $500,000 per insured person and $96,000 aggregating specific deductible for the 2020-21 fiscal year. The plan is provided by an insurance company licensed by the Florida Office of Insurance Regulation. The College contributes employee premiums as a fringe benefit. Employee dependent coverage is by payroll deduction and coverage for retirees, former employees, and their dependents is by prepaid premium.
The College reports a liability when it is probable that a loss has occurred and the amount of that loss can be reasonably estimated. The liability includes an amount for claims that have been incurred, but not reported, and an amount for claims administration expense. Because the actual claims liability depends on such complex factors as inflation, change in legal doctrines, and damage awards, the process used in computing the claims liability does not necessarily result in an exact amount. The College reevaluates the claims liability periodically and the claims liability totaled $9,094,271 as of June 30, 2021. Amounts held by the College in excess of the estimated insurance claims liability at June 30, 2021, totaled $7,442,254 and are classified as insurance claim deposits. The College will use these amounts to pay claims incurred in future fiscal years.
The following schedule represents the changes in claims liability for the current and prior years for the College’s self-insured program:
13. Functional Distribution of Operating Expenses
The functional classification of an operating expense (instruction, academic support, etc.) is assigned to a department based on the nature of the activity, which represents the material portion of the activity attributable to the department. For example, activities of an academic department for which the primary departmental function is instruction may include some activities other than direct instruction such as public service. However, when the primary mission of the department consists of instructional program elements, all expenses of the department are reported under the instruction classification. The operating expenses on the statement of revenues, expenses, and changes in net position are presented by natural
Fiscal Year
Beginning of Fiscal
Year
Claims and Changes in Estimates
Claim Payments
End of Fiscal Year
2019-20 14,016,933 15,965,465 (17,652,819) 12,329,579 2020-21 12,329,579 15,605,521 (18,840,829) 9,094,271
40

classifications. The following are those same expenses presented in functional classifications as recommended by NACUBO:
14. Related Party Transactions
The College’s component unit, the Valencia College Foundation, Inc. (Foundation), purchased a 57,680 square foot building in MetroWest, near the West Campus, which it leases to the College as discussed in Note 8. The rent amount to be paid by the College reflects a 6.77 percent return on the Foundation’s total cost basis for the amount expended on the acquisition of and structural improvements to the building. The lease commencement date was April 1, 2014 and expires 60 years from this date. The annual lease payment of $456,461 per year, payable semi-annually on January 1 and July 1 of each year. The lease agreement contains a purchase option that may be exercised during the period commencing January 1, 2020, and expiring on the earlier of May 31, 2073, or the sale of the property to a third party. The purchase price will be the Foundation’s costs basis as of the date the College notifies the Foundation of its election to exercise the purchase option. As of June 30, 2021, the College has not exercised its option to purchase the building.
Functional Classification Amount
Instruction 107,304,094$ Academic Support 32,804,072 Student Services 33,813,008 Institutional Support 44,621,861 Operation and Maintenance of Plant 28,923,838 Scholarships and Waivers 65,160,587 Depreciation 11,017,586 Auxiliary Enterprises 10,563,162
Total Operating Expenses 334,208,208$
41
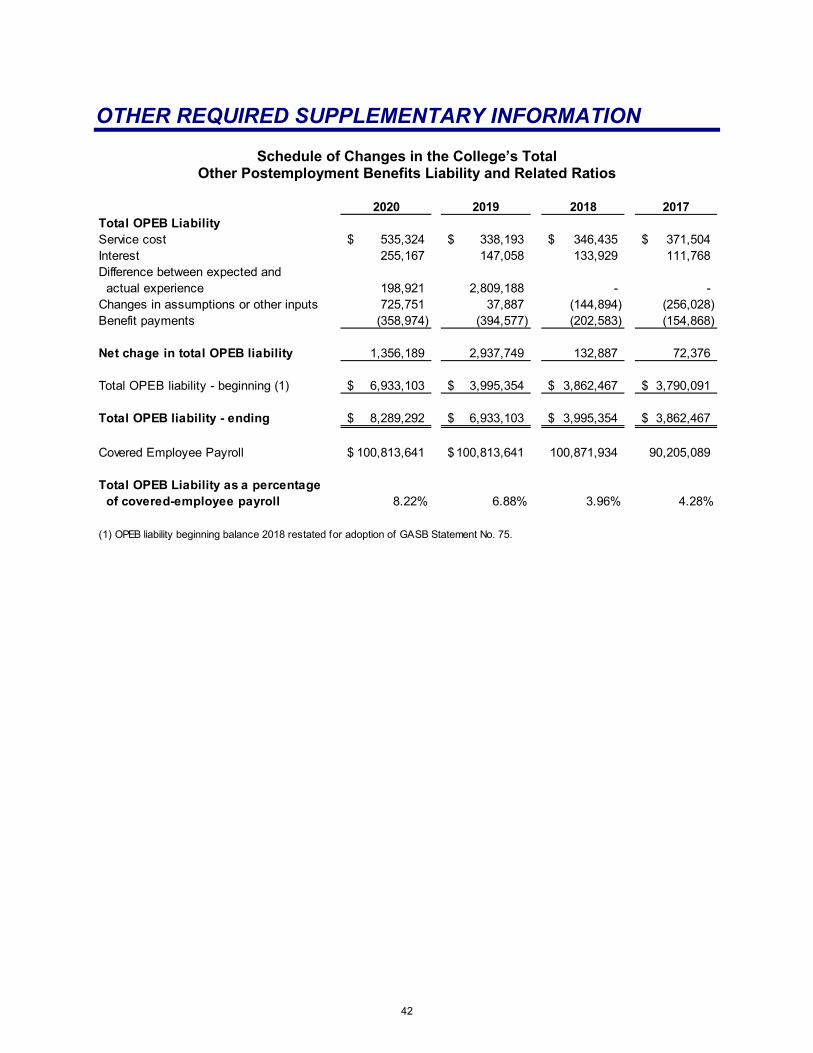
OTHER REQUIRED SUPPLEMENTARY INFORMATION
Schedule of Changes in the College’s Total Other Postemployment Benefits Liability and Related Ratios
2020 2019 2018 2017Total OPEB LiabilityService cost 535,324$ 338,193$ 346,435$ 371,504$ Interest 255,167 147,058 133,929 111,768 Difference between expected and actual experience 198,921 2,809,188 - - Changes in assumptions or other inputs 725,751 37,887 (144,894) (256,028) Benefit payments (358,974) (394,577) (202,583) (154,868)
Net chage in total OPEB liability 1,356,189 2,937,749 132,887 72,376
Total OPEB liability - beginning (1) 6,933,103$ 3,995,354$ 3,862,467$ 3,790,091$
Total OPEB liability - ending 8,289,292$ 6,933,103$ 3,995,354$ 3,862,467$
Covered Employee Payroll 100,813,641$ 100,813,641$ 100,871,934 90,205,089
Total OPEB Liability as a percentage of covered-employee payroll 8.22% 6.88% 3.96% 4.28%
(1) OPEB liability beginning balance 2018 restated for adoption of GASB Statement No. 75.
42

Schedule of the College’s Proportionate Share of the Net Pension Liability – Florida Retirement System Pension Plan
(1) The amounts presented for each fiscal year were determined as of June 30. (2) Covered payroll includes defined benefit plan actives, investment plan members, State college system optional
retirement plan members, and members in DROP because total employer contributions are determined on a uniform basis (blended rate) as required by Part III of Chapter 121, Florida Statutes.
Schedule of College Contributions – Florida Retirement System Pension Plan
(1) The amounts presented for each fiscal year were determined as of June 30. (2) Covered payroll includes defined benefit plan actives, investment plan members, State college system optional
retirement plan members, and members in DROP because total employer contributions are determined on a uniform basis (blended rate) as required by Part III of Chapter 121, Florida Statutes.
2020 (1) 2019 (1) 2018 (1) 2017 (1)College's proportion of the FRS 0.199523546% 0.205245487% 0.205214626% 0.203885664% net pension liabilityCollege's proportionate share of the FRS net pension liability 86,476,445$ 70,683,688$ 61,811,709$ 60,308,011$ College's covered payroll (2) 127,618,733$ 125,895,245$ 121,862,041$ 118,458,249$ College's proportionate share of the FRS net pension liability as a 67.76% 56.14% 50.72% 50.91% percentage of its covered payrollFRS Plan fiduciary net pension as a percentage of the FRS total pension liability 78.85% 82.61% 84.26% 83.89%
2021 (1) 2020 (1) 2019 (1) 2018 (1)Contractually required FRS 8,488,845 7,043,679 5,939,127 5,348,171 contribution
FRS contributions in relation to the contractually required contribution (8,488,845) (7,043,679) (5,939,127) (5,348,171) FRS contribution deficiency (excess) -$ -$ -$ -$ College's covered payroll (2) 128,536,655$ 127,618,733$ 125,895,245$ 121,862,041$ FRS contributions as a percentage of covered payroll 6.60% 5.52% 4.72% 4.39%
43

2016 (1) 2015 (1) 2014 (1) 2013 (1)0.190050708% 0.196294399% 0.187742199% 0.167975911%
47,987,953$ 25,354,054$ 11,455,035$ 28,916,130$ 104,892,761$ 98,931,589$ 94,207,047$ 87,660,009$
45.75% 25.63% 12.16% 32.99%
84.88% 92.00% 96.09% 88.54%
2017 (1) 2016 (1) 2015 (1) 2014 (1)5,194,416 4,650,143 4,785,824 4,112,351
(5,194,416) (4,650,143) (4,785,824) (4,112,351) -$ -$ -$ -$
118,458,249$ 104,892,761$ 98,931,589$ 94,207,047$
4.39% 4.43% 4.84% 4.37%
44

Schedule of the College’s Proportionate Share of the Net Pension Liability – Health Insurance Subsidy Pension Plan
(1) The amounts presented for each fiscal year were determined as of June 30. (2) Covered payroll includes defined benefit plan actives, investment plan members, and members in
DROP.
Schedule of College Contributions – Health Insurance Subsidy Pension Plan
(1) The amounts presented for each fiscal year were determined as of June 30. (2) Covered payroll includes defined benefit plan actives, investment plan members, and members in
DROP.
2020 (1) 2019 (1) 2018 (1) 2017 (1)College's proportion of the HIS 0.316838605% 0.323191784% 0.318270473% 0.312498562% net pension liabilityCollege's proportionate share of the HIS net pension liability 38,685,478$ 36,161,926$ 33,686,104$ 33,413,788$ College's covered payroll (2) 119,511,940$ 117,749,244$ 113,571,692$ 109,716,705$ College's proportionate share of the HIS net pension liability as a 32.37% 30.71% 29.66% 30.45% percentage of its covered payrollHIS Plan fiduciary net pension as a percentage of the HIS total pension liability 3.00% 2.63% 2.15% 1.64%
2021 (1) 2020 (1) 2019 (1) 2018 (1)Contractually required HIS 1,977,998 1,782,625 1,908,989 1,707,432 contribution
HIS contributions in relation to the contractually required contribution (1,977,998) (1,782,625) (1,908,989) (1,707,432) HIS contribution deficiency (excess) -$ -$ -$ -$ College's covered payroll (2) 120,488,335$ 119,511,940$ 117,749,244$ 113,571,692$ HIS contributions as a percentage of covered payroll 1.64% 1.49% 1.62% 1.50%
45

2016 (1) 2015 (1) 2014 (1) 2013 (1)0.281316270% 0.267041405% 0.255960092% 0.241878469%
32,786,246$ 27,234,023$ 23,932,893$ 21,058,701$ 96,187,981$ 90,177,274$ 85,319,642$ 78,946,546$
34.09% 30.20% 28.05% 26.67%
0.97% 0.50% 0.99% 1.78%
2017 (1) 2016 (1) 2015 (1) 2014 (1)1,565,744 1,441,293 1,020,798 876,833
(1,565,744) (1,441,293) (1,020,798) (876,833) -$ -$ -$ -$
109,716,705$ 96,187,981$ 90,177,274$ 85,319,642$
1.43% 1.50% 1.13% 1.03%
46

NOTES TO REQUIRED SUPPLEMENTARY INFORMATION
Schedule of Changes in the College’s Total Other Postemployment Benefits Liability and Related Ratios
No assets are accumulated in a trust that meet the criteria in paragraph 4 of GASB Statement No. 75 to pay related benefits. The June 30, 2021 total OPEB liability increased from the prior fiscal year as a result of the changes to assumptions as discussed below.
Changes of Assumptions. The discount rate was decreased from 3.50 percent to 2.21 percent based on a change in the Municipal Bond Index Rate.
Schedule of Net Pension Liability and Schedule of Contributions – Florida Retirement System Pension Plan
Changes of Assumptions. The long-term expected rate of return was decreased from 6.90 percent to 6.80 percent, and the active member mortality assumption was updated.
Schedule of Net Pension Liability and Schedule of Contributions – Health Insurance Subsidy Pension Plan
Changes of Assumptions. The municipal rate used to determine total pension liability decreased from 3.50 percent to 2.21 percent.
47

DIVISION OF FLORIDA COLLEGES YEAR END REPORTS
Summary of Accounts by General Ledger Code
Summary of Expenditures by Function (Fund 1)
Report of Capital Improvement Fees
Distance Learning Course User Fee Report
Student Activity and Service Fees Report
Tuition and Fees Report
Florida College System and Component Unit Schedules
Certification of Financials
Composite Financial Index Calculations

VALENCIA COLLEGE
FY 2020-2021 Summary of Accounts by General Ledger Code Version:
GL Code
(1) Current Funds Unrestricted
(2)Current Funds -
Restricted(3)
Auxiliary Funds
(4)Loan & Endowment
Funds(5)
Scholarship Funds(6)
Agency Funds
(7)Unexpended Plant
Funds(8)
Debt Service Funds
(9)Invested in Plant
Funds Total All FundsGASB AJEs (Describe in
NOTES)ADJUSTED Total All
FundsASSETS AJE Zero CheckCash In Depository 10100 (17,657,380.40) (745,420.11) 5,327,503.38 537,287.27 1,515,308.89 624,638.19 20,275,135.06 - - 9,877,072.28 - 9,877,072.28 Investments - Cash Equivalent (Other) 10200 - - - - - - - - - - - -
Investments - Cash Equivalent (SBA) 10210 55,019,533.38 - - - - - - - - 55,019,533.38 - 55,019,533.38 Investments - Cash Equivalent (SPIA) 10220 - - - - - - - - - - - - Returned Checks 12000 - - - - - - - - - - - - Cash on Hand 12100 - - - - - - - - - - - - Petty Cash 12200 - - 872.90 - - - - - - 872.90 - 872.90 Change Fund 12300 8,900.00 - 13,565.00 - - - - - - 22,465.00 - 22,465.00 Cash for Replacement of Fixed Assets 12400 - - - - - - - - - - - - Postage Stamps 12800 - - - - - - - - - - - - Accounts Receivable (non Govt.) 13000 4,438,243.87 - 191,684.50 - - - - - - 4,629,928.37 - 4,629,928.37
Account Receivable - Student 13100 5,204,393.25 - 642,572.21 - - 20,661.45 - - - 5,867,626.91 - 5,867,626.91 Account Receivable - Other 13200 - - - - - - - - - - - - Accounts Receivable - Allowance for Doubtful Accounts 13300 (1,401,663.94) - (126,837.29) - - - - - - (1,528,501.23) - (1,528,501.23) Accrued Interest Receivable 13800 - - - - - - - - - - - - Notes Receivable - Current 14010 - - - - - - - - - - - - Notes Receivable - Non-current 14020 - - - - - - - - - - - - Loan Principal Collected 14100 - - - - - - - - - - - - Notes Receivable - Allowance for Doubtful Accounts 14300 - - - - - - - - - - - - Prepaid Expenses 14500 65,235.13 - 36,000.00 - - - - - - 101,235.13 - 101,235.13 Prepaid Expenses - Non Current 14510 - - - - - - - - - - - - Other Assets 14600 - - - - - - - - - - - - Deposits Receivable - Current 15000 - - - - - - - - - - - - Deposits Receivable - Non Current 15100 - - - - - - - - - - - - Deposits Receivable - Bond Trustee 15300 - - - - - - - - - - - - Investments - Current 16100 - - - - - - - - - - 4,219,529.73 4,219,529.73 Investments Current Restricted 16110 - - - - - - - - - - - - Investments - Non-current 16200 - - 4,961,127.35 10,258,618.47 - - - - - 15,219,745.82 6,039,088.74 21,258,834.56 Investments - Non-current Restricted 16210 - - - - - - - 34,514.18 - 34,514.18 (10,258,618.47) (10,224,104.29) Merchandise Inventory 17000 - - 1,357,267.36 - - - - - - 1,357,267.36 - 1,357,267.36 Due from Governmental Agencies 17200 874,649.42 2,066,855.12 - - 13,686.14 59,427.00 - - - 3,014,617.68 - 3,014,617.68 Due from Component Units - Primary 17300 1,171,074.80 664,735.01 - - 13,913.10 - - - - 1,849,722.91 - 1,849,722.91 Due from Component Units - DSO 17400 81,376.11 98,846.69 - - 75,681.45 2,983.00 - - - 258,887.25 258,887.25 Due from Current Funds - Unrestricted 18100 - - - - - - - - - - - - Due from Current Funds - Restricted 18200 - - - - - - - - - - - - Due from Auxiliary Funds 18300 - - - - - - - - - - - - Due from Loan, Endowment, Annuity & Life Income Funds 18400 - - - - - - - - - - - - Due from Scholarship Funds 18500 - - - - - - - - - - - - Due from Agency Funds 18600 - - - - - - - - - - - - Due from Unexp. Plant & Renewals/Replacement Funds 18700 - - - - - - - - - - - - Due from Retirement of Indebtedness Funds 18800 - - - - - - - - - - - - Assets Under Capital Lease 19000 - - - - - - - - 15,941,894.80 15,941,894.80 - 15,941,894.80 Capital Leases, Accumulated Amortization 19009 - - - - - - - - (1,831,215.05) (1,831,215.05) - (1,831,215.05) Leasehold Improvements 19010 - - - - - - - - 13,193,097.99 13,193,097.99 - 13,193,097.99 Leasehold Improvements, Accumulated Amortization 19019 - - - - - - - - (1,232,865.00) (1,232,865.00) - (1,232,865.00) Land 19100 - - - - - - - - 32,987,697.65 32,987,697.65 - 32,987,697.65 Buildings 19200 - - - - - - - - 340,116,390.75 340,116,390.75 - 340,116,390.75 Buildings, Accumulated Depreciation 19209 - - - - - - - - (131,035,612.02) (131,035,612.02) - (131,035,612.02) Other Structures & Land Improvements 19300 - - - - - - - - 3,139,251.98 3,139,251.98 - 3,139,251.98 Other Structures & Land Improv., Accumulated Dep. (10 yr) 19309 - - - - - - - - (879,030.42) (879,030.42) - (879,030.42) Furniture, Machinery & Equipment 19400 - - - - - - - - - - - - Furniture, Machinery & Equipment, (3 Yr. Class) 19410 - - - - - - - - 6,541,376.71 6,541,376.71 - 6,541,376.71 Furn., Mach., Equip, Accumulated Dep. (3 Yr. Class) 19419 - - - - - - - - (6,523,333.26) (6,523,333.26) - (6,523,333.26) Furniture, Machinery & Equipment, (5 Yr. Class) 19420 - - - - - - - - 22,873,942.26 22,873,942.26 - 22,873,942.26 Furn., Mach., Equip, Accumulated Dep. (5 Yr. Class) 19429 - - - - - - - - (17,447,569.93) (17,447,569.93) - (17,447,569.93) Furniture, Machinery & Equipment, (7 Yr. Class) 19430 - - - - - - - - 30,053.04 30,053.04 - 30,053.04 Furn., Mach., Equip, Accumulated Dep. (7 Yr. Class) 19439 - - - - - - - - (30,053.04) (30,053.04) - (30,053.04) Furniture, Machinery & Equipment, (10 Yr. Class) 19440 - - - - - - - - - - - - Furn., Mach., Equip, Accumulated Dep. (10 Yr. Class) 19449 - - - - - - - - - - - - Furniture, Machinery & Equip. (Greater than 10 Yr. Class) 19450 - - - - - - - - - - - - Furn., Mach., Equip, Acc. Dep. (Greater than 10 Yr. Class) 19459 - - - - - - - - - - - - Other Assets 19500 - - - - - - - - - - - - Other Depreciable Assets (3 Yr. Capital Asset Class) 19510 - - - - - - - - - - - - Other Depr. Assets, Acc. Dep. (3 Yr. Capital Asset Class) 19519 - - - - - - - - - - - - Other Depreciable Assets (5 Yr. Capital Asset Class) 19520 - - - - - - - - - - - - Other Depr. Assets, Acc. Dep. (5 Yr. Capital Asset Class) 19529 - - - - - - - - - - - - Other Depreciable Assets (7 Yr. Capital Asset Class) 19530 - - - - - - - - - - - - Other Depr. Assets, Acc. Dep. (7 Yr. Capital Asset Class) 19539 - - - - - - - - - - - - Other Depreciable Assets (10 Yr. Capital Asset Class) 19540 - - - - - - - - - - - - Other Depr. Assets, Acc. Dep. (10 Yr. Capital Asset Class) 19549 - - - - - - - - - - - - Other Depreciable Assets (Greater than 10 Yr. Class) 19550 - - - - - - - - - - - - Other Depr. Assets, Acc. Dep. (Greater than 10 Yr. Class) 19559 - - - - - - - - - - - - Other Assets (non-depreciable) 19600 - - - - - - - - - - - - Artwork/Artifacts 19630 - - - - - - - - - - - - Construction In Progress 19800 - - - - - - - - 1,173,312.24 1,173,312.24 - 1,173,312.24 Deferred Outflows of Resources - Service Concession Arrangement 19901 - - - - - - - - - - - - Deferred Outflows of Resources - Accum Dec in FV of Securities 19902 - - - - - - - - - - - - Deferred Outflows of Resources - Pension FRS 19908 33,600,074.00 - - - - - - - - 33,600,074.00 - 33,600,074.00 Deferred Outflows of Resources - Pension HIS 19909 10,435,703.00 - - - - - - - - 10,435,703.00 - 10,435,703.00 Deferred Outflows of Resources - Other Postemployment Benefits 19910 3,593,463.00 - - - - - - - - 3,593,463.00 - 3,593,463.00 Deferred Outflows of Resources - Lease Agreements 19911 - - - - - - - - - - - -
Deferred Outflows of Resources - Asset Retirement Obligations 19913 - - - - - - - - - - - -
TOTAL ASSETS 95,433,601.62 2,085,016.71 12,403,755.41 10,795,905.74 1,618,589.58 707,709.64 20,275,135.06 34,514.18 277,017,338.70 420,371,566.64 - 420,371,566.64
LIABILITIES
48
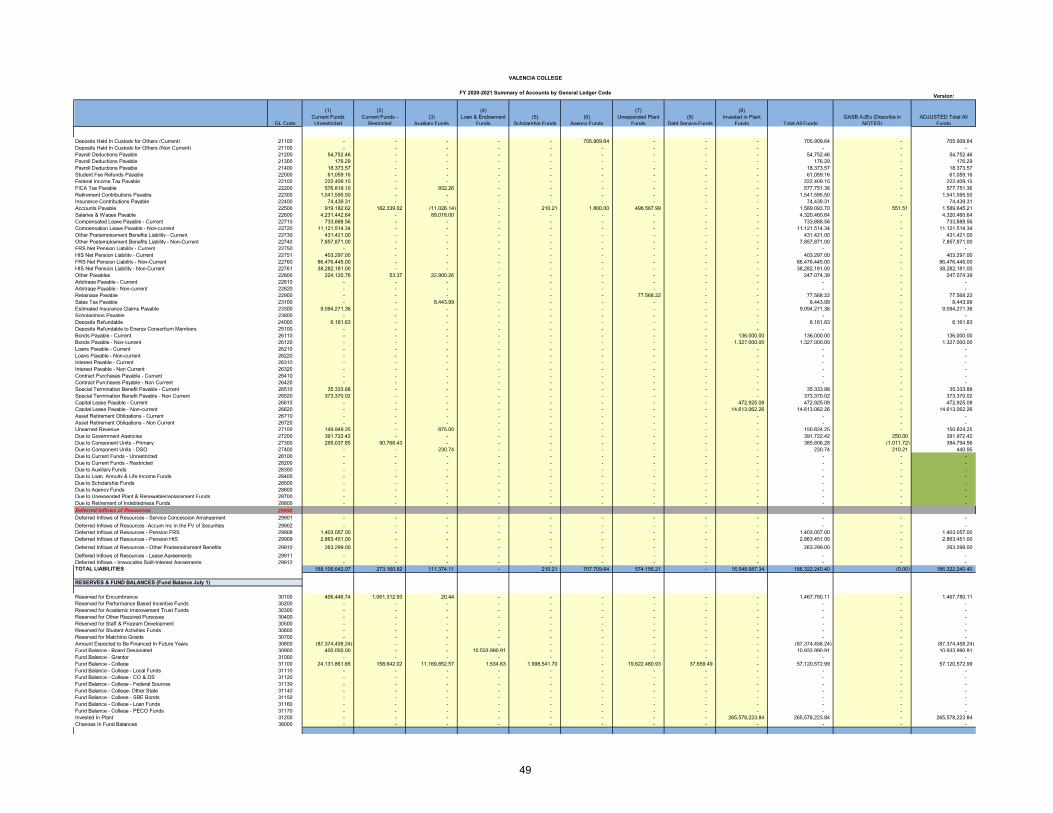
VALENCIA COLLEGE
FY 2020-2021 Summary of Accounts by General Ledger Code Version:
GL Code
(1) Current Funds Unrestricted
(2)Current Funds -
Restricted(3)
Auxiliary Funds
(4)Loan & Endowment
Funds(5)
Scholarship Funds(6)
Agency Funds
(7)Unexpended Plant
Funds(8)
Debt Service Funds
(9)Invested in Plant
Funds Total All FundsGASB AJEs (Describe in
NOTES)ADJUSTED Total All
Funds
Deposits Held In Custody for Others (Current) 21100 - - - - - 705,909.64 - - - 705,909.64 - 705,909.64 Deposits Held In Custody for Others (Non Current) 21100 - - - - - - - - - - - - Payroll Deductions Payable 21200 54,752.46 - - - - - - - - 54,752.46 - 54,752.46 Payroll Deductions Payable 21300 176.29 - - - - - - - - 176.29 - 176.29 Payroll Deductions Payable 21400 18,373.57 - - - - - - - - 18,373.57 - 18,373.57 Student Fee Refunds Payable 22000 61,059.16 - - - - - - - - 61,059.16 - 61,059.16 Federal Income Tax Payable 22100 222,409.15 - - - - - - - - 222,409.15 - 222,409.15 FICA Tax Payable 22200 576,819.10 - 932.26 - - - - - - 577,751.36 - 577,751.36 Retirement Contributions Payable 22300 1,541,595.50 - - - - - - - - 1,541,595.50 - 1,541,595.50 Insurance Contributions Payable 22400 74,439.31 - - - - - - - - 74,439.31 - 74,439.31 Accounts Payable 22500 919,182.62 182,339.02 (11,026.14) - 210.21 1,800.00 496,587.99 - - 1,589,093.70 551.51 1,589,645.21 Salaries & Wages Payable 22600 4,231,442.64 - 89,018.00 - - - - - - 4,320,460.64 - 4,320,460.64 Compensated Leave Payable - Current 22710 733,888.56 - - - - - - - - 733,888.56 - 733,888.56 Compensation Leave Payable - Non-current 22720 11,121,514.34 - - - - - - - - 11,121,514.34 - 11,121,514.34 Other Postemployment Benefits Liability - Current 22730 431,421.00 - - - - - - - - 431,421.00 - 431,421.00 Other Postemployment Benefits Liability - Non-Current 22740 7,857,871.00 - - - - - - - - 7,857,871.00 - 7,857,871.00 FRS Net Pension Liability - Current 22750 - - - - - - - - - - - - HIS Net Pension Liability - Current 22751 403,297.00 - - - - - - - - 403,297.00 - 403,297.00 FRS Net Pension Liability - Non-Current 22760 86,476,445.00 - - - - - - - - 86,476,445.00 - 86,476,445.00 HIS Net Pension Liability - Non-Current 22761 38,282,181.00 - - - - - - - - 38,282,181.00 - 38,282,181.00 Other Payables 22800 224,120.76 53.37 22,900.26 - - - - - - 247,074.39 - 247,074.39 Arbitrage Payable - Current 22810 - - - - - - - - - - - - Arbitrage Payable - Non-current 22820 - - - - - - - - - - - - Retainage Payable 22900 - - - - - - 77,568.22 - - 77,568.22 - 77,568.22 Sales Tax Payable 23100 - - 8,443.99 - - - - - - 8,443.99 - 8,443.99 Estimated Insurance Claims Payable 23300 9,094,271.36 - - - - - - - - 9,094,271.36 - 9,094,271.36 Scholarships Payable 23800 - - - - - - - - - - - - Deposits Refundable 24000 6,161.83 - - - - - - - - 6,161.83 - 6,161.83 Deposits Refundable to Energy Consortium Members 25100 - - - - - - - - - - - - Bonds Payable - Current 26110 - - - - - - - - 136,000.00 136,000.00 - 136,000.00 Bonds Payable - Non-current 26120 - - - - - - - - 1,327,000.00 1,327,000.00 - 1,327,000.00 Loans Payable - Current 26210 - - - - - - - - - - - - Loans Payable - Non-current 26220 - - - - - - - - - - - - Interest Payable - Current 26310 - - - - - - - - - - - - Interest Payable - Non Current 26320 - - - - - - - - - - - - Contract Purchases Payable - Current 26410 - - - - - - - - - - - - Contract Purchases Payable - Non Current 26420 - - - - - - - - - - - - Special Termination Benefit Payable - Current 26510 35,333.88 - - - - - - - - 35,333.88 - 35,333.88 Special Termination Benefit Payable - Non Current 26520 373,370.02 - - - - - - - - 373,370.02 - 373,370.02 Capital Lease Payable - Current 26610 - - - - - - - - 472,925.08 472,925.08 - 472,925.08 Capital Lease Payable - Non-current 26620 - - - - - - - - 14,613,062.26 14,613,062.26 - 14,613,062.26 Asset Retirement Obligations - Current 26710 - - - - - - - - - - - - Asset Retirement Obligations - Non Current 26720 - - - - - - - - - - - - Unearned Revenue 27100 149,949.25 - 875.00 - - - - - - 150,824.25 - 150,824.25 Due to Government Agencies 27200 391,722.42 - - - - - - - - 391,722.42 250.00 391,972.42 Due to Component Units - Primary 27300 295,037.85 90,768.43 - - - - - - - 385,806.28 (1,011.72) 384,794.56 Due to Component Units - DSO 27400 - - 230.74 - - - - - - 230.74 210.21 440.95 Due to Current Funds - Unrestricted 28100 - - - - - - - - - - - - Due to Current Funds - Restricted 28200 - - - - - - - - - - - - Due to Auxiliary Funds 28300 - - - - - - - - - - - - Due to Loan, Annuity & Life Income Funds 28400 - - - - - - - - - - - - Due to Scholarship Funds 28500 - - - - - - - - - - - - Due to Agency Funds 28600 - - - - - - - - - - - - Due to Unexpended Plant & Renewable/replacement Funds 28700 - - - - - - - - - - - - Due to Retirement of Indebtedness Funds 28800 - - - - - - - - - - - - Deferred Inflows of Resources 29900Deferred Inflows of Resources - Service Concession Arrangement 29901 - - - - - - - - - - - - Deferred Inflows of Resources -Accum Inc in the FV of Securities 29902 - - - - - - - - - - - - Deferred Inflows of Resources - Pension FRS 29908 1,403,057.00 - - - - - - - - 1,403,057.00 - 1,403,057.00 Deferred Inflows of Resources - Pension HIS 29909 2,863,451.00 - - - - - - - - 2,863,451.00 - 2,863,451.00 Deferred Inflows of Resources - Other Postemployment Benefits 29910 263,299.00 - - - - - - - - 263,299.00 - 263,299.00 Deffered Inflows of Resources - Lease Agreements 29911 - - - - - - - - - - - - Deferred Inflows - Irrevocable Split-Interest Agreements 29912 - - - - - - - - - - - - TOTAL LIABILITIES 168,106,642.07 273,160.82 111,374.11 - 210.21 707,709.64 574,156.21 - 16,548,987.34 186,322,240.40 (0.00) 186,322,240.40
RESERVES & FUND BALANCES (Fund Balance July 1)
Reserved for Encumbrance 30100 406,446.74 1,061,312.93 20.44 - - - - - - 1,467,780.11 - 1,467,780.11 Reserved for Performance Based Incentive Funds 30200 - - - - - - - - - - - - Reserved for Academic Improvement Trust Funds 30300 - - - - - - - - - - - - Reserved for Other Required Purposes 30400 - - - - - - - - - - - - Reserved for Staff & Program Development 30500 - - - - - - - - - - - - Reserved for Student Activities Funds 30600 - - - - - - - - - - - - Reserved for Matching Grants 30700 - - - - - - - - - - - - Amount Expected to Be Financed In Future Years 30800 (87,374,458.24) - - - - - - - - (87,374,458.24) - (87,374,458.24) Fund Balance - Board Designated 30900 400,000.00 - - 10,533,990.91 - - - - - 10,933,990.91 - 10,933,990.91 Fund Balance - Grantor 31000 - - - - - - - - - - - - Fund Balance - College 31100 24,131,861.65 158,642.02 11,169,852.57 1,534.63 1,998,541.70 - 19,622,480.93 37,659.49 - 57,120,572.99 - 57,120,572.99 Fund Balance - College - Local Funds 31110 - - - - - - - - - - - - Fund Balance - College - CO & DS 31120 - - - - - - - - - - - - Fund Balance - College - Federal Sources 31130 - - - - - - - - - - - - Fund Balance - College- Other State 31140 - - - - - - - - - - - - Fund Balance - College - SBE Bonds 31150 - - - - - - - - - - - - Fund Balance - College - Loan Funds 31160 - - - - - - - - - - - - Fund Balance - College - PECO Funds 31170 - - - - - - - - - - - - Invested In Plant 31200 - - - - - - - - 265,578,223.84 265,578,223.84 - 265,578,223.84 Changes In Fund Balances 38000 - - - - - - - - - - - -
49
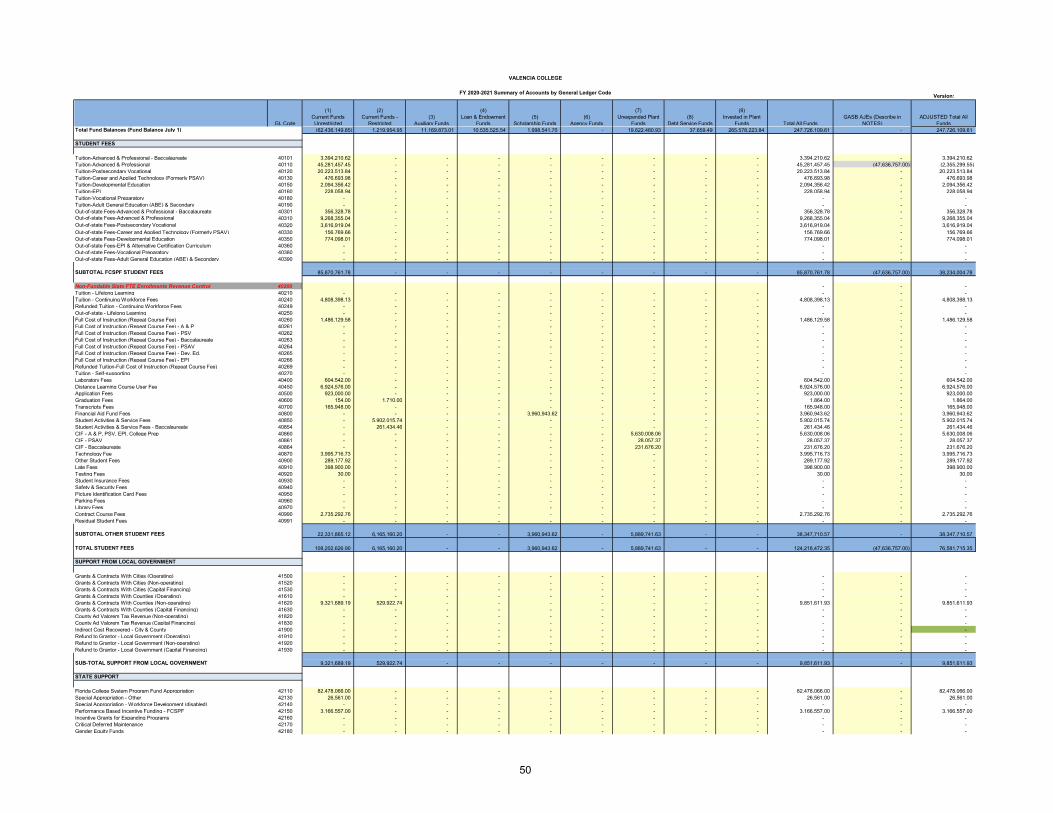
VALENCIA COLLEGE
FY 2020-2021 Summary of Accounts by General Ledger Code Version:
GL Code
(1) Current Funds Unrestricted
(2) Current Funds -
Restricted(3)
Auxiliary Funds
(4) Loan & Endowment
Funds(5)
Scholarship Funds(6)
Agency Funds
(7) Unexpended Plant
Funds(8)
Debt Service Funds
(9) Invested in Plant
Funds Total All FundsGASB AJEs (Describe in
NOTES)ADJUSTED Total All
FundsTotal Fund Balances (Fund Balance July 1) (62,436,149.85) 1,219,954.95 11,169,873.01 10,535,525.54 1,998,541.70 - 19,622,480.93 37,659.49 265,578,223.84 247,726,109.61 - 247,726,109.61
STUDENT FEES
Tuition-Advanced & Professional - Baccalaureate 40101 3,394,210.62 - - - - - - - - 3,394,210.62 - 3,394,210.62 Tuition-Advanced & Professional 40110 45,281,457.45 - - - - - - - - 45,281,457.45 (47,636,757.00) (2,355,299.55) Tuition-Postsecondary Vocational 40120 20,223,513.84 - - - - - - - - 20,223,513.84 - 20,223,513.84 Tuition-Career and Applied Technology (Formerly PSAV) 40130 476,693.98 - - - - - - - - 476,693.98 - 476,693.98 Tuition-Developmental Education 40150 2,094,356.42 - - - - - - - - 2,094,356.42 - 2,094,356.42 Tuition-EPI 40160 228,058.94 - - - - - - - - 228,058.94 - 228,058.94 Tuition-Vocational Preparatory 40180 - - - - - - - - - - - - Tuition-Adult General Education (ABE) & Secondary 40190 - - - - - - - - - - - - Out-of-state Fees-Advanced & Professional - Baccalaureate 40301 356,328.78 - - - - - - - - 356,328.78 - 356,328.78 Out-of-state Fees-Advanced & Professional 40310 9,268,355.04 - - - - - - - - 9,268,355.04 - 9,268,355.04 Out-of-state Fees-Postsecondary Vocational 40320 3,616,919.04 - - - - - - - - 3,616,919.04 - 3,616,919.04 Out-of-state Fees-Career and Applied Technology (Formerly PSAV) 40330 156,769.66 - - - - - - - - 156,769.66 - 156,769.66 Out-of-state Fees-Developmental Education 40350 774,098.01 - - - - - - - - 774,098.01 - 774,098.01 Out-of-state Fees-EPI & Alternative Certification Curriculum 40360 - - - - - - - - - - - - Out-of-state Fees-Vocational Preparatory 40380 - - - - - - - - - - - - Out-of-state Fees-Adult General Education (ABE) & Secondary 40390 - - - - - - - - - - - -
SUBTOTAL FCSPF STUDENT FEES 85,870,761.78 - - - - - - - - 85,870,761.78 (47,636,757.00) 38,234,004.78
Non-Fundable State FTE Enrollments Revenue Control 40200 - - - Tuition - Lifelong Learning 40210 - - - - - - - - - - - - Tuition - Continuing Workforce Fees 40240 4,808,398.13 - - - - - - - - 4,808,398.13 - 4,808,398.13 Refunded Tuition - Continuing Workforce Fees 40249 - - - - - - - - - - - - Out-of-state - Lifelong Learning 40250 - - - - - - - - - - - - Full Cost of Instruction (Repeat Course Fee) 40260 1,486,129.58 - - - - - - - - 1,486,129.58 - 1,486,129.58 Full Cost of Instruction (Repeat Course Fee) - A & P 40261 - - - - - - - - - - - - Full Cost of Instruction (Repeat Course Fee) - PSV 40262 - - - - - - - - - - - - Full Cost of Instruction (Repeat Course Fee) - Baccalaureate 40263 - - - - - - - - - - - - Full Cost of Instruction (Repeat Course Fee) - PSAV 40264 - - - - - - - - - - - - Full Cost of Instruction (Repeat Course Fee) - Dev. Ed. 40265 - - - - - - - - - - - - Full Cost of Instruction (Repeat Course Fee) - EPI 40266 - - - - - - - - - - - - Refunded Tuition-Full Cost of Instruction (Repeat Course Fee) 40269 - - - - - - - - - - - - Tuition - Self-supporting 40270 - - - - - - - - - - - - Laboratory Fees 40400 604,542.00 - - - - - - - - 604,542.00 - 604,542.00 Distance Learning Course User Fee 40450 6,924,576.00 - - - - - - - - 6,924,576.00 - 6,924,576.00 Application Fees 40500 923,000.00 - - - - - - - - 923,000.00 - 923,000.00 Graduation Fees 40600 154.00 1,710.00 - - - - - - - 1,864.00 - 1,864.00 Transcripts Fees 40700 165,948.00 - - - - - - - - 165,948.00 - 165,948.00 Financial Aid Fund Fees 40800 - - - - 3,960,943.62 - - - - 3,960,943.62 - 3,960,943.62 Student Activities & Service Fees 40850 - 5,902,015.74 - - - - - - - 5,902,015.74 - 5,902,015.74 Student Activities & Service Fees - Baccalaureate 40854 - 261,434.46 - - - - - - - 261,434.46 - 261,434.46 CIF - A & P, PSV, EPI, College Prep 40860 - - - - - - 5,630,008.06 - - 5,630,008.06 - 5,630,008.06 CIF - PSAV 40861 - - - - - - 28,057.37 - - 28,057.37 - 28,057.37 CIF - Baccalaureate 40864 - - - - - - 231,676.20 - - 231,676.20 - 231,676.20 Technology Fee 40870 3,995,716.73 - - - - - - - - 3,995,716.73 - 3,995,716.73 Other Student Fees 40900 289,177.92 - - - - - - - - 289,177.92 - 289,177.92 Late Fees 40910 398,900.00 - - - - - - - - 398,900.00 - 398,900.00 Testing Fees 40920 30.00 - - - - - - - - 30.00 - 30.00 Student Insurance Fees 40930 - - - - - - - - - - - - Safety & Security Fees 40940 - - - - - - - - - - - - Picture Identification Card Fees 40950 - - - - - - - - - - - - Parking Fees 40960 - - - - - - - - - - - - Library Fees 40970 - - - - - - - - - - - - Contract Course Fees 40990 2,735,292.76 - - - - - - - - 2,735,292.76 - 2,735,292.76 Residual Student Fees 40991 - - - - - - - - - - - -
SUBTOTAL OTHER STUDENT FEES 22,331,865.12 6,165,160.20 - - 3,960,943.62 - 5,889,741.63 - - 38,347,710.57 - 38,347,710.57
TOTAL STUDENT FEES 108,202,626.90 6,165,160.20 - - 3,960,943.62 - 5,889,741.63 - - 124,218,472.35 (47,636,757.00) 76,581,715.35
SUPPORT FROM LOCAL GOVERNMENT
Grants & Contracts With Cities (Operating) 41500 - - - - - - - - - - - - Grants & Contracts With Cities (Non-operating) 41520 - - - - - - - - - - - - Grants & Contracts With Cities (Capital Financing) 41530 - - - - - - - - - - - - Grants & Contracts With Counties (Operating) 41610 - - - - - - - - - - - - Grants & Contracts With Counties (Non-operating) 41620 9,321,689.19 529,922.74 - - - - - - - 9,851,611.93 - 9,851,611.93 Grants & Contracts With Counties (Capital Financing) 41630 - - - - - - - - - - - - County Ad Valorem Tax Revenue (Non-operating) 41820 - - - - - - - - - - - - County Ad Valorem Tax Revenue (Capital Financing) 41830 - - - - - - - - - - - - Indirect Cost Recovered - City & County 41900 - - - - - - - - - - - - Refund to Grantor - Local Government (Operating) 41910 - - - - - - - - - - - - Refund to Grantor - Local Government (Non-operating) 41920 - - - - - - - - - - - - Refund to Grantor - Local Government (Capital Financing) 41930 - - - - - - - - - - - -
SUB-TOTAL SUPPORT FROM LOCAL GOVERNMENT 9,321,689.19 529,922.74 - - - - - - - 9,851,611.93 - 9,851,611.93
STATE SUPPORT
Florida College System Program Fund Appropriation 42110 82,478,066.00 - - - - - - - - 82,478,066.00 - 82,478,066.00 Special Appropriation - Other 42130 26,561.00 - - - - - - - - 26,561.00 - 26,561.00 Special Appropriation - Workforce Development (disabled) 42140 - - - - - - - - - - - - Performance Based Incentive Funding - FCSPF 42150 3,166,557.00 - - - - - - - - 3,166,557.00 - 3,166,557.00 Incentive Grants for Expanding Programs 42160 - - - - - - - - - - - - Critical Deferred Maintenance 42170 - - - - - - - - - - - - Gender Equity Funds 42180 - - - - - - - - - - - -
50

VALENCIA COLLEGE
FY 2020-2021 Summary of Accounts by General Ledger Code Version:
GL Code
(1) Current Funds Unrestricted
(2) Current Funds -
Restricted(3)
Auxiliary Funds
(4) Loan & Endowment
Funds(5)
Scholarship Funds(6)
Agency Funds
(7) Unexpended Plant
Funds(8)
Debt Service Funds
(9) Invested in Plant
Funds Total All FundsGASB AJEs (Describe in
NOTES)ADJUSTED Total All
FundsLicense Tag Fees 42210 18,948.00 - - - - - 1,042,535.24 201,716.76 - 1,263,200.00 - 1,263,200.00 Public Education Capital Outlay 42310 - - - - - - - - - - - - Other State Appropriations 42500 - - - - - - - - - - - - Performance Based Incentive Program 42510 584,000.00 - - - - - - - - 584,000.00 - 584,000.00 Student Advising System Appropriation 42570 - - - - - - - - - - - - Facilities Enhancement Challenge Grants Appropriations 42580 - - - - - - - - - - - - Distance Learning Grants 42590 - - - - - - - - - - - - Lottery - Community College Program Fund 42610 9,052,905.00 - - - - - - - - 9,052,905.00 - 9,052,905.00 Information Technology Enhancement Grant 42620 - - - - - - - - - - - - Lottery - Facilities Enhancement Challenge Grant 42630 - - - - - - - - - - - - Lottery - Philip Benjamin Grant 42640 - - - - - - - - - - - - Lottery - Capital Projects from Bond Proceeds 42650 - - - - - - - - - - - - Lottery - Capitalization Incentive Funds 42690 - - - - - - - - - - - - Grants & Contracts - State (Operating) 42710 - - - - - - - - - - - - Grants & Contracts - State (Non-operating) 42720 411,711.81 475,959.30 - - - - - - - 887,671.11 - 887,671.11 Grants & Contracts - State (Capital Financing) 42730 - - - - - - - - - - - - Grants & Contracts - State Student Aid 42725 - - - - 12,634,579.34 - - - - 12,634,579.34 - 12,634,579.34 Indirect Cost Recovered - State 42900 - - - - - - - - - - - - Refund to Grantor - State Government (Operating) 42910 - - - - - - - - - - - - Refund to Grantor - State Government (Non-operating) 42920 - - - - - - - - - - - - Refund to Grantor - State Government (Capital Financing) 42930 - - - - - - - - - - - -
SUB-TOTAL STATE SUPPORT 95,738,748.81 475,959.30 - - 12,634,579.34 - 1,042,535.24 201,716.76 - 110,093,539.45 - 110,093,539.45
FEDERAL SUPPORT
Grants & Contracts Federal Government (Operating) 43510 - 1,130,065.30 - - - - - - - 1,130,065.30 - 1,130,065.30 Grants & Contracts Federal Government (Non-operating) 43520 106,075.00 6,329,924.87 - - - - - - - 6,435,999.87 - 6,435,999.87 Grants & Contracts Federal Government -Stimulus (HEERF) - Institutional 43521 - 12,542,892.57 - - - - - - - 12,542,892.57 - 12,542,892.57 Grants & Contracts Federal Government (Student Aid) 43525 - - - - 83,634,875.44 - - - - 83,634,875.44 - 83,634,875.44 Grants & Contracts Federal Government -Stimulus (HEERF) - Student 43526 - - - - 7,399,752.00 - - - - 7,399,752.00 - 7,399,752.00 Grants & Contracts Federal Government (Capital Financing) 43530 - - - - - - - - - - - - Indirect Cost Recovered (federal) 43900 250,202.95 - - - - - - - - 250,202.95 (250,202.95) - Refund to Grantor - Federal Government (Operating) 43910 - - - - - - - - - - - - Refund to Grantor - Federal Government (Non-operating) 43920 - - - - - - - - - - - - Refund to Grantor - Federal Government (Capital Financing) 43930 - - - - - - - - - - - -
SUB-TOTAL FEDERAL SUPPORT 356,277.95 20,002,882.74 - - 91,034,627.44 - - - - 111,393,788.13 (250,202.95) 111,143,585.18
GIFTS, PRIVATE GRANTS & CONTRACTS
Cash Contributions 44100 - - - - - - - - - - - - Non-cash Contributions 44200 - - - - - - - - 17,000.00 17,000.00 - 17,000.00 Gifts, Grants & Contracts - Private (Operating) 44410 - - - - - - - - - - - - Gifts, Grants & Contracts - Private (Non Operating) 44420 795,725.30 811,363.91 125,000.00 - 2,819,356.51 - - - - 4,551,445.72 - 4,551,445.72 Gifts, Grants & Contracts - Private (Capital Financing) 44430 - - - - - - - - - - - - Indirect Costs Recovered - Private Sources 44900 552,072.00 - - - - - - - - 552,072.00 (552,072.00) - Refund to Grantor - Private Sources (Operating) 44910 - - - - - - - - - - - - Refund to Grantor - Private Sources (Non-operating) 44920 - - - - - - - - - - - - Refund to Grantor - Private Sources (Capital Financing) 44930 - - - - - - - - - - - -
SUB-TOTAL GIFTS, PRIVATE GRANTS & CONTRACTS 1,347,797.30 811,363.91 125,000.00 - 2,819,356.51 - - - 17,000.00 5,120,517.72 (552,072.00) 4,568,445.72
SALES & SERVICES DEPARTMENT
Bookstore Sales & Commissions 45000 - - 10,612,789.34 - - - - - - 10,612,789.34 (4,535,571.00) 6,077,218.34 Food Service Sales & Commissions 45600 - - - - - - - - - - - - Food Service Sales & Commissions - Contra 45699 - - - - - - - - - - - - Housing Fees 46000 - - - - - - - - - - - - Commissions 46200 - - 25,706.96 - - - - - - 25,706.96 - 25,706.96 Rental Revenue (Short-Term) 46400 425,342.64 - 990,809.65 - - - - - - 1,416,152.29 - 1,416,152.29 Lease Revenue (Long-Term) 46500 99,811.04 - - 190,965.00 - - - - - 290,776.04 - 290,776.04 Other Sales & Services 46600 33,040.00 - 115,440.14 - - - - - - 148,480.14 - 148,480.14 Risk Management Consortium Insurance Revenue 46650 - - - - - - - - - - - - Taxable Sales 46700 - - 0.10 - - - - - - 0.10 - 0.10 Interdepartmental Sales 46900 - - 214,194.46 - - - - - - 214,194.46 (214,194.46) - Interdepartmental Sales - Bookstore 46901 - - 54,865.10 - - - - - - 54,865.10 (54,865.10) - Interdepartmental Sales - Catering Food Sales 46902 - - - - - - - - - - - - Interdepartmental Sales - Miscellaneous 46903 16,406.03 - - - - - - - - 16,406.03 (16,406.03) -
SUB-TOTAL SALES & SERVICES DEPARTMENT 574,599.71 - 12,013,805.75 190,965.00 - - - - - 12,779,370.46 (4,821,036.59) 7,958,333.87
Endowment Income - Addition to Principal 47100 - - - - - - - - - - - - SUB-TOTAL ENDOWMENT INCOME - - - - - - - - - - - -
OTHER REVENUES
Interest & Dividends 48100 86,931.66 - 100,146.32 208,200.86 - - 50,483.37 13.70 - 445,775.91 - 445,775.91 Gain or Loss on Investments 48200 - - (36,554.95) (75,798.12) - - - - - (112,353.07) - (112,353.07) Fines & Penalties 48700 7,865.00 - - - (450.00) - - - - 7,415.00 - 7,415.00 Miscellaneous Revenues 48900 172,030.09 6,208.00 11,192.09 - (23.30) - - - - 189,406.88 - 189,406.88
SUB-TOTAL OTHER REVENUES 266,826.75 6,208.00 74,783.46 132,402.74 (473.30) - 50,483.37 13.70 - 530,244.72 - 530,244.72
NON-REVENUE RECEIPTS
Mandatory Transfers-In, Current Funds-Unrestricted 49110 - - - - - - - - - - - - Mandatory Transfers-In, Current Funds-Restricted 49120 - 7,124.30 - - - - - - - 7,124.30 (7,124.30) - Mandatory Transfers-In, Auxiliary Funds 49130 - - - - - - - - - - - -
51

VALENCIA COLLEGE
FY 2020-2021 Summary of Accounts by General Ledger Code Version:
GL Code
(1) Current Funds Unrestricted
(2) Current Funds -
Restricted(3)
Auxiliary Funds
(4) Loan & Endowment
Funds(5)
Scholarship Funds(6)
Agency Funds
(7) Unexpended Plant
Funds(8)
Debt Service Funds
(9) Invested in Plant
Funds Total All FundsGASB AJEs (Describe in
NOTES)ADJUSTED Total All
FundsMandatory Transfers-In, Loan, End., Ann.& Life Inc. Funds 49140 - - - - - - - - - - - - Mandatory Transfers-In, Scholarship Funds 49150 - - - - - - - - - - - - Mandatory Transfers-In, Unexp. Plant & Renewals/Repl. Funds 49170 - - - - - - - - - - - - Mandatory Transfers-In, Retirement of Indebtedness Funds 49180 - - - - - - - - - - - - Non-mandatory Transfers-In, Current Funds-Unrestricted 49210 - - - - - - - - - - - - Non-mandatory Transfers-In, Current Funds-Restricted 49220 - 65,897.00 - - 536,759.00 - - - - 602,656.00 (602,656.00) - Non-mandatory Transfers-In, Auxiliary Funds 49230 219,873.45 - 135,819.08 - - - - - - 355,692.53 (355,692.53) - Non-mandatory Transfers-In, Loan, End., Ann. & Life Inc. Funds 49240 - - - - 29,400.00 - - - - 29,400.00 (29,400.00) - Non-mandatory Transfers-In, Scholarship Funds 49250 - - - - 3,395.39 - - - - 3,395.39 (3,395.39) - Non-mandatory Transfers-In, Unexp. Plant & Ren./Repl. Funds 49270 - - 11,880.92 - - - - - - 11,880.92 (11,880.92) - Non-mandatory Transfers-In, Retirement of Indebtedness Funds 49280 - - - - - - - - - - - - Proceeds from Capital Assets & Related Long-term Debt 49500 - - - - - - - - - - - - Gain/Loss from Sale of Property 49505 - - - - - - - - 26,352.36 26,352.36 - 26,352.36 Proceeds from Sale of Property 49510 325,912.44 - - - - - - - - 325,912.44 - 325,912.44 Insurance Recovery 49520 - - - - - - - - - - - - Uninsured Loss Recovery 49521 1,362,433.59 - 883,723.00 - - - - - - 2,246,156.59 (2,246,156.59) - Prior Year Corrections 49600 - - - - - - - - - - - - Loan Principal & Interest Cancellation Reimbursement 49700 - - - - - - - - - - - - Over & Short 49900 (17.94) - - - - - - - - (17.94) - (17.94)
SUB-TOTAL NON-REVENUE RECEIPTS 1,908,201.54 73,021.30 1,031,423.00 - 569,554.39 - - - 26,352.36 3,608,552.59 (3,256,305.73) 352,246.86
GRAND TOTAL REVENUES 217,716,768.15 28,064,518.19 13,245,012.21 323,367.74 111,018,588.00 - 6,982,760.24 201,730.46 43,352.36 377,596,097.35 (56,516,374.27) 321,079,723.08
PERSONNEL COSTS
Salary - Risk Management Consortium 50110 - - - - - - - - - - - - Executive Management 51000 4,160,277.24 - 76,518.00 - - - - - - 4,236,795.24 - 4,236,795.24 Instructional Management 51100 2,384,049.07 - - - - - - - - 2,384,049.07 - 2,384,049.07 Institutional Management 51200 3,353,602.68 - - - - - - - - 3,353,602.68 - 3,353,602.68 Executive, Administrative, Managerial Sabbatical 51400 - - - - - - - - - - - - Executive, Administrative, Managerial Regular Part-time 51500 - - - - - - - - - - - - Instructional 52000 47,706,654.40 14,025.88 - - - - - - - 47,720,680.28 - 47,720,680.28 Instructional - Overload/supplemental 52100 5,761,495.94 88,460.07 - - - - - - - 5,849,956.01 - 5,849,956.01 Instructional - Substitution 52200 3,934.45 - - - - - - - - 3,934.45 - 3,934.45 Instructional - Para-professional / Associate / Assistant 52300 2,503,934.76 309,574.11 - - - - - - - 2,813,508.87 - 2,813,508.87 Instructional - Sabbatical 52400 - - - - - - - - - - - - Instructional - Phased Retirement 52500 993,824.93 9,630.19 - - - - - - - 1,003,455.12 - 1,003,455.12 Other Professional 53000 27,744,168.51 1,577,880.35 279,024.18 - - - - - - 29,601,073.04 - 29,601,073.04 Other Professional - Overload/supplemental 53100 130,121.02 4,018.38 4,892.60 - - - - - - 139,032.00 - 139,032.00 Other Professional - Substitution 53200 - - - - - - - - - - - - Other Professional - Para-professional / Associate / Assistant 53300 - - - - - - - - - - - - Other Professional - Regular Part-time 53500 71,341.90 - - - - - - - - 71,341.90 - 71,341.90 Technical, Clerical, Trade & Service 54000 19,093,615.10 464,119.48 832,089.75 - - - - - - 20,389,824.33 - 20,389,824.33 Technical, Clerical, Trade & Service - Overtime 54100 167,047.81 3,173.00 36,766.75 - - - - - - 206,987.56 - 206,987.56 Technical, Clerical, Trade & Service - Regular Part-time 54500 25,000,449.90 1,024,762.43 99,129.95 - - - - - - 26,124,342.28 - 26,124,342.28 OPS - Other Personnel - Executive, Administrative/ Managerial 55000 - - - - - - - - - - - - OPS - Instructional 56000 - - - - - - - - - - - - OPS - Instructional Substitutes 56100 17,020.07 - - - - - - - - 17,020.07 - 17,020.07 OPS - Other Professional Part-time 56500 31,080.08 - - - - - - - - 31,080.08 - 31,080.08 OPS - Technical, Clerical, Trade & Service 57000 3,039,650.04 1,121,309.04 77,637.94 - - - - - - 4,238,597.02 - 4,238,597.02 Student Employment - Institutional Work Study 58000 12,930.00 438,454.50 - - - - - - - 451,384.50 - 451,384.50 Student Employment - College Work Study Program 58100 188.00 594,565.50 - - - - - - - 594,753.50 - 594,753.50 Student Employment - College Work Experience Program 58200 - - - - - - - - - - - - Student Employment - Student Assistants 58300 - - - - - - - - - - - - Student Employment - Other Government Sources 58400 - - - - - - - - - - - - Employee Awards 58500 85,750.00 - - - - - - - - 85,750.00 - 85,750.00 Social Security Contributions 59100 8,919,079.82 245,497.65 98,078.93 - - - - - - 9,262,656.40 - 9,262,656.40 Social Security Alternative - Optional College Contribution 59112 - - - - - - - - - - - - Retirement Contributions 59200 11,804,158.92 298,896.06 127,607.75 - - - - - - 12,230,662.73 - 12,230,662.73 Pension Expense 59220 12,588,884.00 - - - - - - - - 12,588,884.00 - 12,588,884.00 Accrued Leave Expense (compensated Absences) 59300 1,579,970.66 - - - - - - - - 1,579,970.66 - 1,579,970.66 Accrued Severance Pay Expense 59400 66,855.12 - - - - - - - - 66,855.12 - 66,855.12 Other Benefits - Taxable 59500 232,277.74 - 12,500.00 - - - - - - 244,777.74 - 244,777.74 Prior Year Corrections 59600 - - - - - - - - - - - - Health Insurance OPEB Expense 59601 663,872.00 - - - - - - - - 663,872.00 - 663,872.00 Life Insurance OPEB Expense 59602 - - - - - - - - - - - - Insurance Benefits 59700 - - - - - - - - - - - - Health Insurance Contributions 59701 12,617,448.36 369,089.01 208,873.72 - - - - - - 13,195,411.09 - 13,195,411.09 Life Insurance Contributions 59702 72,198.63 2,102.78 1,189.05 - - - - - - 75,490.46 - 75,490.46 Dental Insurance Contribution 59703 575,469.68 17,647.31 9,652.73 - - - - - - 602,769.72 - 602,769.72 Disability Insurance Contribution 59704 - - - - - - - - - - - - Eye Care Insurance Contribution 59705 - - - - - - - - - - - - Matriculation Benefits & Reimbursement 59800 244,696.85 - - - - - - - - 244,696.85 (16,406.03) 228,290.82 Part-time Employee Matriculation Benefits 59810 - - - - - - - - - - - -
TOTAL PERSONNEL COSTS 191,626,047.68 6,583,205.74 1,863,961.35 - - - - - - 200,073,214.77 (16,406.03) 200,056,808.74
CURRENT EXPENSE
Expenses - Risk Management Consortium 60110 - - - - - - - - - - - - Travel 60500 155,584.66 119,734.08 38,202.14 - - - 3,010.84 - - 316,531.72 - 316,531.72 Freight & Postage 61000 166,175.15 17,499.40 554,300.65 - - - - - - 737,975.20 (54,865.10) 683,110.10 Telecommunications 61500 1,106,089.20 38,547.32 - - - - - - - 1,144,636.52 - 1,144,636.52 Printing 62000 141,647.21 48,818.32 5,930.08 - - - 271.00 - - 196,666.61 - 196,666.61 Repairs & Maintenance 62500 2,768,158.91 18,189.44 46,833.52 - - - 22,007.88 - - 2,855,189.75 - 2,855,189.75 Rentals (Short-Term) 63000 399,399.02 4,282.75 - - - - 575.00 - - 404,256.77 - 404,256.77 Lease Payments (Long-Term/Asset <$5,000) 63100 646,960.76 - 4,958.22 - - - - - - 651,918.98 - 651,918.98 Insurance 63500 - - - - - - - - - - - - Insurance - Property 63501 - - - - - - - - - - - -
52

VALENCIA COLLEGE
FY 2020-2021 Summary of Accounts by General Ledger Code Version:
GL Code
(1) Current Funds Unrestricted
(2) Current Funds -
Restricted(3)
Auxiliary Funds
(4) Loan & Endowment
Funds(5)
Scholarship Funds(6)
Agency Funds
(7) Unexpended Plant
Funds(8)
Debt Service Funds
(9) Invested in Plant
Funds Total All FundsGASB AJEs (Describe in
NOTES)ADJUSTED Total All
FundsInsurance - Workers Compensation 63502 (18,809.79) - - - - - - - - (18,809.79) - (18,809.79) Insurance - Student 63503 25,859.05 - - - - - - - - 25,859.05 - 25,859.05 Insurance - Fleet 63504 - - - - - - - - - - - - Insurance - General Liability 63505 3,132,112.00 - - - - - - - - 3,132,112.00 - 3,132,112.00 Insurance - Professional Liability 63506 - - - - - - - - - - - - Insurance - Patient-Centered Outcomes Research Institute Fee 63507 7,389.48 - - - - - - - - 7,389.48 - 7,389.48 Insurance - Risk Management Consortium 63700 - - - - - - - - - - - - Utilities 64000 - - - - - - - - - - - - Heating Fuels 64001 27,574.74 - - - - - - - - 27,574.74 - 27,574.74 Water & Sewer 64002 345,979.52 - - - - - - - - 345,979.52 - 345,979.52 Electricity 64003 2,593,695.73 - - - - - - - - 2,593,695.73 - 2,593,695.73 Garbage Collections 64004 108,598.93 - - - - - - - - 108,598.93 - 108,598.93 Fuel Vehicular 64005 82,481.87 - - - - - - - - 82,481.87 - 82,481.87 Hazardous Waste Removal 64006 22,375.65 - - - - - - - - 22,375.65 - 22,375.65 Storm Water Runoff Fees 64007 73,091.40 - - - - - - - - 73,091.40 - 73,091.40 Other Services 64500 6,618,851.75 2,116,747.80 28,906.42 - - - 4,237.26 89.03 - 8,768,832.26 - 8,768,832.26 Workforce / Wages/ Grant Participant Support Cost 64600 - 15,284.78 - - - - - - - 15,284.78 - 15,284.78 Service Provider Contracts - Workforce / Wages 64700 - - - - - - - - - - - - Professional Fees 65000 930,307.52 567,654.03 227,181.23 33,587.54 - - 76,000.00 - - 1,834,730.32 - 1,834,730.32 Educational, Office / Department Material & Supplies 65500 1,834,384.74 993,234.04 126,481.73 - - - - - - 2,954,100.51 (214,194.46) 2,739,906.05 Data Software - Non-capitalized 65700 5,248,604.31 2,544,555.00 59,552.33 - - - 906.30 - - 7,853,617.94 - 7,853,617.94 Maintenance & Construction Materials & Supplies 66000 884,163.75 52,773.52 - - - - - - - 936,937.27 - 936,937.27 Other Materials & Supplies 66500 304,660.75 1,389,182.51 29,017.45 - - - 52,914.90 - - 1,775,775.61 - 1,775,775.61 Library Resources 67000 - - - - - - - - - - - - Subscriptions 67001 19,554.99 - - - - - - - - 19,554.99 - 19,554.99 Periodicals 67002 - - - - - - - - - - - - Books 67003 3,302.42 - - - - - - - - 3,302.42 - 3,302.42 Other Library Collections 67004 20,024.00 1,119.94 - - - - - - - 21,143.94 - 21,143.94 E-resources - Purchased 67005 267,805.16 - - - - - - - - 267,805.16 - 267,805.16 E-resources Licensed 67006 774,735.88 - - - - - - - - 774,735.88 - 774,735.88 Purchases for Resale 67500 - - 8,098,129.95 - - - - - - 8,098,129.95 - 8,098,129.95 Indirect Cost Expense 67600 - 250,203.34 552,072.00 - (0.39) - - - - 802,274.95 (802,274.95) - Administrative Cost Pool Allocation 67700 - - - - - - - - - - - - Scholarships & Waivers 68000 665.00 5,936,894.95 - - 111,395,355.33 - - - - 117,332,915.28 (52,172,328.00) 65,160,587.28 Interest on Debt 68500 475,512.35 - - - - - - 72,786.74 - 548,299.09 - 548,299.09 Interest on Unfunded OPEB 68511 - - - - - - - - - - - - Payments on Debt Principal 69000 312,095.59 - - - - - - 132,000.00 (444,095.59) - - Mandatory Transfers-Out, Current Funds - Unrestricted 69110 - - - - - - - - - - - - Mandatory Transfers-Out, Current Funds - Restricted 69120 - 7,124.30 - - - - - - - 7,124.30 (7,124.30) - Mandatory Transfers-Out, Auxiliary Funds 69130 - - - - - - - - - - - - Mandatory Transfers-Out, Loan, End., Ann. & Life Inc. Funds 69140 - - - - - - - - - - - - Mandatory Transfers-Out, Scholarship Funds 69150 - - - - - - - - - - - - Mandatory Transfers-Out, Unexp. Plant & Ren./Repl. Funds 69170 - - - - - - - - - - - - Mandatory Transfers-Out, Retirement of Indebtedness Funds 69180 - - - - - - - - - - - - Non-mandatory Transfers-Out, Current Funds - Unrestricted 69210 - - 30,482.10 - - - - - - 30,482.10 (30,482.10) - Non-mandatory Transfers-Out, Current Funds -restricted 69220 - 65,897.00 - - - - - - - 65,897.00 (65,897.00) - Non-mandatory Transfers-Out, Auxiliary Funds 69230 - - 337,091.35 - - - - - - 337,091.35 (337,091.35) - Non-mandatory Transfers-Out, Loan, End., Ann. & Life Inc. Funds 69240 - - - - - - - - - - - - Non-mandatory Transfers-Out, Scholarship Funds 69250 - 536,759.00 - 29,400.00 3,395.39 - - - - 569,554.39 (569,554.39) -
Non-mandatory Transfers-Out, Unexp. Plant & Ren./Repl. Funds 69270 - - - - - - - - - - - - Non-mandatory Transfers-Out, Retire of Indebtedness 69280 - - - - - - - - - - - - Depreciation / Amortization Expense 69400 - - - - - - - - 11,017,585.62 11,017,585.62 - 11,017,585.62 Other Expenses 69500 359,527.51 - (32,878.54) - - - - - - 326,648.97 - 326,648.97 Uninsured Loss 69521 - 2,246,156.59 - - - - - - - 2,246,156.59 (2,246,156.59) - Prior Year Corrections 69600 (54,141.01) (639.20) - - - - - - - (54,780.21) - (54,780.21)
TOTAL CURRENT EXPENSE 29,784,418.20 16,970,018.91 10,106,260.63 62,987.54 111,398,750.33 - 159,923.18 204,875.77 10,573,490.03 179,260,724.59 (56,499,968.24) 122,760,756.35
CAPITAL OUTLAY
Minor Equipment - Risk Management Consortium 70110 - - - - - - - - - - - - Minor Equipment, Non-capitalized, Non Inventoried 70500 - - - - - - - - - - - - Minor Equipment - Non Capitalized Inventoried 70600 2,166,100.51 1,254,373.72 4,581.94 - - - 168,832.85 - - 3,593,889.02 - 3,593,889.02 Furniture & Equipment 71000 - - - - - - - - - - - - Capitalized Equipment - Risk Management Consortium 71009 - - - - - - - - - - - - Control Account for 3 Year Capital Asset Class 71010 - - - - - - - - - - - - Computer Technology 71011 5,398.00 11,198.00 - - - - - - (16,596.00) - - - Control Account for 5 Year Capital Asset Class 71020 527,986.15 2,512,220.88 147,700.00 - - - - - (3,187,907.03) - - - Control Account for 7 Year Capital Asset Class 71030 - - - - - - - - - - - - Control Account for 10 Year Capital Asset Class 71040 - - - - - - - - - - - - Data Software 72000 - - - - - - - - - - - - Artwork/artifact 73050 - - - - - - - - - - - - Lease Payments (Long-Term/Asset => $5,000) 73100 83,646.19 - - - - - - - (83,646.19) - - - Buildings & Fixed Equipment 75000 - - - - - - 171,042.33 - (171,042.33) - - - Remod. & Renov./Non Cap. Repair & Maint/Other Struct. & Improv 76000 3,760,062.02 141,600.00 - - - - 4,443,390.32 - - 8,345,052.34 - 8,345,052.34 Land 77000 - - - - - - - - - - - - Leasehold = > $25,000/project 78000 - - - - - - 990,700.91 - (990,700.91) - - - Other Structures & Land Improvements 79000 - - - - - - 970,372.73 - (970,372.73) - - -
TOTAL CAPITAL OUTLAY 6,543,192.87 3,919,392.60 152,281.94 - - - 6,744,339.14 - (5,420,265.19) 11,938,941.36 - 11,938,941.36
TOTAL ALL EXPENDITURES 227,953,658.75 27,472,617.25 12,122,503.92 62,987.54 111,398,750.33 - 6,904,262.32 204,875.77 5,153,224.84 391,272,880.72 (56,516,374.27) 334,756,506.45 CHANGE IN FUND BALANCE (10,236,890.60) 591,900.94 1,122,508.29 260,380.20 (380,162.33) - 78,497.92 (3,145.31) (5,109,872.48) (13,676,783.37) (0.00)$ (13,676,783.37)
53

VALENCIA COLLEGE
FY 2020-2021 Summary of Accounts by General Ledger Code Version:
GL Code
(1) Current Funds Unrestricted
(2) Current Funds -
Restricted(3)
Auxiliary Funds
(4) Loan & Endowment
Funds(5)
Scholarship Funds(6)
Agency Funds
(7) Unexpended Plant
Funds(8)
Debt Service Funds
(9) Invested in Plant
Funds Total All FundsGASB AJEs (Describe in
NOTES)ADJUSTED Total All
Funds
FUND BALANCEGL UNRESTRICTED
ACCOUNT TITLE CODE CURRENT
Reserved for Encumbrance 30100 1,449,277.38 3,515,187.80 - - - - 2,699,706.37 - - 7,664,171.55 - 7,664,171.55
Reserved for Performance Based Incentive Funds 30200 - - - - - - - - - - - - Reserved for Academic Improvement Trust Funds 30300 - - - - - - - - - - - - Reserved for Other Required Purposes 30400 - - - - - - - - - - - - Reserved for Staff & Program Development 30500 - - - - - - - - - - - - Reserved for Student Activities Funds 30600 - - - - - - - - - - - - Reserved for Matching Grants 30700 - - - - - - - - - - - - Fund Balance - Board Designated 30900 400,000.00 - - 10,794,371.11 - - - - - 11,194,371.11 - 11,194,371.11 Fund Balance - Grantor 31000 - - - - - - - - - - - - Fund Balance - College 31100 27,684,867.07 (1,703,331.91) 12,292,381.30 1,534.63 1,618,379.37 - 17,001,272.48 34,514.18 - 56,929,617.12 - 56,929,617.12 Invested In Plant 31200 - - - - - - - - 260,468,351.36 260,468,351.36 - 260,468,351.36 TOTAL RESERVE & UNALLOCATED FUND BALANCES 29,534,144.45 1,811,855.89 12,292,381.30 10,795,905.74 1,618,379.37 - 19,700,978.85 34,514.18 260,468,351.36 336,256,511.14 - 336,256,511.14 Amount Expected to be Financed in Future Yrs (negative number) 30800 (102,207,184.90) - - - - - - - - (102,207,184.90) - (102,207,184.90) TOTAL FUND BALANCES (72,673,040.45) 1,811,855.89 12,292,381.30 10,795,905.74 1,618,379.37 - 19,700,978.85 34,514.18 260,468,351.36 234,049,326.24 - 234,049,326.24
Prior Year 6-30 Fund Balance 24,938,308.39 (DOES NOT INCLUDE COMPENSATED ABSENCES). AMOUNT SHOULD BE THE SAME FIGURE AS PRIOR YEAR.Audit Adjustments 0.00 624,530.57 Average Daily ExpendituresOther Adjustments 0.00
Adjusted Prior Year Fund Balance 24,938,308.39 37,371,052.98 Fund 1 Cash and InvestmentsGrand Total Revenues 217,716,768.15 59.84 Days of Operating Cash on handTotal Funds Available 242,655,076.54
State StatuesUnencumbered Fund Balance as % of Total Funds Available 11.5740% (This calculation has been adjusted to conform to Section 1011.84(3)(e), Florida Statutes by including all technically unencumbered GL codes rather than only 31100.)
54

VALENCIA COLLEGESummary of Expenditures by FunctionCurrent Fund - Unrestricted (Fund 1)
Fiscal Year 2020-2021Version:2021.v01
Personnel Current Expense Capital Outlay %FUNCTION (GLC 50000s) (GLC 60000s) (GLC 70000s) Total Of Total
Instruction 101,727,141.96$ 3,304,455.28$ 534,661.46$ 105,566,258.70$ 46%Research -$ -$ -$ -$ 0%Public Service 159,252.91$ -$ 6,911.80$ 166,164.71$ 0%Academic Support
Academic Support-Other 22,313,996.23$ 2,958,922.03$ 524,609.86$ 25,797,528.12$ 11%Staff/Program Development 579,207.43$ 28,251.10$ -$ 607,458.53$ 0%
Student Support 25,712,052.30$ 1,059,903.64$ 52,091.62$ 26,824,047.56$ 12%Institutional Support 28,238,137.57$ 14,014,257.06$ 1,473,129.16$ 43,725,523.79$ 19%Plant Operation & Maintenance 12,833,583.72$ 8,418,629.09$ 3,951,788.97$ 25,204,001.78$ 11%Student Aid -$ -$ -$ -$ 0%Transfers, Contingencies, Etc. 62,675.56$ -$ -$ 62,675.56$ 0%
Total 191,626,047.68$ 29,784,418.20$ 6,543,192.87$ 227,953,658.75$ 100%
55
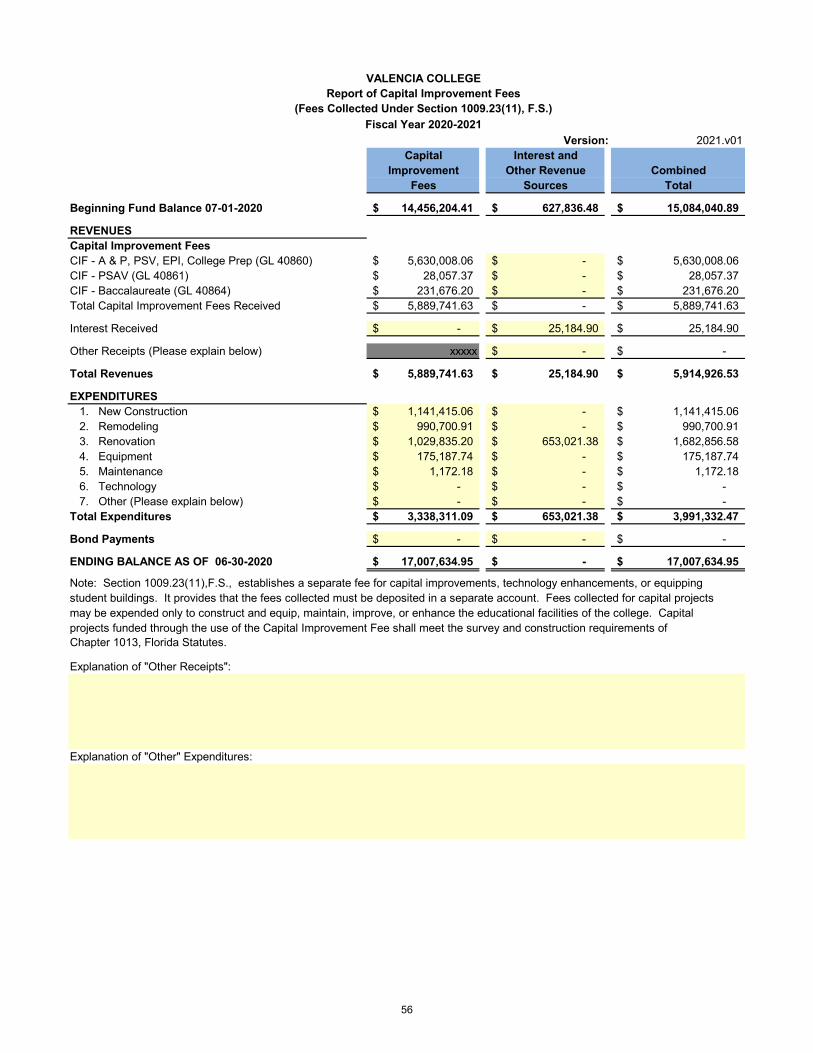
VALENCIA COLLEGEReport of Capital Improvement Fees
(Fees Collected Under Section 1009.23(11), F.S.)Fiscal Year 2020-2021
Version: 2021.v01Capital Interest and
Improvement Other Revenue CombinedFees Sources Total
Beginning Fund Balance 07-01-2020 14,456,204.41$ 627,836.48$ 15,084,040.89$
REVENUESCapital Improvement FeesCIF - A & P, PSV, EPI, College Prep (GL 40860) 5,630,008.06$ -$ 5,630,008.06$ CIF - PSAV (GL 40861) 28,057.37$ -$ 28,057.37$ CIF - Baccalaureate (GL 40864) 231,676.20$ -$ 231,676.20$ Total Capital Improvement Fees Received 5,889,741.63$ -$ 5,889,741.63$
Interest Received -$ 25,184.90$ 25,184.90$
Other Receipts (Please explain below) xxxxx -$ -$
Total Revenues 5,889,741.63$ 25,184.90$ 5,914,926.53$
EXPENDITURES 1. New Construction 1,141,415.06$ -$ 1,141,415.06$ 2. Remodeling 990,700.91$ -$ 990,700.91$ 3. Renovation 1,029,835.20$ 653,021.38$ 1,682,856.58$ 4. Equipment 175,187.74$ -$ 175,187.74$ 5. Maintenance 1,172.18$ -$ 1,172.18$ 6. Technology -$ -$ -$ 7. Other (Please explain below) -$ -$ -$ Total Expenditures 3,338,311.09$ 653,021.38$ 3,991,332.47$
Bond Payments -$ -$ -$
ENDING BALANCE AS OF 06-30-2020 17,007,634.95$ -$ 17,007,634.95$
Note: Section 1009.23(11),F.S., establishes a separate fee for capital improvements, technology enhancements, or equippingstudent buildings. It provides that the fees collected must be deposited in a separate account. Fees collected for capital projects may be expended only to construct and equip, maintain, improve, or enhance the educational facilities of the college. Capital projects funded through the use of the Capital Improvement Fee shall meet the survey and construction requirements ofChapter 1013, Florida Statutes.
Explanation of "Other Receipts":
Explanation of "Other" Expenditures:
56

VALENCIA COLLEGEDISTANCE LEARNING COURSE USER FEE REPORT
Fiscal Year 2020-2021Version: 2021.v01
DISTANCE LEARNING COURSE USER FEE REVENUE
Total Distance Learning Fee Revenue 6,924,576.00$ (General Ledger Code 40450)
DISTANCE LEARNING COURSE EXPENDITURES1. Personnel Costs 5,487,569.11$ 2. Materials and Supplies 858.48$ 3. Software 1,322,178.41$ 4. Computers -$ 5. Peripherals -$ 6. Repairs and Maintenance -$ 7. Contracted Services 113,970.00$ 8. Temporary Contracted Services -$ 9. Other (Specify) -$
10. Other (Specify) -$ 11. Other (Specify) -$
TOTAL EXPENDITURES 6,924,576.00$
TOTAL REVENUE LESS TOTAL EXPENDITURES -$
Note: Section 1009.23(16), Florida Statutes, authorizes a per credit hour distance learning course user fee and requires that colleges submit a distance learning course user fee report to the Division of Florida Colleges.To assist with fullfilling this reporting requirement, the Division of Florida Colleges has credited the above report templete to provide reporting consistency among colleges. This report is intended to describe the use of the distancelearning courses user fee revenue, therefore, only report the expenditures of the revenues collected in GL 40450; do not report any additional distancelearning expenditures even though actual expenses may exceed the revenues collected.
57

VALENCIA COLLEGEReport of Student Activities and Service Fees
Revenues and ExpendituresFiscal Year 2020-2021
Version: 2021.v01
BEGINNING BALANCE 1,113,963.29$
FEES COLLECTED (GL 40850) 5,902,015.74$ FEES COLLECTED (GL 40854 - Baccalaureate) 261,434.46$ OTHER REVENUES (See Note Below) 1,710.00$ TOTAL 6,165,160.20$ EXPENDITURES BY TYPE
5.1000 Social & Cultural Development 5,107,464.45$ 5.2000 Organized Athletics -$ 5.3000 Counseling & Advisement -$ 5.4000 Placement Services -$ 5.5000 Financial Aid Administration -$ 5.6000 Student Records and Admissions -$ 5.7000 Health Services -$ 5.8100 Services for Special Students -$ 5.9000 Student Service Administration -$
OTHER (See note below) 324,576.84$ TOTAL EXPENDITURES 5,432,041.29$
ENDING BALANCE 1,847,082.20$
Note: Other Revenues Include -Diploma replacement feesNote: Other Expenditures Include -Commencement activities
58

VALENCIA COLLEGEVersion: 2021.v01
2020-2021 FEES
TOTAL TOTAL TUITION AND CCPF TUITION AND FEES GLC ALL FUNDS OUT-OF-STATE FEESTuition-Advanced & Professional - Baccalaureate 40101 3,394,210.62$ 3,750,539.40$ Tuition-Advanced & Professional 40110 45,281,457.45$ 54,549,812.49$ Tuition-Postsecondary Vocational 40120 20,223,513.84$ 23,840,432.88$ Tuition-Career and Applied Technology (Formerly PSAV) 40130 476,693.98$ 633,463.64$ Tuition-Developmental Education 40150 2,094,356.42$ 2,868,454.43$ Tuition-EPI 40160 228,058.94$ 228,058.94$ Tuition-Vocational Preparatory 40180 -$ -$ Tuition-Adult General Education (ABE) & Secondary 40190 -$ -$
SUBTOTAL IN-STATE TUITION 71,698,291.25$ 85,870,761.78$ Out-of-state Fees-Advanced & Professional - Baccalaureate 40301 356,328.78$ Out-of-state Fees-Advanced & Professional 40310 9,268,355.04$ Out-of-state Fees-Postsecondary Vocational 40320 3,616,919.04$ Out-of-state Fees-Career and Applied Technology (Formerly PSAV) 40330 156,769.66$ Out-of-state Fees-Developmental Education 40350 774,098.01$ Out-of-state Fees-EPI & Alternative Certification Curriculum 40360 -$ Out-of-state Fees-Vocational Preparatory 40380 -$ Out-of-state Fees-Adult General Education (ABE) & Secondary 40390 -$
SUBTOTAL OUT-OF-STATE FEES 14,172,470.53$ from Accounts by GL:TOTAL CCPF STUDENT TUITION AND OUT-OF-STATE FEES 85,870,761.78$ 85,870,761.78$
OTHER TUITION AND FEESTuition - Lifelong Learning 40210 -$ Tuition - Continuing Workforce Fees 40240 4,808,398.13$ Refunded Tuition - Continuing Workforce Fees 40249 -$ Out-of-state - Lifelong Learning 40250 -$ Full Cost of Instruction (Repeat Course Fee) 40260 1,486,129.58$ Full Cost of Instruction (Repeat Course Fee) - A & P 40261 -$ Full Cost of Instruction (Repeat Course Fee) - PSV 40262 -$ Full Cost of Instruction (Repeat Course Fee) - Baccalaureate 40263 -$ Full Cost of Instruction (Repeat Course Fee) - PSAV 40264 -$ Full Cost of Instruction (Repeat Course Fee) - Dev. Ed. 40265 -$ Full Cost of Instruction (Repeat Course Fee) - EPI 40266 -$ Refunded Tuition-Full Cost of Instruction (Repeat Course Fee) 40269 -$ Tuition - Self-supporting 40270 -$ Laboratory Fees 40400 604,542.00$ Distance Learning Course User Fee 40450 6,924,576.00$ Application Fees 40500 923,000.00$ Graduation Fees 40600 1,864.00$ Transcripts Fees 40700 165,948.00$ Financial Aid Fund Fees 40800 3,960,943.62$ Student Activities & Service Fees 40850 5,902,015.74$ Student Activities & Service Fees - Baccalaureate 40854 261,434.46$ CIF - A & P, PSV, EPI, College Prep 40860 5,630,008.06$ CIF - PSAV 40861 28,057.37$ CIF - Baccalaureate 40864 231,676.20$ Technology Fee 40870 3,995,716.73$ Other Student Fees 40900 289,177.92$ Late Fees 40910 398,900.00$ Testing Fees 40920 30.00$ Student Insurance Fees 40930 -$ Safety & Security Fees 40940 -$ Picture Identification Card Fees 40950 -$ Parking Fees 40960 -$ Library Fees 40970 -$ Contract Course Fees 40990 2,735,292.76$ Residual Student Fees 40991 -$
SUBTOTAL OTHER TUITION AND STUDENT FEES 38,347,710.57$ TOTAL TUITION AND STUDENT FEES 124,218,472.35$
59

VALENCIA COLLEGE2020-2021 FEES
PART II. STUDENT FINANCIAL AID FEE REPORT (Supporting Schedule)
Fund 1 GL RevenueTUITION A & P 40101 & 40110 48,675,668.07$ TUITION PSV 40120 20,223,513.84$ TUITION PSAV 40130 476,693.98$ TUITION DEV. ED. 40150 2,094,356.42$ TUITION EPI 40160 228,058.94$ TUITION VOC PREP 40180 -$ TUITION ABE & SEC 40190 -$ OUT-OF-STATE A & P 40301 & 40310 9,624,683.82$ OUT-OF-STATE PSV 40320 3,616,919.04$ OUT-OF-STATE PSAV 40330 156,769.66$ OUT-OF-STATE DEV. ED. 40350 774,098.01$ OUT-OF-STATE EPI 40360 -$ OUT-OF-STATE VOC PREP 40380 -$ OUT-OF-STATE ABE & SEC 40390 -$
TOTAL FUND 1 85,870,761.78$
FUND 2TUITION A & P 40101 & 40110 -$ OUT-OF-STATE A & P 40301 & 40310 -$
TOTAL FUND 2 -$
TOTAL FUND 1 AND FUND 2 85,870,761.78$
STUDENT FEE REVENUETUITION 71,698,291.25$
OUT-OF-STATE 14,172,470.53$
TOTAL TUITION AND OUT-OF-STATE FEES 85,870,761.78$
TECHNOLOGY FEES 3,995,716.73$
TOTAL TUITION, OUT-OF-STATE FEES AND TECHNOLOGY 89,866,478.51$
DO NOT USE AMOUNTS TO CALCULATE TOTAL FTE.
60

VALENCIA COLLEGEA COMPONENT UNIT OF THE STATE OF FLORIDA
NOTES TO THE FINANCIAL STATEMENTS (CONTINUED)For the Fiscal Year Ended June 30, 2021
LONG-TERM LIABILITIES
Long term liabilities activity for the fiscal year ended June 30, 2021, is shown below:
Description Beginning Additions Reductions Ending CurrentBalance Balance Liabilities
Bonds Payable 1,595,000$ $ 132,000$ 1,463,000$ 136,000$ Note(s) Payable $ - - $ Installment Purchase(s) Payable $ - - $ Capital Lease(s) Payable 14,838,208$ 643,521 395,742 15,085,987$ 472,925 Special Termination Benefits Payable 374,835$ 66,855 32,987 408,703$ 35,334 Compensated Absences Payable 10,275,432$ 2,190,762 610,791 11,855,403$ 733,889 Other Postemployment Benefits Payable 6,933,103$ 1,715,163 358,974 8,289,292 431,421 Net Pension Liability FRS 70,683,688$ 47,918,629 32,125,872 86,476,445 Net Pension Liability HIS 36,161,926$ 15,620,858 13,097,306 38,685,478 403,297 Other Long-Term Liabilities $ - -
Total Long-Term Liabilities 140,862,192$ 68,155,788$ 46,753,672$ 162,264,308$ 2,212,866$
61
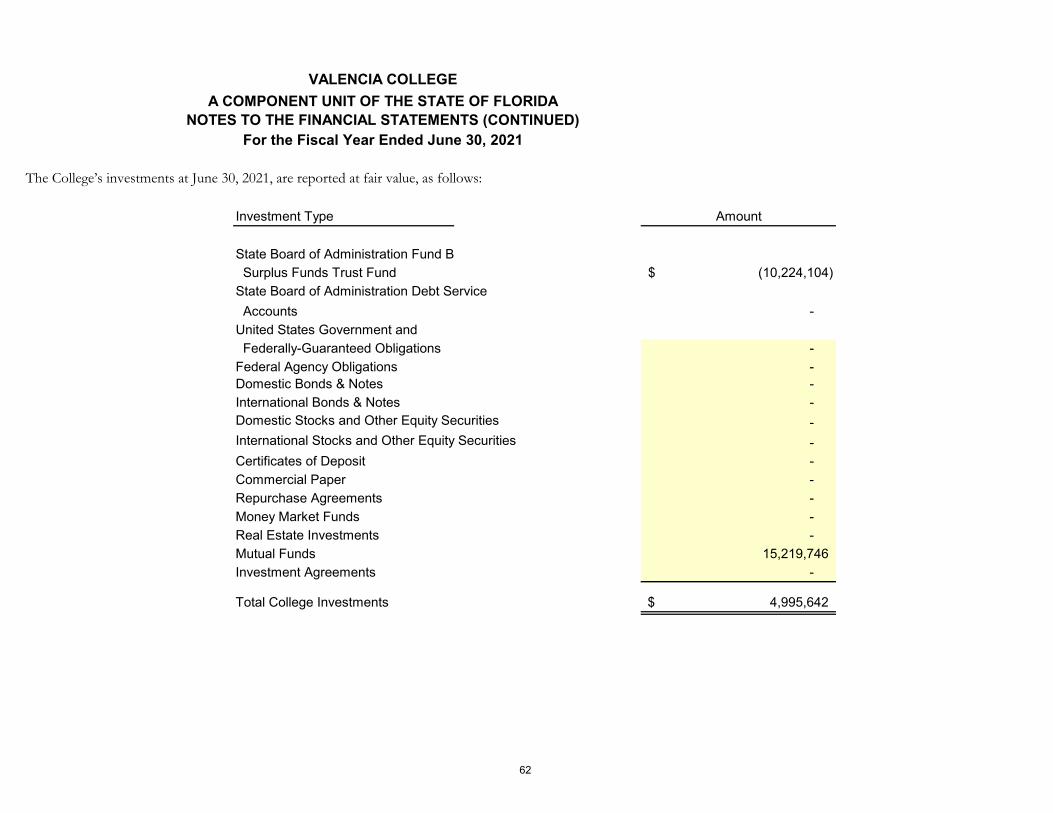
VALENCIA COLLEGEA COMPONENT UNIT OF THE STATE OF FLORIDA
NOTES TO THE FINANCIAL STATEMENTS (CONTINUED)For the Fiscal Year Ended June 30, 2021
The College’s investments at June 30, 2021, are reported at fair value, as follows:
Investment Type Amount
State Board of Administration Fund B Surplus Funds Trust Fund (10,224,104)$ State Board of Administration Debt Service Accounts - United States Government and Federally-Guaranteed Obligations - Federal Agency Obligations - Domestic Bonds & Notes - International Bonds & Notes - Domestic Stocks and Other Equity Securities - International Stocks and Other Equity Securities - Certificates of Deposit - Commercial Paper - Repurchase Agreements - Money Market Funds - Real Estate Investments - Mutual Funds 15,219,746 Investment Agreements -
Total College Investments 4,995,642$
62

VALENCIA COLLEGEA COMPONENT UNIT OF THE STATE OF FLORIDA
NOTES TO THE FINANCIAL STATEMENTS (CONTINUED)For the Fiscal Year Ended June 30, 2021
XX. CAPITAL ASSETS
Capital assets activity for the fiscal year ended June 30, 2021, is shown below:
Description Beginning Adjustments Additions Reductions EndingBalance (1) Balance
Nondepreciable Capital Assets:Land 32,987,698$ - - - 32,987,698$ Artwork/Artifacts -$ - - - - Computer Software -$ - - - - Construction in Progress 16,073,572$ - 2,132,117 17,032,377 1,173,312
Total Nondepreciable Capital Assets 49,061,270$ -$ 2,132,117$ 17,032,377$ 34,161,010$
Depreciable Capital Assets:Buildings 324,491,920$ - 15,624,470 - 340,116,390$ Other Structures and Improvements 1,731,345$ - 1,407,907 - 3,139,252 Furniture, Machinery, and Equipment 26,889,160$ - 3,247,855 691,644 29,445,371 Leasehold Improvements 13,193,098$ - - - 13,193,098 Assets Under Capital Lease(s) 15,298,373$ - 643,521 - 15,941,894 Computer Software -$ - - - -
Total Depreciable Capital Assets 381,603,896 -$ 20,923,753$ 691,644$ 401,836,005
Less, Accumulated Depreciation:Buildings 123,663,450$ - 7,372,162 - 131,035,612 Other Structures and Improvements 565,105$ - 313,925 - 879,030 Furniture, Machinery, and Equipment 22,223,618$ - 2,468,983 691,644 24,000,957 Leasehold Improvements 834,731$ - 398,133 - 1,232,864 Assets Under Capital Lease(s) 1,366,833$ - 464,383 - 1,831,216 Computer Software -$ - - - -
Total Accumulated Depreciation 148,653,737 - 11,017,586 691,644 158,979,679
Total Depreciable Capital Assets, Net 232,950,159$ $ 9,906,167$ $ 242,856,326$
Note: (1) No adjustment needed to correct prior year accounting errors.
63

VALENCIA COLLEGE Version:SUMMARY OF COMPONENT UNIT NOTES TO THE FINANCIAL STATEMENTS 2021.v01
For the Fiscal Year Ended June 30, 2021
COMPONENT UNIT CAPITAL ASSETS
Description Beginning Additions Reductions EndingBalance Balance
Nondepreciable Capital Assets:Land 3,084,063$ -$ -$ 3,084,063$ Artwork/Collections -$ - - - Other Nondepreciable Assets -$ - - - Construction in Progress -$ - - -
Total Nondepreciable Capital Assets 3,084,063$ -$ -$ 3,084,063$
Depreciable Capital Assets:Buildings 6,134,430$ -$ -$ 6,134,430$ Furniture, Machinery, and Equipment 64,026$ 10,365 - 74,391 Other Depreciable Assets -$ - - -
Total Depreciable Capital Assets 6,198,456 10,365 - 6,208,821
Less, Accumulated Depreciation:Buildings 920,166$ 153,360.74$ -$ 1,073,527 Furniture, Machinery, and Equipment 30,468$ 7,368 - 37,836 Other Depriciable Assets -$ - - -
Total Accumulated Depreciation 950,634 160,729 - 1,111,363
Total Depreciable Capital Assets, Net 5,247,822$ (150,364)$ -$ 5,097,458$
COMPONENT UNIT LONG‑TERM LIABILITIES
Description Beginning Additions Reductions Ending CurrentBalance Balance Portion
Bonds Payable -$ $ $ $ $ Note(s) Payable -$ - - - - Installment Purchase(s) Payable -$ - - - - Capital Lease(s) Payable -$ - - - - Special Termination Benefits Payable -$ - - - - Compensated Absences Payable -$ - - - - Other Postemployment Benefits Payable -$ - - - - FRS Net Pension Liability -$ - - - - HIS Net Pension Liability -$ - - - - Other Long-Term Liabilities -$ - - - -
Total Long-Term Liabilities $ $ $ $ $
64
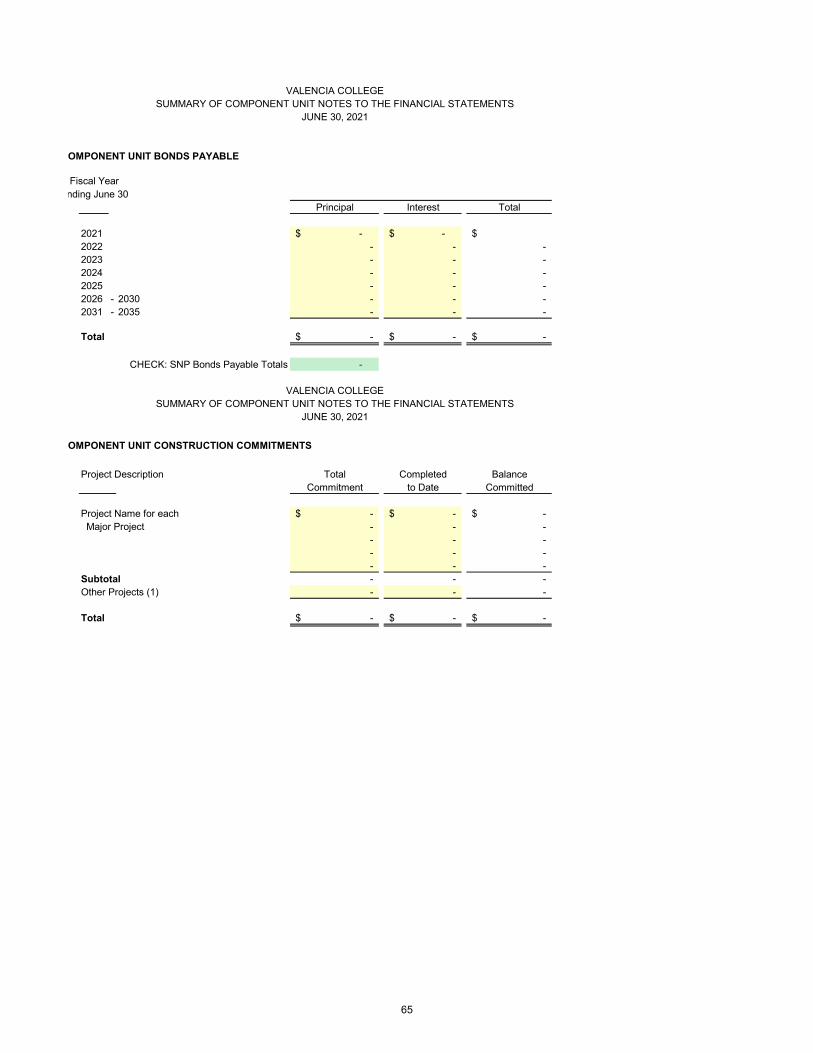
VALENCIA COLLEGESUMMARY OF COMPONENT UNIT NOTES TO THE FINANCIAL STATEMENTS
JUNE 30, 2021
OMPONENT UNIT BONDS PAYABLE
Fiscal Yearnding June 30
Principal Interest Total
2021 -$ -$ $ 2022 - - - 2023 - - - 2024 - - - 2025 - - - 2026 - 2030 - - - 2031 - 2035 - - -
Total -$ -$ -$
CHECK: SNP Bonds Payable Totals -
VALENCIA COLLEGESUMMARY OF COMPONENT UNIT NOTES TO THE FINANCIAL STATEMENTS
JUNE 30, 2021
OMPONENT UNIT CONSTRUCTION COMMITMENTS
Project Description Total Completed BalanceCommitment to Date Committed
Project Name for each -$ -$ -$ Major Project - - -
- - - - - - - - -
Subtotal - - - Other Projects (1) - - -
Total -$ -$ -$
65

OMPONENT UNIT INVESTMENTS AND CASH AND CASH EQUIVALENTS
The Component Unit’s investments at June 30, 2021, are reported at fair value, as follows:
Investment Type Amount
Certificates of Deposit $ Commercial Paper - State Board of Administration Fund B Surplus Funds Trust Fund - State Board of Administration Debt Service Accounts - United States Government and Federally-Guaranteed Obligations - Federal Agency Obligations - Domestic Bonds and Notes - International Bonds and Notes - Domestic Stocks and Other Equity Securities - International Stocks and Other Equity Securities - Repurchase Agreements - Money Market Funds - Real Estate Investments - Mutual Funds 78,978,138 Investment Agreements 10,308,171
Total Component Unit Investments 89,286,309$
CHECK: SNA Investments Totals 89,286,309
Does the component unit carry all investments at fair value? Yes YesNo
The Component Unit's cash and cash equivalents are as follows:
Cash on Hand $ Cash in Depository 619,678 (1)Cash and Cash Equivalents - SBA - Cash and Cash Equivalents - State Treasury - Money Market Funds 2,528,734 Certificates of Deposit - Commercial Paper - Other -
3,148,412$
CHECK: SNP Investments Totals 3,148,412
(1) Cash in Depository - Bank Statement Balance 619,678$
TE: If the amounts above are public deposits in a Qualified Public Depository in compliance with Section 280, Florida Statutes, SKIP THISCTION. Otherwise, disclose amounts for any portion of the above deposits that exceed federal deposit insurance limits and are:
Uncollateralized $ Collateralized with securities held by the pledging financial institution, but not in depositor-CU's name.
$ Collateralized with securities held by the pledging financial institution's trust department or agent, but not in depositor-CU's name.
$
66

Asset Retirement Obligations 6/30/2021
THIS IS A REQUIRED FORM AND MUST BE COMPLETED AND RETURNEDBY EVERY DISCRETELY PRESENTED COMPONENT UNIT EVEN IF IT IS NOT APPLICABLE
OLOAgency name
Fund number
Does an ARO Exist for your entity as of
6/30/2021?
General Description of
Asset having ARO
Current Value of ARO as of 6/30/2021
Method Used to measure the liability value?
Assumptions Used?
Estimated Remaining useful
life of Asset
External obligating event creating
this ARO.
430000 DFS 10-1-000122 YesX-ray Machine
containing mercury$500,000 Estimate
Used Current Pricing for hazardous waste container
and shipping cost2 years F.S. 366.95
480000 Valencia College 95-8-000028
If Not Applicable N/A
67

Component Unit Name:
Component Unit Fund Number: 480000-95-8-000028
A.
Reconciled Bank Balance (1) Bank Statement Balance (2)
Totals 10,496,749.86 9,512,913.50
B. Yes X No
C.
or,
Bank Statement Balance
(1) (2) (3)
Total 0.00
Governing Policy:
D.
Currency Type Bank Statement Balance (in US $)
Total 0.00
Governing Policy:
(1) Uncollateralized,
(2) Collateralized with securities held by the pledging financial institution, but not in the depositor-government's name
(3) Collateralized with securities held by the pledging financial institution's trust department or agent, but not in the depositor-government's name .
Explain the governing policy related to these deposits. If there is no deposit policy addressing a specific type of risk that the deposits are exposed to, the disclosure should indicate that fact.
List amounts for any portion of the above Deposit Totals that are exposed to foreign currency risk and explain the governing policy related to these deposits. If there is no deposit policy addressing a specific type of risk that the deposits are exposed to, the disclosure should indicate that fact.
NOTE: If the amounts above are public deposits in a Qualified Public Depository in compliance with Section 280, Florida Statutes, SKIP THIS SECTION. Otherwise, disclose amounts for any portion of the above deposits that exceed federal deposit insurance limits and are:
Check "Yes" or "No" as to whether any violations of legal or contractual provisions have occurred in relationship to the reported deposits. For items k d "Y " tt h b i f d i ti
Department of Financial Services - Statewide Financial StatementsDiscretely Presented Component Unit - Form CU1 - Deposits
GL 112XX & 222XX
Deposits are defined in Section 280.02(23), Florida Statutes. PLEASE SUBMIT ONE FORM FOR EACH FUND.
List the current year ending 6/30 reconciled/authorized deposit amounts and corresponding unadjusted bank statement balances below. If this is a revolving fund, the amount recorded as the Reconciled Bank Balance should equal the approved amount of the revolving fund less any portion maintained as cash on hand.
(1) The total amount of this column must agree to the amounts recorded in general ledger codes 112XX and 222XX of the FLAIR trial balance. DO NOT include cash in the State Treasurer (GL 121XX, 122XX, & 124XX) nor those maintained with the State Board of Administration (GL 113XX & 223XX) on this form.
(2) This information can be obtained directly from the 6/30 bank statement.
June 30, 2021
Valencia College
68

Component Unit Name: Valencia College
Component Unit Fund Number: 480000-95-8-000028
(Section A)
Quoted Prices in Active Markets for identical
AssetsLevel 1
Significant Other Observable Inputs
Level 2
Significant Unobservable InputsLevel 3 Total Fair Value 6/30
- - - - - -
-$ -$ -$ -$
- -
-$ -$ -$ -$ -$ -$
- - - -
-$ -$ -$ -$ 96,726,617.70$ 96,726,617.70$
-$
- Real estate investments -
- Total NAV Pending Sale Exception Investments -$ -$ -$ -$
Total investments by fair value level 96,726,617.70$ -$ -$ 96,726,617.70$ To
(B-1)(B-2) Domestic equity commingled funds(B-3)(B-4) Short-term investments(B-5)(B-6)(B-7)(B-8)(B-9) 10,308,171.31
(B-10)(B-11)
10,308,171.31$
- - -
-$ -$ -$ -$ -$ -$
Reported Amount 6/30
Certificates of depositDomestic stock
Real estate investmentsOther investments
-$ 107,034,789.01$
Description of valuation methods used to value investments in Level 1A-1:A-2:A-3:A-4:
*ONLY for those investments that are normally reported at NAV; however, cannot be reported at NAV due to a pending sale. See tab "Instructions- Sections A and B."
**Total Other Investments must agree to the amounts recorded in general ledger codes 145XX, 146XX, 147XX, 227XX, 245XX, 246XX and 247XX of the FLAIR trial balance.
Money market fundsRepurchase agreementsLife insurance contracts
Cash collateral on deposit with swap counter party
Total Investments not measured at fair valueTotal Other Investments**
(A-10) Other investments reported as receivables/liabilitiesTotal investments reported as receivables/liabilities
(A-11) Other Investments not measured at fair value:Commercial paper
(A-9) Investments sold shortU.S guaranteed obligationsFederal agenciesOption contracts
Total investments sold short
Private equity funds Private real asset fundsTotal investments measured at NAV
Investments reported as receivables/liabilities in Statement of Net Position:
Activist equity fundsHedge fundsPrivate debt/credit opportunities funds
International equity commingled funds
Real estate investments (directly owned)Real estate investments commingled funds
(A-8) Net Asset Value (NAV) Pending Sale Exception Investments*Private equity funds
Other investments
Investments measured at the Net Asset Value (NAV):Domestic bonds and notes commingled funds
Futures contractsSwap contracts (debt)Total investment derivative instruments
(A-6) Mutual Funds(A-7) Other investments
(A-4) Securities lending collateral investments(A-5) Investment derivative instruments:
Option contractsForward currency contracts
(A-2) Equity securities:Domestic stockInternational stockTotal equity securities
(A-3) Spot currency contracts
Domestic bonds and notesInternational bonds and notes
Total debt securities
*DO NOT include investments pooled with the State Treasurer (GL 141XX, 143XX, 224XX, 225XX & 241XX) nor those maintained with the State Board of Administration (GL 142XX & 226XX) on this form.
Fair Value Measurements Levels
(A-1) Debt securities:Certificates of deposit
Department of Financial Services ~ Statewide Financial StatementsDiscretely Presented Component Unit ~ Form CU2 ~ Other Investments
GL 145XX, 146XX, 147XX, 227XX, 245XX, 246XX, and 247XXJune 30, 2021
Instructions: Complete the following schedules by listing the applicable value for each type of investment owned as of current year ending 6/30. Prior to completing Schedule A and Schedule B, please see "Instructions-Schedules A and B" tab. PLEASE SUBMIT ONE FORM FOR EACH FUND. Section (A) is required for ALL Discretely Presented Component Units. Sections (B-G) are required ONLY for Major Discretely Presented Component Units.
Commercial paperU.S. guaranteed obligationsFederal agencies
69

A-5:A-6:A-7:A-9:
A-10:
A-1:A-2:A-3:A-4:A-5:A-6:A-7:A-9:
A-10:
Description of valuation methods used to value investments in Level 3A-1:A-2:A-3:A-4:A-5:A-6:A-7:A-9:
A-10:
(Section B)Investments measured at the NAV Unfunded Commitments
Redemption Frequency (If Currently Eligible) Redemption Notice Period
Fair Value 6/30
(B-1) - (B-2) - (B-3) - (B-4) Short-term investments - (B-5) - (B-6) - (B-7) - (B-8) 0
Diversifying strategies (CTAs)a
Equity long/shortsb
Event drivenc
Global macrod
Multi-strategye
Opportunistic debtf
Relative valueg
(B-9) 10,308,171.31 (B-10) - (B-11) -
10,308,171.31$ (A-8) Net Asset Value (NAV) Pending Sale Exception Investments*
- Real estate investments - Other investments - Total NAV Pending Sale Exception Investments -$
Description of NAV investments and significant investment strategies.B-1:B-2:B-3:B-4:B-5:B-6:B-7:B-8:
a)b)c)d)e)f)g)
B-9:B-10:B-11:A-8*
Custodial Credit Risk(Section C-1)
Investment Type Fair ValueHow are the investments held? (1, 2a, 2b)
*ONLY for those investments that are normally reported at NAV; however, cannot be reported at NAV due to a pending sale. See tab "Instructions- Sections A and B."
List amounts for: (1) Securities lending collateral that is reported in the statement of net position or (2) Underlying securities if the collateral for those loans is not reported in the statement of net position meeting the following criteria.(a) Are uninsured, are not registered in the name of the government, and are held by the counterparty, but not in the government's name .(b) Are uninsured, are not registered in the name of the government, and are held by the counterparty's trust department or agent, but not in the government's name.
Limited partnership deb/credit funds held by Valencia College Foundation. NAV is calculated on a monthly basis for these funds.
Hedge funds
Private debt/credit opportunities fundsPrivate equity funds Private real asset funds Total investments measured at NAV
Private equity funds
Domestic bonds and notes commingled fundsDomestic equity commingled fundsInternational equity commingled funds
Real estate investments (directly owned)Real estate investments commingled fundsActivist equity funds
Mutual funds publicly traded.
Description of valuation methods used to value investments in Level 2
70

Totals 0.00
(Section C-2)
Governing Policy:
Concentration of Credit Risk(Section D-1)
Totals
(Section D-2)
Governing Policy:
Credit Quality Ratings(Section E)
Debt Security Type Quality Rating Moody's Domestic Value International Value
Total Fair Value(Sum of Domestic and
International)
0.00
0.00
0.00
0.00
0.00
0.00
0.00
0.00
0.00
0.00
0.00
0.00
0.00
0.00Totals 0.00 0.00 0.00
Interest Rate Risk(Section F-1)
(a) Segmented Time Distribution
Investment Type Total Fair Value Less than or equal to 1 > 1 to 5 > 6 to 10 > 10
0.00
(b) Specific IdentificationInvestment Type Fair Value
Totals 0.00
(c) Weighted Average MaturityInvestment Type Fair Value Weighted Average Maturity
Investment maturities (in years)
Maturities
Disclose interest rate risk information for investments in mutual funds, external investment pools, or other pooled investments should be limited to investments in debt mutual funds, external debt
List credit quality ratings of external investment pools, money market funds, bond mutual funds, and other pooled investments of fixed-income securities. If the investment is unrated please disclose that fact.
Quality Rating S&P
0.00
Also, explain the governing policy related to concentration of credit risk for these investments. If there is no investment policy addressing a specific type of risk that the investments are exposed to, the disclosure should indicate that fact.
investments are: (1) issued or explicitly guaranteed by the U.S. government, or (2) invested in mutual funds, external investment pools, and other pooled investments.
Issuer Fair Value
Also, explain the governing policy related to custodial credit risk for these investments. If there is no investment policy addressing a specific type of risk thatthe investments are exposed to, the disclosure should indicate that fact.
List amounts for any investments if any one issuer (even if it's underlying for repurchase agreements) represents 5% or more of the total investments of this component unit unless
71

Totals 0.00
(d) DurationInvestment Type Fair Value
Totals 0.00
(Section F-2)
Governing Policy:
Foreign Currency Risk(Section G-1)
Investment Type Fair Value (in US$)
Totals 0.00
(Section G-2)
Governing Policy:
Also, explain the governing policy related to foreign risk for investments. If there is no investment policy addressing a specific type of risk that the investments are exposed to, thedisclosure should indicate that fact.
needs and anticipated cash flow requirements. As a means of managing its exposure to fair-value losses arising from
increasing interest rates, the college has established a target duration of its fixed income portfolio of 1 to 3 years.
Disclose investments exposed to foreign currency risk.Currency Type
Also, explain the governing policy related to interest rate risk for investments. If there is no investment policy addressing a specific type of risk that the investments are exposed to, the disclosure should indicate that fact.
The college's investment policy limits interest rate risk by attempting to match investment maturities with known cash
Modified Duration
72
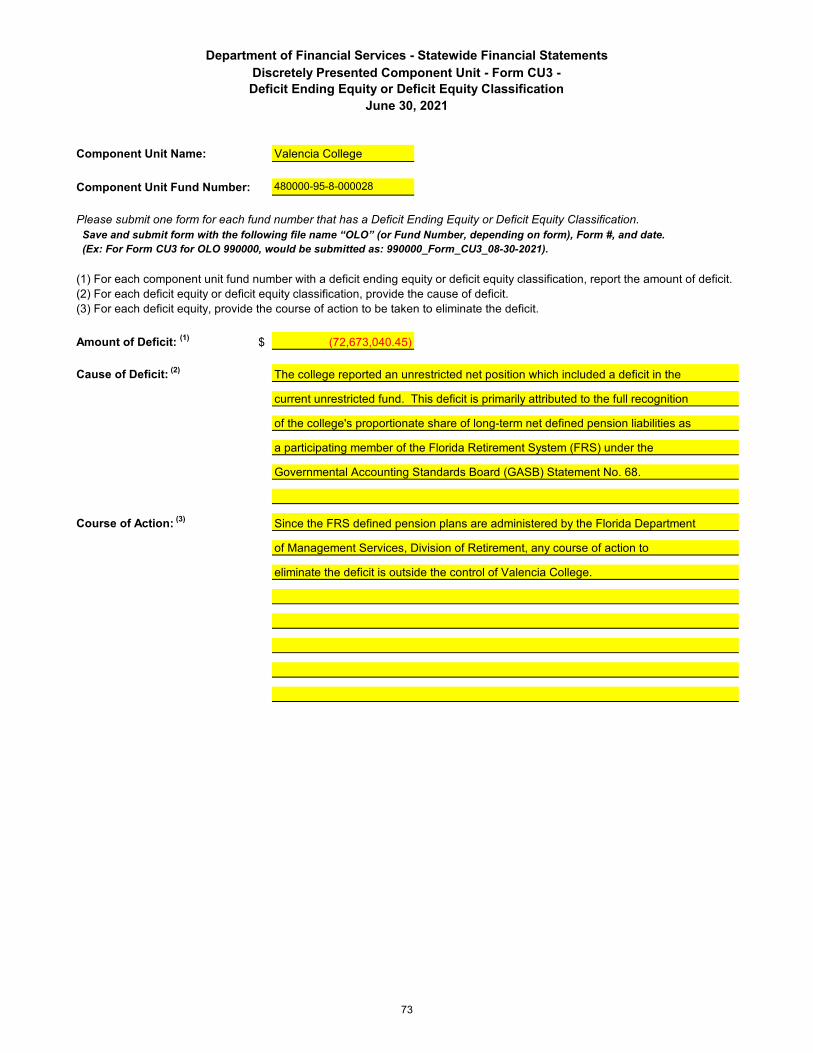
Component Unit Name: Valencia College
Component Unit Fund Number: 480000-95-8-000028
Please submit one form for each fund number that has a Deficit Ending Equity or Deficit Equity Classification. Save and submit form with the following file name “OLO” (or Fund Number, depending on form), Form #, and date. (Ex: For Form CU3 for OLO 990000, would be submitted as: 990000_Form_CU3_08-30-2021).
Amount of Deficit: (1) $ (72,673,040.45)
Cause of Deficit: (2)
Course of Action: (3) Since the FRS defined pension plans are administered by the Florida Department
of Management Services, Division of Retirement, any course of action to
eliminate the deficit is outside the control of Valencia College.
Department of Financial Services - Statewide Financial StatementsDiscretely Presented Component Unit - Form CU3 - Deficit Ending Equity or Deficit Equity Classification
June 30, 2021
(1) For each component unit fund number with a deficit ending equity or deficit equity classification, report the amount of deficit.(2) For each deficit equity or deficit equity classification, provide the cause of deficit.(3) For each deficit equity, provide the course of action to be taken to eliminate the deficit.
The college reported an unrestricted net position which included a deficit in the
current unrestricted fund. This deficit is primarily attributed to the full recognition
of the college's proportionate share of long-term net defined pension liabilities as
a participating member of the Florida Retirement System (FRS) under the
Governmental Accounting Standards Board (GASB) Statement No. 68.
73

Department of Financial Services - Statewide Financial StatementsDiscretely Presented Component Unit - Form CU5 - Prior Period Adjustments
GL 532XX June 30, 2021
Component Unit Name: VALENCIA COLLEGE
Component Unit Fund Number: 480000-95-8-000028
If the component unit does not have any Prior Period Adjustments at the end of the reporting fiscal year, click here N/A:
PLEASE SUBMIT ONE FORM FOR EACH FUND.
Balance per GL 0.00 Detail below must equal balance per GL
Description (Describe circumstances that caused the prior period adjustment) Amount
Total 0.00
74
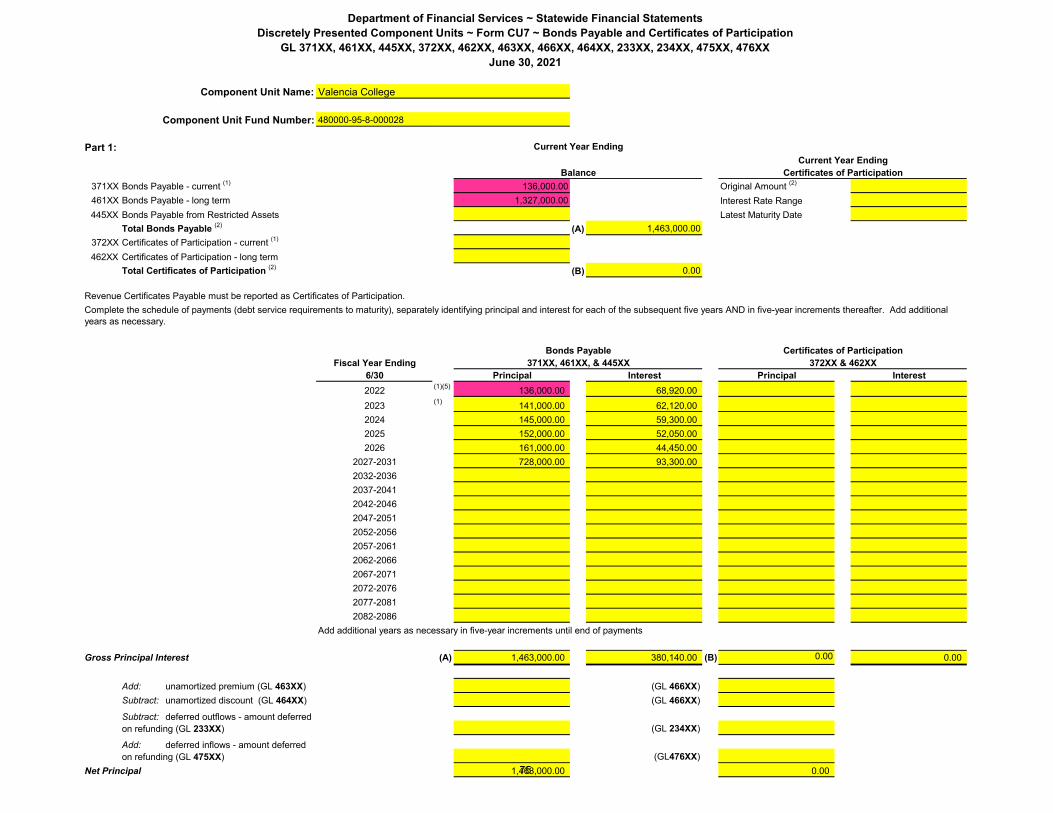
480000-95-8-000028
Part 1:
371XX Bonds Payable - current (1) 136,000.00 Original Amount (2)
461XX Bonds Payable - long term 1,327,000.00 Interest Rate Range445XX Bonds Payable from Restricted Assets Latest Maturity Date
Total Bonds Payable (2) (A) 1,463,000.00 372XX Certificates of Participation - current (1)
462XX Certificates of Participation - long termTotal Certificates of Participation (2) (B) 0.00
Fiscal Year Ending6/30 Principal Interest Principal Interest2022 (1)(5) 136,000.00 68,920.002023 (1) 141,000.00 62,120.002024 145,000.00 59,300.002025 152,000.00 52,050.002026 161,000.00 44,450.00
2027-2031 728,000.00 93,300.002032-20362037-20412042-20462047-20512052-20562057-20612062-20662067-20712072-20762077-20812082-2086
Add additional years as necessary in five-year increments until end of payments
Gross Principal Interest (A) 1,463,000.00 380,140.00 (B) 0.00 0.00
Add: unamortized premium (GL 463XX) (GL 466XX)Subtract: unamortized discount (GL 464XX) (GL 466XX)
(GL 234XX)
(GL476XX)1,463,000.00 0.00
Department of Financial Services ~ Statewide Financial StatementsDiscretely Presented Component Units ~ Form CU7 ~ Bonds Payable and Certificates of Participation
GL 371XX, 461XX, 445XX, 372XX, 462XX, 463XX, 466XX, 464XX, 233XX, 234XX, 475XX, 476XXJune 30, 2021
Component Unit Name: Valencia College
Subtract: deferred outflows - amount deferred on refunding (GL 233XX)
Component Unit Fund Number:
Current Year EndingCurrent Year Ending
Balance Certificates of Participation
Revenue Certificates Payable must be reported as Certificates of Participation.Complete the schedule of payments (debt service requirements to maturity), separately identifying principal and interest for each of the subsequent five years AND in five-year increments thereafter. Add additional years as necessary.
Bonds Payable Certificates of Participation371XX, 461XX, & 445XX 372XX & 462XX
Add: deferred inflows - amount deferred on refunding (GL 475XX)
Net Principal 75

Part 2 : Assets Pledged as Collateral for debt
Fund NumberPledged Assets
GLC and DescriptionTotal Value of
Pledged AssetsDebt Agreement Pledged
ForTotal Value of
Debt Agreement
Part 3 : Terms of Debt Agreements
Debt Agreement
Type Debt Agreement
Description
Financial Related Consequence for
Default Event Description
Estimate of Financial Consequence
for Default EventAdditional
Notes
Part 4 : Principal And Interest Schedule for Direct Borrowings and Direct Placements
Fiscal Year Ending6/30 Principal Interest Principal Interest20222023202420252026
2027-20312032-20362037-20412042-20462047-20512052-20562057-20612062-20662067-20712072-20762077-20812082-2086
Total 0.00 0.00 0.00 0.00
(2) Must equal Gross Principal and Interest (A & B)(3) Original amount needs to be in aggregate terms.(4) List the GL Codes used for principal and interest recording for direct borrowings and direct placements agreements in the spaces provided.
Direct Borrowings (4)(5) Direct Placements (4)(5)
Add additional years as necessary in five-year increments until end of payments
(1) Amount shown in the first year must equal GL 371XX (for bonds) or GL 372XX (for COPs).
76

Component Unit Name: Component Unit Fund Number: 000028
Part 1:
385XX Installment purchase contract - current (1)
485XX Installment purchase contract - long term0.00 0.00 (A)
387XX Capital leases liability - current (1) 395,261.00 472,926.2414,442,947.00 14,613,061.13
14,838,208.00 15,085,987.37 (B)
Fiscal Year Ending6/30 Principal Interest Principal Interest2022 (1) 472,926.24 483,875.17 2023 448,458.53 508,342.88 2024 433,599.48 508,640.23 2025 429,193.46 518,104.00 2026 428,337.27 524,219.58
2027-2031 1,389,037.69 2,756,392.51 2032-2036 1,316,718.07 3,034,962.13 2037-2041 1,261,218.75 3,296,711.45 2042-2046 1,233,105.40 3,531,074.80 2047-2051 1,244,213.74 3,726,216.46 2052-2056 1,309,074.94 3,867,605.26 2057-2061 1,215,776.48 2,982,362.00 2062-2066 1,120,419.47 1,161,885.53 2067-2071 1,563,225.91 719,079.09 2072-2076 1,220,681.97 148,700.03 2077-20812082-2086
Total (2) 0.00 (A) 0.00 (B) 15,085,987.40 27,768,171.12% %% %% %
0 % 0 %
Rental of buildingsRental of furniture and equipmentTotal percentage (must equal 100%)
Rental of land
Audited Balance 6/30 6/30 Closing Balance
Total installment purchase contracts
487XX Capital leases liability - long termTotal capital leases liability
Complete the schedule of payments (debt service requirements to maturity), separately identifying principal and interest for each of the subsequent five years AND in five-year increments thereafter. Add additional years as necessary.
Installment Purchase Contracts Capital Leases Liability385XX & 485XX (3) 387XX & 487XX
Add additional years as necessary in five-year increments until end of payments
Prior Year Current Year Ending
Department of Financial Services ~ Statewide Financial StatementsDiscretely Presented Component Unit ~ Form CU8 ~Installment Purchase Contracts and Capital Leases Liability
GL 385XX, 485XX, 387XX, & 487XXJune 30, 2021
Valencia College
77

Department of Financial Services ~ Statewide Financial StatementsDiscretely Presented Component Unit ~ Form CU8 ~Installment Purchase Contracts and Capital Leases Liability
GL 385XX, 485XX, 387XX, & 487XXJune 30, 2021
Part 2 : Assets Pledged as Collateral for debt
Fund Number
Pledged Assets GLC and
DescriptionTotal Value of
Pledged AssetsDebt Agreement
Pledged ForTotal Value of
Debt Agreement
Part 3 : Terms of Debt Agreements
Debt Agreement
Type Debt Agreement
Description
Financial Related Consequence for
Default Event Description
Estimate of Financial
Consequence for Default Event
Additional Notes
Part 4 : Principal And Interest Schedule for Direct Borrowings and Direct Placements
Fiscal Year Ending6/30 Principal Interest Principal Interest20222023202420252026
2027-20312032-20362037-20412042-20462047-20512052-20562057-20612062-20662067-20712072-20762077-20812082-2086
Total 0.00 0.00 0.00 0.00
(1) Amount shown in the first year MUST equal GLs 385XX and 387XX.(2) Total principal MUST equal corresponding totals (A & B) in the upper portion of the form.
Add additional years as necessary in five-year increments until end of payments
(3) All Consolidated Equipment Financing Program (CEFP) and Energy Savings Contract deferred payments MUST be included within this section of theform.
(4) List the GL Codes used for principal and interest recording for direct borrowings and direct placements agreements in the spaces provided.
Direct Borrowings (4) Direct Placements (4)
78
Department of Financial ServicesStatewide Financial Statements
Form CU9 - Lines of CreditJune 30, 2021
THIS IS A REQUIRED FORM AND MUST BE COMPLETED AND RETURNEDBY EVERY DISCRETELY PRESENTED COMPONENT UNIT EVEN IF IT IS NOT APPLICABLE
Agency OLO: 480000-95-8-000028
Part 1 : Lines of Credit
Lines of Credit Description
Total Credit Line under Agreement
Unused Line of Credit
Additional Notes
If the component unit does not have any Line of Credit at the end of the reporting fiscal year, click here N/A: N/A
79

Part 1:
399XX Other Current Liabilities499XX Other Long-Term Liabilities
Total Other Liabilities (A) 0.00
Fiscal Year Ending6/30 Principal Interest2022 (1)(5)
2023 (1)
202420252026
2027-20312032-20362037-20412042-20462047-20512052-20562057-20612062-20662067-20712072-20762077-20812082-2086
(A) 0.00 0.00
Part 2 : Assets Pledged as Collateral for debt
Fund NumberPledged Assets
GLC and DescriptionTotal Value of
Pledged AssetsDebt Agreement
Pledged ForTotal Value of
Debt Agreement
Part 3 : Terms of Debt Agreements
Debt Agreement
Type Debt Agreement Description (3)
Financial Related Consequence for
Default Event Description
Estimate of Financial Consequence
for Default EventAdditional
Notes
Part 4 : Principal And Interest Schedule for Direct Borrowings and Direct Placements
Fiscal Year Ending 399XX/499XX 399XX/499XX 399XX/499XX 399XX/499XX6/30 Principal Interest Principal Interest20222023202420252026
2027-20312032-20362037-20412042-20462047-20512052-20562057-20612062-20662067-20712072-20762077-20812082-2086
Total 0.00 0.00 0.00 0.00
(1) Amount shown in the first year must equal GL 399XX(2) Must equal Gross Principal and Interest (A)(3) Original amount needs to be in aggregate terms.
(5) If the component unit's current fiscal year end is prior to the current year ending 6/30, the first future payment must be recorded on the first line above. If thecomponent unit's current fiscal year end is 6/30, the first line above must be blank.
Other Liabilities
Department of Financial Services ~ Statewide Financial StatementsDiscretely Presented Component Units ~ Form CU10 ~ Other Liabilities
GL 399XX, 499XXJune 30, 2021
Component Unit Name: Valencia College
Component Unit Fund Number: 480000-95-8-000028
Current Year EndingBalance
Complete the schedule of payments (debt service requirements to maturity), separately identifying principal and interest for each of the subsequent five years AND in five-year increments thereafter. Add additional years as necessary.
(4) List the GL Codes used for principal and interest recording for direct borrowings and direct placements agreements in the spaces provided.
399XX, 499XX
Add additional years as necessary in five-year increments until end of payments
Total (2)
Direct Borrowings (4)(5) Direct Placements (4)(5)
Add additional years as necessary in five-year increments until end of
80

Component Unit Name:
Component Unit Fund Number:
Estimated Liability Amount
FY 2020-2021 Expenditure Short-term Liability Amount
Estimated Recoveries
Amount
Obligating Event (See bottom of
worksheet) Short Name of LiabilityN/A
Obligating Event- (Letter should correspond to Column E on the form above)a. The government is compelled to take pollution remediation action because of an imminent endangerment to the public or environment.b. The government is in violation of a pollution prevention-related permit or license.c.
d. The government is named, or evidence indicates that it will be named, in a lawsuit to compel participation in pollution remediation.e. The government commences, or legally obligates itself to commence, cleanup activities or monitoring or operation and maintenance of the remediation effort.
The government is named, or evidence indicates that it will be named, by a regulator as a responsible party or potentially responsible party for remediation, or as a government responsible for sharing costs.
Department of Financial Services ~ Statewide Financial StatementsDiscretely Presented Component Unit - Form CU11 - Pollution Remediation Obligating Events
June 30, 2021
Valencia College
480000-95-8-000028
Instructions: Please complete this form for each fund with Pollution Remediation Obligating Events in Accordance with GASB 49. Please complete the tab named Attachment. For Obligating Event, please choose the Letter in the legend at the bottom of the worksheet which corresponds with the corresponding Obligating Event.
Save and submit form with the following file name Fund Number, Form #, and date. (Ex: For Form CU11 for FUND 990000-10-1-999999, would be submitted as: 99-10-1-999999_Form_CU11_08-30-2021).
81
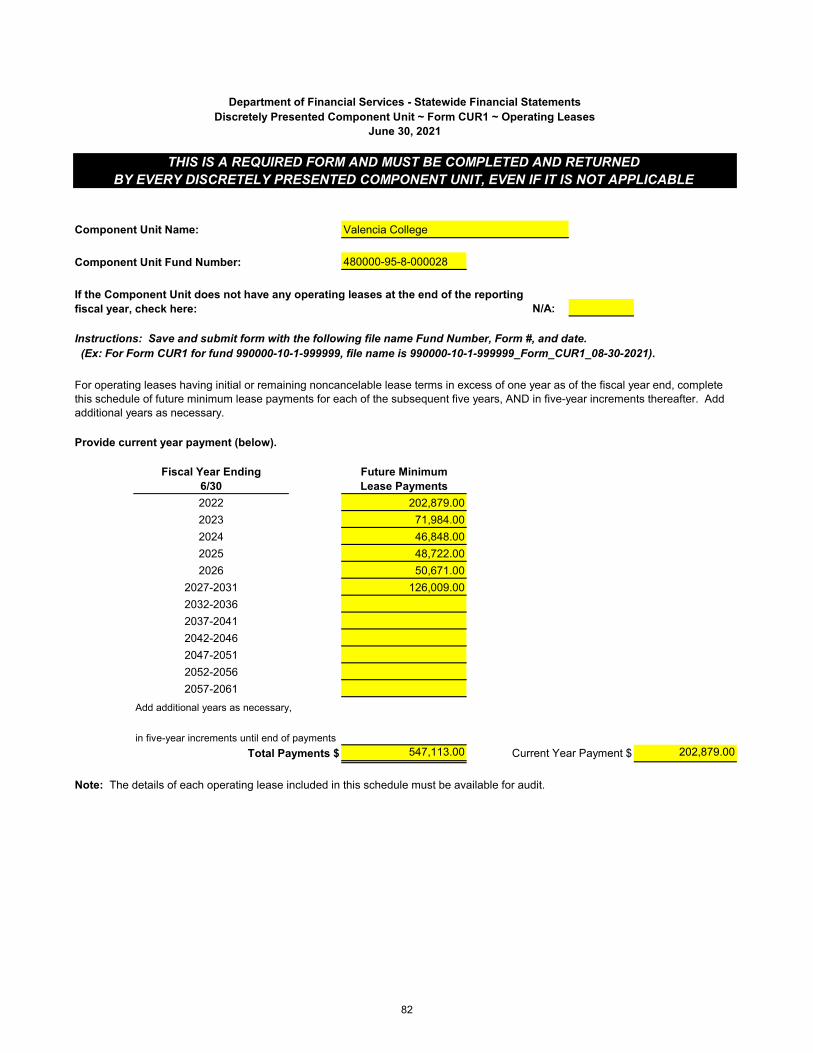
480000-95-8-000028
N/A:
Instructions: Save and submit form with the following file name Fund Number, Form #, and date. (Ex: For Form CUR1 for fund 990000-10-1-999999, file name is 990000-10-1-999999_Form_CUR1_08-30-2021).
Fiscal Year Ending Future Minimum6/30 Lease Payments2022 202,879.00 2023 71,984.00 2024 46,848.00 2025 48,722.00 2026 50,671.00
2027-2031 126,009.00 2032-20362037-20412042-20462047-20512052-20562057-2061
547,113.00 202,879.00 Total Payments $ Current Year Payment $
Note: The details of each operating lease included in this schedule must be available for audit.
Component Unit Fund Number:
If the Component Unit does not have any operating leases at the end of the reporting fiscal year, check here:
For operating leases having initial or remaining noncancelable lease terms in excess of one year as of the fiscal year end, complete this schedule of future minimum lease payments for each of the subsequent five years, AND in five-year increments thereafter. Add additional years as necessary.
Provide current year payment (below).
Add additional years as necessary,
in five-year increments until end of payments
Component Unit Name: Valencia College
Department of Financial Services - Statewide Financial StatementsDiscretely Presented Component Unit ~ Form CUR1 ~ Operating Leases
June 30, 2021
THIS IS A REQUIRED FORM AND MUST BE COMPLETED AND RETURNEDBY EVERY DISCRETELY PRESENTED COMPONENT UNIT, EVEN IF IT IS NOT APPLICABLE
82

Discretely Presented Component Unit Form - CUR2 - Construction and Other Significant Commitments
Save and submit form with the following file name Fund Number, Form #, and date. (Ex: For Form CUR2 for FUND 990000-10-1-999999, would be submitted as: 99-10-1-999999_Form_CUR2_08-30-2021).
Component Unit Name:
Component Unit Fund Number: 480000-95-8-000028
Estimated AmountTotal Estimated Cost Amount Expended Committed
Per at 6/30 (a) Through 6/30 (b) at 6/30 (c)
Agency 2,705,390.00 1,173,312.00 1,532,078.00
Title of Commitment/ Description of Goods/ Amount Expended Estimated AmountContract Services to be Received Through 6/30 Committed at 6/30
N/A
(4) Complete the following:
8/13/21
Signature, Agency Contact Date
(407) 582-3302Printed Name, Agency Contact Phone Number
Position Title
Jacqueline Lasch
Assistant Vice President, Financial Services
(1) Record the Component Unit's total construction commitments below. Prepare a schedule by project and maintain it in your files for theauditors to review if necessary. Do not attach a list of projects. Estimates are permitted.
a. Total estimated cost = The total estimated cost of the projects when completed. This is not necessarily a budgeted amount, butmore likely a contract amount.
b. Amount expended = The cost of the projects accumulated through fiscal year end. This should be the total amount recorded inGL 278XX (Construction Work In Progress).
c. Estimated amount committed = Total estimated cost (a) less amount expended (b). This amount is reported in the Commitmentsand Operating Leases Note in the Comprehensive Annual Financial Report for current year ending 6/30.
(2) Record other significant commitments with parties external to the state (i.e., component units are not considered external to the state) to receive goods or services. To be significant, the total commitment must be 10% or more of the total current expenditures/expenses reported for financial statements by the component unit as a whole. An example of another commitment would be a long-term service contract with a private vendor. Attach additional pages as necessary.
Department of Financial Services - Statewide Financial Statements
GL 278XXJune 30, 2021
(3) If the agency does not have any construction or other significant commitments at the end of the reporting fiscal year, check here:
Jacqueline Lasch
THIS IS A REQUIRED FORM AND MUST BE COMPLETED AND RETURNED
Valencia College
BY EVERY AGENCY EVEN IF IT IS NOT APPLICABLE.
83
Save and submit form with the following file name Fund Number, Form #, and date. (Ex: For Form CUR3 for FUND 990000-10-1-999999, would be submitted as: 99-10-1-999999_Form_CUR3_08-30-2021).
Component Unit Name: Valencia College
Component Unit Fund Number: 480000-95-8-000028
N/A: N/A
Definitions:
Note: Consideration of component unit relationship to the primary government should be given whendetermining potential related party transactions.
Related Party Indicators/Examples -
Detail all identified transactions between the Component Unit and related parties below:
Nature of the relationship Amount
Services or goods purchased/provided at little or no cost.
Department of Financial Services ~ Statewide Financial StatementsDiscretely Presented Component Unit ~ Form CUR3 ~ Related Party Transactions
June 30, 2021
THIS IS A REQUIRED FORM AND MUST BE COMPLETED AND RETURNEDBY EVERY DISCRETELY PRESENTED COMPONENT UNIT EVEN IF IT IS NOT APPLICABLE
If the component unit does not have any related party transactions to be disclosed, check here:
Instructions: In accordance with generally accepted accounting principles that require disclosure of certain related party transactions, please record all transactions that an informed observer might reasonably believe reflect considerations other than self-interest based upon the relationship that exists between the parties of the transactions.
Related Parties - includes members of the governing board, administrative boards or commissions administrative officials and their immediate families (i.e. spouse, parents, children, siblings, mothers, and fathers-in-law, sons and daughters-in-law, and brothers and sisters-in law), and affiliated or related organizations that are not included as part of the financial reporting entity. Key management personnel and other individuals who exercise control or significant influence over the agency should be considered.
Borrowing or lending on an interest-free basis or at a rate significantly different from current market rates; no scheduled repayment terms on debt; or loans to parties that do not have the ability to pay.Selling property at a price that differs significantly from appraisal value.Use of property and equipment by lease or other agreement.
Description
84

CERTIFICATION OF FINANCIALSAS REPORTED ON THE ANNUAL FINANCIAL REPORT
FISCAL YEAR 2020-21
College: VALENCIA COLLEGE
Reserve for Performance Based Incentive Funds -$ Reserved for Academic Improvement Trust Funds -$ Reserved for Other Required Purposes -$ Reserved for Staff & Program Development -$ Reserved for Student Activities Funds -$ Reserved for Matching Grants -$ Fund Balance - Board Designated 400,000.00$ Fund Balance - College 27,684,867.07$ Total Unallocated Fund Balances 28,084,867.07$
Total Funds Available 242,655,076.54$ Unallocated Fund Balance as % of Total Funds Available 11.5740%
CERTIFIED ASAPPROVED BYCFO: APPROVAL DATE:
Chief Financial Officer
Section 11.45(2), Florida Statutes, the Auditor General shall: (c) Annually conduct financial audits of all state universities and Florida College System institutions and verifythe accuracy of the amounts certified by each state university and Florida College System institution chief financial officer pursuant to ss. 1011.45 and 1011.84.
below 5 percent for a Florida College System institution with a final FTE less than 15,000 for the prior year, or below 7 percent for a Florida College System institution with a final
FTE of 15,000 or greater for the prior year, the president shall provide written notification to the State Board of Education. By September 30 of each year, the chief financial
officer of each Florida College System institution shall certify the unexpended amount of state funds remaining in the general fund of an institution as of June 30 of the previous fiscal year.
Please complete and return this form to [email protected] by 9/30/2021.Please note a hard copy is not required to be submitted to the Florida College Budget Office.
85
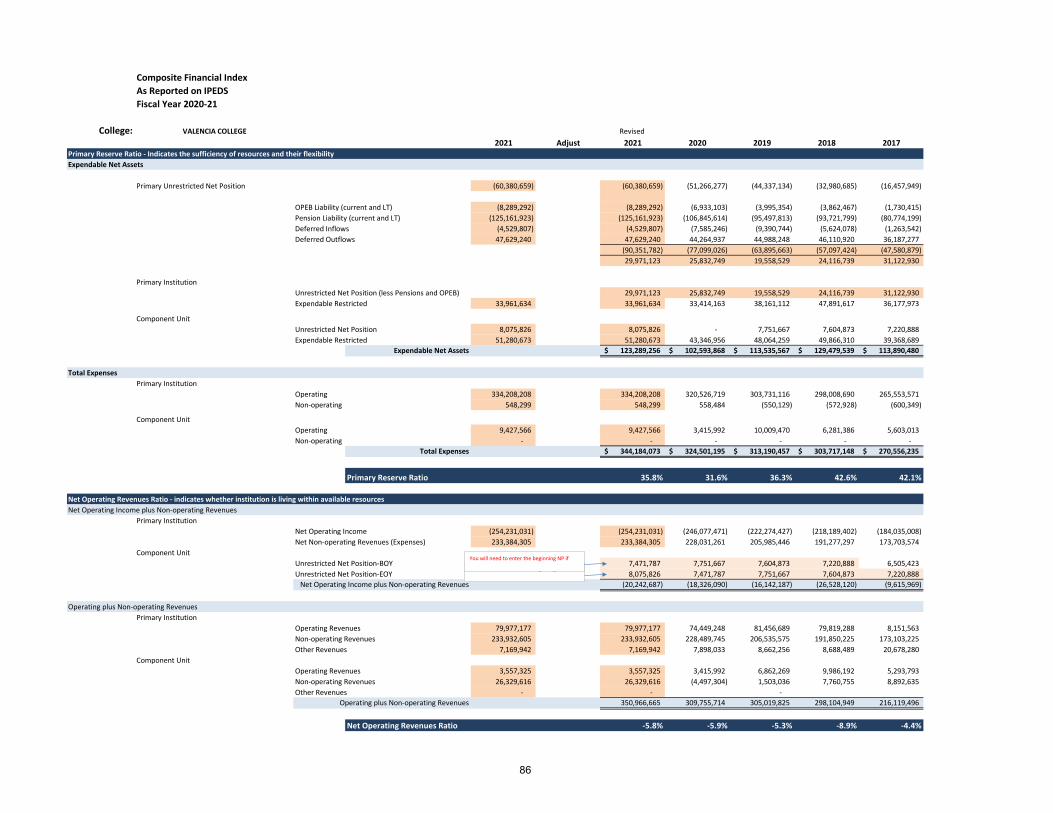
Composite Financial IndexAs Reported on IPEDSFiscal Year 2020-21
College: VALENCIA COLLEGE Revised 2021 Adjust 2021 2020 2019 2018 2017
Primary Reserve Ratio - Indicates the sufficiency of resources and their flexibilityExpendable Net Assets
Primary Unrestricted Net Position (60,380,659) (60,380,659) (51,266,277) (44,337,134) (32,980,685) (16,457,949)
OPEB Liability (current and LT) (8,289,292) (8,289,292) (6,933,103) (3,995,354) (3,862,467) (1,730,415) Pension Liability (current and LT) (125,161,923) (125,161,923) (106,845,614) (95,497,813) (93,721,799) (80,774,199) Deferred Inflows (4,529,807) (4,529,807) (7,585,246) (9,390,744) (5,624,078) (1,263,542) Deferred Outflows 47,629,240 47,629,240 44,264,937 44,988,248 46,110,920 36,187,277
(90,351,782) (77,099,026) (63,895,663) (57,097,424) (47,580,879) 29,971,123 25,832,749 19,558,529 24,116,739 31,122,930
Primary InstitutionUnrestricted Net Position (less Pensions and OPEB) 29,971,123 25,832,749 19,558,529 24,116,739 31,122,930 Expendable Restricted 33,961,634 33,961,634 33,414,163 38,161,112 47,891,617 36,177,973
Component UnitUnrestricted Net Position 8,075,826 8,075,826 - 7,751,667 7,604,873 7,220,888 Expendable Restricted 51,280,673 51,280,673 43,346,956 48,064,259 49,866,310 39,368,689
Expendable Net Assets 123,289,256$ 102,593,868$ 113,535,567$ 129,479,539$ 113,890,480$
Total ExpensesPrimary Institution
Operating 334,208,208 334,208,208 320,526,719 303,731,116 298,008,690 265,553,571 Non-operating 548,299 548,299 558,484 (550,129) (572,928) (600,349)
Component UnitOperating 9,427,566 9,427,566 3,415,992 10,009,470 6,281,386 5,603,013 Non-operating - - - - - -
Total Expenses 344,184,073$ 324,501,195$ 313,190,457$ 303,717,148$ 270,556,235$
Primary Reserve Ratio 35.8% 31.6% 36.3% 42.6% 42.1%
Net Operating Revenues Ratio - indicates whether institution is living within available resourcesNet Operating Income plus Non-operating Revenues
Primary InstitutionNet Operating Income (254,231,031) (254,231,031) (246,077,471) (222,274,427) (218,189,402) (184,035,008) Net Non-operating Revenues (Expenses) 233,384,305 233,384,305 228,031,261 205,985,446 191,277,297 173,703,574
Component UnitUnrestricted Net Position-BOY 7,471,787 7,751,667 7,604,873 7,220,888 6,505,423 Unrestricted Net Position-EOY 8,075,826 7,471,787 7,751,667 7,604,873 7,220,888
Net Operating Income plus Non-operating Revenues (20,242,687) (18,326,090) (16,142,187) (26,528,120) (9,615,969)
Operating plus Non-operating RevenuesPrimary Institution
Operating Revenues 79,977,177 79,977,177 74,449,248 81,456,689 79,819,288 8,151,563 Non-operating Revenues 233,932,605 233,932,605 228,489,745 206,535,575 191,850,225 173,103,225 Other Revenues 7,169,942 7,169,942 7,898,033 8,662,256 8,688,489 20,678,280
Component UnitOperating Revenues 3,557,325 3,557,325 3,415,992 6,862,269 9,986,192 5,293,793 Non-operating Revenues 26,329,616 26,329,616 (4,497,304) 1,503,036 7,760,755 8,892,635 Other Revenues - - -
Operating plus Non-operating Revenues 350,966,665 309,755,714 305,019,825 298,104,949 216,119,496
Net Operating Revenues Ratio -5.8% -5.9% -5.3% -8.9% -4.4%
You will need to enter the beginning NP if
You will need to enter the beginning NP if
86

Composite Financial IndexAs Reported on IPEDSFiscal Year 2020-21
College: VALENCIA COLLEGE Revised
2021 Adjust 2021 2020 2019 2018 2017Return on Net Position Ratio - indicates whether the institution is better off financially this year than lastChange in Net Position
Primary Institution (13,676,784.00) (13,676,784) (10,148,177.00) (7,626,725.00) (18,223,616.00) 9,746,497.00 Component Unit 20,459,375.00 20,459,375 (12,231,401.00) (1,644,165.00) 11,465,561.00 8,583,415.00
Change in Net Position 6,782,591.00 (22,379,578.00) (9,270,890.00) (6,758,055.00) 18,329,912.00
Total Net Position-Beginning of YearPrimary Institution 247,726,110.00 247,726,110 257,874,285.00 265,501,010.00 283,745,327.00 276,058,506.00 Component Unit 86,567,956.00 86,567,956 98,799,357.00 100,443,522.00 88,977,963.00 80,394,551.00
Total Net Assets 334,294,066.00 356,673,642.00 365,944,532.00 372,723,290.00 356,453,057.00
Return on Net Assets 2.0% -6.3% -2.5% -1.8% 5.1%
Viability Ratio - Indicates the capacity to repay total debt through reservesExpendable Net Assets 123,289,256$ 102,593,868$ 113,535,567$ 129,479,539$ 113,890,480$
Long Term Debt (related to plant)Primary Institution 15,940,062 15,940,062 15,905,947 8,604,064 8,659,483 9,511,036 Component Unit - -
Total Long Term Debt 15,940,062 15,905,947 8,604,064 8,659,483 9,511,036
Viability Ratio 7.73 6.45 13.20 14.95 11.97
Summary of Ratios: AveragePrimary Reserve Ratio 35.8% 31.6% 36.3% 42.6% 42.1% 37.7%Net Operating Revenue -5.8% -5.9% -5.3% -8.9% -4.4% -6.1%Return on Net Assets Ratio 2.0% -6.3% -2.5% -1.8% 5.1% -0.7%Viability Ratio 7.73 6.45 13.20 14.95 11.97 10.86
Conversion Factors Strength Factors Average0.133 2.693 2.377 2.726 3.205 3.165 2.83 0.013 (4.000) (4.000) (4.000) (4.000) (3.423) (3.88) 0.020 1.014 (3.137) (1.267) (0.907) 2.571 (0.34) 0.417 10.000 10.000 10.000 10.000 10.000 10.00
Institutions with debt Institutions with little debt Weighting Factors
0.35 0.55 1.48 1.31 1.50 1.76 1.74 0.10 0.15 (0.60) (0.60) (0.60) (0.60) (0.51) 0.20 0.30 0.30 (0.94) (0.38) (0.27) 0.77 0.35 0.00 - - - - -
Composite Financial Index (CFI) 1.19 (0.23) 0.52 0.89 2.00
Choose which set of weights to use. Change formulas to the right to reference column C
Choose which set of weights to use. Change formulas to the right to reference column C
87

Composite Financial IndexAs Reported on IPEDSFiscal Year 2020-21
College: VALENCIA COLLEGE Revised
Financial Ratios Data Strength Weight CFI
Primary Reserve Ratio Calculation:Institution unrestricted net assets + 29,971,123 Institution expendable restricted net assets + 33,961,634 C.U. unrestricted net assets + 8,075,826 C.U. temporary restricted net assets + 51,280,673 C.U. net investment in plant -Numerator Total 123,289,255.9 Institution operating expenses + 334,208,208 Institution non-operating expenses + 548,299 C.U. total expenses + 9,427,566 Denominator Total 344,184,073 Primary Reserve Ratio = ÷ 0.358Primary Reserve Ratio CFI Calculation: 2.693 0.55 1.48
Net Operating Revenue Ratio Calculation:Institution operating income (loss) + (254,231,031)Institution net non-operating revenues + 233,384,305C.U. change in unrestricted net assets + 604,039 Numerator Total (20,242,687) Institution operating revenues + 79,977,177 Institution non-operating revenues + 241,102,547 C.U. total unrestricted revenues + 29,886,941Denominator Total 350,966,664.6 Net Operating Revenue Ratio = ÷ -0.058Net Operating Revenue Ratio CFI Calculation: -4.000 0.15 -0.60
Return on Net Assets Ratio Calculation: Change in net assets + C.U. change in net assets 6,782,591.00 Numerator Total 6782591 Total net assets + C.U. total net assets (beginning of year) 334,294,066Denominator Total 334,294,066 Return on Net Assets Ratio = ÷ 0.020Return on Net Assets Ratio CFI Calculation: 1.014 0.30 0.30
Viability Ratio Calculation: Expendable net assets 123,289,255.9Numerator Total 123,289,255.9 Institution long-term debt (total project related debt) + 15,940,062 C.U. long-term debt (total project related debt) + 0.0Denominator Total = 15,940,062.3Viability Ratio = ÷ 7.735Viability Ratio CFI Calculation: 10.000 0.00 0.00
COMPOSITE FINANCIAL INDICATOR SCORE (CFI) 1.19
88

THE COMPOSITE FINANCIAL INDEX
The Composite Financial Index (CFI) score giving you a quick look at the overall financial health at a single point in time. It will help you answer the question “Is it time to invest in new initiatives to support your mission or should you retrench to improve your institution’s financial health?”
The CFI combines four key financial ratios into one metric, using a four-step methodology. 1. Calculate the values of the four ratios2. Convert the computed values to strength factors along a common scale3. Multiply strength factors by specific weighting factors4. Total the four weighted values to compute a single CFI score
The idea is that by blending strength factors through a weighting process, strengths represented by one ratio may offset weaknesses in another. As such, the composite seeks to provide a holistic measure of financial health.
The CFI RATIOS AND THEIR MEANING
Each of the four core ratios addresses a key dimension related to the mission of colleges and universities.
The primary reserve ratio is designed to assess if resources are sufficient and flexible for the operating size of an institution. It is one factor to determine if you have enough flexible resources to support your mission. A ratio of .40x (provides about 5 months of expenses) or more is recommended to have the financial flexibility needed to manage the institution.
The net operating revenues ratio gages if an institution is operating within its means. Ideally, to optimize financial health, annual results should contribute to and not subtract from resources. A target of at least 2% - 4% is a goal over an extended period.
The return on net assets ratio measures total economic return and is useful for analyzing year over year trends. It evaluates whether financial performance supports institutional objectives. Essentially, institutions must generate a return on net assets that leads to capital reinvestment and financial sustainability. The goal is a 3% - 4% return over the long term.
The viability ratio measures if debt resources are strategically managed. The ratio evaluates the extent to which the financial burden of debt outweighs its strategic usefulness. It measures the ability of available assets to cover debt. A ratio between 1.25X and 2.00X indicates there are sufficient resources to cover current obligations.
89

SCHEDULE OF EXPENDITURES OF FEDERAL AWARDS (SEFA)
SEFA Data
SEFA Loans
SEFA Reconciliation Template
SEFA Checklist

1. OLO 2. FEIN 3. DUNS Number 4. Assistance
Listings # 5. ARRA 6. COVID-19 7. ARP
8. FederalAwardingAgency 9. Assistance Listings Title
050700 591216316 058251372 84.425F N Y N U. S. Department of Education HEERF Institutional Portion050700 591216316 058251372 84.425L N Y N U. S. Department of Education HEERF Minority Serving Institutions (MSIs)050700 591216316 058251372 84.031 N N N U. S. Department of Education Higher Education Institutional Aid050700 591216316 058251372 84.031 N N N U. S. Department of Education Higher Education Institutional Aid050700 591216316 058251372 84.033 N N N U. S. Department of Education Federal Work-Study Program050700 591216316 058251372 17.274 N N N U. S. Department of Labor YouthBuild050700 591216316 058251372 47.076 N N N National Science Foundation Education and Human Resources050700 591216316 058251372 47.076 N N N National Science Foundation Education and Human Resources050700 591216316 058251372 47.076 N N N National Science Foundation Education and Human Resources050700 591216316 058251372 47.076 N N N National Science Foundation Education and Human Resources050700 591216316 058251372 84.367 N N N U. S. Department of Education Supporting Effective Instruction State Grants (formerly Improving Teacher Quality 050700 591216316 058251372 47.076 N N N National Science Foundation Education and Human Resources050700 591216316 058251372 19.009 N N N U. S. Department of State Academic Exchange Programs - Undergraduate Programs050700 591216316 058251372 93.243 N N N U. S. Department of Health and Human Services Substance Abuse and Mental Health Services Projects of Regional and National S050700 591216316 058251372 93.243 N N N U. S. Department of Health and Human Services Substance Abuse and Mental Health Services Projects of Regional and National S050700 591216316 058251372 64.028 N N N U. S. Department of Veterans Affairs Post-9/11 Veterans Educational Assistance050700 591216316 058251372 19.009 N N N U. S. Department of State Academic Exchange Programs - Undergraduate Programs050700 591216316 058251372 21.019 N Y N U. S. Department of the Treasury Coronavirus Relief Fund050700 591216316 058251372 84.367 N N N U. S. Department of Education Supporting Effective Instruction State Grants (formerly Improving Teacher Quality 050700 591216316 058251372 84.048 N N N U. S. Department of Education Career and Technical Education -- Basic Grants to States050700 591216316 058251372 84.048 N N N U. S. Department of Education Career and Technical Education -- Basic Grants to States050700 591216316 058251372 84.002 N N N U. S. Department of Education Adult Education - Basic Grants to States050700 591216316 058251372 45.162 N N N National Foundation on the Arts and the Humanities Promotion of the Humanities Teaching and Learning Resources and Curriculum De050700 591216316 058251372 84.007 N N N U. S. Department of Education Federal Supplemental Educational Opportunity Grants050700 591216316 058251372 84.007 N N N U. S. Department of Education Federal Supplemental Educational Opportunity Grants050700 591216316 058251372 84.063 N N N U. S. Department of Education Federal Pell Grant Program050700 591216316 058251372 84.063 N N N U. S. Department of Education Federal Pell Grant Program050700 591216316 058251372 84.425E N Y N U. S. Department of Education Higher Education Emergency Relief Fund (HEERF) Student Aid Portion050700 591216316 058251372 84.268 N N N U. S. Department of Education Federal Direct Student Loans050700 591216316 058251372 84.268 N N N U. S. Department of Education Federal Direct Student Loans050700 591216316 058251372 84.425C N Y N U. S. Department of Education Governor’s Emergency Education Relief (GEER) Fund050700 591216316 058251372 45.310 N Y N National Foundation on the Arts and the Humanities Grants to States050700 591216316 058251372 14.228 N N N U. S. Department of Housing and Urban Development Community Development Block Grants/State's program and Non-Entitlement Gran
90

4. Assistance Listings #84.425F84.425L84.03184.03184.03317.27447.07647.07647.07647.07684.36747.07619.00993.24393.24364.02819.00921.01984.36784.04884.04884.00245.16284.00784.00784.06384.063
84.425E84.26884.268
84.425C45.31014.228
10. Research & Development
11. Loans & Loans Guaranteed
12. Source of Funding (D, I, or T)
13. If Source of Funding (Column 10) is Indirect (I) or a Transfer (T), you must provide the Pass-Through Grantor or State of Florida Entity Name
14. Award Number (Required for Indirect Grants, CFDA No. XX.UNK, and R&D, ARRA, ARP and COVID-19 awards)
15. Total Expenditures (round to 0)
16. Subgranted to State of Florida Entities (round to 0)
17. Subgranted to Non-State of Florida Entities (round to 0) 18. Agency Identifier
N N D P425F202998 10,731,871 23004N N D P425L200310 1,811,022 23005N N D P031S150017 204,582 23010N N D P031S150020 99,312 23011N N D P033A200945 1,196,250 23031N N D YB-32964-18-60-A-12 402,736 272,522 23139Y N D DUE-1712008 43,450 23212Y N D 1801086 110,300 23213Y N D DUE-1601403 139,310 23224Y N D HRD-1712683 45,959 3,429 23238N N D 2000242 23,067 23261Y N D 1833818 147,874 23269N N I Northern Virginia Community College S-ECAGD-19-CA-0055 (Prime) 163,084 23701N N D 5H79SM080474-02 25,117 23803N N D 5H79SM080474-03 40,650 2380AN N D VA Admin Fee 28,944 23804N N D 2016-38422-25761 11,332 23807N N I U.S. Department of the Treasury 001215519-5820000 529,923 23811N N I Orange County Public Schools 480-2241B-1CT01 17,767 23904N N T Florida Department of Education 482-1610B-0CP01 62,802 23910N N T Florida Department of Education 482-1611B-1CP01 2,475,959 23911N N T Florida Department of Education 482-1611B-1C001 673,338 2391SN N D AV-265991-19 27,790 23920N N D P007A190945 132,421 53010N N D P007A200945 2,078,071 53011N N D P063P192845 7,048,745 53020N N D P063P202845 74,912,397 53021N N D P425E203798 7,399,752 53101N Y D P268K202845 740,403 63000N Y D P268K212845 41,563,694 63001N N T Florida Department of Education 482-1230A-1CR01 1,748,942 22321N N T Florida Department of State 20-CARES-25 29,681 22322N N T Florida Department of Economic Opportunity I0109 82,541.00 22901
91

4. Assistance Listings #84.425F84.425L84.03184.03184.03317.27447.07647.07647.07647.07684.36747.07619.00993.24393.24364.02819.00921.01984.36784.04884.04884.00245.16284.00784.00784.06384.063
84.425E84.26884.268
84.425C45.31014.228
19. Cluster Name 20. Grant Number w/ ARRA
21. Grant Number w/ COVID-19
22. Grant Number w/ ARP
23. R&D CFDA Conversion
24. Total SEFA Expenditures (no double reporting)
Non Cluster: P425F202998 COVID-19 - P425F202 P425F202998 84.425F 10,731,871Non Cluster: P425L200310 COVID-19 - P425L200 P425L200310 84.425L 1,811,022Non Cluster: P031S150017 P031S150017 P031S150017 84.031 204,582Non Cluster: P031S150020 P031S150020 P031S150020 84.031 99,312Student Financial Assistance Cluster: P033A200945 P033A200945 P033A200945 84.033 1,196,250Non Cluster: YB-32964-18-60-A-12 YB-32964-18-60-A-12 YB-32964-18-60-A-12 17.274 402,736Research And Development Programs Cluster: DUE-1712008 DUE-1712008 DUE-1712008 47.076 43,450Research And Development Programs Cluster: 1801086 1801086 1801086 47.076 110,300Research And Development Programs Cluster: DUE-1601403 DUE-1601403 DUE-1601403 47.076 139,310Research And Development Programs Cluster: HRD-1712683 HRD-1712683 HRD-1712683 47.076 42,530Non Cluster: 2000242 2000242 2000242 84.367 23,067Research And Development Programs Cluster: 1833818 1833818 1833818 47.076 147,874Non Cluster: S-ECAGD-19-CA-0055 S-ECAGD-19-CA-0055 S-ECAGD-19-CA-0055 19.009 163,084Non Cluster: 5H79SM080474-02 5H79SM080474-02 5H79SM080474-02 93.243 25,117Non Cluster: 5H79SM080474-03 5H79SM080474-03 5H79SM080474-03 93.243 40,650Non Cluster: VA Admin Fee VA Admin Fee VA Admin Fee 64.028 28,944Non Cluster: 2016-38422-25761 2016-38422-25761 2016-38422-25761 19.009 11,332Non Cluster: 001215519-5820000 COVID-19 - 00121551 001215519-5820000 21.019 529,923Non Cluster: 480-2241B-1CT01 480-2241B-1CT01 480-2241B-1CT01 84.367 17,767Non Cluster: 482-1610B-0CP01 482-1610B-0CP01 482-1610B-0CP01 84.048 62,802Non Cluster: 482-1611B-1CP01 482-1611B-1CP01 482-1611B-1CP01 84.048 2,475,959Non Cluster: 482-1611B-1C001 482-1611B-1C001 482-1611B-1C001 84.002 673,338Non Cluster: AV-265991-19 AV-265991-19 AV-265991-19 45.162 27,790Student Financial Assistance Cluster: P007A190945 P007A190945 P007A190945 84.007 132,421Student Financial Assistance Cluster: P007A200945 P007A200945 P007A200945 84.007 2,078,071Student Financial Assistance Cluster: P063P192845 P063P192845 P063P192845 84.063 7,048,745Student Financial Assistance Cluster: P063P202845 P063P202845 P063P202845 84.063 74,912,397Non Cluster: P425E203798 COVID-19 - P425E203P425E203798 84.425E 7,399,752Student Financial Assistance Cluster: P268K202845 P268K202845 P268K202845 84.268 740,403Student Financial Assistance Cluster: P268K212845 P268K212845 P268K212845 84.268 41,563,694Non Cluster: 482-1230A-1CR01 COVID-19 - 482-1230A482-1230A-1CR01 84.425C 1,748,942Non Cluster: 20-CARES-25 COVID-19 - 20-CARES20-CARES-25 45.310 29,681Non Cluster: I0109 I0109 I0109 14.228 82,541
92
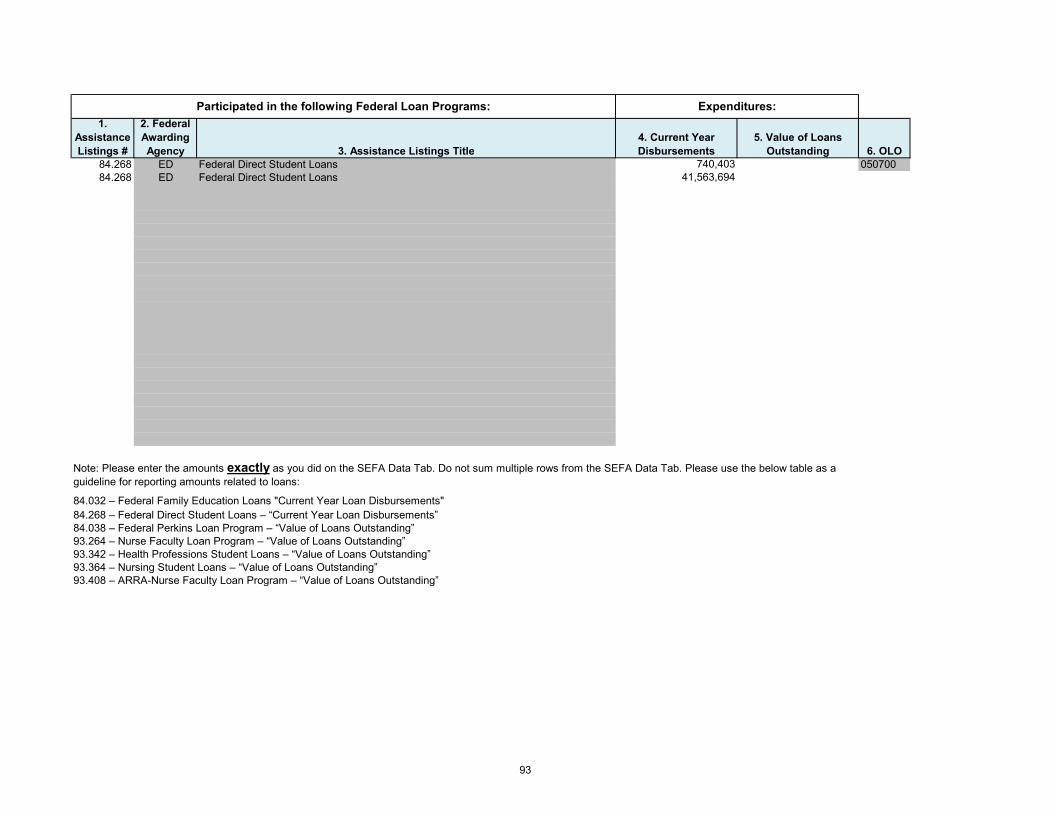
1. Assistance Listings #
2. FederalAwardingAgency 3. Assistance Listings Title
4. Current YearDisbursements
5. Value of LoansOutstanding 6. OLO
84.268 ED Federal Direct Student Loans 740,403 05070084.268 ED Federal Direct Student Loans 41,563,694
84.032 – Federal Family Education Loans "Current Year Loan Disbursements"84.268 – Federal Direct Student Loans – “Current Year Loan Disbursements”84.038 – Federal Perkins Loan Program – “Value of Loans Outstanding”93.264 – Nurse Faculty Loan Program – “Value of Loans Outstanding”93.342 – Health Professions Student Loans – “Value of Loans Outstanding”93.364 – Nursing Student Loans – “Value of Loans Outstanding”93.408 – ARRA-Nurse Faculty Loan Program – “Value of Loans Outstanding”
Participated in the following Federal Loan Programs: Expenditures:
Note: Please enter the amounts exactly as you did on the SEFA Data Tab. Do not sum multiple rows from the SEFA Data Tab. Please use the below table as aguideline for reporting amounts related to loans:
93

GL Code GL Title Financial Statements Balance OLO61400 Grants and Donations - Non Capital (Federal Portion) ($111,393,788.13) 05070062100 Capital Grants and Donations (Federal Portion)65600 Federal Funds Transfers In from Other Agencies68300 Non Capital Grants and Donations (Federal Portion)68700 Capital Grants and Donations (Federal Portion)
(111,393,788.13)$
ACFR/SEFA Reconciling Difference
0.68%1,051,200.87$
Reconciling Items (1) Amounts1 Direct Loans from CFDA 84.268 recorded in agency fund not reported as revenue on financial statements ($42,304,097.00)23456789
1011121314151617181920
(1) Required only if needed to get under $35 million/5% threshold. (42,304,097.00)$
Total Expenditures Reported
Total Balance:
154,749,086.00$
SEFA Reconciliation Template
Instructions:
The expenditures reported on the SEFA should be compared to the grant revenues recorded in the financial statements. If the difference is 5% or more of the total SEFA expenditures, or $35 million or more, an explanation is required. Specific reconciling items should be identified in the space below.
ACFR SEFA
94

FORM DFS-A1-1830. Revised 08/2021
Submission:
Checklist:If entity checks “No” to Part A, it should skip Parts B, C and D and complete the Electronic Signature section.
Part A: Yes No1 Entity expended Federal Awards.
Part B: Yes No2
3
4
5
6
7
Part C: Yes N/A8
9
10
11
12
The “Federal Awarding Agency” and “CFDA Program Title” columns on the SEFA Form were populated ensuring that an active CFDA No. was used. If neither column populates, the CFDA No. was validated in the historical index section of CFDA.gov and DFS was notified prior to submission.
“Source of Funding” was coded properly on the SEFA Form for all expenditures of Federal Awards.
No negative expenditures were recorded within the “Total Expenditures”, “Subgranted to State of Florida Entities”, and “Subgranted to Non-State of Florida Entities” columns.
A reconciliation between the amount of Federal Awards reported on the SEFA and the entity’s basic financial statements was completed prior to submission of the SEFA Form. The Reconciliation submitted is within 5% or $35 million, whichever is less. The Reconciliation Template was submitted with the SEFA Form and Checklist. Support for the reconciliation performed is on file and will be made readily available upon request.
A review of the changes to Uniform Guidance has been performed and any changes from the prior year Compliance Supplement have been properly reported.
All expenditures pertaining to The American Recovery and Reinvestment Act of 2009 (ARRA) were reported and coded with a “Y” in the “ARRA” column under the proper CFDA No. and an award number was populated in Column 14.
Sources of funding including Indirect Awards (I) and Transfers (T) that were received from a non-federal entity had accompanying “Pass-Through Grantor or State Entity Names” reported in Column 13 on the SEFA Data Form in proper format.
All Indirect Awards(" I " in Column 12), CFDA No. XX.UNK entitled “Other Federal Awards”, Research and Development Awards, ARRA Federal Awards, ARP Federal Awards, and COVID-19 Funding that were expended had accompanying “Award Numbers” reported in Column 14 on the SEFA Data Form.
All expenditures pertaining to COVID-19 Funding were reported and coded with a “Y” in the “COVID-19” column under the proper CFDA No. and an award number was populated in Column 14.
All expenditures pertaining to American Rescue Plan were reported and coded with a “Y” in the “ARP” column under the proper CFDA No. and an award number was populated in Column 14.
By certifying Item No. 19 of the Statewide Financial Statements Compliance Checklist, the reporting entity acknowledges that this SEFA Checklist was accurately completed in its entirety and submitted to the Department of Financial Services (DFS) by the submission date.
SEFA Checklist
The SEFA Checklist, along with the SEFA Form and Reconciliation Template, should be electronically submitted to DFS at:
If entity checks “Yes” to Part A, it should check that every item in Part B was completed prior to submission. The entity should also check that all applicable items in Part C were completed prior to submission; otherwise it should check “N/A” for any items not applicable. The entity must check “Yes” or “No” to all items in Part D. Once the Checklist section is completed, please complete the Electronic Signature section.
All required columns on the SEFA Form were completed in accordance with the SEFA Form Instructions.
95

FORM DFS-A1-1830. Revised 08/2021
13
14
Part D: Yes No15
16
Modified accrual basis of accountingAccrual basis of accountingCash basis of accounting
Explanation if not consistent with financial statements:
17
18
19
OR
Electronic Signature:The chief financial officer of the agency must complete the following:
I, as the chief financial officer, hereby certify, to the best of my knowledge, the items on the SEFA Form, SEFA Checklist, and Reconciliation Template have each been accurately reported by the due date.
Electronic Signature Date
List component unit names:
9/7/2021
Subgranted Columns 16 and 17, when added together, do not have an amount greater than the “Total Expenditures” amount recorded within Column 15.
Component unit was reported on the entity’s SEFA Form
All expenditures in the form of noncash benefits were reported on both the “SEFA Data” and “Noncash” worksheets of the SEFA Form.
The basis of accounting used to prepare the Schedule of Expenditures of Federal Awards is consistent with the basic financial statements. If no, provide a detailed explanation below.
Please check the basis of accounting used:
If “Yes” please check one of the following and list the component unit names below:
Did the entity use the De Minimus indirect cost rate for any of the reported expenditures? If yes, provide a detailed explanation below.
Grants that were awarded by National Science Foundation for CFDA 47.XXX that were issued on or after January 14, 2013, are reported on the SEFA as R&D. If you do not have any of these grants, click Yes. If you have 47.XXX grants issued before January 14, 2013 that are not listed as R&D, please list the related CFDA numbers below, along with their issuance dates, and click Yes.
Entity has a component unit that expended $750,000 or more in fiscal year.
Entity participated in any Federal loan program in which funds were provided through the entity to eligible participants. If so, corresponding data was reported on both the “Loan” and “SEFA Data” worksheets of the SEFA Form (State agencies must notify DFS if they participated in a Loan Program).
Component unit had an independent Federal Single Audit performed in accordance with the 2 CFR 200List component unit names:
96

FORM DFS-A1-1830. Revised 08/2021
VP, Business Ops & FinanceTitle Phone Number
Valencia CollegeEntity Name Entity OLO
407-582-3408
050700
97