Differential and combined impacts of extreme temperatures and air pollution on human mortality in...
14
ORIGINAL PAPER Differential and combined impacts of extreme temperatures and air pollution on human mortality in south–central Canada. Part I: historical analysis Chad Shouquan Cheng & Monica Campbell & Qian Li & Guilong Li & Heather Auld & Nancy Day & David Pengelly & Sarah Gingrich & Joan Klaassen & Don MacIver & Neil Comer & Yang Mao & Wendy Thompson & Hong Lin Received: 30 June 2008 / Accepted: 23 January 2009 / Published online: 18 February 2009 # The Author(s) 2009. This article is published with open access at Springerlink.com Abstract This paper forms the first part of an introduction to a synoptic weather typing approach to assess differential and combined impacts of extreme temperatures and air pollution on human mortality in south–central Canada, focusing on historical analysis (a companion paper—Part II focusing on future estimates). In this study, an automated synoptic weather typing procedure was used to identify weather types that have a marked association with high air pollution levels and temperature extremes, and facilitates assessments of the differential and combined health impacts of extreme temperatures and air pollution. Annual mean elevated mortality (when daily mortality exceeds the baseline) associated with extreme temperatures and acute exposures to air pollution, based on 1954–2000, was 1,082 [95% confidence interval (CI) of 1,017–1,147] for Mon- treal, 1,047 (CI 994–1,100) for Toronto, 462 (CI 438–486) for Ottawa, and 327 (CI 311–343) for Windsor. Of this annual mean elevated mortality, extreme temperatures are usually associated with roughly 20%, while air pollution is associated with the remaining 80%. Three pollutants (ozone, sulfur dioxide, and nitrogen dioxide) are associated with approximately 75% of total air pollution-related mortality across the study area. The remaining 25% is almost evenly associated with suspended particles and carbon monoxide, the other two pollutants addressed in this study. Of the five pollutants, ozone is most significantly associated with elevated mortality, making up one-third of the total air pollution-related mortality. PM 2.5 and PM 10 were not used as a measure of particulate in the study due to brief data records. The study results also suggest that, on the basis of daily mortality risks, extreme temperature- related weather presents a much greater risk to human health during heat waves and cold spells than air pollution. For example, in Montreal and Toronto, daily mean elevated mortality counts within the hottest weather type were twice as high as those within air pollution-related weather types. Keywords Temperature . Air pollution . Human mortality . Synoptic weather typing . South–central Canada Introduction It is well known that air pollution has been strongly linked to human health problems, particularly in vulnerable populations such as the elderly, young children, and those suffering from cardio-respiratory conditions (World Health Organization 2004). For example, Judek et al. (2004) Air Qual Atmos Health (2008) 1:209–222 DOI 10.1007/s11869-009-0027-1 C. S. Cheng (*) : Q. Li : G. Li : J. Klaassen : N. Comer : H. Lin Atmospheric Science and Applications Unit, Meteorological Service of Canada Branch—Ontario, Environment Canada, 4905 Dufferin Street, Toronto, ON, Canada M3H 5T4 e-mail: [email protected] M. Campbell : N. Day : S. Gingrich Toronto Public Health, Toronto, Canada H. Auld : D. MacIver Adaptation and Impacts Research Division, Science and Technology Branch, Environment Canada, Toronto, Canada D. Pengelly Department of Medicine, McMaster University, Hamilton, Canada Y. Mao : W. Thompson Public Health Agency of Canada, Ottawa, Canada
-
Upload
risksciences -
Category
Documents
-
view
4 -
download
0
Transcript of Differential and combined impacts of extreme temperatures and air pollution on human mortality in...
ORIGINAL PAPER
Differential and combined impacts of extreme temperaturesand air pollution on human mortality in south–centralCanada. Part I: historical analysis
Chad Shouquan Cheng & Monica Campbell & Qian Li & Guilong Li & Heather Auld &
Nancy Day & David Pengelly & Sarah Gingrich & Joan Klaassen & Don MacIver &
Neil Comer & Yang Mao & Wendy Thompson & Hong Lin
Received: 30 June 2008 /Accepted: 23 January 2009 /Published online: 18 February 2009# The Author(s) 2009. This article is published with open access at Springerlink.com
Abstract This paper forms the first part of an introductionto a synoptic weather typing approach to assess differentialand combined impacts of extreme temperatures and airpollution on human mortality in south–central Canada,focusing on historical analysis (a companion paper—Part IIfocusing on future estimates). In this study, an automatedsynoptic weather typing procedure was used to identifyweather types that have a marked association with high airpollution levels and temperature extremes, and facilitatesassessments of the differential and combined health impactsof extreme temperatures and air pollution. Annual meanelevated mortality (when daily mortality exceeds thebaseline) associated with extreme temperatures and acuteexposures to air pollution, based on 1954–2000, was 1,082
[95% confidence interval (CI) of 1,017–1,147] for Mon-treal, 1,047 (CI 994–1,100) for Toronto, 462 (CI 438–486)for Ottawa, and 327 (CI 311–343) for Windsor. Of thisannual mean elevated mortality, extreme temperatures areusually associated with roughly 20%, while air pollution isassociated with the remaining 80%. Three pollutants(ozone, sulfur dioxide, and nitrogen dioxide) are associatedwith approximately 75% of total air pollution-relatedmortality across the study area. The remaining 25% isalmost evenly associated with suspended particles andcarbon monoxide, the other two pollutants addressed inthis study. Of the five pollutants, ozone is most significantlyassociated with elevated mortality, making up one-third ofthe total air pollution-related mortality. PM2.5 and PM10
were not used as a measure of particulate in the study dueto brief data records. The study results also suggest that, onthe basis of daily mortality risks, extreme temperature-related weather presents a much greater risk to humanhealth during heat waves and cold spells than air pollution.For example, in Montreal and Toronto, daily mean elevatedmortality counts within the hottest weather type were twiceas high as those within air pollution-related weather types.
Keywords Temperature . Air pollution . Humanmortality .
Synoptic weather typing . South–central Canada
Introduction
It is well known that air pollution has been strongly linkedto human health problems, particularly in vulnerablepopulations such as the elderly, young children, and thosesuffering from cardio-respiratory conditions (World HealthOrganization 2004). For example, Judek et al. (2004)
Air Qual Atmos Health (2008) 1:209–222DOI 10.1007/s11869-009-0027-1
C. S. Cheng (*) :Q. Li :G. Li : J. Klaassen :N. Comer :H. LinAtmospheric Science and Applications Unit,Meteorological Service of Canada Branch—Ontario,Environment Canada,4905 Dufferin Street,Toronto, ON, Canada M3H 5T4e-mail: [email protected]
M. Campbell :N. Day : S. GingrichToronto Public Health,Toronto, Canada
H. Auld :D. MacIverAdaptation and Impacts Research Division,Science and Technology Branch, Environment Canada,Toronto, Canada
D. PengellyDepartment of Medicine, McMaster University,Hamilton, Canada
Y. Mao :W. ThompsonPublic Health Agency of Canada,Ottawa, Canada
pointed out that the annual excess number of deathsassociated with short-term and long-term exposure to airpollution was estimated to be 1,800 and 4,200, respectively,for eight Census Divisions in Canada with a population of8.9 million (national total population of 30.0 million in the2001 Census). Another report released by Toronto PublicHealth (2004) estimated that about 1,700 premature deathseach year in the City of Toronto (population=2.5 million inthe 2001 Census) were associated with acute or short-termexposures to ozone (O3), nitrogen dioxide (NO2), carbonmonoxide (CO), sulfur dioxide (SO2), and chronic or long-term exposures to fine particulate matter (PM2.5). About700 of these deaths were attributable to acute exposuresalone. The Ontario Medical Association (OMA 2005)estimated that, based on acute exposure to O3, SO2, NO2,CO, and PM, air pollution causes approximately 5,800premature deaths per year in Ontario (population=11.4 mil-lion in the 2001 Census) and almost $8 billion in directcosts to the provincial health care system.
It is also well known that temperature extremes areresponsible for significant numbers of deaths during hotand cold days. For example, a recent study (Medina-Ramónand Schwartz 2007) investigated the relationships betweentemperature extremes and mortality in 50 US cities,resulting in mortality increases associated to both extremeheat (+5.74%) and extreme cold (+1.59%). In the US,during the hot summer of 1980, an estimated 10,000 deathswere related to oppressive heat (Ross and Lott 2003). Thesevere 5-day heat wave over the central United Statesduring mid-July 1995 caused 830 deaths, with 525 of thesedeaths in the City of Chicago (Changnon et al. 1996).During August 2003, western European countries experi-enced a record-breaking, heat-wave event; in France aloneover 14,800 deaths may have been directly caused by thisheat wave (Pirard et al. 2005).
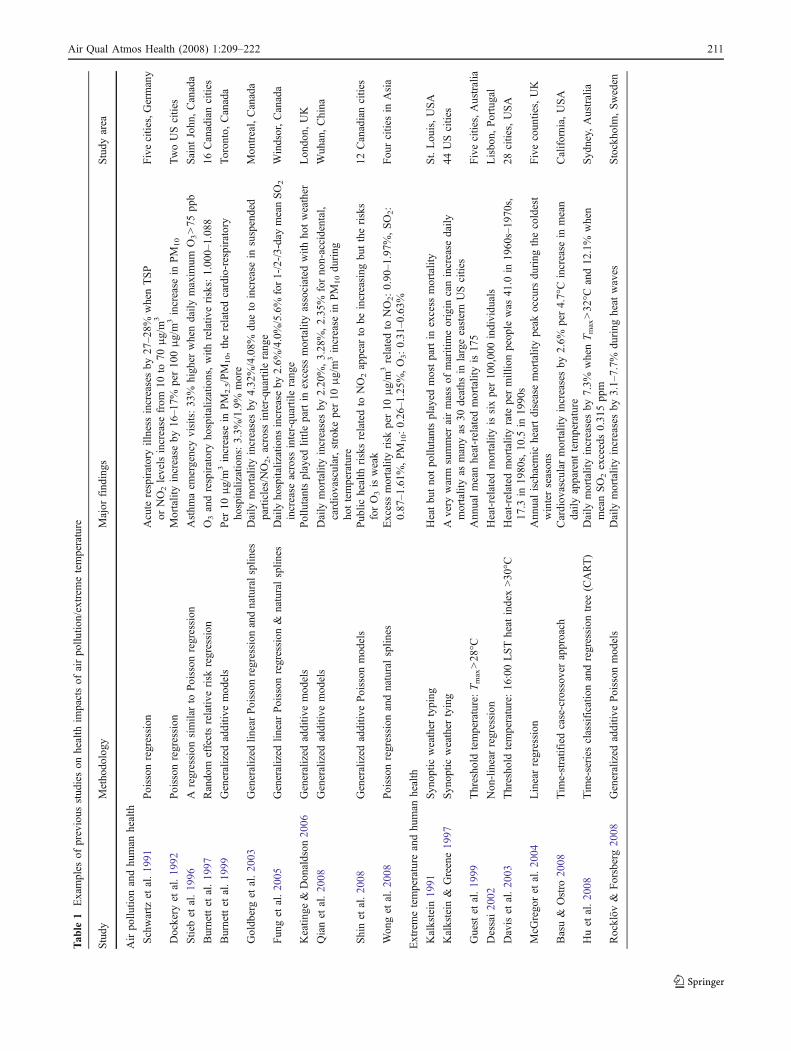
Many chronic diseases, especially those of the respira-tory and cardiovascular systems, are exacerbated mostfrequently during or after a period of specific weatherconditions (e.g., Kalkstein 1991; Cheng 1991; Nichols et al.1995; Sheridan and Kalkstein 2004; Shin et al. 2008) and/or high air pollution concentrations (Schwartz et al. 1991;Burnett et al. 1994, 1999; Schwartz 2000, Basu and Ostro2008). As shown in Table 1 for examples, a number of theprevious studies in this field have examined how human-made factors such as atmospheric pollutants affect humanhealth; many others have focused on how natural stressorssuch as extreme temperatures influence death rates. Someother studies (e.g., Rainham and Smoyer-Tomic 2003; Huet al. 2008) have investigated associations between extremetemperatures and mortality, considering confoundingimpacts of air pollutants. However, the differential andcombined impacts of extreme temperature-related weatherevents and high air pollution episodes on human health are
poorly understood. In the light of these concerns, Environ-ment Canada, in partnerships with Toronto Public Health,McMaster University, Health Canada, and Public HealthAgency of Canada, has completed a 3-year research project.This project, funded by the Health Policy ResearchProgram, Health Canada, proposed a method based onsynoptic weather typing in addition to air pollution levels toevaluate differential and combined impacts of extremetemperatures and air pollution on human mortality in south–central Canada. The results from this study, expressed aselevated mortality (above the baseline) associated withdifferent factors (e.g., heat, cold, pollutants), could be usableby governmental agencies and stakeholders for assisting indeveloping better policies on health protection and balancingpolicy decisions. This study may enhance current understand-ing of environmental problems related to human health insouth–central Canada.
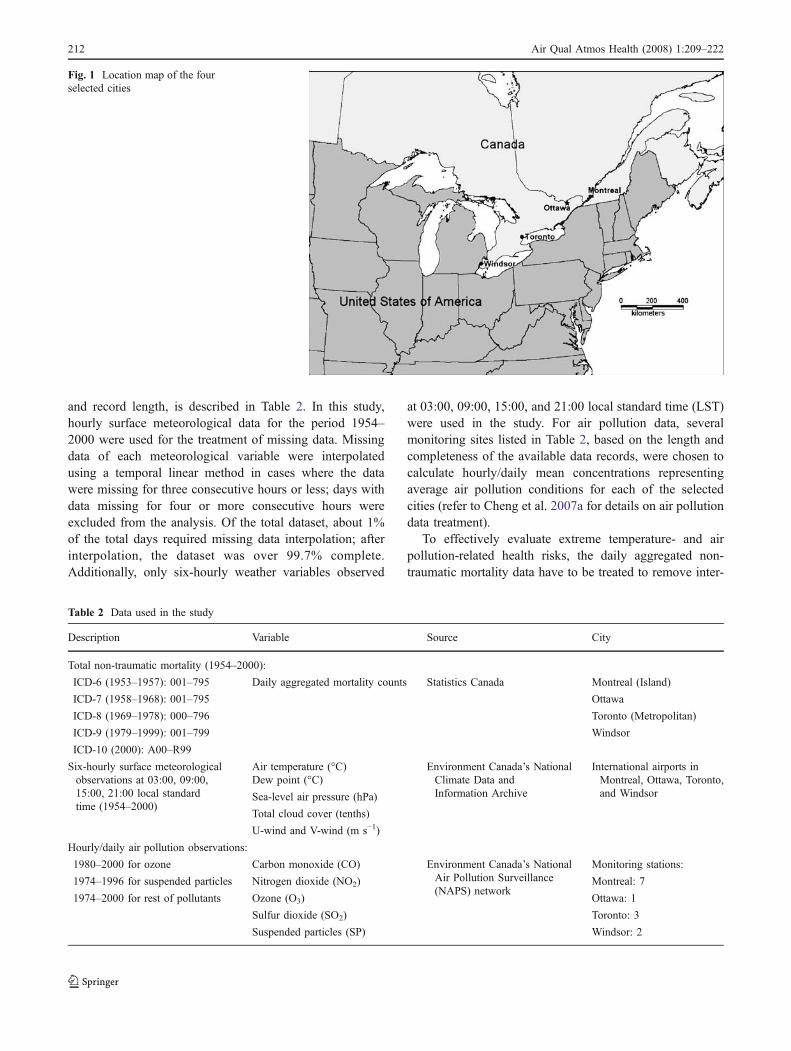
The current paper describes the background to thedevelopment of an analysis approach to quantitativelyestimate elevated mortality, applying an automated synopticweather typing and mortality baseline analyses. Thesynoptic weather typing has been adapted to develop aheat–health watch/warning system piloted in Philadelphia,Cincinnati, Rome, Shanghai, and Toronto for the UNShowcase Project (Sheridan and Kalkstein 2004). Thismethod promises to evaluate relationships among a varietyof weather elements rather than only individual variables—the synergistic impact of several elements being moresignificant than the sum of their individual impacts(Kalkstein 1991; Pope and Kalkstein 1996; Kalkstein etal. 1997). Part of the current study focusing on climatechange impacts analysis on both future air pollution- andtemperature extreme-related mortality in south–centralCanada is presented in a companion paper (Part II, Chenget al. 2009). To effectively estimate climate change-inducedfuture elevated mortality, historical analysis is essential forus to build a solid science foundation on health impacts ofair pollution and extreme temperatures. For this study, fourcities, Montreal, Ottawa, Toronto, and Windsor, located insouth–central Canada, were selected (Fig. 1). There areseveral reasons for selection of the cities. First, the cities,especially for Windsor, have experienced the hottestweather situation in the country. Second, Toronto andMontreal are the two largest cities, in terms of population,in Canada. Finally, Ottawa is the capital of Canada.
Data sources and treatment
To evaluate differential and combined impacts of airpollution and extreme temperatures on human mortality,meteorological, air pollution, and mortality data are needed.The detailed information, regarding data sources, variables,
210 Air Qual Atmos Health (2008) 1:209–222
Tab
le1
Examples
ofprevious
stud
ieson
health
impactsof
airpo
llutio
n/extrem
etemperature
Study
Metho
dology
Major
find
ings
Study
area
Airpo
llutio
nandhu
man
health
Schwartz
etal.19
91Poisson
regression
Acute
respiratoryillness
increasesby
27–28%
whenTSP
orNO2levelsincrease
from
10to
70μg/m
3Fivecities,Germany
Dockery
etal.19
92Poisson
regression
Mortalityincrease
by16
–17%
per10
0μg/m
3increase
inPM
10
TwoUScities
Stiebet
al.19
96A
regression
similarto
Poisson
regression
Asthm
aem
ergencyvisits:33%
higher
whendaily
maxim
umO3>75
ppb
Saint
John
,Canada
Burnettet
al.19
97Rando
meffectsrelativ
erisk
regression
O3andrespiratoryho
spitalizations,with
relativ
erisks:1.00
0–1.08
816
Canadiancities
Burnettet
al.19
99Generalized
additiv
emod
els
Per
10μg/m
3increase
inPM
2.5/PM
10,therelatedcardio-respiratory
hospitalizations:3.3%
/1.9%
more
Toron
to,Canada
Goldb
erget
al.20
03Generalized
linearPoisson
regression
andnaturalsplines
Daily
mortalityincreasesby
4.32
%/4.08%
dueto
increase
insuspended
particles/NO2,across
inter-quartilerange
Mon
treal,Canada
Fun
get
al.20
05Generalized
linearPoisson
regression
&naturalsplin
esDaily
hospitalizations
increase
by2.6%
/4.0%/5.6%
for1-/2-/3-daymeanSO2
increase
across
inter-qu
artilerang
eWindsor,Canada
Keatin
ge&
Don
aldson
2006
Generalized
additiv
emod
els
Pollutantsplayed
little
partin
excess
mortalityassociated
with
hotweather
Lon
don,
UK
Qianet
al.20
08Generalized
additiv
emod
els
Daily
mortalityincreasesby
2.20
%,3.28
%,2.35
%forno
n-accidental,
cardiovascular,stroke
per10
μg/m
3increase
inPM
10du
ring
hottemperature
Wuh
an,China
Shinet
al.20
08Generalized
additiv
ePoisson
mod
els
Pub
lichealth
risksrelatedto
NO2appear
tobe
increasing
buttherisks
forO3isweak
12Canadiancities
Won
get
al.20
08Poisson
regression
andnaturalsplin
esExcessmortalityrisk
per10
μg/m
3relatedto
NO2:0.90
–1.97%
,SO2:
0.87–1
.61%
,PM
10:0.26–1
.25%
,O3:0.31–0
.63%
Fou
rcitiesin
Asia
Extremetemperature
andhu
man
health
Kalkstein
1991
Syn
optic
weather
typing
Heatbu
tno
tpo
llutantsplayed
mostpartin
excess
mortality
St.Lou
is,USA
Kalkstein
&Greene19
97Syn
optic
weather
tying
Avery
warm
summer
airmassof
maritimeorigin
canincrease
daily
mortalityas
manyas
30deaths
inlargeeasternUScities
44UScities
Guestet
al.19
99Thresho
ldtemperature:Tmax>28
°CAnn
ualmeanheat-related
mortalityis17
5Fivecities,Australia
Dessai20
02Non
-linearregression
Heat-relatedmortalityissixper10
0,00
0individu
als
Lisbo
n,Portugal
Daviset
al.20
03Thresho
ldtemperature:16
:00LSTheat
index>30
°CHeat-relatedmortalityrate
permillionpeop
lewas
41.0
in19
60s–19
70s,
17.3
in19
80s,10
.5in
1990
s28
cities,USA
McG
rego
ret
al.20
04Linearregression
Ann
ualischaemic
heartdiseasemortalitypeak
occurs
during
thecoldest
winterseason
sFivecoun
ties,UK
Basu&
Ostro
2008
Tim
e-stratifiedcase-crossov
erapproach
Cardiov
ascularmortalityincreasesby
2.6%
per4.7°Cincrease
inmean
daily
apparent
temperature
California,
USA
Huet
al.20
08Tim
e-series
classificatio
nandregression
tree
(CART)
Daily
mortalityincreasesby
7.3%
whenTmax>32
°Cand12
.1%
when
meanSO2exceeds0.31
5pp
mSyd
ney,
Australia
Rocklöv
&Forsberg20
08Generalized
additiv
ePoisson
mod
els
Daily
mortalityincreasesby
3.1–
7.7%
during
heat
waves
Stockho
lm,Sweden
Air Qual Atmos Health (2008) 1:209–222 211
and record length, is described in Table 2. In this study,hourly surface meteorological data for the period 1954–2000 were used for the treatment of missing data. Missingdata of each meteorological variable were interpolatedusing a temporal linear method in cases where the datawere missing for three consecutive hours or less; days withdata missing for four or more consecutive hours wereexcluded from the analysis. Of the total dataset, about 1%of the total days required missing data interpolation; afterinterpolation, the dataset was over 99.7% complete.Additionally, only six-hourly weather variables observed
at 03:00, 09:00, 15:00, and 21:00 local standard time (LST)were used in the study. For air pollution data, severalmonitoring sites listed in Table 2, based on the length andcompleteness of the available data records, were chosen tocalculate hourly/daily mean concentrations representingaverage air pollution conditions for each of the selectedcities (refer to Cheng et al. 2007a for details on air pollutiondata treatment).
To effectively evaluate extreme temperature- and airpollution-related health risks, the daily aggregated non-traumatic mortality data have to be treated to remove inter-
Table 2 Data used in the study
Description Variable Source City
Total non-traumatic mortality (1954–2000):
ICD-6 (1953–1957): 001–795 Daily aggregated mortality counts Statistics Canada Montreal (Island)
ICD-7 (1958–1968): 001–795 Ottawa
ICD-8 (1969–1978): 000–796 Toronto (Metropolitan)
ICD-9 (1979–1999): 001–799 Windsor
ICD-10 (2000): A00–R99
Six-hourly surface meteorologicalobservations at 03:00, 09:00,15:00, 21:00 local standardtime (1954–2000)
Air temperature (°C) Environment Canada’s NationalClimate Data andInformation Archive
International airports inMontreal, Ottawa, Toronto,and Windsor
Dew point (°C)
Sea-level air pressure (hPa)
Total cloud cover (tenths)
U-wind and V-wind (m s−1)
Hourly/daily air pollution observations:
1980–2000 for ozone Carbon monoxide (CO) Environment Canada’s NationalAir Pollution Surveillance(NAPS) network
Monitoring stations:
1974–1996 for suspended particles Nitrogen dioxide (NO2) Montreal: 7
1974–2000 for rest of pollutants Ozone (O3) Ottawa: 1
Sulfur dioxide (SO2) Toronto: 3
Suspended particles (SP) Windsor: 2
Fig. 1 Location map of the fourselected cities
212 Air Qual Atmos Health (2008) 1:209–222
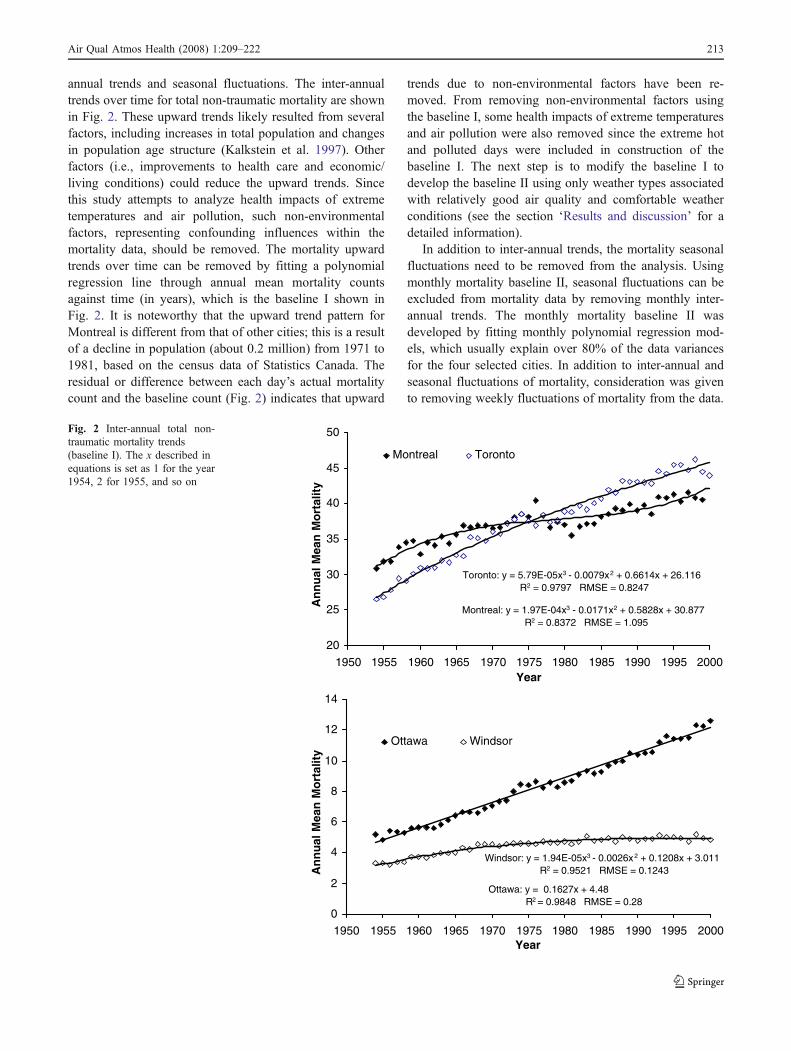
annual trends and seasonal fluctuations. The inter-annualtrends over time for total non-traumatic mortality are shownin Fig. 2. These upward trends likely resulted from severalfactors, including increases in total population and changesin population age structure (Kalkstein et al. 1997). Otherfactors (i.e., improvements to health care and economic/living conditions) could reduce the upward trends. Sincethis study attempts to analyze health impacts of extremetemperatures and air pollution, such non-environmentalfactors, representing confounding influences within themortality data, should be removed. The mortality upwardtrends over time can be removed by fitting a polynomialregression line through annual mean mortality countsagainst time (in years), which is the baseline I shown inFig. 2. It is noteworthy that the upward trend pattern forMontreal is different from that of other cities; this is a resultof a decline in population (about 0.2 million) from 1971 to1981, based on the census data of Statistics Canada. Theresidual or difference between each day’s actual mortalitycount and the baseline count (Fig. 2) indicates that upward
trends due to non-environmental factors have been re-moved. From removing non-environmental factors usingthe baseline I, some health impacts of extreme temperaturesand air pollution were also removed since the extreme hotand polluted days were included in construction of thebaseline I. The next step is to modify the baseline I todevelop the baseline II using only weather types associatedwith relatively good air quality and comfortable weatherconditions (see the section ‘Results and discussion’ for adetailed information).
In addition to inter-annual trends, the mortality seasonalfluctuations need to be removed from the analysis. Usingmonthly mortality baseline II, seasonal fluctuations can beexcluded from mortality data by removing monthly inter-annual trends. The monthly mortality baseline II wasdeveloped by fitting monthly polynomial regression mod-els, which usually explain over 80% of the data variancesfor the four selected cities. In addition to inter-annual andseasonal fluctuations of mortality, consideration was givento removing weekly fluctuations of mortality from the data.
Windsor: y = 1.94E-05x3 - 0.0026x2 + 0.1208x + 3.011R2 = 0.9521 RMSE = 0.1243
Ottawa: y = 0.1627x + 4.48 R2 = 0.9848 RMSE = 0.28
0
2
4
6
8
10
12
14
1950 1955 1960 1965 1970 1975 1980 1985 1990 1995 2000Year
An
nu
al M
ean
Mo
rtal
ity
Ottawa Windsor
Montreal: y = 1.97E-04x3 - 0.0171x2 + 0.5828x + 30.877R2 = 0.8372 RMSE = 1.095
Toronto: y = 5.79E-05x3 - 0.0079x2 + 0.6614x + 26.116R2 = 0.9797 RMSE = 0.8247
20
25
30
35
40
45
50
1950 1955 1960 1965 1970 1975 1980 1985 1990 1995 2000Year
An
nu
al M
ean
Mo
rtal
ity
Montreal Toronto
Fig. 2 Inter-annual total non-traumatic mortality trends(baseline I). The x described inequations is set as 1 for the year1954, 2 for 1955, and so on
Air Qual Atmos Health (2008) 1:209–222 213
However, the weekly fluctuations within a weather groupwere not statistically significant for the four selected citiesand therefore were not considered to be removed.
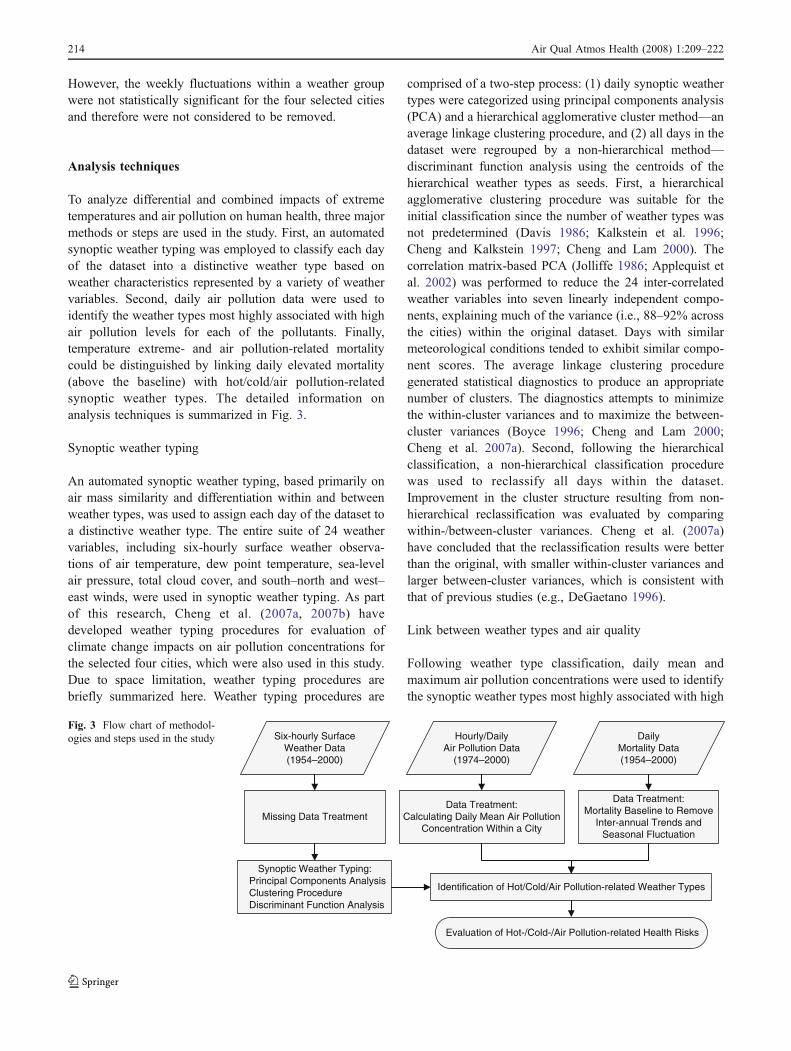
Analysis techniques
To analyze differential and combined impacts of extremetemperatures and air pollution on human health, three majormethods or steps are used in the study. First, an automatedsynoptic weather typing was employed to classify each dayof the dataset into a distinctive weather type based onweather characteristics represented by a variety of weathervariables. Second, daily air pollution data were used toidentify the weather types most highly associated with highair pollution levels for each of the pollutants. Finally,temperature extreme- and air pollution-related mortalitycould be distinguished by linking daily elevated mortality(above the baseline) with hot/cold/air pollution-relatedsynoptic weather types. The detailed information onanalysis techniques is summarized in Fig. 3.
Synoptic weather typing
An automated synoptic weather typing, based primarily onair mass similarity and differentiation within and betweenweather types, was used to assign each day of the dataset toa distinctive weather type. The entire suite of 24 weathervariables, including six-hourly surface weather observa-tions of air temperature, dew point temperature, sea-levelair pressure, total cloud cover, and south–north and west–east winds, were used in synoptic weather typing. As partof this research, Cheng et al. (2007a, 2007b) havedeveloped weather typing procedures for evaluation ofclimate change impacts on air pollution concentrations forthe selected four cities, which were also used in this study.Due to space limitation, weather typing procedures arebriefly summarized here. Weather typing procedures are
comprised of a two-step process: (1) daily synoptic weathertypes were categorized using principal components analysis(PCA) and a hierarchical agglomerative cluster method—anaverage linkage clustering procedure, and (2) all days in thedataset were regrouped by a non-hierarchical method—discriminant function analysis using the centroids of thehierarchical weather types as seeds. First, a hierarchicalagglomerative clustering procedure was suitable for theinitial classification since the number of weather types wasnot predetermined (Davis 1986; Kalkstein et al. 1996;Cheng and Kalkstein 1997; Cheng and Lam 2000). Thecorrelation matrix-based PCA (Jolliffe 1986; Applequist etal. 2002) was performed to reduce the 24 inter-correlatedweather variables into seven linearly independent compo-nents, explaining much of the variance (i.e., 88–92% acrossthe cities) within the original dataset. Days with similarmeteorological conditions tended to exhibit similar compo-nent scores. The average linkage clustering proceduregenerated statistical diagnostics to produce an appropriatenumber of clusters. The diagnostics attempts to minimizethe within-cluster variances and to maximize the between-cluster variances (Boyce 1996; Cheng and Lam 2000;Cheng et al. 2007a). Second, following the hierarchicalclassification, a non-hierarchical classification procedurewas used to reclassify all days within the dataset.Improvement in the cluster structure resulting from non-hierarchical reclassification was evaluated by comparingwithin-/between-cluster variances. Cheng et al. (2007a)have concluded that the reclassification results were betterthan the original, with smaller within-cluster variances andlarger between-cluster variances, which is consistent withthat of previous studies (e.g., DeGaetano 1996).
Link between weather types and air quality
Following weather type classification, daily mean andmaximum air pollution concentrations were used to identifythe synoptic weather types most highly associated with high
Six-hourly Surface Weather Data(1954–2000)
Hourly/Daily Air Pollution Data
(1974–2000)
Missing Data TreatmentData Treatment:
Calculating Daily Mean Air Pollution Concentration Within a City
Synoptic Weather Typing:Principal Components AnalysisClustering ProcedureDiscriminant Function Analysis
Identification of Hot/Cold/Air Pollution-related Weather Types
Evaluation of Hot-/Cold-/Air Pollution-related Health Risks
Daily Mortality Data (1954–2000)
Data Treatment:Mortality Baseline to Remove
Inter-annual Trends and Seasonal Fluctuation
Fig. 3 Flow chart of methodol-ogies and steps used in the study
214 Air Qual Atmos Health (2008) 1:209–222
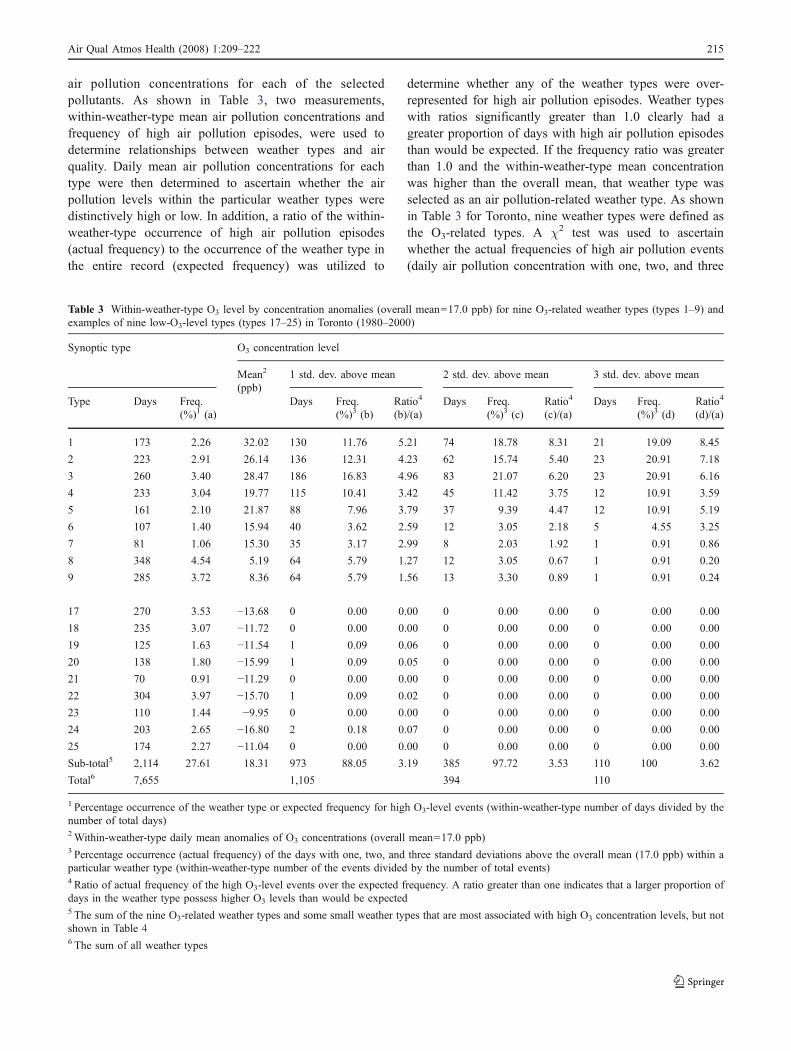
air pollution concentrations for each of the selectedpollutants. As shown in Table 3, two measurements,within-weather-type mean air pollution concentrations andfrequency of high air pollution episodes, were used todetermine relationships between weather types and airquality. Daily mean air pollution concentrations for eachtype were then determined to ascertain whether the airpollution levels within the particular weather types weredistinctively high or low. In addition, a ratio of the within-weather-type occurrence of high air pollution episodes(actual frequency) to the occurrence of the weather type inthe entire record (expected frequency) was utilized to
determine whether any of the weather types were over-represented for high air pollution episodes. Weather typeswith ratios significantly greater than 1.0 clearly had agreater proportion of days with high air pollution episodesthan would be expected. If the frequency ratio was greaterthan 1.0 and the within-weather-type mean concentrationwas higher than the overall mean, that weather type wasselected as an air pollution-related weather type. As shownin Table 3 for Toronto, nine weather types were defined asthe O3-related types. A χ2 test was used to ascertainwhether the actual frequencies of high air pollution events(daily air pollution concentration with one, two, and three
Table 3 Within-weather-type O3 level by concentration anomalies (overall mean=17.0 ppb) for nine O3-related weather types (types 1–9) andexamples of nine low-O3-level types (types 17–25) in Toronto (1980–2000)
Synoptic type O3 concentration level
Mean2
(ppb)1 std. dev. above mean 2 std. dev. above mean 3 std. dev. above mean
Type Days Freq.(%)1 (a)
Days Freq.(%)3 (b)
Ratio4
(b)/(a)Days Freq.
(%)3 (c)Ratio4
(c)/(a)Days Freq.
(%)3 (d)Ratio4
(d)/(a)
1 173 2.26 32.02 130 11.76 5.21 74 18.78 8.31 21 19.09 8.45
2 223 2.91 26.14 136 12.31 4.23 62 15.74 5.40 23 20.91 7.18
3 260 3.40 28.47 186 16.83 4.96 83 21.07 6.20 23 20.91 6.16
4 233 3.04 19.77 115 10.41 3.42 45 11.42 3.75 12 10.91 3.59
5 161 2.10 21.87 88 7.96 3.79 37 9.39 4.47 12 10.91 5.19
6 107 1.40 15.94 40 3.62 2.59 12 3.05 2.18 5 4.55 3.25
7 81 1.06 15.30 35 3.17 2.99 8 2.03 1.92 1 0.91 0.86
8 348 4.54 5.19 64 5.79 1.27 12 3.05 0.67 1 0.91 0.20
9 285 3.72 8.36 64 5.79 1.56 13 3.30 0.89 1 0.91 0.24
17 270 3.53 −13.68 0 0.00 0.00 0 0.00 0.00 0 0.00 0.00
18 235 3.07 −11.72 0 0.00 0.00 0 0.00 0.00 0 0.00 0.00
19 125 1.63 −11.54 1 0.09 0.06 0 0.00 0.00 0 0.00 0.00
20 138 1.80 −15.99 1 0.09 0.05 0 0.00 0.00 0 0.00 0.00
21 70 0.91 −11.29 0 0.00 0.00 0 0.00 0.00 0 0.00 0.00
22 304 3.97 −15.70 1 0.09 0.02 0 0.00 0.00 0 0.00 0.00
23 110 1.44 −9.95 0 0.00 0.00 0 0.00 0.00 0 0.00 0.00
24 203 2.65 −16.80 2 0.18 0.07 0 0.00 0.00 0 0.00 0.00
25 174 2.27 −11.04 0 0.00 0.00 0 0.00 0.00 0 0.00 0.00
Sub-total5 2,114 27.61 18.31 973 88.05 3.19 385 97.72 3.53 110 100 3.62
Total6 7,655 1,105 394 110
1 Percentage occurrence of the weather type or expected frequency for high O3-level events (within-weather-type number of days divided by thenumber of total days)2Within-weather-type daily mean anomalies of O3 concentrations (overall mean=17.0 ppb)3 Percentage occurrence (actual frequency) of the days with one, two, and three standard deviations above the overall mean (17.0 ppb) within aparticular weather type (within-weather-type number of the events divided by the number of total events)4 Ratio of actual frequency of the high O3-level events over the expected frequency. A ratio greater than one indicates that a larger proportion ofdays in the weather type possess higher O3 levels than would be expected5 The sum of the nine O3-related weather types and some small weather types that are most associated with high O3 concentration levels, but notshown in Table 46 The sum of all weather types
Air Qual Atmos Health (2008) 1:209–222 215
standard deviations above the overall mean) were signifi-cantly different from their expected occurrences (χ2 testsignificance level of 0.001). This method was then appliedto different pollutants for each of the selected cities.
Health impacts of extreme temperatures and air pollution
Synoptic weather typing can be used to evaluate thedifferential and combined impacts of extreme temperaturesand air pollution on elevated mortality. In this study, theelevated mortality counts within the weather types associ-ated with high air pollution concentrations—but withcomfortable weather conditions—are treated as the impactsof air pollution on human health. The impacts of extremetemperatures on human health might be determined by thehot and cold weather types. Although the hot/cold weathergroups are usually associated with high air pollutionconcentrations, elevated mortality within the hot/coldgroups was defined as extreme temperature-related mortal-ity since extreme temperatures are most relevant to elevatedmortality in these weather groups (refer to the section‘Results and discussion’ for a more detailed information).
The synoptic weather typing procedure can be used toanalyze differential impacts of air pollutants on elevatedmortality counts as well. The air pollution-related weathertypes may be associated with high air pollution concen-trations for one single pollutant or multiple pollutants. Forthe former case, within-weather-type elevated mortality canbe identified as associated with that particular pollutant. Forthe latter case, the study assumes that within-weather-typeelevated mortality is associated with the one particularpollutant that is most important to the weather type (refer tothe section ‘Results and discussion’ for a more detailedinformation).
Consideration was given to taking into account lag timesof extreme temperature and air pollution impacts onmortality. Based on the analysis, no-lag-time relationshipsbetween heat and mortality are more significant than otherlag times across the study area. This is consistent with theprevious studies (e.g., Dessai 2002; Rainham and Smoyer-Tomic 2003; Sheridan and Kalkstein 2004). As a result, thewithin-weather-type elevated mortality was estimated in thestudy based on lag-zero-day relationships.
Results and discussion
Findings derived from this study are significant in threeareas: (1) extreme temperature- and air pollution-relatedweather types, (2) mortality baseline, and (3) differentialand combined health impacts of temperature extremes andair pollution. The major findings in each of the areas arediscussed in this section as follows.
Extreme temperature- and air pollution-relatedweather types
The number of major synoptic weather types (with sizesabove 1% of the total days) identified for the selected citiesvaried slightly from one city to another: 39, 37, 36, and 39for Montreal, Ottawa, Toronto, and Windsor, respectively.The smaller weather types were still included in theanalysis. As part of this study, Cheng et al. (2007a) havedetermined extreme temperature- and air pollution-relatedweather types for the selected cities. For each of the fourselected cities, there are three hot weather types, four orfive cold weather types, and the number of air pollution-related weather types, as shown in Table 4 for Toronto(similar results were discovered for the other cities as well,but not shown). The three hot weather types (Hot1, Hot2,and Hot3) can capture 50–60%, 20–30%, and about 10% ofthe total days with 15:00 LST temperature ≥32°C,respectively, across the study area. For determination ofthe cold weather types, the criterion varies from location tolocation, based on the difference of January mean 15:00temperature among the cities. The within-weather-typemean 15:00 temperature of ≤−6°C was used to define acold weather type for Ottawa and Montreal, and of ≤−3°Cfor Toronto and Windsor.
As described in the previous section, air pollution-relatedweather types were defined based on (1) within-weather-typedaily mean concentrations and (2) the ratios of actualfrequency of high pollution level events over the expectedfrequency. The within-weather-type mean concentrationsand ratios for nine O3-related weather types and nine low-O3-level types in Toronto are shown in Table 3, as anexample. The similar results were found for other selectedcities but not shown due to limitations of space. Asshown in Table 3, daily mean anomalies of O3 concentra-tion within weather types 1–9 are much higher than theoverall mean (17.0 ppb in Toronto). Most of other weathertypes (e.g., weather types 17–25) possess negative meananomalies of O3 concentrations. For weather type 1 inToronto, the expected frequency of high air pollution eventswould be 2.26%, based on the size of the weather type.However, the actual frequency of the high air pollutionevents with one and three standard deviations above theoverall mean was about 12% and 19%, respectively—morethan five and eight times what might otherwise be expected.Through these analyses, ten, nine, nine, and nine O3-relatedweather types were identified for Montreal, Ottawa,Toronto, and Windsor, respectively, of which the first threeare also called hot weather types. On average across thefour selected cities, these weather types accounted for 83%and 97% of the total high O3 events with greater than oneand three standard deviations above the overall mean,respectively.
216 Air Qual Atmos Health (2008) 1:209–222
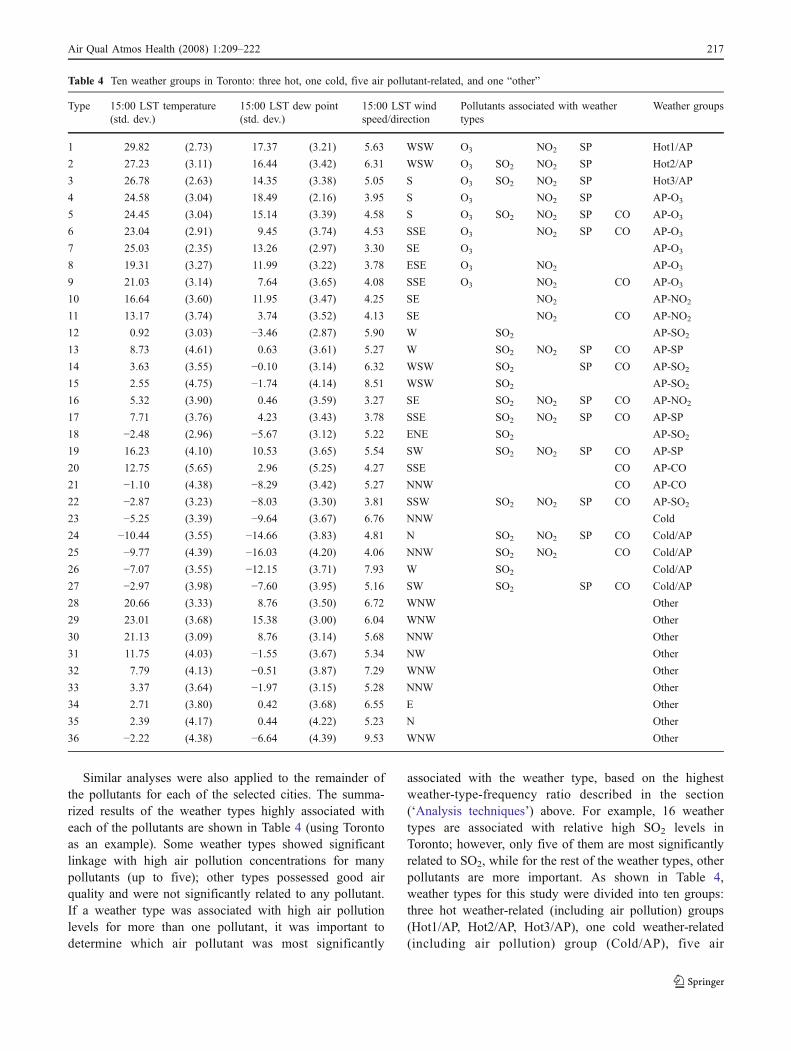
Similar analyses were also applied to the remainder ofthe pollutants for each of the selected cities. The summa-rized results of the weather types highly associated witheach of the pollutants are shown in Table 4 (using Torontoas an example). Some weather types showed significantlinkage with high air pollution concentrations for manypollutants (up to five); other types possessed good airquality and were not significantly related to any pollutant.If a weather type was associated with high air pollutionlevels for more than one pollutant, it was important todetermine which air pollutant was most significantly
associated with the weather type, based on the highestweather-type-frequency ratio described in the section(‘Analysis techniques’) above. For example, 16 weathertypes are associated with relative high SO2 levels inToronto; however, only five of them are most significantlyrelated to SO2, while for the rest of the weather types, otherpollutants are more important. As shown in Table 4,weather types for this study were divided into ten groups:three hot weather-related (including air pollution) groups(Hot1/AP, Hot2/AP, Hot3/AP), one cold weather-related(including air pollution) group (Cold/AP), five air
Table 4 Ten weather groups in Toronto: three hot, one cold, five air pollutant-related, and one “other”
Type 15:00 LST temperature(std. dev.)
15:00 LST dew point(std. dev.)
15:00 LST windspeed/direction
Pollutants associated with weathertypes
Weather groups
1 29.82 (2.73) 17.37 (3.21) 5.63 WSW O3 NO2 SP Hot1/AP
2 27.23 (3.11) 16.44 (3.42) 6.31 WSW O3 SO2 NO2 SP Hot2/AP
3 26.78 (2.63) 14.35 (3.38) 5.05 S O3 SO2 NO2 SP Hot3/AP
4 24.58 (3.04) 18.49 (2.16) 3.95 S O3 NO2 SP AP-O3
5 24.45 (3.04) 15.14 (3.39) 4.58 S O3 SO2 NO2 SP CO AP-O3
6 23.04 (2.91) 9.45 (3.74) 4.53 SSE O3 NO2 SP CO AP-O3
7 25.03 (2.35) 13.26 (2.97) 3.30 SE O3 AP-O3
8 19.31 (3.27) 11.99 (3.22) 3.78 ESE O3 NO2 AP-O3
9 21.03 (3.14) 7.64 (3.65) 4.08 SSE O3 NO2 CO AP-O3
10 16.64 (3.60) 11.95 (3.47) 4.25 SE NO2 AP-NO2
11 13.17 (3.74) 3.74 (3.52) 4.13 SE NO2 CO AP-NO2
12 0.92 (3.03) −3.46 (2.87) 5.90 W SO2 AP-SO2
13 8.73 (4.61) 0.63 (3.61) 5.27 W SO2 NO2 SP CO AP-SP
14 3.63 (3.55) −0.10 (3.14) 6.32 WSW SO2 SP CO AP-SO2
15 2.55 (4.75) −1.74 (4.14) 8.51 WSW SO2 AP-SO2
16 5.32 (3.90) 0.46 (3.59) 3.27 SE SO2 NO2 SP CO AP-NO2
17 7.71 (3.76) 4.23 (3.43) 3.78 SSE SO2 NO2 SP CO AP-SP
18 −2.48 (2.96) −5.67 (3.12) 5.22 ENE SO2 AP-SO2
19 16.23 (4.10) 10.53 (3.65) 5.54 SW SO2 NO2 SP CO AP-SP
20 12.75 (5.65) 2.96 (5.25) 4.27 SSE CO AP-CO
21 −1.10 (4.38) −8.29 (3.42) 5.27 NNW CO AP-CO
22 −2.87 (3.23) −8.03 (3.30) 3.81 SSW SO2 NO2 SP CO AP-SO2
23 −5.25 (3.39) −9.64 (3.67) 6.76 NNW Cold
24 −10.44 (3.55) −14.66 (3.83) 4.81 N SO2 NO2 SP CO Cold/AP
25 −9.77 (4.39) −16.03 (4.20) 4.06 NNW SO2 NO2 CO Cold/AP
26 −7.07 (3.55) −12.15 (3.71) 7.93 W SO2 Cold/AP
27 −2.97 (3.98) −7.60 (3.95) 5.16 SW SO2 SP CO Cold/AP
28 20.66 (3.33) 8.76 (3.50) 6.72 WNW Other
29 23.01 (3.68) 15.38 (3.00) 6.04 WNW Other
30 21.13 (3.09) 8.76 (3.14) 5.68 NNW Other
31 11.75 (4.03) −1.55 (3.67) 5.34 NW Other
32 7.79 (4.13) −0.51 (3.87) 7.29 WNW Other
33 3.37 (3.64) −1.97 (3.15) 5.28 NNW Other
34 2.71 (3.80) 0.42 (3.68) 6.55 E Other
35 2.39 (4.17) 0.44 (4.22) 5.23 N Other
36 −2.22 (4.38) −6.64 (4.39) 9.53 WNW Other
Air Qual Atmos Health (2008) 1:209–222 217
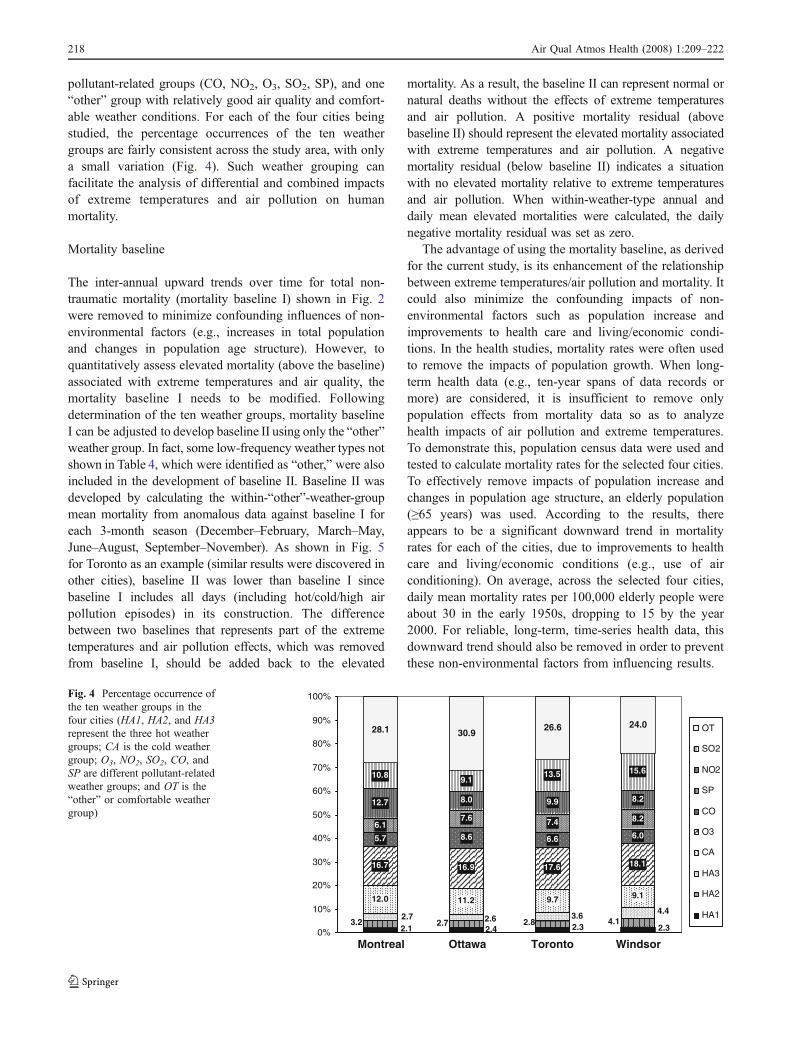
pollutant-related groups (CO, NO2, O3, SO2, SP), and one“other” group with relatively good air quality and comfort-able weather conditions. For each of the four cities beingstudied, the percentage occurrences of the ten weathergroups are fairly consistent across the study area, with onlya small variation (Fig. 4). Such weather grouping canfacilitate the analysis of differential and combined impactsof extreme temperatures and air pollution on humanmortality.
Mortality baseline
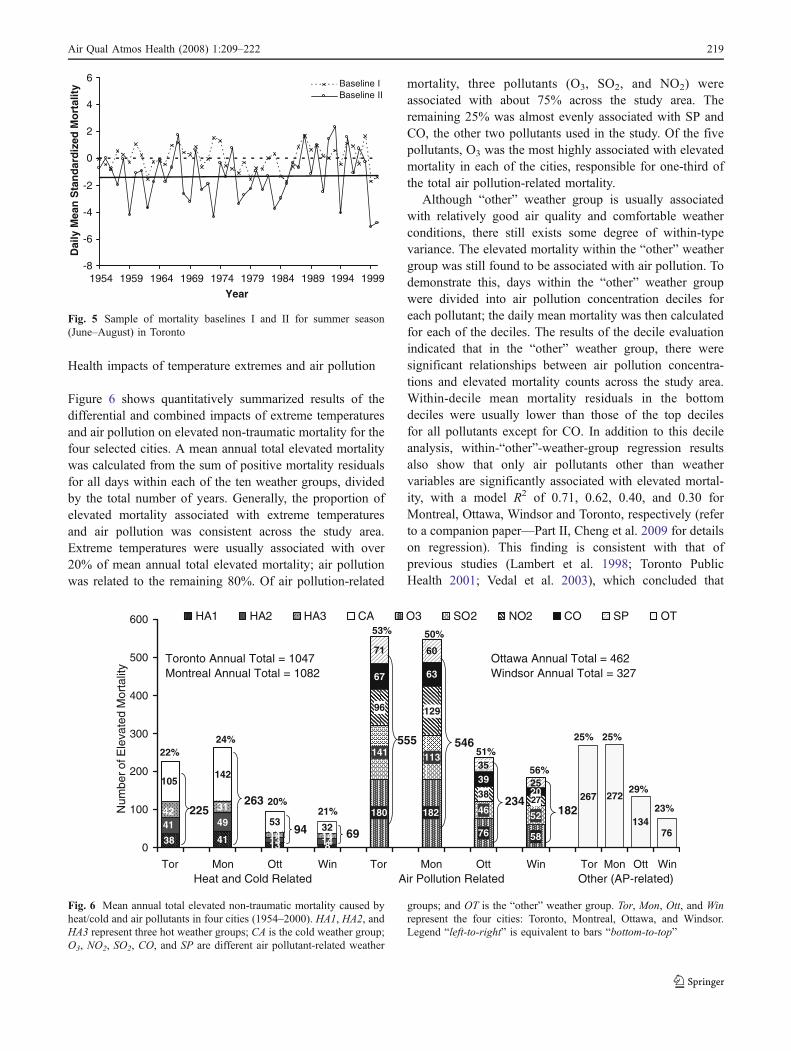
The inter-annual upward trends over time for total non-traumatic mortality (mortality baseline I) shown in Fig. 2were removed to minimize confounding influences of non-environmental factors (e.g., increases in total populationand changes in population age structure). However, toquantitatively assess elevated mortality (above the baseline)associated with extreme temperatures and air quality, themortality baseline I needs to be modified. Followingdetermination of the ten weather groups, mortality baselineI can be adjusted to develop baseline II using only the “other”weather group. In fact, some low-frequency weather types notshown in Table 4, which were identified as “other,” were alsoincluded in the development of baseline II. Baseline II wasdeveloped by calculating the within-“other”-weather-groupmean mortality from anomalous data against baseline I foreach 3-month season (December–February, March–May,June–August, September–November). As shown in Fig. 5for Toronto as an example (similar results were discovered inother cities), baseline II was lower than baseline I sincebaseline I includes all days (including hot/cold/high airpollution episodes) in its construction. The differencebetween two baselines that represents part of the extremetemperatures and air pollution effects, which was removedfrom baseline I, should be added back to the elevated
mortality. As a result, the baseline II can represent normal ornatural deaths without the effects of extreme temperaturesand air pollution. A positive mortality residual (abovebaseline II) should represent the elevated mortality associatedwith extreme temperatures and air pollution. A negativemortality residual (below baseline II) indicates a situationwith no elevated mortality relative to extreme temperaturesand air pollution. When within-weather-type annual anddaily mean elevated mortalities were calculated, the dailynegative mortality residual was set as zero.
The advantage of using the mortality baseline, as derivedfor the current study, is its enhancement of the relationshipbetween extreme temperatures/air pollution and mortality. Itcould also minimize the confounding impacts of non-environmental factors such as population increase andimprovements to health care and living/economic condi-tions. In the health studies, mortality rates were often usedto remove the impacts of population growth. When long-term health data (e.g., ten-year spans of data records ormore) are considered, it is insufficient to remove onlypopulation effects from mortality data so as to analyzehealth impacts of air pollution and extreme temperatures.To demonstrate this, population census data were used andtested to calculate mortality rates for the selected four cities.To effectively remove impacts of population increase andchanges in population age structure, an elderly population(≥65 years) was used. According to the results, thereappears to be a significant downward trend in mortalityrates for each of the cities, due to improvements to healthcare and living/economic conditions (e.g., use of airconditioning). On average, across the selected four cities,daily mean mortality rates per 100,000 elderly people wereabout 30 in the early 1950s, dropping to 15 by the year2000. For reliable, long-term, time-series health data, thisdownward trend should also be removed in order to preventthese non-environmental factors from influencing results.
12.0 11.2 9.7 9.1
16.7 16.9 17.6 18.1
5.7 8.6 6.6 6.06.1
7.6 7.4 8.2
12.7 8.0 9.9 8.2
10.8 9.113.5 15.6
28.1 30.926.6 24.0
2.1 2.4 2.3 2.34.12.82.73.2
4.43.62.62.7
0%
10%
20%
30%
40%
50%
60%
70%
80%
90%
100%
Montreal Ottawa Toronto Windsor
OT
SO2
NO2
SP
CO
O3
CA
HA3
HA2
HA1
Fig. 4 Percentage occurrence ofthe ten weather groups in thefour cities (HA1, HA2, and HA3represent the three hot weathergroups; CA is the cold weathergroup; O3, NO2, SO2, CO, andSP are different pollutant-relatedweather groups; and OT is the“other” or comfortable weathergroup)
218 Air Qual Atmos Health (2008) 1:209–222
Health impacts of temperature extremes and air pollution
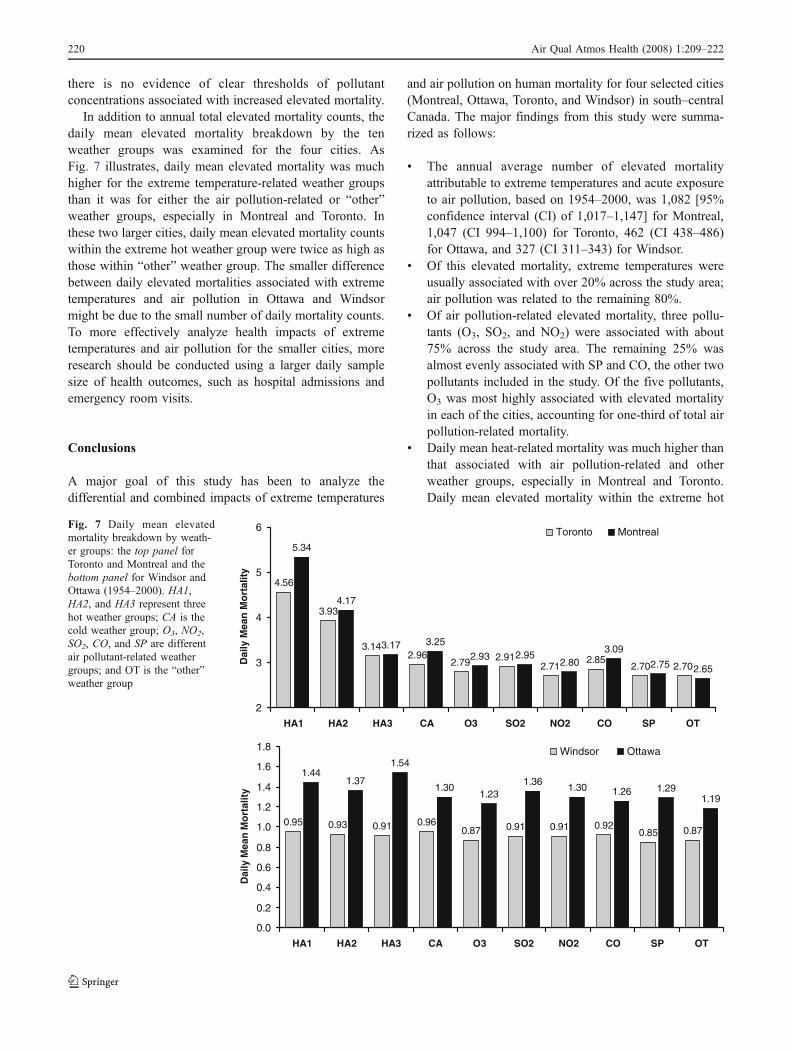
Figure 6 shows quantitatively summarized results of thedifferential and combined impacts of extreme temperaturesand air pollution on elevated non-traumatic mortality for thefour selected cities. A mean annual total elevated mortalitywas calculated from the sum of positive mortality residualsfor all days within each of the ten weather groups, dividedby the total number of years. Generally, the proportion ofelevated mortality associated with extreme temperaturesand air pollution was consistent across the study area.Extreme temperatures were usually associated with over20% of mean annual total elevated mortality; air pollutionwas related to the remaining 80%. Of air pollution-related
mortality, three pollutants (O3, SO2, and NO2) wereassociated with about 75% across the study area. Theremaining 25% was almost evenly associated with SP andCO, the other two pollutants used in the study. Of the fivepollutants, O3 was the most highly associated with elevatedmortality in each of the cities, responsible for one-third ofthe total air pollution-related mortality.
Although “other” weather group is usually associatedwith relatively good air quality and comfortable weatherconditions, there still exists some degree of within-typevariance. The elevated mortality within the “other” weathergroup was still found to be associated with air pollution. Todemonstrate this, days within the “other” weather groupwere divided into air pollution concentration deciles foreach pollutant; the daily mean mortality was then calculatedfor each of the deciles. The results of the decile evaluationindicated that in the “other” weather group, there weresignificant relationships between air pollution concentra-tions and elevated mortality counts across the study area.Within-decile mean mortality residuals in the bottomdeciles were usually lower than those of the top decilesfor all pollutants except for CO. In addition to this decileanalysis, within-“other”-weather-group regression resultsalso show that only air pollutants other than weathervariables are significantly associated with elevated mortal-ity, with a model R2 of 0.71, 0.62, 0.40, and 0.30 forMontreal, Ottawa, Windsor and Toronto, respectively (referto a companion paper—Part II, Cheng et al. 2009 for detailson regression). This finding is consistent with that ofprevious studies (Lambert et al. 1998; Toronto PublicHealth 2001; Vedal et al. 2003), which concluded that
-8
-6
-4
-2
0
2
4
6
1954 1959 1964 1969 1974 1979 1984 1989 1994 1999
Year
Dai
ly M
ean
Sta
nd
ard
ized
Mo
rtal
ity Baseline I
Baseline II
Fig. 5 Sample of mortality baselines I and II for summer season(June–August) in Toronto
418
49
14
31
14
142
53 32 76 58
141 113
46 52
96 129
38
67 63
3920
71 60
35
25267 272
13476
38
4142
105
18218027
0
100
200
300
400
500
600
Tor Mon Ott Win Tor Mon Ott Win Tor Mon Ott Win
Num
ber o
f Ele
vate
d M
orta
lity
HA1 HA2 HA3 CA O3 SO2 NO2 CO SP OT
Heat and Cold Related Air Pollution Related Other (AP-related)
225263
94 69
555 546
234182
Toronto Annual Total = 1047Montreal Annual Total = 1082
Ottawa Annual Total = 462Windsor Annual Total = 327
22%24%
20%21%
53% 50%
51%
56%
29%
23%
25% 25%
131314
Fig. 6 Mean annual total elevated non-traumatic mortality caused byheat/cold and air pollutants in four cities (1954–2000). HA1, HA2, andHA3 represent three hot weather groups; CA is the cold weather group;O3, NO2, SO2, CO, and SP are different air pollutant-related weather
groups; and OT is the “other” weather group. Tor, Mon, Ott, and Winrepresent the four cities: Toronto, Montreal, Ottawa, and Windsor.Legend “left-to-right” is equivalent to bars “bottom-to-top”
Air Qual Atmos Health (2008) 1:209–222 219
there is no evidence of clear thresholds of pollutantconcentrations associated with increased elevated mortality.
In addition to annual total elevated mortality counts, thedaily mean elevated mortality breakdown by the tenweather groups was examined for the four cities. AsFig. 7 illustrates, daily mean elevated mortality was muchhigher for the extreme temperature-related weather groupsthan it was for either the air pollution-related or “other”weather groups, especially in Montreal and Toronto. Inthese two larger cities, daily mean elevated mortality countswithin the extreme hot weather group were twice as high asthose within “other” weather group. The smaller differencebetween daily elevated mortalities associated with extremetemperatures and air pollution in Ottawa and Windsormight be due to the small number of daily mortality counts.To more effectively analyze health impacts of extremetemperatures and air pollution for the smaller cities, moreresearch should be conducted using a larger daily samplesize of health outcomes, such as hospital admissions andemergency room visits.
Conclusions
A major goal of this study has been to analyze thedifferential and combined impacts of extreme temperatures
and air pollution on human mortality for four selected cities(Montreal, Ottawa, Toronto, and Windsor) in south–centralCanada. The major findings from this study were summa-rized as follows:
& The annual average number of elevated mortalityattributable to extreme temperatures and acute exposureto air pollution, based on 1954–2000, was 1,082 [95%confidence interval (CI) of 1,017–1,147] for Montreal,1,047 (CI 994–1,100) for Toronto, 462 (CI 438–486)for Ottawa, and 327 (CI 311–343) for Windsor.
& Of this elevated mortality, extreme temperatures wereusually associated with over 20% across the study area;air pollution was related to the remaining 80%.
& Of air pollution-related elevated mortality, three pollu-tants (O3, SO2, and NO2) were associated with about75% across the study area. The remaining 25% wasalmost evenly associated with SP and CO, the other twopollutants included in the study. Of the five pollutants,O3 was most highly associated with elevated mortalityin each of the cities, accounting for one-third of total airpollution-related mortality.
& Daily mean heat-related mortality was much higher thanthat associated with air pollution-related and otherweather groups, especially in Montreal and Toronto.Daily mean elevated mortality within the extreme hot
4.56
3.93
3.142.96
2.79 2.912.71
2.852.70 2.70
5.34
4.17
3.17 3.25
2.93 2.952.80
3.09
2.75 2.65
2
3
4
5
6
HA1 HA2 HA3 CA O3 SO2 NO2 CO SP OT
Dai
ly M
ean
Mo
rtal
ity
Toronto Montreal
0.95 0.93 0.91 0.960.87 0.91 0.91 0.92
0.85 0.87
1.441.37
1.54
1.301.23
1.361.30 1.26 1.29
1.19
0.0
0.2
0.4
0.6
0.8
1.0
1.2
1.4
1.6
1.8
HA1 HA2 HA3 CA O3 SO2 NO2 CO SP OT
Dai
ly M
ean
Mo
rtal
ity
Windsor Ottawa
Fig. 7 Daily mean elevatedmortality breakdown by weath-er groups: the top panel forToronto and Montreal and thebottom panel for Windsor andOttawa (1954–2000). HA1,HA2, and HA3 represent threehot weather groups; CA is thecold weather group; O3, NO2,SO2, CO, and SP are differentair pollutant-related weathergroups; and OT is the “other”weather group
220 Air Qual Atmos Health (2008) 1:209–222
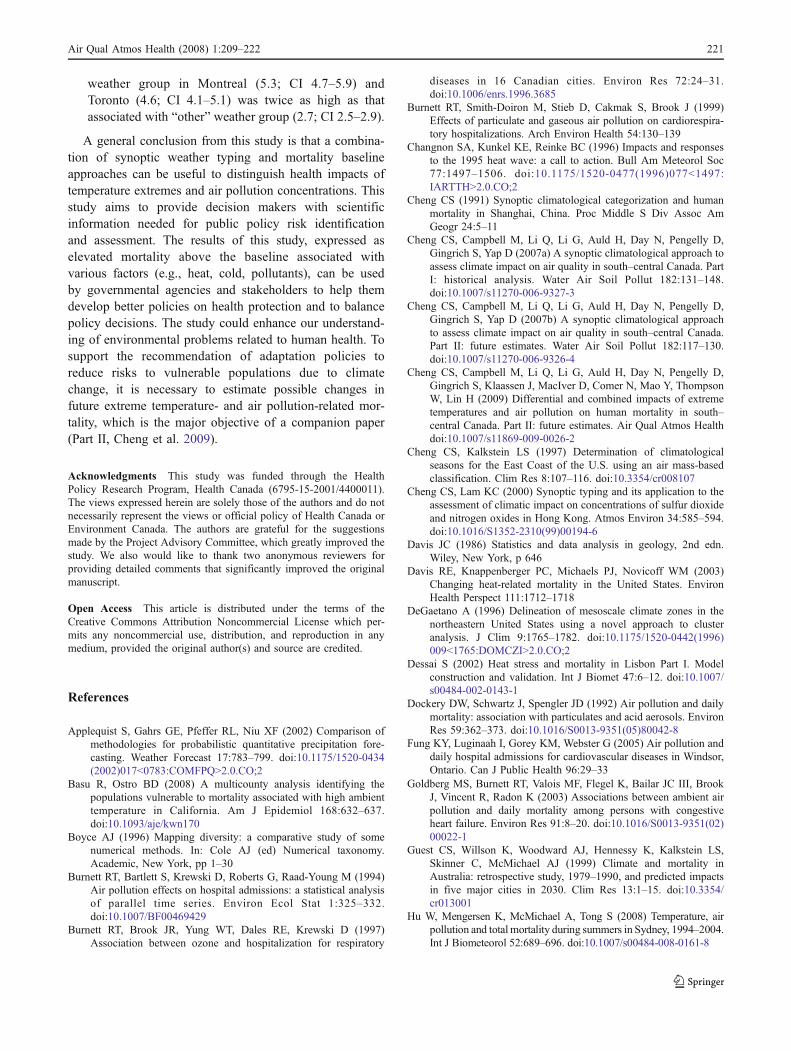
weather group in Montreal (5.3; CI 4.7–5.9) andToronto (4.6; CI 4.1–5.1) was twice as high as thatassociated with “other” weather group (2.7; CI 2.5–2.9).
A general conclusion from this study is that a combina-tion of synoptic weather typing and mortality baselineapproaches can be useful to distinguish health impacts oftemperature extremes and air pollution concentrations. Thisstudy aims to provide decision makers with scientificinformation needed for public policy risk identificationand assessment. The results of this study, expressed aselevated mortality above the baseline associated withvarious factors (e.g., heat, cold, pollutants), can be usedby governmental agencies and stakeholders to help themdevelop better policies on health protection and to balancepolicy decisions. The study could enhance our understand-ing of environmental problems related to human health. Tosupport the recommendation of adaptation policies toreduce risks to vulnerable populations due to climatechange, it is necessary to estimate possible changes infuture extreme temperature- and air pollution-related mor-tality, which is the major objective of a companion paper(Part II, Cheng et al. 2009).
Acknowledgments This study was funded through the HealthPolicy Research Program, Health Canada (6795-15-2001/4400011).The views expressed herein are solely those of the authors and do notnecessarily represent the views or official policy of Health Canada orEnvironment Canada. The authors are grateful for the suggestionsmade by the Project Advisory Committee, which greatly improved thestudy. We also would like to thank two anonymous reviewers forproviding detailed comments that significantly improved the originalmanuscript.
Open Access This article is distributed under the terms of theCreative Commons Attribution Noncommercial License which per-mits any noncommercial use, distribution, and reproduction in anymedium, provided the original author(s) and source are credited.
References
Applequist S, Gahrs GE, Pfeffer RL, Niu XF (2002) Comparison ofmethodologies for probabilistic quantitative precipitation fore-casting. Weather Forecast 17:783–799. doi:10.1175/1520-0434(2002)017<0783:COMFPQ>2.0.CO;2
Basu R, Ostro BD (2008) A multicounty analysis identifying thepopulations vulnerable to mortality associated with high ambienttemperature in California. Am J Epidemiol 168:632–637.doi:10.1093/aje/kwn170
Boyce AJ (1996) Mapping diversity: a comparative study of somenumerical methods. In: Cole AJ (ed) Numerical taxonomy.Academic, New York, pp 1–30
Burnett RT, Bartlett S, Krewski D, Roberts G, Raad-Young M (1994)Air pollution effects on hospital admissions: a statistical analysisof parallel time series. Environ Ecol Stat 1:325–332.doi:10.1007/BF00469429
Burnett RT, Brook JR, Yung WT, Dales RE, Krewski D (1997)Association between ozone and hospitalization for respiratory
diseases in 16 Canadian cities. Environ Res 72:24–31.doi:10.1006/enrs.1996.3685
Burnett RT, Smith-Doiron M, Stieb D, Cakmak S, Brook J (1999)Effects of particulate and gaseous air pollution on cardiorespira-tory hospitalizations. Arch Environ Health 54:130–139
Changnon SA, Kunkel KE, Reinke BC (1996) Impacts and responsesto the 1995 heat wave: a call to action. Bull Am Meteorol Soc77:1497–1506. doi:10.1175/1520-0477(1996)077<1497:IARTTH>2.0.CO;2
Cheng CS (1991) Synoptic climatological categorization and humanmortality in Shanghai, China. Proc Middle S Div Assoc AmGeogr 24:5–11
Cheng CS, Campbell M, Li Q, Li G, Auld H, Day N, Pengelly D,Gingrich S, Yap D (2007a) A synoptic climatological approach toassess climate impact on air quality in south–central Canada. PartI: historical analysis. Water Air Soil Pollut 182:131–148.doi:10.1007/s11270-006-9327-3
Cheng CS, Campbell M, Li Q, Li G, Auld H, Day N, Pengelly D,Gingrich S, Yap D (2007b) A synoptic climatological approachto assess climate impact on air quality in south–central Canada.Part II: future estimates. Water Air Soil Pollut 182:117–130.doi:10.1007/s11270-006-9326-4
Cheng CS, Campbell M, Li Q, Li G, Auld H, Day N, Pengelly D,Gingrich S, Klaassen J, MacIver D, Comer N, Mao Y, ThompsonW, Lin H (2009) Differential and combined impacts of extremetemperatures and air pollution on human mortality in south–central Canada. Part II: future estimates. Air Qual Atmos Healthdoi:10.1007/s11869-009-0026-2
Cheng CS, Kalkstein LS (1997) Determination of climatologicalseasons for the East Coast of the U.S. using an air mass-basedclassification. Clim Res 8:107–116. doi:10.3354/cr008107
Cheng CS, Lam KC (2000) Synoptic typing and its application to theassessment of climatic impact on concentrations of sulfur dioxideand nitrogen oxides in Hong Kong. Atmos Environ 34:585–594.doi:10.1016/S1352-2310(99)00194-6
Davis JC (1986) Statistics and data analysis in geology, 2nd edn.Wiley, New York, p 646
Davis RE, Knappenberger PC, Michaels PJ, Novicoff WM (2003)Changing heat-related mortality in the United States. EnvironHealth Perspect 111:1712–1718
DeGaetano A (1996) Delineation of mesoscale climate zones in thenortheastern United States using a novel approach to clusteranalysis. J Clim 9:1765–1782. doi:10.1175/1520-0442(1996)009<1765:DOMCZI>2.0.CO;2
Dessai S (2002) Heat stress and mortality in Lisbon Part I. Modelconstruction and validation. Int J Biomet 47:6–12. doi:10.1007/s00484-002-0143-1
Dockery DW, Schwartz J, Spengler JD (1992) Air pollution and dailymortality: association with particulates and acid aerosols. EnvironRes 59:362–373. doi:10.1016/S0013-9351(05)80042-8
Fung KY, Luginaah I, Gorey KM, Webster G (2005) Air pollution anddaily hospital admissions for cardiovascular diseases in Windsor,Ontario. Can J Public Health 96:29–33
Goldberg MS, Burnett RT, Valois MF, Flegel K, Bailar JC III, BrookJ, Vincent R, Radon K (2003) Associations between ambient airpollution and daily mortality among persons with congestiveheart failure. Environ Res 91:8–20. doi:10.1016/S0013-9351(02)00022-1
Guest CS, Willson K, Woodward AJ, Hennessy K, Kalkstein LS,Skinner C, McMichael AJ (1999) Climate and mortality inAustralia: retrospective study, 1979–1990, and predicted impactsin five major cities in 2030. Clim Res 13:1–15. doi:10.3354/cr013001
Hu W, Mengersen K, McMichael A, Tong S (2008) Temperature, airpollution and total mortality during summers in Sydney, 1994–2004.Int J Biometeorol 52:689–696. doi:10.1007/s00484-008-0161-8
Air Qual Atmos Health (2008) 1:209–222 221
Jolliffe IT (1986) Principal component analysis. Springer, New York,p 271
Judek S, Jessiman B, Stieb D, Vet R (2004) Estimated number ofexcess deaths in Canada due to air pollution. http://www.hc-sc.gc.ca/ahc-asc/media/nr-cp/2005/2005_32bk2_e.html (accessedFebruary 2008)
Kalkstein LS (1991) A new approach to evaluate the impact of climateon human mortality. Environ Health Perspect 96:145–150.doi:10.2307/3431223
Kalkstein LS, Greene JS (1997) An evaluation of climate/mortalityrelationships in large U.S. cities and the possible impacts of aclimate change. Environ Health Perspect 105:84–93.doi:10.2307/3433067
Kalkstein LS, Nichols MC, Barthel CD, Greene JS (1996) A newspatial synoptic classification: application to air-mass analysis.Int J Climatol 16:983–1004. doi:10.1002/(SICI)1097-0088(199609)16:9<983::AID-JOC61>3.0.CO;2-N
Kalkstein LS, Barthel CD, Ye H, Smoyer K, Cheng CS, Greene JS,Nichols MC, Kalkstein AJ (1997) The impacts of weather andpollution on human mortality. Publ In Clim L(1) p 41
Keatinge WR, Donaldson GC (2006) Heat acclimatization andsunshine cause false indications of mortality due to ozone.Environ Res 100:387–393. doi:10.1016/j.envres.2005.08.012
Lambert WE, Samet JM, Dockery DW (1998) Community airpollution. In: Rom WN (ed) Environmental and occupationalmedicine. Lippincott-Raven, Philadelphia, pp 1501–1522
McGregor GR, Watkin HA, Cox M (2004) Relationships between theseasonality of temperature and ischaemic heart disease mortality:implications for climate based health forecasting. Clim Res25:253–263. doi:10.3354/cr025253
Medina-Ramón M, Schwartz J (2007) Temperature, temperatureextremes, and mortality: a study of acclimatisation and effectmodification in 50 US cities. Occup Environ Med 64:827–833
Nichols MC, Kalkstein LS, Cheng CS (1995) Possible human healthimpacts of a global warming. World Resour Rev 7:77–103
OMA (2005) Illness costs of air pollution. ICAP Summary Report.Ontario Medical Association, Toronto, p 11
Pirard P, Vandentorren S, Pascal M, Laaidi K, Le Tertre A, CassadouS, Ledrans M (2005) Summary of the mortality impactassessment of the 2003 heat wave in France. Euro Surveill10:153–156
Pope CA III, Kalkstein LS (1996) Synoptic weather modeling andestimates of the exposure–response relationship between dailymortality and particulate air pollution. Environ Health Perspect104:414–420. doi:10.2307/3432686
Qian Z, He Q, Lin HM, Kong L, Bentley CM, Liu W, Zhou D (2008)High temperatures enhanced acute mortality effects of ambient
particle pollution in the “oven” City of Wuhan, China. EnvironHealth Perspect 116:1172–1178
Rainham DGC, Smoyer-Tomic KE (2003) The role of air pollution inthe relationship between a heat stress index and human mortalityin Toronto. Environ Res 93:9–19. doi:10.1016/S0013-9351(03)00060-4
Rocklöv J, Forsberg B (2008) The effect of temperature on mortalityin Stockholm 1998–2003: a study of lag structures and heatwaveeffects. Scand J Public Health 36:516–523. doi:10.1177/1403494807088458
Ross T, Lott N (2003) A Climatology of 1980–2003 Extreme Weatherand Climate Events. National Climate Data Center TechnicalReport No. 2003-01, p 14
Schwartz J (2000) Assessing confounding, effect modification, andthresholds in the association between ambient particles and dailydeaths. Environ Health Perspect 108:563–568. doi:10.2307/3454620
Schwartz J, Spix C, Wichmann HE, Malin E (1991) Air pollution andacute respiratory illness in five German communities. EnvironRes 56:1–14. doi:10.1016/S0013-9351(05)80104-5
Sheridan SC, Kalkstein LS (2004) Progress in heat watch-warningsystem technology. Bull Am Meteorol Soc 85:1931–1941.doi:10.1175/BAMS-85-12-1931
Shin HH, Stieb DM, Jessiman B, Goldberg MS, Brion O, Brook J,Ramsay T, Burnett RT (2008) A temporal, multicity model toestimate the effects of short-term exposure to ambient airpollution on health. Environ Health Perspect 116:1147–1153
Stieb DM, Burnett RT, Beveridge RC, Brook JR (1996) Associationbetween ozone and asthma emergency department visits in SaintJohn, New Brunswick, Canada. Environ Health Perspect104:1354–1360. doi:10.2307/3432974
Toronto Public Health (2001) Toronto air quality index health linksanalysis. Technical Report. Toronto Public Health, Toronto, p 40
Toronto Public Health (2004) Air pollution burden of illness inToronto: 2004 summary. Technical Report. Toronto PublicHealth, Toronto, p 19
Vedal S, Brauer M, White R, Petkau J (2003) Air pollution and dailymortality in a city with low levels of pollution. Environ HealthPerspect 111:45–51
Wong CM, Vichit-Vadakan N, Kan H, Qian Z, the PAPA ProjectTeams (2008) Public health and air pollution in Asia (PAPA): amulticity study of short-term effects of air pollution on mortality.Environ Health Perspect 116:1195–1202
World Health Organization (2004) Health aspects of air pollution:results from the WHO project “systematic review of health aspectsof air pollution in Europe.” World Health Organization, ReportE83080. WHO Regional Office for Europe, Copenhagen, p 24
222 Air Qual Atmos Health (2008) 1:209–222