Aid, social capital and village public goods: after the tsunami
54
Aid, social capital and village public goods: after the tsunami. Tiago Freire, Brown University J, Vernon Henderson, Brown University Ari Kuncoro, University of Indonesia * July 19, 2010 Abstract Using survey data on fishermen and fishing villages in Aceh, Indonesia from 2005 and 2007, this paper examines the effect of the December 2004 tsunami and resulting massive aid effort on local public good provision, in particular on public labor inputs, but also public capital choices. Also analyzed are the roles of and changes in local social and political institutions and participation in political and social activities. Such an examination informs not only our understanding of the impacts of aid on villages, but also our understanding of how villages allocate resources to pub- lic goods. For public labor inputs, volunteerism is lower in villages with more aid projects, but that is offset if the dominant donor mitigates agency problems by doing its own implementation. Volunteerism is lower in villages with more ’democratic’ activity such as elections, although that effect is mitigated in villages with higher levels of social capital pre-tsunami. Evidence suggests volunteerism is lower not because of changes in types of leaders with village elections per se, but rather due to heightened internal divisions associated with elections. Correspondingly for public capital, villages with more democratic activity combined with more aid projects tend to emphasize garnering private aid (e.g., houses) at the expense of public aid (e.g., public buildings). Keywords: Aid, Volunteer, Public Goods. JEL Classification Numbers: H41, O12. * We gratefully acknowledge the support of the National Science Foundation (SES 0416840), which made this project possible and continuing support from NIH (R01 HD057188). We thank Ifa Isfandiarni and Zakir Machmud of the University of Indonesia for their efforts in supervision of the survey. The work has benefited from helpful comments by Andy Foster and, for an early version of the paper, seminar participants at LSE, Berkeley, and Minnesota. 1
-
Upload
independent -
Category
Documents
-
view
4 -
download
0
Transcript of Aid, social capital and village public goods: after the tsunami

Aid, social capital and village public goods: after the tsunami.
Tiago Freire, Brown UniversityJ, Vernon Henderson, Brown UniversityAri Kuncoro, University of Indonesia ∗
July 19, 2010
Abstract
Using survey data on fishermen and fishing villages in Aceh, Indonesia from 2005 and 2007, this
paper examines the effect of the December 2004 tsunami and resulting massive aid effort on local
public good provision, in particular on public labor inputs, but also public capital choices. Also
analyzed are the roles of and changes in local social and political institutions and participation
in political and social activities. Such an examination informs not only our understanding of the
impacts of aid on villages, but also our understanding of how villages allocate resources to pub-
lic goods. For public labor inputs, volunteerism is lower in villages with more aid projects, but
that is offset if the dominant donor mitigates agency problems by doing its own implementation.
Volunteerism is lower in villages with more ’democratic’ activity such as elections, although that
effect is mitigated in villages with higher levels of social capital pre-tsunami. Evidence suggests
volunteerism is lower not because of changes in types of leaders with village elections per se, but
rather due to heightened internal divisions associated with elections. Correspondingly for public
capital, villages with more democratic activity combined with more aid projects tend to emphasize
garnering private aid (e.g., houses) at the expense of public aid (e.g., public buildings).
Keywords: Aid, Volunteer, Public Goods.
JEL Classification Numbers: H41, O12.
∗We gratefully acknowledge the support of the National Science Foundation (SES 0416840), which made thisproject possible and continuing support from NIH (R01 HD057188). We thank Ifa Isfandiarni and Zakir Machmud ofthe University of Indonesia for their efforts in supervision of the survey. The work has benefited from helpful commentsby Andy Foster and, for an early version of the paper, seminar participants at LSE, Berkeley, and Minnesota.
1

1 Introduction
The December 2004 tsunami in the Indian Ocean devastated coastal cities and villages of Aceh,
Indonesia. In coastal areas, well over half the population died and almost all physical capital was
destroyed: housing, boats, schools, and local health clinics. Local fishermen’s credit unions and
their records were wiped out. The destruction and ensuing publicity resulted in a truly massive aid
effort, involving a multitude of varied NGOs descending on local villages. Beyond the initial clean-
up efforts, the infusion of aid replaced almost all lost capital for the remaining populationhouses,
boats and public buildings within two and a half years. When the official aid process ended April 16,
2009, there was still $250m left over1, in a context where, despite massive loss of life and households,
aid gave 134,000 houses for 120,000 houses destroyed2. While this infusion of aid helped villagers
restore their livelihoods it also presented village elites with an array of proposals on how to invest
in villages. It has also presented challenges to village life in a conservative, isolated society: an
invasion of foreigner NGOs, culture, and ideas about how to revamp village institutions.
Besides the effects of the devastation and the ensuing aid, there is a third element which is central
to any evaluation of village life post-tsunami. For the previous 20 years Aceh had experienced an
insurgency movement with a strong degree of support from the Acehnese population. The national
government imposed effective military rule, with villages caught in the struggle between the army
and the insurgents. Elections in villages were generally suspended. Village heads were chosen and
certified by the sub-district (kecematan) government, in close consultation with the village council
of elders (tuhapuet), who represent the elites in the village. Being an active leader as village head in
this time of conflict was dangerous, and some village heads were more low-key figureheads, at best
representing interests of village elites. The tsunami and resulting aid process prompted settlement
of the insurgency. After settlement, for villages, there were major election reforms fully enacted
by early 2006. While reforms mandated local democratic elections, as we will see below, in many
villages, elections never happened with elites remaining in control.
Using data from 199 villages, this paper examines the effect of the tsunami, the massive aid effort,
1Jakarta Globe March 2, 20092Xinhua News Service, February 1, 2009
2
and democratic reforms on one aspect of village life: village public goods. The main (input into)
public good(s) we look at is volunteer public labor, in the form of ”Islamic volunteer days”. These are
half days called by the village head, where adult village males assemble to do public work typically
three times a month pre-tsunami. Villages have no paid public workers who provide public services,
such as maintenance of village lands, village shoreline and aquaculture channels, public buildings
and infrastructure. Such construction and maintenance are accomplished through volunteer labor
days.
We will show that the aid effort and specific aspects of aid delivery affect the traditional providing
village public labor inputs. Certain modes of aid delivery seem consistent with maintenance of
village traditions, while others have deleterious effects. Of course villages are heterogeneous pre-
tsunami; some had more social interaction and cohesion - or greater stocks of ”social capital”.
Villages with higher levels of social capital pre-tsunami do a better job of maintaining traditions,
as might be expected. A surprising finding to us is that democratization and whether villages have
elections or not also have a large effect on public labor. In particular, elections are associated with
reduced public labor and the paper models why that might be the case in the specific political and
aid context in Aceh. However, the effect of elections is strongly mediated by pre-existing social
capital, with the negative effect of elections mostly offset in villages with more social capital.
Besides public labor inputs, at the end of the paper, we will look at village acquisition of public
buildings post-tsunami. We will see, albeit more weakly, that the same patterns in the data will
appear for relevant public buildings.
How does this examination fit into the literature? There are three relevant literatures, on aid, social
capital, and democratization. The large literature on the efficacy of aid and best ways to deliver
aid discusses conditionality and agency questions (Collier et al. [1997], Azam and Laffont [2003],
Svensson [2003], and Murrell [2002]), strategic considerations (the Samaritans dilemma in Persson
and Tabellini [2000] and Torsvik [2005]), co-ordination across agencies, village ”ownership” of the
process and the like (e.g., Kanbur et al. [1999], Easterly [2003], and Paul [2005]). Some of this
literature does not bear directly on this paper. The aid process in Aceh was mostly unconditional
3

and largely uncoordinated. Lack of conditionality even at the village level was driven by the huge
number of NGOs ”competing” to deliver aid, in a context with little co-ordination. The government
agency overseeing the process, BRR3, largely defined its role as (1) a clearing house recording aid
and recommending, if asked, where an NGO might focus aid and (2) late in the process filling in ex
post gaps in aid. Given a lack of conditionality and co-ordination, our focus from this literature will
be on the effect of aid provision on local public goods and village-level agency issues in aid delivery.
Our findings are in line with Svensson [2000], which suggests that increased aid may lead to a decline
in public good provision, in part because individuals spend more effort lobbying for private aid for
themselves, as opposed to public goods. In our case, while that may be a factor, the reduction in
volunteerism we observe is largely post-aid delivery. Knack and Rahman [2007] further argue that
having more donors may erode local bureaucratic quality and capacity, which could reduce villagers’
incentives to invest in public goods and the ability of remaining leaders to marshal public effort.
Besides this problem, we also examine the degree of inferred monitoring and NGO involvement in
the aid delivery process, which affects the volume of disputes and villager time spent dealing with
low quality aid.
Second is the role of social capital. Sobel [2002] suggests that outcomes are affected by the stock
of social capital, which may make cooperative outcomes more sustainable. In an empirical pa-
per that tangentially relates to this paper, Labonne and Chase [2008] examine community driven
development programs in the Philippines. They find that in villages where such programs are as-
signed, compared to the control group, people spend more time ”lobbying” for benefits and less
time participating in social-network activities. That is, investment in social capital declines with
aid.
Third, political economy models suggest the form of village political institutions may have a strong
effect on outcomes (Persson and Tabellini [2000]). For example, Foster and Rosenzweig [2001] argue
that a greater degree of democracy leads to greater provision of public goods of more universal
appeal, although Acemoglu and Robinson [2006] question the effect of greater democratization.
The work in Munshi and Rosenzweig [2008] suggests that changes in political institutions may
3Executing Agency for the Rehabilitation and Reconstruction of Aceh and Nias
4
result in villagers seeking different types of leaders in a Besley and Coate [1997] citizen-candidate
framework. Our analysis will be specific to the situation in Aceh. The model will examine under
what circumstances traditional elites remain in control of a village, versus there are elections in
which case existing village heads are replaced by different types of leaders.
2 Data and Context
In this section, we give a description of our data and the contextextent of destruction, extent of
aid, social capital, changes in participation in village activities, and elections.
2.1 Data
In summer and fall 2005, we surveyed village heads and local heads of the fishermen’s association
(Panglima Laot) in 111 fishing villages. In summer and fall 2007, we resurveyed the 111 villages
and added another 88 villages, which were further away from the capital Banda Aceh, and were
inaccessible in 2005. We also surveyed 540 fishing families in 2005 in 72 villages (about 25% of pre-
tsunami boat owners and 45% of surviving boat owners in these villages) and added more fishermen
in 2007, covering fishermen in an additional 26 villages. Our focus in this paper is on the village
survey although we will draw from the fishermen’s survey to bolster specific points.
For the 199 villages, the intent was to cover the universe of fishing villages, defined as all villages
with a significant fishing presence pre-tsunami as certified by Panglima Laot, in three contiguous
districts (Banda Aceh, Aceh Jaya, and Aceh Besar) as we move south and north-east of Banda
Aceh. In addition we covered the fishing villages in two other districts, up to a defined geographic
limit moving east from Banda Aceh into Pidie (the last sub-district surveyed is Meurah Dua) and
moving south into Aceh Barat (the last sub-district surveyed is Meuruebo). These include villages
on islands offshore for these districts. The data now cover 31 sub-districts in the 5 districts. All our
villages were affected by the tsunami; and, in fact, there are no unaffected fishing villages, within
the same local cultural area. Some, such as those in Pidie, were more protected and lost more in
5

the way of boats but little or no housing and population.
Figure 1 shows a map of the survey area, with a blow-up (left side in figure) of the Banda Aceh area
and another blow-up are of the Pidie zone (right side of the figure). The map shows population
survival rates by village (light grey being the worst). Unfortunately, the map is based on the
government rendering, post-tsunami, of village boundaries. In that dimension the map is grossly
inaccurate. We took GPS readings of the center (the mosque) of the living area of each village. In
only 6% of the cases is that GPS reading within the village boundaries. In 15% of the cases, it is
over 10 kilometers away. Coastal villages are drawn as non-coastal and vice-versa which explains
why, in parts of the map, a light grey (low survival) village may be shown next to a supposed coastal
village which is dark (high survival). Nevertheless the map pictures the general survey area.
The village survey asks questions about education, experience, and survival of village and religious
leaders; population composition by sex and age both before and after the tsunami; occupational
structure; destruction of village lands, seawalls, aquaculture areas, docking areas and mangroves;
pre- and post-tsunami data on political, legal, and social institutions; pre and post tsunami informa-
tion on physical capital (houses, boats, public buildings); detailed information on initial and ongoing
operations of NGOs, local governments, and relief agencies providing housing, boats, public build-
ings and restoration of the coast line; and detailed information on the village fishing industry pre-
and post-tsunami, including questions on marketing, fishing fleet composition, catch composition
and boat replacement.
2.2 Destruction and aid in fishing villages
Table 10 presents an overview of destruction and house aid in our villages, where house aid accounts
for much of overall aid within the village. There are two samples: in the first column, numbers are
reported for 104 villages we surveyed in 2005 for which we have complete 2005 and 2007 information
on a variety of characteristics, as well as official government data pre and post tsunami on village
households and population. Column 2 reports on 190 villages where there is a complete informa-
tion requirement for 2007, as well as official government data. Government data on pre-tsunami
6
populations is problematic, given limited survey conditions during the secessionist period; but the
post-tsunami reporting is much better.
Key information in Table 10 is as follows. The survival rate of households is about 58% as reported
in our 2005 survey - that is 42% of households are effectively wiped out, meaning no surviving
independent adults. The survival rate of population from our 2005 survey is 45%, similar to the
government official survival rate of 49% for those villages. We also calculated survival rates for
all 190 villages, using pre-tsunami reported numbers in our 2007 survey versus government post-
tsunami numbers (from the 2006 PODES carried out in 2005). For this, new village heads must
recollection pre-tsunami numbers in 2007. Population numbers have many missing values and
others are ”noisy”. Household (and house) counts are better recollected and for those we calculate
a survival rate of 55% for the 190 villages, similar to the number from 2005 of 58% in 104 villages.
Almost all houses were destroyed in fishing villages. If we add together surviving houses and the
number of permanent houses given in aid, relative to the number of surviving households, there are
now 1.08 permanent houses per surviving household according to our household count, as opposed
to the government post-tsunami count which suggests even more houses per household. In addition,
some the houses reported as ”temporary” by villages may be viewed as permanent by aid agencies.
Regardless, in the aggregate, private house aid looks pretty complete, although the relative amount
of aid given varies across village. And villages have had new family formation as people remarry
and young adults move out of the house, which has prompted village calls for more housing aid.
The other major private good is boats. For the villages surveyed in 2005 the survival rate of boats
is under 6% (not in table). Numbers of pre-tsunami boats reported in 2007 seem inflated by aid
claims (in the face of no proper documentation). So to calculate replacement rates, we calculate the
ratio of boats on the water in 2007 to captains surviving in 2005 for the villages where we have this
information. That yields a 105% replacement rate, indicating that boats overall have been replaced.
We note that unlike housing, many boats were bought privately. Boats given in aid per se show a
99% replacement rate, although as we note later about 25% of boats given in aid in our villages
were useless (not on the water) for fishing.
7
Table 2 shows the aid effort from a different perspective: the count of aid agencies which a village
faces. We identified the agencies involved, as perceived by a village, in provision of houses, boats,
seven types of public buildings discussed later, and replacement of the coast line (seawall, mangroves,
trees, etc). The median and average number of agencies listed as being in villages is about 7 - seven
different NGOs with which a village head needs to negotiate with and co-ordinate. That number
masks a much larger array of donors behind the process and a much larger array of on-the-ground
contractors who are sub-contracted to do construction, as well as NGOs involved in village planning
and advocacy. In our 198 villages overall, 117 different agencies are named by village leaders (where
we did some consolidation of NGOs named, which have different organizational sub-divisions); and
57 different aid agencies are named as providing housing. In over half the villages, 85% or more of
house aid is provided by one agency as reported by village leaders, so there is some degree of NGO
specialization within villages.
Besides the different agencies reported in our survey, the government working with the UN has
recorded aid delivery aspects in the ”RAN” 4. Government numbers which cover a larger scope of
forms of aid (including soft aid) indicate that there were 11 different ”first level implementers” per
village. A first level implementer is an agency who may also be the donor which takes the lead
in implementing an aid project in village. Perhaps more relevant to our work, the RAN database
identifies the number of different, officially recorded aid projects in a village (each, in principle,
negotiated separately). The mean and median are both about 30.
For later reference, we note that, in 97 villages, the largest housing provider reported by the village
in our survey is a ”donor-implementer”, where that definition is based on information in the RAN
database. A donor-implementer is a donor agency that, in at least 30% of the villages where it
provides housing in our villages according to RAN is also acting as the (first level) implementer in
the project, either directly hiring the labor to be used in construction, or else monitoring any sub-
contractors5. Although we drew a 30% cutoff, almost all agencies we classify as donor-implementers
are always both donor and implementer. If the implementer and donor are the same that helps solve
4Recovery Aceh-Nias database - http://rand.brr.go.id/RAND/reference5In some cases an NGO has multiple projects in the same village. We require for at least one of those they are
both the donor and implementor.
8
the donor’s agency problem of monitoring and motivating an implementer. Donor-implementers
typically have on the ground operations with central offices in Banda Aceh, and large teams of
trained people in the field.
When our villages report a housing provider that is either just a donor or implementer in the RAN
database, there is a ”disconnect”. When the named agency is a donor, then at least that donor is
recognizable to the villagers. But these donors have to hire implementers, and typically have little
on the ground capacity to monitor implementation at key stages of the project. If a village names
an implementer, it seems likely there is an even greater disconnect either the donor is so removed
as to be invisible or the implementer represents a set of multiple donors who have no on-the-ground
presence in Aceh.
We note two examples of what happens if donors are not also implementers. For some non donor-
implementers such as Oxfam and the American Red Cross, villages report that over 13% of houses-
in-aid from these agencies are abandoned or uninhabited (due to poor construction). For boats,
while overall the abandonment rate is about 25%, major non-implementer donors like Oxfam and
the International Medical Corps have extremely high proportions (respectively 83 and 65%) of
unusable boats. Below we will examine regressions for rates of abandoned houses and boats.
In our defined set of donor-implementers, we separate out BRR, the government reconstruction
agency, from regular NGOs. BRR tends to use a top-down approach, rather than ground-up in
dealing with villages and has been plagued with accusations of corruption. While in principle BRR
could monitor its own activities, in reality it seems not to; and its effects on village life are very
different than other NGO donor-implementers.
2.3 Elections
Pre-tsunami, elections in villages had been suspended for years, with the villages typically run by
elites with a nominal village head, appointed by the sub-district government, in consultation with
the local council of ”elders”. Post-tsunami there were major election reforms enacted by early 2006.
Reforms attempted to democratize the tuhapuet ; but also gave the tuhapeut even more power.
9
Tuhapeuts certify the village head to the sub-district government and are responsible for organizing
elections, often prompted by the sub-district government. Council members are now supposed to
be elected, can only serve two 6 year consecutive terms, and are supposed to have some female
members. However, typically, such ”elections” involve a post-prayer meeting at the mosque with a
show of hands. A post-prayer meeting means only men are present. A show of hands means elites
are likely to dominate, where non-elites may feel constrained in revealing preferences, because of
the informal debt relationships in the village, as well as simply status.
Election reforms in 2006 mandated that villages should call elections then. This is the time period
when the entire distribution of physical capital in the villages was up for grabs, so these would
be the biggest elections stakes any village could face. By postponing elections with the consent of
the tuhapeut, an elite group can retain power during this critical period. But elections can only be
postponed if the sub-district government is not facing major complaints, written and verbal, from
villagers about the behavior of the village head and his cronies. There has been a lot written about
replacing such village heads because of complaints and unrest in the villages. When elections are
called, the old village head almost never is reelected.
Table 10 gives some basic facts about elections. While 65% of villages have post-tsunami elections,
if the old village head died an election occurs 85% of the time versus only 59% if the village head
survives. If the village head lives and an election is called, the old village head is reelected only 17%
of the time. Elections generally mean the old head is replaced. If there is no election and the old
village head survives, in 89% of the cases he remains the village head. There are only a few villages
where the old head resigns or is forced out of office, absent an election. These facts help shape our
modeling.
There is another aspect in replacing old village heads with new. New ones are better educated,
as shown in the last row of Table 10; and later it will be important to distinguish election effects
on public goods from effects of changing education of the village head. Election reforms in some
districts proscribed that village heads should have a high school education or more. However in
districts with that proscription, tuhapuets can certify that either no such educated person is available
10
or that a village head with less than a high school education is ”qualified”. Only 41% of remaining
old village heads have high school or more, while 72% of new ones do, a difference that is significant
(t-statistic of 4.2). While some of this change could occur because of the education proscription, we
think that constraint is not binding and there are other reasons for the change. Apart from what
we learned in the field, in Table 10, in 2007, we note that old village heads, which are re-elected,
have relatively low education; and new village heads, which replace old ones without an election
have higher education.
Why would new village heads be better educated, regardless of any change in requirements? There
seem to be two aspects. First is a changing of the guard, as old elites are replaced, their younger
successors are simply better educated. Second, villagers when given the choice may want a better
educated head to negotiate with NGOs, especially given both language (speaking English) and
technical demands of many NGOs.
2.4 Village Life
Post-tsunami, measures of village social and community activities show a decline. The exception not
reported here concerns activities directly associated with aid lobbying. Lobbying activities includes
an enormous increase in the number of representatives a village sends to higher level meetings
(lagoon, district or provincial) of Panglima Laot, the traditional fishermen’s organization that post-
tsunami had considerable responsibility for the distribution of boat aid. Also, within the village,
from the fisherman’s survey, we know that the fraction of boat owners attending the traditional
village meeting of captains and owners increases from 62 to 68%. We start by looking at public
labor, our variable of focus.
Public Labor. The key outcome in this study is (Islamic) volunteer days, where the village head
calls so many volunteer (half) days for the month. Table 10 gives some basic numbers. The number
of villages regularly calling volunteer days each month declines dramatically post-tsunami, as does
the average number of days called per month for those having volunteer days. Our focus will not
be on the overall decline, but on the cross-village variation in public labor post-tsunami. We didn’t
11
ask individuals to recollect their pre-tsunami participation; but we note post-tsunami, 48% of our
matched households participated in volunteer work in the prior month.
Social capital. For activities representing investment in village ”social capital”, we have two main
items in our data. First rotating saving and credit associations (RoSCA), called arisan groups in
Indonesia, are popular. Such groups, usually composed of women meet regularly, with each member
contributing a fixed sum to a pot and then taking the pot on a rotating schedule. While, the original
theoretical work on such associations (Besley et al. [1994]) emphasized their role in alleviating
credit market imperfections, empirical work suggests a strong social component, with participation
rising with wealth and complementing (in terms of correlations) rather than substituting for credit
institutions, at least in Indonesia (Varadharajan [2004]). We view the existence of arisan groups
in a village as a measure of social capital, indicating cohesiveness. In 2005, an interesting aspect of
fieldwork was that, in a context where many female spouses died, male villagers identified women
as the social ”glue” which facilitated village unity and purpose. The second group activity also
involving females, but with more social pressure to participate, is Quran recitation. In Table 10 we
look at pre and post-tsunami participation in these two activities. We will interpret pre-tsunami
levels as reflecting differences in the degree of social capital. The tsunami seems to have reduced
these investments, presumably because of the trauma of the tsunami and the distraction of aid, but
these reductions are limited.
Table 10 shows the number of villages reporting the existence of arisan groups from village level
surveys. The table also reports individual pre-and post tsunami participation on a matched sample
of households reporting on pre-tsunami participation in 2005 and post-tsunami participation in 2007.
For the latter, we report for the whole sample. However many wives who would have participated
pre-tsunami in arisan groups died; and most household heads have since remarried. Thus we also
look at a sub-sample of households where the wife survived and there is an adult female present in
2007. Both the number of arisan groups and participation in arisan groups drops, but the drop is
only weakly significant for the larger individual sample.
For Quran recitation groups, most villages claim to have such a group pre and post tsunami,
12

which yields little cross-village variation in this measure. However post-tsunami participation of
households does fall significantly for both the overall household sample and the sub-sample of
surviving wives.
Finally in the table we report on two other potential social capital measures. One is the existence of
a non-bank credit union. There is the same number of villages with a credit union before as after,
although there are quite a few switches. Credit unions are less common, often complement the
existence of an arisan group, and are generally fishermen’s credit unions. They may reflect more
the strength of fishing in a village, rather than social capital. Finally, some villages have education
provided by a dayah or religious school. That choice should reflect religiosity rather than just social
capital per se. Note the persistence in dayah very few villages without dayah pre-tsunami get one,
while many villages where dayah were present replace theirs.
3 Modeling public labor provision
Our first set of empirical results will pertain to the role of social capital and aid delivery on public
goods. As reviewed earlier, the literature has models that deal with these considerations and they
are fairly straightforward. Thus we do not model them per se, although they will be considered
in extensions to the model we do develop. Absent in the literature is a model which examines the
effect on public labor of changes in political institutions as occurred in Aceh. So this section starts
with a stylized model of the political context, and then discusses extensions to do aid delivery and
relaxations of other assumptions of the stylized model.
For politics, the situation in Aceh with an insurgency-government military conflict and suspended
elections pre-tsunami for about 20 years from our fieldwork left villages in control of traditional elite.
Replacing this elite in a democratic process no doubt stirred tensions and divisions in villages, as
strongly indicated in fieldwork we conducted. We are going to model this as involving disagreements
over aid division within the village, rather than ”social tensions” per se, in part because of the unique
circumstance noted above of having the entire village capital stock up for grabs.
13
We assume each village has two groups, A and B. Group A is the elite group, which is in power
after the tsunami when the aid process starts. In power means the members of the tuhapuet and
the village head are from that group. For the moment the village head is any member of that group,
who simply enacts the policies wanted by that group. Below we consider extensions where the head
has a more direct role. Group A can stay in power as long as the sub-district government does
not order an election. Their probability of ordering an election is directly related to complaints
they receive from the village about the current village head. In the post-tsunami context village
complaints were focused on the head’s role in aid distribution.
3.1 The basic model
We assume a village has an exogenous total level of aid, X allocated to it. The village head specifies
the allocation of aid amongst villagers. The allocation to an i type, i ∈ A,B, when the j group,
j ∈ A,B, is in control (village head is from group A), Xi(j). Thus budget constraint for whichever
group is in power is:
X = XA(j)NA +XB(j)NB j ∈ A,B (1)
Where Ni is the number of people belonging to group i. We assume NA < NB, so the elite group
is a minority. Below we will consider an extension where group A may expand their membership
to increase support for their aid distribution policy. Starting with group A in power post-tsunami,
if there is an election we assume the they are removed from power, since group B is the majority.
This is consistent also with table 10, where, if village head survived the tsunami and there is an
election, he loses 81% of the time. The probability of an election being called (and hence won by
group B) is
γ
(XA(A)
XB(A
), γ′ > 0 (2)
14

The ratio XA(A)XB(A) as set by group A is committed in village plans made with the key aid agencies
offering aid in the village, where for houses and boats are generally one agency dominates donations.
The aid agency may place a lower limit of aid allocated to any person, say X ≥ 0. If an election is
called, given the switch in power and signing authorities, group B gets to re-contract post-election
and redo that aid allocation. One could allow total village aid to shrink with any re-contracting
but that doesn’t affect our general analysis.
The second element of the model is the supply of volunteer labor for public goods. The level of
village public goods is:
G
∑k∈A,B
lk
, G′ > 0 , G′′ < 0 (3)
where lk is the amount of labor supplied by person k. Labor effort is unpleasant, with that degree
of unpleasantness for member k of group A given by:
fA(lk, z, SC) ; fA1 > 0 ; fA11 > 0 ; fA3 < 0 (4)
z = 1 & fA2 , fA22, f
A12, f
A23 = 0 if
XB(j)
XA(j)≤ 1
z =XB(j)
XA(j)& fA2 , f
A22, f
A12 > 0 & fA23 < 0 if
XB(j)
XA(j)> 1
Unpleasantness is increasing at an increasing rate in effort, lk. It is decreasing in village social
capital as in place pre-tsunami, SC. For A people, as long as each of them get at least as much aid
as B people there is no impact of aid allocation on the unpleasantness from volunteer labor that they
experience. However if B people get more than A people, then that inequity generates resentment
ans a higher psychic cost of volunteer days, which is increasing in that inequality. In the time line,
each person chooses volunteer effort, post aid delivery. It might be tempting to tie aid allocation to
effort and solve a principal-agent problem, such as the village head making an all-or-nothing offer
of aid contingent on volunteerism. However the problem is that once aid is given, the village head
15
no longer has that lever. In our data, in general, aid has already been delivered, and we are seeing
later volunteer day events. Below we will show that volunteered effort by individuals is increasing
in aid already received, suggesting that is based on feelings about getting aid or not, consistent with
our ”disgruntled or not” specification.
Symmetrically for member k of group B, in specifying disgruntlement, we have:
fB(lk, z, SC) ; fA1 > 0 ; fA11 > 0 ; fA3 < 0 (5)
z = 1 & fA2 , fA22, f
A12, f
A23 = 0 if
XA(j)
XB(j)≤ 1
z =XA(j)
XB(j)& fA2 , f
A22, f
A12 > 0 & fA23 < 0 if
XA(j)
XB(j)> 1
For group A, expected utility from committing to XA(A) and XB(A) is given by:
(1− γ(XA(A)
XB(A)
)U
[XA(A), G
(∑k
lk
), fA(lk, 1, SC)
]+ (6)
+γ
(XA(A)
XB(A)
)U
[XA(A), G
(∑k
lk
), fA(lk,
XB(B)
XA(B), SC)
]U1, U2 > 0 ; U3 < 0 ; U11, U22 < 0 ; U33 = 0 ; Ust,s 6=t = 0
The first line is the probability of group A staying in power when they are set XA(A) and XB(A)
times the utility from that event which depends on the aid they get, village public good levels, and
the discomfort from volunteering. Since they are in power, they set XB(j)XA(j) < 1. The question is
what is the degree of inequality they set? The second line is the probability that there is an election
and the B group gains power, multiplied by A person’s utility when group B is in power. In the
last line, we assume separably of U [.]; and we assume U33 = 0, given f1, f11 > 0 with U3 < 0.
Ex-ante group B faces a corresponding expected utility, but if that group gets to make aid allocation
choices it is only because an election is called (with probability γ(.)) and it assumes power. If group
16
B assumes power, it re-contracts with the aid agency to redo aid allocations and those terms are
then not revocable. If in power, group B chooses XA(B) and XB(B) to maximize:
U
[XB(B), G
(∑k
lk
), fB(lk, 1, SC)
](7)
where U [.] has the corresponding properties as in 6.
To solve the volunteer labor outcomes, under an A regime, any individual member of group A and
B chooses an lk so that:
UA2 (A)G′(A) = −U3FA1 (A) ; UB2 (A)G′(A) = −U3f
B1 (A) (8)
In 8 since U33 = 0, we don’t distinguish people or regimes. Given separably, UA2 (A)G′(A) =
UB2 (A)G′(A), which in turn implies that the RHS of each equation in 8 must also be the same.
Thus fA1 (A) = fB1 (A). In evaluating f i1(A), for B people only the second argument of f(.) is
biting; and, given disgruntlement (fB12 > 0), B people must offer a lower l than A, in order for
fA1 (A) = fB1 (A). By differentiating 8, we can solve for dlA(A)dXA(A) , and dlB(A)
dXA(A) , as well as how total
effort or volunteerism, NAdlA(A)dXA(A) + NB
dlB(A)dXA(A) , changes as group A increasingly slants aid in their
own direction.
Solving for the change in total effort, we get:
NAdlA(A)
dXA(A)+NB
dlB(A)
dXA(A)= −
XA(A)XB(A)2
[XB(A)XA(A) + NA
NB
]fB12(A)fA11(A)U3NB
fB11(A)[θ(A)NA + U3fA11(A)] + fA11(A)θ(A)NB< 0 (9)
θ(s) = U22G′(s)2 + U2(s)G
′′(s) < 0
With separably of U [.], θ depends only on state of overall∑l, not on type of person. Equation 9 is
signed based on prior assumptions. The denominator is negative (θ < 0) as is the numerator (U3 <
0). Total volunteer labor is decreasing in aid going to group A, which increases aid discrepancy.
17
If B people are in power, the symmetrical result is:
NAdlA(A)
dXB(A)+NB
dlB(A)
dXB(B)= −
XB(B)XA(B)2
[XA(B)XB(B) + NB
NA
]fA12(B)fB11(B)U3NA
fB11(B)[θ(B)NA + U3fA11(B)] + fA11(B)θ(B)NB< 0 (10)
Total public labor is decreasing in aid discrepancy, now measured by increases going to group B.
If all functions have the same shape for A and B people and populations are equal, then 9 and 10
yield the same reduction in effort for the same respective degree of inequality.
Group A choose XA(A) subject to the budget constraint in 1, where dXB(A)/dXA(A) = −NA/NB
to maximize 6. Maximizing, using the budget constraint and 7, we get:
UA1 (A) + U2(A)G′(A)
[(NA − 1)
dlA(A)
dXA(A)+NB
dlB(A)
dXA(A)
]= (11)
=γ′(.)
γ(.)
[XA(A)
XB(A)2
(XB(A)
XA(A)+NA
NB
)(UA(A)− UA(B))
]
The RHS is the risk associated with steering more aid towards A people. That will induce more
complaints to the kecamatan from B people increasing the chances that the kecamatan will demand
an election be held. A switch in regime for A people results in a loss of utility, rather than UA(A)
where aid is slanted towards them, they get UA(B) where aid is slanted away from them.
To understand the role of RHS in 11, we first note that if an election is called and B people get
to choose aid allocation they choose XB(B) subject todXA(B)/dXB(B) = −NB/NA to maximize
7. This yields first order condition without the RHS terms that appear in 11. Specifically, for B
people choosing allocations,
UB1 (B) + UB2 (B)G′(B)
[NA
dlA(B)
dXB(B)+ (NB − 1)
dlB(B)
dXB(B)
]> 0 (12)
If we make the starting point XA(B) = XB(B), the LHS of 12 is positive - just equal to UB1 (B),
given f i12 in 9 at that point. We then assume that the LHS of 12 declines as XB(B) rises for two
18

reasons. As XB(B) rises, the first, positive term on the LHS of 12 declines (concavity of the U [.]
function in aid). Second, in the second term as XB(B) rises, total volunteer labor declines from
9 which raises both UB2 (B) and G′(B). These in turn are multiplied by the negative amount in
square brackets. That negative amount could be increasingly negative or not, but we assume that
the first two effects are sufficient to make the LHS of 12 decline in XB(B).
Given the LHS of 12 is declining in XB(B), there could be an interior solution to 12. However also
likely is a corner solution where the LHS is positive over all relevant ranges and XB(B) is set at a
maximum value, based on the minimum per person aid allocation for A people set by aid agency,
X. If X = 0, then B people get X/NB; B people’s allocation declines as X rises.
Returning to 11 and contrasting with 12, the RHS of 12 is the penalty A people risk when they
increase XA(A) and increase the chances of an election. That term makes an interior solution where
XB(A) > X much more likely. We expect the inequality in aid allocation to be less under an A
regime and volunteer labor to be greater. Evaluating all relevant terms, but it is certainly the case
as NA −→ NB. At the limit where NA = NB, if XA(A) = XB(A), volunteer efforts in 9 and 10 are
identical and the LHS of 11 and 12 are identical. If 12 is satisfied with an interior solution, then
for 11 to be satisfied given its LHS is declining in XA(A), it must be that XA(A) < XB(B), which
in turn implies G(A) > G(B), or volunteer labor is greater with no election. If 12 is satisfied at
a corner where XA(B) = X, then either 11 is also at a corner where XB(A) = X which we have
implicitly ruled out (but obviously could occur), or 11 has an interior where XB(A) = X. Absent
a double corner solution, in the data we expect to see more volunteerism, absent elections.
3.2 Extensions
In this sub-section we consider three types of extensions: the role and nature of the village head, a
greater role for social capital, outside labor market opportunities and volunteerism, and endogenous
A group size in the basic model as well as what happens if γ(.) depends on group size.
19
3.2.1 Village head
There are two issues about the village head. First, in the data about a quarter of village heads die in
the tsunami. We assume that shifts the γ(.) function towards a greater chance of an election being
called. Village heads that died were replaced immediately after the tsunami with emergency, interim
heads, seemingly from village elites. For example if the local head of the fishermans association
survived, often he simply temporarily assumed the role of village head. In 2005, 35% of replacement
heads are also the local Panglima Laot head; in 2007 only 1% of all village heads have this double
role. Such heads have reduced legitimacy, in office without even the procedures in place pre-election
reform (e.g., selected by the sub-district government working with the tuhapuet). With election
reforms within a year, these villages were most likely to have elections.
Second we modeled the village head as any representative of his group, with no additional reward
for being head. In preliminary work, we endowed that head with feelings about discord in the
village, had him make effort to garner aid and raise volunteer labor and had him siphon-off extra
income with increasing social sanctions by the village. Adding these factors makes for very complex
analysis, but the basic trade-off modeled above remains.
3.2.2 Social Capital
In the specification in 4 and 5 the role of social capital is to reduce the disutility of volunteerism.
A more general role would be to have social capital as a force to reduce inequality in aid allocation.
Explicitly we have experimented with modeling either villagers or the village head as having a
distaste for inequality (or increased social sanctions), which is enhanced as social capital rises.
That could ameliorate the effect of elections, since village norms limit the degree of inequality.
3.2.3 Work opportunities and volunteerism
Increased work opportunities may lead to less volunteerism as the opportunity cost of public labor
rises. Suppose we assume people can earn labor incomes as well as receive aid, where now the
20

cost of volunteer labor is lost earnings. This requires us to respecify the third argument in U [.], so
U3 > 0 and f(.) now represents a feel-good aspect of volunteerism - being part of village life. The
new objective function for A people is:
(1− γ(XA(A)/XB(A)))U
[w(1− li) +XA(A), G
(∑k
lk
), fA(li, 1, SC)
]+ (13)
(1− γ(XA(A)/XB(A)))U
[w(1− li) +XA(A), G
(∑k
lk
), fA(li, 1, SC)
]+ (14)
+γ(XA(A)/XB(A))U
[w(1− li) +XA(A), G
(∑k
lk
), fA(li, XB(B)/XA(B), SC)
]
Where U1, U2, U3 > 0 ; U11, U22 < 0 ; U33 = 0 ; f1 > 0, f11 < 0 ; F2 ≤ 0 ; f22leq0, f12 > 0.
Now, for example, for an A person, volunteerism is determined by the first order condition:
w =U2(A)
UA1 (A)G′ +
U3
UA1 (A)fA1 (A) (15)
The LHS is the wage opportunity cost of volunteerism. The RHS is the sum of the benefit of
volunteer labor in terms of the marginal evaluation of public goods it produces and the feel-good
aspect of working together in the community. In this formulation the type of results we obtained
above still hold.
The issue for the empirics concerns, under what conditions, a rise in the wage rate leads to less
volunteerism. Ignoring all the general equilibrium effects of a change in market wages in a village on
others’ volunteerism and public goods, for one person facing a rise in his wage rate, we differentiate
15 and re-arrange to get:
dl
dw=UA11(A)w(1− l) + UA1 (A)
θA(A) + U3fA11(A)(16)
21

The denominator is negative. A sufficient condition for the numerator to be positive so that in-
creased wages lead to less volunteerism is that U11 < 0 (can be seen from a simple Taylor Series
expansion of U(.) in its first argument). However simple functional forms where U11 > 0 such as
U(.) = (w(1− l) +X)α + . . ., α < 1 also yield a positive numerator.
3.2.4 Endogenous elite group size
In the Appendix we allow the A group to add B people to its elite club with increasing distance
for added members, and with the likelihood of elections being called depending not just on aid
inequality but also on the offended (B) group size. The benefit of adding members of the A group is
to have aid inequality be less likely to trigger an election; the cost is that aid in the elite group must
be shared among more members. It is possible to add enough members so that group A becomes
the majority, in which case the A group can impose extreme inequality with elections posing no
risk.
4 The determinants of public labor
In our villages we have two types of public labor, which are observed. First and foremost are
(Islamic) volunteer days, which are called by the village head for purposes of using volunteers to
provide public goods and public investment. We observe these type of days in two ways: the
number of volunteer days called at the village level in the month prior to the 2007 survey and,
for individual families in a smaller set of villages, the number of volunteer days devoted by the
family in the past month. Counts run from 0 to 8. In both cases, we looked at the problem both
as a discrete choice over days versus no days and as a count. Results are similar but we use the
count formulation because it is more informative. We focus on the village level results but also look
later at individual family choices. The other type of volunteer labor occurred in the early months
following the tsunami. A number of villages started to first rebuild their mosques, using village
volunteer labor. We examine which villages did this and which did not.
22

4.1 Volunteer days called by the village head
We start with a basic count formulation which models the expected number of volunteer days called
per month in village j, λj , as:
λj = exp [Xjβ] (17)
A form which is convenient for defining elasticities. Xj are village characteristics including measures
of village size, social capital, aid delivery, and politics.
A key issue conceptually, although not in terms of actual results, concerns the sample of villages
used. Of the 199 villages, 2 villages have missing data on key variables. A third village is dominated
by army housing - we exclude it since at times it is hard to tell what numbers relate to indigenous
villagers versus army residents. For survival rates and post-tsunami number of houses in a village,
we use our 2005 survey data for the 110 villages for which we have it. For villages new to the
survey in 2007 we use government data, but there are 7 outliers for which the 2006 PODES counts
of households are non-credibly low (given 2007 reported numbers). These villages distort certain
results (yielding ”false positives”). In total, based on these criteria, we exclude 9 villages. For the
remaining villages, 8 villages experienced no house damages or loss of life, although they lost boats.
They typically face very different circumstances, such as some inflow of refugees and displaced
relatives and no need to replace the entire village capital stock. We include them generally; but,
under robustness checks, we report the stronger results when they are excluded from analysis.
We generally treat our determinants of volunteer days as exogenous, or at least pre-determined.
Survival rates and post-tsunami village size variables seem plausibly exogenous to current volunteer
days called by the village head. Our key measure of social capital, apart from village survival rates
is whether the village had an arisan group (RoSCA) pre-tsunami which applies to 68% of villages,
along with the village household survival rate. Obviously having had an arisan group pre-tsunami is
a crude proxy for pre-existing village social capital, which would be correlated with other unobserved
measures of social capital which might influence village cohesion and the inclination and ability of
23
the village head post-tsunami to call and utilize volunteer days. But it is the one measure we have
where there are cross-village differentials and we utilize it. To ameliorate concerns, we experiment
with controlling for recollected volunteer days called pre-tsunami, potentially capturing the effects
on volunteer days of unobserved aspects of pre-tsunami social capital.
The next issue is whether aid measures are exogenous to volunteer days. There are two parts to
a response. First, most aid in our villages is complete by the time of our survey, so we are asking
whether pre-determined aid activity affects volunteerism, not whether the arrival of aid today has
a contemporaneous effect on volunteer days. Second and more critically is the issue of whether
villages with, say, better unobserved inherent tendencies to volunteer days attract more aid. As
we will see in Section 5, aid seems uncorrelated with any observed measures of leadership survival,
social capital, and political circumstances. Most aid seems driven by observables connected with
need and supply conditions (like access of NGOs to the village), with a random component of ”luck”
what aid agencies landed where. That is a ”nicer” village, a more social village, or a village which
has better or consistent leadership doesnt get more private aid, or a better type of aid agency. Aid
happened and now we see the resulting effects on volunteerism. Third, the prime measure of aid
is not counts of housing or boats, although we looked at these. Rather we measure aid by the
number of projects approved by BRR that a village has received. This is a measure of the number
of separate activities, with which a village head has to contend and the array of on-the-ground
implementers parading through the village.
The last issue concerns exogeneity of elections in the public labor model. This issue is discussed
in Section 4.4. In addition we note that elections may also affect aid. In the model we assumed
for convenience that the total amount of aid was exogenous. But we also assumed an election
introduced re-contracting of who received what and it is not hard to imagine total aid levels being
affected as well. Regressions reported below in Section 4.3 indicate insignificant effects of politics
on aid. Regardless, once we introduce politics, controlling or not for aid delivery can affect the
interpretation of the effects of politics on public labor. Fortunately key coefficients on election
effects are little affected by aid controls.
24
We start with a basic formulation that emphasizes the role of social capital, add the effects of aid
received, and then turn to the impact of political processes.
4.2 Basic results: social capital and aid
Results on counts are in table 10. In all formulations we control for village size post-tsunami. Other
controls are: size, whether a village is coastal, ”urban” (meaning close to Banda Aceh), or whether
the village is on the more remote island of Pulo Aceh, don’t have significant effects on volunteer
labor.
4.2.1 Social capital
Results on social capital before the introduction of aid covariates are in column 1 of Table 10. The
key index of village pre-tsunami social capital is whether the village had an arisan group or not; that
has a strong positive effect, raising the number of days called by 47%. In the last column of Table
10, we experiment with adding other similar social capital measures, such as having a credit union
or Islamic school. These have no significant effects. The arisan groups involve the social glue of the
village women - not formal market arrangements or religiosity. Second, for social capital, higher
survival rates mean more social structures in a village remained intact and the village suffered less
trauma. A one standard deviation increase (.41) in the survival rate raises volunteer days by 11%.
A third concern is whether village leaders survived or not. Based on what we first saw in 2005 in the
field, we thought there would be a strong role for survival of traditional village leaders, who provide
continuity and enforcement of traditional social conventions, relevant to volunteerism. Foremost
is the mullah, who plays a central role in village spiritual life in a context where most men go to
mosques regularly and most women attend Quran recitation groups. Survival of the mullah raises
volunteer days by 22%, but the effect of survival of the mullah on 2007 volunteer days is typically
insignificant (although not always). For the mullah, later we will see that survival of the mullah
plays a role in immediate post-tsunami efforts to rebuild the village mosque using volunteer labor.
While volunteer days are ”Islamic” days enshrined in interpretations of the Quran, they are called
25
by the village head. We also look at survival of the village head, and will report results on that
later, since they relate to election results. We also tried combinations of survival of both the mullah
and village head and interactions with overall village survival rate. These are difficult to disentangle
because all survival rates are correlated.
4.2.2 Aid
We have two dimensions of aid. First as discussed above, there is the official count of different aid
projects in a village, our measure of the overall level of aid for the village. The mean is 30 per
village and the maximum is 76. Second concerns whether the largest housing provider in the village
is a donor-implementer. We believe donor-implementers NGOs solve some of the agency problems
among donors, implementers and sub-contractors, facing all donors.
For the first dimension of aid, in column 2 of Table 10, having more projects reduces volunteerism.
One interpretation is that more aid means villagers devote more time to trying to enhance private
gains from that aid. It could also be a ”lobbying effect” more projects mean individuals waste
more time clamoring for more aid, as suggested in Svensson [2000]. But more projects might reflect
opportunity cost effects, where more projects mean more temporary employment opportunities,
drawing away from volunteerism as suggested in Section 3.2.3. To explore the opportunity cost
interpretation, in column 3 we add a control for the 15% of villages where village hired labor was
used to some degree in housing aid provision and we add controls for distance to Banda Aceh
distance for villages on mainland Aceh and a dummy for island villages on Pulo Aceh. Distance
from Banda Aceh, the capital and dominant aid hiring center, reduces aid and opportunity cost of
labor. These controls leave the coefficient on number of aid projects insignificant, but themselves are
insignificant, potentially a reflection of multi-collinearity. The most compelling results is that using
village paid labor does reduce volunteer days by over 29%. If the distance controls are dropped,
both count of aid projects and use of village labor in house construction are significant.
The negative effect of having more aid projects on volunteerism is offset for a typical count of
projects in a village, if the housing provider is a donor-implementer. Clearly the form in which aid
26
is given has a major impact on village public labor inputs. A donor-implementer may free up time
and energy for volunteerism, by reducing time spent monitoring, given mitigation of the agency
problem between donors, implementers and contractors. Indeed we will see later that villages with
donor-implementers have fewer problems with houses and boats that are not useable. Second, having
a donor-implementer may reduce village squabbling over aid allocation, with the agency imposing
sharper limits (given sharper monitoring) on realized inequality. Finally, a donor-implementer may
be more aware of and response to potential village problems and squabbles. However these effects
do not exist if the donor-implementer is the government, in the form of BRR. BRR has a reputation
for corruption, provision of lower quality housing, and no monitoring.
4.2.3 Lagged public labor
Finally, we control for the typical number of pre-tsunami volunteer days called per month, as
recollected post-tsunami. While there are clear issues with recollection and correlation with current
reporting, this is arguably a way to try to control for village persistent unobservables that we are
unable to measure, which affect volunteerism. In column 4, not surprisingly lagged volunteerism is
significant and it tends to reduce the magnitude of coefficients on other covariates. However such
reductions are modest and all basic results are unchanged.
4.3 Politics
We now turn to the analysis of election effects. Again we start by treating elections as ”exogenous”.
To be clear we are not identifying the effect of regularly called democratic elections on volunteer
labor. We are interpreting elections as being called in the presence of aid disputes in a context
where aid replaces almost all village capital and elections represent a regime switch from elites to
non-elites. A potential endogeneity problem is that elections are more likely to be called in villages
with greater underlying divisions, and such divisions would reduce volunteerism. There are two
responses to this. First is to add more controls which might reflect divisions, including lagged
public labor inputs, and years in which elections are called. Second would be to try IV, but as we
27
will discuss below, we have no strong instruments for elections.
4.3.1 Basic results and robustness
In Table 10 in column 1, we start with a dummy variable for whether a village had an election
post-tsunami by the time of our survey in late 2007. Below we will also separate out year of election
effects. Having an election significantly reduces volunteer days by 25%, an effect that is almost
significant at the 5% level. As discussed in Section 3, elections may heighten aid conflict within
the village, reducing the willingness due to disgruntlement to volunteer. One alternative is that
elections bring in new types of village heads, in particular better educated ones, who simply desire
or can muster fewer volunteer days. We examine this explanation empirically below and reject it.
In column 1, the election effect is not quite significant at the 5% level; we believe that is because
these effects are only felt in a subset of villages. In column 2, the negative effects of elections are
pretty much offset in villages with a pre-tsunami arisan group. In fact the arisan group effect
itself applies just to these villages with elections. We tried many combinations of interactive terms
including donor implementers, mullah surviving, and number of aid projects with both elections
and pre-tsunami arisan groups. Column 2 represents the only persistent and consistent interactive
effects. The result says elections have a negative effect on volunteerism, but higher levels of social
capital can almost completely neutralize this effect. This is an intriguing role for social capital.
We then experimented in columns 3-6 of Table 10 with a variety of robustness exercises. First in
column 3 we add a control for lagged public labor, with no notable impact on results. This may
help alleviate concerns that villages with elections are those with inherent underlying divisions and
lower inherent propensities to volunteer. In column 4 we remove the controls for aid, to look at
”total” election effects including the indirect effect on aid. There effects are weaker. But columns
5 and 6 reveal this weakening is entirely due to our choice of expanded sample.
If we remove villages which experienced no losses of houses and face entirely different post-tsunami
conditions and thus focus just on the group where our model is relevant, results are strengthened.
Most compelling is that, when we go from column 5 to 6 where in 6 we add on both aid controls
28
and lagged volunteerism to column 5, column 5 results on elections are unchanged.
4.3.2 Election: year-by-year effects, village head education
If we break the elections by year, 2005, 2006 and 2007, the effects, whether for elections alone
or for elections interacted with arisan group effects are similar in each year. For 2005, 2006 and
2007 respectively, 13%, 22% and 31% of all villages have elections. In column 1 of Table 10 we see
large negative election effects in 2005 and 2006, with small effects in 2007. Strong offsetting arisan
group effects occur for 2005 and 2006 elections, with an insignificant (but positive) interaction
for 2007. The fact that 2007 effects are smaller is appealing; these are villages that were able to
postpone elections beyond the key aid years and thus may have less ex post divisions and inequity
in aid provision. Results also suggest election effects are due to created disgruntlement, not election
activity and lobbying: 2005 and 2006 elections have persistent effects in 2007.
In columns 2 and 3, we look for two other results that lend credibility to our model of election
effects, albeit with small numbers of cases. First in column 2 for the 6.4% of villages where there
is a new non-elected village head, volunteerism is significantly higher. These are generally villages
where the village head died. Given then elections are very likely, the interim head can only survive
in office if the typical villager is very satisfied with the aid delivery. We see this as a sharp limit
on the extent to which elites (or any group) are favored, enhancing volunteerism. In column 3, we
look at the very different case where an incumbent (elite) village had is reelected (8.5% of cases).
Reelection of an elite could heighten tensions, but then to be reelected the elite must have garnered
sufficient non-elite support rather like the extension in Section 3.2.4. Not surprisingly the effect is
negative but insignificant.
Finally in column 4 of Table 10, we look at village head education effects, measured by whether the
village head has high school education or more. The issue is whether elections reduce volunteerism,
or it is simply that elections have brought better educated village heads, who are less in touch with
ordinary villagers and less able to muster volunteer days. We entered the education dummy on
its own with no election variables, as affecting election-arisan results and as having an effect over
29

and above election effects that could also be ameliorated by arisan group considerations. Column
4 reports on the last case, which is the horse race with election effects. As in column 4, in all
specifications coefficients on the education variables are small and insignificant.
4.4 Loose ends
4.4.1 Aid, unusable aid, and election determinants
In this sub-section we review some aspects of the aid that we have discussed in prior sections: the
determinants of elections, the determinants of aid levels, and determinants of unusable aid.
In Table 10, column 1 we see that the only variable having a significant effect on the likelihood of
an election is whether the old village has died or not. Could we use this as an instrument? There
are three reasons why not. First given village heads die in only 23% of our villages, it is a weak
instrument. In a first stage liner probability model, the partial-F for village head died or not is
only 7.99. Second village head survival may not meet the exclusion restriction; as noted above
disentangling its effects from other survival covariates is difficult in this limited sample. Finally
village head survival for villages added in 2007 has ”recall errors”, in the sense that for the 111
villages surveyed in 2005, some which report the death of the village head in 2005, in 2007 say
he survived and vice versa. A few cases could be later discovery of a village head presumed dead
in 2005 or a death post our 2005 survey of an injured village head. But the real recall problem
appears to occur in the 13 cases where the village head survived in 2005 but quit office (usually due
to emotional trauma or post-traumatic stress disorder). Seven of these 13 are reported in 2007 as
having died in the tsunami.
In the next three columns of Table 10, we ask whether villages with more social capital or with
or without elections get more or less, or better or worse aid. In columns 2 and 3, we look at the
determinants of two measures of aid received by a village: the number of houses given in aid and
the number of aid projects reported in the RAN database. We restrict our basic regression sample
of 190 to exclude villages which suffered no house damages, to sharpen results. We see in columns 2
30

and 3 that the number of houses received in aid and the number of aid projects are driven by village
size and access measures; and, for houses, survival rates (less destruction) means fewer houses. For
both measures, counts are weakly related to nearness to the two main aid centers (Banda Aceh
and Meulaboh, with each village assigned to the nearest, except for those on Pulo Aceh), but are
definitely lower on the poorly accessible island of Pulo Aceh. Election effects and arisan group
effects (with or without the election variables) are insignificant, and mullah survival has no effect.
In columns 4 and 5 we look at determinants of aid agencies and quality, conditional on the village
getting house aid. Column 4 looks at whether a village in more likely to get a donor-implementer
agency for housing other than BRR. Other than access measures no observables drive this allocation.
For access it seems these agencies are the ones more likely to service remote villages.
Finally in column 5, we examine another aspect of why having a donor-implementer matters: what
fraction of house aid is unusable. Unusable houses are never finished or abandoned (a stark example
are houses built with high quantities of asbestos in the construction materials). The key variable
is whether the agency responsible is a donor-implementer, where abandonment is effectively zero
(coefficient of -0.41, for a mean fraction of bad houses of 0.038). This result carries over weakly
to the fraction of boats given in aid that are unusable, despite the fact that these agencies differ
from house aid agencies who are the donor-implementers. Unusable means doesn’t float (literally),
can’t be used on rough coastal waters, or falls apart); and 0.30 fraction of boats given in aid in the
regression sample are unusable. Having the house aid NGO in the village be a donor-implementer
reduces that by 0.340 (but with a standard error of 0.188).
4.4.2 Individual volunteer days
Finally we turn to individual decisions on volunteer days, amongst fishing families that owned
and/or captained boats pre-tsunami. We have information for families in 92 villages; and once we
impose village fixed effects, removing villages where there is no variation among families in days
reported, we are left with 51 villages. The samples cover too few villages to investigate the village
level effects we have in Tables 10 - 10 (coefficients are insignificant) and whether days are called or
31
not. Instead we focus on within village variation in who volunteers (given days are called). Key
results are in column 2.
Not surprising larger householders are more likely to have a volunteer and those with a new baby
less likely. The key result is that, controlling for owning a boat or not in 2007, those who received a
boat on aid are more likely to volunteer (ex post). We interpret as supporting the idea, that those
on the receiving end are less likely to be disgruntled and more likely to offer public labor.
In the final column we add in a variety of other controls for working full time or not, having current
debt and trauma. The last is whether people have symptoms similar to panic attacks (”nausea,
racing heartbeat, difficulty in breathing, sweating”) from memory of the tsunami. Only trauma
matters and positively, perhaps reflecting a therapeutic effect of volunteering
5 Volunteer days to rebuild the mosque
A second dimension of volunteerism in the data is whether the village used volunteer days to rebuild
the mosque. Almost universally, this is a 0% versus 100% splitno volunteer or all volunteer labor.
But there are some villages which report a partial, and so we create a dummy for whether the
mosque was rebuilt using over 50% volunteer labor. 26% of villages report the use of volunteer
labor. Looking at volunteer labor to rebuild the mosque involves an unusual phenomenon. Such
activity occurred mostly in the 2005 before any permanent aid arrived in the village. Once such
aid arrives, it becomes apparent that there are aid agencies willing to pay people to rebuild the
mosque or to hire outside workers. Thus the split is whether a village rallied in the months after the
tsunami, to focus on rebuilding the mosque (noting volunteer labor is not in evidence in the building
of houses or generally other public buildings); or whether people in villages either did nothing or
engaged in ”work-for-pay” programs designed to give people something to do (clear rubble, drive
vehicles, etc.), thus putting aside rebuilding the mosque.
For the empirical formulation this has implications. First, including aid variables is pointlessalmost
by definition more aid programs will imply the village did not proceed with volunteer labor to
32

rebuild the mosque. Second the variables on elections and village decision making on aid allocation
also are not relevantthese involve later events. Thus such variables are all insignificant.
Results are in Table 10. We focus on the sample of 141 villages which had a mosque that was
destroyed by the tsunami. Larger villages are more likely to recruit enough volunteers to proceed,
while urban villages are less likely: there are other mosque options nearby and other immediate
employment in the early days of aid relief.
The key variables involve social capital. Whether the village had an arisan group pre-tsunami
increases the probability of volunteer labor by 15%. Second, survival of the mullah increases the
probability of volunteer labor by 14%, an effect that is almost significant at the 5% level in column
1. Finally, while column 2 shows the same election effects as in the tables above, as expected in
this immediate post-tsunami context, effects are insignificant.
6 Public buildings
In this section we see if our results on public labor inputs carry over into public buildings. This
evaluation does differ, since it implicitly introduces an aspect of choice between public and private
capital, which itself is hard to capture as we will discuss. The general issue is that public buildings
for the ”typical” villager may have general appeal and represent equality in aid divisions (since
all benefit), while some buildings may be more for elites, are proscribed from above, or driven by
aid agency goals. In Table 10, we show the count of different types of public buildings existing
pre-tsunami and the aid allocations by 2007.
The most compelling are mosques. For mosques, almost all villages had one or more mosques pre-
tsunami and the issue is whether they get replaced if destroyed (whether they use public labor in
construction or not). Materials and some labor are provided by a variety of aid agencies, not driven
by one donor; and there is no question that in conservative Aceh almost all villagers go to mosque.
So it is a general public good.
The rest of public buildings have caveats. Other buildings include the village hall, which may be
33
just part of the village head’s complex or may be separate. Village meetings in principle are held in
the village hall, although many relevant meetings seem to happen in the mosque. The issue then is
whether a village hall is valued by the typical villager. Another issue is that village hall construction
was driven by a key Australian NGO (APRID) which also did village land use planning. If APRID
landed in a village it got a new hall.
Schools have more general appeal to villagers, but which villages have schools and which villages
have commuter children seems to be proscribed from above. Having a dayah, or religious school, is
more of a choice but may reflect religiosity of the village and history. Finally health facilities are not
proscribed from above, are not connected with religiosity, and are valuable to the typical villager.
The only caveat is that again allocation of health facilities was largely driven by one NGO.
Based on these comments, in Table 10 we report on mosques, health facilities, and dayahs. Larger
villages and those which lost facilities are more likely to get aid in the form of specific public
buildings. Nothing much else matters, which might be expected if aid is driven by NGO goals for
public health for example. Social capital variables for example have no role. In terms of election
variables, only for mosques is there any strong evidence of effects of the type we obtained for public
labor.
In these specifications, it is difficult to control for total aid (other than public buildings). Looking
at the ratio of, say, total public buildings to houses given in aid to try to identify trade-offs gives
a very noisy dependent variable, because of small numbers in the numerator. A control for total
RAN projects for most public building is positive and significant, but that is almost definitional:
more projects means it is more likely one is for public buildings.
7 Conclusion
We have shown how the aid effort after the December 2004 Indian Ocean tsunami affected the
provision of public goods. In particular, we have found that villages that received more aid (measure
by the number of projects in the village) saw a decrease in the number of volunteer days held in that
34

village. These negative effects are smaller if the aid donor is also the implementer of the project
in the field. While villages with more ”democratic” institutions (elections) have a lower level of
volunteerism, this effect is mitigated in villages with a higher social capital.
Our results imply that the aid delivery method has an impact on the investment in local public
goods. In particular, the aid process may lead to a sub-optimal amount of public goods, with
potential long term implications.
35

References
D. Acemoglu and J. Robinson. De facto political power and institutional persistence. The American
Economic Review, 92(2):325–330, 2006. Papers and Proceedings of the Annual Meeting of the
American Economic Association.
J.-P. Azam and J.-J. Laffont. Contracting for aid. Journal of Development Economics, 70:25–58,
2003.
T. Besley and S. Coate. An economic model of representative democracy. The Quarterly Journal
of Economics, 112(1):85–114, 1997.
T. Besley, S. Coate, and G. Loury. Rotating savings and credit associations, credit markets and
efficiency. The Review of Economic Studies, 61(4):701–719, 1994.
P. Collier, P. Guillaumont, S. Guillaumont, and J. W. Gunning. Redesigning conditionality. World
Development, 25(9):1399–1407, 1997.
W. Easterly. The cartel of good intentions: The problem of bureaucracy in foreign aid. Journal of
Policy Reform, 5:1–28, 2003.
A. Foster and M. Rosenzweig. Democratization, decentralization and the distribution of local public
goods in a poor rural economy. PIER Working Paper No. 01-056, November 2001.
R. Kanbur, T. Sandler, and K. Morrison. The Future of Development Assistance: Common Pools
and International Public Goods. Overseas Development Council, 1999.
S. Knack and A. Rahman. Donor fragmentation and bureaucratic quality in aid recipients. Journal
of Development Economics, 83(1):176–197, 2007.
J. Labonne and R. Chase. Do community-driven development projects enhance social capital ?
evidence from the philippines. The World Bank Policy Research Working Paper Series, July
2008.
K. Munshi and M. Rosenzweig. The efficacy of parochial politics: Caste, commitment, and compe-
tence in indian local governments. NBER Working Papers W14335, September 2008.
36
P. Murrell. The Interaction of Donors, Contracts and Recipients in Implementing Aid for Institu-
tional Reform, chapter 3, pages 69–111. The institutional economics of foreign aid. Cambridge
University Press, Cambridge, UK, 2002.
E. Paul. A survey of the theoretical economic literature on foreign aid. Asian-Pacific Economic
Literature, 20:1–17, May 2005.
T. Persson and G. Tabellini. Political Economics: Explaining Economic Policy. MIT Press, Cam-
bridge, MA, August 2000.
J. Sobel. Can we trust social capital? Journal of Economic Literature, 40(1):139–154, March 2002.
J. Svensson. Foreign aid and rent-seeking. Journal of International Economics, 51(2):437–461,
August 2000.
J. Svensson. Why conditional aid does not work and what can be done about it? Journal of
Development Economics, 70(2):381–402, April 2003.
G. Torsvik. Foreign economic aid; should donors cooperate? Journal of Development Economics,
77(2):503–515, August 2005.
S. Varadharajan. Explaining participation in rotating savings and credit associations (roscas):
Evidence from indonesia. Department of Economics, Cornell University, 2004.
37

8 Appendix 1 - Endogenous elite group size
Suppose A people can expand their base by incorporating some B people and giving the new
additions an equal share in aid. Correspondingly, we assume the chances of election now dependent
on both aid disparities and the relative size of complaining group. Second, we assume B people are
heterogeneous in the distaste they bring to A people. Specifically we assume that B people have an
index s uniformly distributed in (01, 1) that reflects their heterogeneity in terms of disaster on the
part of A people. Combining the two assumptions, now the expected utility of an A group member
is:
(1− γ(XA(A)
XB(A),
(1− s)NB
NA + sNB
)U
[XA(A), G
(∑k
lk
), fA(lk, 1, SC)
]+ (18)
γ
(XA(A)
XB(A),
(1− s)NB
NA + sNB
)U
[XA(B), G
(∑k
lk
), fA(lk, XB(B)/XA(B), SC)
]+
Where s ∈ (0, 1), U1, U2 > 0, U3 < 0, U11, U22 < 0, U33 = 0, Ust,s 6=t = 0, γ1, γ2 > 0. In 16 s is the
fraction of B people who have joined the A group, so the new sizes of the A and B groups from
base populations are respectively NA + sNB and (1− s)NB. As B group size falls relative to that
of the A group size. The last term in the utility function, SC, can be interpreted as the distaste for
adding the marginal B person, s, to the A group given all lower ranked (in terms of distaste) have
been added already. Or it can be the distaste for having added s proportion of type B people.
Now A people must choose XA(A) and s, where given the aid budget constraint now XB(j) =
X−XA(j)(NA+sNB)(1−s)NB
, j ∈ A,B, from which we can solve for dXB/ds and dXB/dXA. This is a messy
model to solve and we focus on the key points. First, for the choice of XA(A), the prior first order
condition holds, except now group sizes are defined after altered group membership. Second, as
before we need to differentiate equation 8 to solve the new terms dlA/dS, dlB/ds. A grind through
the algebra shows that both terms are now negative. As s rises for a given XA(A), that means
XB(A) must decline which increases disparities facing remaining B people. Thus as s rises B
38
people volunteer less. For A people, adding another high effort A person (in pace of a low effort
B person) means also those in the A (and B) group can relax a bit. Third, differentiating the
objective function for A people with respect to s gives:
dE[U(.)]
ds= (19)
= (1− γ(.)
[UA2 (A)G′NB(lA − lB) + UA2 (A)G′(A)
((NA + sNB − 1)
dlA(A)
ds+ (1− s)NB
dlB(A)
ds
)]+
+γ(.)dUA(B)
ds+
+(UA(A)− UA(B))
[γ1XA(A)
XB(A)2
(X −XA(A)N
NB(1− s)2
)+ γ2
NNB
(NA + sNB)2
]γ′(.)− C
In 19 in the second line (first line of RHS), the first term in the square brackets is positive (substitute
high for low effort person increases in public goods), while the second is negative (reduced effort
level in providing public goods). In the third line, adding more to the A group affects A people’s
utility when B people are in charge, since the level of public goods and effort level will be affected.
The first term in the fourth line is the gain to A people from keeping the A regime, multiplied by the
relevant changes in probabilities of an election from changing s. The first term in the square brackets
in the fourth line is a force to increase the probability and reduce utility (noting X−XA(A)N < 0):
increasing s for the same XA(A) increases disparities (XB(A) must decline). On the other hand we
might expect the dominant effect to be the second (γ2) term in the square brackets, where greater
s means less chances of an election, due to less weight on protest form reduced group B size.
In general the sign of 19 is ambiguous, which indicates there are a number of potentially relevant
cases, even assuming DE[U(.)]/ds is well behaved. These cases revolve around whether s is a
set so the A group rises to be 1/2 the population and hence dominates the political process, or
s ≥ 1/2 − NA/NB. Once that happens γ(.) effectively is zero and XB(A) will surely be set at a
minimum, X, without risk of an election being called and lost. The cases are:
1. dE[U(.)]ds < 0 at s = 0.
39

2. dE[U(.)]ds = 0 at s = 1
2 −NANB
; E[UA(A)] ≥ U(A, γ = 0, XB(A) = X, s ≥ 12 −
NANB
).
3. dE[U(.)]ds = 0 at s = 1
2 −NANB
; E[UA(A)] < U(A, γ = 0, XB(A) = X, s ≥ 12 −
NANB
).
4. dE[U(.)]ds > 0 at s ≤ 1
2 −NANB
;dUA(A,γ=0ds < 0 at s = 1
2 −NANB
.
In case 1, group A has no incentive to expand membership. In case 2, there is an interior solution to
s and the enhanced A group size is less than 1/2 of village population. In that interior solution γ(.)
is still positive, so we need to check that setting s < 12 −
NANB
is better than letting group A size rise
to be a majority where γ(.) = 0 and XB(A) = X. If that happens γ goes to zero since the newly
constituted A group will win any election. In case 3, although there is an interior solution where
E[U(.)]ds = 0 at s < 1
2 −NANB
, it is better for group A to expand to just dominate politically and for
sure set aid to group B to the base minimum. Case 4 raises the possibility that there is no interior
solution where E[U(.)]ds = 0, so that group A expands to be a bare majority. The discussion rules out
the possibility that once a bare majority is reached, the best s is still higher because the per person
loss in aid to A people is more than offset by the increase benefits of volunteerism, (XA(A)X declines
as s rises.
What is relevant for the empirical section is the possibility of noise in interpreting elections. If
group A recruits members of group B sufficient for a majority, then it is possible to have high aid
inequality (XB(A) = X) and lack of volunteerism, with no election.
40

9 Appendix 2 - Figures
0 50 100 km
LegendOfficial Survival Rate (in %)
0% - 30%30.1% - 70%70.1% - 100%100.1% - 400%
Source: PODES 2006 and P4B
Population Survival Rate from Official Sources (in %)
Figure 1: Map of population survival rates using official data sources (PODES 2006 and P4B), for197 of the 199 villages we surveyed. The blow-up map on the left side is of the Banda Aceh area,while the one on the right side is of the Pidie area. Some villages report survival rates above 100%due to problems in data collection in the P4B survey during the insurgency, and because somevillages received refugees after the tsunami.
41
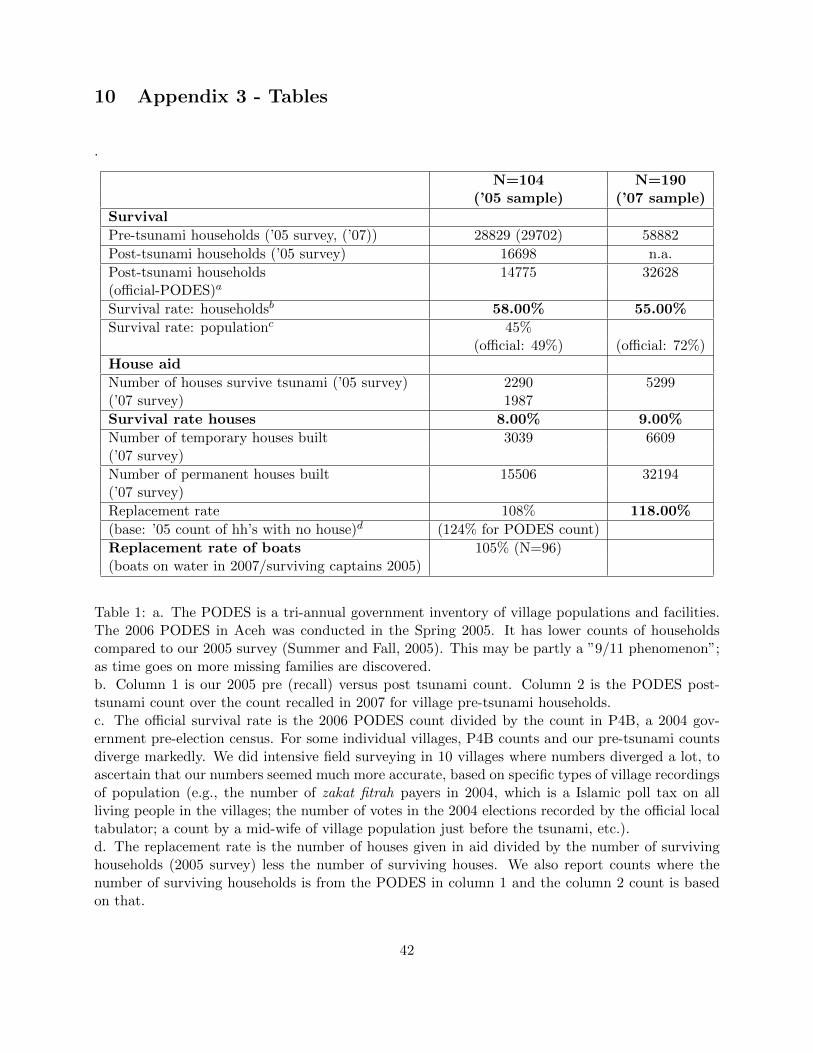
10 Appendix 3 - Tables
.
N=104 N=190(’05 sample) (’07 sample)
Survival
Pre-tsunami households (’05 survey, (’07)) 28829 (29702) 58882
Post-tsunami households (’05 survey) 16698 n.a.
Post-tsunami households 14775 32628(official-PODES)a
Survival rate: householdsb 58.00% 55.00%
Survival rate: populationc 45%(official: 49%) (official: 72%)
House aid
Number of houses survive tsunami (’05 survey) 2290 5299(’07 survey) 1987
Survival rate houses 8.00% 9.00%
Number of temporary houses built 3039 6609(’07 survey)
Number of permanent houses built 15506 32194(’07 survey)
Replacement rate 108% 118.00%
(base: ’05 count of hh’s with no house)d (124% for PODES count)
Replacement rate of boats 105% (N=96)(boats on water in 2007/surviving captains 2005)
Table 1: a. The PODES is a tri-annual government inventory of village populations and facilities.The 2006 PODES in Aceh was conducted in the Spring 2005. It has lower counts of householdscompared to our 2005 survey (Summer and Fall, 2005). This may be partly a ”9/11 phenomenon”;as time goes on more missing families are discovered.b. Column 1 is our 2005 pre (recall) versus post tsunami count. Column 2 is the PODES post-tsunami count over the count recalled in 2007 for village pre-tsunami households.c. The official survival rate is the 2006 PODES count divided by the count in P4B, a 2004 gov-ernment pre-election census. For some individual villages, P4B counts and our pre-tsunami countsdiverge markedly. We did intensive field surveying in 10 villages where numbers diverged a lot, toascertain that our numbers seemed much more accurate, based on specific types of village recordingsof population (e.g., the number of zakat fitrah payers in 2004, which is a Islamic poll tax on allliving people in the villages; the number of votes in the 2004 elections recorded by the official localtabulator; a count by a mid-wife of village population just before the tsunami, etc.).d. The replacement rate is the number of houses given in aid divided by the number of survivinghouseholds (2005 survey) less the number of surviving houses. We also report counts where thenumber of surviving households is from the PODES in column 1 and the column 2 count is basedon that.
42
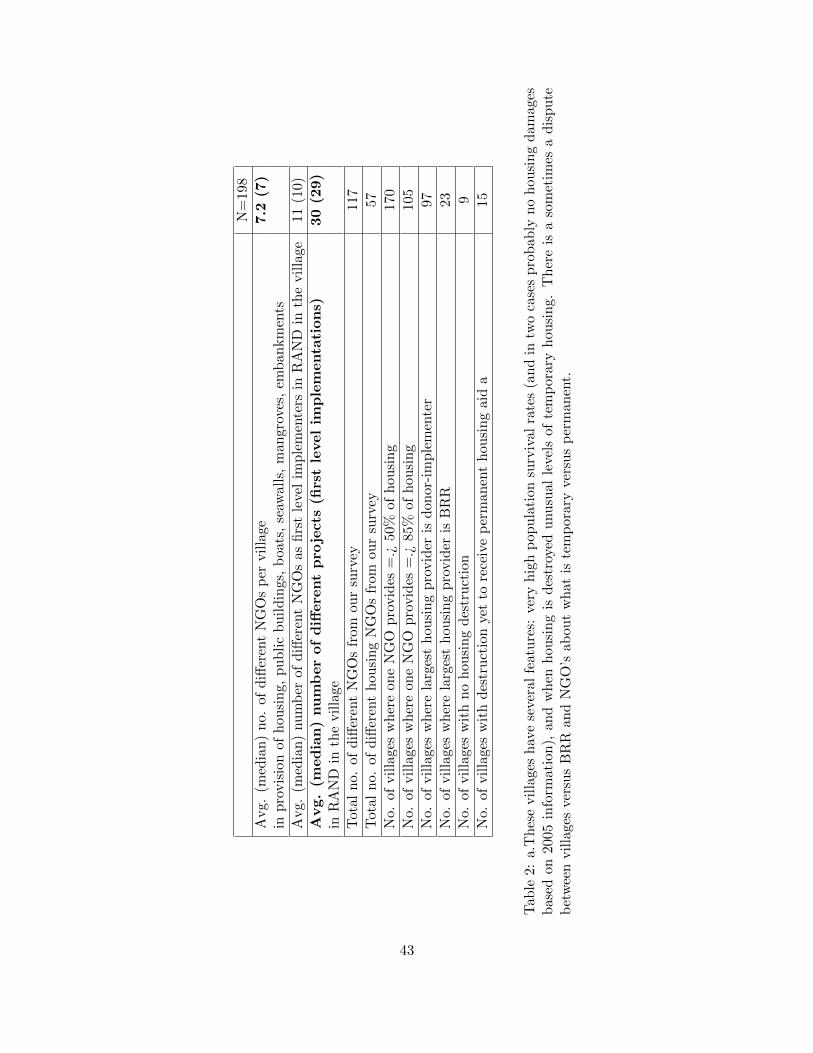
N=
198
Avg.
(med
ian
)n
o.
of
diff
eren
tN
GO
sp
ervil
lage
7.2
(7)
inp
rovis
ion
of
hou
sin
g,
pu
bli
cb
uil
din
gs,
boa
ts,
seaw
alls
,m
angr
oves
,em
ban
km
ents
Avg.
(med
ian
)nu
mb
erof
diff
eren
tN
GO
sas
firs
tle
vel
imp
lem
ente
rsin
RA
ND
inth
evil
lage
11(1
0)
Avg.
(med
ian
)nu
mb
er
of
diff
ere
nt
pro
jects
(firs
tle
vel
imp
lem
enta
tion
s)30
(29)
inR
AN
Din
the
vil
lage
Tot
al
no.
of
diff
eren
tN
GO
sfr
omou
rsu
rvey
117
Tot
al
no.
of
diff
eren
th
ousi
ng
NG
Os
from
our
surv
ey57
No.
ofvil
lages
wh
ere
on
eN
GO
pro
vid
es=
.¿50
%of
hou
sin
g17
0
No.
ofvil
lages
wh
ere
on
eN
GO
pro
vid
es=
.¿85
%of
hou
sin
g10
5
No.
ofvil
lages
wh
ere
larg
est
hou
sin
gp
rovid
eris
don
or-i
mp
lem
ente
r97
No.
ofvil
lages
wh
ere
larg
est
hou
sin
gp
rovid
eris
BR
R23
No.
ofvil
lages
wit
hn
oh
ousi
ng
des
tru
ctio
n9
No.
ofvil
lages
wit
hd
estr
uct
ion
yet
tore
ceiv
ep
erm
anen
th
ousi
ng
aid
a15
Tab
le2:
a.T
hes
evil
lage
sh
ave
seve
ral
feat
ure
s:ve
ryh
igh
pop
ula
tion
surv
ival
rate
s(a
nd
intw
oca
ses
pro
bab
lyn
ohou
sin
gd
amag
esb
ase
don
2005
info
rmat
ion),
and
wh
enh
ousi
ng
isd
estr
oyed
unu
sual
leve
lsof
tem
por
ary
hou
sin
g.T
her
eis
aso
met
imes
ad
isp
ute
bet
wee
nvil
lage
sve
rsu
sB
RR
and
NG
O’s
abou
tw
hat
iste
mp
orar
yve
rsus
per
man
ent.
43

Ele
cti
on
No
Ele
cti
on
Villa
ge
head
die
dV
illa
ge
head
lived
Tota
lV
illa
ge
head
die
dV
illa
ge
head
lived
Tota
l
win
slo
ses
rep
laced
inoffi
ce
N46
1668
130
77
5569
%h
igh
sch
ool
78.
3%37
.5%
66.2
%71
.4%
85.7
%45
.5%
ed
ucati
on
or
more
Tab
le3:
Ele
ctio
ns.
44

Pre
-tsu
nam
iP
ost
-tsu
nam
iS
am
ple
T-s
tat.
on
diff
ere
nces
Ari
san
gro
up
exis
ts13
612
319
9vil
lage
s1.
4
Bel
on
gto
ari
san
gro
up
8062
324
h.h
.sin
62vil
lage
s1.
7su
rvey
edin
2005
and
2007
Bel
on
gto
ari
san
gro
up
(su
b-s
amp
le)
6961
269
h.h
s;a
wif
ep
rese
nt
in07
0.8
Qu
ran
recit
ati
on
gro
up
exis
ts17
617
119
9vil
lage
s0.
7
Att
end
Qu
ran
reci
tati
on
286
223
324
h.h
.ssu
rvey
ed6.
3
at
least
on
cea
wee
kin
2005
and
2007
Att
end
Qu
ran
reci
tati
on
(su
b-s
am
ple
)24
121
926
9h
.hs;
aw
ife
pre
sent
in07
2.7
Hav
ea
cred
itu
nio
n(n
ot
ban
k)
5150
199
vil
lage
s:ov
erla
pis
27
Daya
h71
5443
of63
rep
lace
d(6
3d
estr
oyed
)(4
vil
lage
sn
ewly
hav
edaya
h)
Tab
le4:
Vil
lage
life
and
soci
alca
pit
al.
45

Pre
-tsu
nam
iP
ost
-ts
un
am
iS
am
ple
t-st
at.
on
diff
ere
nces
Reg
ula
rvo
lunte
erd
ays
199
124
199
vil
lage
s11
Ave
rage
[med
ian
]vo
lunte
er2.
66[3
]2.
13[1
]P
re-t
sun
ami
nu
mb
erb
ased
on3.
5[3
.4]
day
sp
erm
onth
,if
hav
ed
ays
rep
orti
ng
of19
3vil
lage
sH
ouse
hol
ds
n.a
.16
632
4h
.h.s
surv
eyed
in05
and
07n
.a.
Tab
le5:
Pu
bli
cL
abor
:V
olu
nte
eris
m
46

Social Aid Market Past Other socialcapital opportunities volunteerism capital
Log number of 0.0067 0.066 0.016 0.087 0.04households post tsunami (0.12) (0.13) (0.14) (0.13) (0.13)
”Social capital”
Survival rate 0.264** 0.314** 0.240* 0.236* 0.310**(households post to pre-tsunami) (0.13) (0.14) (0.13) (0.13) (0.13)
Village had pre-tsunami 0.468** 0.400** 0.361** 0.358** 0.343**arisan group (0.17) (0.17) (0.17) (0.16) (0.16)
Mullah survive tsunami 0.220 0.217 0.168 0.202 0.237(0.16) (0.15) (0.16) (0.15) (0.15)
Pre-tsunami credit union 0.085(0.15)
Pre-tsunami dayah 0.194(0.13)
Aid level and form
Official number of aid -0.011** -0.0061 -0.012** -0.011**projects in village (0.01) (0.01) (0.01) (0.01)
Majority housing provider 0.398** 0.341** 0.336** 0.432**is donor-implementer (0.14) (0.14) (0.14) (0.14)
Majority housing provider -0.561** -0.464** -0.450** -0.556**is BRR (0.19) (0.23) (0.20) (0.19)
Market opportunities
Housing NGO employs -0.292*village labor (0.17)
Log distance to Banda Aceh 0.157(in km) (0.11)
Village in Pulo Aceh 0.696(0.47)
Log number of volunteer 0.391**days per month pre-tsunami -0.16
N 190 188 184 188 188
Pseudo R-Sq 0.04 0.07 0.09 0.08 0.07
Table 6: These are the results from count model regressions on volunteer days per month calledby village head, with robust standard errors in brackets. *** denotes significant at the 1% level,** denotes significant at the 5% level and * denotes significant at the 10% level. In column 1, wedrop from our sample 8 villages, villages with missing information on key variables and villageswith outliers in the count of households. In columns 2, 4 and 5 we drop two villages with missinginformation in RAN database. Finally in column 3, we drop a further two villages with missinginformation on distance to Banda Aceh.
47

Elections Robustness
Election Election - Past No aid Sample withsocial cap. volunteer damages
Log number of households 0.062 0.073 0.094 0.0015 0.018 0.097post tsunami (0.12) (0.13) (0.13) (0.12) (0.12) (0.13)
Survival rate 0.318** 0.319** 0.247* 0.261** 0.219* 0.202(households post to pre- tsunami) (0.13) (0.13) (0.13) (0.13) (0.13) (0.13)
Village had pre-tsunami .403** 0.023 0.060 0.174 0.206 0.085arisan group (0.16) (0.21) (0.24) (0.26) (0.26) (0.24)
Mullah survive tsunami 0.203 0.218 0.210 0.219 0.292* 0.280*(1.51) (0.15) (0.15) (0.16) (0.17) (0.16)
Official number of aid -0.012** -0.013** -0.014** -0.012**projects in village (0.01) (0.01) (0.01) (0.01)
Majority housing provider 0.415** 0.418** 0.358** 0.295**is donor-implementer (0.14) (0.14) (0.14) (0.14)
Majority housing -0.562** -0.575** -0.466** -0.415**provider is BRR (0.19) (0.19) (0.19) (0.19)
Elections
Election, post-tsunami -0.248* -0.761** -0.678** -0.593** -0.739** -0.781**(0.14) (0.26) (0.27) (0.28) (0.27) (0.27)
Election, post-tsunami 0.666** 0.554* 0.528 0.625** 0.622***pre-tsunami arisan group (0.31) (0.32) (0.33) (0.32) (0.31)
Log number of volunteer days 0.353** 0.108**per month pre-tsunami (0.16) (0.05)
N 188 188 188 190 182 180
Pseudo R-Sq 0.08 0.08 0.09 0.05 0.06 0.10
Table 7: These are the results from count model regressions on volunteer days per month calledby village head, when controlling for elections - robust standard errors in brackets. *** denotessignificant at the 1% level, ** denotes significant at the 5% level and * denotes significant at the10% level. In columns 1-3, we drop from our sample 8 villages, with missing information on keyvariables, villages with outliers in the count of households and villages with missing information inRAN database. In column 4, we drop villages with no aid, missing information on key variables,with outliers in the count of households. In column 5 we exclude from our sample 8 villages, withmissing information on key variables, villages with outliers in the count of households and villageswith no aid (overlapped). In columns 6 and 7 we exclude from our sample 8 villages, with missinginformation on key variables, villages with outliers in the count of households and villages withno damages, while in column 7 we further exclude villages with missing information in the RANdatabase.
48
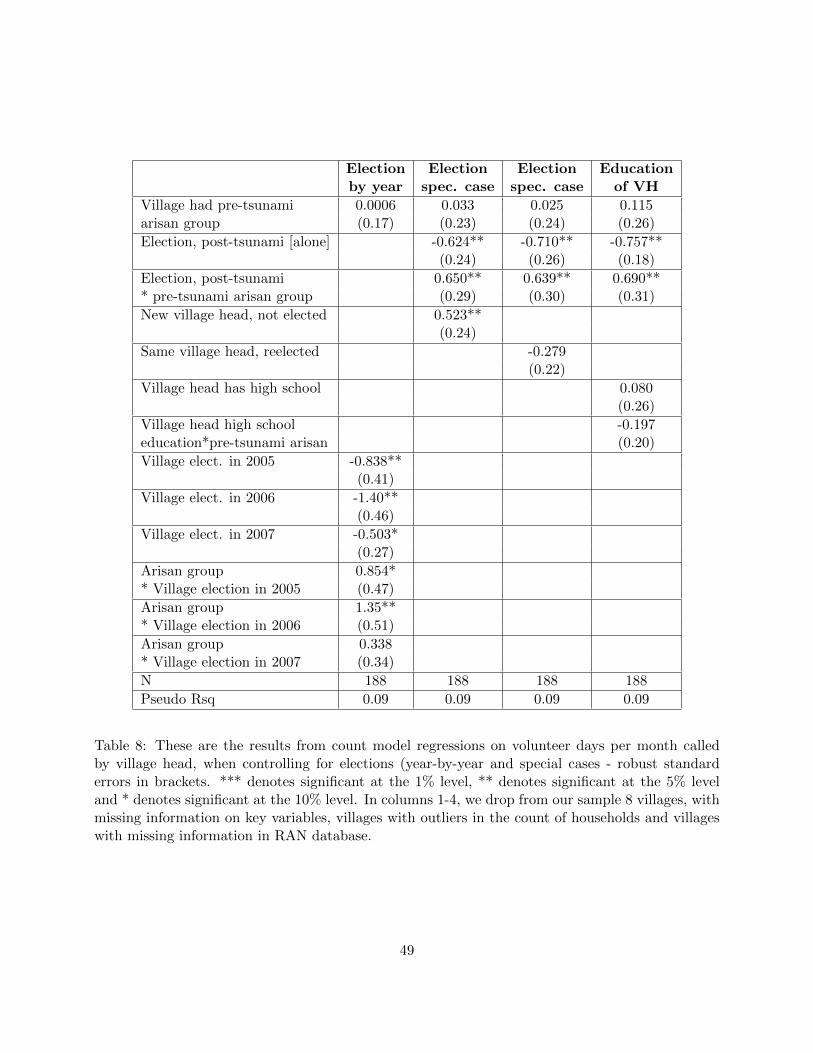
Election Election Election Educationby year spec. case spec. case of VH
Village had pre-tsunami 0.0006 0.033 0.025 0.115arisan group (0.17) (0.23) (0.24) (0.26)
Election, post-tsunami [alone] -0.624** -0.710** -0.757**(0.24) (0.26) (0.18)
Election, post-tsunami 0.650** 0.639** 0.690*** pre-tsunami arisan group (0.29) (0.30) (0.31)
New village head, not elected 0.523**(0.24)
Same village head, reelected -0.279(0.22)
Village head has high school 0.080(0.26)
Village head high school -0.197education*pre-tsunami arisan (0.20)
Village elect. in 2005 -0.838**(0.41)
Village elect. in 2006 -1.40**(0.46)
Village elect. in 2007 -0.503*(0.27)
Arisan group 0.854** Village election in 2005 (0.47)
Arisan group 1.35*** Village election in 2006 (0.51)
Arisan group 0.338* Village election in 2007 (0.34)
N 188 188 188 188
Pseudo Rsq 0.09 0.09 0.09 0.09
Table 8: These are the results from count model regressions on volunteer days per month calledby village head, when controlling for elections (year-by-year and special cases - robust standarderrors in brackets. *** denotes significant at the 1% level, ** denotes significant at the 5% leveland * denotes significant at the 10% level. In columns 1-4, we drop from our sample 8 villages, withmissing information on key variables, villages with outliers in the count of households and villageswith missing information in RAN database.
49

Probit : Tobit: Poisson: Probit: Ratio:Post-tsunami Log number RAND count Donor- defective
election of houses of projects implementer to totalor not in aid or not houses
Log number of households -0.0032 0.695** 0.214** 0.091 -0.237*post tsunami (0.05) (0.10) (0.04) (0.06) (0.13)
Survival rate 0.0088 -0.860** -0.048 -0.192 -0.047(hh post to pre-tsunami) (0.08) (0.30) (0.06) (0.12) (0.20)
Village had pre-tsunami 0.031 0.530 -0.087 0.165 0.348arisan group (0.08) (0.34) (0.13) (0.14) (0.29)
Mullah survive tsunami 0.031 -0.202 -0.048 0.0058 0.078(0.08) (0.17) (0.06) (0.09) (0.17)
Village head survive -0.314** n.a.(0.06)
Village in urban area -0.164 n.a.(0.11)
Ln(distance to Banda Aceh) -0.114 -0.030 0.047(0.08) (0.03) (0.04)
Ln (distance to Meulobah) -0.082 -0.011 0.096**(0.08) (0.02) (0.04)
Dummy: Pulo Aceh -1.33** -0.630** 0.232(0.50) (0.11) (0.18)
Post-tsunami election 0.358 -0.191 -0.100 0.180(0.36) (0.13) (0.16) (0.31)
Post-tsunami election -0.593 0.166 0.098 -0.370* Arisan group (0.45) (0.15) (0.16) (0.38)
No Rand projects -0.0007(0.01)
Donor-implementer -0.407**for housing (0.21)
Major housing provider 0.298is BRR (0.26)
N 190 178 176 167 165
Pseudo R-Sq 0.08 0.09 0.16 0.08 0.08
Table 9: Loose ends: Village has election since 2004 (marginal effects). Robust standard errorsin brackets. *** denotes significant at the 1% level, ** denotes significant at the 5% level and *denotes significant at the 10% level.
50
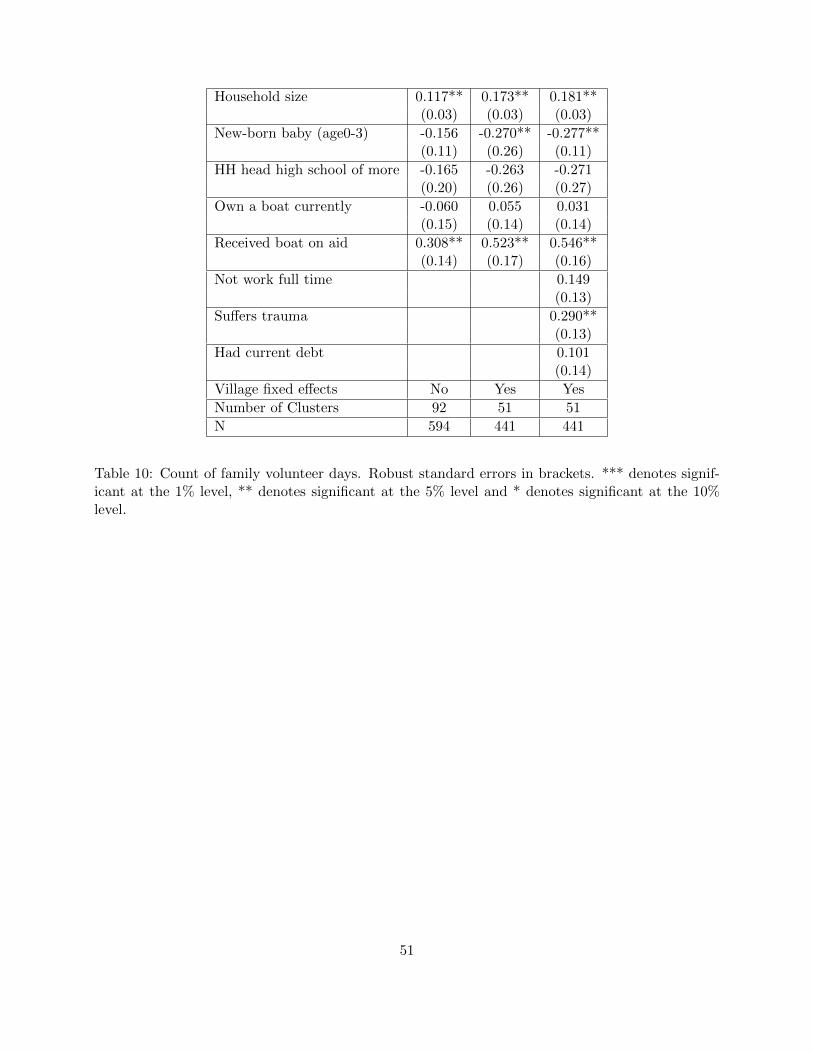
Household size 0.117** 0.173** 0.181**(0.03) (0.03) (0.03)
New-born baby (age0-3) -0.156 -0.270** -0.277**(0.11) (0.26) (0.11)
HH head high school of more -0.165 -0.263 -0.271(0.20) (0.26) (0.27)
Own a boat currently -0.060 0.055 0.031(0.15) (0.14) (0.14)
Received boat on aid 0.308** 0.523** 0.546**(0.14) (0.17) (0.16)
Not work full time 0.149(0.13)
Suffers trauma 0.290**(0.13)
Had current debt 0.101(0.14)
Village fixed effects No Yes Yes
Number of Clusters 92 51 51
N 594 441 441
Table 10: Count of family volunteer days. Robust standard errors in brackets. *** denotes signif-icant at the 1% level, ** denotes significant at the 5% level and * denotes significant at the 10%level.
51
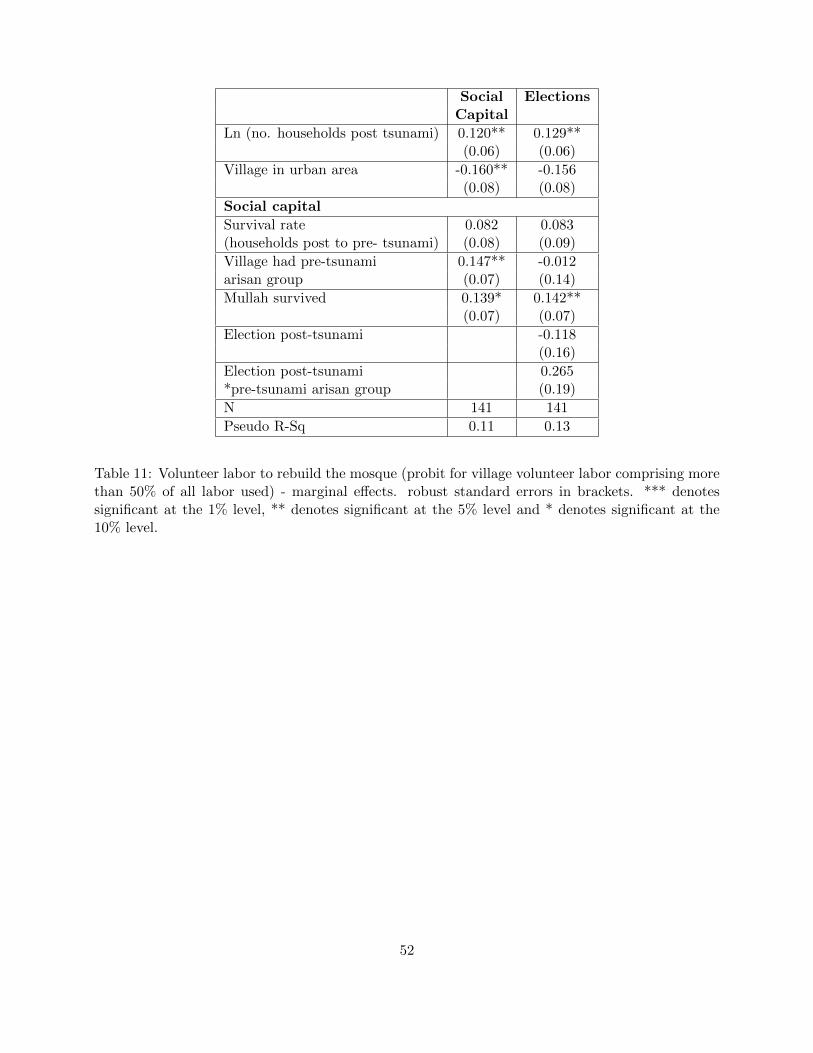
Social ElectionsCapital
Ln (no. households post tsunami) 0.120** 0.129**(0.06) (0.06)
Village in urban area -0.160** -0.156(0.08) (0.08)
Social capital
Survival rate 0.082 0.083(households post to pre- tsunami) (0.08) (0.09)
Village had pre-tsunami 0.147** -0.012arisan group (0.07) (0.14)
Mullah survived 0.139* 0.142**(0.07) (0.07)
Election post-tsunami -0.118(0.16)
Election post-tsunami 0.265*pre-tsunami arisan group (0.19)
N 141 141
Pseudo R-Sq 0.11 0.13
Table 11: Volunteer labor to rebuild the mosque (probit for village volunteer labor comprising morethan 50% of all labor used) - marginal effects. robust standard errors in brackets. *** denotessignificant at the 1% level, ** denotes significant at the 5% level and * denotes significant at the10% level.
52
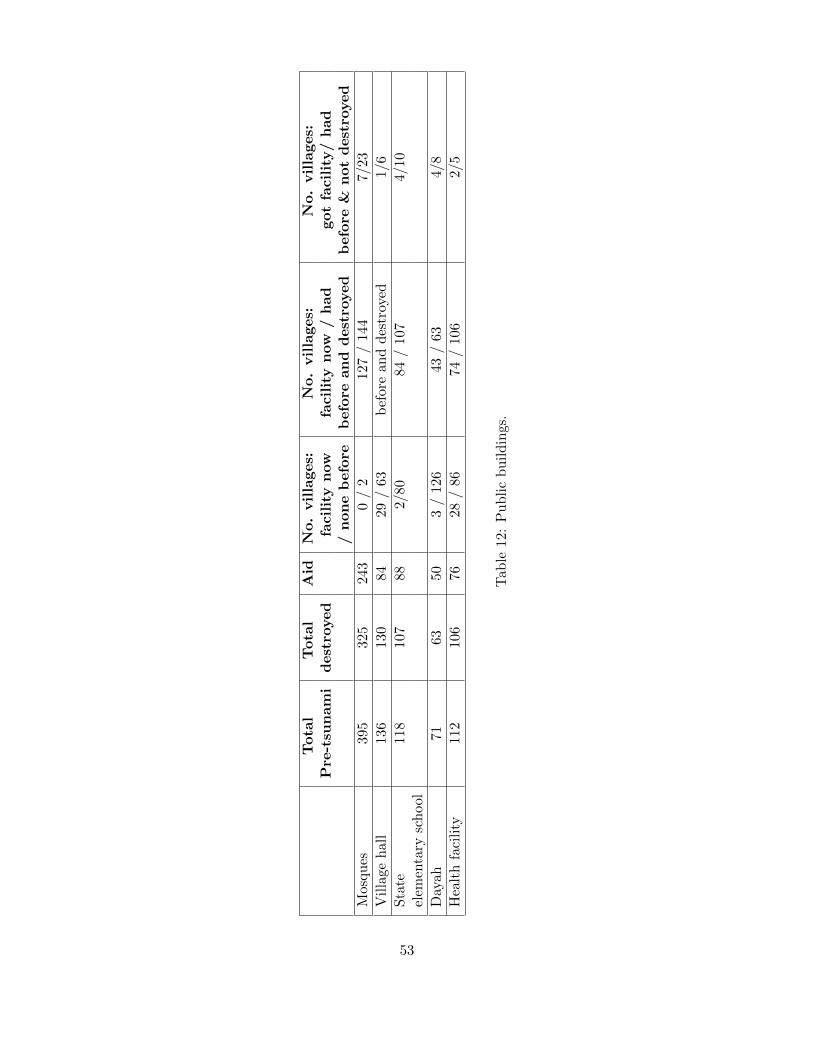
Tota
lT
ota
lA
idN
o.
villa
ges:
No.
villa
ges:
No.
villa
ges:
Pre
-tsu
nam
id
est
royed
facilit
yn
ow
facilit
yn
ow
/h
ad
got
facilit
y/
had
/n
on
eb
efo
reb
efo
rean
dd
est
royed
befo
re&
not
dest
royed
Mosq
ues
395
325
243
0/
212
7/
144
7/23
Vil
lage
hal
l136
130
8429
/63
bef
ore
and
des
troy
ed1/
6
Sta
te118
107
882/
8084
/10
74/
10el
emen
tary
sch
ool
Day
ah
7163
503
/12
643
/63
4/8
Hea
lth
faci
lity
112
106
7628
/86
74/
106
2/5
Tab
le12
:P
ub
lic
bu
ild
ings
.
53
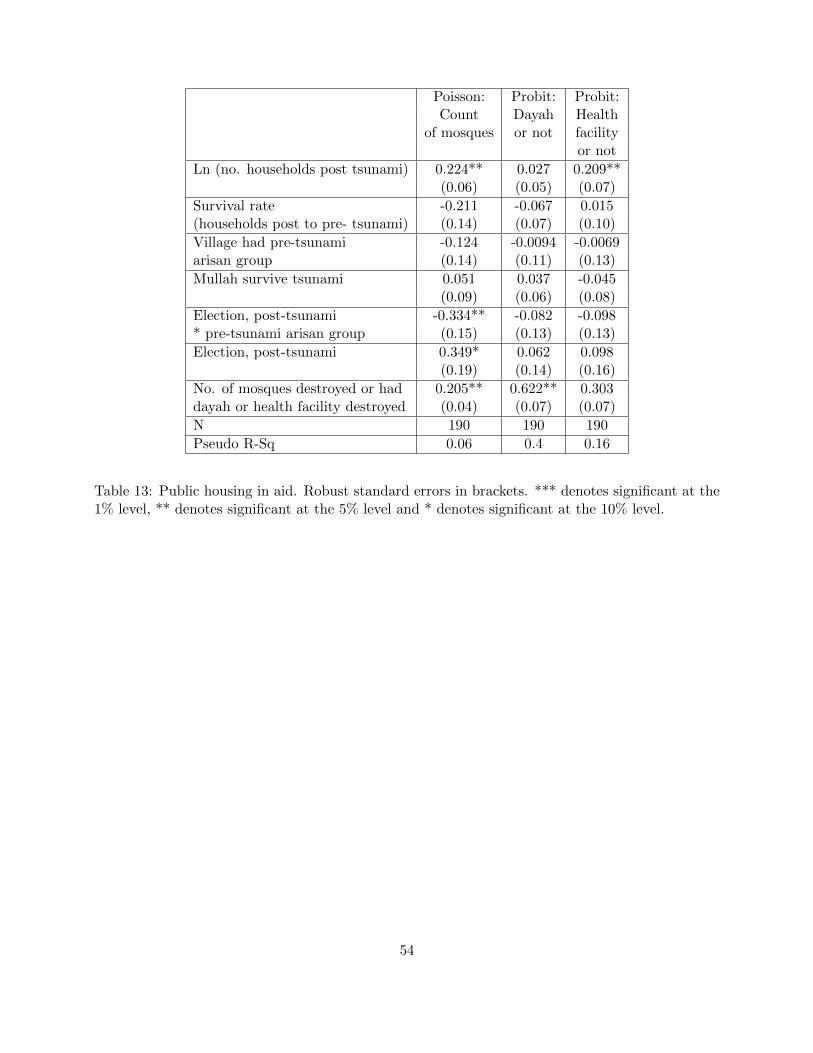
Poisson: Probit: Probit:Count Dayah Health
of mosques or not facilityor not
Ln (no. households post tsunami) 0.224** 0.027 0.209**(0.06) (0.05) (0.07)
Survival rate -0.211 -0.067 0.015(households post to pre- tsunami) (0.14) (0.07) (0.10)
Village had pre-tsunami -0.124 -0.0094 -0.0069arisan group (0.14) (0.11) (0.13)
Mullah survive tsunami 0.051 0.037 -0.045(0.09) (0.06) (0.08)
Election, post-tsunami -0.334** -0.082 -0.098* pre-tsunami arisan group (0.15) (0.13) (0.13)
Election, post-tsunami 0.349* 0.062 0.098(0.19) (0.14) (0.16)
No. of mosques destroyed or had 0.205** 0.622** 0.303dayah or health facility destroyed (0.04) (0.07) (0.07)
N 190 190 190
Pseudo R-Sq 0.06 0.4 0.16
Table 13: Public housing in aid. Robust standard errors in brackets. *** denotes significant at the1% level, ** denotes significant at the 5% level and * denotes significant at the 10% level.
54