village of north riverside, illinois village board meeting agenda ...
Upload
independentCategory
view
5download
0
1
Preliminary, incomplete draft Not for quotation Aid and village public goods: after the tsunami1
Tiago Freire, Brown University
Vernon Henderson, Brown University Ari Kuncoro, University of Indonesia
April 10, 2009
Abstract: Using survey data on fishermen and fishing villages in Aceh, Indonesia from 2005 and 2007, this paper examines the effect of the massive aid effort following the tsunami on village social and political institutions, participation in political and social activities, and local public good provision in terms of both capital and labor inputs. Such an examination informs not only our understanding of the impacts of aid on villages, but also our understanding of how villages allocate resources to public goods. The tsunami and aid effort prompted widespread village elections and replacement of surviving village heads, as well as those that died. We find that volunteerism and participation in village social group activities declined after the tsunami, while participation in political and aid lobbying activities rose. Volunteerism, or public labor inputs, is lower in villages with more aid projects, but that is offset if the dominant aid provider does its own implementation.. Volunteerism is higher in villages with higher pre-existing social capital; but in villages with more “democratic” activity such as elections, volunteerism is lower. Correspondingly, villages with more democratic activity combined with more aid projects tend to emphasize garnering private aid (e.g., houses) at the expense of public aid (e.g., public buildings).
The tsunami of December 2004 devastated major coastal cities and villages of
Aceh, Indonesia. In affected coastal areas, well over half the population died and almost
all physical capital was destroyed: housing, boats, schools, and local health clinics. Local
fishermen’s credit unions and their records were wiped out. The destruction and ensuing
publicity resulted in a truly massive aid effort. Beyond the initial clean-up efforts, the
infusion of aid replaced almost all lost capital for the remaining population—houses,
boats and public buildings within two and half years. Under the rubric of sustainable
development, some aid efforts focused on institutional reform: land titling, credit market
bolstering, joint ownership of boats and the like. Although some types of aid such as
coastal environment restoration lagged, what seems distinctive about the aid effort is the
multitude of NGO’s with budgets that had to be spent, presenting an almost over-
1We gratefully acknowledge the support of the National Science Foundation (SES 0416840), which made this project possible and continuing support from NIH (R01 HD057188). We thank Ifa Isfandiarni and Zakir Machmud of the University of Indonesia for their efforts in supervision of the survey. The work has benefited from helpful comments by Andy Foster and seminar participants at LSE.
2
whelming magnitude and array of aid and of aid agencies with which village leaders had
to negotiate. In fact now at the end of the aid effort, where the official process ends April
16, 2009, there is still $250m left over (Jakarta Globe March 2, 2009), in a context where,
despite massive loss of life and households, aid gave 134,000 houses for 120,000 houses
destroyed (Xinhua News Service, February 1, 2009).
Using data for 199 villages and 543 fishing families, this paper examines the
effect of the massive aid effort on village social and political institutions, participation in
political and social activities, and local public good provision in terms of both capital and
labor inputs. While the outcomes of focus will be the choice of public versus private
goods in a village, these are mediated by social and political institutions, the form of aid
delivery, and changes in political processes because of the aid process. Examining these
issues will inform us about the impact of a disaster and massive relief effort on village
institutions and what factors influence village choices about labor contributions to public
goods and the allocation of aid between private and public capital. While this is a not a
normative paper, understanding the various effects may contribute to shaping better aid
delivery processes.
The literature on aid suggests that increased aid may lead to a decline in public
good provision, in part because individuals spend more effort lobbying for aid to be
distributed in the form of private aid to enrich themselves, as opposed to public goods
(Svennson, 2000). Knack and Rahman (2007) further argue more donors may erode local
bureaucratic quality and capacity, which could reduce villagers’ incentives to invest in
public goods and the ability of remaining leaders to marshal public effort. However, the
literature suggests that outcomes are affected by the stock of social capital, which may
make cooperative outcomes more sustainable (Sobel, 2002). In an empirical paper that
relates to some of the work in this paper, Labonne and Chase (2008) examine community
driven development programs in the Philippines. They find that in villages where such
programs are assigned, compared to the control group, people spend more time
“lobbying” for benefits and less time participating in social-network activities. Finally,
political economy models suggest the form of village political institutions may have a
strong effect on outcomes (Persson and Tabelli, 2000). For example, Foster and
Rosenzweig (2004) argue that a greater degree of democracy leads to greater provision of
3
public goods of more universal appeal, although Acemoglu and Robinson (2006)
question the effect of greater democratization. The work in Munshi and Rosenzweig
(2008) suggests that changes in political institutions may result in villagers seeking
different types of leaders in a Besley and Coate (1997) framework. This idea will be
important in our work.
We focus on two types of public good outcomes in the paper. The first involves
labor inputs by villagers into local public goods. A common practice in Indonesia is for
village heads to call for several “Islamic” volunteer days a month, where villagers
volunteer to clean-up the village, dig aquaculture channels, plant mangroves or otherwise
fortify the shoreline, construct or repair public buildings, and the like. The village head
has to decide whether to call for volunteer days and then individual villagers have to
decide whether to participate or not. The second type of public good is physical capital in
the form of public buildings. Villages make choices as to whether to focus on garnering
private aid (e.g., houses and boats) as opposed to aid for public buildings.
While the processes driving these two outcomes have similarities as we will see,
they have some fundamental differences. Volunteer days require the leader to both want
to assemble village public labor and to be able to induce volunteerism. As we will see
volunteerism is affected by indicators related to the extent of village social capital, the
extent of lobbying and political activities, and the form in which aid is given which will
affect village monitoring costs and the degree of conflict over aid allocation within the
village. However the choice between public and private buildings seems more affected by
the way in which villages make political choices which determine whether the village
will focus on garnering more public versus private aid.
The tsunami and aid effort had a huge impact on village political institutions and
type of leadership. Based on surveying in 2005 and related fieldwork 5-6 months after the
tsunami, the survival of village leadership such as the village head and mullah had a
strong effect on initial outcomes, with these traditional leaders trying to retain autonomy
of the village with the advent of outside aid. However the problem is that, the type of
village head a village wants during a massive relief effort may be very different than the
type under traditional business-as-usual. In a Besley and Coate (1997) framework,
villagers may want a leader who is more competent in dealing with foreign NGO’s, and
4
may want a leader with different preferences for private versus public aid (Munshi and
Rosenzweig, 2008).
In the 2 and ½ years following the tsunami, two thirds of our villages had
elections. These usually occurred because the pre-tsunami village head perished,
prompting an election; or because a regularly scheduled election occurred -- about 20%
of villages are supposed to have an election each year on an overall 5 year election cycle.
Reportedly in some cases where village heads survived and no elections were scheduled
automatically, disputes in villages over aid allocation prompted elections.
Apart from the fact that elections appear competitive, two things stand out. First
and to an extraordinary degree, 80% of the cases, village heads who survived the tsunami
but faced an election generally lost that election; being an incumbent did little to stem the
tide of change. Second and presumably related, new village heads are much better
educated than original ones. What is the impact of this regime switch on villages? We
will show for example that public inputs are distinctly lower in villages which had
elections. The issue is why. For volunteerism, democratic events and elections in the face
of massive aid may stir up contention within the village making cooperation more
difficult and inducing time-intensive political lobbying to shift a focus to private aid, both
lowering inputs into public labor. For public buildings, traditional village heads could
have a paternalistic view for the village that better internalizes public good externalities;
or, alternatively, could benefit more from corruption possibilities in provision of public
goods. Election processes may allow the majority to vote into office a candidate who
focuses on private aid of immediate benefit to the majority, perhaps at the expense of
public aid. For example, public aid while improving overall village outcomes in the
future may disproportionately improve productivity of a minority.
Besides, election processes, we have information about how villages make
decision concerning the allocation of aid within the village and what priorities the village
sets in recruiting and accepting aid, Villages differ in the choice mechanism they state
they use in making immediate choices. In particular, some villages claim such decisions
are made at village hall meetings, while others claim the village head makes such
decisions. Surprisingly, the mechanism itself seems generally uncorrelated with village
circumstances—political, social capital, loss of leadership, elections, and the like.
5
However it seems to affect choices over public versus private aid. The decisions of a
village head may induce different outcomes from those of a village hall meeting, with
both its majority rule and potential for log-rolling.
We first turn to an overview of the data and some background on the project and
disaster relief, so as to provide a context for the current paper, and the questions it will
investigate. Part of that context also involves an overview of the whole aid process. We
then turn to a conceptual framework for individual and village level public good
decisions making. In the third section, we formulate our specific empirical hypotheses,
which require detailing aspects of village institutions and forms of social capital. The
fourth and fifth sections give our results.
1. Disaster relief and our data
In this section, we start with a description of our data and then we outline issues in the
literature, which also indicate the scope of the project.
1.1 Data
In summer and fall 2005, we surveyed village heads and local heads of the
fishermen’s association in 111 fishing villages and we surveyed 540 households that
identified as fishing boat owning families in 72 of those villages. In summer and fall
2007 we resurveyed the 111 villages and added another 88 villages, which were further
away from the capital Banda Aceh, and were inaccessible in 2005. Besides resurveying
most of the original 540 fishing families, we added two types of families and expanded
coverage of fishing families to 26 more villages (beyond the original 72), mostly further
down the coast from Banda Aceh in more traditional fishing areas. We added 151
families that had never owned a boat before but got one through the aid process; and we
added about 200 families that were former boat owners, focused on the 26 new villages.
We will resurvey these villages and fishing families in late 2009 and again in 2012. By
the 2007 survey, as we will see much of the aid effort to villages was “complete”.
However the official deadline on the aid process was early 2009 and some effort is being
made to extend that deadline because there is aid money left over.
For the 199 villages, the intent is to cover the universe of fishing villages, defined
as all villages with a significant fishing presence pre-tsunami, in contiguous districts, as
6
we move south and north-east of Banda Aceh, trying to cover all fishing villages in three
districts (Banda Aceh, Aceh Jaya, and Aceh Besar) and those up to a defined geographic
limit in two other districts, moving east from Banda Aceh into Pidie (the last sub-district
surveyed is Meurah Dua) and moving south into Aceh Barat (the last sub-district
surveyed is Meuruebo). These include villages on islands offshore for these districts. The
data now cover 31 sub-districts in the 5 districts. All villages were affected by the
tsunami, although some, such as those in Pidie, were more protected and lost less housing
and population. There are no unaffected fishing villages, within the same general cultural
area.
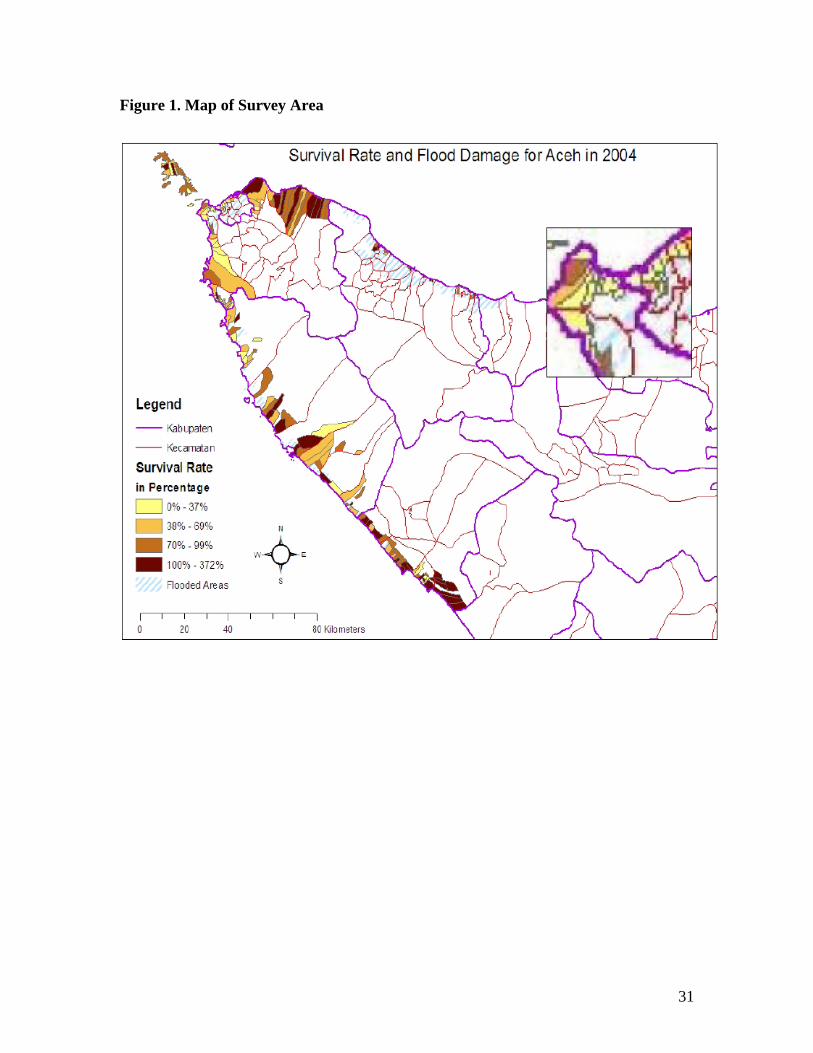
Figure 1 shows a map of the survey area, with a blow-up (right side in figure) of
the Banda Aceh area (upper-left part of figure). The map shows household survival rates
by village (yellow being the worst). Unfortunately, the map is based on the government
rendering, post-tsunami, of village boundaries. In that dimension the map is grossly
inaccurate. We took GPS readings of the center (the mosque) of the living area of each
village. In 6% of the cases is that GPS reading within the village boundaries. In 15% of
the cases, it is over 10 kilometers away. Coastal villages are drawn as non-coastal and
vice-versa which explains why, in parts of the map, a yellow (low survival) village may
be shown next to a supposed coastal village which is dark (high survival). Nevertheless
the map pictures the general survey area.
The village survey asks questions about education, experience, and survival of
village and religious leaders; population composition by sex and age both before and
after the tsunami; occupational structure; use of village lands and destruction of lands,
seawalls, aquaculture areas, docking areas and mangroves by the tsunami; pre- and post-
tsunami data on political, legal, and social institutions; pre and post tsunami information
on physical capital (houses, boats, public buildings); detailed information on initial and
ongoing operations of NGO’s, local governments, and relief agencies providing housing,
boats, public buildings and restoration of the coast line; and detailed information on the
village fishing industry pre- and post-tsunami, including questions on marketing, fishing
fleet composition, catch composition and boat replacement.
7
For fishing families, the sample of initial boat represents 25% of pre-tsunami boat
owners and 45% of surviving boat owners in these villages.2 This module asks pre- and
post-tsunami information on boat sizes, features, catch, marketing and boat aid and boat
sales and purchases; family structure, occupations, debt, and earnings, participation in
village social, political, and volunteer activities; housing conditions and along with
questions on land titling; emotional trauma suffered by the respondent; and the like.
Apart from the analysis in this paper, these data suggest a number of analyses. We
briefly examine issues in the literature that inform this paper and subsequent work in the
project. In the disaster literature, there is work on whether trauma is debilitating versus
spurs a greater focus on the communal activities (Fitz 1961 and Erikson 1976, 1994). But
the economics literature asks whether areas return to their equilibrium path, after a
disaster (Davis and Weinstein, 2002 and Miguel and Roland, 2006), although a focus of
modern aid is “sustainable” development (Brown, Crawford, and Hammil, 2006), which
might be explicitly interpreted as altering the equilibrium path. On a micro scale
sustainable development plays out in the occupational and technology choices of pre-
tsunami fishing families. The literature on institutional reform and development
(Townsend 1994 and Field 2005) is relevant to the notion of sustainable development.
Will new institutions, such as the aid-induced RALAS project in Aceh to formally title
lands within villages, be sustained over time?
There is a large literature on the efficacy of and best ways to deliver aid, discussing
conditionality and agency questions (Collier et al. 1997, Azam and Laffont 2003,
Svennson 2003, and Murrell 2002), strategic considerations (the Samaritan’s dilemma in
Pederson 2001 and Torsvik 2005), co-ordination across agencies, village “ownership” of
the process and the like (e.g., Kanbur and Sandler 1999, Easterly 2002, and Paul 2006).
The aid process in Aceh ended up being unconditional and largely uncoordinated. The
2 The initial frame for this survey was a random sample from a list of pre-tsunami fishing boat owners assembled by the provincial level fishermen’s association-- Panglima Laot [PL] working with an NGO; but the list was amended in the field. Those resurveyed tend to be mostly boat owners who survived the tsunami. The initial survey was carried out under incredibly difficult and traumatic circumstances, with respondents scattered in refugee camps. In the field, there was some over-sampling in a few more accessible villages, although in principle still randomly sampled within that village. Since we know the overall fishing statistics for each village from the village survey (in particular, boat types and catch composition and levels), we can check for representativeness of the sample in terms of boat types and catches, and in terms of observables the sample seems representative,
8
government agency overseeing the process, BRR [Executing agency for the rehabilitation
and reconstruction of Aceh and Nias], largely defined its role as (1) a clearing house
recording aid and recommending, if asked, where an NGO might focus aid and (2) late in
the process filling in ex post gaps in private aid and more particularly public aid. Given a
complete lack of conditionality and co-ordination, we will focus more on agency issues.
Finally there are issues of inequality (Becker and Tomes, 1979, Loury, 1981,
Mookherjee and Ray, 2002 and 2006). The tsunami and subsequent aid process was
equalizing: almost all private and financial capital in villages was destroyed and villagers
largely got the same level of aid. Will the socio-economic rankings of families that
existed pre-tsunami re-emerge in ten years? That is, were original divisions driven by
wealth differences and capital market imperfections, as opposed to ability differences?
2. Aid in fishing villages
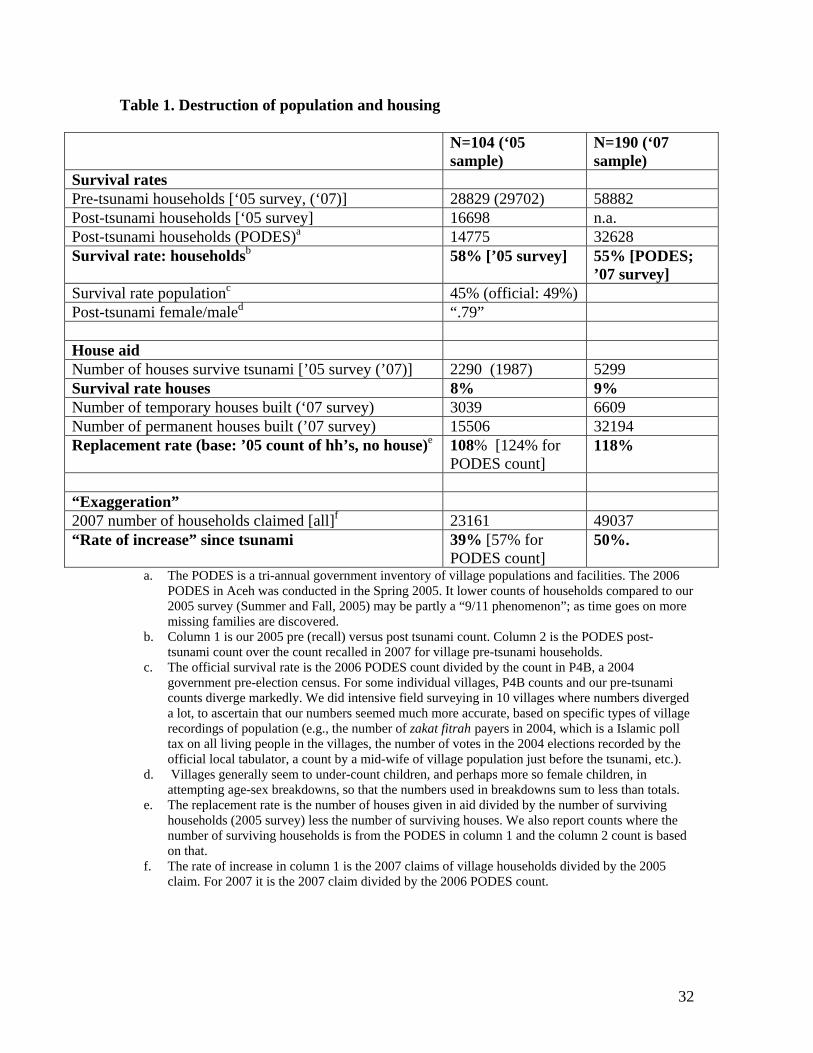
Table 1 presents an overview of destruction and house aid in our villages, where
house aid accounts for much of overall aid within the village. There are two samples: in
the first column, numbers are reported for 104 villages we surveyed in 2005 for which we
have complete 2005 and 2007 information on a variety of characteristics, as well as
official government data pre and post tsunami on village households and population.
Column 2 reports on 190 villages where there is a complete information requirement for
2007, as well as official government data. Government data on pre-tsunami populations is
problematic, given limited survey conditions under the 25 year secessionist movement in
Aceh, a conflict only resolved in mid-2006.
Key information in Table 1 is as follows. The survival rate of households is about
58% -- that is 42% of households are effectively wiped out, meaning no surviving
independent adults. The survival rate of population in a sub-set of our villages is 45%,
and that is similar to the government official survival rate of 49%. Almost all houses are
destroyed in fishing villages. If we add together surviving houses and the number of
permanent houses given in aid, relative to the number of surviving households, there are
now 1.08 permanent houses per surviving houses according to our higher household
count, as opposed to the government post-tsunami count which suggests even more
houses per household. In addition, some the houses reported as “temporary” by villages
9
may be viewed as permanent by aid agencies. Houses built of wood (even if well built)
are considered temporary in local climatic conditions; however their long term efficacy
depends on whether the foundations are cement or not. Regardless, in the aggregate,
private house aid looks pretty complete. Of course the amount of aid given varies across
village. And villages have had new family formation as people remarry and young adults
move out of the house, which has prompted village calls for more housing aid. We
examine these issues in a companion paper; there we also show that this completion of
private aid appears to also hold for boats, based on numbers of surviving captains.
In 2005, we found that house and boat aid at that time, both delivered and
promised, were closely connected with survival of village leaders—the village head and
local religious leader [mullah]. Also in 2005, it looked like villages were going to be
adopted by specific aid agencies, who offered comprehensive plans for recovery and
replacement of village capital. We found that aid and adoption were apparently resisted
by surviving leaders, who wanted to retain control of village affairs. By 2007 the aid
process was so overwhelming, that adoption was no longer a relevant concept and
survival of village leaders, elections and political changes had no effect on the level of
private aid delivery. 3
Table 2 shows the aid effort from a different perspective: the count of aid
agencies a villages faces. We identified the agencies involved, as perceived by a village,
in provision of houses, boats, seven types of public buildings noted below, and
replacement of the coast line (seawall, mangroves, trees, etc). The median and average
number of agencies listed as being in villages is about 7 -- seven different NGO’s that a
village head needs to negotiate with and co-ordinate. That number masks a much larger
array of donors behind the process and a much larger array of on-the-ground contractors
3 The exception is boat aid. If the local head of the fishermen’s association is also head of the lagoon (the unit at which the PL regulates fishing across villages), a village got more boat aid. Also there is a strategic element that appears which we call “exaggeration”. The count of pre-tsunami houses is hard to fudge, because of village collective post-tsunami mapping exercises of all land holdings; because, although the tsunami destroyed house walls, foundations were generally left; and because of government pre-tsunami counts;. What villages claim is over a 50% increase in the number of households between 2005 and 2007, an increase that is uncorrelated with post-tsunami demographics (village average household size, males to females, adults to children). In regression work in the companion paper, these “exaggerated” claims are correlated with higher aid levels, ceteris paribus. For boats there are no records of pre-tsunami boats; but by 2007 villages are recalling there being 30% more pre-tsunami boats than in 2005. Again such claims seem to be rewarded.
10
who are sub-contracted to do construction. Government numbers [RAND] suggest 11
different NGO’s per village, but perhaps more relevant to our work, RAND identifies the
number of different, officially recorded) aid projects in a village (each, in principle,
negotiated separately). The mean and median are both about 30. In our 198 villages, 117
different agencies are named by village leaders (where we did some consolidation of
NGO’s named, which have different organizational sub-divisions); and 57 different aid
agencies are providing housing. We do note that, in over half the villages, 85% or more
of house aid as perceived by village leaders is provided by one agency, so there is some
degree of specialization within villages.
For later reference, we note that, in 69 villages, house aid is provided by a “donor-
implementer ” where that definition is based on the BRR data base [“RAND”]. A donor-
implementer is a donor agency that as a rule does its own implementation, either directly
hiring the labor to be used in construction, or else closely monitoring any sub-contractors.
This helps solve the agency problem that arises when donors differ from implementers
and sub-contractors are used with minimal monitoring. As an example of poor
monitoring issues, for some non donor-implementers such as Oxfam, World Bank,
Spanish Red Cross and American Red Cross, villages report over 13% of houses-in-aid
from these agencies are abandoned/uninhabited (due to poor construction). For boats
overall the abandonment rate is over 20%, with major donors like Oxfam and the
International Medical Corps, as well as the government (BRR), having very high
proportions of unusable boats.
Finally in Table 3, we turn to public buildings. We distinguish two forms of
public buildings—mosques, both regular and masjid (great) mosques, and other public
buildings which consist of village assembly halls for village meetings, fishermen hall for
meeting of fishermen, state elementary schools, Islamic schools (dayah) and health
facilities. Mosques are an “essential” part of village life. In many villages, reconstruction
using village volunteer labor started before any other permanent reconstruction; and we
will examine the use of volunteer labor in mosque reconstruction below. We don’t treat
mosques as an entity of choice to be traded-ff against private aid; nor do regression
results support that. Rather we focus on other public buildings.
11
Table 3 indicates that replacement rates for either mosques or public buildings are
well below 100%. Note there are multiple mosques per village (averaging 2 pre-tsunami).
With a loss of 42% of households and over 50% of population, it isn’t clear what an
appropriate replacement rate is for any facility. Except for mosques, many villages had
no facility of various specific types to begin (column 4). They did without, used facilities
of a neighbor village, or used the mosque. Islamic schooling and village meetings might
be held in the mosque. For village halls and health facilities in particular, many villages
without a facility pre-tsunami got one in the relief effort, to some extent driven by donor
demands to build and locate facilities. For example an Australian agency, AIPRD built
49 village halls. BRR is heavily involved in building of facilities, except oddly for state
elementary schools which come from an array of private donors.
Column 5 of Table 3 shows the share of villages which had a facility (perhaps
multiple for mosques) before the tsunami, and have none now. Mosques have the highest
replacement rate at 88%, followed by schools at 79%. Others are in the 63-79 range,
except for fishermen’s halls at 33%. The last column shows that some villages where
facilities existed and were not damaged, got either an additional one or a new one. There
is a lot of action in the public building numbers of non-replacement and of new
acquisition. We will argue that rates of public building acquisition are not independent of
village choices or recruitment efforts at the margin between public and private aid; and
these choices are affected by the local political situation. However we note the overall aid
process officially only ends in April 2009. In mid-2007 BRR officials characterized the
aid process as being largely complete; and most remaining BRR activity would be
focused on evaluation. But we do expect between 2007 and 2009 there will have been
more construction of public facilities so we may be looking at interim choices.
3. Conceptual framework for public good choices (incomplete)
The simple model in Svennson (2000) suggests that, as aid goes up, villagers will
spend more time lobbying for private aid and that, uncertain specifications, public goods
may decline. Labonne and Chase (2008) suggest that, with resources up for grabs, people
will spend more time lobbying and less time in social-group activities (or social capital
investments). In a more nuanced context, public good and private goods interact in terms
12
of either productivity of private endeavors or pleasure in private consumption and
individuals are heterogeneous, where, for example, returns to private aid in the form of
capital differ across people. Then responses to increased aid might vary with productivity
per se, as well as being influenced by the specification of complementarity between
private and public inputs.
Such specifications involve simple Nash non-cooperative choices as to lobbying
for more private aid versus having more investment in public goods. Again in more
nuanced contexts, outcomes are influenced by the prevailing institutional and social
environment. First, greater pre-existing and surviving social capital in a village may
enhance the likelihood of more co-operative outcomes (Sobel, 2004). Second, outcomes
may depend on political processes. Having an election sparks “democratic debate” within
a village.
As noted above, representative democracy models (Besley and Coate, 1997)
suggest villages must make trade-offs in choosing a leader—competence versus
preferences for public goods— and outcomes may reflect the trade-off of the median
voter. Here we compare villages which have an election during the aid period versus
those which do not. The latter are generally ruled by a surviving village head (in some
cases with no election in many years, or ever). Such a village head may either
paternalistically solve the public goods problem for the village as a whole, or may be able
to benefit more from corruption in public goods aid. With elections, the median voter
may want greater competence in dealing with aid agencies but may perceive little
personal benefit (in terms of enhanced productivity) from more public goods, even if the
village as a whole has great productivity gains. Majority rule (absent side-payments) may
lead to election of a head who prefers less public goods than would enhance productivity
for the village as a whole. In terms corruption, either a village accepted a “small-time”
corrupt village head pre-tsunami but chooses to elect less corrupt village head post-
tsunami; or village heads with experience are more adept at corrupt practices. Certainly
as we will see, there is a dramatic change in the types of village heads which villages
choose pre and post tsunami and elections have significant impact on outcomes.
Villages also cite different village mechanisms for deciding aid allocations,
engaging NGO’s, and dealing with NGO initiatives. About 60% cite that housing aid
13
allocation mechanisms and prioritization of recipients were made at village hall meetings.
While, again such meetings might seem more democratic, they take up time and may
impose majority rule. And they may facilitate logging rolling behavior to garner more
private aid for log-rollers.
4. Social and public goods participation and village institutions
The theoretical work by Svennson (2000) and empirical counterpart in Labonne and
Chase (2008) suggest that activities which might be construed as having a lobbying
component will go up in the face of an aid effort, while those that have a public flavor
will go down. We look at the basic patterns in our data. We start with social and political
participation and contributions to village public goods. Then we turn to a description of
political institutions.
4.1 Social and political participation and contributions to village public goods.
Social capital. For “social capital” measures, or activities representing investment in
village networks we have two main items in our data. First rotating saving and credit
associations (RoSCA), called arisan groups in Indonesia, are popular. Such groups,
usually composed of women meet regularly, with each member contributing a fixed sum
to a pot and then taking the pot on a rotating schedule. While, the original theoretical
work on such associations (Besley, Coate, and Loury, 1994) emphasized that they existed
to alleviate credit market imperfections, empirical work suggests a strong social
component, with participation rising with wealth and complementing (in terms of
correlations) rather than substituting for credit institutions, at least in Indonesia
(Varadharajan, 2004). We view the existence of arisan groups in a village as a measure of
social capital. Similarly, with a social component, but with more social pressure to
participate, are Quran recitation groups. In Table 4 we look at pre and post-tsunami
participation in these two activities.
Table 4 shows the number of villages reporting the existence of arisan groups
from village level surveys. Second it reports individual pre-and post tsunami participation
on a matched sample of households reporting on pre-tsunami participation in 2005 and
post-tsunami participation in 2007. For the latter, we have the whole sample, based on
fishing families where generally the male household head survived. However many wives
14
who would have participated pre-tsunami in arisan groups died; and most household head
have since remarried. Thus we also look at a sub-sample of households where the wife
survived and there is an adult female present in 2007. Both the number of arisan groups
and participation in arisan groups drops, although only significantly so for the sub-
sample.
Quran recitation groups which meet regularly are again female. Most villages
claim to have such a group pre and post tsunami. However post-tsunami participation of
households falls dramatically, from almost universal participation pre-tsunami. For the
overall household sample, the change is significant at the 5% level and for the sub-
sample of surviving wives at the 10% level.
“Lobbying”. For measures of political participation which could be construed as
measures of efforts to garner resources, we are more limited. For fishing boat owners in
2005 versus 2007, we know their participation in the regularly scheduled “Friday
meeting” in which affairs of the local fishermen’s association, including potentially boat
aid and reconstruction of mangroves, are discussed. In Table 5 we show that such
participation rises, although not significantly. Second, at a village level, we know about
participation of fishing captains as representatives in higher levels of the fishermen’s
association, PL. Villages can have representatives at the lagoon level (covering several
villages), district level, and or provincial level. PL was critical in the distribution of boat
aid and formulation of NGO policies in the distribution of such aid. Greater village
participation in the higher levels of the PL could generate significant gains in private aid
received for the village as well as for the individual participants. For 102 villages with
information in 2005 and 2007, we see that, both the mean and median number of
representatives at higher levels of PL rose significantly. Finally, we know attendance at
the last village hall meeting, but we have no pre-tsunami information. We can only
comment that rates seem high.
Volunteerism. A key outcome, in terms of public good provision, below will be
(Islamic) volunteer days, where the village head calls so many volunteer days for the
month and then households decide whether to send an adult male member to participate.
Table 6 gives some basic numbers. The number of villages regularly calling volunteer
days each month declines dramatically, as does the average number of days called per
15
month for those having volunteer days. We didn’t ask individuals to recollect their pre-
tsunami participation; but we note post-tsunami, 48% of our matched households
participated in volunteer work in the prior month.
Summary. The raw data are consistent with the Svennson (2000) and Labonne and
Chase (2008) hypotheses. Participation in social group activities falls; lobbying-type
activities increase or at least seem very high; and public good inputs in the form of
volunteer days decline. The more nuanced hypotheses where villages with greater social
capital might have greater public good inputs; or people’s participation or contributions
to public goods depend on their heterogeneous circumstances such as aid received and
measures of inherent productivity await econometric analysis below. However as we
have emphasized, such choices will also be influenced by the local political environment
and situation. Given that we now turn village politics.
4.2 Local politics
Elections in Aceh pre-tsunami were problematic because of the secessionist
movement of the last 25 years. The movement and army reaction delayed the local
democratic reforms that occurred earlier in other parts of Indonesia. Some basics on
political institutions in Aceh are given in Table 7a, and indicate some issues. For
example, while 78% of villages now report they use direct democratic vote (universal
suffrage with secret ballot) as they are supposed to, that still leaves 22% which use
another election method such as voting at a village hall meeting (in which women are less
likely to participate) by either secret ballot or, worse, by a show of hands. Moreover, 27%
report changing their election method post-tsunami. Although under reforms all villages
are supposed to have elections (on a differential schedule) every 5 years and there is a
mass point at 5 years, there is an equal size one at 6 years and a smaller one at 8, with
numbers ranging up to 20 years. Thirty-seven villages have had no election since 1999,
beyond any notion of a regular democratic cycle. Indonesia has gone through changes in
election cycle timing; so, while 5 years is the current standard, in the past 6 and 8 years
have been standards and village may be slow to adjust. Villages with no election since
1999 are clearly beyond the pale. On the up-side, elections are generally reported to be
competitive, with multiple candidates in the final round. Villages generally have a village
council, although they are perceived as larger ineffective and are a council of “elders”
16
(read village elites). Journalist writings suggest that during the secessionist period many
of these councils performed no function. Elected councils with strong powers that are
supposed to be part of Indonesian democratization have yet to take shape in Aceh.
We note three items. First there are villages which had no election during the aid
process and ones that did. For those without, these are generally villages with surviving
village heads who have not faced an election since 2004. These village heads made aid
decisions, potentially paternalistically (corruptly?), not subject to the immediate pressure
and scrutiny of an election. In contrast are the two-thirds of villages which had an
election post 2004 by the time they are interviewed in the summer of 2007; almost all of
these are post 2005. Which villages had an election? In principle if a village head dies,
there is a replacement process until the next election. However it seems in the data, that
the (exogenous) death of the village head from the tsunami prompts an election (in 87%
of the cases). Then there are villages where the village head survives but faces a
scheduled election after 2004 and before mid-2007. The issue raised above is whether
exogenous election cycles drive the advent of these elections, or whether there is also an
element of elections prompted by aid disputes. For surviving village heads, 60% have an
election in the 2.75 years after the tsunami, which seems like an appropriate rate on a 5-6
year cycle. We start by presuming that the event of a village having an election since
2004 is exogenous, but experiment with IV estimation.
Second, as Table 7a reveals, surviving village heads who face re-election lose in
81% of the cases. That is a phenomenal rate of loss for incumbents in any election
process. This indicates the desire of villagers for a new type of leadership, post-tsunami.
Third and related, new village heads have dramatically better education than those
surviving heads who are still in office. Overall, only 41 of surviving village heads who
are still in office have a high school degree or more. In contrast and significantly higher,
72% of village heads who are new post-tsunami have completed at least high school, with
little difference between village where replacement is prompted by death of the original
village head or by election cycles. These differences even appear in 2005 without
elections; new (and typically temporary until an election) village heads mostly replacing
those who died have significantly more education than surviving heads in office.
17
5. The determinants of volunteer labor
In our villages we have two types of volunteerism, which are observed. First and
foremost are (Islamic) volunteer days, which are called by the village head for purposes
of using volunteers to provide public goods and public investment. We observe these in
two ways: the number of volunteer days called at the village level in the month prior to
the 2007 survey and, for individual families in 88 villages, the number of volunteer days
devoted by the family in the past month. Counts run from 0 to 8. In both cases, we looked
at the problem both as a discrete choice over days versus no days and as a count. Results
are similar but we use the count formulation because it is more informative. We focus on
the village level results but also look at individual family choices. The other type of
volunteer labor occurred in the early months following the tsunami. A number of villages
started to first rebuild their mosques, using village volunteer labor. We examine which
villages did this and which did not.
5.1 Volunteer days called by the village head
We start with a basic count formulation which models the expected number of volunteer
days called per month in village j, jλ , as
exp[ ]j jXλ β= ,. (1)
a form which is convenient for defining elasticities. jX are village characteristics
including measures of social capital which might enhance village cooperation, aid
received which could have the adverse effects in Svennson (2000), and politics and
indicators of “lobbying”, as described below. In section 5.2, when we use individual data
we will have a mixture of personal and village characteristics.
A key issue conceptually, although not in terms of actual results, concerns the
sample of villages used. Of the 199 villages, there are 2 villages with missing data on key
variables (government measures of the count of households before and after the tsunami);
and a third village which is dominated by army housing and we exclude it since at times
it is hard to tell what numbers relate to indigenous villagers, versus army residents. Of the
remaining 196, 8 villages in our sample experienced no house damages or loss of life,
although some lost some boats. They typically face very different circumstances, like
having swelled populations including refuges and displaced relatives. We do not include
18
them in estimation; but report results with them added back in. We also have another 12
villages which report house destruction but report no permanent house aid. These villages
have unusually high levels of “temporary” housing. In general temporary housing is
wood housing; by now most temporary houses have either been torn down and the wood
used for other purposes, or converted to things like storage sheds. However, we believe
there may be a dispute between BRR and these specific villages over what is truly
temporary versus permanent; for example wood houses with a cement foundation are
viewed as permanent. Results on volunteer days when we exclude or include these 12
villages are very similar and we generally include them. Finally, for survival rates and
post-tsunami number of houses in a village, we use our 2005 survey data for the 110
villages for which we have it. For villages new to the survey in 2007 we use government
data but exclude 7 outliers for which the 2006 PODES counts of households are non-
credibly low. These villages distort any results related to the extent to which a village has
been serviced by aid (in fact yielding “false positives”). We also footnote basic results for
the whole sample.
We start by treating our determinants of volunteer days as exogenous. Survival
rates, location, and size type variables seem plausibly exogenous to current volunteer
days called by the village head. Our key measure of social capital, apart from village
survival rates is whether the village had an arisan group (RoSCA) pre-tsunami which
applies to 68% of villages, along with the village household survival rate. Obviously
having had an arisan group pre-tsunami is a crude proxy for pre-existing village social
capital, which would be correlated with other unobserved measures of social capital
which might influence village cohesion and the inclination and ability of the village head
post-tsunami to call and utilize volunteer days. But it is the one measure we have where
there are cross-village differentials.
The next issue is whether aid measures are exogenous to volunteer days. There
are two parts to a response. First, most aid in our villages is complete by the time of our
survey, so we are asking whether pre-determined aid activity affects volunteerism, not
whether the arrival of aid today has a temporary effect on volunteer days. Second and
more critically do villages with, say, better unobserved inherent tendencies to volunteer
days, or the “public good”, attract, say, more aid. House and boat aid in regression work
19
seems uncorrelated with any observed measures of leadership survival, social capital, and
political circumstances. Most aid seems driven by observables connected with need (e.g.,
boats and houses lost and families remaining) and supply conditions (like access of
NGO’s to the village), with a random component of “luck”—what aid agencies landed
where! That is a “nicer” village, a more social village, or a village which has better or
consistent leadership doesn’t get more private aid. Aid happened and now we see the
following effect on volunteerism. Third, the prime measure of aid is not counts of
housing or boats, although we look at these. Rather we measure aid by the number of
projects (“first level implementers”) approved by BRR that a village has garnered. This is
more a measure of the number of separate activities, with which a village head has to
contend and the array of on-the-ground implementers parading through the village.
We start with a basic formulation that emphasizes the role of social capital, add in the
effects of aid received, turn to the impact of political processes, and finally examine the
role of surviving traditional leaders.
5.2 Results
Results on counts are in Table 8a.There is a set of basic controls which we use
throughout—whether a village is coastal; whether it is in an “urban area”; and what its
post-tsunami number of houses was in 2005. None of these are significant.
5.2.1 Social Capital.
Results on social capital before the introduction of aid covariate are in column 1
of Table 8a. Our key index of village pre-tsunami social capital is whether the village had
an arisan group or not; that has a strong positive effect, raising the number of days called
by 52%. Second, higher survival rates mean more social structures in a village remained
intact and the village suffered less trauma. A one standard deviation increase (.41) in the
survival rate raises volunteer days by 12%. There is an issue defining social capital of
distinguishing village leadership from social capital.
We consider village leadership issues in Table 8b, and these could be viewed as
social capital effects, especially given the results. Based on what we saw in 2005 in the
field and in surveying we thought there would be a strong role for survival of traditional
village leaders, who provide continuity and enforcement of traditional social conventions,
relevant to volunteerism. Foremost is the mullah, who plays a central role in village
20
spiritual life in a context where most men go to mosques regularly and most women
attend Quran recitation groups. After all, although called by the village head, volunteer
days are “Islamic” volunteer days, enshrined in interpretations of the Quran. On the right-
hand side of the table, indeed we see that while survival of the village head has no
significant effect on volunteerism, survival of the mullah does. Survival of the mullah
raises volunteer days called by 33%.
We also looked at interactive effects among our three survival rates: mullah,
village head, and overall, noting these are correlated. We have a long discussion in a
footnote to Table 8b, suggesting that there may be some positive interactive effect if both
the mullah and traditional village head survive. However we conclude that the results as
specified in the main part of the table are probably the best we can do for the sample size.
5.2.2 Aid
We have two dimensions concerning aid. First as discussed above, there is the
official count of different aid projects in a village, our measure of the overall level of aid
for the village. The mean is 30 per village and the maximum is 76. Second concerns
whether the major housing provider in the village is a donor-implementer. We believe
these are NGO’s that largely solve the agency problems among donors, implementers and
sub-contractors, facing all donors. This improvement in aid delivery we believe (1)
mitigates disputes within the village between either villagers or villages and NGO’s and
(2) presents an NGO to the village that will be aware of and responsive to village
conditions and (3) reduces villager monitoring costs involved when there are shoddy or
fly-by-night contractors who start and never finish jobs. As we can see in column 2 of
Table 8a, having more projects reduces volunteerism. A basic interpretation is that more
aid means villagers devote more time to trying to enhance private gains from that aid. But
it could also be a “lobbying effect”—more projects mean individuals waste more time in
a social sense, clamoring for more. It might reflect an employment effect where more
projects mean more temporary employment opportunities, drawing away from
volunteerism. We note that in Table 8b we add a control for the 14% of villages where
village hired labor was used to some degree in housing provision. As an aid issue, using
village paid labor does reduce volunteer days by over 40%. But adding that control leaves
the coefficient for number of aid projects unchanged. The negative effect of more
21
projects is more than offset for a typical count of projects in a village, if the housing
provider is a donor-implementer. Clearly the form in which aid is given has a major
impact on village public labor inputs. A donor-implementer frees up time and energy for
volunteerism, by reducing village squabbling and time monitoring, given mitigation of
the agency problem between donors, implementers and contractors).
In addition we control for whether a village has received permanent house aid or
not (as opposed to so-called temporary aid) and whether the village has received boat aid
(about 69%). The former has no effect while the later has a big negative effect. After the
tsunami, villages had a choice of whether to return to fishing and lobby for boat aid, or at
least for now to turn to other employment, such as in the aid sector. Fishing villages in
Aceh also face the issue of adaptation of new technologies. Much of the fishing has been
“primitive”, catching reef and other off-shore fish for local consumption. The tsunami
heavily devastated the feeding and breeding grounds for these fish and their catch is a
tiny fraction of what it used to be. More profitable fishing is using bigger boats capable
of over-night fishing far from shore for tuna and shark. To get boat aid requires village
investment in lobbying, documentation, and monitoring of boat quality (about 30% of
boats given in aid were poorly made and literally not seaworthy). Boat aid generates
disputes over who gets boats, for example among former owners versus crew.
Regardless, villages getting boat aid exhibit less volunteerism. However, as footnoted in
the table, for both house and boat aid, the extent of aid provided in boats and housing has
no additional effect on volunteerism, controlling for our measure of number of projects in
the village. Finally we note that in contrast to public building below, we find no
interactive effect between the measure of overall aid and political or social capital
measures. That is the effect of aid on public labor inputs is not mediated by politics and
social capital.
5.2.3 Politics.
To both column 1 and 2 of Table 8a we add a variety of political controls, as
shown in Table 8b. We start with whether the village had an election post-tsunami.
Having an election significantly reduces volunteer days by 25%, an effect that is almost
significant at the 5% level. Elections take people’s time and may heighten conflict and
social differences within the village, reducing the incentive to volunteer. However, these
22
elections generally occur in months well before we ask about volunteer days, so such
effects would have to be persistent. We think this is the case. In Table 8c, the election
effect seems to interact with social capital. Villages without an arisan group pre-tsunami
that have an election have huge reductions in volunteerism, 75%, while the role of
enhanced social capital seems to be largely to offset this negative effect, to dampen the
generation of conflict prompted by an election. Finally we note in terms of the issue of
conflict and energy, having aid allocation decisions made in village meetings reduces
volunteerism, although the effect is smaller and not significant.
Of course, it is still possible election effects could in part represent what the
median voter wants in terms of the preferences of a new village head: someone who has
less focus on volunteerism. However we see volunteerism as more a “social” than
election issue; and it is unresponsive to other political conditions. For example in villages
where the traditional village head is still in office (with no election), there is no positive
effect on volunteerism. The negative election effect doesn’t interact with what prompts
the election: the effect is the same in villages with elections when the traditional village
head died versus didn’t die in the tsunami.
5.2.4 Politics and IV Estimation.
We have treated elections as occurring exogenously. But we know some elections
were not prompted by either the death of a village head or exogenously scheduled timing,
but by disputes. Disputes themselves could affect volunteerism, biasing the election
coefficient downward (more negative), meaning that it may be more that disputes over
aid rather than elections per se were inhibiting volunteerism. The issue is how to
instrument for elections. We considered five instruments which are correlated with
having an election:(1) whether the village head survived the tsunami (2) whether a village
is on a 5 year elections cycle, (3) whether it is on a 6 year election cycle (4) whether it
had a village hall pre-tsunami potentially reflecting a more democratic tradition of
assemblage; and (5) whether the village experienced ownership disputes, where disputes
might increase chances of an election being called. None of the instruments is ideal.
Whether the village head survived the tsunami as explained in the footnote to
Table 8b is the most likely of these to violate the exclusion restriction. For the rest, on the
surface statistically, they look orthogonal to the error term. When added to a Poisson
23
model for volunteer days, not only are coefficients on instruments all insignificant, more
relevant the coefficient on the election variable is unchanged (-0.23 as opposed to -0.25).
If both the election variable and instruments are correlated with the error term, adding the
instruments should have a noticeable effect on the election variable coefficient. It doesn’t.
Second, Sargan test results suggest instruments are orthogonal to the error term. However
all instruments are suspicious.
Consider election timing; the numbers cited could be in response to the advent of
an election. Maybe the election cycle was longer in a village and aid disputes prompted
an up-dating to the current 5 year national standard. For village halls, it is possible that
the spirit of volunteerism today is connected to past forces for volunteerism that relate to
whether the village had a village hall; being one of the 69% of villages that historically
had a hall is not simply random with respect to any persistent tendencies to volunteerism
not captured by the arisan variable. Finally, for the 20% of villages with land disputes,
they arose in the early days after the tsunami before permanent aid arrived when villagers
engaged in a collective exercise to walk and mark-off landholdings. Based on the simple
tests note above, we treat these disputes as not aid related and idiosyncratic, an accident
of the extent of tsunami destruction of visible markers in the village or greed of 1 family,
with no reflection on village spirit per se. But such disputes could prompt elections. As
Table 9 shows in the last column these four variables all significantly increase the
chances of an election. However F-tests suggest that the instruments are borderline in
terms of strength (the F-on added instruments is 10.3), so not surprisingly they are
sensitive to exclusion of any one of them. We simply report what happens when all four
are used.
The estimator we use the GMM one based on Windmeijer and Santos Silva
(1997) where we define expj j j j jVD VDυ λ π⎡ ⎤≡ − = − ⎣ ⎦ and base estimation on the non-
linear moment condition
| 0j jE Zυ⎡ ⎤ =⎣ ⎦ . (2)
With an endogenous dummy variable, as an instrument, we use the predicted value of the
probability as an instrument from a first stage; a simple linear probability formulation
yields similar results. The results in Table 9 suggest that the exercise leaves significant
24
effects in Table 8 unchanged. However, the election variable coefficient relative is now
very imprecisely estimated, but large and negative.
5.2 Individual volunteer days
Besides village level data, we also have a record of days volunteered by the
family last month for 544 fishing families in 88 villages, all of whom owned a boat pre-
tsunami. In Appendix A, we focus on a version with village fixed effects which covers
420 families in 60 villages; the loss in sample is from villages where no one volunteered
in last month or everyone volunteered the same amount (so there is no within village
variation), implying for most excluded villages that no volunteer days were called. Thus,
with fixed effects, we look at the margin of family participation in villages where
volunteer days have been called by the village head. We don’t find a lot that is of great
interest. Bigger families volunteer more. Those who have received a house on aid
volunteer less; those few who have yet to get a house may volunteer as a form of
lobbying with the village head to up their chances of getting a house sooner. In contrast,
those who get a boat on aid volunteer more; those who don’t get a boat are typically
pursuing work outside the village in the aid sector, driving vehicles, doing construction,
and working in the service sector focused on services to aid workers. While the sample of
villages is small we run also a version with village level covariates to see if the covariates
the matter at the village level (decision to call volunteer days by the village head) also
matter at the family level. That involves two margins—whether the village head called
volunteer days and then whether this family participated. For individual level variables,
that creates noise, since a family can’t participate if the village head didn’t call days. As
noted in the Appednix, village level covariates with the limited number of villages and
weight towards village with high survival rates are not strong, but the key aid, social
capital, and political variables have the same sign as in Table 8.
5.3 Volunteer days to rebuild the mosque
A second dimension of volunteerism in the data is whether the village used
volunteer days to rebuild the mosque. Almost universally, this is a 0% versus 100%
split—no volunteer or all volunteer labor. But there are some villages which report a
partial, and so we create a dummy for whether the mosque was rebuilt using over 50%
volunteer labor. 26% of villages report the use of this volunteer labor. Looking at
25
volunteer labor to rebuild the mosque involves an unusual phenomenon. Such activity
occurred mostly in the 2005 before any permanent aid arrived in the village. Once such
aid arrives, it becomes apparent that there are aid agencies willing to pay people to
rebuild the mosque or to hire outside workers. Thus the split is whether a village rallied
in the months after the tsunami, to focus on rebuilding the mosque (noting volunteer
labor is not in evidence in the building of houses or generally other public buildings); or
whether people in villages either did nothing or engaged in “work-for-pay” programs
designed to give people something to do (clear rubble, drive vehicles, etc.), thus putting
aside rebuilding the mosque. For the empirical formulation this has implications. First,
including aid variables is pointless—almost by definition more aid programs will imply
the village did not proceed with volunteer labor to rebuild the mosque. Second the
variables on elections and village decision making on aid allocation also are not
relevant—these involve later events. Thus such variables are all insignificant. Apart from
whether a village is urban (so there are many nearby alternative inland mosques to visit),
the only observable that matters is social capital.
Results are in Table 10. We focus on the sample of 186 villages which had a
mosque that was destroyed by the tsunami. What influences the probability is whether the
village had an arisan group pre-tsunami, with a marginal effect of 16%. Again this social
capital indictor plays a key role. Whether the mullah survived (not shown) has a positive
effect (as does survival rate), but its coefficient is only .076 and the standard error is .065
(and survival rate is similar a shown in Table 11). We note that in the disaster literature,
more trauma (survival) has two opposing effects on immediate village responses—
individual depression and a rallying around a common cause by survivors. As already
noted variables like survival of the pre-tsunami village head and political variables have
small insignificant effects. Social capital is the most influential variable.
6. Public buildings
In this section we make an initial attempt to examine the determinants of village
decisions to garner public versus private aid. We examine the ratio of total (non-mosque)
public buildings received to the count of houses received in aid. An alternative is to have
the dependent variable be just the count of public building and then control for all types
26
of private aid received; the endogeneity issues are obvious and we have no instruments
that would reasonably meet the exclusion restriction. So the problem is opposed as a
choice over this ratio, we ask how this margin is affected by our covariates. For this we
look only at villages which have received permanent house aid; but we no longer exclude
village with poor counts of post-tsunami households since that variable doesn’t affect
outcomes and results for the two samples (with and with outliers are basically the same).
The formulation we use is simply
count public bldg-in-aid/houses-in aid j jX β ε= + , (3)
which is estimated by OLS. We also did a Tobit specification given about 12% of
villages have gotten no public building aid; results are almost the same as OLS. We show
results with a basic set of controls in Table 11a. These include the count of households
post-tsunami, public buildings destroyed, the social capital variables from Table 8a in
column 1; and then, in column 2, we had in the overall aid measures from Table 8a. None
of these seem to affect the choice between public and private aid and the explanatory
power of the model is negligible. Similarly when we add on variables such as the mullah
and village survive or not (and those interacted) and political variables on their own from
Table 8b, nothing affects the trade-off. The ratio of public to private aid seems neutral
with respect to many observables, perhaps driven by aid agency policies.
However in Table 11b, once we allow for interactive effects between the overall
level of village aid and politics, distinct patterns emerge. To interpret the table we focus
on the set relating to whether aid allocation decisions are decided in village meetings. It
looks like the village meeting decision variable leads to more public buildings, but that
effect diminishes as the number of aid projects increases. In fact only at low levels of
projects (less than 25, for a mean and median of 30) do villages where decisions are made
in meetings have a higher ratio of public buildings to private. At the median of aid
projects, the total effect for villages where decisions are not made at a village meeting is
.0126, while for those where they are made in a village meeting it is lower at .0098. The
differential suggests that villages where decisions are not made in a village meeting have
1/10 of a standard deviation higher ratio of public to private aid (the mean and standard
deviation are .016 and .028). When the number of aid projects hits 49 (the 90th percentile
for aid project counts), villages where decisions are not made in a village meeting have a
27
½ standard deviation higher ratio of public to private aid buildings. While there seems to
be a base positive effect of village “collective” decision making in aid allocation, the
effect withers quickly as the number of aid projects rises. In villages with lots of projects,
the slant is distinctly towards private aid under “collective” decision making.
The results for having had an election are weaker but the pattern under this form
of “greater democracy” is similar. At the median number of projects, villages with and
without an election have the same ratio, ceteris paribus. By the 90th percentile of villages
in numbers of projects, villages with no election have .22 of a standard deviation higher
ratio of public to private aid buildings. Correspondingly, in the last row, “non-
democratic” villages with the same village head as pre-tsunami have a higher ratio of
public aid when the number of aid projects gets large, but estimated effects are smaller
than the greater democracy variables. At the 90th percentile for total projects, the effect is
.17 of a standard deviation).
To be completed
28
References: Acemoglu , D. and J. A. Robinson (2006), “De Facto Political Power and Institutional Persistence”. The American Economic Review, 92(2), Papers and Proceedings of the Annual Meeting of the American Economic Association. Alexander, B., C. Chan-Halbrendt, and W. Salim (2006), “Sustainable livelihood considerations for disaster risk management: Implications for implementation of the government of Indonesia tsunami recovery plan”. Disaster Prevention and Management, 15(1), pp. 31-50. Azam, J-P. and J-J. Laffont (2003), “Contracting for Aid”, Journal of Development Economics, 70, 25-58 Becker, G. and N. Tomes (1997), “An Equilibrium Theory of the Distribution of Income and Intergenerational Mobility.” Journal of Political Economy 87 (6), pp. 1153-89. Besley, Timothy and Stephen Coate (1997), “An Economic Model of Representative Democracy”, Quarterly Journal of Economics, 112(1), pp. 85-114. Besley, T, S..Coate and G. Loury (1994), “Rotating Credit and Savings Associations, Credit Markets, and Economic Efficiency”, Review of Economic Studies, 701-19 Brown, O., A. Crawford and A.Hammill (2006), “Natural Disasters and Resource Rights - Building resilience, rebuilding lives” International Institute for Sustainable Development (IISD). Collier, P., P. Guillaumont, S. Guillaumont, and J.W. Gunning (1997), “Redesigning Conditionality”, World Development, 25, 1399-1407 Davis, D. and D. Weinstein (2002), “Bones, Bombs, and Break Points: The Geography of Economic Activity”. American Economic Review, 92(5), pp. 1269-1289. Easterley, W (2003), “The Cartel of Good Intentions: the Problem of Bureaucracy in Foreign Aid”, Journal of Policy Reform, 5, 1-28 Erikson, K. (1976), “Everything in Its Path: Destruction of Community in the Buffalo Creek Flood” Simon & Schuster, New York.. ______. (1994) “A New Species of Trouble: Explorations in Disasters, Trauma, and Community” W W Norton & Co Inc, New York, 1st ed edition. Field, E.. (2005), “Property Rights and Investment in Urban Slums”. Journal of the European Economic Association, 3(2-3), pp.279-290.. Foster, A. and M. Rosenzweig. (2005), “Democratization and the Distribution of Local Public Goods in a Poor Rural Economy”. mimeo, Department of Economics, Brown University. Fritz, C.E. “Disaster”. In R.R. Merton and R.A. Nisbet, editors, Contemporary Social Problems, Harcourt, Brace and World (New York), 1961.
29
Kanbur R. and T. Sandler (1999) “The Future of Development Assistance: Common Pools and International Public Goods”, ODC Policy Essay #25, Overseas Development Council, Washington. Knack, S, and A. Rahman (2007), “Donor Fragmentation and Bureaucratic Quality in Aid Recipients” Journal of Development Economics, 83, 176-197. Labonne, J. and R. Chase (2008), “Do Community Driven Development Projects Improve Local Governance and Enhance Social Capital: Evidence from the Philippines, World Bank mimeo. Loury, G. C. (1981),“Intergenerational Transfers and the Distribution of Earnings”. Econometrica, 49, pp.: 843-67. Miguel, E. and G. Roland, (2006) “The Long Run Impact of Bombing Vietnam”. NBER Working Papers, 11954, National Bureau of Economic Research, Inc. Mileti, D. (1999), “Disasters By Design: A Reassessment of Natural Disasters in the United States”. Joseph Henry Press, Washington, D.C.. Mileti, D. S. and Lori P. (2002), “Understanding Individual and Social Characteristics in the Promotion of Household Disaster Preparedness.” In T. Dietz and P. C. Stern, editors, New Tools for Environmental Protection: Education, Information, and Voluntary Measures, pp. 125-139. National Academy Press, Washington, D.C. Mookherjee, D. and D. Ray (2002), “Is Equality Stable?” The American Economic Review, 92(2), Papers and Proceedings of the One Hundred Fourteenth Annual Meeting of the American Economic Association, pp. 253-259.. Mookherjee, D. and D. Ray (2006), “Occupational Span and Endogenous Inequality”. Boston University - Department of Economics - The Institute for Economic Development Working Papers, Boston University - Department of Economics. Munshi, K. and M. Rosenzweig (2008), “The Efficacy of Parochial Politics: Caste, Commitment, and Competence in Indian Local Governments”, http://www.econ.brown.edu/fac/Kaivan_Munshi/ Murrell, P, (2002) “The Interaction of Donors, Contractors, and Recipients in Implementing Aid for Institutional Reform” in B. Martens, U. Mummert, P. Murrell, and P. Seabright (eds), The Institutional Economics of Foreign Aid, Cambridge U. Press, 69-111. Paul, E. (2006), “A Survey of the Theoretical Economic Literature on Foreign Aid, Asian-Pacific Economic Literature Pedersen, K. (2001), “The Samaritan’s Dilemna and the Effectiveness of Development Aid”, International Tax and Public Finance, 8, 693 – 703 Persson, T.and G. Tabellini (2002). “Political Economics: Explaining Economic Policy”. MIT Press, Canmbridge. Putnam, R. D. (1995).“Bowling Alone: America's Declining Social Capital”. The Journal of Democracy, 6(1) , pp. 65-78.
30
Sobel, J. (2002), “Can We Trust Social Capital”, Journal of Economic Literature, 40, 130-154 Svennson, J. (2000), “Foreign Aid and Rent- Seeking”. Journal of International Economics, 51, 437-461. Svennson, J. (2003), “Why Conditional Aid Does Not Work and What Can Be Done About It?”, Journal of Development Economics Thorburn, C. (2008), “Village Government in Aceh, Three Years after the Tsunami”, University of California, Berkeley, http://repositories.cdlib.org/cseas/CSEASWP1-08. Torsvik, G. (2005), “Foreign Economic Aid: Should Donors Cooperate”, Journal of Development Economics, 77, 503-515 Townsend, Robert M.. “Risk and Insurance in Village India”. Econometrica, 62(3), pp. 539-591, May 1994. Varadharajan, S. (2004), “Explaining Participation in RoSCAs: Evidence from Indonesia”, Cornell University, http://www.microfinancegateway.org/content/article/detail/23451 Windmeijer, Frank; Santos Silva, Joya (1997), "Endogeneity in Court Data Models: An
Application to Health Care," Journal of Applied Econometrics, 12, 281-294. World Bank. (2006) “Indonesia: Reconstruction of land administration systems (RALAS)”. http://www.reliefweb.int/rw/rwb.nsf/db900SID/KHII-6NL35P?OpenDocument.
31
Figure 1. Map of Survey Area
32
Table 1. Destruction of population and housing
N=104 (‘05 sample)
N=190 (‘07 sample)
Survival rates Pre-tsunami households [‘05 survey, (‘07)] 28829 (29702) 58882 Post-tsunami households [‘05 survey] 16698 n.a. Post-tsunami households (PODES)a 14775 32628 Survival rate: householdsb 58% [’05 survey] 55% [PODES;
’07 survey] Survival rate populationc 45% (official: 49%) Post-tsunami female/maled “.79” House aid Number of houses survive tsunami [’05 survey (’07)] 2290 (1987) 5299 Survival rate houses 8% 9% Number of temporary houses built (‘07 survey) 3039 6609 Number of permanent houses built (’07 survey) 15506 32194 Replacement rate (base: ’05 count of hh’s, no house)e 108% [124% for
PODES count] 118%
“Exaggeration” 2007 number of households claimed [all]f 23161 49037 “Rate of increase” since tsunami 39% [57% for
PODES count] 50%.
a. The PODES is a tri-annual government inventory of village populations and facilities. The 2006 PODES in Aceh was conducted in the Spring 2005. It lower counts of households compared to our 2005 survey (Summer and Fall, 2005) may be partly a “9/11 phenomenon”; as time goes on more missing families are discovered.
b. Column 1 is our 2005 pre (recall) versus post tsunami count. Column 2 is the PODES post-tsunami count over the count recalled in 2007 for village pre-tsunami households.
c. The official survival rate is the 2006 PODES count divided by the count in P4B, a 2004 government pre-election census. For some individual villages, P4B counts and our pre-tsunami counts diverge markedly. We did intensive field surveying in 10 villages where numbers diverged a lot, to ascertain that our numbers seemed much more accurate, based on specific types of village recordings of population (e.g., the number of zakat fitrah payers in 2004, which is a Islamic poll tax on all living people in the villages, the number of votes in the 2004 elections recorded by the official local tabulator, a count by a mid-wife of village population just before the tsunami, etc.).
d. Villages generally seem to under-count children, and perhaps more so female children, in attempting age-sex breakdowns, so that the numbers used in breakdowns sum to less than totals.
e. The replacement rate is the number of houses given in aid divided by the number of surviving households (2005 survey) less the number of surviving houses. We also report counts where the number of surviving households is from the PODES in column 1 and the column 2 count is based on that.
f. The rate of increase in column 1 is the 2007 claims of village households divided by the 2005 claim. For 2007 it is the 2007 claim divided by the 2006 PODES count.
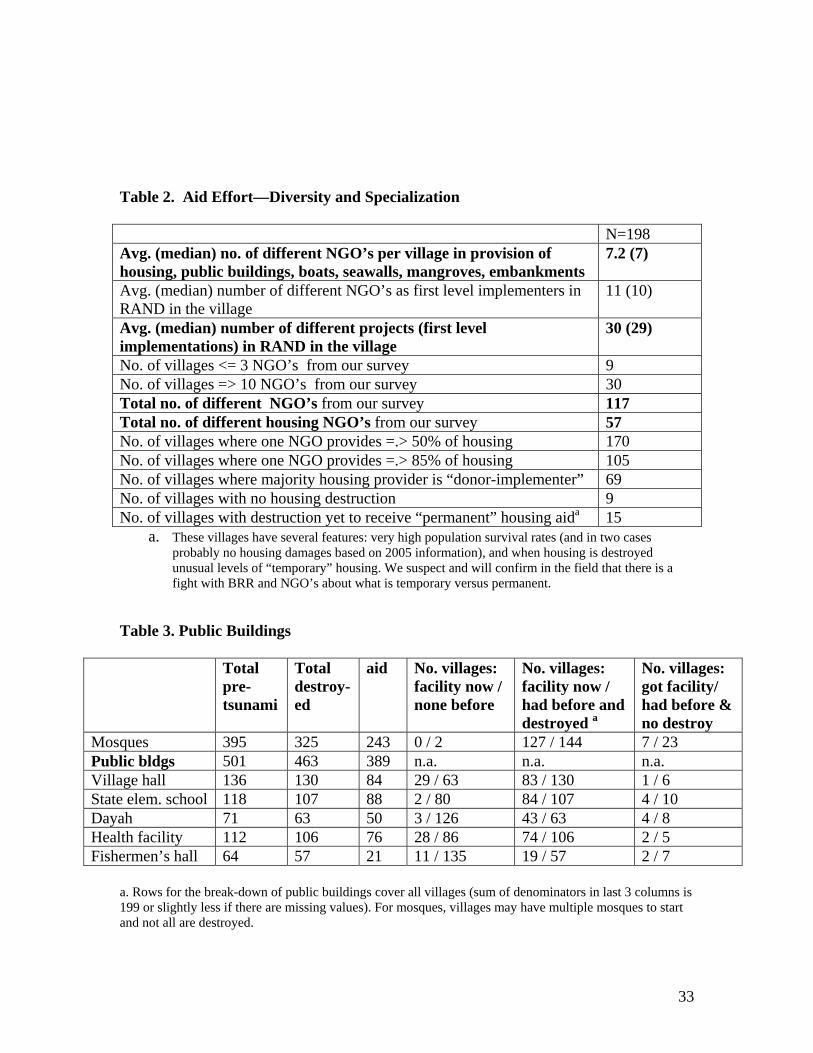
33
Table 2. Aid Effort—Diversity and Specialization N=198 Avg. (median) no. of different NGO’s per village in provision of housing, public buildings, boats, seawalls, mangroves, embankments
7.2 (7)
Avg. (median) number of different NGO’s as first level implementers in RAND in the village
11 (10)
Avg. (median) number of different projects (first level implementations) in RAND in the village
30 (29)
No. of villages <= 3 NGO’s from our survey 9 No. of villages => 10 NGO’s from our survey 30 Total no. of different NGO’s from our survey 117 Total no. of different housing NGO’s from our survey 57 No. of villages where one NGO provides =.> 50% of housing 170 No. of villages where one NGO provides =.> 85% of housing 105 No. of villages where majority housing provider is “donor-implementer” 69 No. of villages with no housing destruction 9 No. of villages with destruction yet to receive “permanent” housing aida 15
a. These villages have several features: very high population survival rates (and in two cases probably no housing damages based on 2005 information), and when housing is destroyed unusual levels of “temporary” housing. We suspect and will confirm in the field that there is a fight with BRR and NGO’s about what is temporary versus permanent.
Table 3. Public Buildings
Total pre-tsunami
Total destroy-ed
aid No. villages: facility now / none before
No. villages: facility now / had before and destroyed a
No. villages: got facility/ had before & no destroy
Mosques 395 325 243 0 / 2 127 / 144 7 / 23 Public bldgs 501 463 389 n.a. n.a. n.a. Village hall 136 130 84 29 / 63 83 / 130 1 / 6 State elem. school 118 107 88 2 / 80 84 / 107 4 / 10 Dayah 71 63 50 3 / 126 43 / 63 4 / 8 Health facility 112 106 76 28 / 86 74 / 106 2 / 5 Fishermen’s hall 64 57 21 11 / 135 19 / 57 2 / 7
a. Rows for the break-down of public buildings cover all villages (sum of denominators in last 3 columns is 199 or slightly less if there are missing values). For mosques, villages may have multiple mosques to start and not all are destroyed.
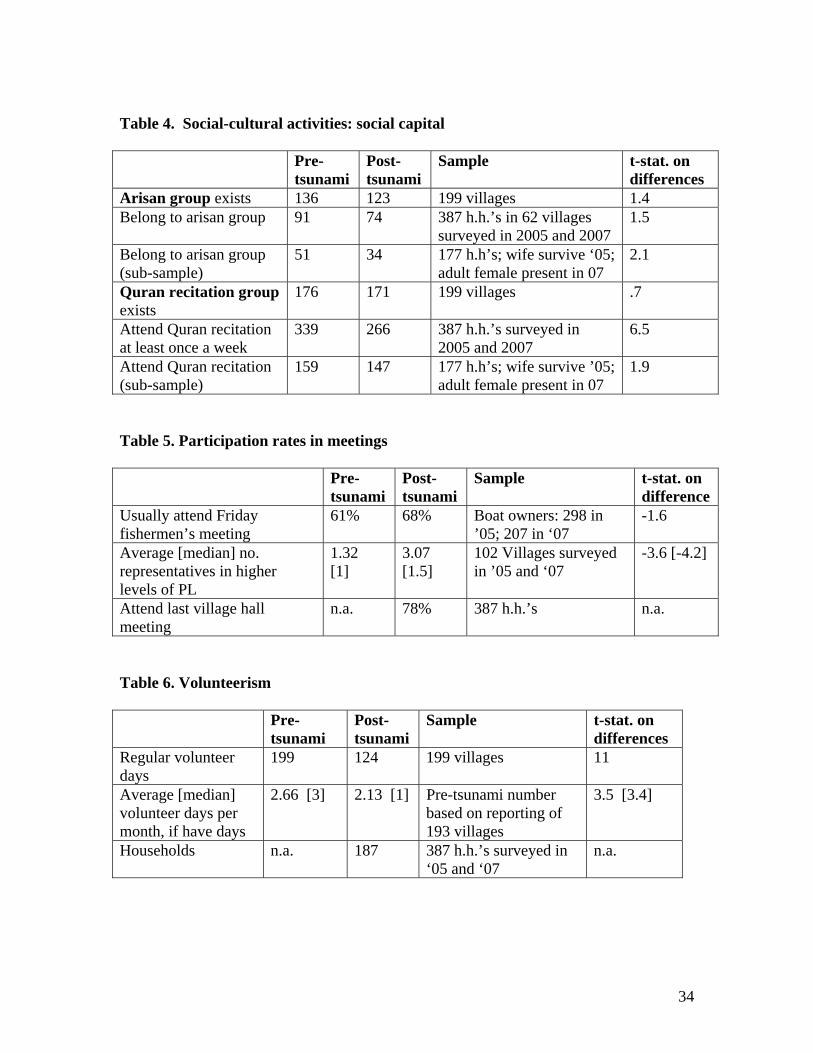
34
Table 4. Social-cultural activities: social capital Pre-
tsunami Post-tsunami
Sample t-stat. on differences
Arisan group exists 136 123 199 villages 1.4 Belong to arisan group 91 74 387 h.h.’s in 62 villages
surveyed in 2005 and 2007 1.5
Belong to arisan group (sub-sample)
51 34 177 h.h’s; wife survive ‘05; adult female present in 07
2.1
Quran recitation group exists
176 171 199 villages .7
Attend Quran recitation at least once a week
339 266 387 h.h.’s surveyed in 2005 and 2007
6.5
Attend Quran recitation (sub-sample)
159 147 177 h.h’s; wife survive ’05; adult female present in 07
1.9
Table 5. Participation rates in meetings Pre-
tsunami Post-tsunami
Sample t-stat. on difference
Usually attend Friday fishermen’s meeting
61% 68% Boat owners: 298 in ’05; 207 in ‘07
-1.6
Average [median] no. representatives in higher levels of PL
1.32 [1]
3.07 [1.5]
102 Villages surveyed in ’05 and ‘07
-3.6 [-4.2]
Attend last village hall meeting
n.a. 78% 387 h.h.’s n.a.
Table 6. Volunteerism Pre-
tsunami Post- tsunami
Sample t-stat. on differences
Regular volunteer days
199 124 199 villages 11
Average [median] volunteer days per month, if have days
2.66 [3] 2.13 [1] Pre-tsunami number based on reporting of 193 villages
3.5 [3.4]
Households n.a. 187 387 h.h.’s surveyed in ‘05 and ‘07
n.a.
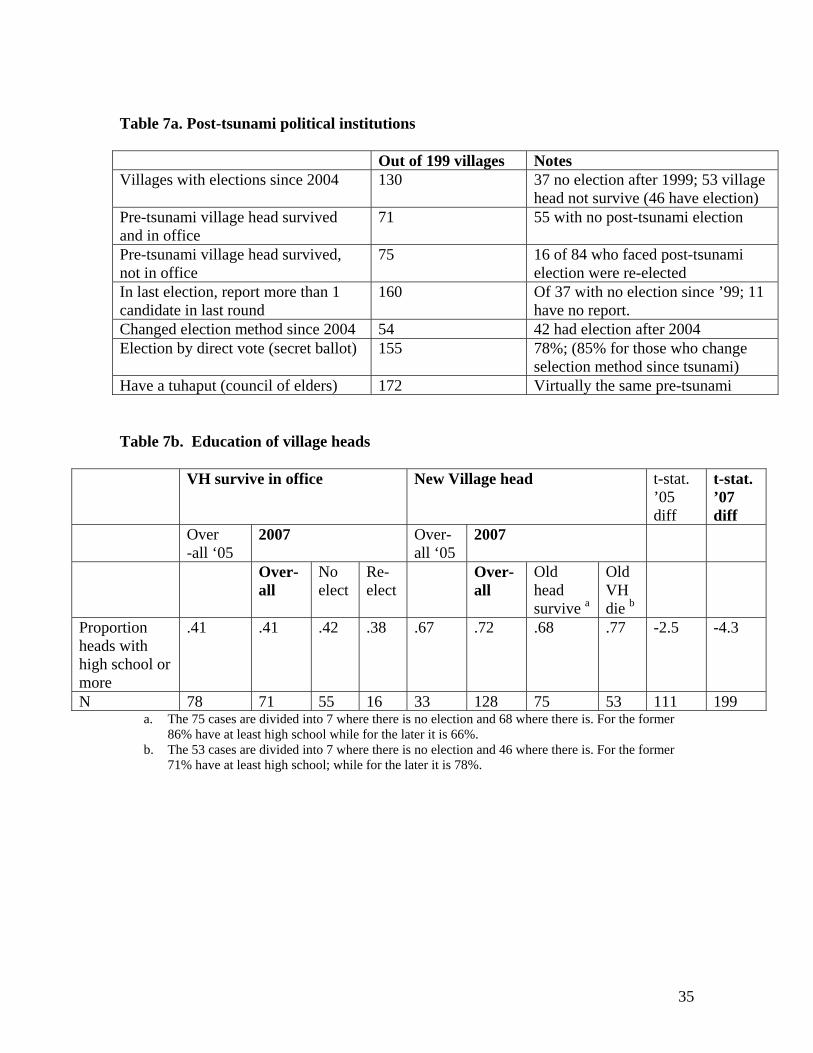
35
Table 7a. Post-tsunami political institutions Out of 199 villages Notes Villages with elections since 2004 130 37 no election after 1999; 53 village
head not survive (46 have election) Pre-tsunami village head survived and in office
71 55 with no post-tsunami election
Pre-tsunami village head survived, not in office
75 16 of 84 who faced post-tsunami election were re-elected
In last election, report more than 1 candidate in last round
160 Of 37 with no election since ’99; 11 have no report.
Changed election method since 2004 54 42 had election after 2004 Election by direct vote (secret ballot) 155 78%; (85% for those who change
selection method since tsunami) Have a tuhaput (council of elders) 172 Virtually the same pre-tsunami Table 7b. Education of village heads
VH survive in office New Village head t-stat. ’05 diff
t-stat. ’07 diff
Over -all ‘05
2007 Over-all ‘05
2007
Over-all
No elect
Re-elect
Over-all
Old head survive a
Old VH die b
Proportion heads with high school or more
.41 .41 .42 .38 .67 .72 .68 .77 -2.5 -4.3
N 78 71 55 16 33 128 75 53 111 199 a. The 75 cases are divided into 7 where there is no election and 68 where there is. For the former
86% have at least high school while for the later it is 66%. b. The 53 cases are divided into 7 where there is no election and 46 where there is. For the former
71% have at least high school; while for the later it is 78%.
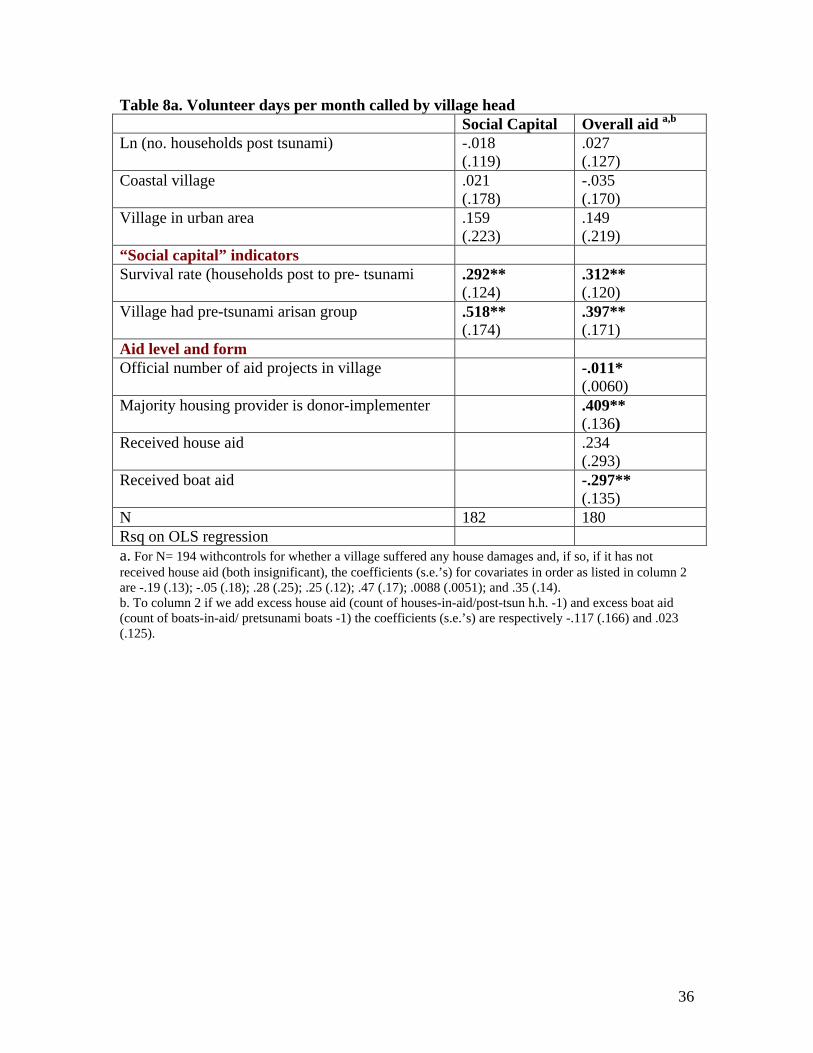
36
Table 8a. Volunteer days per month called by village head Social Capital Overall aid a,b Ln (no. households post tsunami) -.018
(.119) .027 (.127)
Coastal village .021 (.178)
-.035 (.170)
Village in urban area .159 (.223)
.149 (.219)
“Social capital” indicators
Survival rate (households post to pre- tsunami .292** (.124)
.312** (.120)
Village had pre-tsunami arisan group .518** (.174)
.397** (.171)
Aid level and form Official number of aid projects in village -.011*
(.0060) Majority housing provider is donor-implementer .409**
(.136) Received house aid .234
(.293) Received boat aid -.297**
(.135) N 182 180 Rsq on OLS regression a. For N= 194 withcontrols for whether a village suffered any house damages and, if so, if it has not received house aid (both insignificant), the coefficients (s.e.’s) for covariates in order as listed in column 2 are -.19 (.13); -.05 (.18); .28 (.25); .25 (.12); .47 (.17); .0088 (.0051); and .35 (.14). b. To column 2 if we add excess house aid (count of houses-in-aid/post-tsun h.h. -1) and excess boat aid (count of boats-in-aid/ pretsunami boats -1) the coefficients (s.e.’s) are respectively -.117 (.166) and .023 (.125).
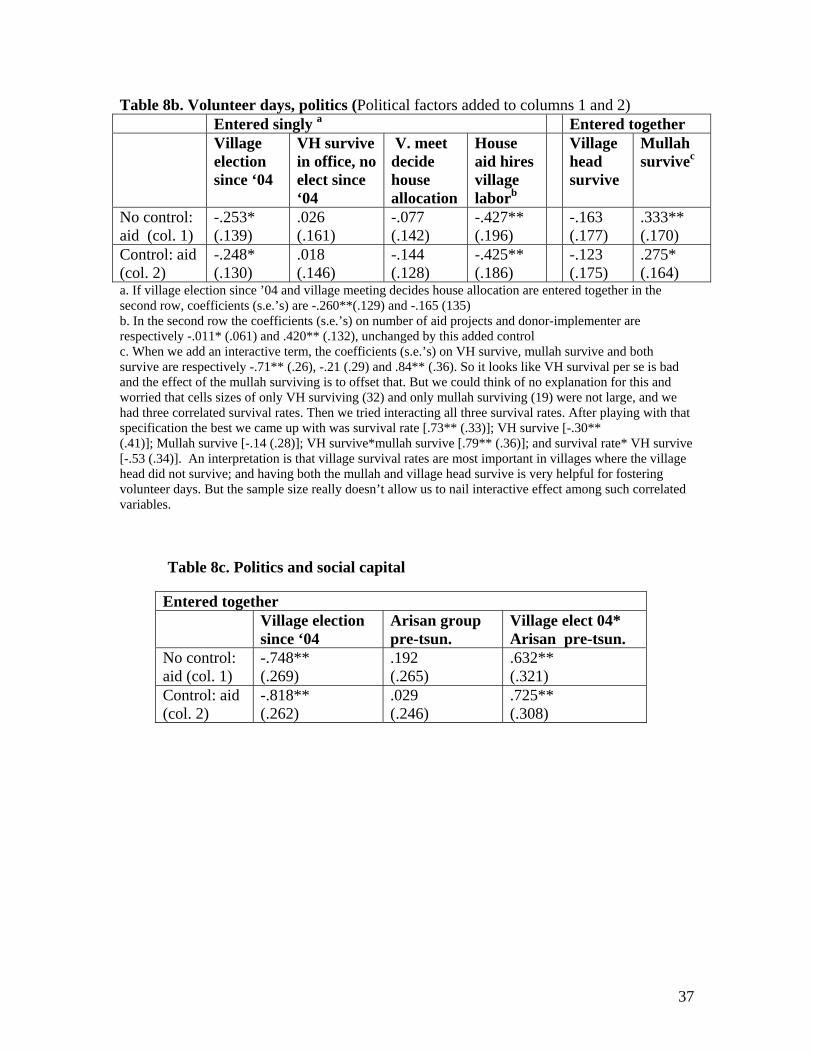
37
Table 8b. Volunteer days, politics (Political factors added to columns 1 and 2) Entered singly a Entered together Village
election since ‘04
VH survive in office, no elect since ‘04
V. meet decide house allocation
House aid hires village laborb
Village head survive
Mullah survivec
No control: aid (col. 1)
-.253* (.139)
.026 (.161)
-.077 (.142)
-.427** (.196)
-.163 (.177)
.333** (.170)
Control: aid (col. 2)
-.248* (.130)
.018 (.146)
-.144 (.128)
-.425** (.186)
-.123 (.175)
.275* (.164)
a. If village election since ’04 and village meeting decides house allocation are entered together in the second row, coefficients (s.e.’s) are -.260**(.129) and -.165 (135) b. In the second row the coefficients (s.e.’s) on number of aid projects and donor-implementer are respectively -.011* (.061) and .420** (.132), unchanged by this added control c. When we add an interactive term, the coefficients (s.e.’s) on VH survive, mullah survive and both survive are respectively -.71** (.26), -.21 (.29) and .84** (.36). So it looks like VH survival per se is bad and the effect of the mullah surviving is to offset that. But we could think of no explanation for this and worried that cells sizes of only VH surviving (32) and only mullah surviving (19) were not large, and we had three correlated survival rates. Then we tried interacting all three survival rates. After playing with that specification the best we came up with was survival rate [.73** (.33)]; VH survive [-.30** (.41)]; Mullah survive [-.14 (.28)]; VH survive*mullah survive [.79** (.36)]; and survival rate* VH survive [-.53 (.34)]. An interpretation is that village survival rates are most important in villages where the village head did not survive; and having both the mullah and village head survive is very helpful for fostering volunteer days. But the sample size really doesn’t allow us to nail interactive effect among such correlated variables. Table 8c. Politics and social capital
Entered together Village election
since ‘04 Arisan group pre-tsun.
Village elect 04* Arisan pre-tsun.
No control: aid (col. 1)
-.748** (.269)
.192 (.265)
.632** (.321)
Control: aid (col. 2)
-.818** (.262)
.029 (.246)
.725** (.308)
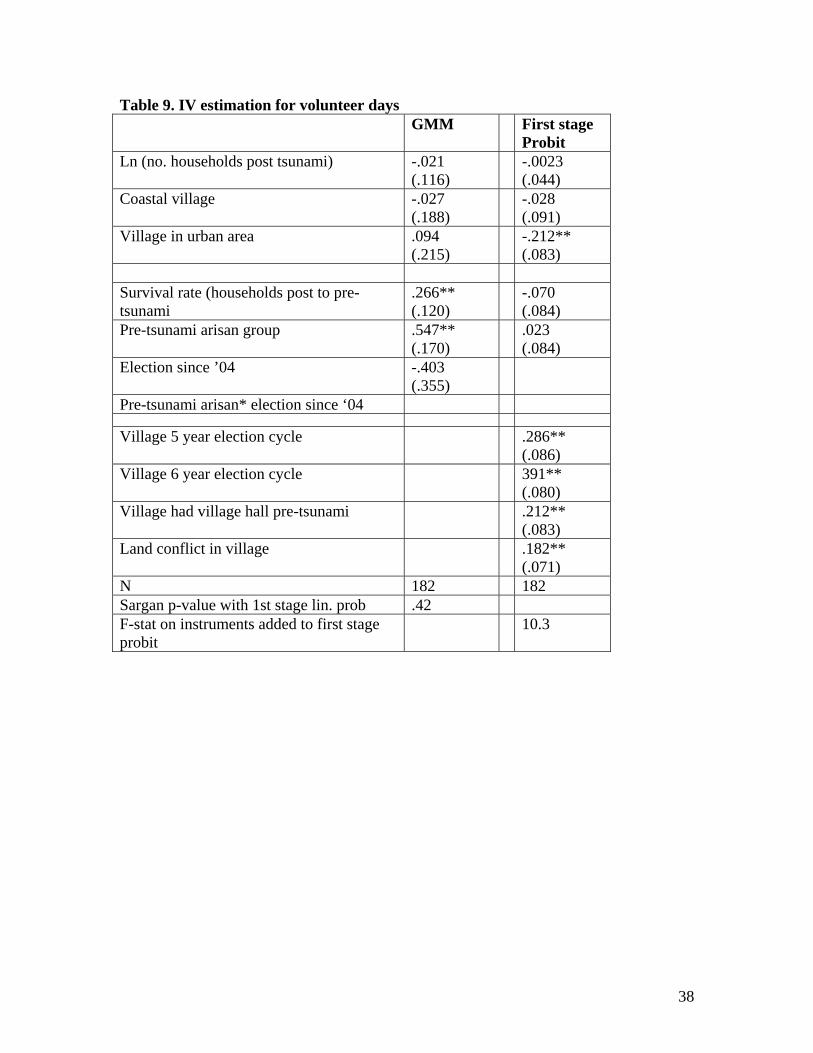
38
Table 9. IV estimation for volunteer days GMM First stage
Probit Ln (no. households post tsunami) -.021
(.116) -.0023
(.044) Coastal village -.027
(.188) -.028
(.091) Village in urban area .094
(.215) -.212**
(.083)
Survival rate (households post to pre- tsunami
.266** (.120)
-.070 (.084)
Pre-tsunami arisan group .547** (.170)
.023 (.084)
Election since ’04 -.403 (.355)
Pre-tsunami arisan* election since ‘04
Village 5 year election cycle .286** (.086)
Village 6 year election cycle 391** (.080)
Village had village hall pre-tsunami .212** (.083)
Land conflict in village .182** (.071)
N 182 182 Sargan p-value with 1st stage lin. prob .42 F-stat on instruments added to first stage probit
10.3
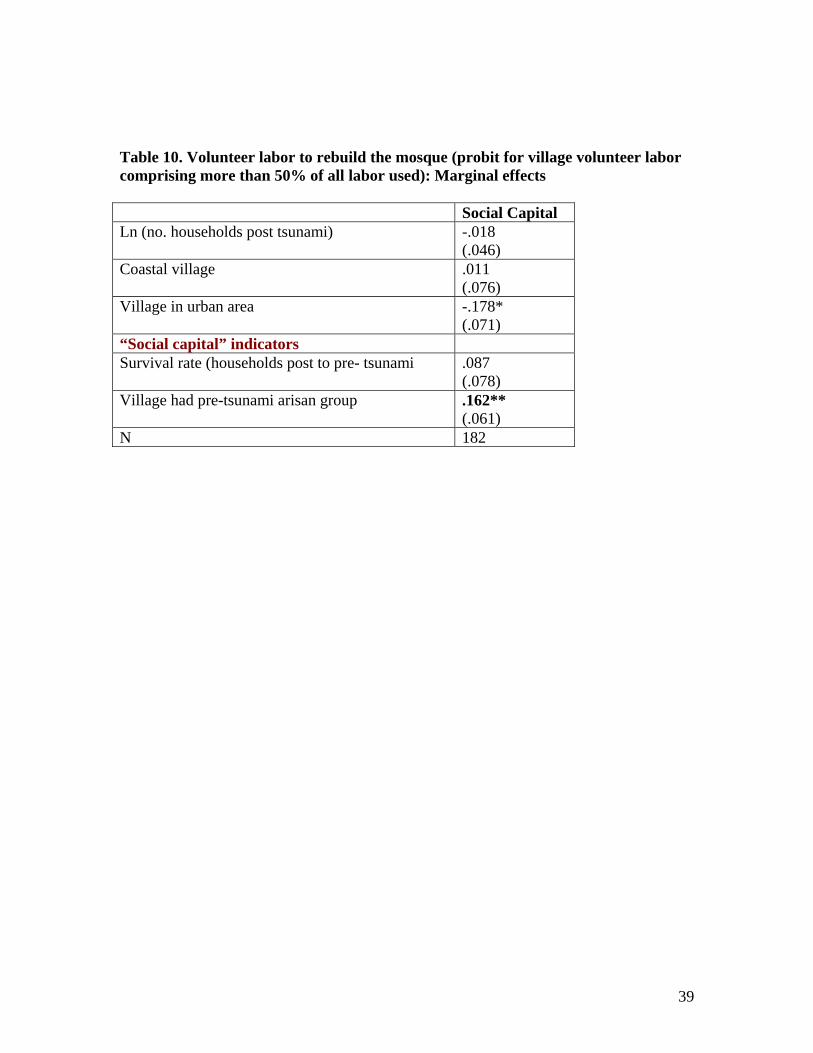
39
Table 10. Volunteer labor to rebuild the mosque (probit for village volunteer labor comprising more than 50% of all labor used): Marginal effects Social Capital Ln (no. households post tsunami) -.018
(.046) Coastal village .011
(.076) Village in urban area -.178*
(.071) “Social capital” indicators
Survival rate (households post to pre- tsunami .087 (.078)
Village had pre-tsunami arisan group .162** (.061)
N 182
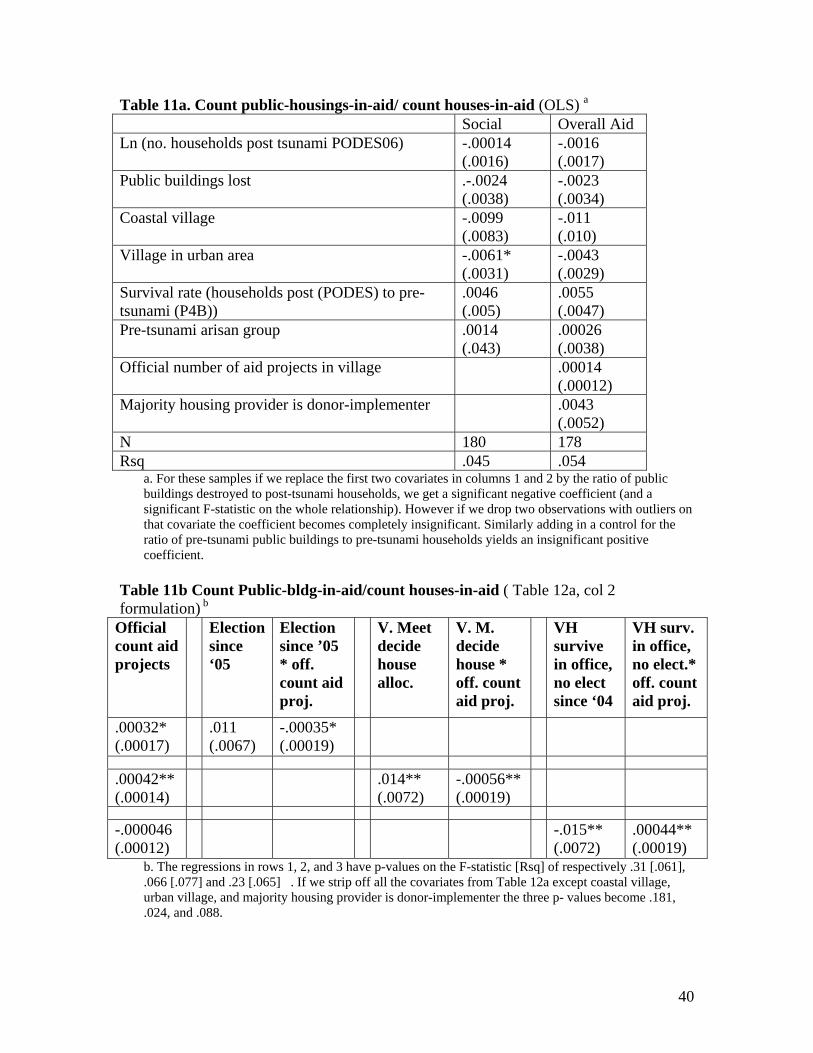
40
Table 11a. Count public-housings-in-aid/ count houses-in-aid (OLS) a Social Overall Aid Ln (no. households post tsunami PODES06) -.00014
(.0016) -.0016 (.0017)
Public buildings lost .-.0024 (.0038)
-.0023 (.0034)
Coastal village -.0099 (.0083)
-.011 (.010)
Village in urban area -.0061* (.0031)
-.0043 (.0029)
Survival rate (households post (PODES) to pre- tsunami (P4B))
.0046 (.005)
.0055 (.0047)
Pre-tsunami arisan group .0014 (.043)
.00026 (.0038)
Official number of aid projects in village .00014 (.00012)
Majority housing provider is donor-implementer .0043 (.0052)
N 180 178 Rsq .045 .054
a. For these samples if we replace the first two covariates in columns 1 and 2 by the ratio of public buildings destroyed to post-tsunami households, we get a significant negative coefficient (and a significant F-statistic on the whole relationship). However if we drop two observations with outliers on that covariate the coefficient becomes completely insignificant. Similarly adding in a control for the ratio of pre-tsunami public buildings to pre-tsunami households yields an insignificant positive coefficient.
Table 11b Count Public-bldg-in-aid/count houses-in-aid ( Table 12a, col 2 formulation) b
Official count aid projects
Election since ‘05
Election since ’05 * off. count aid proj.
V. Meet decide house alloc.
V. M. decide house * off. count aid proj.
VH survive in office, no elect since ‘04
VH surv. in office, no elect.* off. count aid proj.
.00032* (.00017)
.011 (.0067)
-.00035* (.00019)
.00042** (.00014)
.014** (.0072)
-.00056** (.00019)
-.000046 (.00012)
-.015** (.0072)
.00044** (.00019)
b. The regressions in rows 1, 2, and 3 have p-values on the F-statistic [Rsq] of respectively .31 [.061], .066 [.077] and .23 [.065] . If we strip off all the covariates from Table 12a except coastal village, urban village, and majority housing provider is donor-implementer the three p- values become .181, .024, and .088.
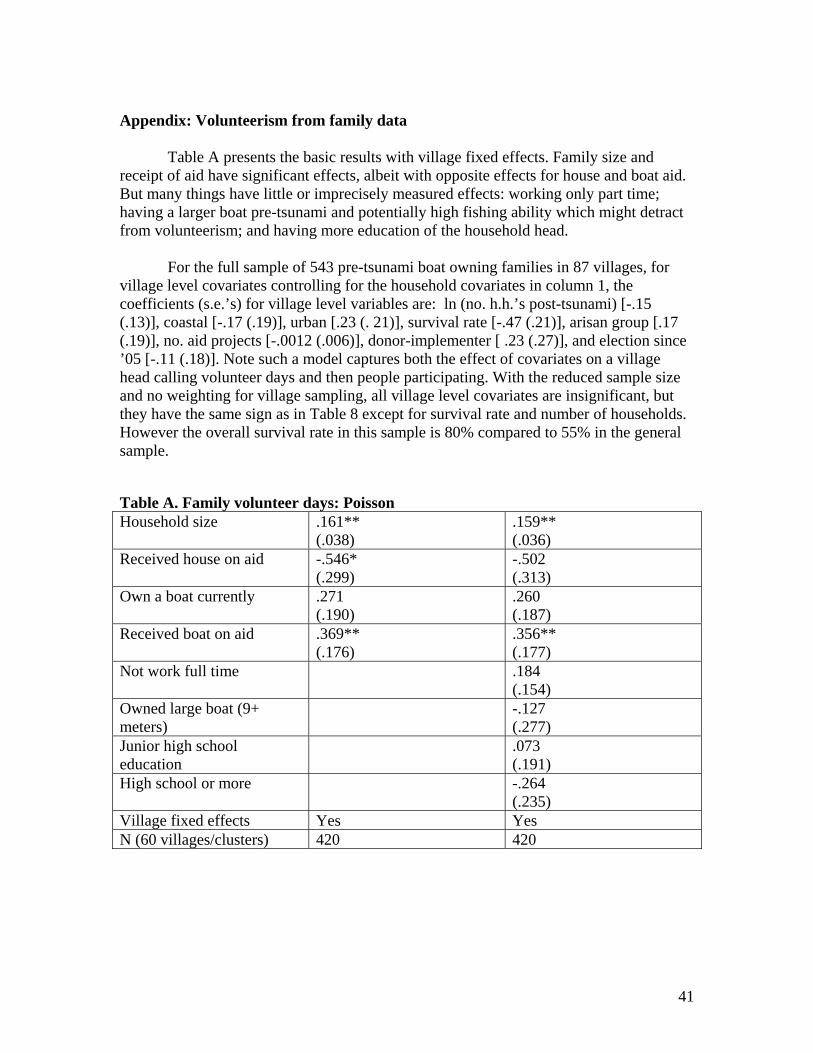
41
Appendix: Volunteerism from family data
Table A presents the basic results with village fixed effects. Family size and receipt of aid have significant effects, albeit with opposite effects for house and boat aid. But many things have little or imprecisely measured effects: working only part time; having a larger boat pre-tsunami and potentially high fishing ability which might detract from volunteerism; and having more education of the household head.
For the full sample of 543 pre-tsunami boat owning families in 87 villages, for village level covariates controlling for the household covariates in column 1, the coefficients (s.e.’s) for village level variables are: ln (no. h.h.’s post-tsunami) [-.15 (.13)], coastal [-.17 (.19)], urban [.23 (. 21)], survival rate [-.47 (.21)], arisan group [.17 (.19)], no. aid projects [-.0012 (.006)], donor-implementer [ .23 (.27)], and election since ’05 [-.11 (.18)]. Note such a model captures both the effect of covariates on a village head calling volunteer days and then people participating. With the reduced sample size and no weighting for village sampling, all village level covariates are insignificant, but they have the same sign as in Table 8 except for survival rate and number of households. However the overall survival rate in this sample is 80% compared to 55% in the general sample. Table A. Family volunteer days: Poisson Household size .161**
(.038) .159** (.036)
Received house on aid -.546* (.299)
-.502 (.313)
Own a boat currently .271 (.190)
.260 (.187)
Received boat on aid .369** (.176)
.356** (.177)
Not work full time .184 (.154)
Owned large boat (9+ meters)
-.127 (.277)
Junior high school education
.073 (.191)
High school or more -.264 (.235)
Village fixed effects Yes Yes N (60 villages/clusters) 420 420
Copyright © 2022 FDOKUMEN