
Ahmed M. Fallatah - Hydra@Hull
234
THE UNIVERSITY OF HULL Development of Lab-on-a chip technology for the analysis of ions in natural waters being a Thesis submitted for the Degree of Doctor of Philosophy in the University of Hull by Ahmed M. Fallatah MSc Loughborough University
-
Upload
khangminh22 -
Category
Documents
-
view
1 -
download
0
Transcript of Ahmed M. Fallatah - Hydra@Hull

THE UNIVERSITY OF HULL
Development of Lab-on-a chip technology for the analysis of ions
in natural waters
being a Thesis submitted for the Degree of Doctor of Philosophy
in the University of Hull
by
Ahmed M. Fallatah
MSc Loughborough University

ii
Acknowledgements
I would like to express my gratitude to my supervisor, Professor Gillian Greenway,
whose expertise, understanding, and patience while reviewing my manuscript added
considerably to my graduate experience. I would also like to thank Dr. Ian Bell for
his support, guidance, and expertise in engineering science. I would also like to thank
Professor Steve Haswell for his support and encouragement during my study, and
Professor Nicole Pamma for the academic writing course.
I would also like to thank all of the members of the Analytical Research Group at the
University of Hull, especially the Saudi nationals and Dr. Etienne Joly for their
tremendous support, and special thanks to the technicians Bob Knight, Tony Sinclair,
Dr. Steve Clark, Dean and Sean Moore, Gary Kipling and Gary Robinson.
I would like to express my special appreciation of and thanks to Taif University for
their unlimited financial and academic support. I also offer my profound thanks to
the Saudi Arabian Culture Bureau.
I would like to thank all of my family for their love and support and my wife Sarah
and my sister Ayshah for being my closest friends. Finally, I cannot express enough
my appreciation and gratitude for the only people whose love and support is
unlimited: my mother and father.

iii
Abstract
There is a demand for portable in-situ measurement systems for measuring ions in
environmental water samples. Commercially available flow injection analysis
systems are not easy to install, have high power requirements, and use large volumes
of reagents. Miniaturising the measurements is promising, and quite successful
microfluidic automated systems have been developed. These systems, however, tend
to only measure one species at a time, and what is really required is a portable system
that simultaneously measures several anions and cations. The aim of this thesis was,
therefore, to develop a novel analytical device that has the ability to measure several
nutrient levels in water samples in-situ, at high-frequency measurements, by
miniaturising the sample preparation and measurement. The system involved: ion
extraction, ion separation, and detection with a C4D contactless conductivity
detector. This analytical system to be developed needs to be able to replace the
current, typical system being used in the field.
To avoid the effects of the sample matrix on the separation process, the extraction of
ions from the sample before separation, was investigated. Different ion extraction
approaches were explored, including ion extraction through a potassium silicate
monolith and electrodialysis. The potassium silicate monolith was used to extract
ions from water samples; this worked as a barrier to prevent unwanted materials
present in the river water from entering the measurement system. The presence of
these materials would influence the separation process.
Extraction techniques using the potassium silicate monolith were investigated, using
both glass chips and glass capillaries. To prevent the electroosmotic flow (EOF)
caused by the negative charge on the surface of the glass and the monolith, the

iv
surface was silanised. Three different silanisation methods were investigated:
trichloro perfluorooctyl silane (FDTS), a commercial coating, and an end-capping
procedure. The extraction of the ions was achieved with all three of the silanisation
methods but greater reproducibility was needed.
Electrodialysis (ED) was examined to see if it could provide a more reproducible
sample introduction method. The advantage of this method was that it could be
effectively combined with electrophoresis (CE) for rapid pre-concentration and the
subsequent determination of inorganic ions in the river water. Different ED
techniques were investigated for extracting the inorganic ions. This involved
exploring different membranes including polytetrafluoroethylene (PTFE), Parafilm,
cellulose acetate, and ion-exchange membranes. Different ED systems were
evaluated, including a commercial flow design and microfluidic chips manufactured
from cyclic olefin copolymers (COC), with both single and multiple membranes.
The cellulose acetate membrane provided good results for cation extraction from a
real river water sample. Sodium, calcium, potassium and magnesium were extracted
at 85%, 45%, 23%, and 10%, respectively. The anion-exchange (AEX) membrane in
the ED system was successful and demonstrated good results. Cation extraction with
a single cation-exchange (CEX) membrane also provided good results.
Several ED microfluidic chips were designed to improve the extraction, using the
ion-exchange membranes. In this system, a gold electrode was used and positive
results were obtained for both anions and cations, and the anion extraction was
demonstrated using a real river water sample. Five anions were extracted:
respectively comprised sulphate 65%, phosphate with 31%, 82% for chloride, nitrite
with 10% and nitrate with 6%.

v
Initial work on the separation of the inorganic ions concentrated on a monolithic
column, as reported in the literature. For the separation of anions, two different anion
exchangers were investigated, lysine and DDAB. The monoliths were prepared in-
house and were then coated with the anion exchanger. A commercial C18 monolith
was used to compare the results obtained from the homemade monolithic column.
Problems were encountered with the coated monoliths, especially in terms of high
back pressures, and it was decided that capillary electrophoresis (CE) would provide
a better separation solution and would more easily integrate with the ED ion
extraction.
A proposed design of an integrated system was presented including the pumps that
are required, the reagents, and the energy use. The proposed integrated system only
required one buffer for all processes in the system, which reduces the environmental
impact of the chemical reagents. The suitability of the buffer (MES/His) was
extensively investigated, and the amount needed for a month was also calculated to
be less than 3 L, which is ideal for the system portability. It was also calculated that
the required power could be provided by a battery, although the inclusion of solar
panels would be advantageous.
The proposed integrated system meets most of the requirements of the project, and
promising results were obtained. Further optimisation of the design will focus on
increasing the robustness of field applications.

vi
Contents
Acknowledgements ............................................................................................. ii
Abstract .............................................................................................................. iii
List of figures ..................................................................................................... xiii
List of tables .................................................................................................... xxiii
Table of abbreviations ..................................................................................... xxiv
Posters and publications ................................................................................... xxv
1 Introduction ................................................................................................. 1
1.1 The aim of the project .................................................................................... 1
1.1.1 EU Water Framework Directive (WFD) .............................................................. 3
1.1.2 The need for miniaturisation for environmental measurements ...................... 3
1.2 Ions in water and its implications ................................................................. 10
1.2.1 Nutrients as a cause of pollution ..................................................................... 14
2 Critical review of the determination of ions in water techniques................. 15
2.1 Laboratory-based instrumentation for ion analysis ....................................... 15
2.1.1 Atomic spectrometry spectrophotometry ....................................................... 16

vii
2.1.2 Ion chromatography (IC) .................................................................................. 19
2.2 Low-cost instrumentation for water analysis ................................................ 29
2.2.1 Ion-selective electrode (ISE) ............................................................................. 29
2.2.2 Further electrochemical techniques ................................................................ 29
2.2.3 Flow injection analysis (FIA) ............................................................................. 30
2.2.4 Lab-on-a-chip (LOC) .......................................................................................... 34
2.3 Miniaturisation of the separation of ions ...................................................... 37
2.3.1 Monolith column and IC ................................................................................... 38
2.3.2 Isotachophoresis (ITP) ...................................................................................... 42
2.3.3 Capillary electrophoresis (CE) .......................................................................... 43
2.3.4 Electrodialysis ................................................................................................... 47
2.4 Chapter Conclusion ...................................................................................... 49
3 General experimental chapter .................................................................... 50
3.1 Reagents ...................................................................................................... 50
3.2 Instruments ................................................................................................. 51
3.2.1 Ion chromatography ......................................................................................... 51
3.2.2 Inductively coupled plasma optical emission spectrometry (ICP-OES) ........... 53
3.2.3 Infrared (IR) spectrophotometry ...................................................................... 54

viii
3.2.4 Capillary electrophoresis .................................................................................. 55
3.3 Chip manufacture ........................................................................................ 55
3.4 HPLC for the assessment of the monolithic column ....................................... 57
3.4.1 Capacitively coupled contactless conductivity detection (C4D) ....................... 59
3.5 Ion extraction .............................................................................................. 65
3.5.1 Power supply and conductivity ........................................................................ 65
3.5.2 Ion extraction through a potassium silicate monolith in a glass capillary ....... 66
3.5.3 Ion extraction through Polytetrafluoroethylene (PTFE) film and Parafilm ...... 67
3.5.4 Electrodialysis for sample introduction with a commercial cell ...................... 68
3.5.5 Electrodialysis for sample introduction with a glass chip ................................ 69
3.5.6 Electrodialysis on a COC chip with a flat carbon electrode .............................. 70
3.5.7 Electrodialysis on a COC chip with a multi-membrane .................................... 72
3.5.8 Electrodialysis on a COC chip with one membrane ......................................... 76
3.6 Printed circuit boards ................................................................................... 78
3.6.1 Gold-coating of the copper electrodes on the PCB .......................................... 78
3.6.2 Carbon coating of the copper electrodes on the PCB ...................................... 80
3.6.3 Commercial PCB ............................................................................................... 81
4 Silica monoliths for the separation of ions .................................................. 82
ix
4.1 Introduction ................................................................................................. 82
4.2 Experimental ............................................................................................... 83
4.2.1 Preparation of analytical separation column ................................................... 83
4.2.2 Derivatisation of the silica monolith with DDAB .............................................. 86
4.2.3 Evaluation of the structure of monoliths ......................................................... 88
4.2.4 Results and discussion ...................................................................................... 89
4.3 Chapter conclusion ....................................................................................... 99
5 The application of a potassium silicate monolith in sample introduction .... 101
5.1 Introduction ................................................................................................ 101
5.2 Ion extraction on a chip ............................................................................... 102
5.2.1 Experimental .................................................................................................. 102
5.2.2 Results and discussion .................................................................................... 105
5.2.3 Nitrite (NO2-) extraction on a glass chip ......................................................... 108
5.3 Ion extraction on a potassium silicate monolith in a glass capillary ............... 112
5.3.1 Experimental .................................................................................................. 113
5.3.2 Results and discussion .................................................................................... 114
5.4 Silanisation of glass capillary for ion extraction ............................................ 114
5.4.1 Experimental .................................................................................................. 115

x
5.4.2 Experimental set-up and conditions .............................................................. 116
5.5 Results and discussion ................................................................................. 117
5.6 Chapter conclusion ...................................................................................... 125
6 Electrodialysis (ED) for sample introduction ............................................... 128
6.1 Ion extraction through Polytetrafluoroethylene (PTFE) film and Parafilm...... 128
6.1.1 Experimental .................................................................................................. 129
6.1.2 Results and discussion .................................................................................... 129
6.2 Ion extraction with a cellulose acetate (CA) electrodialysis (ED) membrane .. 133
6.2.1 Anion extraction with a cellulose acetate (CA) membrane in a commercial ED
cell 134
6.2.2 Cation extraction with a CA membrane in the commercial ED cell ............... 135
6.2.3 Cation extraction through a cellulose acetate membrane following
optimisation ................................................................................................................ 139
6.3 Ion extraction with glass and cyclic olefin copolymer (COC) chips with a flat
carbon electrode ..................................................................................................... 144
6.3.1 Results and discussion .................................................................................... 145
6.4 Ion extraction on a COC chip with a multi-membrane ................................... 145
6.4.1 Results and discussion .................................................................................... 146
6.5 ED with an ion-exchange membrane using a commercial ED cell................... 151

xi
6.5.1 Anion extraction with one anion-exchange (AEX) membrane using a
commercial ED cell ...................................................................................................... 151
6.5.2 Cation extraction with one cation-exchange (CEX) membrane using a
commercial ED cell ...................................................................................................... 156
6.6 Ion extraction in a COC chip with one membrane ......................................... 159
6.6.1 Results and discussion .................................................................................... 160
6.6.2 Optimisation of cation extraction in a COC chip with one CEX membrane ... 161
6.6.3 Optimisation of an anion extraction in a COC chip with one AEX membrane
166
6.7 Chapter conclusion ...................................................................................... 172
7 Combined CE and ED for a fully integrated system ..................................... 176
7.1 Introduction ................................................................................................ 176
7.1.1 System specifications ..................................................................................... 176
7.2 Proposed design for a total integrated LOC system ...................................... 178
7.2.1 CE separation chip .......................................................................................... 181
7.2.2 Separation process ......................................................................................... 183
7.3 Buffer ......................................................................................................... 184
7.3.1 Buffer conductivity ......................................................................................... 186
7.3.2 Buffer safety ................................................................................................... 186

xii
7.4 Pumps ........................................................................................................ 187
7.4.1 Energy ............................................................................................................. 189
7.5 Chapter conclusion ...................................................................................... 190
8 Conclusion ................................................................................................ 192
8.1 Future work ................................................................................................ 197
9 References ................................................................................................ 198

xiii
List of figures
Figure 1-1: The LIMPIDS project study site map ....................................................... 5
Figure 1-2: The instruments used on site for water quality monitoring. (1) Hach
Lange Phosphax, (2) Hach Lange Sigmatax, (3) YSI Multi-parameter Sonde,
and (4) the flow cell to which water is pumped from the river. ........................... 6
Figure 1-3: Photos of the river monitoring station at The Cut at Barry. ...................... 6
Figure 1-4: Block diagram of the analytical system .................................................... 9
Figure 1-5: The nitrogen cycle [31]
............................................................................. 11
Figure 1-6: Simple diagram of the chemical reaction in the nitrogen cycle[32]
.......... 11
Figure 1-7: Phosphorous cycle [40]
............................................................................. 13
Figure 2-1: ICP-AES schematic diagram [61]
............................................................. 17
Figure 2-2: Ion chromatograph operation principle[78]
.............................................. 20
Figure 2-3: Anion-exchange column, A: at the injection point, B: following elution
of KOH ............................................................................................................... 23
Figure 2-4: The operation principle of a spectrophotometer ..................................... 27
Figure 2-5: schematic drawing of FIA ....................................................................... 31
Figure 2-6: Beaton et al. microfluidic system for in-situ determination of nitrate [139]
............................................................................................................................ 36

xiv
Figure 2-7: The reaction mechanism of hydrolysis and condensation steps for
creating a silica monolith ................................................................................... 40
Figure 2-8: The movement of an ion through an electric field .................................. 43
Figure 2-9: Electroosmotic flow affect in ion movement .......................................... 44
Figure 2-10: Electrodialysis process .......................................................................... 48
Figure 3-1: A chromatogram of anion standards ....................................................... 52
Figure 3-2: Schematic drawing of the fabrication process of the microchip[175]
....... 56
Figure 3-3: Experimental set up of the separation experiment on the monolith ........ 57
Figure 3-4: Fusion 100 Classic Syringe Pump (chemyx US) .................................... 58
Figure 3-5: A picture of the top and side of the loop injector used in the HPLC set-up
for the separation on the monolith ..................................................................... 59
Figure 3-6: Comparison between a) contact and b) contactless conductivity detection
systems[180]
R = resistance, i = current. ............................................................. 60
Figure 3-7: Redrawing of Figure 3-6 (a) to demonstrate an electrode equivalent
circuit ................................................................................................................. 62
Figure 3-8: Redrawing of Figure 3-6 (b) to demonstrate an electrode equivalent
circuit ................................................................................................................. 62
Figure 3-9: Redrawing of Figure 3-8 to demonstrate key voltages ........................... 63
Figure 3-10: C4D detection set-up ............................................................................. 64

xv
Figure 3-11: The set-up of the ion extraction through a potassium silicate monolith
using a glass capillary ........................................................................................ 66
Figure 3-12: The set-up of the ion extraction through a PTFE film using a plastic
tube ..................................................................................................................... 67
Figure 3-13: Schematic drawing of an electrodialysis system[182]
consisting of two
polytetrafluoroethylene link chambers separated by a cellulose acetate
electrodialysis membrane ................................................................................... 68
Figure 3-14: An image of the experimental set-up for ion extraction with the
cellulose acetate membrane and the commercial cell (Harvard Apparatus, UK)
............................................................................................................................ 68
Figure 3-15: Glass microchip for an electrodialysis system for sample introduction 69
Figure 3-16: COC chip for ED, for ion extraction ..................................................... 70
Figure 3-17: Printed circuit board with a copper electrode used to connect the carbon
electrode to the power supply ............................................................................ 71
Figure 3-18: Schematic diagram of the COC chip with two membranes for ion
extraction ............................................................................................................ 72
Figure 3-19: Topside view of a COC multi-membrane system for ion extraction .... 74
Figure 3-20: Bottom-side view of a COC multi-membrane system for ion extraction
............................................................................................................................ 75
Figure 3-21: Schematic drawing of an ED chip with one membrane for the extraction
of ions ................................................................................................................. 76

xvi
Figure 3-22: A photo of the ED system used for the extraction of ions .................... 77
Figure 3-23: Edwards S150B gold-sputter coating instrument .................................. 79
Figure 3-24: Edwards High Vacuum Evaporator, model E12, for the carbon coating
for the copper electrodes .................................................................................... 80
Figure 3-25: A schematic drawing of the metallic layers of electroless nickel
immersion gold (ENIG). .................................................................................... 81
Figure 3-26: The customised commercial PCB with the gold electrode ................... 81
Figure 4-1: 6 cm long silica-based monolithic column for separation ...................... 84
Figure 4-2: Derivatisation of the silica monolith with lysine. A) epoxy monolith, B)
diol monolith and C) the lysine modification .................................................... 86
Figure 4-3: Derivatisation of the silica monolith with C18 ....................................... 87
Figure 4-4: SEM images of the cross-section of a final monolith (A) before lysine
modification and (B) after lysine modification .................................................. 90
Figure 4-5: SEM images of a cross-section of a final monolith (A) after formation;
(B) after the treatment of ammonium hydroxide which creates extra surface
area; and (C) after calcination and coating with cationic surface DDAB to create
an anion-exchange surface ................................................................................. 91
Figure 4-6: Chromatogram of a 1 mM sodium nitrite solution, eluent of 50 mM
phosphate buffer, flow rate of 0.025 mLmin-1
................................................... 92

xvii
Figure 4-7: Chromatogram of the separation of 1 mM sodium nitrite and 1 mM
sodium sulphate on a DDAB monolith, flow rate 0.2 mLmin-1
. The buffer 65%
ACN, and the detector was homemade conductivity detection system. ............ 94
Figure 4-8: Chromatogram of the separation of 1 mM sodium nitrite on a DDAB
monolith, flow rate 0.2 mLmin-1
. The buffer 65% ACN, and the detector was
homemade conductivity detection system. ........................................................ 95
Figure 4-9: Chromatograms of 1 mM sodium nitrite in four injection attempts. The
column was an onyx C18 column coated with DDAB, the buffer was 65%
CAN, the flow rate was 02 mlmin-1
................................................................... 97
Figure 4-10: Chromatograms of 1 mM sodium sulphate in four injection attempts.
The column was an onyx C18 column coated with DDAB, the buffer was 65%
CAN, the flow rate was 02 mlmin-1 .................................................................. 98
Figure 5-1: SEM image of a potassium silicate monolith ........................................ 102
Figure 5-2: A) an image of the chip used for ion extraction, the channel contains
glycerol and dye. B) is a diagram of the chip describing the channel design. . 103
Figure 5-3: Eppendorf tips placed on the glass chip to hold solutions in place ....... 104
Figure 5-4: Chromatogram of 1 mM phosphate buffer ............................................ 105
Figure 5-5: Chromatogram of the solution in reservoir B after ion extraction ........ 106
Figure 5-6: The amount of extracted chloride in the glass chip after an applied
voltage of 700V for two hours ......................................................................... 107

xviii
Figure 5-7: Chromatogram of 6.9 µg nitrite with 27.5 µg phosphate buffer, reservoir
A, before applying the voltage of 700 V for two hours ................................... 109
Figure 5-8: Chromatogram of nitrite with phosphate buffer after applying the voltage
of 700 V for two hours ..................................................................................... 110
Figure 5-9: Chromatogram of the reservoir B solution after applying a voltage of 700
V for two hours ................................................................................................ 111
Figure 5-10: Chromatogram of solution in reservoir A, containing 1 mM phosphate
buffer and 1 mM sodium nitrite, before the experiment .................................. 117
Figure 5-11: Chromatogram of solution in reservoir B, which originally contained 1
mM phosphate buffer. The voltage applied was 10 V, and the run time was 10
minutes ............................................................................................................. 118
Figure 5-12: Percentage of migrated anions through a silanised glass capillary. 25 µg
of each anion in reservoir A was spiked with 10 mM of MES/His buffer. The
voltage was 500 V and the running time was 30 minutes. The number of
experiment was three. ...................................................................................... 120
Figure 5-13: Percentage of migrated anions through a silanised glass capillary. 50 µg
of each anion in reservoir A was spiked with 10 mM of MES/His buffer. The
voltage was 1000 V and the running time was 10 minutes. There were three
experiments. ..................................................................................................... 121
Figure 5-14: Percentage of migrated anions through a 5 cm long silanised glass
capillary. 10, 20 and 30 µg of each anion in reservoir A was spiked with a 10
mM MES/His buffer, with a running time of three minutes ............................ 123

xix
Figure 6-1: Percentage of cations migrated through PTFE film, with a running time
of 5 minutes and an applied voltage of 100 V ................................................. 130
Figure 6-2: Percentage of cations migrated through stretched PTFE film, with a
running time of 5 minutes and an applied voltage of 100 V ............................ 131
Figure 6-3: Comparison of the cation migration percentages through stretched and
typical PTFE membranes ................................................................................. 132
Figure 6-4: The chemical structure of a cellulose acetate ........................................ 134
Figure 6-5: Percentage of cations migrated through a cellulose acetate membrane
with 100 V applied for 10 minutes. Extractions of 124.74 µg out of 1100 µg
calcium chloride, 17.66 µg out of 745.5 µg potassium chloride, and 9.24µg out
of 1200 µg magnesium sulphate, were migrated from the sample reservoir to the
destination reservoir ......................................................................................... 135
Figure 6-6: Optimisation of extraction time through a cellulose acetate membrane,
with 5 mM MES/His and cation standards ...................................................... 137
Figure 6-7: Optimisation of voltage applied to the reservoir in the extraction of
cations through a cellulose acetate membrane, with 5 mM MES/His and cation
standards........................................................................................................... 138
Figure 6-8: Percentage of cations migrated through a cellulose acetate membrane,
with a 5 mM buffer and 15 V in 7 minutes ...................................................... 140
Figure 6-9: Percentage of cations migrated in 7 minutes at 15 V, with a 5 mM acetic
acid buffer ........................................................................................................ 142

xx
Figure 6-10: The percentage of cations migrated through a cellulose acetate
membrane, with two different buffers, 5 mM MES/His and 5 mM MES/His + 5
mM acetic acid ................................................................................................. 143
Figure 6-11: The percentage of anion extraction with gold-coated electrodes. The
buffer used was 5 mM MES/His and the anion concentration was 1 g/L of each
anion. ................................................................................................................ 147
Figure 6-12: The percentage of anion extractions, with carbon coating over gold-
coated electrodes. The buffer used was 5 mM MES/His and the anion
concentration was 1 g/L each of anion............................................................. 149
Figure 6-13: The percentage of anion extraction using a desalination cell, with two
different electrode coatings, gold and carbon .................................................. 150
Figure 6-14: The percentage of anion extraction through an anion-exchange
membrane, at different voltages. The sample uses an anion standard solution, 1
g/L of each anion, with a 5 mM MES/His buffer ............................................ 152
Figure 6-15: The percentage of anion extraction through an anion-exchange
membrane, with different timings. The sample was an anion standard solution of
1 g/L of each anion, with a 5 mM MES/His buffer is. The experiment was run
three times. ....................................................................................................... 153
Figure 6-16: IR spectrums for the AEX membrane at three different conditions: only
in water overnight; a new membrane; and a used membrane .......................... 155
Figure 6-17: The extraction percentages of four cations through a cation-exchange
membrane at a fixed time of 1 minute, with different voltages (10, 30, 70, and
100 V) and a 5 mM MES/His buffer................................................................ 157

xxi
Figure 6-18: The extraction percentages of four cations through a cation-exchange
membrane at a fixed voltage of 30 V and different timings (0.3, 1, 2, 3, 4, and 5
minutes), with a 5 mM MES/His buffer .......................................................... 158
Figure 6-19: The percentage of the extraction for four cations through a CEX
membrane at a fixed voltage of 100 V and different timings (0.3, 1, 2, 3, 4 and 5
minutes) ............................................................................................................ 162
Figure 6-20: The extraction percentages of four cations through the CEX membrane
at a fixed extraction time of 3 minutes and different voltages, with a 5 mM
MES/His buffer ................................................................................................ 163
Figure 6-21: The percentage of anion extractions through an AEX membrane in an
ED chip ............................................................................................................ 167
Figure 6-22: The percentages of anion extractions through a new AEX membrane in
an ED chip ........................................................................................................ 169
Figure 6-23: The percentage of anion extractions through a used AEX membrane in
an ED chip ........................................................................................................ 170
Figure 6-24: Comparison of the extraction percentages of five anions through new
and used AEX membranes in an ED chip ........................................................ 171
Figure 7-1: Proposed design of an ED and CE integration system in a total LOC
system............................................................................................................... 178
Figure 7-2: A diagram of the capillary electrophoresis used for the separation of ions
.......................................................................................................................... 181
Figure 7-3: A diagram to explain the injection and separation process ................... 183

xxii
Figure 7-4: Fluorescence emission of a MES/His buffer under different conditions
.......................................................................................................................... 185
Figure 7-5: Rough sketch of a water-quality monitoring system highlighting the
possible collection reservoir ............................................................................. 188

xxiii
List of tables
Table 3-1: Table of reagents ...................................................................................... 50
Table 5-1: Percentage of migrated anions through a 5 cm long silanised glass
capillary ............................................................................................................ 124
Table 5-2: Table of migrated anions in an end-capped glass capillary and the
monolith ........................................................................................................... 125
Table 6-1: The concentration of cations trapped in the cellulose acetate membrane
after experiments .............................................................................................. 141
Table 6-2: Cation extraction with an ED system ..................................................... 160
Table 6-3: The amount of cations in the membrane and ED system after washing
them with 0.1 mM acetic acid and 5 mM MES/His buffer, with analysis carried
out through ICP-AES ....................................................................................... 164
Table 6-4: The results of anion extractions (from River Hull water sample) through
AEX in the ED chip ......................................................................................... 168
Table 7-1: Buffer conductivity at different concentrations ...................................... 186
Table 7-2: Estimated power consumption of the LOC system components ............ 189

xxiv
Table of abbreviations
AAS Atomic absorption spectrometry AC Alternating current ACN Acetonitrile
AES Atomic emission spectroscopy
BET Brunauer-Emmett-Teller
C4D Capacitively Coupled Contactless Conductivity Detection CE Capillary electrophoresis COC Cyclic Olefin Copolymer
DC Direct current
DDAB Didodecyldimethylammonium bromide ED Electrodialysis EOF Electro-osmotic Flow EPSRC Engineering and Physical Sciences Research Council
FDTS trichloro perfluorooctyl silane
FIA Flow injection analysis HV High Voltage IC Ion Chromatography
ICP Inductively coupled plasma IEC Ion exchange chromatography
IPC Ion pairing chromatography
ISE Ion selective electrode
ITP Isotachophoresis LIMPIDS Linking Improved Modelling of Pollution to Innovative Development of Sensors
LOC Lab-on-a-chip
LOD Limit of detection
MEC microchip-based capillary electrophoresis
MS Mass spectrometry
PCB Printed circuit boards
PMMA Polymethylmethacrylate
PTFE Polytetrafluoroethylene
RP Revered phase
SEM Scanning electron microscopy SRP Soluble reactive phosphorus TDP Total dissolved phosphorous
TEOS Tetraethylorthosilicate
TP Total phosphorus TRP Total reactive phosphorus μep Electrophoretic mobility

xxv
Posters and publications
Posters
“Overcoming sample introduction issues for Lab-on-Chip environmental analysis”
poster presented at the Lab-on-Chip European congress held in Edinburgh, 28-29
March 2012.
“Overcoming sample introduction issues for Lab-on-Chip environmental analysis”
poster presented at the Analytical Research Forum 2012 held at Durham University,
2-4 July 2012.
“Development of Lab-on-Chip technology for the analysis of ions in natural waters”
poster presented at Lab on a Chip Europe held in Barcelona, 5-6 March 2013.
“Development of Lab-on-Chip technology for the analysis of ions in natural waters”
poster presented at Waste Water Emissions Monitoring Conference held in Telford,
5-6 November 2014.
“Development of Lab-on-Chip technology for the analysis of inorganic ions in
natural waters” poster presented at The 8th Saudi Student Conference in UK, held in
London, 31 January-1 February 2015.
Conference talks
“Development of Lab-on-Chip technology for the analysis of inorganic ions in
natural waters” at The 6th PhD Experience Conference 2015, held at the University
of Hull, 7-8 April 2015. Awarded best oral presentation.

xxvi
Publications
Joly, E. Bell, I. M., Fallatah, A., Greenway, G. M., Haswell, S. J., Wade, A. J. and
Skeffington, R. A. Design and Test Issues for Lab-on-Chip Ion Separation for In-situ
Water Quality Monitoring. In Mixed-Signals, Sensors and Systems Test Workshop
(IMS3TW), 2012 18th International, 2012.
Wade, A. J., PalmerFelgate, E. J., Halliday, S. J., Skeffington, R. A.,
Loewenthal, M.,Jarvie, H. P., Bowes, M. J., Greenway, G. M., Haswell, S. J.,
Bell, I. M., Joly, E., Fallatah, A., Neal, C., Williams, R. J., Gozzard, E.
and Newman, J. R. From existing in-situ, high-resolution measurement technologies
to lab-on-a-chip – the future of water quality monitoring? Hydrology and Earth
System Sciences Discussions, 2012, 9, 6457-6506.

1
1 Introduction
The increase in demand for water and the problem of water pollution, both the quantity
and quality of surface water and groundwater, are of major concern worldwide,
especially in terms of the presence of nutrients and heavy metals in water, which pose a
serious threat to human health.[1]
The primary step for the effective management of
surface and groundwater is the regular and continuous monitoring of water quality in
terms of the distribution, source and identification of contaminants.[2]
Water is a very important natural resource upon which relies the sustainability of human
civilisation. Unfortunately, it has been subjected to pollution due to human activities;
pollutants such as nutrients, pesticides and heavy metals are transported from many
different sources, through surface and groundwater pathways.[3]
In addition, runoff from
farms and cities is a main source of nutrients (mostly phosphorus and nitrogen) entering
surface waters such as lakes, rivers and coastal waters; industries and vehicle emissions
are also a major source of pollution.[3-4]
Furthermore, with the high use of heavy metal
salts, an alarming increase has been occurring in the concentrations of these ions in the
biosphere.[5]
In addition, some pollutants do not degrade in the environment and they
can persist for hundreds of years because they are only transformed from one oxidation
state to another, or from one organic complex to another.[4]
However, contamination
sources lead to damaging effects on plants and animals, and eventually, on human
health, either directly or through the food chain.[6]
Water pollution, therefore, poses a
great potential threat to the environment and human health.
1.1 The aim of the project
The aim of this project is to develop a novel, analytical device that is capable of
measuring and detecting the nutrient level of water samples in-situ at high-frequency

2
measurements, by utilising the advantages of miniaturisation for sample preparation and
measurement. The system involves:
1. Ion injection
2. Ion separation
3. Detection.
The analytical system to be developed needs to be able to replace the existing system
that the Environmental Agency (EA) and the Centre for Ecology and Hydrology (CEH)
are already using in the field. Ideally, the system would be able to fulfil the following
specifications:
Measure Na+, K
+, Ca
2+, Mg
2+ and NH4
+, NO3
-, NO2
-, SO4
2-, Cl
- down to 0.01mg/L
Measure PO43-
down to 0.001 mg/L and preferably the same for Br+ and I
-
The possibility to measure trace elements such as B, Li, Al, Fe and Mn down to
0.001mg/L
Operating temperature of 0 to +35°C
Housed in a secure unit
Self-calibrating with the option of weekly/monthly field visits
The running cost should be less than £2k/year and preferably less than £1k/year
The option for automatic cleaning
The possibility to be used without mains power, i.e., batteries
The possibility to monitor rainfall
The monitoring frequency should preferably be down to 15 minutes without loss of
accuracy.

3
1.1.1 EU Water Framework Directive (WFD)
The WFD is a European Union directive that commits European Union members to
accomplishing a good qualitative and quantitative status of all water bodies by 2015. It
is a framework that provides steps to achieving a common target rather than adopting a
more traditional approach.[7]
The WFD has established a comprehensive river basin
management-planning scheme to help protect and improve the ecological health of
water surfaces such as rivers, lakes, and coastal and ground waters. This is achieved by
the use of environmental standards to assess the quality of the water environment and
identify the scale of improvements that would be required to enhance the water quality
to a better condition.[8]
The WFD requires the control of nutrient inputs into water bodies, which might reach
the water surfaces from farming activities and agriculture; therefore, nutrient
concentrations from fertilisation has gained considerable attention.[9]
The WFD states
that the concentration of nutrients should be maintained; for instance, the concentration
of nitrates must not exceed 50 mgL-1
for rivers[10]
[11]
, and the concentration of
orthophosphate and total phosphorus hould be between 0.1-0.2 mg L-1
, depending on
the river type.[12]
1.1.2 The need for miniaturisation for environmental measurements
River water is one of the most important water sources, and yet its quality is affected by
human activities such as domestic, industrial and agricultural activities.[13]
Furthermore,
changes in climate also affect river water and the water supply in general.[13]
The
changes in the stream water chemistry of rivers are difficult to predict due to the
geographical, chemical and biological factors; each factor has its own impact on river
water.[14]
However, linking these changes by monitoring the surface water on a sub-

4
daily basis is highly significant because it helps in understanding the hydrochemical and
biological activities of the surface water.[15]
Currently, water-monitoring procedures normally require the collection of samples from
remote locations; these have to then be stabilised and transported to a laboratory. The
samples are then analysed using laboratory-based systems. The procedure is slow and
costly, and samples can degrade. Therefore, one of the best preventive measures is to
determine the contaminants as quickly as possible in-situ, which is an important task in
environmental monitoring.[2]
This will enhance the speed of the response to adverse
changes in water quality, which then leads to the effective sub-daily monitoring of water
quality.
In a recent EPSRC-funded project, LIMPIDS, in which the University of Hull was a
partner, portable laboratory-based technologies were deployed in the field in three
monitoring sites in the catchment area of the River Thames (Figure 1-1). From these
sites, high-frequency water quality data were obtained for the River Enborne, The Cut
and The Kennet. Each of the three study sites was instrumented with a YSI multi-
parameter 6600 sonde and a high-frequency nutrient monitor (Figure 1-2 and
Figure 1-3). These instruments were programmed to send data remotely and they were
connected to the Environment Agency/Meteor Communications sensor web network.

5
Figure 1-1: The LIMPIDS project study site map
The measurements were transmitted and accessed in real-time. The YSI 6600 sonde
measured dissolved oxygen, pH, water temperature, conductivity, turbidity, and
chlorophyll concentration. Two further instruments based on flow injection analysis
(FIA) were used. The first instrument was a Micromac C, which was used to measure
total reactive phosphorus TRP, NO2 and NH4. The second one was a Hach Lange
Sigmatax and Phosphax Sigma to measure total phosphorus TP, total dissolved
phosphorous TDP, and soluble reactive phosphorus SRP. The Hach Nitratax Plus probe
was also used to measure NO3 using a reagent-free, ultra-violet (UV) absorption
technique. Such a mobile, in-situ laboratory made it possible to investigate dynamics at
high-frequency over a range of positions.[15]
More details of the operation of these
instruments are provided in section 2.2.3.

6
Figure 1-2: The instruments used on site for water quality monitoring. (1) Hach Lange Phosphax,
(2) Hach Lange Sigmatax, (3) YSI Multi-parameter Sonde, and (4) the flow cell to which water is
pumped from the river.
Figure 1-3: Photos of the river monitoring station at The Cut at Barry.
1
2
4
3

7
Unfortunately, these monitoring stations needed lots of resources; suitable sites and
locations had to be found and then they need to be installed. Factors that had to be
considered included designing the appropriate structures to install the instrumentation,
site suitability, security, mains power, safety and accessibility. These factors limited the
choice of the best locations for continuous monitoring. In addition, these in-situ
monitoring stations required continuous maintenance, which was time consuming and
costly.
The lack of mains electricity led to the use of the propane-fuelled generator to power the
instrumentation, which was expensive and resulted in measurements being taken every
two hours instead of every hour. Also, winter temperatures caused problems, with too
much power required for heating problems. Furthermore, the river water sample
required filtration to maintain the instrumentation and avoid any interference that would
affect the measurements. However, the filtration of the river water sample for the
measurement on site was very difficult; even with the air-purge system within the
filtration module, the filters still became clogged. This restricted the extraction of the
sample and the continuous determination of filtered phosphorous fractions, which is
very important for environmental monitoring (See section 1.2).
The results obtained from the instruments in the stations show that: the use of field-
based laboratory instrumentation is very useful but, from the experiences of deploying
and maintaining the equipment in this project, it is not ideal for river water monitoring,
because it requires mains electricity. This is very significant limitation of the portability
of the monitoring system, as it affects the choice of location and sampling. In addition, a
field-based laboratory is very expensive, consumes large amounts of reagents and waste
water, needs more infrastructure to make it portable, and is not sufficiently secure. It

8
also requires lots of workers and employees for maintenance, as well as the time spent
on housing the equipment at the location.
New technology is needed to overcome the practical problems associated with the field-
based laboratory system currently used in this project. The development of a rapid,
accurate and robust in-situ microscale analytical technique that can solve these
problems would be highly desirable. With these kinds of devices, the in-situ
measurement of target pollutants at a specific location would explain many complex
reactions of the biodegradation of toxic organics that occur in soil, biofilm and
sediment.[2, 16]
They might also be capable of providing continuous, in-situ monitoring
of contaminants flowing in surface water and groundwater. The need for accurate,
robust in-situ microscale monitoring is not just for hazardous material in river water, but
is more universal. For example in the remediation of hazardous waste sites, especially
for those using bioremediation techniques, there is a significant need for monitoring.
Fast information feedback during waste site remediation is vital for the sustainable
management of soils[17]
. Other possible environmental applications include the
monitoring of stream or lake sediments, water and wastewater treatment reactors, and
water distribution schemes.[2]
Lab-on-a-chip devices for field or in-situ monitoring of river water could provide
advantages over the existing in-situ continuous monitoring technology, since they
require low power and much smaller amounts of reagents and waste.[18]
Most
importantly, their portability means that the measurement can be carried out in many
locations within a sensor network.[15]

9
Figure 1-4: Block diagram of the analytical system
The block diagram in Figure 1-4 demonstrates an overview of the planned system. It is
divided into four parts. The sample introduction would extract the target ions from the
water pumped out of the river. After that, the separation system would separate the ions
before they enter the detection cell. The detector, which would be combined with a
baseline suppression system, measures the current conductivity of the cell and provides
the results that could be stored for later use or connected to a sensor network.[19]
In this interdisciplinary project, the engineers were focused upon developing the control
systems and the detector, whereas the analytical science aspect of the project focused on
combining sample introduction and separation.
This project concentrates on the development of novel methodology based on
microfluidics, which exploits the advantages of miniaturisation for the sample
introduction and separation of a selected range of inorganic ions that can be used for in-
situ water monitoring.
RIV
ER
Sample Introduction
Separation Suppressor
Measurement & Control electronics
Detector
Chemical Chemical Electronic
USBSD Card
Wa
ste
Fluidic path
Analogue / Digital path

10
1.2 Ions in water and its implications
Inorganic ions can cause water pollution, having their own ways of entering the
environment and their own specific dangers.[20]
Inorganic materials are already present
in the environment and river water in particular has ions from rocks and minerals, as
well as from metals such as gold, silver, copper, lead, zinc, and chromium.[21]
Nutrients
are natural elements in the environment, which are necessary for living organisms.
Calcium, magnesium, and sulphur are secondary elements, needed in smaller amounts
than the primary nutrients for plants.[22]
Calcium and magnesium ions come from rocks
and minerals, and these two elements are responsible for creating hard water.[23]
Plants
in particular require relatively large amounts of the primary nutrients, nitrogen,
phosphorus and potassium. These three nutrients are the ones most frequently supplied
to plants during fertilisation, such as ammonium nitrate,[24]
calcium phosphate[25]
and
potassium chloride (known as potash fertiliser).[26]
Nitrogen is an essential element for all known forms of life on Earth. It is an ingredient
in all amino acids, as it is integrated into proteins, and is present in the bases that
form nucleic acids such as DNA.[27]
In plants, a large amount of the nitrogen is used
in chlorophyll molecules, which are significant for photosynthesis and further
growth[28]
. Nitrogen gas (N2) is the largest component of the Earth's atmosphere,[29]
and
chemical and natural processes convert gaseous nitrogen into compounds such as nitrate
or ammonia, which can be used by plants. This is known as the nitrogen cycle, as shown
in Figure 1-5, and it is a significant aspect of the ecosystem.[30]

11
Figure 1-5: The nitrogen cycle [31]
Figure 1-6: Simple diagram of the chemical reaction in the nitrogen cycle[32]
Nitrogen is present in the environment in a wide variety of chemical forms such as
ammonium (NH4+), nitrite (NO2
−), nitrate (NO3
−), nitrous oxide (N2O) and nitric
oxide (NO). The processes of the nitrogen cycle convert nitrogen from one form into
N2 + 3 H2 → 2 NH3
2 NH3 + 3 O2 → 2 2
+ 2 H+ + 2 H2
2 2 2 → 2
→ 2
→ + 2 → N2 Denitrification
Nitrification
Nitrogen fixation

12
another (Figure 1-5). Microbes are responsible for many of these processes.
Atmospheric nitrogen is fixed in order to be used by plants. A proportion of this fixation
occurs in lightning strikes, but the majority of fixation is carried out by diazotrophs
(symbiotic bacteria); these bacteria have the nitrogenase enzyme that combines gaseous
nitrogen from the atmosphere with hydrogen, to make up ammonia.[33]
Another process
that produces ammonia is ammonification, which occurs after the death of plants or
animals, whereby bacteria converts nitrogen back into ammonium salts and
ammonia.[34]
A nitrification step occurs in which ammonia is converted to nitrites (NO2−) and nitrates
(NO3-) after ammonification. This process happens naturally and is carried out by
bacteria that live in the soil,[35]
such as Nitrosomonas.[36]
Denitrification then occurs,
whereby the reduction of nitrates (NO3-) back to nitrogen gas (N2) completes the
nitrogen cycle. This process is also carried out by bacteria such as Pseudomonas and
Clostridium in anaerobic conditions.[37]
Phosphorus also has a cycle (Figure 1-7) but it does not enter the atmosphere;
phosphorus mainly remains on land and in rock and soil minerals. Phosphorus occurs in
the environment as a phosphate ion (PO4)3−
. On land, the majority of phosphorus is
found in rocks and minerals. Initially, phosphorus-rich sediment is formed in the ocean
and then over time, geological processes bring ocean sediments to land. The weathering
of rocks and minerals releases phosphorus to rivers in a soluble form, which is then
returned back to the ocean. It could also be absorbed by plants, where it is converted to
organic compounds.[38]
When animals consume plants, phosphorus is either
incorporated into their tissues or excreted. When animals or plants decompose
following death, phosphorus is returned back to the soil where a large amount of the

13
phosphorus is converted into insoluble components.[39]
Parts of these components are
carried out by runoff and returned back to the ocean (Figure 1-7).
Figure 1-7: Phosphorous cycle [40]
Potassium is found in the environment in different compounds such as potassium
chloride (KCl), which is usually used as a fertilizer,[41]
potassium hydroxide (KOH), and
potassium carbonate (K2CO3). Potassium can be found in vegetables, fruit,[42]
meat,
milk and nuts, and it plays a significant role in human physiology. It is also necessary
for almost all forms of life, including plants. Most potassium occurs in the Earth's
crust[43]
as minerals[44]
such as clays, and is then released and cycled in the environment
through weathering, which is why it presents in large quantities in the sea.[45]
Most soils
have a large amount of potassium, although it is soluble in water, but in some areas it is
not soluble in water; therefore, it cannot be absorbed by plants, hence its common use as
fertilizer.[46]

14
1.2.1 Nutrients as a cause of pollution
Exceeding the normal, natural amount of nutrients in water will cause environmental
problems by causing an unbalanced ecosystem. For instance, nitrogen and phosphorous
increase the growth of algae blooms in water surfaces when healthy levels of nitrogen
and phosphorus are exceeded (eutrophication).[47]
The uncontrolled growth of algae
causes several problems for underwater organisms; these algae block sunlight and
prevent oxygen from reaching deep underwater species, which leads to serious
environmental problems.[48]
Moreover, some algal blooms have a negative effect on
humans because they produce toxins (such as cyanobacteria[49]
) and encourage bacterial
growth that can cause diseases, which makes it a serious threat as it is directly toxic to
humans and animals.[50]
In addition, drinking water and groundwater are of specific
concern, as nitrates in drinking water lead to serious human health problems such as
methemoglobinemia (infantile cyanosis), cancer, neural tube effects, or spontaneous
abortions.[2]
In addition, the presence of ammonia in water when it is treated with
chlorine, forms chloramines, which have been found to be carcinogenic.[51]

15
2 Critical review of the determination of ions in water
techniques
There are currently several methods for detecting ions in water, which could be portable
or laboratory-based systems. The latter method is the most popular as laboratory-based
systems usually provide all the necessary tools for high quality measurements, with
good accuracy, sensitivity and selectivity. Most of the portable systems have limitations
and can only measure one ion at a time.
2.1 Laboratory-based instrumentation for ion analysis
There are two gold-standard techniques used for measuring ions in water: inductively
coupled plasma (ICPAES) and ion chromatography (IC).[52]
Ion chromatography (IC) is
the most widely used analytical technique for the determination of ions in solutions.[53]
It is the most convenient technique for the determination of inorganic cations and anions
in water.[53-54]
Since 1980, IC has been used for the analysis of the most popular
inorganic anions in environmental waters[55]
as it is fast, very efficient, and has good
capacity and sensitivity.[56]
ICP is used for the determination of trace elements in water. It is a powerful technique
as it has the advantages of being able to determine many elements simultaneously in a
single run with low limits of detection, high accuracy, and precision.[57]
There are,
however, other analytical techniques used in water analysis such as ion-selective
electrodes and titration; these techniques have limitations, which will be discussed later.

16
2.1.1 Atomic spectrometry
Atomic spectrometry is an analytical technique that determines the concentrations of
elements in a sample. In this technique, substances are decomposed into atoms in a
flame, furnace or plasma,[58]
and the emission or absorption of ultraviolet UV or visible
radiation is then measured, with each element having its own unique spectra; the
concentration of the element is proportional to the measured radiation.
The most widely used analytical techniques based on atomic spectrometry are atomic
absorption spectrometry (AAS) and inductively coupled plasma atomic emission
spectroscopy (ICP-AES). Both techniques have been used for the analysis of elements
in water samples for a long time, and both are commercially available. ICP-AES has
advantages over AAS, as ICP-AES can measure multi-elements in one run, while AAS
measures one element per run.[59]
Furthermore, the sensitivity of ICP-AES is better than
AAS. ICP-AES has excellent features, such as low detection limits, a wide linear
dynamic range, and high precision.[60]
This technique is very sensitive, being able to
measure down to parts per billion (ng/g). It is widely used for the analysis of
environmental, pharmaceutical, industrial, and geochemical samples.[61]
2.1.1.1 Inductively coupled plasma atomic emission spectroscopy ICP-AES
In order to create plasma in ICP-AES, argon gas is supplied to the torch, and a high
frequency electric current is then applied to the copper coil wrapped around the outside
torch,[62]
allowing the plasma to form. Liquid or gas samples are then injected into the
central channel of plasma via nebulisation, in which the sample solution is converted to
an aerosol. Solid samples have to be acid-digested to ensure that the analytes of interest
are present in the solution.

17
Figure 2-1: ICP-AES schematic diagram [61]
At its core, the ICP has a high temperature of between 6,000-10,000 K,[63]
which rapidly
vaporises the aerosol. Analyte elements become free atoms in the gaseous state. More
collision within the plasma will provide more energy to the atoms, which will promote
them to excited states.[64]
This high energy usually converts the atoms to ions and then
promotes the ions to excited states. The excited atomic and ionic species then relax to
the ground state through the emission of photons; these photons have energies that are
specific to each atom and ion. Therefore, the wavelength of the photons can be used to
identify the elements. The amount of photons emitted is proportional to the initial
concentration of element in the sample.[65]
2.1.1.2 Inductively coupled plasma mass spectrometry (ICP-MS)
Inductively coupled plasma mass spectrometry (ICP-MS) is one of the most important
analytical techniques for the measurement of elements in a sample. It counts the number
of ions at a certain mass of the element. The majority of samples analysed by ICP-MS

18
are liquid, but gas samples can also be measured directly. As with ICP-AES, solid
samples can also be analysed after digestion. In ICP-MS, the plasma is used as an ion
source; a proportion of the ions are extracted via an interface into a mass spectrometer,
which separates into their mass and determines their concentration.[63]
As an instrument, the ICP-MS usually has the ability to measure most of the elements in
the periodic table. It can measure with detection limits down to parts per trillion (ppt)
due to the very high sensitivity of the electron multiplier detector, and it also has the
ability to obtain isotopic information. It is routinely used in many areas of analysis, such
as environmental and forensic sciences, and industries.[66]
In comparison to ICP-AES,
however, ICP-MS is more sensitive but has less tolerance of high solid-liquid samples,
as salt can block the nickel cones used to sample the ions in the interface between the
plasma and the mass spectrometer.[67]
Despite all the fantastic advantages of both ICP-AES and ICP-MS instruments,
especially for water analysis, and the measurement of elements and cations in particular,
they contain some major limitations, meaning that they are not ideal for in-situ
monitoring of water. The main disadvantages are, firstly, the high cost of purchase.
They also have high operational costs and require well-trained personnel for operation.
Secondly, the size of the instrument is very big and requires extra room for the argon
gas. Furthermore, it needs to be housed in a room that has good temperature regulation.
Thirdly and most importantly is the portability of the system: the ICP is usually big in
size and requires a vast amount of argon for operation, which limits the portability and
movement of the system from one place to another. As previously discussed, for in-situ
water monitoring, portability is a very important factor as it greatly helps in monitoring
the changes to water surface.

19
2.1.2 Ion chromatography (IC)
IC has the ability to measure concentrations of most anions, such as fluoride, chloride,
nitrate, nitrite, phosphate and sulphate, as well as most cations such as sodium,
potassium, calcium and magnesium, with limits of detection (LOD) down to parts per
billion (ppb).[68]
An IC system consists of the column and the detection system, which is
usually conductivity (suppressed or non-suppressed), spectrophotometry, or
electrochemistry (amperometry or potentiometry).[69]
There are two separation
mechanisms that can be used for inorganic anions in IC: ion-exchange chromatography
(IEC) and ion-pairing chromatography (IPC).
IPC depends on the addition of an ion-pairing reagent to the eluent, which is a counter
ion that allows the formation of neutral ion-pairs with the charged analytes.[70]
The ion-
pairing agent often has an alkyl chain, which adds hydrophobicity so that the ion-pair
can be retained on a reversed-phase HPLC RP column. When used with typical
hydrophobic HPLC phases in the RP mode, they can be used to increase the selectivity
of retention of charged analytes.[71]
Negatively charged reagents that have a charge
opposite to the analyte of interest, such as decane sulphonic acids, can be used to retain
positively charged ionic bases.[71-72]
On the other hand, a positively charged reagent,
such as tetrabutyl ammonium phosphate,[73]
can be used to retain negatively charged
ionic acids.
IEC is the most widely used technique for the separation of inorganic ions; it utilises
ion-exchange resins to separate inorganic ions based on their interaction with the resin.
Its main use is for the analysis of anion, as it is a fast analytical method for such
analysis,[74]
but it is also used for cationic species.[75]
In IEC, the analyte’s molecules are
retained on the stationary phase, based on ionic interactions. Separation can be
selectively achieved through adsorption and the release of samples from the stationary

20
phase, as discussed below. Ion exchange is established with the equilibration of the
exchanger, using the pH and ionic strength of the mobile phase. In the equilibrium,
exchangeable groups are associated with counter ions. When equilibrium is reached and
the sample added, ions undergo additional adsorption replacing the counter ions on the
column and reversibly bind to the stationary phase. The unbound substances will pass
through the column with the void volume. Finally, substances are removed from the
column by increasing the ionic strength of the eluent.[76]
The most commonly used detection system for IC is conductivity, despite the fact that
there is a high background conductivity signal from the eluent. To overcome this high
background, chemically suppressed conductivity detection is widely used, as initially
established by Baumann et al. in 1975[77]
and commercialised by the Dionex
Corporation.
Figure 2-2: Ion chromatograph operation principle[78]

21
Figure 2-2 shows the operation principle of an IC system, based on ion-exchange
separation with chemical suppression. The pump flushes eluent through the IC system,
which is required to provide a consistent and reproducible flow rate of the eluent
through the separation column. The eluent used with chemical suppression is usually
potassium hydroxide.[79]
Ion capacity in IC plays a great role in measuring the
concentration of competing ions in the eluent. A high capacity column usually requires
more concentrated eluent, as the eluent composition gives the best flexibility for
optimising the retention time.[78]
Different eluents can be used but NaOH or sodium
hydrogen carbonate buffers are commonly used[80]
because they have low conductivity,
which increases the sensitivity and the limit of detection (LOD). The hydroxyl (OH-) is
the weakest ion-exchange competing anion and the high pH allows anions of weak acid
to be ionised and then retained.[78]
The concentration of the eluent should be high
enough to elute anions with a high affinity.[81]
The sample including the analytes of interest is introduced to the top of the column by a
loop injector valve, and carried through the column by the pumped eluent. The ion-
exchange stationary phase in the column consists of uniform small diameters that may
be inorganic or polymeric particles consisting of fixed ions and exchangeable counter-
ions (𝑹−𝑬−), which are displaced by the eluent ions and sample ions as they move
through the column.[82]
In anion analysis, an anion-exchanger column is used with
quaternary amine −𝐍(𝐂𝐇𝟑)𝟑+𝐎𝐇−, and in cation analysis, cation exchangers are used,
such as sulphonic acid −𝐒𝐎𝟑−𝐇+.
[83] Modern ion exchangers phase are porous, layered
beads with an impervious centre covered in a thin (2 µm) porous outer layer with the
ion-exchange layer.[84]
This results in faster rates of mass transfer and higher
efficiencies.

22
For example, in the separation of chloride Cl- and fluoride F
- using an anion-exchange
column where both are at the same concentration and the eluent is sodium hydroxide,
the column must be washed by the eluent prior to injection of the sample in order to
totally change the ion-exchange surface to −𝑶𝑯−. When chloride and fluoride are
injected into the column, an equilibrium step occurs.
𝑹 − 𝑶𝑯− + 𝑪𝒍− ↔ 𝑹 − 𝑪𝒍− + 𝑶𝑯−
𝑹 − 𝑶𝑯− + 𝑭− ↔ 𝑹 − 𝑭− + 𝑶𝑯−
Equation 2-1
Equation 2-2
Separation in IC is measured by the retention factor (K). The analyte is distributed
between the mobile and stationary phases. This was originally called the distribution
constant but is now called the retention factor.[85]
𝐊 =𝐚𝐦𝐨𝐮𝐧𝐭 𝐨𝐟 𝐚𝐧𝐚𝐥𝐲𝐭𝐞 𝐢𝐧 𝐜𝐨𝐥𝐮𝐦𝐧 𝐬𝐭𝐚𝐬𝐭𝐢𝐨𝐧𝐚𝐫𝐲 𝐩𝐡𝐚𝐬𝐞
𝐚𝐦𝐨𝐮𝐧𝐭 𝐨𝐟 𝐚𝐧𝐚𝐥𝐲𝐭𝐞 𝐢𝐧 𝐜𝐨𝐥𝐮𝐦𝐧 𝐦𝐨𝐛𝐢𝐥𝐞 𝐩𝐡𝐚𝐬𝐞 Equation 2-3
In ion chromatographic separation, each ion has a different distribution constant
between the stationary and mobile phases. This constant represents a competition
between these ions for exchange sites on the ion exchanger, on the column surface. For
example, for chloride separation in Equation 2-1, the equilibrium constant k is:
𝒌 =[𝐑 − 𝐂𝐥−][𝐎𝐇−]
[𝐂𝐥−][𝐑 − 𝐎𝐇−] Equation 2-4
The retention factor can be written as below[86]
:
𝐊 =[𝐑 − 𝐂𝐥−]
[𝐂𝐥−] Equation 2-5

23
Alternatively, the retention factor can be calculated using the retention time (tR) of the
sample ion and the dead time (t0); this can be defined as the time taken for unretained
components to pass through the column and detector.[87]
K = (𝒕𝑹 − 𝒕𝟎)/𝒕𝟎 Equation 2-6
The importance of the retention factor is that it does not change, even when the column
length or the flow rate changes.[86]
During the separation process, the stationary phase contains R−𝑪𝒍−, 𝑹 − 𝑭− and
𝑹 − 𝑶𝑯−, and the eluent is a mixture of Cl-, F
-, OH
- and H
+. Chloride and fluoride
move down to the end of the column but because chloride has a stronger affinity to the
positive charge on the column, chloride moves more slowly and elutes later than
fluoride (Figure 2-3).[88]
Figure 2-3: Anion-exchange column, A: at the injection point, B: following elution of KOH
Depending on the ion-exchange groups attached to the column particles, the sample
analytes pass through the column at different rates, ions in the sample are slowed down
Detection cell
Injection point
Chloride
Fluoride
Elue
nt flo
w
A B

24
depending on their attraction to ion-exchange groups on the column surface, the ions
reach the suppressor separately, and then the eluent and analyte ions are transferred to
the detector cell at different times.[89]
To obtain optimal separations in chromatography, band broadening must be minimised;
therefore, the efficiency of the column should be measured. This can be calculated from
the number of theoretical plates of the column (N). This theoretical model supposes that
the chromatographic column consists of a large number of separate layers, and it can be
calculated from Equation 2-8. The analyte moves down the column through the transfer
of equilibrated eluent from one plate to the next, and the higher the value of N, the
better the separation. Also, the efficiency of the separation can be obtained from the
plate height and the height equivalent to a theoretical plate (H); the higher the value of
H the better the separation. This can be calculated from Equation 2-7.[90]
𝑵 = 𝟓. 𝟓𝟓 (𝒕
𝒘𝟎.𝟓)
𝟐
Equation 2-7
𝑯 = 𝑳
𝑵
Equation 2-8
Where HETP is the height equivalent to a theoretical plate, L is the column length, W0.5
is the width at half the peak height, and t is the retention time.
Another measure of the efficiency of the separation is the resolution (R). The resolution
of two species, A and B, can be calculated from Equation 2-9.
𝑹 = 𝟐[(𝒕𝒓)𝑩 − (𝒕𝒓)𝑨]
𝑾𝑨 + 𝑾𝑩
Equation 2-9
Where R is resolution, (tr)B is the retention of the second peak, (tr)A is the retention of
the first peak, WA is the width of the first peak and WB is the width of the second peak.
The best resolution can be achieved when the R=1.5, which is the baseline resolution.[90]

25
The main function of the suppressor is to reduce the background conductivity of the
eluent, which will increase the detector sensitivity for the analyte ions.[91]
The detector
measures the conductivity of the eluent as it passes through the detector cell. However,
the conductivity of an eluent with a high level of ions such as OH- or CO3
2- could be
higher than the conductivity of ions in the sample analyte, and so the eluent
conductivity needs to be supressed before reaching the detector.[81]
The suppressor
consists of an ion-exchange membrane that converts the electrolyte eluent into water.[92]
For example, in anion exchange, the suppressor membrane is a cation exchanger, so
consider if Cl- was the analyte ion and the eluent consisted of NaOH. The eluent reacts
in the suppressor column to exchange the Na+ ions onto the column, leaving
𝐑𝐒𝐎𝟑𝐇 and producing 𝐑𝐒𝐎𝟑𝐍𝐚 (Equation 2-10). At the same time, cations from the
sample such as Na+ are removed by the membrane suppressor and replaced by H
+ ions,
further reducing the conductivity and the eluent react, as in Equation 2-11[22, 78]
:
𝐍𝐚𝐎𝐇 + 𝐑𝐒𝐎𝟑𝐇 ↔ 𝐇𝟐𝐎 + 𝐑𝐒𝐎𝟑𝐍𝐚 Equation 2-10
𝐍𝐚𝐂𝐥− + 𝐑𝐒𝐎𝟑𝐇 ↔ 𝐇𝐂𝐥 + 𝐑𝐒𝐎𝟑𝐍𝐚 Equation 2-11
The results of this process are that the conductivity of the eluent is greatly reduced,
whereas the analyse conductivity increases because sodium ion is replaced by hydrogen
ion, which eventually improves the sensitivity of the analyse.
Similarly, in cation exchange, the suppressor is an anion-exchanger column where more
OH- ions are present. The eluent is changed to water, whereas the conductivity of the
sample is increased because the Cl- ion is replaced by OH
- (Equation 2-12 and
Equation 2-13).[78]
𝐑 − 𝐎𝐇− + 𝐇+ + 𝐂𝐥− ↔ 𝐑 − 𝐂𝐥− + 𝐇𝟐𝐎 Equation 2-12

26
𝐑 − 𝐎𝐇− + 𝐍𝐚+ + 𝐂𝐥− ↔ 𝐑 − 𝐂𝐥− + 𝐍𝐚+ + 𝐎𝐇− Equation 2-13
Another type of chemical suppression used for anion analysis has been developed by
Metrohm; the suppressor consists of three units that work at the same time through a
rotation cycle. One unit is in line with the eluent and the conductivity detector, another
works in line with regeneration reagent, and the third is washed with pure water. The
suppressor can be taken through one more step to remove the carbon dioxide (generated
from the reaction in the suppressor Equation 2-14) and carbonate from the sample; this
means that the sodium hydrogen carbonate eluent is converted to water[93]
[93b]
.
𝑹 − 𝑺𝑶𝟑−𝑯+ + 𝑵𝒂𝑯𝑪𝑶𝟑 → 𝑹 − 𝑺𝑶𝟑
−𝑵𝒂+ + 𝑯𝟐𝑶 + 𝑪𝑶𝟐 Equation 2-14
As mentioned previously, conductivity detectors are by far the most widely used
detector in IC, as they provide a universal detection system responding to all ions. The
detector consists of flow cells containing two electrodes over a range of 1-5 mm,[94]
[94b]
usually made of a noble metal, e.g., platinum. In the conductivity cell are two electrodes
to which an electric potential is applied. The ions passing through the detector flow cell
move in response to the electrical field with anions moving towards the anode and
cations moving to the cathode. The ion movement creates a current and the current is
measured and amplified to produce a signal that is proportional to the concentration of
the ions passing through the cell in the detector. The main disadvantage of this detection
system is that it responds to the eluent composition, which has an impact on the
sensitivity; this leads to the use of suppression in the IC detection system.[95]
Other detection techniques can be used for inorganic separation, such as amperometric
detection, mass spectrometric detection, and direct ultraviolet UV and post-column
reaction spectrophotometric detection.[96]
In general, UV detection is the most
commonly used detection system for chromatographic separation; however, most

27
inorganic ions are not suitable chromophores for UV detectors, as they do not absorb
UV light. This problem can, however, be overcome by employing an indirect UV
detection system, which has been demonstrated to provide good results.[97]
In the
indirect technique, the wavelength of detection is chosen such that the absorbance of the
eluent ion is high, while it is zero for the analyte ions. Therefore, when an analyse ion
passes through the detector flow cell, it displaces a specific amount of eluent co-ions,
and the absorbance of the eluent reduces; this results in negative peaks, following which
ions can then be detected.[98]
2.1.2.1 Spectrophotometric detection
Spectrophotometry is used to measure the amount of light that an analyte sample
absorbs. It operates by passing a beam of light through a sample and measuring the
intensity of light that reaches the detector (Figure 1-1).
Figure 2-4: The operation principle of a spectrophotometer
The spectrophotometric detector is based upon the Beer-Lambert law:

28
𝑨 = 𝜺𝒃𝒄 Equation 2-15
Where A: is Absorbance, b is path length cm, c is molar concentration M and : is
molar absorptivity M-1
cm-1
.[99]
UV and fluorescence are the most common spectrophotometric techniques used in ion
analysis. However, since many solutes absorb UV light across a wavelength range of
180 nm up to about 600 nm, this detection system is also very popular within
chromatographic analysis. In this detection technique, an emission from the mercury
(254 nm), zinc (214 nm) or deuterium lamp with convenient intensity passes through
the flow cell,[40]
and the UV light can be optimised for different analytes.
For compounds that do not absorb UV light, such as most inorganic ions, indirect UV
detection can be used. In the background eluent, a UV-absorbing co-ion is dissolved,
known as the UV-probe.[100]
The non-absorbing analyte ion-band replaces the absorbing
UV-probe. Thus, there will be less absorption at the position of the non-absorbing
analyte and the signal will illustrate a negative peak. The amount of replacement
depends on the charge of the UV-probe and the analyte ions, and on the ion’s mobilities.
The amount of replacement is known as transfer ratio,[101]
and the best transfer ratio is
obtained when the mobility of the UV-probe matches the mobility of the analyte ion;
comparing the mobilities of the analyte ion with the UV-probe will determine the peak
shape. However, indirect fluorescence[102]
has been employed almost as indirect UV,
with less popularity than UV because it requires further reagents to increase the
sensitivity. However, the disadvantages of indirect detection are the addition of more
reagents for derivatisation and the relatively low sensitivity.[103]

29
2.2 Low-cost instrumentation for water analysis
There are several other analytical instruments that can be used for water monitoring,
such as ion-selective electrodes, titration, and electrochemical techniques. These
techniques have a much lower cost than ICP-AES or IC, and they remain popular in
water monitoring, especially for the determination of inorganic ions.
2.2.1 Ion-selective electrode (ISE)
These are based on potentiometry, which measures the difference in electrode
potentials. Determination of pH using a pH electrode is an example of a potentiometric
technique.[104]
The movement of ions from a high concentration to a low concentration
through selective binding with some sites within the membrane, generates a potential
difference.[105]
ISE can be found in different types, namely, glass membranes, solid-state
electrodes, liquid-based electrodes and gas-sensing electrodes.[106]
ISE is a common
analytical technique for the determination of inorganic ions in water,[107]
such as
fluoride,[108]
nitrate[109]
and ammonia.[110]
ISE analysis has some advantages, such as requiring a very small amount of chemical
reagent; usually, there is no waste and it responds quickly, within seconds or a minute.
However, it disadvantages are: electrodes can be fouled by organic solutes,[110]
and
interference from other ions in the same sample solution can influence the analysis.
2.2.2 Further electrochemical techniques
Further electrochemical techniques include coulometry, where nearly 100% electrolysis
occurs with the application of a voltage and the electrochemical cell's current is
measured over time. Voltammetry is similar but occurs in microelectrode with only a
small percentage of electrolysis occurring.[111]

30
Voltammetry is a technique that measures the current of an electrode as a function of
the voltage that is applied to the electrode. Amperometry is similar to voltammetry but
the current is measured at a fixed voltage.[112]
The voltammetry technique requires a potentiostat to control the voltage and measure
the current along with an electrochemical cell. The simplest form of electrochemical
cell is the one that uses two electrodes. The potential of one electrode is sensitive to the
analyte’s concentration (working electrode), whilst the second electrode completes the
electrical circuit and provides a reference potential against which we measure the
working electrode’s potential.[113]
Such electrochemical techniques are inexpensive and can be employed in-situ,
providing direct readings from the water surface in difficult positions.[114]
When
reactions occur at the electrode surface, the electrode is fouled. Electrodes can be fouled
by organic solutes or salts and this may cause interference from other ionic species in
the same sample solution, which would have an impact on the analysis.[115]
2.2.3 Flow injection analysis (FIA)
Flow injection analysis (FIA) can be defined as the injection of a sample into a moving
stream of liquid, to which several reagents can be added. After a certain amount of time,
the sample reacts with the reagents and reaches a detector; this detector is normally a
spectrophotometric cell[116]
(Figure 2-5). FIA is a powerful technique within analytical
chemistry, and it is widely used for a variety of applications in areas such as industries,
medicine, pharmaceutical analysis, marine analysis[117]
and water analysis.[63]

31
Figure 2-5: schematic drawing of FIA
FIA has been applied to the analysis of water, especially for the measurement of
inorganic ions in water such as nitrite, nitrate and phosphate,[116]
using
spectrophotometric detectors.[118]
2.2.3.1 Nitrite and nitrate
The determination of nitrite and nitrate is usually by a colorimetric technique following
the reaction of nitrite with sulphanilamide and N-(1-Naphthyl)ethylenediamine
dihydrochloride (NED);[119]
the diazonium-coupling reaction occurs in the presence of
nitrite to give a strongly red-coloured azo compound, which is detected
spectrophotometrically at 520–540 nm.[120]
Nitrate is also measured
spectrophotometrically, whereby nitrate is converted to nitrite by a reduction agent to
create a nitrite complex that can be measured spectrophotometrically.[47]
This common FIA system for measuring nitrite concentrations is usually large in size,
which limits its deployment capabilities, consumes large amounts of power, and most
importantly, large amounts of reagents (mL per sample).[121]
It is not technically ideal
for an in-situ monitoring system. Therefore, Beaton et al. developed a miniaturised
Reagent 1
Reagent 2
waste
DetectorReaction coilInjection loop
peristaltic pump

32
automated nitrite sensor that was compact and required less power and minimal reagent
usage.[122]
This new system overcame some of the limitations associated with the typical
FIA for nitrite and nitrate.
2.2.3.2 Phosphates
The majority of the phosphorus in surface water is present in the form of phosphates,
and can be divided to four main parts[123]
:
1. Total orthophosphate, also known as total reactive phosphorus (TRP), is an
inorganic form of phosphorus, such as PO4 3–
. This form of phosphorus is
directly absorbed by algae[124]
; therefore, it is important to keep its level as low
as possible to prevent the unnecessary growth of algae. The sample is measured
using a colorimetric method (see below) and is not filtered; therefore, it
measures both:
Dissolved orthophosphate; and
Suspended orthophosphate.
2. Total phosphorus is the sum of all forms of phosphorus, namely:
Orthophosphate
Condensed phosphates (also called polyphosphates) such as P3O10 5–
, which was
commonly used in detergents[125]
Organic phosphates, which are organically bound phosphates found in human and
animal waste or in decaying living species.[126]
As most phosphorus is bound up organically and inorganically,[127]
testing TRP
alone (as mentioned above) is not an indication of the actual amount of phosphorus
that exists in an aquatic system, it only indicates the soluble and available to plants
at that point in time. Thus, in order to measure total phosphorus, the sample must

33
be vigorously digested (treated by strong acid and high heat) to break the strong
chemical bonds. This sample can then be analysed using the colorimetric method
used to measure TRP.
3. Dissolved phosphorus is the measurement of the fraction of the total
phosphorus, which is in a solution in the water. This requires filtration and is
then measured by the same colorimetric method used to measure TRP.
4. Insoluble phosphorus is calculated by deducting the dissolved phosphorus
result from the total phosphorus result.
Spectrophotometric methods, based on colorimetric detection, have also been widely
used to detect phosphate in water.[128]
In this method, the sample is treated with an
acidic molybdate solution to produce a phosphomolybdate complex, which is further
reduced by ascorbic acid to produce an intensely coloured component. This routine
analysis of phosphate is not ideal for various reasons, but the most important reason is
the large amount of reagent consumed on a regular basis as the analysis is being
undertaken.[129]
Quintana et al.
[90] report an amperometric detection of orthophosphate in seawater using
the batch injection analysis (BIA) technique. The phosphomolybdate complex, formed
in the presence of nitric acid, ammonium molybdate and phosphate, was reduced. The
system is simple, limits the consumption of reagents, and has a low detection limit
(0.3 μmol l−1
). However, despite the fact that this system requires fewer reagents than
the typical FIA, it still requires the further addition of reagents and it only measures
phosphates.
FIA instruments are commercially available for the determination of nutrients, and
LIMPIDS project described earlier uses in-situ FIA portable systems for the
determination of phosphate, nitrite and ammonium.[15]
The systems were shown to be

34
reasonably robust, reliable, and easy to calibrate.[130] Furthermore, the data obtained from
the systems were significantly beneficial for the hydrochemical aspect of the project.[15]
However, as previously described, they had high power requirements, needed regular
maintenance, and produced large volumes of waste water (about 100 L every two
weeks). Furthermore, FIA techniques are usually designed to detect one species at a
time, when the measurement of several species is actually required, such as nitrite,
nitrate and phosphate. Moreover, according to the Beer-Lambert law, the
spectrophotometric techniques depend on the path length (b), which might be affected
in a miniaturised system, as the manipulation of the size is significant in miniaturised
devices[131]
such as CE.
2.2.4 Lab-on-a-chip (LOC)
Lab-on-a-chip (LOC), also known as micro total analysis (µTAS), is a form of
technology that can integrate miniaturised laboratory functions such as separation,
extraction and detection, for the analysis of chemical compound mixtures, on one chip,
by using very small fluid volumes between a range of 10-9
and 10-18
L[132]
(microfluidic). LOC technology has very good advantages over the normal analytical
laboratory-based instruments. It has the ability to deal with very small amounts of
samples and reagents, with a high resolution of separations, good sensitivity and
selectivity, low cost, and rapid analysis.[133]
The concept of miniaturising measurements started in the 1960s with the development
of microelectronics, but the first reported integrated LOC device was in 1979, and it
was the total “Gas Chromatographic Air Analyser Fabricated on a Silicon Wafer”
developed by Terry et al.[134]
Publications on LOC and its related subjects have
increased significantly in the 1980s and 1990s, to around 3,500.[135] The trend going
forward is towards more complex, integrated systems that have the capability for more

35
comprehensive analyses, using advanced electronics and microfabrication, mostly for
biochemical analysis such as DNA.
However, the environmental analysis of inorganic ions using LOC was introduced by
Greenway et al. in 1999,[136]
and in 2001, work on inorganic ions, nitrate in particular,
was carried out by Petsul et al.[137]
In 2005, Marle et al. demonstrated a total system for
environmental analysis[16]
and in 2008, Cleary et al. developed an environmental in-situ
LOC system for the analysis of phosphate.[138]
In 2012, Beaton et al. reported an “LOC
Measurement of Nitrate and Nitrite for In-situ Analysis of Natural Waters.” This system
(Figure 2-6) was based on a miniaturised FIA system: the chip incorporates a fluidic
manifold that allows the selection of one of four standards (nitrate or nitrite), the
sample, and a blank. The fifteen valves are used to control the fluids, which are
mounted directly to the chip. A customised syringe pump is used in the system; it has
been designed especially for this work. The pump is used to drive fluid through three
titanium syringes for sample/standard, buffer solution, and Griess reagent (the chemical
reaction used for nitrite analysis). The chip contains three absorption cells: a reference
cell and two measurement cells. The system employs a spectrophotometric technique
for the determination of nitrate and nitrite. This integrated system requires several
mixing steps, which is very challenging.[129]

36
Figure 2-6: Beaton et al. microfluidic system for in-situ determination of nitrate [139]
Despite the significant progress of LOC technologies, especially the work of Cleary et
al. and Beaton et al., the systems measure one species per run, measuring nitrite or
nitrate at separate runs by passing in the system. For measuring nitrite, fluid is directed
through a reference cell, and is then mixed with a Griess reagent in the mixing channel.
Absorption is then determined in two subsequent measurement cells. For nitrate
measurement, fluid is added to an imidazole buffer, passed through a serpentine mixer,
then through an off-chip cadmium tube prior to passing through the reference cell and
mixing with the Griess reagent. Furthermore, LOC systems still lack the capability to
measure several inorganic ions in a single run. Although these systems work
automatically, they are very complex, with lots of tubing and pumping required,
meaning that it is still not an ideal system.

37
A miniaturised system that has the ability to measure inorganic ions in one run, is
highly desirable. IC systems are the golden standard for the measurement of several
ions in one run, and so a miniaturised version of such a system is desirable. The aim of
this work is to develop a novel analytical LOC device that is capable of measuring and
detecting several inorganic ions in water samples in-situ, at high-frequency
measurements, by utilising microfluidic advantages that include sample introduction,
ion injection, ion separation and detection, all in a single run on an LOC device.
2.3 Miniaturisation of the separation of ions
Miniaturised separation has been demonstrated in different forms,[140]
using monolithic
columns[141]
and capillary electrophoresis.[142]
The application has mainly been used for
large biochemical molecules but some results have been obtained for small species such
as ions.[143]
The achievement of high efficiency separations with traditional ion chromatography
requires columns packed with micron-sized particles, which causes high back-pressure
when pumping the eluent through the column. The invention of monoliths has led to a
completely new type of separation media. Monoliths are continuous and, therefore, do
not contain interparticle voids, which are typical of packed columns. They are bimodal
and consist of a network of large, interconnected flow-through pores that reduce back-
pressure, but also small pores that contribute to a high surface area, which offer the
desired interactive separation modes. Other major advantages of monoliths include the
simplicity of preparation and their high permeability.[144]

38
2.3.1 Monolith column and IC
Recently, there has been an increased interest in monolithic stationary-phase media for
high-performance separations of organic and inorganic ions. Initially, work
concentrated on the separation of organic compounds, and subsequently focused on the
separation of inorganic ions, and an efficiency was demonstrated that equals or even
surpasses the classic packed column, even with short monolithic columns.[145]
Monolithic separation media can be divided into two categories: silica (inorganic)
monoliths and polymer (organic) monoliths. Both types have been used successfully for
ion-exchange chromatography. However, the most widely used monolithic stationary-
phase is silica, as it provides favourable mechanical stability and flow characteristics
(low pressure), and a range of chemical modification are available that allow for ion
separation. Polymer-based monoliths have shown better separation of larger molecules,
such as proteins and nucleic acids, whereas silica monolithic columns enable fast
separations of smaller molecules.[92]
Polymeric stationary phases do have an advantage
over silica-based supports for anion-exchange chromatography, since they exhibit
superior stability at high pH, as they are compatible with analysis using hydroxide
gradients. However, a silica-based monolith has more mechanical stability than
polymers, especially for the separation of inorganic ions.[146]
Monolithic columns can be used as a part of an LOC device for the separation of
inorganic ions, as they can be adjusted to be within cm range[147]
and have low back-
pressure,[148]
meaning that they do not require a high pressure pump. They can be
modified with ion-exchange stationary phases to provide good selectivity, efficiency,
and limit of detection LOD,[77]
which is a great contribution to the miniaturisation of
IC.[149]

39
The disadvantage of using the monolithic column in the detection of inorganic ions for
river water monitoring is that it can easily be affected by contamination, because it has
lots of very small pores that are easily blocked by any matrices. This could increase the
back-pressure and interfere with the measurement.
2.3.1.1 Preparation of silica monolithic columns
As previously mentioned, silica monolith provide the best basis for the separation of
small molecules, despite the fact that they cannot cope with a high pH eluent; otherwise,
they demonstrate good chromatography performance, low back-pressure, mechanical
strength, and simplicity of preparation.[150]
2.3.1.1.1 Theoretical consideration in preparing a monolith
Silica monoliths with macropores and mesopores were first introduced by Nakanishi et
al. in 1992.[151]
Since then, they have gained much attention in the field of separation.
The bimodal-pore silica monolith is normally fabricated using a two-step method
involving hydrolysis and the condensation of an alkoxysilane (such as tetraethoxysilane
TEOS)[152]
in the presence of polyethylene glycol, to create a silica skeleton with
macropores.

40
2.3.1.1.2 Gelation
Figure 2-7: The reaction mechanism of hydrolysis and condensation steps for creating a silica
monolith
Figure 2-7 shows the mechanism of hydrolysis and condensation reactions. In the
hydrolysis reaction, the alkoxide groups (OR) in alkoxysilane (TEOS) are replaced with
hydroxyl groups (OH). Then, condensation reactions take place where the silanol
groups produce siloxane bonds (Si–O–Si) and alcohol (ROH) or water. This step can be
called the gelation step. During gelation, the number of siloxane bonds increases;
therefore, the number of silanol (Si-OH) and alkoxide groups decreases,[153]
and the
condensation reaction carries on to form a three-dimensional network resulting from
polycondensation behaviour[154]
[155]
(Equation 2-16).
TEOS + H2O → Si(OH)(OR)3 + ROH Equation 2-16
Si-OH + Si-OH → Si-O-Si + H2O Equation 2-17
Si-OH + Si-OR → Si-O-Si + ROH Equation 2-18
The sol–gel morphology can be managed by controlling the hydrolysis and
condensation reaction in the gelation step. This can be achieved by changing the amount
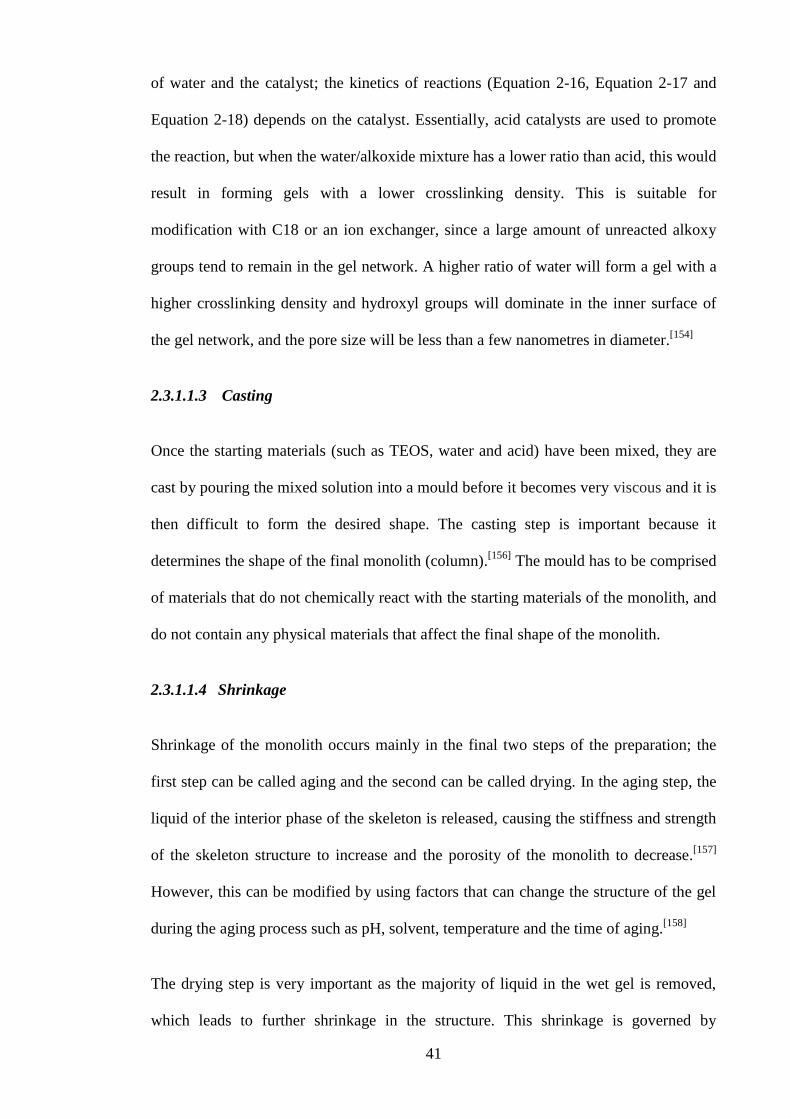
41
of water and the catalyst; the kinetics of reactions (Equation 2-16, Equation 2-17 and
Equation 2-18) depends on the catalyst. Essentially, acid catalysts are used to promote
the reaction, but when the water/alkoxide mixture has a lower ratio than acid, this would
result in forming gels with a lower crosslinking density. This is suitable for
modification with C18 or an ion exchanger, since a large amount of unreacted alkoxy
groups tend to remain in the gel network. A higher ratio of water will form a gel with a
higher crosslinking density and hydroxyl groups will dominate in the inner surface of
the gel network, and the pore size will be less than a few nanometres in diameter.[154]
2.3.1.1.3 Casting
Once the starting materials (such as TEOS, water and acid) have been mixed, they are
cast by pouring the mixed solution into a mould before it becomes very viscous and it is
then difficult to form the desired shape. The casting step is important because it
determines the shape of the final monolith (column).[156]
The mould has to be comprised
of materials that do not chemically react with the starting materials of the monolith, and
do not contain any physical materials that affect the final shape of the monolith.
2.3.1.1.4 Shrinkage
Shrinkage of the monolith occurs mainly in the final two steps of the preparation; the
first step can be called aging and the second can be called drying. In the aging step, the
liquid of the interior phase of the skeleton is released, causing the stiffness and strength
of the skeleton structure to increase and the porosity of the monolith to decrease.[157]
However, this can be modified by using factors that can change the structure of the gel
during the aging process such as pH, solvent, temperature and the time of aging.[158]
The drying step is very important as the majority of liquid in the wet gel is removed,
which leads to further shrinkage in the structure. This shrinkage is governed by

42
capillary pressure, which might damage the structure and eventually lead to the cracking
of the final shape of the monolith.
2.3.1.1.5 Calcination
Finally, the calcination step follows the drying step of the silica monolith, in which a
very high temperature is applied to the monolith to decompose any organic residues
without damaging the monolithic structure.[157]
2.3.2 Isotachophoresis (ITP)
Isotachophoresis (ITP) is a powerful technique in the area of analytical separations and
detection. ITP provides a simultaneous separation and concentration, and it can be
miniaturised[102]
and affectively applied to lab-on-a-chip (LOC) systems,[103]
as it is
highly sensitive and has decent separation resolution, even with small channel lengths
and reasonable applied voltages.[159]
The principle of ITP is that it has two different electrolytes: a leading electrolyte and a
terminating electrolyte. A sample mixture is injected at the zone between leading and
terminating electrolyte solutions. The leading electrolyte is normally a buffer containing
leading ions (L) with high electrophoretic mobility, such as chloride and potassium.[99]
The terminating electrolyte contains an ion with the same charge, but with a slower
mobility than that of the slowest moving sample ion. Under an applied voltage, co-ionic
species focus and simultaneously separate into zones, based on their electrophoretic
mobilities. Common detection can be applied within ITP such as conductivity,[100]
UV,
and fluorescence detection.[101]
Despite the ability of ITP and the usefulness of separating inorganic ions, the use of two
different electrolyte solutions in ITP is limited with regards to our work, because of the

43
possible interference between the electrolyte solutions and ions of interest. Also,
minimising the consumption of reagents is highly preferable.
2.3.3 Capillary electrophoresis (CE)
An alternative to chromatographic separation is electrokinetic separation.
Electrophoresis is an analytical technique whereby ions in solution migrate under the
influence of an applied voltage potential, as shown in Figure 2-8. The mobility of an ion
can be described as the velocity in unit field strength; ions with different charge-to-size
ratios have different electrophoretic mobilities and migrate at different velocities in
channels under applied voltage.[160]
Electrophoretic mobility μep is directly proportional
to the charge of the ion and inversely proportional to the friction coefficient. This can be
described as Equation 2-19:
uep= q
f E
Equation 2-19
Where q (coulombs) is positioned in an electric field, E (V/m) is the force on the ion qE
(Newton). In the solution, the velocity of an ion is uep, retarding frictional force is fuep,
and f is the frictional coefficient. The term (ep) refers to (electrophoresis).
Figure 2-8: The movement of an ion through an electric field

44
The electrokinetic movement of ions can be affected by electroosmotic flow (EOF),
which is the bulk movement of liquid induced by an applied electric field in a capillary
tube or microchannel with a charge surface, such as one constructed from silica. An
electric double layer occurs at the wall of the channel or the capillary, when the voltage
is applied (Figure 2-9).
Figure 2-9: Electroosmotic flow affect in ion movement
In a glass channel, the surface is covered with silanol groups Si-O-, and any cations in a
solution in the channel migrate to the wall and generate a double layer. If an electric
voltage is applied across the channel, the cations of the double layer will migrate
towards the cathode, pulling the associated liquid with them, including the anions; this
leads to a flow of liquid through the channel.[114]
The proportional constant between electroosmotic velocity (Veo) and the applied voltage
is known as electroosmotic mobility (µeo); this is proportional to the surface charge
density on the surface of the wall and is expressed in Equation 2-20:
𝑽𝒆𝒐 = 𝝁𝒆𝒐 . 𝑬 ( 𝐦 𝐬−𝟏) Equation 2-20
Negatively Charged Surface
Negatively Charged Surface
An
od
e
Cath
od
e
-
- -- -
- -
-
-
-
---
-B u l k S o l u t i o n
-Po
sitively C
harge
d Laye
r

45
The electroosmotic mobility (µeo) is described as the speed of the neutral species
(µneutral) divided by the electric field, as shown in Equation 2-21:
𝝁𝒆𝒐 = 𝝁𝒏𝒆𝒖𝒕𝒓𝒂𝒍
𝑬=
𝑳𝒅/𝒕𝒏𝒆𝒖𝒕𝒓𝒂𝒍
𝑽/𝑳𝒕 (𝐦𝟐 𝐯−𝟏𝐬−𝟏)
Equation 2-21
Where E is the electric field, µneutral is the speed of the neutral species, Ld is the distance
to the detector, and tneutral is the migration time to the detector, V is the applied voltage
and Lt is the total length (of the channel or the column) from end to end.[114]
Another factor that might occur when applying a high voltage in this situation is Joule
heating. This is because of the high surface-to-volume ratio in the microchannel and
high thermal conductivity values of silicon and glass.[161]
The problem of Joule heating
can be solved through the use of polymeric materials instead of glass.
According to Ohm’s law, Joule heating can be calculated using the following equation:
𝒒 = 𝑰𝟐
𝝀 (𝐰 𝐦−𝟑)
Equation 2-22
Where q is the Joule heating generated, I is the current and λ is the electrical
conductivity of the electrolyte solution.[162]
The separations obtained through the capillary electrophoresis technique are highly
efficient and rapid, and can be applied to both charged and neutral species. Capillary
electrophoresis can be applied to a wide range of applications, including
pharmaceuticals, food and beverages, and environmental and clinical analyses.[163]
It has
many advantages for miniaturisation because it is a simple technique where the
separation is achieved by the relatively straightforward application of voltages. It does
not require pumps, consumes a low amount of reagents, and a variety of detectors can
be used in CE.[164]

46
Capillary electrophoresis and ion chromatography are very powerful techniques for
environmental analysis and microfluidics.[165]
However, in capillary electrophoresis, the
number of theoretical plates is at least 10 times better than for ion chromatography
(IC)[166]
because there is much less band broadening in CE than in IC. Separation by CE
is fast, and it is relatively easy to find experimental conditions for an adequate
separation of sample ions. One of the greatest advantages of CE is its tolerance of
variations in the sample matrix. However, CE also has some disadvantages that include
an often poor reproducibility, especially for small molecules and ions that move very
quickly in the electrical field.[166]
When comparing IC to CE, a point should be
addressed, which is that IC is a better-understood technique than CE, while CE is an
area of research still being investigated. In the past decade, there have been many new
developments in ion analysis through capillary electrophoresis.
In terms of microfluidics, capillary electrophoresis (CE) has been performed in the
capillary format with dimension of tens to hundreds micrometres,[132]
and microchip-
based capillary electrophoresis (MCE) was one of the original formats of microfluidics.
This was introduced in 1992 by Harrison et al.[167]
and consisted of a sample injection
system and a separation channel integrated on a planar glass chip. MCE devices have
certain advantages over typical CE systems, especially in terms of sample introduction,
but because the channel dimensions are comparable, the resolution is also comparable.
As device dimensions are reduced, system throughputs increase, but automation
schemes will become more complex.[168]
Capillary electrophoresis (CE) separation is achieved by the relatively direct application
of voltages. Pressure pumps and eluents are not needed, which results in a very low
consumption of reagents. An important further simplification for CE of small ions was
the demonstration of contactless conductivity detection (C4D) based on a pair of short

47
tubular electrodes, as described in detail in section 3.4.1. The method is entirely
electronic and relies less on construction, and has a low level of power consumption
compared to other detection methods.[164]
Prototype examples of miniaturised portable
CE instruments combined with C4D are being reported,[19]
and CE has the additional
potential for extended in-situ measurement applications, such as environmental
monitoring.[164]
The use of capillary electrophoresis (CE) for water control is challenging, due to the
complex matrix embedding trace concentrations of the analyse. Selective ion isolation
from a water sample can be achieved by electrodialysis (ED) techniques. ED can be
combined with CE for the preconcentration of inorganic ions from a water sample; this
combination can greatly enhance the analytical performance of river water in order to
eliminate unwanted matrices in the analyse sample.
In ion separation, the detector must measure ions in the presence of background eluent
ions. The detector should respond only to the ion of interest, excluding the ions in the
eluent. Different techniques have been employed to overcome this matter but the main
two categories of these techniques are spectrophotometric techniques and conductivity
detection systems.
2.3.4 Electrodialysis
Electrodialysis (ED) is a well-known process for ion extraction and it has been utilised
for over 50 years in the industrial field, for the production of potable water from
brackish water sources. Nowadays, electrodialysis is applied in many industrial
applications, such as food and drug industries. In addition, it is applied widely in waste
water treatment and the production of high quality industrial water and water
desalination.[169]

48
In ED, ions are migrated through a semi-permeable membrane, under the influence of
an applied electric potential (as shown in Figure 2-10).
Figure 2-10: Electrodialysis process
2.3.4.1 Electrodialysis membrane
There are two different types of membranes that can be used in electrodialysis: a semi-
permeable polymeric membrane or an ion-exchange membrane. Cellulose acetate was
one of the first polymer membranes used for separation in aqueous solutions.[127]
As it is
a hydrophilic material, cellulose acetate provides good fouling resistance.[170]
[171]
It also
does not require any chemical additives and can perform for a relatively long time.[172]
The advantages of a cellulose acetate membrane make it very popular in water filtration
and ED processes.
Ion-exchange membranes normally consist of ion-exchange resins. They might also
contain other polymers to enhance mechanical strength and flexibility. The resin
component of a membrane could be a cation or anion-exchange membrane.

49
2.4 Chapter Conclusion
It is clear from reading the literature that there is a demand for portable in-situ
measuring systems for measuring ions in environmental water samples. Although
commercial flow injection analysis systems are available, they are not easy to install and
maintain, having high power requirements and using large volumes of reagents.
Miniaturising the measurements has proved to be promising, and quite successful
microfluidic automated systems have been developed based on spectrophotometric and
voltammetric measurements. These systems tend to only measure one species at a time;
however, what is really required is a portable system that can simultaneously measure
several anions and cations. The aim of this project was, therefore, to develop a portable
system for measuring a range of ions in a solution. Several approaches were taken to
identify the best solution. One concern when continually operating a system is the effect
of the sample matrix on the system, so it was decided that a good approach would be to
extract the ions from the sample prior to separation.
The detection system selected for the application was the C4D system, which is a
universal detector and does not have the electrodes in contact with the solutions, thus
providing a robust detection solution, and it can be used for each of the followings:
1. To investigate methods to extract ions from water samples in microfluidic devices.
2. To investigate monolith columns for the separation of ions in microfluidic devices.
3. To investigate the electrophoresis separation of ions to include in a microfluidic
device.
4. To investigate the simplest solution to designing a microfluidic device with ion
extraction and separation.

50
3 General experimental chapter
3.1 Reagents
Table 3-1: Table of reagents
Chemical Supplier
4-Morpholineethanesulfonic acid (MES)
Sigma-Aldrich Company Ltd, UK
L-Histidine
Magnesium sulphate 99.5%
Calcium phosphate dibasic
Magnesium sulphate
Poly (ethylene oxide) (PEO) with average relative
molar masses of 100 kDa
Tetraethoxysilane (TEOS)
Ammonium hydroxide (5 M)
Nitric acid aqueous solutions (1 M)
Chloro(dimethyl)octadecylsilane (ODS) 95%
2,6-lutidine 99%
Multi-element ion chromatography standard
solutions I, II and III
Didodecyldimethylammonium bromide (DDAB)
Trimethylchlorosilane
Sodium phosphate monobasic 99% for HPLC
Chloride IC standard
Nitrite IC standard
Humic acid
Multi Anion Standard 2 & 3 for IC
Sodium nitrite analytical grade reagent
Fisher Scientific, UK
Sodium nitrate 99%
Potassium phosphate 97%
Toluene
Sodium chloride
Sodium sulphate anhydrous
HPLC grade acetonitrile (ACN)
Potassium silicate VWR international, UK
Formamide 99% Avocado Research Chemicals Ltd, UK

51
1000 ppm Ca, Mg, K and Na elemental
solutions Romil Ltd, Cambridge UK
Trace metal nitric acid Romil SpA grade, UK
18 MΩ.cm conductivity water Elga UHQ PS or an Elga Purelab
Flex2 system
3.2 Instruments
3.2.1 Ion chromatography
IC is considered to provide a gold standard for the separation and identification of
inorganic anions. This can be used to monitor the extraction of anions after their
extraction from the sample introduction system.
The samples were of variable amounts, usually 100 µl to 2ml, of solutions from the
sample introduction system. It is important to have approximately 500 µl of sample as a
minimum volume for analysis by a Dionex system, as it is practically difficult to deal
with amounts less than 500 µl. The samples were directly injected without further
modification to the loop with a 1 ml plastic syringe. Sometimes, certain samples require
dilution with water prior to injection because some of the anion samples contain a very
high amount of anions that would remain in the sample loop or column after the run,
which would affect the following runs; therefore, to maintain the system, some samples
required dilution.
To quantitatively calculate the concentration of anion in each sample, a set of standard
concentrations of each anion were plotted against their peak areas using Microsoft
Excel, and the graph was then used to calculate the concentration of each anion in the
sample in millimoles (mM) using its peak area, if the sample had been diluted; the
dilution factor is considered in the calculation. For the calculation of the percentage of

52
migration, the concentration of the initial anion sample was calculated before and after
each experiment. When possible, the target results were also calculated before and after
experiments.
The system used was the Dionex ICS-2000 Ion Chromatography System (ICS-2000),
using suppressed conductivity detection. The conditions were: approximate pressure
1830 psi; flow rate 0.39 and 0.38 mLmin-1
; column heater 30 ͦ C; cell heater 35 ͦ C; and
an injector loop of 20 µl. The manufacturer’s standard anion method was followed; the
eluent was comprised of 15 mM sodium hydroxide, with a running time of 10 minutes
for the chromatogram. The system was purchased from Dionex (UK) Ltd in July 2007.
Figure 3-1: A chromatogram of anion standards
Figure 3-1 shows the chromatogram of anion standards under the previously mentioned
conditions. All standards used as there sodium salts in water, the concentrations were 1
g/L (Sigma Aldrich Ltd UK).
Sig
na
l (µ
s)
T i m e ( m i n u t e s )
PO4-
SO4-
NO2-
Br-
Cl-
F-
PO43- SO42-
NO2-
Br-
F-
Cl-

53
3.2.2 Inductively coupled plasma optical emission spectrometry
(ICP-OES)
The samples were variable amounts of water, usually 0.5 to 2 ml, from the sample
introduction system. It is important to have approximately 5 ml of sample as a minimum
volume for analysis through ICP-OES. To quantitatively prepare a 5 ml sample from
these variable amounts, the sample was transferred into a tared 15 ml sample tube with a
screw cap (Sarstedt Ltd, Leicester, UK), the sample weight was recorded, and it was
then diluted to the 5 ml mark and weighed again. Samples were then vortexed prior to
analysis, to ensure complete mixing. The ratio of the final weight to the sample weight
was then a dilution factor, which was applied to the measurements of the elements of
interest in the 5 ml sample in order to provide the concentrations of the elements of
interest in the original sample volume.
Where possible, elements were measured at 3 or 4 wavelengths to check whether any
spectral interference was affecting the measurements. Sodium and potassium only have
a single wavelength available. The response was calibrated for Ca, Mg, K and Na at 0,
10, and 20 ppm using mixed standards diluted from certified single element 1000ppm
solutions into 2% nitric acid, prepared from trace metal nitric acid and 18 MΩ
conductivity water.
The concentrations of the elements were measured on the Perkin Elmer Optima
5300DV emission ICP instrument. K and Na were measured in the axial view, and Ca
and Mg in the radial view, which is less sensitive. This analysis technique is very
sensitive to Ca and Mg; therefore, the conditions were altered in this way to enable
measurements to take place in one run. Measurements were made in triplicate to enable
the mean, standard deviation and %RSD to be calculated for every wavelength, and for

54
every solution. Blank 2% HNO3 solution was analysed several times, and the mean of
the standard deviations for these blanks were calculated when the results dataset was
exported into Microsoft Excel. The value of 3 times the mean SD of the blanks then
provides the detection limit for all of the wavelengths. Excel was used to calculate the
concentrations of the elements of interest in the original sample amount, using the
dilution factors, and the detection limits (LOD) were used to evaluate whether the
measurements were significant or too close to the LOD to be present in the sample.
The Optima ICP-OES sample introduction has a high solids PEEK nebuliser with liquid
streams and gas streams that remain separate until the ends of the capillaries, and a
vortexing spray chamber of borosilicate glass. Typical gas flows were plasma gas
15L/min, auxiliary gas 0.2L/min, and nebuliser gas 0.80L/min. RF power was 1300W,
and liquid flow was 1.50 mLmin-1
. The Perkin Elmer Optima 5300DV instrument was
using Winlab 32 software; this was updated in summer 2014 to the Windows 7 version
5.5.0.0714.
3.2.3 Infrared (IR) spectrophotometry
Infrared (IR) spectrophotometry is a very reliable and well-known fingerprinting
technique that allows for a wide range of substances to be characterised and analysed.
IR spectrophotometry has the ability to obtain spectra from many types of solids, liquids
and gases. In many cases, however, some form of sample preparation is required in
order to obtain a good quality spectrum.
Attenuated Total Reflectance (ATR) is an IR technique that allows for the qualitative
and/or quantitative analysis of samples with sample preparation, which greatly speeds
up sample analysis. The benefits of ATR sampling are its very thin sampling pathlength
and the deep penetration of the IR beam into the sample of interest.

55
ATR was used to analyse the differences between different conditions of anion-
exchange membrane, and the Nicolet™ iS5 FT-IR Spectrometer and MIRacle™ Single
Reflection ATR were both purchased from Fisher Scientific UK.
3.2.4 Capillary electrophoresis
A Beckman Coulter P/ACE MDQ capillary electrophoresis (AB SCIEX Ltd, UK), was
used to examine the performance of the ED system. The CE instrument separates
sample components within a fused-silica capillary; the sample is injected into the
capillary using vacuum, pressure, or voltage. The detection used was UV: when the
separated components pass a window in the capillary, a single wavelength UV detector
measures absorbance and transmits a signal to the computer, which then displays it as
an electropherogram.
3.3 Chip manufacture
Microfluidic devices are normally made of silicon, glass or a polymeric material such as
polydimethylsiloxane (PDMS), cyclic olefin copolymer (COC), or polymethyl
methacrylate (PMMA).[173]
As these are chemically compatible for different
applications, they are disposable and readily manufactured at a relatively a low cost.[174]
The microfluidic chips used in this work were fabricated at the University of Hull using
photolithography and wet-etching processes. The machine used is a Datron M7; this is
an accurate machine for micro-drilling, engraving and the 3D machining of face plates,
housing, fixtures and dyes in any material. It can operate at speeds of 5,000-50,000
revolutions per minute (RPM). The x, y and z movements can move at a maximum
speed of 16 m/min. The machine is pre-installed with an automated tool-length
measure, which has a resolution of 1 mm. A coolant system that uses ethanol is installed

56
in the machine and sprays the coolant, as well as air, around the spindle of the machine
during use.
Figure 3-2: Schematic drawing of the fabrication process of the microchip[175]
Glass microdevices were fabricated by a wet-etching technique similar to McCreedy’s
method.[175]
[176]
Briefly, the design was drawn using autoCAD software and transferred
through a commercial process (J. D. Phototools, Oldham, U.K.) to a film photomask.
1mm thick Crown white glass (B270) panels coated with chrome and photoresist (Telic
Co., Valencia, California, USA) were contacted with the appropriate design on the
photomask and exposed to UV radiation. The panels were then treated consecutively
with Microposit©
Developer (50% dilution in water) and Chrome Etch 18 Solution
(Rohm-Haas materials supplied by Chestech, Ltd). The panels, now with an exposed
glass channel pattern, were etched in 1% hydrofluoric acid / 5% ammonium fluoride
solution at 65C to the required channel depth (the etch rate is approximately 5 µm min-

57
1). The remaining photoresist and chrome layers were removed using Microposit
©
Remover 1165 and Chrome Etch 18 Solution4
(Rohm-Haas materials supplied by
Chestech, Ltd), respectively.
Access holes were drilled, using diamond drill bits, into either the etched base plate or a
B270 glass cover plate. After a thorough cleaning process employing solvents and
aqueous detergent solution, the etched plates were thermally bonded (585C for 2 hrs)
to cover plates.
For the polymer chip, the same procedures were followed, but with no etching with the
1% hydrofluoric acid / 5% ammonium fluoride solution.
3.4 HPLC for the assessment of the monolithic column
Figure 3-3: Experimental set up of the separation experiment on the monolith
Figure 3-3 shows the experimental set up of the separation of inorganic anion,
performed on a silica monolith. An in-house C4D detector was developed. The eluents
was degassed before the experiment using the eluent solution in a sonicator bath
(Ultrawave Sonicator U 300HD, Cardiff, UK) for approximately 30 minutes. The set-up
began with a syringe pump (Figure 3-4: Fusion 100 Classic Syringe Pump (chemyx US)
to ensure the constant pressure of the eluent through the separation monolith that was
0.2 mLmin-1
; the eluent was placed in a 10 ml plastic syringe. PTFE tubing (1.6 mm OD
pump Injector Separation column Detection
cell

58
x 0.5mm ID purchased from Kinesis Ltd UK) was used to carry the eluent from the
syringe to the loop injector, the separation monolith, the detection system, and
eventually, to the waste container. The loop injector was used for introducing the
analyte sample to the eluent (Figure 3-5), with the injector made of polymeric materials
to avoid any interference with the measured ions from the normally metallic injector.
The eluent carried the analyte from the injector to the monolith (6 cm×4 mm), where
separation of the injected components occurred.
Figure 3-4: Fusion 100 Classic Syringe Pump (chemyx US)

59
Figure 3-5: A picture of the top and side of the loop injector used in the HPLC set-up for the
separation on the monolith
Figure 3-5 shows the injector used in the HPLC system set-up for the separation of
inorganic ions on a silica-based column. The injection is done through a designed 6-port
rotary injection valve. The analyte sample is introduced at atmospheric pressure by a
syringe into a constant volume loop; the loop volume is 25 µl. The injector has two
fixed positions: load and inject. In the load position, the loop is not in the path of the
eluent. When rotating to the inject position, the sample in the loop is moved by the
eluent stream into the column. To ensure there are no air bubbles in the loop, it was
important to allow some of the sample to flow into waste from the loop before rotating
to the inject position.
3.4.1 Capacitively coupled contactless conductivity detection (C4D)
Conductivity detection can be accomplished in either the contact or contactless modes.
In contact conductivity detection, the electrodes are in direct electrical contact with the

60
solution, which leads to the possibility of corrosion or fouling of the electrode, and
possibility of the electrode material interfering with the system chemistry. As a result,
C4D has gained considerable attention
[177]. In 1998, Zemann et al.
[178] and Fracassi da
Silva and do Lago [179]
reported what is considered to be the first approach of modern
C4D. This was based on two tubular electrodes for capacitive coupling that were both
positioned on the outside of a capillary. Since then, work has continued on developing
C4D.
Figure 3-6: Comparison between a) contact and b) contactless conductivity detection systems[180]
R = resistance, i = current.
Figure 3-6 shows a comparison between direct and C4D detection. In direct contact
conductivity detection, a small amount of alternating current (AC) or direct voltage
(DC) is applied to two inert electrodes, as shown in
Figure 3-6 (a). The electrodes are in direct contact with the solution.[180]
In C4D
systems, the set-up is similar except the two electrodes are placed outside the sample
reservoir and only AC signal can be used (
Figure 3-6 [b]).

61
In both cases, the second electrode is connected to a transimpedance amplifier
comprised of an operational amplifier and feedback resistor R. The transmittance
amplifier implements an ammeter function, allowing cell current to be measured. The
amplifier output voltage is given by the following equation:
𝑽𝒐𝒖𝒕 = 𝑹𝒊 Equation 3-1
Where R is resistance and i is the current.[181]
Figure 3-7 is a redrawing of Figure 3-6 (a) that shows the system as an electrical
equivalent circuit. From the figure, it can be seen that the voltage can be driven across
the cell by either an AC (Alternating Current) or DC (Direct Current) source. The
solution behaves as a resistor whose resistance depends on the solution’s conductivity.
Figure 3-8 is a redrawing of Figure 3-6 (b), to show the system as an electrical
equivalent circuit. A high-frequency signal is applied in the first electrode; this signal
passes through the sample solution inside the reservoir and then goes to the second
electrode, where the signal is read by an electronic circuit. The current flowing through
the detection cell is proportional to the conductivity of the solution inside the sample
reservoir.[22]
In C4D systems, there is no direct current (DC) because the electrodes are
insulated from the solution and they are capacitively coupled to the electrolyte solution.
The electrodes, the insulator (such as the capillary wall in CE) and the solution behave
like three parallel plate capacitors[149]
and a resistor connected in a series.

62
Figure 3-7: Redrawing of Figure 3-6 (a) to demonstrate an electrode equivalent circuit
Figure 3-8: Redrawing of Figure 3-6 (b) to demonstrate an electrode equivalent circuit
Figure 3-9 is a redrawing of the circuit in Figure 3-8, demonstrating the key voltage and
current in the circuit.

63
Figure 3-9: Redrawing of Figure 3-8 to demonstrate key voltages
Using Kirchhoff's voltage law[66]
:
𝑽𝒔𝒐𝒖𝒓𝒄𝒆 = 𝑽𝒄𝒆𝒍𝒍 + 𝑽𝒂𝒎𝒎𝒆𝒕𝒆𝒓 Equation 3-2
Ideally, the voltage across the cell should be equal to the known (and constant) source
voltage. This requires that Vammeter = 0. The amplifier is a feedback control circuit that
attempts to achieve this condition. If a high-gain operational amplifier with a very low
input current is used, conditions close to the ideal can be achieved and the amplifier
input is referred to as virtual earth or virtual ground (it behaves as if it was connected to
the ground).
When these conditions apply, we have 𝑽𝒔𝒐𝒖𝒓𝒄𝒆 = 𝑽𝒄𝒆𝒍𝒍 , then, using Ohm’s law:
𝒊 =𝑽𝒔𝒐𝒖𝒓𝒄𝒆
𝒁𝒄𝒆𝒍𝒍
Equation 3-3
Where Zcell is the cell impedance and i and Vsource are RMS (root mean square) values of
the AC current and voltage.[68]
The output of the amplifier, again in RMS, will be:

64
𝑽𝒐𝒖𝒕 = 𝑹 𝑽𝒔𝒐𝒖𝒓𝒄𝒆
𝒁𝒄𝒆𝒍𝒍
Equation 3-4
Given that Vsource and R are constant, changes in Vout will only depend on changes in
Zcell.
Zcell comprises both coupling capacitance and solution resistance. If a suitable frequency
is used, Zcell will be dominated by the solution resistance and Vout will be sensitive to
changes in conductivity.
Figure 3-10: C4D detection set-up
Figure 3-10 shows a C4D detector developed in the Department of Engineering at the
University of Hull. The initial aim was to design a detector with an electronic board and
baseline suppression.

65
3.5 Ion extraction
3.5.1 Power supply and conductivity
The D100 power supply (Farnell UK Limited) was used to apply voltage to the
reservoirs in ion extraction experiments, using Pt electrodes. Furthermore, the
conductivity in the system was measured using a voltmeter (Fluke 8010A digital
multimeter, Fluke, the Netherlands).

66
3.5.2 Ion extraction through a potassium silicate monolith in a glass
capillary
Figure 3-11: The set-up of the ion extraction through a potassium silicate monolith using a glass
capillary
Figure 3-11 shows the set-up of the extraction system. There are two reservoirs:
reservoir A contains a buffer and anion mixture, and reservoir B contains a buffer. Both
reservoirs were linked to each other by a glass capillary (0.6 ± 0.05 mm ID) (Brand
GmbH, Germany). The capillary contains a 2 cm thermally-activated silica-based monolith;
the monolith was attached to reservoir A.
- +
---
Buffer &
Anions buffer
2 cm Potassium silicate monolith
6 cm Glass Capillary
Reservoir A Reservoir B
a
Reservoir BReservoir A
Wires to measure the current in the system and for detection
Electronic board to measure the current
6 cm glass capillary
Wires to measure the current in the system
Potassium silicate monolith placed in the end of the capillary
Plastic fitting to contain the solutions
A
B

67
3.5.3 Ion extraction through Polytetrafluoroethylene (PTFE) film and
Parafilm
Figure 3-12: The set-up of the ion extraction through a PTFE film using a plastic tube
Figure 3-12 shows the experimental set up for ion extraction through PTFE film. This
system consists of two reservoirs. The sample reservoir, which will be referred to as
reservoir A, contains an anion mixture and MES/His buffer. The second reservoir is the
destination reservoir, which will be referred to as reservoir B; this reservoir contains
MES/His buffer. Both reservoirs are linked to each other by a plastic tube, which is
covered with PTFE film (Acro Ltd, Hull, UK) or Parafilm (Sigma Aldrich Ltd, UK).
The film was stretched and sealed over the end of the plastic tube. The plastic tube was
placed between the two reservoirs, and the PTFE film or Parafilm was stretched and
sealed around one end of the tube and then attached directly to reservoir A, as shown in
Figure 3-12.
The anions should migrate from reservoir A to reservoir B through the PTFE film or
Parafilm, by the attraction of the applied voltage. The conditions were: 10 mM
MES/His Buffer; an applied voltage of 10-200; and times of 10, 5 and 2.5 minutes.

68
3.5.4 Electrodialysis for sample introduction with a commercial cell
Figure 3-13: Schematic drawing of an electrodialysis system[182]
consisting of two
polytetrafluoroethylene link chambers separated by a cellulose acetate electrodialysis membrane
Figure 3-14: An image of the experimental set-up for ion extraction with the cellulose acetate
membrane and the commercial cell (Harvard Apparatus, UK)

69
The system in Figure 3-13 and Figure 3-14 consists of a chamber and a cellulose acetate
dialysis membrane that was placed in the chamber. Two Pt electrodes were directly
inserted into the destination and sample reservoir, the sample reservoir was filled with
about 500 µl analyte, and the chamber (500 µl) was filled with 5 mM MES/His buffer.
The electrodialysis ED system was operated using a power supply. The ion should
migrate through a cellulose acetate electrodialysis membrane with a molecular weight
cut-off value of 100 Da (Harvard Apparatus, UK). The samples were then collected
from the destination reservoir and analysed using ICP-AES.
3.5.5 Electrodialysis for sample introduction with a glass chip
Figure 3-15: Glass microchip for an electrodialysis system for sample introduction
Figure 3-15 shows a glass chip that was used for extracting ions through a cellulose
acetate membrane. The chip consists of two parts, the top and the bottom. The top part
has a circle reservoir that is 1 cm2
wide, with a depth of 3 mm. In the reservoir, there is a
hole in the centre for the electrode, and the width of the hole is 0.5 mm. The reservoir

70
has two channels that are each 1 cm long and 100 µm in depth. The bottom part of the
chip also has a 1 cm2 reservoir that is 3 mm deep, and it also contains a hole in the
centre for the electrode. There are two channels on the sides of the reservoir that are
each 3 cm long and 100 µm depth. The two parts are connected to each other by double-
sided tape without the reservoirs part, on both reservoirs a 1.5 cm2 cellulose acetate
membrane. Thus, the final design of the chip is two reservoirs with a cellulose acetate
membrane in between them, with each reservoir containing a fluid channel where the
sample and buffer can enter and exit. Each reservoir has a Pt electrode that is connected
to a power supply.
3.5.6 Electrodialysis on a COC chip with a flat carbon electrode
Figure 3-16: COC chip for ED, for ion extraction

71
Figure 3-16 shows a chip that was used for extracting ions through a cellulose acetate
membrane. The chip consists of two parts: the top and the bottom. Both parts have a
circle reservoir that is 1 cm2
wide, with depth of 2 mm. In the reservoir, there is a 3 mm
wide hole in the centre for a flat carbon electrode. The reservoir has two channels that
are each 1 cm long and 200 µm in depth. The two parts are connected to each other with
double-sided tape without the reservoirs part, on both reservoirs a 1.5 cm2 cellulose
acetate membrane. Thus, the final design of the chip is two reservoirs with a cellulose
acetate membrane in between them; each reservoir has a fluid channel where the sample
and buffer can enter and exit. Each reservoir has a carbon electrode that is connected to
a power supply by a circuit board (see Figure 3-17), with a copper electrode that is
placed on the board; and the board is connected to a power supply.
Figure 3-17: Printed circuit board with a copper electrode used to connect the carbon electrode to
the power supply
Copper electrode

72
3.5.7 Electrodialysis on a COC chip with a multi-membrane
In this system, two types of ion exchange membrane were used: an anion-exchange
membrane for the extraction of anion and a cation-exchange membrane for the
extraction of cation. The chip in this system is made from COC (using the process
mentioned earlier in section 3.3).
Figure 3-18: Schematic diagram of the COC chip with two membranes for ion extraction
Figure 3-18 shows a schematic of the chip, which consists of four layers. The first layer
has a reservoir of deionised water (or any convenient solution), which is situated
directly after the electrode (cathode); this is in order to generate enough current to
complete the electric circuit and to condition the cation exchange membrane, which is
situated in the other side of the water reservoir. Following this is the second layer,
which contains the analyte sample; this layer is between two membranes, the anion-
Wate
r
Wate
r

73
exchange and cation-exchange. Following the analyte sample reservoir anion-exchange
membrane, this membrane only allows the anion to pass through the membrane to the
anode. The anion-exchange membrane passes anions only towards the anode on the
other side of the chip. The third layer after the anion-exchange membrane has a buffer
reservoir (most of the time the buffer was 5 mM MES/His); the buffer has to be
compatible with the separation step. The buffer should carry the extracted anions from
the water sample to the separation chip, and in order to pre-concentrate the anion in this
stage, the cation-exchange membrane is placed in the other part of the reservoir to keep
the anions between the two membranes. The last layer after the second cation-exchange
membrane has a reservoir of water (or any convenient solution) to condition the
membrane and generate current to complete the electric circuit. On the other side of the
reservoir is the other electrode (anode).

74
Figure 3-19: Topside view of a COC multi-membrane system for ion extraction

75
Figure 3-20: Bottom-side view of a COC multi-membrane system for ion extraction
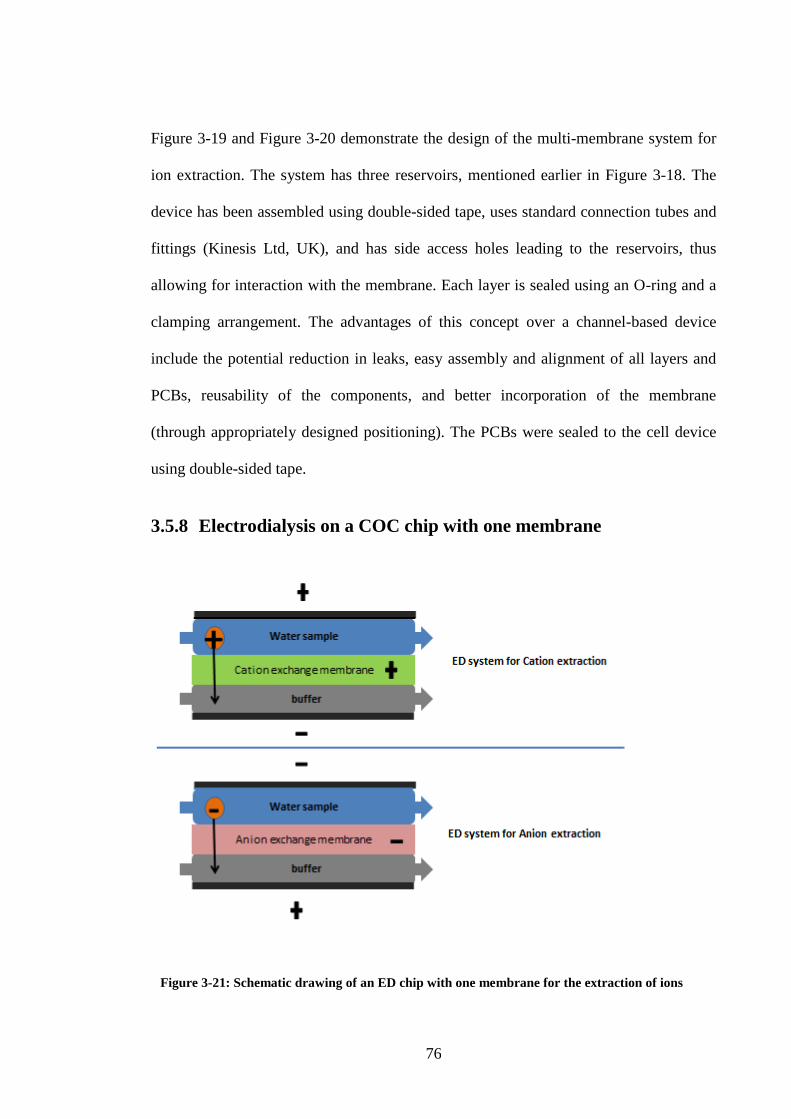
76
Figure 3-19 and Figure 3-20 demonstrate the design of the multi-membrane system for
ion extraction. The system has three reservoirs, mentioned earlier in Figure 3-18. The
device has been assembled using double-sided tape, uses standard connection tubes and
fittings (Kinesis Ltd, UK), and has side access holes leading to the reservoirs, thus
allowing for interaction with the membrane. Each layer is sealed using an O-ring and a
clamping arrangement. The advantages of this concept over a channel-based device
include the potential reduction in leaks, easy assembly and alignment of all layers and
PCBs, reusability of the components, and better incorporation of the membrane
(through appropriately designed positioning). The PCBs were sealed to the cell device
using double-sided tape.
3.5.8 Electrodialysis on a COC chip with one membrane
Figure 3-21: Schematic drawing of an ED chip with one membrane for the extraction of ions

77
Figure 3-21 shows a diagram of the ED chip design. The chip has a top inlet from the
side to introduce the sample to the reservoir, and an outlet that allow the sample to exit;
the bottom side also has the same, for the buffer reservoir. The fluid has been
introduced to the chip and the exit by tubes connected to the chip through lure
connectors (Kinesis Ltd, UK). The fluid has been pumped to the chip by a syringe pump
(see Figure 3-4).
Both reservoirs are separated by a membrane, where the ED processes take place. The
top and bottom reservoirs are attached to a PCB that has an electrode (for more details
about the PCB and the electrode, see section 3.6.3). The PCBs are connected to a power
supply. More details of the ED system are provided in the following image.
Figure 3-22: A photo of the ED system used for the extraction of ions

78
3.6 Printed circuit boards
A printed circuit board (PCB) is a non-conductive board that physically supports and
electrically connects electronic components, using conductive tracks that are
typically etched from copper sheets laminated onto a non-conductive substrate, such as
polymer[183]
(see Figure 3-17). The copper on the board works as an electrode to
establish a conductive environment in the solutions used in electrodialysis systems.
Sometimes, there are disadvantages to using copper as an electrode: it becomes easily
oxidised and suffers from impurity,[184]
which influences the analysis of inorganic ions.
Therefore, different coating techniques have been used to overcome these issues.
3.6.1 Gold-coating of the copper electrodes on the PCB
Sputter coating is a process for applying an ultra-thin coating or layer of electrically
conductive material.[41]
Typically, metals such as silver, chromium, platinum and
gold/palladium alloy are used for coatings. This technique is commonly used in the
preparation of non-conductive samples for scanning electron microscopy. In SEM
examination, the coating promotes the emission of secondary electrons from the sample
surface, and prevents sample charging.[42]
For this exercise, gold has been used as the coating material. In the sputtering process, a
gold target (cathode) is bombarded with a heavy gas (argon), in a vacuum chamber. If a
high voltage is then applied, a discharge is created resulting in the acceleration of argon
ions to the target surface. These ions eject material from the gold target, resulting in a
coating on a sample that is sat below the target.[44]
Modern, low-voltage sputter coaters
enable coatings to be deposited at rates of up to 1nm/s.[43]

79
Figure 3-23: Edwards S150B gold-sputter coating instrument
The sputter coater used was an Edwards S150B (Figure 3-23). The board to be coated
was “masked” with plastic film to prevent coating of the board, apart from the area
comprising the electrodes (Figure 3-17). The board was placed in the vacuum chamber
of the coater, approximately 50 mm from the gold target (60 mm diameter), and the
rotary pump of the coater was switched on, until a suitable vacuum for coating was
reached (typically 0.1 to 0.5 mbar). A voltage of approximately 1 kV was then applied
to produce a discharge/plasma. A timed sputtering run of 3 minutes was applied to the
board, in order to achieve a conductive gold layer of 6 to 10 nm.

80
3.6.2 Carbon coating of the copper electrodes on the PCB
Figure 3-24: Edwards High Vacuum Evaporator, model E12, for the carbon coating for the
copper electrodes
A mask of tape and a thick plastic covered all of the board except the electrode part on
the centre of the board (see Figure 3-17). The board was then placed on the baseplate of
an Edwards High Vacuum Evaporator, model E12 (Figure 3-24). The carbon source
was approximately 25 cm above the board. The source consisted of two spec-pure
carbon rods; one sharpened to a point and the other to a slightly flattened point. The
rods opposed each other under the spring pressure. The 30 cm diameter glass bell jar
and its polycarbonate implosion guard were then replaced off on the machine, which
was then evacuated to a pressure of <10-5 Pa. The carbon was evaporated by applying
approximately 30 Volts at 30 Amps to the carbon rods (the carbon rods [300 mm x 6.15
mm] were supplied by Agar Scientific). The board was then covered with a layer of
conductive carbon that was about 10 nm.

81
3.6.3 Commercial PCB
A more advanced technique for coating surfaces is used to overcome the problems
associated with copper: electroless nickel immersion gold (ENIG).[185]
ENIG is a
surface-plating technique used for printed circuit boards. It is literally two layers of
metallic coating of 2-8 microinches of gold over 120-240 microinches of nickel.[186]
The
nickel works as a barrier to the copper and is the surface to which the electrical
components are soldered. The gold layer is there to protect the nickel from oxidation
(Figure 3-25). ENIG has some advantages over typical surface plating techniques, such
as good oxidation resistance. (The PCB was fabricated by Faraday Printed Circuits Ltd,
UK.) see Figure 3-26.
Figure 3-25: A schematic drawing of the metallic layers of electroless nickel immersion gold
(ENIG).
Figure 3-26: The customised commercial PCB with the gold electrode

82
4 Silica monoliths for the separation of ions
4.1 Introduction
For IC to be useful for in-situ monitoring, it is necessary to reduce the time taken to
perform separations of ions of interest. Therefore, a monolithic column was used for the
fast separation of inorganic ions, which can be achieved in minutes.[187]
Recent
investigations into the separation of inorganic molecules on monolithic columns have
provided some very promising results, and have shown that a short, silica-based
monolithic column can demonstrate peak efficiencies that are equivalent to, or better
than, those previously obtained using the more traditionally sized particle-packed
columns.[145]
Furthermore, as mentioned in section 2.3.1, inorganic silica-based
monolithic columns can provide good mechanical stability, and the possibility of
chemical modification for IC. In addition, the separation is simple and the final shape of
the monolith can be adjusted. Therefore, silica monolith was used in this research for
the separation of inorganic ions.
Silica monolith was used as a stationary phase for the separation of inorganic ions, as it
can be miniaturised and can perform very good separation. However, the separation of
ions requires a high, specific surface area, which was achieved through the porosity of
the monolith media’s nm-sized pores. It is also highly permeable, which is achieved
through micron-sized pores to allow for rapid mass transfer to the detector.
Furthermore, it has to be mechanically strong in order to stand the pressures applied to
move fluid through them. Therefore, effective monoliths must achieve a convenient
compromise between these requirements, which can be obtained through the fabrication
process that ensures that monoliths have both micron- and nano-scale pores. These
processes are explained in the experimental section 4.2.1.1.

83
To separate ions on a silica monolith, the surface of the monolith has to be modified
with an ion exchanger. Two promising approaches have been investigated for the
separation of ions: lysine and DDAB.
4.2 Experimental
4.2.1 Preparation of analytical separation column
Silica-based monolithic columns can be prepared through hydrolysis and the
polycondensation of alkoxysilanes catalysed by an acid in the presence of a porogenic
agent such as Tetraethylorthosilicate (TEOS). After drying and heating treatments, the
sol–gel network is derivatised by an on-column silylation reaction for chromatographic
separation. The functional groups should be introduced onto the silica monolith; there
are more details on the preparation of the monolithic column in the following section.
4.2.1.1 Synthesis of silica monoliths
The silica monolith was prepared using a procedure similar to that described by
Nakanishi.[154]
The desired amount of polymer, 0.282 g of polyethylene oxide, was
added to aqueous solution of acid (0.291 ml of distilled water + 2.537 ml 1M HNO3).
The mixture was cooled in an ice bath and stirred for 20 minutes, or until a
homogeneous solution was formed. The required amount of silicon alkoxide (2.256 ml)
of TEOS was then added and the mixture was stirred strongly in the ice bath for about
30 minutes, to form a transparent solution. The solution was then poured into a plastic
tube (diameter 4.8 mm; length 10 cm). Both ends were closed with PTFE tape and the
tube was placed in a 40 °C oven for 3 days, during which a wet semi-solid gel monolith
was formed. About 20% shrinkage occurred during this gel formation, which allowed
for the easy removal of the wet gel monoliths from the plastic tube. The wet gel
monoliths were washed with copious amounts of water to remove any possible residues

84
and then moved to a 1 M NH4OH aqueous (1:4 NH4OH: water) solution in a conical
flask (100 ml), which was placed in an oil bath to ensure the uniform distribution of the
heat. This system was located on a hot plate to maintain 90˚C overnight. The monolith
was again washed with lots of water before drying in an oven at 40°C for 24 hours.
Finally, the monolith was calcined at 550–650 °C for six hours under an air flow, to
remove any remaining organic material.[188]
After preparation, the silica rod was cut to
the desired length of 6 cm. The silica rod was placed in a (tetrafluoroethylene) (PTFE)
shrinkable tube (Adtech Polymer Engineering Ltd, UK) and then placed in the oven at
330ºC for two hours to seal the heat-shrinkable tube around the monolithic rod.
Following this, the silica monolith was synthesised, with the monolith rod shown in
Figure 4-1.
Figure 4-1: 6 cm long silica-based monolithic column for separation
4.2.1.2 Derivatisation of the silica monoliths with lysine
The coating procedure was based on the method of Huang et al.[189]
Figure 4-2 shows
the reaction mechanism for the generation of the desired epoxy, diol and lysine
stationary phases on a silica monolith. To generate an epoxy monolith, a solution of 2-
mL GPTMS (3-Glycidyloxypropyltrimethoxysilane), 100 µL of 2,6-lutidine (catalyser)
and 40 mL of anhydrous toluene was used. This mixture was placed in a 10 ml glass
syringe and flushed through the monolith by a syringe pump at 0.1 mLmin-1
, for about 1
hour, and the column was then reacted at 110ºC for 1 hour. This step was repeated three

85
times and the final reaction was carried out overnight. The monolith was then flushed
with toluene by using a syringe pump at 0.5 mLmin-1
for 1 hour, and then with
methanol at 0.5 mLmin-1
; the epoxy monolith was then ready for the next treatment, to
generate the lysine stationary phase.
The next step was to produce the diol. This is performed by flushing the prepared epoxy
monolith with 0.1 M HCL for five hours and placing it in an oven at 60ºC for two hours,
to open the epoxy ring groups and generate the diol groups. The monolith was then
flushed with water and methanol, leaving the resulting diol stationary phase on the
monolith surface ready to use.
The next step involved the preparation of the lysine stationary phase: 4.38 g of lysine
was dissolved in 30 mL NaH2PO4 (50 mM) at pH 8.0, adjusted by 1 M NaOH. The
prepared epoxy monolith was perfused with this solution for 1 hour and reacted at 75ºC
for 1 hour. This step was repeated twice before the final reaction was carried out
overnight, for 16 hours. The monolith was then rinsed with water and methanol prior to
use.

86
Figure 4-2: Derivatisation of the silica monolith with lysine. A) epoxy monolith, B) diol monolith
and C) the lysine modification
4.2.2 Derivatisation of the silica monolith with DDAB
The derivatisation of the silica monolith column with DDAB requires a C18 coating
prior to coating the column with DDAB. As bare silica monoliths do not possess anion-
exchange sites, they may demonstrate a low retention for anion separation.[190]
Furthermore, DDAB as a reverse phase has shown a good separation of anions and it
has performed fast separations of anions of less than a minute.[191]
4.2.2.1 Derivatisation of the silica-based monolith with C18
The monolith was modified by C18 using a procedure similar to that described by
Xie.[192]
Briefly, the derivatisation reagent was 1 g chloro(dimethyl)octadecylsilane
(ODS) as the silanisation reagent in 10 ml toluene and few drops 2,6-lutidine. The
derivatisation was coated on the monolith by a continuous flow from a syringe pump at

87
a flow rate of 30 ml/mins for six hours at 80 °C in a water bath. After the derivatisation,
the monolith was flushed with toluene and then with methanol, using a syringe pump
for one hour; finally, the derivatised silica column was placed in an oven for 24 hours at
70°C prior to use.[193]
Figure 4-3: Derivatisation of the silica monolith with C18
After preparation, the silica rod was cut to the desired length of about 6 cm. The silica
rod was placed in a (tetrafluoroethylene) (PTFE) shrinkable tube and then placed in the
oven at 330ºC for two hours to seal the heat shrinkable tube around the monolithic rod.
Following this, the silica monolith is ready for modification, with the monolith rod
demonstrated in Figure 4-1.
4.2.2.2 Coating the C18 silica monolith with ion exchange;
didodecyldimethylammonium bromide (DDAB)
The monolith was coated using the procedure of Hatsis and Lucy.[150b]
Briefly, the
monolith was conditioned with 33% ACN in water, and then flushed with 1mM DDAB
(didodecyldimethylammonium bromide) in 33% ACN in water at a 0.2 mLmin-1
flow
rate, until DDAB breakthrough was observed. The monolith was flushed with water for
about one hour at a 0.2 mLmin-1
flow rate to wash out any unbound DDAB. The detector
was reattached and the coated monolith was then conditioned with the eluent (65%

88
ACN in water) at 0.5 mLmin-1
flow rate, until the conductivity stabilised. The ion-
exchange capacity of the coated monolith was estimated from the DDAB Breakthrough
time, using the following equation:
𝑸 = 𝑪 𝑭 (𝒕𝒃 − 𝒕𝟎) Equation 4-1
Where C is DDAB concentration in the coating solution (µmol/ml), F is the flow-rate
(mLmin-1
), tb is the breakthrough time of DDAB (min) and t0 is the hold-up time of the
monolith (min). The ion-exchange capacity of the monolith can be varied by adjusting
the ACN content of the coating solution.[150b]
4.2.2.3 Coating the commercial C18 monolith with DDAB
A commercial C18 monolithic column (100 x 4.6 mm size Onyx Monolithic C18,
Phenomenex Inc., UK) was first tested on a HPLC system, and was then conditioned
with 100% ACN. Following this, the column was conditioned with 65% ACN: 35%
water solution and then flushed with 1mM DDAB in 65% ACN: 35% water at 2
mLmin-1
, until a stable baseline was observed on the detection. The column was flushed
with water for 30 min at 1 mLmin-1
to wash out the unbound DDAB. This was repeated
at least two times to ensure the best possible coating of DDAB.
4.2.3 Evaluation of the structure of monoliths
4.2.3.1 Scanning electron microscopy (SEM)
The morphology of the monolith was characterised by scanning electron microscopy
(SEM), using a Cambridge S360 scanning electron microscope (Cambridge Instruments,
Cambridge, UK). The monolith was cut to an appropriate size and then images of a cross-
section were obtained, using an accelerating voltage of 20 kV and a probe current of 100 pA
in high vacuum mode. The monoliths were coated with a thin layer of 2 nm thick gold-
platinum using a SEMPREP 2 Sputter Coater (Nanotechnology Ltd, Sandy, UK).

89
4.2.3.2 Brunauer-Emmett-Teller (BET) model
The physical properties of the monolith such as surface area, average pore diameter and
pore volume, were studied through the Brunauer-Emmett-Teller (BET) model using a
surface area and porosity analyser (Micromeritics Ltd, Dunstable, UK). The porous
monolith was fabricated inside a 1 mL disposable plastic syringe. The monolithic rod was
then removed from the syringe and dried using N2 gas. The porous properties of the
monoliths were determined using the BET isotherms of nitrogen adsorption and desorption
at 77 K. The isotherms were analysed to obtain the surface area according to the BET
model. The BJH (Barrett-Joyner-Halenda) model was used to measure the pore volume, and
the pore size distributions of pores within the monoliths were measured from the nitrogen
adsorption isotherm.
4.2.3.3 Ion-separation experiment
The HPLC experimental set-up described in section 3.4 was used to perform the
separation of an anion mixture. Characterisation started with a 1mM nitrite solution
(was used as sodium salts). The set-up began with a syringe pump to ensure constant
pressure of the eluent through the separation monolith that was 0.02 mLmin-1
, with the
eluent 50 mM phosphate buffer placed in a 10 ml plastic syringe. A plastic tub with 0.5
mm diameter was used for carrying the eluent from the syringe to the loop injector, the
separation monolith and then the detection system, and eventually to the waste
container.
4.2.4 Results and discussion
4.2.4.1 Evaluation of the lysine monolith structure
The aim of the lysine approach was to produce high-performance ion exchangers on the
silica monolith, for the separation of inorganic ions. The silica monolith has been

90
modified with lysine to produce a high-performance monolithic zwitterionic ion-
exchanger. This has been investigated elsewhere, showing promising results.[194]
Figure 4-4: SEM images of the cross-section of a final monolith (A) before lysine modification and
(B) after lysine modification
Figure 4-4 demonstrates that the structure of the monolith surface is highly porous,
containing a rigid silica backbone; the physical geometry is random, without any
apparent regular lattice “sponge-like” structures that are continuous. The continuous
monolithic structure of silica skeletons shows a range of macropores sizes between 1
and 10 µm; these macropores allow for convective flow through the continuous column
bed. Further treatment of the monolith with an alkaline aqueous solution, such as
ammonium hydroxide, generates mesoporous silica structures with a pore-size ranging
between 5 and 30 nm. These mesopores allow the analyte to diffuse through, which
makes them responsible for the selective separation by adsorption or desorption. This
structure simultaneously enables a high efficiency of separation and low back
pressure.[151, 154, 195]
[196]
The chemically-modified silica monolith surface with lysine was characterised by SEM
and BET to identify the differences between the modified and non-modified silica-based
A B

91
monoliths. Figure 4-4 shows the SEM image of the surface of the silica monolith before
(A) and after (B) modification with lysine, and they are characterised by a bimodal pore
structure with continuous macropores and mesopores. The SEM image demonstrated no
noticeable differences in the structural morphology of the two monoliths. The BET
analysis of the surface area of the lysine-modified silica monolith, however,
demonstrated a decrease from 356 m²g-1
before lysine modification to 150 m²g-1
after
modification with lysine. The pore sizes have also decreased from 130 Å (non-modified
silica-based monolith) to 111 Å for the modified monolith.
4.2.4.2 Evaluation of the structure of the DDAB monolith
Figure 4-5: SEM images of a cross-section of a final monolith (A) after formation; (B) after the
treatment of ammonium hydroxide which creates extra surface area; and (C) after calcination
and coating with cationic surface DDAB to create an anion-exchange surface
Figure 4-5 shows that the structure of the monolith surface is highly porous, containing
a rigid silica backbone; the physical geometry is random, without any apparent regular
lattice “sponge-like” structures that are continuous. The continuous monolithic structure
of silica skeletons shows a range of macropore sizes between 1 and 10 µm; these
macropores allow for convective flow through the continuous column bed. Further
treatment of the monolith with an alkaline aqueous solution, such as ammonium
A B C

92
hydroxide, generates mesoporous silica structures with a pore-size range between 5 and
30 nm. These mesopores allow the analyte to diffuse through, which makes them
responsible for the selective separation by adsorption or desorption. This structure
simultaneously enables a high efficiency of separation and low back pressure.[151, 154, 195]
[196]
4.2.4.3 Chromatography of a lysine monolith
In sections 4.2.3.3, the procedure of the modification of the silica monolith and the
experimental work were demonstrated. In order to investigate the optimum conditions
for the separation of an anion using this experimental set-up, 1 mM sodium nitrite was
injected into the system.
Figure 4-6: Chromatogram of a 1 mM sodium nitrite solution, eluent of 50 mM phosphate buffer,
flow rate of 0.025 mLmin-1

93
Figure 4-6 shows the chromatogram of 1 mM sodium nitrite on a monolithic column
coated with lysine, using a conductivity detection system. The chromatogram
demonstrates a peak retained at 250 s. Using Equation 2-7, the value for N was 27,
which is low.
The results obtained from the silica monolith coated with a lysine ion exchanger for the
purpose of optimising the conditions, are very promising but require further
optimisation. The low value for N might be due to the HPLC system. The syringe pump
could not pump consistently against the resistance in the monolith.[197]
It has been proved that a shorter monolith has demonstrated the successful separation of
inorganic ions,[77]
and longer columns have also demonstrated the successful separation
of inorganic ions[194]
; further optimisation of the length of the monolith will probably
enhance the separation.
Another issue with the lysine coating is that, practically, it was hard to coat the column
with lysine because of the lengthy preparation procedure. During the coating process,
there was a considerable blockage of the monolith due to the nature of the monolith
surface (further discussion below), which required halting the coating process a few
times and restarting the procedure with a new monolith. This was indicated at times
with changes in the colour, especially after the reaction when removing the monolith
from the oven during the heating step. The long procedure steps and the addition of
chemical reagents is not ideal for continuous in-situ monitoring, because it will
eventually affect the separation process and the reproducibility[197]
of the
chromatogram, which were examined a few times and showed considerable changes in
the chromatogram. Further examination of the effect of the lysine coating is to follow.

94
The decrease in the surface area of the monolith following the modification could be the
reason for the blockage of the monolith during the modification process, as it was
creating high back pressure that was difficult to deal with, making the preparation of the
monolithic column slightly difficult. This problem could be overcome by modifying the
monolith’s surface area, but this requires a longer period of investigation.
4.2.4.4 Chromatography of a DDAB monolith
Figure 4-7: Chromatogram of the separation of 1 mM sodium nitrite and 1 mM sodium sulphate
on a DDAB monolith, flow rate 0.2 mLmin-1
. The buffer 65% ACN, and the detector was
homemade conductivity detection system.
Figure 4-7 shows the chromatogram of the separation of a 1 mM nitrite and 1 mM
sulphate mixture on a monolithic column coated with DDAB, using a conductivity
detection system. The choice of these two anions was due to the fact that they normally
have a relatively large retention time gap in a typical chromatography separation.
However, the chromatogram demonstrates two overlapping peaks: the first one retained
0 50 100 150 200 250 300 350 400 450 500
0.1
0.15
0.2
0.25
0.3
0.35
0.4
0.45
0.5
Time (s)
AC
Ou
tpu
t Vo
ltag
e (
Vrm
s)
Voltage Output with mix of 1mM NaCl & Na2SO4 @ .2mL/min - Rf=100k = Signal= 5Vpp 500Hz - 290911

95
at 225 s, which could be a nitrite peak, and the second retained at 300 s, which could be
sulphate peak. In order to distinguish between these two peaks, typical chromatogram of
nitrite can be seen in Figure 4-8.
Figure 4-8: Chromatogram of the separation of 1 mM sodium nitrite on a DDAB monolith, flow
rate 0.2 mLmin-1
. The buffer 65% ACN, and the detector was homemade conductivity detection
system.
Figure 4-8 shows a chromatogram of a single peak retained just after 200 s. The peak is
relatively wide and has a long tail, and it has a low intensity, as the peak height is about
0.2 Vms. Using Equation 2-7, N for nitrite in the chromatogram was 79.
Using Equation 2-8, h for nitrite chromatogram (Figure 4-7) was 1.45 ×10⁻³
, and h for
nitrite chromatogram (Figure 4-8) was 0.075. Using Equation 2-9, the resolution of the
nitrite peak and the sulphate peak in Figure 4-7 was 6.8.
Figure 4-8 shows an unexpected peak as it demonstrated a lower intensity than
Figure 4-7; the peak height is 0.2 V ms while it is 0.5 V ms in Figure 4-7. Also, there
was a slight shift in the retention times of both peaks. Both chromatograms should show

96
identical nitrite peaks, or at least peaks that are similar to each other. Both
chromatograms have demonstrated an improved number of theoretical plates. The first
chromatogram for the separation of nitrite and sulphate (Figure 4-7) has poor resolution
and considerable loss of efficiency; this is probably due to the extra column length from
connector and the glass rods at the end of each monolith, as they are relatively big in
size when compared to the monolith (see Figure 4-1). The extra-column band
broadening has to be minimised as much as possible to improve the efficiency.[191]
However, the estimated capacity of the monolith has to be calculated to compare the
results with the literature.
𝑸 = 𝑪 𝑭 (𝒕𝒃 − 𝒕𝟎) Equation 4-2
Where C is the DDAB concentration in the coating solution (µmol/ml), F is the flow-
rate (mLmin-1
), tb is the breakthrough time of DDAB (min) and t0 is the hold-up time of
the monolith (min). The concentration of DDAB in a I mM solution was 115.66 mg, the
flow rate was 0.2 mLmin-1
, the breakthrough time was about 50 s (0.83 min), and the
void time was around 5 s (0.083 min); therefore, the capacity was 17.279 µeq/column.
The capacity here is lower than the theoretical one in the literature, which was 44
µeq/column.
In general, the estimated calculation of the capacity, N and R, demonstrate unexpected
results. However, this was from one attempt, as it is extremely difficult to optimise the
separation conditions as there was a continuous leakage from the monolith, even when a
commercial column was used for comparison. Also, the syringe pump used was creating
bubbles because it was not pumping continuously. Moreover, the monolith was first
derivatised with a C18 layer before the layer was coated with DDAB; this double layer

97
might have had a negative effect on the diffusion of the analyte through the monolith,
leading to poor resolution.
4.2.4.5 Chromatography of DDAB on a commercial monolith
A commercial Monolithic HPLC Column was used to compare the chromatographic
behaviour of the homemade monolithic columns with DDAB, and to compare the
results obtained with DDAB derivatisation to the literature.
Figure 4-9: Chromatograms of 1 mM sodium nitrite in four injection attempts. The column was
an onyx C18 column coated with DDAB, the buffer was 65% CAN, the flow rate was 02 mlmin-1
Figure 4-9 shows the chromatograms of 1 mM sodium nitrite in a commercial C18
column coated with DDAB. The chromatograms demonstrate nitrite peaks in four
different injections. At the first injection, the peak retained at 270 S; the peak is not a
great shape and has a second minor peak on its side. The second, third and fourth peaks

98
were retained between 300 and 350 S; the peaks have different shapes, especially at the
bottom, which indicates different peak areas.
Figure 4-10: Chromatograms of 1 mM sodium sulphate in four injection attempts. The column
was an onyx C18 column coated with DDAB, the buffer was 65% CAN, the flow rate was 02
mlmin-1
Figure 4-10 shows the chromatograms of 1 mM sodium sulphate in a commercial C18
column coated with DDAB. The chromatograms demonstrate the sulphate peaks for
three different injections. The peaks were not a good shape: they have second minor
peaks on their sides. The peaks were retained between 250 and 300 S, and have
different shapes, especially at the bottom, which indicates different peak areas.
The main purpose of using the commercial C18 column was to compare its behaviour
with the behaviour of the prepared in-house monolithic column. Both figures
(Figure 4-9 and Figure 4-10) demonstrate a lack of reproducibility in the chromatogram

99
using the commercial C18 column with DDAB. They also have very close retention
times of nitrite and sulphate; these two anions usually have a good gap in retention
times due to their differences in charge density. Furthermore, the peak shapes are totally
different when comparing the chromatograms of nitrite that used the prepared in-house
monolith to those using the commercial monolith.
4.3 Chapter conclusion
The monolithic column was used as a possible stationary phase for the separation of
inorganic ions, as it demonstrated very good results in the literature. For the separation
of anions, two different anion exchangers were investigated, lysine and DDAB. The
monolith was prepared in-house and then coated with the anion exchanger. A
commercial C18 monolith was used to compare the results obtained from the
homemade monolithic column.
Two anions were used to perform the chromatography on the monolithic columns,
nitrite and sulphate. On the lysine monolith, the nitrite chromatogram showed a good
peak but coating the column was time-consuming and back pressure occurred. With the
DDAB homemade monolith, the separation of nitrite and sulphate showed poor
resolution, and a low number of theoretical plates was observed. When nitrite was
evaluated on its own on the same monolith, a shift was seen in the retention time, and
the peak intensity decreased. The commercial C18 monolith was also coated with
DDAB and showed poor reproducibility for nitrite and sulphate.
Good chromatographic performance was not observed on the monolith. This could have
been due to two factors. One is the problem of high back pressures which was obtained
by pumping liquid through the monolith. The second problem is the operation of the
detector, which needs further development. In relation to these problems, it was decided

100
that IC would not be suitable for the portable device, and electrophoresis would be a
better approach.

101
5 The application of a potassium silicate monolith in
sample introduction
5.1 Introduction
A potassium silicate monolith was used to extract ions from a water sample, as a
possible media for extracting ions from a river water sample. A potassium silicate
monolith works as a barrier against unwanted materials that are already present in the
river water. The presence of these materials would influence the separation process. As
a pre-concentration and pre-treatment step before separation, a potassium silicate
monolith is permeable enough to allow only ions to pass through and blocks anything
else, under the influence of applied voltage.
The bulk body of the monolith contains micropores (< 2 nm), mesopores (2-50 nm), or
macropores (> 50 nm),[198] and the extraction of small molecules requires monoliths with
pore sizes ranging from 8 to 10 nm (mesopores).[199] In 1996, Fields[200] prepared a silica
xerogel monolith from a potassium silicate solution. This potassium silicate monolith can
be formed into the desired shape, the surface can be chemically modified, the pore size can
be modified, and it can be made physically strong. Therefore, extraction of inorganic ions
can be performed in a silica monolith, for pre-concentration and pre-treatment prior to
separation.

102
Figure 5-1: SEM image of a potassium silicate monolith
Figure 5-1 shows the structure of a potassium silicate monolith, by SEM. The structure
is highly porous, containing a rigid silica backbone; the physical geometry is random,
without any apparent regular lattice structure. This shows a good media for the
extraction of ions through the monolith.[198]
5.2 Ion extraction on a chip
5.2.1 Experimental
5.2.1.1 Preparation of a potassium silicate monolith
Microporous silica frits were prepared from 1:10 formamide and potassium silicate
solutions, at room temperature (25 °C).[201]
The reagents were manually mixed for about
10 minutes and then injected into the chip’s middle reservoir (Figure 5-2). In order to

103
control the position of the monolith in the microchip, glycerol was mixed with a food
dye (the dye was to allow for visual control of the glycerol, as it is colourless), forming
a highly viscous material that provides resistance to the mixture. The glycerol gel was
pressure-injected with a syringe into the chip; the mixture was injected against the
glycerol and held in position. The microchip was then placed in an oven at 90 °C for
about 20 hours, before being removed and allowed to cool. The coloured glycerol gel
was then removed with water and the device placed back in the oven, overnight.
Figure 5-2: A) an image of the chip used for ion extraction, the channel contains glycerol and dye.
B) is a diagram of the chip describing the channel design.
In order to place the solution in the chip, two Eppendorf tips were cut and their size
adjusted to fit on both reservoirs (Figure 5-3). A Pt electrode (of about 1.5 cm long and
0.5 mm wide) was dipped in each reservoir; the electrodes were connected to a power
supply.
On the chip used (see Figure 5-2), there were two reservoirs: the sample reservoir,
referred to as reservoir (A) and the destination reservoir, referred to as reservoir (B).

104
Figure 5-3: Eppendorf tips placed on the glass chip to hold solutions in place
5.2.1.2 The ion extraction procedure
Initially, a phosphate buffer was used for separation following Huang et al.[189]
(see
section 4.2.3.3); furthermore it was used due to the convenient pH range (between 5-8),
and its long-term stability under different temperatures for separation. Therefore, it was
used for ion extraction, as the latter is the starting point of the analysis in this project,
and so maintaining the same buffer for both steps (ion extraction and separation) is
desirable.
A few experiments were run earlier to find the suitable voltage and timing. The
experiment was performed by applying a voltage of 700 V to both reservoirs in the chip,
for two hours. Reservoir A contained a 0.2 ml phosphate buffer (1mM) and 0.1 ml NaCl
(1mM), and reservoir (B) only contained 0.3 ml phosphate buffer (1mM) . If the
experiment were successful, the amount of anions in reservoir A should have decreased
after the application of voltage, and increased in reservoir B. Solutions were then
measured by ion chromatography (see section 3.2.1).

105
5.2.2 Results and discussion
Figure 5-4: Chromatogram of 1 mM phosphate buffer that used for the extraction experiment.
Figure 5-4 shows the blank chromatogram for 1 mM phosphate buffer. An individual
chromatogram of each anion was obtained in order to identify the peaks in Figure 5-4.
The first overlapping peak was the fluoride ion, retained at 2.39 minutes, with the
acetate ion retained at 2.55 minutes. The third peak retained at 3.77 minutes was for
chloride ions. The fourth peak retained at 6.65 minutes was for phosphate ions from the
buffer. The last peak retained at 8.93 minutes was for sulphate ions. However, the most
important peak was the chloride peak, which is the ion of interest in this part (the
chloride peak height is 0.33 µs and the peak area 0.06 µs.min). The presence of fluoride
in the buffer was higher than normal, due to a contamination of fluoride already in the
column.

106
Figure 5-5: Chromatogram of the solution in reservoir B after ion extraction
Figure 5-5 shows the chromatogram of solution in reservoir B in the extraction chip,
after the application of the voltage. This chromatogram was the best of three
chromatograms obtained for the solutions in reservoir B. On the chromatogram, four
peaks of fluoride, chloride, phosphate and sulphate, and fluoride and sulphate are
already present in the blank sample, with the phosphate peak representing the buffer.
However, the most important peak from the chromatogram is the chloride peak (the
chloride ion peak which retained at 3.72 minutes), which is the point of investigation in
this experiment, as it represents the extracted amount of chloride from reservoir A to
reservoir B.
The concentration of chloride in reservoir B of the chip, after applying the voltage of
700 V for two hours, shows that the chloride ion successfully migrated from reservoir A
in the chip to reservoir B. The amount of migrated chloride was 4.52 µg from 5.8 µg;
about 78% of the chloride moved to reservoir B. The mass balance was calculated by

107
setting a set of standards in different concentrations for each anion, and a graph was
then plotted for each anion, using the peak areas of the standards against their
concentrations. The equation then was used to calculate the concentration of anions in
every chromatogram, by using the peak area of the anion of interest.
In order to ensure the reproducibility of the results, the experiment was repeated three
times on the same chip and two times on a different chip, under the same conditions. A
further experiment was carried out under the same conditions but with no voltage
applied. The results show that there was no migration without the application of voltage.
Figure 5-6: The amount of extracted chloride in the glass chip after an applied voltage of 700V for
two hours
Figure 5-6 shows the repeated measurements of chloride extraction, which jumped from
about 5 µg in the first experiment to about 45 µg in the second experiment and then
dropped dramatically to about 8 µg. Migration occurred but the amount of chloride
moved, fluctuated every time. The fluctuation of the chloride level might be due to
Joule heating or electrolysis (see section 2.3.3), which causes a bubble formation that
0
5
10
15
20
25
30
35
40
45
50
1 2 3Am
ou
t o
f m
igra
ted
Ch
lori
de
ion
s/µ
g
Experiments

108
plays a great role in the migration of the ions. Also, when the current was measured
during the extraction of chloride, it was found to be very low (between 0.1-10 µA) ,
which means that there was a high resistance from the monolith. This might be due to
the length of the potassium silicate monolith in the chip.
5.2.3 Nitrite (NO2-) extraction on a glass chip
The aim of this part was to investigate the migration of anions by measuring nitrite
instead of chloride, because chloride was found to be present in the chromatograms of
the phosphate buffer. The extraction of nitrite was compared to chloride extraction.
5.2.3.1 Experimental
The same experimental conditions used for chloride extraction were used for the
extraction of nitrite (see section 5.2.1). Two variations were investigated in the
experiment: time (30, 45 and 60 minutes) and voltage (700 and 1000).

109
5.2.3.2 Results and discussion
Figure 5-7: Chromatogram of 6.9 µg nitrite with 27.5 µg phosphate buffer, reservoir A, before
applying the voltage of 700 V for two hours
Figure 5-7 shows the chromatogram for the solution in reservoir A, which was a nitrite
and phosphate buffer. The first peak, which retained at 2.45 minutes, was the fluoride
peak; the second peak, which retained at 3.75 minutes, was the chloride peak; the third
peak at 4.35 minutes was the nitrite ions peak; and the peak at 6.22 minutes was the
phosphate buffer. The nitrite peak area is 0.01 µs.min, which equals 6.89 µg.
The amount of nitrite in this chromatogram should decrease after applying a voltage, as
nitrite should move to reservoir B, bearing in mind that reservoir B has no nitrite.

110
Figure 5-8: Chromatogram of nitrite with phosphate buffer in reservoir A, after applying the
voltage of 700 V for two hours.
Figure 5-8 shows a chromatogram of the solution in reservoir A of the chip, after
applying a voltage. The most important peak is the nitrite peak, which represents the
amount of nitrite, and this retained at 4.287 minutes. The peak area was 0.008 µs.min,
and the calculated amount of the moved nitrite ions was 3.68 µg.
This shows that the amount of nitrite in reservoir A decreased from 6.89 µg to 3.68 µg
(about 53%), after applying a voltage of 700 V for two hours.

111
Figure 5-9: Chromatogram of the reservoir B solution after applying a voltage of 700 V for two
hours
Figure 5-9 shows a chromatogram of solution in reservoir B after applying a voltage of
700 V for two hours. The nitrite peak was at 4.30 minutes, the peak area was 0.004
µs.min, and the calculated amount of nitrite was 1.83 µg. This means that the amount of
nitrite moved to reservoir B from reservoir A after applying the voltage.
The amount of nitrite in reservoir A decreased after applying the voltage, as indicated in
Figure 5-8, as the amount of nitrite ions was 3.68 µg, which means that the amount of
nitrite decreased by 53%. Subsequently, reservoir B, the destination reservoir,
demonstrated an increase in the amount of nitrite by 1.83 µg (see Figure 5-9); this is a
26% extraction of nitrite.
Despite the extraction of nitrite through the potassium silicate monolith using the glass
chip, there was a loss of 21% of the nitrite amount; this might be trapped in the
monolith body due to the large surface area of the monolith, or lost during the transfer

112
of the sample for analysis by IC. Also, the total amount of nitrite is very low and this
small amount might be affected, especially during the lengthy experiment time.
Furthermore, the voltage applied might be very high for such an application, but this
requires further investigation.
The amount of nitrite was increased in reservoir A by about 1,000 times (0.1 M nitrite)
to enhance the extraction, but less than 2 µg of the nitrite migrated to reservoir B. To
optimise the process, the voltage and time of extraction were investigated. The applied
voltage was increased from 700 V to 1,000 V, and the extraction time was changed
three different times: 60, 45 and 30 minutes. Despite changing theses parameters, the
small amount of nitrite migrated to reservoir B can be described as irreproducible.
However, the results showed that the applied voltage had an effect on the concentration
of nitrite in reservoir A, but the migration to reservoir B was still unclear and requires
further investigation. This is clearly a difficult problem to investigate.
5.3 Ion extraction on a potassium silicate monolith in a glass
capillary
A potassium silicate monolith was used as a barrier to stop unwanted materials from
entering the separation system, as they are very likely to change the separation of ions.
The work on the glass chip has some difficult issues. Therefore, a new set-up was used
to enhance the extraction system.
To investigate the behaviour of chloride and nitrite, a glass capillary was filled with the
potassium silicate monolith used, instead of using the glass chip. The reasons for this
are that a shorter potassium silicate monolith (between 0.5 - 3 cm long) can be
fabricated, as well as narrower channel (25 µm) for the faster migration of ions, and

113
there is less resistance from the monolith. The monolith aims to work as a barrier to
allow only ions to pass through it; therefore, it should be as small as possible to ensure
easier migration and integration with separation in the following step. Furthermore, it is
easier to prepare, allowing for the possibility to measure the current in the capillary,
which helps to optimise conditions.
5.3.1 Experimental
The system shown in Figure 3-11 (section 3.5.2) illustrates reservoir A, which contains
buffer and an anion mixture and reservoir B, which contain buffer. The anion should
migrate from reservoir A (sample reservoir) to reservoir B (destination reservoir)
through a potassium silicate monolith.
A solution of 1 mM sodium nitrite was prepared in 10 mM of phosphate buffer, as the
buffer should keep the monolith wet enough to allow for a conductive environment on
the side of reservoir A (and at this stage, the proposed design of the total integrated
system of sample introduction and separation should use one buffer for both parts). 300
µl of this solution was placed in reservoir A and 300 µl phosphate buffer in the
destination reservoir (B). 10 V was applied directly to both reservoirs, with the running
times of 10, 20 and 30 minutes.
The reason for decreasing the voltage and time significantly is that the potassium
silicate monolith in this set-up is smaller than the one used earlier in the glass chip.
Timing was also decreased for these reasons, and because the target is to measure ions
in the shortest possible time, meaning that the extraction time should be short.
Nevertheless, the voltage and timing were investigated and optimised in this section of
the research.

114
5.3.2 Results and discussion
Poor migration of the anions was observed in this work. The amount of solution in
reservoir A increased dramatically during the experiments; this was observed by
marking the volume level in the reservoirs. This was noticeable during the experiment
for two reasons: the EOF (see section 2.3.3), which was causing the bulk solution to
move towards the cathode in reservoir A; and the bubble formation in the system,
which was also visual as it stopped the conductivity of the system, even after decreasing
the applied voltage. Both issues will affect the extraction process and will definitely
affect the reproducibility of the analysis, which would eventually lead to incorrect
results.
The surface of the monolith and the glass has a negative charge due to the silanol group
at the surface of the silica (Si-OH), which might also exist as a Si-O- group.
[131] This is
because both the surface of the monolith and the glass capillary might interfere with the
same charge of anions, and create an EOF in the system. This might have a significant
impact on the migration of anions from reservoir A to reservoir B.
5.4 Silanisation of glass capillary for ion extraction
Because of effect of EOF on the capillary, which affects the migration of anions, a
silanised glass capillary is used to enhance the migration. The silanisation suppresses
electroosmotic flow (EOF), which was present in the glass capillary because of the
negative charge on the hydroxyl group (OH-) of the glass surface.
Three approaches were investigated as a possible silanisation technique to suppress the
EOF. The first approach was a silanised glass capillary with trichloro perfluorooctyl
silane (FDTS). The second approach was a silanised glass capillary with a commercial

115
coating, and the third approach was a silanised glass capillary with an end-cap
procedure.
5.4.1 Experimental
5.4.1.1 Silanisation procedure
5.4.1.1.1 Silanisation procedure with trichloro perfluorooctyl silane (FDTS)
The capillary (containing a potassium silicate monolith) was dried in the oven and then
flushed for 5 minutes at a flow rate of 5 µl/min with a silanisation reagent (1ml iso-
octane + 145 µl trichloro perfluorooctyl silane [FDTS]).[202]
It was then washed with
iso-octane, acetone and water, respectively, before being dried at 60ºC overnight.
5.4.1.1.2 Silanisation procedure with a commercial coating
For silanisation, the capillary (which contained a potassium silicate monolith) was
flushed for 5 minutes at a flow rate of 5 µl/min with a silanisation reagent (SafetyCoat
Nontoxic Coating, Ultrapure Bioreagent, J.T. Baker, US) to block the charge on the
silanol group on the surface. The capillary was then dried in an oven for 24 hours at
90oC, prior to use.
5.4.1.1.3 Silanisation with an end-cap procedure
The end-cap procedure used was 1 g of trimethylchlorosilane in 10 ml toluene. This
mixture was flushed through the capillary for two hours in order to block unreacted
silanol on the capillary wall and the monolith surface. It was then flushed with toluene,
and then with methanol using a syringe pump for 30 minutes. Finally, the capillary was
placed in an oven for 16 hours at 90˚C, prior to use.[193]

116
5.4.2 Experimental set-up and conditions
To examine the EOF suppression of each silanisation method, the capillary was placed
in the same set-up described in section 3.5.2. Reservoir A contained a buffer and 0.58
µg chloride, and reservoir B contained only a phosphate buffer. The level of liquid was
marked; therefore, if the level were to increase in reservoir A then this would be due to
EOF. A voltage of 100 V was applied for one hour.
5.4.2.1 Experimental set-up and conditions for silanisation with FDTS and
silanisation with an end-cap procedure
The same set-up described in section 3.5.2 on Ion extraction through a potassium
silicate monolith in a glass capillary, was used. Reservoir A contained a 300 µl solution
of 20.7 µg sodium nitrite (or an anion mixture in end-cap silanisation), and reservoir B
contained a 300 µl phosphate buffer. The voltage applied was 10-100 V and the running
time was 10-30 minutes.
5.4.2.2 Experimental set-up and conditions for silanisation with a commercial
coating
The buffer used in this step was changed from a phosphate buffer to a MES/His buffer,
as this is more suitable for the separation of ions. The MES/His buffer (pH 6) is a well
known buffer in the separation of ions in CE with C4D, as it has good stability under
different conditions.[203]
[149]
In addition, the previously used phosphate buffer would interfere with other anions, and
phosphate itself is one of the anions of interest in this work, which would make the use
of a phosphate buffer undesirable.
Two different conditions were examined for ion extraction on a silanised glass capillary:

117
Reservoir A contained 25 µl anion mixture + 150 µl buffer (10 mM, MES/His), and
reservoir B contained 200 µl buffer. The running time was 30 minutes and the voltage
applied was 500 V.
Reservoir A contained 50 µl anion mixture + 150 µl buffer (10 mM, MES/His), and
reservoir B contained 200 µl buffer. The running time was 10 minutes and the voltage
applied was 1000 V.
5.5 Results and discussion
5.5.1.1 Silanisation with FDTS
The extraction of nitrite through a potassium silicate monolith with a silanised capillary
with FDTS, was investigated.
Figure 5-10: Chromatogram of solution in reservoir A, containing 1 mM phosphate buffer and 1
mM sodium nitrite, before the experiment

118
Figure 5-10 shows a chromatogram consisting of two main peaks. The first peak
retained at 3.960 minutes; this peak is the nitrite peak, representing the amount of nitrite
in reservoir A. The second peak retained at 5.693 minutes; this is the phosphate peak,
representing the amount of phosphate in the buffer.
Figure 5-11: Chromatogram of solution in reservoir B, which originally contained 1 mM
phosphate buffer. The voltage applied was 10 V, and the run time was 10 minutes
Figure 5-11 shows a chromatogram of reservoir B after applying a voltage. The
chromatogram demonstrates a peak that retained at 5.690 minutes, which is phosphate
from the buffer.
From the chromatogram in Figure 5-10, it can be noticed that nitrite was present in
reservoir A; nitrite should migrate from reservoir A to reservoir B. Figure 5-11 shows
that there was no presence of nitrite, which means that it did not migrate under these
conditions (10 V, 10 minutes); therefore the conditions were changed in order to

119
enhance the extraction of nitrite. Different voltages were applied between 10 and 100 V,
and different running times were also tested; unfortunately no progress was observed.
However, the results obtained using this method were not surprising, because during the
examination of the capillary for EOF suppression (see experimental section 5.4.1), the
level of liquid in both reservoirs changed significantly, especially when the voltage was
increased. Furthermore, the amount of bubbles generated in the capillary was very
obvious. The liquid in the capillary looked like a layer of oil due to the very high
hydrophobicity of the capillary, owing to the silanisation method used in this part. The
reason for continuing to work on the experiment despite these obvious problems was
that the capillary might needed further conditioning with plenty of water after the
silanisation process was complete and prior to running the extraction experiment. The
conductivity of the system was measured before and after the capillary was washed with
water, and it increased significantly after washing the capillary with water.
This method of silanisation was not ideal, as its main purpose was to supress the EOF in
the capillary, but EOF still has an impact on the extraction process. Furthermore,
bubbles in the capillary were accumulated during the experiment, which might have
stopped the conductivity and eventually stopped the migration of nitrite from reservoir
A to reservoir B. In addition, adding more water to condition the capillary would form
small particles as a result of the silanisation reagents containing water.[202]
This might
have already happened but was not visual enough to notice, and it could be the reason
behind the formation of bubbles in the system.
5.5.1.2 Silanisation with a commercial coating
In order to supress the EOF in the capillary, another silanisation method was used to
avoid the problems associated with the previous silanisation method (see

120
section 5.5.1.1). This method uses a commercial silanisation reagent. The process was
easier than the previous method and it should not react with water. Also, the
hydrophobicity of the silanisation should not be very high.
The number of anions in the reservoir A sample were increased to more anions, in order
to investigate their movement before the separation step.
Figure 5-12: Percentage of migrated anions through a silanised glass capillary. 25 µg of each
anion in reservoir A was spiked with 10 mM of MES/His buffer. The voltage was 500 V and the
running time was 30 minutes. The number of experiment was three.
Figure 5-12 shows the percentage of migrated anions through a silanised glass capillary.
From the graph, it can be noticed that about 5% fluoride, 10% chloride, 4% phosphate,
2% nitrite and 5% sulphate out of 25 µg was migrated from reservoir A to reservoir B.
Chloride has the highest percentage (10%) and nitrite has the lowest (2.1%). These
results demonstrate a successful extraction of the anions, with a variation in the values
of migration from reservoir A to reservoir B. The calculation used the percentage of
0.00
2.00
4.00
6.00
8.00
10.00
12.00
14.00
fluoride chloride phosphate nitrite sulphate
pe
rce
nta
ge %
Anion

121
migration, as it demonstrates the mass balance more clearly than showing the original
and extracted amounts of ions.
However, considering the initial amount in reservoir A, the result is very small and
barely enough for the purpose. These results might suffer from reproducibility because
of the bubble generation in the capillary that was noticeable after 10 minutes of each
run, as the current in the capillary dropped dramatically and suddenly stopped just after
10 minutes. Therefore, less experimental time to 10 min and a higher voltage, might
improve the results. Also, the amount of anions in reservoir A should be increased in
order to investigate the concentration effect. Therefore, the next experiment was
modified, with the time reduced to 10 minutes, the voltage increased to 1000 V, and the
concentration in reservoir A increased to 50 µg of each anion.
Figure 5-13: Percentage of migrated anions through a silanised glass capillary. 50 µg of each
anion in reservoir A was spiked with 10 mM of MES/His buffer. The voltage was 1000 V and the
running time was 10 minutes. There were three experiments.
0
5
10
15
20
25
fluoride chloride phosphate nitrite sulphate
pe
rce
nta
ge
Anion

122
Figure 5-13 shows the percentage of migrated anions through a silanised glass capillary.
From the graph, it can be observed that about 7% fluoride, 18% chloride, 17%
phosphate, 3% nitrite and 17% sulphate, out of 50 µg, was migrated from reservoir A to
reservoir B. Chloride has the highest percentage (85.48%) and nitrite has the lowest
(3.22%). These results demonstrate a successful extraction of anions, with a variation in
the values of migration from reservoir A to reservoir B.
The results in Figure 5-13 demonstrate good progress and better results than the results
in Figure 5-12, with a similar variation in the values of migration. This improvement
was due to the changes in conditions by increasing the voltage and the concentration, as
well as the running time. This was expected, but needed further investigation, especially
with regards to the generation of bubbles in the capillary. This problem might be
overcome by manipulating the conditions, especially the length of the capillary and the
timing. Therefore, the same experiment was run with a 5 cm long capillary that
contained a 5 mm monolith, and was silanised as described earlier in the experimental
section (5.4.1.1.2). The running time was shortened to 3 minutes, the voltage remained
at 1000 V, and reservoir A contained three different concentrations: 10, 20 and 30 µg.

123
Figure 5-14: Percentage of migrated anions through a 5 cm long silanised glass capillary. 10, 20
and 30 µg of each anion in reservoir A was spiked with a 10 mM MES/His buffer, with a running
time of three minutes
Figure 5-14 shows the percentage of migrated anions through a silanised glass capillary,
with three different concentrations of anion in reservoir A. From the graph, it can be
observed that fluoride has the highest percentage of migration from reservoir A to
reservoir B, with 10 µg (48%), before decreasing to 20 µg (around 35%) and continuing
to decrease to less than 20%, with 30 µg. Chloride maintains the second highest
percentage (just above 10%), with 10 µg, before it jumps to 24% with 20 µg and
decreases to less than 5%. Phosphate decreased following a trend similar to fluoride but
with a much lower percentage than 10%. Nitrite had the lowest percentage, with slightly
similar numbers for the three conditions. Finally, sulphate behaved differently to
fluoride and phosphate, increasing to about 6%, 7% and 20% for 10, 20 and 30 µg,
respectively. The details of the data used in Figure 5-14 are presented in Table 5-1.
0.00
10.00
20.00
30.00
40.00
50.00
60.00
fluoride chloride phosphate nitrite sulphate
Pe
rce
nta
ge o
f m
igra
tio
n
Anion
10 µg
20 µg
30 µg

124
Table 5-1: Percentage of migrated anions through a 5 cm long silanised glass capillary
Anion concentration in reservoir A % anion extracted
Fluoride Chloride Phosphate Nitrite Sulphate
10 µg 49.10 11.58 6.60 2.61 6.52
20 µg 34.42 23.75 5.03 2.66 7.09
30 µg 18.05 2.08 1.76 2.05 19.82
Figure 5-14 and Table 5-1 show the percentage of migrated anions through the silanised
potassium silicate monolith in a glass capillary, using the commercial silanisation. The
suppression was successful, extraction of the anion through the monolith was good, and
the amount of migrated anions noticeably increased. However, the migration
percentages are random and demonstrate the unsystematic behaviour of anions, which is
slightly surprising. For example, the fluoride percentage is the highest at the smallest
concentration in reservoir A, and the chloride percentage is the highest at 20 µg
(23.75%) and lowest at 30 µg (2%). Unfortunately this makes the extraction
uncontrollable, which is most likely due to the bubble formation in the capillary.
Furthermore, the high hydrophobicity of the capillary surface makes the extraction more
uncontrollable, because the hydrophobicity of the glass causes the accumulation of
bubbles in the capillary that delays and eventually stops the anion movement.
Despite the hydrophobic surface, anions were moving towards reservoir B. This
indicates very promising extraction but needs to be easily controlled, in order to ensure
reproducible results. Thus, to overcome this problem, a less hydrophobic surface is
required, meaning that another silanisation method is necessary.

125
5.5.1.3 Silanised glass capillary with an end-cap procedure
In order to enhance the migration of anions through a potassium silicate monolith, end
capping was used. End capping is a secondary bonding step used to cover silanol on the
silica surface. It is a well-known technique in high-performance liquid chromatography
HPLC columns, in which end-capped packing materials eliminate unpredictable,
secondary interactions on the column surface.
Table 5-2: Table of migrated anions in an end-capped glass capillary and the monolith
Anion Fluoride Chloride Phosphate Nitrite Sulphate
% of migration (µg)
0.000838 0.000896 0.622933 0 0.00082
0.0025 0.00221 0 0.001 0.00222
0.001 0.00025 0 0 0.000532
Mean 0.001446 0.001119 0.207644 0.000333 0.001191
Table 5-2 shows the percentage of migrated anions. The experiment was repeated three
times to ensure the reproducibility of results. The table shows the triplicate in
percentages and then the average of the percentage of each anion.
However, it can be seen that the percentage of migrated anions is very small, under 0.5
in all triplicates; even phosphate, which has the highest number (0.6%), is perhaps too
small to consider as a migration. The reason for this low value could once again be the
EOF that is still affecting the migration of anions.
5.6 Chapter conclusion
In conclusion, anion extraction through a potassium silicate monolith in a glass capillary
was performed, because it has good characteristics for the extraction of ions: a
potassium silicate monolith can be easily formed into a desired shape; the surface can be

126
chemically modified; the pore size can be modified; and it can be made physically strong.
Therefore, extraction of inorganic ions can be performed in a silica monolith, for pre-
concentration and pre-treatment prior to separation. However, experiments on the bare
silica capillary showed poor results due to the interference of the negative charge on the
surface of the glass and the monolith causing EOF. Therefore, the surface needed to be
silanised. Three different silanisation methods were investigated: ion extraction on a
silanised glass capillary with trichloro perfluorooctyl silane (FDTS); ion extraction with
a silanised glass capillary with a commercial coating; and ion extraction with a silanised
glass capillary with an end-cap procedure. Different factors in the extraction were
investigated, including applied voltage and the time of extraction.
The results of the extraction with FDTS were less successful than the other methods, as
there was noticeable EOF during the extraction process. A commercial silanisation
reagent was used to overcome the EOF problem. This shows very promising results but
they were irreproducible and difficult to control. This might have been caused by the
high hydrophobicity of the capillary surface, which makes the extraction more
uncontrollable as the hydrophobicity of the glass causes the accumulation of the bubbles
in the capillary that delays and eventually stops the anion movement. The end-capping
procedure as a silanisation method was also investigated, and it showed much less
results than the extraction with the commercial reagent method. The percentages of
anion extraction were very small, under 0.5% in all triplicates. The reason for these low
values could once again be due to the EOF affecting the migration of anions.
In general, the extraction with a potassium silicate monolith could be enhanced by using
a polymer capillary rather than a glass capillary. This was already attempted but it was
practically hard to keep the monolith in place. Further investigation of a different design
is required; such a design would be in a suitable polymer chip, for example, to avoid the

127
EOF. The system might include the potassium silicate monolith as the main extraction
part, as it has already shown promising results.

128
6 Electrodialysis (ED) for sample introduction
A combination of electrodialysis ED and electrophoresis CE was investigated, for the
rapid pre-treatment and subsequent determination of inorganic cations in river water
samples. A combination of ED with CE will improve the analytical performance of ion
separation by keeping only ions in the separation channel (see section 2.3.4.1 for more
details).
6.1 Ion extraction through Polytetrafluoroethylene (PTFE)
film and Parafilm
To increase the extraction performance, a plastic tube was used instead of a glass
capillary in order to avoid the associated problems such as the silanisation process and
the EOF. The surface of plastic does not have any charges that would interfere with ions
during the extraction process. Also, PTFE was used as a membrane rather than using a
potassium silicate monolith, to gain better mass transfer. PTFE is highly hydrophobic
and has a high melting point (about 327˚C), which makes it highly stable in harsh
environments and hard to dissolve. PTFE membrane techniques have been widely used
to isolate gas and liquid in solutions.[204]
Parafilm is a polymer film used for a variety of applications such as sealing or
protecting vessels (such as flasks or cuvettes). It is flexible, waterproof, partly
transparent and has the ability to be deformed and stretched without losing
toughness.[205]
Parafilm has been used in scientific research and laboratories for
years.[206]
Since Parafilm is a moisture-resistant polymer,[207]
it was investigated as a
possible membrane that would only allow ions to pass through under the influence of
voltage.

129
6.1.1 Experimental
For anion extraction, a 10 mM MES/His buffer was used and the conditions examined
were: reservoir A contained 25 µl anion mixer + 150 µl buffer; and reservoir B
contained a 200 µl buffer. The running times were 5 and 2.5 minutes and the voltage
applied was 200 V. The set-up has been explained in section 3.5.3.
For cation extraction, the buffer was 5 mM MES/His (the concentration of the buffer
was decreased from 10 mM in anion extraction to 5 mM in cation extraction, as the
conductivity in the system was improved in cation extraction), and the cation standard
solution was used as a sample (cation standard 1 for IC, purchased from Sigma Aldrich,
UK). The solution consisted of 200 mg/L each of sodium, potassium and 1,000 mg/L
calcium.
The system set-up was described in Figure 3-13 and in section 3.5.4, whereby the PTFE
was wrapped around the top screw part of the fitting to seal the bottom of it and then
screwed back to form the sample reservoir. The sample reservoir contained 30 µl of the
cation standard and 500 µl of buffer, and the destination reservoir contained only buffer.
The voltage applied was 100 V for 5 minutes.
6.1.2 Results and discussion
In anion extraction, the conductivity in the system was measured prior to any
experiment in this section ((section 3.5.3) extraction of anion by PTFE and Parafilm).
Most of the time, the conductivity in the system was very low and at times the system
was not conductive. Therefore, it was practically hard to establish a conductive
environment in the sample reservoir that allowed anions to form electrolytes in the
solution.

130
This might be why this method was not successful; there was no migration of anions
from reservoir A to reservoir B. This could result from the resistance of the PTFE film
or the Parafilm, due to the high hydrophobicity of the films. It also could be a result of
the set-up, as it was difficult to ensure that the solution reached the bottom end of
reservoir A (see Figure 3-12), which led to no conductivity in the system.
Initially, the ED system was used to investigate the extraction of anions but the IC was
not operated for a period of time; this had to be carried on with cations. Thus, in order
to investigate the movement of ions through the PTFE membrane, an ED system was
used. One of the problems of the previous system was that it was hard to establish a
conductive environment within the system; therefore, the set-up was changed to a better
system (see section 3.5.4) with a larger reservoir whereby it was practically easier to
ensure the wettability of the membrane, and the conductivity could be investigated
further.
Figure 6-1: Percentage of cations migrated through PTFE film, with a running time of 5 minutes
and an applied voltage of 100 V. The cation sample was a cation standard solution consisted of
200 mg/L each of sodium, potassium and 1,000 mg/L calcium.
0.00
0.50
1.00
1.50
2.00
2.50
3.00
3.50
Ca Mg K Na
% c
atio
n m
igra
tio
n
cation

131
Figure 6-1 shows the migration percentages of four cations (calcium, magnesium,
potassium and sodium) through a PTFE membrane in the ED system. Sodium had the
highest percentage of migration with 3.6 µg out of 122 µg (about 3%), followed by
potassium with 1.97% (4.2 out of 212.4 µg), and calcium with 1.94% (5 out of 256.3
µg). Magnesium had the lowest migration percentage of 1% (1.7 out of 163 µg).
The results demonstrated the extraction of cations through the PTFE membrane, and the
improved set-up was successful. However, the migration percentage was low and
needed enhancing; this could perhaps be achieved through decreasing the membrane
thickness by stretching it further.
Figure 6-2: Percentage of cations migrated through stretched PTFE film, with a running time of 5
minutes and an applied voltage of 100 V. The cation sample was a cation standard solution
consisted of 200 mg/L each of sodium, potassium and 1,000 mg/L calcium.
Figure 6-2 shows the migration percentages of four cations (calcium, magnesium,
potassium and sodium) through a stretched PTFE membrane in an ED system. A
running time of 5 minutes was the proposed maximum extraction time, and it was used
here to allow for the best possible migration of ions. 100 V was the maximum voltage
0.00
1.00
2.00
3.00
4.00
5.00
6.00
7.00
Ca Mg K Na
% o
f ca
tio
n m
igra
tio
n
cation
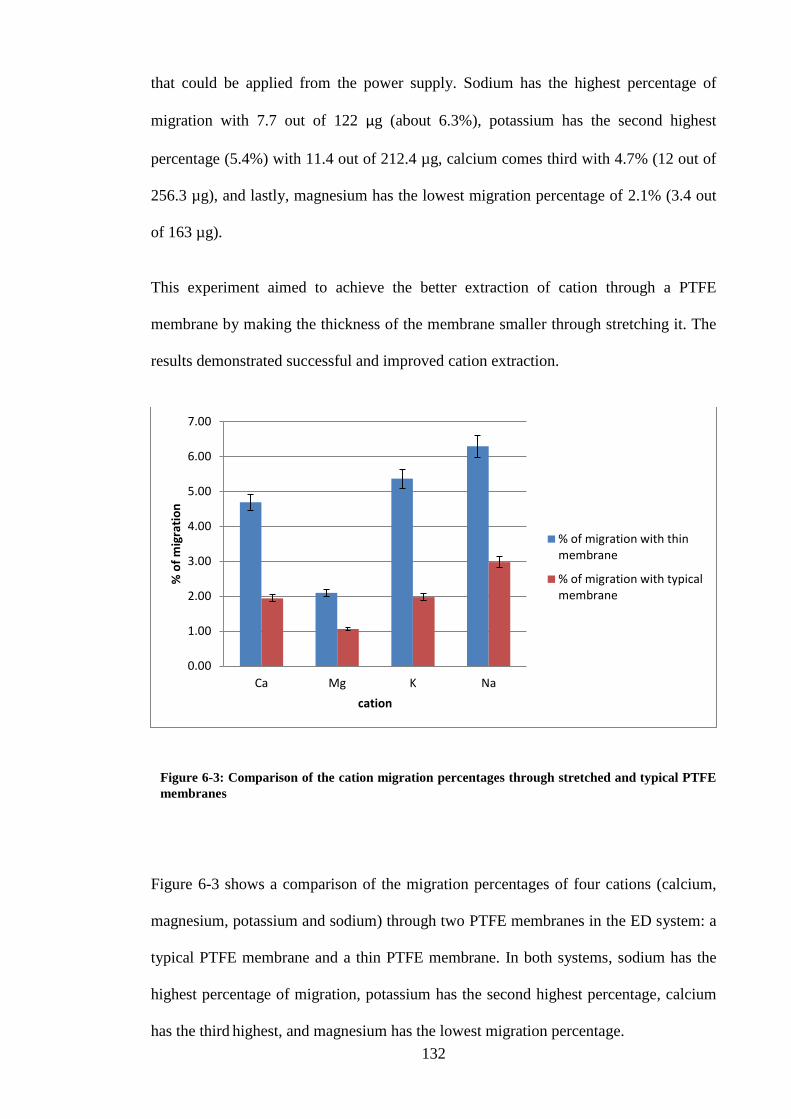
132
that could be applied from the power supply. Sodium has the highest percentage of
migration with 7.7 out of 122 µg (about 6.3%), potassium has the second highest
percentage (5.4%) with 11.4 out of 212.4 µg, calcium comes third with 4.7% (12 out of
256.3 µg), and lastly, magnesium has the lowest migration percentage of 2.1% (3.4 out
of 163 µg).
This experiment aimed to achieve the better extraction of cation through a PTFE
membrane by making the thickness of the membrane smaller through stretching it. The
results demonstrated successful and improved cation extraction.
Figure 6-3: Comparison of the cation migration percentages through stretched and typical PTFE
membranes
Figure 6-3 shows a comparison of the migration percentages of four cations (calcium,
magnesium, potassium and sodium) through two PTFE membranes in the ED system: a
typical PTFE membrane and a thin PTFE membrane. In both systems, sodium has the
highest percentage of migration, potassium has the second highest percentage, calcium
has the third highest, and magnesium has the lowest migration percentage.
0.00
1.00
2.00
3.00
4.00
5.00
6.00
7.00
Ca Mg K Na
% o
f m
igra
tio
n
cation
% of migration with thinmembrane
% of migration with typicalmembrane

133
The amounts of migrated cations were approximately doubled with the thinner
membrane, but the amount of migrated potassium more than doubled. The thinner
membrane provided a better result, which was expected, as there would be less
resistance and less interaction between the ions and the membrane, allowing for
migration through the membrane.
These results are still quite low; however, this could be improved by further
optimisation, such as a higher voltage or more running time. The problem, however,
was that the membrane would not tolerate a high voltage for a long time as the heat
produced would damage the membrane or at least affect the results; therefore, the
membrane has to be changed regularly to maintain reproducible results. Even with a
different new membrane, the reproducibility might be affected, as the stretched
membrane that provided the better results was stretched through a manual procedure
that caused irreproducibility, which is not ideal for long-term monitoring. A stronger
and more reliable membrane was needed for water monitoring, which could cope with
the high voltages.
In conclusion, the PTFE membrane and Parafilm are not ideal for long-term monitoring;
it might work for a period of time, for less continuous applications.
6.2 Ion extraction with a cellulose acetate (CA) electrodialysis
(ED) membrane
Dialysis membranes are widely used and a cellulose acetate seems to be suitable as a
membrane material because of it is: cost-effective; relatively easy to manufacture;
practically easy to handle; non-toxic; a renewable resource of raw material; and has
high salt-rejection properties.[208]
It has been widely used in water research due to its

134
unique properties.[209]
Cellulose acetate membrane has been used in this work for its
physical strength and chemical convenience in ED applications.
6.2.1 Anion extraction with a cellulose acetate (CA) membrane in a
commercial ED cell
6.2.1.1 Experimental
The experiment was carried out using a 500 µl mixed anion solution (1 g/L) in the
sample reservoir, and 500 µl of 5 mM MES/His buffer was placed in the chamber,
which was the destination reservoir. A voltage of 10-100 V was applied for 1, 5 and 10
minutes. The system set-up has been explained in section 3.5.4.
6.2.1.2 Results and discussion
The extraction of anions through the cellulose acetate membrane was not successful,
even after changing the voltage and the extraction time. Looking at the cellulose
chemical structure, the problem can be addressed (see Figure 6-4). The presence of
oxygen in the chemical structure of the cellulose acetate membrane would affect the
migration of anions because this oxygen is partially negative, which repels anions away
from the membrane; this means that the use of a cellulose acetate membrane in the
electrodialysis system is not ideal for anion extraction.
Figure 6-4: The chemical structure of a cellulose acetate

135
6.2.2 Cation extraction with a CA membrane in the commercial ED
cell
6.2.2.1 Experimental
The cation solutions were prepared from the chloride salts of calcium and potassium,
but the magnesium was prepared from magnesium sulphate (all analytical grade and
purchased from Fisher Scientific, UK). The concentration was 1 mM for each salt.
Initially, the first experiment was carried out using a cation mixture, whereby a 500 µl
cation mixture (Ca++
, Mg++
and K+) was inserted into the sample reservoir and 500 µl of
MES/His buffer was placed in the chamber that was the destination reservoir. A voltage
of 100 V was applied for 10 minutes. The system set-up has been explained in
section 3.5.4.
6.2.2.2 Results and discussion
Figure 6-5: Percentage of cations migrated through a cellulose acetate membrane with 100 V
applied for 10 minutes. Extractions of 124.74 µg out of 1100 µg calcium chloride, 17.66 µg out of
745.5 µg potassium chloride, and 9.24µg out of 1200 µg magnesium sulphate, were migrated from
the sample reservoir to the destination reservoir
0.00 2.00 4.00 6.00 8.00 10.00 12.00 14.00
Ca
Mg
K
percentage of migration
cati
on
s

136
Figure 6-5 shows the migration percentages of three cations (potassium, magnesium and
calcium) through the membrane. Calcium has the highest migration percentage,
11.34%, while potassium has a lower percentage of 2.37% and magnesium has the
lowest migration percentage of approximately 0.77%.
This result is promising, demonstrating the successful extraction of cations through a
cellulose acetate membrane. However, the amount of migrated cations is still small and
requires further optimisation to enhance the extraction. For instance, the voltage was
slightly high and caused the generation of bubbles in the reservoir, which was probably
due to the electrode position in the reservoir (the electrodes were directly facing each
other; see Figure 3-13 ). Also, the running time needs to be reduced, as the process of
extracting ions should be within 5 minutes, in the total integrated system.
6.2.2.3 Optimisation of cation extraction through a cellulose acetate membrane
Optimising the conditions for cation extraction through a cellulose acetate membrane,
would allow for better investigation of the issues that might affect the extraction. These
issues include the extraction time, the voltage applied, the suitability of the buffer and
the set-up materials. Initially, timing and voltage were optimised.
6.2.2.4 Results and discussion
In order to optimise the extraction, the voltage was fixed at 100 V and different timings
were examined: 30 seconds and 1, 2, 3, 4, and 5 minutes. Also, to optimise the timing of
the extraction, the timing was fixed at 5 minutes and different voltages were examined,
from 10 V to 100 V. The same set-up mentioned in section 3.5.4 was used; the buffer

137
was 5 mM MES/His, and the cation standard solution contained 200 mg/L potassium
and magnesium, and 1,000 mg/L calcium.
Figure 6-6: Optimisation of extraction time through a cellulose acetate membrane, with 5 mM
MES/His and cation standards
Figure 6-6 shows the changes in the amount of migration during different timings, from
1 to 10 minutes. The percentage of migration started from less than 1% for all of the
cations and then gradually increased until it reached 5 minutes, after which it levelled
off for all cations except for sodium, which carried on increasing to more than 6% at 10
minutes. In general, sodium has the highest percentage of migration and magnesium
noticeably has the lowest, which requires further investigation. However, the level of
migration increased along with the increase in time from 1 to 10 minutes. The average
level of migration is slightly low, less than 6%, but the aim of this optimisation step is
to examine the behaviour at different timings, with further investigation to follow later
in this work, to enhance the migration.
0
1
2
3
4
5
6
7
8
1 2.3 5 10
% o
f m
igra
tio
n o
f ca
tio
n
Time/min
Ca
Mg
K
Na

138
Figure 6-7: Optimisation of voltage applied to the reservoir in the extraction of cations through a
cellulose acetate membrane, with 5 mM MES/His and cation standards
Figure 6-7 demonstrates the cation behaviour during extraction through a cellulose
acetate membrane with different voltages. The figure showing the changes of voltages
versus the percentage of migration, the migration levels of in the graph between 10 to
50 V, and it dropped at 50 V, which was surprising and could be due to the bubble
formation on the reservoir at that particular point. Nevertheless, the percentage
noticeably increased again after 50 V to the highest value, except for magnesium and
calcium, whose percentages levelled off up to 70 V and then increased at 100 V.
The cation behaviour with different voltages should gradually respond to the increasing
voltage, but this only occurred at 70 V onwards, at high voltages. The problem with a
high voltage is the production of bubbles in the reservoir, which might affect the
0
1
2
3
4
5
6
7
10 20 30 40 50 70 100
% o
f m
igra
tio
n
Voltage/ V
Na
K
Mg
Ca
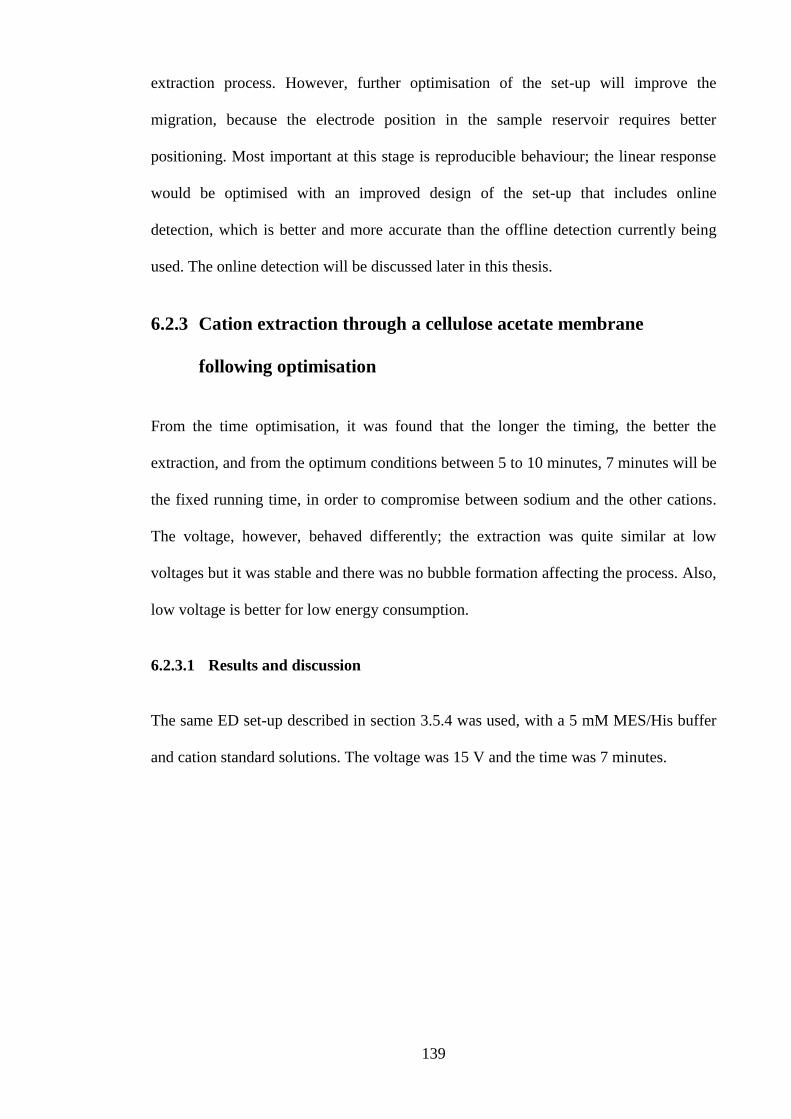
139
extraction process. However, further optimisation of the set-up will improve the
migration, because the electrode position in the sample reservoir requires better
positioning. Most important at this stage is reproducible behaviour; the linear response
would be optimised with an improved design of the set-up that includes online
detection, which is better and more accurate than the offline detection currently being
used. The online detection will be discussed later in this thesis.
6.2.3 Cation extraction through a cellulose acetate membrane
following optimisation
From the time optimisation, it was found that the longer the timing, the better the
extraction, and from the optimum conditions between 5 to 10 minutes, 7 minutes will be
the fixed running time, in order to compromise between sodium and the other cations.
The voltage, however, behaved differently; the extraction was quite similar at low
voltages but it was stable and there was no bubble formation affecting the process. Also,
low voltage is better for low energy consumption.
6.2.3.1 Results and discussion
The same ED set-up described in section 3.5.4 was used, with a 5 mM MES/His buffer
and cation standard solutions. The voltage was 15 V and the time was 7 minutes.
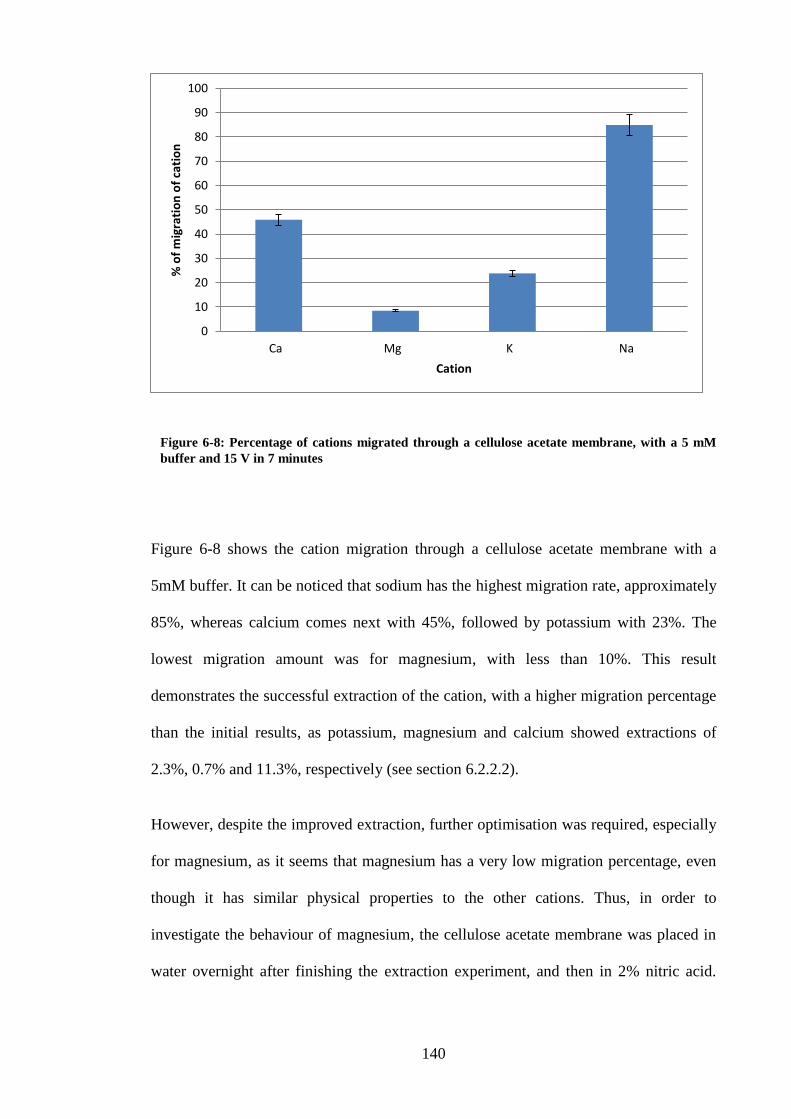
140
Figure 6-8: Percentage of cations migrated through a cellulose acetate membrane, with a 5 mM
buffer and 15 V in 7 minutes
Figure 6-8 shows the cation migration through a cellulose acetate membrane with a
5mM buffer. It can be noticed that sodium has the highest migration rate, approximately
85%, whereas calcium comes next with 45%, followed by potassium with 23%. The
lowest migration amount was for magnesium, with less than 10%. This result
demonstrates the successful extraction of the cation, with a higher migration percentage
than the initial results, as potassium, magnesium and calcium showed extractions of
2.3%, 0.7% and 11.3%, respectively (see section 6.2.2.2).
However, despite the improved extraction, further optimisation was required, especially
for magnesium, as it seems that magnesium has a very low migration percentage, even
though it has similar physical properties to the other cations. Thus, in order to
investigate the behaviour of magnesium, the cellulose acetate membrane was placed in
water overnight after finishing the extraction experiment, and then in 2% nitric acid.
0
10
20
30
40
50
60
70
80
90
100
Ca Mg K Na
% o
f m
igra
tio
n o
f ca
tio
n
Cation

141
The water was then analysed using the ICP-AES, to find out if magnesium was trapped
in the membrane more so than the other cations.
Table 6-1: The concentration of cations trapped in the cellulose acetate membrane after
experiments
Cation Ca Mg K Na
Concentration in the membrane/ µg 1.78 8.28 0.86 2.36
Table 6-1 shows the amount of ions trapped in the cellulose acetate membrane.
Magnesium has the highest amount of cations trapped in the membrane (8.3 µg), with
the second highest amount for sodium (2.3 µg), followed by calcium (1.8 µg). Finally,
the lowest amount was for potassium, with less than 1 µg.
It can be noticed from the table that the amount of magnesium in the membrane is four
times higher than the other cations. This is expected, and explains the low percentage of
magnesium migration through the membrane.
In order to improve the extraction of cations through a cellulose acetate membrane, the
amount of cations trapped in the membrane has to be quickly released during the run
time. One approach investigated was the addition of acid to the buffer, as acid can
chemically help in speeding up the extraction process. Nitric acid was used earlier to
examine the amount trapped in the membrane, but nitric acid might have a severe effect
on the polymer set-up used in this section.[210]
Acetic acid is weaker than nitric acid and
might be suitable for the set-up. Therefore, 5 mM of acetic acid was added to the
MES/His buffer to investigate the low migration of magnesium.

142
Figure 6-9: Percentage of cations migrated in 7 minutes at 15 V, with a 5 mM acetic acid buffer
Figure 6-9 shows the percentage of cation migration through a cellulose acetate
membrane with an acidified buffer. From the figure, it can be seen that sodium has the
largest migration, with more than 90%, calcium comes second, with more than 60%,
followed by potassium with 40%. The lowest percentage is for magnesium, with
slightly more than 20%. These results demonstrate progress after the addition of acid to
the buffer, whereby the general rate of migration has increased and improved.
0
20
40
60
80
100
120
Ca Mg K Na
% m
igra
tio
n o
f ca
tio
ns
Cations

143
Figure 6-10: The percentage of cations migrated through a cellulose acetate membrane, with two
different buffers, 5 mM MES/His and 5 mM MES/His + 5 mM acetic acid
Figure 6-10 shows the comparison of cation migration through a cellulose acetate
membrane between two buffers: the MES/His buffer and the acidified MES/His buffer.
The individual buffers have been discussed earlier (Figure 6-9 and Figure 6-8).
Nevertheless, sodium has the highest percentage in both buffers, increasing from 84%
to 97%. Calcium has also increased, from 45% to 62%, and potassium from 23% to
39%. The lowest migration is again for magnesium, from 8% to 21%. This shows the
progress made with the acidified buffer, but that magnesium still has the lowest
migration percentage. The acid has increased the general rate of migration but greater
control over the extraction of magnesium is required. However, the separation system
used in this work contains a PMMA chip, which was severely affected when the acetic
acid buffer was used for the separation step; therefore, the use of this buffer will not be
beneficial for future use, and the use of the MES/His buffer without acetic acid,
although working, needs further optimisation.
0
20
40
60
80
100
120
Ca Mg K Na
Pe
rce
nta
ge o
f m
igra
tio
n o
f ca
tio
n %
Cation
Buffer
acedified buffer

144
Another issue that might affect extraction when using this system is the accumulation of
unwanted white solid materials at the phase interfaces of the membrane or on the
electrode surface (fouling). This issue is one of the major problems regarding
electrodialysis.[180]
Calcium in particular is most likely to form calcium oxide or
calcium hydroxide on the surface of the electrode. The calcium composition in a
solution in the operation of electrodialysis will affect the migration kinetics of the
cations, as will the composition of cations in the sample.[211]
The fouling problem with regards to the electrodialysis system might be solved through
the continuous movement of the fluid in the system. This could protect the electrodes
and membranes from the accumulation of this solid material, and also clean the system
between runs, removing the leftover material from previous runs. Therefore, another
design for the ED system is preferable, in order to avoid fouling and ensure the better
positioning of the electrodes.
6.3 Ion extraction with glass and cyclic olefin copolymer
(COC) chips with a flat carbon electrode
Initially, work began with a glass chip (Figure 3-15), but there was a severe problem
with sealing the membrane in the chip. Furthermore, there was another serious problem
with the EOF, and so work had to stop on the glass chip, and was carried on with the
COC chip.
In order to enhance the extraction of ions through the ED membrane to avoid the
problems associated with the system in the previous section (6.2), a new ED chip was
designed for the extraction. The design of the new chip should be more compatible with
the final, integrated total system that includes both parts (separation and sample
introduction).

145
The new chip material, COC polymer, was selected for the new chip design; COCs are
engineering thermoplastics with good, unique properties such as transparency, low
density that makes it light, withstanding relatively high temperatures, high rigidity, and
good surface hardness. The most important feature is that it can chemically stand
aqueous acids and bases[212]
; this is very good for the pH optimisation of the ED system.
6.3.1 Results and discussion
The system mentioned earlier (sections 3.5.5 and 3.5.6) was used. The voltages applied
were 10, 15, 50, and 100 V. The run times were 1, 3, 5 and 10 minutes, and the buffer
was 5 mM MES/His. The samples were anion and cation standard solutions.
There were problems with this design, which caused severe leaking. This was mainly
due to difficulties in sealing the electrode. There was also a problem with balancing the
pressure on either side of the membrane. To overcome all of these problems and
improve the system, another system was designed, which will be discussed in the
following section.
6.4 Ion extraction on a COC chip with a multi-membrane
The design is shown in Figure 3-19. In order to overcome the problems associated with
a cellulose acetate membrane for anion extraction, the possible formation of unwanted
materials in the system (fouling), and to control leakages in the system, the design in
section 3.5.7 was tested. In this new system, ion-exchange membranes were used rather
than the cellulose acetate membrane. Two types of membrane were examined: an anion-
exchange membrane for the extraction of anions and a cation-exchange membrane for
the extraction of cations. The electrode used was copper coated with gold and the
coating process has been described in section 3.6.1.

146
6.4.1 Results and discussion
The system in section 3.5.7 was mainly used for anion extraction, as the cellulose
acetate was not satisfactory for anion extraction (see section 6.2).
The buffer was 5 mM MES/His and the anion sample included the IC standard solutions
of fluoride, chloride, nitrate, phosphate and sulphate. The voltage applied was 100 V for
15 minutes, three times continuously. This involved a 5-minute run, before switching
off the voltage, collecting the results and filling the destination reservoir with buffer,
followed by another run of 5 minutes. This was repeated three times in order to collect
enough samples to be measured by the IC system and to concentrate the extracted anion.
When the voltage is applied, hydrogen ions will appear at the cathode, and oxygen ions
will appear at the anode. A reduction reaction takes place, with electrons (e−) from the
cathode being given to hydrogen cations, to form hydrogen gas (the half-reaction
balanced with acid):
Reduction at cathode: 2 H+
(aq) + 2e− → H2(g)
At the anode, an oxidation reaction occurs, generating oxygen gas and giving electrons
to the anode to complete the circuit:
Oxidation at anode: 2 H2O(l) → O2(g) + 4 H+
(aq) + 4e−
The same half reactions can also be balanced with base, as listed below:
Cathode (reduction): 2 H2O(l) + 2e− → H2(g) + 2 OH
-(aq)
Anode (oxidation): 4 OH- (aq) → O2(g) + 2 H2O(l) + 4 e
−

147
Combining either half-reaction pair yields the same overall decomposition of water into
oxygen and hydrogen:
Overall reaction: 2 H2O(l) → 2 H2(g) + O2(g)
The number of hydrogen molecules produced is therefore twice the number of oxygen
molecules. Hence, the electrode used has to be compatible with hydrogen production,
and gold and platinum are the best electrode materials,[213]
although a gold electrode has
less hydrogen production than platinum.[214]
This could be the reason behind the unsuccessful initial experiment with the copper
electrode; therefore, the copper electrode was coated with gold for better conductivity,
and the gold coating was mentioned earlier, in section 3.6.1.
Figure 6-11: The percentage of anion extraction with gold-coated electrodes. The buffer used was
5 mM MES/His and the anion concentration was 1 g/L of each anion.
6.61
4.59
6.38
3.67
0.01
0 1 2 3 4 5 6 7 8
Fluoride
Chloride
Nitrate
Sulphate
Phosphate
% of migration of anion
Am
ion

148
Figure 6-11 shows the percentage of anion extraction using the multi-membrane ED
chip with a gold coating on the copper electrode. The highest extraction was for
fluoride, with about 6.6%, followed by nitrate with 6.3%, chloride with 4.5%, and
sulphate with less than 4%. The lowest extraction was for phosphate, with 0.01%. This
shows that extraction was improved with the gold coating.
The extracted percentage was a relatively small amount and this might have been
caused by the low conductivity, as the gold coating was a thin layer of around 10-100
nm. Also, the stability of the coating was important and was thus examined. It was
found that the gold coating could be physically washed off the copper after several runs.
This could be solved by thickening the layer of gold to ensure better conductivity,
although it would eventually be washed off again, meaning that the coating is not ideal
for such an application. In addition, the gold might become oxidised and not conductive
after several runs, as it is unstable over the copper. However, in both cases, it will not be
conductive enough to attract the anion to migrate through the membrane, which would
eventually affect the migration process and decrease the migration amount.
To overcome this potential problem, a layer of carbon coating was placed over the gold
coating (see section 3.6.2 for the coating process). This was to protect the gold from
oxidisation and to keep it in place; if the carbon washed off, then the gold layer would
remain there for a longer period. Also, the carbon is a conductive material that will not
stop conductivity in the system during the runs, and it can increase the conductivity in
the system. The same experimental procedure used previously was used here (see
section 6.4.1).

149
Figure 6-12: The percentage of anion extractions, with carbon coating over gold-coated
electrodes. The buffer used was 5 mM MES/His and the anion concentration was 1 g/L each of
anion.
Figure 6-12 shows the percentage of anion extraction using a multi-membrane system
with carbon coating over gold coating, over the copper electrode. The largest extraction
percentage was 15.3% for nitrate, followed by 13% for fluoride, 2.4% for chloride, and
0.3% for sulphate. Phosphate did not show any extraction. This demonstrated good
extraction performance for fluoride and nitrate but phosphate and sulphate showed poor
extraction. That might have been caused by the concentration of anions in the sample
and the anions ability to migrate through the membrane, which requires further
investigation. Nevertheless, the aim of this step was to increase conductivity in the
system by coating the gold layer on the electrode with carbon. Increasing the
conductivity will improve the extraction performance. The conductivity of the system
following the carbon coating did not increase as expected; it fluctuated quite
13.13
2.38
15.27
0.29
0
2
4
6
8
10
12
14
16
18
Fluoride Chloride Nitrate Sulphate
% o
f e
xtra
ctio
n
Anion

150
considerably but overall, there was no great difference in conductivity between the two
coating methods.
Figure 6-13: The percentage of anion extraction using a desalination cell, with two different
electrode coatings, gold and carbon
Figure 6-13 shows the percentage of migration using a multi-membrane chip with two
different electrodes: copper coated with gold, and copper coated with gold and carbon
over the gold. The extraction of fluoride and nitrate seems to be twice as high with
carbon coating than with gold alone, while it is twice as low for chloride, much lower
for sulphate, and slightly better for gold than carbon.
Generally, gold seems better for overall extraction whereas carbon showed no extraction
of phosphate. A fluctuation in conductivity was observed that might be due to the
design of the system, as the electrode might be not in good contact with the sample, or
the buffer in the channel has not been filled. This could also be a result of the gold
coating over the electrode, which might physically wash off the electrode or become
0
2
4
6
8
10
12
14
16
18
Fluoride Chloride Nitrate Sulphate Phosphate
% o
f e
xtra
ctio
n o
f an
ion
Anion
% of extraction with gold
% of extraction with carbon

151
oxidised. However, in both cases, the conductivity had to be increased to attract the
anion to migrate through the membrane. Further optimisation was needed to enhance
the extraction, including the system design, to ensure better contact with the fluid in the
system and robust electrodes.
6.5 ED with an ion-exchange membrane using a commercial
ED cell
6.5.1 Anion extraction with one anion-exchange (AEX) membrane
using a commercial ED cell
In the multi-membrane system previously described (section 6.4), there were three
layers of ion-exchange membrane. The main reason for this was to enhance the anion
extraction. However, the anion-exchange membrane can be used on its own to extract
anions. The membrane was used to examine its extraction behaviour in this system,
which will then be adjusted for the suitable set-up of a fully integrated system.
6.5.1.1 Results and discussion
The commercial system described earlier in section 3.5.4 (Figure 3-13 and Figure 3-14)
was used here because this system is practically easier to handle, and the system in this
stage needed to be disassembled a few times in order to optimise the extraction. The
system consisted of a chamber and an anion-exchange membrane that was placed in the
chamber. Two Pt electrodes were directly inserted into the destination and sample
reservoirs; the sample reservoir was filled with about 500 µl analyte (anion mixer) and
the chamber (500 µl) was filled with 5 mM MES/His buffer.
The voltage applied was 100 V and the run time was 1 minute. The results were
collected from the destination reservoir and then analysed using the IC Dionex system.

152
Figure 6-14: The percentage of anion extraction through an anion-exchange membrane, at
different voltages. The sample uses an anion standard solution, 1 g/L of each anion, with a 5 mM
MES/His buffer
Figure 6-14 shows the percentage of anion extraction from the sample reservoir to the
destination reservoir, through an anion-exchange membrane at different voltages (10,
25, 50 and 100 V), with a running time of 1 minute. From the figure, it can be observed
that the extraction was examined under four different voltages at a fixed time of 1
minute. At the first point, 10 V, the system has its lowest rate of migration percentage,
with its largest at around 10%, for sulphate. The second point, 25 V, seems to be the
largest rate of extraction for all anions except for sulphate, with a maximum higher than
50%, for nitrate. The third point, 50 V, has a similar rate to the 25 V rate but is slightly
lower. Finally, the last point, 100 V, follows a similar trend to 25 and 50 V but is 50%
lower for nitrate.
At 10 V, sulphate extraction was low. This might be due to the ability of sulphate to
migrate faster than the other anions, or to a sulphate contamination that accumulated at
that point; this requires further investigation. At 50 and 25 V, the extraction follows a
0
10
20
30
40
50
60
70
Fluoride Chloride Bromide Nitrate Sulphate Phosphate
1 min, 100 V
1 min, 50 V
1 min, 25 V
1 min, 10 V

153
similar trend but is slightly lower for 50 V, which is surprising, as the increase in
voltage should in theory increase the extraction performance. At 100 V there was a
similar but lower trend, with the high voltage causing the production of bubbles in the
sample reservoir. The bubble formation was noticeable and the current flowing into the
system stopped suddenly after 30 seconds. It seems that 25 V was the best voltage at
this point for the extraction of anions using this system; however, the results in general
require more investigation for the extraction of individual anions.
6.5.1.1.1 Timing optimisation
After the optimisation of the voltage using the ED system, the same set-up from the
previous work was used to optimise the timing, using 25 V as an optimum voltage.
Three different extraction times were examined: 1, 2.5 and 5 minutes as in this stage in
the total system the extraction time have to be less than 5 minutes if possible.
Figure 6-15: The percentage of anion extraction through an anion-exchange membrane, with
different timings. The sample was an anion standard solution of 1 g/L of each anion, with a 5 mM
MES/His buffer is. The experiment was run three times.
0
10
20
30
40
50
60
70
Fluoride Chloride Nitrate Sulphate Phosphate
% o
f m
igra
tio
n
Anion
1 min and 25 V.
2.30 min and 25 V.
5 min and 25 V.

154
Figure 6-15 shows the migration percentages of five anions through an anion-exchange
membrane at different timings (1, 2.5 and 5 minutes) and a fixed voltage of 25 V. From
the figure, it can be seen that the migration percentage at 1 minute was less than 20%
for fluoride and chloride but it was at the maximum of more than 50% for nitrate, and
less than 10% for both sulphate and phosphate. At 2.30 minutes, it was less than 10%
for chloride, jumping to around 45% for nitrate and phosphate, and it was less than 20%
for sulphate. At 5 minutes, fluoride and chloride migration was between 15 and 25%,
while it was very low for sulphate and phosphate, with less than 10%. It has to be
mentioned that some of the points in the graph had to be excluded due to
contaminations at those particular points, which will be discussed later.
However, the figure is showing that the anion-exchange membrane was extracting
anions in the ED system. The results were good and further improvement of the ED
system will show even better results. Yet, at higher voltage and longer timing,
fluctuation and irreproducibility occur due to the bubble formation in the systems which
affect the results. A positive point is that it was reproducible but this was unexpected
and was probably due to the ability of the membrane to stand chemically and physically
for a long period (around 60 runs). One membrane was used at least three times for each
run, to ensure reproducibility under the same conditions and to keep the practical set-up
fixed, so that the results would be as accurate as possible. Also, the membrane had to be
conditioned with water before each run at the same position. These factors might affect
the performance of the membrane during experiments.
6.5.1.2 Examination of the used AEX membrane
In order to investigate the membrane ability under different conditions, IR was used to
examine the membrane that was used in the extraction experiments.

155
Figure 6-16: IR spectra for the AEX membrane at three different conditions: only in water
overnight; a new membrane; and a used membrane
Figure 6-16 shows the IR spectrums of three different anion-exchange membranes
under different conditions. The first condition was a membrane placed in water
overnight and then dried at room temperature overnight. The second condition was a
new dry membrane and the third condition was a membrane that had been used for ED
experiments several times (about 100 runs) and then allowed to dry at room temperature
overnight. Figure 6-16 shows that the membranes have similar trends but that the new
membrane and the one placed in water were almost identical, with a slight difference in
the region between 1,000 and 1,500 cm-1
. The new membrane demonstrated a different
spectrum, especially in the regions between 500 and 1,500 cm-1
, and 3,000 and 3,500
cm-1
.
The peak between 3000 and 3500 cm-1
was the O-H peak from water [127]
, and it was
smaller for the new membrane because it was dry, and it was similar for the other two
conditions because they have more water. The two peaks between 2800 and 3000 cm-1
40
50
60
70
80
90
100
500 1000 1500 2000 2500 3000 3500 4000
Tran
smit
tan
ce %
Wavelength/ cm-1
in water
newmembrane
usedmembrane

156
were for C –H [129]
; and they were nearly identical for all the three conditions. The peaks
at 1655 and 1670 cm-1
were for H-C=O (amide) peaks [215]
, and they were very similar
for the three conditions. The peak at 1340 cm-1
might be for CO3 2-
[127]
, it was long peak
for the new membrane, and then was depleting for the membrane that kept in water, and
it decreased further for the used membrane. This indicated that the membrane was a
polyamide membrane and it might be modified or coated (with carbonate). The
chemistry of the coating layer or the modification was hard to identify.
However, there were chemical differences and changes in the spectrums. The new
membrane had a different spectrum while the other two indicated changes that occurred
following the use of the membrane in the ED system. Overall the three conditions
showed similar spectrums, and the changes on the original membrane occurred when
the membrane was exposed to water, except the peak at 1340 cm-1
and this is probably
the reason behind the membrane behaviour. However, more investigation is required to
accurately examine the membrane ability for ED, such as how many runs it could last
for and what type of conditions might affect the anion extraction.
6.5.2 Cation extraction with one cation-exchange (CEX) membrane
using a commercial ED cell
In the ED system described earlier (section 6.4), there were three layers of ion-exchange
membrane, two AEX membranes, and a CEX. However, the cation-exchange membrane
can be used on its own to extract cations.
In this extraction, the CEX membrane was compared to the cellulose acetate membrane
(CA) for the extraction of cations (see section 6.2.1.2).

157
6.5.2.1 Results and discussion
The system described earlier in section 3.5.4 was used here, for the previously described
reasons. The sample reservoir was filled with about 500 µl analyte (cation mixer) and
the chamber (500 µl) was filled with 5 mM MES/His buffer. The results were collected
from the destination reservoir and then analysed using a ICP-AES system.
Figure 6-17: The extraction percentages of four cations through a cation-exchange membrane at a
fixed time of 1 minute, with different voltages (10, 30, 70, and 100 V) and a 5 mM MES/His buffer
Figure 6-17 shows the percentage of extracted cations at a fixed time with different
voltages. From the figure, it can be seen that the extraction has a similar trend for all
cations, but with different behaviours. At 10 V, the extraction was between 25-30% for
0
5
10
15
20
25
30
35
40
45
50
Ca Mg K Na
% p
erc
en
tage
of
mig
rati
on
Cation
10 V
30 V
70 V
100 V

158
all cations, whereas it was between 40-45% at 30 V, and it was less than 5% for 70 V.
The lowest extraction percentage occurred at 100 V.
The best percentage was obtained at 30 V and the lowest was at 100 V. This was due to
the bubble formation in the system at high voltages affecting the migration of cations
from the sample reservoir to the destination reservoir in the ED system. Therefore, the
optimum condition at this point was the relatively low voltage of about 30 V. However,
in a further improved system, this might change to a higher voltage in order to enhance
the extraction.
Figure 6-18: The extraction percentages of four cations through a cation-exchange membrane at a
fixed voltage of 30 V and different timings (0.3, 1, 2, 3, 4, and 5 minutes), with a 5 mM MES/His
buffer
Figure 6-18: shows the changes in migration for different extraction times, from 30
seconds to 5 minutes. The amount of migrated cation increased from less than 5% at 30
0
5
10
15
20
25
30
35
40
0.3 1 2 3 4 5
% o
f m
igra
tio
n
Time/ min
Na
K
Mg
Ca

159
seconds to more than 35%. In general, sodium has the highest migration percentage and
calcium has the lowest. However, the increasing trend of the migration percentage was
expected, despite the fact that it levels off between 30 seconds and 1 minute, which is a
short time. The most important point is that a longer time is better for extraction in these
conditions.
6.6 Ion extraction in a COC chip with one membrane
Initially, both anion- and cation-exchange membranes were used in the multi-membrane
(see section 3.5.7) for the extraction of anions, and they were then examined as
individual membranes for the extraction of anions through an anion-exchange
membrane and the extraction of cations through a cation-exchange membrane. Both
have shown promising results and they could potentially be used for ion extraction with
further modification of the ED chip, to enhance and improve the extraction of ions.
Using the ED system (see section 3.5.8 ), the system was examined for three main
points:
The physical stability of the chip under pressure. The pressure from the pump
that was used to load the sample and collect the results would affect the chip,
leading to leakage in the system. (This is practically critical as it requires
appropriate tubing.) This point was examined by pumping buffer at different
flow rates (0.1- 1 mL min-1
) into both reservoirs.
The stability of the gold coating on the electrode (see section 3.6.3). This was
examined by analysing gold in the flushed buffer that was used to examine the
physical stability.
The behaviour of cations in the system without the applied voltage, as they
might migrate through the membrane without the attraction of electrical power.

160
This point was examined by leaving a cation solution in the sample reservoir for
five hours before collecting and analysing the buffer in the destination reservoir.
6.6.1 Results and discussion
Table 6-2: Cation extraction with an ED system
Amount of cation Ca Mg K Na Au
Original sample/µg 337.374 531.244 604.794 819.304 -0.042
Blank (system flush)/µg 0.456 0.190 1.233 1.198 -0.074
Destination reservoir after 5 hrs/ µg 0.233 0.083 1.183 1.591 -0.022
Table 6-2 shows the amount of cations and the amount of gold (on the electrode), which
was analysed by ICP-AES for the new ED system. The first row represents the
concentration of original cation standard samples that were used in this experiment. The
second row is the concentration of cations present in the buffer and the ED system (this
includes the chip, tubing and syringe), as the buffer was flushed at different flow rates
through the system, before analysing the flushed buffer. The third row is the amount of
cations and gold in the destination reservoir after leaving the original sample (displayed
in the first row) for five hours.
The table shows that there are cations in the system and contamination of the buffer that
probably accumulated from the tubes or during preparation; however, the levels are
extremely small compared to the original cation sample, and would not affect the results
obtained from the system. The destination reservoir after five hours also shows an
extremely small amount of cations in the reservoir. The concentration of gold in the
entire system even after five hours is zero, which means that the gold coating has not
been removed.

161
The results obtained from the table are excellent and demonstrate that the gold electrode
is stable. Also, there is no migration without voltage for five hours. Thus, the system is
reliable for ion extraction.
6.6.2 Optimisation of cation extraction in a COC chip with one CEX
membrane
In order to find the optimum conditions for the extraction of ions, and after the
investigation of the cation-exchange membrane behaviour in an ED commercial cell
(see section 6.5.2), the CEX membrane was shown to be effective for cation extraction.
In this section, ED was carried out with microfluidic-based ED chip, as described in
section 3.5.8.
6.6.2.1 Experimental
The buffer used was 5 mM MES/His at a flow rate of 0.5 mL min-1
, using a syringe
pump. The buffer was introduced to the destination reservoir in the system. Samples
were collected and analysed by the ICP.
The effects of changing the extraction times (1-5 minutes) at the applied voltage (1-5
V), was investigated.

162
6.6.2.2 Results and discussion
Figure 6-19: The percentage of the extraction for four cations through a CEX membrane at a
fixed voltage of 100 V and different timings (0.3, 1, 2, 3, 4 and 5 minutes)
Figure 6-19 shows the extraction percentages of four cations through the CEX
membrane at a fixed voltage of 100 V, at an increasing extraction time. The cation
extraction can be seen to increase along with the increased extraction time. The
extraction percentages increased for all cations from 0.3 to 1 minute, before levelling
off between 1 and 2 minutes. After this, it increased at 3 minutes. At 5 minutes, the
sodium and potassium percentages increased, while the calcium and magnesium
percentages decreased.
The extraction for this system showed an increasing trend along with the increasing run
time. However, the general extraction percentage was very low, as was the conductivity
in the system. This was probably due to the position of the electrodes, especially the
top-side electrode of the chip, as the fluid in the sample reservoir might not have good
0
0.05
0.1
0.15
0.2
0.25
0.3
0.35
0.4
0.3 1 2 3 5
% o
f m
igra
tio
n
Time/min
Ca
Mg
K
Na

163
contact with the electrode, which then leads to a low conductive environment and the
low migration of cations from the sample reservoir to the destination reservoir.
Figure 6-20: The extraction percentages of four cations through the CEX membrane at a fixed
extraction time of 3 minutes and different voltages, with a 5 mM MES/His buffer
Figure 6-20 shows the extraction percentages of sodium, magnesium, calcium and
potassium through a CEX membrane in an ED system with a MES/His buffer. From the
figure, it can be seen that there is a similar trend for all cations. At 10 V, the trend was
around 0.8%, decreasing at 20 V and then remaining the same between 20-50 V, with a
slight increase at 50 V.
However, despite the successful extraction of cations, the extraction percentages were
very low (under 1%) and the conductivity in the system was also very low. This was
probably due to the electrode position.
In order to investigate the conductivity of the system, a platinum electrode was placed
in the reservoir with the buffer, and voltage was applied. Another platinum electrode (as
0
0.1
0.2
0.3
0.4
0.5
0.6
0.7
0.8
0.9
1
10 V 20 V 30 V 40 V 50 V
% o
f m
igra
tio
n
Voltage
Ca
Mg
K
Na
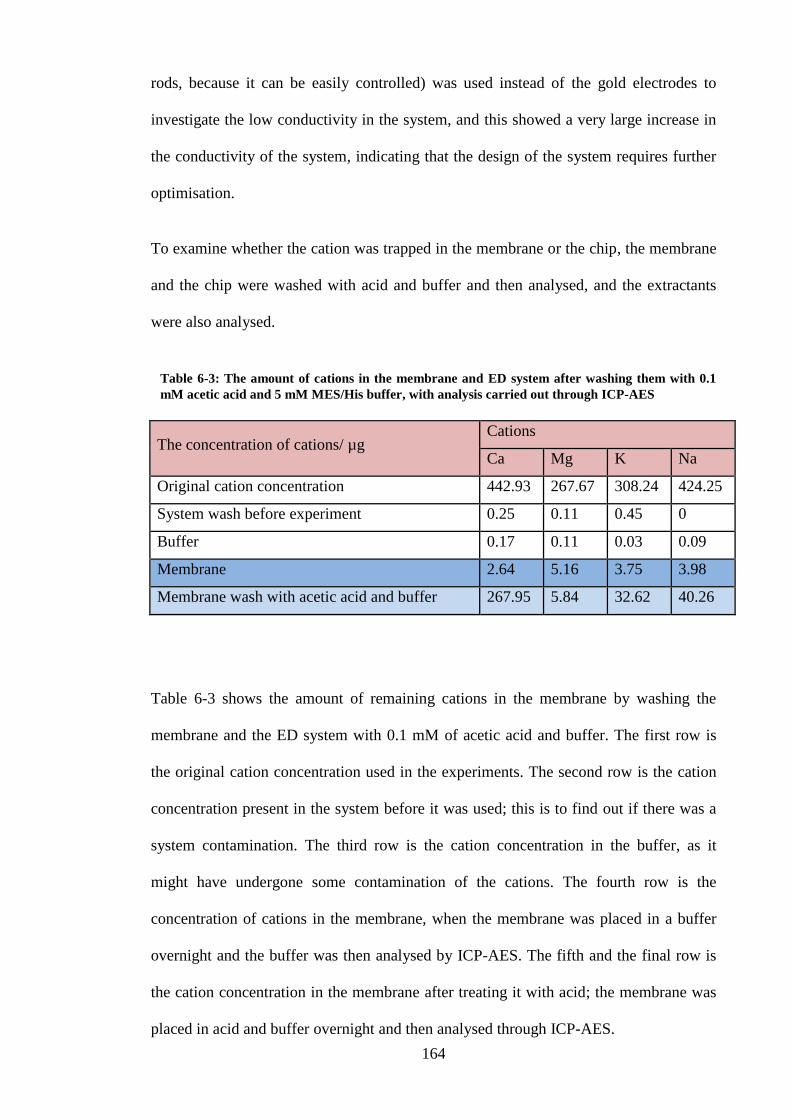
164
rods, because it can be easily controlled) was used instead of the gold electrodes to
investigate the low conductivity in the system, and this showed a very large increase in
the conductivity of the system, indicating that the design of the system requires further
optimisation.
To examine whether the cation was trapped in the membrane or the chip, the membrane
and the chip were washed with acid and buffer and then analysed, and the extractants
were also analysed.
Table 6-3: The amount of cations in the membrane and ED system after washing them with 0.1
mM acetic acid and 5 mM MES/His buffer, with analysis carried out through ICP-AES
The concentration of cations/ µg Cations
Ca Mg K Na
Original cation concentration 442.93 267.67 308.24 424.25
System wash before experiment 0.25 0.11 0.45 0
Buffer 0.17 0.11 0.03 0.09
Membrane 2.64 5.16 3.75 3.98
Membrane wash with acetic acid and buffer 267.95 5.84 32.62 40.26
Table 6-3 shows the amount of remaining cations in the membrane by washing the
membrane and the ED system with 0.1 mM of acetic acid and buffer. The first row is
the original cation concentration used in the experiments. The second row is the cation
concentration present in the system before it was used; this is to find out if there was a
system contamination. The third row is the cation concentration in the buffer, as it
might have undergone some contamination of the cations. The fourth row is the
concentration of cations in the membrane, when the membrane was placed in a buffer
overnight and the buffer was then analysed by ICP-AES. The fifth and the final row is
the cation concentration in the membrane after treating it with acid; the membrane was
placed in acid and buffer overnight and then analysed through ICP-AES.

165
As found in section 6.6.1, the buffer and the system both had a very small amount of
cations that would not affect the results. The concentration of cations in the membrane
was only small. The membrane following the acid treatment should have a higher
presence of cations, especially with calcium at 267.95 µg, which is very high; this could
be a result of contamination during the analysis process but requires further
investigation. Magnesium, on the other hand, was normal; it demonstrated a similar
amount to the initial amount in the membrane before washing it with acid. Potassium
and sodium demonstrated slightly higher concentrations of 32.6 and 40.2 µg, which is
high but within an acceptable range. These values indicate that there are some cations
that are trapped or delayed in the membrane; releasing this amount from the membrane,
especially the calcium, is very important and would enhance the extraction.
The extraction in a COC chip with one membrane has shown extraction, but with a
small amount of cation extracted. This might be due to a few factors such as the
membrane strength, the offline detection of the ions, and the position of the electrode. A
new design of the system would improve the extraction and enhance the system. Online
detection would significantly improve the system, as the offline system has less
accuracy than the online one, and the sample could be lost during the transfer process.
Nevertheless, work is being undertaken to design a total integrated system that includes
sample introduction, separation and conductivity detection, all with online, real-time
analysis. Thus, the low results in the current system might appear better with the new,
integrated system.

166
6.6.3 Optimisation of an anion extraction in a COC chip
with one AEX membrane
Anion extraction has not been reported in the literature for CE as a simple system. This
work aims to extract anions through an AEX membrane using a novel ED system in a
microfluidic chip, with different techniques having been used for the extraction of
anions in this work.
6.6.3.1 Experimental
The system described earlier in section 3.5.8 was used with the commercial PCB (see
section 3.6.3). IC standards (chloride, nitrite, nitrate, phosphate and sulphate) were
used, each with a concentration of 1 g/L (Sigma Aldrich, UK). The sample used here
was diluted to the following concentrations: chloride 1 µg, nitrite 2 µg, and nitrate,
phosphate and sulphate concentrations of 6 µg each. A 5 mM MES/His buffer was used.
The flow rate was at its convenient between 0.1-3 mLmin-1
from the syringe pump in
order to introduce the buffer to the destination reservoir in the system, before the sample
was collected and analysed by the IC Dionex. The run time was 3 minutes and the
voltage applied on the system was 100 V.
In this work, we aimed to analyse a real river water sample that was collected on 21
May 2015 from the River Hull, in Kingswood.

167
6.6.3.2 Results and discussion
Figure 6-21: The percentage of anion extractions through an AEX membrane in an ED chip
Figure 6-21 shows the percentage of anion extractions for chloride, nitrite, nitrate,
phosphate and sulphate, through an AEX membrane in the ED chip. From the graph, it
can be seen that the percentage of chloride was the highest with 82%, followed by
phosphate with 31%, nitrite with 10.6%, and nitrate with about 6%, followed by the
lowest percentage of migration, which was sulphate with 5%.
The chloride extraction was high while the other anions showed lower extraction. This
is possibly because of the charge density of each anion. Considering the low amount of
anion in the original sample, these results are very good. Furthermore, these results are
more likely to improve further with an online detection system, which would be more
accurate as the sample would be in real-time and less analyte would be lost during
transfer.
82.32
10.62 5.94
31.33
5.27
0
10
20
30
40
50
60
70
80
90
100
Chloride Nitrite Nitrate Phosphate Sulphate
% o
f e
xtra
ctio
n
Anions

168
6.6.3.2.1 Real river water analysis of anions
A sample of River Hull water was collected and analysed using the same conditions
mentioned earlier (see section 6.6.3.1).
As described in section 6.5.1.2, the efficiency of the membrane decreased; therefore, the
River Hull sample was analysed with the same conditions, with two different
membranes. The first one was a new membrane and the second one had been used for
several runs.
Table 6-4: The results of anion extractions (from River Hull water sample) through AEX in the
ED chip
Anion
Original River
Hull water
sample µgL-1
Extracted concentration/µg L-1
New membrane Used membrane
Chloride 7.18 1.62 0.65
Nitrite 0.60 0.04 0.03
Nitrate 6.46 0.36 0.01
Phosphate 8.44 2.96 0.13
Sulphate 0.97 0.64 0.16
Table 6-4 shows the amount of five anions in a River Hull water sample using an ED
chip. The second and third columns are the extracted amount of anions through an AEX
membrane in the ED chip, using a new membrane and a used membrane.
The original sample contains a variety of anion concentrations. The highest
concentration was for phosphate, with 8.44 µgmL-1
, followed by chloride with 7.18
µgmL-1
, nitrate with 6.46 µgmL-1
, and then nitrite and sulphate with 0.60 and 0.97
µgmL-1
, respectively.

169
Figure 6-22: The percentages of anion extractions through a new AEX membrane in an ED chip
Figure 6-22 shows the extraction percentages of five anions through a new AEX
membrane. From the figure, it can be observed that the largest extracted amount was for
sulphate with 65%, followed by phosphate with 35%, chloride with 22.5%, nitrite with
6.5%, with lowest percentage of extraction for nitrate, with 5.5%.
The figure again demonstrates a great success in extracting anions using this system. All
anions were extracted with a variation in the migrated amount of each anion. Sulphate
seems to be the largest and this is possibly because of the small concentration of
sulphate in the original River Hull sample, which migrated better than the other anions.
Phosphate, on the other hand, had the largest amount in the original sample but 35%
was migrated to the destination reservoir. Chloride was one of the largest concentrations
in the original River Hull water sample but about 22% of this was extracted. Nitrate was
also one of the anions with the highest presence in the sample and 5.5% of it was
migrated through the membrane. Finally, nitrite demonstrated a 6.5% extraction.
22.52
6.53 5.52
35.04
65.79
0
10
20
30
40
50
60
70
Chloride Nitrite Nitrate Phosphate Sulphate
% o
f e
xtra
ctio
n
Anion

170
The same conditions were used to extract anions from the membrane used for 15 runs,
with a range of 1-5 minutes for each run.
Figure 6-23: The percentage of anion extractions through a used AEX membrane in an ED chip
Figure 6-23 shows the extraction percentages of five anions through a used AEX
membrane. From the figure, it can be observed that the largest extracted amount was for
sulphate with 16.3%, followed by chloride with 9%, nitrite with 5.5%, and phosphate
with 1.5%. The lowest percentage of extraction was for nitrate, with 0.11%.
The figure again demonstrates a great success in extracting anions using this system. All
anions were extracted with a variation in the migrated amount of each anion. Sulphate
seems to be the largest and this is very likely because of the small concentration of
sulphate in the original River Hull sample, which migrated better than the other anions.
Phosphate, on the other hand, had the largest presence in the original sample but only
1.5% was migrated to the destination reservoir. Chloride was one of the largest
concentrations in the original River Hull water sample but about 9% of it was extracted.
Nitrite had a 5.5% extraction followed by nitrate, which was one of the highest present
8.99
5.57
0.11
1.58
16.31
0
2
4
6
8
10
12
14
16
18
Chloride Nitrite Nitrate Phosphate Sulphate
% o
f e
xtra
ctio
n
Anion

171
anions in the sample, of which 0.1% was migrated through the membrane; this was the
lowest extraction percentage in the graph.
Figure 6-24: Comparison of the extraction percentages of five anions through new and used AEX
membranes in an ED chip
Figure 6-24 shows the difference in extraction results between new and used
membranes in an ED chip. The figure illustrates that the extraction with both
membranes has variations at some points; the trend is not the same. This can be noticed
more clearly with phosphate and sulphate, both of which have a large variation between
the membranes. Nitrite, on the other hand, has very similar results with both
membranes.
However, despite the good extraction obtained by the used membrane, the rate of
extraction between the new and used membranes might be an issue, as it would affect
the reproducibility and reliability of the extraction. This issue could be solved through
the continuous flush of the membrane in the system with an appropriate reagent to
regenerate the membrane, or by changing the membrane when it reaches a limit where
0
10
20
30
40
50
60
70
Chloride Nitrite Nitrate Phosphate Sulphate
% o
f e
xtra
ctio
n
Anion
% of extraction (newmembrane)
% of extraction (usedmembrane)

172
the extraction can be affected and the membrane is no longer reproducible. Both
possibilities are considered in the total integrated system under development.
6.7 Chapter conclusion
Electrodialysis (ED) was examined as a possible sample introduction method because it
can be combined with electrophoresis (CE) for rapid pre-treatment and the subsequent
determination of inorganic ions in river water. The analytical performance of ion
separation in CE can be significantly improved with pre-treatment, with ED as a sample
introduction technique.[123]
Different ED techniques were investigated for extracting inorganic ions from a river
water sample, including ion extraction through polytetrafluoroethylene (PTFE) film and
Parafilm; ion extraction with a cellulose acetate (CA) ED membrane; ion extraction
with a cyclic olefin copolymer (COC) chip; ion extraction with a COC multi-
membrane; ion extraction with an ion-exchange membrane; and ion extraction through
an ion-exchange membrane in an ED chip.
Ion extraction through polytetrafluoroethylene (PTFE) film and Parafilm initially began
with a set-up that involved a plastic capillary; this was practically hard and subsequently
showed no results. Therefore, another ED set-up was used and it was successful but it
showed a low migration of ions. Thus, to improve the migration of ions, the film was
stretched to reduce the thickness of the film. This provided better results and the amount
of migrated ions was doubled after reducing the thickness. Despite the successful
migration, PTFE and Parafilm are not ideal for a few reasons, the most important reason
being that the stretching was manual and would influence the reproducibility of the
results in the future, as manual stretching cannot ensure the exact same thickness every
time the film is used.

173
A cellulose acetate (CA) ED membrane was also used for extracting ions from a sample
of river water. Unfortunately, anion extraction through the cellulose acetate membrane
was unsuccessful, which could be due to the cellulose acetate chemical structure.
However, cation extraction through a CA membrane was successful, showing very good
results. The extraction time, applied voltage and different buffers were investigated to
optimise the extraction, and good progress was made after the optimisation. Further
optimisation, such as the mechanical design of the system, will improve the extraction
performance.
In order to enhance the extraction of ions through an ED membrane, a new ED chip was
designed for the extraction (Figure 3-15 and Figure 3-16). The design of the new chip
should be more compatible, physically and chemically, with the final integrated total
system. Work on this COC chip was unsuccessful due to the continuous leakage, despite
the effort made to control the leakage. This will cause inaccurate results as the fluid
would be easily contaminated, or the sample would leak out of the chip, resulting in the
incorrect reading of the extraction.
However, to overcome the problems associated with the COC chip and improve the
extraction, especially for anions, a COC multi-membrane system was designed. In this
system, ion-exchange membranes were used rather than the cellulose acetate membrane.
Two types of membrane were examined: an anion-exchange membrane for the
extraction of anions and a cation-exchange membrane for the extraction of cations.
Different electrodes were used in the system to examine their suitability, including a
gold-coated electrode and a carbon-coated electrode. Generally, extraction with a gold
electrode was overall slightly better than extraction with carbon; the problem with the
carbon electrode was that it demonstrated no phosphate extraction. Nevertheless, both
methods showed good extraction despite the low conductivity in the system. This might

174
be due to the design of the system. This could also be a result of the gold coating over
the electrode which might physically wash off the electrode, or become oxidised.
Further optimisation is needed to enhance the extraction, including the system design.
To enhance the extraction of ions and simplify the multi-membrane system to a single
membrane, ion extraction with an ion-exchange membrane was investigated as a
possible extraction media for both anions and cations. Anion extraction with an anion-
exchange (AEX) membrane in an ED system was successful and demonstrated good
results, yet the AEX membrane has one disadvantage: its inability to tolerate chemical
and physical stress for long periods. Cation extraction with a single cation-exchange
(CEX) membrane has also shown very good results for the extraction of cations.
Initially, both anion- and cation-exchange membranes were used in the multi-membrane
for the extraction of anions, and they were then examined as individual membranes for
the extraction of anions by an AEX membrane and the extraction of cations by a CEX
membrane in an ED system (plastic fitting). Both have shown promising results and
they can be used for ion extraction with further modification of the ED system.
Therefore, a new ED chip was designed to improve the extraction. In this system, a new
gold electrode was used, and its physical and chemical suitability was examined for an
ion extraction system in an ED chip. The extraction using this system has shown great
results for both anions and cations, and an even better anion extraction was tested using
a real river water sample, also demonstrating great results.
To summarise, different ED techniques and methods were used to extract ions from a
river water sample. Most of these techniques were successful, with some disadvantages.
Some of these disadvantages can be overcome but this requires further work. However,
the most successful and suitable technique for anion extraction was anion extraction
with an AEX single-membrane in an ED chip. The best cation extraction was obtained

175
using the ED system with a cellulose acetate (CA) membrane. Both systems have
shown very good results and these results can be further improved with a greater
optimisation to suit the total integrated systems.

176
7 Combined CE and ED for a fully integrated system
7.1 Introduction
Chip-based CE is one of the fastest and potentially convenient techniques for the
separation of inorganic ions,[22]
and has shown very promising results,[216]
indicating
that it can be used in-situ for the analysis of inorganic ions as part of a total integrated
analytical system. The combination of CE and C4D for LOC analysis has become very
attractive for in-situ analysis due to several factors such as the low consumption of
reagents and samples, fast analysis time, and good detection sensitivity.[217]
Therefore,
this work has concentrated on developing an LOC system that uses the advantages of
both CE and C4D.
To increase the sensitivity of the CE system, the ED system ( chapter 6) has been used
as a sample introduction system as well as a pre-concentration technique. In the
proposed LOC total integrated system, the ED system should be placed prior to the CE
chip and the C4D placed last.
7.1.1 System specifications
The analytical system should be able to measure ions in the field every 15 minutes,
logging all of the collected data at any time on a network. Hence, the ideal system
should be able to operate without intervention for at least three months, allowing for a
minimum of three-monthly measurements.
This means that the quantity of reagents should be enough for three months. Ideally, the
system should have as few reagents as possible, including washing reagents and those
for conditioning the membrane. Therefore, the buffer is the only chemical reagent in the
system and that will be discussed in detail later on in this chapter. The use of one

177
chemical reagent is good because it reduces the environmental impact of chemical waste
produced by the system. The volume of buffer used in the system for three months
should be as small as possible to make the system portable enough; the proposed
maximum buffer volume should be no more than 2 L and this will be discussed later on
in this chapter.
The system has to be portable enough to be carried to remote, difficult locations, with
the preferable approach being to place as many systems as possible in different
locations. In addition, in case of the failure of one system, its portability means that it
could be quickly replaced with an alternative system.
The energy requirements and power budget for the system has to be as small as
possible, and this will be discussed later in the chapter. Finally, one of the most
important specifications of the system is that it must have a low environmental impact
in case of failure.

178
7.2 Proposed design for a total integrated LOC system
Figure 7-1: Proposed design of an ED and CE integration system in a total LOC system.
Pump to pump
water from the
river
Extracted ion chamber
Sample
Reservoir
Buffer
Reservoir
RIV
ER
Buffer refresh
Run
ED
Membrane
Switching valve to
refresh the buffer
Peristaltic
pump
Waste
container
CE chip
Ion bridge to control ion
diffusion to the injection
channel A pump to
control fluid
movement to
the CE chip
Electrodes

179
Figure 7-1 shows the potential design of the LOC system. The design begins with a
sample reservoir. This reservoir contains the river water sample collected from the river
by a standard water pump. The fluid is then placed in a sample reservoir and the extra
amount of the water sample goes back into the river. The fluid is introduced to the ED
chip from the sample reservoir by a peristaltic pump. The sample side of the ED chip is
connected to a tube that exits the fluid back to the river, and the fluid is controlled by
the peristaltic pump. This pump should keep pumping long enough to extract sufficient
ions from the river water, by continuously extracting ions from a large amount of water.
The other side of the chip, which is the side with the extracted ions, is also connected to
a tube; this tube works as a loop that circulates the buffer and the ions. The buffer is
introduced to the loop by the peristaltic pump, and the fluid of the buffer is controlled
by an injection valve placed after the buffer reservoir. When the valve is switched on,
the buffer moves to the loop to fill in the system, including the other side of the ED
system. During the analytical run, the valve should be closed in order to continue
circulating the buffer in the loop. Following the analytical run, the valve should open to
clean the system of any possible residues and to refresh the buffer.
After the extraction of ions, the ions and the buffer are moved by the peristaltic pump to
the extracted ion chamber. In this chamber, the ions are introduced to the CE chip in
order to be separated, and the introduction of the ions from the chamber to the sample
reservoir in the CE chip is electrokinetically controlled. An ion bridge can be placed at
the interface between the extracted ion chamber and the sample injection channel in the
CE chip; this bridge aims to stop the fluid from entering the injection channel and only
allows ions to pass through.[98]
The purpose of this step is to avoid any interference
caused by the conflict between the two different flows of fluid in the sample loop and

180
on the CE chip. This conflict is due to the different dimensions of the loop and the CE
chip (or directions of fluid). The ions are injected into the separation channel by
applying a voltage to force the ions to move to the separation channel. More details are
provided later in the chapter.
The buffer is introduced to the system by a valve that allows the buffer to enter the loop
and wash it after each run, and then refresh the loop with a new buffer. After each run,
the used buffer goes to a waste container in order to be disposed of appropriately.
Ideally, the amount of buffer should be less than 2 L to ensure that the system is
portable. By using the following equation,[46]
the amount of buffer in the system can be
calculated:
𝑽 = 𝝅 (𝒊𝒅
𝟐)
𝟐
𝒉 Equation 7-1
Where V is the volume of buffer, id is the internal diameter of the tubes or the channel,
and h is the length of the tubes or the channel that carries the buffer.
The total amount of buffer in the system is the subtotal of volumes in the tubes and
channels in the system, which can be calculated by using the following equation:
𝑽𝒕𝒐𝒕𝒂𝒍 = 𝑽𝑬𝑫 + 𝑽𝒔𝒆𝒑 + 𝑽𝒇𝒍𝒖𝒔𝒉 + 𝑽𝒕𝒖𝒃𝒊𝒏𝒈 + 𝑽𝑬.𝑰.𝑪 Equation 7-2
Vtotal is the total volume of buffer needed in the system, VED is the volume of buffer in
the side of the ED chip with the extracted ions, Vsep is the volume of buffer in the CE
chip, Vflush is the volume needed to flush the system after each run to clean the system,
Vtubing is the volume of buffer in the tubing, and VE.I.C is the volume in the extracted
ions chamber (EIC).

181
From the previous equations (Equation 7-1 and Equation 7-2), the volume of buffer in
the system is 0.53 ml per run and each run is 15 minutes; therefore, the amount of buffer
needed is 52 ml a day. As the volume in the tubing is 0.015 ml (h = 500 mm and id =
200 µm), the volume in the ED system is around 0.5 ml based on the ED experiments
and the volume of the CE chip is 0.369 µl including the waste path (h = 78 mm [the
separation channel] + 10 mm [the injection channel] + 100 mm [the waste path], and r =
50 µm). The volume in the extracted ion chamber is 0.0125 ml (r = 400 µm and h =
100µm). This amount does not include the washing step; to include the washing step,
this volume is doubled, as the system should be flushed once after every run, which
means that the total volume needed is 104 ml a day.
7.2.1 CE separation chip
Figure 7-2: A diagram of the capillary electrophoresis used for the separation of ions
Figure 7-2 shows the CE microchip used for the separation of ions. The chip consists of
two channels in a cross shape, the separation and injection channels. At the beginning
and end of each channel there is an electrode. In the injection channel, the sample
introduction point has an electrode with the same charge as the ions of interest, to push
the ions to move to the separation channel through the ion bridge. At the end of the

182
sample channel, the electrode has the opposite charge to pull ions towards it. The
separation channel also has two electrodes to move ions in the channel to be separated.
At the end of the separation channel, just before the waste exit, there is a detection area
(see section 3.4.1). The separation channel is 78 mm long and 100 µm deep; it is
relatively long to allow for the good separation of ions.[104]
At the beginning and end of
the separation channel, and at the end of the injection channel in the CE chip, expanded
chambers ensure the buffer capacity. The expanded buffer chambers for the electrodes
are used to simplify electrode addressing and counteract buffering capacity depletion
caused by the high electrophoretic current.[124]
The channels in the chip must be filled with a buffer, by pumping the buffer from the
buffer reservoir to fill the CE chip. The buffer fills the chip via a tube; this tube is
connected directly to the buffer reservoir. The buffer should remain in the chip during
the run, and the buffer position in the CE is controlled by a pump.
After the analytical run, the system should be flushed with a buffer to clean the system
of any possible residues. Finally, the buffer from the entire system goes to one waste
container, to make the system portable.

183
7.2.2 Separation process
Figure 7-3: A diagram to explain the injection and separation process
After the extraction of ions through the ED chip in the previous part of the system
(section 7.2), followed by the pre-concentration of ions in the other side of the
membrane in the system, the process of the electrokinetic injection of ions to the
separation channel in the CE chip, begins. In the case of anions, for example, in the
extracted ion chamber they are injected into the separation channel by applying a
voltage (200-500 V) for a few seconds (5-10 Sec)[218]
; the ions should move through the
attraction of a negative charge at the beginning of the sample injection channel, and a
positive charge at the end of the sample injection channel. When the ions move to the
junction in the chip, a high voltage is applied across the separation channel to force ions
to move through the channel in order to be separated and detected. The movement also
occurs through the influence of a negative charge at the beginning of the separation
channel and a positive charge at the end of the separation channel. The time required for

184
separation is between 2-5 minutes or less,[10]
depending on the separation conditions
such as the chip materials, for example, Poly(methyl methacrylate) (PMMA). The
voltage applied should be in the range of 2-4 KV.[69]
7.3 Buffer
The buffer must be stable at different conditions and withstand changes in the
environment such as temperature. Therefore, the buffer chemistry was investigated
under various conditions. The analysis was carried out using a fluorescence
spectrometer instrument (LS 55 Fluorescence Spectrometers, Perkin Elmer, UK), with
an excitation wavelength of 440 nm and an emission wavelength of 470-350 nm.
The buffer (10 mM MES/His) was prepared in 100 ml stock and this 100 ml buffer
solution was then distributed in ten 10 ml sample glass vials. Each vial was treated
differently. The first condition was the buffer vial left in a freezer for a week, the second
condition was the fresh buffer, and the third condition was the buffer vial left in a 5ºC
fridge for 48 hours. The rest of the buffer was then placed in a box with the temperature
fixed at 40ºC, and the sample vials were then left in the box for different timings: 1, 3,
5, 10, 24 and 48 hours, and 4 months. Each sample was then measured using a
fluorescence spectrometer.[219]
These conditions represent different environmental conditions that would affect the
buffer in an LOC system in the field. However, leaving the buffer for 4 months is not
recommended, as the buffer might be changed biologically by bacterial activities.
Technically, the frozen sample of the buffer would represent the most extreme
temperature in winter, which is unlikely to occur because the box contains a system that
will raise the temperature inside the box due to the presence of the electronics in the
system, which means that most of the time, the buffer will not be in a frozen condition.

185
The changes in UK temperature are usually not as warm as 40ºC for a long time, but
this would be the most extreme condition. Conditions colder than 5ºC would not usually
change the buffer chemistry; therefore, the buffer was mostly examined at high
temperatures, as they are likely to change the conditions of chemical reagents.
Figure 7-4: Fluorescence emission of a MES/His buffer under different conditions
Figure 7-4 shows the changes in the chemistry of the buffer under different conditions.
The first condition emission was at 970 FU. The second (the fresh buffer), third and
fourth conditions showed very similar emissions at about 975 FU. After this, it
decreased at the fifth condition and remained the same until the ninth condition, at 960
FU. The tenth and last condition showed an emission of 860 FU.
From Figure 7-4, it can be seen that the MES/His buffer demonstrates similar emission
figures, which means that the buffer is able to stand the adverse changes in the field
conditions.
840860880900920940960980
10000˚C for a week
Fre
sh b
uff
er
48 h in 5˚C
1 h in 40˚C
h in 40˚C
5 h in 40˚C
10 h in 40˚C
24 h in 40˚C
48 h in 40˚C
4 m
onth in 40˚C
1 2 3 4 5 6 7 8 9 10
flu
ore
sce
nce
em
issi
on
/ F.
U.
Conditions

186
7.3.1 Buffer conductivity
Table 7-1: Buffer conductivity at different concentrations
Sample Conductivity µS/cm
Deionised Water 0.46
5 mM MES/Histidine 1.34
10 mM MES/Histidine 2.60
30/10 MES/Histidine 3.59
Table 7-1 shows three different concentrations of the MES/His buffer. The deionised
water used in the preparation of the buffer has a conductivity of 0.46 µS/cm. The 5 mM
buffer conductivity was 1.34 µS/cm, the 10 mM buffer conductivity was 2.60 µS/cm,
and the 30/10 MES/His buffer conductivity was 3.59 µS/cm.
The buffer conductivity was examined at different concentrations as the concentration
of the buffer might change depending on the separation suitability, due to a conflict in
the buffer concentration in the sample introduction and separation. The buffer
concentration used for separation can be used for the ion extraction. Different
concentrations of the buffer were also examined for the ED system, and the lowest
concentration of buffer (5 mM) was used. The 5 mM concentration was the less
conductive concentration, and a higher concentration of the buffer should be more
conductive, allowing for better extraction of ions in the ED system.
7.3.2 Buffer safety
The buffer consisted of two chemical compounds: 2-(N-morpholino)ethanesulfonic acid
(MES) and Histidine (His). According to most chemical reagent suppliers, neither of the
compounds are hazardous substances.[45]
However, hazards might occur from some
emissions including carbon oxides, nitrogen oxides and sulphur oxides. This might

187
occur in the case of fire and a solid state (powder). The system only used a buffer
solution and so the hazard is not relevant to this content.
To keep the environment safe from any possible buffer spillage, it is necessary to
consider the possibility of spillage, which could be due to any failure. Two main causes
of spillage could occur. The first cause is an internal system failure, which leads to a
leakage of the buffer. In this case, the system should have an electronic leakage sensor
or self-testing technique that stops the pump and minimises the leakage. The self-testing
process should also be able to identify a number of issues that result in errors or faults in
the measurements[11]
; for example, blockages in the fluidic system or dramatic changes
to the temperature of the system. In addition, the system should be in a physically strong
box that is designed to keep the reagents inside the system, in case of spillage.
The second cause of spillage is physical damage that causes the total destruction of the
system, due to a catastrophe such as a falling a tree or vandalism. In such an extreme
incidence, the box containing the system should involve a technique to prevent the
buffer from entering the environment. For example, the inner wall of the box could be
covered with materials that can absorb liquid, such as sponge. However, both chemical
compounds in the buffer are diluted in water with a small concentration; this will further
reduce the risk associated with the buffer, in the case of a spillage that is out of control.
7.4 Pumps
In this work, two different pumping systems are required. The first pump is a standard
water pump to pump the water sample from the river to a sample collection subsystem
(reservoir). The second type of pump is for pumping the water sample from the
reservoir to the LOC device, and to move the fluid inside the device. An example of this
pump is a peristaltic pump. Figure 7-1 shows a peristaltic pump in the LOC system.

188
This pump aims to move the buffer and the extracted ions in the other side of the
membrane.
Figure 7-5: Rough sketch of a water-quality monitoring system highlighting the possible collection
reservoir
Figure 7-5 shows a possible process for extracting a water sample from the river to the
LOC system. The system on the riverbank should begin with a standard filter to stop
any large particles from entering the system. The filter is at the end of a tube that is
connected to a pump that pulls water from the river. The water sample should be
collected in a reservoir, prior to passing through the system. The LOC system is then
running the required amount for analysis, and the rest of the water sample in the sample
collection reservoir goes back into the river.
The pumps should operate as long as the analytical system is running and it should stop
when no analysis is running, such as a system failure or when changing the buffer or the
waste container. Based on the ED experiments in chapter 6, the ED time should be
within 5 minutes, hence, the peristaltic pump should operate continuously for 5 minutes

189
in every run, and then stop working until the next run. The system should be able to
perform a run every 15 minutes, which comes to 2,942 runs a month, and so the
pumping time is 246 hours a month. The best pump performance is a compromise
between factors such as the tubing size and life, and the flow rate.[7]
However, a
standard peristaltic pump should be able to operate for three months based on this
calculation, and some peristaltic pumps can run for more than 1,000 hours,[49]
which
make long-term pumping achievable.
7.4.1 Energy
Considering the fact that the analytical system should consume as little energy as
possible and be portable, a portable battery is required to operate the pump. 12 V
batteries should be able to operate the pumps for the time required; motorcycle or car
batteries should be suitable for such a task.
Table 7-2: Estimated power consumption of the LOC system components
Subsystem Power (W)
Usage in 15 min sample cycle (min)
Average continuous power (W)
HV Electronic 1 4 0.27
Peristaltic pumps 0.3 6 0.12
Main power 1 2 0.13
Main electronic 0.1 15 0.10
Total 0.62
Table 7-2 shows the estimated power consumption of the proposed LOC system. The
table contains the system components, the power required to operate them, and the
usage time of that particular component. The values were estimated from very similar
commercial products for each part.[220]
[221]
However, the total average of the system’s

190
power consumption is 0.62W, using the following equation to calculate the power
consumption per day:
𝑬 = 𝑷𝒕 Equation 7-3
Where E is the energy, P is the power and t is the time in seconds.[222]
[83]
Thus, the
energy is 53568 J (0.62 W per day).
From the previous calculation, the energy consumption was calculated, which then has
to be fulfilled with the appropriate battery. If the system is running for 720 hours a
month, the energy capacity of the system is 446.4 Wh. A typical 12 V battery weighs 6
KG, which is relatively portable and can also deliver up to 480 Wh.[80]
However, these figures can be adjusted to suit the system, but they are reliable enough
to a realistic stage to prove that the LOC system energy is far less than the current
standard analytical system that measures ions in the field. These typical systems require
mains power supply or a higher voltage power supply (230 V).[84]
7.5 Chapter conclusion
To summarise, the proposed analytical system should fulfil the project requirements and
the demand for an LOC system that can monitor water quality in-situ. The project
requirements were a robust, portable LOC system with reduced time, reagent
consumption and power. The run time was significantly reduced as this LOC system
can measure all of the required species in one run, in 15 minutes, while the current
standard system measures one species at a time, in a few minutes. The reagent
consumption of the current standard system is 100 L every two weeks,[12]
while for this
LOC system it is 1.5 L every two weeks. This also significantly reduces the amount of
waste from the system and makes the system portable. The portability of the system is

191
very convenient, as it could be carried by an ordinary person; the entire system should
be the size of a briefcase. The power needed is also reduced, less than the current
system, and the portability of the system might be limited by the battery size, but a
possible compromise could be considered that involves using a smaller capacity battery
and reducing the usage time.

192
8 Conclusion
There is a demand for portable in-situ measuring systems for measuring ions in
environmental water samples. Although commercially available flow injection analysis
systems are available, they are not easy to install and maintain, having high power
requirements and using large volumes of reagents. Miniaturising the measurements has
proved to be promising, and quite successful microfluidic automated systems have been
developed, based on spectrophotometric and voltammetric measurements. These
systems tend to only measure one species at a time, and what is required is a portable
system that can simultaneously measure several anions and cations. The aim of this
project was, therefore, to develop a novel, analytical device capable of measuring and
detecting nutrient levels in water samples in-situ, at high-frequency measurements, by
utilising the advantages of miniaturisation for sample preparation and measurement.
The system involves ion injection, ion separation, and detection. This analytical system
to be developed needed to be capable of replacing the existing systems being used in the
field.
Work started on the separation of ions using a monolithic column, as they demonstrated
good results in the literature.[92, 194]
For the separation of anions, two different anion
exchangers were investigated, lysine and DDAB. The monolith was prepared in-house
and then coated with the anion exchanger, and a commercial C18 monolith was used to
compare this to the results obtained from the homemade monolithic column.
Two anions were used to perform the chromatography on the monolithic columns,
nitrite and sulphate. With the homemade lysine-coated monolith, a good peak shape was
observed for nitrate but it was practically difficult to continue with lysine, due to the
continuous blockage of the monolith. On the homemade DDAB-coated monolith, the

193
separation of nitrite and sulphate was poor. When nitrite was on its own on the same
monolith has shown shift in retention time, and the peak intensity was decreased, which
means that the peak was changed, making the results irreproducible. A commercial C18
monolith was coated with DDAB and this showed poor reproducibility for nitrite and
sulphate.
It was clear that the monolith was not providing the required separation for small ions,
and there were also problems with high back-pressure with regards to prolonged use;
therefore, it was decided that another approach was necessary for a portable system.
The work on ion separation was changed from an IC to a CE, which does not require
pressure pumps or complex eluents and has a very low reagent consumption. Also, no
blockage or leakage occurs in the CE, whereas in the IC, these are a major problem.
Furthermore, low-cost CE systems can be obtained using simple manufacturing
techniques, and the separation of inorganic ion solutions has successfully been
performed in LOC devices.[22]
One concern with continually operating a system is the effect of the sample matrix on
the system; therefore, it was decided that a good approach would be to extract the ions
from the sample prior to separation. Different ion extraction approaches were
investigated, including ion extraction through a potassium silicate monolith and through
electrodialysis (ED). The potassium silicate monolith was used to extract ions from
river water samples. The potassium silicate monolith worked as a barrier that stopped
unwanted materials already present in the river water from entering the measurement
system. The presence of these materials would influence the separation process.[94a]
However, different extraction techniques using the potassium silicate monolith were
investigated, using both a glass chip and a glass capillary. The bare silica capillary

194
showed poor results due to the interference of the negative charge on the surface of the
capillary, and the monolith causing EOF; therefore, the surface was silanised. Three
different silanisation methods were investigated: trichloro perfluorooctyl silane (FDTS),
commercial coating, and an end-capping procedure. Different extraction factors were
investigated, including the applied voltage and extraction time.
The extraction was successful for all three silanisation methods, showing promising
results. The results of the extraction with FDTS were less successful than the other
methods, as there was noticeable EOF during the extraction process. The end-capping
procedure was better but not as good as the commercial coating. The commercial
silanisation reagent showed promising results but they were irreproducible and difficult
to control. The high hydrophobicity of the coated surface of the capillary caused the
accumulation of bubbles in the capillary, which affected the anion movement. The glass
capillary could be replaced by a polymer capillary but then the frit could not be kept in
place. Further investigation of a different design was required. This design would be in
a suitable polymer chip to avoid, for example, the EOF. The system could include the
potassium silicate monolith as the main extraction part, as it has already shown very
promising results.
Electrodialysis (ED) was examined as a possible alternative sample introduction method
because it can be combined with electrophoresis (CE) for rapid pre-concentration and
the subsequent determination of inorganic ions in river water. The analytical
performance of ion separation in CE can be significantly improved by pre-treatment
with ED as a sample introduction technique.[94b]
[96]
Different ED techniques were investigated for extracting inorganic ions from a river
water sample, including: ion extraction through a polytetrafluoroethylene (PTFE) film
and Parafilm, ion extraction with a cellulose acetate (CA) ED membrane; ion extraction

195
in a cyclic olefin copolymer (COC) chip; ion extraction with a COC multi-membrane;
ion extraction with ion-exchange membranes; and ion extraction through an ion-
exchange membrane in an ED chip.
Ion extraction through polytetrafluoroethylene (PTFE) film and Parafilm did not
produce reproducibility, as the films had to be stretched in order to reduce the thickness
of the film. Despite the successful migration of ions, PTFE and Parafilm were not ideal
for such an application.
A cellulose acetate (CA) ED membrane was also used for extracting ions from a river
water sample. Anions could not be extracted due to the chemical structure of cellulose
acetate; however, they were successfully extracted through the AEX membrane.
In order to enhance the extraction of ions through the ED membrane, a new COC ED
chip was designed. The new chip had to be both physically and chemically compatible
with the final integrated total system, and the initial COC-chip design was not
practically ideal. Thus, to overcome the problems associated with the initial design and
to improve the extraction, especially of anions, a COC multi-membrane system was
designed. In this system, ion-exchange membranes were used rather than the cellulose
acetate membrane. Two types of membrane were examined: an anion-exchange
membrane for the extraction of anions and a cation-exchange membrane for the
extraction of cations. Different electrodes were used in the system to examine their
suitability, including a gold-coated electrode and a carbon-coated electrode. Generally,
extraction with a gold electrode was better than extraction with carbon. Nevertheless,
both methods demonstrated good extraction, despite the low conductivity in the system.
To enhance the extraction of ions and to simplify the multi-membrane system to a
single membrane, ion extraction with just one ion-exchange membrane was investigated

196
as a possible extraction media for both anions and cations. Anion extraction with the
anion-exchange (AEX) membrane in an ED system was successful and showed good
results, but the AEX membrane was not very robust, with the disadvantage that it has no
ability to stand chemically and physically for a long period of time. Cation extraction
with a single cation-exchange (CEX) membrane has shown very good results for the
extraction of cation, and it can be used for about 100 runs.
To summarise the work on ED, different ED techniques and methods were used to
extract ions from a river water sample. Most of these techniques were successful, with
some disadvantages that can be overcome with further work. The most successful and
suitable technique for anion extraction was anion extraction with an AEX single
membrane in an ED chip, whereas ED extraction using a cellulose acetate (CA)
membrane was the best cation extraction. Both systems have shown very good results
and these results can be further improved with a greater optimisation to suit the total
integrated systems.
A design for a total LOC system is proposed, which includes the pumps, buffer and the
energy required to operate the system. Two different types of pumps should work
together in the system, one to extract the water from the river and peristaltic pumps to
work in the system. Ideally, the system should be in operation in-situ for three months.
The energy required for the pumps should be supplied by a portable battery that is able
to function for a long period, with relatively low voltage. The suitability of the buffer
(MES/His) was extensively investigated, and the amount needed for a month was also
calculated. The amount of buffer needed for a month is less than 3 L, which is ideal for
system portability. The power needed can also be reduced, as in the current system. The
portability of the system might be limited by the battery size, but a compromise could
be considered, using a smaller capacity battery and reducing the usage time.

197
8.1 Future work
The proposed LOC system can meet most of the requirements from a chemistry
perspective, and it was linked to the electronic and mechanical design. It showed highly
promising results and with further optimisation, the system could be operated and
achieve the requirements. The system can measure ions and with slight modification, it
could also measure elements with the required LOD. The portability of the system was
intensively considered and the system should be small enough to be carried by a person
and placed in different, difficult locations; it could be powered by a large battery
(perhaps backed up with solar power). The analytical run can be achieved within 15
minutes, and could be reduced. The development of the system still requires further
work, especially on the separation. However, the separation of ions in such a system has
been investigated elsewhere, and it can be accomplished.[97]

198
9 References
[1] D. Ning, Y. Huang, R. Pan, F. Wang and H. Wang, Science of The Total Environment 2014, 485–486, 596-603.
[2] M. AG in 850 Professional IC Manual, Vol. 2015 http://www.metrohm.com/en-us/company/, 2009.
[3] B. Flores, J. Ren, S. Krishnamurthy and W. Belzer in Assessment of Nutrient and Heavy Metal Levels in Manadas Creek, an Urban Tributary of the Rio Grande in Laredo, Texas, Vol. Eds.: D. Ramirez, J. Ren, K. D. Jones and H. Lamm), Springer Netherlands, 2014, pp. 97-115.
[4] C. Ye, S. Li, Y. Zhang and Q. Zhang, J Hazard. Mater. 2011, 191, 366-372.
[5] G. E. Brown, A. L. Foster and J. D. Ostergren, Proceedings of the National Academy of Sciences 1999, 96, 3388-3395.
[6] M. Hendryx, J. Conley, E. Fedorko, J. Luo and M. Armistead, International Journal of Health Geographics 2012, 11, 9.
[7] h. apparatus in Peristaltic Pump ‘1200‘ Series User’s Manual, Vol. 2015 2015.
[8] I. Bharodiya and A. Parikh, 2014.
[9] W. Theodore, Electrical machines, drives and power systems, 6/E, Pearson Education India, 2007, p.
[10] J. Wang, M. Pumera, G. Collins and I. Jelínek, Analyst 2002, 127, 719-723.
[11] E. Joly, I. M. Bell, A. Fallatah, G. M. Greenway, S. J. Haswell, A. J. Wade and R. Skeffington, Mixed-Signals, Sensors and Systems Test Workshop (IMS3TW), 2012 18th International 2012, pp. 28-33.
[12] A. Wade, E. Palmer-Felgate, S. Halliday, R. Skeffington, M. Loewenthal, H. Jarvie, M. Bowes, G. Greenway, S. Haswell and I. Bell, Hydrology and Earth System Sciences 2012, 16, 4323-4342.
[13] I. Haddeland, J. Heinke, H. Biemans, S. Eisner, M. Flörke, N. Hanasaki, M. Konzmann, F. Ludwig, Y. Masaki, J. Schewe, T. Stacke, Z. D. Tessler, Y. Wada and D. Wisser, Proceedings of the National Academy of Sciences 2014, 111, 3251-3256.
[14] P. Whitehead, D. Butterfield and A. Wade in Potential impacts of climate change on river water quality Vol. (Ed. E. agency), 2008.
[15] A. J. Wade, E. J. Palmer-Felgate, S. J. Halliday, R. A. Skeffington, M. Loewenthal, H. Jarvie, M. J. J.Bowes, G. M. Greenway, S. J. Haswell, I. M. Bell, E. Joly, A. Fallatah, C. Neal, R. J. Williams, E. Gozzard and J. R. Newman, Hydrology and Earth System Sciences 2012, 16, 4323-4342.

199
[16] L. Marle and G. M. Greenway, TrAC Trends in Analytical Chemistry 2005, 24, 795-802.
[17] J. G. E. Gardeniers and A. van den Berg, Analytical and Bioanalytical Chemistry 2004, 378, 1700-1703.
[18] J. E. Prest, S. J. Baldock, P. R. Fielden, N. J. Goddard and B. J. Treves Brown, Journal of Chromatography A 2003, 990, 325-334.
[19] E. P. Joly in Development of an autonomous lab-on-a-chip system with ion separation and conductivity detection for river water quality monitoring, Vol. University of Hull, 2013.
[20] P. E. Kenneth M. Vigil, Clean Water An Introduction to Water Quality and Water Pollution Control, Oregon State University Press, United States of America, 2003, p. 176.
[21] K. C. Cheung, B. H. T. Poon, C. Y. Lan and M. H. Wong, Chemosphere 2003, 52, 1431-1440.
[22] J. S. Fritz, Journal of Chromatography A 2000, 884, 261-275.
[23] H. Thea and M. Fred, Nutrient on the move International institute for Environment ans Development, London, 2000, p. 146.
[24] J. Paul, N. Dinn, T. Kannangara and L. Fisher, Journal of Environmental Quality 1998, 27, 528-534.
[25] S. V. Dorozhkin and M. Epple, Angewandte Chemie International Edition 2002, 41, 3130-3146.
[26] S. Khan, R. Mulvaney and T. Ellsworth, Renewable Agriculture and Food Systems 2015, 1-4.
[27] C. Lee, Marine Ecology Progress Series 1993, 98, 135-148.1993.
[28] J. A. J. Dungait, L. M. Cardenas, M. S. A. Blackwell, L. Wu, P. J. A. Withers, D. R. Chadwick, R. Bol, P. J. Murray, A. J. Macdonald, A. P. Whitmore and K. W. T. Goulding, Science of The Total Environment 2012, 434, 39-50.
[29] J. H. Seinfeld and S. N. Pandis, Atmospheric chemistry and physics: from air pollution to climate change, John Wiley & Sons, 2012, p.
[30] D. E. Canfield, A. N. Glazer and P. G. Falkowski, science 2010, 330, 192-196.
[31] K. H. v. Mogel in Will cover crops feed the world?, Vol. 2015 (Ed. biofortified.org), biofortified.org, biofortified.org, 2011.
[32] A. C. Anthonisen, R. C. Loehr, T. B. S. Prakasam and E. G. Srinath, Journal (Water Pollution Control Federation) 1976, 48, 835-852.
[33] J. P. Montoya, C. M. Holl, J. P. Zehr, A. Hansen, T. A. Villareal and D. G. Capone, Nature 2004, 430, 1027-1032.
[34] H. L. Golterman, The chemistry of phosphate and nitrogen compounds in sediments, Kluwer Academic Publishers, 2004, p.
[35] F. Lipschultz, O. Zafiriou, S. Wofsy, M. McElroy, F. Valois and S. Watson, 1981.

200
[36] J. Shi, S. Fujisawa, S. Nakai and M. Hosomi, Water Research 2004, 38, 2323-2330.
[37] R. Knowles, Microbiological reviews 1982, 46, 43.
[38] K. B. Föllmi, Earth-Science Reviews 1996, 40, 55-124.
[39] K. Ruttenberg, Treatise on geochemistry 2003, 8, 585-643.
[40] Pregun Csaba and J. Csaba in Water Resources Management and Water Quality Protection, Vol. 2015 (Ed. http://www.tankonyvtar.hu/en), http://www.tankonyvtar.hu/en, 2011.
[41] P. Echlin, Scanning Electron Microsc 1975, 7, 1019-1028.
[42] W. E. Graves Jr, D. Boys and F. T. Turner in Sputter-coating system, and vaccuum valve, transport, and sputter source array arrangements therefor, Vol. Google Patents, 1982.
[43] S. Mathur, S. Barth, H. Shen, J. C. Pyun and U. Werner, Small 2005, 1, 713-717.
[44] G. C. Lane, C. A. Cartwright and K. W. Elmslie in Sputter coating method, Vol. Google Patents, 1976.
[45] S. Aldrich in Sigma-Aldrich MSDS, Vol. 2015 Sigma-Aldrich, 2015.
[46] J. SITZIA, European journal of cancer care 1995, 4, 11-16.
[47] M. J. Moorcroft, J. Davis and R. G. Compton, Talanta 2001, 54, 785-803.
[48] U. S. E. P. Agency in Nutrient Pollution: The Problem, Vol. 2015 United state of America
2012.
[49] Saint-Gobain in Comparative Peristaltic Pumps Tubing life, Vol. 2015 www.tygon.com, 2015.
[50] a) K. K. Gill, H. S. Sandhu and R. Kaur, Pesticide Biochemistry and Physiology; b) A. H. Wolfe and J. A. Patz, AMBIO: A Journal of the Human Environment 2002, 31, 120-125.
[51] L. N. Kolonel, J. H. Hankin, J. Lee, S. Y. Chu, A. M. Nomura and M. W. Hinds, British Journal of Cancer 1981, 44, 332-339.
[52] M. C. Bruzzoniti, S. Cavalli, A. Mangia, C. Mucchino, C. Sarzanini and E. Tarasco, Journal of Chromatography A 2003, 997, 51-63.
[53] S. Wilbur in The Agilent 7700x ICP-MS Advantage for Drinking Water Analysi, Vol. (Ed. I. Agilent Technologies, 2009), 2009.
[54] B. Michalke, TrAC Trends in Analytical Chemistry 2002, 21, 142-153.
[55] R. Roehl, R. Slingsby, N. Avdalovic and P. E. Jackson, Journal of Chromatography A 2002, 956, 245-254.

201
[56] S. AB in A practical guide to Ion chromatography an introduction and troubleshooting manual Vol. 1998-2007.
[57] J. W. Olesik, Analytical Chemistry 1991, 63, 12A-21A.
[58] R. D. Cowan, The Theory of Atomic Structure and Spectra University of California Press 1992, p. 568.
[59] G. Tyler in AA or ICP - Which do you choose?, Vol. (Ed. V. A. P. Ltd), Australia 1991.
[60] J. W. Olesik in Elemental Analysis Using An Evaluation and Assessment of Remaining Problems, Vol. 1991.
[61] PerkinElmer in Atomic Spectroscopy A Guide to Selecting the Appropriate Technique and System, Vol. (Ed. PerkinElmer), 2008-2013.
[62] D. A. Skoog, F. J. Holler and S. R. Crouch, Principles of instrumental analysis, Thomson Brooks/Cole, Belmont, CA, 2007, p. 1039 p.
[63] D. C. Harris, Quantitative Chemical Analysis, Craig Bleyer, New York, 2007, p. 663.
[64] R. L. Dahlquist and J. W. Knoll, Applied Spectroscopy 1978, 32, 1-30.
[65] X. Hou and B. T. Jones in Inductively Coupled Plasma/Optical Emission Spectrometry, Vol. (Ed. R. A. Meyers), John Wiley & Sons Ltd, Ch, Chichester, 2000, pp. 9468–9485.
[66] S. Toumpis and S. Gitzenis, INFOCOM 2009, IEEE 2009, pp. 1656-1664.
[67] J. L. Todolí and J. M. Mermet, Spectrochimica Acta Part B: Atomic Spectroscopy 2006, 61, 239-283.
[68] H. Zhang, X. Liu, X. Zhang and R. Weng, Nano/Micro Engineered and Molecular Systems (NEMS), 2013 8th IEEE International Conference on 2013, pp. 1104-1107.
[69] X.-J. Huang, Q.-S. Pu and Z.-L. Fang, Analyst 2001, 126, 281-284.
[70] T. Cecchi, Critical Reviews in Analytical Chemistry 2008, 38, 161-213.
[71] R. M. Smith, Anal. Proc. 1984, pp. 72-75.
[72] S. AbuRuz, J. Millership and J. McElnay, Journal of Chromatography B 2003, 798, 203-209.
[73] B. A. Bidlingmeyer, Journal of Chromatographic Science 1980, 18, 525-539.
[74] E. Sugrue, P. N. Nesterenko and B. Paull, Journal of Chromatography A 2005, 1075, 167-175.
[75] L. Kisley, J. Chen, A. P. Mansur, B. Shuang, K. Kourentzi, M.-V. Poongavanam, W.-H. Chen, S. Dhamane, R. C. Willson and C. F. Landes, Proceedings of the National Academy of Sciences 2014, 111, 2075-2080.
[76] A. Williams and V. Frasca in Ion-Exchange Chromatography, Vol. John Wiley & Sons, Inc., 2001.

202
[77] D. Schaller, E. F. Hilder and P. R. Haddad, Journal of Separation Science 2006, 29, 1705-1719.
[78] L. Lu, X. Han, J. Li, J. Hua and M. Ouyang, Journal of power sources 2013, 226, 272-288.
[79] K. R. Elkin and J. M. Riviello, Talanta 2014, 119, 353-360.
[80] W. www.smartbattery.com in Lithium Battery, Vol. 2015 2015.
[81] F. James and GjerdeDouglas, Ion Chromatography, WILEY-VCH, Weinheim, 2009, p. 377.
[82] F. Zhang, G. Shen, S. Ji and B. Yang, Journal of Liquid Chromatography & Related Technologies 2015, 38, 349-352.
[83] J. Loehr, J. E. Loehr and T. Schwartz, The power of full engagement: Managing energy, not time, is the key to high performance and personal renewal, Simon and Schuster, 2005, p.
[84] in PHOSPHAX sc Phosphate analyser on-site, 0.05-15 mg/L, 1 channel, Vol. 2015 2015.
[85] J. S. Fritz, Journal of Chromatography A 2005, 1085, 8-17.
[86] J. S. Fritz and D. T. Gjerde, Ion Chromatography, Wiley, 2009, p.
[87] J. E. MacNair, K. C. Lewis and J. W. Jorgenson, Analytical chemistry 1997, 69, 983-989.
[88] W. Joachim, Ion Chromatography, VCH Verlagsgesellschaft mbH, Cambridge 1995, p. 464.
[89] M. J. Shaw and P. R. Haddad, Environment International 2004, 30, 403-431.
[90] D. C. Harris, Exploring chemical analysis, Macmillan, 2004, p.
[91] S. Wouters, B. Wouters, S. Jespers, G. Desmet, H. Eghbali, C. Bruggink and S. Eeltink, Journal of Chromatography A 2014, 1355, 253-260.
[92] F. Svec and C. G. Huber, Analytical chemistry 2006, 78, 2100-2107.
[93] a) E. Joly, I. M. Bell, A. Fallatah, G. M. Greenway, S. J. Haswell, A. J. Wade, R. A. Skeffington, and 18th International Mixed-Signals, Sensors and Systems Test Workshop (IMS3TW) 2012; b) H. Schäfer, M. Läubli and R. Dörig, Metrohm, Herisau 1998.
[94] a) P. R. Haddad, P. Doble and M. Macka, Journal of Chromatography A 1999, 856, 145-177; b) T. K. . Doan, P. Kubáň, P. Kubáň, I. K. Kiplagat and P. Boček, Electrophoresis 2011, 32, 464-471.
[95] in Chapter 9 Electrolytic Conductivity Detector, Vol. Volume 36 (Ed. M. Dressler), Elsevier, 1986, pp. 181-207.
[96] M. Kelly, K. Altria and B. Clark, Journal of Chromatography A 1997, 768, 73-80.
[97] A. R. Timerbaev, Electrophoresis 2004, 25, 4008-4031.
[98] S. Park, T. D. Chung and H. C. Kim, Microfluidics and nanofluidics 2009, 6, 315-331.

203
[99] F. M. Everaerts, J. L. Beckers and T. P. Verheggen, Isotachophoresis: theory, instrumentation and applications, Elsevier, 2011, p.
[100] B. Graß, A. Neyer, M. Jöhnck, D. Siepe, F. Eisenbeiß, G. Weber and R. Hergenröder, Sensors and Actuators B: Chemical 2001, 72, 249-258.
[101] B. Toussaint, P. Hubert, U. Tjaden, J. Van der Greef and J. Crommen, Journal of Chromatography A 2000, 871, 173-180.
[102] L. Chen, J. E. Prest, P. R. Fielden, N. J. Goddard, A. Manz and P. J. Day, Lab on a Chip 2006, 6, 474-487.
[103] J. E. Prest, S. J. Baldock, P. R. Fielden, N. J. Goddard and B. J. T. Brown, Analytical and bioanalytical chemistry 2003, 376, 78-84.
[104] Y. Tachibana, K. Otsuka, S. Terabe, A. Arai, K. Suzuki and S. Nakamura, Journal of Chromatography A 2004, 1025, 287-296.
[105] Y. Tani and Y. Umezawa, Sensor Letters 2005, 3, 99-107.
[106] N. Lakshminarayanaiah, Membrane electrodes, Elsevier, 2012, p.
[107] R. Wetzel and G. Likens in Inorganic Nutrients: Nitrogen, Phosphorus, and Other Nutrients, Vol. Springer New York, 2000, pp. 85-111.
[108] J. E. Harwood, Water Research 1969, 3, 273-280.
[109] E. Hansen, A. K. Ghose and J. Růžička, Analyst 1977, 102, 705-713.
[110] R. De Marco, G. Clarke and B. Pejcic, Electroanalysis 2007, 19, 1987-2001.
[111] V. S. Bagotsky, Fundamentals of electrochemistry, John Wiley & Sons, 2005, p.
[112] R. O. C. DIOXIDE in ELECTROCHEMISTRY. PRINCIPLES, METHODS AND APPLICATIONS, Vol.
[113] K. Rajeshwar and J. G. Ibanez, Environmental electrochemistry: Fundamentals and applications in pollution sensors and abatement, Academic Press, 1997, p.
[114] D. C. Harris, Quantitative Chemical Analysis, W. H. Freeman and Company, New York, 2003, p. 645.
[115] J. Wang, M. Jiang and F. Lu, Journal of Electroanalytical Chemistry 1998, 444, 127-132.
[116] J. Ružicka, Flow injection analysis, John Wiley & Sons, 1988, p. 493.
[117] K. S. Johnson, R. L. Petty and J. Thomsen in Flow-injection analysis for seawater micronutrients, Vol. DTIC Document, 1985.
[118] A. Kazemzadeh and A. A. Ensafi, Microchemical Journal 2001, 69, 61-68.
[119] M. B. Shinn, Industrial & Engineering Chemistry Analytical Edition 1941, 13, 33-35.

204
[120] J. Gómez, N. Sanjuán, J. Bon, J. Arnau and G. Clemente, Journal of Food Engineering 2015, 149, 188-194.
[121] K. S. Johnson and L. J. Coletti, Deep Sea Research Part I: Oceanographic Research Papers 2002, 49, 1291-1305.
[122] A. D. Beaton, V. J. Sieben, C. F. Floquet, E. M. Waugh, S. A. K. Bey, I. R. Ogilvie, M. C. Mowlem and H. Morgan, Sensors and actuators B: Chemical 2011, 156, 1009-1014.
[123] B. Buscher, U. Tjaden and J. Van der Greef, Journal of Chromatography A 1997, 788, 165-172.
[124] B. M. Paegel, C. A. Emrich, G. J. Wedemayer, J. R. Scherer and R. A. Mathies, Proceedings of the National Academy of Sciences 2002, 99, 574-579.
[125] K. S. Ritter, Paul Sibley, Ken Hall, Patricia Keen, Gevan Mattu, Beth Linton, Len, Journal of Toxicology and Environmental Health Part A 2002, 65, 1-142.
[126] U. Förstner and G. T. Wittmann, Metal pollution in the aquatic environment, Springer Science & Business Media, 2012, p.
[127] H. Al-Hosney and V. Grassian, Physical Chemistry Chemical Physics 2005, 7, 1266-1276.
[128] A. Amine and G. Palleschi, Analytical letters 2004, 37, 1-19.
[129] L. Allamandola, S. Sandford, A. Tielens and T. Herbst, The Astrophysical Journal 1992, 399, 134-146.
[130] H. A. M. FACILITY in MICROMAC C On line analyzer for potable, surface and waste water monitoring, Vol. 2014 2014.
[131] S. H. Behrens and D. G. Grier, The Journal of Chemical Physics 2001, 115, 6716-6721.
[132] G. M. Whitesides, Nature 2006, 442, 368-373.
[133] R. Daw and J. Finkelstein, Nature 2006, 442, 367-367.
[134] S. C. Terry, J. H. Jerman and J. B. Angell, Electron Devices, IEEE Transactions on 1979, 26, 1880-1886.
[135] Z. He in Microarrays, Vol. (Ed. Z. He), Caister Academic Press, University of Oklahoma, Norman, OK, USA, 2014, p. 258.
[136] G. M. Greenway, S. J. Haswell and P. H. Petsul, Analytica Chimica Acta 1999, 387, 1-10.
[137] P. H. Petsul, G. M. Greenway and S. J. Haswell, Analytica Chimica Acta 2001, 428, 155-161.
[138] J. Cleary, C. Slater, C. McGraw and D. Diamond, Sensors Journal, IEEE 2008, 8, 508-515.
[139] A. D. Beaton, C. L. Cardwell, R. S. Thomas, V. J. Sieben, F.-E. Legiret, E. M. Waugh, P. J. Statham, M. C. Mowlem and H. Morgan, Environmental Science & Technology 2012, 46, 9548-9556.

205
[140] L. Chen, J. E. Prest, P. R. Fielden, N. J. Goddard, A. Manz and P. J. R. Day, Lab on a Chip 2006, 6, 474-487.
[141] Z. Walsh, B. Paull and M. Macka, Analytica Chimica Acta 2012, 750, 28-47.
[142] R. Gupta, S. J. Baldock, P. R. Fielden and B. D. Grieve, Journal of Chromatography A 2011, 1218, 5362-5368.
[143] J. E. Prest, S. J. Baldock, P. R. Fielden and B. J. T. Brown, Analyst 2001, 126, 433-437.
[144] J. P. Hutchinson, E. F. Hilder, M. Macka, N. Avdalovic and P. R. Haddad, Journal of Chromatography A 2006, 1109, 10-18.
[145] B. Paull and P. N. Nesterenko, TrAC Trends in Analytical Chemistry 2005, 24, 295-303.
[146] P. G. Wang, Monolithic chromatography and its modern applications, ILM publications, 2010, p.
[147] A. Strancar, A. Podgornik, M. Barut and R. Necina in Short Monolithic Columns as Stationary Phases for Biochromatography, Vol. 76 (Ed. R. Freitag), Springer Berlin Heidelberg, 2002, pp. 49-85.
[148] K. Cabrera, D. Lubda, H.-M. Eggenweiler, H. Minakuchi and K. Nakanishi, Journal of High Resolution Chromatography 2000, 23, 93-99.
[149] D. S. Burgi and R. L. Chien, Analytical Chemistry 1991, 63, 2042-2047.
[150] a) H. Guo, C. Chu, Y. Li, B. Yang and X. Liang, Analyst 2011, 136, 5302-5307; b) K. M. Glenn, C. A. Lucy and P. R. Haddad, Journal of Chromatography A 2007, 1155, 8-14.
[151] K. Nakanishi and N. Soga, Journal of non-crystalline solids 1992, 139, 1-13.
[152] S. Donath, H. Militz and C. Mai, Wood Science and Technology 2004, 38, 555-566.
[153] K. Sinkó, Materials 2010, 3, 704-740.
[154] K. Nakanishi, Journal of Porous Materials 1997, 4, 67-112.
[155] O. Núñez, K. Nakanishi and N. Tanaka, Journal of Chromatography A 2008, 1191, 231-252.
[156] C. Liang, S. Dai and G. Guiochon, Chemical Communications 2002, 2680-2681.
[157] A. K. Khattab in Fabrication, functionalization and characterization of silica monolith for forensic chemistry applications, Vol. University of Hull, 2014.
[158] A.-M. Siouffi, Journal of Chromatography A 2003, 1000, 801-818.
[159] G. Kaigala, M. Bercovici, M. Behnam, D. Elliott, J. Santiago and C. Backhouse, Lab on a Chip 2010, 10, 2242-2250.
[160] E. Oosterbroek and A. van den Berg, Lab-on-a-Chip: Miniaturized Systems for (Bio)Chemical Analysis and Synthesis, Elsevier Science, 2003, p. 384.

206
[161] L. Gui and C. L. Ren, Langmuir 2008, 24, 2938-2946.
[162] G. Tang, C. Yang, J. Chai and H. Gong, International Journal of Heat and Mass Transfer 2004, 47, 215-227.
[163] N. Anastos, N. W. Barnett and S. W. Lewis, Talanta 2005, 67, 269-279.
[164] T. D. Mai, S. Schmid, B. Müller and P. C. Hauser, Analytica chimica acta 2010, 665, 1-6.
[165] D. Wu, J. Qin and B. Lin, Journal of Chromatography A 2008, 1184, 542-559.
[166] J. S. Fritz, Journal of Chromatography A 2000, 884, 261-275.
[167] D. J. Harrison, A. Manz, Z. Fan, H. Luedi and H. M. Widmer, Analytical chemistry 1992, 64, 1926-1932.
[168] B. Mohammadi, R. Bharadwadj and J. Santiago, Electrophoresis Journal 2002, 23, 2729-2744.
[169] H. Strathmann, Desalination 2010, 264, 268-288.
[170] J.-J. Qin, Y. Li, L.-S. Lee and H. Lee, Journal of membrane science 2003, 218, 173-183.
[171] S. Waheed, A. Ahmad, S. M. Khan, T. Jamil, A. Islam and T. Hussain, Desalination 2014, 351, 59-69.
[172] M. Yoshikawa and K. Tharpa in Application of Membranes from Cellulose Acetate Nanofibers, Vol. Springer, 2015, pp. 369-394.
[173] M. Sequeira, M. Bowden, E. Minogue and D. Diamond, Talanta 2002, 56, 355-363.
[174] P. A. Greenwood and G. M. Greenway, TRAC Trends in Analytical Chemistry 2002, 21, 726-740.
[175] T. McCreedy, TrAC Trends in Analytical Chemistry 2000, 19, 396-401.
[176] T. McCreedy, Analytica chimica acta 2001, 427, 39-43.
[177] P. Kubáň and P. C. Hauser, Analytica chimica acta 2008, 607, 15-29.
[178] A. J. Zemann, E. Schnell, D. Volgger and G. K. Bonn, Analytical Chemistry 1998, 70, 563-567.
[179] J. A. Fracassi da Silva and C. L. do Lago, Analytical Chemistry 1998, 70, 4339-4343.
[180] L. Bazinet and M. Araya-Farias, Journal of colloid and interface science 2005, 281, 188-196.
[181] X. Wang, J. Song, J. Liu and Z. L. Wang, Science 2007, 316, 102-105.
[182] K. P. Doan TK, Kubáň P, Kiplagat IK, Boček P., Electrophoresis. 2011, 32, 464-471.
[183] E. C. Craig in Printed Circuit Boards, Vol. Springer, 1994, pp. 77-82.

207
[184] T. Oishi, K. Koyama, S. Alam, M. Tanaka and J.-C. Lee, Hydrometallurgy 2007, 89, 82-88.
[185] G. O. Mallory and J. B. Hajdu, Electroless plating: fundamentals and applications, William Andrew, 1990, p.
[186] K. Johal, H. Roberts, S. Lamprecht and C. Wunderlich, Americas 25, 35.
[187] P. Hatsis and C. A. Lucy, Analyst 2002, 127, 451-454.
[188] P. I. Fletcher, S. Haswell, P. He, S. Kelly and A. Mansfield, Journal of Porous Materials 2011, 18, 501-508.
[189] G. Huang, Q. Lian, W. Zeng and Z. Xie, Electrophoresis 2008, 29, 3896-3904.
[190] M. E. Ibrahim and C. A. Lucy, Talanta 2012, 100, 313-319.
[191] P. Hatsis and C. A. Lucy, Analytical chemistry 2003, 75, 995-1001.
[192] C. Xie, M. Ye, X. Jiang, W. Jin and H. Zou, Molecular & cellular proteomics : MCP 2006, 5, 454-461.
[193] E. Alzahrani and K. Welham, Analyst 2011, 136, 4321-4327.
[194] E. Sugrue, P. N. Nesterenko and B. Paull, Journal of Chromatography A 2005, 1075, 167-175.
[195] J. Guo, Y. Lu and R. Whiting, BULLETIN OF THE KOREAN CHEMICAL SOCIETY 2013, 34, 447-452.
[196] J. Guo, Y. Lu and R. Whiting, Bull. Korean Chem. Soc 2013, 34, 447.
[197] N. Tanaka, H. Kobayashi, N. Ishizuka, H. Minakuchi, K. Nakanishi, K. Hosoya and T. Ikegami, Journal of Chromatography A 2002, 965, 35-49.
[198] X. Chen, D.-F. Cui, C.-C. Liu and H. Li, Microsystem Technologies 2008, 14, 51-57.
[199] J. Kirkland, F. Truszkowski and R. Ricker, Journal of Chromatography A 2002, 965, 25-34.
[200] S. M. Fields, Analytical chemistry 1996, 68, 2709-2712.
[201] P. Christensen, S. Johnson, T. McCreedy, V. Skelton and N. Wilson, Anal. Commun. 1998, 35, 341-343.
[202] R. Arayanarakool, L. Shui, A. van den Berg and J. C. Eijkel, Lab on a Chip 2011, 11, 4260-4266.
[203] F. Tan, B. Yang and Y. Guan, Analytical sciences 2005, 21, 955-958.
[204] L.-T. Huang, P.-S. Hsu, C.-Y. Kuo, S.-C. Chen and J.-Y. Lai, Desalination 2008, 233, 64-72.
[205] B. company in Parafilm M® Brand Products and Floral Flexible Stemwraps, Vol. 2015.

208
[206] Y.-L. Hung, M.-J. Wang, J.-W. Huang and S.-Y. Lin, Experimental Thermal and Fluid Science 2013, 48, 102-109.
[207] Y.-L. Hung, M.-J. Wang, Y.-C. Liao and S.-Y. Lin, Colloids and Surfaces A: Physicochemical and Engineering Aspects 2011, 384, 172-179.
[208] H. Kamal, F. Abd-Elrahim and S. Lotfy, Journal of Radiation Research and Applied Sciences 2014, 7, 146-153.
[209] S. Fischer, K. Thümmler, B. Volkert, K. Hettrich, I. Schmidt and K. Fischer, Macromolecular Symposia 2008, pp. 89-96.
[210] C.-P. I. Company. in Chemical Compatibility Results
Vol. 2015 2015.
[211] L. Bazinet and M. Araya-Farias, Journal of colloid and interface science 2005, 286, 639-646.
[212] R. R. Lamonte and D. McNally, Advanced materials & processes 2001, 159, 33-36.
[213] G. Wang, L. Zhang and J. Zhang, Chemical Society Reviews 2012, 41, 797-828.
[214] L. Burke and P. Nugent, Electrochimica acta 1997, 42, 399-411.
[215] C. Y. Tang, Y.-N. Kwon and J. O. Leckie, Desalination 2009, 242, 149-167.
[216] A. A. Elbashir and H. Y. Aboul‐Enein, Biomedical Chromatography 2010, 24, 1038-1044.
[217] T. D. Mai and P. C. Hauser, Journal of Chromatography A 2012, 1267, 266-272.
[218] G. Chen, Y. Lin and J. Wang, Talanta 2006, 68, 497-503.
[219] J. R. Lakowicz, Principles of fluorescence spectroscopy, Springer Science & Business Media, 2013, p.
[220] H. I. G. C. KG in Heidolph Peristaltic Pumps Overview, Vol. 2015 www.heidolph.com
[221] http://www.ultravolt.com in Vol. 2015 2015.
[222] D. C. Giancoli and J. J. Boyle, Physics: principles with applications, Pearson Education, 2005, p.